report no. 2865b-in - world...
TRANSCRIPT

Document of
The World Bank j PAVFOR OFFICIAL USE ONLY
Report No. 2865b-IN
INDIA
RAJASTHAN WATER SUPPLY AND SEWERAGE PROJECT
STAFF APPRAISAL REPORT
May 19, 1980
Regional Projects DepartmentSouth Asia Projects
This document has a restricted distribution and may be used by recipients only in the performance oftheir official duties. Its contents may not otherwise be disclosed without World Bank authorization.
Pub
lic D
iscl
osur
e A
utho
rized
Pub
lic D
iscl
osur
e A
utho
rized
Pub
lic D
iscl
osur
e A
utho
rized
Pub
lic D
iscl
osur
e A
utho
rized
Pub
lic D
iscl
osur
e A
utho
rized
Pub
lic D
iscl
osur
e A
utho
rized
Pub
lic D
iscl
osur
e A
utho
rized
Pub
lic D
iscl
osur
e A
utho
rized
CURRENCY EQUIVALENTS(As of September 1, 1979)
Currency Unit - Rupee (Rs)US$1.00 - Rs 8.4Rs 1.00 - US$0.119
MEASURES AND EQUIVALENTS
L millimeter (mm) = 0.04 inches (in)1 meter (m) = 3.28 feet (ft)1 kilometer (kim) 2 = 0.62 miles (mi)1 square meter (m ) = 10.8 square feet (sq ft)1 hectare (ha) 2 = 10,000 square meters or 2.47 acres (ac)1 square kilometer (km ) = 0.386 square miles (sq mi)1 liter (1) = 0.26 US gallons (gal)1 liter per capitaper day (1/cd) = 0.26 US gallons per capita per day (gcd)
I cubic meter (m ) 35.3 cubic feet (cu ft)
ABBREVIATIONS AND ACRONYMS
Four Cities - Jaipur, Jodhpur, Kota and BikanerThree Cities - Jaipur, Jodhpur and BikanerCP - IBRD/WHO Cooperative ProgramDGS&D - Directorate General for Supply and DisposalGOI - Government of IndiaGOR - Government of RajasthanLIC - Life Insurance Corporation of IndiaMD - Medical DepartmentPHED - Public Health Engineering DepartmentRWSSB - Rajasthan Water Supply and Sewerage Management
Board
FISCAL YEAR
April 1 - March 31
The project was appraised in November/December 1979 and March/April1980 by Lars Rasmusson, Senior Sanitary Engineer, R.C. Mitchell, Senior Finan-cial Analyst, and Tauno Skytta, Sanitary Engineer.

FOR OFFICIAL USE ONLY
INDIA
RAJASTHAN WATER SUPPLY AND SEWERAGE PROJECT
STAFF APPRAISAL REPORT
Table of Contents
Page No.
I. THE RAJASTHAN WATER SUPPLY AND SEWERAGE SECTOR .... ....... 1Country Background ...................................... 1Water Resources ......................................... 1Sector Organization and Development ..................... 2Present Service Levels .................................. 3Service Levels Goals .................................... 4Sector Investment Program ............................... 4
II. POPULATION SECTOR SERVICES AND DEMAND INTHE PROJECT AREA ........................................ 6Population Projections and Demand for Services .... ...... 6Population Served and Standard of Services
for Project Areas ..................................... 7Design Parameters ........................................ 8Project Locations ....................................... 8Development Prospects ................................... 9
Existing Water Supply and Waste Disposal Systems ........ 9
III. THE PROJECT ............................................. 10Genesis ................................................. 10Project Objectives ...................................... 10Technological Aspects ................................... 11Description of Project Components ....................... 13Cost Estimates .......................................... 14Project Financing ....................................... 16Project Implementation .................................. 16Procurement ............................................. 18Disbursements ........................................... 19
IV. FINANCIAL ANALYSIS ...................................... 19Past Financial Performance .19Present Finance Position .20Revenues and Tariffs .21Future Financial Performance .23Financing Plan .25Commercial Accounting System .26Billing and Collection .26Audit .27Insurance .27
This document has a restricted distribution and may be used by recipients only in the performanceof their official duties. Its contents may not otherwise be disclosed without World Bank authorization.

-2-
Table of Contents (cont'd)
Page No.
V. THE IMPLEMENTATION AND OPERATION AGENCY .... ............. 27Operating Arrangements .................................. 27Organization .......... .................................. 27Management and Personnel ................................ 29Training ............ .................................... 30
VI. ECONOMIC ANALYSIS ....................................... 30Marginal Cost Analysis .................................. 30Pricing Considerations .................................. 31Incremental Financial Rate of Return .... ................ 32Project Benefits and Impact on Poverty Groups .... ....... 32Project Merits and Risks ................................ 33
VII. AGREEMENTS REACHED AND RECOMMENDATIONS .... .............. 34
ANNEXES
Annex 1Table 1 Summary of Service Levels in Rural
and Urban Areas, Water Supply andSewerage ........... ....................... 35
Table 2 Past and Projected Water Supplyand Sewerage Sector Investments(Rural and Urban Areas) ..... .............. 36
Table 3 Service Levels and ImplementationSchedule (Rural Areas) ..... ............... 37
Table 4 Salient Data and Service Levels(Four Cities Water Supply) ..... ........... 38
Table 5 Salient Data and Service Levels(Three Cities Sewerage) .39
Table 6 to 10 Cost Estimates for Rural and UrbanAreas, Water Supply and Sewerage .40-44
Table 11 Material and Equipment Requirements .45Table 12 Estimated Schedule of Disbursements .46Table 13 Urban Areas - Income Statement .47Table 14 Urban Areas - Funds Flow Statement .48Table 15 Urban Areas - Balance Sheet .49Table 16 Rural Water Supply - Income Statement .50Table 17 Rural Water Supply - Funds Flow Statement 51Table 18 Rural Water Supply - Balance Sheet .52Table 19 Current Tariff Structure .53-53Table 20 Project Location - Income Statement .55

-3-
Table of Contents (cont'd)
Page No.
Annex 2 Summary of Assumptions for Financial Projections ........ 56-58
Annex 3 Additional Information Available in Project File ....... 59
Annex 4 Performance Indicators ................................. 60
CHART
21142 Construction Implementation Schedule .... ............... 6121143 RWSSB Organization ..................................... 62
MAP
IBRD 14817 - The State of Rajasthan with Project Districts andProject Cities Indicated


INDIA
STAFF APPRAISAL REPORT
RAJASTHAN WATER SUPPLY AND SEWERAGE PROJECT
I. THE RAJASTHAN WATER SUPPLY AND SEWERAGE SECTOR
Country Background
1.01 The State of Rajasthan is located in the northwestern part of Indiabordering Pakistan (M2p IBRD 14817). It is the second largest State, coveringan area of 342,000 km or 10% of India's total area. The Aravalli mountainranges divide the State north to south into almost two equal halves. Thewestern part is the Thar desert, while the eastern part is hilly semi-desert.Extreme climatic conditions are typical for Rajasthan with temperatures rangingbetween -4OC to 50 0C and annual rainfall varying from 50 mm to 2,000 mm.
1.02 The population of Rajasthan was 25.8 million at the 1971 censusand is estimated to have increased by 1979 to about 32 million. About 80%(26 million) live in rural areas (33,305 villages) and the remaining 20% (6million) in urban areas 2(175 cities and towns). The population density averagesabout 90 persons per um which is much lower than the overall average for India(about 200 persons/km ). The population increase for the period 1961/71 was27.8%, or 38.5% for urban areas and 25.8% for rural areas.
1.03 The economy of the State is primarily based on agriculture, fromwhich about 56% of its total income is derived. Of the total area, about 50%is under cultivation, of which about 20% is irrigated. The per capita incomeby 1977/78 was Rs 925 or about 20% below the national average (Rs 1,163). TheState development plan outlay during FY1979 was Rs 95 per capita or only about45% of the national average (Rs 212).
1.04 The public health level in Rajasthan appears to be below the Indianaverage. Infant mortality is more than 10% higher than the all-India figureand high incidences of dysentery and infectious hepatitis have been reported.Skeletal fluorosis is comparatively widespread because of the use of ground-water with high fluoride content. The prevalence of guineaworm also addsto the number of water-borne diseases. A significant number of villages usewater rated as hazardous to health.
Water Resources
1.05 There are no perennial rivers in the arid region (Western part)where the main surface water source is the Rajasthan irrigation canal system.The eastern districts are covered by river systems with highly variabledry-wet season flows and include some minor lakes.

- 2 -
1.06 The Rajasthan Groundwater Department has comprehensively surveyedthe State's geological formations with regard to groundwater. In general,groundwater availability is scarce and the quality ranges from satisfactoryto poor. In the desert areas the groundwater is frequently brackish andavailable only at considerable depth (below 200 m).
1.07 In brief, the water supply situation is difficult and frequentlyremote water sources have to be developed to satisfy basic needs.
Sector Organization and Development
1.08 Most functions at the State Government level related to the watersupply and sewerage sector have since 1965 been concentrated in the PublicHealth Engineering Department (PHED) which has been responsible for projectplanning and construction, as well as operation and maintenance of rural andurban water supply systems. The operation of sewerage systems remained alocal function.
1.09 In order to better cope with the needs of the sector, the Governmentof Rajasthan (GOR) decided to establish a semi-autonomous State GovernmentOrganization and effective May 1, 1980 established the Rajasthan Water Supplyand Sewerage Management Board (RWSSB) 1/ (see para 5.02).
1.10 The RWSSB/PHED is responsible for all sector activities includingoperation and maintenance for both water supply and waste disposal works(para 3.25). The GOR would retain the powers (i) to borrow funds for capitalinvestments in water supply and sewerage schemes, for which the prioritieswould be based on recommendations to be made by RWSSB; and (ii) to sanctionwater supply and sewerage tariffs based also on recommendation made by RWSSB.
1.11 The formation of RWSSB does not exclude the ultimate developmentof a two-tier system with local responsibility for operation and maintenance;a gradual transfer of this function to local bodies might take place in thefuture (para 5.04 and 5.05). However, initially all properties would be ownedby GOR and operated by RWSSB. Assurances that all water supply assets havebeen transferred from the municipalities to GOR was provided for all proper-ties currently operated by RWSSB.
1/ A Government order giving notification of the effectiveness of theRajasthan Water Supply and Sewerage Corporation Act was issued in January1980 establishing the Rajasthan Water Supply and Sewerage Corporation.However, it was subsequently determined that transfer of staff to a newCorporation would be disruptive and administratively complex. Hence, GORdecided to continue to utilize the organization of PHED which wouldhenceforth operate under a Board (RWSSB) established to oversee PHED'sactivities. Accordingly, GOR has withdrawn the notification of theestablishment of the Corporation by government order and the Act wouldbe subject to repeal as soon as necessary legislative action can bescheduled.

1.12 The establishment of RWSSB is a major step in the developmentof the sector. RWSSB and the Medical Department (MD) will administrativelybe under the same ministry which would assure continued close cooperation onhealth aspects and education in connection with water supply and sanitation.Proper coordination is also being maintained with other GOR organizationsinvolved in water resource development and allocation and environmental matters(the Groundwater Department, the Irrigation Department, and the Water PollutionControl Board).
Present Service Levels
1.13 Present (1979) and past (1971) service levels (water supply andsewerage) in rural and urban areas are summarized below:
Water Supply 1971 1979
RURAL AREASPopulation Served- Nos. (million) 3.0 6.3- % of total 14% 24%
URBAN AREASPopulation Served by Connections- Nos. (million) 2.0 3.7- % of total 43% 61%
Population Served by Standposts- Nos. (million) 1.4 1.3- % of total 31% 21%
Sewerage
URBAN AREASPopulation Served by Connections- Nos. (million) 0.2 0.3- % of total 5% 5%
1.14 Of a total of 33,305 villages (present population about 26 million),24,037 (present population about 20 million) have been classified as problemvillages based on criteria such as health hazard aspects and distance andaccessibility to and quality of water sources. By 1979 about 3,800 villages(almost all of them problem villages) with a population of about 6.3 millionhad been provided with piped water supply, mainly through standposts but witha few private connections covering less than 15% of served population.Unserved population rely on shallow wells, remote surface water sources orwater collected during the rainy season. About 0.8 million (3%) are served bywater supplied through public handpumps. The service levels are similar tothose in other rural areas throughout India.
1.15 Rajasthan is the only State of India, which has provided all itscities and towns (175) with piped water supply. In Jaipur, Jodhpur, Kotaand Bikaner (the four major cities), accounting for about 32% of the total

- 4 -
urban population, the service levels have remained about constant while inremaining urban areas they have improved during the period 1971 to 1979.Rajasthan and the all-India figure for served population in urban areas arecomparable. The water supply is, however, generally intermittent, at lowpressure and unevenly distributed.
1.16 Sewerage systems have been extended mainly to two urban areas (Jaipurand Jodhpur) covering about 20% of the population in these two cities or about5% of total urban population, much below the all-India average. The bulk ofthe population rely on the conservancy system or have no sanitary facilitiesat all. Sanitary conditions, particularly in congested urban areas, arepoor and steadily deteriorating. A program to convert dry latrines intowater seal latrines has commenced but so far its impact cannot be measured.
1.17 In rural areas, there is a general lack of sanitary facilities andno program has, as yet, been evolved to improve the present situation. Theproblems are, however, less severe than in urban areas.
Service Levels Goals
1.18 A long range sector objective is to provide satisfactory watersupplies in all urban and rural areas, and sewerage systems in congestedurban areas, but this would require capital investments that cannot be realizedwithin the foreseeable future. Priorities have thus been established commen-surate with the immediate needs of the sector. The development or extensionof water supplies is most urgently required in scarcity rural areas (problemvillages) and in the growing major cities. Likewise, the extension of seweragesystems is most justified in congested areas of the major cities.
1.19 The objectives are, through FY1986, to increase the service levels(calculated on total population in rural and urban areas, respectively) asfollows: (i) rural water supply from 24% to about 45%; (ii) urban watersupply connections from 61% to about 72%; and (iii) urban sewerage from 5% toabout 10%. This would imply about 60% coverage (based on population) of theproblem villages and significant improvements (water supply and sewerage) inthe four major cities (Jaipur, Jodhpur, Kota and Bikaner). Annex 1, Table 1shows present and projected service levels in rural and urban areas.
1.20 In order to achieve these objectives (i) sector investments willhave to be increased significantly; (ii) more appropriate cost recovery sys-tems will have to be introduced; and (iii) RWSSB's project implementation andworks operation capacity will have to be further developed and strengthened.
Sector Investment Program
1.21 The development of the water supply and sewerage sector is givena comparatively high priority by GOR, as indicated by the proposed increase insector investments. Of the total development plan budget, the proportionallocated to water supply and sewerage would increase from 7% (for the period1974/78) to 10% (for the period 1979/83).
1.22 Past and projected sector investments (current values) throughFY1985 are shown in Annex 1, Table 2, and summarized below:

- 5 -
Past Investments Projected InvestmentsFY1951 Through 1980 For FYs 1981/85
Rs Million US$ Million Rs Million US$ Millionequivalent equivalent
Rural Areas- Water Supply 900 107 1,660 197
Urban Areas- Water Supply 460 55 756 90- Sewerage 32 4 148 18
1,392 166 2,564 305
1.23 Capital investments in the sector for FY1979 amounted to Rs 186million and the budget allocation for FY1980 is Rs 263 million. Annualinvestment is projected to average about Rs 500 million during the periodFYs1981/85. Likewise, the annual per capita investment in rural areas isprojected to increase from Rs 8 (FY1980) to Rs 11 (average for FYs1981/85);corresponding figures for urban areas are Rs 11 and Rs 25, respectively. Pastsector investments have been divided between rural water supply, urban watersupply and sewerage on the ratio of 65:33:2; the corresponding ratio forprojected investments (FYsl981/85) is 64:30:6. This also reflects sectorpriorities.
1.24 The Government of India (GOI) allocations to State Governmentsin general are for the overall development plan rather than for specificprojects and comprise 30% grant and 70% loan. Each State Government estab-lishes its priorities for the distribution of such funds as well as its ownfunds between various sectors. Exceptions are, however, made for specialprograms such as the Minimum Needs Program and Accelerated Rural DevelopmentProgram, with funds allocated as grants and specifically earmarked. In thepast the subsequent GOR allocation of funds to the water supply and seweragesector has been on a 100% grant basis but in the future, it is proposed thatonly rural area water supply will be covered by grants. For urban areas, GORis expected to make funds available on terms and conditions which would becommensurate with the sector's capacity to service the debt. Some financefor the sector for urban areas has also been provided by loans from the LifeInsurance Corporation of India (LIC) to the municipalities, while municipalcontributions have been insignificant.
1.25 The revenues from the urban water supply sector have not beensufficient to cover operational costs but for FY1980 a breakeven is expected.The sewerage sector has depended entirely on the municipal budgets since nocharges have been levied. In rural areas water charges are imposed only forprivate connections, and corresponding revenues have not covered total operat-ing costs, which are incurred primarily to provide standpost water to most ofthe population. The estimated recurrent cash deficit for rural areas forFY1979 amounted to Rs 21.3 million and is projected at Rs 38.2 million forFY1980. This deficit has been covered by GOR budget allocations.

- 6 -
1.26 The State Government objective is to make the sector financiallyviable from FY1981 through increased tariff levels in urban and rural areasand through the introduction of sewerage and standpost water charges.
II. POPULATION, SECTOR SERVICES AND DEMANDIN THE PROJECT AREA
Population Projections and Demand for Services
2.01 Population projections through 2001 for the state of Rajasthan havebeen made by the Directorate of Economics and Statistics (GOR) and, thereafter,through 2014, by PHED. The projections through 2001 are as follows:
TotalYear Population Urban Areas Rural Areas
-----------------Million-------------------
1971 25.8 4.6 21.21978 30.8 5.6 25.21984 35.0 6.5 28.52001 49.6 9.7 39.9
The average annual population growth rate for the period 1971/78 is estimatedat 2.6% for total population, the combination of 3.0% for urban and 2.5% forrural areas. Corresponding projected average annual growth rates for theperiod 1978/2001 are 2.1%, 2.4% and 2.0%, respectively. The Town PlanningDepartment (GOR) has made population projections for the project citiesindividually in the light of master plans for urban development and takinginto account such factors as growth potential and industrial development.These projections are summarized below and shown in Annex 1, Table 4.
Population Average Annual1980 2001 Growth Rate---- ' 1000 -…- ------ %-----
Jaipur 890 1,620 2.76Jodhpur 432 764 2.64Kota 347 714 3.36Bikaner 281 528 2.93
Total 1,950 3,626 2.86
2.02 For rural areas, water demand has been estimated at 50 1/cd, andthe extent of private connections has been assumed to be limited to about 15%of the population. These assumptions are reasonable in view of the objectiveto provide basic services to the maximum number of people and considering thescarcity of water sources and, consequently, the high investment costs.
2.03 In the four project cities, present service levels would not onlybe maintained but reasonable improvements have been assumed. Projectedservice levels and average water demand by 1985 are summarized as below:

Population Water Supply Sewerage Average(1986) Connections Standpost Connections Water Demand'000 --------------% served 1-------------- /cd
Jaipur 1,078 78 16 38 112Jodhpur 512 71 26 31 96Kota 448 82 18 - 116
Bikaner 334 86 14 27 96
Total 2,372 78 /a 18 /a 34
/a People who do not use the public systems would rely on private watersupplies.
2.04 Present and projected water demands for the four cities are shownin Annex 1, Table 4. The projected per capita demand assumes that the futureconsumption pattern (for domestic use) will be affected by factors such as(i) better availability of water, (ii) metering of most of the connectionswith charges based on consumption; (iii) extension of water connections tothe lower income groups; and (iv) the introduction of a block tariff structureto make greater water use more costly. Maximum day consumption, which usuallyoccurs near the end of the dry season, is estimated at 1.25 times average dayconsumption. Standpost water consumption has been projected at 50 1/cd forrural areas.
Population Served and Standard of Services for Project Areas
2.05 In the ten rural districts, 27% of the population is served by pipedwater supplies. About 15% of served population have private connections withthe remaining 85% relying on standpost water supply. The availability ofwater is about 50 liters per capita and day (1/cd) which is normally distrib-uted during a period each morning and evening. The long history of waterscarcity in Rajasthan has produced good habits for its conservative use, andthe standard of service appears to be reasonably good.
2.06 Present service levels (1979) in the four cities are shown in Annex1, Tables 4 and 5 and are briefly summarized below. Figures in parenthesisindicate service levels, based on the projected 1985 population, if the systemswere not to be extended.
Population Water Supply Sewerage1980 Connections Standpost Connections('000) ------------- % served --------------
Jaipur 890 65(54) 22(18) 25(21)Jodhpur 432 67(57) 29(24) 14(12)Kota 347 64(50) 24(19) -Bikaner 281 76(64) 16(13) 0
Total 1,950 67(55) 23(19) 18(15)
2.07 Industrial and commercial connections and about 90% of domesticconnections have meters, although many meters do not operate. Water producedis not currently metered (para 3.32). Water production and consumption dataare therefore of questionable accuracy but the average day consumption (compo-site for the four cities) would be about 100 1/cd for domestic use; unaccounted-for water including that distributed through standposts is estimated to averageabout 30% of water produced.
2.08 The water supplies are intermittent (only available a few hours perday) and, because of inadequate pressure, unevenly distributed. Productioncapacities are fully utilized. System operation and maintenance suffered frominadequate availability of funds (para 4.02).
2.09 For Jaipur, Jodhpur, Bikaner (the three cities) combined, about18% of the population are connected to the sewerage systems, about 30% haveseptic tanks, and about 52% use bucket privies (conservancy system) or have nodisposal facilities at all. The connection rate to the sewerage systems inJaipur and Jodhpur is comparatively high, covering about 50% of the populationwith access to the systems. A larger population than actually connectedbenefits indirectly from the sewerage systems since sullage waste dischargedinto the storm water system may ultimately enter the sewerage system, thetwo systems being interconnected.
2.10 Extreme poverty areas are mainly unplanned developments, which areprovided with standpost water supply but lack sanitation facilities. Thepopulation in such areas probably represents about 20% of the total population.
Design Parameters
2.11 A survey of actuil consumgtion in industrial areas has been carriedout, which varies from 4 m to 12 m per acre per day, depending on the typeof industrial activity. Similar rates have been applied in the projectionsfor industrial areas to be developed. The unaccounted-for water is expectedto decrease during the project period mainly because of improved metering(both bulk and customer meters), reduction in number of standposts and theimplementation of a leak detection program.
2.12 Sewage flow is based on the assumption that 75% of water consumptionwill enter the sewerage system. In addition, provision has been made forgroundwater infiltration.
Project Locations
2.13 The project is proposed to cover (i) water supplies in about 2,000problem villages in 10 out of 26 districts of the State and (ii) water supplyand sewerage in Jaipur, Jodhpur, and Bikaner and water supply only in Kota.Map 14817 shows the location of the various districts and the cities.Jodhpur and Bikaner and seven out of the ten districts are in the westerndesert region of the State.

-9-
Development Prospects
2.14 The irrigation canal systems, predominantly in the western districts,are continously being extended and, by 1978, 2.8 million hectares will havebeen made arable. This is projected to increase to 4.3 million hectares by1984. Concomitant with the extension and improvement of agricultural land isrelated rural development including the provision of potable water supplies.
2.15 The four project cities are all administrative and industrial centerswith significant growth pot@ntial. Kota is highly industrialized and Bikaneris becoming the focal pnint for increasing development activities in connec-tion with the constiuctlon of the Rajasthan irrigation canal.
Existing Water Supply and Waste Disposal Systems
2.16 All rural areas have been surveyed regarding the availabilityand quality of water resources and have been broadly classified into problemand non-problem villages. The criteria, which designate a village as a"problem village," are (i) hardship in transporting the water because ofremotely located water sources or its availability only at considerable depth;(ii) excessive salinity content; and (iii) health risks because of excessivefluoride content or prevalence of guinea-worm. Annex 1, Tables 1 and 3 showthe number of villages and population with or without water supplies, whichare summarized below (for 1979).
Project Districts Other Districts Total StateServed Unserved Served Unserved Served Unserved
Problem Villages- Villages Nos.) 1,408 8,023 2,200 12,406 3,608 20,429- Population ('000) 2,490 6,480 3,310 7,550 5,800 14,030
Non Problem Villages- Villages (Nos.) 59 1,350 120 7,739 179 9,089- Population ('000) 150 800 305 4,620 455 5,420
Total- Villages (Nos.) 1,467 9,373 2,320 20,145 3,787 29,518- Population ('000) 2,640 7,280 3,615 12,170 6,255 19,450
2.17 Annex 1, Tables 4 and 5, shows major existing water supply andsewerage works in the four cities. These systems may be briefly describedas follows:
(a) the water supplies in Jaipur, Jodhpur and Kota are mainlybased on surface water sources (impoundments) with treatmentof raw water before being distributed to consumers. InJaipur, groundwater supplements the surface water source,and Bikaner is entirely served by groundwater;

- 10 -
(b) the distribution areas are subdivided into zones functioningindependently with service reservoirs being fed from wellsor the treatment works; and
(c) the sewerage systems (Jaipur, Jodhpur and Bikaner) arerather skeletal consisting of laterals, interceptors,short outfall mains; there is a treatment works only atJaipur.
III. THE PROJECT
Genesis
3.01 The project has been developed in close cooperation between GOR(and RWSSB), the World Bank and the IBRD/WHO Cooperative Program (CP). Asector study, carried out by CP staff, was completed in August 1978. Projectpre-appraisal took place in October 1978 and June 1979 and appraisal inNovember/December 1979 and March/April 1980.
3.02 The rural component of the project was originally envisaged to coverall 26 districts of the State but it was subsequently decided to concentrateon 10 districts where water supply problems are most severe. The selection ofthe villages proposed under the project has been or will be subject to reviewand approval by the Development (Panchayat) Department and district committeesto ensure integrated rural development (para 3.26).
3.03 The project, to be implemented during FYsl981/85, covers about 54%of GOR's projected sector investment during that period and assists in theachievement of sector objectives as established by GOR (paras 1.18 and 1.19).Cost-wise the project would be distributed between rural water supply, urbanwater supply and sewerage on a ratio of 39:50:11.
Project Objectives
3.04 The project objectives are:
(a) to provide safe water supplies in about 2,000 problemvillages;
(b) to improve and extend the water supplies in the four cities(Jaipur, Jodhpur, Kota and Bikaner) achieving total coverageof the population (2.4 million by 1985) and increasingpopulation served by connections from 67% to 78%;
(c) to extend the sewerage system in the three cities (Jaipur,Jodhpur and Bikaner) increasing population served by con-nections from 18% to 34%;
(d) to establish and/or strengthen operations and maintenanceunits in urban and rural areas; and

- 11 -
(e) to introduce proper billing and revenue collection systemsand to set water rates to achieve financial self-sufficiency.
3.05 The project would aim at (i) facilitating further rural developmentin those villages to be provided with water supplies; (ii) enabling envisagedindustrial expansion in the four cities; and (iii) improving social andhealth conditions.
3.06 In the project areas, safe water supplies will be made availableto effectively all of the population. Standpost water supply will be providedto that population not in a position to have private connections. The seweragesystems will only cover limited areas of the cities but the total populationwould directly or indirectly benefit from the improved environment. Communitytoilets will also be constructed where feasible. To enable lower income groupsto connect to the sewerage sytems, the project would provide for credit onconcessional terms to cover connection and basic plumbing installation costs(para 4.09).
Technological Aspects
3.07 Based on hydrogeological surveys (para 1.06), areas with ground-water potential have been located, and those villages have been identifiedthat can be supplied by groundwater economically. For other villages, avail-able surface water sources (mainly irrigation canals) will be utilized withappropriate treatment. In order to achieve maximum impact, preferences aregiven to villages with large populations, usually those presently providedwith electricity supply and where per capita investment needed is compara-tively low. The groupings of villages to be covered under each particularscheme has been or will be subject to least cost evaluations (para 3.26).Sample schemes have been reviewed in detail, and treatment works alternativeshave been evaluated by consultants, based on which standardized designs arebeing prepared.
3.08 For water supply in the four cities, groundwater availabilityand quality vary but is generally inadequate or unsuitable for future systemextensions; therefore, existing or new surface water sources must be developed.Major technical features in the four cities are briefly summarized as below:
(a) In Jaipur, the existing water supply is based on groundwater(62%) and surface water from Ramgarh (38%). After the pro-posed extension of the water supply system, correspondingfigures (by 1985) will be 58% and 42%, respectively. Indi-vidual tubewell yields, however, are comparatively low andthe groundwater level has shown a receding trend. A hydro-geological study is presently being undertaken to form thebasis for future groundwater exploitation. 114 tubewellshave been included under the project. These will be sup-plemented by additional surface water supply from Ramgarh(about 30 km from the city) by raising the dam and theconstruction of a low dam for an impoundment at Kanota(about 10 km from the city).

- 12 -
(b) For Jodhpur, the most advantageous alternative is a furtherexploitation of Jawai (about 170 km from the city), whichis presently being used. Currently, the water is conveyedby gravity from Jawai to Jodhpur (via Hemawas) in an opencanal with considerable losses due to evaporation, leakageand pilferage. The water allocation from the Jawai impound-ment has been increased (para 3.09). Various alternativeshave been evaluated and the most economical solution isrehabilitation and raising (to accommodate the increasedwater allocation) of the Jawai-Hemawas canal (about 80 km)and the laying of a closed conduit between Hemawas andJodhpur (about 65 km of 1,900 mm conduit), which can followa shorter route than the existing canal. The Jawai sourcewould then be sufficient to about 1991.
(c) In Kota, the present water source is abundant and is basedon the river Chambal. The intake facilities and treatmentworks close to the city and upstream of an existing barragewill be extended.
(d) For Bikaner, the present groundwater source is being tappedbeyond its capacity and the groundwater level is receding.Water quality is also less than satisfactory. The Rajasthanirrigation canal has recently been extended to a location about6 km from the city and this water source is the most economicalfor development. The groundwater supply will then gradually bephased out.
3.09 The Jodhpur water source, the Hemawas/Jawai canal system andimpoundments, also supplies villages and one major town en route and providewater for irrigation purposes. The allocation of water for municipal watersupply is estimated to be 2,750 million cubic feet per year at 70% depend-ability level. Water is technically released from a number of raw waterreservoirs and the above annual quantity is calculated as an equivalentquantity at the Jewai impoundment. Since considerable investment will bebased on the total capacity of the system, IDA received assurances from GORthat an adequate allocation for the water supply purposes will be maintainedin the future.
3.10 Treatment works (settling tanks and rapid sand filtration) will beconstructed in the four cities and, to enable an evaluation of different alter-natives, international bids for treatment plant equipment on a "performancebasis" are proposed to be invited. For the four cities, local consultantassistance has been used to evaluate alternatives on the design of trans-mission and distribution systems, locations of service reservoirs, and zoningarrangements as well as for preparation of preliminary engineering design forvarious water works components.
3.11 For the sewerage and sewage disposal systems, different alternativeshave been investigated regarding population coverage, alignments of intercep-tors and outfall mains, location of disposal works and type and degree oftreatment. For the latter, local consultant assistance has been used.

- 13 -
3.12 All alternatives recommended for implementation represent leastcost solutions at a discount rate of 10%. The design criteria were reviewedby the appraisal mission and are acceptable.
Description of Project Components
3.13 The project would include the following major components: (i) ruralwater supply schemes; (ii) extension of water production (intake, treatmentworks, tubewells) and water distribution (transmission and distribution mains,service reservoirs, connections) facilities in the four cities; (iii) exten-sion of sewage collection (connections, laterals, interceptors) and disposalworks (outfalls, pumping stations, treatment works) in the three cities; and(iv) consultant services and training.
3.14 The number of rural water supply schemes is tentative and will besubject to an annual review (para 3.26). The schemes will be simple withpumping from treatment works or tubewells to storage tanks and a limitednumber of distribution mains; some handpump schemes will also be included.
3.15 Increases in production capacities for water supply in rural andurban areas and major project components are summarized below:
Urban Areas Rural AreasJaipur Jodhpur Kota Bikaner Total 10 Districts
Production Capacity(MLD) /a
- Existing 142 63 63 34 302 -- Additional 76 72 64 30 242 100Dams for Impoundment 1 - - - 1 -Intakes and TreatmentPlants 2 1 1 1 5 48
Tubewells 114 - - - 114 475Transmission Mains (kms) 91 - 19 45 155 3,750Service Reservoirs- Nos 3 6 2 6 5 19 250- Capacity (m ) 7,250 6,550 16,300 5,600 35,700 15,000Distribution Mains (kms) 73 128 219 133 553 - /bConnections 36,700 6,500 14,500 8,400 66,100 30,000Standposts 50 - 25 - 75 5,000Water Meters 45,000 10,000 19,000 17,000 91,000 -
/a Million liters per day.7b Included under transmission mains.
3.16 The sewerage works in the three cities concentrate on the provisionof sewer connections and laying of laterals in congested areas where the con-servancy system is predominantly used and where, because of space constraints,other alternatives are not feasible. The treatment works (stabilization ponds)will be extended in stages and, under the project, only screening and grit

- 14 -
chambers will be provided. The treated sewage will be used for irrigationpurposes. The major project components for sewerage and waste disposal aresummarized below:
Jaipur Jodhpur Bikaner Total
Sewer Connections (nos.) 20,950 9,250 8,250 38,450Laterals (kms) 72 27 53 152Interceptors (kms) 6 5 6 17Outfalls (kms) 13 3 3 19Pumping Stations (nos.) 1 - - 1Treatment Works (nos.) 1 1 1 3
3.17 The consultant studies would cover: (i) the preparation of organi-zational and staffing proposals; (ii) the establishment and installationof a commercial accounting system; (iii) detailed engineering for major workscomponents including the preparation of tender documents for water treatmentworks and tender evaluation; (iv) the preparation of feasibility reports forfurther extensions of the water supplies for Jaipur and Jodhpur; (v) thepreparation and implementation of a training program; (vi) the preparationof project monitoring and reporting systems; and (vii) the preparation andimplementation of a health education program. Only local consultant firmswill be engaged but for part (iii), association with a foreign consultant maybe required for specialized assignments. The total number of man-months forconsultant services is estimated at 900 of which about 10 would be for foreignconsultants.
Cost Estimates
3.18 Annex 1, Tables 6 to 10, show the cost estimates for water supplyand sewerage for rural and urban areas. A summary cost estimate is shownbelow:

- 15 -
% ofRs Millions US$ Million Equivalent Grand
Total Local Foreign Total Local Foreign Total
RURAL AREASWater Supply
Civil Works 94.7 94.7 - 11.3 11.3 -Material &Equipment 217.8 159.0 58.8 25.9 18.9 7.0Total 312.5 253.7 58.8 37.2 30.2 7.0 23
URBAN AREASWater Supply
Civil Works 132.3 132.3 - 15.8 15.8 -Material &Equipment 238.1 174.3 63.8 28.3 20.7 7.6Total 370.4 306.6 63.8 44.1 36.5 7.6 27
SewerageCivil Works 48.0 48.0 - 5.7 5.7 -
Material &Equipment 30.5 30.5 - 3.6 3.6 -
Total 78.5 78.5 - 9.3 9.3 - 6
Sub-Total 761.4 638.8 122.6 90.6 76.0 14.6 56
CONTINGENCIESPhysical 107.3 90.5 16.8 12.8 10.8 2.0Price 316.5 272.0 44.5 37.7 32.4 5.3
Total 423.8 362.5 61.3 50.5 43.2 7.3 30
ENGINEERING COSTSINCLUDING CONSULTINGSERVICES AND TRAINING 192.4 191.5 0.9 22.9 22.8 0.1 14
Grand Total 1,377.6 1,192.8 184.8 164.0 142.0 22.0 100
3.19 The cost estimates in urban areas are based on preliminary engineer-ing design and in rural areas on per capita costs, which have been derived fromdetailed cost estimates for typical sample schemes in respective districts.The basic costs are at mid-1979 price levels. Physical contingencies havebeen assumed to average 10% for rural areas and 15% for urban areas but forthe Jodhpur raw water main (Hemawas-Jodhpur) 25% has been applied becauseof uncertainties in the cost estimates and in the availability of suitablecontractors. The price contingencies for both civil works and material andequipment for local procurement have been estimated assuming cost increases of8% to April 1, 1980, 10% for FY1981, 7% annually for FY1982 through FY1984 and5% annually thereafter. The same percentages have also been applied toforeign procurement, since this would represent an insignificant amount andthe differences between projected price increases for local and foreignprocurement would be minor. Engineering costs have been assumed at 16% of

- 16 -
basic costs including contingencies and include consultant services andtraining to an estimated amount of US$1.5 million equivalent. The averageman-month cost including salary, costs, fees, international travel, whenappropriate, and subsistence is expected to be about US$10,000 for foreignconsultants and US$1,000 for local consultants. In addition to these costswould be the costs of vehicles, drilling equipment, local transportationand local office operating expenses to the extent required.
3.20 The foreign exchange component is estimated at US$22 million equiv-alent. This has been based on assumptions made regarding goods to be importedand on the average foreign cost component in local manufacturing of materialand equipment. The project costs include import duties, excise and salestaxes estimated at US$5.0 million equivalent.
3.21 The average costs per capita calculated on the 1985 served popu-lation amount to: (i) for rural water supply US$38; (ii) for urban watersupply US$36; and (iii) for sewerage US$27. These costs are acceptable.
Project Financing
3.22 An IDA Credit of US$80.0 million is proposed, which would financeabout 50% of total project costs (US$164 million equivalent) net of dutiesand taxes. The credit would finance all direct and indirect foreign exchangecosts (estimated at US$22 million) and local currency expenditures on civilworks, equipment and material, consultant services, and training (US$58million).
3.23 Additional funds of US$84 million equivalent would be made avail-able to RWSSB through normal budget allocations. There would be no municipalcontributions for urban water supply and sewerage, while the villages exclu-sive of minor deserving case exceptions would contribute the equivalent of2.5% of capital costs (para 4.13).
3.24 GOR would make funds available to RWSSB/PHED and reflect the follow-ing terms and conditions in the commercial accounts:
(i) for rural water supplies, 100% grant; and
(ii) for urban water supply and sewerage, 100% loan at 6.5%interest rate with a 25 year term including a five yeargrace period.
Project Implementation
3.25 RWSSB/PHED will be responsible for both project implementation andsystem operation and maintenance for water supply and sewerage in rural andurban areas. Completed rural water supply schemes would, however, for reasonsof economy and to encourage local involvement, be operated by the local bodiesprovided RWSSB can be assured of satisfactory organization and financialsoundness of the local entities and an agreement can be obtained regardingthe continuation of major maintenance by RWSSB. The responsibility for theoperation of sewerage works, presently under local bodies, as well as all
- 17 -
assets would be transferred to RWSSB by April 1, 1981, to ensure the develop-ment of proper water supply and sewerage operational entities. IDA obtainedsuch assurances from GOR.
3.26 For rural water supplies, acceptable technical reports have beenprepared for each of the ten districts covered under the project. Villagesproposed to be provided with water supplies have been identified and pertinentdata have been collected and summarized. However, as project implementationproceeds, revisions regarding the villages to be covered under the project areexpected to occur and RWSSB would submit to IDA for review the proposed imple-mentation program for each FY by each preceding March 1. The detailed engineer-ing design will be ongoing through 1983 and IDA will, during the course ofproject implementation, review sample schemes.
3.27 Reports on feasibility studies with preliminary engineering for theproject cities (water supply and sewerage) have been appraised. The detailedengineering will be executed by PHED regarding transmission and distributionmains and by consultants regarding major water works components. For worksto be executed through 1981, consultants have been appointed, and for worksto be executed thereafter, consultants would be appointed by April 1, 1981.The detailed design would be completed by end-1982.
3.28 In order to assist in the maintenance of the construction schedule,documents for immediate procurement requirements and for two treatment plants(Jaipur and Kota) have been submitted to IDA for review.
3.29 The PHED must be strengthened to be able to cope with the increasedworkload (para 5.11). In order to maintain the schedule in project processing,the following number of additional divisions have been sanctioned in the Plan-ning and Design Department: (i) four divisions for the processing of ruralwater supply schemes and five divisions for the four project cities; and(ii) two divisions for procurement and material management.
3.30 CPM networks for project implementation have been prepared by con-sultants and a project implementation schedule is shown on Chart 21142. Thesame consultant has been appointed to prepare project monitoring and reportingsystems. The system would commence functioning starting January 1, 1981.Project monitoring would also include reports of selected technical and finan-cial performance indicators, formats for which have been submitted by RWSSB(Annex 4).
3.31 For future extension (1984 or beyond) of the water supply systems inJaipur and Jodhpur, consultants are expected to be appointed by April 1, 1982,for the preparation of feasibility studies, and preliminary engineering. Aconsultant would also be appointed to prepare a health education program byMarch 31, 1982 in order to achieve envisaged health benefits under the project.
3.32 Operational standards are expected to improve gradually during theproject implementation period. Initial emphasis will be put on (i) meteringfor controlling water produced and consumed, (ii) commencement of a wastedetection program, and (iii) improvements in billing and collection.

- 18 -
Procurement
3.33 Annex 1, Table 11 shows material and equipment (M&E) requirements,cost estimates, assumed number of contracts and average contract sizes.Contracts for material and equipment would be awarded on the basis of (i)international competitive bidding (ICB) for an estimated value of about US$65million in accordance with IDA "Guidelines for Procurement" and (ii) localcompetitive bidding (LCB) for an estimated value of US$15 million in accordancewith acceptable local procurement procedures. LCB is recommended for concreteand stoneware pipes because of fragility and high transportation costs and forsuch other small items (contracts below US$150,000) which would not attractforeign bidders, will be needed in annual deliveries and are more suitable fordecentralized procurement.
3.34 The total value of civil works under the project is estimated atUS$52 million equivalent. Because of the dispersed nature of the project andthe limited possibilities of grouping the contracts there would be about 400contracts in rural areas and 80 in urban areas. One contract only wouldexceed US$6 million equivalent, the Jodhpur raw water main, which is estimatedat US$26 million equivalent including the cost for the pipe to be cast in situ.The average size of other contracts would be about US$50,000 in rural areas andabout US$300,000 in urban areas. The majority of the contracts would compriselabor intensive pipe laying works. Under these circumstances, LCB would beappropriate for all civil works and is recommended, except for the Jodhpur rawwater main for which ICB is proposed. Overall, the contracting industry iswell developed in Rajasthan and in India and would be adequate, and works willbe executed by force account only in unusual cases. Force account work, whenneeded, with a cost of less than US$30,000 equivalent may be undertakenwithout prior approval by IDA.
3.35 For ICB for material and equipment, a domestic preference of 15%
or the import duty, whichever is lower, is proposed to be applied in bidevaluation. For ICB for civil works, a domestic preference of 7.5% is pro-posed. Local bidding procedures are satisfactory. It is recommended thatlocal procurement would include the award of contracts to suppliers with whomthe Directorate General for Supply and Disposal (DGS&D) of GOI has enteredinto annual rate contracts after bidding. The contracts (ICB and LCB) will besuitably grouped to secure the advantages of economies of scale, but for theinitial requirements, it is envisaged that RWSSB may enter into some smallercontracts via DGS&D procedures to expedite the commencement of constructionworks.
3.36 It is recommended that IDA should review: (i) all documents and
proposed awards for material and equipment for contract values exceedingUS$150,000 equivalent; and (ii) documents and proposed awards for civil worksfor contract values exceeding US$500,000 equivalent. This would cover about90% of material and equipment costs (about US$84 million equivalent) and 60%of civil works costs (about US$30 million equivalent). A selected review ofother contract awards would be made prior to disbursement.

- 19 -
Disbursements
3.37 It is recommended that the proposed IDA credit should be disbursedas follows: (i) for equipment and material contracts, 100% of foreign expendi-tures (c.i.f. costs) for directly imported goods or 100% of local expenditures(ex-factory) for locally manufactured goods, or 35% of local expenditures forgoods procured locally; (ii) for civil works, 100% of foreign expendituresand 35% of local expenditures (including force account works); and (iii) 100%of consultant and training costs. A quarterly disbursement forecast is shownin Annex 1, Table 12.
3.38 Disbursement would be made against statements of expenditures forprogress payments in respect of civil works and material and equipment notexceeding Rs 300,000 (US$35,700 equivalent) and Rs 150,000 (US$17,900 equiv-alent), respectively. Relevant documents would be retained by RWSSB to besubject to regular local auditing to be available for review by IDA duringproject supervision. The institutional capacity after the introduction ofappropriate accounting systems would be satisfactory for these disbursementprocedures. Retroactive financing to an amount not exceeding US$500,000equivalent is recommended for the costs of consultant services incurred afterMay 1, 1979.
IV. FINANCIAL ANALYSIS
Past Financial Performance
4.01 The PHED, as a department of State Government, has maintainedGovernment type accounts rather than accounts under a double-entry, accrualaccounting system. For the appraisal they have, however, restated these cashaccounts in a commercial manner and have produced proforma financial state-ments. These statements relate separately to PHED's water supply operationsin the urban and rural areas of the State. Proforma sewerage financialstatements have been developed from records made available by the munici-palities of Jaipur, Jodhpur and Bikaner.
4.02 Prior to fiscal year 1980, revenues from water supply operations inurban areas did not cover operating costs as tariffs were too low. EffectiveApril 1, 1979, tariffs were increased. As a result of this action, It isestimated that PHED operations will approximately breakeven for the fiscalyear 1980. Annex 1, Table 13 provides a detailed income statement for thefiscal years 1978 and 1979 based on proforma accounts and an estimated incomestatement for the fiscal year 1980 based on a restatement of the annualdepartmental budget. A summary of these three years' activities follows:

- 20 -
Urban Water Operations
1978 1979 1980Proforma Actual Estimated
(Rs millions)
Operating Revenues 61.4 68.3 119.0Operating Expenses Exclu-
sive of Depreciation 75.4 86.9 106.5Depreciation 11.7 12.6 13.1Total Operating Expenses 87.1 99.5 119.6
Operating Deficit (25.7) (31.2) (0.6)
4.03 The water supply services in the 26 rural districts have alsooperated at a loss in the past even without giving consideration to depre-ciation as an operating expense. The primary reason for this is that GORhad followed a practice of not charging the consumers in the villages forstandpost water. Annex 1, Table 16 provides a detailed income statement forthe fiscal years 1978 to 1980. A summary of these three years' activitiesfollows:
Rural Water Operations
1978 1979 1980Proforma Actual Estimated
Operating Revenues 9.6 11.0 11.5Operating Expenses Exclu-
sive of Depreciation 28.9 32.3 49.7 /aOperating Income BeforeDepreciation (19.3) (21.3) (38.2)
Depreciation 10.2 12.7 15.8
Operating Deficit (29.5) (34.0) (54.0)
/a Reflects Rs 6.4 million of headquarters expense not previouslyallocated to local operations.
Present Financial Position
4.04 Annex 1, Tables 15 and 18 provide the estimated financial po-sition at March 31, 1980 for PHED's urban and rural water supply operationsrespectively. The debt-equity ratio, applicable to urban operations only, at34/66 would be acceptable. The current ratios of 1.7 for urban, and 1.1 forrural, would also be acceptable as of that date, considering that PHED'soperations are as a department of Government where all expenditures are met byGovernment. The estimated financial position at March 31, 1980 is summarizedas follows:

- 21 -
Urban Rural Total(Rs million)
Assets
Fixed Assets
Net Plant in Operation 322.3 509.9 832.2Plant under Construction 34.6 195.2 229.8
Total Fixed Assets 356.9 705.1 1,062.0
Net Current Assets 22.3 .3 22.6
Total Assets 379.2 705.4 1,084.6
Equity and Liabilities
Equity 245.7 705.4 951.1
Long-term Debt 126.6 126.6
Other Liabilities 6.9 6.9
Total Liabilities 379.2 705.4 1,084.6
4.05 On July 25, 1979, the GOR appointed a committee to review the valua-tion of the fixed assets of PHED. Under the direction of this committee thefixed assets were physically verified and valued at their historical cost.The valuation methods reflect Indian standard accounting practices and werediscussed and informally accepted by the Accountant General; the study wascompleted and the final report has been issued. The resulting figures willbe utilized in the establishment of RWSSB's opening Balance Sheet as ofApril 1, 1980.
Revenues and Tariffs
4.06 The details of current tariffs are set out in Annex 1, Table 19.Effective April 1, 1979, the net tariffs for all urban areas were increasedto Rs 0.80 per thousand liters for domestic consumers, Rs 1.20 per thousandliters for Commercial (1-1/2 times domestic) and Rs 1.60 per thousand litersfor Industrial (twice domestic). These are among the highest water tariffs inIndia.
4.07 The financial projections for the urban areas (see Annex 1, Table13) anticipate additional annual increases in all fiscal years from 1981through 1987. These projected increases would raise the average domestic rate(per thousand liters) in all urban areas of the state except Jodhpur to Rs 0.85in FY1981, Rs 0.90 in FY1982, Rs 0.95 in FY1983, Rs 1.05 in FY1984, Rs 1.15 in

- 22 -
FY1985, Rs 1.30 in FY1986 and Rs 1.40 in FY1987. For projection purposes,due to high investment costs, the tariffs for Jodhpur has been set at twicethe rate in the other cities in the fiscal year 1985.
4.08 The sewer systems, which will be transferred to RWSSB/PHED by April 1,1981, currently are operated by the municipalities from general funds and nobillings have been made to users. GOR believes that the sewerage system shouldbe self-supporting and plans to introduce sewerage charges from April 1, 1981.For projection purposes, these have been computed at 40% of the water chargethrough fiscal year 1985 and 50% thereafter. IDA obtained assurances from GORthat a sewerage charge would be introduced by April 1, 1981. It is expectedthat this change would reflect the tariff study (para 4.10) and be applicableto all premises with a water connection and within a prescribed distance froma sewer main.
4.09 The loans being proposed to finance sewer connections and basicplumbing installation costs for lower income groups (para 3.06) would beinterest-free to families with monthly household income to Rs 600 and with 4%interest to families with monthly household incomes from Rs 601 to Rs 1,200.The repayment period of these loans would be ten years. GOR agreed to developa detailed program to administer this consumer credit, acceptable to IDA, byDecember 31, 1980.
4.10 RWSSB has appointed a consultant to conduct a more comprehensivetariff study. Decisions based on this study should be made effective byApril 1, 1981 concerning:
(i) the introduction of a block tariff structure and relatedtariff levels;
(ii) the magnitude of the sewerage charge developed as a per-centage of the water charge; and
(iii) the extent to which tariffs should be uniform in urbanareas or be adjusted to reflect particular local costsand conditions.
4.11 In rural areas no charge has been levied for standpost water supplyand the charges for water connections are on a flat rate basis (Rs 8 per monthfrom fiscal year 1975). GOR plans to make rural water supply self-sufficientby increasing the flat rate for connections and by introducing a standpostwater supply charge. The local bodies would then be responsible for payingRWSSB for the service. The charges for each individual scheme would be basedon the population and the procedures for its collection would be adjusted tomeet particular local conditions.
4.12 This approach is largely untested and some collection problems canbe anticipated. In case of default the funds will be made available throughthe Development Department from grant-in-aid funds earmarked for the default-ing local body or from any other appropriate source.
- 23 -
4.13 The GOR has approved the conditions which will apply to ruralwater supply and will provide the necessary rulings to make these conditionseffective. These conditions will include:
(i) the requirement for the local body to contribute theequivalent of 2.5% of the total construction costsexcept for a minor amount of deserving cases wherethe voiding of this requirement will be communicatedto IDA;
(ii) the introduction of water charges sufficient to coveroperation and maintenance costs from April 1, 1981. Itwould appear that this would require a standpost watercharge equivalent to Rs 1 per person per month and aflat rate charge for connection of Rs 10 per month;
(iii) the authorizing of the local body to collect the stand-post water charges; and
(iv) in the event experience shows that the proposed level ofcollection for standpost water is not possible, StateGovernment budget allocations will be made availablethrough the Development Department of the State Govern-ment to cover the shortfall within 120 days of initialbilling.
Assurance that these conditions would be applied was obtained from GOR.
4.14 GOR has assured IDA that it intends to introduce a standpost watersupply charge in urban areas effective January 1, 1981, equivalent to Rs 1 perperson per month for that portion of the population using the standpost watersupply, to be paid by the municipality to PHED. GOR intends to obtain fundsfor this purpose by placing a 15% surcharge on the Octroi and depositing thedaily collections in the RWSSB's account. If this is not possible, the muni-cipalities will have to meet these obligations from their General Funds. Inthe event that any municipality does not make payment within 120 days ofbilling, GOR will make funds available to meet the shortfall through itsSelf-Government Department.
Future Financial Performance
4.15 Forecast Income Statements for urban operations for fiscal years1981-88 are shown in Annex 1, Table 13. Assumptions utilized in these pro-jections are shown in Annex 2. Significant measures of RWSSB/PHED's financialperformance during the project period, which are considered satisfactory,are indicated below:

- 24 -
Fiscal Year 1981 1982 1983 1984 1985
Average Tariff 0.85 0.90 0.95 1.05 1.15 /aOperating Revenues
(Rs million) 153.0 173.1 204.2 236.4 299.6Operating Ratio 94 95 91 88 78Rate of Return onNet Fixed Assets %Historical 2.70 2.40 3.91 5.06 8.98
Revalued (WholesalePrice Index) Neg Neg Neg - 2.96
Debt Service Coverage 1.3 1.1 1.2 1.2 1.5Current Ratio 2.4 2.2 2.4 2.1 2.0Debt Equity Ratio 40/60 49/51 54/46 69/31 74/26
/a Not applicable to Jodhpur.
4.16 As the water rates in Rajasthan are comparatively high when comparedwith other areas of India and per capita income is low, the proposed averagerates used in the urban projections have been designed to barely meet debtservicing requirements except that in fiscal year 1985 the rates in Jodhpurhave been increased substantially to reflect that city's high investmentcosts. Since India does not recognize the revaluation of assets, this earningsrequirement has been equated to a historical cost rate of return. IDA obtainedassurances from GOR that tariffs will be set to ensure the following earningsperformances in the urban areas:
(i) for fiscal year 1981, to produce at least revenue adequateto cover operations and maintenance costs and debt service(or depreciation, if greater);
(ii) for fiscal year 1982, after the commercial accountingsystem has been installed, to produce a rate of returnof 2% on net fixed assets;
(iii) for fiscal year 1983, to produce a rate of return of 3%;
(iv) for fiscal year 1984, to produce a rate of return of 5%; and
(v) for fiscal year 1985 and thereafter, to produce a rateof return of 8%.
4.17 Annex 1, Table 20 provides summary income statements and perform-ance indicators for the water and sewerage operations in each of the projectcities and for the total water operations in the ten project rural districts.A summary of each city's rate of return on historical cost follows:

- 25 -
Project CitiesJaipur Jodhpur Bikaner Kota Combined
Fiscal Year
1981Water 11.94 14.87 Neg 130.77 18.35Sewerage - - - - -Total 11.94 14.87 Neg 130.77 18.35
1982Water 14.06 16.10 Neg 69.16 15.10Sewerage 7.47 Neg Neg - 3.06Total 12.10 7.79 Neg 69.16 12.62
1983Water 12.66 8.40 Neg 27.93 11.22Sewerage 8.03 Neg Neg - 3.93Total 11.48 7.11 Neg 27.93 10.08
1984Water 11.01 7.53 Neg 20.32 9.34Sewerage 9.37 3.17 Neg - 5.94Total 10.67 7.05 Neg 20.32 8.94
1985Water 10.12 17.60 1.13 14.67 12.26Sewerage 5.77 23.45 2.82 - 8.70Total 8.97 18.07 1.39 14.67 11.75
These statements reflect acceptable performance with a composite earningsposition for the project's urban area greater than that required of RWSSB/PHEDas a whole. The rates of return for Jodhpur are influenced by the significantvalue of older plant and the doubling of the tariff in FY1985. Bikaner'slower rate of rate reflects the insignificant value of older plant and theapplication of the overall average tariff, while Kota's very high returnreflects the substantial amount of older plant.
4.18 Annex 1, Table 16 provides income statements for rural watersupply operations for the combined 26 rural districts which assumes therecommended charge of one rupee per head per month for the standpost waterservice. Since construction funds are provided by GOR as a grant, there isno requirement for revenue levels exceeding cash operating expenses. There-fore the projected earning position is acceptable.
Financing Plan
4.19 Funds Flow Statements appear as Annex 1, Table 14 for urban andAnnex 1, Table 17 for rural. RWSSB/PHED is expected to meet its debt serviceand working capital requirements from cash generation from operations and othercustomer payments. RWSSB/PHED estimated financial requirement and financingplan for capital investment for the project period FYs1980/85 is summarizedas follows:

- 26 -
Urban Rural Total Percent(Rs 000) US$ 000
Capital Improvement Program 903,101 1,660,566 2,563,667 305,198
IDA Credit - Loan to Urban,Grant to Rural 411,443 260,557 672,000 80,000 26.2
Government Project Financing- Loan to Urban, Grantto Rural 431,678 273,216 704,894 83,916 27.5
Government Grant for otherSanctioned Works 42,000 1,126,793 1,168,793 139,142 45.6
Grants from Other Sources 13,980 13,980 1,664 .5
Other Loans 4,000 4,000 476 .2
903,101 1,660,566 2,563,667 305,198 100.0
Commercial Accounting System
4.20 Consultants had been also employed to design and install a commercialaccounting system by April 1, 1981. This system would supplement the existingcash accounting system required by GOR, utilizing the source data and recordsof the cash system to the greatest degree possible to provide accounts andaccounting records needed in a commercial system. The system would not pro-vide for a separate cash account for RWSSB/PHED but it would provide for a"drawing account" representing funds which have been generated through theoperations of RWSSB and which continue to be designated for its future use.The system would also provide for the servicing of debt related to urbanschemes based on the following terms and conditions: 6.5% interest ratewith a 25 year term including a five years grace period.
Billing and Collection
4.21 PHED's billing and collection for customer connections appears tohave been reasonably effective in the past. However, adequate statisticalreports on customer balances, age of outstanding accounts and overall collec-tion performance are not currently available in headquarters to fully evaluateperformance. With the introduction of the commercial accounting system(para 4.20), the required data should be available to provide a positivecontrol on billing and collection performance. IDA obtained assurances fromRWSSB that adequate controls will be exercised to assure that the amount ofuncollected accounts does not exceed the value of three month's billings forthese accounts from FY1982.

- 27 -
4.22 The collection of standpost billings in the rural areas will prob-ably be more difficult and portions of these billings may have to be referredto the Development Department for payment from government budget funds. Itis anticipated that these referals will be made on a six month basis; conse-quently, receivable balances for these accounts will tend to be larger thanfor normal customer accounts. However, with effective collection practicesand proper follow-up, it is believed that these accounts can be kept to alevel of four months' billing for standpost water supply from FY1982. IDAobtained such assurances from GOR.
Audit
4.23 The RWSSB/PHED's commercial accounts will be subject to audit bythe Accountant General's office of the State of Rajasthan under delegationfrom the Comptroller and Auditor General of India. The Accountant Generalmaintains a commercial audit group and has agreed to produce a commercialtype long-form audit report acceptable to IDA. Assurances were obtainedthat RWSSB will submit audited statements of account to IDA within ninemonths of the end of the fiscal year beginning with fiscal year 1981.
Insurance
4.24 RWSSB would prefer, as has been the practice in other governmentundertakings, to follow the principle of self-insurance with GOR providingfunds for major casualty losses and to cover other risks as they occur.This concept is acceptable.
V. THE IMPLEMENTATION AND OPERATION AGENCY
Operating Arrangements
5.01 RWSSB/PHED will normally operate all water supply and sewerage works.In the event of transfer of the responsibility for such works to the respec-tive local body, an agreement between GOR and the local body would be required.IDA obtained assurances from GOR that in case of transfer, such agreements tobe entered into would contain conditions related to servicing of debt, organi-zation and staffing, and operational criteria to assure efficient operationand management as outlined in para 5.05.
Organization
5.02 The operations of the sector was reorganized effective May 1, 1980and is composed of three organizational levels--(i) the Committee of Direction;(ii) RWSSB; and (iii) PHED. The Committee of Direction meets infrequently,about every 6 months or at shorter intervals depending upon the requirementsof RWSSB. RWSSB is the management organ of the sector and would administerthe activities of PHED and provide the authority and flexibility necessary tomeet the day-to-day requirements of a commercially oriented entity. RWSSB
- 28 -
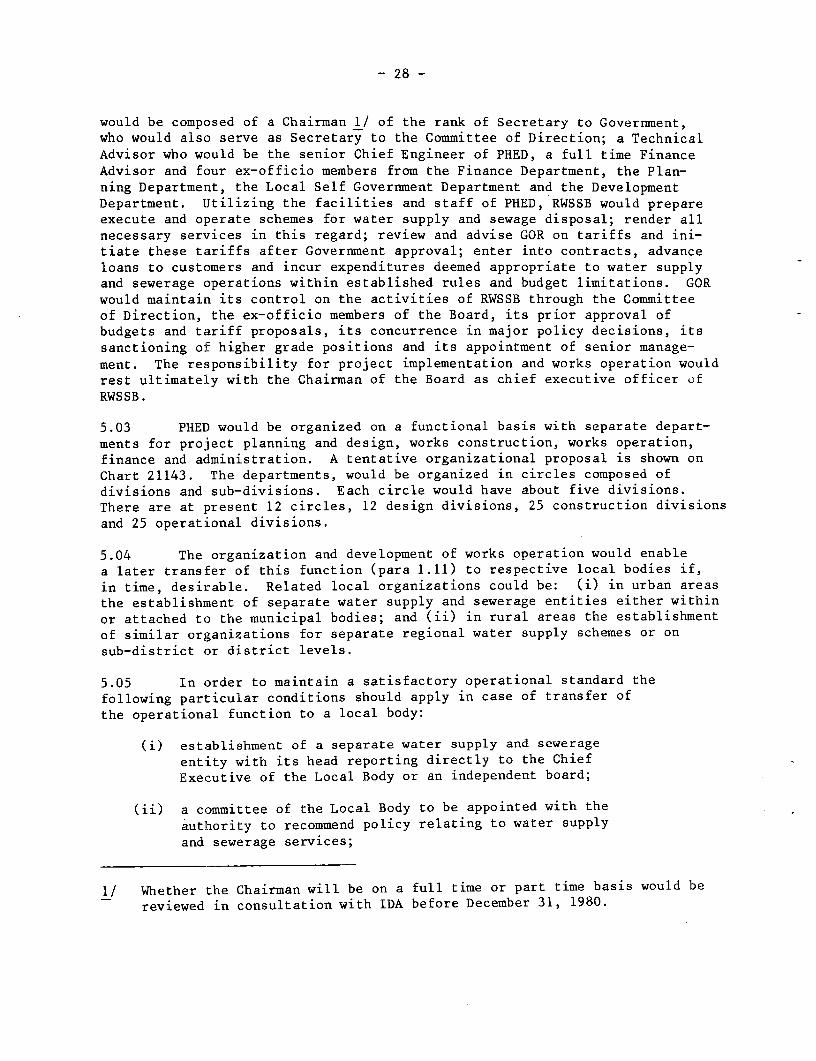
would be composed of a Chairman 1/ of the rank of Secretary to Government,
who would also serve as Secretary to the Committee of Direction; a Technical
Advisor who would be the senior Chief Engineer of PHED, a full time Finance
Advisor and four ex-officio members from the Finance Department, the Plan-
ning Department, the Local Self Government Department and the Development
Department. Utilizing the facilities and staff of PHED, RWSSB would prepareexecute and operate schemes for water supply and sewage disposal; render all
necessary services in this regard; review and advise GOR on tariffs and ini-
tiate these tariffs after Government approval; enter into contracts, advance
loans to customers and incur expenditures deemed appropriate to water supplyand sewerage operations within established rules and budget limitations. GOR
would maintain its control on the activities of RWSSB through the Committee
of Direction, the ex-officio members of the Board, its prior approval ofbudgets and tariff proposals, its concurrence in major policy decisions, its
sanctioning of higher grade positions and its appointment of senior manage-
ment. The responsibility for project implementation and works operation would
rest ultimately with the Chairman of the Board as chief executive officer of
RWSSB.
5.03 PHED would be organized on a functional basis with separate depart-
ments for project planning and design, works construction, works operation,
finance and administration. A tentative organizational proposal is shown on
Chart 21143. The departments, would be organized in circles composed of
divisions and sub-divisions. Each circle would have about five divisions.
There are at present 12 circles, 12 design divisions, 25 construction divisions
and 25 operational divisions.
5.04 The organization and development of works operation would enable
a later transfer of this function (para 1.11) to respective local bodies if,
in time, desirable. Related local organizations could be: (i) in urban areas
the establishment of separate water supply and sewerage entities either within
or attached to the municipal bodies; and (ii) in rural areas the establishmentof similar organizations for separate regional water supply schemes or on
sub-district or district levels.
5.05 In order to maintain a satisfactory operational standard thefollowing particular conditions should apply in case of transfer ofthe operational function to a local body:
(i) establishment of a separate water supply and sewerage
entity with its head reporting directly to the ChiefExecutive of the Local Body or an independent board;
(ii) a committee of the Local Body to be appointed with the
authority to recommend policy relating to water supplyand sewerage services;
1/ Whether the Chairman will be on a full time or part time basis would bereviewed in consultation with IDA before December 31, 1980.
- 29 -
(iii) the maintenance of a commercial accounting system separatefrom that of other local body activities with a separatebudget and bank account;
(iv) all funds generated from water supply and sewerage servicesto be first used to cover operational and maintenance costs,debt service, working capital increases and necessary systemextensions; any surplus funds might be transferred for use inother local activities;
(v) compliance with agreed technical and financial performanceindicators;
(vi) appointment of staff with appropriate qualifications; and
(vii) cost recovery should meet acceptable financial requirements.
IDA obtained assurances from GOR that any transfer of the operational func-tion for water supply and sewerage system from RWSSB to an urban local body(a) would not, without IDA's agreement, take place before April 1, 1986;this would ensure the establishment of uniform operational practice; (b)would not involve any basic changes in the organizational and functionalpattern to be established by RWSSB; and (c) would be subject to conditionssimilar to the above.
5.06 A deeper organizational study is required for RWSSB and consultantsare to be appointed by July 31, 1981 and would submit recommendations onorganizational structure by March 31, 1980. RWSSB would decide upon organi-zational structure and commence its implementation by July 1, 1981.
Management and Personnel
5.07 The present number of professional staff in PHED in differentpositions are: one chief engineer; one financial advisor; five additionalchief engineers; 12 superintending engineers; 71 executive engineers; 252assistant engineers; 833 junior engineers; and 44 accountants. The presenttotal staff numbers about 11,000, making it one of the largest governmentorganizations in the State.
5.08 The PHED's staff is experienced in general design matters and in theexecution of construction works. This project has brought a new approach tothe preparation of water supply and sewerage schemes, which is expected to befollowed for other projects. With the introduction of cost recovery criteriaand with the increased number of schemes being commissioned, the operationaldepartment will have to be expanded and further developed.
5.09 The projected increase in the work load during the project periodis significant. Difficulties in recruiting engineering personnel are notexpected as there is an adequate output of graduate engineers. Higher tech-nical positions can be filled by internal promotions. Difficulties couldarise in the recruitment of accounting personnel since the salary level, whichis State Government regulated, cannot compete with that being offered in the

- 30 -
private sector. However, most accounting personnel will be provided by theAccountant General thus limiting the extent of the recruiting difficulties.In order to handle the increased work requirements while expanding the RWSSBstaff, increased consultant use will be necessary (para 3.17).
5.10 A thorough study is required on manpower and staffing and consul-tants would be appointed by July 31, 1980 (the same one as under para 5.06).RWSSB would decide upon a staffing recruitment schedule and commence itsimplementation by July 1, 1981.
Training
5.11 PHED does not have a regular training program. The engineeringand operational staff are trained on-the-job after recruitment or reassign-ment. In the process of project preparation and implementation through con-sultant involvement, training has occurred in various design matters. Theaccountant consultant (para 4.20) will include in his assignment the trainingof staff in the development of commercial accounting systems and in financialmanagement. The consultant assignment (para 3.30) for project monitoring andreporting systems will also include training of staff.
5.12 A training consultant has been appointed, for the preparation ofan overall training program. By April 1, 1981, a training unit, adequatelystaffed, would be established within RWSSB and the training program wouldbegin to be implemented.
VI. ECONOMIC ANALYSIS
Marginal Cost Analysis
6.01 The marginal costs for water supply (per m 3) and sewerage (perconnection) at a 10% discount rate in the four project cities have beencomputed as below. No marginal cost analysis has been made for rural areas.
Jaipur Jodhpur Kota Bikaner
Water SI3 pply- Rs/m 0.7 3.2 1.3 1.9- USHlm 8.0 38.0 15.0 23.0
Sewerage- Rs/connection and month 10.0 14.0 - 27.0- US$/connection and month 1.19 1.67 - 3.21
6.02 The marginal costs for water vary significantly between the fourcities. The Jodhpur cost is very high, mainly because of a very expensive rawwater main, and similarly the Bikaner cost is comparatively high, mainlybecause of the need to change from a groundwater to a surface water source.

- 31 -
The marginal cost per sewer connection is significantly higher in Bikaner thanin Jaipur and Jodhpur, mainly because of the requirement to lay an almostcomplete system, since there are few existing facilities.
Pricing Considerations_~~~~~~~~~~~~~~~~~~~~~
6.03 The projected tariff levels in urban areas for water supply (Rs/m )and sewerage (Rs as an average per connection and month) are as follows (paras4.07 and 4.08):
FY 1981 1982 1983 1984 1985 1986
- Jaipur, Kota, Bikaner 0.85 0.90 0.95 1.05 1.15 1.30- Jodhpur 0.85 0.90 0.95 1.05 2.30 2.30
Sewerage- Jaipur - 14.0 15.0 16.0 18.0 25.0- Jodhpur - 11.0 12.0 13.0 27.0 35.0- Bikaner - 11.0 12.0 13.0 14.0 20.0
6.04 An analysis of the projected water and sewerage tariffs as comparedto the marginal costs indicates that: (i) the water in Jaipur is priced abovemarginal cost and in Kota the tariff level would about equal marginal cost byFY1986; (ii) the water in Bikaner and Jodhpur are, despite heavy tariff in-creases in Jodhpur, priced significantly below marginal cost; (iii) thesewerage service in Jaipur and Jodhpur (after 1985) are priced above marginalcost, while for Bikaner, the price is significantly below the marginal cost.These questions will be further analyzed in the proposed tariff study (para4.10). The marginal cost would, if it cannot be achieved as an averagerate, be applied in a block tariff structure for water used exceeding acertain amount.
6.05 An analysis has been made of the beneficiaries' ability to pay thewater supply and sewerage charges, which has taken into account: (i) avail-able statistics on household expenditures; (ii) assumed pattern of water con-sumption in various income groups; and (iii) a tentative block tariff structure.The water supply and sewerage costs as a percentage of household expenditureswere measured for three years (1981, 1982 and 1986) and are summarized belowfor the income group representing the second lowest 20% of the population (thelowest 20% use standpost water). By FY1982, the sewerage charge would beimposed and, by FY1986, the requirement for payment of debt services wouldbegin. In the income group below 20% there would be few water connections andhardly any sewer connections:
Fiscal Year 1981 1982 1986
Jaipur 3.0 3.6 4.5Jodhpur 2.0 2.2 5.8Kota 2.9 2.5 2.8Bikaner 2.3 2.7 3.3

- 32 -
6.06 The water and sewerage tariff levels are comparatively high, butwhen taking into account the percentage they represent of household expendi-tures, they would still be within the beneficiaries' capacity to pay. Thehigh charge for Jodhpur must be accepted considering the severe water scarcitysituation in that area.
Incremental Financial Rate of Return
6.07 The incremental financial rate of return, individually and combined,for the project towns are summarized as follows:
Water Supply Sewerage Total
Jaipur 9.3 6.4 8.3Jodhpur (1.2) 20.5 0.7Kota 4.8 - 4.8Bikaner 5.6 3.2 5.0Total (combined) 3.6 8.5 4.2
If labor is valued at 75% of market, the combined rate would be 5.8% (insteadof 4.2%). A sensitivity analysis shows that with a 10% increase in bothcapital and operational costs the rate of return (combined) would be 2.2% forwater, 7.2% for sewerage and 2.7% for water and sewerage together.
6.08 The above rates of return are comparatively low overall, which,however, is very much affected by the Jodhpur water supply scheme. ExcludingJodhpur, the rate of return (combined) would be 6.8% for water and 6.5% forwater and sewerage together, which would be reasonable. The overall ratewould therefore be acceptable since for Jodhpur there is no other feasiblealternative and no further increases of the tariff levels would be practicable.
Project Benefits and Impact on Poverty Groups
6.09 The financial rates of return do not reflect such benefits thataccrue from a water supply and sewerage project but cannot readily bequantified.
6.10 Major benefits that have not been quantified could be summarizedas follows:
(i) the provision of water supplies in rural areas relieves asignificant manpower input, presently occupied transportingwater from remote water sources, for other productivefunctions required for rural development;
(ii) the provision of water supplies favorably stimulates indus-trial developments and subsequent creation of employmentopportunities;
(iii) the use of safe water and proper sanitation facilitiesimproves health conditions, increases productivity andreduces medical and hospital costs; and

- 33 -
(iv) particularly in Rajasthan, the reduction of the use ofwater infected by guineaworm or containing excessivefluoride would, besides health benefits, have a signi-ficant social impact.
6.11 The project's rural component representing about 43% of totalproject cost for water supply, is mainly directed toward the provision ofstandpost water supply and would primarily meet the needs of rural povertygroups. The urban water supply systems would predominantly be for waterconnections, which because of a structured tariff would be affordable tomost income groups, with standposts mainly concentrated to unauthorizeddevelopment areas.
6.12 Any sewerage system will have to be extended gradually for economicalreasons but where sewer mains are being laid the total population would bein a position to connect to the system. Under the project the proportion ofthe sewerage component for covering loans for connection and basic plumbinginstallation costs (para 4.09) is about 25% and would directly benefit thelower income groups:
Project Merits and Risks
6.13 The project embodies a sectorwide approach. It should have asignificant impact on the institutional development of the water supplyand sewerage sector and on the provision of water supply and sewerage servicesto the entire State. Specialization will be created in engineering planningand design which would improve the quality of project preparation. Costrecovery systems will be established which will make the sector less dependenton State Government contributions and make adequate funds available forproper system operation.
6.14 The GOR sector development plan (paras 1.22 and 1.23) is veryambitious and a considerable effort will be required for its implementation;therefore, the possibilities of delays cannot be excluded. The project,however, covers only 54% of the plan and, with appropriate consultant assis-tance, adequate resources can be made available to ensure its completionwithin the project period.
6.15 The proposed cost recovery system for rural areas is largely untestedand the revenue collection from standpost water supply users might not berealized as projected. Consequently, any shortfalls for covering operationaland maintenance costs would have to be covered from State Government budgetallocations and scarce funds would have to be diverted from other importantrural development activities. In the extreme case that no standpost watersupply charges would be realized, the required State Government subsidy byFY1985 would amount to about Rs 111 million, which would correspond to about32% of projected capital investments for rural water supply for the same year.
- 34 -
VII. AGREEMENTS REACHED AND RECOMMENDATIONS
7.01 During negotiations agreements were reached with GOR on the follow-ing major points:
(i) allocation of water from Jewai impoundment to Jodhpur
(para 3.09);
(ii) terms and condition relating to provision of funds (para
3.24);
(iii) transfer of sewerage functions (paras 3.25 and 4.08);
(iv) transfer of operational functions (paras 3.25, 5.01 and 5.05);
(v) rural implementation program (para 3.26);
(vi) consultant for detailed engineering (para 3.27);
(vii) project monitoring and reporting (para 3.30);
(viii) feasibility studies for Jaipur and Jodhpur (para 3.31);
(ix) health education program (para 3.31);
(x) consumer financing program for sewer connections (para 4.09);
(xi) tariff study (para 4.10);
(xii) conditions applying to rural water supply schemes (para 4.13);
(xiii) urban standpost water charges (para 4.14);
(xiv) earnings requirements (para 4.16);
(xv) commercial accounting system (para 4.20);
(xvi) billing and collection (paras 4.21 and 4.22);
(xvii) audit (para 4.23);
(xviii) organization study (para 5.06);
(xix) manpower and staffing study (para 5.10); and
(xx) training program (para 5.12).
7.02 With the indicated assurances the project is suitable for an IDAcredit of US$80 million equivalent.

INDIA
RAJASTHAN WATER SUPPLY AND SEWERAGE PROJECT
RURAL AND URBAN AREAS
Service Levels
WATER SUPPLY SEWERAGEPopulation Served 1979 Population Served 1985 Population Served 1979 Population Served 1905
Population Connections Standposts Connections Standposts Con4ections Connections1979 _9_ _ nos_nos % n os Iwo nos
RURAL AREAS- 10 districts
(under the project) 9,919,000 11,309,000 370,000 4 2,270,000 23 935,000 8 5,760,000 51- 16 districts 15,869,000 17,863,000 505,000 3 3,106,000 20 975,000 5 5,985,000 34
Total 25,788,000 29,172,000 875,000 3 5,376,000 21 1,910,000 7 11,745,000 40 -
URBAN AREAS- Jaipur 890,000 1,078,000 578,ooo 65 196,000 22 841,000 78 172,000 16 221,180 25 412,290 38
Jodhpur 432,200 512,400 290,400 67 124,900 29 363,800 71 132,200 26 61,450 14 157,160 31- Kota 347,000 448,ooo 222,000 64 83,000 24 367,ooo 82 81,000 18 - - -- Bikaner 280,700 333,700 213,300 76 44,900 16 287,000 86 46,700 14 - - 89,680 27
Sub-total 1,949,900 2,372,100 1,303,700 67 448,800 23 1,858,800 78 431,900 18 282,630 18 659,130 34_ Remaining Towns 4,178,000 4,925,000 2,422,000 58 856,ooo 20 3,415,oo0 69 687,000 14 - - 112,000 2
Total 6,127,900 7,297,100 3,725,700 61 1,304,800 21 5,273,800 72 1,118,900 15 282,630 5 771,130 U
H

IfDIA
RAJASTHAN WATER SUPPLY AND SEWERAGE PROJECT
RURAL AND URBAN AREAS
Past and Projected Water Supply and Sewerage Sector Investments
Total1951-74 1974-78 1978-83 1983-88 1978/79 1979/80 1980/81 1981/82 1982/83 1983/84 1984/85 1960/81 t4
Fiscal Year (23 Years) (4 Years) (5 Years) (5 Years) _ _ 1984/85- - - - - - - - - Project Period - - - - - - - - -
A. RURAL AREASTotal 262.5 306.4 1,362.3. 1,469.7 136.4 195.2 300.0 346.4 384.1 280.0 350.0 1,660.5
B. URBAN AREAS
B1. WATER SUPPLY- Jaipur 16.9 82.3 89.0 6.7 8.o 6.3 26.2 29.9 45.1 36.3 143.8- Jodhpur 6.7 60.2 254.2 0.5 9.5 14.5 16.3 25.2 146.1 144.5 346.6- Kota 1.3 57.8 69.o 0.4 2.0 12.3 26.8 13.7 35.4 21.4 109.6- Bikaner 1.4 48.9 55.6 2.4 2.0 10.7 21.4 15.5 27.6 20.7 95.9
Sub-total 26.3 249.2 467.8 10.0 21.5 43.8 90.7 84.3 254.2 222.9 695.9
B2. SEWERAGE- Jaipur 5.9 20.0 57.3 5.1 5.6 2.8 3.8 3.9 38.2 28.5 77.2
- Jodhpur 0.9 7.6 23.6 0.4 2.0 1.1 1.9 2.8 13.6 13.9 33.3- Bikaner O.4 8.0 25.9 o.6 1.2 1.2 2.1 3.6 16.7 13.5 37.1
Sub-total 7.2 35.6 106.8 6.1 8.8 5.1 7.8 10.3 68.5 55.9 147.6
Total (B1 + B2) 33.5 284.8 574.6 16.1 30.3 48.9 98.5 94.6 322.7 278.8 843.5
B3 OTHER URBAN AREAS 91.8 144.1 345.8 33.9 37.7 16.6 17.4 26.0 - - 60.0(Water Supply and Sewerage)Total (B1 + B2 + B3) 248.4 125.3 428.9 92o.4 50.0 68.o 65.5 115.9 120.6 3W.7 278.8 903.5
C. RURAL AND URBAN AREASGrand Total (A 4+ B) 510.9 431.7 1,791.0 2,390.1 186,4 263.2 365.5 462.3 504.7 602.7 628.8 2,564.0
D. InA - PROJECT- Water Supply (rural) 46.4 98.2 131.2 140.0 18.o 533.8- Water Supply (urban) 43.8 90.7 84.3 254.2 222.9 695.9- Sewerage 5.1 7.8 10.3 68.5 55.9 147.6Total 95.3 196.7 225.8 462.7 396.8 1,377.3
Note: Totals may not agree due to rounding.The amounts are in current values.
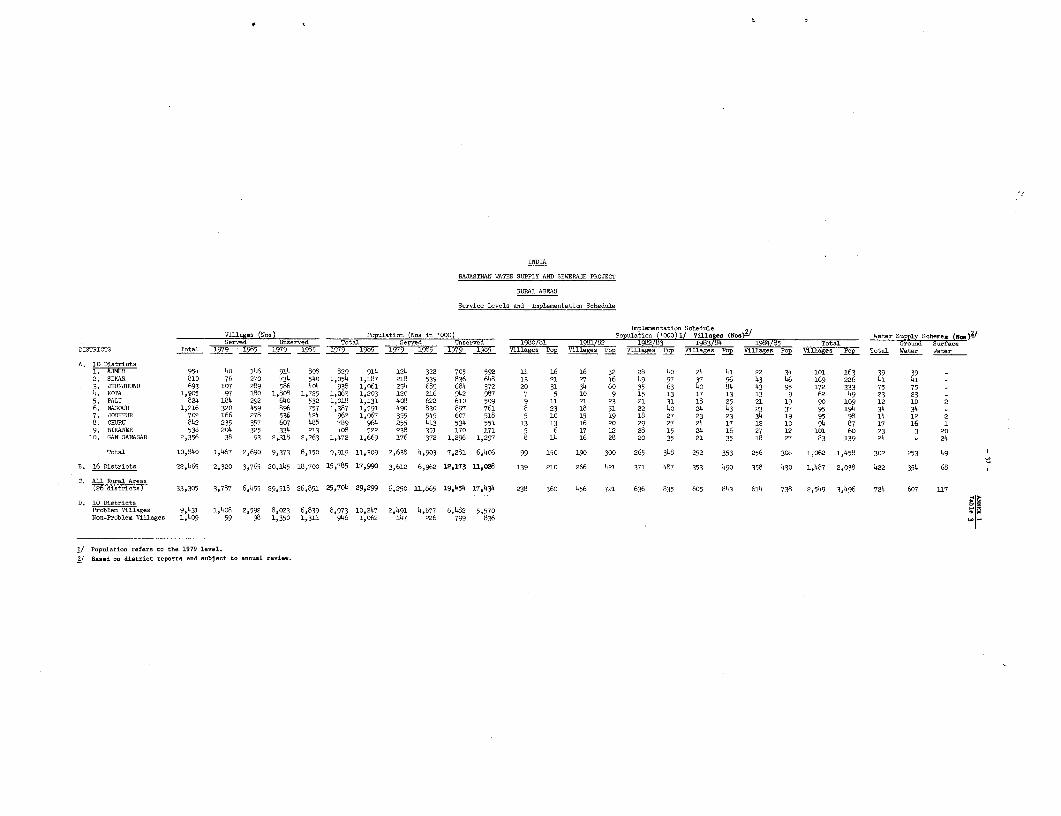
RAJASTHAN WATER SUPPLY AND SEWERAGE PROJECT
RURAL AREAS
Service L-1ele and Imple-entatim Echedolo
OmpleneataionShdlVillaesg (No.) Population (N.O in '000) Poplatica ('000)1/ Villases (Noe) Water Supply Scheme-. (Nes9ServeS Saserved Total Served Unserved 1980/81 1981/82 19 283/4 1984/85 Total Ground Sorfa-e
DISTRICTS Total 1979 1955 1979 1985 1979 1985 1979 1979 1979 1985 Villages Pop Villages Pop V ilages Pop Villages Pop Viliogee Pop Villages Pop Total Water Water
A. 10 Diotricte1, AJMER 954 48 146 914 808 829 914 124 322 705 592 11 16 i6 32 28 4A 24 4t 22 34 101 163 39 39 -
2. SIKAR 810 76 270 734 54o 1,054 1,187 218 539 836 648 13 21 27 46 49 57 37 56 43 46 169 226 4A 4i _
3; JHUNdJPOUN 693 107 289 586 404 938 1,o61 254 689 684 372 20 31 34 60 35 63 4o 84 43 95 172 333 75 75 -4. KOTA 1,905 97 180 1,808 1,725 1,062 1,203 120 216 942 987 7 5 10 9 15 13 17 13 13 9 62 49 23 23 _5. PALI 824 184 292 64o 532 1,018 1,131 408 622 610 509 9 11 21 23 21 31 18 25 21 19 92 129 12 10 2
6. NAGOUR 1,216 320 459 896 757 1,387 1,591 430 830 897 761 8 23 18 51 22 40 24 43 23 37 95 194 34 34 -7 7ODHPUR 702 i66 278 536 424 962 1,867 355 549 607 518 5 10 15 19 18 27 23 23 34 19 95 98 14 12 2
8. ChURU 842 235 357 607 485 789 964 255 413 534 551 13 13 16 20 29 27 24 17 12 10 94 87 17 16 1
9, BIKANR11 538 2o4 325 334 213 408 522 238 351 170 171 5 6 17 12 28 15 24 16 27 12 101 60 23 3 20
10. GAN GANAGAR 2,356 38 93 2,318 2,263 1,472 1,669 176 372 1,296 1,297 8 14 16 28 20 35 21 35 18 27 83 139 24 - 24
Tot:l lo,84o 1,467 2,690 9,373 8,150 9,919 11,309 2,638 4,903 7,281 6,406 99 150 198 300 265 348 252 353 256 308 1,062 1,458 302 253 49
B. 16 fi,tricto 22,46S 2,320 3,765 20,145 18,700 15,785 17,990 3,612 6,962 12,173 11,098 139 210 266 421 371 487 353 490 358 430 1,487 2,038 422 354 68
C. All Rural Arena
(26 dHstrhotel 33,305 3,787 6,455 29,518 26,851 25,704 29,299 6,250 11,865 19,454 17,434 238 360 456 721 636 835 605 843 614 738 2,549 3,496 724 607 117
D. 10 DUStrieta 1 5Prohlem Villages 9,431 1,408 2,392 8,023 6,839 8,973 10,247 2,491 4,677 6,482 5,578Ron-P-oblem Villages 1,409 59 98 1,350 1,301 946 t,o62 147 226 799 836 -
1/ Populaticn refers to the 1979 level.
Z/ Based os district reports sad subject te s-nseS revise.

Al 1
IlllIA
RAJASTHAN WATER SUPPLY AND SEWERAGE PROJECT
URBAN AREAS WATER SUPPLY
Salient Data and Service Levels
Jaipur 9/80 Kota Bikaner1979o5le/86 1990/91. 1958 1990 9 i 998 1985/8E6 1990/91 1 9 98 1955/K8 1990/91
1. Population (Nos.) 890,000 1,078,000 1,254,000 432,200 512,400 587,000 347,000 448,0oo 550,000 280,700 333,700 389,400
2. Ponolation Served
2.01 by connections
. non 578,000 841,oo0 1,066,000 290,400 363,800 446,100 222,000 367,000 478,000 213,300 287,000 334,900
-8 of total population 65 78 85 67 71 76 64 82 87 76 86 86
_ average no/connection 9 8 8 10 10 8 10 10 10 10 9 9
2,02 by standpoats
_ nos 196,000 172,000 157,000 124,900 132,200 128,000 83,000 81,000 72,000 44,900 46,700 54,500
- 8 of total population 22 16 13 29 26 22 24 18 13 16 14 14
- average no/connection 196 16o 132 93 98 94 345 300 252 112 116 135
2.03 by other mecns
- nos 116,000 65,ooo 31,000 16,900 16,400 12,900 42,000 - - 22,500
_ of total population 13 6 2 4 3 2 12 - - 8
3. Connectiona/Standposta (Nos)
3.01 Domestic
metered 59,740 105,100 133,250 26,4So 34,650 55,760 21,160 37,500 50,000 14,250 31,885 37,205
- unnetered 3,780 - - 1,950 _ _ - - - 7,080 - -
total 63,520 105,100 133,250 28,400 34,650 55,760 21,160 37,500 50,000 21,330 31,885 37,205
3.02 Commercial (metered) 3,800 4,400 4,900 1,64o 1,86o 2,210 1,000 1,480 1,880 226 284 345
3.03 Induntrial (metered) 450 880 1,190 450 600 850 535 780 1,005 682 855 21,042
3.04 Total no connections 67,770 110,380 139,340 30,490 37,110 58,820 22,695 39,760 52,885 22,238 33,024 38,592
3.05 Standposts 1,000 1,075 1,250 1,340 1,345 1,365 240 270 285 403 403 403
4. Water Demand, M-a Day (lcd)
domestic 140 140 14o 86 120 120 138 145 155 114 120 120
-standpost 50 50 50 36 50 50 50 50 50 45 50 50
5. Water Demand (m3/day)
5.01 Domestic Consumption 80,920 117,740 149,240 24,974 43,656 53,532 30,636 53,215 74,090 24,316 34,440 40,188
5.02 Standpost Conaumption 9,800 8,600 7,850 4,496 6,61o 6,400 4,150 4,050 3,600 2,245 2,335 2,725
5.03 Commercial Consumption 7,600 8,8oo0 o,4oo 2,448 2,991 3,554 2,000 2,960 3,760 630 1,761 2,139
5.04 Industrial Consumption 4,550 8,900 11,950 3,805 5,073 7,187 3,200 4,690 6,o40 1,208 2,699 3,292
5.05 Others - - - 17,145 19,478 31,145 3,600 l0,0O0 10,500 600 3,693 5,525
5.06 Unaccounted for 34,280 48,010 59,810 10,132 25,936 33,940 10,900 25,400 33,000 5,000 14,975 17,954
5.07 Total Demand 137,150 192,050 239,250 63,000 103,744 135,758 54,486 100,315 130,990 34,000 59,903 71,823
6. Water Production Capacity (n3/day)
6.01 Surface Water 54,400 91,000 91,000 51,750 123,750 123,750 54,500 127,000 191,000 - 60,000 60,000
6.02 Ground Water 87,720 125,640 148,4oo 11,250 10,850 8,850 - - - 34,000 11,220 9,282
- no. of bore holes 204 318 386 12 12 12 - - - 34 34 26
6.03 Total 142,120 216,640 239,400 63,000 134,600 132,600 54,500 127,000 191,000 34,000 71,220 69,282
7. Water Supply Systecma
7.01 Balancing Neservoira
-nos 24 30 36 5 7 9 6 12 14 8 13 15
- capacity (In3) 25,145 32,395 46,412 24,100 30,650 36,900 5,4o0 21,677 25,176 4,903 10,508 12,948
-% of demand 18 17 19 38 30 27 10 22 19 14 18 18
7.02 T-rnS.nission Main. (kn) 166 257 290 57 67 72 4 23 23 88 133 139
7.03 Distribution Mais (kI) 573 802 972 340 495: 605 110 334 359 110 280 305
Note: Totals may not agree due to roundings.Data for intervening yearn are available in the Project Pile.
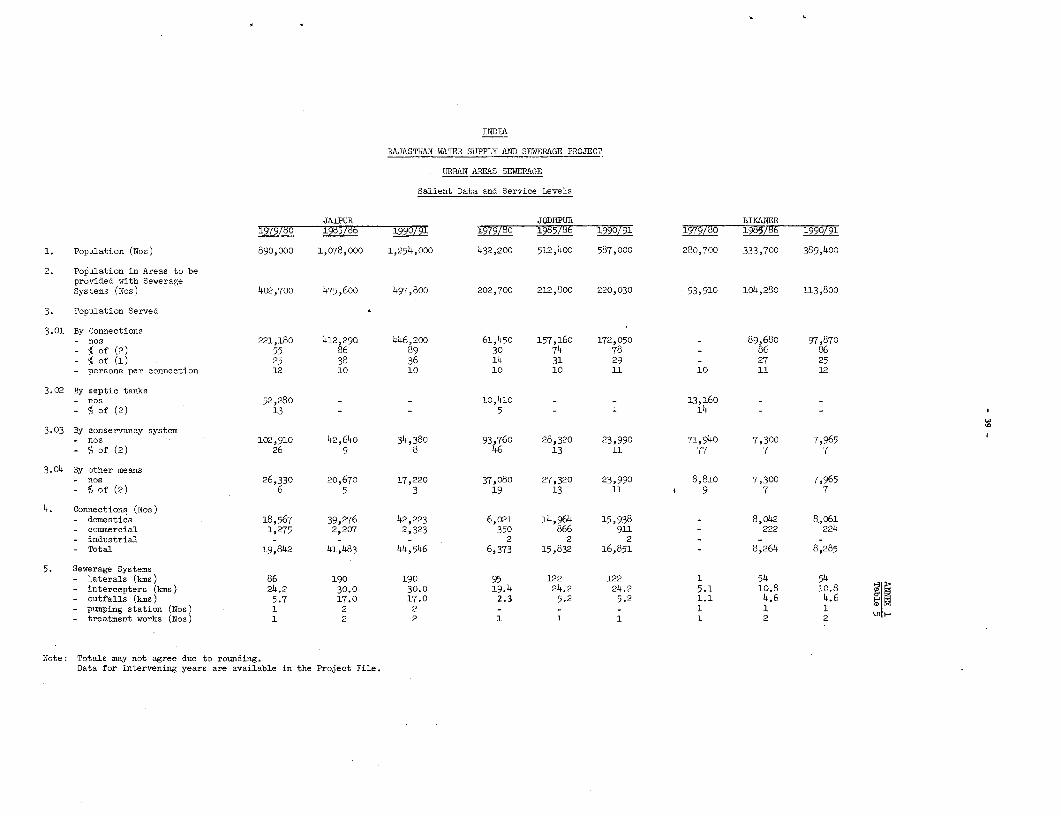
INTIA
RAJASTHAN WATER SUPPLY AND SEWERAGE PROJECT
URBAN AREAS SEWERAGE
Salient Data and Service Levels
JAIPUR JODHPUR BIKANER1979/80 1985/86 1990/91 1979/80 1985/86 1990/91 1979/80 1985/86 1990/91
1. Population (Nos) 890,000 1,078,000 1,254,000 432,200 512,400 587,000 280,700 333,700 389,400
2. Population in Areas to beprovided with SewerageSystems (Nos) 402,700 475,600 497,800 202,700 212,800 220,030 93,910 104,280 113,800
3. Population Served
3.01 By Connections- nos 221,180 412,290 446,200 61,450 157,160 172,050 - 89,680 97,870- % of (2) 55 86 89 30 74 78 _ 86 86_ % of (1) 25 38 36 14 31 29 - 27 25- persons per connection 12 10 10 10 10 11 10 11 12
3.02 By septic tanks- nos 52,280 - - 10,410 - - 13,160 - -
- of (2) 13 _ - 5 - - 14 - -
3.03 By conservancy system- nos 102,910 42,640 34,380 93,760 28,320 23,990 71,940 7,300 7,965- % of (2) 26 9 8 46 13 11 77 7 7
3.04 By other means- nos 26,330 20,670 17,220 37,080 27,320 23,990 8,810 7,300 7,965-%of (2) 6 5 3 19 13 11 1 9 7 7
4. Connections (Nos)- domestics 18,567 39,276 42,223 6,021 14,964 15,938 _ 8,o42 8,061- commercial 1,275 2,207 2,323 350 866 911 - 222 224- industrial - - - 2 2 2 - - -- Total 19,842 41,483 44,546 6,373 15,832 16,851 - 8,264 8,285
5. Sewerage Systems- laterals (kms) 86 190 190 95 122 122 1 54 54- intercepters (kms) 24.2 30.0 30.0 19.4 24.2 24.2 5.1 10.8 10.8- outfalls (kmss) 5.7 17.0 17.0 2.3 5.2 5.2 1.1 4.6 4.6
pumping station (Nos) 1 2 2 - - - 1 1 1treatment works (Nos) 1 2 2 1 1 1 1 2 2
Note: Totals may not agree due to rounding.Data for intervening years are available in the Project File.
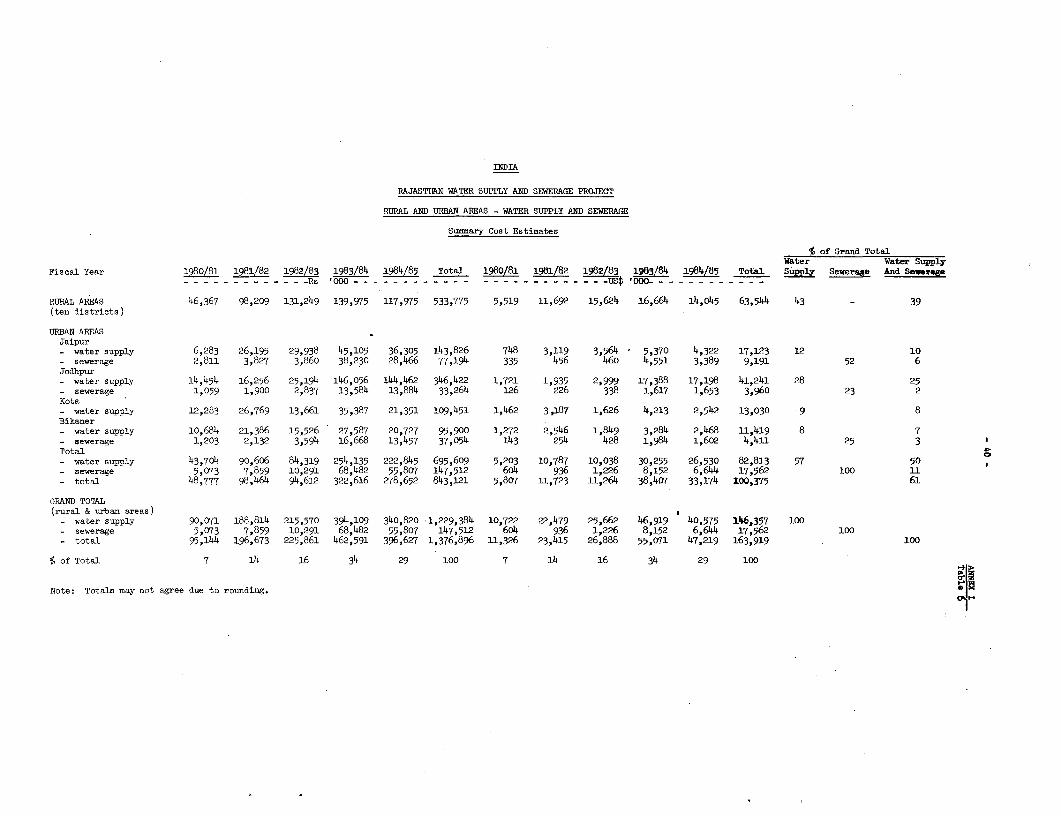
INDIA
RAJASTIAN WATER SUPPLY AND SEWERAGE PROJECT
RURAL AND URBAN AREAS - WATER SUPPLY AND SEWERAGE
Summary Cost Estimates
% of Grand TotalWater Water Sujpply
Fiscal Year 1980/81 1981/82 1982/83 1983/84 1984/85 Total 1980/81 1981/82 1982/83 1983/84 1984/85 Total Supply Sewerage And Sewrage-- - - - - - - - - - - -Rs '000 - - - - - - - - - - - - - - - - - - - - - - - - -US'O000- - - - - - - - - - - -
RURAL AREAS 46,367 98,209 131,249 139,975 117,975 533,775 5,519 11,692 15,624 16,664 14,045 63,544 43 - 39
(ten districts)
URBAN AREASJaipur- water supply 6,283 26,195 29,938 45,105 36,305 143,826 748 3,119 3,564 5,370 4,322 17,123 12 10
- sewerage 2,811 3,827 3,860 38,230 28,466 77,194 335 456 46o 4,551 3,389 9,191 52 6Jodhpur- water supply 14,454 16,256 25,194 146,056 144,462 346,422 1,721 1,935 2,999 17,388 17,198 41,241 28 25
- sewerage 1,059 1,900 2,837 13,584 13,884 33,264 126 226 338 1,617 1,653 3,960 23 2
Kota- water supply 12,283 26,769 13,661 35,387 21,351 109,451 1,462 3,187 1,626 4,213 2,542 13,030 9 8Bikaner- water supply 10,684 21,386 15,526 27,587 20,727 95,900 1,272 2,546 1,849 3,284 2,468 11,419 8 7
- sewerage 1,203 2,132 3,594 16,668 13,457 37,054 143 254 428 1,984 1,602 4,411 25 3
Total- water supply 43,704 90,606 84,319 254,135 222,845 695,609 5,203 10,787 10,038 30,255 26,530 82,813 57 50- sewerage 5,073 7,859 10,291 68,482 55,807 147,512 604 936 1,226 8,152 6,644 17,562 100 11
- total 48,777 98,464 94,612 322,616 278,652 843,121 5,807 11,723 11,264 38,407 33,174 100,375 61
GRAND TOTAL(rural & urban areas)
- water supply 90,071 188,814 215,570 394,109 340,820 1,229,384 10,722 22,479 25,662 46,919 40,575 i46,357 100
- sewerage 5,073 7,859 10,291 68,482 55,807 147,512 604 936 1,226 8,152 6,644 17,562 100
- total 95,144 196,673 225,861 462,591 396,627 1,376,896 11,326 23,415 26,888 55,071 47,219 163,919 100
%of Total 7 14 16 34 29 100 7 14 16 34 29 100
Note: Totals may not agree due to rounding.

INDIA
RAJASTHAN WATER SUPPLY AND SEWERAGE PROJECT
RURAL AREAS - WATER SUPPLY
Cost Estimates
%ofFiscal Year 1980/81 981/82 1982/83 1983/84 1984/85 Total 1980/81 1981/82 1982/83 1983/84 1984/85 Total Grand Total
- - - - - - - - - - - - - - Rs '000 - - - - - - - - - - - - - - - - - - - - - US$ '000 - - - - - - - - - - - - -
ALL DISTRICTS COMPOSITEA. Basic Costs
- civil works 11,775 17,021 21,859 19,.312 24,758 94,725 1,402 2,026 2,602 2,299 2,947 11,276 18- MEE 20,382 45,554 56,065 58,488 37,294 217,783 2,426 5,423 6,674 6,963 4,44o 25,926 41- Total 32,157 62,575 77,924 77,800 62,052 312,508 3,828 7,449 9,276 9,262 7,387 37,202 59
B. Physical Contingencies- civil works 1,178 1,702 2,186 1,931 2,476 9,473 140 203 260 230 295 1,128 2- MWE 2,038 4,555 5,607 5,849- 3,729 21,778 243 542 668 696 444 2,593 4- Total 3,216 6,257 7,793 7,780 6,205 31,251 383 745 928 926 739 3,721 6
C. Price Contingencies- civil works 1,684 4,306 7,694 8,710 13,345 35,739 200 513 916 1,037 1,589 4,255 7- MEE 2,915 11,525 19,735 26,378 20,101 80,654 347 1,372 2,349 3,140 2,393 9,601 15- Total 4,599 15,831 27,429 35,088 33,446 116,393 547 1,885 3,265 4,177 3,982 13,856 22
Sub-total A+B+C- civil works 14,637 23,029 31,739 29,953 40,579 139,937 1,742 2,742 3,778 3,566 4,831 16,659 27- M&E 25,335 61,634 81,407 90,715 61,124 320,215 3,016 7,337 9,691 10,799 7,277 38,120 60- Total 39,972 84,663 113,146 120,668 101,703 460,152 4,758 10,079 13,469 14,365 12,108 54 779 87
D. Engineering 6,395 13,546 18,103 19,307 16,272 73,623 761 1,613 2,155 2,299 1,937 8,765 13Grand Total A+B+C+D 46,367 98,209 131,249 139,975 117,975 533,775 5,519 11,692 15,624 16,664 14,045 63,544 100%of Total 9 18 25 26 22 100
GRAND TOTAL DISTRICT WISE1. Ajmer 3,683 7,860 10,418 11,854 9,420 43,235 438 936 1,240 1,411 1,121 5,146 82. Sikar 4,901 9,795 13,304 14,919 11,974 54,893 583 1,166 1,584 1,776 1,426 6,535 103. Jhunjhunu 5,699 11,474 15,545 16,666 14,871 64,255 678 1,366 1,851 1,984 1,770 7,649 124. Kota 1,711 3,629 4,830 5,126 4,383 19,679 204 432 575 610 522 2,343 45. Pali 3,974 8,473 11,221 12,013 10,138 45,819 473 1,009 1,336 1,430 1,207 5,455 96. Nagou 5,678 12,104 16,035 17,161 14,479 65,457 676 1,441 1,909 2,043 1,724 7,793 127. Jodhpur 6,255 13,322 17,642 18,852 15,908 71,979 745 1,586 2,100 2,244 1,894 8,569 138. Churu 5,449 11,626 15,398 14,543 13,845 60,861 649 1,384 1,833 1,731 1,648 7,245 119. Bika 5,148 9,213 13,654 14,992 11,933 54,940 613 1,097 1,626 1,785 1,421 6,542 11
10. Ganga Nagar 3,869 10,713 13,202 13,849 11,024 52,657 461 1,275 1,572 1,649 1,312 6,269 10 ,
Note: Totals may not agree due to rounding.M&E = Material and Equipment.

INDIA
RAJASTHAN WATER SUPPLY AND SEWERAGE PROJECT
URBAN AREAS - WATER SUPPLY AND SEWERAGE
Cost Estimates(Composite Four Towns)
%ofFiscal Year 1980/81 1981/82 1982/83 1983/84 1984/85 Total 1980/81 1981/82 1982/83 1983/84 1984/85 Total Grand Total
- - - - - - - - - - Rs ' OO - - - - - - - - - - - - - - - - - - - - - - - - - - us$ * oo- -- - - - - - - - -
WATER SUPPLYA. Basic Costs
- civil works 4,416 14,237 11,974 64,067 37,589 132,283 526 1,695 1,426 7,627 4,475 15,749 19- M&E 23,249 40,316 35,044 68,540 70,989 238,138 2,768 4,799 4,172 8,160 8,451 28,350 34- Total 27,665 54,553 47,018 132,607 108,578 370,421 3,294 6,494 5,598 15,787 12,926 44,ogg 53
B. Physical Contingencies- civil works 663 2,263 1,963 10,090 6,317 21,296 79 269 234 1,201 752 2,535 3- MbE 3,487 6,688 6,o8g 12,681 14,036 42,981 415 796 725 1,510 1,671 5,117 6- Total 4,150 8,951 8,052 22,771 20,353 64,277 494 1,065 959 2,711 2,423 7,652 9
C. Price Contingencies- civil works 660 3,794 4,457 30,404 21,494 60,809 79 452 531 3,620 2,559 7,241 9- M&E 3,476 10,811 13,162 33,300 41,664 102,413 414 1,287 1,567 3,964 4,96o 12,192 15- Total 4,136 14,605 17,619 63,704 63,158 163,222 493 1,739 2,098 7,584 7,519 19,433 24
Sub-total A+B+C- civil works 5,739 20,294 18,394 104,561 65,400 23A,388 684 2,416 2,191 12,448 7,786 25,525 31- M&E 30,212 57,815 54,295 114,521 126,689 383,532 3,597 6,882 6,464 13,634 15,082 45,659 55- Total 35,951 78,109 72,689 219,082 192,089 597,920 4,281 9,298 8,655 26,082 22,868 71,184 86 >
D. Engineering 7,753 12,497 11,630 35,053 30,756 97,689 923 1,488 1,385 4,173 3,662 11,631 14GRAND TOTAL A+B+C+D 43,704 go,606 84,319 254,135 222,845 695,609 5,204 10,786 10,040 30,255 26,530 82,815 100% of Total 6 13 12 37 32 100 6 13 12 37 32 100
SEWERAGEA. Basic Costs
- civil works 2,155 2,903 3,602 22,304 17,059 48,023 257 346 429 2,655 2,031 5,718 32- M&E 1,210 1,886 2,242 14,105 11,018 30,461 144 225 267 1,679 1,312 3,627 21- Total 3,365 4,789 5,844 36,409 28,077 78,484 401 571 696 4,534 3,343 9,345 53
B. Physical Contingencies- civil works 323 436 54o 3,345 2,559 7,203 38 52 64 398 305 857 5- M8E 182 283 337 2,116 1,653 4,571 22 34 40 252 197 545 3- Total 505 719 877 5,461 4,212 11,773 60 86 104 650 502 1,402 8
C. Price Contingencies- civil works 322 768 1,325 10,516 9,613 22,544 38 92 158 1,252 1,144 2,684 15- M&E 181 499 825 6,650 6,209 14,364 22 59 98 792 739 1,710 10- Total 503 1,267 2,150 17,166 15,822 36,908 60 151 256 2,044 1,883 4,394 25
Sub-total A+B+C- civil works 2,800 4,107 5,467 36,165 29,231 77,770 333 490 651 4,305 3,480 9,259 53- MAE 1,573 2,668 3,404 22,871 18,880 49,396 188 318 4o5 2,723 2,248 5,882 33_ Total 4,373 6,775 8,871 59,036 48,111 127,166 521 808 1,056 7,028 5,728 15,141 86
D. Engineering 700 1,084 1,419 9,446 7,697 20,346 83 129 169 1,125 916 2,422 14GRAND TOTAL A+B+C+D 5,073 7,859 10,290 68,482 55,808 147,512 604 937 1,225 8 153 6,644 17,563 100,of Total 3 5 8 46 38 100 3 5 8 46 38 100
Note: Totals may not agree due to rounding.M&E = Material and Equipment.

RAJASTHAN WATER SUPPLY AND SEWERAGE PROJECT
URBAN AR3AS - WATER SUPPLY
Cost Estimates
JAIPYR JODHPURY KOTA BIKANER TOTAL, FOUR TOWER9 fof f 79 f-of f 9 of
Grand Grand Gan.d Gan.d Grand
Partiulas CEW WAS Totol Totsal ME.. mm Total Total C,W WM&E Total Total CW. MRE Total Total _W. RM&E Total Cw. WAE Total Total
A. BASIC COSTS
1. Source Developaeat 10,502 4,357 14,859 10 - - - _ _ - - - 9,063 36 9,099 9 19,565 4,393 23,959 2,329 523 2,852 3
2. ICtake 805 195 1,O0 1 1,040 260 1,300 - 220 - 220 - 100 496 596 1 2,165 951 3,116 258 113 371 -
3. Raw Water Mains 625 16,458 17,983 12 41,863 81,502 123,365 36 337 2,852 3,189 3 - - - - 42,825 100,812 143,637 5,096 12,002 17,100 21
4. Treatme-t Works 3,003 1,947 4,950 3 5,908 2,532 8,44o 2 5,250 2,250 7,500 7 1,400 600 2,000 2 15,561 7,329 22,890 1,853 873 2,726 3
5. Clear Wall 1,940 485 2,425 2 1,448 362 1810 1 1,600 - 1,60o 1 3,150 1,933 5,083 5 8,138 2,780 10S,92B 969 331 1,300 2
6. Puapiog Statioos - 5,106 5,106 4 1,876 4,301 6,177 2 - 2,391 2,391 2 - - - - 1,876 11,798 13,674 223 1,405 1,628 2
7. Trarsmission Maits 253 8,332 8,585 6 - - - - 2,786 17,286 20,072 18 180 6,o62 6,242 7 3,219 31,680 34,899 383 3,772 4,155 5
8. Servioe Se,ervaot 1,651 498 2,149 1 2,o46 511 2,557 1 5,383 1,681 7,064 6 2,152 627 2,779 3 11,232 3,317 14,549 1,337 395 1,732 2
9. Distribution MRio 187 5,225 5,412 4 1,150 21,950 23,000 7 2,064 7,684 9,748 9 925 18,372 19,297 20 4,326 53,131 57,457 515 6,325 6,84o 8
10. Water Meter, - 5,600 5,600 4 - 815 815 - - 2,021 2,021 2 - 1,996 1,996 2 - 10,432 10,432 - 1s242 1,242 2
11. Land Aeqoisition 477 - 477 - 600 - 600 - 1,581 - 1,581 2 1,143 - 1,143 1 3,801 - 3,801 453 - 453 1
12. Misoellaneo-e 6,542 4,529 11,071 8 4.064 3,766 7.830 2 4.990 1,402 6,392 6 3.979 1,818 5,797 6 19.575 11.515 31,090 2,330 l,jft 3,701 4
Sab-total (A) 25,985 52,732 78,717 55 59,995 115,899 175,894 51 24,211 37,567 61,778 56 22,092 31,940 54,032 56 132,283 238,138 370,421 15,748 28,352 44,100 53
B. P8Y3YCAL CONTINGENCIES 3,899 7,910 11,809 8 10,451 24,646 35,097 10 3,631 5,635 9,266 8 3.315 4,790 B,105 8 21,296 42,981 64.277 2,535 5,117 7,652 9
Sob-total (A+B) 29,884 60,642 90,526 63 70,446 140,545 210,991 61 27,842 43,202 71,044 64 25,407 36,730 62,137 64 153,379 281,119 434,698 18,293 33,469 51,752 62
C. PRICE CONTINGENCIES 11,736 20,864 32,600 23 29,677 57,091 86,768 25 10.o76 13,235 23,311 22 9,320 11,223 20,543 22 6o,809 102,413 193,222 7,239 12,192 19,431 24
Sub-total (AuBRC) 41,620 81,506 123,126 86 100,123 197,636 297,759 86 37,918 56,437 94,355 86 34,727 47,953 82,680 86 214,388 393,532 597,920 25,522 45,661 71,183 86
D. ENGINEERING 7,o50 13,650 20,700 14 16,540 32,105 48,645 14 6.040 9,056 15,096 14 5,550 7,680 13,230 14 35,180 62,491 97,671 4,188 7,440 11,628 14
GPAND TOTAL 48,670 95,156 143,826 100 116,663 229,741 346,404 100 43,958 65,493 109,451 lRO 40,277 55,633 95,910 100 249,568 446,023 695,591 29,710 53,101 82,811 100
% f total 21 50 16 13 100
Note: C.W. = CiEil Warks.M&E = plate-ial and Equipmest.Totals mapy et agree due to ro-nding.

INDIA
RAJASTHAN WATER SUPPLY AND SEWERAGE PROJECT
URBAN AREAS - SEWERAGE
Coat Estimates
JAIPURe JODHPUR BIKAlER TOTAL. TREE TOWNS
Grad Grad G-ad Gran
Parti-- c.W. NA Tota Totll C.W. mu Total TotKa G.W. MAE Total Total CW. MK&E Total C.W. M1E Total Totall
A. PASIC COSTS
1. Coanotiosa 3,922 3,836 7,758 10 3,323 3,467 6,790 21 3,016 3,039 6,055 16 10,261 10,342 20,603 1,222 1,231 2,453 14
2. Lataral 11,082 2,691 13,773 18 3,139 891 4,030 12 5,589 1,730 7,319 20 19,810 5,312 25,322 2,358 632 2,990 17
3. Tateroaptora 1,363 531 1,894 . 2 791 490 1,281 4 845 584 1,429 4 2,999 1,605 4,604 357 191 548 3
4. Puping Stotioaa 262 135 397 1 - - - _ _ - - - 262 135 397 31 IS 47 -
5. Preaore Maai 88 115 203 - - - - - - - - - 88 215 203 10 14 24 -
6. Outfell Serr 4,659 6,199 10,858 14 890 895 1,785 5 934 1,323 2,257 6 6,482 8,417 14,899 772 1,002 1,774 10
7. Diapoal Wor-k 213 149 362 1 184 145 329 1 120 95 215 1 517 389 906 62 46 106 1
8. Lnd Aoqoilitio 2,430 - 2,430 3 781 - 781 2 588 - 588 2 3,799 - 3,799 452 - 452 3
9. Mi-aoolanao- 1,413 1,946 3.359 4 1,203 1,480 2,683 8 1,187 720 1,907 5 3,803 4,146 7,949 453 494 947 5
Sob-total (A) 25,432 15,602 41,034 53 10,311 7,368 17,679 53 12,279 7,491 19,770 53 48,021 30,461 78,482 5,717 3,626 9,343 53
B. PHYSICAL CONTINGENCES 3.815 2,342 6.157 8 1.546 1,106 2.652 8 i,841 1,125 2,966 8 7,202 4,573 11,775 857 544 i,401 8
SGb-total (A+B) 29,247 17,944 47,191 61 11,857 8,474 20,331 61 * 14,120 8,616 22,736 61 55,223 35,034 90,257 6,574 4,170 10,744 61
C. PRICE CONTINGENCIES 11.981 7,375 19,356 25 4,875 3,470 8,345 25 5,688 3,519 9,207 25 22.544 14,364 36,908 2,684 1,710 4,394 25
Sob-total (A+B.C) 41,228 25,319 66,547 86 16,732 11,944 28,676 86 19,808 12,135 31,943 86 77,767 49,398 127,165 9,258 5,880 15,138 86
D, ENGINEERING 6,601 4,046 10,647 14 2,661 1,927 4,588 14 3,169 1,942 5,111 14 12,431 7,915 2.0346 1,480 942 2,422 14
GRAND TOTAL (A+BfC+D) 47,829 29,365 77,194 100 19,393 13,871 33,264 100 22,977 14,077 37,054 100 90 '98 57,313 147,511 10,738 6,822 17,560 100
% of Total 52 23 25 100
Notoe C.W. = Civol Work,.
MAE = Material and Evuipment.
Totala may not agree do, to roanding.

INDIA
RAJASTHAN WATER SUPPLY AND SEWERAGE PROJECT
RURAL AND URBAN AREAS
Material and Equipment Requirements
Quanitities - Coat Estimates Contracts 2Basic Inlc. Basic Incl.C
Units Rural Urban Total Basic Contingencies Basic Contingencies Nos Ave Size- - - - -Rs '000 - - - - US - - - - USe O000
A. WATER SUPPLY1. Pipes Q''
- Asbestos-cement (A.C)!/ KM 3,681 462 4,143 223,165 343,674 26,568 40,914 5 8,000
- P.V.C.2] KM 5 - 5 460 708 55 84 2 40
- Cast Iron KM - 116 116 52,224 80,425 6,217 9,575 5 2,000
- Galvanized Iron KM 28 6 34 1,581 2,435 188 290 5 60
- Concrete 2/ KM - 66 66 75,651 116,503 9,006 13,870 - -
- Steel KM _ 6 6 11,279 17,370 1,343 2,068 3 700
2. Valves NOs 8,400 815 9,215 6,607 10,175 787 1,211 4 300
3. Treatment Plants NOS 48 5 53 12,282 18,914 1,462 2,252 2 1,100
4. Chlorination Equipment NOS 285 40 325 1,816 2,797 216 333 5 60
5. Pumps NOS 1,145 277 1,422 20,894 32,177 2,487 3,831 10 380
6. Water Meters- Bulk NOS - *70 70 718 1,106 85 132 3 40- Domestic NOS - 91,000 91,000 9,714 14,960 1,156* 1,781 4 450
7. Casings KM 33 4 37 7,175 11,050 854 1,316 4 350
8. Strainers EM 8 6 14 3,560 5,482 424 653 5 130
9. M.S. Bars and Sections MT 5,200 1,845 7,045 19,964 30,745 2,377 3,660 5 750
Total (A) 447,090 688,521 53,225 81,970
B. SEWERAGE1. Pipes
- Stone Ware KM 105 105 1,896 2,920 226 348 5 75
- R.C.C. (Concrete) KM - 102 102 10,792 16,620 1,285 1,979 5 4002. Pumps NOS - 4 411 85 131 10 16 1 16
3. Manhole Covers NOS - 5,800 5,800 1,821 2,804 217 334 4 80
4. Vent Shafts NOS - 280 280 323 497 38 59 4 15
5. Foot Steps NOS - 33,000 33,000 413 636 49 76 4 20
6. Sewer Connections- W.C. with Fittings NOS - 24,000 24,ooo 2,467 3,799 294 452 5 go- Connection Pipes KM - 300 300 2,674 4,118 318 190 5 100
- Miscellaneous LS - - - 5 377 8 281 6410 96 10 100
Total (B) 3,077 4,740
C. MISCELLANEOUS1. Drilling Rigs NOS 6 1 7 4,545 6,999 541 833 2 4002. Leak Detection Equipment NOS - 10 10 250 385 30 46 1 463. Sewer Cleaning Equipment L.S. - - - 1,364 2,101 162 250 1 24. Vehicles NOS 21 63 84 7,576 11,667 902 1,389 10 15. Office & Laboratory Equipment LS - - - 1,391 2,142 166 255 4 60
6. Well Point Equipment NOS _ 2 2 400 616 48 73 1 73Total (C) 15,526 23,910 1,849 2,8
GRAND TOTAL A+B+C 488,464 752,237 58,151 89,556
Note: KM = KilometersNOS = NumbersMT = Metric TonsLS = Lump SumTotal may not agree due to rounding.
The proportions of AC and PVC pipes to be procured may change.2/ Raw water pipe (Johdpur) to be laid in situ by the civil works contractor.
2/ Tentative numbers and contract sizes.

- 46 -
ANNEX 1Table 12
INDIA
RAJASTHAN WATER SUPPLY AND SEWERAGE PROJECT
Estimated Schedule of Disbursements
IDA Fiscal Year Quarterly Cumulative Disbursements % ofAnd Quarter Ending Disbursements At End of Quarter Total
US$ Millions US$ Millions
1981December 31, 1980 0.5 0.5 1March 31, 1981 2.6 3.1 4June 30, 1981 2.6 5.7 7
1982September 30, 1981 2.7 8.4 11December 31, 1981 2.7 11.1 14March 31, 1982 2.7 13.8 17June 30, 1982 2.7 16.5 21
1983September 30, 1982 3.1 19.6 25December 31, 1982 3.1 22.7 28March 31, 1983 3.1 25.8 32June 30, 1983 3.1 28.9 36
1984September 30, 1983 6.5 35.4 44December 31, 1983 6.5 41.9 52March 31, 1984 6.5 48.4 61June 30, 1984 6.5 54.9 69
1985September 30, 1984 5.6 60.5 76December 31, 1984 5.6 66.1 83March 31, 1985 5.6 71.7 90June 31, 1985 5.6 77.3 97
1986September 30, 1985 2.7 80.0 100

- 47 -
INDIA ANHEX 1
RAJASTHAN WATER SUPPLY AND SEWERAGE PROJECT TABLE 13
RAJASTHAN WATER SUPPLY AND SEWERAGE BOARD
URBAN AREAS
INCOME STATEMENT(RB 000)
Proforma Actual Estimated Forecast
For the Year Ended March 31 1978 1979 1980 1981 1982 1983 1984 1985 1986 1987 1988
Population (000) 5,735 5,930 6,128 6,304 6,484 6,690 6,874 7,081 7,297 7,525 7,760
Population Served ByMetered Connections (000) 3,144 3,362 3,615 3,868 4,142 4,431 4,673 4,974 5,264 5,583 5,896
Unmetered Connections (000) 116 122 111 88 66 44 21
Standposts (000) 1,326 1,316 1,304 1,283 1,256 1,228 1,200 1,162 1,120 1,069 1,022
Other Means (000) 1,149 1,130 1,098 1,065 1,020 987 980 945 913 873 842
Total Number ConnectionsDomestic Metered 202,996 215,960 255,127 277,561 312,863 349,312 384,134 414,744 451,759 489,659 526,564
Domestic Unmetered 123,119 133,569 126,261 118,057 110,060 102,375 94,901 87,776 83,329 78,219 74,353
Commercial Metered t13?882 14,493 16,487 18,452 20,154 22,270 22,589 25,826 28,448 30,408 32,490
Industrial Metered 3;071 3,441 4,235 4,737 5,257 5,872 6,254 6,969 7,630 8,329 8,957
Standposts 7,077 7,202 7,212 7,217 7,222 7,227 7,232 7,287 7,322 7,357 7,415
Other 94 94 94 94 94 94 94 94
Water Production (million liters)_ 172,243 181,285 210,389 222,085 232,539 257,400 269,261 281,331 303,887 319,069 332,834
Water TariffDomestic Metered .60 .60 .80 .85 .90 .95 1.05 1.151-/ 1.301' 1.401/ 1.401/
Domestic Unmetered 8.00 8.00 IO." 10.00 10.00 10.00 10.00 10.00 10000 10.00 10.00
Commercial Metered .90 .90 I.20 1.2;5 1.35 1.425 11575 1 72r/ 195. 21 .10'l 2.10-
Industrial Metered .90 .90 1.60 1.70 1.80 1.90 2.10 2.30- 2.60- 2 80- 280-/
Standpost (per person/month) 1.00 1.00 1.00 1.00 1.00- 1:00 11 1:00 1/ 1.0
Meter Rent 1.25 1.25 1.50 1.50 1.50 1.50 2.00 2.00 2.04
Connection Fee 10.00 10.00 15.00 15.00 15.00 15.00 20.00 20.00 20.00
Operating Revenues - WaterDomestic Metered 33,525- 37,058 69,016 82,105 92,250 114,606 1371137 173,987 208,225 236,367 253,102
Domestic Unmetered 11,783 12,795 15,293 14,321 13,362 12,440 11,542 10,684 12,008 11,264 10,707
Commercial Metered 5,485 5,818 12,990 14,511 15,958 19,805 22,570 28,238 33,911 38,304 40, H5
industrial Metered 3,018 3,438 8,803 12,097 13,849 16,457 19.669 26,291 31,231 35,907 38,537
Standpost 63 63 100 15,397 15,217 10,726 12.671 14,437 18.684 22,226 24,108
Bulk Supply 4,005 5,302 7,893 9,034 10,071 15,741 15,311 21,358 2D,738 20,956 21,260
Meter Rent 2,668 2,806 3,505 4,012 5,274 6,101 6,766 7,527 10,632 11,572 12404
Connection Fee 274 240 321 348 540 598 534 505 800 801 788
Miscellaneous 598 795 1,071 1,208 1,350 1,496 1,642 1,770 1,911 2,044 2,177
'Total Operating Revenues - Water 61,419 68,315 118,992 153,033 167,871 197,970 277,842 284,797 338,140 381,441 403,478
Operating Revenues - SewerageDomestic
4,439 5,175 7,065 12,295 19,154 20,784 21,170
Commercial 625 743 1,003 1,821 2,655 2,846 2,71
Industrial 4 4 5 10 14 15 16
Sale of Sullage 63 74 87 89 89 94 95
Sale of Sewerage Water 56 63 79 104 117 119 121
Interest on Connection Loans 66 132 341 524 584 524 461
Total Operating Revenue - Sewerage _T8 5,253 6_191 8,580 14.843 22 3 24382 24 4
Total Operating Revenue 61.419 68.315 '118,992 153,033 173,124 204.161 236,422 Z299,640 24.382 411L2299,40 30.73 405.823 428lJJ2
Operating ExpensesSalary and Wages 31,721 36,518 47,200 57,412 64,820 74,871 83,275 92,298 101,788 111,043 120,591
Power and Fuel 21,741 25,920 29,902 38,764 43,994 49,559 54,533 57,920 65,049 71,031 77,272
Raw Water 2,388 3,577 3,166 3,734 4,149 4,794 5,243 5,698 6,168 6,816 7,585
Chemicals 1,942 2,332 2,776 3,592 3,958 4,546 5,034 5,496 6,178 6,736 7,310
Maintenance Materials 9,667 9,826 8,845 9,413 11,064 11,221 13,222 14,900 18,194 18,758 19,894
Headquarters Expenses 4,157 4,501 9,189 11,292 12,799 14,499 16,131 17,631 19,738 21,438 23,265
Other 3,778 4,261 5,423 5,741 6482 7.487 8,328 9.,230 10,179 11,104 12,Q59
Total Operating Expenses BeforeDepreciation 75,394 86,935 106,501 129,948 147,266 166,977 185,766 203,173 Z27,294 246,926 267,976
Depreciation 11,692 12,565 13,088 14,119 16,421 19,043 22,445 29,397 38,746 44.269 46,995
Total Operating Expenses 87,086 99,500 119.589 144,067 163,687 186,020 208,211 232,570 266,040 291;195 314.971
Operating Income (Loss) (25,667) (31,185) (597) 8,966 9,437 18,141 28,211 67,072 94,713 114,628 113,241
Interest Expense 8,407 9,334 9,750 11.201 16,548 22.222 35,133 54,053 62,204 60,535 58.939
Net Income (Lass) (34,074) (40.519) (10,347) (2,235) 1 (4081) (6.922) 13.017 32,509 54.093
Average Net Plant In Operation 298,272 315,072 330,198 332,521 393,860 464,184 557,712 746,747 1,002,666 1,134,633 1,179,872
Rate of Return () Bleg Neg Neg 2.70 2.40 3.91 5.06 8.98 9.45 10.10 9.60
Operating Ratio 142 146 101 94 95 91 88 78 74 72 74
1/ A higher rate has been applied to Jodhpur operations to produce earnings necessary to support the costs of the pipe line con-
struction needed to improve its water supply.

- 48 -
INDIA ANNEX 1
RAJASTHAN WATER SUPPLY AND SEWERAGE PROJECT TABLE 14
RAJASTHAN WATER SUPPLY AND SEWERAGE BOARD
URBAN AREA
FUNDS FLOW STATEMENT(Rs 000)
ProformaActual Estimated Forecast
For the Year Ended March 31 1980 1981 1982 1983 1984 1985 1986 1987 1988
Sources of FundsInternal GenerationOperating Income (Loss) (597) 8,966 9,437 18,141 28,211 67,070 94,713 114,628 113,241Depreciation 13,088 14,119 16,421 19,043 22,445 29,397 38,746 44,269 46,995
Total Internal Generation 12,491 23,085 25,858 37,184 50,656 96,467 133,459 158,897 160,236
BorrowingsLoans for Other Works 9,617 4,000 4,038 8,993 8,619IDA Credit Loan 23,803 48,050 46,171 157,437 135,382Government Loan - IDA Project _ 24,974 50,414 48,441 165,179 142,670Total Borrowings 9,617 52,777 98,464 94,612 322,616 278,652 4,038 8,993 8,619
Other SourcesGovernment Grants for SanctionedWorks 24,812 8,000 14,000 20,000 22,000 32,500
Grants from Other Sources 2,000 4,611 3,353 6,016 6,588 7,124 7,893Customer Deposits 819 733 779 878 789 728 899 885 896Government Grants for Operations 12,227Payment on Connection Loans 308 639 1,613 3,011 3,642 3,702 3,765Total Other Sources 39,858 13,244 18,440 27,533 2,402 3,739 11,129 33,711 45,054
Total Sources 61,966 89,206 142,762 159,329 375,674 378,858 148,626 201,601 213,909
Application of FundsCapital Program
IDA Project - Water 43,704 90,605 84,321 254,134 222,845IDA Project - Sewerage 3,480 4,358 5,891 52,098 43,477Other - Water 34,612 16,611 17,353 26,016 80,626 101,117 120,012Connection Loans 1,593. 3,501 4,400 16,384 12,330Total Capital Program 34,612 65,388 115,817 120,628 322,616 278,652 80,626 101,117 120,012
Debt ServiceProject LoansInterest 1,585 6,371 12,646 26,205 45,779 54,459 53,042 51,530Principal _ _ _ _ 21,469 22,886 24,398Total Debt Service - ProjectLoans 1,585 6,371 12,646 26,205 45,779 75,928 75,928 75,928
Other LoansInterest 9,750 9,616 10,177 9,576 8,928 8,274 7,745 7,493 7,409Principal 6,318 6,885 7,939 8,478 8,746 8,839 8,938 9,045 7,333Total Debt Service - OtherLoans 16,068 16,501 18,116 18,054 17,674 17,113 16,683 16,538 14,742
Total Debt Service 16,068 18,086 24,487 30,700 43,879 62,892 92,611 92,466 90,670
Increase in Working CapitalCash 17,669 3,429 3,907 21,264 22,160 (50,148) 2,890 1,650Other 11,286 (11,937) (971) 4,094 (12,085) 15,154 25,537 5,128 1,577
Total Increase in Working Capital 11,286 5,732 2,458 8,001 9,179 37,314 (24,611) 8,018 3,227
Total Applications 61,966 89,206 142,762 159,329 375,674 378,858 148,626 201,601 213,909
Debt Service Coverage 0.8 1.3 1.1 1.2 1.2 1.5 1.4 1.7 1.8
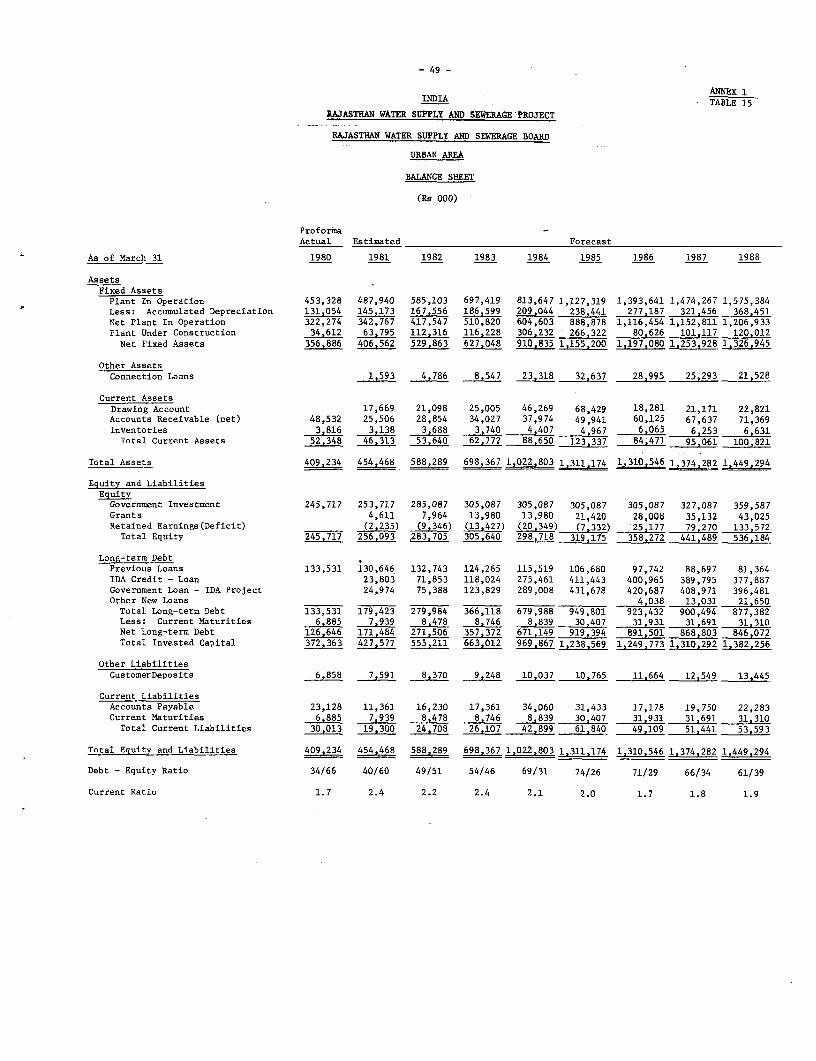
- 49 -
ANNEX 1INDIA - TABLE 15
RAJASTHAN WATER SUPPLY AND SEWERAGE PROJECT
RAJASTHAN WATER SUPPLY AND SEWERAGE BOARD
URBAN AREA
BALANCE SHEET
(Rs 000)
Proforma -Actual Estimated Forecast
As of March 31 1980 1981 1982 1983 1984 1985 1986 1987 1988
AssetsFixed AssetsPlant In Operation 453,328 487,940 585,103 697,419 813,647 1,127,319 1,393,641 1,474,267 1,575,384Less: Accumulated Depreciation 131,054 145,173 167,556 186,599 209,044 238,441 277,187 321,456 368,451Net Plant In Operation 322,274 342,767 417,547 510,820 604,603 888,878 1,116,454 1,152,811 1,206,933Plant Under Construction 34,612 63,795 112,316 116,228 306,232 266,322 80,626 101,117 120,012Net Fixed Assets 356,886 406,562 529,863 627,048 910,835 1,155,200 1,197,080 1,253,928 1,326,945
Other AssetsConnection Loans 1,593 4,786 8,547 23,318 32,637 28,995 25,293 21,528
Current AssetsDrawing Account 17,669 21,098 25,005 46,269 68,429 18,281 21,171 22,821Accounts Receivable (net) 48,532 25,506 28,854 34,027 37,974 49,941 60,125 67,637 71,369Inventories 3,816 3,138 3,688 3,740 4,407 4,967 6,065 6,253 6,631Total Current Assets 52,348 46,313 53,640 62,772 .88_,650 123,337 84,471 95,061 100,821
Total Assets 409,234 454,468 588,289 698,367 1,022,803 1,311 174 1,310,546 1,374 282 1,449,294
Equity and LiabilitiesEquityGovernment Investment 245,717 253,717 285,087 305,087 305,087 305,087 305,087 327,087 359,587Grants 4,611 7,964 13,980 13,980 21,420 28,008 35,132 43,025Retained Earnings(Deficit) (2,235) (9,346) (13,427) (20,349) (7,332) 25,177 79,270 133,572Total Equity 245,717 256,093 .283,705 305,640 298,718 319,175 358,272 441,489 536,184
Long-term DebtPrevious Loans 133,531 130,646 132,743 124,265 115,519 106,680 97,742 88,697 81,364IDA Credit - Loan 23,803 71,853 118,024 275,461 411,443 400,965 389,795 377,887Government Loan - IDA Project 24,974 75,388 123,829 289,008 431,678 420,687 408,971 396,481Other New Loans _ 4,038 13,031 21,650Total Long-term Debt 133,531 179,423 279,984 366,118 679,988 949,801 923,432 900,494 877,382Less: Current Maturities 6885 7,939 8,478 8,746 8,839 30,407 31,931 31,691 31,310Net Long-term Debt 126,646 171,484 271,506 357,372 671,149 919,394 891,501 868,803 846,072Total Invested Capital 372,363 427,577 555,211 663,012 969,867 1,238,569 1,249,773 1,310,292 1,382,256
Other LiabilitiesCustomerDeposits 6,858 7,591 8,370 9,248 10,037 10,765 11,664 12,549 13,445
Current LiabilitiesAccounts Payable 23,128 11,361 16,230 17,361 34,060 31,433 17,178 19,750 22,283Current Maturities 6,885 7,939 8,478 8,746 8,839 30,407 31,931 31,691 31,310Total Current Liabilities 30,013 19,300 24,708 26,107 42,899 61,840 49,109 51,441 53,593
Total Equity and Liabilities 409,234 454,468 588,289 698,367 1,022,803 1,311,174 1,310,546 1,374,282 1,449,294
Debt - Equity Ratio 34/66 40/60 49/51 54/46 69/31 74/26 71/29 66/34 61/39
Current Ratio 1.7 2.4 2.2 2.4 2.1 2.0 1.7 1.8 1.9

_50 - ANNEX 1
TABLE 16
INDIARAJASTHAN WATER SUPPLY AND SEWERAGE PROJECT
RAJASTHA WATER SUPPLY AND SEWERAGE BOARD
RURAL WATER SUPPLY - INCOME STATEHENT(Re 000)
Proforma Actual Estimated Forecast
For the Year Ending March 31 1978 1979 1980 1981 1982 1983 1984 1985 1986 1987 1988
Population Served By (000)Domestic Connections 820 917 1,008 1,105 1,369 1,524 1,644 1,808 1,978 2,136 2,294Standposts 4,677 5,290 5,947 6,583 8,285 9,560 10,515 11,778 12,727 13,559 14,555Handpumps 25 43 57 59 62 63 67 72 87 103 120
Total Population Served 5,522 6,250 7,012 7,747 9,716 11,147 12,226 13,558 14,972 15,898 16,979
Total Number of ConnectionsDomestic 100,530 112,549 124,313 138,073 171,295 190,600 118,271 225,904 247,245 255,925 286,760Standposts 5,287 5,823 11,830 16,459 20,712 23,904 25,285 29,450 31,821 34,150 36,415Handpumps 100 170 228 235 243 251 269 305 365 429 497
Water Production (millions liters) 84,287 100,837 123,414 150,592 187,815 215,265 235,833 263,371 285,682 305,957 327,885
Water Sale RateDomestic (Rs/month) 8.00 8.00 8.00 10.00 10.00 10.00 10.00 10.00 10.00 10.00 10.00Standposts (Rs/person/ronth) 1.00 1.00 1.00 1.00 1.00 1.00 1.00 1.00Handpumps (Ra/person/month) 1.00 1.00 1.00 - 1.00 1.00 1.00 1.00 1.00
Operating RevenuesConnections 9,483 10,849 11,369 15,743 19,036 21,714 23,754 25,872 28,391 30,851 33,222Standposts 75,180 92,274 107,070 120,450 133,758 147,030 158,316 169,345Handpumps 696 738 750 780 834 954 1,140 1,337Connection Fees 98 114 116 137 332 194 148 205 213 198 200Miscellaneous 23 41
Total Operating Revenues 9,604 11,004 11.485 91,756 112,380 129,728 145,132 160,669 176588 190.505 204,104
Operating ExpensesSalary and Wages 11,905 13,355 17,662 23,230 32,537 41,000 48,333 56,797 64,620 72,687 81,019Power and Fuel 8,585 10,059 12,688 16,008 22,464 28,428 33,732 39,953 45,511 51,367 57,393Raw Water 107 95 153 206 332 462 597 732 853 983 1,127Chemicals 212 334 584 832 1,367 1,914 2,379 2,844 3,253 3,690 4,152Maintenance Materials 6,201 6,950 10,491 6,720 9,196 12,428 16,081 19,402 22,552 25,702 28,502Headquarters Expense 6,368 4,700 6,590 8,423 10,112 11,973 13,683 15,443 17,219Other 1.867 1,487 1.769 2,323 3.254 4.100 4,833 5.680 6.462 7.269 8.102
Total Operating Expenses BeforeDepreciation 28,877 32.280 49,715 54,019 75,740 96,755 116,067 137,381 156,934 177,141 197,514
Net Operating Income (Loss) BeforeDepreciation (19,272) (21,276) (38,230) 37,737 36,640 32,973 29,065 23,288 19,654 13,364 6,590
Depreciation 10.252 12,768 15,737 20,159 27,588 37,284 48,242 58.205 67.655 77.105 85,505
Net Operating Income (Loss) (29.525) (34.044) (53,967) 17.578 9.052 (4,311) (19,177) (34.917) (48,001) (63.741) (78.915)
Operating Ratio Before Depreciation 301 293 433 59 67 75 80 86 89 93 97
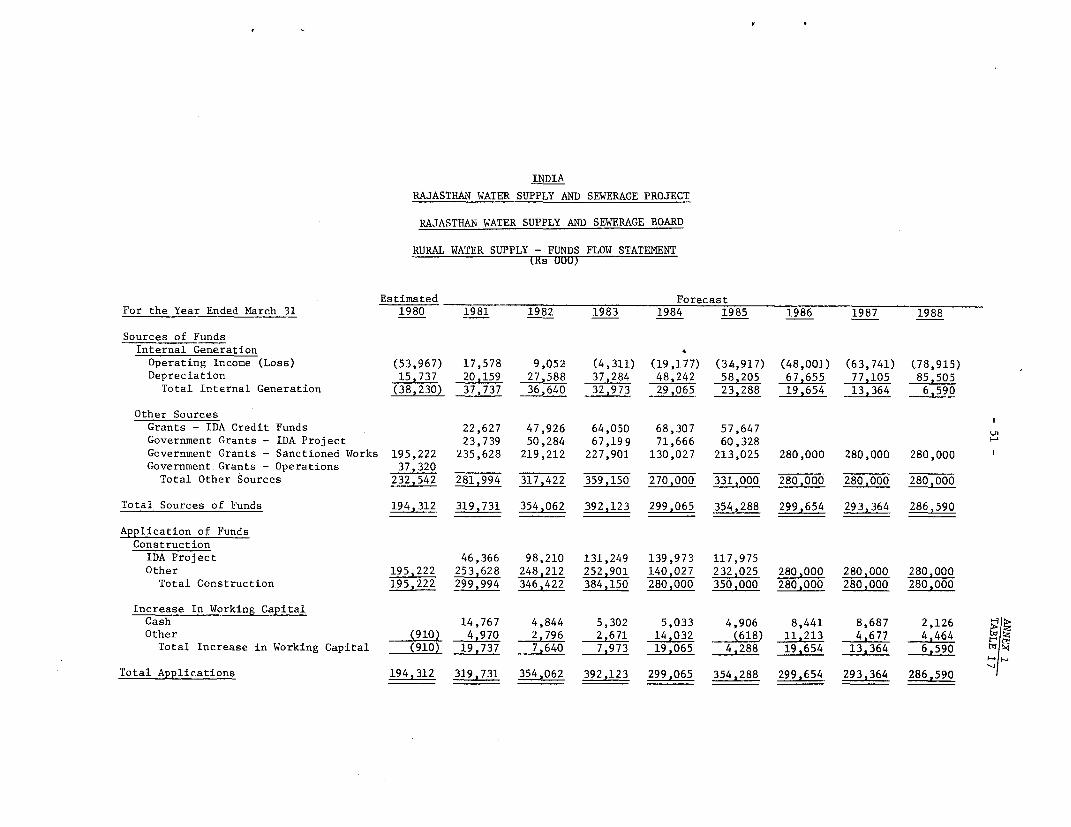
INDIA
RAJASTHAN WATER SUPPLY AND SEWERAGE PROJECT
RAJASTHAN WATER SUPPLY AND SEWERAGE BOARD
RURAL WATER SUPPLY - FUNDS FLOW STATEMENT(Ks UUU)
Estimated ForecastFor the Year Ended March 31 1980 1981 1982 1983 1984 1985 1986 1987 1988
Sources of FundsInternal Generation *
Operating Income (Loss) (53,967) 17,578 9,052 (4,311) (19,177) (34,917) (48,001) (63,741) (78,915)
Depreciation 15,737 20,159 27,588 37,284 48,242 58,205 67,655 77,105 85,505
Total Internal Generation (38,230) 37,737 36,640 32,973 29,065 23,288 19,654 13,364 6,590
Other SourcesGrants - IDA Credit Funds 22,627 47,926 64,050 68,307 57,647 >
Government Grants - IDA Project 23,739 50,284 67,199 71,666 60,328
Government Grants - Sanctioned Works 195,222 235,628 219,212 227,901 130,027 213,025 280,000 280,000 280,000
Government Grants - Operations 37,320Total Other Sources 232,542 281,994 317,422 359,150 270,000 331,000 280000 280,000 280,000
Total Sources of Funds 194,312 319,731 354,062 392,123 299,065 354,288 299,654 293,364 286,590
Application of FundsConstruction
IDA Project 46,366 98,210 131,249 139,973 117,975
Other 195,222 253,628 248,212 252,901 140,027 232,025 280,000 280,000 280,000
Total Construction 195,222 299,994 346,422 384,150 280,000 350,000 280,000 280,000 280j000
Increase In Working CapitalCash 14,767 4,844 5,302 5,033 4,906 8,441 8,687 2,126
Other (910) 4,970 2,796 2,671 14,032 (618) 11,213 4,677 4,464Total Increase in Working Capital (910) 19,737 7,640 7,973 19,065 4,288 19,654 13,364 6,590
Total Applications 194,312 319,731 354,062 392,123 299,065 354,288 299,654 293,364 286,590

INDIARAJASTHAN WATER SUPPLY AND SEWERAGE PROJECT
RAJASTHAN WATER SUPPLY AND SEWERAGE BOARD
RURAL WATER SUPPLY - BALANCE SHEET(Rs 000)
Estimated Forecast
As of March 31 1980 1981 1982 1983 1984 1985 1986 1987 1988
AssetsFixed Assets
Plant In Operation 574,367 769,589 1,069,583 1,416,005 1,800,155 2,080,155 2,430,155 2,710,155 2,990,155Less: Accumulated Depreciation 64,494 84,653 112,241 149,525 197,767 255,972 323,627 400,732 486,237Net Plant In Operation 509,873 684,936 957,342 1,266,480 1,602,388 1,824,183 2,106,528 2,309,423 2,503,918
Plant Under Construction 195,222 299,994 346,422 384,150 280,000 350,000 280,000 280,000 280,000Net Fixed Assets 705,095 984,930 1,303,764 1,650,630 1,882,388 2,174,183 2,386,528 2,589,423 2,783,918 L,
Current Assets
Drawing Account 14,767 19,611 24,913 29,946 34,852 43,293 51,980 54,106Accounts Receivable (net) 1,172 30,585 37,460 43,243 48,377 53,556 58,863 63,502 68,035Inventories 1,495 2,240 3,065 4,143 5,360 6,467 7,517 8,567 9,501
Total Current Assets 2,667 47,592 60,136 72,299 83,683 94,875 109,673 124,049 131,642
Total Assets 707,762 1,032,522 1,363,900 1,722,929 1,966,071 2,269,058 2,496,201 2,713,472 2,915.560
Equity and LiabilitiesEquity
Government Investment 705,385 987,379 1,304,801 1,663,951 1,933,951 2,264,951 2,544,951 2,824,951 3,104,951Retained Earnings (Deficit) 1_7,_578_ 26,630 22,319 3,142 (31,775) (79,776) (143,517) (222,432)
Total Equity 705,385 1,004,957 1,331,431 1,686,270 1,937,093 2,233,176 2,465,175 2,681,434 2,882,519
Current LiabilitiesAccounts Payable 2,377 27,565 32,469 36,659 28,978 35,882 31,026 32,038 33,041
Total Equity and Liabilities 707,762 1,032,522 1,363,900 1,722,929 1,966 ,071 58 2,496,201 2,713,472 2,915,560
Current Ratio 1.1 1.7 1.9 2.0 2.9 2.6 3.5 3.9 4.0

ANNEX 1
- 53 TABLE 19Page 1 of 2
INDIA
RAJASTHAN WATER SUPPLY AND SEWERAGE PROJECT
Current Tariff Structure
1. Urban Metered Water Supply
per 1,000 liters
a. Domestic Rs 1.00
b. Commercial Rs 1.50
c. Industrial Rs 2.00
Note - a rebate of 20% is given for payment within stipulated
time.
2. Unmetered
a. Initial tap (per family) Rs12.50
b. Each additional tap Rs 5.00
c. Flush latrine per seat Rs 2.00
Note - a rebate on a and b of 20% is given for payment within
stipulated time.
3. Minimum Charges
Size of Pipe Rate
2 Rs12.50
3/4" Rs16.00
1" Rs2O.00
1½" Rs3O.00
2" Rs4O.00
3T1 Rs5O.00
4" and above Rs6O.00
Note - a rebate pf 20% is given for payment within the stipulated
time.

ANNEX 1TABLE 19
- 54- Page 2 of 2
4. Meter Rent Rs 1.25
5. Connection Fee RslO.00
6. Rural Water Supply
a. Initial tap (per family) RslO.00
b. Each additional tap Rs 4.00
c. Flush latrine per seat Rs 2.00
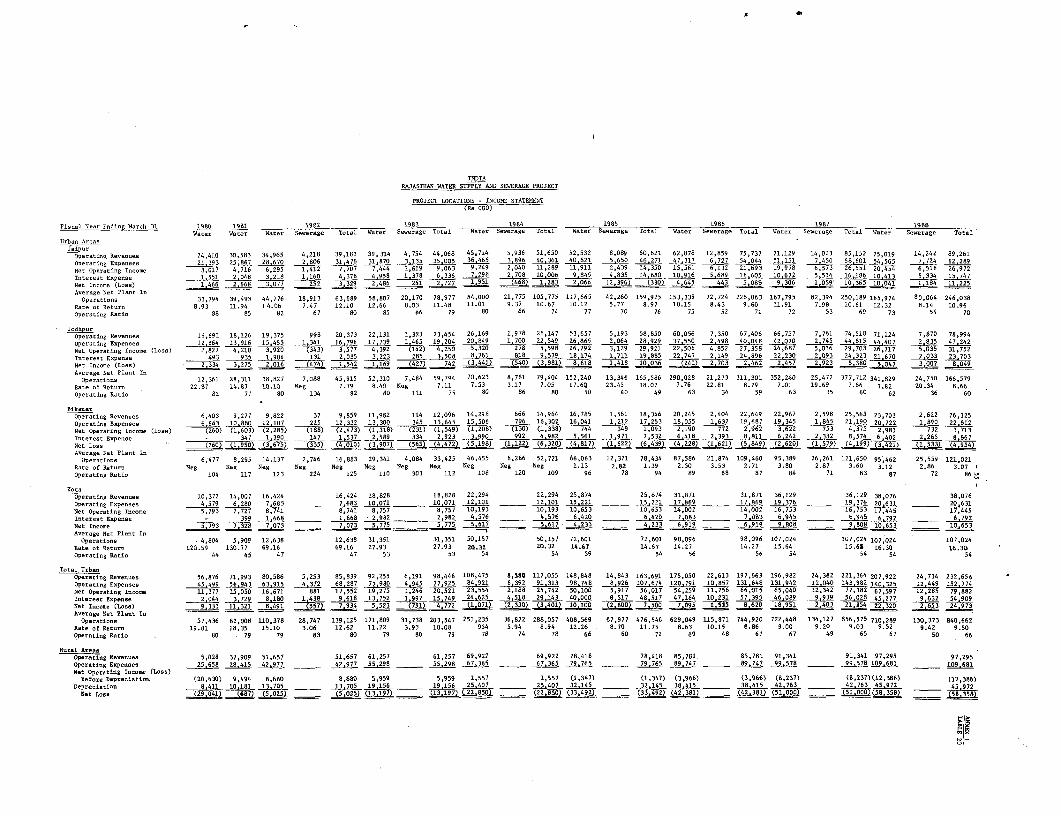
INDTARAJASTHAN WATER SUPPLY AND7 SEWERAGE PROJECT
PROJECT LOCATIONS - OINCOME STATEMENT
isc-I Sear Ending Marh 31 1900 1981 19S2 -- 1903 1904 1985 1986 1987 19ggWater Water Water Sewerge oa ae eeae Total Water Sewrge Sei Water Se-eag ToteS Water Sewerge Total Water Sewerag Total Water Sewrage Twet1
J.ip.rOSe-ting~ Reve-e 24,410 30,583 34,965 4,218 39,183 39 ,314 4,754 44.060 45,714 5,936 51.650 52,532 8.089 60,621 62,878 12,859 75,737 71.129 14,023 85,152 75.019 14,242 89,261
Operting Enpeese 2_ 9 25,867 2867 2_0 31.476 31_870 3_135 35.005 36.465 3,89 40.361 40.621 5.650 46.271 47_317 6,727 5404 51.151 7.450 58.601 54,545 7_774 62,28Set Opertteg Tnce- 3,017 4,716 6.295 1,412 7,707 7,444 1,619 9,063 9,249 2,040 11,289 11,911 2,439 14,320 15.561 6,132 21.693 19,976 6,573 26,551 20.454 6,518 26,972In te-et lao....e_I.551 2.048 3_218 1_168 4,378 4,958 1.378 6.336 7,298 2.708i 10.006 9_845 4.835 14.680_ 10.916 5.689 16.605 1067 )_514 16.186 10.413 5,334 1574Set Oncene (Le) 1.46 2,668 _2Z 2521 3Z39 246 241 2_727 191 (6) 1.283 2.066 (2.396) (__330) 465 43 5,088 9,396 10559' 10,365 10.041 1.184 1 2Acrege Net Plant 1wop-rarg..s 33,794 39,493 44,776 18,913 63,689 58,807 20.170 78.977 84,800 21,775 105.775 117,665 42,260 159,923 153,339 72,724 226,063 167.795 82,394 750,189 165.974 90,064 246,038
mate e8 gRe- 8.83 11.94 0 4.06 7.47 12.10 12.66 8.03 11.48 11.01 9.37 10.67 10.12 5. 77 8.97 50.15 8.43 9.60 11.91 7.98 10.61 12.32 8.14 10.96Operating NRtie 00 85 82 67 80 85 66 79 80 66 74 77 70 76 75 52 71 72 53 69 73 54 70
J.dh-nOperating Navene.s 15,691 18,126 19,375 998 20,373 22,131 1,323 23,454 26.169 1,878 20,147 53.657 5,883 58,850 60,056 7.350 67.406 66.757 2,761 74,518 71.124 7,870 70,994Operting Enpens..s 12,86 13.916 15.455 1_341 16_..Z96 17.739 1_4465 19.204 20.849 1,700 22.549 26_865 2,6 28.929 37_550 2,9 4004 42_070 2,4 44.815 44.407 2_835 47.242Set OperatinE 1n-e. (2ee ,82 7 4,710 3.920 (343) 3,577 4,392 (4) 4,250 5,320 278 5,598 26.792 3.129 29.921 22,506 4,852 27.358 24,687 5,016 29,703 26.717 5,035 31,752
internt Enp.... 483 935 1_904___ 131 2__035 3__223 285 358 8.761 818 _) 9 1,17 1,71 19__5 2,74 2,19 286 22.230 2.093 24.323 21 670 2.033 23.703Net lenn- (Lose) _2.334 3_275 ~21 ( 474) 1.4 119 47) 72 3441) __5-40) 3.81) ,1 1.418 10.0O36 (241) 2.703 2,462 247 293 530 .07 3,002 804
Averge Set Plant InOperaogn- 12,301 28,311 38,827 7,088 45,912 52,310 7,404 59,794 70,623 8,781 79,404 152,240 13,346 165.586 290,028 21,273 311,301 352,240 25,472 377,717 341,829 24,750 366,579
Nte nO erene 22.87 14.g7 15.10 Neg 7.79 0.40 Neg 7.11 7.53 3.17 7.85 17.60 23.45 18.07 7.76 22.81 0.79 7.01 19.9 7.06 7.62 20.34 8.66Operating Ratie 82 77 00 134 82 s0 110 75 80 86 80 55 40 49 63 34 59 63 35 60 62 36 60
BikanerOperetiog Nav-..e. 6,403 9.,2 77 9,822 37 9,859 11,982 114 12,046 14,298 666 14,864 16.785 1,565 18,346 20,245 2,404 22,648 22,967 2,598 25,565 23,703 2,622 26.325Operting p- 6 663 10 860 12.107 2---25 12_332 1~3,300 345 13,645) 15.506 796 16.302 16 041 1 212 17 253 18 025 1,632 19_687 19,34 1_85_1_901_90 2261
N~t O~ :r.ti.g I-.. (L ... (260) (1603) (2,285) (188 (231) (1,208) (10) (744334871,093 1 2.190277202,7 62,9 3.622675374354575 2,98117322 3,773IntterenOp.... . 347 1_390. 147 5.37 2.589 334 9.2 ,9 92 4_9 82 5.561 1.971 7.532 6.418 12,3f93 8,811 6.242 2.332 _8.574 6_4 02 2.265 8.667
SaC Iee (20) (1950) 3.675 (335 (4.00) (3907) 565) 4.472 (5,18) 11122) 6.325 (4.0(1__1622656,439 (4.2817(1628 5 5,8498429 60)20 1579) 4,199 423141) 11533) 4.954Acrege Net Plant In
op r-rl.n. 6,477 8,295 54,137 2,746 16,603 29,341 4,884 33,425 46.455 6,266 52,721 66.063 12,371 78,434 67,586 21,874 109,460 95.389 26,261 121,650 95,462 25,559 121,021Sate of Reton Neg Nag Sag Neg Nrg Sa,g Meg Sag Na Ng Nag 1.13 2.82 1.39 2.50 3.53 2.71 3.80 2.87 3.60 3.12 2.86 3.07Oper-tgeg Ratio 104 117 173 224 125 110 303 112 100 120 189 96 78 94 89 68 87 84 71 83 87 72 866n
KntoOperating Rnveos10,372 14,007 16,424 16,424 18,026 08,028 22,284 22,294 25,874 25,874 31,871 31.671 36,129 36,129 36,076 38,076Oper-te~g Enpena 4,579 6.280 7.63 ______ 7.683 10.071 _ 10.071 12_101 _ ___ 12,101 15.221 ______ 15.221 17_869 ______ 17.869 1937 ______ 19.376 20.631 _____ 20.631
See Oper-n0ng Iec... 5,793 7.727 8,741 8,741 8,757 8,757 10,193 10,193 10.653 10,653 14,002 14,602 16.753 16.753 17.445 17,445IJteret Enp.... 399 1.668 ________2.9.. 2 _ 2.962 4.576 _____ 4.576 6.420 ______ 6.420 7_083 ______ 0 2 3 6.945 ______ 6.945 6_792 _____ 6.792St Inen 5,793 7.328 7,073 _____ 7.073 5,775 5,775 5.617 _____ 5.617 4.233 ______ 4.233 6.919 _____ 6,919 9_88 ____808 08 A6 ____3 10.533
Averge Net Piser OnOperetinne 4,804 5,909 12,638 12,638 31,351 30,351 50.157 50.157 72,601 72,601 980.06 98.096 107,024 107,024 107,024 107,024
Natn of Ret.rn 120 .59 150.77 69.16 69 .16 27 .93 27.93 28.3Z 20.32 14.67 14.63 14.27 14.2 7 15.64 15.61 16.30 5,6.30,Ope..atEeg NatGo 44 45 47 47 53 33 54 54 59 54 56 56 54 54 54 54
Total UrbanCOPerting R-venoe 56,676 71,993 800.586 5,253 85,639 92,255 6,191 98,446 106,475 8,505 117,055 148,848 14,843 163,691 175,050 22,613 197.663 196,902 24,382 221,364 207,922 24,754 232,656
Opnrtftn Enp-nn- 45.499 56_943 63.915 4.372 68.287 72.980 4_945 77,925 64.921 6,392 91.313 98_748 8,2 107.674 120.791 10_857 131,
648
131.942 j~ 143.962 140 ~325 12.449 152,774Ne.t Operting Inton 11,377 15.058 16,671 681 17,552 19,275 1,246 20,521 23,554 2.188 25,742 50.106 5,817 56,017 54.259 11,756 66,019 65,040 12,342 77,382 6 7.59 7 12,265 79,682
Onnee-e Enpe.... 2.044 3.729 8,8 1.438 9 618 13.752 1.997 15,749 24.6a25 456 29.143 40_000 85107 48.517 47_164 10.231 57.395 46.089 9,3 56.028 4527 9.632 54.909
SN. I-...e (S .e) 9,3 J5,_321 8.41 5 57) 7.34 552 751) =4.!7~72 (07) 2,3) 3412 0,0 (.600 7_500 7.095 _.3 860 18.951- 243 2 5 22,320 353 24.873Aveag Set Plant IaOp-ren... 57,436 62,008 110,378 28.747 139,125 171,809 31,738 203,547 251,235 36,622 286,057 406,569 67,977 476.546 629,049 115,871 744.920 722,446 134,127 856,575 210,289 130,373 848,662
Nate nf R.toen 19.81 18,35 15.10 3.06 12.62 11.22 3.93 10.08 834 5.94 8.94 12.26 8.70 11.75 6.63 10.15 8.86 9.00 9.20 9.05 9.52 9.42 9.50Oper-tgeg Matte 60 79 79 83 60 79 80 78 78 74 78 66 60 72 69 48 67 67 49 65 67 50 66
Rora Aces,Operating R.-en... 5,028 37.909 51,657 51,657 61,257 61,257 69,872 69,922 79,416 76,418 85,781 85,781 91,341 91,341 97.295 97,295
GPeratoeg Re.psens 25.658 28.415 42.977 ______ 42.977 055298 ______ 55.298 67_365 ___ 67_ 365 79.765 ______ 79.765 89.747 ______ 89.747 99.578 ______ 99.578 109,681 109_681Nee Op-etein 1-nan (Lone.) Bef-re Seprenti-ra (20,6305 9,494 8.688 8,680 5,959 5,959 2,557 2,557 (5,3405 (1,347) (3,966) (5,966) (6.2375 (8,2375(12,386) (12,586)
D.prangsnti. 8_411 .2a!L. 13.705 ______ 1370 _915 19.156 25.407 ______ 25.407 32.145 -___ 32.145 38,415 38.415 42.76 ______ 42.763 45.972 4____ 5.972
Net Los...1) (67 500 ____ 502)(317 (13.197) !22 8506 _____ 2280)(34923 _____(342 4.8)(23815 (5.00 _____ UE_Ž'8358L ____0838

- 56 -ANNEX 2
INDIA
RAJASTHAN WATER SUPPLY AND SEWERAGE PROJECT
Assumption for Financial Projection
1. Financial projections for RWSSC have been prepared for the fiscalyear 1981 through 1988 using the budget figures for the base fiscal year1980.
Income Statement
Urban Revenues
2. Domestic water connection were developed from population servedas provided in the service level report.
3. Unmetered connections have been gradually reduced to achieve completemeterization by FY1985.
4. Water consumption has been based on service level reports withaverage day demand (domestic consumption) assumed at 80% of the maximum daydemand.
5. Water rates utilized except for Jodhpur are shown on Annex 1,Table 13. Special rates used for Jodhpur are Rs 2.30 in FY1985/86 and Rs 2.40in FY1987/88.
6. Miscellaneous revenues have been computed at Rs 5 per connection.
7. Domestic sewer connections were developed from population servedprovided in service level report.
8. Sewerage rates have been assumed at 40% of water rates for FY's 1982through 1985 and at 50% for FY's 1986 through 1988.
9. Sale of sewage has been estimated at Rs 8,825 per million M3 for 60%of the sewage flow.
10. Interest on connection loans has been estimated at 4% with a recoveryperiod of ten years and equal monthly payments (representing both interest andprincipal).
Urban Expense
11. Inflation has been assumed at an annual rate of 10% for FY1981, 7%for FY's 1982 through 1984 and 5% for FY's 1985 through 1988.

- 57 -
ANNEX 2Page 2
12. Basic figures for expense categories, Salary and Wages, Power andFuel, Raw Water and Chemicals have been developed by the technical staff ofPHED based on operating requirements and have been reviewed and determinedreasonable. The basis figures were then inflated in accordance with theinflation assumption. Basic salaries include a factor for the 8.33% bonuswhich was deemed to be required under the corporate structure. However,there is some evidence that a bonus requirement will eventually be necessarydespite the organizational structure. Therefore, to be conservative, theeffect of the bonus has been retained in the projected accounts.
13. Maintenance materials for water supply have been projected as apercentage of average gross plant in operation. The rate is expected todecline from 2.25% in FY1981 to 1.50% in FY1988. For sewerage, the rate isassumed constant at 0.75%.
14. Headquarter expense has been calculated at 10% of total operatingexpenses exclusive of other expenses and depreciation.
15. Other expenses have been calculated at 10% of salary and wages.
16. Depreciation for water supply has been computed at 3% of theaverage gross plant in operations during the FY and for sewerage at 2-1/2%.
17. Interest on project loans has been computed at 6-1/2% with apayment period of twenty-five years including five years of grace and equalsemi-annual payments of interest and principals).
18. Interest on other loans is in accordance with agreements andschedules.
Rural Revenues
19. Numbers of connections have been developed by dividing populationserved by 8, the average number per family.
20. Water rates are shown on Annex 1, Table 16.
Rural Expense - (Same as urban except for following)
21. Maintenance materials have been computed as 1% of average grossplant in operation.
Balance Sheets - Urban
22. Plant under construction represents the estimated current years'construction.
23. Accounts receivable have been assumed at two months' billings.

- 58 -ANNEX 2Page 3
24. Inventories have been assumed to represent a four month supply basedon estimated annual usage of maintenance materials.
25. Grants represent funds received from Municipal Boards, housingsocieties for capital works.
26. Previous loans represent LIC loans.
27. Customer deposits were computed at Rs 25 per connection.
28. Accounts payable were computed at 1/12 annual cash expenditures forboth assets and expense less salary and wages which are paid in the monthearned.
Balance Sheet - Rural (Same as urban except for following)
29. Accounts receivable have been assumed to represent four months'billings.

- 59 -ANNEX 3
INDIA
RAJASTHAN WATER SUPPLY AND SEWERAGE PROJECT
Additional Information Available in Project File
A. Legal Documents and Sector Report
Al The Rajasthan Water Supply and Sewerage Corporation Act (1979)
A2 The Rajasthan Municipalities Act (1959)
A3 Rajasthan Water Supply and Sewerage Sector Study
B. Studies
BK Summary project report
B2 Reports on feasibility studies and preliminary engineering for
water supply for Jaipur, Jodhpur, Kota and Bikaner
B3 Reports on feasibility studies and preliminary engineering for
sewerage and sewage disposal for Jaipur, Jodhpur and Bikaner
B4 Technical reports for the districts Ajmer, Sikar, Jhunjhunu,
Kota, Pali, Nagour, Jodhpur, Churu, Bikaner and Gan Ganagar
B5 Financial analysis reports on urban and rural areas
B6 Consultant reports on distribution system analysis, water
treatment and sewage treatment works and CPM master network
for project implementation
C. Selected working papers and other documents
Cl Data compilation prepared by RWSSC
C2 Complete financial projections
C3 Drawings and maps on proposed water supply and sewerage systems
C4 Terms of Reference for consultant studies

ANNEX 4
- 60 -
INDL4
RAJASTRAN WATER SUPPLY AND SEWERAGE PROJECT
Monitoritg Indicators
1980 1981 1982 1983 1984 1985 1986 1987 1988
Population and Service LevelsPopulation (000)
Jaipur 890 927 955 985 1,015 1,046 1,078 1,111 1,145Jodhpur 432 447 460 472 485 499 512 527 541Bikaner 281 289 297 306 315 324 334 344 355Xots 347 366 381 397 413 430 448 467 486Tee Rural Districts 9,919 11,309
Percent Served By Water ConnectionsJaipur 65 67 70 72 74 76 78 80 82Jodhpur 67 68 68 69 69 70 71 72 73Bik.aer 76 79 81 84 86 86 86 86 86Kota 64 67 70 73 76 80 82 85 86
Percent Served By StsndpostsJaipur 22 21 20 19 18 17 16 15 14Jodhpur 29 29 28 28 27 27 26 25 24Bikaner 16 16 15 15 14 14 14 14 14Rota 24 23 22 21 21 20 18 15 15
Percent Served By Sewer ConnectionsJaipur 25 25 26 27 31 39 38 38 37Jodhpur 14 14 17 20 26 31 31 30 30Bikner - - 1 3 20 27 27 26 26
De mand and ProductionWater Connections
Jaipur 67,770 75,390 83,190 90,170 98,730 104,500 110,380 116,460 123,040Jodhpur 30,490 31,040 31,540 32,140 32,690 33,630 37,110 40,500 44,280Bikaner 22,238 23,618 25,066 27,918 29,571 30,646 33,024 33,869 35,147Kota 22,935 25,455 28,175 31,095 34,215 37,435 40,030 43,185 45,238
Sewer ConnectionsJaipur 19,842 20,904 22,051 23,588 27,976 40,795 41,483 42,177 42,697Jodhpur 6,373 6,592 7,778 9,427 12.707 .15,626 15,832 16,039 16,244Bikaner 3 - 91 311 817 5,150 7,332 7,451 7,573 7,696
Water Cons..ption (nillion = )Jaipur 37.54 40.06 42.74 45.06 47.47 49.95 52.58 55.22 58.07Jodhpur 19.32 19.32 19.32 21.43 23.13 23.69 28.40 30.11 31.84Bikaner 10.42 12.38 13.16 14.00 14.91 15.60 16.40 17.36 17.91Cots 15.91 18.07 19.99 21.82 23.63 25.46 27.76 29.02 30.08Ten Rural Districts 3
DoneStic Water C.nnumptlon/Conne-ti-n (a/ro)Jaipur 40.41 38.77 37.52 36.20 35.10 34.57 34.54 34.52 34.53Jodhpur 26.63 26.63 27.15 29.55 33.47 33.95 40.26 37.62 35.77Bikaner 35.27 37.11. 37.14 36.09 35.19 34.52 33.63 33.00 33.00Rota 45.72 46.02 45.15 44.21 43.36 43.17 44.83 45.12 43.66
Percent Unaccounted For WaterJaipur 25 25 25 25 25 25 25 25 25Jodhpur 16 16 16 16 16 16 25 25 25
Mikaner 16 25 25 25 25 25 25 25 25Cots 20 21 25 25 25 25 25 25 25Ten Rural Districts
Production (millions =Jaipur 51.87 53.54 57.13 63.17 63.39 69.22 70.24 73.67 77.58Jodhpur 23.00 23.00 23.00 25.50 27.53 28.21 37.87 40.15 41.36Bikaner 12.41 16.51 17.54 18.66 19.88 20.80 21.86 23.15 23.88"ota 19.89 23.00 46.36 46.36 46.36 46.36 46.36 46.36 46.36Ten Rural Districts
Per Capita Production (1cd)Jaipur 189.49 184.50 186.89 197.24 189.81 198.89 193.80 195.20 197.36Jodhpur 154.36 149.02 144.36 155.59 163.35 164.35 214.39 218.51 216.50Bikaner 135.05 170.71 172.52 174.58 177.12 178.31 182.09 187.13 189.33Cota 184.75 198.74 373.53 350.34 327.74 305.66 289.29 277.60 266.53Ten Rural Districts
AdmInistrationEmployees per 1000 Water Connections
Jaipur 22 21 20 20 20 20Jodhpur 24 25 25 25 26 29Bikaner 28 31 30 27 27 26Rots 24 25 27 25 25 24
Employees per 1000 Sewer ConnectionsJaipur - 12 11 12 12 10Jodhpur - 27 23 19 16 15Bikaner - 144 56 32 15 13
Costs and Revenues3
Water Cost per t Produced (Re)Jnipur .41 .48 .50 .50 .58 .59 .67 .69 .70Jodhpur .56 .61 .67 .70 .76 .95 .99 1.05 1.07Bikaner .54 .66 .69 .71 .78 .77 .83 .84 .87
Rota .23 .27 .17 .22 .26 .33 .39 .42 .45Ten Rural Diutrictu
Water Costs per = Sold (Rs)Jaipur .57 .65 .67 .71 .77 .81 .90 .93 .94Jodhpur .67 .72 .80 .83 .90 1.13 1.32 1.40 1.39Bika.er .64 .88 .92 .95 1.04 1.03 1.10 1.11 1.16Rota .29 .35 .38 .46 .51 .60 .64 .66 .69
Total Revenues per 3 Produced (US$)Jaipu- 0.06 0.07 0.08 0.08 0.10 0.11 0.13 0.14 0.14Jodhpur 0.08 0.09 0.11 0.11 0.12 0.25 0.21 0.22 0.23Bikaner 0.06 0.07 0.07 0.08 0.09 0.10 0.12 0.13 0.13Eots 0.06 0.07 0.04 0.05 0.06 0.07 0.08 0.09 0.10
Pinancial RatiosTotal Urban
Rate of Return Neg 2.70 2.40 3.91 5.06 8.98 9.45 10.10 9.60Operating Ratio-mfter depreciation 101 94 95 91 88 78 74 72 74Current Ratio 1.7 2.4 2.2 2.4 2.1 2.0 1.7 1.8 1.9Debt-Equity Ratio 34/66 40/60 49/51 54/46 69/31 74/26 70/29 66/34 61/39Debt-Ser,ice Ratio 0.8 2.3 1.1 1.2 1.2 1.5 1.4 1.7 1.8Receivable % of Billings 17 17 17 17 17 17 17 17 17
Total RuralOperating Ratio-befora depreciation 433 59 67 75 80 86 89 93 97Current Ratio 1.1 1.7 1.9 2.0 2.9 2.6 3.5 3.9 4.0
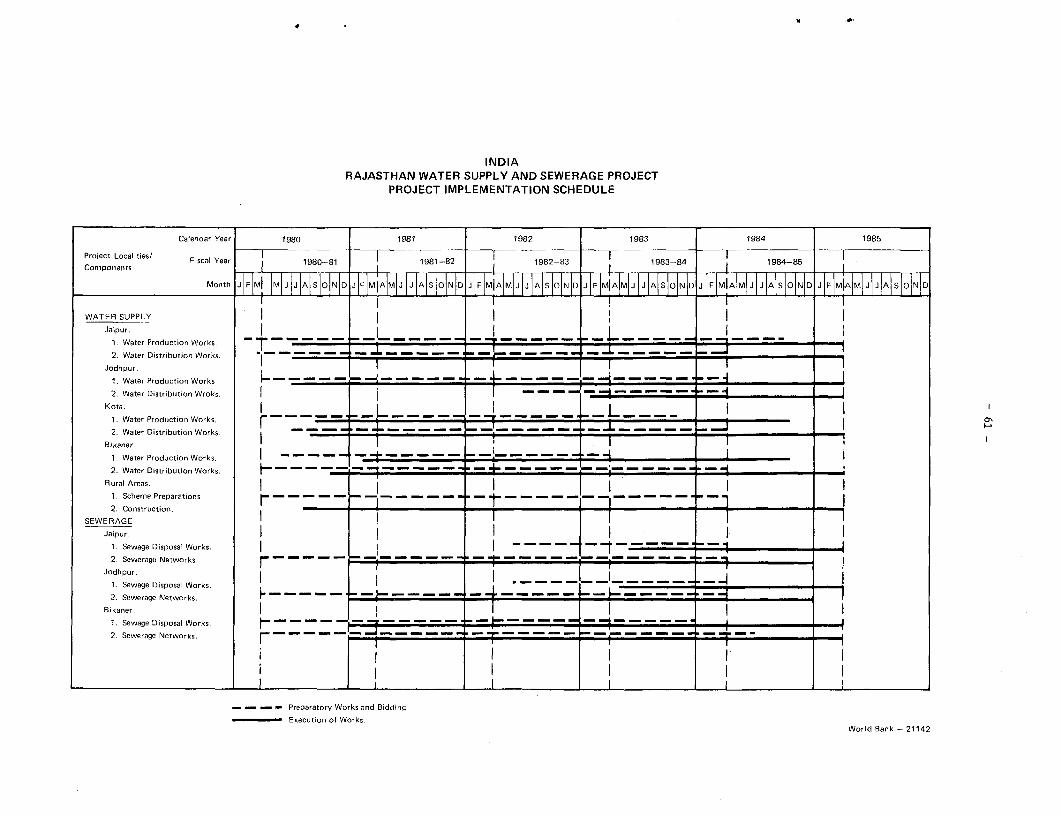
INDIARAJASTHAN WATER SUPPLY AND SEWERAGE PROJECT
PROJECT IMPLEMENTATION SCHEDULE
Calendar Year 1980 1981 1982 1983 1984 1985
Project Localities/ Fiscal Year 1980-81 1981-82 1982-83 1983-84 1984-85Components -; I I T
Month ]JF|MI |M|J|J|A|S|O|N|D JIF IMA|M|J|JIA|SIOIN|D JFMIA M|J|J|AS|N|D JIF|M|A| HJ|J|A|S|ONTD ,J AFIMIA MAJIJIAISIOINID JIFMjj¶jftJjDND
WATER SUPPLY I i
Jaipur. i Lii. VWater Production Works. __T______-_----____
2. Water Distribution Works. ___' -- ' r-____Jodhpur.
1. Water Production Works - __ _-_ __ - _ _ _4_*_*._ 4*_*_*_*_*_*_** _ _ _*_*_ . _ * I2. Water Distribution Wroks. T -
Kota. i L
1. Water Production Works. rO- -- ==
2. Water Distribution Works. - - - - - -Bikaner.
1. Water Production Works. |4
2. Water Distribution Works._ 4 - - - - - - - - - - - -Rural Areas. _ _
1. Scheme Preparations ------ -2. Construction.
SEWERAGE
Jaipur. i i
1. Sewage Disposal Works.
2 Sewerage Networks. ------ Jodhpur. i I I _
1. Sewage Disposal Works.
2. Sewerage Networks. |- .. Z ..... .......-.. ~...._._, .- L _ _ _ _._ ._ _Bikaner. i
1. Sewage Disposal Works. - --- _ - _ _ . t
I _ _ _ I I .…
2. Sewerage Networks. =~__ _ _ -…-r--=--------- -
- - - - Preparatory Works and Bidding
Execution of Works.World Bank -21142

INDIARAJASTHAN WATER SUPPLY AND SEWERAGE PROJECTRAJASTHAN WATER SUPPLY AND SEWERAGE BOARD
TENTATIVE ORGANIZATION
C CommitteeC of Direction &
I
Di n MaChairmani
ProjectMonitoring lItra ui
Technical nn
Member Advisorr
* | ~~~~~Chief Engineer
Planning 8& Construction Operar onE&e_i_r_Design St Procurement MaintenanWe Administrative Finance C24
Depa rtment Departmen t L Departmnent Department Departmrent r)
Desi Diison :r .na
Divisi ~ ~ l Dltios Divisions Administration | Expenditures|
_ Procurement |Acc_untin_Divisions in eal lg Acounting
World Bank -21143

< 72° 749 76 ~~~~~~~~~~~~~~~~~~~~~~~~~~~~~~~~~~~~~~~~~~-EBP.UARY{ 198C!
pakison r ~ v chu=r-~ N D I Aliawss4\xS-N5E_J<L7= <RAJASTHAN WATER SUPPLY AND SEWERAGE PROJECT 1
^ C Indio yf<Brmo 0 ~~~~~~2I5 50 75 10~0 125 i50 175 200
Sar oK Bongoi KILOIVIETERS y i3f ~~~~~~~~~~~~~~~~~Project Disiricts
\ 1 300 If ._o, ro30' Project Towns °X XitOb,n X j . TO remmx D ~~~~~~~~~~~~~~~~~~~~~Other Towns
x Disitrict HeadquarterCsns
70°~~~ ~ ~~~~~~~~~~~~~~~ j A ;N A G A R -<------- District Bovndaries
G }' <- X 1s_Os,Ns; o_____ fi78 +4------International Boundaries
4' <> /4t ' -~~~~~-- ~~ X - -~ Maior Roads
,!> t t/ ~~~~B XANE R,A 'CHUR\/- JHUNJ HUNU" A.
-28° A iBfo ~ ~ W Xt-1 ( XHuSr ° , 28°1
/ J s / 13 ; ;- 2 ; l~~~~~~~~~~~~~~~~~~~~~~ K A g iWr* ! J A I S A L M E R /- X ( LA 3nriF\9Ag
* S ~~~ \ ~s.} 'V , ~.mer W ~ --- _S' W-- ~tNS AWA I E §/ - S R)F R u 5 B8MARHOPU C>BA6/~~~~~~~~~~~~D U k
' --- ? -- XP A < ! B~BH I LWARA /BUD1
_A_ ? ,;oac 's%S f HITTORSGARH X -WSWOR* 24' DtFPr\ - ; T /s 24g-
DUNGAPR . Toblm
70° 72° 4 716 78°