report no. 3187-ma recop malaysia's file copy...
TRANSCRIPT

Report No. 3187-MA RECOP
Malaysia's Manufacturing Sector: FILE COPYDevelopment Issues and Policy Options(In Three Volumes)
Volume II: The Main ReportApril 9, 1981
Projects DepartmentEast Asia and Pacific Regional Office
FOR OFFICIAL USE ONLY
Document of the World Bank
This document has a restricted distribution and may be used by recipients
only in the performance of their official duties. Its contents may not otherwisebe disclosed without World Bank authorization.
Pub
lic D
iscl
osur
e A
utho
rized
Pub
lic D
iscl
osur
e A
utho
rized
Pub
lic D
iscl
osur
e A
utho
rized
Pub
lic D
iscl
osur
e A
utho
rized
Pub
lic D
iscl
osur
e A
utho
rized
Pub
lic D
iscl
osur
e A
utho
rized
Pub
lic D
iscl
osur
e A
utho
rized
Pub
lic D
iscl
osur
e A
utho
rized

CURRENCY EQUIVALENTS
Currency Unit - Ringgit (M$)
1 M$ = US$0.45
1 US$ = M$ 2.20
ABBREVIATIONS
BNM Bank Negara MalaysiaDRC Domestic Resource CostEPRs Effective Protection RatesEPU Economic Planning UnitFFMP Fourth Malaysia PlanFTZs : Free Trade ZonesGOM : Government of MalaysiaICA : Investment Coordinating ActIEs Industrial EstatesIIP Index of Industrial ProductionLIs Locational IncentivesLUR : Labor Utilization ReliefMIDA : Malaysian Industrial Development AuthorityMIDF : Malaysian Industrial Development Finance Co.MIS Monthly Industrial StatisticsMTI Ministry of Trade and IndustryNEP New Economic PolicyPS Pioneer StatusQLFS Quarterly Labor Force SurveySACT Special Advisory Committee on TariffsSEDCs: State Economic Development CorporationsSMIs : Small and Medium IndustriesTAB : Tariff Advisory BoardTMP Third Malaysia Plan
FISCAL YEAR
January 1 - December 31

FOR OFFICIAL USE ONLY
MALAYSIA-S MANUFACTURING SECTOR:
DEVELOPMENT ISSUES AND POLICY OPTIONS
Volume II: The Main Report
Table of Contents
Page No.
PREFACE . . . . . . . . . . . . . . . . . . . . . . . . . . . . 4-5
BASIC DATA .. 6-7
PART ONE: THE GENERAL MANUFACTIJRING SECTOR 8
I. INTRODUCTION AND OVERVIEW OF GROWTH PERFORMANCE . . . . . . . 8
A. Introduction .... . . . . . . . . . . . . . . . . . . 8
B. Growth and Structural Changes in Manufacturing .10
Historical Pespective and Growth Performance . . . . . 10
Structural Changes in the Sector . . . . . . . . . . . 13
II. POPULATION, LABOR FORCE AND MANUFACTURING EMPLOYMENT . . . . 24
Population and Labor Force . . . . . . . . . . . . . . 24
Employment in the Manufacturing Sector . . . . . . . . 24
Trends in Subsectoral Employment . . . . . . . . . . . 27
Ethnic Composition of the Manufacturing Labor Force . . 28
Trends in Wages and Earnings . . . . . . . . . . . . . 30
Trends in Labor Productivity and Capital Intensity . . 31
Labor Market Segmentation . . . . . . . . . . . . . . 32
Skill Shortages and Incentive System . . . . . . . . . 33
Concluding Remarks .. 35
III. MANUFACTURED EXPORTS .36
Growth Performance . . . . . . . . . . . . . . . . . . 36
Export Markets .. 38
Achievement of Export Growth . . . . . . . . . . . . . 40
Manufacturing Sector Export Prospects . . . . . . . . . 42
IV. INVESTMENT IN THE MANUFACTURING SECTOR . . . . . . . . . . . 47
Introduction .. 47
Overview of Investment in Malaysia . . . . . . . . . . 48

-2-
Page No.
Investment in Manufacturing . . . . . . . . . . . . . 49Investment Profiles and Problems of Estimation . . . 54
V. THE ROLE OF PUBLIC ENTERPRISE IN MANUFACTURING . . . . . . . 58
Introduction .... . . . . . . . . . . . . . . . . . . . 58Performance and Achievements . . . . . . . . . . . . . . . 59The Issue of Objectives and the Role of PublicManufacturing Enterprise ... . . . . . . . . . . . . . 59
Relationship to Private Sector: Price and IncentivesFramework . . . . . . . . ... . . . . . . . . . . . . . . 60
Issues in Financial Administration . . . . . . . . . . . . 62Ensuring Proper Control and Accountability . . . . . . . . . 62The Key Issue . . . . . . . . . . . . . . . . . . . . . . . 63Guidelines for the Future . . . . . . . . . . . . . ... . 64
VI. INCENTIVE SYSTEM AND POLICIES ... . . ..... . . . . . . 66
A. Introduction .... . . . . . . . . . . . . . . . . . . 66
B. Tariff Protection and Import Restriction . . . . . . . . 67
Case-by-Case System ... . . . . . . . . . . . . . . . 67Subsector Development Strategies . . . . . . . . . . . 68Tariff Exemptions ... . . . . . . . . . . . . . . . . 69Infant Industry Protection . . . . . . . . . . . . . . 70
C. Export Incentives .... . . . . . . . . . . . . . . . . 71
Exchange Rate .... . . . . . . . . . . . . . . . . . 71Trade Bias and Nonfree Trade Zone Exports . . . . . . 71Preferential Export Loans . . . . . . . . . . . . . . . 73Export Allowance . . . . . . . . . . . . . . . . . . . 73Streamlining of Export Incentives Administration . . 74
D. Investment Incentives ... . . . . . . . . . . . . . . . 75
Case-by-Case System ... . . . . . . . . . . . . . . . 75Pioneer Status (PS) Incentives . . . . . . . . . . . . 75Labor Utilization Relief (LUR) . . . . . . . . . . . . 76
E. Industrial Dispersion Incentives . . . . . . . . . . . . 77
Locational Incentives (LIs) . . . . . . . . . . . . . . 77Industrial Estates (IEs) . . . . . . . . . . . . . . . 77
-3-
Page No.
F. Restructuring Incentives ... . . . . . . . . . . . . . 78
Tax Incentives for Restructuring . . . . . . . . . . . . 78Policies to Promote Backward Linkages . . . . . . . . . 79
G. Reforms of the Industrial Incentive System and Policies . 79
Broad Development Strategy . . . . . . . . . . . . . . 79Direction of Reforms .80Tariff Exemption and Drawbacks . . . . . . . . . . . . 80Export Credit .81Partial Income Tax Exemptions for Exports or
Industries in Development Areas . . . . . . . . . . . 81Training and Skill Development Incentives . . . . . . . 82Review of Import Protection Structure . . . . . . . . 82Effects of Proposed Measures . . . . . . . . . . . . . 83
PART TWO: SELECTED SUBSECTORS 85
I. RESOURCE-BASED INDUSTRY SUBSECTORS . . . . . . . . . . . . . 85
A. The Wood Processing Industries. . . . . . . . . . . . . 85B. The Rubber Processing Industries. . . . . . . . . . . . 89C. The Food Processing Industries. . . . . . . . . . . . . 92
II. LABOR-INTENSIVE EXPORT SUBSECTORS . . . . . . . . . . . . . . 97
A. The Electronics and Electrical Machinery. . . . . . . . 97B. The Textiles and Wearing Apparel Industry . . . . . . . 100
III. CAPITAL-INTENSIVE, HEAVY INDUSTRY SUBSECTORS. . . . . . . . . 105
A. The Fertilizer Industry .105B. The Steel Industry .................. 111
- 4 -
PREFACE
This report presents an overview of the findings of an Industrial
Sector Mission which visited Malaysia from February 18 to March 11, 1980.
Two basic objectives of the mission were: (a) to review the past performance
and assess the growth potential of the manufacturing sector in terms of its
likely contribution to increased output, employment and exports; and (b) to
highlight, where appropriate, policies and incentives that will help to
ensure that Malaysia's manufacturing potential is fully exploited and the
benefits to the national economy maximized.
The present report is intended as a contribution to the preparation
of the Fourth Malaysia Plan (FMP: 1981-1985). From the very start the work of
the mission was seen as a cooperative effort of the Government and the Bank.
Recognizing the collaborative nature of the task, the Economic Planning Unit
(EPU) established a counterpart steering committee, drawing its members from
the Ministry of Trade and Industry, Treasury, Bank Negara Malaysia, Ministry
of Labor, Ministry of Public Enterprises and the Department of Statistics.
This committee contributed substantially to the success of the mission both
during the formulation of the terms of reference for the study and during the
field visit of the mission. Given the tight time schedule set for the pre-
paration of the FMP, the mission focused mainly on highlighting the
development issues and the changing role of incentives and policies at this
stage of the manufacturing sector in Malaysia.
This mission consisted of the following members:
Fateh M. Chaudhri - Chief of Mission
Keith Marsden - Employment Policies & Incentives
Ozay Mehmet (Consultant) - Labor Market Analysis
Hugo Molina (UNIDO) - Light Industry Subsectors
Vinod Prakash - Sector Performance and Prospects
Yung Rhee - Incentives and Policy Framework
Bertil Walstedt (Consultant) - Public Enterprises and Heavy Industry
In the processing of this report and in reviewing some of the working papers,
Mr. S. Talbot gave substantial support to the mission. Mr. F.M. Iqbal,
Senior Field Advisor, UNIDO, also provided the mission with notes on the
Institutional Framework for Industrial Development in Malaysia.
A preliminary draft of the report was submitted to EPU in July 1980
and technical discussions on that draft took place with government officials
in Kuala Lumpur during August 23-September 1, 198U. Follow-up policy level
discussions were conducted by a Bank mission consisting of Messrs. Jaycox,
Gould, Tsantis and Chaudhri in January-February 1981. This report reflects
those discussions.

This report consists of three volumes:
Volume I : Summary-Report and Recommendations
Volume II : The Mlain Report
Volume III: Annex and Statistical Tables
The following background working papers prepared in connectionwith the report have been issued individually in white cover and areavailable upon request from the East Asia and Pacific Projects Department.
1. A Study of Growth Performance and Outlook of the ManufacturingSector in Malaysia.
2. Incentive Systems and Policies for the Manufacturing Industriesin Malaysia.

-6- Page 1 of 2 pages
MALAYSIA - BASIC DATA - MANUFACTURIG4C SECTOR
M$ billion at 1970 prices Anntual growth rates (%)1971 1973 1975 1978 1980 1961-65 1965-70 1971-75 1975-80
GDP 13.0 15.9 17.4 22.3 25.7 5.6 5.5 7.5 8.1Manufacturing 1.9 2.5 2.9 4.3 5.3 12.1 9.9 11.3 13.0% of GOP 14.3 15.8 16.4 19.1 20.5
Manufacturing Value Added (current prices) Structure Annual Contribution(VA = Value added, GO = Gross Output, of value growth rates (1) to growth (%)GO* = Gross Output approximated by Sales added (%) 1968-73 1968-73 1973-78 1968-73 1973-78
of Ilanufactured Own Products) 1968 1973 GO VA GO* GO GO*
31 Food, beverages & tobacco products 28.0 23.9 15.9 17.8 13.8 27.3 18.332 Textiles, clothing & footwear 3.2 6.1 30.2 39.0 26.7 6.7 10.333 Wood & wood products 11.8 13.9 23.7 26.0 12.4 12.0 2.034 Paper, paper products, printing &
puhlishing 6.7 5.7 18.3 17.7 14.2 3.8 2.6
35 Chemicals, petroleum, rubber & coalproducts 28.1 21.2 15.2 13.6 17.2 21.8 26.0
36 Nonmetallic mineral products 7.0 5.3 14.8 14.7 20.0 2.7 2.937 Basic metal products 2.5 3.7 31.0 32.0 23.0 4.1 2.038 Fabricated metals, machinery, etc. 12.4 19.8 30.2 34.0 31.6 20.1 25.839 Miscellaneous industries 1.5 10.1
Manufacturing Total 100.0 100.0 19.4 21.6 20.1 100.0 100.0
Monthly indus- AnnualCensus trial statistics growth rates (%)
Mlanufacturing Employment ('000 no.) 1968 1973 1973 1978 1968-73 1973-78
31 Food, beverages & tobacco products 26.7 46.2 23.9 31.3 11.6 5.532 Textiles, clothing & footwear 8.8 34.9 29.0 53.1 32.0 12.933 Wood & wood products 21.9 44.9 15.0 17.9 15.4 3.634 Paper, paper products, printing &
publishing 10.9 17.4 11.6 16.1 9.8 6.8
35 Chemicals, petroleum, rubber & coalproducts 25.8 42.7 35.9 49.4 10.6 6.6
36 Nonmetallic mineral products 7.3 13.0 3.3 5.5 12.2 10.837 Basic metal products 3.1 6.8 2.7 4.0 17.0 8.238 Fabricated metals, machinery, etc. 20.6 65.9 40.0 85.9 26.0 16.5
Manufacturing Total 125.5 273.5 181.2 240.8 16.9 9.9
JuneManufacturing Production Index (1968=100) Weight 1969 1971 1973 1975 1977 1978 1979
311/2 Food products 16.5 109 112 130 136 162 172 172321 Textiles 2.2 112 122 197 214 314 356 395331 Wood & wood products 11.9 108 140 203 190 286 274 303351/2 Indtustrial chemicals & products 9.6 112 122 166 155. 180 204 235
353/4 Refined petroleum & products 5.0 100 92 99 118 169 189 19935591 Rubber remilled & latex processed 8.4 107 107 98 82 83 82 70
Other rubber products 6.4 109 132 166 164 196 193 198369 Nonmetallic mineral products 7.6 112 119 147 161 196 246 261
37 Basic metal products 2.7 144 166 226 228 284 318 318381 Fabricated metal products 4.2 107 141 243 186 233 292 311383 Electrical machinery, etc. 2.0 129 189 201 287 432 466 468384 Transport equipment 2.3 210 282 393 412 481 573 f 633
Manufacturing Total 100.0 116 138 187 216 284 312 337
-7- Page 2 of 2 pages
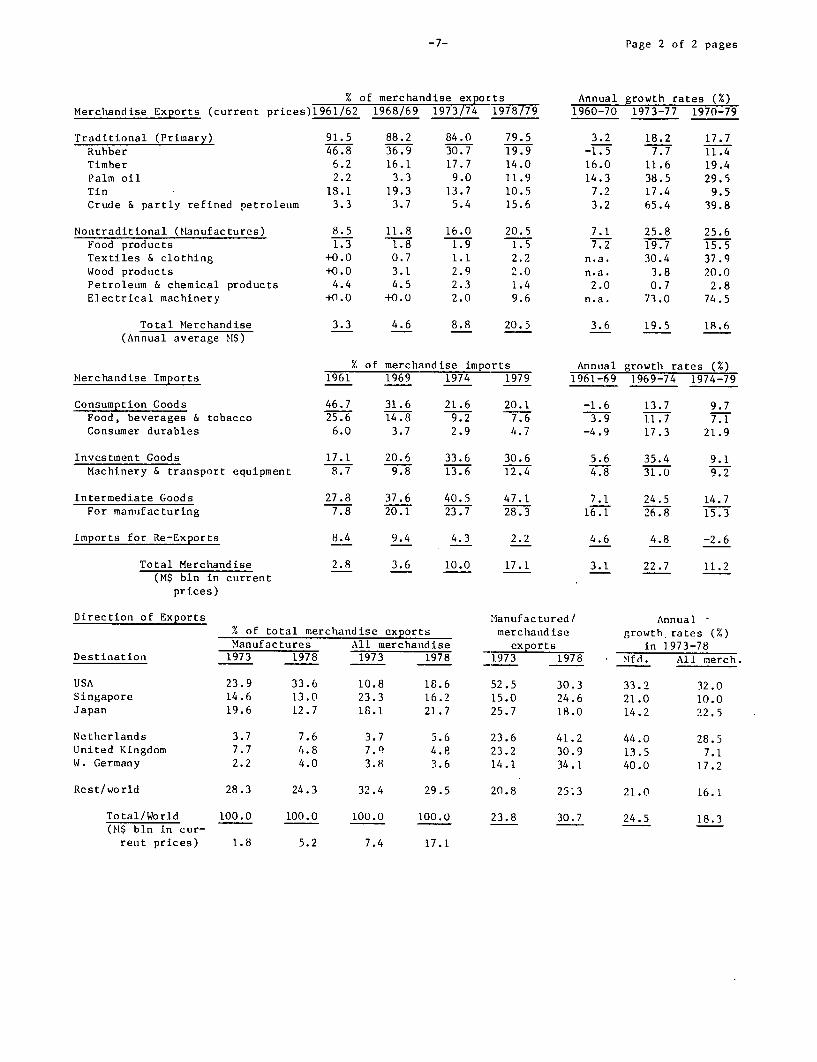
% of merchandise exports Annual growth rates (%)Merchandise Exports (current prices)1961/62 1968/69 1973/74 1978/79 1960-70 1973-77 1970-79
Traditional (Primary) 91.5 88.2 84.0 79.5 3.2 18.2 17.7Rubber 46.8 36.9 30.7 19.9 -1.5 7.7 11.4Timber 6.2 16.1 17.7 14.0 16.0 11.6 19.4Palm oil 2.2 3.3 9.0 11.9 14.3 38.5 29.5Tin 18.1 19.3 13.7 10.5 7.2 17.4 9.5Crude & partly refined petroletim 3.3 3.7 5.4 15.6 3.2 65.4 39.8
Nontraditional (Manufactures) 8.5 11.8 16.0 20.5 7.1 25.8 25.6Food products 1.3 1.8 1.9 1.5 7.2 19.7 15.5Textiles & clothing +0.0 0.7 1.1 2.2 n.a. 30.4 37.9Wood products +0.0 3.1 2.9 2.0 n.a. 3.8 20.0Petroleum & chemical products 4.4 4.5 2.3 1.4 2.0 0.7 2.8Electrical machinery +0.0 +0.0 2.0 9.6 n.a. 73.0 74.5
Total Merchandise 3.3 4.6 8.8 20.5 3.6 19.5 18.6(Annual average M$)
X of merchandise imports Annual growth rates (%)Merchandise Imports 1961 1969 1974 1979 1961-69 1969-74 1974-79
Consumption Goods 46.7 31.6 21.6 20.1 -1.6 13.7 9.7Food, beverages & tobacco 25.6 14.8 9.2 7.6 3.9 11.7 7.1Consumer durables 6.0 3.7 2.9 4.7 -4.9 17.3 21.9
Investment Goods 17.1 20.6 33.6 30.6 5.6 35.4 9.1Machinery & transport equipment 8.7 9.8 13.6 12.4 4.8 31.0 9.2
Intermediate Goods 27.8 37.6 40.5 47.1 7.1 24.5 14.7For manufacturing 7.8 20.1 23.7 28.3 16.1 26.8 15.3
Imports for Re-Exports 8.4 9.4 4.3 2.2 4.6 4.8 -2.6
Total Merchandise 2.8 3.6 10.0 17.1 3.1 22.7 11.2(M$ bln in current
prices)
Direction of Exports Manufactured/ Annual -% of total merchandise exports merchandise growth rates (X)Manufactures All merchandise exports in ]973-78
Destination 1973 1978 1973 1978 1973 1978 Mffd. All merch.
USA 23.9 33.6 10.8 18.6 52.5 30.3 33.2 32.0Singapore 14.6 13.0 23.3 16.2 15.0 24.6 21.0 10.0Japan 19.6 12.7 18.1 21.7 25.7 18.0 14.2 22.5
Netherlands 3.7 7.6 3.7 5.6 23.6 41.2 44.0 28.5United Kingdom 7.7 4.8 7." 4.8 23.2 30.9 13.5 7.1W. Germany 2.2 4.0 3.8 3.6 14.1 34.1 40.0 17.2
Rest/world 28.3 24.3 32.4 29.5 20.8 25:3 21.0 16.1
Total/World 100.0 100.0 100.0 100.0 23.8 30.7 24.5 18.3(M$ bln in cur-
rent prices) 1.8 5.2 7.4 17.1

-8-
PART ONE: THE GENERAL MANUFACTURING SECTOR
I. INTRODUCTION AND OVERVIEW OF GROWTH PERFORMANCE
A. Introduction
1.01 The Government considers the eradication of poverty and
restructuring of employment and ownership as key factors in maintaining the
delicate balance of Malaysia's pluralistic, democratic society. With an
estimated annual growth of GDP around 7.5% during the last decade, spear-
headed by manufacturing value added growing at 12-13%, progress toward the
objectives of the New Economic Policy (NEP) has been substantial. The
continued higher growth performance of the manufacturing sector is indeed
crucial to maintain the progress already achieved. In order to assess the
current situation and prospects of the sector, the mission first reviewed
its performance over the past two decades. This is presented in Section B
of this Chapter. Besides reviewing the growth performance, structural
changes and operational characteristics, this section also discusses the
severe data deficiences in current manufacturing statistics./l
1.02 Since the continuation of a rapid increase in productive employ-
ment in the manufacturing sector is critical to attaining the NEP objective,
the mission paid special attention (Chapter II) to reviewing overall
employment trends during the last few years, the structure of employment at
end-1979, the nature of labor market segmentation and trends of average
earnings in manufacturing. As with output statistics, the mission felt that
a summary critique of employment data was necessary in view of the Govern-
ment s heavy reliance on the employment-generating capacity of the manufac-
turing sector and of its importance in monitoring the impact of employment
and skill development policies.
1.03 While the domestic market will continue to be a substantial factor
in industrial expansion, a relatively small domestic market cannot sustain the
continued rapid expansion of the manufacturing sector necessary to generate
the desired number of productive jobs in the modern sector. Therefore, a
review of the growth in manufactured exports, sources of such growth and a
discussion of export markets has been included in Chapter III. This section
concludes with a brief discussion of the key issues and manufactured export
prospects.
/1 See Annex I, Volume III, on Inadequacy of the Manufacturing Data Base.

-9-
1.04 The level, structure and trend in manufacturing sector investmentare crucial to assessing the current situation and prospects of this sector,but again severe data deficiencies defy a thorough and critical analysis.The mission had to rely on several indirect estimates (presented in ChapterIV) to develop an overview of investment in the manufacturing sector. Thissection ends with a discussion of the main conclusions and key issues inthis area.
1.05 In the course of the last decade a public manufacturing enterprisesector has developed in Malaysia. In the last few years it has grown veryrapidly largely due to the desire to achieve substantial restructuring ofindustrial ownerships and employment by 1990. Chapter V addresses some keyquestions in this area: How rapidly and in what directions has the publicmanufacturing sector grown? What has been the performance of publicenterprises in terms of profitablility and investment? What particularissues have surfaced in terms of its relation to the private sector? Whatproblems of administration, coordination, supervision, control andaccountability have to be reviewed before assessing the future of the publicmanufacturing sector in Malaysia? What future direction should the publicmanufacturing sector take?
1.06 Industrial development strategy - the incentives system and policyframework - is the key instrument in influencing the rate of growth, pros-pects and guiding the directions of the manufacturing sector. It is apowerful instrument which encourages or discourages certain activities inthe manufacturing sector, determines its orientation to domestic or exportmarkets, affects the locational choices made by industrial investors and ofcourse it influences the overall efficiency of the sector. A major part ofthe mission's work was therefore geared to an assessment of the existingimport tariff protection, export, investment and locational incentives, thebearing of the incentive system on the restructuring objectives anddiscussion of key issues in each of these areas. The existing incentivessystem and policies have made a substantial contribution to the growth of themanufacturing sector but its general efficiency remains an open question.The mission feels, therefore, that for continued growth of the sector inchanged and more difficult international circumstances, a reorientation inthe incentives framework is now highly desirable. The whole of Chapter VIis devoted to a discussion of possible adjustments in the incentives andpolicy framework which, in the mission's judgement, would enhance the exportperformance and its linkages to the domestic economy, the more effective useof labor and the regional dispersion of industry, all of which correspond tothe Government's development objectives.

-10-
1.07 Even though the time framework for the preparation of this reportwas extremely short, the mission also felt it necessary to study several keyindustries because of their importance in furthering manufacturing growth.We selected three resource-based industries (the wood, rubber and foodprocessing industries), two labor-intensive, export-oriented subsectors (the
electronics and textiles industries) and two capital-intensive, heavyindustries (the fertilizer and steel production subsectors) for briefsubsector-specific analyses. In these reviews, presented in Part Two of thereport, the mission sought to examine the growth performance, discuss thenature of problems and constraints and assess the growth potential of therespective sectors. This part also discusses certain measures which shouldimpart greater efficiency and competitiveness to activities in these various
industries, leading to the creation of more productive jobs and increasedefficiency of the sector in the medium and long-run.
1.08 The assessment of current and proposed policies has to be seen
against the perspective of growth performance and structural changes inmanufacturing over the last several years. The following section of thisintroductory chapter therefore provides an overview of growth performanceand discusses the strengths and weaknesses of the sector which emerge fromthis analysis.
B. Growth and Structural Changes in Manufacturing
Historical Perspective and Growth Performance
1.09 Over the past two decades, the industrial sector has received thepolicymakers special attention. As early as 1958, the Pioneer IndustrialOrdinance was introduced, to be replaced a decade later by the InvestmentIncentives Act. By 1970, the New Economic Policy (NEP) added a freshdimension to the industrialization process in Malaysia./l The MalaysianIndustrial Development Finance (MIDF) Institute was set up in 1960 and the
Malaysian Industrial Development Authority (MIDA) was established in 1965as the key industrial sector institutions.
1.10 In the beginning the policymakers interest was to use the process
of industrialization as a vehicle to diversify the country's excessive
reliance on rubber and tin and to generate additional productive employment.Industrial growth depended primarily on the initiative of the private sectorwith the Government fostering a conducive environment by providinginfrastructural facilities and incentives for investment. More recently,industrialization has become an important vehicle to achieve restructuringof employment and ownership of assets as well as alleviation of poverty.Thus, the Government began to participate more actively and directly in the
/1 The main objectives of the NEP are: the eradication of absolutepoverty and the restructuring of society to achieve racial balance.

-11-
overall development process by investing in industries. In 1975 theIndustrial Coordination Act was introduced for accelerating the pace ofindustrialization and achieving the NEP objectives. Pragmatic changes inthe role of industrial sector policies, reinforced by sustained politicaland price stability, bouyant balance of payments, favorable investmentclimate and natural resources, together with a fairly well-educated laborforce have helped Malaysia achieve substantial industrial growth over thelast two decades. Table 1 illustrates the annual growth rates andcontribution to GDP of the various sectors.
1.11 Manufacturing has been by far the fastest growing economicactivity on a sustained basis - almost twice the 6% rate of average annualgrowth of GDP in the 1960s and one and a half times the high 7.5% p.a. GDPgrowth in the 1970s. The contribution of manufacturing to the growth inGDP has increased from 20% to 26% from early 1960s to late 1970s. The shareof manufacturing in GDP rose from about 9% in 1960 to about 20% two decadeslater, compensating for the declining share of the primary sectors (agricul-ture, livestock, fisheries, etc.). The great emphasis given to the role ofthe manufacturing sector in the Malaysian economy shows up in anotherstudy /1 which compares the "observed" ratio of value added in asector to GDP in Malaysia with the typical 'predicted' pattern obtained froma hypothetical country of Malaysia's population size, per capita income andexport orientation (measured by the ratio of primary exports and manufac-tured exports to GNP). During the 1960s the observed share of manufacturingin total GDP was 4-5 percentage points below the predicted share; by 1970,the gap had narrowed and finally closed in 1975, before reversing itself by1980 when the observed share was about 20% compared with the predicted 18%.
1.12 What have been the sources of this substantial growth of themanufacturing sector in the past? The available evidence shows that thegrowth in domestic demand and import substitution were the dominant directsources (about 90%) of industrial development during the 1960s. By the late1960s and early 1970s, the scope of 'easy' or first stage of importsubstitution was substantially reduced. Further, beginning around themid-1960s, manufactured exports (mainly the resource-based processed goods)gradually became an important direct source of growth accounting for about afifth of the sector growth./2 In more recent years, 1974-78, manufacturedexports have maintained their contribution to growth at about 20% andadditional import substitution appears to have contributed 12-13% to growthin these years.
/1 The ongoing World Bank Research Project No. 671-08 "Pattern ofIndustrial Development".
/2 The contribution of export expansion is overestimated because PeninsularMalaysia's foreign trade statistics also include trade with Sabah andSarawak (almost 25% in 1973).

-12-
Table 1: MALAYSIA: GROWTH IN GDP BY KIND OF ECONOMICACTIVITY, 1961-1980 AT CONSTANT PRICES /a
Annual growth rates (%) Contributions of growth (x)1961- 1965- 1971- 1975- 1961- 1965- 1971- 1975-
65 70 75 80 65 70 75 80
Kind of EconomicActivity
Agriculture, live-stock, forestry,& fishing 3.3 6.9 5.7 4.5 17.9 40.2 22.3 12.8
Mining & quarrying 2.8 1.1 -1.3 10.2 4.2 1.6 -1.0 5.3
Manufacturing 12.1 9.9 11.3 13.0 19.5 20.4 22.8 25.8
Construction 11.5 4.1 4.8 12.0 8.5 3.0 2.6 2.1
Services 5.8 4.4 8.6 7.7 49.9 34.8 53.3 54.0
GDP 5.6 5.5 7.5 8.1 100.0 100.0 100.0 100.0
Per capita income 2.7 2.6 4.8 5.4
/a Estimates of growth rates or contributions to growth of the manufactur-ing sector suffer from severe deficiencies in the basic statistics aswell as in the methodology used in estimating them. In brief, thenational accounts framework was changed in the early 1970s, and compar-able time-series over the 1960s are not available. Even for the 1970sreasonably reliable estimates are available only for 1971 and 1973. Theestimates for 1974 to 1977 are still preliminary, because they are basedon the short-cut methods necessitated by the availability of very lim-ited information. Malaysia has adopted an integrated and comprehensiveapproach to estimate its national accounts, in accordance with theUnited Nations: A System of National Accounts Rev. 3 (SNA 3). Althoughthis sophisticated approach leads to very detailed, accurate and usefulaccounts, the whole exercise takes an enormous time (say, four to fiveyears), and by the time the sectoral and national accounts are final-ized, they are out of date. For a further discussion of the extremelyserious data deficiencies and means of alleviating them, see Annex I.
Source: Annex Table 1.1

-13-
Structural Changes in the Sector /1
The Period 1959 to 1973
1.13 The growth of the overall manufacturing sector has been uneven but
fairly substantial. During the 15-year period, 1959-73, total the number of
establishments more than doubled, the number of paid full-time employeesincreased from 57,400 to 268,200 (about four times), gross value added
jumped by about six times and gross output four-five times in real terms.The continuously rising ratio of value added to gross output during this
period perhaps indicates Malaysia's success in increasing the domestic value
added content of its manufacturing gross output.
1.14 During 1963-68 and 1968-73 there was remarkable acceleration of
annual growth rates compared to the 1959-63 period. Gross value added inreal terms increased at 14% and 18% respectively as against 8-9% p.a.increase during 1959-63; gross output in real terms increased at 11% and 16%
annual rates compared to 6% in the earlier period. Full-time employmentcreation in manufacturing progressed at a much faster rate (13% p.a.) during
1963-73 compared to its increase during the previous ten years. With
virtually no increases during 1959-63, labor productivity in real termsincreased at an annual rate of about 3% during the subsequent ten years./2It is also important to mention here that manufactured exports in the latter
period were rising at a much faster rate than the previous two periodsmentioned above.
/1 The available data on manufacturing sector activities suffer from severe
deficiencies. The 1959 census, the first, is known to have incomplete
coverage. Also the 1959, 1963 and 1968 censuses used the two industrialclassifications that have been replaced by the new classification(called "MIS-1972, updated") since the 1973 census. The mission had to
convert the old classification into the new one for comparativeanalysis. Despite the utmost care it might have resulted in somemismatching. Beyond 1973, the data are highly aggregative and subject
to further qualifications. The more detailed analysis of the 1959-73period is therefore separated from the analysis of the more recent
years, 1974-78.
/2 The deflator used in converting the nominal data into real values is the
official Consumer Price Index.
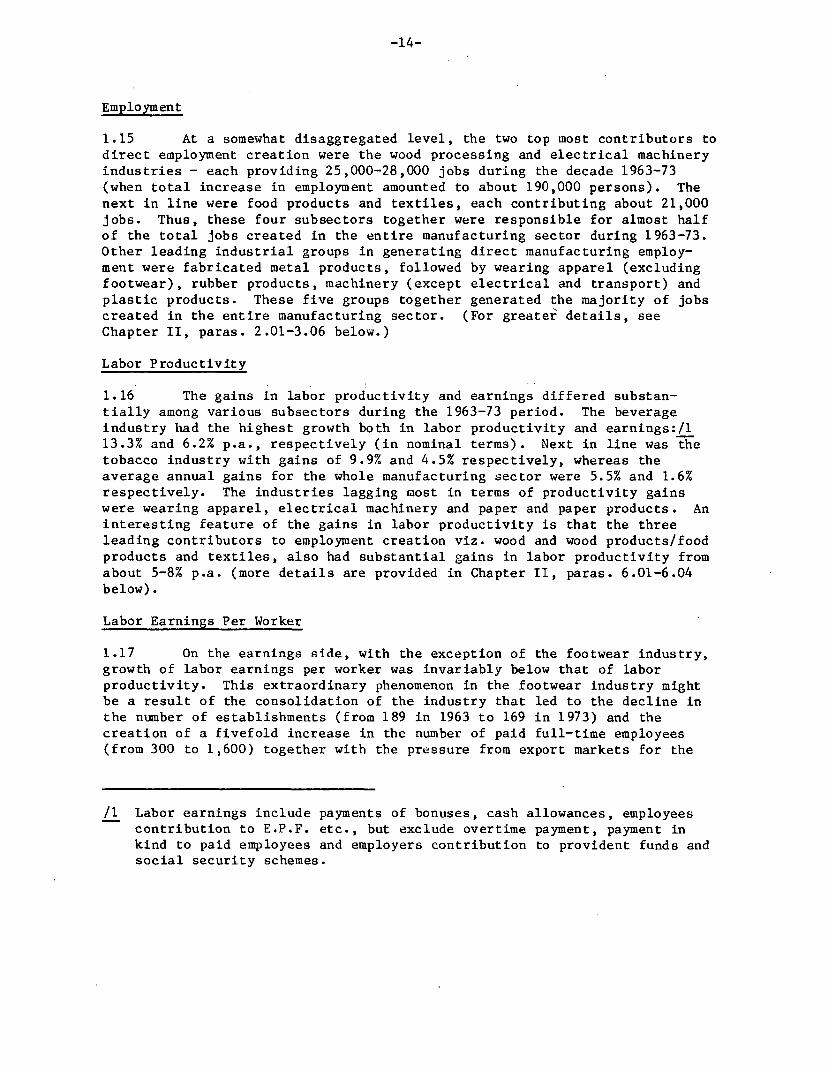
Employment
1.15 At a somewhat disaggregated level, the two top most contributors to
direct employment creation were the wood processing and electrical machineryindustries - each providing 25,000-28,000 jobs during the decade 1963-73
(when total increase in employment amounted to about 190,000 persons). The
next in line were food products and textiles, each contributing about 21,000
jobs. Thus, these four subsectors together were responsible for almost halfof the total jobs created in the entire manufacturing sector during 1963-73.Other leading industrial groups in generating direct manufacturing employ-
ment were fabricated metal products, followed by wearing apparel (excludingfootwear), rubber products, machinery (except electrical and transport) and
plastic products. These five groups together generated the majority of jobscreated in the entire manufacturing sector. (For greatei details, seeChapter II, paras. 2.01-3.06 below.)
Labor Productivity
1.16 The gains in labor productivity and earnings differed substan-tially among various subsectors during the 1963-73 period. The beverageindustry had the highest growth both in labor productivity and earnings:/113.3% and 6.2% p.a., respectively (in nominal terms). Next in line was thetobacco industry with gains of 9.9% and 4.5% respectively, whereas theaverage annual gains for the whole manufacturing sector were 5.5% and 1.6%
respectively. The industries lagging most in terms of productivity gainswere wearing apparel, electrical machinery and paper and paper products. Aninteresting feature of the gains in labor productivity is that the three
leading contributors to employment creation viz. wood and wood products/foodproducts and textiles, also had substantial gains in labor productivity from
about 5-8% p.a. (more details are provided in Chapter II, paras. 6.01-6.04below).
Labor Earnings Per Worker
1.17 On the earnings side, with the exception of the footwear industry,growth of labor earnings per worker was invariably below that of laborproductivity. This extraordinary phenomenon in the footwear industry mightbe a result of the consolidation of the industry that led to the decline inthe number of establishments (from 189 in 1963 to 169 in 1973) and the
creation of a fivefold increase in the number of paid full-time employees(from 300 to 1,600) together with the pressure from export markets for the
/1 Labor earnings include payments of bonuses, cash allowances, employeescontribution to E.P.F. etc., but exclude overtime payment, payment inkind to paid employees and employers contribution to provident funds andsocial security schemes.

-15-
supply of high quality products which in turn needed better qualified personscapable of earning higher wages. The most conspicuous industriesexperiencing a substantial fall in average labor earnings per worker wereprecision instruments, electronics and electrical machinery, glass and glassproducts and tobacco products. Out of these four industries, only the caseof electronics and electrical machinery appears to be well-recognized: thegrowth of this industry has been dominated by the enormous expansion ofelectronic assembly and subassembly which needed unskilled (mostly urban,female) labor that was both abundant and cheap. (For further details, seeChapter II, paras. 5.01-5.05 below.)
Value Added
1.18 Total value added in manufacturing registered an almost sixfoldincrease during the decade, 1963-1973. In current prices, the gross valueadded in electrical machinery, textiles and wearing apparel (exceptfootwear) rose most rapidly: 40, 25 and 15-fold respectively in the courseof the decade. The growth of value added in wood and wood products as wellas in fabricated metal products was as much as the overall sector aroundfive to six times.
1.19 The three leading contributors to the overall growth of themanufacturing sector, however, were food products, wood and wood productsand electrical machinery, which together shared more than 40% of theincremental value added in the sector. Next in line were rubber products,tobacco products and textiles which accounted for another 20% of thesectoral value added.
Structural Shifts and Changes in Product-Mix
1.20 The mission analyzed the changes in product-mix during 1963-73 byregrouping the 27 industrial groups into two types: Consumer- andproducer-oriented industries, which were further divided into twocategories: consumer durables and nondurables, and intermediate and capitalgoods respectively. During 1963-68, the per annum growth rates of consumerdurable, nondurable and intermediate goods was about the same (17% incurrent prices) with capital goods lagging behind, but still growing at animpressive rate of 14% p.a. During the second half of the period consumerdurables were increasing at a very high rate of 34% p.a. compared to about20% annual growth registered in consumer nondurable and intermediate goodsand 28% in capital goods. But it is important to look at the contributionthat these various categories have made to increased overall value addedbecause of their different initial bases. In this respect. the contributionof nondurable consumer goods and intermediate goods declined from 37.3% to33.7% and from 49.9% to 41.1% respectively from the 1963-68 period to the1968-73 period. Over this decade the contribution of durable consumer goodsincreased from 10.0% to 20.4% and that of capital goods from 2.8% to 4.8%.

-16-
The smallness of the capital goods' contribution is as conspicuous as thesubstantial contribution made by intermediate products. Throughout theperiod, the production of consumer durable and intermediate productscontinued to account for about 60% of the total increase in value added inthe manufacturing sector. This indicates that despite the sluggish growthof the capital goods sector some deepening of the manufacturing sector in-the Malaysian economy has been achieved.
1.21 Looking at it from another angle it is clear that during the1963-73 period, import substitution was more prominent among consumer goodse.g. food products, textiles, wearing apparel, bicycles, automobiles andelectrical goods - (more so among consumer durables) than among capitalgoods. By 1973, gross domestic output as a percentage of domestic marketwas 90% for consumer durables, 95% for consumer nondurables, 87% forintermediate goods and about 48% for capital goods./l
1.22 Yet another classification of the structural shift that themission analyzed was the growth performance and extent of contribution madeby the resource-based and nonresource-based industries. Given the richresource base of Malaysia and the policymakers' natural preference toharness these resources, the resource-based industries (both agriculturaland mineral) expanded rapidly during 1963-68 and contributed about 60% tothe sector's overall growth during this period. This contribution fell toabout 50% during the 1968-73 period. But most prominent is the increase inthe contribution made by the so-called footloose industries (electronics,clothing, textiles, etc.) from about 27% during 1963-68 to about 36% during1968-73. By the mid-1970s, the contribution made by these two categoriesof industries was catching up fast with the overall contribution made by theresource-based, agro-processing industries. It is clear that during thelate 1960s and early 1970s the Government shifted its emphasis fromdomestic-oriented, import-substitution activities to export-orientedindustrial development. Consequently, not only the structure ofmanufacturing production shifted in favour of nonresource-based industries,but among them it also shifted in favour of the export-oriented (even iffootloose) industries mainly in the Free Trade Zones.
Structural Changes and Factor Intensity
1.23 In order to ascertain the nature of factor intensity of manu-facturing activity during the period under review, the mission reclassifiedthe 27 major industrial groups into high, medium and low capital intensity
/1 See Chee Peng Lim From Import Substitution to Export Promotion; A Studyof Malaysia's Industrial Policy, Faculty of Economics and Administra-tion, University of Malaysia, Kuala Lumpur, January 1980 (unpublished).

-17-
in terms of the three indicators, K/L, V/L and V/W./1 All three indicatorssuggest that during 1963-68 some capital deepening of fhe manufacturingsector took place as industries with relatively low capital/labor ratio(such as furniture, footwear, leather) grew at substantially lower rates(11-13% p.a.) whereas industries with relatively high capital/labor ratio(e.g. beverages, glass and glass products, basic iron and steel, nonferrousmetal and products) expanded at substantially higher annual rates of 17% to22%. In the subsequent period, 1968-73, relatively more labor-intensiveindustries (wearing apparel, plastic products, electrical and othermachinery) expanded more rapidly - 25% to 31% - than the capital-intensiveindustries which grew at below the average rate. As a result themanufacturing sector directly generated almost 150,000 jobs during 1968-73as against 40,000 jobs during the previous five years and the annual employ-ment growth rate also doubled from 8.3% (1963-68) to 17% during 1968-73./2
Size-Distribution of Establishments
1.24 How did the rapid growth of the manufacturing sector affect thesize distribution of establishments in Malaysia? By the mid-1970s /3 80% ofestablishments had assets below M$50,000 (in terms of their book value) and90% had assets less than M$200,000./4 The majority of establishments hadless than 5 paid (full-time) employees, the bottom 80% had less than 20employees and the bottom 90%, less than 50 employees. Therefore, at leastfour fifths of establishments belonged to the category of small-scaleindustry. They contributed only 8% to the sectoral value added, generatingabout 12% of the paid full-time jobs (plus 90% of the unpaid workers and 60%of the paid part-time workers).
/1 The first indicator (K/L) is the ratio between the measures of twostocks (capital and labor), the second (V/L) is a ratio between a flow(value added) and stock (labor) while the third is a ratio between twoflows (value added and salaries and wages). All ratios, in terms ofthe 1973 census data are grouped into three ranges (high, medium andlow) by distributing the 28 industrial groups somewhat evenly (at thesame time avoiding cut-off points falling within a cluster ofobservations) and ensuring that the average ratio for the overallmanufacturing sector falls in the middle range.
/2 Aggregative evidence beyond 1973 indicate the reversal of the 1968-73trend in capital-intensity discussed here.
/3 Based mainly on an analysis of the 1973 census.
/4 It is interesting to note that the 1975 Industrial Coordination Act(ICA) applies to those establishments with share capital in excess ofM$250,000 (or 25 employees), thereby excluding at least 90% of estab-lishment in mid-1970s.

-18-
1.25 While data limitations are substantial, our analysis neverthelessshows that: (a) labor productivity (i.e. value added per paid full-timeemployee); (b) capital-intensity (fixed assets per paid, full-timeemployee); and (c) gross "surplus" (value added minus wages and salaries)sharply increase with the rise in asset size of the establishment. Like theasset size distribution, the employment size distribution also shows anincrease in labor productivity, capital intensity and "surplus" subject toan important exception of the largest-sized category of establishments(employing 500 or more workers)./l
1.26 The mission further analyzed these changes (during 1968-73) in thegrowth pattern by employment size in relation to several characteristics -viz. number of establishments, number of paid full-time employees, number ofpaid employees, salaries and wages, value added, gross output, and "surplus".It was found that the growth rate of each of the above characteristicincreased with employment size - in part reflecting the influence of theincentive system that strongly favored relatively larger establishments.The number of small establishments (employing less than 20 paid full-timeworkers) rose only by 14% whereas the number of medium and large establish-ments grew by about 80%; the value added by the small establishments grew byonly 70% whereas that among the medium and large establishments grew by180%, and among the large alone by 250%. It would be deirable to provide anincentives environment and support program which remove constraints on smallestablishments and provide them the necessary growth stimulus.
1.27 The slow growth of the relatively small establishments is furtherconfirmed by looking at the longer ten year period, 1963-73. The number ofsmall establishments rose by about 900 (from 6,500 in 1963 to 7,400 in 1973)whereas medium and large establishments rose by more than 1,300 (from 2,400to 3,700) during the same period./2
!Growth Scenario in Recent Years: 1974-78
1.28 According to the Index of Industrial Production, the manufacturingsector grew at an annual real rate of 13% in the second half of the 1970s,showing the growth elasticity with respect to GDP over 1.5. During thisperiod manufacturing activities contributed 26% to GDP growth twice thecontribution of the primary sector. The main sources of growth sustainingthis expansion during 1974-78 were domestic demand expansion (contributingabout two-thirds to overall growth), increase in manufactured exports
/1 The last category is dominated by traditionally labor-intensivelarge electronics and textile firms.
/2 Curiously enough, the official statistics show that the total number ofestablishments in wearing apparel (except footwear) fell from 214 (inthe 1963 census) to 111 (in the 1968 census), in wood and wood productsfrom 918 to 874 and in furniture and fixtures from 682 to 630.
-19-
(about one-fifth) and additional import-substitution about 12-13%. Withsustained rapid growth of the domestic market and a widening of theindustrial base, the manufacturing sector appears to have acquired duringthe last five-to-six years a favorable environment for the next phase ofimport substitution.
1.29 Can we say something more about the performance of the manufactur-ing subsectors over this period? As stated above no statistical informationis available for the entire manufacturing sector for any year beyond 1973.The Index of Industrial Production and Statistics on the Production of MajorCommodities is based on partial coverage, uses outdated weights andindustrial classification and shows no clear-cut relationship or linkageswith any annual surveys pertaining to the entire manufacturing sector. Themission, therefore, used sales value of domestically produced goods as asurrogate measure of gross output for analyzing the growth and structuralchanges in the Malaysian manufacturing sector for recent years./I
1.30 These data show that the overall manufacturing sector has perhapsgrown during the two quinquennial periods - 1968-73 and 1973-78 - at aboutthe same rate - 19% to 20% p.a. in current prices. Since the producersprice index (approximated by the available consumer price index forPeninsular Malaysia) rose more rapidly during the latter period - 6.7%annually as against 3.3% - the annual growth of manufacturing activity inreal terms may have been 16% during 1968-73 and 13% during 1973-78, thelatter being consistent with the overall growth mentioned in para. 1.28above. At the disaggregated level, the sales data at current prices show /2that manufacturing of machinery and equipment grew most rapidly in bothperiods - 30 to 32% annually - mainly due to the electronics components andassembly that grew by almost 50% p.a. throughout the decade. The textileindustry showed an annual growth of 31%. The implied real rates ofgrowth in these industries would be lower but still very substantial. Severalother industries which grew quite rapidly during the 1973-78 period were:palm oil, edible oils and fats and motor vehicle bodies. Industries which -
/1 Because of inventory changes this represents only an approximation ofgross output. Sales data also pertain to some 1,600 to 2,500 (rela-tively large) manufacturing establishments (including some 100 pioneerstatus estabishments).
/2 Because of the lack of individual price series it is not possible tocompute the growth rates in real terms for various subsectors mentionedhere.

-20-.
showed a decline in real terms /1 were: remilling and latex processingof rubber, food industries (mainly estate processing/refining of coconutoil, rice milling and canning of pineapples). Other industries which showedconsiderable deceleration in growth rates were plywood, hardboard andparticle board industries, and food beverage and tobacco industries to alesser extent. Most of these are resource-based manufacturing or processingactivities.
1.31 The most prominent contributors to manufacturing growth during1973-78 were electrical machinery and electronics, and textiles (both ofwhich quadrupled in sales value to M$1,720 million and M$950 millionrespectively by 1978). Together with rubber products which increased fromM$1,160 to M$1,730, these three groups of industries accounted for abouthalf of the increase in sales from 1973 to 1978./2
1.32 How reliable are the growth rates for recent years discussedabove? In the mission's judgement, the scope for a wrong estimation ofgrowth rate is not confined to the various factors discussed in Annex I,Volume III. In fact the possibilities of errors in estimating growth ratesof individual industrial groups or industries are real. As an illustration,the index of industrial production (IIP) suggests that electronics andelectrical machinery grew annually at 18.0 and 18.4% respectively during1973-78 in real terms; the "sales" data suggest that the growth rates in
/1 Based mainly on the Index of Industrial Production which has many short-comings briefly mentioned in para. 1.29 above and elaborated in Annex I,Volume III.
/2 The mission intended to study the growth of manufacturing value addedand the associated structural changes for the 1973-78 period butabsolutely no statistics on manufacturing values added are availablebeyond 1974. In the absence of this information, the mission studiedthe behavior of the ratio of value added to gross output (or 'sales')for the 1968-73 period and found it so unstable at the subsector levelas to be totally unsuitable for measuring the growth of value added fromthe growth of gross output or sales. Also, the official index ofindustrial production suggests that manufacturing value added grew inreal terms at 13.4% during 1968-73. Since the 1968-73 censuses indicatea growth of 22% p.a. in nominal terms, the implicit inflation rate is8.6% which is substantially more than the actual rate of about 3.3%.Therefore the index of industrial production may well underestimate the"true" growth of value added over the period, 1968-73. On the otherhand there is some evidence that the effective protection rates and,therefore, the discrepancy between the domestic and internationalprices may have increased during the 1970s. This would suggest thatsome of the recent industrial growth shown by the inadequate statisticsmay be more apparent than real.

-21-
nominal terms were 46 and 49% - the implied price rise being 27-28% which is
far greater than the price increases of these products on the internationalmarkets and the official Producers' Price Index showing about 7% p.a.
increase. Similarly, the implicit price rise in textiles (16%) is fargreater than the price increases in the international market and theProducers' Price Index. This clearly demonstrates that industrial sectordata are mutually inconsistent even in certain key subsectors. Since these
two industries have been among the most important contributors to Malaysia'sindustrial progress and some important policy decisions may impinge upon
their growth rates (which are subject to a substantial margin of error) theneed for policymakers to assign high priority to the improvement of the
industrial data base is obvious.
1.33 To measure the contribution that various subsectors are working
to the advance of the economy more accurately, it is also important to takeinto account that high rates of effective protection may lead to large
discrepancies between changes in value added measured in the conventionalway, and real contributions to the economy (there are examples in theliterature of industries producing negative value added in internationalprices). Also, especially in the case of Malaysia with its largepercentage of industries under foreign ownerships, it is important todevelop indices that reflect increases in national rather than domestic
income.
1.34 Furthermore the 1968 weights used in the current production index
for individual industrial groups or industries do not represent the structure
of production reflected by the 1973 manufacturing census. For instance,weight of electronics is 0.8 in the current official index, whereas it is
6.3 according to the 1973 census; weight of textiles is 2.2 and 4.5respectively and that of basic metal products 2.7 and 3.7 respectively.On the other hand, several industrial groups have lost substantial ground
during 1968-73. Prominent among them are "other dairy products" from 4.0to 1.0, petroleum and coal products from 5.0 to 2.2, rubber products from14.8 to 9.6, cement from 5.9 to 1.9. "Other pioneer" firms should berevised from 4.5 to zero as they should belong to appropriate manufacturing
industry groups in the production index. Other serious limitations of theofficial index are: (a) all the industries specified in the index together
contributed only 76% of manufacturing value added in 1973; and (b) this
index does not include 11 (out of 28) major industrial groups such aswearing apparel and footwear; leather and leather products, furniture and
fixtures; printing, publishing and allied industries, plastic products,pottery, china and earthenware; glass and glass products; machinery exceptelectrical; and precision instruments. The omission of so many importantindustrial groups casts doubts on the usefulness and accuracy of the
outdated official production index. (See Annex I, Volume III, for a moredetailed discussion of manufacturing statistics and their weaknesses in
Malaysia).

-22-
Achievements and New Challenges
1.35 The problems of measuring growth rates precisely are enormous andshould be kept in proper perspective when reviewing the achievements of thepast. The available statistics show that the Malaysian manufacturing sectormade considerable progress over the last two decades, both in terms ofoverall growth rate and structural changes. The manufacturing sector grewat an accelerated pace of 10 to 11 to 13% annually during the first, secondand third plan periods, respectively. As a result of Government's keennessto overcome the (urban) unemployment problem, manufacturing employmenttripled in a decade thereby directly creating 250,000 new jobs; the growthelasticity of manufacturing employment continuously increased from 0.7(1963-68) to 0.9 (1968-73) to 1.1 (1973-78)./l
1.36 Policymakers' success in directing an accelerated growth wasfacilitated to a considerable extent by a favorable world economic environ-ment owing to a buoyant demand for Malaysia's commodity exports (petroleum,timber, rubber, palm oil, etc.); a rapidly expanding market for nonresource-based footloose manufactured exports (textiles, clothing, electronics, etc.)from developing economies; a ready access to urban, easy-to-train laborforce and ample natural resources. The present volatile world economicsituation as well as vulnerability and deceleration in the growth of certainmanufacturing industries, however, pose new challenges for continuation ofthe rapid industrial growth so necessary to meet the NEP objectives ofpoverty alleviation and restructuring of employment. Meeting thesechallenges would require new policy initiatives and strengthening of themonitoring, evaluation and implementation system, both at the subsector andgeneral levels, and are briefly discussed in Chapter VI below.
1.37 of particular interest to the policymakers should be the analysisof changes in size distributions which revealed that the number of smallmanufacturing establishments remained almost stationary. Small establish-ments provide a substantial proportion of paid part-time as well as "unpaid",jobs, and thus help to reduce underemployment. These results are reinforcedby a detailed cross-sectional field study of some 400 establishments con-ducted by Chee Peng Lim./2 Another recent study discusses the importance of
/1 There are some obvious contradictions: increase in employment as wellas increase in employment elasticity coupled with increase in laborproductivity do not seeem to be consistent with declining or low levelof manufacuring sector investment, discussed in Section "E", in thepost-1974 era and reinforce the mission's suggestion that weaknesses ofthe manufacturing statistics deserve serious attention of the plannersand policy makers.
/2 Chee Peng Lim, "A Study of the Pattern of Employment and Wages in SmallIndustry in Malaysia," The Developing Economies, March 1978.

-23-.
small industries and the problems they face in the Malaysian economy, andevaluate various official programs for promoting small industry development;besides conducting a sample survey of the rubber processing machinery andtin mining machinery industries./I The mission's impressions are reinforcedby this study which concludes that small industry in Malaysia could notdevelop to its full potential due to the inherent difficulties that it facesand to an unfavorable, albeit unintended, government policy environmentwhich favored growth of relatively large establishments, mainly through avariety of incentives./2 The development experience suggests that awell-balanced industrial structure requires small, medium and largeestablishments and that each has a role to play in industrialization of aneconomy, despite an accelerated use of sophisticated technology and modernindustrial organization. In Malaysia the general interest in Bumiputradevelopment makes the establishment of "new" small industry an even moreattractive target for promotional efforts. Certain industries seem to bewell suited for small-scale operations; they include industrial machinerycomponents foundries, motor vehicle bodies, furniture, leather footwear,clothing and bakeries. Specific problems faced by SMIs in Malaysia deservefurther analysis.
1.38 The growth of the manufacturing sector value added and output aswell as changes in product mix and the sources of growth have beensubstantial. In the mission's judgement, however, the growth in employmentand its distribution, trends in wages and earnings, differentiation in laborproductivity and capital intensity as well as labor market conditions areeven more important from the viewpoint of the NEP objectives and theirfulfillment. The following chapter therefore reviews the extent of progressmade and the nature of outstanding issues in these various areas.
/1 See Chee Peng Lim and Foong Wai Fong, An Analysis of Small Industry inMalaysia (Faculty of Economics and Administration, University of Malaya,Kuala Lumpur, September 1979, unpublished). This study is sponsored bythe Asian Regional Team for Employment Promotion as a research projecton Asean Comparative Study of Labour-Intensive Industries in Malaysia.
/2 See Chapter VI for a more detailed discussion.

-24-
II. POPULATION, LABOR FORCE AND MANUFACTURING SECTOR EMPLOYMENT
Population and Labor Force
2.01 Malaysia is one of the medium-sized countries in terms of itspopulation which is estimated around 14 million in 1980. Its 2.6% p.a.population growth places it among the group of 39 countries showing a littlemore than moderate growth in their population size./l Almost 85% of thispopulation is in Peninsular Malaysia (Sabah 6%, Sarawak 9%) and 54% of themare Malays, 35% Chinese, 10% Indian and 1% others./2 Some of the othercharacteristics of the Malaysian population are: (a) its youngness (around40% are in the 0-14 age group) - therefore, the dependency ratio is high;and (b) 65% of the people live in rural areas and the majority of the ruralpopulation (about two thirds) are Malays, and (c) in recent years the Malayurban population has been rising fast because of the lure of manufacturingand commercial sector jobs.
2.02 Expanding at an annual rate of about 3.5% and with some 80,900 newentries into the labor force over the Third Plan period, the total laborforce is expected to reach about 5.1 million in 1980. About 89% of thislabor force is in Peninsular Malaysia - comprising about 52% Malays, 36%Chinese, 11% Indians and 1% others. According to the Mid-Term Plan Review,total employment during 1975-80 is estimated to rise at 3.7% p.a. and thecurrent unemployment rate is about 6%. About 42% of those employed in 1980were in agriculture, 14% in manufacturing industry, 14% in governmentservices,/3 13.7% in finance, insurance and commerce, 4.7% in constructionand the rest in other services.
Employment in the Manufacturing Sector: Overall Situation
2.03 The Third Malaysia Plan (TMP) assigned highest priority to a rapidgrowth of the economy, the manufacturing sector being the most dynamic forcebehind this growth. The principal government strategy for reducing ruralpoverty is to encourage people to transfer from low productivity ruraloccupations to higher income opportunities in the modern sector through therapid development of the industrial and service sectors. The manufacturing
/1 The World Bank "ATLAS", 1979.
/2 Malaysia, "Mid-Term Review of the Third Malaysia Plan, 1976-80" (to becalled the Mid-Term Plan Review).
/3 Including public administration, defence, health, education and publicutilities.

-25-
sector is expected to contribute almost 30% to the total new jobs to becreated during the plan period.
2.04 In spite of the enormous importance assigned to the manufacturingsector in terms of its contribution to the creation of new jobs, the database to evaluate the performance of the sector in this respect remains veryweak and deficient. Analysis of the trends at the disaggregated and sub-sectoral level is particularly difficult since the only source of consistenttime series - viz. the Monthly Industrial Statistics (MIS) at the five-digitlevel - present data derived from full enumeration of only 49 out of 95industry subsectors covered by MIS. Others involve industry-specificcut-off points varying from industry-to-industry but in many cases excludingestablishments with less than 20 employees, and more importantly excludingcertain important subsector completely e.g. furniture, fish canning, made-uptextiles, repairs of frig, air-conditioners, etc., resulting in seriousunder-coverage./l But the other alternative data source - viz. theQuarterly Labor Force Surveys (QLFS) also suffers from major deficiencies:(a) it is based on a small sample of 18,000 households (from a total ofabout 2.6 million estimated households in 1980); and, (b) in 1976 theunemployed were differentiated by "passive" and "active" - making the laborforce participation rates (LFPR) incomparable over time.
2.05 Despite the numerous inconsistencies and limitations in primarydata sources, which make reliable labor market analysis a very difficulttask, various statistics do indicate a rapid growth in manufacturing sectoremployment in the second half of the 1970s. The growth of aggregateemployment in the manufacturing sector, as shown in the table below rangesfrom 9% to 12% p.a. during 1974-78. Industrial sector employment derived asa difference and shown in the last column perhaps contains a substantialelement of employment in the small-scale segment of the industrial sector.Even that appears to have grown at 6% to 8% p.a. The mission did not havetime to look deeply into the performance and characteristics of the SSIsegment of the manufacturing sector but clearly this sector is important anddeserves much greater attention in future work.
2.06 Even over a longer period, 1967/68 to 1978, the QLFS data show aremarkable increase in manufacturing employment in Peninsular Malaysia - anaverage annual growth of 12%. The expansion in more recent years (1974-78)has slowed down but is still substantial. Based on these data, the share of
/1 MIS reports manufacturing sector employment level which is about half ofthat reported by alternative sources. Many of the nonreportedestablishments are small (employing less than 20 workers) but aconsiderable number would also be medium-sized establishments.

-26-
Table 2: AGGREGATE EMPLOYMENT IN THE MANUFACTURING SECTOR, 1974-78
(C)(A) (B) Treasury/
QLFS MIS EPU /a Difference
(End Dec) Estimates (C-B) (A-B)1974 460.3 193.9 448 254 266.41975 533.4 211.6 498 286 321.81976 581.3 241.5 535 293 339.81977 622.6 262.5 587 324 360.11978 666.4 307.8 630 322 358.61974-78 9.7 12.2 9.0 6.1 7.7Growth rates
QLFS = Quarterly Labor Force Surveys
MIS = Monthly Industrial Statistics
/a Mid-Term Review of the Third Malaysia Plan and Economic Report,1979/80.
manufacturing in total employment went up from 9.1% in 1967/68 to 16.7% in1978./i In commerce the increase was from 10.8% to 14.5%. As a result theproportion of employment in agriculture declined from 51.5% to 39% over the
same ten-year period. The intersectoral transfers have created some laborshortages in agriculture (particularly for young workers) and have set inmotion an important long-term mechanism for raising per capita incomesthrough moderate mechanization. Despite a fairly rapid growth inemployment, however, not all the slack has disappeared. In September 1979,the QLFS disclosed that 5.3% of the labor force was still unemployed.
2.07 Data limitations are even more severe at disaggregate levels butan analysis of labor market trends is desirable for discussion of futureindustrial strategy, employment and manpower policy and other key socio-economic objectives of the Government during the Fourth Malaysia Planperiod. The deficiencies of the MIS data have been noted above but that is
the only source of data for discussion at the disaggretate level. Thereforethe finding and conclusions which 'emerge cannot be better, than the primary
/1 EPU/Treasury (adjusted) data show the share of manufacturing employmentin total around 14%.

-27-
data underlying the analysis. There are nevertheless some very interestingfeatures of recent developments at the subsectoral level and the series doesgive a useful indication of broad trends in the enterprises which accountfor the bulk of industrial output. The next section, therefore, discussesthe trends in employment at disaggregated levels.
Trends in Subsectoral Employment
2.08 Among the 12 growing specific industries during recent years(1973-79), leading the list was the electronics/electrical machinerysubgroups which quadrupled its labor force. It was followed by the motorvehicle parts and accesories showing a net growth of employment in 1979almost 3.5 times the level in 1973. Industries which succeeded in increas-ing their employment twice or almost twice over this period were metal andmiscellaneous products, pulp, paper and paper boards, and planing windowsand door mills and joinery works. A total of 7 other industries, chemicalproducts, medical and pharmaceutical preparations, breweries, clothing, ironfoundries, textiles (major group 321) and chemical fertilizers/pesticidesincreased their employment by about 100% within the six years under review.
2.09 In terms of the absolute employment gains, particularly conspicuousis the contribution made by the electronic machinery and apparatus sector(mostly electronic subassembly) rising from 22,562 in 1973 to 60,957 in1978. This is a labor-intensive industry dominated by multinationalcorporations which have been attracted to Malaysia by its relatively lowlabor costs, political stability, generous tax incentives, good workingenvironment for expatriate executives, and reasonably good transportfacilities. It has benefitted from the world-wide boom in demand forsemiconductor components (US semiconductor industry shipments alone areexpected to reach M$7.7 billion in 19780)./1 Malaysian exports of machineryand equipment (principally electronic components) totalled M$1. billion in1978 and grew by 78.8% p.a. between 1971-78.
2.10 A second rapidly growing industrial group has been textiles andclothing. Combined employment nearly doubled in five years, rising from28,531 in 1973 to 51,793 in 1978 (16.8% of the total manufacturing employ-ment recorded by the survey). Here a major stimulus to growth has beenimport substitution behind a moderate tariff protection (nominal rate of35%), together with a rapid expansion of domestic demand. Total consumptionexpenditure rose by more than 9% p.a. in real terms in this period.Domestic demand for textiles and clothing will have increased at a higherrate because the income elasticity of demand for textiles-is above unity.Nevertheless, exports also contributed significantly to the growth,
/1 Asian Wall Street Journal, February 1980.

-28-
especially in the clothing sector. Clothing exports reached M$255 millionin 1978. The sales value of output from the clothing factories covered bythe monthly industrial statistics amounted to only M$207 million in 1978.As the official cut-off point was 5 workers or more for this subsector,these figures suggest either under-coverage in the survey or a significantvolume of exports emanating from very small establishments (possibly on asubcontract basis to export traders). Exports of textiles on the other handreached M$196 million compared with a total sales value of M$957 million in1978 recorded in the monthly industrial statistics where the coverage ofestablishments in this sector was supposed to be complete. Collectively,the three subgroups: electronics, textiles and clothing accounted for almost40% of total manufacturing employment reported in MIS.
2.11 Another major employer is the food and beverage industry. Herethe expansion of employment has been less rapid (33% over the five-yearperiod) but still accounted for 10.4% of total employment in 1978. Theindustry depends largely on the domestic market. Processed food exportsaccounted for 1.5% of total exports in 1978 (7% of manufactured exports).Food exports grew by 14% p.a. between 1971-78 compared with 24.8% for totalmanufactured exports.
2.12 The Bank Negara estimates that 20% of total manufacturing outputis now exported. As a high proportion of manufactured exports are labor-intensive products (electronics, textiles and clothing), upwards of one outof every four jobs in industry can be attributed to overseas demand and theproportion is growing.
2.13 The rate of job creation was rather disappointing in rubberproducts, plywood and particle boards, printing and publishing and plasticproducts. During 1973-79, some specific industries even showed a decline inemployment. They were: pineapple canning, coconut oil, sugar factories,and in more recent years (1976-79), this group included large rice mills,rubber remilling and latex processing off estates as well as sago andtapioca establishments. In fact during mid-1976 and mid-1979, all thefive-digit manufacturing industries in MIS, with just three exceptions,/lregistered slower rates of employment growth. The rate of manufacturingoverall employment in recent years has therefore decelerated.
Ethnic Composition of the Manufacturing Labor Force
2.14 A major objective of the Government's New Economic Policy (NEP) isthe absorption of a higer proportion of Malays in the modern sectors of theeconomy. Although the percentage of Malays employed in the secondary andtertiary sectors has increased from 34.2% in 1967/68 to 48.5% in 1978,
/1 These exceptions are: other grain mills, soft drinks and carbonatedbeverages and iron foundries.

-29-
progress has been relatively slow in manufacturing alone. Bumiputrasconstituted 35.1% of manufacturing employment in 1978 compared with 32.3%ten years previously. One reason perhaps is the slower rate of appropriateskill development in Malay labor force in line with the needs of themanufacturing sector. No breakdown is available showing the distribution byoccupational categories within the manufacturing sector. In the economy asa whole, 50% of those employed in professional and technical occupationswere Malays in 1978, close to their proportion in the total labor force(48.8%). But they accounted for just 27.7% of administrative and managerialgrades and 24.3% of sales and related workers.
2.15 The relatively low penetration of Mlalays into managerial/ adminis-trative sales posts may be explained by: (a) a traditional preference amongeducated Malays for public administration and professional jobs (e.g.doctors); and (b) the predominance of family-owned businesses established bynon-Malay entrepreneurs who, as with family businesses throughout the world,tend to reserve managerial posts for family members. The 1973 ManufacturingCensus showed that 10,527 enterprises out of a total of 11,060 wereindividual proprietorships, partnerships or private limited companies. Inthe subsidiaries of multinational corporations, the percentage of Malays isrelatively high. A survey conducted by the Malaysian International Chamberof Commerce and Industry (MICCI) in December 1978 revealed that 44.6% oftotal employees in the international companies were Bumiputras and theyrepresented 49.2% of the skilled worker category, 23.1% at the supervisorygrades and 20.6% of executives. These latter two percentages had almostdoubled in six years. In public sector companies the Bumiputra proportionis likely to be substantially greater but no data were available to themission for further analysis.
2.16 The MICCI forecasts a gradual but continued rise in the Malayshares. Already around 50% of their recruits coming from institutions ofhigher learning are Bumiputras. They are given training within companyprograms and/or courses run by the National Productivity Center. Thistraining, combined with on-the-job experience, should result in a betterracial balance among senior personnel in the future. In the mission'sjudgement the prospects of this happening naturally within the fast-growingmanufacturing sector and the Malaysian economy are very good. As thesecondary and tertiary sectors continue to grow rapidly, the manufacturingand commercial enterprises will outgrow the family-oriented management styleand as the more competitive export manufacturing and trading keep theirmomentum and the investment climate remains attractive, the demand fortechnically and professionally trained Malays will rise rapidly. What theGovernment should make sure of is that there is an adequate supply of M4alaysin these skill categories to take advantage of the emerging situation. Themission therefore places very strong emphasis on appropriate skilldevelopment among the Mfalay labor force. This contributes both to a morebalanced racial distribution of employment and income levels enjoyed bythem - the key socio-economic objectives of the NEP.

-30-
Trends in Wages and Earnings
2.17 It is difficult to trace the trends in wages and labor earnings.No wage indices are prepared by the Department of Statistics or the Ministryof Labor and the coverage of the industrial surveys varies from year toyear.
2.18 During the two census years - 1968 and 1973 - for which reliabledata are available, the yearly wage levels in manufacturing remainedstationary, averaging M$2,210 in 1968 and M$2,190 in 1973. This reflectssubstantial unemployment and underemployment which prevailed during thisperiod. During 1973-78 when the manufacturing growth was rapid and thelabor market tightened, average annual wages among the pioneer statusestablishments increased from M$2,056 to M$3,519 - raising money wages by71% as compared with 39% increase in the Official Consumer Price Index.
2.19 Information on the broader concept of average earnings per month(AEM) reported in the Monthly Industrial Statistics (MIS) also shows that innominal terms they increased from about M$190 to M$320 at an annual compoundrate of about 9%. In constant 1973 prices the overall sector AEM increaseduring 1973-79 was 18.6% - or 2.9% p.a. The increase was 2 to 3 timesfaster than the overall sector average in motor vehicle bodies, ironfoundries, plywood and particle board, textile manufacturing and 1-1/2 to 2times the average sector growth in such subsectors as footwear, clothingfactories, planning mills, cement and concrete, assembly of automobiles,etc. The largest employing industry, viz. electronics and electrical ranked17th among 21 industries showing,AEM increases during 1973-79 (25.3%) - onlymoderately above the industry average. The second and the third largestemploying industries, viz. textiles and clothing were significantly higherthan the sector average.
2.20 Looking at the trend in real AEM during 1973-76 and 1976-79separately, the mission found that among the 8 largest employing industries,growth remained stationary in electronics and plywood/particle board mills;decelerated substantially in textiles, plastic products, printing/publishing, etc. from the first to the second period but acceleratedconsiderably for such subgroups as clothing, and rubber products.
2.21 This fragmentary evidence on average real earnings suggests thatthere are perhaps some industry-specific shortages, reflecting quitepossibly rigidities in local supply conditions rather than a generalshortage of labor facing the manufacturing sector in the Malaysian economy.During the last three years, acceleration in AEM has occurred and laborshortages have been reported in some industries but they have regionalconcentration and sex bias. For example, labor scarcity has been created insome regions by a heavy concentration of new industries like electronics ina few localities (e.g. Penang) and their rapid growth has exhausted theavailable supply of labor in the immediate neighborhood. This seems toapply particularly to female labor whose mobility is restricted by
-31-
conventional social/cultural barriers. Another factor explaining laborscarcity in some areas of the economy is the fragmented character of thelabor market and the wage negotiation system. Less than half a million(out of a total of about 5 million) workers throughout the economy aremembers of trade unions and collective agreements, lasting 2 or 3 years, arenegotiated at the plant or subsectoral level. Thus, although both nominaland real wages appear to have risen in recent years there are substantialdifferences in the wage rates for the same jobs in different firms andindustries. This tends to induce job-hopping, thereby creating temporaryshortages for certain employers.
Trends in Labor Productivity and Capital Intensity
2.22 The Mid-Term Review of the Third Malaysia Plan estimated that reallabor productivity in manufacturing increased by 4.5% p.a. from 1976-78 andwould average 4.1% for the whole of the five year period (1976-80). This isderived from national accounts estimates of GDP growth in the manufacturingsector (13.0% p.a. for 1976-80) and employment growth estimates (8.5% p.a.).These estimates indicate a capital intensive pattern of development with aconsiderable elasticity of employment to output. Between 1968 and 1973fixed assets per worker rose only slightly, from M$7,370 to M$8,560 incurrent prices. This was accompanied by corresponding moderate growth invalue added per worker from K$7,230 to M$8,680. More recently the capitaldeepening process appears to have accelerated in some industries. A sampleof 779 firms submitting information to MIDA under the Industrial Coordina-tion Act showed a mean value of fixed assets per worker of M$21,466 in 1978in nominal terms and M$12,400 at deflated prices. But these figures over-state the real increase because small firms with less than 25 workers wereomitted and the prices of machinery and buildings increased significantlyduring this period. Even then considerable capital deepening appears tohave happened in the manufacturing sector.
2.23 There are also substantial variations in capital intensity levelsbetween different industries and even between firms within the sameindustry./l The number of jobs created for a given level of investmentdepends both on the type of product being produced and on the kind of tech-nology chosen. Factors influencing this choice include size of enterprise,type of ownership and whether the enterprise had been accorded PioneerStatus (entitling it to various investment-based tax incentives). Also thelarger the firm (expressed in level of fixed assets), the higher the amountof investment per worker. There is a similar pattern when size is measuredby the number of workers per establishment, except that the largest sizegroup (500 or more workers) has an average capital intensity below themedium sized enterprises (100-499 workers). This may be explained by theprominence of textile and electronics firms among the largest employers.
/1 See W.H. Knowles, Cost of Job Creation and Ethnic Composition of Jobsin Various Sectors of the Economy, mimeo., ILO/UNDP, August 1979 basedon data derived from MIDA files.

-32-
2.24 The existing incentive system, following the Pioneer Status (PS)approach to development, has probably resulted in fewer jobs per unit ofinvestment. The 1973 Census showed that fixed assets per worker in the PSfirms were 42% greater than the average for the whole of manufacturing andwere higher in 12 out of 14 subsectors. This difference seems to be derivedfrom the bias in the incentive system towards large projects and the natureof incentives offered them.
2.25 A third important variable is the legal status of the enterprise.Public corporations owned by the Government and public limited companies inthe private sector were almost equally capital-intensive in 1973, with fixedassets per worker of M$17,277 and M$17,246 respectively. The level droppeddrastically to M$7,808 in private limited companies and M$4,478 inpartnerships. Individual proprietorships used merely M$1,852 in fixedassets per worker. Besides activity differentiation and related technologythese differences also reflect the easier access of public companies andgovernment enterprises to investment funds, both domestic and foreign.Smaller private firms are more dependent upon proprietor's savings andploughed-back profits and appears to show greater conservatism in the use offunds.
Labor Market Segmentation
2.26 The issue of labor shortages is also related to the fairly deepsegmentation of the Malaysian labor market. Thus different categories ofjob seekers, e.g. females and young persons, typically face different labormarket conditions than males and adults and pockets of labor shortage inregions and for certain skill categories coexist with surplus labor else-where. The phenomenon of labor market segmentation is clearly reflected inthe wage rates data produced by the occupational wage survey of the Ministryof Labor and Manpower./l
2.27 Inflation has not been a serious problem and Peninsular Malaysiais reasonably compact with a good system of internal transportation, as wellas national education. Accordingly, one would expect a relatively narrowrange of wage differentials for equally qualified categories of workers.Yet the occupation wage survey reveals large wage differentials manifestingthemselves in every direction: interindustry, interregional, interoccupa-tional, and by skill level and sex. In general, average monthly wages forsix out of eight occupations reported /2 from Kuala Lumpur and Johore Baru
/1 The latest survey refers to May 1977 and as in other data series thesestatistics also suffer from many weaknesses. For example the surveyrefers only to a selected sample of occupations and many occupations arelisted with too few employees in the data source.
/2 General chemists, accountants, production managers, laboratorytechnicians, plant maintenance mechanics, office clerk, productionsupervisor and general foremen, laborers.

-33-
were well above the Peninsular average. Part of these differentials areperhaps due to area differences in the cost of living 'or special circum-stance (e.g., Johore Baru's closeness to Singapore./l As a general.pattern,for the same occupation the rates of pay can vary by as much as twice ormore across industries. As between male and female in the production groupof occupations the female/male ratio is around the 0.5 to 0.6 range. In allregions there are very large disparities in relative pay rates. The highlyskilled occupations (e.g. chemists, accountants, professionals andproduction managers) carry scales of pay which are about 10 times largerthan rates of pay for laborers, and this is true for both male and femaleemployees./2 Further studies would be useful to get some insight into thephenomena of labor market segmentation, wage differential, internalmigration and labor flows to devise appropriate labor market policies.
Skill Shortages and Incentive System
2.28 The most acute scarcities appear to be in the categories ofskilled workers, technical and managerial personnel. This reflects to alarge extent the inevitable lag in a rapidly growing economy between thecapacity of the educational institutions and the in-firm training facilitiesto develop new skills (and experience), and the demand for qualified per-sonnel in the modern sectors. It is also affected by four other factors.The first is the Government's desire to increase the proportion ofBumiputras (Malays) in the higher occupational groups. This desire, coupledwith socio-political pressures being applied to employers to meet specificethnic targets, has not been matched by an equally signficant shift in theeducational/job preferences of the Malays. They still tend to gravitatetowards humanities courses and to white-collar, administrative jobs in thepublic sector rather than skilled craftsmen or technical/managerial posts inindustry./3 Those qualified Malays who have made the switch can commandsignificant salary premiums over other ethnic groups. It would be necessaryto develop the low cost, mass manpower training and skill developmentschemes.
/1 Wages and salaries in Singapore are 30-40% higher than Malaysia andwhile no statistics are available on the extent of Malaysian labor inSingapore figures of well over 100,000 are often cited.
/2 The Malaysian disparities in relative pay rates are considerably highercompared with those of advanced countries where the usual ratio betweena professional and a laborer's earnings is less than 5:1.
/3 For example, data from the Employment Services of the Department ofMinistry of Labor suggests that during 1978/79 among those registeredas unemployed, 90% were less than 30 years old; 70% had education belowthe LCE/SRP level; 93% had no institutional training and 90% had nowork experience.

-34-
2.29 Also an employment survey conducted by the Malaysian InternationalChamber of Commerce and Industry (MICCI) in March 1979 shows that theBumiputra's share or total management and supervisory-grade employmentvirtually doubled during 1973-78 although these shares.were still in the 20%and 25% range. The Malaysia labor market for high-level manpower is alsoquite tight.
2.30 A central recommendation of the Master Plan for ManpowerDevelopment in Melaka (prepared in May 1979) is the establishment of a"multi-purpose institution, providing training for a wide range of skills"(p. 57). It would not be difficult to anticipate similar conclusions inother state master plans. The Melaka Study, however, does not attempt todetermine the present and future participation of firms in the privatesector in skill development; nor does it take into account the public costof training. According to another MAMPO study, there was a total of 206skill development institutions operating under the Ministry of Education(excluding academic schools)./l While a consolidated and appropriateorientation of the public sector training and skill development institutionsis an obvious need,' in the mission's judgment, underinvestment in skilldevelopment may be more serious at the plant level than at the institutionlevel.
2.31 In order to encourage greater investment in in-plant training byemployers in the private sector the mission studied three alternativemeasures: (1) an industrial training levy, (2) an in-plant training subsidyand (3) a tax credit scheme for employers undertaking an approved program.
2.32 The levy scheme would require a substantial bureaucracy toadminister it effectively. In Malaysia, there is already a large parastatalsector and there may be substantial bottlenecks in securing suitablyqualified officials (accountants, instructor-trainers) to operate thescheme. Furthermore, there would be considerable delay in implementing thescheme to allow the construction of additional infrastructure for the volumeof industrial training required. The in-plant training subsidy wouldovercome some of these difficulties, especially the need for substantialnew training facilities. But a major weakness of the subsidy scheme is thatit would require a direct cash outlay on the part of the Government.Another limitation of the scheme is that it would tend to favor the largeremployers rather than SSIs because few of the latter would have the space orthe resources to undertake formal in-plant training. Finally, administeringsuch a program would be highly difficult owing to lack of adequate recordsand machinery.
2.33 A close substitute to the training subsidy proposal is a taxcredit' granted to employers undertaking an approved in-plant trainingprogram. Instead of receiving a periodic cash subsidy, the employer wouldsimply'be allowed a reduced rate of corporate income tax; all the other
/1 MAMPO: "Skill Production Facilities in Malaysia, 1977", p.3.

-35-
details of the in-plant training subsidy discussed above would apply. Themain relative advantage is that the tax credit scheme could be included inthe MIDA incentives package. The in-plant training tax credit would beavailable to all firms starting with a flat minimum, say, 25% of theincurred training expenditures with additional credits of 5% each to firmslocated in development areas; or firms meeting restructuring targets orperhaps 10% additional credit to encourage especially small-sized firms./1The training tax credit scheme would appear to have the highest merit,especially if it were introduced as part of a reformed system of incentivesadministered by MIDA.
Concluding Remarks
2.34 The analysis presented above has shown that the industrial sectorhas contributed considerably to the creation of gainful employment in themodern sector. But the national labor force continues to increase at afairly rapid pace and substantial poverty remains a common feature of therural areas. The analysis has also shown that the Malaysian labor market isnot now, and has not been for the last several years, working as efficientlyas the relative openness of the economy would suggest, or indeed wouldrequire. Collectively, the evidence underlying the present analysis castsdoubts about the existence of a general labor shortage in Malaysia and thewisdom of a general capital-intensive development strategy at this stage ofMalaysia's development. There are no doubt many industry-specific andskill-specific shortages, reflecting quite possibly rigidities in localsupply conditions rather than general shortage of labor in the Malaysianeconomy.
2.35 The mission therefore feels that in such a fluid and transitionaryphase, it would be desirable to realign incentives in such a way that theirinducement to capital- and labor-use remains neutral. Also it would seemappropriate to conduct in-depth studies of key industry-specific manpowerbottlenecks and other constraints and selective application of capital-intensive technologies only where appropriate.
2.36 `"e role of manufactured exports has been extremely important inachieving impressive growth in output and employment in the manufacturingsector in the 1970s. In the mission's judgement, this role will remaincrucial in sustaining the momentum of this growth in the 1980s and inkeeping the manufacturing operations oriented toward Malaysia's comparativeadvantage. The 'following chapter therefore evaluates the growth performanceand prospects of Malaysia's manufactured exports.
/1 It would also be desirable to grant tax credit for sending staff toexisting skill development institutions or to larger firms- in-planttraining facilities because only a lmited number of small-sized firmsmay have such facilities and bureaucreatic approval to many in-housetraining schemes may be both costly and time consuming.

-36-
III. MANUFACTURED EXPORTS
Growth and Diversification of Exports
3.01 While the information gap is bound to leave many important analy-tical questions unanswered,/l there are a number of generally interestingfeatures of the growth and diversification of exports worth analyzing here.The Malaysian economy is highly trade-oriented. Its exports in relation toGNP have gone up from 42% during the First Malaysia Plan and the SecondMalaysia Plan to 49% during the Third Malaysia Plan. Since imports inrelation to GNP remained around 35-37% of GNP, the country has benefittedfrom a very favorable trade balance, resulting in substantial currentaccount surpluses and accumulation of 'foreign exchange reserves.
3.02 Although international trade continues to dominate the Malaysianeconomy, there have been substantial changes in the underlying tradestructure as indicated by Table 3 below.
3.03 Several important features of the changing trade structure areworth noting: (a) the share of nonmanufactured exports in total has gonedown continuously over the last two decades (rubber and tin are conspicuousin their falling shares) notwithstanding the rapid increase in petroleum(crude and refined) and the phenomehal rise in the shares of palm oil andtimber exports; (b) the share of manufactured exports has more than doubledfrom 8.5% in 1961/62 to 20.5% in 1978/79; (c) exports of items virtuallynonexistent in the 1960s, textiles and clothing, electronics, electrical
machinery and appliances, growing at an annual average rate of 10% havecaptured a 12% share of Malaysia's merchandise exports and almost 50% ofmanufactured exports. In fact the share of electronics and electricalmachinery alone in 1978/79 ,was greater than the share of manufacturedexports in total merchandize exports in the early 1960s. During the courseof one decade only, the nominal value of exports of electronics have risenalmost 100 times from a modest base of M$20 million in 1971 to about M$2billion in 1979.
3.04 While Malaysia continued to exploit its comparative advantage inresource-based industries and abundant, unskilled, low wage labor, severaldevelopments led to a dramatic shift in the product-mix of Malaysia's manu-factured exports. With increasing labor costs in industrialized and semi-industrialized countries (particularly in the USA, Japan, Singapore, HongKong, Taiwan and South Korea) multinational corporations were attracted bywell-disciplined, low-paid, easy-to-train Malaysian labor together with avery favorable climate for foreign investment, including an extensive arrayof tax and tariff incentives. Along with its effort to create employment
/1 See Annex I for details on this issue.

-37-.
Table 3: MALAYSIA: CHANGING STRUCTURE OF MERCHANDISE EXPORTS /a
As x of total merchandise exportsProducts 1961/62 1968/69 1973/74 1978/79
Rubber 46.8 36.9 30.7 19.9Tin 18.1 19.3 13.7 10.5Timber 6.2 16.1 17.7 14.0Petroleum, crude & partly refined 3.3 3.7 5.4 15.6Palm oil (incl. processed & kernel) 2.2 3.3 9.0 11.9
Total Nonmanufactured Products 91.5 88.2 84.0 79.5
Total Manufactured Products 8.5 11.8 16.0 20.5
Food 1.3/c 1.8 1.9 1.5Petroleum & chemicals 4.47-T 4.5 2.3 1.4Textiles & clothing neg. 0.7/d 1.1 2.2Electrical machinery /b neg. neg. 2.0 9.6Others 2.8 4.8 8.7 5.8Average annual total exports 100.0 100.0 100.0 100.0
(M$ million in current prices) 3,249 4,589 8,784 20,512
/a In order to reduce the effect of year-to-year fluctuations, averageratios for two consecutive years are presented here.
/b Mainly electronic, electrical appliances and components./c Relates to 1960.7_ Includes exports of footwear also.
Sources: Annex Table 3.2: Quarterly Economic Bulletin, December 1979 (BankNegara Malaysia).
opportunities and attain rapid economic growth, Malaysia also wanted toupgrade the technical know-how and skill level of its labor, particularlywhen faced with limited market prospects for exports of textiles, clothingand footwear, etc. Consequently, Malaysia established FTZs in 1970 toprovide an added stimulus to the manufacturing of nonresource-based productsfor exports especially for the exports of electronic equipment andcomponents, which are assembled (manufactured) almost exclusively in FTZs.The composition of manufactured exports thereby dramatically changed fromthe resource to the nonresource-based: from about 50:50 in 1971 to 25:75 in

-38-
1979./1 During the 1970s, all resource-based processed products increasedat an annual rate of 19% (at current prices) whereas the nonresource-basedmanufactured exports grew at twice this rate (38%) and among them electron-ics and electrical machinery exports grew at the massive rate of 76% p.a./2
3.05 Even looking at the constant 1970 prices the growth rate ofelectronics/electrical machinery has been impressive - 22% annual growthduring 1969-73 and over 100% during 1973-77. The same is not true for otherprincipal products; the growth rates of palm oil and wood simply shaped havehalved in recent years (1973-77) from their substantial growth rates (23.4%and 16% respectively) in the early 1970s.
Export Markets
3.06 Changes in the composition of Malaysia-s international trade wereaccompanied by significant changes in the direction of exports and importsover the last two decades. The increasing level of exports was sold to newmarkets and imports were obtained from more competitive and newer sources ofsupply./3 Some changes in the direction of trade reflect a shift towardsdirect marketing. Malaysia also has taken advantage of the changes ininternational competitiveness and is trying to establish new markets for itstraditional and nontraditional manufactured exports.
/1 Implications of this dramatic change on the import content of manufac-tured exports and relationship between net and gross foreign exchangeearnings as well as domestic and national value added need furtherstudies.
/2 In general the growth rate of merchandise exports from FTZs was morethan twice (31% p.a.) the overall growth (14%) during 1974-78; within ashort-span of six years, the exports of FTZs reached a level ofM$1.4 billion (1978) - or one fourth of Malaysia-s total manufacturedexports. The dominant exports from FTZs consisted of electronics,machinery and transport equipment.
/3 The mission also looked at Malaysia's import composition briefly and thefollowing features are worth mentioning: Until the mid-1960s, Malaysia'simports were dominated by final consumption goods whose share in importsusually exceeded 45%. This share has sharply fallen and seems to havestabilized around 20-22% during the 1970s. The share of investmentgoods that generally remained around 20% during the 1960s has risen to30% during the 1970s, reflecting an increase in investment activityparticularly until the mid-1970s and limited supply of investment goodsfrom domestic sources. The share of intermediate goods has risen byabout 10 percentage points each during the 1960s as well as the 1970sand is currently around 47% of total merchandise imports.

-39-
3.07 Despite the abovementioned efforts that were geared toward marketdiversification, Malaysia's dependence on the three leading partnercountries - USA, Singapore and Japan - remained, as they continued to sharetogether some 55% to 60% of its exports. Although Japan has now become aprominent customer of Malaysia's merchandise exports - buying more than onefifth of its total exports, USA's market share in Malaysia-s manufacturedexports, which was already one fourth in 1973, has gone up to one third in1978, and has outpaced the next leading markets (Singapore and Japan) byvery wide margins (almost 20 percentage points)./l Both the manufactured,as well as the primary exports to USA have grown at an average annual rateof 30% to 33% between 1973 and 1978, though bulk of the rise in manufacturedexports is due to the exports of electronic appliances and components. ThusUSA absorbed almost half of Malaysia's exports of electronics, whereasSingapore (next in line) absorbed almost one fifth. The only leading part-ner country for Malaysia's exports, whose share has drastically fallen (from7.8% to 4.8%) is the United Kingdom. This decline may be attributed to theerosion of preferential tariffs on trade with UK and the increasing competi-tive pressure from Japan, USA and other countries (see Annex Table 3.6).
3.08 Some important features of export trade in recent years (1973-78)have been: (a) the share of manufactured exports in 'sales' (proxy for out-put) rose from 22% in 1973 to 30% in 1978; (b) the ratio of exports to salesdeclined for certain important products like textiles, wood and wood pro-ducts, petroleum products, iron and steel; (c) Malaysia succeeded inmitigating the constraint imposed by its relatively small domestic market inproducts like electronics and clothing, footwear, fabricated metal products(other than machinery and equipment and transport equipment); (d) eventhough data are scanty, growth of manufactured exports was probablyresponsible for a substantial number of full-time jobs created in themedium- and large-scale manufacturing sector during 1973-78./2
/1 Japan, followed by USA and Singapore, is also among the leading tradepartners of Malaysia in terms of its imports of machinery, equipment,components and consumer durables. The combined share of these threecountries in manufactured as well as total merchandised exportsincreased by 1 to 4 percentage points. A rapid growth in manufacturedexports to Netherlands and Germany in recent years is indicative ofMalaysia's success in diversifying exports.
/2 The contribution of exports to increased job creation was around 81% inelectronics and electrical machinery. Data problems do not warrantthese estimates for other subsectors. More importantLy, nothing isknown about the cost of creating these jobs or significant differencesin the characteristics of goods produced for exports or manufactured fordomestic consumption.

-40-
Achievement of Export Growth
3.09 A fast rise in the level and a rapidly shifting structure ofmanufactured exports together with a weak statistical base make it rather
difficult to assess the growth prospects (discussed in the next section)except perhaps in only broad and indicative terms. One key question in thisrespect is where does Malaysia stand after this fast growth of manufactured
exports and what should it strive to achieve in the next few years?
3.10 Malaysia succeeded in raising the level of manufactured exports in
current prices from M$310 million in 1960 to more than M$4,800 million in1974 (15% p.a. over a fairly long period of 20 years). This growthperformance is indeed commendable but perhaps not outstanding by interna-tional standards. A somewhat better growth in manufactured exports wasachieved by 88 Third World Countries as a group - expanding their totalmanufactured exports from US$4.3 billion in 1963 to US$56.0 billion in 1976
(or 22% p.a.). Malaysia, nevertheless, has now become an important exporter
of manufactures from the Third World, ranking 15th in 1978./1
3.11 Malaysia's successful export drive has significantly contributedto: (a) diversification from its heavy dependence on natural rubber and tin
to other resource-based products; (b) broadening the base of manufacturedexports and introducing some new exports; (c) generating substantial foreignexchange, employment and additional income (especially for the unskilled/urban female workers who had limited alternative employment opportunities);and (d) exploiting other benefits such as economies of scale, gradualupgrading of skills, improving product quality, and using resources rela-tively more efficiently. An export-led growth strategy will remain critical
to further progress in these areas. There are also a number of other poten-tial benefits emanating from exporting that Malaysia can look forward to:improved industrial management and greater marketing skills, technologyacquisition, design and product development, and greater linkages with therest of the manufacturing sector./2
/1 The leading developing countries, ranked in order of the value of man-
factured exports (defined as STIC (rev) 5 to 8 minus 68) in billion US
dollars are: Republic of Korea (11.2), Taiwan (10.8), Hong Kong (10.6),Spain (9.6), Singapore (4.5), Brazil (4.2), Yugoslavia (3.4)*, India(3.4)*, S. Africa (2.6)*, Mexico (2.3)**, Portugal (1.7), Greece (1.5),Argentina (1.4)* and Malaysia (1.4). [* = 1977 figures, ** = 1976
figures.] Source: UN Yearbook of Trade Statistics and Mission'sEstimates.
/2 Some of these tasks are not easy for a variety of reasons: possibleconflict of interest between a transnational firm and the nationalpolicy makers with respect to technology and manpower development,hidden cost of technology transfer, etc.

-41-
3.12 Malaysia has already acquired a necessary base and experience toexploit its benefits from exporting to its long-term advantage. WhileMalaysia should continue to offer attractive investment opportunities tomultinationals and other foreign companies, it should now devise a deliber-ate policy for ensuring that potential benefits from export expansion areappropriately passed on to (and absorbed by) the Malaysian trading compa-nies, domestic manufacturing firms and industrial labor. The relevantagencies like MIDA should study the inter-relationships between exports ofmanufactures and their production characteristics. The difficult problem oflinking the enclave type of exporting activities of firms establshed in FTZswith the rest of the economy and bringing the non-FTZ firms into the main-stream of export business are discussed at length in Chapter VI of thereport and deserve the urgent attention of the policy makers. The relevanceand critical importance of linkages between exports and economic growth hasbeen recognized for a long time,/l and has become an integral part of anysocio-economic analysis of an investment project. In Malaysia itself, theThoburn study shows that exports of primary products (particularly tin andrubber) through a process of investment and import substitution led to asubstantial rise in the light engineering industry. This study shows that asubstantial portion of capital investment by the export industries (tindredge, gravel pump mine, rubber processing factory) was incurred on locallymade producer goods./2 On the other hand a recent review of Progress of theSecond United Nations Development Decade in the Asian and the Pacific Region(including Malaysia) done by the ESCAP Secretariat concluded that theindustrial activity represented by electronics subassembly had not made anysubstantive contribution to the process of industrialization. This activityhad virtually no linkages with other production units within the economy,and it was an example of an international "putting-out system./3 A morerecent study of transnational corporations in the Consumer ElectronicIndustry of Developing ESCAP countries reinforced the above conclusions andstressed the need to review the situation./4 Some of these points have alsobeen raised in the mission's discussion of the industrial sectors in Part twoof the report. The following section discusses this point further andprovides an overview of manufactured export prospects in general and certain
/1 A. 0. Hirschman, The Strategy of Economic Development (Yale UniversityPress, New Haven, 1958).
/2 J. T. Thoburn, Exports and Malaysian Engineering Industry: A Case Studyof Backward Linkage, Oxford Bulletin of Economics and Statistics, May1973.
/3 Economic Bulletin for Asia and the Pacific, June/December 1977, UnitedNations, New York.
/4 Monthly Bulletin of Statistics, December 1979, United Nations, New York.

-42-
specific subsectors. Pending the preparation of subsector strategy studies -based on the calculation of effective rates of protection and domesticresource cost estimates of various activities, the areas identified belowshould be considered tentative and subject to further investigations.
Manufacturing Sector Growth and Export Prospects
3.13 Following our evaluation of the past growth performance and anassessment of the problems and challenges that the Malaysian manufacturingsector faces as it enters the 1980s we can ask the basic question: is itpossible to maintain the momentum of growth that the sector has acquired; ifyes, then how? Since Malaysia is a very open economy, the answer shouldfirst briefly assess the current international economic scenario as itaffects Malaysia's growth prospects.
3.14 The long-term outlook for Malaysia's primary exports (naturalrubber, petroleum, timber and palm oil) remains bright except during thenext one or two years, when they face a sluggish demand from industrializedcountries due to the current recessions. Also, except perhaps palm oil,prices in real terms are likely to increase in all cases./l
3.15 The outlook for Malaysia's export of manufactures is also somewhatintertwined with their demand from industrialized economies; as compared toa per capita average annual rate of 2.4% (in real terms) during the 1970s,the growth rates of these economies are not expected to improve much duringthe 1980s and in fact are projected to remain below the growth rate of1960 which was about 4% p.a./2 During recent years, protectionist pressuresin industrialized economies have continued to be st'rong even though the OECDcountries have reaffirmed their commitment to free trade./3 The continua-ation of the manufactured export growth rates achieved during the 1970s willtherefore not be easy. Also, the base has expanded - manufactured exports(1979 nominal terms) were nine times the level in 1971. The degree ofachievement thus hinges quite heavily on the success in the resolution ofkey overall and subsector specific issues discussed above and a speedy
/1 Largely based on Price Prospects for Major Primary Commodities (WorldBank Report No. 814/80, Washington, D.C., January 1980). As aconsequence of higher prices for oil and synthetic rubber, demand fornatural rubber will be stimulated and price increase is almost acertainty. Malaysia can take advantage of the emerging opportunity ifyield-improving measures are taken and additional land is devoted torubber production.
/2 World Development Report 1980, World Bank, Washington, D.C.
/3 Annual Meetings of the OECD Ministers held on June 3-4, 1980 in Paris.

-43-
rationalization of the incentives framework (detailed in Chapter VI) whichaims at balancing the incentives for import-substituting and exportingactivities.
3.16 One way to indicate growth prospects is to undertake a disaggre-gate analysis of the industrial sector over the last decade and study thedifference between the "observed" and "predicted' values. This analysisshows that the sectors in which Malaysia has scope for further growthinclude food products, textiles (principally knitwear), clothing and foot-wear, and basic metal products./l Another way to look at Malaysia's growthprospects is to compare its level of industrialization, industrial structureand manufactured exports with neighboring countries such as Korea,Philippines, Taiwan and Thailand. This comparison shows South Korea andTaiwan had higher levels of industrialization and manufactured exports.
3.17 First of all Malaysia has not fully exploited its naturalcomparative advantage although the scope for doing appears to be substan-tial. For example, Korea's exports of rubber manufactures in 1977 wereUS$160 million as against Malaysia's US$21 million; with imported rubberinputs, Korea succeeded in raising the export level of rubber tires andtubes by about US$88 million during 1974-77 whereas Malaysia's levelremained low and almost stationary around US$20 million despite itsabundant supply of high grade natural rubber and well established institu-tional and physical infrastructure./2 Malaysia exports almost 98%. of itsnatural rubber and domestically uses only the remaining 2% for downstreamprocessing. Consequently, Malaysia shares almost half of the world exportsin natural rubber but only 0.2% in rubber manufactures. These facts arewell recognized by the Malaysian Rubber Research and Development Board(MRRDB) and the Rubber Research Institute of Malaysia (RRIM). Substantialtechnical management and marketing problems appear to be hindering progressin this respect. Perhaps a task force consisting of technical personnel,financial analysts and knowledgeable, aggressive sales persons should studythe scope for downstream processing of rubber - tires, tubes, automobile -parts, industrial rubber hoses, rubber gloves, use of rubber wood for pulpand furniture, etc. and marketing of these products. The scale at whichthis processing is being done does not match the importance as well as theapparent comparative advantage of this product in the national economy.
3.18 Similarly, the further downstream, processing of logs, (intotimber, plywood, veneer sheets) offers considerable scope for enhancing
/1 The analysis also shows that Malaysia appears to be "overindustrialized'in fabricated metal products but this result is somewhat misleadingbecause it is heavily influenced by the "electronics" industry. On theother hand, a large positive residual for wood and rubber-basedindustries simply reflects Malaysia's strong natural resource base.
/2 UN: International Yearbook of Trade Statistics, 1979. The figuresrefer to SITC-62 category of exports and are in current US dollars.

-44-
domestic use mainly associated with the construction industry (growing at arate of about 11-12% p.a.) and export growth around 10%. The efficiency ofthe industry will improve with technological development which will in turnrequire more skilled manpower than unskilled labor. Also the possibilitiesfor collaboration with the Japanese investors having access to improvedtechnology which are quite bright will further improve the efficiency andcompetitive position of processed wood products.
3.19 The electronics and electrical industry (E & E) would contributesubstantially to export and the import substitution process. But within theE & E industry (wlhich helped considerably in mopping up the surplusunskilled labor when it was abundant in Malaysia), the process can startfrom the initial phase of simple assembling operations to products embodyingmore advanced technology (including the necessary research and development)and participation of international marketing thereby internationalizing theintangible gains (transfer of technical and marketing knowledge) anddeepening the industrialization process. With international demand for E&Erising rapidly, M4alaysia is likely to remain reasonably competitive in thenear future. However, given the relatively high degree of internationalmobility of assembly operations, carried largely by multinationalcorporations, Malaysian policymakers should remain alert to the adjustmentneeds (development of new products, markets and training of indigenouspersons for higher level positions). Malaysian authorities will have topersuade transnational corporations to develop closer links with theMalaysian economy and involve taore tMalaysians in technology learning andmarketing systems. Some imaginative changes in the incentives system wouldbe necessary to achieve success in this area.
3.20 Within the other high export industry, textiles, the scope for theexpansion of the knitting and garment segments requiring smaller investmentsappears to be substantially more than for other segments. The domesticdemand for textiles would continue to grow at about 9-10% but for exportpurposes the Malaysian Government will have to put considerable effort inquota renegotiations and development of new markets (like the Middle East)."Buy local" campaigns will also help in reducing the apparent consumerpreference for imported woven fabrics. Overall the sector has reasonablegrowth potential but employment will probably grow at a slower rate than inthe past as much needed productivity improvements are effected and as wagerates increase.
3.21 On the domestic front there is also considerable growth potentialfor food processing industries via efficient import substitution for therapidly expanding domestic urban market. In 1977, M4alaysia importedprocessed food valued at M$l billion. According to FIMA, these industriescan grow at 8-9% p.a. in real terms and with proper incentives exports canexpand at a slightly higher rate. For palm oil a growth rate of at least

-45-
10% (by volume) is feasible with possibly a relatively greater share goingto the domestic market than in the past. The scope for further refining of
crude oil (into margarine and other products) is substantial.
3.22 With processed food and other industries rising rapidly, theoutlook for the packaging material industries is favorable; in tin canmaking, particularly, upgrading and rationalizing of the operations of 6-7small can manufacturers and establishing of new facilities should reduce therather high cost through technological improvement.
3.23 Increased incomes and improved living standards for the majorityof the population will result in the growth in domestic demand for suchhousehold appliances as recreation equipment, vacuum cleaners, hair dryers,
sound equipment, cookware, watches, furniture, cooking ranges, color TVs,refrigerators and air-conditioners. The elasticity of demand for allthese goods is well over 1.0 (for consumers durable and recreation articlesit is around 2.0)./l Domestic demand may reach a level in the 1980s atwhich the local production may become economic, resulting in additionalimport substitution (IS), in many consumer durable goods. The additionalIS should also become feasible in a number of other technically rathersophisticated products such as various size of cables, telecommunicationequipment (through joint ventures), telephone exchange components, coldstorage equipment, coastal ships and ship repairing.
3.24 More generally, the building materials industries may provideconsiderable impetus to the manufacturing sector. As an illustration, evenif investment during the 1980s (in real terms) increases at only half therate achieved during the 1970s (6 to 7% p.a. compared to about 12-13%during the 1970s), investment is expected to exceed M$9 billion in 1985.The investment activity (including repairs and upgrading) is likely toincrease demand for construction materials by 10-11% p.a. or so. Inaddition to the infrastructure, public sector building, schools, hospitals,the rapidly expanding housing industry will require domestic supplies ofconstruction materials such as structural steel, bars,
/1 The income elasticity is measured as the demand elasticity of per capitaexpenditure - with households gouped into declines according to theirper capita expenditure. The statistical results are derived from theHousehold Expenditure Survey conducted in Malaysia in 1973, as explainedin An Analysis of Household Demand in Peninsular Malaysia (ResearchPaper No. 15, Department of Statistics, Malaysia, September 1979). Thenumerical results, quoted here, are taken from Pravin Visaria,"Incidence of Poverty and the Characteristics of the Poor in PeninsularMalaysia, 1973" (World Bank, 1980, unpublished).

-46-
wires, cement, bricks, sawn timber, plywood and panels, sanitary ware, tiles
etc. With new mortgage facilities (25 years) the building boom is likely to
continue and the question of local material supply (90 to 95% of materials,
are supplied locally because of 'natural' protection given by weights and ,
shipping costs), becomes important. The need for replacement of old cemenu
industry equipment and machinery and expansion of steel production, iffeasible, will determine the scope for expansion in these basic industries.
The development of ancillary firms also offers good opportunities for
Malaysian manufacturing activities. A fairly detailed study has been
conducted by Chee Peng Lim and Fong Chan Onn regarding ancillary firm
development in the automobile and machinery industry which provides a basis
for support programs in this area./l
3.25 The government emphasis on agriculture, eradication of poverty and
increased incomes in rural areas will substantially increase the demand for
fertilizers, pesticides, and other chemicals. Expansion of exports of
resource-based products, e.g. palm oil, rubber, and food will also generate
increased demand for fertilizers much of which could be produced locally.
Recent labor shortages in certain areas will also induce moderate
mechanization in agriculture.
3.26 Additionally, Malaysia is one of the few countries with substantial
energy resources. It can attract relatively energy-intensive industries such
as cement, fertilizer, aluminum, glass, pulp and paper, in which economic
energy supply is of critical importance. Natural gas, an energy not easily
transported, is suitable for such projects; the new aluminum smelting plant
planned for East Malaysia is a notable example of such investment. Although
Malaysia should continue to identify other similar projects, it must care-
fully consider the social costs and benefits before taking a decision. The
expansion of the fertilizer industry hinges on the use of local natural gas
and its price to the fertilizer plant. With more than half of the proposed
plant's planned output committed to Malaysia's ASEAN partners, a small
proportion of the remaining capacity of 1,500 tpd of ammonia will have to be
exported and Malaysia's competitiveness in this respect looks reasonable.
But, given the existence of extensive price and import controls on steel
products, it is difficult to obtain a clear view of Malaysia's prospects forsteel production and the competitive strength of the existing industry. In
/1 The Council of Manpower Studies (CAMS) sponsored the research project,
"A Comparative Study of Ancillary Firm Development in Asian Countries"in 1976. See, in particular, Chee Peng Lim and Fong Chan Onn, AncillaryFirm Development in the Transport Equipment and Machinery Industries in
Malaysia (Faculty of Economics and Administration, University of Malay,Kuala Lumpur, December 1979, unpublished).
-47-
respect of major additions to capacity currently under consideration, themission feels that, on the basis of its rough calculations, Malaysia'sproduction of bars and rods from a new plant would be over 20% moreexpensive than imports. A new integrated mill producing flat products wouldface even greater competitive disadvantage. It is therefore desirable thatvarious alternatives for steel production be carefully explored beforecommitting substantial amount of resources to its development.
3.27 Our discussion in this section has indicated that the overallmanufacturing sector would benefit and its performance will continue to beimpressive if Malaysian policymakers were to promote the efficient import-substitution activities at a somewhat higher level of technicalsophistication but more importantly the present export-oriented activitiesshould be given even greater emphasis particularly because of the smallnessof the domestic market. Malaysia's interest in establishing very large,capital-intensive projects has to be studied more carefully by competenttechnical and financial analysts before large sums are committed to largelynonreversible investments. Also public sector investment should not be asubstitute for private (local and foreign) investment in the industialsector. There are formidable difficulties in quantifying the behavior ofinvestment in the private industrial sector. The following section attemptsto study this behavior and discussed the key issues in the manufacturingsector investment in the Malaysian economy.
IV. INVESTMENT IN THE MANUFACTURING SECTOR
Introduction
4.01 The level, structure and trend in manufacturing sector investmentremain serious imponderables among the key variables affecting the growthand performance of the sector. In the wake of the Industrial CoordinatingAct, 1975 (ICA), general interest in investment behavior has increased butwithout any corresponding improvement in the availability of statistics.While it is exceedingly difficult to isolate the effect of ICA on investmentfrom the influence of other factors (e.g., world recession, unsettledpolitical conditions in the South East Asia Region), even the factualinformation on the trend in investment itself cannot be established with adegree of accuracy and confidence that would warrant firm conclusions.Given the extreme paucity of relevant statistical information, the missioncould at best reach only tentative conclusions about the changes and trendsin manufacturing sector investment. In view of the manufacturing sector'simportance in achieving the broader objectives of the NEP and generaltransformation of the economy as well as for monitoring the impact of somemajor policy changes, it is important that greater attention is paid todirect investment estimates at least for the leading and fastest growingsector of the Malaysian economy.

-48-
Overview of Investment in Malaysia
4.02 The mission has reviewed the estimates of gross fixed capitalformation, of which investment in manufacturing is a substantial part. Theofficial estimates have been prepared with the utmost care and in detail for1971 and 1973 by following the SNA3 or the input-output approach./lThe commodity flow approach was used for other years until 1977 b7ytheDepartment of Statistics. It is difficult to ascertain the accuracy ofthe estimates for 1978-80, prepared by I.A.P.G., as no details about themethodology and data base used are available to the mission.
4.03 Table 4 shows that government investment continued to rise duringthe 1970s but private investment fell after 1974 both in real and nominalterms as well as in absolute terms and in relation to GDP. Since the GDP
Table 4: MALAYSIA: INVESTMENT AND GDP(At constant and current prices)
1973 1974 1975 1976 1977 1978 1980
Gross Fixed Capital Formation in M$ millionAt 1970 Govt. 1,021 1,205 1,482 1,668 1,951 2,001 3,022
prices Pvt. 2,468 3,047 2,454 2,465 2,726 3,076 3,742At current Govt. 1,203 1,644 2,110 2,505 3,078 3,419 6,233
prices Pvt. 2,908 4,154 3,492 3,701 4,265 5,208 7,740
Gross Fixed Capital Formation/GDP (%)At 1970 Govt. 6.4 7.0 8.5 8.6 9.4 9.0 11.8
prices Pvt. 15.5 17.7 14.1 12.8 13.1 13.8 14.6At current Govt. 6.5 7.2 9.4 9.0 9.5 9.4 13.3
prices Pvt. 15.6 18.2 15.6 13.2 13.2 14.3 16.5
Source: Annex Table 1.2.
/1 Even for these years substantial differences between the recorded fixedcapital formation and the outcome of the allocation of supplies by fol-lowing the commodity flow approach were observed. It is doubtful if theresults can be any better without improving the basic statistics. Forfurther details see Reidar Oines: Methods of Estimating National Ac-counts for Malaysia: Final and Preliminary Accounts and Producer PriceIndex (Restricted, Department of Statistics, Malaysia, March 1976).

-49-
did not suffer any decline in its absolute level, private investment as aratio of the GDP declined even more and this ratio in 1978 was lower thanthe 1973 level, although private investment recovered in 1976 at currentprices and in 1977 at constant prices. In the absence of direct estimatesof investment in the manufacturing sector and also of any indication ofdrastic curtailment of private investment in the nonmanufacturing sectors,it is perhaps reasonable to infer that a major brunt of the fall in privateinvestment between 1974/75 and leveling off around 1975-76 occurred in themanufacturing sector.
4.04 This general behavior of private sector investment is alsoconfirmed by indirect indicators of private investment activity. Theseindicators are presented in Table 5 below derived from Annex Table 4.5.The general indicators relate to the whole economy, whereas the specificindicators relate to the manufacturing sector. For the general indicatorsfour time-series on imports of capital goods are derived by using fourdifferent measurements./l All these series confirm that imports of capitalgoods were at their peak in 1974 and they did not return to that level until1977 or 1978.
Investment in Manufacturing
4.05 The most commonly used figures for manufacturing investment inMalaysian official circles are the proposed investments in industrialprojects approved by MIDA, although their serious deficiencies are also wellrecognized by many officials. Inclusion of information (statistical orother) in the 1979 Amendment of the ICA (1975) reflects Government s aware-ness and recognition of the major concerns mentioned below. How effectivelythe Government will succeed in achieving its goals is yet to be seen./2
/1 The first time series is based on the method followed in the BusinessExpectations Survey (BES) conducted quarterly by the Department ofStatistics, Malaysia. The second is based on the Broad Economic Cate-gories (BEC) classification recommended by the United Nations. Thethird is based on a detailed reclassification of imports by the economicfunctions done by the Bank Negara Malaysia. The fourth is based on theimports of machinery and transport equipment (SITC (Rev) 7) as reportedby the Department of Statistics Malaysia to the World Bank EconomicMission, 1975 and updated from the UN International Trade Yearbook.
/2 Based on a limited exposure to the issue of improvement in industrialstatistics in Malaysia, the mission feels that the Statistics Section inthe Ministry of Trade and Industry, which is vested with the responsi-bility of gathering (processing) and analyzing the statistical informa-tion on the implementation of Government's approved industrial projects,needs considerable strengthening if it is expected to turn out analyti-cally sound results that are based on empirically valid statisticalinformation.

-50-
Table 5: MALAYSIA: TRENDS IN IMPORTS OF CAPITAL GOODS
Current prices1972 1973 1974 1975 1976 1977 1978
1. Business ExpectationsSurvey /aM$ million 574 621 1,077 840 744 916 1,046Index (53) 958) (100) (78) (69) (85) (97)
2. Broad EconomicClassificationM$ million 1,195 1,449 2,632 2,147 2,441 2,936 -Index (45) (55) (100) (82) (93) (112) -
3. Imports reclassifiedby Bank Negara /aM$ million - - 3,370 2,740 3,210 3,542 4,176Index - - (100) (81) (92) (105) (124)
4. Selected SITC (Rev)codes /bM$ million 1,069: 1,212 2,235 2,017 2,238 2,547 -Index (48) (54) (100) (90) (100) (114) -
5. Import unit value forSITC (Rev)
Index - - 100 117 119 125 127
/a Relates to Peninsular Malaysia.
/b SITC (Rev) 7 minus (7199, 725, 729, 7321, 7328 and 7329), i.e.,machinery and transport equipment less parts and accessories, nes;domestic electrical equipment; other electrical machinery and apparatus;passenger motorcars (whether or not assembled); bodies chassis, framesand other motor vehicle parts; and motorcycles and their parts.
Source: Annex Table 4.5.
The "proposed investment" in MIDA's approved projects by the year of approvalis a very poor proxy for the "actual annual investment" for several reasons:(a) the proposed investment is seldom realized during the year of approval;(b) some of the approved projects may never be implemented; (c) the investment

-51-
time profile may considerably differ from project to project; (d) many largeprojects are necessarily implemented in phases; (e) considerable investmenttakes place during the construction stage, and both the gestation period aswell as the investment time profile may vary by industry, region, orinvestment size of a project./l
4.06 MIDA's published results are updated every year only in terms of
the "number of approved projects by the year of approval," although it alsocollects data on actual capital investment in terms of the paidup partner-ship capital and loans and actual employment, etc. Moreover, even theseresults are not published by industry or size of employment or investment.Since the mission did not have access to the unpublished data, it couldestimate the investment in MIDA's approved projects only on the basis of
certain assumptions and hypothetical time profiles for the actual investmentin those projects.
4.07 Besides the limitations directly related with the hypotheticaltime profile, it was also not possible to quantify the divergence betweenthe proposed capital investment (defined as paidup capital plus long-term
loans) and the realized investment. Investors may claim neither perfectforesight nor their investment proposals may be immune from voluntarychanges warranted by changed market conditions and/or other circumstances.Moreover, internal savings (generated out of the investment project inquestion) may be reinvested, and inventory investment (stock formation) maybe financed out of short-term loans and/or bank overdrafts. Further, a
portion of the capital investment may not be spent for purchasing/installing/improving capital goods, and may be either deposited in banks as liquidasset or kept at hand for paying salaries, wages and other sundry expenses.Finally, investment taking place in some new industrial projects may notrequire MIDA's approval because of the smallness of their investment amountor employment size, and some existing projects may undergo modernization, or
expansion or change in product mix without seeking MIDA's approval; none of
these investments may be covered by MIDA.
4.08 Three investment time profiles are drawn on the assumption that a
typical project, whether implemented or not, is of the average investmentsize among all the projects approved during a given year. The first two
profiles further assume that 25% of the projects approved in any year arenot implemented at all, and an implemented project takes three or four yearsincluding the year of approval, according to the investment time profile of
/1 The importance of all these issues has been recognized in the develop-ment economics literature for two or more decades. See W.B. Redaway,The Development of the Indian Economy (Allen and Unwin, Londin, 1962).
-52-
100:25; 25; 25; (25% not implemented) and 100:25; 35; 10; 5; (25% notimplemented)./l These are presented as estimates 1.2 and 1.3, respectively,in Table 6.
4.09 MIDA proposed investment figures are naturally higher than thefirst two estimates of investment, and also often differ in the direction ofchange. MIDA approvals show a levelling off of investment in 1974/75 and asharp fall in investment from 1975 to 1976, a further fall in 1977 and thenrise in 1978. The first two estimates (1.2 and 1.3) show a peak ininvestment in 1975 (probably because of the fairly high level of approvedinvestments in the preceding two or three years) and then a gradual fall ininvestment, which continued until 1978. On the basis of its best estimates,the mission tentatively concludes, subject to the numerous qualificationsstated above, that the two estimates perhaps give a better indication of thetrend in manufacturing investment than figures reflected in MIDA's approvalsonly. These estimates show that there was a dip in investment during1976-78.
4.10 The mission compiled four other estimates of investment in themanufacturing sector. First estimate (2.1) is derived from the annualsurvey/quinquennial census of manufacturing industries conducted by theDepartment of Statistics, which publishes data on the fixed capital expendi-ture incurred during a year. However, the period covered ends in 1974.Second estimate (2.2) relates to the survey of investment position inindustrial projects that have been approved by the Government and imple-mented by the end of 1977. This survey covered 1,736 projects and definedinvestment as the sum of paidup capital and loan capital. Moreover, theestimates relate to a project's year of approval and not to a year in whichthe investment had actually taken place. Like MIDA's estimates, they alsoinclude investment in hotels and tourist complexes, which is estimated to beonly about M$200 million out of the total investment of M$5,650 million.Thus, these estimates share many of the deficiencies inherent in anyestimates primarily based on MIDA's industrial investment approval figures.Moreover, the response rate is said to be only about 80% (in terms of thenumber of projects). Third estimate (2.3) relates to the value of equipmentimported as capital goods for the manufacturing sector. These data rein-force the findings of other estimates, showing a sharp dip in manufacturinginvestment after 1974 and a slow recovery thereafter. If nominal values aredeflated, the dip in investment in real terms would be much deeper and therecovery much slower than the nominal time series indicate.
4.11 Finally, the mission reviewed indicators of investment reflectedin the available data on loans taken by the manufacturing firms from the
/1 According to MIDA estimates 20-25% of projects are not implemented aftertheir approval.

-53-
Table 6: MALAYSIA: ESTIMATES OF INVESTMZNT IN MANUFACTURING SECTOR(M$ million in current or book values)
1971 1972 1973 1974 1975 1976 1977 1978
1. Proposed/EstimatedActual Investmentin MIDA's ApprovedProjects
1.1 Proposed by yearof approval 805/a 792/a 1,193 1,425 1,427 1,005 862 1,098
1.2 100:25;25;25;25]Estimated actual 229 258 476 742 1,011 964 824 741
1.3 (100:25;35;10;5;25]in the year - 257 473 827 992 953 781 748
2. Estimated ActualInvestment
2.1 Annual survey/census ofmanufacturingestablishments /b - - 580 896 - - - -
2.2 Survey ofmanufacturingfirms /c 705 478 1,086 531 215 111 659 -
2.3 Imports of indus-trial machinery /d - 284 394 772 616 535 594 -
3. Financing ofInvestment
3.1 Commercial bankloans & advances 104 40 273 174 209 116 213 631
3.2 Finance companies 17 3 - 1 20 23 21 193.3 MIDF's loans
approved 73 50 102 74 55 30 38 72
Total 194 93 375 249 284 169 272 722
4. Price Deflators4.1 Gross fixed capital
formation 76 79 87 100 105 110 115 1254.2 Imports of goods
& services 71 77 84 100 111 117 119 128
/a The proposed investment is measured by MIDA as the sum of paidup capital andloans. But the loan figures were not available prior to 1973. They havebeen estimated by the mission (see Annex Table 4.3).
/b Investment figures are not comparable over time, because 1973 is a censusand others are survey years.
/c Firms are recorded by MTI according to the year of Government's approval./d SITC (Rev) codes: 1/3 of 714 (office machines), + 715 (metal working
machinery) + 717 (textile & leather machinery) + 718 (machines for specialindustries) less 718.4 (construction & mining machinery, nes), less 2/3 of718.5 (mineral crushing, sorting & molding machinery, glass workingmachinery), + 719 (machinery, appliances and machine parts, nes) less 2/3719.1 (heating & cooling equipment), less 719.4 (doestic appliances, non-electrical), less 719.51 (machine tools for working minerals), less 719.65(automatic vending machines), less 719.66 (railway track fixtures, etc.),less 719.7 (ball & roller bearings), less 719.9 (parts & accessories, nes),+ 1/3 of 732.3 (lorries & trucks, whether or not assembled).
Sources: Annex Tables 4.5. 5.1 and 5.2.

-54-,
commercial banks (3.1), the finance companies (3.2), and the MIDF (3.3).The commercial loans and advances represent a bulk of industrial financing,and they include short-term borrowings, out of which only a portion may beused for inventory investment (or stock building). The unusual rise of morethan M$4,000 million in the commercial banks loans and advances to themanufacturing sector in 1978 has resulted from all-round increase in demand(except frorm the metal products and machinery industry) for loans/advances.The estimates also confirm a reduction in investment financing during1975-77 with some recovery taking place in 1978.
Investment Profiles and Problems of Estimation
4.12 The fragmentary evidence suggests that investment in the manufac-turing sector probably reached its peak around 1974/75 and remained substan-tially below that level for 3-4 subsequent years. It was probably not until1979 that manufacturing investment recovered. Thus, the recovery ofmanufacturing investment seems to be distinctly slower than that of privateinvestment in nonmanufacturing sectors (see Tables 4 and 5). How does oneexplain the slackening of manufacturing investment since the mid-1970s? Thelikely explanations could include: first, considerable apprehensiveness inthe minds of private investors, particularly the minority communities orforeigners, resulting from their interpretation of the restructuringpolicies implied by the ICA (1975). Second, the Petroleum Development Act(1974, amended in 1975), introducing the concept of management sharing, hadits spillover effects on other foreign investors about the future of invest-ment in Malaysia. Third, for the world economy as a whole, the economicdownturn of 1974/75 among the industrialized economies was the longest anddeepest in the postwar period, with widespread adverse effects on the growthof real output and income, both in the industrial and developingeconomies./l Malaysia's export-oriented, small economy was naturallyaffected by it with a moderate time lag. Fourth, a rapid growth of theMalaysian manufacturing sector throughout the 1960s and first half of the197 0s expanded the size of its base (in terms of the value added at constant-prices) sixfold, and the overall Malaysian economy also tripled during thesame period. Fifth, as stated above, the "easy" import-substitutionopportunities were substantially reduced by the mid-1970s and finally in thewake of the Viet Nam events the unsettled political conditions of the regioncontinued to affect the thinking of the private foreign investors as to thefuture of South East Asia.
4.13 Hlas the investment in the Malaysian manufacturing sector regainedits momentum? There are signs that under the stimulus of strong growth of
/1 Annual Report and Statement of Accounts, 1975 (Bank Negara Malaysia).
-55-
Malaysian manufactured exports during the late 1970s,/1 manufacturinginvestment is recovering. Also the Government has seriously endeavored todiffuse the apprehensions of local and foreign investors by emphasizing thatthe implementation of ICA would be both pragmaatic and flexible. Much moreeffort is needed in this respect because the task of restoring andmaintaining the investor confidence is not easy.
4.14 The discussion in the previous section has clearly shown that thedata deficiencies regarding investment in manufacturing are so severe thatthe mission had to develop investment profiles in a very laborious mannereven at the aggregate level, not to mention dependable estimates ofinvestment disaggregated by industries, states, size of assets oremployment, etc. The available statistical information is so incomplete oraggregatd that it is hardly useful for a trend analysis and developmentplanning. The mission, therefore, considers the lack of statisticalinformation a major impediment to under impact analysis of policy changes andto the formulation of a sound five-year plan and its implmentation. Hence,the roles of MIDA and Industry Division of the Ministry of Trade andIndustry are reviewed below from the point of producing policy-oriented,analytically sound statistical information.
4.15 The MIDA is supposed to monitor the development of industrializa-tion in all states and advise on the planning and development of industrialestates./2 It is also expected to evaluate applications for setting upindustries, tariff protection, quantitative restrictions and duty exemp-tions, etc. Moreover, it is said to follow up on the implementation ofapproved projects. Additionally, it may be involved in assigning industrialsector priorities and generating statistical information for planning andresearch purposes, besides discharging other important responsibilities,which directly affect the Government's efficacy in formulating andimplementing development plans.
4.16 The MIDA conducts a half-yearly survey on the "Position of Indus-trial Estates in Malaysia" but the published information is confined to landutilization at each estate;/3 highly desirable information regardinginvestment, employment, output, sales, etc., by manufacturing industries,size and location is being obtained but has not been
/1 The annual growth rates (in nominal terms) are: 1975/76 and 1978/79:26%; 1976/77: 11%; and 1977/78: 34%.
/2 See the Organization Chart in the Annual Report, 1978 (MIDA).
/3 Op. cit., pp. 36-38 and Table XXII (MIDA).

-56-
regularly compiled and published for analysis and policy adjustments. Itwould be highly desirable to enlarge the scope of published information onindustrial estates. Similarly, information on the cost of providing theinfrastructural facilities by the Government is not available. Nor are theresutls of any studies of the most successful or unsuccessful industrialestates made public so that lessons may be learnt from the experience of theGovernment and the business community. Furthermore, MIDA's biannual surveyresults published on the progress of implementation. of approved projects arelimited to the'number of projects by the status of implementation as atDecember 31 of a given year, without any other information except the yearof approval. As seen above, this information serves only a very limitedpurpose.' Similarly, the mission strongly feels that analytically moreuseful information should be generated as a by-product of MIDA's evaluationof the projects submitted by investors for approval and published withgreater regularity.
4.17 Besides the MIDA, the Industry Division of the Ministry of Tradeand Industry seems,to' be actively involved in monitoring and implementationof industrial projects approved by the Federal Government. This Division issupposed to maintain close contact and liaison with the private industrythrough its field staff. For the past four years, it has been conducting anannual'(or half-yearly).survey on the progress of implementation of industrialprojects employing atl least 25 workers or having paid-up/partnership capitalof more than M$250,000. Until last year the' response to this surveydepended on voluntary cooperation of the business firms, and the responserate was said to be about 80%. Beginning January 1, 1980, a penalty ofM$1,000 or three months' imprisonment can be imposed on a nonrespondingfirm, but what is perhaps even more important is to pursuade the businesscommunity of the usefulness of such surveys. This can be done if theGovernment conducts surveys more purposefully and ensures that theinformation gathered is properly analyzed and published. *This will help inimproving the credibility of the information-gathering agencies in the eyesof the business community and,will enhance their cooperation.
4.18 Is the Industry Division,. particularly its Statis'tics Section,fully equipped to accept the challenge? In the mission's judgement theStatistics Section needs to be strengthened considerably, if it is expectedto continue its functions properly. At the present, it does not seem tohave adequate professional expertise or trained statistical (supporting)staff. It is apparent from the questionnaire used by the Division that itis in need of technical assistance for obtaining useful data and fordeveloping a meaningful monitoring and evaluation system. The improvedsystem should encompass all phases of a field survey including statisticaland economic analyses of the res'ults for the Government's industrial policy

-57-
and socio-economic planning purposes. The question of interagencycoordination with the MIDA, Department of Statistics or any other relevantoffice, is extremely important and should be resolved before a strengthenedStatistics Section becomes the central body for generating reliableindustrial investment statistics or for monitoring and evaluation of theindustrialization process in general./l
4.19 A general improvement in the analysis of performance and invest-ment behavior in the private manufacturing sector is indeed important butequally central to the formulation and implementation of the developmentplan is the role of the public enterprise in Malaysia. The followingChapter therefore reviews the performance, objectives and the role of thepublic enterprise sector as well as its relationship to the private sector.After identifying some of the organizational, management and financialissues, some guidelines for the future are discussed which, in the mission-sjudgement, would enhance the effectiveness and contribution of this sector.
/1 See Annex I, Volume III, for a discussion of problems of manufacturingstatistics and possible suggestions for improvement of the data base.

V. THE ROLE OF PUBLIC ENTERPRISE IN MANUFACTURING
Introduction
5.01 In the course of the last decade, a public manufacturing sectorwas born in Malaysia. The main motive was to achieve substantialrestructuring of industrial ownership and employment by 1990. Since theBumiputra population is heavily concentrated in certain regions which havebeen lagging behind others in development, restructuring simultaneouslyaimed at increased industrialization of backward regions became an importantobjective of industrial development in Malaysia. A secondary motive was thecreation of certain basic or pioneering industries not likely to beundertaken by private enterprise.
5.02 About 15% of public expenditures for social and economic develop-ments under the Third Plan, or roughly R 3.3 billion was allocated tocommerce and industry. Of this, roughly one third was disbursed throughgovernment agencies and two thirds were channelled to public enterprises, inthe main through major holdings or financial institutions such as Pernas,MARA and UDA. These sums will support a larger total volume of investmentsince they will be supplemented with capital market and foreign financing.Nevertheless, they are still relatively modest when compared with targetedprivate investments in manufacturing, construction, and mining of M$21 bil-lion over the same period.
5.03 The manufacturing sector accounted for only about one fifth of thetotal development allocations for public enterprise under the Third MalaysiaPlan (1976-80). Based on available information it apears that, by the endof 1977, the state or public bodies held shares in at least 132manufacturing companies with a combined share capital of M$500 million and atotal employment probably in excess of 30,000.
5.04 Judged by past investments and present extension, the public stakein manufacturing is substantial but not overwhelming. However, thissituation is likely to change. The Government is committed to increasingthe Bumiputra share in the ownership and control of the industrial sector to30% by 1990. So far only a small portion of the industrial units has beentransferred to individual Bumiputra entrepreneurs and investors. Hence,most of them are being held in trust by the state. This means that in orderto fulfill the total restructuring target, the assets of the publicmanufacturing sector would probably have to grow fourfold by 1990. If thereis no further escalation in the NEP's restructuring targets beyond 1990, therelative proportion of the assets of the public manufacturing sector intotal will start shrinking overtime. However, efficient management ofmanufacturing units in the public sector will remain an issue deserving fullgovernment attention.

-59-
Performance and Achievements
5.05 Within the short period of a decade, the New Economic Policies have
clearly influenced the participating character of development effort in
Malaysia. In this area, public manufacturing enterprise has contributed
substantially. There are indications that the share of Bumiputra employment
in the public manufacturing sector is significantly higher than in companies
with a minority public ownership. Public acquisition of industrial holdings
and sponsorship of new industrial ventures has been bold and vigorous.
5.06 The mission had to rely heavily on a qualitative assessment of the
commercial and financial performance of public manufacturing enterprise in
Malaysia due not only to the shortage of time but also to the insufficient
information base. On the positive side, substantial investments have been
made and an organizational structure created, based on a limited number of
holdings, major enterprises, and state economic development corporations. On
the other hand, there have been several business failures (particularly at the
state level) due to poorly conceived projects reflecting haste andinsufficient project preparation, lack of operating experience, lax financialadministration, shortage of management and other vital skills, poor public
insight into the operations of these enterprises and undue political
considerations in certain cases. A particularly serious problem has been the
shortage of persons capable of serving on the boards of the new companies and
at the supervisory level in the ministries.
5.07 These problems are not unique to Malaysia; they are typical of state
enterprises in all developing countries, and even in some industriallyadvanced nations. Yet it would be a mistake to write them off as thetransient ailments of a young industry. The task facing public industrialenterprise is an exceedingly difficult one. The mission has attempted to
identify some of the problems discussed below and possible ways of alleviatingthem. But the most important precept - and this lesson stands out clearlyfrom the experience of other countries - is to allow the public manufacturingsector to expand only at the rate consistent with its capacity to perform and
ability to overcome difficulties which may otherwise become quite intractable.
The Issue of Objectives and the Role of Public Manufacturing Enterprises
5.08 According to several observers many public enterprises in Malaysia
have difficulties in reconciling profitable operations with a multiplicity of
other objectives, such as development of new industries, regional development,Bumiputra employment and entrepreneurial development, etc. The mission fullyrecognizes the importance of the Government s noncommercial objectives butfeels that other instruments (e.g. entrepreneurship development and SSIsupport programs for additional Bumiputra employment) can be used to achieve
these objectives without losing sight of the discipline imposed by theexpectation that public enterprises should earn a normal profit on theresources entrusted to them. Industrial development objectives in general
should be promoted through incentives available to public and private

-60-
enterprise alike such as protection (or subsidies) to infant industries andregional development incentives. By the same token, public manufacturingenterprise should not be looked upon as a specific instrument for therestructuring of society, viz. increased Bumiputra participation in skilledjobs and in industrial entrepreneurship. In the interest of efficient useof national resources in the long run, therefore, public manufacturingenterprise should be subjected to the full test of commercial and economicviability. Conflicting objectives have provided an alibi for lax financialadministration in many public enterprises.
5.09 The suggestion that the public enterprise should earn a normalprofit on the investment does not mean that the development and restruc-turing dimensions would be absent. Agricultural extension work, manpowerdevelopment and technological research, etc. often have a high financialreturn and should not be ignored by public enterprise. As for restruc-turing, one might perhaps hope that the public sector, without sacrificingcommercial profitability, might assume leadership in exploring opportunitiesin this area. In fact the stronger the public enterprise is in economic andfinancial terms the greater vigor and capability it can show in pursuing therestructuring targets through general instruments and programs mentionedabove.
Relationship to Private Sector: Price and Incentives Framework
5.10 In the past, as amply demonstrated in the Public Enterprise Study,state enterprise has been granted unequal favors and access to privilegedfinancial circuits. There are signs that in certain cases public enterpriseemployees are also becoming a privileged group, a situation which has beenshown in other countries to be inconsistent with long-term commercial andeconomic viability.
5.11 Public and private manufacturing enterprises should be looked uponas natural partners in development, freely competing, cooperating, orcombining as circumstances warrant. The Government should be neutral andopen in this process, establishing an incentives framework which isunrelated to public or pivate categories of ownership but looks only at thecharacteristics of each industry and the country's needs at this stage ofdevelopment. This has not been the case so far. In order to maintain themomentum of development in the manufacturing sector and to enhance itscapacity to face the challenges of 1980, a movement in that direction wouldbe desirable.
5.12 Recent planning for steel and petrochemicals has been confined tothe highest levels of the Government and state and consultation withexisting industries has been inadequate. If some of the proposed schemes insteel, fertilizers and petrochemicals were to require substantial
-61-
protection, the resulting high prices would impede the development of those
more labor-intensive downstream industries, generally in the private sector,in which Malaysia has a comparative advantage. In general, prices in basicindustries should be close to those in the world market, and support shouldbe by predetermined subsidies rather than by protection.
Organization and Management Aspects
5.13 The Malaysian executive power is struggling to gain control overthe investments and operations of a rapidly growing public industrialsector. As in many other developing countries, they face three majorchallenges: adherence to basic principles of business administration,mobilization of the best available talent, and protection of the publicsector from political factors.
5.14 To run a manufacturing enterprise requires a special talent not
sufficiently available in political or civil service circles. While it ishealthy and necessary to have these categories represented on the boards ofmajor public companies, today they seem to be over-represented. In thefuture, board members should be selected to a much larger extent fromprivate industry and from among recognized financial, technical andmanagement experts. A deliberate movement in that direction should increase
the efficiency and economic viability of public manufacturing enterprises.
5.15 An inadequate level of expertise and experience in many of the key
agencies dealing with public enterprise could prove costly to the nationaleconomy. This situation should not be allowed to continue. One couldsubscribe to the principle of affirmative action without reservations andyet recognize that certain key professional positions in the ministries and
in the state enterprises should be filled by persons having the rightexpertise and experience. In Malaysia, the availability of talent is lessof a constraint than in most developing countries. Moreover, the workingenvironment in Malaysia is sufficiently attractive to permit any residualgaps to be covered through recruitment from abroad. Finally, there is noreason why there should not be a free flow of executive, professional andbusiness talent from private industry to state enterprise and administrationand vice versa. To encourage such a flow and to promote long-runefficiency, the pay scale and employment conditions in public enterpriseshould be aligned with enterprises of similar size in the private sector.This means that public enterprises in general should be commerciallyoriented and outside the usual civil service, earning sufficient profits to
follow the course indicated above.
5.16 In the past, there has been a tendency for ministries to becomeinvolved in detailed business decisions. Recently, a trend is emergingtowards greater autonomy for the enterprises. Yet experience from othercountries proves that it is extremely difficult to keep politics out of the
-62-
administration of public enterprise. The Government might thereforeconsider establishing a State Industrial Enterprise Corporation, a kind of
superholding for the state assets in the manufacturing sector particularly
for small and medium enterprises which would take the place of supervisionby the ministries. It would be easier to insulate such a corporation from
politics. Professionally managed, it would also become directly accountable
for the financial returns on state investments.
Issues in Financial Administration
5.17 There is considerable doubt about the quality of many existing
feasibility and project studies. Investment criteria are vague. Many
companies lack a proper financial structure. Terms of financing vary
considerably and often include a subsidy element. Financial reporting falls
short of a desirable standard. Clearly financial control must be tightened
all through the project cycle. If a State Industrial Enterprise Corporation
is established, this would be one of its major tasks. Otherwise, it wouldbe handled by the Treasury.
5.18 In a rapidly developing economy like Malaysia's, most companies
would be expected to require additional loan and/or equity financing at
regular intervals. Ideally, public enterprise should rely on the capital
market or the banking sector without recourse to government guarantees. For
new and risky ventures, the proposed State Industrial Enterprise Corporationwould be the major source of equity. For very large ventures, say the
planned urea plant, a proposal for state equity subscription should be
presented to Parliament, the Secretary of the Treasury acting as thegovernment spokesman. The newly created Heavy Industries Corporation could
fill an important role not only as a presumptive major supplier or
intermediary in the provision of loan capital but also in promoting a newprofessionalism throughout the project cycle, particularly for projectsrequiring large investments and longer gestation periods.
Ensuring Proper Control and Accountability
5.19 Available information on the financial performance of the public
enterprise sector is incomplete, out-of-date and poorly accessible. This is
a formidable impediment to rigorous analysis, good administration and
adequate control. Of equal seriousness, an information gap is ipso facto a
creditability gap.
5.20 Maximum transparency regarding financial and economic results
should be a cardinal rule. The accounting and reporting system of public
enterprise must be current and designed in such a manner as to produce
correct information on financial and economic results and also to provideinputs making it possible to judge the impact of individual public
enterprises and of the public industrial sector as a whole on industrialdevelopment and on restructuring.

-63-
5.21 The annual reports of public enterprise should be made availableto the Parliament no later than, say, June 30. We suggest the establishmentwithin the Parliament of a Select Committee on Public Enterprises whichshould present an annual report on the operations of the public enterprisesector no later than, say, December 31, of the year following the relevantoperating year.
5.22 Whether or not the formal audit needs to be strengthened, as someobservers have suggested, it is important to complement this with aperformance audit. Parliament aided by a secretariat of competent expertswould then have a dual role. It would review the annual report and conducta rigorous audit on the state industrial holding. Secondly, with respect tomajor new projects, it would pass judgment on two questions: whether anyspecial privileges or subsidies requested were justified in the nationalinterest and whether proposed new ventures could not with equal advantage beundertaken by the private sector, alone or in partnership with the publicsector.
The Key Issue
5.23 The key issue faced by the Government :Ls the speed and directionof the growth of public manufacturing acceptable in a developing countrycommitted to free enterprise and a market economy. Because of therestructuring objective, the domain of public enterprise is not limited inMalaysia to a few basic industries. It extends to a range of medium-sizedestablishments where the state role should, in theory, be strictlytransitory and where, in other free market countries, state participationwould fulfill no useful purpose.
5.24 Even disregarding the recent lackluster performance of publicenterprise in Malaysia, the drawbacks of this approach are many. Ministriesand other government agencies are being seriously hampered by the adminis-trative burden and diverted from important planning and strategy formulationtasks. If the state becomes saddled with many unprofitable and uneconomicenterprises; problems of disinvestment are bound to grow. The remediessuggested above are essentially to alleviate the most harmful weaknesses ofstate-run enterprise. They, by themselves would not be adequate totransform the rapidly growing public sector into an efficient vehicle fordevelopment.
5.25 The situation could become even more serious if the pace were tobe stepped up to meet the 1990 restructuring targets. There is a dangerthat the official targets for Bumiputra percentage shares in the control ofindustrial enterprise - if regarded as mandates rather than an indicativestatement - may constrain the dynamism of the private sector while forcingpublic enterprises to shoulder a greater burden than they can efficientlyhandle, in addition to creating a permanent rather than transitory presenceof the state in the industrial sector. The public enterprise sector would
-64-
then become a separate large and powerful political constituency. Therelationship with the private sector, already delicate, would deteriorate.These dangers should be averted because otherwise the NEP targets themselvescould be jeopardized.
Guidelines for the Future
5.26 The launching of the Fourth Plan presents both a challenge and anopportunity to take stock of public enterprise in manufacturing, to reviewbasic objectives and devise realistic solutions. In the mission's view, theGovernment's program should be guided by the following considerations:
(a) the expansion of public manufacturing enterprise should proceedpragmatically in line with its performance and proven ability toovercome many of the existing weaknesses discussed above;
(b) greater attention should be paid to the transfer of ownership andcontrol from the public sector to individual Bumiputraentrepreneurs and shareholders. Problems would multiply if theGovernment were to press on with the acquisition by the state ofindustrial assets, without adequate attention given todisinvestment envisaged in the same program;
(c) the equity participation target could be defined more liberally(and realistically) to include commercial and manufacturingactivities of public enterprises like PERNAS; and
(d) the advancement of Bumiputra entrepreneurship and participation inskilled jobs should be vigorously promoted, in the main, throughentrepreneurial promotional schemes and general incentives ratherthan administrative targets or political pressure or applicationof incentives on a case-by-case basis.
5.27 As in the case of manufacturing employment, the mission believesthat the restructuring of equity and control in the manufacturing sectorcannot be achieved successfully through rigid mandatory targets (or ifachieved, it would entail high cost), with state acquisition of industrialassets as the ultimate instrument of implementation. Instead, emphasisshould be placed on a combination of institutional support and financialinducements. The incentives and cost of such a program could be adjustedflexibly to the degree of progress achieved and permit the nation toevaluate its costs and benefits realistically. The incentives, moreover,would work directly on the individual non-Bumiputra entrepreneurs andstimulate them towards a variety of new solutions and approaches.
5.28 The restructuring of financial ownership of industrial assets isan easier task than the restructuring of control. First, existing foreign,

-65-
Chinese-Malaysian and Indian-Malaysian enterprises would often welcomefinancial participation (with customary safeguards for the investor) but beextremely reluctant to cede financial control of their enterprises.Secondly, it is not necessary for the Bumiputra financial participations tobe vested directly in public manufacturing enterprise. In fact, it would bemore consistent with the goals of a pluralistic society and one whereeconomic power is diffused to encourage the acquisition of industrial assetsby a vast range of fairly mature Bumiputra financial institutions alreadyexisting in Malaysia or by new institutions to be formed for that specificpurpose.
5.29 The restructuring of management control is the most difficulttask. The reluctance of existing entrepreneurs to cede establishedpositions is exacerbated by the lack of preparedness of the Bumiputrapopulation for the entrepreneurial role. Entrepreneurship takes time toacquire. It is strongly rooted in the family background. It must benurtured through education, specialized training, and practical experience.Besides the thrift and judicious risk-taking which is not easy to Inculcateit takes time for small enterprises to grow into medium-sized firms andsubsequently to mature into large industrial enterprises. Undue haste andpushing through the process may result in considerable cost to the society.
5.30 This does not mean that the Government would remain passive.First, action to foster entrepreneurship must initially be concentrated atthe grass roots level and delivered as a package combining finance withmanagement, technical and accounting services, together with pre-feasibilitystudies in many appropriate cases. Secondly, there is every reason toencourage a deliberate and orderly disinvestment (as mentioned in para. 5.28above) to Bumiputra entrepreneurs of industrial assets now held in trust bythe federal and state governments. Such investment will be speeded up ifthe state (through financial intermediaries) remains as a (silent) equitypartner in the transferred companies, correspondingly reducing the startingcapital needed by would-be entrepreneurs.
5.31 In conclusion, the mission feels that the Government of Malaysiawhile pursuing diligently the national objective of restructuring canprobably allow the pace of restructuring to be guided pragmatically byconsiderations of economic efficiency.
5.32 In maintaining the dynamism of the private sector and in improvingthe efficiency of the public manufacturing sector, the incentives and policyframework is of central importance. It is a powerful instrument whichstimulates or discourages certain activities in the manufacturing sector,determines the sector's orientation to domestic or foreign markets, affectsthe locational choices and influences the overall growth efficiency andprospects of the sector. The following Chapter therefore discusses theelements of the existing incentives system and enhance the export potentialand its linkages to the domestic economy, the labor intensity of industrialactivities and their regional dispersions - all of which are importantGovernment objectives for the next plan period.

-66-
VI. INCENTIVE SYSTEM AND POLICIES
A. Introduction
6.01 Until the late 1950s, there was very little manufacturing in
Malaysia, except for activities associated with primary production and tradewhich were under "natural protection." It was only in 1958 that the PioneerIndustries Ordinance was introduced and an attempt was made to develop themanufacturing industries under a system of mild protection. To streamlinethe industrialization effort, the Government created the Federal IndustrialDevelopment Authority (FIDA; recently renamed the Malaysian IndustrialDevelopment Authority, MIDA) and the Tariff Advisory Board (TAB, which wassubsequently replaced by the Special Advisory Committee on Tariffs, SACT) in
1963. In an attempt to step up industrialization and to provide more
focused incentives, the Government replaced the earlier legislation with theInvestment Incentive Act in 1968 which also defined the Pioneer Status ofIndustries. The Act has been the principal tool to provide tax incentivesfor investment, export, and locational dispersion of industries. Also,
since the late 1960s, import tariffs and restrictions have played a key role
among the major instruments to provide infant-industry protection for importsubstitution. By 1973, the first phase of import substitution had been
substantially completed./l As the possibility of further expansion of
import substitution became increasingly limited, policymakers have stressedexport promotion since the early 1970s (the Free Trade Zone Act was enacted
*in 1971). In the 1970s, the sharp increase in export of manufacturing goodswas accounted for, basically, by large labor-intensive manufacturingindustries such as electronics, electrical machinery, footwear and clothing,
textiles and miscellaneous-manufacturing. The bulk of the expansion ofexports was from FTZs where multinational corporations dominate the
manufacturing activity.
6.02 On the more general side, monetary and price stability and acompetitive financial structure in Malaysia have contributed to the main-tenance of an exchange rate regime and a financial market with minimumdistortion which is creditable compared to many developing economies.Political stability together with relatively liberal policies toward foreigninvestment, external trade and exchange control have provided a favorable
environment for foreign investment and international trade. An extensivearray of investment incentives, tariff and quota restrictions, pioneer
/1 In 1973, 90% of marketed consumer nondurables and 95% of consumerdurables were produced domestically. See Chee Peng Lim, "A Study of theManufacturing Sector in Malaysia: The Case for Labor-IntensiveIndustries," December 1979.

-67-
status (PS) and export incentives (including the Free Trade Zone facilities)have contributed greatly to rapid import substitution and export growth.Yet there are a number of areas in the present incentive framework wheresome reorientation and adjustments would be necessary: (a) to maintain orimprove upon the sector's overall growth performance and its efficiency; (b)to stress the neutrality of incentives as between labor and capital-useand (c) to broaden the export base and promote its linkages to the domesticeconomy. The broader objectives of the Fourth Malaysian Plan (FMP) and itsefficient implementation would be facilitated by these adjustments. Thischapter therefore pays special attention to an assessment of import tariffprotection, export, investment and locational incentives, the role of theincentive system in achieving the restructuring objectives and discussion ofprincipal issues in each of these key areas. Also the expiry of taxholidays in the near future would require the affected enterprises to pay40% corporate income tax which may make some of them quite reluctant, ifthey have alternatives, to stay on in Malaysia. The proposals mentionedbelow offer them an alternative and inducement to continue and even enlargetheir role, which should benefit the Malaysian economy.
B. Tariff Protection and Import Restriction
Case-by-Case System
6.03 Malaysia's protective system has often been characterized as"made-to-measure" or "case-by-case" system, with tariff-setting, tariffexemption, and quantitative restrictions administered through hearings andreviews of the SACT /1 on a case-by-case application basis. Applicationsfor tariff protection and import restrictions are submitted to MIDA on theprescribed forms with a copy to the Treasury./2 The protective measuresand assistance granted by the Government on a case-by-case application basisinclude: (a) tariff protection; (b) import licensing; (c) exemption fromimport duty and surtax on raw materials or component parts and machinery;and (d) drawback and/or refund of import duties and surtax paid.
/1 In 1963, FIDA took over the functions of industrial promotion andincentive administration from the Ministry of Trade and Industry (MTI);the TAB took over the function of tariff-setting. Later, the TAB wasreplaced by the SACT, (under the FIDA (Amendment) Incorporation Act,1971) which is serviced by a Tariff Unit of MIDA.
/2 MIDA, Investment in Malaysia: Policies and Procedures, April, 1978MIDA, Guidelines for Getting Tariff Assistance.

-68-
6.04 The case-by-case approach /1 may have been reasonably suitable inthe early years of promoting manufacturing industries when the industrialpromotional policy was first introduced and the industrial structure. was notvery complex. However, because of a lack of clarity in defining the cri-teria and an unmanageable administrative burden /2 embedded in its approach,the system has become a major source of anti-export "trade bias," "subsectorbias," and "firm bias."/3 In particular, the "firm bias" that stemsdirectly from the PS system has resulted in much distortion in the economy;this impedes the efficient allocation of resources. An anti-export "tradebias" also originates from the existing criteria, which do not clearlydistinguish between domestic market-oriented, import-substituting andexport-related production activities. Concern should be given to the"subsector bias" because there exist hardly any sectoral developmentstrategies that are articulate and coherent enough to support and trace theimpact of the import protection policies resulting in such a bias.
Sector Development Strategies,
6.05 Sectoral Development Strategies. Import protection is no morethan a trade policy tool to achieve the objectives of overall and sectoraldevelopment strategies. Where the latter do not exist; the importprotection mechanism is not systematic. Overburdened by the routineday-to-day handling of enormous applications based on unclear criteria underthe current system, the import protec,tion administration does not appear tohave the resources to develop a comprehensive strategy and to analyze theimpact of past and proposed import protection measures. 'The overall levelof tariff, and quotas in the 1970s was substantially higher than that of the1960s. In the second half of the 1970s, however, the overall weightednominal tariff applicable to manufacturing industries (29-31%) was notsignificantly different from that prevailing in the early 197 0s (34%)./4Yet the variation in the effective protection rates at the sectoral and firm
/1 For the shortcomings of "case-by-case" protection system, see W.M.Corden, "Trade Policies," J. Cody, H. Hughes, D. W4all (ed.), Policiesfor Industrial Progress in Developing Countries, 1980
/2 Annex Table 7.1 shows the trend in the number of applications, seekingimport protection to Tariff Unit of MIDA during 1970-79. Total numberof applications increased from about 800 in 1970 to 1,900 in 1979. Thereview committee has to study most of them.
/3 "Trade bias" refers to discrimination against exports compared toimport substitution; "subsector bias" refers to discrimination amongsubsectors; "firm bias" refers to discrimination among firms within asubsector.
/4 Annex Table 7.2 shows the average sectoral nominal tariff rates inMalaysia, 1963-77.
-69-
levels appears to have become wider in recent years than in the early1970s./l An assessment of the impact of these protection changes requiressystematic and rigorous analysis, within the contexl: of overall and sectoral
development strategies. However, in previous and current studies conductedby the import protection administration, there is hardly any attempt toestimate up-to-date sectoral effective protection, effective incentive, anddomestic resource costs. These are critical for an evaluation of the
adequacy of import protection policies (past studies on these measures are
seven-to-ten years out of date)./2
Tariff Exemptions
6.06 According to the estimate based on the Government's approvals,tariff exemption granted to the manufacturing industries (excluding those in
FTZs) for their intermediate goods imports in 1978 were equivalent to about13% of their import value./3 The more striking fact: than the high average
rate of tariff exemption granted is the higher share of exemptions (three-fourths) granted to the manufactured goods for domestic sales (amounting toM$684 million) during 1978/79. The tariff exemptions granted for machineryimports in the manufacturing industries were equivalent to about 3% of thetotal value of machinery imports in 1978./4 Again, the tariff exemptionswere granted without distinguishing the market destinations of these goods.
/1 Standard deviation having increased from about 37% in 1973 to 52% in1977.
/2 For a summary of the previous studies on nominal and effective protec-tion rates, see Annex Table 7.7. According to one of these studies thenominal protection rates (NPR) varied between 0% and 182% and effectiveprotection ranged from -26% to 308%. Some of the major nonfoodindustries having EPRs exceeding 100% were motor vehicles (296%),electric appliances (270%), plastic products (268%), tires and tubes(246%), products of petroleum and coal (174%), furniture and fixtures
(157%), leather and leather goods (112%), and radio, television (101%).The EPR for import-substituting industries was on average 40% and for
non-free trade zone exporters a negative -44%.
/3 Annex Table 7.8 shows tariff exemptions granted to the manufacturingindustries for intermediate goods imported by them during 1973-79.
/4 For tariff exemptions on machinery imports in manufacturing industriesduring 1973-79, see Annex Table 7.9. The percentage is low because (a)tariff on machinery imports is low and (b) it excludes machineryimported by establishments in FTZs - paying no taxes at all.
-70-
6.07 One important source of the observed anti-export "trade bias" and"firm bias" is the unclear rule and underlying rationale for granting tariffexemptions on imported inputs for manufacturing activities destined for thedomestic market. If the main objective of setting a certain tariff rate foran industry is to provide the necessary infant industry protection it isdifficult to justify any tariff exemptions on imported inputs fordomestic market-oriented production activities. For example, if, based on asectoral development strategy for the mechanical engineering industries, agiven tariff rate is set for machinery imports, then the tariff can hardlyserve the purpose of infant industry protection so long as tariff exemptionson machinery imports for domestic-market-destined production activitiesremain a common feature of the exemption mechanism. This illustrates theproblem with the protection mechanism and is one of the principal reasonsresponsible for the smallness and slow growth of the machinery and capitalgoods subsector in the manufacturing sector in Malaysia.
Infant Industry Protection
6.08 Import protection to infant industries provides a viable means ofencouraging rapid industrialization, but only if a relatively small numberof carefully selected industries is promoted at one time and their perform-ance in technological learning and productivity increase are continuallymonitored. According to the experience of a few developing countries thathave been highly successful in achieving such objectives in certainindustries, the most efficient way of accelerating technological learningand preventing inefficiencies is to press the protected infant industries toenter the export market at an early stage of their protection. There doesnot appear to be any evidence that such a policy has been implemented inMalaysia. For example, in the case of those industries being protected bythe quota restrictions for long periods on the grounds of their infancy, noevidence is available as to whether they have ever attempted to enter theexport market. Even though the number of commodities under quantitativeimport restrictions decreased from 53 to 37 during 1974-1980, the overallshare of prohibited items in total restricted items has increased from 11%in 1974 to 62% in 1980 and the duration of the period of restrictions hasincreased substantially,/l whereas the number of firms protected remainedsmall in each industry. Even under long-term infant industry protection, ifan industry does not have the technological capacity to export its products,then the viability of such protection is questionable and the prospects ofthe industry becoming an efficient import-substituting activity remainuncertain.
/1 See Annex Tables 7.10 and 7.11.

-71-
C. Export Incentives
Exchange Rate
6.09 During 1970-79 the nominal exchange rate index appreciated by 11%.However, due to the relative stability of domestic prices compared to theprices of primary export commodities, during 1970-79, the relative overallexport price-index adjusted exchange rate for export depreciated by 19%.Similarly, the relative overall import-price-index adjusted exchange rateindex for import depreciated by 25%. During the most recent years(1975-79), however, the overall price-adjusted exchange rate index forimport appreciated by 8% and that for exports depreciated by 30%./l In viewof the dominant share of the primary commodities in the Malaysian export(i.e., the high weight given to the primary good exports in computing theexport price index), the aggregate increase in exchange rate index forexport during the last ten years may not necessarily mean a similarimprovement for manufactured goods exporters. Therefore, a price adjustmentbased on manufactured goods prices would be more desirable than that basedon the aggregate export and import price indices. Foreign exchange rateindices based on such price adjustments indicate somewhat differentdirections from those shown by the indices based on the aggregate export andimport price indices. In the case of export, even though the manufacturedgoods price-adjusted exchange rate indices moved in the same direction asthe previous indices during 1975-79, the magnitude of depreciation was only2%. In the case of import, the two indices indicate the oppositedirection of change during 1975-79. Thus, according to the manufacturedgoods price adjusted exchange rate indices, it does not appear that theexchange rate incentives for exporters have improved substantially over thelast 10 or 5 years in so far as manufactured goods exports are concerned./2However, at the same time, it should be stressed that, due to the relativestability of real exchange rates in Malaysia the exchange rate was not oneof the key factors causing an anti-export "trade-bias."
Trade Bias and Non-Free Trade Zone Exports
6.10 According to three previous studies trade bias (i.e. effectiveprotection rate for imports substitution minus that for non-FTZ exports) was
estimated around 80-90% in the early 1970s./3 The mission's preliminary
/1 Full details are provided in Annex Table 7.12.
/2 See Annex table 7.13.
/3 For example, (the average weighted) effective protection rate (EPR) forimport substitution was 39% in 1973 and the EPR for exports was -44%.See Annex table 7.15.

-72-
estimates indicate that the level of bias against exports would be no lessthan the 1970-73 level. One of the major issue is to provide balancedincentives for import-substituting and exporting activities. Another keyquestion is how could the country's manufactured goods exports grow sosubstantially despite such a high overall anti-export "trade-bias" againstthem during the 1970s? The answer lies in the fact that while the overall"trade bias" refers to manufactured exports in general, their growth duringthe 1970s was led mainly by the Free Trade Zone (FTZ) export industries.The full incentives granted to FTZ-based export industries are substantialand consist of:
(a) a free trade regime with respect to imported inputs;
(b) "Export Incentives" (i.e., tax incentives provided to exportindustries under the Act);
(c) Pioneering Status investment incentives;
(d) preferential export credits; and
(e) infrastructure.
On the other hand, only some of the above incentives were provided to somenon-FTZ exporters, mostly on a case-by-case basis. Therefore, while FTZexporters were enjoying substantial net effective incentives on top of acomplete free trade regime, non-FTZ exporters were suffering from substan-tial negative net effective incentives, due to their lack of a free traderegime./l The contribution of FTZ-exports to the overall export growth andemployment creation has been substantial, and their further growth deservesencouragement. However, the mission feels strongly that the time has cometo review the pattern of manufactured goods exports and their incentives inthe broader perspective of a long-term industrial development strategy.Backward linkages to local industries and substantial externality (stemmingfrom technological learning and marketing experiences) are sometimes morecritical gains from exports than mere value added and employment creation atfinal assembly activities. There appears to be much greater potential innon-FTZ export industries (including producers who can potentially export orsupply intermediate inputs to final exporters either in or outside the FTZs)in obtaining these gains from backward linkages and learning. Therefore,one of the most critical issue in the Mlalaysia incentive system appears to
/1 The average estimated tariff exemption rate on intermediate goodsimports for the non-FTZ export industries was only 11% whereas that forthe manufacturing industries for domestic sales was 26% in 1978. SeeAnnex Table 7.16.

-73-
be to eliminate the anti-export "trade bias" suffered by non-FTZ exportersin comparison with FTZ exporters and import-substitution industries withinthe domestic economy.
Preferential Export Loans
6.11 The introduction of preshipment preferential export loans in early1979 may be potentially the most important policy element in the Malaysianexport incentive system, provided that the export credit system is -
substantially expanded to cover all manufactured export-related productionactivities, including indirect exports. The initial quarter's credit volumeis equivalent to about 2% of the manufactured goods export during the sameperiod. In particular, the most effective means to develop small andmedium-scale industries as direct or indirect export industries appears tobe to provide preferential working capital export loans;/l these arecritical to finance not only wage payments but also imports and localpurchases of raw materials. The current maximum ceiling, 50% of the exportvalue, would be far short of critically required funds for intermediateinput imports and local purchases, as well as wage payments for small andmedium-scale exporters. Such export loans may be more important than anyother preferential loans for small and medium-scale industries or Bumiputradevelopment, since export promotion for them would be the most efficientmeans to achieve the NEP policy objectives without conflicting with theoverall objective of economic and employment growth. While tariffexemptions provide no more than a neutral regime, and tax incentives provideno benefit at all for those exporters initially saddled with negativeprofits, preferential export loans provide genuinely positive incentives interms not only of a preferential interest rate, but also the easy anduniform availability of working capital to every exporter.
Export Allowance
6.12 The Export Allowance (i.e. major component of Export Incentives inthe Investment Incentives Act) /2 can hardly be a satisfactory substitute
/1 In particular to indigenous entrepreneurs outside the FTZs and carryingout activities showing substantial domestic value added in theiroperations.
/2 An outright Export Allowance of 2% of ex-factory value of export salesand an additional 10% of ex-factory value of export sales on theirincrease over the export sales of the last year is given as deductionfrom income tax base. This export allowance system has replaced theprevious system in the 1980 budget. Previously an allowance at the rateof 5% of the increase in exports over the average exports of thepreceding 5 years was given as deduction from income tax base.
-74-
for a free trade regime for non-FTZ exporters./l On the other hand, itprovides very generous benefits on top of a complete free trade regime tolarge-scale exporters, mainly located in the FTZs aggravating the "firmbias" among the export industries. Therefore, it appears that:
(a) providing a free trade regime to all export industries (directand indirect), combined with
(b) an income tax exemption (partial exemption) scheme (not directlytied with the absolute value of exports or their increments)granted to all exporters, appears to be a better scheme than thecurrent Export Allowance System particularly in reducing the "firmbias" and anti-export "trade bias" for non-FTZ firms./2
Streamlining of Export Incentives Administration
6.13 The current export incentive administration can be characterizedas lacking clear guidelines, automaticity, simplicity, and uniformity. Forexample, 17 copies of an application are needed to apply for tariffexemptions on intermediate inputs for manufactured goods for export, everytime a firm imports. If applications are not approved, the authorities arenot obliged to give reasons for nonapproval. The extremely complicatedpresent procedures whereby duty drawback is allowed was first introduced asfar back as in 1953, when the number and range of industries were limited.The "positive list" system of limiting duty drawback, post-shipment credit,or preshipment credit to those products included in this list providesanother dimension of unnecessary complexity. The direction of streamliningthe current export incentive administration is clear: all exports (director indirect exports FTZ or non-FTZ exports, direct and indirect importsof raw materials to be used for exports) and exporters should be eligiblefor tariff exemptions and drawbacks, based on automatic and simpleadministrative procedures. In order to include indirect exports and importsin the above, a carefully developed comprehensive, and efficientadministrative scheme is imperative.
/1 Annex Table 7.17 provides aggregate estimates of benefits arising fromExport Allowance in comparison with those from tariff exemptions onimported inputs (for non-FTZ exporters). Under the previous exportallowance scheme only 8-12% of the exporters' tariff payments that werenot exempted could be compensated. Even under the more generousrevised version, only about one-quarter of them could be compensated.
/2 This scheme will be considered further in a later discussion of themajor issues related to Pioneer Status incentives.
-75-
D. Investment Incentives
Case-by-case System
6.14 Mlany of the problems involved in the "case-by-case" approach ofthe import protection administration apply to the "case-by-case" investmentincentives system with equal force. While the provisions laid down for thevarious investment incentives are unambiguous, the criteria for eligibilityare not clear. It does not appear that pioneering products or priorityproducts are selected according to coherent overall and sectoral developmentstrategies or through careful project appraisals.
6.15 The mission was told that a "package deal" system of approvals formanufacturing projects was being considered by MIDA. Under this proposal,applications for manufacturing licenses, project approvals, investmentincentives, expatriate posts, and tariff protection, as well as exemptionfrom custom duties on intermediate and capital goods for new and expandingprojects, would be evaluated and considered as a whole. This "packagesystem" may initially appear to be a significant improvement in theincentive administration, since it is convenient to the investor and byreviewing all incentives given to a firm simultaneously, at least the "firmbias" for a given firm may be known more easily than through individualreviews. However, the proposed system is no more than an integration ofseveral "case-by-case" reviews into one, so it is still basically a combined"case-by-case" system. As pointed out previously, this system appears tohave outlived its utility and needs to be replaced by clear rules, based oncoherent sectoral development strategies applied uniformally to all firms.
Pioneer Status (PS) Incentives
6.16 Pioneer status is by far the most important incentive available tofirms. More than one third of the proposed capital investment of theapproved projects during 1974-79 was planned by the PS firms. PS incentiveshave stimulated investment in certain sectors and firms by providingpreferences for large-scale and capital-intensive investments./1 However,such investments and PS incentives have resulted in strong "firm bias" and"sector bias". For example, double benefits enjoyed by PS companies areevidenced by the following:
/1 Annex Table 7.18 shows the size distribution of PS establishments incomparison with all others in 1969 and 1974 and Table 7.19 shows theproposed investment size and investment per worker, 1973-79. In 1974,only 27% of total number of establishments had gross annual salesexceeding M$1.0 million but 76% of PS firms were in that size group.

-76-
(a) 37 companies (and groups of producers) out of 52 (i.e., 74%)local producers being protected by quotas and import restrictionsare the PS companies (as at December 31, 1977);
(b) 59 companies out of 70 companies (i.e., 84%) currently located inthe FTZs and 17 out of 22 companies currently equipped withLicensed Manufactured Warehouse are the PS companies (as atDecember 31, 1977).
In turn, the following two observations can be made:
(a) the recent pattern of manufactured goods export growth suggeststhat potential social gains obtainable from non-FTZ exportexpansion have not been realized because the private profitabilityof such exports appears very low now due to negative effectiveincentives whereas the social profitability appear to be as high,if not higher, than that of FTZ based firms; and
(b) the only way to stimulate an exploitation of the aforementionedsocial gains from non-FTZ export expansion is to reform theincentive structure so as to reduce the "firm bias" and anti-export "trade bias" for such exports.
Consequently,, it appears that non-FTZ export industries now suffering from alower level of incentives deserve more incentives. Purely profit-based taxincentives granted to,all manufactured good export /1 (direct and indirect)firms appear to be the most desirable alternative to the current system.Such a partial income tax exemption scheme granted only to export firms(existing as well as new) was already suggested as a substitute for ExportAllowances.
Labor Utilization Relief (LUR) /2
6.17 It is evident that LUR is not a genuine employment-subsidy-typeincentive, nor has it been widely utilized. The LUR formula is related tothe absolute number of employees and therefore favors large 'projects andby-passes the SMIs completely. But for those projects better incentives
/1 If the firms make losses in the initial years of export-trading thenthey could be allowed to carry forward the losses and avail benefits insubsequent years.
/2 An industry can qualify for either,PS incentive (a basic 5-year taxholiday for capital investment in excess of M$l million or canavail LUR (5 years of tax holidays for employment,exceeding 351workers) but not both.

-77-
(e.g. Pioneer Status) than LUR are avallable. This is one reason why only2% of the approved projects actually utilized this benefit. In fact, ascheme to grant income tax reductions to export industries would be moreemployment-oriented than LUR. If implemented, such a new system wouldprovide relatively greater incentives to small and medium-scale exportindustries (who are currently receiving fewer incentives than do the large
and capital-intensive export industries.) Therefore, the proposed schemewould be more employment-generating than other incentives. Also, a taxincentive to stimulate skill formation and training is strongly needed, in
view of the expected skill shortage in the near future and the externalityassociated with skill training.
E. Industrial Dispersion Incentives
Locational Incentives (LIs)
6.18 The locational priority given to the Development Areas (DAs) and
especially to the LI areas has not been realized. The overwhelming approvalhas been given to PS projects in favor of the well-established centers ofthe country. The tax incentives appear to have exerted only small influenceon decentralization because they could hardly compensate for theinsufficient supply of location facilities. In light of the suggestionbeing made concerning PS and LUR incentives, a partial income tax exemptionscheme suggested for export industries could be extended to includelocational element as well. Such a scheme would have greater incentive thanLI because the additional incentive stemming from LI (compared to PS and LUR
incentives under the current system) extends the tax holiday period by 2years after the PS and LUR periods have run out). But Eor regionaldispersion, as discussed in the next section, availability of adequateinfrastructure seems to be more important than financial incentives.
Industrial Estates (IEs)
6.19 The mission had only limited time to visit few Industrial Estates
but a comprehensive assessment of the costs and benefits of the industrialdispersion strategy through IE approach appears to be needed. This is alsoconfirmed by a recent study /1 on the industrial location behavior inMalaysia. Most of the industrial estates in the DAs (especially in the LIareas) suffer from problems with power, water, telecommunication and
/1 W. Zehender, etc. Industrial Location Behavior of Malaysian and ForeignInvestors - The Effectiveness of the Malaysian Decentralization Policy,May 1978. German Development Institute

-78-
transportation. Therefore, it appears that difficulties in adequateinfrastructural supply in the DAs are the major area of concern for theeffective decentralization of industrial locations.
6.20 While the recently adopted selective approach /1 may be effectivein the short run in overcoming the ineffectiveness of tax incentives, itwould create depressive effects on investment in the long run. Furthermorea coherent decentralization strategy must replace such ad hoc and selectiveapproach. The efficiency of industrial estates as an instrument ofdecentralization policy depends primarily on their endowment withinfrastructure and timing of their availability. Therefore, industrialestate planning (focussing on power, water, roads and telecommunicationfacilities) under the jurisdiction of states has to be carefully coordinatedwith national and subsectoral development strategies, a higher degree of acentral responsibility (MIDA) in the field of industrial estate planning andan improved institutional coordination between MIDA, the State EconomicDevelopment Corporations (SEDCs) and the agencies that provide publicutilities is desirable.
F. Restructuring Incentives /2
Tax Incentives for Restructuring
6.21 The mission was encouraged to observe that more use is being madeof fiscal incentives to attain the restructuring objectives than directcontrols and regulations. It will become even more important to continuethis approach as the economy becomes more complex and the role of the marketmechanism becomes even more essential. Beginning with the 1980 budget theGovernment has offered, on a yearly basis for three assessment years(1980-82), a reduction of company income tax from 40% to 35% to any companyconforming to the equity restructuring requirements of the NEP./3 Similarlyany company conforming to the employment restructuring will be exempted from
/1 Restricting the approval of investment to locations designated asdevelopment areas.
/2 Since the scope of this report is limited to manufacturing sectorprospects, comments made here regarding restructuring policiesare also limited to the issues dealing with the manufacturing sectordevelopment.
/3 The company must either have a paid-up capital or net assets ofM$1 million. Companies enjoying PS and other incentives will notqualify for this incentive.

-79-
the development tax of 5% on a yearly basis for three assessment years. Themission strongly endorses this general approach designed to achieve the
restructuring targets and feels that the case-by-case tariff exemptionapproach is a poor alternative to this more general and less discriminatinginstrument. The Government has also introduced a number of otheradministrative measures (e.g., projects reserved for Bumiputra or formajority Bumiputra participation, a more flexible and liberal tax relief
consideration to Bumiputra projects).
Policies to Promote Backward Linkages
6.22 Any policy reform to promote export industry's backward linkages
to local small and medium-scale industries may not be successful unless
small and medium local enterprises are able to respond actively andpositively to the incentive signals of the Government. An activeparticipation of the efficient and aggressive local entrepreneurs appears to
be a fairly important factor for the development of small and medium-scaleindustries as viable export (indirect as well as direct) industries under an
improved policy framework. Once it is recognized that the successful,development of non-FTZ small and medium industries as export industries is
one of the important aspects which will in the long run contributesubstantially to the strength of the Malaysian 21anufacturing sector and inturn to the achievement of the NEP goals, it would not be difficult to
devise a carefully thought-out scheme which would encourage them toward thatgoal and further progress toward the restructuring objectives.
G. Reforms of the Industrial Incentive System and Policies
Broad Development Strategy
6.23 The more recent export-oriented development strategy that theMalaysia policymakers have rightly pursued during the 1970s should be
continued during the FMP period, with some fresh attention to the backward
linkages of the manufactured goods export industries to local small- andmedium-scale industries. A broadened export base would permit specializa-tion according to comparative advantage in labor-intensive activities,induce technological improvement and economies of scale because of greatercompetition in foreign markets which in turn will lead to efficientoperations and a lowering of production costs for exports and for domestic
consumers. In addition, a rapid growth in manufactured goods exportsstemming directly from improved backward linkages to local small- andmedium-scale industries would not only consolidate the development base and
become an engine of overall economic growth, but would also be an importantmeans to achieve the NEP goals. However, an acceleration in growth can be
expected only if the "firm bias," "subsector bias," and anti-export "trade
bias" in the economy are eliminated or drastically reduced. Therefore,policy reforms are aimed at eliminating or reducing such biases.

-80-
Broad Direction and Priorities of Policy Adjustments
6.24 The "case-by-case" approach adopted in granting incentives shouldbe replaced by automatic and simple rules which are based on coherentoverall and subsectoral development strategies and which are applieduniformly to all firms. Therefore, coherent subsectoral developmentstrategies are essential, and streamlining of the incentive administrationshould be initiated immediately. In order to achieve a balance betweenimport-substituting and export ativities the first priority of the reformshould be to (a) provide a complete free-trade regime to non-FTZ exportindustries (indirect as well as direct exporter; indirect as well as directimportation of inputs for use in export); and (b) expand preshipment exportcredits to all export industries (indirect as well as direct) coveringfinancial requirements for intermediate input importation and domesticpurchases (including wage payments)./l Since these reforms would be neutralto those exporters already included in the scheme, they could be implementedwithout much difficulty. The second priority should be to: (a) consolidateincome tax incentives into a single partial income tax exemption systemfavoring export industries and locational dispersion;/2 (b) introduce atraining (or skill formation) incentive scheme; and (c) conduct acomprehensive review of the import tariff structure aiming at a low uniformtariff rate for most mature industries and infant industries-protectiontariff rates for a small number of carefully selected infant industries,justified and based again on subsectoral development strategies. Sincethese reforms would inevitably reduce some subsidies being received bycertain firms, careful planning and time phasing are required to minimizeany side effects of the transition from one policy regime to another on thesubsectors affected by these changes. The main policy changes mentionedabove are elaborated individually in the following paragraphs.
Elaboration of Recommendations
6.25 Tariff Exemption and Drawbacks. There should be no exceptions inthe granting of tariff exemptions and drawbck on intermediate and capitalgoods imports (direct or indirect) for use in manufactured export (direct orindirect) production. Also, the rule that only those exporting all of theirproduction qualify for duty drawbacks is much too rigid and should bereplaced by a proportional rule; if 40% of outputs produced by importedinputs are exported, then 40% of imported inputs should receive tariffexemptions. On the other hand, tariff exemptions granted on importedintermediate inputs and capital goods for use in manufactured goods production
/1 In this scheme, activities with very limited domestic value added(like electronic sub-assembly operations and basically run by non-indigenous firms) would be a marginal one.
/2 This is basically to balance the relative quantum of incentiveavailable to import-substituting activities through the tariffmechanism.
-81-
for the domestic market should in general be eliminated, except forextremely unusual cases (in which the purpose of exemption is not to providean additional effective protection for exempted industries). The tariffexemaptions and drawbacks for export-related activities should be grantedautomatically, based on simple and efficient administrative procedures. The"positive list" system should be replaced by a "negative list" system./l Inorder to include indirect exports and indirect imports in the above, acarefully thought-out, comprehensive, and efficient administrative schemeneeds to be developed.
6.26 Export Credit. The current preshipment export credit systemshould be substantially expanded to cover all manufactured export-relatedproduction activities, including indirect exports and indirect imports (ofintermediate inputs for use in export production). The maximum ceiling, 50%of the export value, would be far short of critically required workingcapital for intermediate input imports and local purchases, as well as wagepayments for small- and medium-scale exporters (indirect as well as direct).In order to administer export credits for indirect exporters, an efficientscheme, such as the local letter of credit (L/C system) being used in suchcountries as Korea, may be introduced.
6.27 Partial Income Tax Exemptions for Exports or Industries inDevelopment Areas. The PS incentives, LUR, and Export Allowances should bereplaced by a partial income tax (including development and excess profittaxes) exemption scheme (e.g., a flat exemption rate, 1/2 or 1/3 of thenormal rate) exclusively granted to direct and indirect exporters, orindustries located in development areas (existing as well as new firms).Tax exemptions should be proportional to export shares. The partial incometax exemption scheme for export industries could be implemented for about 10years, until the deepening of export industries by acquiring technology andbackward linkages is significantly achieved. Also it would be desirable toconsolidate gradually the remaining investment-based incentives developed onad hoc basis over time (ITC, IKA, ADA, RA and Accelerated Depreciation Under'Export Incentives") /2 into a
/1 The "negative list" will simply include activities in which domesticmarkets are saturated and exports encounter market limitations abroad.The activities not included in the negative list should automaticallyreceive incentives offered by the Government.
/2 Investment Tax Credit (ITC), Increased Capital Allowance (ICA), Accel-erated Depreciation Allowance (ADA), Reinvestment Allowance (RA).
-82-
simple scheme because they were developed on an ad hoc basis, have becomeover-complex and seem to have favored capital-intensive operations. Such ascheme should again favor export industries in order to induce more invest-ments into the export sector than into the importsubstitution subsectorwhich is already receiving substantial incentives. This should lead to anoverall balance in the quantum of incentives available to various activitiesand improvement of the efficiency of the manufacturing sector.
6.28 Training and Skill Development Incentives. Under this scheme, anadditional deduction from taxable income of a constant fraction (1/2 or 2/3)of the value of labor training expenses incurred for upgrading labor skillsshould be allowed. Labor training expenses should include annualizedcapital expenditures associated with training facilities, in addition tocurrent expenditures as well as scholarship expenses involved in skilldevelopment. It would also be desirable to grant tax credit to SMIs forsending staff to existing skill development institutions or to larger firmsin-plant training facilities.
6.29 Review of Import Protection Structure. A comprehensive review ofthe import tariff structure should be initiated, aimed at establishing asystematic "two-tariff rate" structure. A narrow range of low uniformtariff rate should be considered for the already more mature import-substitution industries. On the other hand infant-industry protectiontariff rates must be applied only to a small number of carefully selectedinfant industries. Such selection must be based on coherent subsectoraldevelopment strategies and a careful evaluation of each infant industry'sperformance and growth potential. The concept of "PS industries" or a listof "priority products" would be too broad to be directly applicable for suchselection. Such a comprehensive review is highly desirable because theimport protection reviews and tariff setting over the past ten years appearto have been done on ad hoc and piecemeal bases. Furthermore, there aresome indications that the level of, and variations in, the subsectoraleffective protection rates may have increased in recent years. This shouldbe confirmed by updating the outdated previous studies which should precedethe tariff reforms.
6.30 The proposed review should develop up-to-date sectoral effective
rates and domestic resource costs of the various activities. In order tomaximize the effect of infant-industry protection, an innovative scheme bywhich granting of protection is tied to a firm's performance in export salesof protected products is advisable. In particular, such a scheme should beseriously considered for products being protected by import quotas for longperiods. Starting with the proposed review of the import protectionstructure, the case-by-case review system of tariff adjustment and quotarestrictions (basically initiated by private firms' requests) should beplaced by periodic reviews, to be initiated and conducted by the Government

-83-
as part of a periodic overall review of the development strategy andindustrial policies, preferably just prior to the launching of a newdevelopment plan or at the time of mid-term plan review.
6.31 Broad Effects of Proposed Measures. First of all, the proposedreform would eliminate virtually all "firm bias" stemming from PS incentivesand ad hoc discretionary tariff exemptions. As soon as the "firm bias"within the export industries or import-substitution industries iseliminated, then there will be only two classes of firms and one type of"trade bias" left, as far as a trade regime is concerned. The unconditionaland automatic granting of tariff exemptions or drawbacks on imported(directly or indirectly) inputs used for export production (directly orindirectly) would put all export-related activities in a free trade regime,making their effective protection rate zero across the board as against thepresent negative one and eliminating the bias between FTZ and non-FTZ basedfirms. The more broadened preferential export credits and partial incometax incentive to be granted to all export-related activities would result inabout a 10% effective incentive rate, according to a rough estimate.Together with a new low uniform tariff rate applied to most mature mportsubstitution industries (assuming no tariff exemption on imported inputs fordomestic industries) the effective incentive rate would be close to theirnominal protection rate, and the remaining anti-export trade bias measurewould be small. Such a minor "trade bias" can easily be compensated for bythe Government's increased assistance to exporters in the field of overseasinformation gathering and dissemination and technology learning tasks. Theminimization of anti-export trade bias would accelerate manufactured goodsexports based on Malaysia's comparative advantage and with the closerbackward linkages, these exports would become a powerful instrument of themanufaturing sector's growth during the 1980s. Once the bulky paperwork andinvolvement of the staff in "case-by-case" system are eliminated, MIDA maybe able to focus on more critical policy-advising and policy-makingactivities, such as the preparation of subsectoral development strategies,updating of effective protective rate studies, review of the "negative list'and incentive policy reforms. In turn, it may be able to conduct verycareful project appraisals for a small number of giant projects tied withdirect foreign investments (in collaboration with the recently establishedHeavy Industries Corporation) for which the need for a social benefit-costanalysis is imperative. A "package deal" concept would be useful only forthese exceptional projects - not in estimating the required incentives forthem, but in evaluating their social and private profitability.Furthermore, the rest of MIDA's resources could be effectively directedtoward previously largely neglected areas (such as sector development

-84-
studies,/l technology transfer and learning and overseas marketing) that arevery critical for the future promotion of manufactured exports as well asthe development of the manufacturing sector in general.
6.32 In addition to the review of the sector performance, constraintson sector expansion and industrial development strategy as well as theincentives system and policy framework discussed above the mission, withinvery short time available, also sought to examine the growth performance,discuss the nature of problems and constraints and assess the growthpotential of the various subsectors. The results of this attempt arepresented in Part Two of the report below. A quick study of general keysubsectors was deemed necessary because of their importance in furtheringmanufacturing growth in the Malaysian economy.
/1 Because of its heavy involvement in long-term financing, MIDF hasdeveloped intimate knowledge of the strengths, weaknesses, principalproblems and prospects of the various subsectors. In the preparationof the sector development strategy it is necessary that MIDA and MIDFconduct them jointly and in consultation with the manufacturers- asso-ciations in these matters.

-85-
PART TWO: SELECTED SUBSECTORS
I. RESOURCE BASED INDUSTRY SUBSECTORS
A. The Wood Processing Industries
Main Products
1.01 Malaysia's wood processing industries are represented by:
(a) saw mills;
(b) plywood and veneer mills;
(c) planing mills, moulding and related products;
(d) establishments producing furniture and fittings, including rattanfurniture.
Size, Structure and Location
1.02 Wood processing is one of the main industries of Malaysia.Excluding logging operations, the subsector contributed 5.7% of industrialoutput, 10% of manufacturing sector value added, 7% of industrial employmentand 18% of Malaysia's total exports in 1977. It is estimated that in 1979there were approximately 1,000 wood processing mills in Peninsular Malaysia,of which 556 were saw mills. Employment was estimated at 45,000. The grossvalue of output of the subsector was M$884 million in 1974./1
1.03 Ownership of wood processing industries is predominantlyMalaysian Chinese although the State Economic Development Corporations(SEDCs) have invested heavily in several saw mills and integrated plants.Export-oriented mills, especially those producing plywood and veneer arejoint ventures with Singapore and Hong Kong investors.
1.04 The major concentration of wood processing industries in 1974 wasin Selangor, Perak, Pahang and Johore. Saw mills and integrated millsgenerally tend to locate close to the source of raw materials while thoseengaged in further processing generally locate close to their main markets.
Recent Performance
1.05 Output. The volume of output of the wood processing industries inPeninsular Malaysia exhibited rapid growth between 1968 and 1973 (15.3% per
/1 No later estimates are available.

-86-
year) but was affected by the international recessipn of 1974 and 1975.There was a strong recovery in 1976 but the growth rate slowed down in 1977and there was a net decrease in output in 1978 despite expansions ofprocessing capacity.
1.06 Employment. Employment in the subsector increased from approxi-mately 26,000 in 1970 to 42,000 in 1974 and the mission estimated a furthersmall increase to 45,000 in 1979. Among the companies interviewed,Malaysians represented more than 50% of the labor force. Females, carryingout operations of inspection and quality control, represent more than 20% ofthe labor force in these industries. Malaysians are well represented at theadministrative and professional levels but not in export marketing which iscarried out almost exclusively by agents or foreign partners and parentcompanies.
1.07 Exports. For the period 1972 to 1977 exports of logs and woodproducts grew at an annual average rate of 19%. Exports of logs and sawntimber still constitute the bulk of the subsector exports (58% and 31%respectively in 1977). By 1977 wood products had become the second largestsource of Malaysia's export earnings, the first being rubber products.
1.08 At present the major customers for logs and sawn timber areSingapore, Japan, Korea and Taiwan. Plywood, veneer and planing millproducts are sold to the United Kingdom, EEC, USA and Middle East countries.Domestic demand accounts for about 30-40% of production, in many casesusing lower quality products that cannot meet the stringent standardsrequired by foreign customers.
Problems and Constraints
1.09 Labor Supply. Due to the hard working conditions and relativelylow salaries, compared with those offered by other industies and in otherplaces (e.g. Singapore), wood processing mills visited by the Missionclaimed to be finding it more and more difficult to recruit all the laborthey need (particularly unskilled labor). Among the companies visited,wages for unskilled workers ranged between M$4 to M$9 per day. Even thehighest rate is about 30% less than the minimum wages in Singapore.
1.10 Forest Resources Wood processing mills, especially those on theWest Coast, are experiencing serious difficulties in obtaining logs of goodquality. Further, the 10 most valuable commercial species /1 show signs of
/1 Merzawa, White Meranti, Meng Kulang, Kedondong, Durian Hutan, Mlelantai,Bintargor, Tualang, Kerwing and Red Meranti. Recently, the Governmenthas imposed a ban on the export of commercial timber log species exceptfor small diameter logs.
-87-
nearing depletion. The main reasons for these emerging supply problemsappear to be:
(a) since 1977 production of logs in Peninsular Malaysia has declined
after growing at an average rate of 6.6% per year for the previoussix years;
(b) the demand for logs and sawn timber by countries such asJapan, Taiwan and Singapore has been very bouyant withhigh prices being offered by these customers particularlyuntil 1977/78 when the ban was imposed on log exports;
(c) reforestation and rehabilitation programs have been inadequate,especially on the West Coast of Peninsular Malaysia whereuncontrolled exploitation has caused major damage;
(d) until 1977 logs entering the Peninsular (where most processingmills are currently located) from Sabah and Sarawak faced an importduty of 15% which has since been abolished; and
(e) processors complained that they find it difficult to obtainforest concessions.
Process Technology and Capacity Utilization
1.11 Even the largest plywood and veneer mills have recovery rates (logweight recovered as final product) below 50%, in comparison with 60% to 65%obtained in Korea, Japan and Taiwan. This may be, in part, due to lowquality and small diameter logs being fed to the mills which are unable toobtain adequate supplies of good quality logs. Also, few mills have thehigh speed lathes designed to peel logs down to a smaller diameter core.Still another reason is the lack of integration through which byproductsrecovery can be achieved; at present wood-waste is used as fuel for theboiler or left to rot while the alternative uses as raw material forblock-board, laminboard, particle board, etc. are applied only by a fewcompanies. Technological improvement is one of key need of the woodprocessing industries.
1.12 The high degree of labor intensity, especially for transportoperations within mills, and high labor turnover rates are reflected inpoor productivity rates. It is estimated that output per worker inmaking plywood panels in Malaysia is about one-quarter of that in Koreaand Taiwan. Capacity utilization is also low. Plywood mills operated atonly 65% of capacity in 1978 while saw mills and planing mills were probablyoperating below this level. Low labor productivity and capacity utilizationhave also surfaced as basic problems lowering the international competitive-ness of the industry.
1.13 Besides better machinery for improved recovery rates (para. 3.11),areas where additional investment and expansion are needed include greater

-88-
kiln drying capacity (wood is normally dried in the open air) and greateruse of chemical treatment to avoid spoilage by pests. More extensiveapplication of these two systems of wood preparation and preservation wouldimprove the quality of the timber and of the final product.
Growth Potential and Recommendations
1.14 Domestic sales of wood products are mainly associated with theconstruction industry, both residential and nonresidential. Since theconstruction sector is expected to grow at 13% to 14% per year a similarrate of growth of domestic demand for wood products may be expected.
1.15 The bulk of current exports have been of logs or sawn timberor ordinary plywood which is further processed by the importing countries.Recently, a ban has been imposed on the export of commercial timber logspecies except for small diameter logs, to ensure adequate local supplyof logs for domestic processing. Nevertheless, careful investigation isrequired to assess whether upgrading could profitably be undertaken inMalaysia. There are indications that joint ventures with Japan and othercountries in integrated plants mainly to overcome technical difficultieshold out considerable promise of growth and development in wood processingindustries.
1.16 The USA is becoming an important market for Malaysian plywoodalthough Malaysia still accounts for only 2% of USA imports. The EECimposes quotas on duty-free imports of plywood (imports in excess of quotapay a tariff of 13%) but it may be possible to negotiate increased quotasin the future. Other important markets for plywood are Middle Eastcountries whose demand growth is closely related to construction activity.Although Japan has a large plywood industry it has started to deploy itsinstallations to countries rich in forest resources and Malaysia may well befavored if attractive joint venture prospects are offered. Efforts are alsorequired to establish direct contracts between Malaysian manufacturers andoverseas users and to reduce the dependence on foreign agents, partners andparent companies as the only sales outlets.
1.17 Measures which will need to be taken to place the sector on a morecompetitive international footing include:
(a) allocation of forest concessions on a more efficient andequitable basis, e.g. by auction. This would allow processorsto acquire reliable sources of supply and should result inbetter locational distribution of processing facilities;
(b) implementation of effective reforestation and rehabilitationprograms to ensure that long term opportunities are notjeopardized by the pursuit of short term profits;

-89-
(c) provision of technical assistance aimed at improving productionefficiency and encouraging the use of the most appropriateproduction techniques and new uses like knocked down furniture,mouldings, windows, doors, etc.; and
(d) promotion of increased research on the characteristics,properties and applications of forest species which have now nocommercial value.
1.18 If these steps are taken and vigorous efforts are made to seekout new and expanded export markets it appears reasonable to anticipatecontinued export growth (by value) at the rate of 9 to 10% per yearachieved over recent years.
1.19 Because export expansion requires improved productivity and more
sophisticated production techniques it is likely that, for unskilled labor,employment growth, though positive, will be significantly smaller thanoutput growth. The demand for skilled labor should increase quite rapidly,however, especially if a greater proportion of production is furtherprocessed.
B. The Rubber Processing Industries
Main Products
1.20 The manufacturing of rubber products in Malaysia includes the
following activities and products:
(a) rubber latex processing and rubber remilling;
(b) rubber smokehouses, tyre and tube manufacturing; and
(c) rubber footwear; and other rubber products (e.g., gloves, hoses,tubing).
1.21 Some production is destined to the domestic market (tires and
tubes and canvas shoes) while the major part is exported as dry rubber andlatex and as manufactured products (gloves, medical apparatus, tubing, swimcaps). Basic production of dried natural rubber and latex is normallyundertaken within the rubber plantations or estates and is thereforeconsidered in Malaysia a part of the agricultural sector even thoughmachinery is used to transform the raw material.
Size, Structure and Location
1.22 In 1978 crude rubber production totalled 1.65 million tons with anestimated value of M$3.8 billion of which M$3.6 billion was exported. There

-90-
could be as many of 500,000 workers engaged in agricultural production ofcrude rubber./l Rubber processing industries on the other hand producedgoods valued at M$380 million only, exported M$96 million and employed about16,000 workers in 1978.
1.23 The industry is relatively capital-intensive compared with otherMalaysian light manufacturing industries with gross output per worker ofmore than M$50;000./2 It is almost totally privately owned with a high pro-portion of Malaysian Chinese ownership, a number of joint ventures withoverseas interests and some fully overseas-owned enterprises.
1.24 The main concentrations of mills (other than those on rubberestates) are in Johore and Selangor because of closeness to raw materialsand to urban centers.
Recent Performance
1.25 Output. The volume of crude rubber production increased at a rateof only 0.5% per year during the period 1973-78. The corresponding rate forrubber manufacturing industries was 2.9%.
1.26 Exports. Export earnings from natural rubber and rubber productscontribute more than 20% of Malaysia's total exports, although this hasdeclined from almost 35% in 1973. The value of exports increased fromM$2.5 billion to M$3.6 billion from 1973 to 1978 due in large part toimproved prices from M$1,530/ton to M$2,230/ton over the period. Exports ofmanufactured rubber products increased from M$36 million to M$96 millionover the period.
Problems and Constraints
1.27 As with the rest of the agricultural sector legal problems asso-ciated with land ownership constitute a barrier to expansion of crude rubberproduction. Also, unskilled workers are becoming increasingly difficult toattract to and retain in the industry even though wage rates are among thehighest in Malaysia. Some shortages at the technical and professionallevels have also been reported.
1.28 Primary processing of latex and rubber still uses highly labor-intensive processes and this may need to change as the cheap and abundantlabor supply on which they were based disappears. There is scope forgreater mechanization and automation. The associated need for skilldevelopment will also arise with increased mechanization.
/1 Calculated at the rate of 1 worker per 4 hectares.
/2 There are no estimates of fixed assets per worker.

-91-
1.29 Foreign sales of manufactured products are handled directly byoverseas parent companies and their distributors; Malaysians have verylimited knowledge or experience of overseas marketing. The subsector istherefore not well placed to aggressively pursue new export markets.
Growth Potential and Recommendations
1.30 World demand for natural rubber in 1978 was around 3.8 milliontons of which Malaysia contributed approximately 45%. Higher prices for oiland synthetic rubber are likely to stimulate growth in world demand fornatural rubber at a rate of at least 5% per year. Simultaneously, pricesare likely to continue rising rapidly although ongoing talks sponsored byUNCTAD for the establishment of an "International Natural Rubber PriceStabilization Scheme," if successful, could result in the establishment ofbuffer stocks designed to maintain prices between a minimum of M$1,500/tonand a maximum of M$2,700/ton for a period of five years./l
1.31 Malaysia's ability to capture a share of the expanding market fornatural rubber will depend on the rate at which additional land can bedevoted to its production and the success with which yield-improvingmeasures are introduced. Yields are gradually being improved by replantingwith selected planting material and the use of stimulants (hormones). Theexpansion of plantation area will depend, in part, on the relative returnsfrom rubber and other crops such as oil palm and cocoa and on whetherprogress can be made in resolving legal problems of land ownership.
1.32 For manufactured rubber products the export expansionpossibilities are not so clear because markets are limited and highlycompetitive. Tyre companies, however, have good expectations for tyreexports for heavy earth-moving equipment and for greater penetration of themarkets of Southern Asia. The local demand for tyres and canvas shoes isexpected to grow at a rate of 10% per year, because of the general buoyancyof the economy and high income levels.
1.33 Being a large supplier of natural rubber to the world market,Malaysia should devote considerable resources to the development andpromotion of products like rubber gloves, industrial rubber hoses,automotive rubber parts, uses of rubber wood for pulp or furniture, etc.The scale at which it is being done does not match with the importance ofthis product in the national economy.
/1 As noted earlier the price in 1978 was M$2,230/ton.

-92-
C. The Food Processing Industries
Main Products
1.34 Most sections of M4alaysia's food processing industries serve only
the domestic market. The muajor exceptions are vegetable oils (palm oil),canned pineapple and some highly priced species of fish. Areas in whichMalaysia is not self-sufficient include beef (20% of consumption is
imported), milk and dairy products (95%) and wheat (100%). Sugar productionfrom domestic sugarcane represents only 50% and paddy 85% of domestic
demand. Although cocoa beans are becoming an attractive cash crop vis-a-vis
oil palm and rubber, not more than 10% of beans undergo local processing(e.g. production of cocoa butter and chocolate powder) and most of them areexported in the dried form.
Characteristics of the Food Processing Sector
1.35 The mission estimates that, in 1979, food processing industriescomprised 20% of all industrial enterprises, employed 15% of the industriallabor force and generated 30% of gross industrial outputs./l Output of theindustries (at constant prices) increased at a rate of 5.5% per year duringthe period 1973 to 1978 compared with population growth of 2.7%.
1.36 The subsector has not grown as rapidly as other industries such aselectronics, textiles and wood processing for a number of reasons.
(a) Production of raw materials is obtained largely from small plots,using traditional farming methods and precluding the use of selec-ted varieties of seeds, mechanization and good agronomic standards,including the use of fertilizers and pest controls.
(b) The population shows a preference to consume fresh produce ratherthan canned or preserved foods, especially in the case of fruitand vegetables; the varieties needed for export-oriented develop-ment differ from those used for direct consumption (e.g. tomatoes)where uniformity of size, color, ripeness and yields are not soimportant.
(c) There is a general lack of enough and efficient storage facilities(including cold storage) for raw materials like fruit and vegeta-bles, whose production is seasonal.
/1 Up-to-date statistical information is not available from officialsources.

-93-
(d) There are legal problems associated with granting land ownershipwhich have left many farms idle for years. Extension services andagricultural credit are provided to title holders only.
(e) Containers (glass, tin cans) and packaging materials, which arelocally produced with the assistance of fairly high tariff, arevery costly.
1.37 The relevance of some of these factors is discussed in the contextof an examination of the two major export-oriented activities - palm oilproduction and pineapple canning - which occupies the remainder of thissection on food processing industries.
Palm Oil
Size, Structure and Location
1.38 It is estimated that a little over 750,000 ha was devoted to oilpalm growing in 1979, yielding 1.85 million' tons of crude oil. The privatesector owned an estimated 57% of the total oil palm area in 1979. Most ofthe recent increases are the result of converting rubber estates, a tendencythat the Government is discouraging. New oil palm estates belong to publicenterprises such as FELDA and FELCRA. In 1960, oil palm estates wereconcentrated in Johore, Selangor and Perak but by 1979 Pahang had thegreatest area and significant increases had occurred in Trengganu, NegriSembilan, and Sabah and Sarawak.
1.39 Palm oil mills tend to be located inside the plantations due tothe high cost of transportation of the fresh fruit bunches (FFB) and thedecline in oil content if the fruit is not processed immediately afterharvest. There is a further tendency to establish newer plants based onintegrated operations (from plantations suppying FFBs for crude oil todownstream processing into required products).
Recent Performance /1
1.40 Output. Production of crude palm oil increased from 0.6 milliontons in 1971 to 1.85 million tons in 1979. Yield (tons) per hectare hasincreased from 2.07 to 2.44 over this period, mainly due to the introductionof improved varieties. A substantial shift in land use has occured becauseat current prices, oil palm planting is much more lucrative than rubberplanting and is also less labor-intensive while the maturity period for palmoil trees is less than half of rubber trees.
/1 No information on employment is available for this industry.
-94-
1.41 Exports. The volume of exports increased at an average rate of15% per year between 1971 and 1978 while their value increased at 26% (atcurrent prices) accounting for 11% of Malaysia's total exports in 1978.Exports comprise crude oil and processed palm oil (which includes refinedoil, olein, stearin and palmitic acid). In 1972, 95% of exports consistedof crude oil, by the late 1970s, it had come down to a level of 20%. Thetendency is to increase gradually the degree of processing and hence valueadded in these exports.
1.42 The EEC (especially the United Kingdom) is the major buyer ofMalaysian crude palm oil. Other important markets are the USA, India andthe Middle East. Exports of processed palm oil go mostly to the EEC, Japan,India, Singapore and the Middle East.
Problems and Constraints
1.43 Installed Capacity. The country as a whole appears to have excessinstalled crude oil capacity although there are seasonal peaks to be takeninto account in assessing overcapacity. Monthly fluctuations of FFB produc-tion may be as high as 30%. On a state-by-state basis, refining capacity isnot well matched with FFB supply and not all mills have arrangedsatisfactory supply contracts. In rmany states, there is an imbalancebetween fruit production, crude oil capacity and refining facilitiesestablished for palm oil processing. Labor in rural area estates isbecoming increasingly difficult to obtain because people prefer to work inurban/industrial areas. Wages have doubled in three years from M$3 per day(unskilled workers) to M$6-7 per day and even then plantations cannot getmore than half the labor they need. Now they are trying to get laborthrough contractors which adds 20-25% to labor costs. Plantations areseveral miles away from population areas and housing costs for live-in laborare beyond what these estates can absorb. Better infrastructure, includingelectricity, is needed to relieve labor shortages in plantation areas. The
Government should also consider partial or full write-off of expenditures-incurred on workers' houses in plantation areas.
1.44 Export Incentives and Taxes. The Ministry of Finance has imposedexport-duty on the export of crude palm oil. Duty exemption is given on theexport of refined oil (varying with the degree of refining). The mission wastold that because of the Government's big push on refined oil and thenecessity of foreign importers to pay duty on it, refined oil has beenselling at a price 30% lower than that of crude oil in recent months. Acareful analysis of the government strategy is needed to rectify thisapparent imbalance in relative prices.
Growth Prospects and Recommendations
1.45 While the domestic consumption of palm oil has rapidly increasedfrom 120,000 tons in 1975 to 206,000 tons in 1979, the local market remains

-95-
small compared to the volume of production and prospects for furthersubstitution of other cooking oils by palm oil are limited. In view of thelarge exportable surplus, efforts should therefore be made to diversifyexport markets and to sell Malaysian oil to other developing countries, manyof which are large importers of oils and fats. Overseas tariffs range from2.5% to 15% and efforts should be made to negotiate bilateral reductions ofthese tariffs. Also, serious consideration should be given to removing theinconsistencies between the relative crude/refinecd oil prices. The problemsassociated with frequent changes in the revision of export duty should alsobe looked into. An increased supply of palm crude oil would be an importantdeterminant of the future expansion of this industry.
1.46 Overall, an increase in palm oil production of at least 10% peryear seems reasonable over the next five years although competition inoverseas markets from soyabean oil exports from the USA, Brazil, Argentinaand other countries could constrain this growth in the absence of concertedexport promotion measures of the type suggested aboVe.
Pineapple Canning
Size, Structure and Location
1.47 Production of canned pineapple totaled 50,400 tons in 1978 valuedat M$60 million. In addition, production of pineapple juice totaled 2,100tons valued at M$1.7 million. There are four pineapple canneries (comparedwith 27 before World War II), all located in Johore with three privatelyowned (mostly by Singapore stockholders) and one state enterprise (owned100% by FIMA). Total installed capacity is approximately 3.5 millionstandard cases./l
Recent Performance
1.48 Output of canned pineapple totaled 54,600 tons in 1974, fell to45,000 tons in 1975 and has since increased to 50,400 tons in 1978./2Exports account for 99% of production volume and export receipts increasedat a rate of 10.8% per year between 1973 and 1978. The main customers arethe United Kingdom (40%), the USA (20%) and Middle East countries (20%).
Problems and Constraints
1.49 Production of fresh pineapples has declined in Peninsular Malaysiaduring the last five years, from 245,300 tons in 1974 to 190,300 tons in
/1 1 ton = 50 standard cases.
/2 Production in 1979 is estimated to have been around 49,000 tons.

-96-
1978. About 50% of total output is produced by small farmers who areincreasingly leaving their land idle (because of legal or economic problems)or switching to more rewarding and less risky crops. Even large plantationsare experiencing labor shortages due to better pay and conditions elsewhere.Shortages have most affected the state enterprise which has the lowest capa-city utilization (40%), compared with close to 80% capacity utilization bythe private companies which also operate plantations.
1.50 Overseas tariffs on pineapple products are quite high: 25% in theUSA and 24% for slices and 12% for cubes and spiral cuts in the EEC. TheUSA and Japan also impose quota restrictions and there are well developedbrand loyalties in those countries for goods manufactured by American andJapanese subsidiaries (some of which are located in the Philippines andThailand).
1.51 Malaysian producers also face high costs for cans which arelocally produced with fairly high tariff assistance. Further, fruitrecovery is low (18% of fruit weight), compared with the Philippines andThailand (25%).
Growth Prospects and Recommendations
1.52 The considerable expansion of pineapple processing in Thailand andPhilippines is expected to result in a saturation of the international mar-ket, at least in the next two years. The prospects for increased Malaysianexports, therefore, are not good. If existing markets are to be preservedand expansion achieved, a number of measures will be required. Theseinclude improved research into the agronomics of pineapple growing;/lresolution of legal problems of land ownership; and reduction of the costsderiving from high tariffs on imported cans. Attention should also be givento the reasons for the relatively poor capacity utilization of thestate-owned processor, especially if it results from its failure orinability to pursue sound commercial practices.
/1 Canners interviewed claimed that MARDI has set very low priorities onpineapple research.

-97-
II. LABOR-INTENSIVE EXPORT SUBSECTORS
A. The Electronics and Electrical Machinery
Main Products
2.01 The electrical and electronic (E AND E) industries of Malaysiacover the following product groups:
(a) electrical industrial machinery and apparatus;
(b) electronic appliances, telecommunications equipment and electroniccomponents;
(c) electrical appliances and houseware;
(d) cables and wire;
(e) dry cells and storage batteries;
(f) electric lamps and tubes; and
(g) miscellaneous electrical apparatus and supplies.
Size, Structure and Location
2.02 The Malaysian E&E industries comprise about 200 establishmentsemploying 60,000 workers, mostly female, with exports of M$1.9 billion in1979. Most of the industries development ocurred only during the lastdecade. With increasing labor costs in industrialized countries, many largeUSA and Japanese corporations sought new locations in Malaysia where theyfound ample and easy-to-train workers together with a reasonably goodindustrial infrastructure, including industrial estates, free trade zonesand transport facilities. More than 60% of the subsector's labor force isMalay and more than 50% is female.
2.03 In 1977, 73 of the existing 168 establishments producedelectronics goods, employed 88% of the labor force and produced 86% of theoutput. There is no statistical information on the size distribuion offirms in the industry later than 1974. In general, however, companiesproducing electronic components are the largest employers (several employmore than 2,000 workers), while those manufacturing assemblies andsubassemblies are small and medium-sized enterprises.
2.04 American-owned companies, accounting for about 10% of existingenterprises, are the largest in terms of output and employment. Second in
-98-
importance are firms from Japan, Hong Kong 'and Singapore (9% of all firms).
The majority of companies producing assemblies and subassemblies are
Malaysian and/or joint ventures with foreign companies (62%). However,
Malaysian ownership is mostly Chinese, while Malays' participation is still
low and far from the 30% goal aimed at by the Government.
2.05 In 1976 the largest concentration of firms in the subsector was in
the states of Selangor (51%), Penang (18%), Johore (12%) and Perak (9%).
Many firms are located in industrial estates and free trade zones where
infrastructure, communications, ancillary services and government incentives
are most satisfactory.
Recent Performance
2.06 Output. Output of the E and E industries, valued at constant
prices, grew at an average annual rate of 13.6% during the period 1970 to
1978. During the last five years of the period the growth rate was evenhigher at 18.9% per year.
2.07 Employment. Employment in the subsector has grown from a little
over 22,500 in 1973 to an estimated 60,000 in 1978 - a growth rate of more
than 20% per year. Shortages of female workers were reported in the south
of the country.
2.08 Exports. Export-oriented firms producing electronic componentsand assemblies began to appear in the early 1970s. These firms are
characterized by their labor-intensive production processes. During the
last five years about*85% to 90% of total producton of E+E firms was
exported. In 1979, exports of the subsector totalled M$1.9 billion (up 15%
from 1978). This represented 45% of exports by the manufacturing sector and
8% of all Malaysia's exports. About 80% to 90% of exports are electronic
components, assemblies and subassemblies.
Problems and Constraints
2.09 Although the subsector has contributed significantly to employment
and exports its future contribution is not assured. The economics of the
operations of multi-national electronics companies in countries such asMalaysia are highly sensitive to changes in production costs due to newtechnology, increased labor costs or tax or other incentives. Operations of
this nature tend to be highly mobile between countries.
2.10 Export-oriented E+E firms are, at present, quite profitable. How-
ever, with the expiration of their tax holidays in a few years time this
position could change abruptly. Corporate income tax in Malaysia is 45% of
profits.' Further, if wage rates were to outstrip improvements in labor

-99-
productivity (due, for example, to developing shortages of labor in thevicinity of the' plants) Malaysia could quite rapidly lose its comparativeadvantage over other developing countries.
2.11 In general, only labor-intensive operations are carried out inMalaysia while operations requiring sophisticated technology and capital-intensive, mass-production methods are undertaken in the USA and Japan, evenwhere this implies additional transportation costs to send the goods inprocess back and forth. The linkages between the subsector's export-oriented section and the rest of the economy are minimal. Less than 5% ofraw materials are purchased locally and local employees receive littleexposure to technological developments or marketing *nethods. Productionoperations generally involve workers using simple tools with very fewmachines. The proportion of domestic value added in total is perhaps quitesmall.
Growth Potential and Recommendations
2.12 Increased income and improved living standards for the majority ofthe population will result in growth in domestic demand for E and E appli-ances in household use. Domestic demand may also reach a level at which thelocal production of more sophisticated goods may become economic in the1980s resulting in a second round of import substitution. Such productscouid include vacuum cleaners, hair dryers, food mixers and electric andelectronic toys, cooking ranges, refrigerators, air conditioners.
2.13 The international demand for E+E products is growing rapidly.Malaysia has only a small share of this market and could benefit substan-tially from its growth provided that it can maintain or improve its compet-itive position. Factors which are likely to have the greatest impact onthis competitive position are labor availability and productivity and theexpiration of tax holidays. Any significant upwards pressures on wage ratesresulting from increasing competition for unskilled, and largely female,labor will adversely affect the subsector unless offsetting productivityimprovements can be achieved. There is some evidence to indicate, however,that productivity in the kind of operations performed in Malaysia is closeto that'in the USA and Japan. Further improvements may therefore onlybe available from greater investment in mechanization, automation andmass-producion methods - areas in which Malaysia's comparative advanatageshould be evaluated, which the policy-makers should try to induce theexisting companies to move into through appropriate incentives.
2.14 As previously noted, the expiration of tax holidays will have alarge impact on the profitability of E and E firms since corporate incomeand development tax is levied at a rate of 45% in Mialaysia (compared with15% in Korea and Hong Kong and 5% in Singapore). However, extension of thetax holidays or the provision of alternative incentives for E and E firmsover and above that consistent with infant industry development ordemonstrated external economies is difficult to justify, irrespective of

-100-
comparisons of corporate tax rates in other countries. Such incentives canonly be provided at a cost to other sectors of the economy or to Governentservices generally. Long-term general incentives for export activites as ameans of generating or maintaining employment have been discussed in Part I,Chapter VI of this report. Incentives to E&E and other subsectors shouldbe determined in that framework./l
2.15 Overall, Malaysia is internationally competitive in E&E productionand is likely to remain so in the immediate future, providing opportunitiesfor.good export growth. Over a longer period there is likely to be a switchaway from the highly labor-intensive operations presently undertaken bymultinationals as these operations are moved to locations with more abundantsupplies of low cost, unskilled labor. Efforts will have to be made to seekout and develop new production possibilites and markets and to trainMalaysians as technicians, professionals and marketing staff to replaceexpatriate staff who presently dominate these occupations.
B. The'Textiles and Wearing Apparel Industry
Main Products
2.16 Textiles and wearing apparel industries in Malaysia are involvedin the following activities:
(a) spinning imported cotton and synthetic fibers into yarns;
(b) weaving yarns into cloth;
(c) finishing operations, including dyeing, printing and specialtreatment of cloth;
(d) knitting fabrics and finished products such as underwear,sweaters, and stockings;
(e) garment manufacturing, including sheets, blouses, pants, suits,,jeans and a variety of other products.
/1 Part of an overall analysis of industrial development strategy inMalaysia, however, might look at the impact on various sectors of theeconomy of alternative revenue raising devices available to the Govern-ment. This would take into account the relative discouragement ofexport activity associated with a heavy reliance on corporate tax as arevenue source.

-101-
2.17 Spinning and weaving mills are normally integrated and may eveninclude finishing plants. However, in most cases the capacities for thedifferent sections are not in balance and firms buiy or sell to compensatefor bottlenecks or to dispose of surpluses. A number of producers have alsotaken advantage of incentives for export oriented mills by establishingmills producing intermediate inputs such as wool tops, synthetic yarns andgrey cloth./l
Size, Structure and Location
2.18 According to the last (1974) Census of Manufacturing Industries inPeninsular Malaysia there were 154 textile firms (spinning, weaving andfinishing) and 146 garment factories./2 It is thought that the number oftextile mills was approximately the same in 1979, increases in investmentand output resulting largely from expansion of existing firms.
2.19 Due to the large investments and minimum economic size of spinningand weaving mills and of finishing plants, the companies engaged in theseactivities are mostly large. Knitting raills without spinning facilities areoperated by small and medium-sized companies, representing about 80% of thetotal number of firms in this group. The number of garment factories isestimated to be around 200 in 1979, the majority being of small or mediumsize with the largest firms producing exclusively for export.Export-oriented enterprises (both textile and garments) are generallyforeign-owned.
2.20 Most textile and garment mills are located in the states of PenangPerak, Selangor and Johore although there is also a large number of verysmall textile mills in Kelantan.
Recent Performance
2.21 Output. Output of the subsector has grown very rapidly since 1974at an average rate of 27% per year valued in current prices. The gross
/1 Inadequate information is available to analyze the inter-industrylinkages between the different sections of the Malaysian textiles andgarment industries. Considerable efforts should be made to overcomethis information gap so that a clearer appreciation of theinterdependencies within the subsector can be obtained and inoreappropriate policy responses formulated.
/2 No statistical information is available on these industries in Sabah andSarawak.

-102-
value of output in 1978 was M$1.2 billion. The growth rate was highest in1975 and 1976, largely due to the turnaround in the international marketfrom the recession in 1974. Since 1976, output in current prices hasincreased on average by 10% per year. In addition to improved conditions onthe international market after 1975, domestic demand for local productionincreased due to higher incomes and increased tariff protection for localproducers. The growth in domestic demand and import substitution togetheraccounted for approximately 50% of total subsector growth. MIDF estimatesfor 1976 indicate that local mills supplied a little under 60% (by volume)of the domestic market for textile fabrics.
2.22 Employment. It is estimated that by 1979 the textile and wearingapparel industries provided direct employment for approximately 60,000persons, representing 10% of total industrial employment. Employment in thesubsector grew at an average rate of almost 19% per year between 1970 and1979.
2.23 Exports. Exports of textiles and garments have grown fromM$51.8 million in 1971 to M$451.9 million in 1978; representing approxi-mately 35% of total production. The growth rate between 1975 and 1978averaged 21.5% per year. The major overseas markets are the EEC (42%) andthe USA (15%), where products are sold under (volume) quota restrictionsresulting from bilateral agreements. Other non-quota markets successfullypenetrated by Malaysian exporters include Japan, Australia, Singapore andHong Kong.
Problems and Constraints
2.24 There were indications of developing labor shortages, inparticular of female workers, in a number of plants visited by the missioncausing firms to work below capacity or to spend considerable amounts oftime and money training new workers to replace those who leave. Theshortages appear to be worst for those mills in close competition for laborwith E&E industries and/or with Singapore./l
2.25 The size of many existing textiles mills is significantly belowthe minimum economic size (m.e.s.). The m.e.s. for spinning and weavingis of the order of 20,000 spindles and 1,000 looms, but many existingmills in Malaysia are well below these scales. Sub-optimal scale
/1 Salaries for unskilled workers of M$4 to 6 per day paid by textileindustries are, on average, 10% less than those paid by electronicsindustries in Malaysia and 30% less than those paid by textileindustries in Singapore.
/2 Scale of operations is not as critical for knitting and garmentfactories which employ much less complex and less capital-intensiveproduction processes.

-103-
is exacerbated by a lack of product specialization. Spinning mills visitedby the mission produce a minimum of 35 different gauges of yarn (the maximumfound was 60). If differences in raw material and colours are taken intoaccount the variety of product is even greater. Ak similar situation prevailsin the weaving and knitting mills with the result that considerable"down-time" is necessary to adjust the machinery Eor each different product.Suboptimally scaled plants with excessive product differentiation have beenable to compete against imports largely because of the existence of tariffprotection of 35% for the majority of imported goods. Also the installedcapacity is for middle and higher range product and the industry cannotcompete with lower quality foreign products (even at 30% tariff protection).Some restructuring of the capacity and considerable improvement in cost perunit are needed to effectively compete with imported items and to counter-balance the rising cost of imported inputs. Furthermore, some of the earliertextile mills were established by bringing in used machinery from abroad.These establishments need extensive modernization and balancing investments.Most of the smaller units should be maerged to become economic sized units.
Growth Potential and Recommendations
2.26 Given the lack of specialization and the relatively small size ofthe present textile firms serving the domestic market the rate of growthachieved during the last 5 years cannot be maintained without significantchanges in industry structure. Increasing the already high tariff protectionmay permit some further import substitution but the associated increases inprices would discourage textile exports and deter domestic demand for theseproducts as well as imposing severe costs of resource misallocation on themanufacturing sector (and the economy) as a whole. A more sensiblealternative would be to encourage greater efficiency among local producersby reducing tariffs to more moderate levels and simultaneously providingtechnical, financial and other assistance to smaller firms seeking tomodernize their operations and to increase their scale (possibly by mergers)and product specialization./l The domestic market remains small andfragmented. In the past five years the growth of domestic demand fortextiles was around 9.3% at current prices. The same rate of growth ofdomestic output can be sustained and even increased if local productionbecomes more efficient and competitive with imported goods. Garmentproducers would also benefit from reduction in the costs of their textileinputs. The Government might consider reducing the tariff gradually to 20%over a period of 3 to 4 years. Subsequently the level should be determinedin accordance with the general restructuring of tariffs proposed in Part I,Chapter VI of the report.
/1 Most of the problems highlighted in this paragraph and the suggest

-104-
2.27 The possibilities of expanding sales of Malaysian goods onoverseas markets depend importantly on the ability of the Government tonegotiate increased quotas in the USA, Norway, Sweden and the EEC countries.The USA imports about 15% of textile exports from Malaysia and quota growthcannot exceed 6.5% per year. The EEC buys 42% of Malaysia's textile exportsbut quota growth is limited to somewhere between 0.5% and 4% per yeardepending on the product. Considerable efforts should be made by theGovernment to negotiate increased quota sales to these markets.
2.28 Export quotas are distributed by the Government according topast performance and most of these are obtained by firms established inExport Processing Zones (EPZs). Not much of the national quota is left fornon-EPZ firms; this seriously limits the expansion of these firms. A companymust establish exports in nonquota markets for at least two years to qualifyfor a quota. This rigidifies the structure of the industries' export sectorand makes it very difficult for new companies to participate. A moreefficient and equitable system would result if the Government auctioned thequotas. By so doing it would gain the added advantage of appropriating allthe quota rents.
2.29 The further penetration of nonquota markets depends again onimproved efficiency and aggressive marketing. A growth rate of exportmarkets of around 7% to 8% per year is quite probable if the recommendedsteps are taken. Overall, the textile and garment subsector in Malaysia hasthe potential to continue to grow at a rate in excess of 10% per year (incurrent prices).
2.30 In view of the emerging indications of labor shortages and theneed for firms supplying both the domestic and export markets to improve theefficiency of their operations it is likely that there will be a move torelatively more capital and skill intensive production techniques resultingin greater productivity and increased wage rates. This is likely to be agradual process, however, and although employment may not increase asrapidly, relative to output growth, as in the recent past the subsector isnevertheless likely to provide significant opportunities for increasedemployment. In particular, the knitting segment of the industry and garmentmaking have substantial room for expansion; they are also more labor-intensiveand require small investments. There is also the possibility that becauseof higher labor costs some of the firms engaged in these operations will shiftfrom Singapore to the Johore area. As in the past a large proportion of theadditions to the subsector's workforce is likely to be Malays and femaleworkers.
2.31 A joint in-depth study of textiles industry by MIDF and MIDA ishighly desirable for adjustment in the subsector specific incentives and toimprove specialization or to encourage merger among smaller units. Furtherexpansion of the industry should be based on the recommendations of thisjoint study.

-105-
III. CAPITAL INTENSIVE, HEAVY INDUSTRY SUBSECTORS
A. The Fertilizer Industry
Past Growth in Production, Consumption and Trade of Fertilizers
3.01 Fertilizer consumption in Malaysia per hectare of arable land isfar below consumption in Japan, Taiwan and Korea but considerably above thatof its ASEAN partners. Malaysia's consumption pattern is peculiar in so faras the potash usage is relatively high (44% of the combined total for thethree major nutrients as compared with a weighted average of about 18 forsix other East Asian countries) /1 and the nitrogen usage relatively low(31% as contrasted with 59%). This reflects primarily the high use ofpotash (60% of total nutrients) in Malaysian palm oil plantations.Consumption of fertilizer, both by weight and by nutrient content increasedby about 9% per year between 1970 and 1975. More recent estimates ofconsumption by nutrient content are not available.
3.02 Most of the basic nutrients are imported. Valued at M$167 millionin 1978, net fertilizer imports accounted for about 1.2% of Malaysia's grossimports and was a relatively modest factor in its balance of payments.
3.03 Local production of basic nutrients is limited to an ammonia plantoperated by Esso Company using feedstocks from its Port Dickson refinery.This plant reached full capacity of 45,000 N in 1975 which was convertedinto roughly 130,000 tons of ammonium sulphate and 20,000 tons of ammoniumnitrate by the Chemical Company of Malaysia and the Federal FertilizerCompany, respectively. The latter actually has the capacity to produce70,000 tons of ammonium sulphate and will increase its output once itsinstallations for receiving imported ammonia have been completed this year.A substantial portion of the locally produced straight nitrogen fertilizersare combined with imported potash and phosphate to produce NPK granulatedcompounds or mixtures.
The Malaysian Fertilizer Market
3.04 The following table shows fertilizer consumption by main crops, in1975.
/1 Japan, Taiwan, Korea, Philippines, Indonesia, Thailand.

-106-
FERTILIZER CONSUMPTION BY MAIN CROPS - 1975(in actual nutrient content)
Total consumption Specific consumptionCrop ('000 tons) (kg/ha)
Oil palm 115 193Rubber 79 38Padi rice 32 56.5Other 31 54
Total 257 67.5
3.05 Approximately 30% each of the cultivated acreage is in largeestates or is covered by state development schemes (FELDA, FELCRA, RISDA);the remaining 40% or so is in small holdings. Whereas fertilizerapplication in the first two categories is said to be close to the financialoptimum, about two thirds of the smallholders use no fertilizers at all andmany others use less than the recommended amounts. According to one study,the potential for increased applications is not limited to smallholders.According to that source, the total application in 1975 was roughly one halfof what might theoretically have been applied with advantage./l
Import Duties
3.06 Fertilizers produced in Malaysia carry a typical import duty ofM$44.29 per ton product, independently of nutrient content. This compareswith an average c.i.f. import price in 1978 of about M$256 per ton fornitrogen fertilizer other than urea, i.e. the duty then was roughly 18%.(Percentagewise it is presumably somewhat lower today because of the recentincrease in prices for nitrogen fertilizers.). Protection at this rate hastwo disadvantages. First, it reduces fertilizer consumption below an eco-nomically desirable level. Secondly, since fertilizers which are not pro-duced in Malaysia like urea are imported free of duty, it biases the choiceagainst the domestically produced types. For this reason, it would seemdesirable to adjust the structure of tariffs or replace tariff protection bya subsidy for the domestic industry and increased use of fertilizers.
/1 Difference between actual applications and FAO/ESCAP Guidelines,aggregate for all crops. MIDF, Economics and Market Research Unit,"Fertilizers" (September 1979), Annex VII. The study stresses that thisis only a very crude indication of the potential for increased use.

-107-
Production Plans
3.07 In view of Malaysia's extensive hydrocarbon resources, it isnatural that prospects for producing ammonia and urea should have beenconsidered. A Malaysian project for the production of urea has beenaccepted by the ASEAN Regional Industrial Cooperation Group as one of thefirst five industrial projects susceptible of implementation as a regionalproject. In this respect, it is preceded by a similar,Indonesian ureaproject. The Japanese International Cooperation Agency, (JICA) hasevaluated these two projects for financing by the OECF and the EXIM Bank ofJapan and has already established the feasibility of the Indonesian projectand the Malaysian./l The Indonesian project is scheduled to go on stream by1982 and the Malaysian project by late 1984.
3.08 The Malaysian plant would be located at Tajung Kidurong on Sarawaktaking advantage of the local availability of natural gas and would have acapacity of 1,000 tpd of ammonia of which 900 tpd would be converted into1,500 tpd of urea and the remainder sold as ammonia. The plant would beowned and operated by Petronas, the State Petroleum Corporation. Accordingto a preliminary estimate, the total investment would be about $300 million,Malaysia, providing 60% of the equity. Fifty percent of the output would befor Malaysian account. This offtake is intended for the domestic market andfor non-ASEAN exports.
Consideration of the Sarawak Project
3.09 The main issues with respect to this project are the market andthe economic return.
Market Projections
3.10 The quantities to be set aside for Malaysia (50% of the total) areexpected to exceed domestic market growth, even if application rates inMalaysia approach their optimum level./2 The plant would therefore
/1 According to more recent information, a consultancy contract for thedesign and construction of the plant has now been awarded.
/2 As noted in the following section, it is also pertinent to recognizethat a plant located in Sarawak would, because of high freight cost toPeninsular Malaysia, essentially be in the situation of an exporter tothe main Malaysian market.

-108-
have to sell substantial quantities of urea for exportover and above the quotas which would be taken up by Malaysia's partners inthe ASEAN region. The market for such nonquota exports in the ASEAN regionis highly uncertain in view of the established position of Indonesia and theplans of Thailand to use natural gas for ammonia production. On the otherhand, a Sarawak plant would be well located in relation to the Chinesemarket which is expected to import substantial quantities of nitrogenfertilizers for several years to come. Whether or not Malaysia will be ableto turn these opportunities to its advantage will depend essentially uponthe competitiveness of the projected Sarawak plan in relation to rivalsuppliers to the Chinese market. While the overall urea supply does notlook worrisome, the question of increased fertilizer application anddisposition of the exportable surplus should be given adequate attention bypolicy makers.
Prospective Economic Return
(a) General Considerations
3.11 The economic returns from the proposed Sarawak plant would dependupon the average realization on home and export sales in relation toproduction costs. In view of the location of the plant away from PeninsularMalaysia where the main domestic market is located, a Sarawak plant would bevery much in the same position as an export plant and, for a firstapproximative view of its competitive outlook, we shall compare it withother export plants.
(b) The Opportunity Cost of Natural Gas
3.12 The most economical alternative to using natural gas in fertilizerproduction on Sarawak would appear to be export of liquified natural gas toJapan. A Sarawak plant would appear to have no net advantage ordisadvantage over an Indonesian plant with respect to the opportunity costof its natural gas. Compared with a Persian Gulf plant, however, therewould be a net disadvantage (i.e. higher opportunity cost) of at least US$35per ton of urea due to the freight advantage on export of LNG to Japanassociated with a Sarawak plant.
(c) Ocean Freight Rates for Ammonia and Urea
3.13 When exporting urea to Japan, a Sarawak plant would have a freightcost advantage over plants in the Persian Gulf region of an estimated US$13per ton of urea. Once adequate port facilities were available, the freightwould presumably be roughly the same as from an Indonesian plant.
(d) Charges against the Investment and Other Operating Costs
3.14 There are four principal reasons why the charges against theinvestment in developing countries, particularly in remote locations, arelikely to be higher than in industrialized countries:

-109-
(i) At the limit, all infrastructure, both industrial and social,will have to be provided.
(ii) Quite apart from additional infrastructure, the same facili-ties will cost more in a remote and underdeveloped area,reflecting the lack of local resources, the greater need forexpatriate labor, the higher inbound freights, the longerconstruction period and the greater contingencies. Workingcapital requirements (e.g. raw materials inventories andstores of spare parts) will also be higher.
(iii) It will take a longer period before the plant can be run atfull capacity and before a uniformly high quality of theproduct can be achieved.
(iv) The required return on the investment is normally higher in adeveloping country.
3.15 The proposed Sarawak plant would be disadvantaged in respect ofits remote location and the absence of infrastructure, except that theremight be some infrastructure common to the LNG plant at Bintulu. In thisrespect, the Bintulu plant would apparently be very similarly placed as thefirst ASEAN plant under construction in Northern Sumatra in proximity toanother LNG export plant.
3.16 As compared with a plant in the Persian Gulf region, both ASEANplants would have higher costs for gas. The charges against the investmentare also likely to be somewhat higher. Whereas the plant within batterylimits might well be less expensive, infrastructure costs for most producersin the Persian Gulf area have been heavily subsidized and are unlikely to befully reflected in the fertilizer price. Finally, the required return onthe investment would be much lower in places like Saudi Arabia and Kuwaitwith enormous surpluses of investible funds. The cost disadvantage for aSarawak plant as compared to a Persian Gulf plant would be even greater forsales to Western Malaysia than on sales to China since the transport situa-tion would be less favorable. The estimates presented in the Table in thefollowing section were based on rough orders of magnitude at various loca-tions for 1650 tpd urea plants./l The comparisons are illustrative only.
Conclusion
3.17 Summarizing the above discussion, it appears that proposed Sarawakplant might suffer from the following net cost disadvantage in export salesto Japan and perhaps a similar disadvantage in sales to Peninsular Malaysia:
/1 For a plant of smaller scale, cost calculations, could on balance beeven more unfavorable.

-110-
POSSIBLE COST DISADVANTAGE FOR A MALAYSIAN PLANT COMPAREDWITH A PLANT ON THE PERSIAN GULF
US dollars per ton of urea
Natural gas 35Operating costs -5Charges against investment 35Ocean freight -13
Total 52
3.18 If the above figures portray the situation correctly, economies ofthe urea plant would have to be monitored more carefully. Nevertheless,apart from any difference in view as to the values assigned to basicparameters, one should perhaps also consider the possibility of a differentscenario for the future world market. Clearly, there is a shift in thecenter of gravity of production towards countries with vast reserves ofnatural gas. Naphtha is becoming very expensive as a feedstock and former.exporters of nitrogen such as Western Europe, Japan, and the United Statesare now becoming importers of ammonia and urea or, at best, will havesharply reduced export surpluses. Many older plants or plants with anexpensive source of hydrogen have been forced to close. It will takeconsiderable time to build those new facilities in developing countrieswhich will be necessary to complete the process of readjustment.Conceivably, we could face a more or less extended though transitory period,during which world prices would be above their equilibrium level therebyallowing higher cost plants such as that under consideration on Sarawak tooperate profitably for a period./l This is not necessarily the mostplausible scenario but it is a relevant subject for further study.
/1 This period of profitability would depend on the rate at whichothers, possbily lower cost, developing producer countries wereable to bring on stream new capacity.

-111-
VII. The Steel Industry
Production, Consumption and Trade
3.19 Data on steel production and consumption are only intermittentlypublished in Malaysia. The following statistics are from internationalsources and from information supplied by MIDA.
PRODUCTION, TRADE AND APPARENT CONSUMPTION OF STEEL('000 tons)
Domestic productionImports Bars and rods Galvanized sheets Welded pipes
1965 2481970 2921973 5111974 6251975 4171976 495 181 56 581977 (671)/a1978 (66O)7a 240 60 85
/a Preliminary estimates of "finished" steel imports.
3.20 To devise estimates of apparent domestic consumption of steel, itis necessary to net out imports which are further processed in Malaysia.Assuming imports similar to the 1977 level, the net domestic consumption ofsteel in 1978 would have been about 677,000 tons./l
3.21 The composition of consumption may be judged approximately byadding domestic production to imports. This gives the following picture,assuming as before that 1978 imports were the samie as in 1977. Japansupplied 450,000 tons out of the total 1977 steel imports of 486,000 tons.
/1 49,000 tons of imported ingots and semis was used to produce about40,000 tons of bars, rods and sections. Some 60,000 tons of galvanizedsheet were made from imported blacksheets and 85,000 tons of weldedpipe were made from imported tube strip. Processing losses for theselatter products are neglected in this rough calculation.

-112-
STEEL SUPPLY BY SOURCES('000 tons)
Domestic Net supplyImports Output of finished steel
Ingots and semis 49 - - /aBars and sections 89 }Wire rods and wire 70 } 240 399Plates 65 65Sheets and strip 154 60 69 /aTinplate 44 44Tubes and fittings 14 85 99Other 1 - 1
Total 486 (292)/a 385 677 /a
/a Imported ingots and semis (49,000 tons) for domestic conversion intobars, rods, and sections and imported black sheets and tube strips fordomestic conversion into 60,000 tons of galvanized sheets and 85,000tons of welded tubes are excluded from net supply to avoid doublecounting.
The Existing Industry
3.22 There are six steel mills operating in Malaysia with a combinedmelting capacity of 262,600 tons and a rolling mill capacity of 440,400tons. The dominant and only fully integrated producer, Malayawata, accountsfor 180,000 tons of melting capacity and, in 1978, produced about two thirdsof the country's total production of bars and rods of 240,000 tons./l Therest was produced by small rerollers. Other establishments, as alreadynoted, produced 60,000 tons of galvanized sheets from imported black sheetsand 85,000 tons of welded steel pipe from imported strip.
3.23 Malayawata went into operation in 1967 with an initial capacity ofabout 65,000 tons of rolled products. Nippon Steel originally held 58% ofthe shares and IFC contributed both equity and loan funds. Iron is producedin small charcoal furnaces using local iron ore and charcoal from overagerubber trees. Steel is made in 16 ton B.O.F. furnaces. This makes
/1 In 1979, production of bars and rods totalled 343,476 tons.

-113-
Malayawata the smallest integrated steel producer in the world; only therolling mill is of conventional size.
3.24 In 1977 and 1978, the company earned net profits of respectively12.9 and 12.7% of the book equity. This must be considered satisfactorysince no corporate taxes were payable in view of unabsorbed capital allow-ances; dividends were also free of tax. Fixed assets, excludingconstruction in progress, were carried on the books at a net value of about$180 per ton of finished steel produced - prima facie (i.e. without allowingfor possible obsolescence) a reasonable valuation.
Government Controls
3.25 The present domestic price for steel bars and rods is about M$700per ton which is said to compare with a present import price of about M$800per ton (US$364). Imports are controlled as are steel mill prices, and oneis confronted with the strange spectacle of a Malaysian steel shortage andblack market prices in the face of a world surplus of steel and no shortageof foreign exchange in Malaysia. A study of the pricing policies andpossibilities of import liberalization are clearly indicated in thisrespect.
Development Plans
3.26 The future development of the steel industry in Malaysia has beenstudied by foreign consultants; this study has been under way for severalyears. An intermediate report (dated 1976) recommended the installation ofan integrated steel mill for the production of flat products. TheGovernment wisely decided to defer this project to the indefinite future.However, it is still looking at the possibility of producing flat productsby installing a cold rolling mill which would be based on imported hotrolled coils. It is also focussing attention on additional production ofnon-flat products and on additional metallurgical capacity, with ironsupplied as direct reduction (sponge) iron rather than charcoal iron. Anadditional merchant direct reduction plant of 0.6 million tons per year ofspong iron has been included in the development plan of Malaysia.
3.27 Malaysia possesses abundant resources of natural gas which is thepreferred fuel for the direct reduction process. The Government istherefore exploring the possibilities of building either a 0.6 or a 1.2million tons sponge iron plant to be located near the natural gas fields ofEastern Malaysia (Trengganu) or, alternatively, on Sarawak (Bintulu). Amill of the smaller size would cost about US$120 million (at 1978 prices)and a preliminary price for the sponge iron of about US$120 per ton has beenmentioned, based upon a natural gas price of US$1 per million BTU. Underone alternative, the direct reduction plant would be integrated with anelectric furnace and a continuous casting installation to produce billetsfor Malaywata and other existing or approved new plants.

-114-
3.28 According to MIDA, the Government has licensed seven new rollingmills with a combined capacity of 630,000 tons per year, of which two arepresently being implemented and would start operations in 1982/83. Amongthe approved projects not yet implemented is Malaywata's proposed secondrolling mill with a capacity of 230,000 tons at an estimated cost of aboutUS$ 100 million. The company is understandably reluctant to undertake thismajor new investment without clear signals as to future billets supplies andpermitted prices.
The Future World Price
3.29 A critical factor in appraising the economics of steel expansionin Malaysia is the future course of world prices. A number of observationcan be made in this context.
(a) World export prices for steel have historically been very lowin relation to full production costs in major exporting countries.However, Japan, has emerged as the undisputed world leader interms of production growth and price competitiveness. It isreasonable to assume that future world market prices will bedetermined by Japanese production costs including a reasonablereturn on investment.
(b) In spite of recent huge financial losses in the Western Europesteel industry, there is sufficient flexibility in the worldindustry to respond to increases in world demand. Temporary steelshortages and periods of high prices must be expected, such ashave been triggered in the past by transitory stringency ofsupplies reinforced by speculative inventory accumulation. Yet,as in the past, these are likely to be of short duration.
(c) The greater degree of concertation between major steel exportingcountries and their governments will help to modify price erosionin the downward cycle. By the same token, the steel companiesmay find it difficult to increase prices in the upward cycle astheir profits improve drastically with improved capacityutilization. Excessive profit inflation may not be tolerated bygovernments which have subsidized steel industry reconstructionand by consumers who have borne the burden of protection andadministered pricing.
3.30 In conclusion, the world steel market will remain highly competi-tive with prices determined by the low-cost Japanese steel industry.
Comparison of Costs from a New Plant inMalaysia with Import Prices for Japanese Steel
3.31 The Malaysian government has indefinitely postponed decision onthe production of flat products. There are two compelling reasons why
-115-
Malaysia should not consider integrated production of flat steel products.First, the Malaysian market is diminutive in relation to the capacity of aneconomic size flat products mill. Second, the investment cost per ton ofsteel capacity for a new integrated flat products mill would be a multipleof the investment cost likey to be reflected in the world steel price.During the last decade a tremendous gap lhas opened up between the averagecost of existing steel industry installations (net fixed assets atreplacement cost) and the cost of new greenfield plants. In the major steelproducing nations, existing plants had an aggregate net replacement value ofless than US$200 per ton of crude steel whereas the corresponding cost of anew greenfield plant was estimated at about US$1,000 per ton.
3.32 These disadvantages are not of the same order of magnitude whenconsidering a "mini-mill" for the production of bars and rods or,conceivably, as a separate propositon, for the production of seamless tubesaimed at the ASEAN market (only the first proposition will be consideredhere).
3.33 The mission did not have access to information on the likely costsof sponge iron, continously cast billets or finished bars and sections fromprojected new facilities in Malaysia. Such information is expected to beavailable when the study by the Japanese International Cooperation Agencyhas been completed. Mleanwhile, certain rough orders of magnitude ofinvestment and production costs may be derived from data on other plantsrecently commissioned or under consideration. On this basis, the missionestimated that the basic cost for bars and rods, f.o.b. works at Malayawatawould be around US$407 per ton /1.
3.34 The mission had no opportunity to study the actual prices paid forMalaysian steel imports in the past. However, we assume that, because ofMalaysia's proximity to Japan and because its annual imports of about500,000 tons represent a sizable volume for any individual exporter tocompete for, the future Malaysian import price would be equal to thestandard Japanese export price plus normal freight.
3.35 Judging from financial statements and other data, the Japanesesteel industry might have been able to earn a normal profit at 90% capacityutilization at a composite price level of about US$390 per ton of finishedsteel under conditions ruling in the first quarter of 1979. Based uponcurrent differentials, this translates into a base price for reinforcingbars of the order of US$300. The corresponding duty free price intoMalaysia would be of the order of US$335 per ton. On this preliminarycalculation, therefore, Malaysian production from a new plant would beperhaps 20% more expensive than imports.
/1 Details of these cost estimates are available in a separate WorkingPaper.
-116-
The Future of Iron Production at Malayawata
3.36 Whether or not the Government decides to increase steel production
in Malaysia, a question must be faced regarding the long-run viability ofthe present metallurgical installations at Malawayata. Supplies of charcoalare becoming increasingly expensive and scarce and have to be eked out with
more expensive imported coke. There is also a very serious problem of dust
pollution from the charcoal iron furnaces. At the same time, since theMalaysian deposits of highgrade export ore are virtually exhausted,low-grade ore has to be trucked from Eastern Malaysia. We recommend that a
study be made of the gains in output and the possible lowering of costswhich would result from using high-grade imported ores even though costingmore rather than domestic ores for producing iron at Malayawata.
3.37 If a direct reduction plant is built in Malaysia, it wouldprobably be appropriate on both economic and environmental grounds toreplace the production of charcoal iron at Malayawata with purchased D.R.iron. However, the BOF steel furnaces are dependent upon the supply ofliquid iron. Hence, either the BOF futnaces would also have to be replaced
by electric furnaces or production carried on as today with only theadditional steel supplied from electric furnaces or in the form of purchased
billets.
3.38 In conclusion, there is an urgent need for a study of the locationof additional steel making and steel rolling capacities - whether at
Malayawata or integrated with a direct reduction plant. There would belarge transport distances for sponge iron if the steel furnaces were builtat Malayawata but this might be more than offset by the advantages of an
established organization, lower infrastructure costs, better access toskilled labor and easier distribution. Additional rolling mill capacity,one imagines, could also be brought into operation at Malayawata far more
quickly than at a new site. The proposed study should look at thosequestions rather critically.