report no. 714w-h the philippines the challenge of...
TRANSCRIPT

Report No. 714W-H
The PhilippinesThe Challenge of PovertyOctober 17,1918
Country Department IIAsia Region
FC)R OFFICIAL USE ONLY
Document of the World Bank
This document has a restricted distribution and mav be used by recipientsonly in the performance of their official duties. Its contents may not otherwisebe disclosed without World Bank authorization.
Pub
lic D
iscl
osur
e A
utho
rized
Pub
lic D
iscl
osur
e A
utho
rized
Pub
lic D
iscl
osur
e A
utho
rized
Pub
lic D
iscl
osur
e A
utho
rized

CURRENCY EQUIV4LENTS
Average 1987 - US$1.0 = P20.568P1.0 = US$0.05
Average 1986 - US$1.0 - P20.4P1.0 = US$0.05
Average 1985 - US$1.0 = P18.6P1.0 - US$0.05
ARI........................ Acute Respiratory InfectionsBHS ........ Barangay Health StationBIR. .... Bureau of Internal RevenueBNS .......... Barangay Nutrition ScholarBSP. ........ Barangay Supply PointBSPO.... ...... . Barangay Service Point OfficerCARP.. * ........... . Comprehensive Agrarian Reform ProgramCEDP .........t........... Community Employment Development ProgramCHMS ....... .............. Community Health ?aintenance SystemCPO ...................... City Population OfficerDAR ............. . Department of Agrarian ReformDOH ........................ Department of HealthDPO .......**se............. District Population OfficerDPWH. .... Department of Public Works and HighwaysFIES....................... Family Income and Expenditure SurveyFNRI........ses............ Food and Nutrition Research InstituteFTOW... .................., Full-time outreach workerHMO**... ................. Health Maintenance OrganizationHSMS ...................see. Household and School Matching Survey (HSMS)ISH ......... see,.....0... Integrated Survey of HouseholdsMCH-s. ................... Maternal and Child Health CareMW'. ................ o..... Married women of reproductive ageNCEE.... ................. National College Entrance ExaminationMEC*.. ................. . Ministry of Education and CultureNCR... ......... M National Capital RegionNCk9........................ National Census and Statistics OfficeNGO... ............ oo.... Non-governmental organizationNEDA. .................... National Economic Development AuthorityPOPCOM..... ..... *.. -... Poptlation CommissionPPO... ......... . Provincial Population OfficerPRODED,.. ........... Program for Decentralized Educational DevelopmentRDA ....................... Recommended Daily AllowanceRHU .......- *. ......... *9. Rural Health UnitSUC .................... State Universities and CollegesTTR . ......... Total Fertility RateTWG ......stes............ Technical Working GroupVHW ... . .. ..... Voluntary health worker

FOR OMCIAL USE ONLYPHILIPPINES:
THE POVERTY CHALLENGE
Table of Contents
Page No.
SUMMABY AND CONCLUSIONS
I. WHO ARE THE POOR AND WAY ARE THEY POOR?........................ 1
Ao The Poverty Probleme................................... .....- 11. The Incidence of 1...................................... 12. Unequal Income Distributione........................... 53. The Core Poor.......................................... 8
B. Why are they Poor?.... ..................................... 121. Unequal Ownership of Assets...o....o..o................ 122. Population Growtho...........0......0..0...00..0...000...0.....0.000. 133. Lack of Employment Generation.......................... 13
II. PUBLIC POLICY AND POVERTY ALLEVIATIONoo....ooo................. 16
A. The Impact of Macroeconomic Management..................... 161. Growth and the Incentive Framework .....................o 162. The Philippines Stabilization Experience............... 173. The Impact of the Adjustment on the Poor............... 19
B. Tax and Expenditure Policieso... oooo....................... 221. Tax Iniec .........................--222. The Composition of Government Expenditures ............. 25
C. Land Reform and Rural Development............................ 31
Do Population Plc ............................ 35
E. The Social Sectors............................... ... ...... . 361. Health and Nutritional Policies........................ 362. The Education System and Poverty......................-- 38
This report is based on the findings of a mission which visited thePhilippines in September 1987. The report was prepared by Isabel Guerrero(mission leader), Guillermo Hakim, Ruth Klinov, and Luis Riveros, from theBank; Mario Blejer (IMF); Jose Pablo Arellano and Alex Herrin (consultants).Contributions were also made by Albert Berry, David Rosenberg, Je-Pee Tang,and Vic Paqueo. The report was prepared under the general supervision ofNorman Hicks. Background papers were prepared in the Philippines by ManuelMontes and Orville Solon ftom the University of the Philippines.
r This document has a restricted distribution and may be used by recipients only in the performanceof their official duties. Its contents may not otherwise be disclosed without World Bank authorization.

- ii -
Page No.
III EWPLOYMENT AND POVERTY......................................... 40
A. Labor Market ........... ................................... 401. Labor Supply and Unemployment......................... 40
B. Poverty Implications of Existing Unemployment andUnderemployment .................. Sees...... ............ 44
C. Characteristics of Labor Etenings .......................... 461. Evolution of Real Wages and Von-Wage Costs.............--- 462. Determinants of Wagesg... . ...... ..................... 493. Labor Earnings and Poverty v e r ty........................ 5o
D. Employment Prospects and Directions........................ 51
ANNEX 1: The Empirical Data ... 54
IV. POPULATION POLICIES IN THE PHILIPPINES................. 57
1. Recent Treends. 572. Family Planning Service Delivery...**.*.*.*e***.*. . -*** 613. Alternative Population Futures.......... e.e.. ...... 634. Issues and Recammendations...-...--.*.o --.. *-.......- -e 65
V. EQUITY ASPECTS OF THE PHILIPPINE EDUCATIONAL SYSTEME............ 6q
A. The Incidence of Educational Services......................** 681. Characteristics of the Educational System.............. 682. The Incidence of Attendance Rates*.********............ 703. The Quality of Schooling...........................e.***. 724. The Incidence of Tuition............................. 75
B. Returns on Investment in Education........................ 76
C. Policy Implications of the Incidence Analysis.............. 78
Do Financing .............. 791. Public Expenditures .............. *. *..e..*-****.****** 792. Privatization.... *---0- - v **-- - - - *- 80
VI. HEALTH AND NUTRITION POLICIES ...................... 81
A. Health and Health Care...................... 811. Health Status ........................... 812. The Health Care System...........................--.- 873. Current Approach of DOH and Recommendawtons............ 94

-iii. -
Page No.
1. Current Situation..................................e 1012. Nutrition Policies and Progrlaog........................ 1093. Recommendations ..........................e-*eeo e*--e*-oo log
STATISTICAL APPENDIX ........... ...................... ......... o 112
MAP
PREFACE
This report looks at the poverty problem in the Philippines, basedon the findings of a mission which visited the country in September 1987. Thereport finds that the number of poor families has increased since 1971 whilepoverty incidence has remained unchanged. The main areas for policy actionidentified in this report are land reform, family planning, productivityimprovements, taz policies, and education, health and nutrition expenditures.
The analysis in this report is limited to the 1971-85 period sincemost of the data available at the time of the ,ission, particularly the FaailyIncome and Expenditure Survey, only covered that period. The National Censusand Statistics Office (NCSO) is currently preparing a new household surveywhich will be a valuable source of information on changes in poverty andincome distribution since 1985.
A number of developments have taken place after the mission visitedthe Philippines in September 1987. The government has prepared an UpdatedMedium Term Plan for the 1988-89 period. This plan addresses many of theissues discussed in this report, with particular emphasis on improving localparticipation through greater decentralization, on expanding social sectorprograms, and on land reform as a vital means of addressing the povertyproblem. The Plan recognizes that the ke!r to human development is employmentgeneration and the provision of social services, with emphasis on the rur.'aland urban poor.
Nev policy directions have also begun in the social sectors,particularly in the Department of Health (DOH). The health budget has beenexpanded in FY89 and a large share of these resources is going to high impactprograms which directly benefit the poor. Budgeting and procurementmonitoring are now done at the local level and the Department of Health is inthe process of establishing link with Non-Governmental Organizations in orderto obtain a more effective delivery system to the commnunities. The ExecutiveBranch has placed the population problem on the agenda and a population planis now under preparation.
All these are encouraging developments which lay the basis fortackling the poverty problem in the future. Although the current economicrecovery has probably improved the living conditions of some of the poor,continued government action in this aLea will remain a crucial concern inPhilippine economic development.

SUMMARY AND CONCLUSIONS
Overview
With the Philippines on its way to recovery, it is now time toconcentrate efforts to address the long standing and growing povertyproblem. In 1985 more than 30 million people out of a population of 56million were living in poverty, in V4e sense of having an income that did notenable them to satisfy basic needs.._' This represents a worsening of thesituation from 1971. Using comparable definitions, in 1971 the incomes ofabout 3 million families were insufficient to meet basic needs; in 1985 thefigure had risen to 5 million families. Although the proportion of poor hasremained unchanged, an additional 10 million persons have been recruited intothe rcnks of "the poor", Just as a result of the expansion in populationduring the period. In this context, a larger amount of resources andattention in policy taking shouid be shifted to address the poverty problem.
The outlook for the future is equally troubling. Every year over700,000 new entrants join a labor force that already contains about 6 millionunderemployed or unemployed workers. This labor force will be expanding evenmore dramatically in the future because of the failure to adequately addre4sthe population problem facing the Philippines. The employment issue cannot beevaded; much of the future labor force has already been born, about 16 millionnew entrants will join the labor force in the next 15 years and it is notclear where these additional job-seekera will be absorbed. During 1980-86 thelargest employment generators, namely agriculture, services, andmanufacturing, created jobs for equivalent of less than two years' of newentrants to the labor force.
This Report describes some aspects of the poverty problem in thePhilippines and analyzes the reasons for its growth. Since poverty haspolitical and sociological dimensions beyond the scope cf this report, theanalysis presented here is only a contribution to the formation of an overallpoverty strategy. The main theme of the Report can be briefly summarized asfollows:
(a) in view of the maldistribution of assets, rapid labor force growth,high levels of underemployment and already extensive poverty, thePhilippines will have to make major efforts just to keep the povertyproblem from worsening;
(b) rapid economic growth will help alleviate the poverty problem, butthe type of growth and quality of economic management is also offundamental importance;
1/ Estimated at P5,010 per capita for urban areas and P3,759 per capita forrural in 1978 prices.

- ii -
(c) while it is impossible to articulate a strategy that will solve theproblem once and for all, there are a number of positive steps thatthe Government can take to alleviate the worst aspects of poverty;this will require political will, adequate resources, anddecisiveness in policy-making. Areas for policy action include:
- land reform and rural development;
- population policy and family planning;
- productivity improvements;
- public expenditure and tax policies; and
- the education, health and nutrition expenditures.
The Poverty Problem
Characteristics of the Poor. About 702 of all poor families live inrural areas, the majority of these are small farmers involved in corn, rice orcoconut production, with corn farmers being the poorest. However, even amongfamilies that derive most of their income from farming, wage income is animportant complementary source: around one million of the poorest farm fami-lies derive most of their income from wages. Low-income agricultural familiesare characterized by high levels of underemployment, small farm size, largefamily size, limited use of modern technology, and low levels of education.The majority of poor farm families do not own the land they till, or cultivateother farms as tenants or leasors in addition to their own. Most poor farmersdo not use fertilizers and pesticides, dtc not have access to irrigation, norhave access to credit. More than one-third of the rural poor ha-we not com-pleted elementary school, while another tenth have never attended schools.
Although the largest concentration of poor families is in the ruralareas, the urban areas also suffer from widespread poverty, especially inmetro Manila. Low income urban families live in precarious housing and incongested conditions, and lack basic facilities such as water and electricity.More than half of the urban poor in metro Manila are employed in the informalsector, with a high participation of women and children, and a relativelysmaller proportion of their income coming from the household head. Most ofthese workers meet their capital requirements through self-financing or infor-mal lending. A high incidence of squattiag results from the poorer familieshaving to live closer to work centers, since transport costs are an importantproportion of their expenditures. The situation of the urban poor is worseoutside Manila in terms of income, open unemployment, educational attainment,health care, and access to housing facilities.
Poverty Group Identification. The methodology for identifying po-verty groups suffers from both conceptual ambiguities and data problems. Itis therefore not surprising that differences should appear in statisticalexercises to estimate the proportion of the population in "poverty". Absolutepoverty measures take a basket of goods and services as the means of estab-lishing an income minimum. Secular comparisons require precise price tracking
- iii -
of this bundle over time. Official stitistics show a rise in those below the
poverty line between 1971 and 1985. Bank estimates show this proportion to be
roughly constant, but in either case between 521 and 581 of the Philippine
population is identified as belonging to the poverty group using this broad
definition of minimum purchasing power.
For policy purposes, and to facilitate international comparisons, a
more restrictive poverty measure, a subsistence income line, was estimated,
taking minimal food intake as the main indicator. This more restrictive
definition yields a core poverty group of 281 of the populotion in 1985 (com-
pared to 351 in 1971). The interesting finding using this measure is that the
proportion of core poor although higher in rural areas has been reduced much
more rapidly in rural areas compared to urban areas. While this finding could
be a result of the urban-rural definition, migration, or more likely the
greater needs of the urban population to purchase food, the statistics show a
2 percentage point reduction in the urban poverty incidence (from 20% to 181)
and a 7 percentage point reduction in the rural inciden;ce (from 421 to 35%).
Policymakers may wish to use the bottom three deciles of the
national income distribution as a possible working definition of the core
poor. This roughly coincides with the proportion fully below subsistence.
The core poor would number 15 million - 4 million urban and 11 million
rural. Their number is rising in line with population growth trends. Given
an eetimated population growth rate of 2.51 tor the lowest income groups, the
core poverty will be expanding by 400,000 people every year. This would
require significant real national income growth, substantial employmect gene-
ration, and increases in transfers to the core group.
Income Distribution. The Philippines has one of the most unequal
income distributions among middle-income countries; in 1985 the top 10% of the
population had more than fifteen times the income of the poorest 101. The
Philippine income distribution appears particulaly unequal when compared with
some other developing countries in the region. Inequality of income after
taxes is also much worse when compared with similar indicators in other coun-
tries, since revenue collections in the Philippines are regressive. There are
also major disparities in incomes between rural and urban areas. The absolute
level of rural income is, on average, less than half the average urban income.
The disparity has remained virtualy unchanged over the last 25 years; rural
incomes are now 471 of average urban incomes as compared with 40% in 1961.
While there is some evidence of a small aggregate improvement in the distribu-
tion of income over the 1971-85 period, the gains are modest and are oversha-
dowed by the large absolute additions to the core poor group.
Why are They Poor?
The growing number of poot and the persistence of income inequality
is a result of three structural factors: unequal asset ownership, particular-
ly land, population growth, and the lack of productivity growth. In addition,
economic policies had an anti-poverty bias in areas such as price policies,
credit allocation, fiscal policy and government intervention in productive
activities. Such policies were also detrimental to sustainable growth and led
the Philippines into a debt crisis by 1983, when the need of adjustment could

- iv -
not be postponed anv longer. The adjustment program had an additional nega-tive impact on poverty, since by 1985 personal income had dropped below 1971levels.
The distribution of land is more skewed than the distribution ofincome in the Philippines. More than half o0 the farms in 1980 occupied 16%of farm area, while less than 4% occupy over one fourth of the land. In addi-tion, a very high proportion of land operators are tenants and not landowners.
One of the major factors explaining the increase in poverty in thePhilippines has been the failure to decrease fertility rates. The rapidgrowth of the labor force has had a depressive effect on real wages; in therural areas the growing population pressure on land haa resulted in theimpoverishment of a large proportion of the population. At the householdlevel, the presence of more children in poor households has lowered thefamily's capacity to save. Since higher income families not only have fewerchildren but also invest heavily in their human capital, population growth hasalso been translated into increasing income inequality.
The trends in the labor market show the weak contribution of pastgrowth strategies to poverty alleviation. Higher underemployment and unem-ployment, combined with declining real wages and labor earnings have resultedin a larger number of poor. Underemployment in the 1980's more than doubledwith respect to the previous decade, and real wages have been constantlyfalling since 1960 Aor both skilled and unskilled workers.
The developments in the labor market are a reflection of both under-lying produ-.ivity trsnds and the rapid growth in the labor force. Total fac-tor productivity growth in manufacturing was negative throughout the seven-ties, and output labor ratios for the whole economy increased only slightly inthe 1971-83 period. The small increase in overall labor productivity, how-ever, did not increase labor's share of output. The combination of fastgrowth labor supply and small productivity gains, explains why real wages fellthroughout the 1971-83 period. After 1983, there was an additional increasein unemployment and underemployment a, a result of the drop in economic acti-vity and the cut in investment that -t place during the government's stabi-lization program.
Framework of Policj Intervention
The past fifteen years show that poverty needs to be attacked in itsstructural basis and that an outward-looking growth strategy is a criticalcomponent of a sustainable program to reduce poverty. The government must re-distribute land, provide an effective program of family planning, and facili-tate the development of human capital among the poor. Any strategy that ig-nores these elements will fail to get to the core of the poverty problem inthe Philippines. The Government can also take steps that have an immediateimpact on the poor through expanding expenditures on poverty-oriented socialsectors, reforming the tax system to become less regressive dnd to generatemore resources, and promoting an employment-oriented, more productive patternof growth.

- v -
Macroeconomic Management and Policies with a Short Term Impact
A number of the government policies which led to the 1983 crisis
were also contributing to the poverty probelm. Some affected the poor through
providing incentives to transfer resources out of agriculture, the main income
isource for most poor families in the Dhilippiens. Returns to agriculture were
badly battered by price controls, export taxes and levies, and an overvaluedpeso. The resulting decline in a&ricultural terms of trade was especially
prejudicial to the incomes of small farmers. Other policies affected the poor
through introducting a bias against the use of labor. Regulated interest*ates and subsidized credit programs, for example, favored capital intensiveprojects and higher-income groups with greater access to rationed credit.
The eventual need to deal with the debt crisis also had a serious
impact on the poor. The 1983-85 stabilization process led to a sharp incrase
in underemployment and a drop in real GDP per capita to 1975 levels. If the
adjustment had been accomplished through a greater reliance on the exchangerate and supply enhancing policies, and if fiscal adjustment had been achieved
by increasing tax collection and changing the composition of public expendi-
tures, the incomes of the poor could have been sheltered more successfullyduring this period of severe adjustment.
The poor were mainly affected by increasing underemployment and in-
flation. Increases in underemployment have the strongest effect on thoseworkers that have the least specific skills and, therefore, are the first ones
to become underemployed when aggregate employmen; falls. In the Philippines,underemployment had the largest negative impact on the share in total income
of the lowest two quintiles in the Philippine economy. The poor also suffered
from the surge in inflation since they pay most of the inflation tax. Both
the urban and rural poor cannot protect their incnme from inflation bec.ause
they do not have indexed wages, and they seldom iicwe assets that keep their
real value in times of inflation. Inflation was found to be a regressive tax
since it lowered the incomes of the lowest six deciles, while increasing the
incomes of the highest two deciles.
In the future, the large social cost of output contraction and grow-
ing underemployment should be kept in mind by policymakers. Poverty can be
reduced both through higher growth and by increasing the employment content of
such growth. Increases in productivity appear, in fact, as the most pro-
gressive way of achieving higher employment and potentially raising the income
share of the poor. Cautious macroeconomic policy will also help in that it
will make large adjustments unnecessary. However, whenever adjustments are
required they should be planned keeping both the medium term and employment
objectives in mind. In the past, for example, real devaluations have had a
positive impact on the income share of the lowest four deciles of the popu-
lation, since the poor are mostly involved in the production of tradables.
Policies with Medium Term Impact
One of the most urgent task for policymakers is to increase the
employment content of growth, since this is the basic mechanism by which the
benefits of good economic performance reach the poor. The government has

- vi -
already implemented a number of reforms which will have a positive impact onemployment generation in the medium term. The completion of the removal oftrade restrictions will, increase net employment generation through the expan-sion of exports and agricultural activity. The removal of price controls onagricultural products will also have a positive impact on agricultural produc-tion. The bias against labor intensive activities has also been substantiallyremoved through the interest rate liberalization and the removal of fiscalincentives for capital use.
Fast productivity growth is the only way for new entrants to thelabor force to be absorbed without further drops in real wages. There seemsto be ample room to improve productivity through interindustry shifts. Theelimination of the Major Industrial Projects is one important step which hasalready been taken by the new government. Further steps in trade liberaliza-tion are also crucial, specialiy given the fact that in the past the largestprotection was provided to inefficient industries with low total factor pro-ductivity growth. The privatization of government corporations involved inproduction is another potentially significant step in helping to improve pro-ductivity in manufacturing. Support to research and development, and adapta-tion of technology, are the best ways for the government to contribute to longterm productivity improvements. In the short run, tie government's majorcontribution could be in the area of training.
Tax and Expenditure Policies
For the most part, the system of government expenditures and taxa-tion has tn regressive. Because the tax system relies heavily on regressiveindirect taxes, it has a particularly pernious effect on income distribu-tion. While nominal tax rates are high, actual collections are low, so thatthe overall tax effort on the Philippines is low in comparison with othercountries. Taxes on income are widely evaded, there is no effective capitalgains tax, and collection of taxes on real property are extremely low. Theresult is a regressive taxation structure in which poor families pay 272 oftheir income in taxes while higher income families pay only 18X.
Legal steps should be taken to increase compliance. In addition,tax administration and enforcement should be improved, particularly in thearea of income taxation. In the medium term, the Philippines could gain morein terms of revenue and equity from steps towards better compliance than frommodification of the tax rates.
The poor have not been the major beneficiaries of government expen-diture programs in the past. In fact, the type of government spending thattook place in the seventies mainly benefited the rich through large capitalintensive industrial projects, and through a social service system that didnot reach a large proportion of the poor. The benefits of public educationhave been greater for higher income students. In health, most publicresources have been devoted to expensive urban-based curative services.Housing subsidies, both in financing loans and in providing shelter, havemainly benefitted the upper half of the income ladder. Family planningprograms, too, have failed to reach a large portion of lower income women.

- vii -
Public expenditures on poverty-related areas such as agriculture andrural development, the social sectors, and basic infrastructure need to beexpanded. The Philippines spends less than half of what other countries atcomparative levels of development spend on social services. In some cases,Government programs already have extensive coverage (e.g. primary education),but there is a need to improve the quality of services. In areas such asnutrition, health care and family planning, there is a need to expand both thequality and coverage of services offered. Within the public investment pro-gram, more resources should be directed at expanding rural infrastructure,particularly rural roads, small-scale irrigation works, and rurai electrifica-tion, as well as programs designed to upgrade public facilities in squatterdevelopments in urban areas. The efforts at developing labor-intensive publicworks under the Community Employment Development Program should beincorporated into the on-going programs of Government departments.
The Social Sectors
A major task is to increase the human capital, and thus the earningcapac;ty, of the poor. The long run productivity of the poor can be increasedthrough improving the delivery system of health care, preschool and infantnutrition, education and improving environmental conditions. Nutrition andhealth care are the most urgent programs where additional resources should bedirected. In order to reach the level of government spending of othercountries at comparable level of development, expenditures in these twosectors should double as a proportion of GNP. In contrast, in housing andsocial security, the resources to meet the needs of the poor should come frominternal redistribution of existing resources, and the increase in resourcesshould be limited to CNP growth.
Nutrition programs need to be expanded both in quality and coverage,particularly to high riak groups. International experience shows that a sub-stantial nutritional impact can be achieved by a program of a limited numberof components, rtat can be successfully delivered to a well defined targetgroup. To provise better coverage of Food and Nutrition Progtam, nutri-tionally at risk households should be identified at the barangay level.
Education p-ogrammes for mothers in nutrition, breastfeeding, andchildrearing practices should be implemented together with early nutritionintervention at the preschool age. In the Philippines, the poor students havelower performance in ability tests, partly due to conditions related to theirnutritional status combined with environmental deprivation. The current Foodand Nutrition Plan need to be coordinated among its various implementingagencies, aad commonly defined targets need to be adopted. Currently, foodassistance to preschoolers misses a large proportion of children in need whilecovering t large number of preschoolers that do not need such assistance.Furthermore, food assistance to school children should be reconsidered sinceit might have a higher impact if allocated to malnourished preschoolers.
The budget for health needs to be doub.ed and the composition of itsexpenditures radically changed. The disease pattern among the poor in thePhilippines nalls for promotive and preventive health care, and basic curativeservices in tnie rural areas. Although the Government supports this approach,

- viii -
expenditures in preventive medicine represented only 0.2X of GNP in 1985 asmost of the health budget goes to curative care. The Government shouldcontinue to actively pursue a policy which links both public and privatesectors in developing new mechanisms for health financing. Such policiescoild include recovering costs from the nontarget population using publichospitals and financing lower income patients so as to allow them to use theexisting excess capacity in private hospitals.
On delivery el health services the Department of Health (DOH) shouldbe supported in its plan to strengthen community-based services, includingempowering the communities to take a more active role in their own healthcare. However, the generation of effective demand for services such as immu-nization, prenatal and post-natal services, should be emphasized for the suc-cess of these programs. In this context, the Government may wish to expandsubstantially the number of midwives to help provide these services. TheGovernment could also seek agreement with NGO's and local governments to helpidentify high risk households, and to diagnose or refer cases requiring morecomplicated health interventions.
Additional resources will be required to train and supervise healthworkers, and to increase facilities, drugs and supplies to the health units.These resources should be allocated on the basis of poverty incidence at leastto the level of municipalities. Increased reliance on non-budgetary resourceswill also be necessary including higher user charges from higher income pa-tients. Additional resources could be mobilized through upgrading the capa-bilities of traditional health practitioners and volunteer workers which wouldalso strengthen the referral system at the village level. External support onfavorable terms should be sought to finance the cost of implementing the re-forms in the delivery of health services and in health financing.
Education. Although the majority of the poor have access to elemen-tary education, the educaticnal system in the Philippines is regressive at alllevels. The regressivity of education at the elementary level stems from thevariance in quality, where poorer students receive lower quality services. Insecondary education, there is not only inequality within public schools, butalso lack of access to the higher quality private system. The regressivitybecomes more acute in tertiary education where subsidies are larger and gomostly to higher income students.
While the share of GNP spent for education is largely adequate, checomposition of educational expenditures should change. Although governmentexpenditures in education are only 2.42 of GNP, the private sector plays amuch more significant role than in other lower middle income countries. Thepriority within education is to improve the quality of elementary and secon-dary public schools, and increase the attendance rates of low income childrenof ages 11-14. Since low income is a leading cause of low attendance,directed expenditures which raise the poor children's real income--such asfood and textbooks-might help retain children at school.
Public school quality should be improved tLrough the provision ofdesks, books, and on-the-job triaing for teachers in the poorer communities.Academic achievement at the primary level is influenced significantly by non-

- ix -
wage expenditures in the school. These expenditures are now distributedregressively and should be increased and redirected to schools catering tolower income children. Moreover, minimal standard of facilities, now appliedto private schools should be also specified for public schools. School costswhich are unrelated to quality should be cut in favor of more cost effectiveresources. Experience in previous Bank financed projects in the Philippinesshows that school quality interventions had the most pronounced effect amongthe poorest children. The children who benefitted the most from the nation-wide Textbook Project, were those coming from the most impoverishedbackgrounds.
Overall tuition subsidies which benefit the rich should be redirect-ed towards lower income students. Expenditures on tertiary education shouldbe devoted to scholarships for the lower income students, while the tuitionfor high income student should reflect the cost of attending private schools.The Government should absorb the cost of the barangay high schools, whichprovide poor quality service at high cost.
Given the limitations of a housing policy to reach the poorest inthe Philippines, the resources devoted to this sector should be limited. Thegovernment should focus on promoting the generation of long term loans in thebanking system. This would take care of the middle income families that needfinancing in order to get a house. As for the poor, the units constructedshould be much cheaper than in the past and subsidies on the cost of loansshould be avoided. For most of the poor, since they live in rural areas,their housing problem is not so acute as the lack of other facilities.
Policies with Longer Run Impact
Land Reform and Rural Development. The most fundamental interven-tion is land reform. In the Philippines, over half the farms occupy only 16%of the land area; two-thirds of all poor farmers are full or partial tenants.In addition, there is a growing body of landless agricultural workers who lackaccese to land. The problem is particularly acute in sugarland areas, wherelarge estates are operated with landless wage labor. The Government'sComprehensive Agrarian Reform Program could do much to alleviate thisproblem. A fully implemented program could benefit as many as 1.5 millionlandless agricultural families, in addition to giving clear title to 800,000small farmers. While such a program is large, it is similar in scope to thatundertaken by other governments. In addition to the more obvious social andequity benefits, it might also raise overall productivity.
The land reform bill was approved by Congress in June 1988, underRepublic Act No. 6657, providing the basis for the implementation of aComprehensive Agrarian Reform Program (CARP). The land reform on rice andcorn lands is to be completed in the next four years under Phase I; Publiclands over 50 ha are to be completed in the following four years under coconutplantations: holdings between 4 and 10 ha will be affected in years 4 to 10,holdings between 5 to 24 ha in years 6 to 10. With the exception ofcommercial lands, like orchards, fish ponds, poultry, and coffee, land reformis to be completed in the next 10 years. A substantial support program forthe farmers getting new land is currently being designed by the Department ofAgrarian Reform.

- X -
Other steps need to be accelerated to improve the level of ruraldevelopment. Public investment can increase the productivity of small farmers
if it is directed at high priority activit;es. Probably the most useful
intervention is the development of better rural roads, particularly those
linking rural areass to markets. Investments in small-scale, communalirrigation and rural electrification are also beneficial. The system of
research and extension needs to be improved, 94 that extension workers can
reach poor farmers in remote areas and provide appropriate technologicalpackages suited to their environment. The adaptation of modern technologies
by small farmers will require some forther improvements in the system of rural
credit as well.
Population. Population growth currently adds over 1.5 million
persons to the population of the Philippines each year. Between 1975 and
1985, 13 million people were added to the population and 10 million to the
labor force. The persistent swelling of the labor supply coupled with amoderate-to-poor record of economic growth has led to a substantial increasein the rate of underemployment. These conditions have adversely impactedlabor's earnings, and real wages have constantly declined since 1960. For the
future, projections indicate that even a 4 to 5% growth rate of GDP will
barely provide enough jobs so as to keep underemployment from increasingfurther. A substantial growth in real wages will be difficult to attain
unless there is a significant drop in population and labor force growth rates.
The government's aim should be fertility reduction so that the
population growth rate does not exceed 2.0X by the year 2000. Information by
income categories shows that the poor have higher fertility and lowercontraceptive rates than higher income groups. At the same time, the largest
unmet demand for contraceptives is found among lower income women. Part of
this discrepancy appears to be due to the lack of access to family planningservices by lower income households. Overall, the level of Governmentexpenditures on family planning should be increased and the delivery of
services made more effective. While the existing clinic and community based
network is an effective delivery mechanism, it should be expanded so as to
reach more families, and integrated with the delivery of nutrition and health
care. In addition non-government organizations should be encouraged since
they have been the most effective in delivering family planning services.
Financing Basic Needs. Given the limited resource availability and
the large number of poor families, the Government can only afford to provide
basic services to the poorest. The cost of expanding social programs can be
reduced by insuring full cost recovery from the non-poor, in terms of higher
levels of fees and better collection efforts. In addition, access to servicesshould be limited to the very poor wherever possible. One way achieving this
goal is through the provision of only basic services which are not attractive
to the non-poor, or through selective targeting of beneficiaries. Even then,
selective targeting of government basic services needs be implemented down to
the community level. The provision of services to the non-poor by the private
sector should be supported in the areas of health, education and housing. In
addition, NGOs should be encouraged to expand services, since they have proven
to be effective in reaching the poor in such areas as health, family planning
and nutrition.

- xi -
User charges are more important in reducing the leakage of benefitsthan in financing the expansion of social programs. Cost recovery should beimproved in hospital and housing programs and in higher education. From theequity point of view, cost recovery should be focused on screening theprovision of subsidies so that they only reach those in need. "Free for all"services tend to be the most regressive formula si 'ce higher income groupswill benefit the most. However, since cost recovery nas a limited potentialas a source of finance, most of the resources will have to come from improvedtax collection.
Reducing the scope of government programs to the lower income groupscould release resources for the most needy. This cculd be done partly throughreallocation of subsidies between differext components within each sector.The poor could also be reached through reducing the quality of sometimesexpensive services that mainly benefit higher income groups. In health careand housing, the services provided are, in general too expensive. Quality hasto be sacrificed in order to reach the large unserved population. Subsidiesto public hospitals and higLer education have to be reallocated to finance theneeds of the poorest groups within each sector. Inadequate use has been madeof the private sector in the delivery of some basic services. Overall, thecase for financing basic needs must be based on the efficacy of theintervention and on its clearly targetted group of beneficiaries.

PART I
POVERTY IN THE PHILIPPINES: ANI OVERVIEW

I, WHO ARE THE POOR AND WHY ARE THEY POOR?
1.1 There are more poor people in the Philippines today than at any timein recent history. The situation has worsened during the past three decades,and the stagnation and decline of the 1980's has only made matters worse.While there is now evidence that an economic recovery is taking place, even along period of output growth will be insufficient to substantially reducepoverty, particularly in the face of rapid population growth. Well-focusedprograms are therefore needed to address this problem, particularly in therural areas where the impoverishment of subsistence farmers and the growingnumbers of landless workers remains one of the most serious problems. Ifpositive results cannot be achieved in these areas, we are likely to see anacceleratioa of political and social unrest, which could undermine the entiredevelopment effort. This chapter briefly surveys the nature and causes of thepoverty/employment problem. The following chapters (in Part I) discuss inmore detail the employment problem, and the role of public policy. Part IIgives a more detailed discussion of the issues in the social sectors:population, health, nutrition and education.
A. The Poverty Problem
The Incidence of Poverty 1/
1.2 The number of poor people in the Philippines has significantly in-creased over the last decade specially in rural areas. This has happeneddespite slight improvements in the real average incomes for the lower decilesof the population (Table 1.4). Although poverty incidence did not changeduring the period, in 1985 there were around 10 million additional individualsin poverty as compared to 1971 just as a result of population growth (Table1.1). Furthermore, the number of people below subsistence conditions in-creased by around 2 million in sRite of the fact that the proportion of peoplebelow subsistence has decreased._
1/ The 1971 poverty line was derived using the least cost consumption basketneeded by the lowest quintile in order to meet their minimum needs,specified in terms of 2,016 calories and 50 grams of protein per day.The estimates of non-food needs are based on the actual expenditurepattern of the lowest family income group in 1971 PIES. The procedurefollowed World Bank Guidelines which assume that such a diet "generallyprovides an adequate balance of carbohydrates, proteins and othernutrients". The 1985 poverty line was updated from the 1971 base usingthe food price index.
2/ The subsistence level is defined as an income level that provides for theminimum food requirements, as opposed to the poverty level which includesnon-food items. The official subsistence lines for 1985, in per capitaterms, are 2,904 pesos for the urban areas and 2,414 pesos for the ruralareas. This lines have been deflated using the national food price indexto obtain the corresponding 1971 levels of 351 pesos for the urban areasand 292 pesos for the rural areas.

Table 1.1: POVERTY FAMILIES AND POPULATION, 1971-1985
AveragePopulation Families family size
(000'ws) - (Z) (000's) (Z)
1985Poor 30,622 57 5,115 52 5.99Non-poor 23,435 43 4,732 48 4.95
Total 54,057 100 9,487 100 5.49
1971Poor 20,485 57 3,322 52 6.2Non-poor 15,454 43 3,066 48 5.0
35,939 100 6,388 100 5.6
Source: PIES and Staff Calculations.
1.3 A systematic study of changes in absolute poverty incidence faces anumber of methodological problems which introduce considerable arbitrarenessinto the measurement of poverty and its trends. First, to identify the poor apoverty line based on minimum needs has to be idintified yet needs vary amongindividuals, regions, and countries. Second, the income and expenditure datacollected in the past decade is only comparable for 1971 and 1985. Finally,changes in relative prices and consumption patterns introduce further compli-cations into the assessment of time trends. Keeping in mind these difficul-ties, this section examines the evolution of poverty by analyzing other incomeand welfare indicators in conjunction with the official estimates and Bankadjustments to the poverty line. For policy purposes however, the reportfocus is on the lowest three deciles which are approximately equivalent tothose people living below subsistence conditions.
1.4 Our findings for the 1971-85 period are the following:
(a) the percentage of people below the poverty line has not changed, butthere are a larger number of poor in the Philippines as a result ofpopulation growth;
(b) the percentage of people below subsistence is lower, but, again, thenumber of people living with lower incomes than those required forminimum food requirements is higher;
(c) the balance between urban and rural poor has slightly changed sincepoverty incidence increased in urban areas and did not chaage inrural areas. However, the majority of the poor are still living inrural areas; and
(d) income distribution has slightly improved as a result of theincrease in average real incomes of the lowest five deci.es of thepopulation.
- 3 --3.
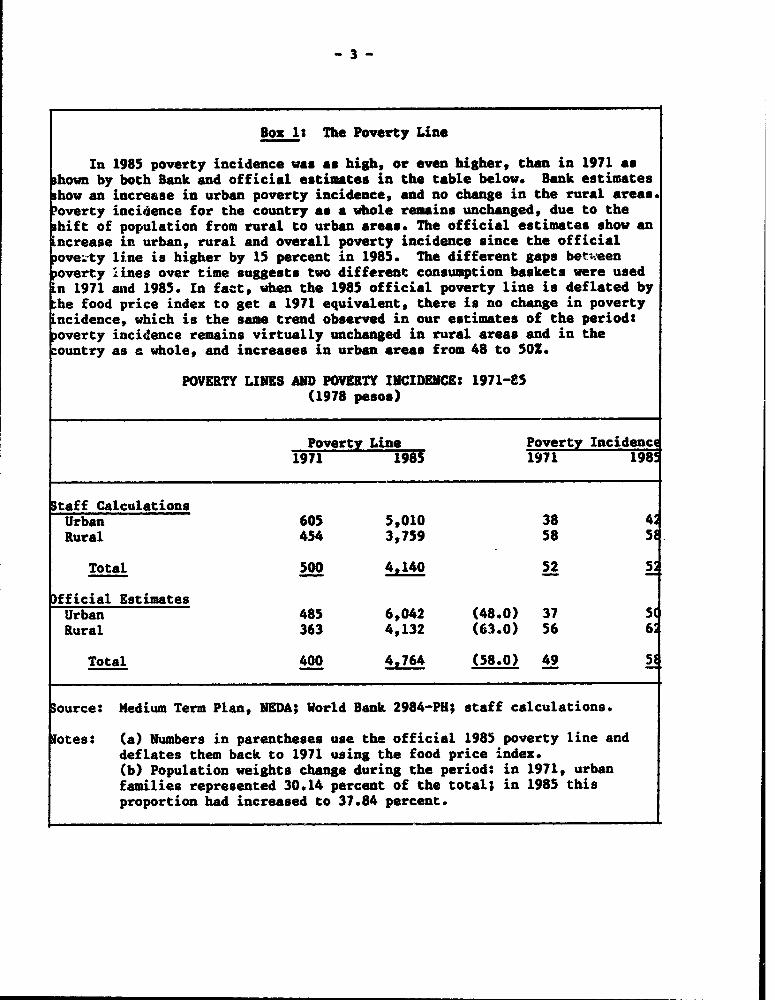
Box 12 The Poverty Line
In 1985 poverty incidence was as high, or even higher, than in 1971 ashown by both Bank and official estimates in the table below. Bank estimateshow an increase in urban poverty incidence, and no change in the rural areas.overty incidence for the country as a whole remains unchanged, due to thehift of population from rural to urban areas. The official estimates show anncrease in urban, rural and overall poverty incidence since the official
zovety line is higher by 15 percent in 1985. The different gaps betweenpoverty .ines over time suggests two different consumption baskets were usedn 1971 and 1985. In fact, when the 1985 official poverty line is deflated byhe food price index to get a 1971 equivalent, there is no change in povertyncidence, which is the same trend observed in our estimates of the period:overty incidence remains virtually unchanged in rural areas and in theountry as a whole, and increases in urban areas from 48 to 501.
POVERTY LINES AND POVERTY INCIDENCEt 1971-85(1978 pesos)
Poverty Line Poverty Incidenc1971 1985 1971 198!
Staff CalculationsUrban 605 5,010 38 4Rural 454 3,759 58 5
Total 500 4,140 52 5
fficial EstimatesUrban 485 6,042 (48.0) 37 5Rural 363 4,132 (63.0) 56 6
Total 400 4,764 (58.0) 49 5
Source: Medium Term Plan, NEDA; World Bank 2984-PH; staff calculations.
lotes: (a) Numbers in parentheses use the official 1985 poverty line anddeflates them back to 1971 using the food price index.(b) Population weights change during the period: in 1971, urbanfamilies represented 30.14 percent of the total; in 1985 thisproportion had increased to 37.84 percent.

- 4 -
1.5 Although no income and expenditure surveys could be used to analyzethe trends within the 1971-85 period, there are good reasons to believe thatpoverty inuidence decreased during the seventies and increased thereafter.First, CNP growth was not matched by personal income growth throughout theperiod. During the 1971-79 period personal income did grow, showing that someoutput growth war translated into higher household incomes. Unless there wasa deterioration in income distribution, poverty incidence must have declinedduring the 1971-79 period. As we will see in in the next section, incomedistribution improved slightly during the period. After 1979, personal incomestarts a downward trend in spite of the fact that GNP continues to grow until1981 (Table 1.2). This is the time when poverty incidence might have startedto increase as average household incomes were dropping. It also coincideswith the stepping up of government investments in construction and the MajorIndustrial Projects (MIP's), and with the expansion of lending activities ofthe Government Financial Institutions (GFI's). Poverty got even worse after1981 when there was a sharp decline in both personal income and GNP percapita. By 1985, GNP per capita had fallen back to its 1975 level, andpersonal income back to its 1972 level.
Table 1.2: AVERAGE ANWJAL RATES OF GROWTH OF PER CAPITA AGGREGATES(in pE centages)
71-79 79-81 81-85 71-85
GNP 3.92 -.10 -4.63 1.00Indirect Taxes (net) 7.40 -7.33 -5.94 1.25Depreciation 3.90 8.80 -2.08 2.84Corporate Income 13.11 -1.88 -43.12 -8.92Personal Income 1.43 -0.90 -3.85 -0.44
1.6 Second, during the seventies some welfare indicators improvedsubstantially on average, probably in correlation with the high growth of theperiod. Crude death rates dropped from 11.6 per 1000 to 8.4 per 1000, lifeexpectancy increased from 59 to 62.8 years, and households with safe watersupply services increased from 22% in 1970 to 43% in 1979. Furthermore,infant mortality decreased from 62 per 1000 in 1971 to 42 per 1000 in 1982.These indicators are average for the country and obscure the fact that theywidely range across regions and provinces (see Part II).
1.7 After 1983, the limited evidence available suggests an increase inpoverty in the form of lower energy intake and higher malnutrition rates. Forexample, in Metro Manila the adequacy of mean one-day per capita intake ofenergy declined from 88% in 1982 to 85% in 1985; for protein it declined from101% to 95%. This was more pronounced in depressed areas. Similarly, theproportion of children below weight-for-height standards, which had declinedin the seventies, increased from 10% in 1982 to 14% in 1985.
1.8 The proportion of people living below subsistence decreased duringthe 1971-85 period to around 30% of the population, which will be the focus ofthe analysis in the next section (Table 1.3). Subsistence incidence hasdropped in both, urban and rural areas. This coincides with the fact thatincome distribution slightly improved during the period. Although average

- 5 -
family income fell in real terms from 1971 to 1985, it increased for thelowest five deciles, and declined for the top five decit is. While somefamilies in the bottom 50 percent moved out from the poverty group, newentrants increased .he absolute number of poor.
Table 1.3: PEOPLE LIVING BELOW SUBSISTENCE CONDITIONS 1971-1985(In percentages)
Proportion of families Proportion of Individuals1971 1985 1971 1985
Urban 17.33 15.13 19.94 17.76Rural 38.51 30.00 42.13 35.04Total 32.13 24.37 35.39 28.38
Source: NEDA 1987. Philippine Statistical Yearbook.
Unequal Income Distribution 31
1.9 Poverty in the Philippines is uot only a reflection of low averageincomes but it is also a result of a very unequal distribution of income with-in the population. Although income distribution has improved over the 1971-8Speriod, the Philippines is still among the most unequal of middle income coun-tries. The average real incomes of the lowest five oeciles has slightlyincreased over the period, while there was a drop in the average income of thehighest deciles (Table 1.4). However, in 1985, the top decile of thepopulation had more than 15 times the income of the lowest decile.
Table 1.4: AVERAGE REAL FAMILY INCOME IN PESOS, 1961-85(1978 - 100)
1961 1971 1985Deciles Total Urban Rural Total Urban Rural Total Urban Rural
I 1,565 2,086 1,292 1,596 2,358 1,204 2,020 2,837 1,626II 1,938 1,963 1,640 2,159 3,832 1,841 2.970 4,296 2,495
III 2,459 4,049 2,187 3,192 5,748 2,761 3,733 5,470 3,086IV 3,130 5,154 2,634 4,131 7,369 3,398 4,553 6,719 3,714V 3,875 6,5i3 3,230 5,257 9,137 4,318 5,537 8,179 4,337VI 4,918 8,344 3,876 6,571 11,201 5,380 6,465 9,927 5,057VII 6,185 10,552 4,820 8,543 14,001 6,726 7,933 11,984 6,035VIII 8,346 13,865 6,112 11,265 17,833 8,708 10,032 15,064 7,371IX 11,923 19,755 8,249 16,147 24,465 12,03; 13,590 20,786 9,576X 30,181 50,063 15,654 35,016 50,992 24,424 30,784 45,3'3 18,823
Average 7,454 12,273 4,971 9,387 14,741 7,080 M280 13,081 6,204
3/ A comparison with National accounts and NSCO income distributionestimates is presented in the Statistical Appendix.

1.10 Partly as a result of past policies, there are significant incomedisparities between rural and urban areas. The absolute level of rural incomeis, on average, less than half the average urban income. This disparity hasremained almost unchanged over the last 25 years, and rural incomes are now471 of average urban incomes, compared to 401 in 1961 (Table 1.5). Therelatively lower income in rural areas reflects the concentration of skilledoccupations in urban areas, as well as the policy bias in favor of industrial-ization in the last two decades. The low abs'lute level of rural incomes,however, results from a higher ratio of people to natural resources andcapital, and the lack of human skills.
1.11 Income disparities are greater in urban than in rural areas. Asshown in Table 1.5, the top 20% of the rural population has 46% of ruralincome, while the bottom 301 receives only 121. However, in urban areas thetop quintile controls half of the income, while the bottom 30% earns only 101of income in urban ireas. As shown in Figure 1.1, rural income distributionhas improved betv' - 1971 and 1985. This improvement however, may be due tothe fact that 18 sc landlords, who were previously surveyed in the r,ralareas, have now moved into the cities because of the insurgency situation.
Table 1.5: INCOME DISTRIBUTION 1961-1985
1961 /a 1971 1985 lb
UrbanTop 201 56.9 51.2 50.5Bottom 30% 6.6 8.1 9.7Gini Coefficient /c 0.52 0.46 0.43
RuralTop 201 48.1 51.5 45.7Bottom 301 10.3 8.2 11.6Gini Coefficient /c 0.42 0.46 0.37
TotalTop 20% 56.5 54.5 51.1Bottom 30% 8.0 7.4 9.9Gini Coefficient /c 0.51 0.49 0.43
Memo:Rural/urban ratio (1) 40.5 48.0 47.4
/a UN (1981).7i gtaff calculations.7- The Gini coefficients measures income inequality, with zero representing
perfect equality and one representing perfect inequality.
Source. Family Income and Expenditure Survey.

Figure 1. 1
PHIUPPINESIncome Dlsttbi4tion, 1961-1985 Rural
35
20 1961
EJi97i30 19785
25
0
I II W IV V VI vn VIN IX XDedbs
WoVd 8ank - 408 73
The Core Poor
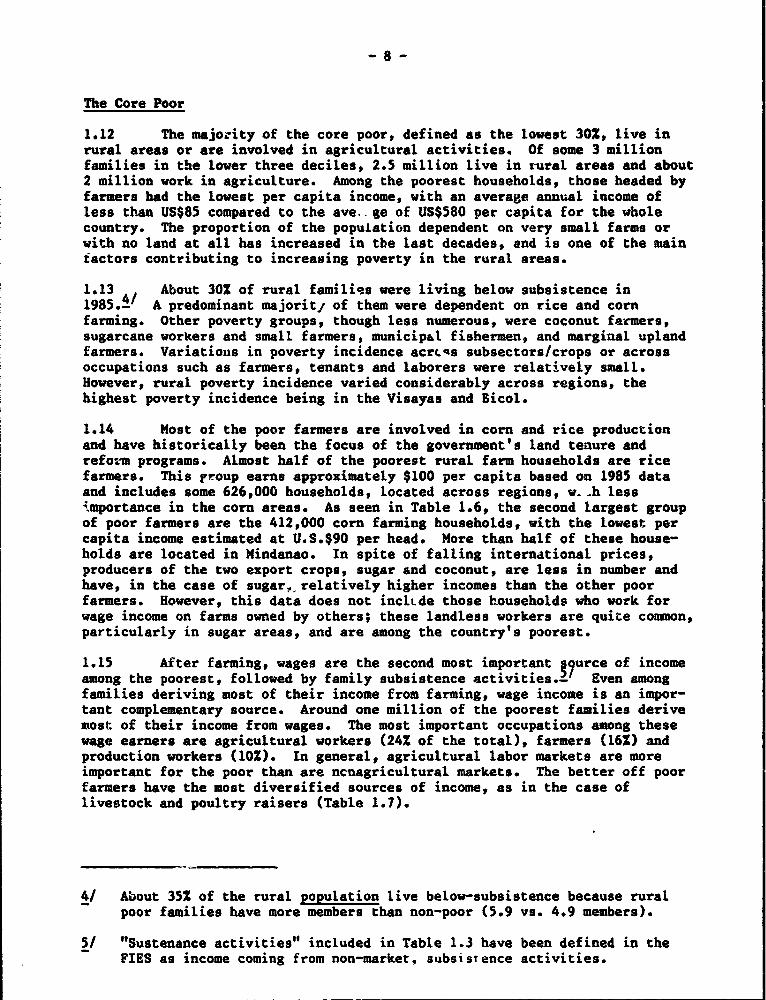
1.12 The majority of the core poor, defined as the lowest 30, live inrural areas or are involved in agricultural activities. Of some 3 millionfamilies in the lower three deciles, 2.5 million live in rural areas and about2 million work in agriculture. Among the poorest households, those headed byfarmers had the lowest per capita income, with an average annual income ofless than US$85 compared to the ave. ge of US$580 per capita for the wholecountry. The proportion of the population dependent on very small farms orwith no land at all has increased in the last decades, and is one of the maintactors contributing to increasing poverty in the rural areas.
1.13 About 302 of rural familiss were living below subsistence in1985 .- A predominant majoritj of them were dependent on rice and cornfarming. Other poverty groups, though less numerous, were coconut farmers,sugarcane workers and small farmers, municipal fishermen, and marginal uplandfarmers. Variations in poverty incidence acrc.s subsectors/crops or acrossoccupations such as farmers, tenants and laborers were relatively small.However, rural poverty incidence varied considerably across regions, thehighest poverty incidence being in the Visayas and Bicol.
1.14 Most of the poor farmers are involved in corn and rice productionand have historically been the focus of the government's land tenure andreform programs. Almost half of the poorest rural farm households are ricefarmers. This group earns approximately $100 per capita based on 1985 dataand includes some 626,000 households, located across regions, w. .h lessimportance in the corn areas. As seen in Table 1.6, the second largest groupof poor farmers are the 412,000 corn farming households, with the lowest percapita income estimated at U.S.$90 per head. More than half of these house-holds are located in Mindanao. In spite of falling international prices,producers of the two export crops, sugar and coconut, are less in number andhave, in the case of sugars relatively higher incomes than the other poorfarmers. However, this data does not incltde those households who work forwage income on farms owned by others; these landless workers are quite common,particularly in sugar areas, and are among the country's poorest.
1.15 After farming, wages are the second most important Igurce of incomeamong the poorest, followed by family subsistence activities.- Even amongfamilies deriving most of their income from farming, wage income is an impor-tant complementary source. Around one million of the poorest families derivemost of their income from wages. The most important occupations among thesewage earners are agricultural workers (24Z of the total), farmers (162) andproduction workers (102). In general, agricultural labor markets are moreimportant for the poor than are ncnagricultural markets. The better off poorfarmers have the most diversified sources of income, as in the case oflivestock and poultry raisers (Table 1.7).
4/ About 352 of the rural population live below-subsistence because ruralpoor families have more members than non-poor (5.9 vs. 4.9 members).
5/ "Sustenance activities" included in Table 1.3 have been defined in theFIES as income coming from non-market, subsistence activities.

- 9 -
Table 1.6: CHARACTERISTICS OF FARMERS IN THE BOTTOM 302OF INCOME DISTRIBUTION, 1985
IncomeX of entre- Annual
No. of X of total 2 of preneurial per capitafamilies poor farmers wages activities income (P)
Rice 625,961 43.3 12.48 58.99 1,995Corn 412,333 28.5 13.73 58.53 1,770Sugar 7,985 0.6 22.43 46.72 2,041Other crops 145,771 10.1 12.76 54.71 1,816Coconut 224,603 15.5 10.90 58.82 1,958Fruit 6,098 0.4 36.57 37.14 1,882Livestock 10,659 0.7 10.89 52.67 1,899Poultry 3,613 0.2 8.19 62.60 2,486Not classified 8,982 0.6 6.24 66.55 1,964
Total 1i4604 100 12.70 58.30
Source: Staff calculations and FIES.
Table 1.7: MAIN SOURCE OF INCOME BY FARMING ACTIVITY, BOTTOM 30%, 1985(in 2)
Wages NetAgri- Nonagri- Sustenance share Other Total
Farming culture culture Total activities crops sources income
Rice 69.85 6.80 3.85 10.65 6.82 1.40 11.28 100.00Corn 62.85 6.65 6.04 12.69 7.65 2.34 14.47 100.00Sugar 48.53 16.53 0.00 16.53 26.27 0.00 8.67 100.00Other crops 55.66 9.82 4.01 13.83 11.87 2.89 15.74 100.00Coconut 66.20 5.99 3.07 9.06 7.81 2.89 14.04 100.00Fruit 33.77 47.98 0.00 47.98 0.00 0.00 18.25 100.00Livestock 19.93 12.37 0.00 12.37 0.00 0.00 67.70 100.00Poultry 35.40 0.00 0.00 0.00 0.00 17.19 47.41 100.00Others 72.61 4.79 0."' 4.79 7.23 0.00 15.38 100.00
Total 65.15 7.18 4.27 11.45 7.74 2.06 13.61 100.00

- 10 -
1.16 Although farmers in marginal rainfed and upland areas are notseparately identified by FIESs and micro studies, they form a large groupamong the rural poor. These farmers are found in most regions and grow arange of different crops. Many of them are farmers who have migrated andsettled in marginal, remote areas; some are minority tribes who followtraditional cultural activities, including shifting cultivation and destruc-tive slash and burn practices. Specific factors which contribute to thepoverty in tl -ae areas are: (a) low productivity due to high slope, poorquality of soil, or soil erosion; (b) inadequate support services; (c) limitedopportunities for off-farm employment; and (c) largely subsistence farmoperations which are sometimes inappropriate or even destructive to soilconditions in the area. The farm size threshold necessary to provide adequateincomes to families in these areas is thus much higher than in others. Mostof this land is suitable only for permanent crops (such as coconut and abaca)or for grazing. With the available tecnnology and the present cropping sys-tems, it will be difficult to raise the income of many upland farms abovepoverty levels.
1.17 Absolute poverty in the Philippines not only means low incomes butalso malnutrition and poor health. Discounting for differences in per capitaincomes social indicators in the Philippines are not out of line with theASEAN region (see Table 1.8). It haa, however, a much higher level of povertyand the lowest calorie supply per capita. Like most countries in the region,the Philippines scores below China in terms of progress in infant mortality,life expectancy and other social indicators, despite having a higher percapita income. Furthermore, health and nutrition indicators show a largevariance among regions and provinces within the Philippines.
Table 1.8: COMPARATIVE BASIC INDICATORS, 1985
Li£e Infant Pop. CaloriePer capita expectancy mortality per supplyincome at birth rate physi. per capita
China 310 69 35 1,730 2,602Indonesia 530 55 96 12,300 2,533Philippines 580 63 48 6,710 2,341Thailand 800 64 43 6,870 2,462Malaysia 2,000 68 28 3,920 2,684Korea 2,150 69 27 1,390 2,677Exporters ofmanufactures 520 64 56 2,330 2,499
Source: World Bank, WDR and Social and Economic Indicators, 1987.

- 11 -
1.18 In the future, even to just maintain these modest health indicatorswill require considerable resources since fertility rates and populationgrowth are considerably above the average middle income country. Fertilityrates in the Philippines are estimated at 4.2Z while they are 3.62 for theaverage lower middle income country. In the Philippines, population statis-tics are even more dramatic for lower income groups since fertility rates arehigher in the poorest regions, and among less educated mothers. As a resultof higher fertility, poor families are larger, with an average size of 6.0persons versus 4.9 for the non-poor.
1.19 Low-income agricultural families are also characterized by highlevels of underemployment, small farm size, inadequa;9 access or use of moderntechnology and low levels of educational attainment.- The poorest familieshave higher than average labor force particip_.tion, lower unemployment rates,and a higher underemployment rate. Almost 70X of the rural poor are own-account workers or unpaid family workers. Those engaged in farming generallyoperate small farms, averaging 1.6 hectares (ha) per family. The majority(521) of crop-farm poor families do not own the land they till; an additional151 cultivate other farms as tenants or lessees in addition to their ownfarms. Most poor farmers do not use modern inputs and technologies, but ope-rate simple, largely subsistence farms. Only about one third of all poorfarmers use fertilizers and pesticides, and only about one-fifth have accessto irrigation. Only 132 of poor farmers report using credit since 1970, and802 of those who did used informal sources. Only 122 of the poorest farmfamilies have used government extension services. The families of the ruralpoor average 6.3 members, versus 5.2 for the nonpoor; the average working mem-ber of a poor agricultural family supports 2.5 dependents. Housing in the ru-ral areas lacks basic facilities: 252 of their houses lack toilets and 802lack access to electricity. More than one third of the rural poor have notcompleted elementary school while another tenth never attended schools at all.
1.20 The main concentration of urban poor is in Metro Manila where1.5 million families have incomes below the poverty line. The average incomeof the urban poor is half the average income in Metro Manila. Low income ur-ban families live in precarious housing and congested conditions, lack facili-ties such as water, toilets and electricity, and have large families._'
1.21 More than half of the urban poor in Metro Manila are employed in theinformal sector, with a high participation of women and children. A largeproportion of the income of poor households comes from members other than thehousehold head. Squatting is common among poorer families who need to liveclose tO work centers to save in transport expenditures. Most of these work-ers meet their capital requirements through self financing or informal lend-ing. The urban poor outside Metro Manila are worse off in terms of income,
6/ Based on NEDA, "Study on Government Assistance to Low-Income Groups withInadequate Access to Institutional Credit", vol. II (April, 1987).
7/ From Orville Solon, "The Urban Poor: Their Case from SelectedCommunities in Metro Manila, Cebu and Davao", mimeo, 1987.

- 12 -
open unemployment, educational attainment, health care, and access to housingfacilities. However, congestion is worse in Metro Manila, and constructionmaterials are of lower quality.
B. Why are They Poor?
1.22 Rising poverty and unequal income distribution are due to threefundamental factors: unequal asset ownership, rapid population growth, andlack of new jobs. The government has failed to address these structuralissues in the past and, if anything, has contributed to income concentra-tion. Economic policies have had an anti-poverty bias in areas such as pricesand the incentive structure, credit allocation, and fiscal policy. Thefollowing section discusses some of the causes of poverty in the Philippines;succeeding chapters develop these themes in more detail.
Unequal Ownership of Assets
1.23 The distribution of land in the Philippines is more skewed than thedistribution of income (Table 1.9). More than half of the farms in 1980occupied 161 of the 8;otal farm area, while less than 4X occupied over onefourth of the land.8' The distributi.on of land is particularly skewed forsugar farms, where 601 of the farms account for 12Z of the area, while lessthan 21 cover almost 25Z of the sugar area. In addition to the skewness inland distribution, a very high proportion of land operators are tenants andnot landowners, despite previous efforts at land reform.
Table 1.9: SIZE DISTRIBUTION OF FARMS, 1980
Size of Farm (ha) Percent of Farms Percent of Land
<0.50 8.5 0.70.50 to 0.99 14.2 3.11.00 to 1.99 28.2 12.22.00 to 2.99 18.0 13.73.00 to 4.99 17.2 21.35.00 to 7.00 8.3 16.67.01 to 9.99 2.2 6.5
10.00 to 24.99 3.0 14.5>25.00 0.4 11.5
Source: Derived from 1980 Census of Agriculture, in World Bank Report6779-PH.
8/ From World Bank Report No.79-PH. Comparisons of land ownership aredifficult because of differences in land quality. However, these figuresare based on estimates by land operators rather than owners and probablyunderestimate the concentration of ownership.
- 13 -
1.24 A comprehensive land reform program could benefit more than twomillion farmers, almost half of them now landless. Although the 1972 landreform program was designed for the rice and corn farmers, it was nevercompleted and it benefited less than 81 of rice and corn tenants. Thegovernment is now pursuing the completion and even extension of this programto other lands through the comprehensive Agrarian Reform Program (CARP).
1.25 The redistribution of land could materially reduce poverty in ruralareas but will not, by itself, solve the rural problem. Other importantdeterminants of poverty for farmers are their low physical productivity, lackof non-farm employment, and lack of infrastructure. In addition to landconcentration, population pressure on land is a major factor in explainingsmall farm size and limited access to land.
Population growth
1.26 One of the major factors behind the increase in poverty incidence isthe rapid growth of the labor supply, which has had a depressive effect onreal wages. The rapid growth of the labor force is a result of the failure todecrease fertility rates significantly over the last decade. Populitiongrowth has also been regressive in that an expanding labor supply, contributedto a lower income share of labor from additional output.
1.27 Population policy is also critical ro poverty alleviation at thehousehold level. As mentioned above, poor families in the Philippines havemore children. The presence of more children lowers the family's capacity tosave. As a consequence, the distribution of inherited physical and humanwealth will become even more unequal over time, and poverty will furtherincrease among the lower income households. In addition, since higher incomefamilies not only have fewer children but also invest heavily in their humancapital, existing income gaps will further increase over time.
Lack of Employment Generation
1.28 From a poverty perspective, there has been a lack of transfer oflabor from agriculture to the secondary sectors and agriculture has remained alabor surplus sector. If this transfer had happened, labor in rural areaswould have decreased, eventually generating real wage increases in agriculturelike in Japan, Taiwan, and Korea. Instead, although resources were shifted tothe secondary sectors through protection and avaiiability of infrastructure,these sectors did not generate enough employment. This was a result of aninappropriate incentive system which provided excessive protection and did notreflect the relatively resource endowment in the Philippine economy. Negativereal interest rates and the public investment pattern led to a substantialrise in the capital intensity of the economy which dampened labor absorptionin the industrial sector. Given the high labor force growth rates, this ledto a reduction in real wage rates, reflecting the fact that agriculturallaborers did not benefit from productivity increases ia the sector.
1.29 Price Policies and the Incentive Structure. The imprbssive economicgrowth of the Philippines in the seventies, both aggregate and sectoral, was

- 14 -
not translated into equivalent increases in the well being of the poor. Onthe contrary, as indicated above, the number of people in poverty increasedover the 1971-85 period. This was partly a result of the policies pursued bythe government during this period. The policies most responsible forincreasing poverty are discussed below. The impact of short run macroeconomicmanagement on income distribution is discussed i Chapter II.
1.30 The relative price structure of the past contributed to poverty inat least three ways. First, excessive protection in manufacturing led to theallocation of too many resources in the sector, while creating few jobs andraising production costs for the farmers. Such industrialization strategyalso led to the concentration of public resources in Metro Manila and a fewother urban centers. Second, the negative movement in agriculture's terms oftrade has also been prejudicial to the incomes of small farmers. Third,negative real interest rates favored high income groups and contributed to thecapital intensive structure of the manufacturing sector.
1.31 One of the mechanisms which transferred resources to the secondarysectors was the drop in agricultural terms of trade. Price controls onagricultural products, export taxes, the coconut levy, and the monopolies onsugar and coconut trading, were all domestic policies which had adverseeffects on the agricultural terms of trade. This downward trend was furtherexacerbated by the fall in international prices of the two main Philippineagricultural exports.
1.32 Another instrument which hurt the agricultural terms of trade wasthe exchange rate. In fact, the peso overevaluation had a larger negativeprotection effect on agricultural products than the direct price interventions(see Table 1.10). The trade regime effectively penalized agricultural growththrough the overvalued exchange rate which, even when not regulated, reflectedthe artificially low foreign exchange requirements of a protected industry.For the last three decades there has been a persistent and significant bias inrelative incentives against agricultural production in favor of import compet-ing industrial consumer goods. It has been estimated that in the Philippinesa 10 rise in the domestic price of importables is associated with a 6.6X de7cline in the domestic price of agricultural exports relative to home goods.,The same study shows during the 1975-80 period import and foreign exchangecontrols, and the real exchange rate lowered domestic agricultural prices by19% relative to home goods and by 25% relative to non-agricultural products.This reinforced the drop in international prices of sugar and coconut, result-ing in the dramatic fall of agricultural prices that took place after the mid-seventies.
9/ Bautista, R., Production Incentives in Philippine Agriculture: Effects ofTrade and Exchange Rate Policies. IFPRI, May 1987.

- 15 -
Table 1. 10: AVERAGE NOMINAL RATES OF PROTECTIONFOR AGRICULTURAL PRODUCTS
(In percent)
ProductsRice Corn Sugar Coconut
Periods
I. From Direct PriceInterventions /a
1971-75 5 17 -34 -141976-80 3 28 -4 -171981-82 -2 46 -22 -361960-82 11 22 -16 -11
II. Including ExchangeRate Effects /b
1971-75 -16 -5 -46 -301976-80 -26 -7 -31 -401981-82 -29 5 -44 -531960-82 -14 -6 -35 -31
/a The nominal rate of protection from direct price interventions.7- The nominal rate of protection from both direct price interventions and
the peso overvaluation.
Source: P. Intal and J. Power. "Government Interventions and PhilippineAgriculture" (1988), draft for Political Economy of AgriculturalPricing Policies, edited by Krueger, Valdes, and Schiff. WorldBank, forthcoming.
1.33 The financial sector was heavily regulated in the seventies. andinterest rates were often negative in real terms. In addition, differentialsbetween rates did not encourage long term savings. After the refcorms of theearly eighties a number of problems still remained such as the heavy presenceof government financial institutions in the financial sytem, selectiverediscounting by the Central Bank, and later the rapid increase in domesticborrowing from the government.
1.34 The system of negative interest rates and rationed credit probablydistorted the flow of funds. .nvestment decisions favored capital intensiveprojects with low employment coefficients. The system led to a greaterconcentration of income since higher income groups had greater access torationed credit as financial intermediaries provided the rationed credit totheir best clients. The same is true for regulations on interest rates paid onsavings.

- 16 -
II. PUBLIC POLICY AND POVERTY ALLEVIATION
Background
2.1 An immediate priority for the country is to continue the presenteconomic recovery in a way which specially raises low incomes, and providesmaximum employment benefits. A longer-run and more basic requirement is toalter the growth process in such a way that its fruits are more equitablydistributed. Poverty remained very prevalent in the country even afterseveral decades of good economic growth. Declining real wages in bothagricultural and non-agricultural activities during periods of economicexpansion indicate serious defects in the growth pattern, even when some otherindicators might paint a more positive picture.
2.2 It is impossible at this stage to articulate a comprehensive programthat will solve the poverty problem once and for all. Some of these problemsmay be outside of the Government's power to influence or direct. However,there are a number of intervention points that are of high priority and towhich it should devote its attention. The key intervention points at thistime appear to be:
(a) macro-economic management policies;
(b) land reform and rural development;
(c) population policy and family planning programs;
(d) tax policies and expenditure policies; and
(e) improved efficiency in social sector programs.
Not all these issues are of equal urgency. Land reform is a high priority.Vithin the social sectors, the critical issue is the ability to developprograms that will eventually reduce the population growth rate. The balanceof this chapter looks at public policy as it affects these issues. Part II ofthe report gives more detailed treatment of the issues in the social sectors,including the population problem.
A. The Impact of Macroeconomic Management
Growth and the Incentive Framework
2.3 Rapid growth in output will do much to alleviate the povertyproblem, but growth alone will not solve the problem. The high growth of theseventies was associated with declining real wages and growing levels ofpoverty and underemployment. Past policies led to a pattern of growth thatemphasized capital-intensive, import substitution activities and discouragedrapid agricultural and export development. Since 1980, however, there hasbeen a gradual removal of major controls and distortions affecting factor andcommodity prices. While progress has not always been smooth, nor without sometemporary back-tracking, what has emerged is an incentive structure which can

- 17 -
lay the basis for a better pattern of growth in the future. Major stepsinclude:
(a) the liberalization of interest rates to reflect market conditions(1981);
(b) the lowering of tariff levels from an average of 43Z to 28Z (1980-85);
(c) the removal of many trade restrictions (1980-87);
(d) the removal of price controls on agricultural outputs and inputs(1983-86);
(e) the elimination of direct Government investment in capital intensiveindustries (1986); and
(f) the adoption of a market-oriented exchange rate (1985).
2.4 The result of these reforms has been to reorient incentives withinthe economy so that future investment will have a higher employmentcoefficient, be less capital-intensive, and have a a greater export andagricultural orientation. These reforms should help alleviate poverty byincreasing labor demand, wages and employment. The impact of these reformswill take some time to be felt, however, since the existing capital stockreflects the past pattern of incentives. Furthermore, the level of investmenthas been depressed in recent years by the impact of the recession associatedwith the debt crisis and stabilization policies (1983-85). While theresumption of strong growth in 1987 (about 5Z) indicates that a major economicrecovery has now been started, it is important that it be kept on track. TheGovernment's own Development Plan calls for a growth rate of 6.51 over thenext five years. It is equally important, however, that this growth becombined with further improvements in the incentive system, or at the least,without a return to the distorted incentive system of the recent past.
The Philippines Stabilization Experience
2.5 Following a decade of substantial growth the Philippine economyarrived into a crisis situation in 1983. Although GNP and exports wererapidly expanding during the seventies, the seeds of the crisis were alreadybeing planted because of the underlying structural weaknesses in theeconomy. Manufacturing expansion largely occurred in highly protected sectorsand the incentive system was not conducive to a broad based export expan-sion. Investment rates were about 301 of CNP, but these resources were notindustiral used and the government was increasingly participating in produc-tive activities. To sustain such high GNP growth rates the governmentgradually increased its reliance on external sources of finance.
2.6 The deterioration in terms of trade in the late seventies, followedby rising interest rates in the early eighties, brought into the open theseunderlying structural weaknesses in 1983. Growing import requirements werenot met with higher import receipts and the current account deficit increased

- 18 -
from an average deficit of 4.62 of GNP in the 1975-80 period to nearly 8Z in1982. As most of these deficit was financed by foreign borrowing, totalexternal debt increased from 5 billion at the end of 1975 to 24 billion in1982. The growing public sector gap was not offset by public sector savingsand the consolidated public sector deficit went from 3Z of GDP in 1980 to 5.8Zin 1982. Although the external environment of the late seventies called formoderate fiscal and monetary policies and a real devaluation, the adjustmentcontinued to be postponed by increasing short term debt. Following the Aquinoassassination, the external debt problem came into the open as commerciallenders refused to roll over short term credits or extend new loans. Thecapital flight that followed the political crisis further exacerbated thebalance of payments problem. The option of continuing to postpone theadjustment was no longer available.
2.7 The Philippines started its stabilization process in late 1983 andhad brought under control the short run external imbalances by 1985. Thisturnaround in the current account deficit was achieved through a drop in realabsorption and a sharp output contraction. The current account deficit fellfrom 81 of GNP in 1983 to a small surplus in 1965, with both imports andexports falling at the same time. Drastic cuts in public expenditures andrestrictive monetary policies were the main instruments used for stabilizationand resulted in a drop in CNP of 6.82 in 1984 and 3.81 in 1985. The consoli-dated public sector deficit as a share of CNP was reduced from 5.81 in 1982 to2.61 in 1985. Total investment dropped from 27.1S of CNP to 16.51 in 1985with public investment down to 3.6X from 7.71 and private investment down byaround 6.81 of CNP.
2.8 In conLrast the real exchange rate, which was initially depreciated,was back to its 1981 level by 1985. Furthermore, quantitative importrestrictions, increases in import duties, and taxes on exports were alsointroduced as part of the government's stabilization program at a time whenincentives to promote export oriented activities were urgently needed. Theintensification of import controls at the time of the initial 1983 nominaldevaluations, complemented with accommodating monetary policies, resulted inan acceleration in inflation in 1984 which eroded part of the effect of thenominal devaluation on the real exchange rate. Inflation surged from 10 in1983 to 50Z in 1984. Another 28.6% devaluation took place in June 1984 and amanaged float was implement shortly thereafter. However, as a result of thedrop in aggregate demand the real exchange rate remained constant and thenappreciated in 1985.
2.9 The restrictive monetary policy followed in 1985 contributed notonly to a nominal currency appreciation but also to a sharp increase in realinterest rates. Real lending rates went up from 71 in 1982 to 21% by the lastquarter of 1985. In addition, given the rigidity in the already cutgovernment borrowing requirements, the stock of credit to the private sectordecreased by 54% during the adjustment period. In 1985, private savingsfinanced the public sector's investment-savings gap as well as the surplus inthe current account. While the public sector gap was 2.61 of CUP in 1985, theprivate sector gap, which was 2.91 in 1982, had turned into 2Z surplus mainlyas a result of falling investment.
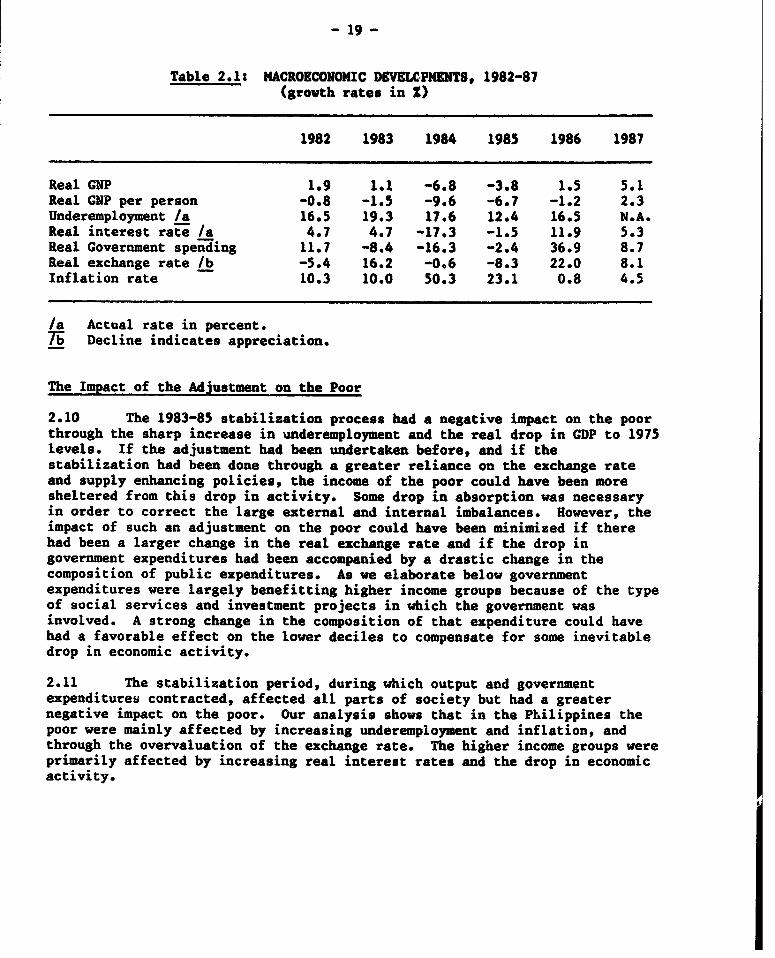
- 19 -
Table 2.1: MACROECONOMIC D6VELCPMENT8, 1982-87(growth rates in X)
1982 1983 1984 1985 1986 1987
Real GNP 1.9 1.1 -6.8 -3.8 1.5 5.1Real GNP per person -0.8 -1.5 -9.6 -6.7 -1.2 2.3Underemployment /a 16.5 19.3 17.6 12.4 16.5 N.A.Real interest rate /a 4.7 4.7 -17.3 -1.5 11.9 5.3Real Government spending 11.7 -8.4 -16.3 -2.4 36.9 8.7Real exchange rate /b -5.4 16.2 -0.6 -8.3 22.0 8.1Inflation rate 10.3 10.0 50.3 23.1 0.8 4.5
/a Actual rate in percent.7r Decline indicates appreciation.
The Impact of the Adjustment on the Poor
2.10 The 1983-85 stabilization process had a negative impact on the poorthrough the sharp increase in underemployment and the real drop in GDP to 1975levels. If the adjustment had been undertaken before, and if thestabilization had been done through a greater reliance on the exchange rateand supply enhancing policies, the income of the poor could have been moresheltered from this drop in activity. Some drop in absorption was necessaryin order to correct the large external and internal imbalances. However, theimpact of such an adjustment on the poor could have been minimized if therehad been a larger change in the real exchange rate and if the drop ingovernment expenditures had been accompanied by a drastic change in thecomposition of public expenditures. As we elaborate below governmentexpenditures were largely benefitting higher income groups because of the typeof social services and investment projects in which the government wasinvolved. A strong change in the composition of that expenditure could havehad a favorable effect on the lower deciles to compensate for some inevitabledrop in economic activity.
2.11 The stabilization period, during which output and governmentexpenditures contracted, affected all parts of society but had a greaternegative impact on the poor. Our analysis shows that in the Philippines thepoor were mainly affected by increasing underemployment and inflation, andthrough the overvaluation of the exchange rate. The higher income groups wereprimarily affected by increasing real interest rates and the drop in economicactivity.
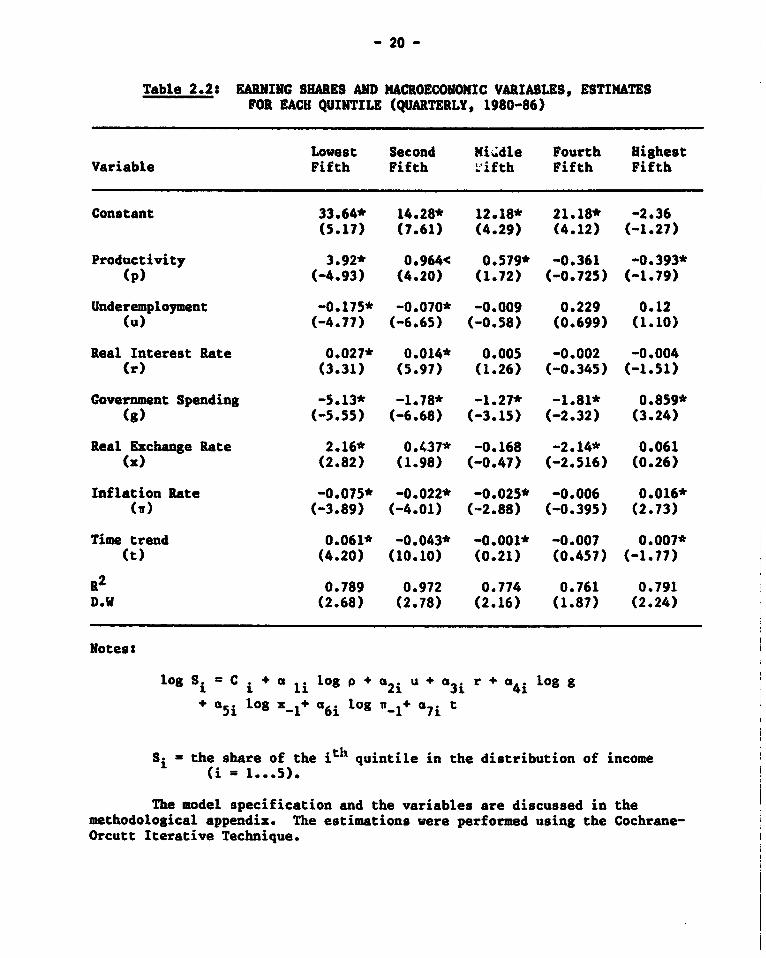
- 20 -
Table 2.2s EARNING SHARES AND MACROECONOMIC VARIABLES, ESTIMATESFOR EACH QUINTILE (QUARTERLY, 1980-86)
Lowest Second Mi4dle Fourth HighestVariable Fifth Fifth 'ifth Fifth Fifth
Constant 33.64* 14.28* 12.18* 21.18* -2.36(5.17) (7.61) (4.29) (4.12) (-1.27)
Productivity 3.92* 0.964< 0.579* -0.361 -0.393*(p) (-4.93) (4.20) (1.72) (-0.725) (-1.79)
Underemployment -0.175* -0.070* -0.009 0.229 0.12(u) (-4.77) (-6.65) (-0.58) (0.699) (1.10)
Real Interest Rate 0.027* 0.014* 0.005 -0.002 -0.004(r) (3.31) (5.97) (1.26) (-0.345) (-1.51)
Govertment Spending -5.13* -1.78* -1.27* -1.81* 0.859*(g) (-5.55) (-6.68) (-3.15) (-2.32) (3.24)
Real Exchange Rate 2.16* 0.437* -0.168 -2.14* 0.061(x) (2.82) (1.98) (-0.47) (-2.516) (0.26)
Inflation Rate -0.075* -0.022* -0.025* -0.006 0.016*(w) (-3.89) (-4.01) (-2.88) (-0.395) (2.73)
Time trend 0.061* -0.043* -0.001* -0.007 0.007*(t) (4.20) (10.10) (0.21) (0.457) (-1.77)
R2 0.789 0.972 0.774 0.761 0.791D.W (2.68) (2.78) (2.16) (1.87) (2.24)
Notes:
log Si = C i + a li log p + a2i u + a3i 4ilogg
a5i log s_l a6i log i-1+ a7i t
Si - the share of the it" quintile in the distribution of income1 =(i 1...5).
The model specification and the variables are discussed in themethodological appendix. The estimations were performed using the Cochrane-Orcutt Iterative Technique.

- 21 -
2.12 The recent macroeconomic adjustment in the Philippines affected thepoor mainly through the increase in underemployment that followed thestabilization program. Increases in underemployment have a high social costsince they have a larger effect on those workers that have the least specificskills and, therefore, are the first ones to become underemployed whenaggregate employment falls. Table 2.2 shows that an increase inunderemployment has a negative impact on the share in total income of thelowest two quintiles in the Philippine economy. Underemployment was not foundto be significant for the highest 60X income earners.
2.13 The poor also benefitted from the drop in inflation which resultedafter the stabilization period because they pay most of the inflation tax.Both the irban and rural poor cannot protect their income from inflationbecause tley do not have indexed wages, and they seldomly have any otherassets that keep their real value in times of inflation. Inflation was foundto be a regressive tax since it lowered the incomes of the lowest six deciles,while increasing the incomes of the highest two deciles.
2.14 The type of government spending that took place in the past mainlybenefitted the rich through large capital intensive industrial projects, andthrough a social service system that did not reach the poor. This can be seenin Table 2.2 where government expenditure only increases the income share ofthe highest decile. If fiscal adjustment had been achieved through switchingexpenditures and increasing revenues through direct tas collection, the poormight have end up better off than before the adjustment.
2.15 The lack of a greater real devaluation during the stabilizationprogram had a negative effect on the poor since they are mostly involved inthe production of tradables, and export production is intensive in labor,their main resource. A devaluation does not have adverse effects on thepurchasing power of the poor since their consumption basket contains a smallshare of imported goods. In the Philippines 72Z of the expenditures of thepoor are locally produced cereal and cereal preparations, fish, and fruits andvegetables. In the medium term, the landless workers will also benefit from adevaluation to the extent that this expands employment opportunities in ruralareas. Again, in Table 2.2 we see that a real devaluation will have apositive impact on the income share of the lowest four deciles of thePhilippine economy. This becomes insignificant for the rest of the decileswith the exception of the fourth quintile which has a drop in its income sharewith a devaluation. This could be the urban consumers which have a largerimported component in their consumption basket and are employed in importsubstituting activities.
2.16 When analyzing the magnitudes of the estimated coefficients,increases in underemployment have the largest impact in the earnings of thepoor, as measured by the share of the lowest 30X. Improvements inproductivity have the most important positive impact on the income shares ofthe poor. The Beta coefficients presented in Table 2.3 normalize themeasurement units and allow comparisons among the effect of the differentsignificant variables on the income shares of the poor. Once again, theseresults underline the importance of avoiding growing underemployment boththrough higher growth and by increasing the employment content of such

- 22 -
growth. Increases in productivity appear, in fact, as the most progressiveway of achieving higher employment given the large impact it has on the incomeshare of the poor.
Table 2.3: EARNING SHARE OF THE LOWEST THREE DECILESAND MACROECONOMIC VARIABLES
Variable Beta Coefficient /a Coefficient
Underemployment -0.92 -0.17Productivity (log) 0.81 1.84Real interest rates 0.42 0.01Covernment spending (log) -0.41 -2.04Real exchange ate (log) 0.39 1.36Inflate rate -0.13 -0.01
/a The Beta coefficients relate a one standard deviation in income shares toa similar change of the independent variables and therefore highlight therelative importance of each independent variable in explaining changes inthe dependent variable.
Source: Staff calculations
B. Tax and Expenditure Policies
Tax Incidence
2.17 The Philippine tax system provides few resources for redistribution,and relies heavily on regressive indirect taxes, with very little collectionof direct taxes. This results in one of the lowest tax burden among middleincome countries, and a shift away from vertical equity.
2.18 The most striking feature of the system is the country's very lowtax burden. Although the ratio of tax revenue to CNP in the Philippinss hasincreased since the 1960s, it has recently shown a downward trend. Thesystem's elasticity has also been extremely low. A large number of discre-tionary measures have been adopted to prevent revenues from falling further.Any expansion in government expenditures for equity or growth objectives willbe constrained by such low revenues.
2.19 After 20 years, the structure of taxation remains unchanged, withmost of the revenues coming from indirect taxation. In 1986, indirect taxa-tion accounted for 57% of total revenue, compared with 59X in 1966. Similarly,income taxes comprised 20.8% of total revenue in 1986, compared to 19.21 in1966, with the split between income and corporate tax remaining roughlyconstant.

- 23 -
2.20 Such a high share of revenue coming from indirect taxes isregressive, especially considering the low progressivity of the Philippineincome tax. The total amount of taxes paid by different income groups ispresented in Table 2.4. High income families spend 121 of their income inindirect taxes, while the poorer spend 20Z of their income in indirect taxes.Direct taxes are only slightly progressive. This, combined with the regress-ivity of indirect taxes, renders the whole system regressive.
Table 2.4: PHILIPPINES: INCOME AND TAXES PAID SY INCOME CLASS, 1985(In millions of pesos)
Income Income Total Direct Indirect Individual Fuel andClass Before Tax Taxes Taxes Taxes Income Tax Oil Taxes
I 1,700 359 91 239 11 91II 9,202 1,892 443 1,295 26 109III 22,207 4,728 1,152 3,204 117 298IV 26,770 5,718 1,381 3,889 136 394V 47,373 10,317 2,617 6,907 351 814VI 37,402 8,496 2,318 5,551 441 777VII 50,499 11,902 3,631 7,425 919 1,147VIII 47,225 12,173 4,279 7,103 1,435 1,380IX 63,396 18,782 8,039 9,681 3,422 2,224
Total 305,775 74,367 23,951 45,295 6,857 7,163
Source: NCSO, Survey of Family Income and Expenditures.
2.21 The effective rate of tax paid by higher-incomes families is lowerthan the effective rate paid by low income groups (Table 2.5). While poorfamilies pay 27% of their income in taxes, higher-income families pay only18Z. In fact, middle income families pay the largest proportion of theirincome in taxes. This points to a possible U-shaped pattern of incidence.
Table 2.5: PHILIPPINES: EFFECTIVE RATE OF TAX BY INCOME CLASS, 1985(In percentage of average family income)
Income All Direct Indirect Individual Fuel andClass /a Taxes Taxes Taxes Income Tax Oil Taxes
I-III 26.8 5.2 19.8 0.63 1.78IV-VI 32.1 8.8 23.3 1.16 2.70VII-IX 18.2 6.4 11.8 1.89 2.00
/a Weighted average of the rates applying to each class within the range;the weights are given by the number of families in each class.

- 24 -
2.22 However, the low revenues and the regressivity of the Philippine taxsystem do not arise from the statutory structure of taxation, but rather fromthe poor collection performance. While the country collects the revenues of alow-tax country, its tax legislation is that of a country with much higherrevenues. The Philippines has a comprehensive network of taxes, with ratesthat are not low by international standards. The existing tax code would leadone to expect much higher tax ratios, probably around 20Z.
2.23 It is the effectiveness of tax collection which determines, to alarge extent, the redistributive effects of taxation. The evidence on taxcollection, presented above, illustrates this point. Higher-income classeshave a lower tax burden than do low income classes. High income-familiesspend less of their income in indirect taxes than do the poorer groups.
2.24 Despite a number of past reforms, the heavy reliance on indirecttaxation continues to be a major problem. This is not only inequitable butalso promotes misallocation of resources and inefficiency. There is alsoample room to increase revenues from direct taxation through the furtherelimination of special exemptions. The 1986 tax package already dealt withsome of this exceptions. The movement to a value-added tax in 1987 hasprobably eliminated much of the distortions of the indirect tax system, whichit partially replaces.
2.25 The most important problem, though, is that of evasion and poorcompliance. Legal steps should be taken to make tax rules more conducive tocompliance. In addition, tax administration and enforcement should beimproved, particularly in the area of income taxation. In the medium term,the Philippines could gain more in terms of revenue and equity from measuresto improve tax compliance than from modification of the tax rates. Theoverall goal should be to raise the effective rate of taxation, not thenominal rate.
2.26 Recommendations. A number of steps should be taken to increasecompliance with existing laws and to raise taxes where appropriate. Theseinclude measures to prevent the abuse of deductions and to close legal loop-holes; the greater use of presumptive income levels for the self-employed; thedevelopment of enforceable reporting procedures for secondary employmentincome; the simplification of legal and bureaucratic procedures; and a reduc-tion in the number of income tax rates, in order to ease administration. Inaddition, there is no effective capital gains and low levels of real propertytax collection. The collections of estate and donors' taxes are very lowdespite their very high rate. A detailed study of the potential of thesetaxes, together with the administrative needs to make them operational, isneeded. Finally, and most importantly, measures should be taken to improvethe ability of the BIR to deal adequately with tax avoidance and taxevasion. This includes increasing human and capital resources to fightunderreporting of income and outright evasion of taxes. A program ofcomputerization and training in this area could yield high returns.

- 25 -
The Composition of Government Expenditures
2.27 Both the level and the composition of government expenditures havefluctuated somewhat over the years. Social services accounted for almost onethird of total expenditures up to 1972, but dropped after that, to less thanone fifth of expenditures in the rest of the decade. At the same time,services, especially infrastructure and utilities, took an increasing share oftotal expenditures, accounting for 402 after the first oil shock.
2.28 Overall expenditures sharply dropped during the 1983-85 stabiliza-tion period, returning to their previous levels in 1986. While the sharedevoted to social sectors, agriculture, and other poverty oriented programshas been relatively stable, the composition of other expenditures changedduring the 1980s. Economic services and defense dropped significantly, whileexpenditures on debt service and administration reached almost half of overallexpenditures. With the cutback on utilities and infrastructure during thestabilization period, the share of expenditures in economic services droppedto 232 on 1984. Defense expenditures continued a longer-term downward trendfrom 19.3X in 1976, to 11.3Z in 1981, 9.6Z in 1984, and 8.22 in 1986. Debtservice, including interest and amortization, increased from 18.72 in 1976 to24.72 in 1986. General administration had the largest increase, from 4.82 oftotal expenditures in 1976 to 24.5Z in 1986.
2.29 Social Services. The Philippines spends less than half of whatother similar countries spend on social services, partly as a result of thesignificant participation of the private sector in both education and healthcare. Lower middle income countries with a per capita GNP similar to that inthe Philippines devote around 6.62 of GNP to social expenditures (Table 2.6).
Table 2.6: SOCIAL SPENDING: PHILIPPINES AND LOWER MIDDLE INCOMECOUNTRIES, 1985
(2 of GNP)
Lower middle incomePhilippines countries
Government Total Government Total
Education 1.8 n.a. 3.7 n.s.Health-care 0.6 2.5 1.0 n.a.Nutrition 0.06 - n.s. -Social Security 0.7 0.7 1.9 2.5Housing 0.4 3.7 n.a.
Total 3.6 - 6.6
Source: Staff calculations.

- 26 -
During the last decade, the Philippines spent on average less than 3X of itsnational product on social services. Recognizing this deficit, the MediumTerm Plan aims to increase the share of social services in government expendi-tures to an average of one third during 1987-92. The largest percentageincrease is projected for health services, while education would receive thelargest allocation in absolute terms, accounting for 152 of total expendi-tures.
2.30 The share of social services in total national government expendi-tures has averaged about 20% in recent years. There was a serious drop duringthe adjustment period when they declined to 2.4X of CNP, and despite increasesin 1986, real per capita expenditures in social services, were still below1983 levels (see Figure 3.1). This reduction represents important cuts inmaintenance and operating expenditures in health, education, and otherimportant subsectors. The increase in social expenditures of over 45% in realterms in 1987 has helped restore the level back to 1983 rates, but may stillbe inadequate.
2.31 Within the social sectors, education continued to receive thelargest budgetary share in the 1980-84 period, and rose even more after 1985in line with the new government's priorities. A significant rise in thebudget for housing and community development took place between 1979 and 1983following the implementation of the nation's shelter program and the estab-lishment of a provident fund for the financing of home mortgages. The shareof housing has decreased since then, consistent with a new emphasis onprivatization and with the recognition that they were mainly benefitting highincome families. The health subsector received an almost constant share ofthe public budget in the 1980s despite the implementation of the primaryhealth care approach in 1980. Furthermore, national government transfers tohighly specialized hospitals which became significant from 1983 onwards, werealso regressive. Social security, welfare, and other services continued toreceive diminished budgetary shares, particularly during 1980-83.
2.32 Programs in the social sectors have the potential of amelioratingsome of the worse aspects of poverty: malnutrition, illness, and illiteracy.In some cases, the Government has programs with extensive coverage (e.g.primary education), but there is a need to improve the quality of services,particularly in rural areas. In most cases (i.e. health care, nutrition,family planning) there is a need to expand both the coverage and quality ofservices (see Fig. 3.2). The cost of expanding social programs can be reducedby a more careful attention to cost recovery from the non-poor. By increasingcost recovery from those services which benefit the rich (e.g. hospitalservices, high education, housing) more resources can be devoted to providingfree basic services to the poor. Likewise, the Government should rely more onthe private sector to meet the needs of the non-poor, and focus on more basicservices. It should avoid programs that, even with full c st recovery, willnot benefit the poor, such as expensive programs designed to produce middle-class housing and urban curative health facilities. Some attention needs tobe devoted as well to the possibility of extending the social security systemto the lower income groups and old age people below the poverty line.

- 27 -
Figure 3. 1
Public Social Sector Expenditures(per ccpta, 1978 prices)
. ~~~~40-
120 -
1104
100
90
so
70
60
40-
30
20
1976 1977 1978 1979 190 1 91 1982 1963 1964 1966 186 1067
0 totd + | dan d ualh
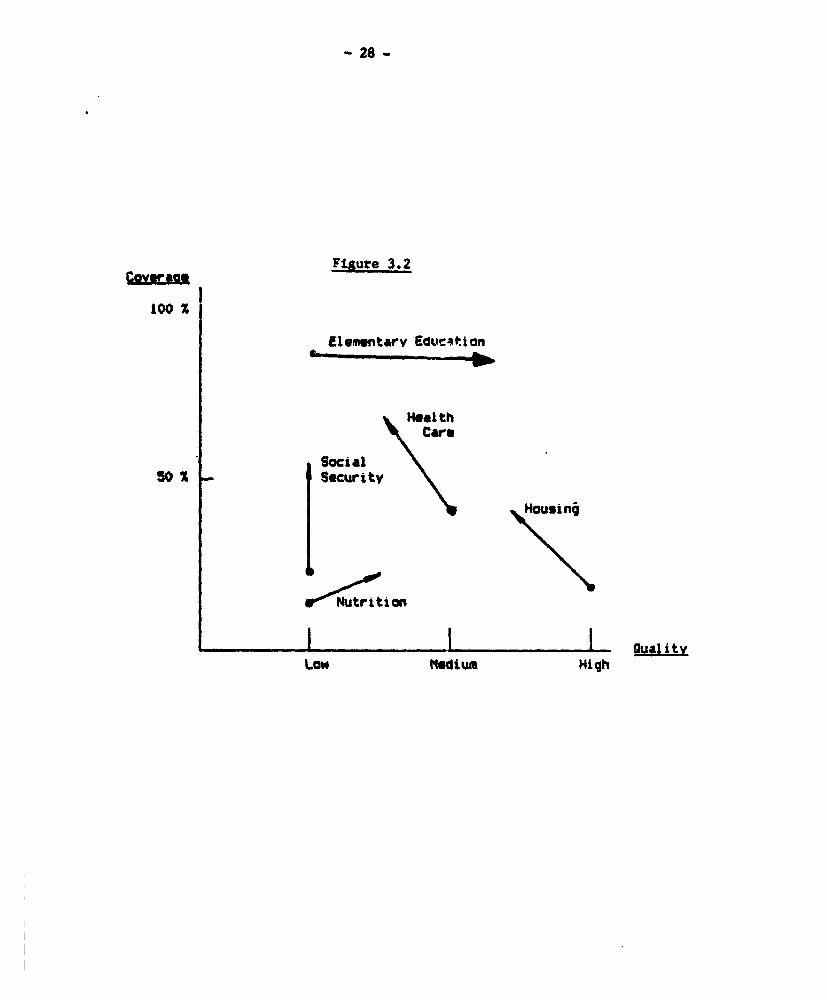
- 28 -
Figure 3.2
Gov - ^e
I100 %
Elementarv Educ^t.ion
HealthCare
Social50 X . Security
i~~~~~~~~~~~~og \~
l~~~~~~,-14 l t t _ an| t~~~~riti~aon
I Io d High
Low medium High

29 -
2.33 Public Investment. Historically, the level of public investment inagriculture, social services and other poverty oriented activities has beenless than 20Z of total investment. Public investment, which expanded quicklyafter the oil crisis of 1979, also contracted quickly during the 1983-85stabilization period. Most of this contraction, however, took place in theenergy, power and infrastructure sectors which had been expanded rapidly inprevious years. Thus, poverty-oriented investments tended to fall onlyslightly, and remain a small portion of total investment (see Figure 3.3).
2.34 The incidence of public investment is particularlv difficult toassess. In the short run, the main impact is through the effect on economicactivity and levels of employment. In the long run, public investment canincrease the productivity of small farmers, or the profitability of largeprivate sector projects. The income distribution impact of public investmentprojecto ras analyzed in a comprehensive study covering the 1978-83period.- The study concluded that, while most infrastructural projects hada positive effect on income distribution, small-scale industry projects,aquaculture production and some social areas (such as education loans) had anegative impact on reducing inequality. The positive effect on incomedistribution was particularly important in the area of small-scale irrigation,feeder roads, and electrification.
2.35 Overall, more effort should be made to increase the poverty contentand employment impact of the public investment program. The CommunityEmployment Development Program (CEDP) was a useful initiative started in 1986,which was designed to produce rural infrastructure using labor intensivetechniques, with a maximum amount of local participation and control. Thedecentralized nature of CEDP, and the difficulties of controlling a largenumber of small projects, resulted in a mixed record of success. On the onehand, a large number of road, school and irrigation projects were undertakensuccessfully and employment increased. On the other hand, some funds werediverted or wasted, due to inadequate financial controls and lack ofsupervision. The CEDP program has now been incorporated into the bvudgets ofthe executing agencies, and will no longer appear as a separate program. Theuseful lessons of the CEDP should not be forgotten, however, and attentionshould be devoted to continuing the approach of locally directed, laborintensive, rural infrastructure projects.
2.36 In urban areas, the Government needs to build on the success of theTondo Foreshore and other slum up-grading projects, and develop programs whichimprove conditions in urban squatter settlements. Urban land reform, whichgives land titles to squatters, is essential in order to give private incen-tive to upgrade housing. This should be part of area development programswhich provide essential public services: water, sanitation, drainage, roadsand schools. Past housing program, which adopted standards which could not be
10/ ESIA/WID Project. For a summary related to income distribution, seeAlburo (1986). Alburo, Florian A., "The ESIA/WID Micro-ComponentProject," Development Research News, Vol. IV, No. 4 (July-August 1986),pp. 1-5.

Figure 3.3
Public Investment. 1979-88WdUNm p.ma 34 -re
0~6
so cvO
NM. VW mi m m mm m i mm
a + go" .9 i

- 31. -
afforded by the poor, have been rightly abandoned by the present Government,and should not be restarted. Any subsidy element from present housing loansshould also be removed on the basis that lover market interest rates providelarger benefits to the larger borrowers.
C. Land Reform and Rural Development
2.37 Rural poverty continues to be a major problem in the Philippines,and one which promises to grow worse over time. At present, about 67% of allpoor families are in rural areas, and 64% of all rural families are poor,compare to 56X in 1971 (NEDA estimates). Fundamentally, the problem arisesfrom a growing population/labor force which cannot be absorbed productively inurban employment, and which increases pressure on agricultural resources.Thus, there is a tendency for surplus population to migrate to upland areas tofind new land, for average farm size to fall over time, and for the number oflandless workers to increase.
2.38 Current government strategies recognize the growing poverty problem,and the need to combine equity and efficiency objectives. The major newthrust, however, consists of emphasizing an increase in farm profitability,rather than productivity and national self-sufficiency. While this goal makessense, it is not clear that it will necessarily benefit the poorer farmers.In the past, innovations have often been adopted by the middle-income farmers,rather than the small and poorer farmers.
2.39 Poverty in rural areas can be reduced by giving poor farmers moreproductive assets, increasing the productivity of existing assets, or throughgreater access to public services. All of these strategies have been pursuedin some degree in the past, with mixed results. The emphasis of the UpdatedMedium Term Plan on reducing poverty is commendable, but the precise strategyof the Government in the future is still somewhat unclear. While much atten-tion has been directed at the need to improve the system of research andextension, for instance, it is not clear that this can been done effectively,or in a way that will benefit the poor. In the discussion below, somespecific poverty-oriented interventions for the rural sector are discussed.
2.40 The pressure for agrarian reform was heigthened by the economiccrisis of the last few years and the insurgency which draws recruits heavilyamong the landless. Presidential Executive Orders (E.O. 228) outlined aComprehensive Agrarian Reform Program (CARP). This program provides forfaster settlement of rice and corn lands; a program that was initiallyundertaken in 1972, but remains largely unfinished. Land owners would becompensated through ten year bonds with market interest rates, a decidedlysuperior form of compensation over previous arrangements under which bondswere repaid over 20-30 years at a fixed 6% interest. The negative cash flowto the Land bank would be covered by the Government. Unlike the old system,landowners would not be able to delay the land transfer by contesting thevaluation and payment through the courts. Payments not accepted by thelandowners would be held in escrow.
2.41 Other components of the CARP include the distribution of foreclosed

- 32 -
and sequestered land, sugar and coconut lands, and giving titles to squatterson public lands. Excluding this last part, a fully implemented CARP couldcover 4.4 million ha, of which 3.3 million are coconut and sugar lands. Sinceabout 2 million ha of the potentially affected area are already tenanted,2.4 million could be provided to landless workers in the rural areas. With anaverage farm size of 1.7 ha, the CARP could benefit 1.4 million landlessfamilies.
2.42 The goals of the CARP are ambitious, administratively complex, andpolitically sensitive. In terms of overall size, the proposed program rankswith those undertaken in several other countries (see Table 2.7). In terms ofland area, the Philippine program would be larger than that of Japan's landreform, but smaller than that undertaken by Mexico, Peru and Chile.
Table 2.7: AGRARIAN REFORMS COMPARED
Country Reformed Area (ha) Households Time Period
South Korea 577,320 1,646,100 1948-1958Mexico 81,456,500 2,772,300 1915-1976Chile 9,861,500 272,400 1965-1973Peru 8,296,100 359,600 1969-1979Nicaragua 1,766,300 83,300 1979-1985Japan 2,000,000 4,300,000 1946-1949Philippines (1972). 265,000 190,000 1972-1985Philippines (CARP)/a 4,400,000 2,575,000 1987-1992
/a World Bank estimates; exciudes resettlement of public land.
Source: World Bank "Agrarian Reform Issues in the Philippines"(May 12, 1987) p.13.
2.43 Republic Act No. 6657 was signed into law on June 10, 1988 andprovides the basis for the implementation of a comprehensive agrarian reformprogram. RA 6657 defines more fully the scope and priorities of the program,including: retention limits; exceptions and exclusions; basis for landvaluation; the privileges granted to multinationals and commercial firms; andadministrative mechanisms. Considerable work is still required of theDepartment of Agrarian Reform to formulate implementation guidelines.
2.44 Since under the present law, farmers would have to pay for land thenet benefits to the farmer depend heavily on the valuation of the land placedby the Department of Agrarian Reform (DAR). Landlords must file a declarationof land value. The final land value will be based on this, plus considerationof such factors as assessed values, recent land sales, and loan appraisalvalues.
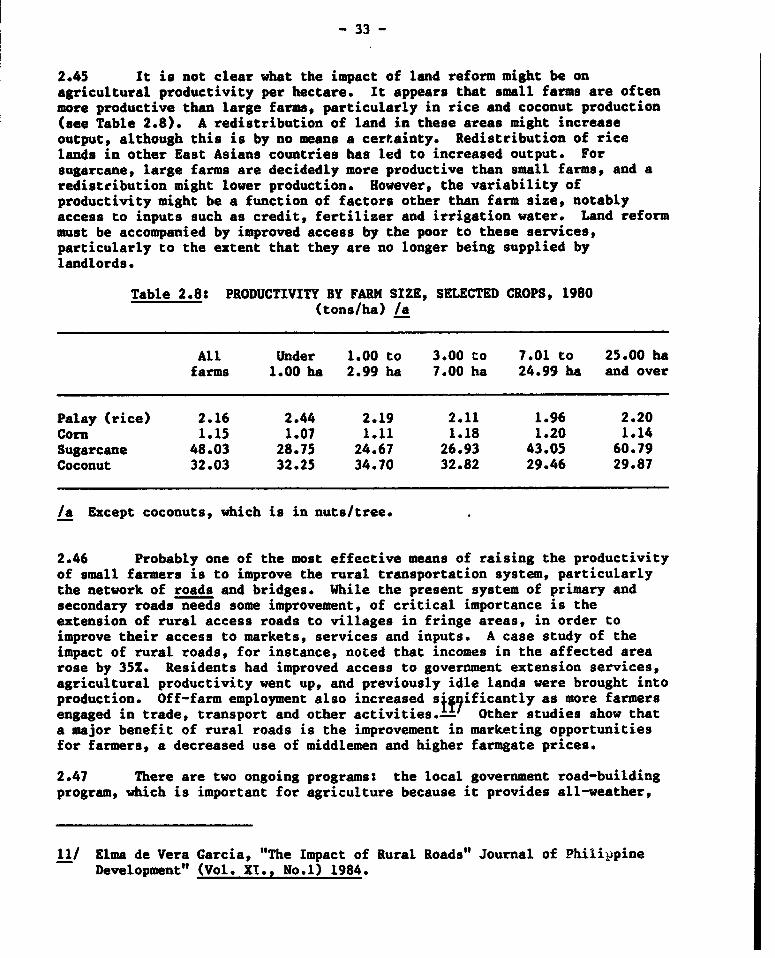
- 33 -
2.45 It is not clear what the impact of land reform might be onagricultural productivity per hectare. It appears that small farms are oftenmore productive than large farms, particularly in rice and coconut production(see Table 2.8). A redistribution of land in these areas might increaseoutput, although this is by no means a certainty. Redistribution of ricelands in other East Asians countries has led to increased output. Forsugarcane, large farms are decidedly more productive than small farms, and aredistribution might lower production. However, the variability ofproductivity might be a function of factors other than farm size, notablyaccess to inputs such as credit, fertilizer and irrigation water. Land reformmust be accompanied by improved access by the poor to these services,particularly to the extent that they are no longer being supplied bylandlords.
Table 2.8: PRODUCTIVITY BY FARM SIZE, SELECTED CROPS, 1980(tons/ha) /a
All Under 1.00 to 3.00 to 7.01 to 25.00 hafarms 1.00 ha 2.99 ha 7.00 ha 24.99 ha and over
Palay (rice) 2.16 2.44 2.19 2.11 1.96 2.20Corn 1.15 1.07 1.11 1.18 1.20 1.14Sugarcane 48.03 28.75 24.67 26.93 43.05 60.79Coconut 32.03 32.25 34.70 32.82 29.46 29.87
/a Except coconuts, which is in nuts/tree.
2.46 Probably one of the most effective means of raising the productivityof small farmers is to improve the rural transportation system, particularlythe network of roads and bridges. While the present system of primary andsecondary roads needs some improvement, of critical importance is theextension of rural access roads to villages in fringe areas, in order toimprove their access to markets, services and inputs. A case study of theimpact of rural roads, for instance, noted that incomes in the affected arearose by 352. Residents had improved access to government extension services,agricultural productivity went up, and previously idle lands were brought intoproduction. Off-farm employment also increased sjgqificantly as more farmersengaged in trade, transport and other activities . Other studies show thata major benefit of rural roads is the improvement in marketing opportunitiesfor farmers, a decreased use of middlemen and higher farmgate prices.
2.47 There are two ongoing programs: the local government road-buildingprogram, which is important for agriculture because it provides all-weather,
11/ Elma de Vera Garcia, "The Impact of Rural Roads" Journal of PhilippineDevelopment" (Vol. XT., No.1) 1984.

- 34 -
graveled farm-to-market roads, but is constrained by implementation limita-tions, despite assistance from the Bank and other external sources. Thesecond program is a labor-intensive barangay road construction/maintenanceprogram undertaken by the Department of Public Works and Highways (DPWH) undera special employment-generation program started in 1986--the CommunityEmployment Development Program (CEDP).
2.48 Both programs need to be expanded, and both warrant further externalassistance. Before an expanded program can be identified, it is necessary toestablish priorities for agriculture and rural poverty alleviation. Forexample, how much emphasis should be given to constructing simple roads (andbridges) at the barangay level to open up previously inaccessible areas,compared with upgrading provincial roads to better serve areas of existingagricultural importance? The capacity of both local governments and DPWH toundertake an expanded road construction/maintenance program needs to beexpanded.
2.49 Agricultural credit in the Philippines has had a checkered historyover the last 25 years. Prior to the 1960s formal sector credit went only tothe largest farmers. Then a rapid expansion took place, especially in the1970s, in connection with the introduction of high yielding varieties ofrice. The rural banks played the major role in providing formal sector creditto smaller farmers, utilizing very cheap rediscount privileges with thecentral bank, and other subsidies as well. Laxness in the system led toconsiderable arrearages, and the supervised credit programs declined rapidlyin the early 1980s. With the fiscal crunch of 1984, the government greatlytightened access to rediscount privileges. The flow of funds to agriculturewas sharply curtailed and many rural banks found themselves in severe diffi-culties. Meanwhile the informal sector, once dominated by landlords andspecialized moneylenders, grew rapidly with the increasing involvement oftraders, millers and other new types of lenders.
2.50 A major policy decision must now be made as to whether to attempt are-expansion of formal credit on a firmer base than before, or to accept thatthe informal sector can do most of the job more efficiently. Though competi-tion in the informal sector has bid interest rates down in some regions, theyremain high in others. In some cases the main purveyors of credit to thepoorer farmers are larger farmers, for whom the lenders' risk is not a seriousproblem because they are willing or anxious to foreclose and take over theland.
2.51 The development of a "new informal sector" might provide thelinkages between the formal banking system and the farmer clients. Thesecould include a variety of informal groups such as credit cooperatives,wholesale and retail traders, and farmers associations. All these could besupported through links to the formal credit system. However, the ruralbanking system is in considerable disarray, so galvanizing it to meet newchallenges will not be easy. The government is in the process of implementingprograms for the restructuring of the rural banking system, through acombination of fresh equity inf-isions by owners, and the writing-off ofarrearages owned to the Central bank. These programs should result in asystem that relies more on domestic savings and less on Central Bankrediscounting.

- 35 -
2.52 A number of steps have been taken to correct the bias againstagriculture profitability. The dismantling of input and output monopolies,maintenance of steady prices in the major crops at reasonable levels, andcurtailment of excessive protection for agriculture inputs from themanufacturing sector are all appropriate stepc in this direction. Theirlikely effects, while certainly important, should not be exaggerated to thepoint where they are viewed as a substitute for programs that will directlyaffect the poor.
2.53 Measures with short-run effects are undeniably important since thekeys to longer run productivity growth-increased investment in infrastructureand in research and extension-will be able to carry the agriculture sectoronly after a certain lag. Irrigation investment, which was very important tothe output increases of the 1970s has slowed down in recent years. TheGovernment should continue to promote the rehabilitation a.d maintenance ofirrigation system, a labor intensive activity. The focus of new irrigationinvestment should continue to be shifted towards communal small scale irriga-tion projects. These will not only have a better chance of reaching poorfarmers but they also have higher rates of return than the now more marginallyprofitable large scale systems. Although the Government does give priority tooperation and maintenance and rehabilitation over new construction, and infavoring communal and small scale schenes, some of the large new irrigationschemes included in the medium term plan seem to run counter to this strategyand should be reevaluated. It would also be useful to review the experiencewith self-help maintenance to see whether a more successful model for handingmaintenance over to irrigation associations can be derived. The potential fordeveloping low-cost irrigation facilities on individual holdings should alsobe explored.
2.54 Investment in research has been ineffective in reaching the poorfarmers. However, technological improvements will have to carry an increasingshare of the burden of rising output. Agricultural research in thePhilippines is in relatively good shape, organizationally and in terms ofpersonnel. But it is seriously underfunded for the task it faces, particu-larly in undertaking further research on non-traditional crops, testingprofitable cropping systems for more marginal rainfed zones, and developinglow-cost production and processing techniques that would be of specialimportance to the poorest farmers. A weak link is the delivery system. Theextension services suffer from excessive duplication between agencies,overstaffing, poor pay, and lack of mobility. All these result in poormorale, lack of focus and limited impact. There is an urgent need toestablish a cost-effective service that will tell poor farmers what they needto know and feed their information back to research activities.
D. Population Policy
2.55 The continued rapid growth of population remains one of the mostcritical problems in the Philippines today. If present trends continue, andonly a slight decline in fertility takes place during the next 20 years, thepopulation will almost double in the next 20 years. While the overall popula-tion growth rate is around 2.5X, the working age population will grow at 2.8%.

- 36 -
In order to employ this labor force will require (a) a very strong andsustained economic growth; (b) a marked increase in the employmont content ofthat growth; and (c) well targetted supplemental public employment programswhich raise the incomes of the poorest groups.
2.56 Between 1960 and 1975, crude birth rates declined. But since 1975,the crude birth rate has actually risen slightly, reflecting an increase inthe number of women in child bearing years, earlier marriages, and a slowdecline in female fertility. Fertility rates are higher among poor house-holds, in rural areas, and among the less well educated women. Ruralfertility rates are 40X higher than urban rates. Women with little educationhave an average of seven children; those with seven or more years of schoolinghave an average of 3.8. Contraceptive usage also varied by the same factors;it is lower among poorer households, in rural areas, and among women with lesseducation. Yet the demand for contraceptive supplies among the poor is high,but often cannot be afforded.
2.57 The Government's recently adopted "Population Policy Statement"(April, 1987) provides a broad framework for addressing the problems of unmetdemand for family planning services. In the past, Government programs havesuffered from inadequate funding, resulting in clinics and outreach workershaving inadequate supplies. While the strategy of a combined clinic-basedoutreach network should be continued, it needs more adequate funding.Barangay level service workers should be integrated with health and nutritionservices, and their efforts focused on the highest risk groups.
E. The Social Sectors
Health and Nutrition Policies
2.58 Health Status. On average, health and nutrition indicators for thePhilippines give a relatively favorable picture, one which is comparable toother countries of its income .:vel. However, there are wide regional varia-tions in these indicators, and substantial evidence that the public healthsystem does not reach the poor. Infant mortality, which is only 44 perthousand in Manila is 113 in some parts of Mindanao. Infant mortality isclearly higher among the poor and less v.:il educated, and in those familiesalready having large families. In rur#: areas, only about one-third of birthshave medical attendance; in urban areas figure is over 701. Among all agegroups, easily preventable infectious and communicable diseases account for411 of all deaths. These are directly related to poor sanitation, crowdedliving conditions, poor nutrition and ignorance of proper health practices.
2.59 Nutrition. Nutritional problems in the Philippines are primarilytbose of dietary/nutrient inadequacies among low-income groups, and oelowaverage growth in preschool children. While some progress was made between1978 and 1982 in improving the nutritional status of the population, thisprogress was reversed during the 1982-85 period. For instance, the proportionof children below the weight-for-height standard was 141 in 1978, but declinedto 10% in 1982, and then rose back to 141 in 1985. Experience gained fromnutrition projects show that substantial impact can be achieved with a limited

- 37 -
number of components delivered to a clearly defined target population. Mostof present Government programs aim at children 7-14 through school feedingprograms. Yet the most apparent malnutrition is among preschool children.The present Government programs are scattered among a number of agencies withno central coordinating body.
2.60 The Health Care System. The existing health care system has notbeen adequate in dealing with the health needs of the population, particularlythe larger majority who are poor. The present pattern of diseases suggeststhat greater efforts are needed in promotive and preventive health careservices, including immunization, environmental sanitation and hygiene, nutri-tion, family planning, breast feeding and maternal care. It also calls for awider coverage of basic curative services in the rural areas, and strongerefforts to counteract inappropriate beliefs and attitudes about health careprevalent among the poor.
2.61 While the hospital bed ratio is about one per 600 population (1985),about half of these are in private hospitals. As a result, there is an unevendistribution of facilities, with the bed ratio being 1:200 in Manila and ashigh as 1:1,000 in the poorer regions. Public health facilities for the ruralpopulation are provided mainly through the rural health units (RHUs) andbarangay health stations (BHSs). While RHUs and BlSs are relatively moreevenly distributed across the country than hospital beds, they are generallyaccessible to the populition residing close to towns, and a large part of therural population resides in remote rural areas far from these facilities. Thesystem is supplemented by various non-governmental organizations (NGOs), whichprovide mainly maternal and child health care (MCH), family planning andnutrition services. Although they focus on the depressed areas of thecountry, their size of operations are relatively small. A large majority ofthe rural population continues to rely upon the services of traditional healthpractitioners.
2.62 The Department of Health has launched a major review of its programsand identified several important ways of improving services, particularly forthe MCl program. In general, there is a need to develop a system that targetspoor households in each barangay, particularly those who are nutritionally atrisk, and concentrate MCH interventions on these households. In addition,there is a need to emphasize informaticn, education and motivation componentsof the program in order to generate appropriate demand from target households,and to improve home management of simple diarrheal and respiratory infections.This approach needs to be supplemented with an expanded role for the voluntaryhealth workers (VUWs) in identification, education and referral activities.
2.63 The budget for health care needs to be expanded and expendituresfocused on preventive, rather than curative, care. An expanded primary healthcare system will require more resources to finance:
(a) a larger number of health workers;
(b) training of primary health care workers;
(c) improved management and supervision of VHWs;

- 38 -
(d) increased facilities, drugs, supplies and logistics at the BHS/RHUlevel; and
(e) development of health and nutrition information strategies.
2.64 After a period of budgetary reductions (1984-86), a major effort isbeing made now to restore expenditures to past levels. An expanded program,however, will require additional resources, raising real per capita expendi-tures above past levels. Greater efforts at cost recovery of public serviceexpenditures from the non-poor is one possibility for reducing this resourceburden. At present, cost recovery in public hospitals is only 10 of totalexpenditures. Even if fully paid, fee schedules are presently below themarginal costs of providing services for the non-poor. On the other hand,because of a lack of supplies, the indigent must often purchase medicinesoutside of hospitals. Fees schedules should be adjusted upwards, and the non-poor asked to pay the difference between Medicare reimbursements and hospitalcosts. Hospital care and medicines should continue to be provided to poorfree of charge.
The Education System and Poverty
2.65 Relative to other countries, the Philippines has attained a highlevel of educational development. More than 90X of primary students werealready enrolled twenty years ago. Besides continued high primary enrollment,the Philippines currently enrolls 70Z at the secondary level and 30Z at thehigher level. Despite these attainments, the education system is inequitableand public schools are deteriorating.
2.66 The System. The Philippine education system combines both privateand public facilities. At the primary level, most students attend free publicschools. Inequality in the elementary system stems mainly from the variancein the quality of the public system. Poorer communities and students get thepoorer facilities. The ratio of textbooks per pupil, for instance, is higherin urban schools than in rural ones, and is higher for students from highincome families. As a result of these and other factors, low income studentstend to have higher dropout rates, and score lower in attainment tests.
2.67 At the secondary level, 42Z of students are enrolled in privateschools whose fees are regulated by the Government. In the public sector,local secondary schools cater to the poor, have low costs, and low quality.National and city schools are high quality and high cost institutions whichserve high income groups, but whose tuition fees are lower than those of localschools, because they are subsidized by the national Government. At thehigher level, the private sector accounts for 78Z of enrollments. Stateuniversities and colleges (SUC) tend to offer a higher quality of education,but charge lower tuition fees than private institutions.
2.68 Investment and Policy. Analysis of rates of return in educationshow low rates of both social and private profitability. With an averageprivate return from a year of education of 8%, it would appear that expandinginvestment in education may not be economically justified. However, the

- 39 -
impact of additional investment might be stronger if targetted to financeinexpensive ways to enhance school quality, which could improve learningachievement and raise completion rates. In order to lessen the regressivityof the present system, the Government should consider taking steps to:
(a) distribute non-wage expenditures evenly across all schools;
(b) establish minimal standards for facilities for public schools,similar to those established for private schools;
(c) raise fees at public higher education facilities, and expandscholarship funds for low income students; and
(d) reduce tuition fees at barangay secondary schools by taking thefinancial responsibility for all recurrent expenditures.

- 40 -
III. EMPLOYMENT AND POVERTY
A. Labor Market Trends
3.1 The lack of employment and the growing labor supply in thePhilippines is at the core of the poverty problem. Every year, over 700,000new entrants join the existing labor force, which already includes fivemillion under or unemployed workers. In the future, the expansion of thelabor force will be even more dramatic given the failure to keep downfertility rates in the last decade. Much of the future labor force alreadyhas been born and, regardless of any current population programs, there willbe 16 million new entrants in the next 15 years. Further contributing tounemployment is the fact that there have been productivity declines inmanufacturing over the past two decades. During 1980-86, the largestemployment generators, agriculture, services, have created jobs for theequivalent of less than two years of new entrants to the labor force. Inmanufacturing, however, net new job creation in the eighties has beennegligible.
3.2 Two sets of distortions have adversely affected the employmentcontent of growth: those that have affected the sectoral composition ofoutput and those that have increased the relative cost of labor. Traderestrictions have fostered the expansion of import competing industries at theexpense of agriculture. Internal price policies, which have kept the price offood down, have also discriminated against agricultural growth. To the extentthat agriculture's labor intensity is greater than that of protectedindustries, these policies have had a negative net effect on employmentgeneration. Negative real interest rates, undervalued exchange rates, fiscalincentives to investment, and imports of capital goods with no import duties,have all been a source of cheap use of capital. These policies haveincreased, therefore, the relative cost of labor over and above the onecorresponding to the relative abundance of labor in the Philippine economy.
Labor Supply and Unemployment
3.3 Although the labor force expanded rapidly in the 1970s, employmentgrowth could keep pace due to rapid economic growth and expansion of servicesand own accounted activities. During the 19120, the Philippine labor forcegrew at a yearly average rate of about 3.6X._ The expansion of the laborsupply was matched with an employment growth of 3.7X per year in the 1970s(NEDA 19% 8 a rate that was in line with the observed average yearly growth ofthe CDP.A- Consequently, unemployment decreased during the first part of thedecade and then stabilized after 1976 at relatively low levels.
12/ In 1971-75, the average growth rate reached 3.4Z per year, and it furtheraccelerated to a yearly average of 3.7Z in the period 1976-80 (NEDA(1986)). These rates are not strictly comparable allowing to changes indefinitions (see Annex at the end of this chapter).
13/ In fact, during 1971-75 average GDP growth was of about 6.6Z per year andduring 1976-80, a 6.2% per year. Thus, the implicit employment outputelasticity was of about 0.6.

-41 -
3.4 The trends of rapid labor force expansion and low labor productivitybegan to show their cumulative effect in the early 19809, and were furtherexacerbated by the drop in domestic activity. (Table 3.1). Although thelabor force continued to expand at above 3% per. year, CDP dropped by more than101 in the adjustment period. As a result, by 1986 open unemployment reached11.11 and underemployment 16.5%. During the 1980s, there has been a largeexpansion in employment in urban services and subsistence agriculture toabsorb both displaced workers and new entrants to the labor force.
3.5 Labor force growth declined during the recession suggesting thatparticipation rates are positively correlated with economic growth.Estimations of Philippines labor supply show that the GDP elasticity ofparticipation rates is greater than one, which suggest that labor force growthis procyclical. Participation rates of females and young workers in factdropped during the stabilization period.
3.6 NCSO statistics, show that the labor force grew 3.5Z per year in1980-82, and 3.2Z in 1984-86. Due to changes in definitions during 1983-84,the rural/urban components of the labor force significantly changed showing alarge growth in urban areas and a decline in rural areas. In order to takeinto account the effect of this statistical change, the analysis in thisreport is based on both the rate of change in national series (i.e. urban plusrural) and in the rate of growth in 1980-83 and 1984-86 of the rural and urbancomponents. As seen in Table 3.1, the rate of growth of the labor force isvery similar in both periods, thus indicating the change in definitions causedju!st a one time change in levels, but not in the underlying trends during theperiod.
3.7 Underemployment levels importantly picked up in the 1980s, relativeto the observed averages of the 1970s. High growth of the labor force in the1970s, combined with relatively sluggish job creation in industry, inducedmore employment absorption in the urban informal sector and in subsistenceagriculture, leading to an increase in underemployment. Some of the defini-tions of underemployment used by the statistical office and other authors aresomewhat controversial as an adequate measure of potential supply. However,if one defines underemployed as those working less than 65 days in a quarterand reporting their willingness to work additional time, underemployment inthe 1980. more than doubled compared to its 1970 levels. If one looks at theless ambiguous category of urban underemployment, the same conclusion holds.The rate of household heads working less than 40 days a quarter and declaringtheir desire to work additional time, also grew significantly throughout the1980s.

- 42 -
Table 3.1s PHILIPPINES: LABOR FORCE STATISTICS
AverageCrowth Rate per annum
1980 1982 1984 1986 1980-82 1984-86 1980-86(thousands) (percentages)
Working AgePopulation 29,155 30,978 32,920 34,853 2.2 2.9 3.02
Urban 9,646 10,265 13,043 13,841 2.9 3.0 6.20Rural 19,509 20,713 19,877 21,011 3.0 2.8 1.24
Labor Force 16,855 18,048 20,257 21,578 3.5 3.2 4.20Urban 5,162 5,685 7,629 8,169 4.9 3.5 7.95Rural 11,622 12,342 12,627 13,410 2.9 3.0 2.40
Employed 15,491 16,336 18,104 19,192 2.7 3.0 3.60Urban 4,587 4,881 6,420 6,707 3.1 2.2 6.50Rural 10,904 11,455 11,683 12,485 2.5 3.4 2.30
(proportion of the labor force)
Unemployment /a 8.1 9.5 10.6 11.1Urban 11.1 14.1 15.8 17.9Rural 6.5 7.2 7.5 6.9
(Z)Underemployment /b 13.0 16.5 17.6 16.5
Urban 8.4 12.1 11.9 10.9Rural 14.9 18.4 20.8 19.8
/a The unemployment definitions have been recently revised and the referenceperiod is based on the "past week" rather than "past quarter".
/b Those who worked less than 65 days during the quarter, but still wanted to workadditional time, expressed as a proportion of the labor force.
Source: National Cezsus and Statistics Office (NCSO).
3.8 The Philippines stands out in relation to countries at similarincome levels in that manufacturing and agriculture have a lower share oftotal employment, while the service sector has a very high share of employmentbut an atypically low share of output. The Philippinas remains a predomi-nantly rural and agricultural country in terms of population and labor force;as of 1985, about half of the labor force was found in agriculture, fishingand forestry. The share of output coming from agriculture is, however, muchlower, at about 22Z in 1985, of which only 16.21 was in agriculture proper.

- 43 -
The labor market pressure has affected the service sector, which as a resultis characterized by far lower relative labor productivity than is typical incountries at the Philippines income level (Table 3.2). A large part of this"employment" reflects the forced absorption by the sector of redundantworkers, and a high degree of underemployment in the sector.
Table 3.2: SECTORAL SHARES IN OUTPUT AND EMPLOYMENT - PHILIPPINESCO5PARED TO COUNTRIES AT SIMILAR LEVELS OF DEVELOPMENT, 1984
IndustryAgriculture Overall Manufacturing Service
PhilippinesOutput 25 34 23 41Employment 52 16 9 33
Fifteen Countries withSimilar Levels of PerCapita Incomeoutput 24 29 19 46Employment 62 13 15 25
Source' We ld Br1A k Wn-in neU iomzw Retmrt. ±9oo. d-, I-' F'7S
Labor Statistics.
3.9 During the 1980-86 period, self employment expanded faster than wageand salary employment. In particular, employment in trade and services, whichtypically include informal activities, grew at 8.5% and 12.2% per yearrespectively during the period (Table 3.3). Agriculture wage employment was,by and large, the biggest among sectors, especially during the crisis.Services wage employment did not expand faster than in the 70's. Job creationin manufacturing was slow during the seventies, and practically zero in theeighties.

- 44 -
Table 3.3: PRILIPPINES: EMPLOYMENT BY INDUSTRIES(000's)
Growth rate1980 1982 1984 1986 1980-86
Wage and Sglary 7,720 7,484 8,702 8,958 2.51
Agriculture 1,474 1,480 2,149 2,102 6.09Mining 81 64 108 103 4.09Manufacturing 1,249 1,228 1,240 1,267 0.24Electricity,Gas and Water 52 59 65 60 2.41
Construction 587 598 682 615 0.78Trade 390 433 506 641 8.63Transportation 599 573 717 645 1.24Financing 310 295 341 315 0.27Services 2,546 2,753 2,891 3,210 3.94
Own Account 6,325 6,974 7,590 8,235 4.50
Agriculture 4,405 4,735 4,957 5,154 2.65Mining 36 10 22 45 3.79Manufactu ...i..ng 425 490 487 530 3.75Electricity,Gas and Water 2 1 5 3 6.99
Construction 13 16 32 58 28.31Trade 1,118 1,284 1,619 1,826 8.52Transportation 120 155 160 207 9.51Financing 19 25 28 39 12.73Services 188 257 279 376 12.24
Unpaid FamilyWorkers 3,559 4,158 3,075 3,732 0.79
Source: NCSO (Integrated Household Survey).
B. Poverty Implications of Unemployment and Underemployment
3.10 From the poverty angle, underemployment is a much more seriousproblem than unemployment in the Philippine labor markets. Moreover, theextent of underemployment is substantially higher than unemployment, and ithas expanded following the recession, the continuous growth in labor supply,and the stagnation of growth in formal sector employment.
3.11 The open unemployment problem is almost entirely one of young highschool or college graduates. While the national unemployment rate is 11%, itis 13Z for those under 24 years of age, and 23% for the same age group in

- 45 -
urban areas (Table 3.4). Only about lOX of the unemployed are household heads(Table 3.5). Almost 70X of the unemployed have at least high school educa-tion, and more than half are under 24 years old. Clearly, these are not thepeople who suffered private sector retrenchment during the recession. On thecontrary, young entrants are entirely dependent on the rate of recruitment,which has collapsed in the past few years. New entrants are most probablyunwilling or unable to enter the informal sector or migrate to rural areas.The tragedy of prolonged unemployment among new entrants to the labor force isthat they will have the most potential for productivity-enhancing employment.
Table 3.4: UNEMPLOYMENT RATES BY SELECTED LABOR FORCE GROUPS
1970-78/a 1980 1981 1982 1983 1984 1985 1986
Female 8.2 7.5 8.5 8.6 6.8 10.0 8.2 8.9Ui i 1T;n 1177 115 9.4 fl. 1;W 1TXRural 6.7 7.1 7.0 5.6 8.8 6.3 7.2
Less than 19 yrs. old 8.0 7.9 9.8 9.0 8.4 11.5 9.6 9.4Urban 1l7R 2". 177W 177ff 2U 13 17.Rural 5.1 6.3 6.4 3.2 7.3 5.4 5.5
Less than 24 yrs. old 7.8 7.5 10.9 10.4 9.9 13.5 12.1 12.9Ur-ban 1775 U7 " IY7. 1G.6 2T3 G15 Z7Rural 6.1 6.7 6.7 6.3 8.9 6.7 7.4Total 4.7 5.4 5.5 4.9 7.0 6.1 6.4
/a Average for 1970-78 tNEDA (1986)J.
Source: NCSO (ISH)
Table 3.5: SHARE OF HOUSEHOLD HEADS IN TOTAL UNEMPLOYMENT(percentage)
1984 1985 1986
Total 12.3 11.7 10.3Tr-ban /a T3K TT1 ITTRural 7T 10.9 9.1 7.3Over 2 ryears old /b 13.0 12.8 11.8
/a Unemployed household heads as a proportion of total urban (or rural)unemployment.
/b For urban household heads only.
Source: NCSO.

- 46 -
3.12 Urban underemployment is higher among less educated and olderpeople. In general, the family of the average underemployed person livesbelow the poverty line; in 1984-86, only those families headed byunderemployed college graduates were above the poverty line (Table 3.6).
Table 3.6: PHILIPPINES: URBAN UNDEREMPLOYMENT BY SCHOOLING LEVELS /aAND EARNINGS /b
(percentages and constant 1985 pesos)
1980 1981 1982 1983 1984 1985 1986
TotalUnderemployment 100 100 100 100 100 100 100
Earnings (4,650) (4,502) '50124) (5,110) 3,070 (2,770) (3,080)
No schooling 4.3 2.9 1.9 2.6 2.3 0.9 2.3
Elementary 47.8 43.5 44.8 44.6 45.5 42.9 38.6Earnings (2,900) (3,440) (3,940) (3,460) (2,005) (2,012) (2,070)
High School 31.9 34.5 36.4 34.1 37.2 37.4 39.8Earnings (4,060) (4,430) (4,470) (4,700) (2,970) (2,600) (2,510)
College 6.9 12.0 10.9 12.2 8.3 11.6 12.5Undergrad. (5,465) (5,160) (5,600) (5,200) (3,860) (4,170) (4,250)
College 4.8 4.3 2.8 6.0 6.8 6.1 7.0Graduates (8,509) (8,580) (9,650) (8,790) (5,890) (5,090) (6,710)
/a Highest degree completed.7i Figures indicate the number of persons in each group expressed as a
proportion of the total number of urban underemployed in each group. Thetotal average family per capita income of each group in 1985 pesos isshown in parentheses.
Source: NCSO (ISH).
C. Characteristics of Labor Earnings
Evolution of Real Wages and Non-Wage Costs
3.13 Real wages fell continously between 1960 and 1980 for both urbanskilled and unskilled workers, at a rate of about 3% per year. Rural wages,although also falling, did not drop as fast as urban wages since laborabsorption in agriculture was more dynamic than in manufacturing and industry

- 47 -
(Table 3.7). After 1980, and before the crisis, there was a slight real wagerecovery, where services accounted for most of the employment creation.However, this small recovery in real wages did not reverse the long termdecline.
Table 3.7: PHILIPPINES: REAL WAGE INDEXES(1972 - 100)
(1) (2) (3)Skilled Workers Unskilled Workers Agricultural Workers
1960 133.4 107.9 1441965 115.2 102.7 1271970 114.4 111.6 1021975 72.7 72.9 1071980 63.7 60.7 921981 68.4 65.4 901982 76.8 71.3 971983 87.1 72.6 1041984 69.5 75.1 891985 66.6 75.7 891986 60.3 73.5 98
Sources: Columns (1) & (2), Central Bank and staff estimates; (3) Lal (1983)(1960-70), and staff estimates with data provided by the Bureau ofAgricultural Economics, Ministry of Agriculture and Food.
3.14 Minimum wages have not been a binding factor in preventing thegeneration of more employment. In fact, they have followed a pattern similarto non-regulated wages in the rest of the economy. Minimum wages have alsodropped in real terms throughout the seventies. Again, the drop was moredramatic in urban than in rural minimum wages. The minimum wage was, onaverage, about 70X of unskilled wages during 1979-81. Underemploymentexpansion has been driven by depressed demand conditions and not by theenforcement of the legal minimum wage.
3.15 Although non-wage costs did not increase in the late 1970's, thereal unit cost of labor has been constantly dropping in the 1971-1985period. The ratio of non-wage cost to total wages increased from 13Z in 1976to 301 in 1987, basically as a result of the introduction of the Cost ofLiving Allowance (COLA) (Table 3.8). However, even taking COLA into account,the hourly cost of a manufacturing worker is quite low, equivalent to US$0.60per hour. Furthermore, the long run decline in labor costs is stillsubstantial when real wages are adjusted by productivity changes. The drop inthe real unit labor cost for manufacturing is illustrated in Table 3.9.

- 48 -
Table 3.8: PHILIPPINES: MANDATED NON-WAGE COST (NWC) PAYMENTSAS A PROPORTION OF WAGES
(Z)
1976 1986
13th Month 8 8Vacations (15 days after one year) 4 4Social Security 5 5-8Medicare 1 1.5COLA /a 11
Total 18 30
/a COLA is P 175 per month. The ratio here is calculated on the basis ofthe average monthly earnings of a wage and salary earner in 1986(P 1,470), which is almost equal to the average monthly wage rate.
Sources: 1976: Comparative Labor Costs, published by the SGV Group,January 1970.1986:Price Waterhouse: Doing Business in Philippines.Also from interviews and data from the Research Department,Department of Labor and Employment.
Tabie 3.s; PHILIPPINES; unii LABuO 0u05T LIMANUFACfliINGl, 1970-84(1970 = 100)
Year Productivity /a Real wage rate Real unit labor cost /b
1970 100 100 1001971 102 95 931972 110 92 841973 101 79 781974 108 68 641975 113 77 681976 86 73 851977 81 77 941978 79 79 991979 78 64 821980 80 60 751981 81 66 821982 83 68 821983 125 83 691984 139 73 60
/a Real value added per worker.T|h Real wage rate/productivity.
Sources: "Trends in manufacturing competitiveness in Souti iast Asia",Leipziger, D., Hakim, L.G., Petri, P. 1988 (forthcoming).

- 49 -
Determinants of Wages
3.16 Real wages in the Philippines have not dropped because ofinsufficient capital accumulation. From 1975 to 1983, gross capital formationwas close to 30Z of CDP. Even allowing for the fact that these resources werenot always used in the most productive way, this is a period of growingcapital accumulation (Table 3.10). It was only after 1983, during theadjustment, that investment dropped to 13X of GDP in 1985, a level even belowthe gross capital formation in the Philippines of the 1950s. Even then thisdrop in investment did not get translated into a net reduction in capitalstock until 1986.
Table 3.10: CAPITAL FORMATION, WAGE RATES, AND LABOR SUPPLY
Cross K Real wages OutputFormation Unskilled Labor Force per
Year (Z CUP) (1972=100) ('000) worker
1970 22Z 111.6 12,300 4.501975 281 72.9 15,161 4.501980 29Z 60.7 17,308 5.2419R3 251 72.6 20.310 4.931984 16X 75.1 20,969 4.401985 131 67.1 21,318 4.10
Source: NCSO Staff calculations.
3.17 The substantial expansion of investment in the seventies, wasaccompanied by some increase in output per worker (Table 3.10). In spite ofthis, real wages have been dropping throughout. Wages have dropped because ofthe fast pace of increase in labor supply.
3.18 Although there is no justification based on national growth rates,total factneproductivity growth in manufacturing was negative in theseventies. The productivity slow-down of the 1970s is principallyassociated with shifting resources to inefficient industries, particularly inthe capital good and intermediate good sectors. As shown in Table 3.11, totalfactor productivity growth was negative between 1971-80 (-1.2Z per year).However, within individual industries there was positive growth in producti-vity; the negative total reflects a shift from industries with high
14/ Total factor productivity measures the difference between the change inoutput and a corresponding change in capital, labor and intermediateinputs, weighted by their contributions to output.

- 50 -
productivity to industries with low productivity. Since 1980, productivityhas rebounded both as a result of greater efficiency within subsectors and asa result of the more outward-orientation of the economy.
Table 3.11: ANNUAL GROWTH RATE IN TOTAL FACTOR PRODUCTIVITY(Z)
1956-70 1971-80 1981-83
All manufacturing 0.56 -1.23 3.2Within industry 0.77 0.34 3.0Between industries -0.21 -1.57 0.2
Source: Hooley Productivity Growth in Phililipine Manufacturing, PIDS(1985); 1981-83 new estimates.
3.19 The potential for increasing productivity and employment throughintersectoral transfers can be illustrated by the problems facing the textilesubsector. In 1985, the textile industry was operating at half its capacityand employment in the industry was below 30X of its 1981 level: 30,000orkershad bean 1aidd off *n th.ee. yeAa Mnot e f the nrnhlAmn irk theindustry stemmed from the fact that it had to purchase its inputs well aboveinternational prices, since their imports were restricted. The most importantinput is synthetic fiber, which at the time represented 60% of the value ofthe raw materials for textile production. Synthetic fiber was produced by onefirm with costs, in terms of domestic resources, ten time larger than the costof importing fiber. The firm employed less than 1,000 workers and imported100% of its raw materials. In this context, reallocating resources to textileproduction, and allowing the importation of raw materials would have meant aloss of 1,000 jobs in the synthetic fiber plant. However, the net effect onemployment would have been very substantial, given the high employment contentof textile production.
3.20 Although there is some segmentation in the labor market, it was notvery important in depressing real wages or employment levels. The growinglabor supply has put considerable pressure on wage rates of unskilled workers,significantly reducing the differentials between informal and formal earningsin that segment of the market. Furthermore, the existing segmentationreflects the conditions of the Philippine industrial structure rather thanrigidities particular to the labor market.
Labor Earnings and Poverty
3.21 Labor market trends explain a large part of the growing povertyproblem. Higher underemployment and unemployment, combined with decliningreal wages and labor earnings, have resulted in an increase in poverty interms of labor income.

- 51 -
3.22 A cross-sectional picture of the distribution of poverty in thelabor force shows that poverty is concentrated in agricultural, self-employed,and unskilled workers (Table 3.12). The figures also confirm that poverty ismore a rural phenomenon. In urban areas, most of the poor are in trade,transportation and services. The poorest families are usually headed byunskilled workers. Overall, poverty is greatest among own-account workers inagriculture and services. For wage earners, poverty is highest in agricul-ture.
Table 3.12: DISTRIBUTION OF FAKILIES ACCORDING TO OFFICIAL POVERTY LINEBY LABOR MARKET CHARACTERISTICS OF THE HEAD
(Z)
Under P 3,759/year Under P 5,010/year
Employee Private Sector 42.9 60.3Employee Public Sector 17.1 31.0Self-employed 55.3 70.5Employees 27.6 39.0
Agriculture 61.7 77.0Manufacturing 33.5 48.7Construction 42.9 61.0Trade 29.9 45.8Transportation 30.8 49.8Financing 12.9 24.0Services 24.2 39.2
Skilled Workers 7.0 15.5Semi-skilled Workers 27.3 42.6Unskilled Workers 36.0 51.1Agricultural Workers 62.1 77.2
The figures show the proportion of families under the rural and the urbanthreshold.
Source: Estimates based on the Household Incomes and Expenditures Survey(1985)
D. Employment Prospects and Directions
3.23 In the future, to counteract falling real wages, labor supply mustgrow less rapidly, productivity needs to increase, growth must be maintained,and the employment content of growth has to be greatly improved. The growthof the labor force must be lower than the 3.6Z average of the seventies.However, even if an effective population program is started right away, suchpolicies will only have a tangible effect 15 years from now. The need for

-52-
productivity growth is clear: it is the only way for new entrants to the laborforce to be absorbed without further drops in real wages.
3.24 Productivity improvements in manufacturing require the shifting ofresources within industrial subsectors, to those activities which generatehigher employment. The elimination of the Major Industrial Projects is oneimportant step which has already been taken by the new government. Furthersteps in trade liberalization are also crucial, especially given the fact thatin the past the largest protection was provided to those industries with lowertotal factor productivity (TFP) growth. The privatization of government firmscould also help to improve productivity in manufacturing. Support to researchand development (R&D), adaptation of technology, and training is the best wayfor the government to actively contribute to productivity improvements.
3.25 The cost of negative growth is very high, especially for the poor,and this should be kept in mind when designing stabilization and medium termadjustment programs. The permanent employment loss of the drop in investmentwhich took place in the adjustment period is considerable. A rough calcula-tion shows that if investment had remained around the average level of theearly 1980's, with similar capital-labor ratios, the economy would havecreated around two million additional potential jobs during the 1983-86period. This loss in potential employment is different from the unemploymentresulting from the drop in capacity utilization. Restrictive macroeconomicpolicies also affect unemployment through their impact on final demand.During the recession firms reduced their level of operations and temporarilyreduced their demand for labor as a result of lower capacity utilizationlevels.
3.26 If the Philippine economy were to continue its past employmentgeneration record, the negative impact on the earnings of the poor would beconsiderable. Table 3.13 shows for illustrative purposes differentunderemployment scenarios for the next 15 years, keeping sectoral employmentelasticities and labor supply growth at historical levels. The simulationshows that even under very high output growth conditions, underemploymentwould only drop to around 14% by the end of the century. High populationgrowth is the key explanation. However, of significant importance as well arethe low employment elasticities and labor sipply growth in the industrialsector.

- 53 -
Table 3.13: UNDEREMPLOYMENT SIMULATIONS, 1986-2000
1986 1990 1995 2000
Unchanged Labor Force Growth
Base Case (CDP - 4.5X) 16.5 16.6 16.7 16.8High Case (GDP 7%) 16.5 15.6 14.6 13.6
Source: Staff calculations.
Assumptions: Labor force continues to grow at 3.62, its historical averagesince 1970; employment-output elasticities for agriculture, industry, andservices, remain at their 1970-80 historical averages.
3.27 This alarming reality may not come to pass in the outyears if thereforms that have been taking place this decade are maintained andsupplemented by transitory measures and programs to increase employment.Negative real interest rates, fiscal incentives that reward the use ofcapital, and the elimination of foreign competition through protection, arethe main policies responsible for the very low employment creation in thePhilippine economy. These are also the policies which explain why the rapidgrowth in the seventies hardly benefitted the lower income families of thePhilippine society. The continuation of ongoing reforms, such as the tradeliberalization program, are instruments to the fundamental structural changeswhich need to take place not only for sustainable growth but also for the poorto benefit from economic progress.

- 54 -
ANNEX 1Page 1 of 3
The Empirical Data
Labor Force Statistics
The basic source of labor force data is the national IntegratedSurvey of Households (ISH) conducted by the National Census and StatisticsOffice (NCSO). After 1970, the ISH were conducted on a quarterly basis.Results of the fourth quarter of the year, which are used in this report, areconsidered more representative because they do not coincide with schoolvacation nor with the wet month of the monsoon; both factors introducingimportant seasonal effects on both the demand and the supply of labor.
Some important changes in definitions were implemented in 1976 whichhave probably resulted in a undervaluation of unemployment in the 1980s. Theperiod of reference for the questionnaire was changed from a week to aquarter, and the age limit of the labor force was raised from 10 to 15 yearsand older. Tidalgo & Esguerra (1984) noted that for the period 1976-78,employment figures based on a reference quarter were consistently higher thanthose based on a reference week. By the same token, one should expect toobserve a lower unemployment rate when a longer period of reference is usedand when the youngest group of the labor force is excluded. For instance,Canlas (1987) points out the likely underestimation of unemployment levelswhen 1980s' figures are compared with the 1970s.
In addition, in 1984, NCSO allowed the ISH sample results to reflecturban/rural composition of the different categories in the survey. Formerly,NCSO constrained the results to fit with figures projected with censusresults. This methodology introduced some problems with regard to urban/ruralcomparisons in years not close enough to a population census. On the otherhand, the change implemented in 1984 makes it impossible to comparerural/urban trends between 1983-84 since NCSO did not release adjustmentfactors.
The change in methodology does not seem to affect the rate of growthof the more relevant variables in 1980-83 versus 1984-86. It will probablyshow a more significant decline in employment and a larger wage increase inunderemployment than otherwise, but the results do not reveal majordistortions. It is also possible that the increase in urban population, andthe decrease in rural population has been associated with the large decline inurban earnings. However, this has not been severe, as revealed by the verysimilar decline in urban earnings between 1983-84 for different schoolinggroups.
Sample design for the ISH is done conjointly with NEDA and BEACON,thus making more reliable the distribution of questionnaires amongbarangays. The size of the sample (as for 1983) was of about 32,000households, their selection being based in random sampling with probabilitiesproportional to populational results. In both collecting and processing theinformation, NCSO employs civil servants.

- 55 -
AMEX I1Page 2 of 3
The definitions contained in the survey follows closelyinternational standards: Employed are all those fifteen (15) years and olderwho reported their main activity during the period of reference was to workfor pay or profit, to work without pay in a family business or to have a jobor business but not at work because of illness, vacation, strike or badweather. Unemployed are all those fifteen (15) years and older who reportedtheir main activity during the reference period was the active search for ajob. There are some very well known problems in empirically interpreting thisdefinition. For instance, the ezistence of part-time employed (or those self-employed in informal activities) who declare they are actively looking for ajob. Likewise, the existence of inactives (i.e., those out of the laborforce) who are willing to take a job or to start a job search as soon as theyperceive greater probabilities of success, and that are not reported asunemployed. In general terms, those problems with definitions of labor forcecategories are important in in,erpreting time trend fluctuations.
The publications of NCSO also report the category of Underemployed,defined as those employed but declar.ng their villingness to work additionaltime. The concept is useful as long as it reflects a potential laborsupply. For example, the concept involved in "invisibly underemployed" (i.e.,those working full time but wanting additional work) is not totally convincingwith regard to its role in creating strain on the labor market. With thisproblem in mind, NCSO does report time worked and income earned by thosewilling to work additional time. Using this information we have built up aseries of "visibly underemployed" (i.e., those working less than 65 days or 40days a quarter, but wanting additional work), with low income levels, thus,satisfying better the idea of potential labor supply.
Labor Earnings
Data on labor earnings (i.e., wages, salaries and income derivedfrom own accounted activities) are characterized by two major problems thathave to be kept in mind in interpreting the results. First, they refer to the"past quarter", thus, relying too much in the recollection of the surveyedperson. Second, given that this is not an income survey, most probably incomein kind, which are important in rural areas, will tend to be underestimated.This is particularly relevant in considering that in this type of survey, theperson interviewed is not necessarily the income earner. By examining theconsistency of earnings statistics in a time series framework, it seems thatthe errors and underreporting resulting from the two above nentioned problemsare basically a constant factor throughout time. In this scase, it is safe tomake comparison of results for different years.
Data from the Household Income and Expenditure Survey (HIES) hasalso been used for 1985. The quality of the information on earnings reportedby this source appears to be reliable since the survey methodology requirespermanent supervision of the units being interviewed. At the same time, thechecking of the slots of earnings through its corresponding expenditurepattern, also demonstrate the consistency of collected information.

- 56 -
ANNEX 1Page 3 of 3
The Wase Data
There are several wage series available in the Philippines thatcomple ent each other in a time series contest. In fact, owing to bothinstitutional and definitional changes some surveys have been eliminated whilenew ones have been started. Some discontinuation occurred in both the periodsand the coverage of the survey.
The most important sources on wages are:
(a) The Central Bank (CEBA) survey of industrial establishments in MetroManila conducted yearly between 1^55 and 1980. This survey wasdiscontinued and replaced by the MOLE survey.
(b) The NEDA survey of Key Manufacturing Enterprises (KEY) conductedbetween 1981-1986 among the 1000 largest Corporations. This source,however, is not directly comparable to (a) or (c) because of itscoverage and methodology.
(c) The Ministry of Labor and Employment (MOLE) Survey conducted yearlysince 1983 by the National Wages Council, which is carried outwithin the same methodology of the CEBA survey.
(d) The Integrated Quarterly Survey of Households (ISH) conducted byNCSO, which provides data on labor earnings.
(e) The agricultural wage surveys carried out quarterly since 1960 bythe Bureau of Agricultural Economics (BACON).
(f) The Wage and Position Classification Office (WAPCO) surveys, whichwere carried out between 1960 and 1981. The surveys covered largefirms and their purpose was to analyze the relative position ofpublic sector earnings.
The CEBA and MOLE surveys cover establishments larger than 10employees and thus pick up reasonably well the top of the informal sector.However, since 1978 the CEBA survey collects data only on basic wages, itsreported information may underestimate total labor compensation.

PART II
THE SOCIAL SECTORS: THEIR ROLE I. POVERTY ALLEVIATION
I

- 57 -
IV. POPULATION POLICIES IN THE PHILIPPINES
4.1 Population growth in the Philippines is a major cause of the highincidence of poverty and underemployment. Population growth is regressivefrom every point of view. At the household level, it affects the poorestfamilies the most. From a macroeconomic point of view, population growth canbring about a drop in labor's share of output. In terms of employment, it hasled to a labor surplus which has consistently depressed real wages.Population pressure on land has brought about the impoverishment of a largepart of the rural sector. Population growth also imposes a heavy demand onthe resources required to provide poor households with a shelter, health,nutrition and education services. Given current population trends, the burdenon the government budget for providing these services will reach increasinglyhigh proportions of CNP in the next 30 years.
4.2 With its low incomes and limited ratio of natural resources topopulation, Philippines will require a striking effort in savings and inimprovement of technology to generate an annual growth of 4X in the number ofproductive jobs. Yet with the country's unfolding demography even with thateffort no increase in per capita income levels can be expected. Theexperience of the last decades shows, further, that even when growth of GDPexceeds that of population and the labor force, wage rates can still fall. Itis therefore hard to exaggerate the importance of slowing population growthfor the achievement of poverty alleviation in the middle and longer run.
4.3 The Philippines population program has a major advantage in the higheducation levels of women relative to those in most developing countries.Also, women in the Philippine face less severe discrimination in the labormarket. Against this backdrop it is discouraging that population growth mayhave accelerated in the late 1970s after an earlier decline, and that therewas a decline in the rate of contraceptive use after 1978. Clearly a majorpush is called for on this policy area.
Recent Trends
4.4 The current popula 4qn growth rate is probably around 2.5% perannum, the highest in ASEAN±.' The slow decline in the rate which ocurred inthe 1970s results from a combination of a slow decline in fertility and thefact that death rates have remained constant (see Table 4.1). Crude birthrates declined from 39.2 per 1,000 in 1970 to 34.8 in 1975, but slightly roseto 36.3 in 1980. Crude death rates declined from 10.8 per 1,000 in 1970, to8.7 in 1975, remaining at around 8 thereafter.
15/ There has been new data from the 1986 contraceptive prevalence survey andsome discussion on methodology used in the 1983 survey after the missionvisited Manila in September 1987. However, the official estimates forpopulation growth have only been slightly revised down to 2.5% for 1985.

- 58 -
Table 4.1: SELECTED ESTIMATES OF CRUDE BIRTH RATE,CRUDE DEATH RATES, AND RATES OF NATURAL INCREASE
1960-1980
Rate ofCrude Birth Rate Crude Death Rate natural increase
Year per 1,000 per 1,000 per 1,000
1960 46.0 12.8 33.21970 39.2 10.8 28.41975 34.8 8.7 26.11980 36.3 8.8 27.51985 31.7 7.9 23.8
Source: Various sources described in A.N. Herrin, 'Philippine DemographicDevelopment and Public Policies: 1970-1985," 1987.
4.5 The lack of progress in the reduction of birth rates is directlyrelated to the increase in the proportion of women in childbearing ages, adecline in the mean age at marriage, and a slow decline in maritalfertility. This slow change in marital fertility is directly related to theslow progress, and even decline in the 1980s, of contraceptive prevalencerates (Table 4.2).
Table 4.2: CONTRACEPTIVE PREVALENCE RATES,CURRENTLY KARRIED WOMEN 15-44 YEARS OLD, 1968-83
Method 1968 1973 1978 1983
All Methods 15.5 24.4 37.1 32.1
Modern Program Methods 2.2 10.4 12.5 17.6Pi=l T-7 b99 -r7 -57IUD 0.1 2.6 2.4 2.5Sterilization - 0.9 5.3 9.5Injection - - - -
Other Program Methods 5.5 8.0 12.7 9.1iythum 571Condom - 1.0 3.8 2.0
Non-Proaram Methods 7.8 6.0 11.8 5.3witndrawaL 67Z 4Z:: 9V.5 473Others 1.6 2.0 2.3 1.1
Source: 1968, 1973 and 1983 National Demographic Survey and 1978 Republic ofthe Philippines Fertility Survey.

- 59 -
4.6 Fertilitz and Contraception. As indicated in Table 4.3 the poorhave higher fertility rates than the higher income groups. Fertility ratesare higher in the poorest regions, the rural areas, among less educatedmothers, agricultural households, and manual occupations. The total fertilityrate (TFR) in the National Capital Region is half that of the poorestregion. The two poorest regions, Bicol and Eastern Visayas, have the highestTFRs, while the NCR and other urbanized regions have the lowest TFRs. Largedifferential in TFR still exist. In 1980 they ranged from 3.5 per woman inNCR to 6.3 per woman in Bicol. There are also large differences withinregions, with the rural TFR 40% higher than the urban TFR.
Table 4.3: MEAN NUMBER OF CHILDREN BORN IN THE PASTFIVE YEARS TO WOMEN WHO HAVE BEEN CONTINUOUSLY MARRIED,
BY BACKGROUND VARIABLES
Background variable Mean Background variable Mean
Level of Education Husband's OccupationNone 1.1 Professional 0.9Primary 1.4 Clerical 0.9Intermediate 1.2 Sales 1.0High school 1.0 Agriculture, self-employed 1.3Some college 0.9 Agriculture, not self-employed 1.3With college degree 1.0 Services 0.9
Manual, skilled and unskilled 1.2
Region of Residence Place of ResidenceMetro Manila 0.9 Urban 1.0Luzon 1.2 Rural 1.3Visayas 1.3Mindanao 1.3
All Women 1.2
Source: 1978 Republic of the Philippines Fertility Survey.
4.7 Fertility rates also vary by the education of the woman and theoccupation of the household head. It is generally higher among women withlower educational attainment. For 1980, the TFR of women with one to threeyears of schooling was 7 children, compared to 3.8 for women with seven ormore years of schooling. The TFR is also higher among agricultural and manualworkers.
4.8 The differences in fertility rates are paralleled by differences incontraceptive prevalence rates. As shown in Table 4.4 substantial differencesin contraceptive prevalence rates were found between urban and ruralresidents, by region, by household income, occupation of the household head,

- 60 -
and educational attainment of the wife. Higher contraceptive prevalence ratesare found among higher income groups which is consistent with higher use ofcontraceptives among urban areas, women with college education, and highoccupational status.
Table 4.4: CONTRACEPTIVE PREVALENCERATES ACCORDING TO SELECTED SOCIOECONOMIC VARIABLES
(married women 15-44 years old)
Socioeconomic characteristics Contraceptive prevalence (%)
ResidenceRural (a) 27.1Urban (b) 40.4
Monthly HH IncomeLess than P 1,000 28.5P 1,000 and over 41.5
HH Head Occupational IndexLow 31.0High 45*4
Educational AttainmentPrimary or less 21.4Elementary 28.9High school 36.8College andover 43.7
Source: 1983 National Demographic Survey as reported in J.V. Cabigon,"Fertility and Contraception in the Regins," Philippine PopulationJournal, 1(4): 30-66, December 1985.
4.9 The proportion of women who were not using contraceptives but didnot want more children was higher among poor households (Table 4.5). Thisgroup should form the initial target population for family planning. Data for1978 show that 40% of "exposed" women who did not want more children were notusing any contraceptive method. This proportion was higher among rural areas,women with less education, and in agricultural occupations. Data for 1983show rat g,ranging from 82% in Southern Mindanao, to 91% in CentralVisayas. _ Part of the discrepancy between fertility desires andcontraceptive practices may be due to the lack of access to family planning
16/ See E.A. de Guzman, "Fertility, Nuptiality and Contraceptive Practice inthe Philippines," 1987.

- 61 -
services. One survey reported that 67X of the women could not afford the costof contraception.
Table 4.5 PERCENTAGE OF WOMEN WHO ARE NOT CURRENTLY USINGAN EFFICIENT METHOD OF CONTRACEPTION AMONG THOSE WHOARE CURREULY EXPOSED AND WANT NO MORE CHILDREN, 1978
All 25-34 35-44 All 25-34 35-44Background variable ages years years Background variable ages years years
Level of Education Husband's OccupationNone 84.9 (100.0) 84.8 Professional 51.7 43.5 54.5Primary 83.4 80.7 84.0 Clerical 60.7 38.9 58.5Intermediate 73.6 68.2 75.0 Sales 63.5 58.0 62.5High school 60.6 58.9 59.8 Agriculture, self-Some college 49.6 46.7 48.1 employed 82.2 79.8 83.0With college degree 54.7 49.3 55.3 Agriculture, not self-
employed 82.8 78.0 85.9Region of Residence Services 59.1 55.8 56.5Metro Manila 56.7 50.1 57.5 Manual, skilled 64.0 58.7 66.6Luzon 71.2 65.4 73.3 Manual, unskilled 60.0 57.5 60.1Visayas 79.6 78.2 78.8Mindanao 70.4 68.2 72.0
Place of ResidenceUrban 58.9 63.8 58.7Rural 77.6 73.8 79.5 All Women 70.9 66.5 72.1
Source: 1978 Republic of the Philinoines Fertility Survey.
Family Planning Service Delivery
4.10 In the early 1970s, the Philippine family planning program dependedentirely on the clinic network for both the delivery of family planningservices and information/motivation services. In order to strengthen theprogram, the Outreach Project was launched in 1976 in order to complement theclinic network by increasing the demand for family planning services and toresupply couples with pills and condoms. The project was the core activity ofthe Philippine family planning program until 1986.
4.11 The Outreach Project essentially consisted of a network of both paidand volunteer outreach personnel. The paid personnel include the provincial/city population officers (PPOs/CPOs), district population officers (DPOs), andfull-time outreach workers (FTOWs). The unpaid community-based volunteers areknown as barangay service point officers (BSPOs). The FTOWs and BSPOs'functions were to motivate and recruit contraceptive acceptors, distribute IECmaterials, resupply contraceptives, monitor family planning acceptors, andreport the number of these acceptors to POPCOM. In 1985, there were 157PPOs/CPOs, 324 DPOs, 2,250 FTOWs and 51,169 BSPOs.
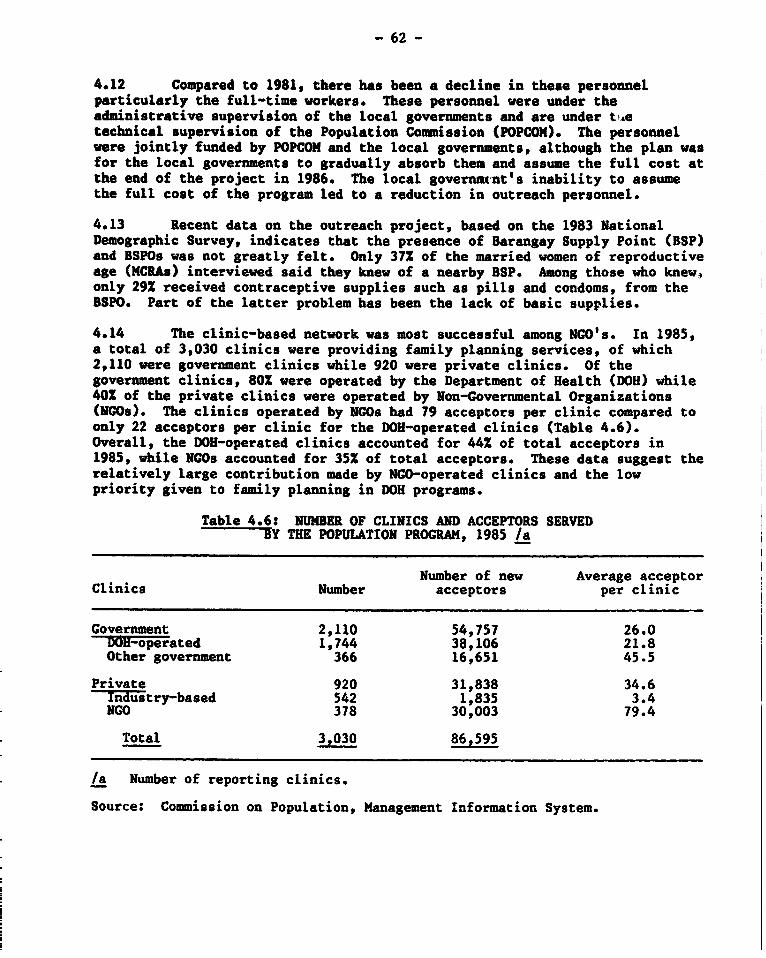
- 62 -
4.12 Compared to 1981, there has been a decline in these personnelparticularly the full-time workers. These personnel were under theadministrative supervision of the local governments and are under t.etechnical supervision of the Population Commission (POPCOM). The personnelwere jointly funded by POPCOM and the local governments, although the plan wasfor the local governments to gradually absorb them and assume the full cost atthe end of the project in 1986. The local governmtnt's inability to assumethe full cost of the program led to a reduction in outreach personnel.
4.13 Recent data on the outreach project, based on the 1983 NationalDemographic Survey, indicates that the presence of Barangay Supply Point (BSP)and BSPOs was not greatly felt. Only 37Z of the married women of reproductiveage (MCRAs) interviewed said they knew of a nearby BSP. Among those who knew,only 29S received contraceptive supplies such as pills and condoms, from theBSPO. Part of the latter problem has been the lack of basic supplies.
4.14 The clinic-based network was most successful among NGO's. In 1985,a total of 3,030 clinics were providing family planning services, of which2,110 were government clinics while 920 were private clinics. Of thegovernment clinics, 80% were operated by the Department of Health (DOH) while40X of the private clinics were operated by Non-Governmental Organizations(NOs). The clinics operated by NGOs had 79 acceptors per clinic compared toonly 22 acceptors per clinic for the DOB-operated clinics (Table 4.6).Overall, the DOH-operated clinics accounted for 44Z of total acceptors in1985, while NGOs accounted for 35Z of total acceptors. These data suggest therelatively large contribution made by NCO-operated clinics and the lowpriority given to family planning in DOH programs.
Table 4.6: NUMBER OF CLINICS AND ACCEPTORS SERVEDTY THE POPULATION PROGRAM, 1985 /a
Number of new Average acceptorClinics Number acceptors per clinic
Government 2,110 54,757 26.0DOH-operated 1,744 38,106 21.8Other government 366 16,651 45.5
Private 920 31,838 34.6Iiin-iitry-based 542 1,835 3.4NMO 378 30,003 79.4
Total 3,030 86,595
/a Number of reporting clinics.
Source: Commission on Population, Management Information System.

- 63 -
Alternative Population Futures 17/
4.15 While the most recent development plan was based on the mediumfertility variant, the high variant is more realistic in view of the apparentslowing down of fertility reduction in the 1975-1980 period relative to theprevious quinquennial period. Under the high variant, the population isexpected to grow by 22 million in the next 15 years and another 22 million inthe 2000-2015 period. In contrast, under the low variant the population isexpected to increase by only 17 million between 1985 and 2000, and 14 millionbetween 2000 and 2015.
4.16 Rapid fertility decline will be translated into an absolutereduction in the number of preschoolers in the next 15 years, while slowfertility decline will bring about an increase larger than that of the past 15years. For children age 0-6 years, the major target groups for nutritioninterventions, rapid fertility decline would imply a reduction by the year2000 by more than one million preschoolers. Under a slow fertility decline,however, the number of preschoolers would increase by 2.3 million.
4.17 Clearly, the pressure for providing elementary and secondaryeducation will be much less during the next 15 or 30 years under a more rapidfertility decline than under a slow one. Such reduced pressure providesopportunities for improving the quality of elementary and secondary educationin the future. In the next 15 years the number of elementary and secondaryschool age children will grow by only 1.8 million under rapid fertilitydecline compared to 3.9 million under a slow fertility decline. Between 2000and 2015, the number of school age children will decline by almost 2.0 millionunder rapid fertility decline, while they will increase by another 2.1 millionunder slow fertility decline.
Budgetary Cost of Maintaining Per Capita Social Service Expenditures
4.18 A rapid fertility decline implies a budgetary saving of over$300 million for basic social services in the next 30 years. Budgetar7requirements for social services will be lower by 8% in 2000 under a rapidfertility decline than under a slow one; in 2015, such requirements will be14% lower (Table 4.7). The budgetary savings from reduced population growthcan be allocated for upgrading social services or for alternative uses.
17/ The three fertility assumptions are (a) rapid fertility decline (lowvariant) a net reproduction rate (NRR) of 1 will be achieved by the year2000; (b) moderate fertility decline (medium variant) an NRR of 1 will beachieved by year 2010; and (c) slow fertility decline (high variant) anNRR or 1 will be ackieved by the year 2020. The mortality assumption isone of moderate mortality decline, that is, life expectancy will risefrom 62 years in 1980 to 68 years in 2000 and 74 years in 2030.

- 64 -
Table 4.7: BUDGETARY COST OF MAINTAINING PER CAPITA SOCIALSERVICE EXPENDITURES UNDER ALTERNATIVE POPULATION PROJECTIONS
(Millions of Pesos)
Population ProjectionExpeno3 ture 2000 2015Category Low High Low High
Social Services /a 24,812 26,865 29,839 34,660Health /a 3,922 4,246 4,702 5,478Education lb 12,132 13,718 10,546 15,384Nutrition 7_ 388 537 403 539
Ia Per capita basis.7i Per population of school age children age 7-16.7T Per child age 0-6 years.
Notes: Per capita expenditures by categories are based on 1986 expenditurepatterns at 1985 values.
4.19 To maintain per capita social service expenditures in general, andhealth expenditures in particular, the rate of increase of budgetaryexpenditures should equal the rate of population growth. Under a slowfertility decline, the total budgetary burden will increase at an averageannual rate of 2.32 between 1985 and 2000, and 1.7% between 2000 and 2015. Incontrast, under rapid fertility decline, such budgetary burden needs to growonly at an annual average rate of 1.8Z between 1985 and 2000, and only 1.22between 2000 antd 2015.
4.20 By the year 2000 the budgetary requirements for maintaining existinexpenditure levels for primary and secondary education will be 12X lower unde'rapid fertility decline than under a slow fertility decline. By 2015 it wil-be 322 lower. In the next 15 years the average annual rate of increase inbudgetary requirements to maintain per school age child expenditures is only0.8X under rapid fertility decline compated to 1.72 under slow fertilitydecline. Between 2000 and 2015, the relevant percentages are -0.9 and 0.9 a0.8, respectively.
4.21 The budgetary requirements for maintaining existing nutritionexpenditure levels will be 282 lower in 2000 under rapid fertility declinethan under slow fertility decline; in 2015, it will be 252. Between 1985 a2000, the average annual rate of increase in budgetary requirements tomaintain per child expenditure levels is -0.73S under rapid fertility declicompared to 1.362 under slow fertlity decline.

- 65 -
Table 4.8: PROJECTION OF POPULATION AND PER CAPITASOCIAL SERVICE EXPENDITURES
Population Population Per Capita Expenditures forGrowth in Social ServicesRate Year Millions According to CGP Growth Rate (Pesos)
4% 6Z 8%
Low 1985 54.5 349 349 3492000 71.3 487 657 8872015 85.5 739 1,347 2,455
High 1985 54.8 348 348 3482000 77.2 449 607 8192015 99.6 635 1,157 2,107
Notes: Assumes a constant share of social service expenditures to CNP of3.2% based on 1986 expenditures which reflect increased attention tosocial services.
Issues and Recommendations
4.22 In view of the recent reversal in demographic trends the Governmentadopted a "Population Policy Statement" in April 1987. This statementprovides a broad framework for addressing the current problems of unmet demandfor contraceptive supplies and services, especially among the poor. However,the implications of Commission on Population's (POPCOM) new role as a policyformulating, coordinating and monitoring body, rather than as an implementingbody, is still being worked out within Government. A number of importantissues still need to be addressed including responsibility for contraceptiveprocurement (POPCOM's responsibility for all Government agencies and NGO's),collection and management of family planning service statistics, delivery ofinformation, education and communication materials, and the coordination ofpopulation activities among agencies and the NCO's.
4.23 Program Strategy. The experience of the population program in thelast 15 years suggests that both a clinic-based network and a community-basedoutreach network are necessary in delivering adequate IEC and contraceptivesupplies and services especially to remote rural areas and urban poor communi-ties. However, the performance of the public sectors in both clinic-based andcommunity-based network has left much to be desired. The Government's networkof clinics, particularly those operated by the DOH, have given much lesspriority to family planning than to other services. The Outreach Project'sperformance in recent years also appeared to be low because of decliningsupport given to such projects, particularly by local governments. However,the concept of the community-based network (not necessarily the OutreachProject) supported by a strong clinic-based network is still valid.

- 66 -
4.24 It is, therefore, recommended that the strategy of combining aclinic-based and community-outreach network be continued. However, theclinic-network needs to strengthened in resources and visibility in order toprovide adequate family planning services. This involves allocation of morepersonnel time for family planning services and adequate supplies of contrt-ceptix.s at the clinics. Moreover, in line with the integrated approach toproviding population, health and nutrition services, the Government shouldconsider a common network of community outreach personnel at the barangaylevel. Because family planning services are currently seen as a basic part ofmaternal child care, much of this care can be provided by the paid healthworkers already in the field, i.e. midwives in Barangay Health Stations(BHSs). Finally, the delivery of IEC and contraceptive supplies and servicesshould be based on a commonly defined and identified target population basedon households at risk.
4.25 Resource Mobilization. Population program expenditures have beendeclining in real terms since 1975 (Table 4.9). Real expenditures per persondeclined from P 180 in 1973 to P 52 in 1983. If in 1983 the program hadmaintained the 1977 level of total real expenditures it could have achieved acontraceptive prevalence rate of 34% for program methods, instead of only28Z. Contraceptive prevalence would have been 41% for all methods instead ofonly 32X.
Table 4.9: PHILIPPINES: POPULATION PROGRAM EXPENDITURES(Million pesos)
Total expenditures Percent share ofConstrant expenditures, by source
Year Current (1978=100 CPI) Total GOP USAID Others
FY 1972 54.4 126.2 100.0 15.1 71.1 13.81973 72.5 144.6 100.0 36.8 48.3 14.91974 113.8 180.1 100.0 51.3 30.3 18.41975 127.7 170.3 100.0 47.6 32.4 20.01976 113.9 140.2 100.0 49.5 26.2 24.31976 ext. 73.3 86.2 100.0 59.8 32.6 7.6
CY 1976 130.3 153.3 100.0 55.3 29.8 14.91977 131.6 140.9 100.0 55.2 31.3 13.7
CY 1983 204.5 107.3 100.0 51.5 28.6 19.91984 257.4 89.9 100.0 40.9 33.2 25.91985 287.4 81.5 100.0 45.4 26.7 27.91986 328.6 92.5 100.0 45.0 26.0 29.0
Source: POPCOM, "Briefing Materials on the Philippines Population Program,"and "Report of the Ad Hoc Committee to Review the 1987 and 19888POPCOM Budget and the 1986 PIL of the PPIII."

- 67 -
4.26 To meet the high unmet demand for contraceptive supplies andservices, particularly among the poor, it is recommended that real resourcesfor population program be increased. The provision of such increasedresources, however, should take into account the required changes in thedelivery structure. These include the introduction of a more focusedtargetting procedure at the community level, the increased role of the DOH-operated clinics in service delivery, the modified community outreach network,and a more important role of NGOs.
4.27 Coordination. The Population Program is implemented by variousagencies of the government and by various institutions of the privatesector. The NGOs have been particularly successful in providing familyplanning services in spite of their relatively small size in terms of numbersof clinics and personnel. It is, therefore, recommended that the Governmentstrengthen its support to participating UGOs and other private agencies,particularly in facilitating the review and approval of NGO projects. Thecoordination of the various activities of private and government agencies,however, should be based on a commonly defined and identified targetpopulation and objectives. Each agency's activities should be directedtowards effectively addressing the needs of the target population.

- 68 -
V. EQUITY ASPECTS OF THE PHILIPPINE EDUCATIONAL SYSTEM
Introduction
5.1 Compared to other countries at a similar level of economic develop-ment, the Philippines has attained a high educational level. In 1980, 83.3Zof the population above 15 years old was literate. School attendance ratesare high: 961 for primary age students and 541 for secondary age (1986).However, the educational system is confronted by two interrelated problems:inequities in the distribution of educational services among socio-economicgroups; and the low and declining quality of public schools.
5.2 A general recommendation to raise public expenditures on educationon equity grounds is unsatisfactory for three reasons. First, raisinginvestment in education across the board is not desirable from an equity noran efficiency perspective. The relevant issue is the nature of the gapbetween the educational resources at the disposal of the poor, and the rest ofthe population.
5.3 Second, although earnings do rise with education, private rates ofreturn on education range between 5 and 12 percent in the Philippines. There-fore, it is necessary to specify the kinds of investment which give highprivate rates of return, specifically identifying those with high social ratesof returns. Finally, the public sector's budget constraint requires adiscussion of financing possibilities. These include reallocation betweenlevels and types of expenditures, increasing the private sector's participa-tion in education, and increasing the cost-effectiveness of the existingbudget.
A. The Incidence of Educational Services
Characteristics of the Educational System
5.4 Inequality of opportunity within the elementarv school system stemsmainly from the variance in quality within the public system. Inequality atthe secondary level reflects both inequality within public schools and thelack of access to the private system. Within the public system, local schoolscatering to the poor, have lower expenditures per student, lower quality, andhigher tuition than national and city schools. Access to the private systemis limited by high tuition. The regressiveness of tertiary education stemsfrom its tuition-quality structure.
5.5 With the exception of elementary education, the private sector playsa significant role in the Philippine educational system. Ninety-four percentof the students in elementary education attend free public schools while thereis a small high quality private sector, mostly in Manila. Secondary schoolsfall into three categories: private, barangay, provincial and municipal, andnational, city and college-related schools.

- 69 -
5.6 Secondary Education. Private schools have 421 of all secondaryenrol jqnt and are entirely privately funded, mainly through tuitionfees._ The government restricts tuition fee increases to 152 annually whichhas resulted in some of the schools being in a financial crisis. The qualityof secondary private schools is slightly below the average with 45Z of itsstudents passing the national college entrance examination (Table 5.1).
Table 5.1: CHARACTERISTICS OF THE EDUCATIONAL SYSTEM, 1985-86
AverageDistribution Average cost per
of students within tuition studentLevel and Type level (p) (p) Quality /a
Primary (6 grades)Private 6.0 411 - 52.5Public 94.0 - 528 38.6
Secondary (4 grades)Private-total 42.5 554 454 45.1NCR - 1,060 - 51.6National 17.3 37 1,223 61.1city 8.9 200 901 81.3Municipal 5.5 282 232 39.3Provincial 4.3 182 309 36.3Barangay 19.4 273 232 37.5SUC-related 2.1 149 4,700 64.8
TertiaryPrivate 77.7 - 3,900 -Public 12.3 - 6,000 -
/a Measured as the percent of students passing the NCEE test.
Sources: HSMS study; Laya, J.C., Vol. I, Tables C-21 and C-13.
5.7 Almost one third of total enrollments in secondary education areconcentrated in barangay, provincial and municipal schools. They cater to thepoor, have low costs, and low quality. Average cuition fees are P 261 whichis high relative to other types of public schools. Starting this year thenational government will increase its coverage of teachers' salaries from 70
18/ Average tuitions are around P 554 per year. For Manila, the range isfrom P 1,060 up to P 6,000 in some schools.

- 70 -
to 100X while local authorities have the financial responsibility formaintenance, other personnel services, teaching materials and capital outlays.
5.8 National, city and college-related schools also have 29Z of totalenrollments. They are high quality (691 pass the NCEE), high-cost institu-tions with low tuition fees. They cater to a higher income population thanthe one served by local schools.
5.9 The public sector funds both the most expensive and the cheapesttype of secondary education. It is difficult to compare costs per studentacross secondary schools since the figures available reflect different cost-sharing arrangements with other institutions. Therefore, only cost ranking,rather than quantitative differences, can be inferred. As seen in Table 5.1national, city and college related schools are the most expensive whilebarangay, provincial and municipal schools are the cheapest secondary schools.
5.10 The private sector covers 781 of total enrollments in teritareducation. Although state universities and colleges (SUC) have higher costsand higher quality, they have much lower tuition than do private institu-tions. Tertiary education also contains technical and vocational schools,both private and public. Tuition fees are high: P 300-P 500 per year in thepublic, and P 900-P 1,500 in the private sector with large variance in qualitywithin each group.
5.11 The IV'tion-quality structure of higher education in the Philippinesis regressive._ Most colleges, private and public, require a minimum scoreon the NCEE as a condition for admission which is higher in the better SUCs.On average, the poor have a lower probability to be admitted to the SUC syst=mbecause they do le - well in the NCEE tests. This is partially a result ofthe accumulated di. rential of the quality of the education received by thepoor in elementary and secondary education.
2. The Incidence of Attendance Rates
5.12 Attendance to school is higher among high income groups. There is acasual relationship between attendance rates and income, especially afterprimary education. Although physical accessbility is not a constraint inelementary education there are substantial income related differences inschool attendance thereafter. Equity in tertiary education is an importantissue for the poor since a substantial percentage of the lowest three decilesgraduate from secondary school.
5.13 The analysis of attendance rates by income decile is based on the1982-83 Household and School Matching Survey (HSMS), carried out by theProgram for Decentralized Educational Development (PRODED) at the Ministry ofEducation and Culture (MECS). Nearly 5,000 households were interviewed inthis unique survey that matches for each child, household, school, and
19/ Unit costs and tuition figures for higher education are only availablefor 1977. (Statistical Appendix Table 3.6)

- 71 -
community information. In addition, students were given tests to comparetheir attainment with national standards.
5.14 Although almost every 7-10 year old attends :chool in thePhilippines, enrollment starts to drop after that age, especially for therural poor. Rates of attendance are nearly 1001 in both urban and rural areasfor children 7-10 years old, regardless of income. At age 11-12 theenrollment of the rural poor declines to 86x. At ages 13-14, while most ofthe three upper deciles of urban and rural children still attend school, only75Z and 651 of the lowest three deciles in urban and rural areas areenrolled. The differences in attendance become more accute for ages 15-16with 86Z and 70X attendance for the three upper deciles, and 661 and 42% forthe three lower deciles (Table 5.2).
Table 5.2: ENROLLMENT RATES BY AGE AND INCOME DECILE
Age7-LIu LJI-Z 1J-14 1)-16
Income decile 1 2 3 4 Total
Urban
1 0.99 0.98 0.70 0.63 0.832 0.97 0.94 0.71 0.67 0.823 0.96 0.96 0.84 0.68 0.864 0.99 0.97 0.87 0.74 0.895 0.99 0.97 0.90 0.77 0.916 0.98 0.97 0.95 0.80 0.937 0.99 1.00 0.92 0.87 0.958 0.99 0.98 0.96 0.78 0.939 0.99 1.00 0.97 0.92 0.9710 1.00 1.00 1.00 0.97 0.99
Total 0.99 0.98 0.88 0.78 0.91
Rural
1 0.96 0.86 0.64 0.48 0.742 0.94 0.86 0.70 0.39 0.723 0.96 0.85 0.61 0.40 0.114 0.97 0.91 0.71 0.52 0.785 0.98 0.93 0.87 0.57 0.846 0.97 0.92 0.79 0.64 0.837 0.99 0.90 0.78 0.64 0.838 0.99 0.96 0.84 0.64 0.869 0.99 0.97 0.92 0.73 0.9010 0.99 0.94 0.83 0.80 0.89
Total 0.97 0.91 0.77 0.58 0.81
Source: HSMS - special tabulations.

- 72 -
5.15 The association between income and education is not merelystatisical, but also casual. This close connection between attendance ratesand income was analyzed by Paqueo using the HSMS data to explore the effect oeconomic, demographic, anl0 focial factors on years of completed schoolingamong children ages 7-13.- The father's wage, household assets andborrowing capacity were shown to have a significant positive effect on yearsof schooling completed. Surprisingly, living in a rural community per se doe!not have a negative effect since the lower attendance rates of rural childrenare due to their socio-demographic characteristics rather than to the ruralnature of their community. Physical accessibility of public elementaryschools was not found to be an important constraint in elementary education.
5.16 The attendance rates at the tertiary level are remarkably high byincernational standards with a 33% enrollment ratios. Although enrollmentdistribution by income levels is unknown, in 1974 only 64Z of the studentswith family income below P2{7 000 passed the NCEE, compared to 85% of thosewith higher family income.- In addition, high tuition an foregone earningsmay be another barrier to entry, specially since less than 1% of studentsreceive scholarships for tertiary education.
The Quality of Schooling
5.17 The quality of schooling can be measured by the costs per student orby the average attainment level of graduates. Both are conceptually proble-matic. Cost differences could reflect the difference in the cost-effective-ness of specific items. Attainment levels reflect not only school inputs butalso the family and community background.
5.18 Differences in Attainment 221 There is higher attainment within thehigher deciles of the sample. Clear income-related difference were found intest scores, especially in urban areas. In addition, rural pupils generallyhave lower achievements than urban pupils (Table 5.3).
20/ Paqueo, Vicente B., "An Econometric Analysis of Educational Attainmentamong Elementary School Children: Preliminary Results." NationalAcademy of Science & Technology (Philippines), 1985:7, pp. 359-380.
21/ Alonzo, R., "Notes on Philippine Education," Social Science Information,April-June, 1986.
22/ This section is based on the PRODED cost study (1985) of elementary andsecondary schools based on 1981 data.

- 73 -
Table 5.3: ATTAINMENT TESTS BY INCOMEDECILE FOR PUBLIC ELEMENTARY EDUCATION /a
Average scoreIncome decile Urban Rural
1 37.80 33.822 38.66 37.243 36.12 35.834 38.41 34.475 43.73 36.946 40.39 39.057 44.45 37.388 42.53 39.789 47.76 38.9810 47.64 46.06
/a Average of test scores given to 4th grade studentsin Mathemalzics, English and Filipino.
Source: HSMS - special tabulations.
5.19 Differences in School Inputs. Private schools have much higher non-salarv expenditure than public schools. The ratio is 7:1 in private vs.publ.k . elementary schools. The variance is very high also within the publicsystem, with a ratio of 8:1. For our analysis total unit costs have beendisaggregated into: recurrent cost per pupil = teaching salaries plusnonteaching salaries plus expenditures on nonsalary items.
5.20 For elementary education, recurrent expenditures are higher inprivate schools (P 325 per student) than in public schools (P 226) in spite ofhaving lower teacher salaries. The regressivity in school costs, as reflectedin differences between private and public schools, is concentrated in non-salary costs which are much higher than in private schools while teachingsalaries are lower. In private schools teachers receive only 80% of thesalaries in public schools while they have a higher teaching load (30.8 hoursper week compared to 25.3 nours). Private schools' expenditures on non-salaryitems per student are P 115 in private as against P 18 in public23phools,mainly due to parents' pressure, and to government requirements.- Inconstrast, the best secondary schools pay higher teachers salary while alsohaving higher non-salary costs.
23/ The government stipulates guidelines for the establishment andmaintenance of private, but not public, schools. These include, amongothers, an adequate supply of seats, blackboards, library equipment andsupplies, instructional and teaching aids, and textbooks.

- 74 -
5.21 The extent to which non-wage inputs are income-related is furtherillustrated in the incidence of textbooks per pupil. In urban areas, thedistribution of textbooks per pupil is similar to the distribution ofattainment tests (Table 5.4) with students from high income deciles havingaccess to a greater number of textbooks. Textbook/pupil ratios are generallylower, and not income-related in rural areas where there is remarkableequality of access.
5.22 The experience in the Philippines shows that new textbooks have themost pronounced effect on students from lower income families. Textbooks weredistributed throughout the Philippines in the 1977-1978 school year as part ofthe World Bank's textbook project. An evaluation, in terms of generalachievement changes and of who benefited most from the introduction of newtextbooks, was done as part of the project. The overall effect of the firstyear of investment in textbooks was to raise the national level of academicachievement considerably. The intervention was more effective on children whocame from low income families. The study concluded that... "the effect of aschool quality intervention appears to be the most pronounced among thechildren who are most improverished and whose home background are the mostunderprivileged."-"
Table 5.4: NO. OF TEXTBOOKS PER PUBLIC ELEMENTARYSCHOOL STUDENT, BY INCOME DECILE
Income decile Urban Rural
1 3.84 2.652 3.41 2.613 3.64 2.424 4.55 2.105 3.72 2.756 5.00 3.207 4.61 2.498 6.94 2.949 4.25 3.0310 7.66 2.16
Source: HSMS - special tabulations.
5.23 Desks, books, teacher quality score, and nutrition have the most

- 75 -
class, and teachers' formal credentials were found to be much lesseffective. The effect of school input variables on achievements is strongerthan in industrialized countries, while that of family traits is weaker.
5.24 Therefore, there is room for reducing costs in non-quality relateditems, particularly by setting standards of class-size and teaching loads.Also, unit cost support by the national government should be item-specificrather than across-the-board, and accompanied by supervision of standards.
The Incidence of Tuition
5o25 It has long been recognized that secondary school tuition fees areregressive in public schools. Local schools levy higher fees and provide lessservices than do national schools. The fact that there is no systematicrelation between tuition and income (Table 5.5) shows that the poor payroughly as much as the higher income groups. This is mostLy the result of thedecentralization of the secondary schools system, where f aancial responsibi-lity for local schools was undertaken by communities with very differentaverage income. Scholarships, in both secondary and higher education, arevery limited.
Table 5.5: AVERAGE TUITION IN SECONDARY SCHOOLSBY INCOME DECILES, AGES 13-15
(in P)
Average tuitionIncome decile Urban Rural
1 189.80 161.202 210.50 138.103 141.53 198.004 191.09 235.905 252.83 151.406 151.91 181.507 192.69 210.818 204.00 210.229 243.65 186.4210 317.00 271.25
Source: HSMS - special tabulation.

- 76 -
B. Returns on Investment in Education
Past Estimates
5.26 Past IW estimates showed that the social returns to education inthe Philippines were considerably lower than those for other developingcountries, particulary at the primary and aecondary levels (Table 5.6). Thisresult is not surprising in view of the relatively high enrollment ratiosmentioned in the previous section. Although private returns are slightlyhigher, they are still much lower than the average middle income country.
Table 5.6: RATES OF RETURN TO EDUCATION IN THE PHILIPPINES AND OTHER WORLD REGIONS
Averageenrollment Social rates of return Private rates of return
Region/country type ratio Primary Secondary Higher Primary Secondary Higher
Philippines (1971) 69 7.5 6.5 8.5 8.0 6.5 9.5
Africa 31 26.0 17.0 i3.O 45.0 26.0 32.0
Asia 43 27.0 15.0 13.0 31.0 15.0 18.0
Latin America 53 26.0 18.0 16.0 32.0 23.0 23.0
Intermediate/devel-oped countries 70 13.0 10.5 8.5 17.0 12.5 12.5
Source: Data on enrollment ratios are from World Bank (1986); data on rates of returnare from Psacharospoulos (1985) and ILO (1971).
Updated Estimates
5.27 Updated estimates show that an additional year of schooling at thesample mean yields a private return of 8.1Z so that expanding investment ineducation may not be as economically profitably in the Philippines as in other

- 77 -
developing countries.251 Since this estimate ignores the direct costs ofschooling, we have also estimated returns incorporating these costs. Thereturns to completing schooling at three levels, appear in Table 5.7. Theyshow relatively higher rates of return for students completing any level ofschooling, but much lower returns to incomplete schooling.
Table 5.7: SOCIAL AND PRIVATE RETURNS TO EDUCATION INTHE PHILIPPINES, 1985
Years of schooling completed Private Social
Primary 1-4 years 5.3 4.5
Primary 5-6 years 11.4 9.3
Secondary 1-3 years 8.2 7.8
Secondary 4 years 11.8 11.3
Higher education 1-3 years 9.7 9.3
Higher education 4 years 11.7 11.4
Source: Staff calculations. Estimates include the direct costs of schooling.
5.28 Investment in tertiary education is even less profitable whencorrected for the fact that unemployment rates rise with years of schooling.This supports suggestions that overall public resources for higher educationshould not be expanded.
25/ The data for our estimates come from the 1985 Family Income and*- * F :~ 1 gq *

- 78 -
5.29 These results should be qualified by the fact that private andsocial rat2, vary substantially by quality of institution, tuition and fieldof study.- The better-paying fields are usually reserved for higher-incomestudents since the poor do not have the necessary academic qualifications.
Implications
5.30 Both past and updated estimates show that both the social andprivate profitabilitr of education remain low, especially as compared withother developing countries. The rate of return esticates by level ofeducation, however, show interesting patterns. First, except in the case ofthe primary educdtion, the differences among inte-mediate (grade 5-6),secondary and tertiary education, do not strongly indicate inefficentintrasectoral allocation of resources. Second, completing an educationalcycle, particularly elementary level, makes an noticeable differences on ratesof return. Therefore, the impact of additional educational investment mightbe stronger, it targetted to finance inexpensive ways to enhance schoolquality that could improve both learning achievement and completion rate atthe same time.
C. Policy Implicatious of the Incidence Analysis
5.31 The utmost priorities, from both efficiency and equity perspectives,are a rise in attendance :ates of ages 11-14, und an improvement in quality ofschooling at the primary and secondary levels. Since low income is a leadingcause of low attendance, directed expenditures which raise poor children's"real income"-food, clothing, etc., might help retain children at school.
5.32 Public school quality should be improved through the provision ofdesks, books, and on-the-job training for teachers. Academic achievement atthe primary level is influenced significantly by non-wage expenditures in theschool. These expenditures are now distributed regressively. Vigorousefforts to raise expenditures on these items should be pursued. Moreover,minimal standards of facilities, now applied to private schools should bespecified for public schools as well. School costs which are unrelated toquality should be cut in favor of the more cost-effective resources.
5.33 An increasing part of state expenditure or tertiary eduication shouldbe devoted to scholarships, at the expense of direct school support. In spiteof the multiplicity of scholarship and loan programs, their coverage is pre-sently very small. With an adequate scholarship program students could chooseamong institutions, including those in the private sector, subject to entrancetests. The low returns to higher education would probably make the scope forself-financing loan programs quite limited.
26/ Tan, Edita, A., Income Distribution. Underdevelopment and the LaborMarket, University of the Philippines, School of Economics, DP 8202,February 1982.

- 79 -
5.34 Tertiary level scholarships to the private sector have a betterchance to succeed than secondary level scholarships. Private secondaryschools have, on average, a higher cost than do public secondary schools.Public-sector financing based on the public schools average cost will not beattractive to the private system. By contrast, private institutions at thetertiary level have a lower cost than do SUCs. A scholarship plan based onpublic sector standards, or even lover, would be attractive.
5.35 Tuition fees in barangay secondary schools should be the first to bereduced. Since the national government undertakes the financial responsibi-lity on recurrent expenditures, it should also undertake to set minimum physi-cal standards, as w,ll as minimum teacher qualification requirements, in localschools. National control of local schools is also necessary, in order toactivate the new curriculum program for secondary schools, developed byPRODED.
D. Financing
Public Expenditures
5.36 Total public expenditures on education at constant 1976 pricesincreased by 34X between 1976 and 1982. Roughl* half the increase wasexplained by enrollment increases, and the rest by rising costs per student.The expansion was strongly biased in favor of tertiary education which showedthe largest increase in enrollment and in student cost increase (seeTable 5.8).
Table 5.8: NATIONAL GOVERNMENT EXPENDITURE ON EDUCATION(Indexess 1976 = 100)
Elementary Secondary Tertiary /a Total
Enrollment /a
1976 100 100 100 1001982 111 146 170 1171986 116 187 231 126
Expenditures /b
1976 100 100 100 1001982 132 135 209 1341986 116 114 165 115
Per student
1976 100 100 100 1001982 119 92 123 1141986 100 61 80 81
/a Public only.7b 1976 prices, obligation basis.
Source: Enrollments: Felipe, A. (1986b). Budget: World Bank '1987).
- 80 -
5.37 After 1982, enrollment continued to increase, but total expendituresdecreased sharply. Expenditures per studei. in elementary education werereduced to 1976 levels. Secondary and tertiary education expenditures perpupil were cut by 31Z and 43Z respectively. In 1987, the Government undertookto bring real expenditures back to their 1982 levels in real terms. However,because of the continued growth in enrollments, per pupil expenditures in 1987are likely to remain below the 1982 level.
Privatization
5.38 The share of enrollments in private institutions is declining atboth secondary and tertiary levels. The decline at the tertiary levelresponds to the rapid increase in the supply of places in public institutions,at much lower tuition fees.
5.39 It may be possible to reactivate private tertiary education. Thiscould be done by freezing the level of public schools enrollments, and financ-ing low income students regardless of whether they enroll in a private or apublic institution. This would be cost effective, as unit cost is lower inprivate than in public institutions, while channeling scholarships to poorstudents. It would also induce public institutions to compete for enrollmentsand lower their own costs. The tuition fur high-income students should beincreased to approach that of private schools. Schools should continue to settheir own academic admission standards, and should be freed from the burden ofpublic regulation of tuition rates.

- 81 -
VI. HEALTH AND NUTRITION POLICIES
A. Health and Health Care
6.1 Although data on average life expectancy in the Philippines andhospital bed numbers show a relatively satisfactory situation in health andnutrition, the public health system is not reaching the poor. First, welfareindicators differ substantially across regions. Although mortality hasdeclined on average, the difference in life expectancy between the capitalregion and Western Mindanao is larger than the difference in average lifeexpectancy between 1960 and 1980. Second degree malnutrition ranges from 271in Northern Mindanao to 141 in Southern Mindanao. Second, some absoluteindicators also show inadequate health care. More than 701 of deaths in tLecountry had no medical attendance in 1983. The major causes for infantmortality, poor environmental conditions and poor quality child care, havebeen worsening in the Philippines. Finally, infectious and parasitic diseasesare the major causes of death, and could be addressed relatively easy throughadequate preventive care.
Health Status
6.2 While the health of the Philippine population improved significantlyduring the 1970s, progress towards mortality reduction in the 1980s hasprobably slowed considerably. The crude death rate declined from 12 per 1,000in 1970 to 9 per 1,000 in 1980; life expectancy at birth increased from 58years in 1970 to 62 years in 1980; and the infant mortality rate declined from75 per 1,000 live births in 1975 to 63 per 1,000 live births in 1980 (Table6.1) .
Table 6.1: SELECTED ESTIMATES OF MORTALITY 1970-85
Year Crude death rate Life expectancy at birth Infant mortality rate(per 1,000 population) (in years) (per 1,000 population)
1970 11.8 58.1 -
1975 9.2 59.9 74.6
1980 8.7 61.6 63.2
1985 7.9 63.1 56.6
Source: NCSO, Population Studies Division, as reported in NEDA, Compendiumof Philippine Social Statistics, 1986.

- 82 -
6.3 At the same time, there are significant regional differences inmortality, with higher rates in the less developed regions (Table 6.2). In1980, life expectancy at birth varied from a high of 66 years in the NationalCapital Region to 52 years in Western Mindanao, a ! fference of 14 years whichis more than the difference in life expectancy for the national populationbetween 1960 and 1980. Infant mortality rates likewise ranged from 44 per1,000 live births in the National Capital Region to 113 per 1,000 live birthsin Western and Central Mindanao.
Table 6.2: PHILIPPINES: CRUDE DEATH RATE, LIFE EXPECTANCY AT BIRTHAND INFANT MORTALITY RATE BY REGION, 1975-80
InfantLife expectancy mortality rate
Crude death rate at birth (per 1,000(per 1,000 pop.) (in years) live births)1975 1980 1980 1975 1980
Philippines 9.2 8.7 61.6 74.6 63.2National Capital Region 8.6 5.7 66.1 - 44.0
I Ilocos 10.6 9.9 63.0 83.4 57.0II Cagayan Valley 9.3 10.6 58.3 98.1 78.3III Central Luson 9.2 7.1 65.1 62.3 48.2IV Southern Tagalog 9.2 7.6 64.3 69.2 51.6V Bicol 9.3 9.2 61.2 63.4 64.8VI Western Visayas 9.5 9.0 62.2 73.2 60.5VII Central Visayas 10.0 8.7 63.9 65.6 53.3VrII Eastern Visayas 9.5 10.9 58.3 75.3 78.3IX Western Mindanao 8.4 14.3 51.3 116.0 112.8X Northern Mindanao 8.8 12.3 35.0 112.1 94.5XI Southern Mindanao 8.5 12.6 54.4 91.9 97.6XII Central Mindanao 8.0 14.3 51.5 112.1 112.8
Note: Data for 1975 and 1980 were derived from the 1975 and 1980 censuses,respectively.
Source: NCSO, Population Stzdies Division as reported in NEDA, Compendium ofPhilippine Social Statistics, 1986.
6.4 The leading causes of death for all ages are still infectious andconmmicable diseases, although degenerative diseases appear to be slowlygaining prominence (Table 6.3). In 1984, pneumonia accounted for 19X of allreported deaths, tuberculosis for 111, while diarrhea, nutritional deficien-cies and measles added another 11X. Altogether, these easily preventablediseases accounted for 41X of all reported deaths while degenerative diseasesaccounted for only 282 of all reported deaths.

- 83 -
Table 6.3: LEADING CAUSES OF DEATH9 1978-84(Per 100,000 population)
1978 1979 1980 1981 1982 1983 1984
Pneumonia 99.7 104.2 94.0 87.1 89.3 93.4 89.3
Tuberculosis, all forms 62.0 61.6 59.9 55.1 55.7 54.9 52.9
Disease of the heart 56.1 64.3 61.0 68.7 72.5 70.8 61.0
Gastroenteritis and colitis 41.0 35.5 28.0 32.7 25.1 29.0 27.8
Disease of the vascular system 34.3 44.5 44.0 42.6 42.4 51.8 39.6
Malignant neoplasm 30.9 32.8 33.3 32.4 33.1 34.6 30.2
Avitaminosis and other nutri-tional deficiencies 27.9 17.5 15.4 13.9 11.9 13.6 13.4
Accidents 19.1 24.2 18.7 19.2 11.5 11.0 16.8
Bronchitis, emphysema and asthma 12.9 - 9.3 - - - -
Nephritis, nephratic syndromeand nephroses - 9.8 9.3 9.0 8.8 10.4 8.5
Measles 12.2 11.9 10.8 14.0 14.1 17.8 9.8
Cerebrovascular accidents - - - 13.2 - - -
Cardiovascular diseases - - - 6.0 - - -
Sources: MOH, Health Intelligence Service; and ISCO, Population Studies Divi-sion, as reported in NEDA, Compendium of Philippine Social Statis-tics, 1986.

- 84 -
6.5 Infant deaths are at least one fifth of all reported deaths withpneumonia as the single most important cause of infant mortality. Pneumoniahas not declined since 1978. In 1984, 24% of all infant deaths were due topneumonia and 16% were due to other respiratory diseases. Diarrhea,nutritional deficiency and measles accounted for another 17%. Together thesediseases accounted for more than half of all infant deaths (Table 6.4).
Table 6.4: LEADING CAUSES OF INFANT MORTALITY, 1978-84(Per 1,000 live births)
1978 1979 1980 1981 1982 1983 1984
Pneumonia 13.5 a3.3 11.4 10.5 10.2 10.2 11.5Respiratory condition of fetus andnervosarum 1.3 5.7 5.5 5.3 6.1 7.8 13.5
Diarrhea 4.9 5.1 4.0 4.7 3.4 4.0 8.7Avitaminosis and other nutritionaldeficiencies 4.6 2.5 2.1 4.7 1.3 1.7 2.4
Congenital anomalies 1.7 2.1 2.4 2.0 2.1 1.9 4.4Birth injury and difficult labor - 1.7 1.5 1.5 1.1 1.1 -Acute bronchitis and bronchiolitis 1.3 1.2 1.0 1.0 0.8 0.7 3.9Measles 1.1 1.1 .. .. 1.2 1.5 1.0Meningitis 0.7 0.6 0.6 0.6 0.5 0.6 0.1Dysentery, all forms - 0.4 0.4 0.3 0.3 0.4 -
Tetanus 1.8 - - - - - 2.3
Anoxia and hypoxia, conditions notelsewhere classified 3.8 - - - - _ _
Nutritional maladjustment - - - - - - -
Septicemia - - - 0.5 0.5 0.6 0.9
Sources: MOM, Health Intelligence Service; and NSCO, Population Studies Divi-sion, as reported in NEDA, Compendium of Philippine Social Statis-tics, 1986.
6.6 As to morbidity, respiratory infections (bronchitis, influenza,pneumonia and tuberculosis) and diarrhea are also the most prevalentdiseases. Between 1983 and 1984, there appears to be a spectacular rise inmorbidity rates (Table 6.9, Statistical Appendix). It is not clear, however,whether this sharp increase in morbidity rates is real and shows the effectsof hard economic times, or it only reflects better reporting. Infants andchildren less than 5 years of age account for a large majority of morbiditycases from specific causes. In 1983, 66% of cases of pneumonia, 59Z ofbronchitis, 57% of diarrhea, and 64Z of measles were due to infants andchildren less than 5 years of age.

- 85 -
6.7 Health Status of the Poor. Mortality rates for all ages and forinfants are higher in regions with a very high incidence of poverty. Data ondifferential mortality show that, in general, the poor have higher mortalityrates than the economically better off. The infant mortality rate is higherin rural areas where the majority of the poor are located (Table 6.1,Statistical Appendix). The infant mortality rate among mothers in farmoccupations was three times that among mothers in professional, administrativeor managerial occupations. Survey data reveal significant *nfant mortalitydifferentials by selected characteristics of mothers: the infant mortalityrate varied from 52 per 1,000 births among mothers with some collegeeducation, and to 118 per 1,000 births among mothers without any grade ofschooling completed; women with 3 to 4 children experienced 30% higher infantmortality rates in both urbar and rural areas than women with 1 to 2 children.
6.8 The major causes of death and of morbidity, particularly of infantsare generally associated with poor environmental sanitation, crowding andcongestion arising from inadequate housing, and poor quality child carearising from the low education of mothers and child carers. All thesecharacteristics are commonly found in low-income households.
6.9 Determinants of Health Status. Current trends do rot favor rapidimprovements in health status in the medium term unless major and highlyfocused interventions are implemented. A major underlying health determinant,other than income, is the education of mothers. The proximate determinants ofthe health status include reproductive factors such as parity and birthinterval; environmental risk factors; nutrient intake of calories, protein,micronutrients; and health care. High infant mortality risk is associatedwith very young or old mothers, increasing parity and shorter birth intervals,indicating high fertility. As we saw in Chapter IV, fertility has notdeclined. Indicators of environmental sanitation in terms of the proportionof households with sanitary toilet facilities and access to safe water supplyhave shown improvements since 1970. However, in 1985, 33Z of households stilldid not have sanitary toilet facilities, and 23% did not have ready access tosafe water supply. Moreover, poor environmental sanitation is suggested bythe very high prevalence of infectious parasitism among pre-schoolers. Dataon the nutritional status of pre-schoolers reveal high rates of malnutritionwhich do not appear to show signs of significant reductions from 1978 to1985. Malnutrition rates were around 20%, about the same rate found in 1978.
6.10 A major determinant of the nutritional status of infants and a majorfactor in infant mortality risk is breastfeeding. Survey data on breast-feeding show declining prevalence as well as duration between 1973 and 1983.Moreover, it declined among younger mothers, among women with only a primaryeducation or less, in rural areas and in all regions except Metro Manila.Whatever information and education campaigns were waged to encouragebreastfeeding since 1978, they reached only the older, more urbanized andhighly educated women (Table 6.5). Besides breastfeeding, the most importantpreventive child care is inmlunization. Current immunization rates are stilllow. The Medium-Term Development Plan, 1987-1992 (MTDP) estimated that in1986 only 30% of infants were fully immunized. The goal is to achieve 90%immunization coverage by 1990.

- 86 -
Table 6.5: TRENDS IN BREAST-FEEDING PREVALENCE AND DURATIONBY SELECTED CHARACTERISTICS, 1978 AND 1983
/a /aX ever breast-fed Mean duration (mos.3Y
Characteristics 1978 1983 1978/b 1983/c
All births 84.6 83.1 12.6 11.3
Current Age of Mother15-24 87.8 85.3 11.4 10.425-34 85.4 83.3 12.6 10.935-49 80.1 81.3 13.5 12.7
ResidenceUrban 72.2 73.8 9.0 9.7Rural 89.1 87.8 14.4 12.0
RegionMetro Manila 65.0 67.9 6.6 7.8Other Luson 85.4 84.1 13.3 11.4Visayas 89.1 87.9 15.0 12.9Mindanao 86.6 83.9 12.2 1(.8
Mother's EducationNo schooling 93.3 90.8 17.0 12.5Primary 92.3 89.4 15.9 12.4Intermediate 87.4 87.7 13.6 12.0High school 64.2 67.5 10.0 10.6College, 1+ 64.2 61.5 7.3 7.9
/a Excludes cases with no information on breast-feeding practice, on theselected characteristics or on both.
/b Prevalence/incidence mean based on proportions still breast-feeding.7- Arithmetic mean based on reported duration of breast-feeding for children
who were weaned, had died, and those still breast-feeding during the 1983NDS.
Source: Zablan, Z., "Philippine Trends in Breast-feeding Practice," Univer-sity of the Philippines Population Institute, July 1985.
6.11 A final factor affecting survival is the utilization of healthcare. The proportion of all reported deaths with medical attendance has beenslowly declining. In 1983, only 30Z of reported deaths had medical attendancecompared to 331 in 1977 (Table 6.6, Statistical Appendix). The proportion ofbirths with medical attendance steadily rose from 49Z .n 1977 to 571 in 1980,but no progress has occurred since 1980. In 1983, only 572 of births hadmedical attention, varying from 342 in Bicol to 931 in the National Capital

- 87 -
Region (Table 6.7, Statistical Appendix). Medical attendance was clearlyassociated with increasing urbanization, indicating that access to medicalfacilities and personnel was more limited in the rural than in the urbanareas. Indeed, between 1979 and 1981, survey data indicate that only 342 ofbirths in the rural areas had any medical attendance compared to 712 in theurban areas (Table 6.6).
Table 6.6: PERCENTASE DISTRIBUTION OF MOTHERSWHO GAVE BIRTH IN 1979 TO 1981, BY CATEGORY OF ATTENDANTS
Attendants Nationwide Urban Rural
Physicians 17.6 35.7 8.0
Nurses 2.2 3.0 1.8
Midwives 27.0 32.0 24.3
Hilots (TBA) 45.5 23.0 57.6
Relatives 1.4 0.3 2.0
Source: Ministry of Health, National Health Survey, 1981, as reported inINTERCARE, Health Care Financing in the Philippines: A CountryStudy, 1987.
6.12 Maternal care is largely provided by traditional practitionersrather than by trained medical personnel. Inadequate pre-natal care cancontribute to poor birth outcomes. The proportion of newborn infants withmedical attendance with low birth weight was 192 in 1978 and 15X in 1984.Livebirths without medical care during the pre-natal period, which stillconstitute the majority of cases, are likely to exhibit higher percentage oflow birth weight infants, and thus higher mortality risk.
6.13 Rural women still have relatively low literacy rates. An importantunderlying factor in mortality, particularly infant and child mortality whichinfluences the above proximate determinants is the level of education of themother. This is mainly due to the fact that higher education enhances thequality of child care. In 1980, only 762 of rural women aged 15 years andover were literate compared to 922 of urban women. For women aged 25 andover, only 692 of rural women were literate compared to 902 of urban women(Table 6.8, Statistical Appendix).
2. The Health Care System
6.14 The existing health care system has not been adequate in dealingeffectively with the health needs of the population, particularly the largermajority who are poor. The current disease pattern calls for greater efforts

- 88 -
in promotive and preventive health care services which would include familyplanning, immunization, environmental sanitation and hygiene, nutrition,breastfeeding, and maternal care. It also calls for a wider coverage of basiccurative services in the rural areas, and stronger efforts to counteract theignorance and inappropriate beliefs and attitudes about health care associatedwith low educational levels among the poor.
6.15 Infrastructure and Manpower. Health care services are providedthrough public and private hospitals, rural healtik units (RHUs), barangayhealth stations (BESs), privat4 physicians, various non-governmental organiza-tions (WGOO) and traditional health practitioners.
6.16 In 1986, there were 1,949 hospitals, more than two thirds privateand 30X public. Of the total number of hospitals, half were for primary careand were mostly owned by the private sector (Table 6.7). These are relativelysmall hospitals wtth limited diagnostic and treatment capabilities. Theirrapid growth in the 1970s was partially encouraged by a government policy thatprovided loans for the establishment of these hospi ls.
Table 6.7: PHILIPPINES: HOSPITALS CLASSIFIED AS TOLEVEL OF CARE PROVIDED
Number of Number of AverageCategory hospitals beds size
PrimaryPrivate 792 12,120 15.3Government 164 5,253 32.0
Subtotal 956 17,373
SecondaryPrivate 399 16,795 42.1Government 304 12,023 39.5
Subtotal 703 28,818
TertiaryPrivate 172 21,351 124.1Government 118 33,051 280.0
Subtotal 290 54,402
Total, Including Mentaland Leprosaria 1,949 100,593
Source: Philippine Health Association (PHA).

- 89 -
6.17 In 1985, the hospital bed ratio was one bed per 600 population forthe entire country and about half of these beds were in private hospitals.However, these beds were unevenly distributed across the country. 6iey werehighly concentrated in the National Capital Region where the hospital bedratio was ls200 While in the rest of the regions the hospital bed ratio rangedfrom 1:600 to 1:1,000 (Table 6.8).
Table 6.8: PHILIPPINES: HOSPITAL BED TO POPULATION RATIO BY REGION, 1982-85
1982 1983 1984 1985
Philippines 1:575 1:612 1:591 1:607
National Capital Region 1:208 1:240 1:228 1:234I Ilocos 1:652 1:645 1s666 1:685II Cagayan Valley 1:691 1:779 1:7601 1:778III Central Luzon 1:789 1:782 1:884 1:903IV Southern Tagalog 1:790 1:809 1:771 1:800V Bicol 1:751 1:816 1:784 1:785VT Western Visayas 1:954 1:953 1:960 ll:,048VII Central Visayas 1:658 1:661 1:667 1:690VIII Eastern Visayas 1:1,042 1:1,062 1:l,018 1:1,040IX Western Mindanao 1:989 1:947 1:916 1:921X Northern Mindanao 1:629 1:674 1:610 1:625
XI Southern Mindanao 1:675 1:713 1:596 1:618XII Central Mindanao 1:856 1:850 1:795 1:798
Sources: NOH, Bureau of Medical Services; and NSCO, Population Studies Divi-sion, as reported in NEDA, Compendium of Philippine Social Statis-tics, 1986.
o.18 There is still significant differential physical access to publichealth facilities. Public health services for the rural population areprovided mainly through the rural health units and bsrangay health stations.Both RHUs and BHSs are relatively more eveniy distributed across the countrythan hospital beds but are more accessible to the population residing close tomajor transportation networks and closer to towns, while a large part of thepopulation still resides in remote rural areas far from these facilities. Theleast accessible government health workers are nutritionists with a ratio of186,000 population in 1985, followed by dentists with a ratio of 1:48,000population, and sanitary inspectors with a ratio of 1:28,000 population.Physicians, nurses and midwives have ratios of about one per 6,000 population(Table 6.9). There are also substantial differences in the regionaldistribution of health manpower (Table 6.13, Statistical Appendix).

- 90 -
Table 6.9: PHILIPPINES: GOVERNMENT MEDICAL ANDSELECTEDWPARANEDICAL WORKRES PER PERSON, 1978-85
San.Physician Nurse Midwife Dentist Nutritionist Inspector
1978 7,437 6,132 7,437 57,967 150,146 30,489
1979 6,877 5,518 5,407 60,537 93,700 31,379
1980 6,656 5,029 5,179 46,954 78,182 30,873
1981 6,714 5,136 5,230 45,445 82,697 25,692
1982 6,883 5,265 5,362 46,589 84,779 26,339
1983 6,401 5,050 5,437 46,353 84,095 27,689
1984 6,560 5,176 5,572 47,507 86,189 28,378
1985 6,423 5,245 5,582 47,704 86,228 28,282
Sources: MOH, Planning Service; and NSCO, Population Studies Division, asreported in NEDA, Compendium of Philippine Social Statistics, 1986.
6.19 The formal public and private health care delivery system is supple-mented by various non-governmental organizations (NGOs), which provide mainlymaternal and child health, family planning and nutrition services. Althoughthey focus on the depressed areas in the country, their size of operations arerelatively small. A large majority of the rural population continues to relyupon the services of traditional health practitioners.
6.20 Or8anization and Mana8ement. The Department of Health (DOH) wasreorganized this year in order to streamline management and to improve theefficiency and effectiveness of health care service delivery. The reorganiza-tion has expanded the physical coverage of the public health care system,particularly to the barangay level, and has clarified responsibilities at eachlevel of the health care tslivery system.
6.21 Health Care Expenditures and Financing. Serious problems have beennoted regarding the quality of services in public health facilities arisingfrom inadequate funding, and inadequate financial management and planningcapabilities, as well as supervision and monitoring. Public health expendi-tures account for only a relatively small proportion of total spending comparedto private health expenditures. In 1985, health care expenditures (HCE) in theformal sector totalled an estimated P 14.5 billion, with the Governmentaccounting for 26Z, and the private sector for 74%. (Table 6.10).

- 91 -
Table 6.10: PHILIPPINES: HEALTH CARE EXPENDITURES (HCE)IN CURRENT TERMS, 1981-85
(Million pesos)
Year Government HCE Private HCE Philippine HCE
1981 2,736 5,143 7,8791982 3,309 6,014 9,3231983 3,921 7.025 10,9461984 3,596 8,760 12,3561985 3,779 10,717 14,496
1985 1.4 2,1 2.01981
Sources: Government expenditures: Commission on Audit, Office of the Budgetand Management; Private Expenditures: National Economic and Develop-ment Authority, as reported in INTERCARE, Health Care Financing inthe Phil'ppines: A Country Study, 1987.
6.22 Between 1981 and 1985 health care expenditures declined by 9Z in realterms as a result of the overall decline in government spending (Table 6.14,Statistical Appendix). On a per capita basis, real health care expendituresdropped to P 40 in 1985, from P 49 in 1981 and P 52 in 1983. Tre Governmentspent P 10 per person in 1985, down from P 17 in 1981 and P 20 in 1983 (Table6.11). The DOR accounted for 65Z of total public spending on health between1981 and 1985 (Table 6.15, Statistical Appendix). Other agencies with healthexpenditures include the Department of Defense and local governments.
Table 6.11: PHILIPPINES: PER CAPIT6 HEALTH CARE EXPENDITURES, 1981-85(Pesos)
Government Private PhilippinesYear Nominal Real Nominal Real Nominal Real
1981 55 17 104 31 159 491982 65 18 118 32 183 511983 75 20 135 33 210 521984 67 12 164 29 231 411985 69 10 196 30 265 40
Source: Tables 7.22 and 7.23 in Chapter 6, Volume 2 of this report.

- 92 -
6.23 Composition of Government Spending in Health. The Government spendsmost of its resources in curative care, and since 1982 the proportion spent forpreventive care has been declining. Between 1981 and 1985, 57Z of totalgovernment spending went to curative care as opposed to only 33% for preventivecare; administrative costs took up 91 of government spending, and trainingactivities accounted for the remainder (Table 6.12). In 1982, the proportionof government spending for preventive care was 371 and fell to 281 in 1985. Incontrast, the proportion of government spending for curative care rose from 541in 1982 to 631 in 1985. A large part of public spending on curative care wentto support public hospitals. Public hospital expenditures constituted 551 oftotal DOH expenditures in 1981, and increased to 71Z in 1985 (Table 6.17,Statistical Appendix).
Table 6.12: PHILIPPINES: USE OF ALL GOVERNMENT HEALTH FUNDS, 1981-85(Amount in million pesos)
Preventive Curative Admin.Care Services Training Services Total
Year Amount X Amount Z Amount 1 Amount 1 Amount X
1981 954.0 34.9 1,503.2 54.9 16.2 0.6 262.9 9.6 2,736.3 100.0
1982 1,212.7 36.6 1,786.4 54.0 14.6 0.4 295.7 8.9 3,309.4 100.0
1983 1,263.0 32.2 2,315.8 59.0 14.0 0.4 328.0 8.4 3,920.8 100.0
1984 1,234.9 34.3 2,017.0 56.1 14.1 0.4 330.4 9.2 3,596.4 100.0
1985 1,071.1 28.3 2,389.3 63.2 14.4 0.4 304.3 8.1 3,779.1 100.0
Average 1,147.1 33.3 2,002.3 57.4 14.7 0.4 304.3 8.8 3,468.4 100.0
Note: Includes national and local government funds.
Sources: General Appropriations Act, Republic of the Philippines, 1981-85, andAnnual Financial Report (Local Government), Commission on Audit, 1981-85as reported in INTERCARE, Health Care Financing in the Philippines: ACountry Study, 1987.
6.24 Private Health Care Expenditures. Little data exist on the patternof private health care expenditures. It is commonly believed, however, that alarge proportion of total private health care spending goes to curativecare. Data on household health expenditures indicate that a large proportionof total expenditures went to pay for curative care in the form of hospitalcharges (322), physician's fees (29Z), and drugs related to serious illness(9%) (Table 6.18, Statistical Appendix).

- 93 -
6.25 Lower income households who cannot afford expensive curative careare most likely to need it eventually because of underinvestment in preventivecare. As indicated in Table 6.13 average medical expenditures do vary withincom. While no information is available on the allocation of expendituresinto preventive and curative care by income groups, it is likely that the low-income groups, who spend a smaller absolute amount on health care than higherincome groups, spend a relatively larger amount of their total expenditures oncurative care than preventive care compared to higher income groups. This isbecause low-income households have to spend on other more pressing needs anddue to their lower levels of education, may not be aware of the need forpreventive care or where to obtain that care.
Table 6.13: AVERAGE MEDICAL EXPENDITURES PER FAMILY,BY INCOME CLASS, URBAN-RURAL, 1985
Total number Average medicalIncome class of families expenditures per family
(Pesos) (Thousands) (Pesos)
Total - Urban 3.603 834Under 4,000 16 1094,000 - 9,999 202 19010,000 - 29,999 1,530 42430,000 - 99,999 1,583 968
100,000 - 499,999 264 2,677500,000 and over 8 9,403
Total - Rural 5,963 386Under 4,000 108 784,000 - 9,999 1,210 16910,000 - 29,999 3,561 33730,000 - 99,999 1,030 757
100,000 - 499,999 53 2,083500,000 and over 1 2,718
Total - Philippines 9,566 556Under 4,000 124 854,000 - 9,999 1,411 17710,000 - 29,999 5,092 36830,000 - 99,999 2,612 880
100,000 - 499,999 318 2,521500,000 and over 9 8,335
Source: National Census and Statistics Office, as reported in INTERCARE,Health Care Financing in the Philippines: A Country Study, 1987.

- 94 -
Current Approach of DOW and Recommendations
6.26 The diseases associated with factors commonly found among the poorare easily preventable and controllable at low cost per beneficiary throughimmunization, proper hygiene, early detection and simple cure. Yet the healthsector in the past allocated a substantial part of its scarce resources toexpensive urban-based curative care based on hospitals and highly trainedhealth professionals for which the poor have had limited financial andphysical access. Moreover, in times of severe budgetary cutbacks, expendi-tures on such curative care were maintained at the expense of preventive andpromotive health care.
6.27 The Government recognizes this problem and adopted policies andstrategies for the 1987-92 planning period to address this problem. The majorfeatures of the new policies and strategies are (a) the emphasis on provisionof basic health services for the poor; (b) vigorous implementation ofpreventive and promotive health measures; and (c) increased budgetaryresources to the health sector. In addition, the policies and strategies callfor the greater integration of efforts among sectoral agencies involved in thedelivery of health and health-related services, the increased reliance onindividual and collective efforts, and greater collaboration with the privatesector.
6.28 These policies could have a substantial impact on the health statusof the poor. DOH has already started increasing budgetary resources forhealth and reversing the declining share of DOH expenditures on preventivecare. In 1986, the DOH made P 527 million available for additional financingof its operating costs and purchase of drugs. Moreover, in 1987, the share ofthe DOH budget in total government expenditures rose to 5.3Z from 3.1% in1986. Secondly, the share of the DOl budget for preventive care increasedfrom only 14% in 1985 to 31X in 1987, higher than the average share during1981-85 (22Z). Finally, DOH improved efficiency in drug procurementpractices, resulting in savings of at least 30%. Such savings were used toexpand service capacity.
6.29 The DOH has recently examined a wide range of health issues and hasidentified several key constraints and their solutions. These issues are
; organized around four major concerns, namely: (a) program concerns--issues ofdirect service delivery; (b) interagency concerns--issues of direct impact
i requiring DOH collaboration with other agencies; (c) funding concerns--issuesof resource provisiont and (d) institutional concerns--issues concerning DOH'sinstitutional capabilities to implement programs, collaborate with otheragencies, and properly utilize resources. The analysis of these issues andthe approaches chosen to address them are basically sound and deservesupport. However, the following areas warrant further attention.
6.30 Service Delivery. The various DOH programs include: implementationof an integrated maternal and child health program (including family
* planning); strengthening of the community-based health care approach;sustained support to existing programs for TB, malaria, and schistosomiasis;and the development of new programs for cancer, cardiovascular disease, andAIDS. The maternal and child health program is considered central.

- 95 -
6.31 The Maternal and Child Health Program. This program involves a setof interrelated activities which include immunization, nutrition, maternalcare, family planning, and the control of diarrheal diseases and respiratoryinfections. The immunization component seeks to achieve expanded coverage forthe population under three years of age from an estimated 25% in 1985 to 90Xin 1990. It involves training personnel, vaccine distribution via a coldchain, communication and education of mothers, and thorough monitoring andevaluation. The key issue perceived by DOH is how to assure continued fundingsupport for the program and how to institutionally strengthen the healthservices to sustain high coverage for full immunization. The DOH recommendsprovision of support for upgrading and expanding local production capabilitiesfor vaccines.
6.32 The nutrition component aims to prevent permanent disability ofseverely and moderately malnourished children and to rehabilitate malnourishedpregnant and lactating mothers. The DOH plans to increase the coverage ofOperation Timbang (OPT) for planning purposes at local levels, achievecomplete coverage of severely and moderately severely malnourished childrenand at risk pregnant and lactating mothers, and increase cover*ge of micro-nutrient supplementation, and strengthen malward operations. It faces variousoperational problems, however, including the inadequate supply of clinicalweighing scales, lack of nutritionist-dieticians, and inadequate funds forfood and micro-nutrient supplements. The DOH recomuends hiring nutritionists-dieticians for every municipality and purchasing equipment, particularlyweighing scale. To deal with the problem of scarce resources, the DOHrecommends better targeting of disadvantaged groups and institutionalizationof nutrition information to prevent the occurrence of malnutrition. Suchrecommendations are sound and deserve support.
6.33 The maternal health care program covers prenatal, postnatal andbirth delivery care. It aims to reduce maternal mortality from 0.9 per 1,000live births in 1985 to 0.7 per 1,000 in 1992. The DOH considers the presenthealth care delivery system lacks the capability to adequately meet the needfor maternal care. It recommends improvement in logistics and facilities inhealth centers and hospitals, establishment of maternal health clinics inevery barangay (BHS), and expansion of the health manpower ratio to one RuralHealth Midwife (RHM) per 2,500 population. In addition, it recommendsimproving the quality of midwifery training and revision of nursing andmidwifery laws to authorize nu.rses to attend to deliveries and midwives togive tetanus toxoid injections.
6.34 The control of diarrheal diseases is a major component of theprogram since this is one of the major causes of infant and child deaths andmorbidity. Intravenous therapy, anti-diarrheals, and antibiotics are stilloverused, while modern concepts of diarrhea management, such as OralRehydration Therapy (ORT) are not widely practiced. The DOH, therefore, plansto intensify efforts to promote techniques of diarrhea control, supported bythe production of ORESOL packets. DOH will also strengthen non-ORT strategiesto diarrhea control, i.e. breastfeeding, proper weaning, personal and domestichygiene, safe wster supply, etc. The shift from relatively expensive(intravenous therapy) and sometimes ineffective (anti-diarrheals and anti-biotics) therapy to simple and low cost modern ORT techniques is indeed awelcome development that need support.
- 96 -
6.35 The control of acute respiratory infections component of the -ECUprogram aims to establish and implement a national targeted program to reduceinfant and child mortality from ARI. While the program is still beingprepared, some of the lessons being generated by the pilot project on ARI inBohol might be considered. This pilot project has demonstrated that midwivescan be taught to detect and treat moderately severe ARI cases using prescribedoral antibiotics combined with home management. This innovative approachrepresents a shift in treatment protocols of moderately severe cases fromexpensive hospital-based treatment involving physicians, to simple diagnosticand treatment involving midwives in the BHS. Such innovation not only reducesthe cost per case but also expands the coverage of services to the rural areaswhich have limited access to hospitals.
6.36 Recommendations. Certain general recommendations could complementcurrent DOH thinking. First, there is a need to develop a system that targetshouseholds in each barangay who are at risk, and then concentrate the MCHinterventions on these households. Second, there is a need to emphasize theprovision of information, education and motivation components of the programin order to generate effective demand from the target households for theupgraded facilities and services to be made available. The information andeducation will also help households to effectively handle simple casedetection and home management of diarrheal diseases and respiratoryinfections. Third, there is a need to support the innovative approaches nowbeing developed with the DOH, which build on existing experiences andsuccesses, regarding community-based health development in the Philippines.It appears that this general approach to development, now being formalizedwithin the DOH, is being considered more broadly by Government for othersectors. Employment of communities to undertake self-help projects stronglylinked to locally availab'l resources and facilitated through effective publicand private local partnerships could provide a valuable approach whether it isfor health, agriculture, rural water and sanitation or income generatingactivities.
6.37 Within the maternal and child health program it is critical toincrease the demand for immunization. Recent field studies in urban poorcommunities bear out the importance of house visits by volunteer healthworkers to 2;ovide information and to motivate mothers to have their childrenimmunizedXY' Very often there is a need, initially at least, for thevolunteer health workers (VHW) to accompany mothers and their children to theclinic for immunization. Follow-up visits to these mothers are almost alwaysneeded to insure that mothers bring their children for full immunization.High drop-out rates are likely to occur after the first visit when mothers areunprepared for the minor side-effectives of vaccination, i.e. the child gets aslight fever. Still largely neglected are systematic activities to reducematernal mortality and morbidity through provision of prenatal and postnatalservices. Such activities should include identification of high-risk mothers,
27/ See A.N. Herrin, "The Coverage and Impact of a Pilot Project toStrengthen MCH/FP Services in Selected Urban Poor Communities: Analysisof Household Survey Data," 1986.

- 97 -
training for doctors, midwives and traditional DON midwives, provision ofequipment, drugs and medical supplies and information and motivationalmaterials.
6.38 To maximize the impact of the nutrition component it is necessary tohave common, narrowly focused targets as the basis for the coordinated actionof the various implementing agencies. The current Food and Nutrition Plan(FNP) is implemented by a host of government agencies and private groups withdifferent targets and priorities, and coordination has been a constantproblem. The current targetting procedures tend to miss out disadvantagedgroups in nonpriority areas. An alternative is to identify high riskhouseholds in all barangays, and then focus nutrition and other health inter-ventions on these households. Better targetting of groups requiring foodassistance and micro-nutrient supplements could lead to greater coverage ofthe disadvantaged groups for the same resources. Currently, food assistancetargets for preschoolers tend to miss out a large number of preschoolers notin need of such assistance. Furthermore, food assistance to school childrenshould be reconsidered since it might have a high impact if allocated tomalnourished preschoolers rather than to school children.
6.39 In the control of diarrheal diseases non-ORT therapy should be givenmore emphasis and breastfeeding campaigns should be refocussed to cover ruralwomen with lower education. In particular, we find that breastfeedingprevalence and duration has been declining since 1973 especially in the ruralareas and among women with low education. Although these women and theirchildren are the most vulnerable groups, the current breastfeeding campaignsare reachi-ng only the urban and better educated women.
6.40 In the design of the national program for the control of ABI, oneneeds to take into account the influence of other factors within the MiCHprogram on the incidence of ARI. Successful implementation of immunization,nutrition and diarrheal disease programs could already reduce expected ARIcases significantly. Therefore, the program cost would probably be lower thanestimates based on prevailing incidence and prevalence of ARI.
6.41 Another important part of ARI control should be education tohouseholds on case detection, home management techniques for mild cases, andreferral of moderately severe and severe cases to proper health personnel.Although the effectiveness of such an approach has yet to be tested in theBohol project the case detection techniques developed there could be packagedfor national implementation. The aim is to help mothers distinguish betweenmild and serious ARI cases, and have serious cases brought to the immediateattention of the proper health personnel. Such early action could spell thedifference between rapid cure and infant/child death.
6.42 Funding Concerns. The greater emphasis on preventive and promotivehealth services through the primary health care approach requires moreresources to finance; (a) a larger number of health manpower; (b) training ofan expanded number of existing and newly recruited health workers; (c)improved management and supervision by the paid health workers of volunteerhealth workers; (d) increased facilities, drugs, supplies and logistics at theBHS/RHU level for various public health programs; and (e) development ofappropriate health and nutrition information and education strategies.

- 98 -
6.43 The changes being contemplated should be tried on a pilot basis,both to deal with initial operational problems and to determine costs. Atpresent, it is difficult to estimate what additional resources are needed tofinance health programs that emphasize the preventive, promotive and simplecurative care to be offered. It is not yet clear, for example, how thepattern of demand for such services will evolve.
6.44 Government Funding. The DOH plans to allocate budget increases:(a) on the basis of regional incidence of poverty; (b) at the provinciallevel, based on population, with 65Z going to public health and 35X tohospitals; and (c) at the hospital level, by occupancy rate. While thisallocation procedure explicitly takes account of the need to shift resourcestoward provision of services to the poor, it might also adversely affect thepoor. First, there are large regional and provincial differences in povertyincidence. The allocation of resources between provinces in a poor region onthe basis of population might tend to favor better-off provinces. Moreover,it is possible that more resources per capita will be allocated in a richprovince located in a poor region than in a poor province located in a richregion. Therefore, it will be cost-effective if poverty incidence is used asan allocation criteria, at least to the level of provinces or municipalities.
6.45 With respect to the allocation of resources for hospitals on thebasis of utilization rates, there is a need to consider the factors affectingsuch rates. An underutilized facility in the province may indicate lack ofdemand because of poor quality of facilities and services. If so, moreresources may be needed to upgrade facilities and personnel to obtain betterutilization rates. On the other hand, a facility that is fully or over-utilized may not always indicate efficiency but may indicate substantial by-passing of rural health facilities because of poor services in these ruralfacilities. As a result, hospitals are treating cases that could either havebeen prevented or treated at lower-level facilities. Under thesecircumstances, more resources allocated to these hospitals may only aggravatethe misallocation between hospital and public health services with seriousimplications for public health services that should be reaching the poor. Itis, therefore, recommended that DOH proceed with the establishment of a HealthFinance Secretariat within DOH to review the issues of resource allocation inthe health sector and to recommend changes designed to bring greater equityand efficiency into the system.
6.46 Nongovernment Financing. Expanding the coverage and improving thequality of health care services for the poor require increased reliance onextra-budgetary sources. The common options include the imposition ofincreased user charges for curative public services particularly in hospitals,the expansion of insurance or risk coverage for the poor, community financingschemes, and an increased role for private and nongovernmental organizationsin the delivery of health care. The DOH is currently examining theseoptions. The various options available are discussed below.
6.47 User Charges. A key issue identified by DOH is how to maximizehospital income and utilize such income to improve the quality of hospitalcare and to reach a large segment of the poor. At present, there is concernregarding cost recovery in public hospitals. Cost recovery has declined to

- 99 -
102 in 1985 for both secondary and tertiary public hospitals. At the highestlevel of tertiary facility, cost recovery in 1983-85 ranged from 72 to 92.While DOH recommends that public hospitals retain their incomes from usercharges and utilize these to improve quality, efficiency and equity ofhospital care, it does not directly address the issue of increasing usercharges. Higher charges should be collected from higher-income patients toincrease subsidies to the poor.
6.48 Upon admission to hospitals, patients are interviewed by a socialworker who classifies patients according to ability to pay. Patients arecharged according to the following classifications: (a) Class A patients pay100% of total computed charges which are based on a Medicare schedule; (b)Class B patients pay at least 502 of total computed charges; (c) Class Cpatients donate whatever amounts they can afford up to 502 of total computedcharges; and (d) Class D patients are extended free treatment, uponverification of noncapacity to pay. Despite this classification, pay patientsand Medicare patients do not pay the entire cost of confinement. On average,in 1986 pay patients paid only 84X, while Medicare patients paid only 791, ofthe cost of confinement while full indigent and partially indigent patientspaid around 10% and 342, respectively, of the cost of confinement, in additionto the cost of medicines that they were required to purchase outside thehospitals ((Table 6.20, Statistical Appendix).
6.49 Recommendation. To obtain greater cost recovery for hospitalservices and at the same time to improve equity, it is recommended that DOHconsider the following: (a) collect from pay patients the social marginalcost of hospital services instead of the cost based on the Medicare feeschedule, which generally would not reflect social marginal cost; (b) directlycollect from Medicare patients the difference between the social marginal costand the Medicare support value, but gradually upgrade such support valuethrough better management of Medicare funds as planned; (c) provide services,including medicines, to indigents free of charge and (d) for partialindigents, collect some amount, e.g., through donations. The cost of hospitalservices recovered through (a), (b) and (d) can be used to expand services tosupport (c) and (d). These approaches are expected to improve equity byincreasing the subsidies to indigents and reducing subsidies to pay andMedicare patients who have the option to go to private hospitals. The capitalfinancing and operating capital needs of the Philippines hospital industry areextremely complex and these needs affect level and quality of care availableto the poor. Hospital financing needs should be considered in the context ofthe entire health care service industry, rather than just that of hospitals.Industry needs include the financing of HMOs and other contractual servicearrangements for provision of health services, group purchasing of suppliesand community-financed health centers, as well as additional hospitalrehabilitation and construction.
6.50 In order to reach a larger segment of the very poor, the cost ofhospitalization including drugs must, in the short term, be highly subsidizedby the public sector. In the long run, however, insurance and other riskcoverage should finance the cost of health care for some of the poor.

-100 -
6.51 Health Insurance and Other Risk Coverage. Since hospital care isexpensive, some r:4jans must eventually be found to recover the cost of hospitalcare of indigents in addition to possible donations and fees. One option isto expand insuran'.e and other risk coverage to the poor. None of the existinginsurance or risk coverage schemes reach the very poor who are mostly self-employed in both the rural areas and the urban informal sector. There shouldbe a more effective use of Government sponsored insurance, both SSS and GSIS,to increase benefits and extend coverage. The agencies should establish anexperimental unit to encourage field testing of various projects. Privatesector insurance should be encouraged to offer contracted and managed healthservices. The carriers have an opportunity to address underwriting and/oradministering health care services for other than employer-relatedpopulations. Both public and private insurer and reimbursements forphysicians and hospitals should be modified and designed to reinforce costeffective community health strategies.
6.52 Under the current Medicare plan about 30Z of health care costsare covered by for the government insurance system and 48X by private sectorsocial security system. Thus, even the insured still face substantialfinancial risk. The DOH recommends better management of the Health InsuranceFund to allow an increase in the Medicare support value. This will provideadditional resources for greater cost recovery in public hospitals handlingMedicare patients, since a larger portion of the cost can now be recovered byinsurance payments.
6.53 The Government is now reviewing its approach to community healthdevelopment. A working group composed of DOH staff and NCO representativeshas been formed to assist in development of a policy concerning theCovernment's approach to community-based health development. Work has begunon a policy and approach which is innovative and which builds on existingexperience and success regarding community-based health development in thePhilippines. This process should be strengthened and the Government proposesto seek Bank funding for it through the proposed Health Development ProjectIII.
6.54 Nongovernmental Resources. The private sector provides the bulk ofhealth care services in the Philippines. The formal private sector isconcentrated in urban areas and generally caters to higher-income groups.Traditional health practitioners, called hilots and herbolarios, practicemostly in rural areas and in urban poor communities. Various nongovernmentalorganizations (NGOs) also provide service to the poor, but they have limitednational coverage in view of their small size.
6.55 Various opportunities exist for mobilizing private sector resourcesat the community level, and many of these have been used in the past. Theseresources are generally in the form of labor inputs, a major component ofwhich is volunteer services, principally the BHWs. This is indeed a valuableresource which needs to be sustained through improved training, close super-vision, and provision of some nonmonetary incentives. The DOH's plan toexpand and sustain volunteer health workers via the formal health networkdeserves support. Properly managed and supervised, and more importantly,publicly recognized, volunteer health workers can be a valuable resource insupport of public sector efforts.

- 101 -
6.56 Another important community resource that has been tapped in thepast are the traditional health practitioners, i.e., hilots. Hilots provide alarge part of maternal care and birth deliveries among the poor. Their roleas partners in health care has been recognized by DOH in the past and as aresult a number of hilots were trained in sanitary birth delivery procedures.Such training needs to be pursued more systematically and in a sustainedfashion. Health education for hilots is also necessary in order to avoidconflicting messages between the hilots and the health sector's informationand education programs. The hilott can also be enlisted to strengthen thereferral system at the village level. It is recommended that the DOH continuesupporting the traditional health practitioners in the provision of primaryhealth care, and to upgrade their capabilities in more modern health practicesand concepts.
6.57 Successful community financing projects are often those where time-consuming efforts are made in social preparation and where village leadershipis already strong. The development and implementation of such projects shouldperhaps be better left to private groups or NGOs.
6.58 External Resources. Increased budgetary resources for health,greater efficiency in the use of existing resources, various cost recoverymeasures, and tapping community resources are all expected to generateadditional resources to finance cost-effective health care measures for thepoor. The full impact of these reforms on resource mobilization, however, arenot likely to be achieved in the medium term. In the meantime, there is anurgent need to adopt cost-effective measures based on greater emphasis onpreventive and promotive care and on input-substitution to achieve the least-cost combinations in the delivery of curative care. Thus, as the abovemeasures are being implemented, there is a need to supplement domesticresources from external sources in terms as favorable as possible. Whileexternal funding has traditionally been reserved for the development ofcapital infrastructure, there is a greater urgency to finance the cost ofoperationalizing and implementing the reforms in the delivery of healthservices (i.e., preventive and promotive care and shifts in input combination)and in health care financing. It is recommended that external agencies takethis current need of the Government into account in approving funding forhealth activities.
C. Nutrition
Current Situation
6.59 Nutritional problems in the Philippines are primarily those ofdietary/nutrient inadequacies among low-income groups and growth failure inpreschool children. Available nat',nal data indicate that some progress hasbeen achieved in improving the nutritional status of the population between1978 and 1982; however, such progress appears to have been reversed by 1985,particularly among preschool children.
6.60 Data on energy and protein intake from surveys carried out by theFood and Nutrition Research Institute (FURI) show that the percentage ofhouseholds with energy intakes less than 80X of the recommended daily

Table 6.14: PHILIPPINES: COMPARISON OF PERCENTAGE DISTRIBUTION OF HOUSEHOLDS BYLEVELS OF ENERGY AND PROTEIN ADEQUACY, BY URBANIZATION
AND ISLAND GROUP, PHILIPPINES, 1978 AND 1982
By urbanization By island groupNutrition/level Philippines Urban Rural Luzon Visayas Mindanaoof adequacy /a 1978 1982 1978 1982 1978 1982 1978 1982 1978 1982 1978 1982
Energy /bLess than 80% 38.4 33.6 38.7 32.1 38.2 34.3 34.3 33.1 46.2 38.0 41.0 27.180-99% 39.1 44.2 37.0 44.4 40.1 44.3 39.9 44.8 35.6 43.8 43.0 42.5100% and over 22.5 22.1 24.3 23.5 21.7 21.4 25.9 22.0 18.2 18.2 16.0 30.5
Total 100.0 99.9 100.0 100.0 100.0 100.0 100.0 99.9 100.0 100.0 100.0 100.1
Protein /cLess than 70% 16.4 14.2 12.0 11.1 18.5 15.6 16.0 14.9 16.5 15.3 17.8 11.170-119% 55.6 61.5 54.5 59.1 56.2 62.6 53.7 62.3 57.7 61.5 60.2 58.4 o120% and over 28.0 24.3 33.5 29.6 25.3 21.6 30.3 23.3 25.8 23.5 22.0 30.3
Total 100.0 100.0 100.0 99.8 100.0 99.8 100.0 100.0 100.0 100.0 100.0 99.8
/a Percent of nutrient intdke over recommended allowance.
/b Less than 80% energy adequacy level is an arbitrary cut-off point set as marginal level of energy ade-quacy based on the coefficient of variation of energy expenditure from various occupational groups whichis about 20%.
/c Less than 702 protein adequacy level-an arbitrary cut-off set as marginal level of protein adequacywhich takes into account 30% margin of safety.
Source: FNRI, Second Nationwide Nutrition Survey, Philippines, 1982, 1984 as reported in UPLB AgriculturalPolicy Working Group, Policy Issues on Nutrition and Welfare, 1987.

- 103 -
Table 6.15: PHILIPPINES: PERCENT ADEQUACY OF MEAN ONE-DAYFEf-AYTTr NUTRIENT INTAKE BY SELECTED CHARACTERISTICS, 1982
NutrientRibo- Ascorbic
Characteristics Energy Protein Iron Calcium Thiamine flavin Niacin acid
PHILIPPINES 89.0 99.6 91.5 60.4 71.0 66.3 119.7 91.1
ResidenceeEFro Manila 87.7 100.8 85.5 70.0 80.0 70.2 118.1 81.3Other urban 91.3 105.9 100.0 83.9 75.7 64.1 129.0 84.9Rural 88.6 97.6 90.5 78.9 60.9 50.5 116.0 95.0
Island GroupLuzon 89.3 98.6 91.5 83.9 74.8 59.2 121.2 92.6Visayas 86.0 101.0 91.4 75.0 64.7 51.5 113.0 86.8Mindariao 93.7 101.8 94.0 80.4 72.0 50.5 122.6 93.2
Annual Per Ca itaTmco-me kresos)Lests than 250 78.4 77.0 72.9 71.4 62.1 38.8 90.5 125.0250- 499 82.8 89.8 86.4 73.2 66.0 64.7 107.3 84.2500- 999 84.4 90.9 85.6 76.8 68.0 46.6 110.2 92.0
1,000-1,999 89.7 100.2 91.5 80.4 69.9 53.4 123.4 84.02,000-3,499 92.1 106.5 94.9 85.7 74.3 62.1 125.5 91.13,500-6,999 96.4 114.0 103.4 89.3 82.6 74.8 133.6 90.07,000+ 106.0 128.0 111.0 101.8 89.3 88.3 143.8 98.1
Occupation of HH Headrro!essionalltech-nical/skilled 91.1 109.8 100.8 85.7 77.7 66.0 129.9 89.6
Farm owner 93.4 102.0 94.9 87.5 76.7 54.4 124.1 104.0Farm worker 67.6 92.5 87.6 76.8 66.0 48.5 112.4 103.7Fisherman 87.5 97.8 84.7 76.6 81.2 44.7 113.0 80.2Semiskilled 87.5 97.0 87.3 78.6 70.9 56.3 115.3 80.9Unskilled 87.3 92.1 60.5 69.6 66.0 50.5 113.9 73.7Others 92.3 109.3 100.8 94.6 76.7 67.0 129.9 94.1None 81.8 92.1 91.5 78.6 70.9 52.4 117.5 91.7
Education of MealPIannerNo formal schooling 87.0 64.1 86.4 82.1 57.0 57.6 109.5 99.11-6 years 87.7 96.3 89.0 80.4 66.0 51.5 116.1 92.07-10 years 90.0 102.0 91.5 78.6 75.7 59.2 123.4 80.611+ years 94.4 115.0 103.4 92.9 32.5 75.7 133.6 98.5
Household SizeI_z 113.4 127.0 123.7 117.9 89.3 66.0 156.9 125.33-4 99.2 111.8 102.5 85.7 80.6 63.1 131.4 102.55-6 89.7 100.8 93.2 85.7 71.8 57.3 119.7 92.27-8 87.3 96.5 88.1 78.6 70.0 54.4 116.1 82.89+ 84.8 95.5 86.4 75.0 68.0 52.4 114.6 91.3
Source: FNRI, Second Nationwide Nutrition Surey Philippines, 1982, 1984 as reported inZ. Zablan, 1986 Situalion Analysis ot unildren and women: Demographic andHealth Perspectives," 1986.

- 104 -
allowance (RDA) declined from 381 in 1978 to 34Z in 1982, while the percentageof households with protein intakes less than 701 of RDA declined from 16% in1978 to 14S in 1982 (Table 6.14). The percentage of households withinadequate energy and protein intakes was higher in rural than in urban areas,and was generally higher in the poorer regions.
6.61 Data on per capita nutrient intake for 1982 show large variationsbetween social groups (Table 6.15). Nutrient intake adequacy by type ofnutrient is generally lower among low-income households; among farm workers,fishermen, semi-skilled and unskilled workers; among households with poorlyeducation meal planers; and among large households.
6.62 Among the more important micronutrient deficiencies are in iron,iodine and Vitamin A. Deficiencies in iron, in particular, have caused a highprevalence of anemia. In 1982, the FNRI survey showed that the highest anemiarates occurred among infants (531) and pregnant mothers (351) (Table 6.16)
Table 6.16: PREVALENCE OF ANEMIA, 1982(percentage)
Age, sex andphysiological state Philippines All urban Rural
Below 1 year 51.3 47.6 52.91 - 6 years 32.0 29.0 33.27 - 12 years 31.0 28.3 33.313 - 50 years (males) 14.9 11.3 16.813 - 59 years (non-pregnant,
non-lactating females) 27.0 26.4 27.360 years and over 37.2 32.8 39.0
Pregnant 34.1 32.5 34.8
Lactating 20.2 23.4 19.3
Source: FNRI, Second Nationwide Nutrition Survey, Philippines, 1982, 1984 asreported in R. F. Florentino, et al., 1986 Situation Analysis ofChildren in the Philippines: Food and Nutrition, 1986.
6.63 The economic crisis had a negative impact on nutritionalconditions. FNRI surveys in Metro Manila conducted in 1984 and 1985 designedto asms this impact suggest a deterioration in nutritional status after19820._ Data on food consumption and nutrient intake from these surveys show
28/ C. M. Villavieja, et al., "Assessment of the Nutritional Situation in anUrban Region in a State of Rapid Economic Flux," 1985.

- 105 -
clear tendencies towards decreases in food consumption and correspondingdecreases in nutrient intake for Metro Manila as a whole, but more partic-ularly for the depressed areas since 1982. For the Metro Manila sample, themost affected groups were households headed by workers in transport and commu-nications, craftsmen, production workers, and the unemployed. In contrast,households headed by professionals, technical workers, entrepreneurs andskilled workers showed improvements in food consumption and nutrient intake.
6.64 The nutritional problem that has generated most concern ismalnutrition among preschool children. Preschool children aged 0-6 years,constitute about 202 of the population, have been identified as the populationgroup most likely to be affected by malnutrition, and the group most likely tosuffer from its severe consequences.
6.65 National data based on anthropometric measurements conducted by FNRIreveal that the prevalence of malnourished children declined between 1978 and1982 (Table 6.21, Statistical Appendix). This trend, however, appears to havebeen reversed by 1985 as data from the National Nutrition Surveillance Survey(1S18) of the National Nutrition Council (NNC) suggest. In 1978, theproportion of children below weight-for-height standards was 142. Thisdeclined to around 102 in 1982. In 1985, the proportion rose again Xo 142(Table 6.17).
Table 6.17: COMPARISON OF TRENDS IN WEIGHT-FOR-HEIGHT,HEIGHT-FOR-AGE AND WEIGHT-FOR-AGE OF UNDERNOURISHED
0-6 YEARS OLD CHILDREN, FNRl AND NNSS RESULTS
Year No. of Weight-for-Height Height-for-Age Weight-for-Ageand source subjects (852 (902 <752
1978 (FNRI) 3,400 13.8 n.a. 22.21982 (FNRI) 3,615 9.5 20.6 17.21984 (NNSS) 3,440 13.3 25.2 20.51985 (NNSS) 3,243 14.3 24.8 22.0
Source: 1978 and 1982 National Nutrition Surveys, FNRI (1981, 1984) andNational Nutrition Council, Management Information Services Divisionas reported in UPLB Agricultural Policy Working Group, Policy Issueson Nutrition and Welfare, 1987.
6.66 In 1985, the prevalence of malnutrition among preschoolers based onweight-for-height was higher in urban areas (182) than in rural areas (112).Moreover, while the prevalence declined in rural areas from 13X in 1984 to 112in 1985, the prevalence rose n urban areas from 142 in 1984 to 182 in 1985(Table 6.18).

Table 6.18: PHILIPPINES: DISTRIBUTION OF PRESCHOOL CHILDRENBY NUTRITIONAL STATUS AND BY LOCATION FOR 1984 AND 1985
Rural Urban Total1984 1985 1984 1985 1984 1985
Z of X of Zof of Z of Z ofParameters No. total No. total No. total No. total 90. total No. total
< 85% WH 212 12.83 159 10.63 229 13.81 281 17.81 441 13.32 440 14.31>-85% WH 1,441 87.17 1,337 89.37 1,429 86.19 1,297 82.19 2,870 88.68 2,634 85.69
Total 1,653 100.00 1,496 100.00 1,658 100.00 1,578 100.00 3M1 100.00 3,074 100.00
< 90% HA 437 26.26 395 25.83 411 24.06 385 23.75 848 25.15 780 24.76>-90% HA 1,227 73.74 1,134 74.17 1,297 75.94 1,236 76.25 2,524 74.85 2,370 75.24
Total 1,664 100.00 1,529 100.00 1,708 100.00 1,621 100.00 3,372 100.00 3,150 100.00 o
<-75% WA 350 20.72 301 19.23 354 20.22 411 24.38 704 20.47 712 21.95> 75% WA 1,339 79.28 1,256 80.67 1,397 79.78 1,275 75.62 2,736 79.53 2,531 78.06
Total 1,689 100.00 1,557 100.00 1,751 100.00 1,606 100.00 3,440 100.00 3,243 100.00
WH - weight-for-height; HA - height-for-age; WA - weight-for-age.
Source: National Nutrition Council as reported in UPLB Agricultural Policy Working Group, Policy Issues onNutrition and Welfare, 1987.

Table 6.19: PHILIPPINES: MEAN ONE-DAY NUTRIENT INTAKE AND PERCENT ADEQUACY OF 6-MONTH TO4-YEAR-OLD CHILDREN BY URBANIZATION, 1982
Philippines Metro Manila Other urban All urban RuralX ade- Z ade- % ade- X ade- X ade-
Nutrient Intake quacy Intake quacy Intake quacy Intake quacy Intake quacy
Energy (kcal) 873 63.3 1,018 75.9 943 68.8 968 71.1 820 59.0
Protein (g) 27.3 100.0 31.5 118.4 30.0 110.7 30.5 113.4 25.5 92.7
Calcium (g) 0.29 58.0 0.38 74.5 0.33 66.0 0.35 68.6 0.25 50.0
Iron (mg) 5.4 80.6 5.9 86.8 6.2 92.5 6.1 91.0 5.0 74.6
Thiamine (mg) 0.47 65.3 0.64 90.1 0.54 75.0 0.57 80.3 0.41 56.9 £
Riboflavin (mg) 0.44 61.1 0.68 95.8 0.53 73.6 0.58 81.7 0.36 50.0
Niacin (mg) 8.2 87.2 8.5 92.4 9.2 97.9 9.0 96.8 7.8 82.1
Ascorbic acid (mg) 28.9 77.1 23.2 62.5 29.5 78.9 27.4 73.5 29.8 79.0
Source: FNRI, 1982 Nationwide Nutrition Survey as reported in R.F. Florentino, et al., 1986 Situation Anal-ysis of Children in the Philippines: Food and Nutrition, 1986.

- 108 -
6.67 Determinants of Nutritional Status. The proximate determinants ofnutritional status, particularly for preschool children, are dietary/nutrientintake and health status. The underlying determinants include householdincomes, family size, knowledge and education of child care-givers,environmental sanitation, and vtilization of health care services.
6.68 The high prevalence of malnutrition among children can be traceddirectly to the quantity and quality of their diet. In 1982, the mean one-daydietary intake of children aged 6 months to 4 years, although adequate forprotein, was only 63% adequate for energy, and generally inadequate for suchmicronutrients as calcium, iron, thiamine, riboflavin, niacin, and ascorbicacid (Table 6.18). As a whole, rural children have the lowest overallnutrient intake compared to children in urban areas. Data on mean nutrientintake, however, tend to hide the fact that a very large proportion of allchildren have diets that fall below 100% adequacy. In 1982, only 12% ofchildren had 100% or more adequacy in energy intake and only 33% had 100% ormore adequacy in protein intake (Table 6.19).
6.69 In addition to inadequate average dietary intake, there is evidenceof intrahousehold differences in dietary intake, with the children being moredisadvantaged than adults. In general, several studies have shown thatparents had more adequate diets than their children; female members were lessadequately fed than males; adolescents were more deprived than other familymembers; and pregnant and lactating adolescents were mQr , at risk anddisadvantaged than pregnant and lactating adult women._
6.70 An important determinant of nutrient intake of children,particularly infants, is breastfeeding. As we saw in the previous section,the prevalence and duration of breastfeeding has declined somewhat between1978 and 1983, particularly among younger women with a low level of educationand women in rural areas.
6.71 Another important proximate determinant of nutritional status amongyoung children is their health status. The relationship between infection andnutrition is well known. While malnutrition reduces resistance to infections,acute infections worsen nutritional status through loss of appetite, vomiting,nutrient loss or malabsorption, etc. Among the various infections, diarrhea,parasitism and respiratory infections are said to have the most pronouncedeffects on the nutritional status of children. Both diarrhea and respiratoryinfections account for most infant and child mortality and morbidity.
6.72 The underlying factors affecting nutritional status have notimproved, and some have even deteriorated. Real household incomes havedeclined in the recent past, the incidence of poverty has been increasing,fertility has not declined rapidly, and literacy rates among women 25 yearsold and over have not significantly improved. Moreover, indicators of
29/ For a review of these studies, see C. Barba and N. M. Pandes, "SomeIssues in the Assessment of Nutritional Status" in UPLB AgriculturalPolicy Working Group, Policy Issues on Nutrition and Welfare, 1987.

- 109 -
environmental sanitation still leave much to be desired, and the use of healthcare services has been inadequate, particularly for immunization and thecontrol of infectious diseases.
Nutrition Policies and Programs
6.73 The National Nutrition Council (MC) was established in 1974 toformulate the Food and Nutrition Program (FNP). The agency also integratesthe policies and programs of all agencies involved in nutrition-relatedactivities.
6.74 A basic feature of the FPP is the adoption of a multisectoral andmultiagency approach to program implementation, based on the recognition ofthe multiple factors affecting nutritional status. In the latest FNP (1987-1992), program activities are divided into a number of main components. Themajor component, called the Nutrition Intervention Program (NIP), includesfood assistance; nutrition services; incremental food production and growthmonitoring. The Nutrition Information, Education and Advocacy (NIEA) compo-nent has been expanded to focus on government and private entities aimed tomake nutrition an important development concern.
6.75 The NNC is the central agency responsible for policy formulation,program planning, monitoring and coordination. At the local level, the FNP isto be operationalized by various L>trition committees at the regional,provincial, city, municipal and barangay levels. Local government executivesare expected to provide leadership in the planning, implementation andevaluation of the program.
6.76 To mobilize grassroots participation and to strengthen the FNP atthe barangay level, the NNC trained and deployed Barangay Nutrition Scholars(BNS) starting in 1978. As of 1984, the BNSs cover less than one third of allbarangays in the country. The BNS is a trained village worker who receiveslimited remuneration from the local government for working as a communityorganizer and for delivering basic nutrition and related health services.
Recomuendations
6.77 The FNP consists of a large number and variety of projectsimplemented by a host of government and private agencies. This basic featureof the FNP is in line with the government strategy to address the multiplefactors affecting nutritional status. The continued use of scarce resourceson a wide range of activities, of which some might have limited nutritionalimpacts, may not be producing maximum impact on the nutrition problem of themost vulnerable groups of the population. At present there is little activitybeing planned for the systematic evaluation of the various project componentsof the FNP both with respect to coverage and impact.
6.78 It is, therefore, recommended that systematic monitoring and impactevaluations be conducted to identify the best use of resources for maximumimpact. This involves upgrading the evaluation capability of the staff of theNNC, and will require additional funding. Experience gained from nutritionprojects throughout the world show that substantial nutritional impact can be

- 110 -
achieved by a program with a limited number of components that can besuccesfylly delivered to a well defined and clearly identified targetgroup., Highly focused interventions require a clear definition of thetarget population. Moreover, the target needs to be commonly defined for allagencies involved.
6.79 A review of the planned food assistance activity of the FNP (1987-1992) raises questions regarding the adequacy of its targeting procedures.First, while moderate and severely malnourished preschoolers are given thehighest priority in food assistance, only half of the eligible population istargeted for assistance in 1987. On the other hand, about 8Z of preschoolersregardless of nutritional status is planned to receive food assistance in1987. Such a plan necessarily leads to undercoverage of the needy populationand unnecessary coverage of the less needy population.
6.80 Around one quarter of the children aged 7-14 years are moderately orseverely malnourished (weight-for-age measure). Planned coverage of thesechildren by the school feeding program is almost total. However most of theapparent undernutrition among school children is due to stunting rather thanwasting or acute malnutrition. Therefore, the current supplementary feedingprograms in schools are likely to be less useful than nutrition education andlong-term fyfroaches, together with measures to improve pre-school agenutrition._
6.81 In view of the foregoing, it is recommended that the targetpopulation for food assistance be reviewed with the aim of reallocating theprogram thrust to achieve as complete a coverage as possible of the group mostin need of such intervention and for which significant nutritional impact canbe expected.
6.82 The NNC currently determines priority municipalities, cities andbarangays for nutrition interventions based on OPT data. Thosemunicipalities/cities with a prevalence of severe and moderately underweightpreschoolers higher than the national average are categorized as nutritionallydepressed. Since the coverage of OPT varied from area to area, the resultingprofile of undernutrition may be highly inaccurate.
6.83 In order to provide better coverage of the FNP, it is recommendedthat the targeting system for nutrition interventions be based on the identi-fication of nutritionally at risk households in each barangay. Such identi-fication shall be based on common criteria which includes occupation ofhousehold head, family size, quality of housing, education of mother, andpresence of preschoolers and pregnant and lactating mothers. These factorsare known by NNC to be related to nutritionally-at-risk households. Such
30/ See A. Berg, Malnutrition: What Can Be Done: Lessons from World BankExperience, 1987.
31/ R. F. Florentinop et al., 1986 Situation Analysis of Children in thePhilippines: Food and Nutrition, 1986.

- ill -
identification can be carried out by trained volunteer workers supervised bypaid barangay health workers.
6.84 A major constraint to the success of the FNP is the lack ofappreciation of nutrition as a development concern by various agencies of thegovernment and by local government executives. This is believed to be afactor in the lack of integration of nutrition considerations in developmentprograms by other agencies of government on the one hand, and by the lack ofsupport and commitment by local government executives to the FNP on theother. The NNC plans to address this constraint through its NIEA programcomponent involving various activities including workshops and seminars, useof media, and orientation/briefings of government officials (legislators andlocal government executives) on nutrition and development and on the FNP.These activities are appropriate and need continued support, particularly withthe election of a new set of legislators and local government executives. Itis recommended to link the NIEA component with current efforts by POPCOM andNEDA for the integration of population and development planning and thetraining and orientation program for various government officials andplanners.
6.85 Another constraint is that the decentralized approach to theplanning, implementation and evaluation of FNP has not been fully realized.The FNP is still highly centralized. It has been observed that while the NNCas a body collectively agreed to decentralize nutritional planning and imple-mentation, the authority of member agenuies over nutrition programs andactivities has not yet been effectively transferred to the local levelnutrition committees headed by the provincial governors, city and municipalmayors. It is recommended that the NNC make a policy decision on whether togive local government executives greater operational control over fieldpersonnel of NNC member agencies, as well as a greater role in influencingagency program/project priorities. Such a decision, however, has to take intoaccount the entire issue of decentralization of government functions to thelocal level, an issue that has not yet been resolved at the top policymakinglevel.

-112 -
PHILIPPINES
A. Statistical Appendix
Table of Contents
Table No.
SECTION I - POVERTY AND INCOME DISTRIBUTION
1.1 Poverty Incidence by Family Size1.2 Poverty Incidence by Household Head's Occupation (X)1.3 Distribution of the 30% Poorest by (a) Area (b) Type of Activity and
(c) Sex1.4 Major Source of Income for Families in the Bottom 30%1.5 Main Source of Income by Farming Activity, Bottom 30%1.6 Distribution of Bottom 30% by Region1.7 Families with Wages as the Major Source of Income by Head Occupation1.8 Income Distribution, 1961-851.9 Average Real Family Income in Pesos (1978 = 100)1.10 Average Real Income Index (1961 = 100)1.11 Comparisons of Income Distribution and Poverty Incidence in Some East
Asian Countries1.12 Revised Income Distribution, 1985
SECTION II - EMPLOYMENT AND WAGES
2.1 Labor Force Statistics2.2 Labor Force Participation by Specific Groups2.3 Geographical Distribution of the Labor Force2.4 Employment by Industries2.5 Unemployment Rates by Selected Labor Force Groups (Z)2.6 Unemployment by Household Heads2.7 Unemployment by Schooling Levels and Ages2.8 Underemployment of Household Heads2.9 Urban Underemployment by Schooling Levels and Earnings2.10 Average Income Underemployed Household Heads2.11 Real Wage Indexes2.12 Real Minimum Wage Indexes (1972 = 100)2.13 Real Average Earnings by Industries2.14 Proportion of Fully Employed Workers in Urban Areas by Earning Groups2.15 Distribution of Fully Employed Workers in Rural Areas by Earnings2.16 Government Employment by Branch2.17 Structure of Public Employment Across Ministries2.18 Real Average Salary in the Public Sector2.19 Share of Income and Percentage of Taxes Paid by Each Income Class,
1985

- 113 -
Table No.
SECTION III - EDUCATION
3.1 Student by Type of School and Income Decile (A 13-16)3.2 Number of Scholarships Awarded Accommodated Yearly by Program3.3 National Government Expenditure on Education3.4 Distribution of Public Recurrent Expenditure by Purpose, 1984 (Z)3.5 Education Expenditures by Category (Z)3.6 Unit Cost and Tuition in Higher Education, 1977.
SECTION IV - THE INCOME DISTRIBUTION CONSEQUENCES OF MACROECONOMIC ADJUSTMENT
I. The Model
II. Graphical Presentation
III. Empirical Results
SECTION V - METHODOLOGICAL APPENDIX
5.1 Comparison of National Accounts and FIES Estimates of Family Incomeand Expenditure
5.2 NCSO Income Distribution by Deciles, 1985 (Z)5.3 Total, Rural and Urban Income Distribution and Distribution of
Families, NCSO, 19855.4 Revised Income Distribution by Deciles, 19855.5 Revised Income Distribution, 1985
SECTION VI - HEALTH
6.1 Infant Mortality Rates for Selected SocioecoLomic Characteristics,1970-83
6.2 Proportion of Households with basic facilities, 1970-856.3 Prevalence of intestinal parasitism by island groups, 19826.4 Malnutrition Rates by Region, 19840856.5 Trends in Breastfeeding prevalence and duration, 1973-836.6 Proportion of deaths with medical attendance by region, 1977-836.7 Proportion of Births with medical attendance by region, 1977-836.8 Literacy by selected age group, sex, urban and rural 1960, 1970, 19806.9 Ten Leading Causes of Morbidity, 1978-846.10 Hospital Beds by region, 1982-856.11 Government Health Facilities, 1975-856.12 Government Workers, 19078-856.13 Health Manpower by region, 1973 and 19776.14 Real Health Care Expenditures, 1981-856.15 Distribution of Government Health Funds, 1981-856.16 Uses of the Budget of the Department of Health, 1981-85

- 114 -,
6.17 Expenditures on Public Hospitals by Region, 1981-856.18 Family Health Expenditures, 1965 and 19716.19 Government Health Funds by Source, 1981-856.20 Financial Statistics on Government Hospitals in Metro Manila, 19866.21 Distribution of Children by Energy and Protein Adequacy Level: 1978
and 19826.22 Department of Health Reorganized Structure

- 115 -
Table 1.1: POVERTY INCIDENCE BY FAMILY SIZE
No. of persons Poverty incidence (x) % Distributionin family 1971 1975 1985 1971 1975 1985
1 7.9 9.4 25.2 0.4 0.3 1.13
2 13.7 13.9 28.9 2.6 1.8 3.76
3 20.1 24.9 37.3 6.5 6.3 8.03
4 24.8 34.4 46.6 10.2 10.8 14.50
5 34.3 39.6 51.6 13.9 13.1 17.57
6 40.5 52.1 , 58.4 15.1 16.4 17.87
7 44.5 57.6 64.4 14.3 14.6 14.50
8 50.2 60.8 64.9 15.3 13.1 10.29
9 52.0 65.2 64.3 -8.0 9.9 6.18
10 or more 58.3 5.3 57.6 13.7 13.6 6.17
Total 36.1 45.3 51.7 100.0 100.0 100.00

-116 -
Table 1.2: POVERTY INCIDENCE BY HOUSEHOLD HEAD'S OCCUPATION(%)
Total Total Urban Rural1971 1985 1985 1985
Professional, administrative andclerical workers 5.6 16.78 15.90 18.74
Sales workers 20.0 38.08 36.69 40.31
Farmers 1 64.04 62.31 f-4.24} 53.9/a
Farm managers } 41.97 19.15 57.85
Service workers 27.7 44.82 45.94 42.64
Agricultural workers /b 51.3 70.20 74.85 69.56
Forestry workers 41.4 73.35 52.32 78.15
Fishermen, hunters 53.6 71.48 79.29 69.76
Production workers 31.7 46.57 43.77 50.70
Miners 28.6 63.48 67.35 62.46
Transport workers 28.7 47.42 50.15 43.55
Construction workers 32.2 61.92 57.97 65.83
Laborers not classified N.A. 69.76 74.14 64.21
Not elsewhere classified 28.8 34.07 30.78 38.60
All Occupations 38.7 51.70 41.58 57.86
/a The definition of this occupational category has changed from 1971 and isnot comparable with the 1985 items.
/b Appeared as farm laborers in 1971.

- 117 -
Table 1.3: DISTRIBUTION OF THE 30% POOREST BY (a) AREA(b) TYPE OF ACTIVITY AND (c) SEX
No. of Total % of % of ent. Family Per capitafamilies income wages activities size income
… __- -__----____---- - (a) -----------…------- -
Urban 532,217 13,718 41.39 31.06 6.6 2,094
Rural 2,445,120 11,889 26.39 45.43 6.2 1,962
Total 2,977,337 12,344 30.10 41.90 6.3 1,995
____ ___ _ _ _ ~~~(b)------------- -
Agriculture 1,958,526 11,709 21.89 51.98 6.2 1,926
Nonagriculture 1,018,811 13,422 44.09 24.77 6.4 2,111
Total 2,977,377 12,344 30.10 41.90 6.3 1,995
Male 2,713,420 12,590 30.64 42.72 6.42 1,988Female 263,916 9,923 25.05 33.31 4.91 2,060
Total 2,977,337 12,344 30.10 41.90 6.3 1,995

118 -
Table 1.4: MAJOR SOURCE OF INCOME FOR FAMILIES IN THE BOTTOM 30%
Total Urban RuralFamilies % Families Z Families X
Wages 1,008,738 0.34 266,984 0.50 741,754 0.30Agriculture 473,044 0.16 41,863 0.08 431,181 0.18Nonagriculture 535,694 0.18 225,121 0.42 310,573 0.13
Entrepreneurial Activities 1531,706 0.51 182,755 0.34 1,348,951 0.55Crop farming 997,664 0.34 59,004 0.11 938,660 0.38Livestock 27,757 0.01 2,729 0.01 25,028 0.01Fishing 230,894 0.08 31,268 0.06 199,626 0.08Forestry 34,139 0.01 2,897 0.01 31,242 0.01Trade 151,305 0.05 63,087 0.12 88,218 0.04Manufacture 53,036 0.02 8,908 0.02 44,128 0.02CSRP services 18,332 0.01 8,683 0.02 9,649° %.00Transportation 13,556 0.00 5,232 0.01 8,324 Q.00Mining 4,076 0.00 0 0.00 4,076 0.00Construction 947 0.00 947 0.00 0 0.00NEC 0 0.00 0 0.00 0 0.00
Other Income 435.774 0.15 82.000 0.15 353,774 0.14Net share of crops 46,944 0.02 5,932 0.01 41,012 0.02Assistance from abroad 19,866 0.01 4,355 0.01 15,511 0.01Assistance from domestic 116,575 0.04 31,741 0.06 84,834 0.03Rental, nonagricultural 3,615 0.00 2,314 0.00 1,301 0.00Interest from banks, etc. 1,776 0.00 1,094 0.00 682 0.00Pension 14,821 0.00 6,169 0.01 8,652 0.00Dividends 0 0.00 0 0.00 0 0.00Rental value of owner 27,448 0.01 9,815 0.02 17,633 0.01Sustenance activities 158,386 0.05 11;444 0.02 146,942 0.06Gifts 45,134 0.02 8,614 0.02 36,520 0.01Other income 1,209 0.00 522 0.00 687 0.00
Total Number of Families 2.976,218 1.00 531,739 1.00 2,444,479 1.00

- 119 -
Table 1.5: MAIN SOURCE OF INCOME BY FARMING ACTIVITY, BOTTOM 30%
Wages NetAgri- Nonagri- Sustenance share Other Total
Farming culture culture Total activities crops sources income
…- …----- ----------- Number of families -- -- - -------------- -
Rice 437,251 42,584 24,077 66,661 42,708 8,756 70,585 625,961Corn 259,141 27,412 24,921 52,333 31,556 9,648 59,655 412,333Sugar 3,875 1,320 0 1,320 2,098 0 692 7,985Other crops 81,138 14,315 5,849 20,164 17,308 4,213 22,948 145,771Coconut 148,695 13,462 6,887 20,349 17,533 6,497 31,529 224,603Fruit 2,059 2,926 0 2,926 0 0 1,113 6,098Livestock 2,124 1,319 0 1,319 0 0 7,216 10,659Poultry 1,279 0 0 0 0 621 1,713 3,613NEC 6,522 430 0 430 649 0 1,381 8,982
Total 942.084 103,768 61,734 165,502 111,852 29,735 196,832 1.446,005
- ------- Percentages
Rice 69.85 6.80 3.85 10.65 6.82 1.40 11.28 100.00Corn 62.85 6.65 6.04 12.69 7.65 2.34 14.47 100.00Sugar 48.53 16.53 0.00 16.53 26.27 0.00 8.67 100.00Other crops 55.66 9.82 4.01 13.83 11.87 2.89 15.74 100.00Coconut 66.20 5.99 3.07 9.06 7.81 2.89 14.04 100.00Fruit 33.77 47.98 0.00 47.98 0 00 0.00 18.25 100.00Livestock 19.93 12.37 0.00 12.37 0.00 0.00 67.70 100.00Poultry 35.40 0.00 0.00 0.00 0.00 17.19 47.41 100.00NEC 72.61 4.79 0.00 4.79 7.23 0.00 15.38 100.00
Total 65.15 7.18 4.27 11.45 7.74 2.06 13.61 100.00- _ - - - _
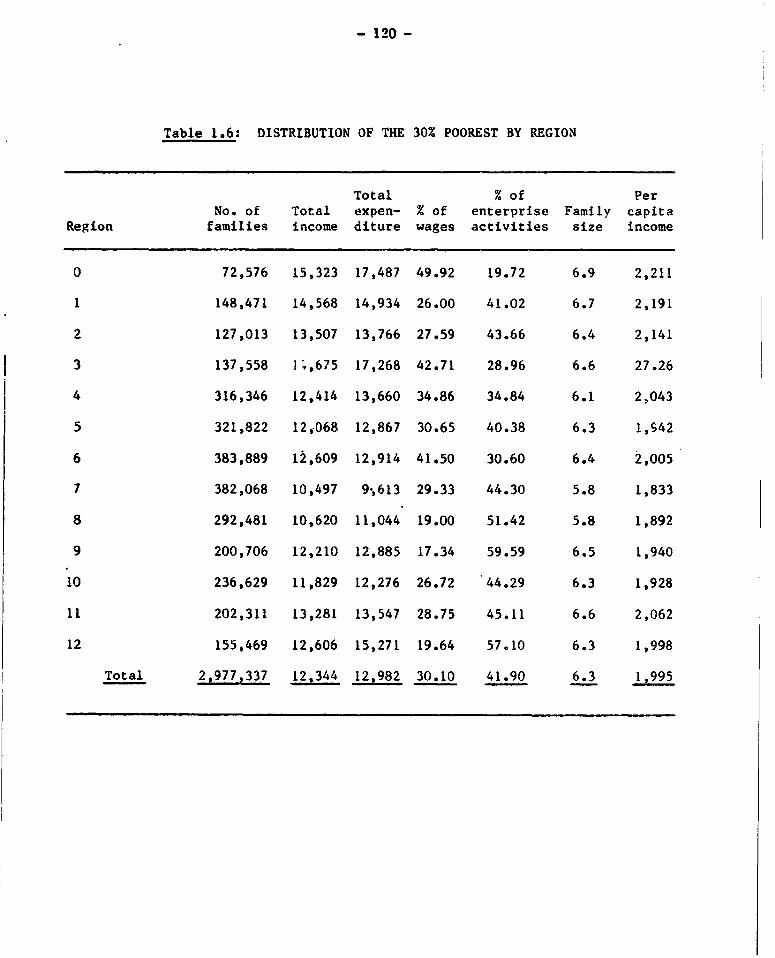
- 120 -
Table 1.6: DISTRIBUTION OF THE 30% POOREST BY REGION
Total % of PerNo. of Total expen- % of enterprise Family capita
Region families income diture wages activities size income
0 72,576 15,323 17,487 49.92 19.72 6.9 2,211
1 148,471 14,568 14,934 26.00 41.02 6.7 2,191
2 127,013 13,507 13,766 27.59 43.66 6.4 2,141
3 137,558 ];,675 17,268 42.71 28.96 6.6 27.26
4 316,346 12,414 13,660 34.86 34.84 6.1 2,043
5 321,822 12,068 12,867 30.65 40.38 6.3 1,S42
6 383,889 12,609 12,914 41.50 30.60 6.4 2,005
7 382,068 10,497 9;613 29.33 44.30 5.8 1,833
8 292,481 10,620 11,044 19.00 51.42 5.8 1,892
9 200,706 12,210 12,885 17.34 59.59 6.5 1,940
10 236,629 11,829 12,276 26.72 44.29 6.3 1,928
11 202,311 13,281 13,547 28.75 45.11 6.6 2,062
12 155,469 12,606 15,271 19.64 57.10 6.3 1,998
Total 2,977,337 12,344 12,982 30.10 41.90 6.3 1,995

- 121 -
Tablel.7: POOR FAMILIES WITH WAGES AS THE MAJOR SOURCE OF INCOMEBY HEAD OCCUPATION
NonagricultureAgriculture wages Total
Professional, administrativeand clerical workers 2,783 21,956 24,739
Sales workers 5,086 22,838 27,924
Parmers 103,770 61,734 165,504
Farm managers 8,425 1,929 10,354
Service workers 2,500 54,672 57,172
Agricultural workers 228,685 17,239 245,924
Forestry workers 7,363 2,620 9,983
Fishermen, hunters 62,605 8,561 71,166
Production workers 5,500 92,043 97,543
Miners 0 9,178 9,178
Transport workers 8,413 85,054 93,467
Construction workers 8,814 83,337 92,151
Laborers not classified 3,765 29,133 32,898
Not elsewhere classified 25,337 45,401 70,738
Total 473,045 535,694 1,008,739

- 122 -
Table 1.8: INCOME DISTRIBUTION, 1961-85(M)
Share of total incomeDeciles Total Urban Rural Total Urban Rural Total Urban Rural
- 1961/a -- - 1971/a -- --- 1985/b ----
I 2.1 1.7 2.6 1.7 1.6 1.7 2.3 2.1 2.6
II 2.6 1.6 3.3 2.3 2.6 2.6 3.4 3.3 4.0
III 3.3 3.3 4.4 3.4 3.9 3.9 4.2 4.3 5.0
IV 4.2 4.2 5.3 4.4 5.0 4.8 5.2 5.2 6.0
V 5.2 5.3 6.5 5.6 6.2 6.1 6.1 6.3 7.0
'VT 6.6 6.8 7.8 7.0 7.6 7.6 7.3 'P.6 8.2
VII 8.3 8.6 9.7 9.1 9.5 9.5 9.0 9.2 9.7
VIII 11.2 11.3 12.3 12.0 12.1 12.3 11.4 11.6 11.9
IX 16.0 16.1 16.6 17.2 16.6 17.0 15.5 15.7 15.5
x 40.5 40.8 31.5 37.3 34.6 34.5 35.6 34.8 30.2
Gini coefficient 0.51 0.52 0.42 0.49 0.46 0.46 0.43 0.43 0.37
/a UN (1981).
/b Staff calculations.

- 123 -
Table 1.9: AVERAGE REAL FAMILY INCOME IN PESOS, 1961-85(1978 - 100)
1961 1971 1985Deciles Total Urban Rural Total Urban Rural Total Urban Rural
1 1,565 2,086 1,292 1,596 2,358 1,204 2,020 2,837 1,626
II 1,938 1,963 1,640 2,159 3,832 1,841 2,970 4,296 2,496
III t!2,459 4,049 2,187 3,192 5,748 2,761 3,733 5,470 3,086
IV 3,130 5,154 2,634 4,131 7,369 3,398 4,553 6,719 3,714
V 3,875 6,503 3,230 5,257 9,137 4,318 5,537 8,179 4,337
VI 4,918 8,344 3,876 6,571 11,201 5,380 6,465 9,927 5,057
VII 6,185 10,552 4,820 8,543 14,001 6,726 7,933 11,984 6,035
VIII 8,346 13,865 6,112 11,265 17,833 8,708 10,032 15,064 7,371
IX 11,923 19,755 8,249 16,147 24,465 12,035 13,590 20,786 9,576
X 30,181 50,063 15,654 35,016 50,992 24,424 30,784 45,313 18,823
Average 7,454 12.273 4,971 9,387 14,741 7,080 8,806 13,081 6,204

- 124 -
Tablel.10: AVERAGE REAL INCOME INDEX(1961 = 100)
Total Urban RuralDeciles 1961 1971 1985 1961 1971 1985 1961 1971 1985
I 100.00 101.98 129.08 100.00 113.04 136.00 100.00 93.15 125.85
II 100.00 111.44 153.29 100.00 195.18 218.82 100.00 112.24 152.20
III 100.00 129.79 151.80 100.00 141.95 135.09 100.00 126.27 141.14
IV 100.00 131.97 145.47 100.00 142.99 130.38 100.00 129.02 141.01
V 100.00 135.67 t42.89 100.00 140.50 125.77 100.00 133.69 134.27
VI 100.00 133.61 131.45 100.00 134.24 118.97 100.00 138.81 130.46
VII 100.00 138.12 128.26 100.00 132.68 113.57 100.00 39.52 125.20
VIII 100.00 134.97 120.20 100.00 128.61 108.64 100.00 142.46 120.59
IX 100.00 135.42 113.,98 100.00 123.84 -105.22 100.00 145.89 116.08
X 100.00 116.02 102.00 100.00 101.86 90.51 100.00 156.03 120.25
Average 100.00 125.93 118.14 100.00 120.11 106.58 100.00 142.43 124.80
Source: Staff calculations.

- 125 -
Tablel.11: COMPARISONS OF INCOME DISTRIBUTION ANDPOVERTY INCIDENCE IN SOME EAST ASIAN COUNTRIES
% Share % ShareYear of X of population Gini of lowest of highestsurvey in poverty coefficient quintile quintile
Phllippines 1971 45.3 0.49 4 54.5
Philippines 1985 51.7 0.43 5.7 51.1
Malaysia 1970 40.2 0.51 3.5 55.0
Malaysia 1984 28.0 0.48 4.2 53.2
Thailand 1981 31.0 0.47 - -
Korea 1982 7.7 0.36 18.8/a 43.0
Taiwan 1972 - 0.28 -
/a Lowest 40%.
Sources: For Philippines and Thailand: staff calculations. For Taiwan:Fei, Ranis, Kuo: "Growth with Equity: The Taiwan Case." ForMalaysia: Anand, "Prequality and Poverty in Malaysia." For Korea:Sang-Mok Suh: "Economic Growth and Change in Income Distribution."Working Paper.

- 126 -
Tablel.12: REVISED INCOME DISTRIBUTION, 1985
Income Mean No. of x of(P'OOO) income families families
A. Overall Income Distrubtion
I 6,996,560 7,122 982,387 9.98II 10,405,593 10,471 993,754 10.09III 12,903,247 13,164 980,192 9.95IV 15,859,129 16,054 987,862 10.03V 18,494,432 18,899 978,593 9.94VI 22,451,924 22,795 984,950 10.00VII 27,652,063 27,970 988,633 10.04VIII 34,796,304 35,372 983,725 9.99TX 47,248,376 47,921 985,964 10.01
X 108,966,642 108,546 1,003,875 10.20
Total 305,775,274 31.054 9,846,566 100.00
B. Urban Sector
I 3,650,299 10,003 364,920 9.79II 5,670,977 15,147 374,396 10.05III 7,301,235 19,288 378,538 10.16IV 8,940,930 23,692 377,382 10.13V 10,783,446 28,839 373,919 10.04VI 13,051,284 35,001 372,883 10.01VII 15,746,556 42,256 372,647 10.00VIlI 19,881,364 53,115 374,308 10.05IX 27,039,250 73,293 368,920 9.90X 59,804,330 159,773 374,308 10.05
Total 171,869,676 46,127 3,726,010 100.00
C. Rural Sector
I 3,505,662 5,732 611,595 9.99II 5,394,316 8,802 612,851 10.01III 6,667,567 10,881 612,772 10.01IV 8,021,019 13,097 612,432 10.01V 9,382,444 15,291 613,593 10.02VI 10,912,515 17,832 611,962 10.00VII 13,036,930 21,281 612,609 10.01VIII 15,889,305 25,989 611,386 9.99IX 20,708,190 33,764 613,322 10.02x 40,387,643 66,370 608,523 9.94
Total 133,905,597 21,876 6,121,119 100.00
Source: FIES Tapes 1985, Staff Estimates

- 127 -
Table 2.1: LABOR FORCE STATISTICS(00Os and percentages)
1970-79/c 1980 1981 1982 1983 1984 1985 1986
Wor-king Age
Population 29,155 30,079 30,978 31,908 32,920 33,887 34,853Urban 9,646 9,956 10,265 10,581 13,043 13,438 13,841Rural 19,509 20,122 20,713 21,327 19,877 20,499 21,011
Labor Force 18,010 18,818 19,698 20,369 20,833 21,643 22.364Urban 5,392 5,710 5,947 5,995 7,614 7,993 8,209Rural 12,618 13,107 13,751 14,375 13,218 13,650 14,1555 X) (3.6) (3.4) (4.3) (4.7) (3.4) (2.3) (3.9) (3.3)
Employed 17,154 17,810 18,614 19,366 19.368 20.327 20.926Urban 4,968 5,177 5,396 5,457 6,762 7.148 7,305Rural 12,186 12,632 13,218 13,909 12,605 1. 179 13,621
UnemploymentRate 4.6 4.7 5.4 5.5 4.9 7.0 6.1 6.4Urban 7.9 9.3 9.3 9.0 11.2 10.6 11.0Rural 3.4 3.6 3.9 3.2 4.6 3.5 3.8
Underem2loymentA: la 13.9 21.4 22.8 27.6 30.3 24.3 17.5 24.4Urban Ti2.5 18.4 28 .1 27.7 T9.5 12.7 T1FTRural 21.3 24.8 27.5 31.4 27.1 20.4 27.6
B: /b 7.3 13.0 14.5 16.5 19.3 17.6 12.4 16.5Ur-t'n 8.4 8.4 12.1 13.5 11.9 8.3 10.9Rur. . 14.9 15.6 18.4 21.7 20.8 14.8 19.8
/a Those who worked during the reference quarter, but still wanted to work addi-tional time, expressed as a proportion of the labor force.
/b Those who worked less than 65 days in the quarter, but still wanted to work addi-tional time, expressed as a proportion of the labor force.
/c Average value for the 1970s ENEDA (1986)].
Source: NCSO: Integrated Survey of Households (ISH).

- 128 -
Table 2.2: LABOR FORCE PARTICIPATION BY SPECIFIC GROUPS(percentages) /a
1976-79/b 1980 1981 1982 1983 1984 1985 1986 1980-86/c
Total 60.7 61.8 62.6 63.6 63.8 63.3 63.9 64.2 63.3
Urban 56.0 55.9 57.4 57.9 56.7 58.4 59.5 59.3 57.9
Rural 62.3 64.7 65.1 66.4 67.4 66.5 66.8 67.4 66.3
Male 80.7 78.9 79.9 78.9 78.9 80.3 80.2 80.0 79.6
Urb.n 68.1 70.1 69.0 68.3 71.7 72.7 71.8
Rural 83.7 84.3 83.5 83.7 85.6 85.3 83.6
Female 40.6 44.8 45.5 48.4 49.2 46.9 47.9 48.4 47.3
Urban 44.2 45.9 48.1 46.5 46.2 47.9 47.6
Rural 45.1 45.3 48.6 50.7 47.4 48.0 49.0
Youth /d 38.9 40.3 40.4 41.0 41.8 38.6 40.7 40.5 40.5
Urban 26.4 28.5 28.0 29.1 28.6 30.8 30.6
Rural 47.6 46.7 47.7 48.3 45.6 47.4 48.1
/a Figures are expressed as a proportion of the respective population group.
/b Average for the period (NEDA, (1986)1. In the case of the categories ofmale, female and youth they correspond to the average for 1976-78, giventhat the information for 1979 has not been processed by NCSO. The urbancategory in 1976-79 was measured through NCR, while the rural one by theaverage of the remaining 12 regions of the country.
/c Average for the period.
/d Total labor force 19 years and younger as a proportion of the respectivepopulation group.
Source: NCSO (ISH).

- 129 -
Table 2.3: GEOGRAPHICAL DISTRIBUTION OF THE LABOR FORCE /a(OOOs and percentages)
1976-79/b 1980 1981 1982 1983 1984 1985 1986
Total Labor Force 18,010 18,818 19,698 20,369 20,833 21,643 22,364
NCR 2,069 2,228 2,297 2,197 2,503 2,713 2,737
Rest 15,941 16,590 17,401 18,172 18,330 18,930 19,627
U rate NCR 8.6 10.0 14.6 13.0 11.8 16.8 18.7 18.6
Rest 3.2 4.1 4.1 4.5 4.1 5.7 4.3 4.7
Female PR NCR 42.6 44.3 46.1 41.9 45.1 48.8 46.7
Rest 45.1 45.7 48.8 50.4 47.2 47h.8 48.7
Female U NCR 11.1 18.3 15.8 11.2 15.5 17.1 16.8
Rest 6.9 7.0 7.5 6.2 9.2 6.6 7.6
Employment NCR 1,863 1,902 1,999 1,937 2,081 2,207 2,228
Rest 15,291 15,908 16,615 17,429 17,287 18,120 18,698
/a NCR - National Capital Region; U - Unemployment; PR - Participatira Rates
/b Average for 1976-79 [ENEDA (1986)1.
Source: NCSO (ISH).

- 130 -
Table 2.4 : EMPLOYMENT BY INDUSTRIES(000.)
1980 1981 1982 1983 1984 1985 1986
Wage and Salary 7,720 7,387 7.484 7,799 8,702 9,113 8.958
Agriculture 1,474 1,400 1,480 1,559 2,149 2,255 a,102Mining 81 77 64 72 108 85 103Manufacturing 1,249 1,189 1,228 1,169 1,240 1,303 1,267Electricity,gas and water 52 61 59 66 65 77 60
Construction 587 570 598 617 682 646 615Trade /a 390 410 433 411 506 591 641Transportation /b 599 596 573 701 717 705 645Financing /c 310 320 295 287 341 322 315Services /d 2,546 2,765 2,753 2,897 2,891 3,128 3,210
Own Account 6,325 6,733 6.974 7,467 7.590 7.864. 8.235
Agriculture 4,405 4,668 4,735 5,105 4,957 5,029 5,154Mining 36 12 10 40 22 32 45Manufacturing 425 445 490 473 487 493 530Electricity,
gaS and water 2 1 1 - 5 2 3Construction 13 12 16 13 32 30 58Trade 1,118 1,225 1,284 1,375 1,619 1,717 1,826Transportation 120 119 155 183 160 201 207Financing 19 27 25 26 28 27 39Services 188 224 257 252 279 333 376
Unpaid FamilyWorkers 3,559 3,689 4,158 4,100 3,075 3,351 3,732
/a Includes wholesale and retail trade.
/b Includes transportation, storage and communications.
/c Includes financing, insurance, real estate and business services.
/d Includes community, social and personal services.
Source: NCSO (ISH).

- 131 -
Table 2.5 : UNEMPLOYMENT RATES BY SELECTED LABOR FORCE GROUPS
1970-78/a 1980 1981 1982 1983 1984 1985 1986
Female 8.2 7.5 8.5 9.6 6.8 10.0 8.2 8.9
Urban 8.9 11.2 11.5 9.4 11.8 10.8 11.4
Rural 6.7 7.1 7.0 5.6 8.8 6.3 7.2
Less than 19 Years Old 8.0 7.9 9.8 9.0 8.4 11.5 9.6 9.4
Urban 17.8 20.5 17.4 17.8 20.9 19.3 19.3
Rural 5.1 6.3 6.4 3.2 7.3 5.4 5.5
Less than 24 Years Old 7.8 7.5 10.9 10.4 9.9 13.5 12.1 12.9
Urban 17.8 20.8 19.0 18.6 21.5 21.3 22.7
Rural 6.1 6.7 6.7 6.3 8.9 6.7 7.4
/a Average for 1970-78 [NEDA (1986)1.
Source: NCSO (ISE).

- 132 -
Table 2.6 : UNEMPLOYMENT OF HOUSEHOLD HEADS(percentage of total unemployment)
1984 1985 1986
Total 12.3 11.7 10.3
Urban /a 13.4 13.1 12.1
Rural /a 10.9 9.1 7.3
> 25 years old lb 13.0 12.8 11.8
Totally Unemployed /c
Urban 14.7 14.3 12.4
Rural 10.4 15.1 14.8
/a Expressed as a proportion of total urban (or rural) unemployment.
/b Urban household heads as a proportion of total urban unemployment.
/c Those reporting "working" as their main activity during the year, asopposed to "housekeeper", "student" or "others", expressed as a proportionof total urban (rural) unemployment.

- 133 -
Table 2.7 : UNEMPLOYMENT BY SCHOOLING LEVELS AND AGE(percentage of total unemployment)
1980 1981 1982 1983 1984 1985 1986
Schooling Level
0 3.4 2.6 1.8 1.5 1.4 1.3 nta.
Elementary 27.9 29.5 26.1 26.6 26.7 26.5 n.a.
High school 38.1 35.3 38.5 35.9 35.8 36.0 n.a.
College 30.1 32.6 33.5 35.8 36.1 37.1 n.a.
Less than 19 23.2 25.0 22.8 23.9 20O1 20.. 18.6
Less than 24 53.4 55.5 52.7 55.3 51.4 52.7 53.2
Source: NCSO (ISH).
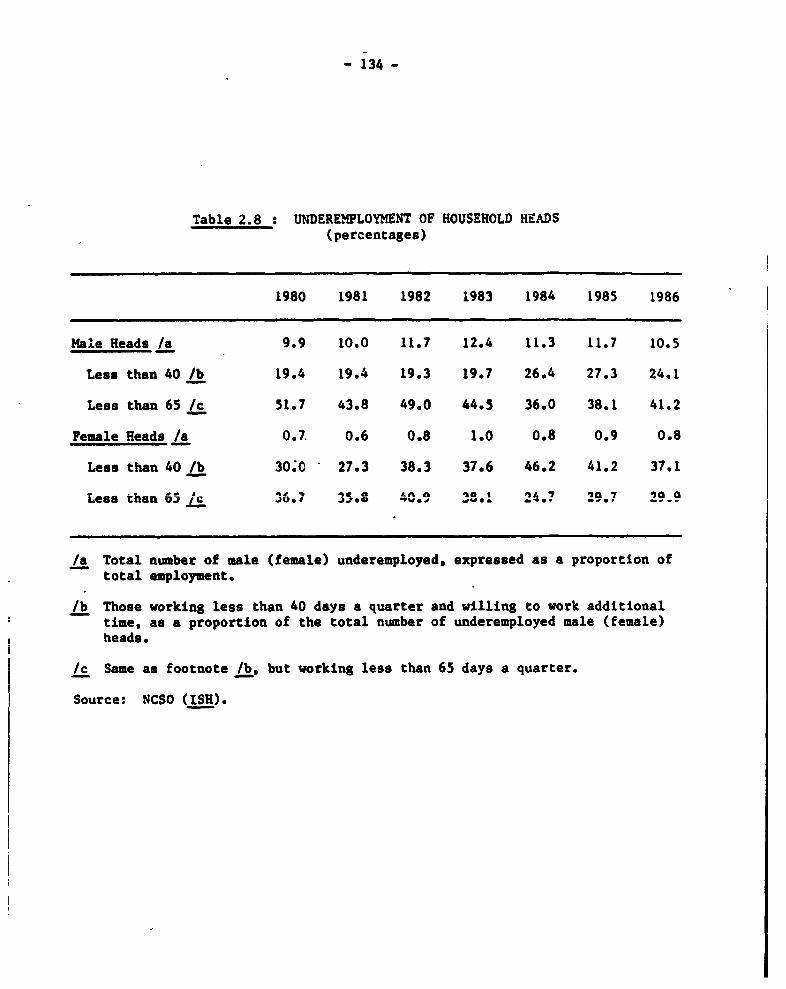
- 134 -
Table 2.8 : UNDEREMPLOYMENT OF HOUSEHOLD HEADS(percentages)
1980 1981 1982 1983 1984 1985 1986
Male Heads /a 9.9 10.0 11.7 12.4 11.3 11.7 10.5
Less than 40 /b 19.4 19.4 19.3 19.7 26.4 27.3 24.1
Less than 65 /c 51.7 43.8 49.0 44.3 36.0 38.1 41.2
Female Heads /a 0.7. 0.6 0.8 1.0 0.8 0.9 0.8
Less than 40 /b 30;0 27.3 38.3 37.6 46.2 41.2 37.1
Less than 6; Ic 36.7 35. C.^ 3°. 2A.? q2n 291 a
/a Total number of male (female) underemployed, expressed as a proportion oftotal employment.
lb Those working less than 40 days a quarter and willing to work additionaltime, as a proportion of the total number of underemployed male (female)heads.
i /c Same as footnote lb, but working less than 65 days a quarter.
Source: NCSO (ISH).
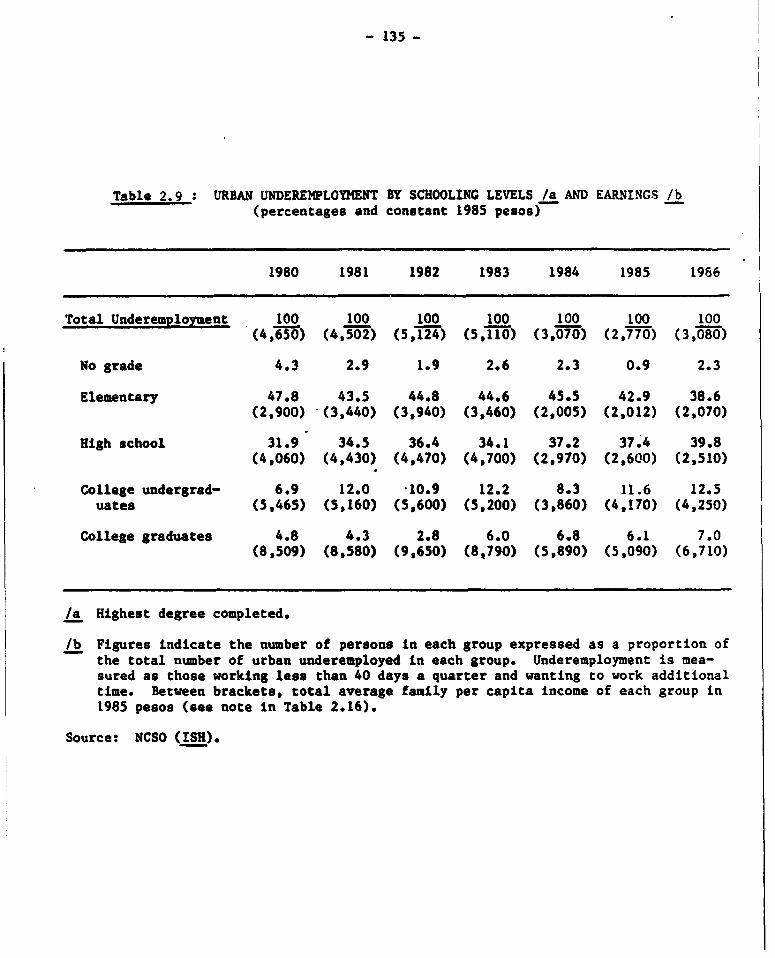
- 135 -
Table 2.9 : URBAN UNDEREMPLOYMENT BY SCHOOLING LEVELS /a AND EARNINGS /b(percentages and constant 1985 pesos)r
1980 1981 1982 1983 1984 1985 1986
Total Underemployment 100 100 100 100 100 100 100(4,650) (4,502) (5,T24) (5,110) (3,070) (2,770) (3,080)
No grade 4.3 2.9 1.9 2.6 2.3 0.9 2.3
Elementary 47.8 43.5 44.8 44.6 45.5 42.9 38.6(2,900) (3,440) (3,940) (3,460) (2,005) (2,012) (2,070)
High school 31.9 34.5 36.4 34.1 37.2 37.4 39.8(4,060) (4,430) (4,470) (4,700) (2,970) (2,6010) (2,510)
College undergrad- 6.9 12.0 10.9 12.2 8.3 11.6 12.5uates (5,465) (5,160) (5,600) (5,200) (3,860) (4,170) (4,250)
College graduates 4.8 4.3 2.8 6.0 6.8 6.1 7.0(8,509) (8,580) (9,650) (8,790) (5,890) (5,090) (6,710)
/a Highest degree completed.
/b Figures indicate the number of persons in each group expressed as a proportion ofthe total number of urban underemployed in each group. Underemployment is mea-sured as those working less than 40 days a quarter and wanting to work additionaltime. Between brackets, total average family per capita income of each group in1985 pesos (see note in Table 2.16).
Source: NCSO (ISH).

- 136 -
Table 2.10s AVERAGE INCOME UNDEREMPLOYED HOUSEHOLD HEADS(constant 1985 pesos)
1980 1981 1982 1983 1984 1985 1986
Total employed 3,513 3,908 3,933 3,974 3,642 3,354 3,256(4,700) (5,200) (5,250) (5,300) (4,850) (4,450) (4,350)
All underemployed 2,772 2,568 2,850 3,019 2,515 1,966 2,056(3,700) (3,400) (3,800) (4,000) (3,350) (2,600) (2,750)
Heads working <40 1,188 1,492 2,066 2,397 1,881 1,699 1,655(1,580) (2,000) (2,750) (3,200) (2,500) (2,250) (2,200)
Rousehold heads 3,671 3,685 4,226 4,703 3,569 3,115 3,074(4,900) (4,900) (5,650) (6,300) (4,750) (4,150) (4,100)
All underemployedworking >65 4,288 4,170 4,316 4,687 4,197 3,240 3,215
(5,700) (5,550) (5,700) (6,250) (5,600) (4,300) (4,300)
Heads working >65 5,300 5,106 5,552 6,051 5,050 4,1E9. 4,021(7,050) (6,800) (7,400) (8,050) (6,750) (5,550) (5,350)
Male heads 3,739 3,728 4,304 4,757 3,657 3,217 3,154(5,000) (4,950) (5,750) (6,350) (4,900) (4,300) (4,200)
Female heads 2,714 2,987 3,113 3,998 2,396 1,904 2,020(3,600) (4,000) (4,150) (5,350) (3,200) (2,550) (2,700)
Notes: (1) Figures between brackets correspond to yearly per capita familyincome, calculated by assuming two wage earners per family group, sixmembers per family and the same income for both wage earners in thefamily and In the four quarters of the year. Figures are for thecountry as a whole.
(2) Heads working <40: Household heads that worked less than 40 days inthe quarter of reference, and that reported their willingness to workadditional time.
(3) Heads working >65: Household heads that worked 65 or more days inthe quarter of reference, and that reported their willingness to workadditional time.
(4) All underemployed working >65: All employed reporting their willing-ness to work additional time.

- 137 -
Table 2.11 : REAL WAGE INDEXES(1972 - 100)
(1) (2) (3)CEBA CEBA BAECON
Skilled workers Unskilled workers Agricultural workers
1960 133.4 107.9 1441961 131.2 108.8 1371962 125.5 105.9 1411963 122.3 105.6 1261964 115.1 98.6 1171965 115.2 102.7 1271966 114.9- 104.8 1331967 113.1 103.2 1301968 119.4 112.1 1161969 123.3 115.2 1131970 114.4 111.6 1021971 105.1 104.1 1001972 100.0 100.0 1001973 92.4 90.0 891974 75.6 72.8 941975 72.7 72.9 1071976 71.2 72.3 1171977 72.9 70.4 1241978 76.1 68.4 1181979 70.8 60.6 1071980 63.7 60.7 921981 68.4 65.4 901982 76.8 71.3 971983 87.1 72.6 1041984 69.5 75.1 891985 66.6 67.1 891986 60.3 67.2 98
Sources: (1) & (2). Central Bank (1960-1980); staff estimates based on simi-lar categories of household surveys (1981-1982) and in unpublisheddata from Mole (1983); unpublished wage series, Research Department,Mole (1984-1986). The deflator used was the CPI.
(3) Lal (1983) (1960-70), and staff estimates with data provided bythe Bureau of Agricultural Economics, Ministry of Agriculture andFood. This series is the sample average of daily wage rates (with-out meals) of palay, corn, coconut and sugarcane farm workers. Thedeflator used was the CPI for areas outside Metro Manila.
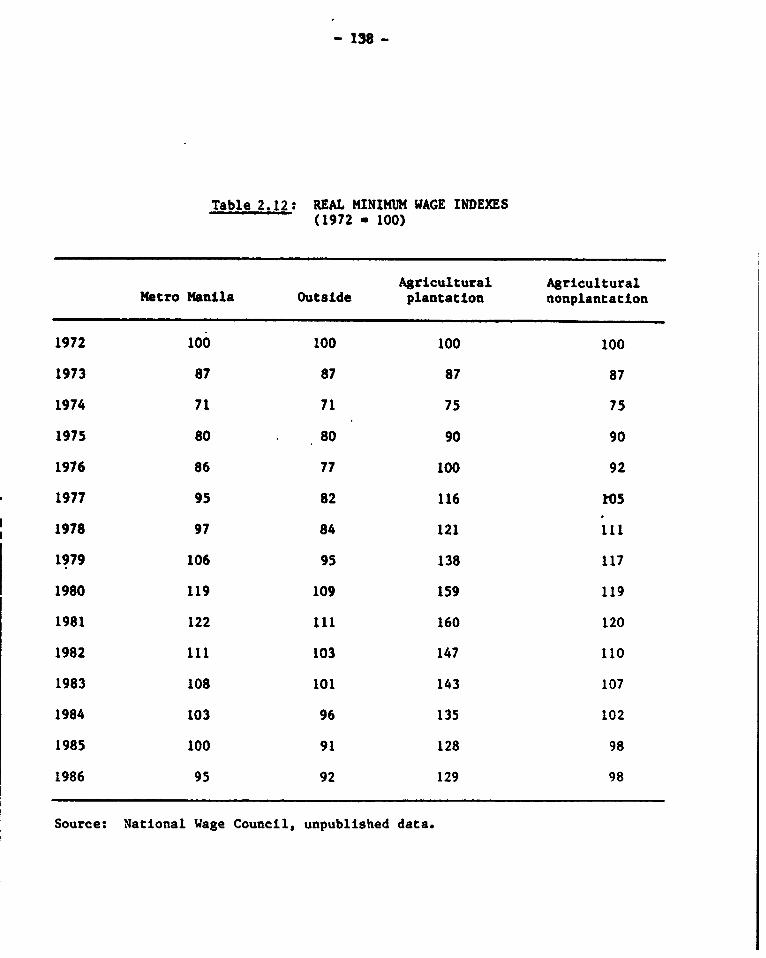
- 138 -
Table 2.12: REAL MINIMUM WAGE INDEXES(1972 * 100)
Agricultural AgriculturalMetro Manila Outside plantation nonplantation
1972 100 100 100 100
1973 87 87 87 87
1974 71 71 75 75
1975 80 80 90 90
1976 86 77 100 92
1977 95 82 116 kO5
1978 97 84 121 ill
1979 106 95 138 117
1980 119 109 159 119
1981 122 111 160 120
1982 111 103 147 110
1983 108 101 143 107
1984 103 96 135 102
1985 100 91 128 98
1986 95 92 129 98
Source: National Wage Council, unpublished data.

- 139 -
Table 2,13: REAL AVERAGE EARNINGS BY INDUSTRIES(Philippines 1980 - 100)
1980 1981 1982 1983 1984 1985 1986
Philippines 100 112 119 113 104 95 93
Urban 145 168 170 167 138 127 128
Rural 77 83 83 87 83 76 70
Agriculture 71 72 74 82 77 74 65
Manufacturing 120 138 145 137 91 113 99
Constructi=n 119 115 1*;08 i28 i20 99 90
Trade 112 139 142 136 130 117 101
Transportation 137 152 140 149 118 117 122
Financing 232 223 276 234 241 184 199
Services 112 135 129 127 113 99 117
Source: NCSO (ISH).
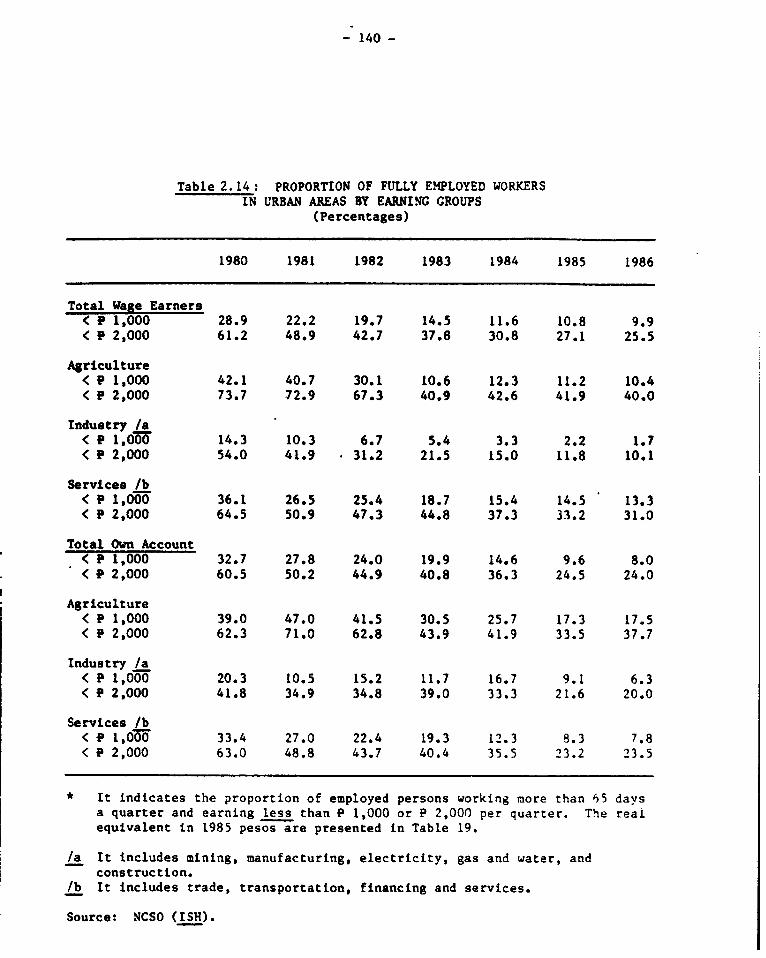
- 140 -
Table 2.14: PROPORTION OF FULLY EMPLOYED WORKERSIN URBAN AREAS BY EARNING GROUPS
(Percentages)
1980 1981 1982 1983 1984 1985 1986
Total Wage Earners< P 1,000 28.9 22.2 19.7 14.5 11.6 10.8 9.9< P 2,000 61.2 48.9 42.7 37.8 30.8 27.1 25.5
Agriculture< P 1,000 42.1 40.7 30.1 10.6 12.3 11.2 10.4< P 2,000 73.7 72.9 67.3 40.9 42.6 41.9 40.0
Industry /a< P 1,000 14.3 10.3 6.7 5.4 3.3 2.2 1.7< P 2,000 54.0 41.9 * 31.2 21.5 15.0 11.8 10.1
Services /b< P 1,000 36.1 26.5 25.4 18.7 15.4 14.5 13.3< P 2,000 64.5 50.9 47.3 44.8 37.3 33.2 31.0
Total Own Account< P 1,000 32.7 27.8 24.0 19.9 14.6 9.6 8.0< P 2,000 60.5 50.2 44.9 40.8 36.3 24.5 24.0
Agriculture< P 1,000 39.0 47.0 41.5 30.5 25.7 17.3 17.5< P 2,000 62.3 71.0 62.8 43.9 41.9 33.5 37.7
Industry /a< P 1,000 20.3 10.5 15.2 11.7 16.7 9.1 6.3< P 2,000 41.8 34.9 34.8 39.0 33.3 21.6 20.0
Services /b< P 1,000 33.4 27.0 22.4 19.3 12.3 8.3 7.8< P 2,000 63.0 48.8 43.7 40.4 35.5 23.2 23.5
* It indicates the proportion of employed persons working more than 65 davsa quarter and earning less than P 1,000 or P 2,000 per quarter. The realequivalent in 1985 pesos are presented in Table 19.
/a It includes mining, manufacturing, electricity, gas and water, andconstruction.
/b It includes trade, transportation, financing and services.
Source: NCSO (ISH).

- 141 -
Table 2.15: DISTRIBUTION OF FULLY EMPLOYED WORKERSIN RURAL AREAS BY EARNINGS
(Percentages)
1980 1981 1982 1983 1984 1985 1986
Total Wage Earner< P 1,000 42.4 33.8 33.8 24.7 16.9 14.1 12.8> P 2,000 79.3 69.6 66.8 58.3 45.8 42.6 42.0
Agriculture< P 1,000 57.7 51.4 45.6 32.3 21.0 12.6 11.8< P 2,000 85.7 84.1 77.8 71.0 58.8 52.8 51.7
Industry< P 1,000 30.5 22.7 17.5 16.4 4.7 7.0 8.2% r 2,00u iJ.Y io.li 5o.3 47.4 26Q. 2 .7 ^v
Services< P 1,000 42.0 33.0 26.5 26.2 21.4 19.1 16.0< P 2,000 78.1 66.4 55.7 59.2 48.1 42.5 43.9
-Total Own Account< P 1,000 57.4 52.0 45.9 43.0 27.8 20.8 21.1< P 2,000 80.3 74.1 69.4 64.7 51.4 38.1 43.3
Agriculture< P 1,000 57.2 53.5 47.3 47.1 27.4 20.0 21.2< P 2,000 79.8 74.7 70.6 67.1 49.0 34.8 40.0
Industry< P 1,000 56.6 52.3 50.8 41.8 37.2 32.0 25.0< P 2,000 72.1 69.4 71.9 64.5 57.4 57.3 42.9
Services
< f 1,000 58.1 49.1 42.0 36.6 26.8 20.3 20.1< P 2,000 83.9 74.1 66.7 61.0 54.4 49.6 48.7
See notes in Table 2.20.
Source: NCSO (ISH).

- 142 -
Table 2.16: GOVERNMENT EMPLOYMENT BY BRANCH(0008)
Central LocalTotal government Corporation government Education /a
1976 641.8 221.6 63.9 96.1 260.1
1977 992.8 369.8 80.9 181.3 360.8
1978 1,028.7 445.7 93.7 170.5 318.7
1979 1,064.6 521.7 106.5 159.7 276.8
1980 1,097.5 519.1 111.6 144.7 322.0
1981 1,154.5 542.6 115.5 173.2 13L.2
1982 1,180.0 554.6 118.0 177.0 33b.4
1983 1,205.4 570.0 122.1 186.1 327.3
1984 1,310.8 627.1 134.5 189.9 359.8
1985 1,321.7 634.4 132.2 191.3 356.8
1986 1,364.9 655.2 136.5 204.7 368.5
/a It includes schools, state colleges and universities.
Source: Ministry of Budget.

- 143 -
Table 2.17: STRUCTURE OF PUBLIC EMPLOYMENT ACROSS MINISTRIES(percentages)
Production Social GovernmentTotal related /a development Jb Defense Education services /c
1982 100 13.0 8.0 28.8 39.8 10.4
1983 100 12.8 8.2 28.3 40.1 10.6
1984 100 13.3 8.4 25.3 41.9 11.1
1985 100 13.2 8.1 25.3 41.9 11.5
1986 100 13.4 8.0 24.6 42.3 11.7
/a It includes Ministries of Agrarian Reform, Agriculture and Food, NaturalResources, Tourism, Trade and Industry, Science and Technology, Energy,Public Works and Highways, Transportation and Communication.
/b It includes Ministries of Labor and Employment, Health, Human Settlements,Social Services and Development.
/c It also includes Legislative, Judiciary and Constitutional Offices.
Source: Ministry of Budget.

- 144 -
Table 2.18: REAL AVERAGE SALARY IN THE PUBLIC SECTOR(in 1980 pesos)
Production Social Governmentrelated development Defense Education services
1982 13,351 10,187 3,920 11,692 19,168
1983 12,341 10,456 3,880 10,683 46,989/a
1984 7,107 7,498 (10,258)/b 8,035 11,460
1985 6,956 7,498 8,965 7,219 10,680
1986 5,184 6,037 3,178 6,841 8,094
/a The 1983 real salary in Government Services must be taken with caution:according to the original source, total compensation jumped more than tentimes in the Ministry of Finance between 1982 and 1983 (which seemedunacceptable) while employment practically stagnated.
/b With regard to the 1984 real salary in Defense, the original sources showthat total compensation jumped almost five times between 1983 and 1984, tonotably decline thereafter, while employment did not reveal major changes.
Source: MISSING.

- 145 -
Table 2.19: SHARE OF INCOME AND PERCENTAGE OF TAXES PAID BYEACH INCOME CLASS, 1985
Income Income Total Direct Indirect Individual Fuel andclass before tax taxes taxes taxes income tax oil taxes
I 0.56 0.48 0.38 0.53 0.16 0.26
II 3.01 2.54 1.85 2.86 0.38 1.52
III 7.26 6.35 4.80 7.07 1.70 4.16
IV 8.75 7.69 5.77 8.59 1.97 5.49
V 15.49 13.87 10.92 15.25 5.11 11.36
vi 12.23 11.42 9.68 12.25 6.42 10.85
VII 16.52 16.00 15.16 16.39 13.40 .16.01
VIII 15.44 16.36 17.86 15.68 20.93 19.27
IX 20.74 25.26 33.56 21.37 49.90 31.05
I-III 10.83 9.37 7.03 10.46 2.24 5.94
VII-IX 52.70 57.62 66.58 53.44 84.23 66.33

- 146 -
Table 3.1: STUDENTS BY TYPE OF SCHOOL AND INCOME DECILE (A 13-16)
Income decile1 2 3 4 5 6 7 8 9 10 Total
URBAN
Private
Row percent 2.68 5.02 4.25 6.62 7.70 10.96 7.35 12.59 18.38 24.45
Col. percent 13.21 26.84 18.92 27.03 29.68 34.44 28.30 42.32 52.90 70.83
Public
Row percent 10.45 8.11 10.79 10.59 10.81 12.37 11.04 10.17 9.70 5.97
Col. percent 86.79 73.16 81.08 72.97 70.32 65.56 71.70 57.68 4.10 29.17
Total No. ofObservations 69 63 76 83 88 107 88 100 117 116 90
RUR'AL
Private
Row percent 4.06 2.44 3.95 6.21 3.31 6.85 13.28 11.19 22.85 25.87
Col. percent 13.70 8.80 14.44 21.45 7.95 17.46 32.71 26.36 45.29 52.71
Public
Row percent 9.23 9.11 8.44 8.21 13.82 11.68 9.87 11.29 9.97 8.38
Col. percent 86.30 91.20 85.56 78.55 92.05 82.54 67.29 78.63 54.71 47.29
Total No. ofObservations 171 160 158 167 241 227 235 246 292 284 2.18
7.86 7.34 7.25 7.68 11.03 10.40 10.77 11.26 13.33 13.02 100.
Source: HSMS - special tabulations.

Table 3.2: NUMBER OF SCHOLARSHIPS AWARIDED ACCOMMODATED YEARLY BY PROGRAM
Work study Selected Teijin DesignState National grant program ethnic graoups limited Kabataang Pangulo Denterscholar- integration for Southern educational scholar- barangay scholar- PhilippinesSchool ship study grant Philippines assistance ship scholarship ship scholarshipyear program program (PHD No. 697) program program program program program Total
1969/70 174 -- 1741970/71 90 -- - - - - 901971/72 139 - - - - - - - 1391972/73 250 - - - - - 250197:: 74 215 4,000 - - - - - - 4,1251974/75 243 950 - - - - - - 1,1931975/76 257 1,308 - - 5 - - - 1,5701976/77 157 1,180 775 - 1 - - - 2,1131977/78 185 1,170 662 475 4 - - - 2,4961978/79 204 761 308 151 3 - - - 1,4271979/80 1,094 1,194 655 242 3 - - - 3,1881980/81 300 915 356 175 5 - - - 1,7511981/82 525 956 356 115 3 25 - - 1,9801982/83 188 879 34 78 2 25 150 6 1,3621983/84 377 781 - 211 3 - 71 1 1,4441984/85 488 683 1,065 96 - - 81 6 2,4191985/86 1,382 3,629 2,730 572 10 44 146 26 8,539
Total 6,268 18,406 6,941 2,115 39 94 448 39 34,350
Source: National Scholarship Center.

- 148 -
Table 3.3: NATIONAL GOVERNMENT EXPENDITURE ON EDUCATION(Indexes: 1976 - 100)
Elementary Secondary Tertiary /a Total
Enrollment /a
1976 100 100 100 100
1982 111 146 170 117
1986 116 187 231 126
Expenditures /b
1976 100 100 100 100
1982 132 135 209 134
1986 116 114 165 115
Per Student
1976 100 100 100 100
1982 119 92 123 114
1986 100 61 80 81
/a Public only.
/b 1976 prices, obligation basis.
Source: Enrollments: A. Felipe (1986b). Budget: World Bank (1987),Table 4.2.

- 149 -
Table 3.4: DISTRIBUTION OF PUBLIC RECURRENT EXPENDITUREBY PURPOSE, 1984
(%)
Percentage of public expendituresallocated to
Teachers Teachingenrollments materials Other
Philippines /a 77.7 1.2 21.1
Low-income countries 70.5 4.1 25.4
Lower-middle-income countries 75.7 2.3 22.0
Upper-middle-income countries 67.9 1.8 30.3
High-income countries 64.0 3.9 32.1
/a Belongs to lower-middle-income countries.
Source: Komenan (1987).

Table 3.5: EDUCATION EXPENDITURES BY CATEGORY(2)
1976 1977 1978 1979 1980 1981 1982 1983 1984 1985 1986
',eneral administra-tion 5.38 493 4.94 7.57 7.27 4.80 4.96 4.84 4.27 16.50 11.14
Primary 61.76 60.04 60.92 56.86 58.25 58.38 59.19 56.85 58.89 55.59 63.14
Secondary 10.25 9.96 10.27 9.56 9.64 9.52 9.89 9.41 9.78 10.48 11.35
Universities andcolleges 18.57 21.24 19.77 22.52 21.35 23.63 21.90 24.27 23.08 10.89 8.87
Others 4.04 3.83 4.10 3.49 3.49 3.67 4.06 4.63 3.98 6.54 5.51
Total 100.00 100.00 100.00 100.00 100.00 100.00 100.00 100.00 100.00 100.00 100.00
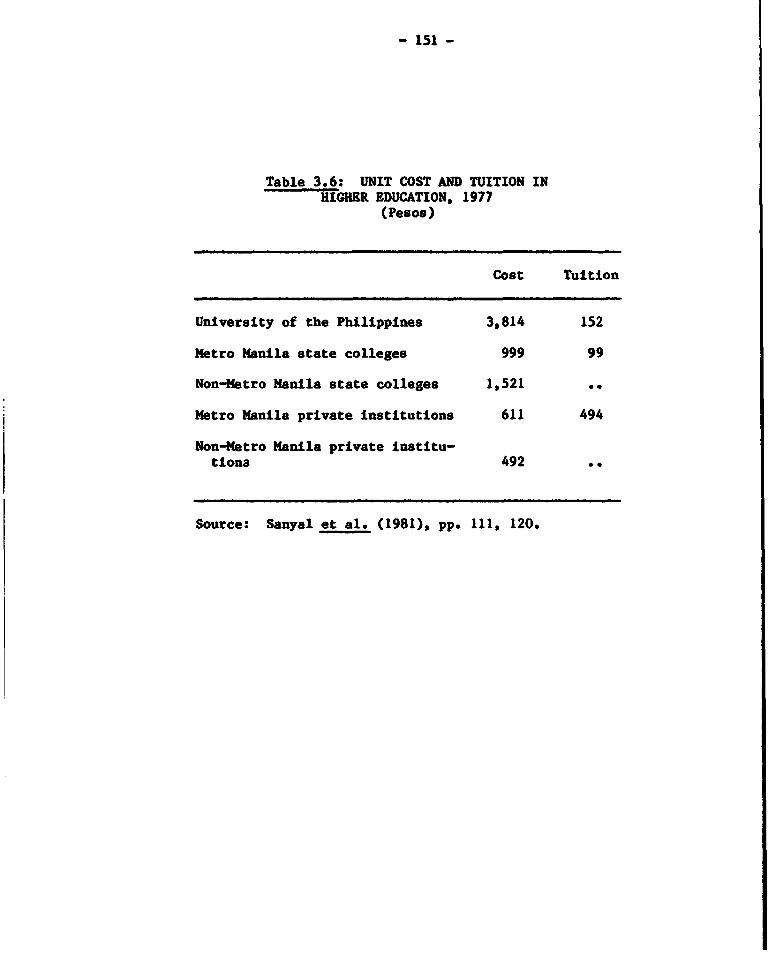
- 151 -
Table 3.6: UNIT COST AND TUITION INHIGHER EDUCATION, 1977
(Pesos)
Cost Tuition
University of the Philippines 3,814 152
Metro Manila state colleges 999 99
Non-Metro Manila state colleges 1,521 0.
Metro Manila private institutions 611 494
Non-Metro Manila private institu-tiona 492
Source: Sanyal et al. (1981), pp. 111, 120.

- 152 -
Section IV - THE INCOME DISTRIBUTION CONSEQUENCES OFMACROECONOMIC ADJUSTMENT
I. The Model
In order to evaluate the impact on income distribution ofmacroeconomic variables, a three-equation model is postulated here to serve asthe basis for the analysis of the covariance between income shares and anumber of indicators for which information is available on a comparablefrequency, including uaderemployment, exchange rates, inflation rates, andinterest rates. The three basic equations are the following:
p0 w8i x2i y3 i L, (1)
j. x'li 2ivi X0 0 e (2)
al t + a3 r + u4 n
where:
Si the share of income going to class i (in particular, wedistinguish between low (L) and high (H) income classes)
P = price indexw real wagesx a real exchange ratey = real incomep = productivity levelU = underemployment rateg real government spendingr = real interest rateT = rate of inflationt = time trend.
The earnings function measures, for each income group, theimportance of the different variables which are postulated here as maindeterminants of the overall level of personal income (Equation 1). Realearnings are determined (in different proportions measured by the ceefficients B)
by real wages, the level of overall economic activity, and the ..hanges inthe real exchange rate. Specifically, one would expect higher wages andgreater economic activity to have a positive effect onearnings (B ., 0 .> 0) while the influence of the real exchange rate couldaffect earnings 6i different groups in different manners according to thecomposition of their activities in terms of trade and nontradedgoods (B2' > 0) . Moreover, it would be expected that earnings of low-incomegroups wlil ge affected more by wages compared with the level of activity,since self-employed and capital income are probably a larger share of totalearnings in high-income groups.

- 153 -
The real wage.function, is a version of the Phillips curve Equa-tion 2. Therefore, we would expect a negative relationship between labormarket conditions, as measured by underemployment, and the level of realwages. The equation also includes a measure of overall labor productivity,which is ezpected to have a positive effect on real wages. The magnitude ofthe effects on w of p and U at the different income levels are measured bythe X. coefficient.
The extended version of the IS curve, relates overall real economicactivity to fiscal and monetary variables as represented by the level ofgovernment spending and by the real rate of interest Equation (3). Inaddition, it incorporates a time trend and the rate of inflation, whichprovide an additional variant of a short-term Phillips curve.
We need to obtain a reduced-form yersion for the model-which, inits present version, is a recursive model.' For that we take the naturallogarithm form of equations (1) - (3) and substitute equations (3) and (2)into equation (1). Then the ratio of the low-income group to the high-incomegroup is calculated.
The reduced form equation estimated here is the logarithm of theratio of the low to the high-income shares as a function of productivity,underemployment, government spending, the real exchange rate, the real rate ofinterest, and the rate of inflation, with a constant and a time trend. Thecoefficients are the following:
log (8 L/)H C + p1X log o + B A U + B2 log X
where: 3 a118g g + 3a2 i 0303r + 03*4
c l 0 + Q AO= + 03 a ° OL aOH
01I 1LX-IL IHXiH01 5 B I1L 2L IH^2H
B2a. 52 'B32 03 j j = 1 ... 4
For the most part, the coefficients of the independent variables inthis reduced form represent the net difference between the effect of avariable on the income share of the low-income group and its effect on thehigh-income group. Given the way the equation has been defined, a positivecoefficient indicates a relative improvement in the share of the low-incomegroup with respect to the high-income group.
For example, the coefficient of undermploymentB X = B 2L X B1-0 A2 0 reflects the relationship between theunderemp oyment se i-elasticities of real wages for each income group (theslope of their Phillips curves) weighted by the share of wages in the totalearnings of each group. If B A < 0, an increase in underemployment tends toworsen the relative share of lhe low-income group, reflecting a higher
1/ Given the lack of information matching real wages by economic class, thestructural equations cannot be directly estimated.

- 154 -
sensitivity of low-income wages to unemployment conditions and/qy a highershare of wages in the total earnings of the lower income group._ Similarly,a positive sign for the coefficient of the real interest rate variable,(s X > 0), implies a negative impact of r on economic activity combined with
a more important effect of economic activity (when employment effects areaccounted for independently) in determining the level of real earnings inhigh-income groups (B 3H > 03L
II. Graphical Presentation
The functional interactions described by equations (1) - (3) can beillustrated in Figure 1. The upper quadrants I and II represent therelationship between real wa%es and earnings for the low and the high-incomegroups, respectively. The slope of the curves is given bythe B. coefficients, while the parameters of both curves are real income andthe real exchange rate. If wages represent a higher portion of earnings inlow-income groups than in high-income groups, B > B>l , the earning curvein quadrant II will be steeper than in quadrantli. AcHhange in real incomewill shift both curves upwards. The extent of the shift will be determined bythe coefficient B .. Changes in the real exchange rate may shift the curvesin opposite direcions, given the different effects that earnings arising fromtradable and nontradable goods may have on each income class. Quadrants IIIand IV represent the Phillips curves of the L and H groups, respectively, withthe productivity level as a parameter. If unemployment (or underemployment)affects more strongly the level of real wages in the low-income than in thehigh-income bracket (i.e., *X L* larger than *X *), the Phillips curve inquadrant IV will be steeper thsan in quadrant II*H
I. Given the set of parameters assumed in Figure 1, the higher level ofunemployment causes a widening in inequality, as measured by the difference inearning shares depicted by the shaded area at the left of the vertical line.Starting from an initial general level of unemployment equal to UO, the levelof real wages in the L group will be equal to wLO and, in the H group, will beequal to wHO. At these levels of real wages, total earnings are determinedalong the respective earning curves with the low-income group at point AL andthe high-income group at point AH. The difference between the two earninglevels is represented along the common vertical axis by the shaded area to theright. An increase in the rate of unemployment to U induces a movement alongthe Phillips curves (from TL to VL in panel III and from TH to VH in panelIV). This will reduce real wages to wLl and wHl. At these lower wage levels,earnings will fall (to BL and BH).
The effects of other macrovariables can also be analyzed within thisframework. For example, if b < b , there is a higher positive effect ofeconomic activity on the earnThgs o?high-income compared with low-incomegroups. Then, increase in government spending will tend to increaseinequality by shifting upwards the earning curve in panel II by more than inpanel I. This increases the vertical difference, for a given level of realwages. Similarly, for a real devaluations take progressive, earnings of the L
2/ Since 8li > 0 and X2i < O0 81X2 ' 0 when *BLX2L2 > *B1HX2H*.

- 155 -
FIGURE I
Si
~~ I ~~H L
: u Se, -SL; 1.!
II~~~~~Ii L
IOS
II~~~~~~~~~~~~~~~~~~PWX WI
v -
IV 111U

- 156 -
group must improve relatively more than those of the H group. Low-incomefarmers producing exportable crops could be benefited by an improvement intheir competitiveness). In that case, the earning schedule in panel I willshift upwards more than in panel II. It is, moreover, conceivable, asmentioned above, that both curves could move in opposite directions.
III. Empirical results
The data used for the independent variables in equation (4) arediscussed in Appendix I. The dependent variable, log (S I/Se), is calculatedas the ratio of the share of income of the lowest three Keciles of incomeearners to the share of income of the highest decile. The reason for thissplit is that a very high proportion of income goes to the top 10, and thatthe incidence of poverty in this resgrt is analyzed by focusing on the lowestthree deciles of the income ladder._
The fit of the regression is extremely good, with all the variablesyielding statistically significant coefficients. The coefficients of laborproductivity, the real exchange rate, the real interest rate, and the timetrend, are all positive. The coefficients of underemployment, the inflationrate, and government spending are negative.
The results indicate that, over Lhe sample period, gains inproductivity tend to reduce inequality probably by inducing real wageimprovements. Increases in both the real exchange rates and the real interestrate also tend to reduce income disparity.
The progressive effects of the real exchange rate support the viewthat low-income groups tend to benefit relatively more from gains in externalcompetitiveness than the high-income groups. The positive sign of the realrate of interest probably stems from the fact that short-run improvements ineconomic activity bgnefit high-income groups more than low-income groups(or 83H > 3L
For the Philippines, the size and significance of the coefficientsstrongly suggest that underemployment, probably through its depressing effectson wages, affects low-income groups more adversely than high-income groups.The negative signs for underemployment is consistent with the findings ofBlank and Blinder who have studied the effects of those variables on income
3/ Within the data set used in this section, the average fraction of incomereceived by families in the lowest 30Z was 6.32, while the highest 1OZreceived 44.6%.
4/ Clearly the fact that income (in the IHS survey) does not include returnsto financial assets, may affect this conclusion. Increases in realinterest rates probably benefit more the higher decile. This particularconclusion could change depending on the magnitudes involved However,the lack of information on returns to financial assets does not allow usto incorporate this effect in our calculations.

- 157 -
shares in the United States for the period 1982-83.5/ They find thatunemployment has significant regressive effects on the distribution ofincome.
Inflation also has a regressive effect which probably arises, inaddition to its effects through economic activity, from the better ability ofthe upper-income groups to protect their real earnings from being eroded byprice increases.
The somehow qurprising result arises from the sign of the governmentexpenditure variable.6- It is apparent from the sample that governmentspending has had regressive redistributive effects. This could arise from thepositive relationship between y and g (given 03 - > 0), or from agovernment expenditure composition which has a ow (or falling) component ofsocial expenditures. This issue is discussed in more detail in the nextsection.
Because the units of measurement for the dependent variables aredifferent, an alternative way of determining the relative influence of theexplanatory variables on income shares is to calculate the B coefficientswhich are also reported in Table A.I. These coefficients measure the changein income shares, other things being equal, for a unit change in each of theindependent variables. Since all the variables are expressed in standarddeviation, the B coefficients are independent of the unit of measurement, andcan thus be compared directly within the equation.
5/ Blank, Rebecca H. and Alan S. Blinder, "Macroeconomics, IncomeDistribution, and Poverty," Working Paper No. 1567, NBER Working PaperSeries, Cambridge, Massachusetts (February 1984).
6/ Although government consumption is used in the estimaticn as a proxy forgovernment expenditures, adding construction expenditures did not alterthe results.

- 158 -
Table A.1: PHILIPPINES: EARNING SHARES AND MACROECONOMICVARIABLES (EQUATION 4), QUARTERLY, 1980-86
Dependent Variable: log (SL/SH)
Variable Coefficient t-value B - coefficient
Constant 22.145 3.86 --
- Productivity (log) 2.713 3.89 1.003
U - Underemployment -0.202 6.25 -0.915
x - Real exchange rate (log) 1.500 2.19 0.362
g - Government spending (log) -3.639 4.46 -0.613
r - Real interest rate 0.213 2.94 0.548
U - Inflation rate -0.413 2.41 -0.532
t - time trend 0.962 7.56 1.731
R2 = 0.961D.W. = 2.611S.E.E. - 0.128
Note: The variables are defined and reported in Appendix I. The estimationswere performed using a Cochrane-Orcutt Iterative technique.
We can observe from the B coefficients that labor market condi-tions are the most important explanatory variables to explain inequality. Thehighest B values correspond to productivity and underemployment abstractingfrom the time trend. The negative effect of government spending seems tofollow in importance, while inflation and the real interest rate follow with asimilar (although opposite) impact. The real exchange rate, although signifi-cant, is substantially less important in explaining the changes in incomeinequality.

- 159 -
Section V. COMMENTS ON METHODOLOGY FOR INCOME DISTRIBUTION ANDSAMPLE OF URBA POOR ACROSS CITIES
A. Comparison of FIES and National Accounts Estimatesof Personal Income and Expenditure
In this appendix a comparison of FIES and National Accounts (NA)estimates of average family income and expenditure is presented in order totest the degree of accuracy of the survey data. Two things are of interest inthis comparison. First, it is important to compare the magnitude of the FIESestimates in relation to that of the NA estimates. A large discrepancybetween the two estimates can be indicative of problems of measurement ineither the FIES and/or the NA data. Second, a change in the magnitude of thediscrepancy over time, might be a reflection of changes in the methods ofestimation, thus making any comparison between the different FIES somewhatproblematic.
5.1 The FIES estimates are always below the NA estimates as presented inTable Al.l. For the 1961-85 period the discrepancy between the two estimatesof average family income is roughly constant, around 35M, with the exceptionof the FIES estimate for 1975, in which the discrepancy is over 50X. This iswhy income data for 1975 has been excluded from the present analysis.
Table 5.1: COMPARISON OF NATIONAL ACCOUNTS AND FIES ESTIMATESOF FAMILY INCOME AND EXPENDITURE, 1961-85
1961/a 1965/b 1971/c 1975/d 1985 /b
NA Personal Income 12,190 19,387 38,508 85,236 466,931NA Personal Consumption 11,430 17,949 36,343 761,165 485,929No. of Families 4,427 5,132 61,347 6,860 9,847
NA Personal Income/Family 2,754 3,778 6,067 12,425 47,419NA Personal Consumption/Family 2,582 3,497 5,726 11,103 49,384
FIES Average Family Income 1,803 2,538 3,736 5,8409 31,052FIES Average Family Expenditure 1,845 2,903 4,566 6,940 26,865
Ratio FIES/NA Income per Family 0.65 0.67 0.62 0.47 0.65Ratio FIES/NA Expenditure perFamily 0.71 0.83 0.8 0.63 0.54
/a The National Accounts estimates for Personal Income and Consumption arethose reported in Berry (1975).
/b NEDA, Philippine Statistical Yearbook, .986.71 NEDA, National Income Series, No. 2, 1974.71 NEDA, National Income Series, No. 7, 1978.

-160 -
5.2 The FIES estimate of the average family expenditure is also belowthe NA estimate for the entire period but after a reduction in the discrepancybetween the two estimates from around 301 in 1961 to around 20. in 1971, thediscrepancy between the two estimates from around 30X in 1961 to around 20Z in1971, the discrepancy increased to around 371 in 1975, and to 45X in 1985.The discrepancy between the two estimates for the years 1975 a-id 1985 alsoincreases for family expenditure in real terms (1978 = 100). ior this reasonexpenditure data is excluded from the analysis, except for the comparison ofchanges in poverty incidence between 1975 and 1985.
5.3 According to the NA estimates, the difference between personalincome and expenditure have been positive for all years except 1985. FIESestimates offer exactly the opposite picture: negative difference of the twocategories during all the period except for 1985. It should be noted however,that for the FIES estimates the difference between income and expenditurerepresents directly family savings, while for the NA the difference includescategories as direct taxes, social security, transfers to the rest of theworld, personal savings and a statistical discrepancy. So even though 1985personal income is less than expenditures in the NA, savings is a positivemagnitude, due basically to a large negative statistical discrepancy.
5.4 The discrepancy between the FIES and NA figures presented here forincome and expenditure for the years 1965, 1971 and 1975 are larger than theones presented by the World Bank in 1980. The reason is that the figurespresented here are based on the latest revisions of the NA by NEDA. Thisrevisions have increased the NA figures as compared with the figures presentedin the earlier report.
B. A Comment on the Income Distribution b? Deciles as Calculated byNCSO for the Philippines
5.5 In 1986 the National Economic and Development Authority publishedthe results of the 1985 Family Income and Expenditures Survey and presentedthe profile of income distribution based on the response of 16,791households. The distribution of income at a national level was complementedwith the distributions for the urban and rural areas. In Table 5.2 the decileincome distribution as published by NCSO has been reproduced, together withits decomposition into urban and rural distributions. Based on thisinformation the Gini coefficients corresponding to each of the distributions,are indicated in the last row of the table.
5.6 The construction of income deciles involves two steps:
(a) A ranking of weighted total family income is constructed for theentire sample by sorting all cases from low income to high.
(b) The families then are grouped into groups each of them containing10 of the population.
5.4 A first quick test to check for the consistency of the calculationpresented is to divide, for each decile, the amount of income of all the

- 161 -
Table 5.2: NCSO INCOME DISTRIBUTION BY DECILES, 1985(X)
Decile National Urban Rural
I 2.0 0.5 4.0
II 3.2 0.9 6.1
III 4.1 1.5 7.4
IV 5.0 2.3 8.5
V 6.0 3.4 9.4
VI 7.3 4.6 10.6
VII 8.9 7.0 11.5
VIII 11.4 10.8 12.2
Ix 15.7 17.3 13.6
X 36.4 51.7 16.8
Total 100.0 100.0 100.0
Gimi 0.45 0.64 0.20
Source: FIES 1985, NCSO.

- 162
families by the mean income. The result should give us the number of familiesclassified in each decile. Since we should end with 10 groups of equal size,each decile should have approximately 10 of the population.
(a) National Deciles
5.8 NCSO has estimated the total number of families in the Philippinesto be 9,847,339, hence each decile should have approximately 984,734families. Table 5.3A presents the number of families in each decile. Thisnumber is obtained simply by dividing total income by mean income for eachdecile.
(b) Urban Deciles
5.9 The number of urban families has been estimated at 3,726,049, soeach decile should include approximately 372,605 families. Table 4.3B showshow the urban deciles have been miscalculated. The first decile has only3.59Z of the urban families while the tenth decile has over 201 of the urbanfamilies.
(c) Rural Deciles
5.10 The total number of rural families is estimated at 6,121,290families. Each decile should have approximately 612,129 families. In Table4.3C the number of families for each decile are presented. The first decilehas almost 14X of the rural families while the tenth decile has only 3.82S.
5.11 Given this inconsistency the corrected decile distribution areconstructed as follows:
(a) Families are ordered from low per capita income to high per capitaincome.
(b) They are grouped into deciles. Each decile is constructed asfollows:
(i) The first 101 of the families in the sample are groupedtogether in the first decile. Total weighted income and meanincomes are then computed. The maximum weighted income in thisgroup is also computed to mark the upper limit of the decile.The second decile begins with that family whose total weightedfamily income comes right after the maximum in the firstdecile. This is repeated until the 10th decile has beenconstructed.
(ii) The number of families in the population represented by the 101of the sample families in each decile is then computed simplyby obtaining the sum of the weights for each sample family ineach decile.
(iii) Due to the different weights given to each family, 101 of thesample families do not necessarily represent 101 of the

- 163 -
Table 5.3: TOTAL, RURAL AND URBAN INCOME DISTRIBUTION ANDDISTRIBUTION OF FAMILIES, NCSO, 1985
Income Income Mean No. of % ofdeciles (0OOO) income families families
A. Overall Income Distribution
I 6,176,187 6,273 984,567 10.00II 9,813,306 9,963 984,975 10.00III 12,517,805 12,718 984,259 10.00IV 15,258,927 15,494 984,828 10.00V 18,406,585 18,682 985,258 10.01VI 22,202,123 22,548 984,660 10.00VII 27,325,352 27,761 984,307 10.00VIII 34,785,278 35,312 985,084 10.00IX 47,869,347 48,612 985,084 10.00X 111,420,363 113,152 984,f16 10.00
Total 305,775,274 31,052 9,847,201 100.00
B. Urban Sector
I 844,389 6,311 133,795 3.59II 1,623,067 9,997 162,355 4.36III 2,657,955 12,796 207,718 5.57IV 3,910,083 15,538 251,646 6.75V 5,816,793 18,781 309,717 8.31VI 7,989,762 22,569 354,015 9.50VII 11,969,497 27,842 429,908 11.54VIII 18,487,699 35,596 519,375 13.94IX 29,701,304 48,956 606,694 16.28X 88,869,137 118,359 750,844 20.15
Total 171,869,677 46,127 3,726,010 100.00
C. Rural Sector
I 5,331,808 6,267 850,775 13.90II 8,190,239 9,956 822,644 13.44III 9,859,851 12,698 776,489 12.68IV 11,348,844 15,480 733,129 11.98V 12,589,792 18,637 675,527 11.04VI 14,212,361 22,537 630,623 10.30VII 15,355,856 27,698 554,403 9.06VIII 16,297,579 34,995 465,712 7.61IX 18,168,043 48,060 378,028 6.18X 22,551,226 96,435 233,849 3.82
Total 133,905,597 21,875 6,121,399 100.00
Source: FIES 1985, NCSO.

- 164 -
population families. For each decile, the ratio of the sum ofthe weights divided by the actual number of families thatrepresent 10% of the population is computed. This ratiosindicate how off the mark we are when we try to obtain 10% ofthe population by selecting 10% of the families in thesample. A ratio of one indicates that the 10% selected fromthe sample represents exactly 10 of the families in thepopulation. A ratio greater than one indicates that the 101 ofthe families in the sample represent more than 10% of thefamilies in the population, and vice versa.
(iv) The ratios 'hus constructed are used to adjust the number offamilies in the sample that we have to select in order toconstruct population deciles. Thus, new and correctedpopulation deciles are again calculated based on the adjustednumber of sample families that go into each decile.
(v) For the urban distribution, the ranking of low per capita tohigh per capita income families is restricted to urban familiesonly. Same for the rural distribution.
5.12 Table 5.4 presents the corrected distributions, and the Ginicoefficients in the last row of the Table. The distributions for the nationallevel show a slight difference mainly because NCSO has ranked the familiesfrom low to high family income while in this Report families are rankedaccording to per capita income. The differences are very small, as can beseen from the discrepancy of the Cini rations, 0.45 based on NCSO'sdistributions 0.43 based on the corrected one (less than 5% difference).
5.13 For the urban and rural distributions the differences are large.Comparing the share of each decile in both distributions NCSO's urbandistribution underestimates the share of the lower deciles, and inflates theshare of the highest deciles. NCSO's Gini coefficient for the urbandistribution is almost 50X higher than the corrected Cini.
5.14 In the case of the rural distribution, NCSO overestimates the shareof the lower deciles and underestimates that of the higher deciles. Thus theGini coefficient calculated from NCSO's distribution is almost 50% less thanthe corrected Gini. In sum, while the national income distribution shows verylittle differences in the two methods discussed here, urban and rural distri-butions show large differences. NCSO's calculations tend to overestimate thedegree of inequality in the urban sectors and underestimate it in the ruralsectors.
5.15 Tables 5.5A, 5.5B and 5.5C present the corrected income distribu-tions, with mean incomes and number of families by decile.
5.16 Still there is a way of obtaining the correct Gini coefficientsusing the income distribution as calculated by NCSO once it is recognized thatin fact the ten groups into which the population is grouped are not deciles

- 165 -
Table 5.4: REVISED INCOME DISTRIBUTION BY DECILES, 1985(%)
Decile National Urban Rural
I 2.3 2.1 2.6
II 3.4 3.3 4.0
III 4.2 4.3 5.0
IV 5.2 5.2 6.0
V 6.1 6.3 7.0
VI 7.3 7.6 8.2
VII 9.0 9.2 9.7
VIII 11.4 11.6 11.9
IX 15.5 15.7 15.5
x 35.6 34.8 30.2
Total 100.0 100.0 100.0
Gini 0.43 0.43 0.37
Source: FIES Tapes for 1985, Staff Estimates.

- 166 -
Table 5.5: REVISED INCOME DISTRIBUTION, 1985
Income Income Mean No. ot X ofdeciles (P 000) income families families
A. Overall Income Distrubtion
I 6,996,560 7,122 982,387 9.98II 10,405,593 10,471 993,754 10.09III 12,903,247 13,164 980,192 9.95IV 15,859,129 16,054 987,862 10.03
V 18,494,432 18,899 978,a93 9.94VI 22,451,924 22,795 984,950 10.00
VII 27,652,063 27,970 988,633 10.04VIII 34,796,304 35,372 983,725 9.99
IX 47,248,376 47,921 985,964 10.01X 108,966,642 108,546 1,003,875 10.20
Total 305,775,274 31,054 9,846,566 100.00
B. Urban Sector
I 3,650,299 10,003 364,920 9.79II 5,670,977 15,147 374,396 10.05
III 7,301,235 19,288 378,538 10.16IV 8,940,930 23,692 377,382 10.13V 10,783,446 28,839 373,919 10.04
VI 13,0,1,284 35,001 372,883 10.01VII 15,746,556 42,256 372,647 10.00
VIII 19,881,364 53,115 374,308 10.05IX 27,039,250 73,293 368,920 9.90X 59,804,330 159,773 374,308 10.05
Total 171,869,676 46,127 3,726,010 100.00
C. Rural Sector
I 3,505,662 5,732 611,595 9.99II 5,394,316 8,802 612,851 10.01
III 6,667,567 10,881 612,772 10.01IV 8,021,019 13,097 612,432 10.01V 9,382,444 15,291 613,593 10.02
VI 10,912,515 17,832 611,962 10.00VII 13,036,930 21,281 612,609 10.01VIII 15,889,305 25,989 611,386 9.99IX 20,708,190 33,764 613,322 10.02X 40,387,643 66,370 608,523 9.94
Total 133,905,597 21,876 6,121,119 100.00
Source: FIES Tapes 1985, Staff Estimates

- 167 -
but groups with different population shares When the groups are deciles theformula for the calculation of the Gini is:I/
C = 2 COV (Y, F(Y) )v
When the groups are not deciles and contain different shares of the totalpopulation then the formula is:
n21 Wi (Yi Y) (F. - F)
G =i-
where: Yi = income of group i
W. = population share of group i
F= Wj + Wi/2 , where WO = °
J-
F = is the mean of the cumulative income distribution
C. A Comparison of Urban Cotmu '4ies in the ThreeLargest Cities -
5.17 While in general government poverty alleviation programs have had astrong urban bias, this has been mainly limited to Manila. The urban poor inthe second largest city, Cebu, are among the poorest groups in the country.Health and health care are generally higher in Metro Manila, while congestionis the worst. Access to facilities is also better, in general, in Manila.
5.18 Employment and Income Opportunities. Average incomes in othercities is much lower than in Metro Manila. The lowest average income wasfound in Cebu at 906 pesos per month, followed by Davao at 1,607 pesos permonth. The variation in incomes is also lower than in Metro Manila. Thissuggest that middle income families are less important in the poor urban
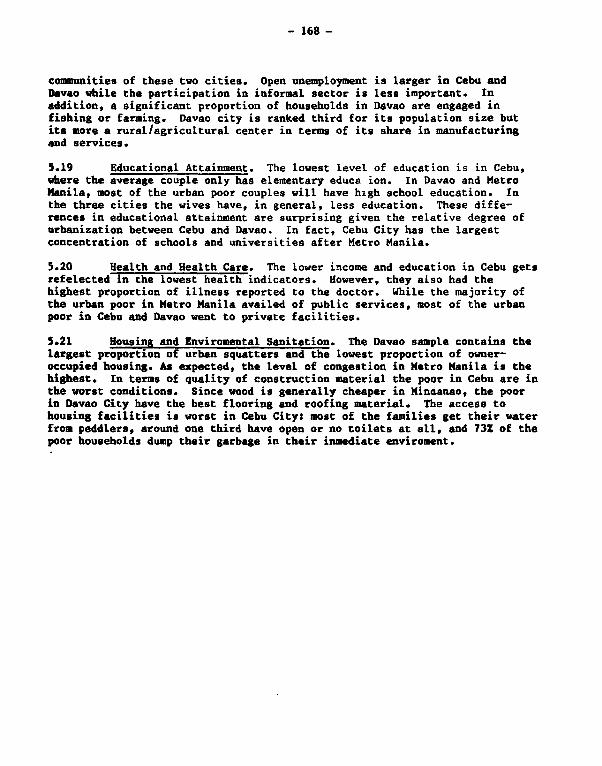
- 168 -
comunuities of these two cities. Open unemployment is larger in Cebu andDavao while the participation in informal sector is less important. Inaddition, a significant proportion of households in Davao are engaged infishing or farming. Davao city is ranked third for its population size butits more a rural/agricultural center in terms of its share in manufacturingand services.
5.19 Educational Attainment. The lowest level of education is in Cebu,where the average couple only has elementary educa ion. In Davao and MetroManila, most of the urban poor couples will have high school education. Inthe three cities the wives have, in general, less education. These diffe-rences in educational attainment are surprising given the relative degree ofurbanization between Cebu and Davao. In fact, Cebu City has the largestconcentration of schools and universities after Metro Manila.
5.20 Health and Health Care. The lower income and education in Cebu getsrefelected in the lowest health indicators. However, they also had thehighest proportion of illness reported to the doctor. While the majority ofthe urban poor in Metro Manila availed of public services, most of the urbanpoor in Cebu and Davao went to private facilities.
5.21 Housing and Enviromental Sanitation. The Davao sample contains thelargest proportion of urban squatters and the lowest proportion of owner-occupied housing. As expected, the level of congestion in Metro Manita is thehighest. In terms of quality of construction material the poor in Cebu are inthe worst conditions. Since wood is generally cheaper in Minaanao, the poorin Davao City have the best flooring and roofing material. The access tohousing facilities is worst in Cebu City: most of the families get their waterfrom peddlers, around one third have open or no toilets at all, and 731 of thepoor households dump their garbage in their inmediate enviroment.

- 169 -
Table 6.1: PHILIPPINES: INFANT MORTALITY RATES (IMR)FOR SELECTED SOCIOECONOMIC CHARACTERISTICS, 1970-83
Year and characteristics IMR /a
ResidenceRural: 1970 54.3
1973 61.01983 59.0
Urban: 1970 45.21973 49.01983 54.6
Occupation of Wife1973: Professional, administrative and managerial 33.9
White collar 34.8Blue collar 58.4Farm 100.2None 57.9
1983: Working 64.3Not working 57.6
Wife's Education1973: None 115.1
Grades 1-4 61.2Grades 5-7 59.8High school, 1-4 years 49.1College, 1 year + 33.6
1983: None 90.3Elementary 54.7High school 48.5College 36.8
/a Based on Brass q(2)-q(3) estimates for recent mortality.
Source: Zablan, Z.C., "Trends and Differentials in Mortality," in UnitedNetions (1978), Population of the Philippines, ESCAP Country Mono-graph Series No. 5, Bangkok, and estimates based on the 1983 NationLlDemographic Survey.

- 170 -
Table 6.2 PHILIPPINES: PROPORTION OF HOUSEHOLDSWITH BASIC FACILITIES, 1970-85
(Z)
Sanitary toilet facilities Safe water supply
1970 22.6 43.5
1973 32.3 39.01974 32.3 39.01975 32.1 43.01976 33.0 45.01977 45.0 50.01978 45.0 51.01979 45.0 55.01980 50.0 59.01981 56.5 64.51982 58.5 68.51983 60.0 72.01984 65.0 77.01985 67.1 77.1
Notes: (1) Sanitary toilet facilities refer to water carriage system ofexcreta disposal which includes septic tank and flush/watersealed types.
(2) Safe water supply includes tap (inside the house), public well,public faucet, improved spring, improved dug well and privatedeep well.
(3) Figures for 1970 were based on the 1970 census of population andhousing.
(4) Figures for 1978 and 1982-85 were based on regional reportssubmitted to the Division on Environmental Sanitation of MOR.
(5) Figures for 1981 were based on the results of the 1981 NationalHealth Survey.
Source: MOH, Division on Environmental Sanitation, as reported in NEDA, Com-pendium of Philippine Social Statistics, 1986.

- 171 -
Table 6.3: PHILIPPINES: PREVALENCE OF INTESTINAL PARASITISMBY ISLAND GROUPS, 1982
Number Percent positive forexamined any type of parasite
Philippines 14,785 69.3
Urban 4,455 64.4Rural 10,330 71.4
Luzon 8,444 66.3Visayas 4,247 73.7Hindanao 2,095 72.4
Source: FNRIt Nationwide Nutrition Survey, 1982, as reported in NEDA, Compen-dium of Philippine Social Statistics, 1986.

- 172 -
Table 6.4: PHILIPPINES: MALNUTRITION RATES BY REGION, 1984/85(Based on OPT weight-for-age measures)
Second degree Third degreeRegion 1984 1985 1984 1985
Philippines 16.0 17.8 2.2 2.3
NCR 17.1 16.5 1.7 2.1
I 19.1 17.0 3.2 3.1
II 13.3 14.1 1.9 1.9
III 13.8 13.3 1.6 1.5
IV 17.2 19.9 2.6 2.5
V 18.2 19.4 2.9 3.1
VI 21.4 21.8 2.6 2.9
VII 11.6 14.8 1.0 1.5
VIII 17.3 19.1 2.6 3.2
IX 13.8 14.2 2.2 2.1
X 15.5 26.9 1.7 2.0
XI 13.0 14.1 1.6 1.6
XII 16.0 20.5 3.0 3.6
Sources: Regional Development Indicators (RDI); Ministry of Health (MOH).

- 173 -
Table 6.5: PHILIPPIIIES: TRENDS IN BREAST-FEEDING PREVALENCEAND DURATION, 1973-83
DurationYear Source and nature of data breast-fed Mean Trimean N
(mos.) (mos.)
1973 NDS (last child) 86.8 - 12.3 7,190
1978 RPFS (all children born 84.6 12.6 11.4 7,780three years before (9,531)/asurvey date, 1978)
1983 NDS (all children born 83.1 10.4 9.6 11,846between 01/73 and 12/82) (9,531)/a
NDS (all children born 83.2 11.2 9.6 12,865between 01/7' and 07/83) (10,677)/a
/a Sample sizes for data on duration.
Source: Zablan, Z., "Philippine Trends in Breast-feeding Practice," Univer-sity of the Philippines Population Institute, July 1985.

- 174 -
Table 6.6: PHILIPPINES: PROPORTION OF DEATHS WITHMEDICAL ATTENDANCE BY REGION, 1977-83
(M)
1977 1978 1979 1980 1981 1982 1983
Philippines 33.0 31.0 30.2 31.2 29.3 28.2 29.8
National Capital Region 66.1 64.0 60.4 57.9 55.9 51.8 55.0
I Ilocos 24.1 24.0 23.4 26.0 24.0 22.2 24.6
II Cagayan Valley 17.0 16.0 15.7 17.7 14.9 14.9 17.7
III Central Luzon 32.0 30.0 30.3 32.0 28.6 28.6 30.7
IV Southern Tagalog 32.0 30.1 29.4 31.0 29.1 29.1 28.7
V Bicol 21.0 21.0 19.6 22.0 19.3 19.3 20.4
VI Western Visayas 28.3 27.3 26.9 28.7 27.5 27.5 26.7
VII Central Visayas 20.0 21.2 21.2 22.0 21.4 21.4 21.5
VIII Eastern Visayas 16.3 15.3 16.5 18.0 17.3 16.9 18.5
IX Western Mindanao 32.0 33.0 31.2 34.0 30.0 30.7 35.5
X Northern Mindanao 26.1 27.0 27.0 26.1 25.5 24.0 24.7
XI Southern Mindanao 34.1 33.0 32.9 33.3 30.8 28.4 29.4
XII Central Mindanao 40.1 39.0 38.3 36.3 36.0 37.7 38.1
Note: Deaths with medical attendance are those attended by a physician duringthe deceased's illness or injury and the date of attendance was speci-fied in the death certificate.
Source: NSCO, Vital Statistics Division, as reported in NEDA, Compendium ofPhilippine Social Statistics, 1986.

- 175 -
Table 6.7: PHILIPPINES: PROPORTION OF BIRTHSWITH MEDICAL ATTENDANCE BY REGION, 1977-83
(%)
1977 1978 1979 1980 1981 1982 1983
Philippines 49.1 50.1 53.7 57.0 57.3 56.9 56.6
National Capital Region 95.0 94.4 93.9 93.9 94.7 93.5 93.1
I Ilocos 45.7 48.0 51.4 56.8 59.6 60.1 61.2
II Cagayan Valley 24.3 26.8 33.9 47.4 48.7 48.0 48.1
III Central Luzon 64.8 66.2 70.2 74.3 73.7 74.2 74.3
IV Southern Tagalog 42.5 44.0 46.6 50.4 51.1 50.5 50.4
V Bicol 24.0 25.9 29.7 32.2 33.6 33.9 33.6
VI Western Visayas 42.1 44.0 46.7 47.5 46.6 45.8 45.3
VII Central Visayas 45.2 47.6 54.7 57.1 56.5 54.8 55.3
VIII Eastern Visayas 35.9 36.4 40.0 44.8 44.5 44.1 43.6
IX Western Mindanao 37.4 39.2 42.2 45.9 46.8 45.4 47.2
X Northern Mindanao 35.6 37.1 41.7 44.7 44.1 43.5 41.1
XI Southern Mindanao 34.4 35.3 38.1 39.7 38.8 38.2 36.8
XII Central Mindanao 42.0 44.4 47.3 47.0 46.2 45.6 44.6
Note: Birth with medical assistance refers to birth attended by a physician,nurse or midwife.
Source: NCSO, Vital Statistics Division, as reported In NEDA, Compendium ofPhilippine Social Statistics, 1986.

- 176 -
Table 6.8: PHILIPPINES: LITERACY BYSELECTED AGE GROUP, SEX AND URBAN AND RURAL, 1960, 1970 AND 1980
Both sexes Male FemaleTotal Urban Rural Total Urban Rural Total Urban Rural
15 Years Oldand Over
1960 71.9 - - 74.2 - - 69.5 - -
1970 82.6 92.6 77.4 84.3 94.0 79.6 80.9 91.3 75.3
1980 83.3 93.1 76.9 83.9 94.0 77.6 82.8 92.3 76.1
25 Years Oldand Over
1960 64.5 - - 68.6 - - 60.6 - -
1970 77.7 90.2 71.5 80.5 92.4 74.9 74.8 88.1 68.1
1980 78.7 91.0 70.9 80.1 92.5 72.5 77.3 89.5 69.2
Note: Literacy rate refers to the percentage of the population who can readand write a simple message in any language or dialect.
Source: NSCO, Census of Population and Housing, as reported in NEDA, Compen-dium of Philippine Social StatistEics, 1986.

- 177 -
Table 6.9: PHILIPPINES: TEN LEADING CAUSES OF MORBIDITY, 1978-84(Per 100,000 population)
Causes 1978 1979 1980 1981 1982 1983 1984
Bronchitis 455.6 471.3 427.3 507.1 552.2 577.8 1,039.5
Influenza 488.7 406.0 419.9 445.5 445.5 447.9 783.3
Diarrheas 462.6 466.2 413.0 482.7 435.6 443.6 962.6
Pneumonias 248.8 272.2 242.7 248.6 108.3 237.5 337.6
Tuberculosis, all forms 260.5 233.6 232.4 235.8 206.2 179.2 268.0
Malaria 77.7 68.2 82.1 89.1 68.9 88.0 207.4
Malignant neoplasms 43.6 43.4 59.8 50.0 - 49.7 50.6
Dysentery, all forms 60.7 60.7 56.7 54.4 66.7 - -
Measles 61.2 62.8 55.4 54.6 67.3 71.7 126.5
Whooping cough 33.5 - 41.1 38*7 31.3 27.4 -
Infectious hepatitis - 19.0 - - 16.5 17.6 28.3
Accidents - - - - - - 156.8
Source: MOH, Health Intelligence Service, as reported in Zablan, Z., "Demo-graphic and Health Perspectives of the Status of Women and Childrenin the Philippines," report prepared for UNICEF, 1986.

Table 6.10: PHILIPPINES: HOSPITAL BEDS BY REGION, 1982-85
1982 1983 1984 1985Bed- Bed- Bed- Bed-
population population population populationBed ratio Beds ratio Beds ratio Beds ratio
Philippines 88,250 1:575 85,050 1:612 90,279 1:591 90,008 1:607
National Capital Region 30,461 1:208 27,265 1:240 29,534 1:228 29,633 1:234I Ilocos 5,649 1:652 5,817 1:645 5,749 1:666 5,695 1:685II Cagayan Valley 3,386 1:691 3,080 1:779 3,236 1:760 3,239 1:778III Central Luzon 6,427 1:789 6,644 1:782 6,024 1:884 6,040 1:903IV Southern Tagalog 8,252 1:790 8,287 1:809 5,948 1:771 8,857 1:800V Bicol 4,870 1:751 4,590 1:816 4,889 1:784 4,998 1:785VI Western Visayas 4,984 1:954 5,704 1:953 5,187 1:960 4,859 1:1,048VII Central Visayas 6,002 1:658 6,102 1:661 6,162 1:667 6,076 1:690 XVIII Eastern Visayas 2,792 1:1,042 2,791 1:1,062 2,964 1:1,018 2,954 1:1040IX Western Mindanao 2,700 1:989 2,886 1:947 3,054 1:916 3,110 1:921X Northern Mindanao 4,661 1:629 4,470 1:674 5,073 1:610 5,084 1:625XI Southern Mindanao 5,258 1:675 5,111 1:713 6,274 1:596 6,207 1:618XII Central Mindanso 2,808 1:856 2,903 1:850 3,185 1:795 3,256 1:798
Sources: MOH, Bureau of Medical Services; and NSCO, Population Studies Division, asreported in NEDA, Compendium of Philippine Social Statistics, 1986.

- 179 -
Table 6.11: PHILlPPINES: GOVERNMENT HEALTH FACILITIES, 1975-85
Rural Health Unit Barangay Health StationYear Number Ratio Number Ratio
1975 1,075 1:24,785 3,075 1:13,743
1979 1,928 1:24,397 4,552 1:10,333
1980 1,991 1:24,267 7,353 1:6,571
1981 1,991 1:24,880 7,991 1:6,199
1982 1,991 1:25,506 7,991 1:6,355
1983 1,991 1:26,145 7,991 1:6,514
1984 1,991 1:26,796 7,991 1:6,676
1985 1,991 1:27,458 7,991 1:6,841
Note: Figures for 1981-85 were taken from the results of the survey offacilities conducted in the said years by the Ministry of Health.
Sources: MOH, Planning Service Division; and NSCO, Population StudiesDivision, as reported in NEDA, Compendium of Philippine SocialStatistics, 1986.

Table 6.12: PHILIPPINES: GOVERNMENT WORKERS, 1978-85
Physician Nurse Midwife Dentist Nutritionist San. InspectorNumber Ratlo Number Ratio Number Ratio Number Ratio Number Ratio Number Ratio
1978 6,157 1:7,437 7,467 1:6,132 6,157 1:7,437 790 1:57,967 305 1:150,146 1,502 1:30,489
1979 6,839 1:6,877 8,523 1:5,518 8,698 1:5,407 777 1:60,537 502 1:93,700 1,499 1:31,379
1980 7,259 1:6,656 9,606 1:5,029 9,329 1:5,179 1,029 1:46,954 618 1:78,162 1,565 1:30,873
1981 7,378 1:6,714 9,644 1:5,136 9,470 1:5,230 1,090 1:46,589 599 1:82,697 1,928 1:25,692
1982 7,378 1:6,883 9,644 1:5,265 9,470 1:5,362 1,090 1:46,589 599 1:84,779 1,928 1:26,339
1983 8,132 1:6,401 10,306 1:5,050 9,574 1:5,437 1,123 1:46,353 619 1:84,095 1,880 1:27,689
001984 8,132 1:6,560 10,306 1:5,176 9,574 1:5,572 1,123 1:47,507 619 1:86,189 1,880 1:28,378
1985 8,511 1:6,423 10,423 1:5,245 9,793 1:5,582 1,146 1:47,704 634 1:86,228 1,933 1:28,282
Sources: MOH, Planning Service; and NSCO, Population Studies Division, as reported in NEDA,Compendium of Philippine Social Statistics, 1986.

- 181 -
Table 6.13: M ILIPPINES: HEALIH MANPOWERBY REGION, 1973 AND 1977
1973 1977Region Physician Nurse Midwife Physician Nurse Midwife
Philippines 1:3,052 1:4,829 1:5,785 1:2,661 1:2,950 1:3,687
National Capital Region 1:1,643 1:4,504 1:5,263 1:1,514 1:1,537 1:2,651
I Ilocos 1:3,592 1:3,693 1:4,968 1:3,054 1:2,765 1:4,116
II Cagayan Valley 1:4,790 1:5,938 1:6,326 1:3,875 1:4,660 1:4,231
III Central Luzon 1:2,916 1:5,020 1:4,149 1:2,470 1:4,295 1:2,869
IV Southern Tagalog 1:1,643 1:4,504 1:5,263 1:1,514 1:1,537 1:2,651
V Bicol 1:4,959 1:8,139 1:8,542 1:4,025 1:6,508 1:5,047
VI Western Visayas 1:3,775 1:3,163 1:5,232 1:3,888 1:3,090 1:4,475
VII Central Visayas 1:2,979 1:2,849 1:6,0A3 1:2,516 1:2,518 1:5,591
VIII Eastern Visayas 1:6,082 1:7,053 1:8,175 1:4,384 1:6,226 1:5,920
IX Western Mindanao 1:6,248 1:5,984 1:8,357 1:7,057 1:6,122 1:5,517
X Northern Mindanao 1:4,465 1:6,377 1:5,190 1:2,858 1:4,461 1:3,407
XI Southern Mindanao 1:6,206 1:11,122 1:8,161 1:4,372 1:5,399 1:3,683
XII Central Mindanao 1:6,380 1:10,589 1:7,096 1:5,540 1:10,153 1:4,348
Sources: Ministry of Health, National Census and Statistics Office, and NEDARegional Development Indicators, as reported in INTERCARE, Health CareFinancing in the Philippines: A Country Study, 1987.

- 182 -
Table 6.14: PHILIPPINES: REAL HEALTH CARE EXPENDITURES, 1981-85(Million 1972 pesos)
Government HCE/a Private HCE/b Philippine lCEYear Amount X Amount Amount X
1981 862 36 1,556 64 2,418 100
1982 962 37 1,627 63 2,589 100
1983 1,021 38 1,695 62 2,716 100
1984 628 29 1,551 71 2,179 100
1985 562 26 1,632 74 2,194 100
1985 0.65 1.05 0.91
Average 807 33 1,612 67 2,419 100
/a Deflated by the Implicit Price Index of the Gross National Product inas-much as inputs to government health services run the gamut of all goodsand services.
/b The service component of the Private Health Care Expenditure was deflatedby the Implicit Price Index of Private Medical Services. The IntermediateInputs of Private Medical Services such as utilities, rent and drugs, weredeflated by IPIGNP, for the same reason as in /a.
Source: INTERCARE, Health Care Financing in the Philippines: A CountryStudy, 1987.

- 183 -
Table 6.15: PHILIPPINES: DISTRIBUTION OF GOVERNMENT HEALTH FUNDS, 1981-85(in million pesos)
National governmentDepartment Other Localof Health ministries Total government Grand total
Year Amount z Amount X Amount I Amount z Amount z
1981 1,801.8 65.8 652.0 23.8 2,453.9 89.7 282.4 10.3 2,736.3 100.0
1982 2,149.8 65.0 848.1 25.6 2,997.8 90.6 311.6 9.4 3,309.4 100.0
1983 2,661.0 67.9 912.9 23.3 3,573.8 91.2 347.0 8.8 3,920.8 100.0
1984 2,271.6 63.2 902.8 25.1 3,174.4 88.3 422.0 11.7 3,596.4 100.0
1985 2,425.3 64.2 850.2 22.5 3,275.4 86.7 503.7 13.3 3,779.1 100.0
Sources: National Government Funds: General Appropriations Act, Republic ofthe Philippines, 1981-85; and Local Government Funds: Annual Finan-cial Report, Commission on Audit, Republic of the Philippines,1981-85, as reported in INTERCARE, Health Care Financing in thePhilippines: A Country Study, 1987.

- 184 -
Table 6.16: PHILIPPINES: USES OF THE BUDGET OF THE DEPARTMENTOF HEALTH, 1981-85(in million pesos)
Preventive Curative Admin.Care Services Training Services Total
Year Amount X Amount Z Amount % Amount % Amount X
1981 437.4 24.3 1,179.6 65.5 16.2 0.9 168.6 9.4 1,801.8 100.0
1982 553.4 25.7 1,401.8 65.2 14.6 0.7 180.0 8.4 2,149.8 100.0
1983 616.2 23.2 1,829.4 68.9 14.0 0.5 201.3 7.6 2,661.0 100.0
1984 559.0 24.6 1,492.1 65.7 14.1 0.6 206.4 9.1 2,271.6 100.0
1985 337.4 13.9 1,901.7 78.4 14.4 0.6 171.8 7.1 2,425.3 100.0
Average 500.7 22.3 1,561.0 68.7 14.7 0.7 185.6 8.3 2,261.9 100.0
Source: General Appropriations Act, Republic of the Philippines, 1981-85 a:reported in INTERCARE, Health Care Financing in the Philippines: ACountry Study, 1987.

- 185 -
Table 6.17: PHILIPPINES: EXPENDITURES ON PUBLIC HOSPITALSBY REGION, 1981-85
('000 pesos)
Region 1981 1982 1983 1984 1985
National Capital Region 223,193 253,175 297,717 242,320 257,820
I Ilocos 76,804 95,907 131,258 110,642 154,992
II Cagayan Valley 51,772 66,705 93,486 79,973 119,098
III Central Luzon 79,481 93,925 132,408 111,438 160,990
IV Southern Tagalog 88,397 100,917 152,563 126,583 179,984
V Bicol 54,337 62,320 91,317 67,189 112,899
VI Western Visayas 65,320 80,866 108,823 95,205 117,804
VII Central Visayas 54,128 68,488 90,194 75,696 108,436
VIII Eastern Visayas 58,147 70,771 109,576 80,485 118,805
IX Western Mindanao 29,176 42,613 68,264 52,978 86,465
X Northern Mindanao 46,378 57,846 75,060 65,487 100,502
XI Southern Mindanao 44,995 54,535 74,933 66,668 96,965
XII Central Mindanao 26,373 34,602 47,758 37,466 65,317
National pool 92,329 67,679 68,351 64,751 44,210
Total /a 990,830 1,150,349 1,541,708 1,276,881 1,724,287
(X) 55.00 53.51 57.94 56.21 71.10
Total expenditures, DOH 1,801,845 2,149,789 2,660,953 2,271,584 2,425,281
/a Expenditures by Department of Health.
Source: General Appropriations Act, Republic of the Philippines, 1981-85 asreported in INTERCARE, Health Care Financing in the Philippines: ACountry Study, 1987.

- 186 -
Table 6.18: PHILIPPINES: FAMILY HEALTH EXPENDITURES, 1965 AND 1971(PERCENTAGE DISTRIBUTION)
Item 1965 1971
Hospital charges 21.00 32.30
Provider FeesPhysician/midwife 28.00 28.70Nursing 0.80 0.60Traditional 5.80 5.,0
Subtotal 34.60 34.30
DrugsFirst aid, common ailments 13.30 7.00Serious illness and maternity 17.90 8.60Medicinal herbs, vitamins, etc. 6.00 13.00
Subtotal 37.20 28.60
OtherDental care 4.50 2.70Eye exams and eyeglasses 2.40 1.90Thermometers, hot-water bags, etc. 0.30 0.20
Total 100.00 100.00
Source: Family Income and Expenditures Survey, 1965 and 1971, NCSO asreported in INTERCARE, Health Care Financing in the Philippines: ACountry Study, 1987.

Table 6.19: PHILIPPINES: GOVERNMENT HEALTH FUNDS BY SOURCE, 1981-85(Amounts in million pesos)
1981 1982 1983 1984 1985Source Amount X Amount x Amount 2 Amount X Amount X
National Government 2,453.9 89.7 2,097.8 90.6 3,573.8 91.2 3,174.4 88.3 3,275.4 86.7
Taxes 2,200.7 80.4 2,689.2 81.3 3,211.0 81.9 2,859.9 79.5 2,848.6 75.4
Operating income 185.1 6.8 173.7 5.2 190.4 4.9 149.3 4.2 160.0 4.2
Foreign loans & grants 68.1 2.5 134.9 4.1 172.4 4.4 165.2 4.6 266.9 7.1
Local Government 282.4 10.3 311.6 9.4 347.0 8.8 422.0 11.7 503.7 13.3
Total 2,736.3 100.0 3,309.4 100.0 3,920.8 100.0 3,596.4 100.0 3,779.1 100.0
Note: Figures (X) may not add up to total due to rounding.
Sources: National government: General Appropriations Act, Republic of the Philippines, 1981-85 and Budgetof Receipts and Expenditures, Republic of the Philippines, 1981-85; Local Government: AnnualFinancial Report, Commission on Audit, 1981-85, as reported in INTERCARE, Health Care Financing inthe Philippines: A Country Study, 1987.

- 188 -
Table 6.20: PHILIPPINES: FINANCIAL STATISTICS OF SELECTEDGOVERNMENT FOSPITALS IN METRO MANILA, 1986
Patient classificationPartlal Full
Item Medicare Pay indigent indigent
Average cost per patient per day(Pesos) 210.09 309.47 180.71 125.29
Average cost per patient perconfinement (Pesos) 1,187.93 1,116.96 673.73 665.82
Percentage of cost borne by thepatient (Z) 78.96 83.84 33.93 9.96
Average cost of outside purchases perpatient (Pesos) n.a. n.a. 374.25 431.70
Highest amount paid by a patient inone confinement (Pesos) 9,527.85 34,193.35 3,500.00 4,500.00
Lowest amount paid by a patient inone confinement (Pesos) 60.00 60.00 5.00 none
Source: Department of Health Hospital Records, September 1986, as reported inINTERCARE, Health Care Financing in the Philippines: A CountryStudy, 1987.

- 189 -
Tabale 6.21: PHILIPPINES: DISTRIBUTION OFCHILDREN BY ENERGY AND PROTEINADEQUACY LEVEL: 1978 AND 1982 /a
Actual/ Actual/Energy ade- increase Protein ade- increasequacy level 1978 1982 (decrease) quacy level 1978 1982 (decrease)
0-19% 6.5 3.3 (3.2) 0-19% 3.2 1.2 (2.0)
20-29 11.3 6.8 (4.5) 20-39 12.3 7.1 (5.2)
30-39 13.8 11.6 (2.2) 40-59 16.6 14.9 (1.7)
40-49 15.3 17.1 18.0 60-79 19.9 17.6 (2.3)
50-59 14.6 14.6 0.0 80-99 15.2 18.0 2.8
60-69 10.2 13.7 3.5 100-119 10.7 13.1 2.4
70-79 8.8 9.5 0.7 120-139 7.4 9.8 2.4
80-89 5.5 7.0 1.5 140-159 5.6 6.1 0.5
90-99 4.7 4.9 0.2 160-179 3.2 3.6 0.4
100-109 2.2 2.8 0.6 180-199 2.1 3.2 1.1
110-129 2.9 5.0 2.1 200-219 1.4 2.1 0.7
130-149 1.4 1.7 0.3 220-239 0.7 1.0 0.3
150 and over 2.8 2.0 (0.8) 240 and over 1.7 2.3 0.6
Total 100.0 100.0 Total 100.0 100.0
/a Six month to four year old children.
Source: FNRI, 1982 Nationwide Nutrition Survey as reported in R.F.Florentino, et al., 1986 Situation Analysis of Children in thePhilippines: Food and Nutrition, 1986.

- 190 -
CHART IIIPHIUPPINES
DEPARTMENT OF HEALTH REORGANIZED STRUCTUREPer E.O. 119 (1987)
B u ofme d r
& Research Health Foaa& DiuSpatOVof Halt
|B_ ua ueae Comfuonc_ - QirDaon Dti noe
(AceAgences)
Nan-Cammuniccele Ianof mrae-ntChetO
Faceln es SWAM & QegUlM S cm
; l TBN0100111 Control _| kFtoefn Reeac & Adl kfn L t L om t SWA
SchistoControl Rantenn B Reoau l Rn KoW
Research Fool NW Heolthperpon
1 De ContG i 1 1 _ Ha,p|osranem De Cn l orntnunit r
T BNL.CrltlOtl | Avrv He LConnuxxftHeftNaIon als 3 Rgona r Pr
& os Helt OficeshEdcaio
Dtsneass Contl Lo 1 ecoters
| Chi(S Heannl | Productin r |rAurityrub Planntng Exct| Comiffe AuWorx
Oeenetons l
Nv1t.tiin 1 | | ~~~~~~~~~~~ ~~~~~15 iODa 3 RegonOl
Centers e cs
Oentcg Health
ProvincZialmeal" Office
EnvironmnentalHealth
DistnctHealth Office
WOWdBank -40B791

MAP SECTION

ISRO 21020
emlee blES
POVTY INCIDENCEBY REGION. 1986
* *
IWSAN IMLAL TOTAL:
40% 60% 47%
mu-. ii u4% 6-% 55%
rZ=o _, % of tota pmtdatlon,+0 ,J ~~~~~ILW A S 0t 100t- 300x 300
1N-OM" * I I S /S Oo
i~~~~~~~ ~~~~~~~~~~~~~~~~~~~~~~~~~~~~~~~~~ I ° U
A*m 0 C 0 100 '0 "a
NOR
CHINA
IN D>',-4I ¶.,;104
fbruary 91