report of digester users’ survey (bus), 2019
TRANSCRIPT
Biogas Dissemination Scale-Up Programme (NBPE+)
Report of
Bio-digester Users’ Survey (BUS), 2019
Submitted to: SNV Ethiopia
Prepared by: Miklol Consulting and Research Plc. Tel: +251-118-656880 Email: [email protected]
May 2019 Addis Ababa, Ethiopia
i
CONTENTS List of tables ........................................................................................................................................ iii
List of figures....................................................................................................................................... iii
Acronyms ............................................................................................................................................ iv
EXECUTIVE SUMMARY .................................................................................................................. v
1. INTRODUCTION ........................................................................................................................... 1
1.1 Background .............................................................................................................................. 1
1.2 Objectives of BUS ................................................................................................................... 2
2. REVIEW OF RELATED LITRATURE .......................................................................................... 3
2.1 Country Context ....................................................................................................................... 3
2.1.1 Background ................................................................................................................... 3
2.1.2 Socioeconomic condition .............................................................................................. 3
2.1.3 Agricultural and environmental landscape .................................................................... 4
2.1.4 Energy Sector ................................................................................................................ 5
2.1.5 The Biogas sub-sector ................................................................................................... 5
2.2 National Biogas Program of Ethiopia (NBPE) ......................................................................... 6
2.2.1 National Biogas Program of Ethiopia Phase I (NBPE-I) ............................................... 6
2.2.2 National Biogas Program of Ethiopia Phase II (NBPE-II) ............................................ 6
2.2.3 Biogas Dissemination Scale-up Program (NBPE+)....................................................... 7
2.2.4 Institutional setup .......................................................................................................... 7
3. SURVEY METHODOLOGY .......................................................................................................... 8
3.1 Survey Regions ........................................................................................................................ 8
3.1.1 Tigray Region ............................................................................................................... 8
3.1.2 Amhara Region ............................................................................................................. 8
3.1.3 Oromia Region .............................................................................................................. 8
3.1.4 SNNP Region ................................................................................................................ 8
3.2 Survey Design .......................................................................................................................... 9
3.2.1 Quantitative research design.......................................................................................... 9
3.2.2 Qualitative research activities...................................................................................... 10
3.2.3 Data collection process ................................................................................................ 10
4. SURVEY FINDINGS .................................................................................................................... 11
4.1 Household characteristics ...................................................................................................... 11
4.1.1 Respondents’ profile ................................................................................................... 11
4.1.2 Household structure..................................................................................................... 11
4.1.3 Livelihood ................................................................................................................... 12
4.1.4 Animal holdings .......................................................................................................... 13
4.1.5 Access to water ........................................................................................................... 13
4.1.6 Toilet ........................................................................................................................... 14
4.1.7 Electric connectivity .................................................................................................... 14

ii
4.2 Decision Making Process ....................................................................................................... 15
4.2.1 Access to utilization of information about biogas ....................................................... 16
4.2.2 Construction cost of biogas plants and financing schemes .......................................... 18
4.3 Biogas functionality and service delivery performance .......................................................... 19
4.3.1 Description of biogas plants installed .......................................................................... 19
4.3.2 Functionality rates ....................................................................................................... 19
4.3.3 Performance of functional biogas systems .................................................................. 23
4.3.4 Biogas feeding patterns ............................................................................................... 23
4.4 Users’ training and after-sale services .................................................................................... 26
4.5 Socio-economic impacts of biogas technology ...................................................................... 27
4.5.1 Impact on health and sanitation ................................................................................... 27
4.5.2 Impacts on violence against women and girls ............................................................. 28
4.5.3 Impact of biogas on households’ energy expenditure .................................................. 29
4.5.4 Impact of biogas on children’s education and study time ............................................ 29
4.5.5 Impact of biogas on agricultural productively ............................................................. 30
4.5.6 Impact of biogas on creating employment opportunities ............................................. 31
4.6 Environmental impacts of biogas technology ........................................................................ 32
4.7 Users level of satisfaction from their biogas plant and its services ........................................ 33
5. CONCLUSION AND RECOMMENDATION ............................................................................. 35
5.1 Conclusion ............................................................................................................................. 35
5.2 Recommendations .................................................................................................................. 36
Annexes .............................................................................................................................................. 38
1. References.............................................................................................................................. 39
2. Data collection tools .............................................................................................................. 40
3. Survey Methodology .............................................................................................................. 54
4. List of surveyed biogas users ................................................................................................... 1
iii
List of tables
Table 1: Sample sizes by survey woredas................................................................................ 10
Table 2: Number of family members by age and sex .............................................................. 12
Table 3: Number of livestock .................................................................................................. 13
Table 4: Sources of information about biogas ......................................................................... 16
Table 5: Description of biogas plants ...................................................................................... 19
Table 6: Amount of input feeding at a time by biogas plant size ............................................ 24
Table 7: Amount of biogas co-products................................................................................... 25
Table 8: Impact of biogas on agricultural productivity ........................................................... 30
Table 9: Employment opportunities created as a result of biogas ........................................... 31
Table 10: Households' biomass usage ..................................................................................... 33
List of figures
Figure 1: Ethiopia: the country and regional states ................................................................... 3
Figure 2: Sex of respondents, by region .................................................................................. 11
Figure 3: Households' major income sources .......................................................................... 12
Figure 4: Households' main water sources .............................................................................. 14
Figure 5: Households electric connectivity.............................................................................. 15
Figure 6: Decision to install biogas made ................................................................................ 17
Figure 7: Household loan and repayment status ...................................................................... 18
Figure 8: Functionality status of biogas plants ........................................................................ 20
Figure 9: Problems affecting biogas functionality ................................................................... 21
Figure 10: Reasons of non-functionality of biogas plants ....................................................... 22
Figure 11: Frequency, households feed thier biogas ............................................................... 24
Figure 12: Types of after-sale services obtained ..................................................................... 27
Figure 13: Changes in household health status ........................................................................ 28
Figure 14: Household members who used to collect firewood and animal dung .................... 29
Figure 15: Impact of organic fertilizer ..................................................................................... 31
Figure 16: Household energy sources before the biogas ......................................................... 32
Figure 17: Users' level of satisfuction from biogas services ................................................... 34

iv
Acronyms
ABPP Africa Biogas Partnership Programme
BCE Biogas Construction Enterprises
BUS Biogas Users’ Survey
CDM Clean Development Mechanism
CRGE Climate Resilient Green Growth
EREDPC Ethiopian Rural Energy Development and Promotion Centre
HH/s Household/s
Hivos Humanist Institute for International Development Cooperation
KG Kilogrammes
MEA Mining and Energy Agency
MFIs Micro-finance Institutions
MoWIE Ministry of Water, Irrigation & Energy
NBPCU National Biogas Programme Coordination Unit
NBPE National Biogas Programme of Ethiopia
NBPE+ Biogas Dissemination Scale-Up Program
PAV Production, Administration & Verification
PID Program Implementation Document
PoA Programme of Activities
RBPCU Regional Biogas Programme Coordination Unit
SLM Sustainable Land Management
SNNPR Southern Nations, Nationalities and Peoples’ Region
SNV Netherlands Development Organization
TVET Technical and Vocational Education and Training
v
EXECUTIVE SUMMARY
In view of the fact that biogas is one of the alternative renewable energy sources, the Ethiopian
government had launched consecutive 5-year biogas programmes since 2009 with the aim of
promoting biogas energy for domestic uses. Biogas Dissemination Scale-up Program (NBPE+) was
introduced in April 2017 by SNV with the aim of ensuring continuity, scale-up and expansion of
efforts and achievements made under NBPE-I and NBPE-II. The overall objective is to improve the
living standards of farmers and their families in 8 regions of the country. Until April 11, 2019, a total
of 23, 802 household size bio-digesters were constructed.
The BUS mainly serves three purposes: (1) a basis for monitoring and evaluation of the effects of
biogas and bio-slurry use on households; (2) a basis to provide regular feedback for necessary
improvements or review of the programme or its approaches and activities and (3) it serves to
establish the woody biomass usage per household as per the guidelines of the Clean Development
Mechanism’s small-scale approved methodology.
This study focused on biogas uses that joined the program in the period 2015 – 2017 and employed
both quantitative and qualitative data collection methods. Quantitative information was primarily
collected form biogas users’ directly using structured questionnaire and direct observation techniques.
The study used Electronic Data Capturing (EDC) technique and a total of 200 biogas users were
interviewed in 16 woredas of eight zone administrations of the four survey regions, namely Tigray,
Amhara, Oromia and SNNP. Qualitative information was also collected from primary sources
including Focus Group Discussions (FGDs) and Key Informant Interviews (KIIs) as well as from
secondary sources such as documents review.
Survey Findings
Household characteristics
A total of 200 households were surveyed and out of these 92% are male-headed households; 7.5%
female headed households and 0.5% child-headed households. The average family size of surveyed
households is 7.31 with gender composition of male (3.81) and female (3.5). Agriculture is the
dominant sector which the livelihood of majority of surveyed communities based in. The majority of
respondents (97%) reported that agriculture is their household’s major source of income. Employment
activities, business such as petty trades and daily labour works are also practiced by members of
households. The average cattle holdings are 5.33 cow/oxen, 1.38 equines, 2.07 goats/sheep and 5.68
of calf, poultry, etc.
Majority of biogas users (36%) use lakes/rivers/ponds as the main source of water for household uses.
Households with water sources out of their compound, on average it takes about 16 minutes to reach
the nearest water sources. On average, 94.4% of households have a toilet in their compound and
among these, on average, 84% of toilets are connected to the biogas system. 44.5% houses have
electric connectivity to their houses, in which the majority (51.4) obtain electric from solar power.
Decision making process
Woreda energy offices and technicians are the well-known promoters of the biogas technology in
rural communities. Above 81% of respondents stated that they have heard about the technology for
the first time from woreda offices and technicians. Different driving motives were also mentioned by
respondents that inspire them to decide installing biogas plant for household uses. Need for lighting,
vi
cooking energy and organic fertilizer are the three most important factors behind installing biogas
plants by surveyed households with 91%, 87% and 78.5% proportion of respondents respectively.
Only 32% of biogas users from Tigray and SNNP regions took loans to partly finance their plant
construction.
Biogas functionality and service delivery performance
Households install biogas systems mainly for cooking, lighting and organic fertilizer. In this regard
the national average functionality rate is 79% with slight variations among survey regions. More
specifically, 30% of the systems are functioning without significant problem, 22% are functioning
with minor problems and other 27% are functioning, but with major problems. 21% of the plants are
found totally not functional. Most of the stated problems associated to mal-functionality of the biogas
plants include problems with appliances, pipes, fittings and valves, lack of skills, spare parts and
inputs, crack down of bio-digesters and absence of adequate after-sale services.
In survey areas, the majority of biogas users (45%) feed their plant once a day and 28% of them feed
their plant weekly on average. Other 22% of the users also feed their plant in two days. Only 5% of
surveyed households report that they feed their biogas twice a day with water and dung to generate
gas and bio-slurry. About 97% of households also reported that they use all available dungs to feed
their biogas. The amount of input (dung and water) that users feed their biogas plant at a time is low
compared to the recommended amount.
Users’ training and after-sale services
As clearly stated in the PID, training and after-sale services are integral part of the program for
smooth and effective implementation. Among surveyed biogas users about 65% of them reported that
they/member of their family have got trainings on biogas (mostly the post-construction orientations)
and masons and woreda technicians are those who deliver trainings/post-construction orientations.
About 84% of respondents have reported that they have received one or more types of after-sale
services after the construction of their biogas plant. However, significant share of biogas users who
received after-sale services were not satisfied with the services they received.
Socio-economic impacts of biogas technology
Small-scale biogas plants have a proven capacity of improving quality of life among rural
communities and help reduce global warming impacts if used appropriately. Overall, 89% of
respondents have reported that the health condition of their family members have improved after they
started using biogas energy. After the introduction of biogas technology in their household, 68% of
respondents stated that abuse and violence against women and girls has highly reduced. 93% of
respondents also reported that biogas has helped women to be involved in social and income
generating activities. Reduction in households’ monthly energy expenditure is also another benefit
users enjoy from their biogas plants. Out of the surveyed biogas users, 57% of them reported that their
monthly energy expenditure has reduced due to using biogas energy. On average, households have
saved about 110 ETB per month from their energy expenditure. By using biogas light, students have
got an opportunity to study during evening and night. 65% of respondents reported that children
begun to study in the evening and night which was not common in rural communities before the
installation of the biogas plant. As reported by survey respondents, the average study hours of
children in the evening/during the night has improved from about 2 hours and 30 minutes to 3 hours
and 20 minutes.
vii
Biogas technology and the organic fertilizer farmers obtain as co-product has improved users’
agricultural productivity from 17.58 quintals of product per hectare to 19.02 quintals of agricultural
product per hectare. Demand for chemical fertilizer has also significantly reduced from 105 kilogram
to 77.52 kilogram after the biogas. 67% of organic fertilizer users in their farm practice reported that
paste has reduced in their farm where they applied organic fertilizer and 84% of organic fertilizer
users stated that demand for chemical fertilizers has reduces significantly.
Environmental impact
It is also interesting that biogas has reduced households’ consumption of biomass which directly
contributes for environmental protection and related positive outcomes. Overall, weekly consumption
of firewood in survey areas is declined by 21% (from 73 kilograms to 60.5 kilograms per week). Due
to inability of the existing biogas plants to be used for baking injera, almost all of the respondents use
biomass as alternative source of energy along with the biogas. Households’ weekly demand for
charcoal had declined by above three folds (from 19 kilograms to 4.7 kilograms per week).
Conclusion
Biogas technology has significant potential to mitigate several problems related to ecological
imbalance, minimizing crucial fuel demand, improving hygiene and health, and thus, resulting in an
overall improvement in the quality of life in rural and semi-urban areas. In the study it is found that
biogas technology has brought significant positive changes in the socioeconomic conditions of rural
households and supports environmental protection efforts. It helped users to improve their health
condition, reduced women and children work burden allowed them to be involved valuable
economic/social activities. It also significantly reduced their vulnerability for violence and helped
children to study their education for longer time in the evening and during the night using biogas
light. Biogas has reduced expenditures households incur for energy as well as chemical fertilizer and
improved farmers’ agricultural productivity. It also reduced households’ woody biomass
consumption.
Recommendation
Information dissemination and awareness creation: as survey results revealed, information
dissemination efforts are insufficient and available information sources are very limited. It is thus
important to consider all available channels, especially with wider coverage such as national and local
mass media to promote the technology and build community awareness.
Users’ trainings are critical: the technology is generally new and the effort is to promote this new
technology in rural and semi-urban areas, where educated manpower is scarce. There is no also
accumulated/capitalized knowledge and experience regarding this technology at community level in
rural societies, because the technology is introduced very recently. Hence, due attention should be
given to pre-construction and post-construction trainings tailored with the specific needs of rural
communities. Refresher trainings and experience sharing visits must also be integral parts of the
users’ capacity building efforts.
Provide adequate after-sale services: no matter what the level of support from the government and
other stakeholders is, the performance of the biogas plants and their functionality ultimately depends
on the users’ commitment and capability to use the technology. However, considering the educational
level of family heads/family members in rural communities, biogas users can hardly address all the
viii
problems and issues emerged with their biogas system by themselves. So they need continuous
follow-up and support to make them effectively operate their biogas system and enjoy its benefits to
the maximum possible level.
Improve accessibility of spare parts and appliances: since the biogas sub-sector is underdeveloped
and at an infant stage in the country, so far it doesn’t develop the market that supply materials and
spare parts, which calls strong hands of the government and all relevant stakeholders to fill the market
gap. When the owners are not able to use their biogas for intended purposes properly (mostly due to
lack of materials and spare parts), they lack interest to maintain the functionality of their biogas and
gradually they might cease feeding and operating it. Hence, it is critical to find the mechanism
through which biogas-related materials and parts are accessible to rural communities easily.
Improve local infrastructure and capacity of technicians at woreda level: woreda technicians are the
most important actors in serving the biogas users at grassroots level, as they are at the lowest structure
of the program and have direct contact with biogas users. Capacity of woreda offices in terms of
logistics, structures and systems need to be strengthened. Existing technicians also need refresher
trainings skill enhancement exposures to better serve the biogas users.
Strengthen existing information and communication system: For such newly introduced technologies
with large expansion prospects, effective service delivery system and communication mechanisms are
required. Information must be collected continuously, analysed properly and utilized effectively,
especially at regional level. Appropriate and sufficient supervision and monitoring system should be
in place by SNV to make sure that the services provided in the field comply with the standards set at
the PID.
1
1. INTRODUCTION
1.1 Background
Building on its positive recent development record, Ethiopia intends to reach middle-income
status by 2025. As stated in the country’s development plants, (GTP-I and GTP-II), reaching
this goal will require boosting agricultural productivity, strengthening the industrial base, and
fostering export growth, which result in a sharp increase in GHG emissions and unsustainable
use of natural resources. To avoid such negative effects, the government has developed a
strategy to build a green economy. The draft National Energy Policy also envisioned ensuring
access to affordable, clean and modern energy for all citizens by 2025, which calls for
collaborated efforts of the government as well as local and international partners.
National Biogas Program of Ethiopia (NBPE) has been under implementation since 2009
with the aim of promoting domestic biogas and develops a commercially viable market for
biogas sector in the country. Ministry of Water, Irrigation & Electricity (MoWIE) is hosting
the program on behalf of the Government of Ethiopia and is implementing through the
regional energy bureaus of agencies, together with the Woreda energy offices and private
sector. The basic systems and capacities have been put in place that could enable for large
scale dissemination of bio-digesters throughout the country.
The first phase of the NBPE culminated on December 31st, 2013. Official sources have stated
that 8,161 plants in the targeted four large regions were built. The second phase of the NBPE was
implemented between 2014 and 2017 and aims to construct 20,000 additional biogas plants.
In 2014 alone, the government expects to build 3,600 bio-digesters in the four regions of
implementation. Biogas Dissemination Scale-up Program (NBPE+) was introduced in April
2017 by SNV with the aim of ensuring continuity, scale-up and expansion of efforts and
achievements made under NBPE-I and NBPE-II. The overall objective is to improve the
living standards of farmers and their families, in the Ethiopian regions of Afar, Amhara,
Benishangul-Gumuz, Gambela, Oromia, SNPPR, Somali and Tigray while reducing the over-
exploitation of biomass cover in the 8 regions and reducing GHG emissions.
The programme targets 36,000 rural low income families, who have some 4 cattle for dung
while they can spare a small piece of land and able to partially contribute with labour and
cash or credit for bio digester. NBPE+ is a five year program and will continue operating
until July, 2022. As NBPE II is still in progress and will continue to be so, NBPE+ operates
in a way that ensures complementarity, avoid duplication and create synergies, wherever
possible. A total of 21,735 household size bio-digesters are constructed till June 2018, under
the NBPE-I, NBPE-II and NBPE+ in 6 regions of Ethiopia. The market is gradually
developing, though private sector development is still in an infant stage.
The Biogas Users’ Survey (BUS) is part of the monitoring framework applied by the
programme providing relevant data to evaluate the impact of domestic biogas digester
installations as experienced or perceived by the users. A periodic Bio-digester Users’ Survey
(BUS) is therefore being carried out in the program to assess the socio-economic and
environmental impacts as well as other parameters to measure program effectiveness.

2
1.2 Objectives of BUS
The BUS will mainly serve three purposes: (1) a basis for monitoring and evaluation of the
effects of biogas and bio-slurry use on households as it provides benchmark data on potential
bio-digester users, on the expected benefits, as outlined above; (2) a basis to provide regular
feedback for necessary improvements or review of the programme or its approaches and
activities and (3) it serves to establish the woody biomass usage per household as per the
guidelines of the Clean Development Mechanism’s small-scale approved methodology.
Specifically this particular survey will have the following objectives:
a) Bio-digester functionality assessment: It is to determine proportion of the bio-digester
systems that are functional with various degree and the reasons of non-functionality.
b) Socio-economic impacts assessment:
a. Assessment of benefits and effects of biogas and bio-slurry on male and female
headed households, including on health, time saving, socialisation, education,
saving or income generation, etc.
b. Extent in improvement in health outcomes: reduced incidence of respiratory/eye
and other diseases related to fuels,
c. Extent in increase in crop yield and income or decreased cost from use and sale of
bio-slurry;
d. Extent in workload reduction, mostly for women & children, in terms of hours of
time saved per day; and
e. Number of direct employment generated (and percentage of total jobs generated for
women).
c) Local and global environmental impacts assessment: It is to assess the extent in
reduction in deforestation, in terms of reduced annual use of woody biomass or
firewood. For this, establish an annual average use of woody biomass before and after
the installation of bio-digesters, and hence determine the reduction in use of the
woody biomass. This will form the basis for calculation of reduction of Greenhouse
Gas (GHG) emissions, which is a separate task to be done by DBE with support from
the World Bank/CI-Dev.
d) Other Programme performances and parameters assessment:
a. Ratio of households installing bio-digester with credit from MFIs/cooperatives; and
b. Ratio of female headed and other disadvantaged households owning bio-digesters
with or without credit from MFIs/cooperatives;
c. Extent of users’ overall satisfaction from the programme;
d. If not satisfied, what are the issues (user training and after-sales service, user-
friendliness of the technology, behaviours of the public sector and private sector
actors, etc.); and
e. Percentage of bio-digesters with two bio-slurry pits.

3
2. REVIEW OF RELATED LITRATURE
2.1 Country Context
2.1.1 Background
Ethiopia is strategically located in the north-eastern part of Africa popularly known as "the
Horn of Africa". It shares boundary with the North and South Sudan on the west, Somalia
and Djibouti on the East, Eritrea on the North and northwest and Kenya on the South. It is a
country of great geographical
diversity. A large part of the country
comprises of high plateaus and
mountain ranges with precipitous
edges dissected by rushing streams.
As the country is located within the
tropics, its physical conditions and
variations in altitude have resulted in
great diversity of terrain, climate, soil,
flora and fauna.
The 1995 federal constitution
recognized nine regional states
(Tigray, Afar, Amhara, Oromia,
Somali, Benishangul-Gumuz, Southern Nations, Nationalities and Peoples (SNNPR),
Gambella, and Harari), all of which were given considerable autonomy. In addition to the
nine regions, there are two chartered cities-Addis Ababa, the federal capital, and Dire Dawa.
The nine regions are hierarchically divided into zones, woreda, special-woreda, and kebele,
the smallest City Administration administrative unit.
2.1.2 Socioeconomic condition
Ethiopia is the second largest populous country in Africa with 94 million population size
scattered over a 1.1 million square kilometre territory and 83.2% of the population resided in
rural areas (CSA, 2014). According to the same report, almost 50% of Ethiopia's population
is under the age of 18. In 2007, the literacy rate of the population above 15 years of age was
39.9% of the population (46.2% for male and 33.3% female). It is evident that remarkable
progress has been accomplished, especially in primary education, with a gross enrolment of
more than 90%. However, both, secondary and tertiary education, have a lower percentage of
enrolment with 37.2% and 8.2% respectively.
The lack of infrastructure is a significant burden for development, especially for the poorest
people. According to Stevenson et al (2012), 77.3% of the Ethiopian population lacks access
to clean water. Moreover, only 1% of the Ethiopian households have a tap inside the house,
and 54.5% of the households get their water from unprotected wells or springs or directly
from rivers or lakes. Furthermore, by 2007, 75.8% of the rural households did not have a
toilet facility (CSA, 2010).
Figure 1: Ethiopia: the country and regional states

4
In order to improve economic and social performance, the Federal Democratic Republic of
Ethiopia (FDRE) government has launched a set of periodical national programs to set the
guidelines to steer its development. These are: Sustainable Development and Poverty
Reduction Program (SDPRP) from 2002/03 to 2004/05; Plan for Accelerated and Sustained
Development to End Poverty (PASDEP) from 2005/06 to 2009/10; Growth and
Transformation Plan (GTP) from 2010/11 to 2014/15 and the current Growth and
Transformation Plan II (GTP-II) from 2015/16 to 2019/20. Complementary to the
abovementioned development programs, in 2011, the Ethiopian Government also launched
the Climate-Resilient Green Economy (CRGE) with the aim to protect the country from the
effects of climate change while developing a green economy (Federal Democratic Republic
of Ethiopia, 2011).
Ethiopia has experienced a sustained economic growth over the last years. Ethiopia’s
economy is mainly based in services and agriculture, which contributed to 36.9.1% and
34.2% of the Gross Domestic Product (GDP), respectively by 2017. The share of industry
sector (including construction) rose to 22.9% of GDP in the same year (World Bank, 2018).
More than two decades ago, agriculture was the dominant economic activity (with a 68.9%
contribution to the GDP in 1992). Nonetheless, the service sector has been gaining terrain
over this time, thus becoming the main economic activity of Ethiopia. Meanwhile, the
manufacturing sector has remained as a residual activity, with an average contribution to the
GDP of 5.5% over this period.
2.1.3 Agricultural and environmental landscape
Agriculture becomes the second main economic activity next to the service sector in Ethiopia,
accounting for 34.2% of the GDP by 2017 (World Bank, 2018). The country is believed to
have one of the largest livestock populations in Africa (CSA, 2012). The majority of the
agricultural production in Ethiopia is performed at a household level and farming is generally
characterized by the combination of crop production and livestock breeding. Furthermore,
these agricultural households are characterized by limitedly small land tenure and it is
common for all the household members to contribute to the farm’s activities. The rural
holdings account for 96.8% of the total agricultural holdings and the vast majority (75.1% of
the rural households) mixed their activities between crops and livestock (CSA, 2013).
Ethiopian farmers employ different practices in order to improve their crops’ productivity.
The most commonly used practice is to apply fertilizers. These synthetic fertilizers are
applied to almost half of the cropland area and natural fertilizers are only applied to 10.2% of
this land. Only 1.8% of the total cropland area employs irrigation practices. (CSA, 2013).
One of the most worrying environmental trends in Ethiopia is the depletion of the forest
coverage due to the extensive use of fuel wood. In 2008, forest coverage accounted for 2.7%
of the total area of Ethiopia, being 40% more less than 35 years ago (Boers et al., 2008). The
largest amount of forest is concentrated in the west of Ethiopia. However, most of the
remaining forest has already been intervened and the percentage of untouched forest is
residual.
5
2.1.4 Energy Sector
The energy sector in Ethiopia is mainly based on biomass. 92.9% of the primary energy
consumption comes from biofuels and waste; 81.2% of which is supplied by woody biomass
(Wolde-Ghiorgis, 2002). Furthermore, 93.5% of the primary energy consumption holds place
at the household level. Therefore, when looking at the Ethiopian energy balance, it is valid to
assume that the majority of the energy is supplied by fuel wood and that it is predominately
consumed by rural households.
Imported oil, electricity and biofuels and waste are the major energy sources in Ethiopia
which represent 6.0%, 1.1% and 92.9%, respectively. Hydroelectric plants, mostly supply the
electricity that is required in Ethiopia. According to World Bank (2018), electricity access
has reached 33.4% of the Ethiopian population (80.1% urban and 20.2% rural) in 2015.
Specifically for biomass, 81.2% of the biomass that is consumed comes from woody biomass
(especially firewood), followed by dung cakes and crop residue with a contribution of 9.1 and
8.1%, respectively. Other types of biomass are charcoal, bagasse and bio-briquettes (Wolde-
Ghiorgis, 2002).
At the household level, 98.6% of the energy is supplied by biomass (IEA, 2014c). But, how is
it consumed? According to Gebreegziabher (2007, 2014), between 50 and 60% of household
energy demand is used to bake injera; a traditional fermented flatbread with a sour taste.
Injera is baked on large batches using a clay plat covered with a lid made out of straw and
dried cow manure (Simons, 2012). The baking process is highly inefficient and it
predominantly uses a significant amount of firewood (Esthete et al., 2006). The rest of the
energy is used for cooking other foods and for lighting.
2.1.5 The Biogas sub-sector
Biogas was first introduced in Ethiopia by Ambo Agricultural College around 1957 to supply
the energy for welding agricultural tools. During the last two decades, around 1,000 biogas
plants were deployed in Ethiopia with sizes ranging between 2.5 and 200 cubic meters for
households, communities and institutions (Boers & Esthete, 2008). Between 1999 and 2002,
Christopher Kellner, a German biogas expert, built 60 fixed-dome biogas plants through a
bottom-up implementation approach. This deployment was partly done based on an
Ethiopian-German development project named “Land Use Planning and Resource
Management, Oromia” (LUPO). Since 2000, LEM-Ethiopia (a local NGO) started an
awareness and promotion program with latrine-fed biogas digester in schools and households
in regions like Amhara, Oromia and SNNPR (Worku, 2014).
In 2006, a technical team integrated by experts from the Ethiopian Rural Development and
Promotion Centre (EREDPC) and SNV conducted a feasibility study to determine biogas
potential in four Regions of Ethiopia which accounted for the largest number of inhabitants
and livestock (Amhara, Oromia, SNNPR and Tigray). In 2015, another Report on Biogas
Technical Feasibility study on biogas was conducted for Afar, Benishangul-Gumuz,
Gambella and Somali Regions of Ethiopia.

6
2.2 National Biogas Program of Ethiopia (NBPE)
Inspired from the positive environment with regard to domestic biogas in Africa and with the
aim to up-scale domestic biogas in Ethiopia, the Ethiopian National Biogas Program (NBPE)
was developed and launched for a first stage of implementation between 2008 and 2013.
From February to July 2007, a team from SNV and EREDPC conducted an extensive
consultation process with relevant stakeholders in order to develop a Project Implementation
Document or PID. In the end, the consensus was set to build 14,000 family-sized biogas
plants between 2008 and 2013 and the NBPE was launched. The first years of
implementation of the NBPE faced several obstacles in deploying the program. It is important
to understand that by then, biogas was considered as new technology in the rural context and
the response of the demand was slower than expected. The slow development of the NBPE
was reflected in the small amount of biogas plants that were built. Consequently, in 2010,
during an intermediate revision of the NBPE, the African Biogas Partnership Programme
(ABPP) decided to reduce the initial target from 14,000 to 10,000 biogas plants by end of the
first phase in 2013.
2.2.1 National Biogas Program of Ethiopia Phase I (NBPE-I)
The first phase of the Program was launched as National Biogas Program of Ethiopia – Phase
I (NBPE-I) in 2009 and run for five consecutive years until 2013. This program targeted to
install 10,000 bio-digesters in the four large regions of the country, namely Amhara, Oromia,
SNNP and Tigray. Program participants were households with four or more local breed cattle
(two in the case of hybrid), residing within thirty minutes walking distance from a water
source, and willing to pay 60% of the investment cost in cash or through credit in the
installation of the bio-digester with an optional toilet connection. The Ethiopian Government
and donors covered the remaining 40% of the construction cost as an investment incentive.
Meanwhile, government actively supports the dissemination of biogas technology through
policy support and promotion, and as a result this first phase of the NBPE has enabled the
construction of over 8,161 plants in the targeted four large regions.
2.2.2 National Biogas Program of Ethiopia Phase II (NBPE-II)
National Biogas Program of Ethiopia Phase II (NBPE-II) has also been under implementation
since 2014 with the aim of improving the livelihood and quality of life of rural households in
Ethiopia through the exploitation of market and non-market benefits of domestic biogas. This
is intended to be realized through replacement of unsustainable utilization of wood and
charcoal for cooking and lighting; the application of high-value organic fertilizer from the
bio-slurry; and improvement of the overall economic situation of rural households. The
specific objectives of NBPE-II project are to (1) attract and strengthen the capacity of
relevant national and regional institutions and organizations in developing and promoting
bio-digester technology as clean source of energy for cooking and lighting and (2) ensure the
continued effective and efficient operation of the bio-digesters installed under NBPE-I and in
NBPE-II; and in the process, maximizing the benefits of all bio-digesters installed. The
program targeted the market-driven dissemination of 20,000 high quality biogas installations
7
to provide households with access to clean energy for cooking and lighting and promote the
use of bio-slurry as organic fertilizer in a scientific way. The Program continues running until
March, 2019 and under this program alone, additional 12,538 bio-digesters are installed up to
February 2019.
2.2.3 Biogas Dissemination Scale-up Program (NBPE+)
Biogas Dissemination Scale-up Program (NBPE+) has also been born in April 2017 with the
aim of ensuring continuity, scale-up and expansion of efforts and achievements made under
NBPE-I and NBPE-II. The overall objective is to improve the living standards of farmers and
their families, in the Ethiopian regions of Afar, Amhara, Benishangul-Gumuz, Gambela,
Oromia, SNPPR, Somali and Tigray while reducing the over-exploitation of biomass cover in
the 8 regions and reducing GHG emissions. By developing a viable bio-digester sector
embedded in an enabling institutional and policy environment, the programme also aims to
contribute to increased economic and business development (particularly in rural areas) and
the longer term objective of supporting the transition in Ethiopia to a more sustainable energy
mix and corresponding socio-economic and environmental benefits. The programme targets
36,000 rural low income families, who have some 4 cattle for dung while they can spare a
small piece of land and able to partially contribute with labour and cash or credit for bio
digester. NBPE+ is a five year program and will continue operating until July, 2022. As
NBPE II is still in progress and will continue to be so, NBPE+ operates in a way that ensures
complementarity, avoid duplication and create synergies, wherever possible.
A total of 23,802 household size bio-digesters are constructed till April 11, 2019, under the
NBPE-I, NBPE-II and NBPE+ in eight regions of Ethiopia. The market is gradually
developing, though private sector development is still in an infant stage. The following chart
presents the trend of household size bio-digester installation in Ethiopia:
2.2.4 Institutional setup
The NBPE consists of the main implementation framework for the dissemination of domestic
biogas in Ethiopia, as its initial structure was developed in 2008 where multiple actors were
assigned with specific roles and responsibilities. However, since then, the implementation
structure of the NBPE has changed.
The NBPE was led at a Federal level by the EREDPC which was part of the former Ministry
of Mines and Energy. A National Biogas Coordination Office (NBPCO) was created under
the supervision of the EREDPC. Furthermore, in each of the regions Regional Biogas
Coordination Offices (RBCO) were established. Moreover, the implementation of the NBPE
is done at local level in coordination with the Woreda Administration and in collaboration
with the private sector, consisting of individual masons that are trained by the NBPE. The
role of SNV has been to provide technical assistance at a federal and regional level on topics
such as the training of technicians, bio-slurry promotion and extension and private sector
development.
8
3. SURVEY METHODOLOGY
3.1 Survey Regions
The 2019 biogas users’ survey was conducted in the four large areas in which the program is
being implemented, namely, Tigray, Amhara, Oromia and SNNP regional states.
3.1.1 Tigray Region
Tigray Region lies in the northernmost part of Ethiopia. The region is bordered by Eritrea in
the north, Sudan in the west, Afar region in the East and Amhara region in the south west.
The region is sub divided into seven administrative zones and 52 woredas (districts). Tigray
has an estimated area of 53,638 square kilometres and a total population of 5,056,000 (CSA
2007 census projected for 2015). Over 80 % of the population resides in rural areas whose
livelihoods depend on subsistence farming. In recent years, the industry and service sectors
are increasingly becoming important. The region has an estimated cattle population of
2,665,129 with average cattle holding of 4.8 per household.
3.1.2 Amhara Region
Amhara Region is located in the north-western part of the country and bordered with Tigray
region in the north, Afar region in the east, Oromia region in the south and Benishangul-
Gumuz region in the south-west. The region consists of 10 administrative zones, one special
zone, 105 woredas, and 78 urban centres. According to the 2007 Census, the region had a
total population of 17,221,976 projected to grow to 20.7 million in 2016. Agriculture is the
dominant sector which absorbs about 90 % of the population and generates about 70 % of the
regional GDP. The estimated cattle population of the region is 10,275,527 with 4.0 average
cattle holding per household.
3.1.3 Oromia Region
Oromia region sprawls over the largest part of the country and at present consists of 12
administrative zones and 180 woredas. Oromia region borders Afar, Amhara and
Benshangul-Gumuz regions in the north, Kenya in the south, Somali region in the east, Sudan
and Benishangul-Gumuz region in the west, SNNP and Gambella region in the south.
According to the 2007 Census, the regional population size was 26,993,933 which is
projected to reach 34.6 million in 2016. In the region, agriculture is the dominant economic
sector in terms of generating employment as well as its share in the regional GDP. In the
region, an estimated amount of 18,575,227 cattle population exists. The average cattle
holding per household is 5.2.
3.1.4 SNNP Region
The Southern Nations, Nationalities and People's region (SNNP) is located in the south west
Ethiopia. It borders Kenya to the south and South Sudan to the southwest. The total area of
the region is approximately 118,000 square kilometres. The region is divided into nine zones,
72 woredas and five special woredas. Population density is about 151 people per square
9
kilometre; making the region one of the most populous parts of the country. An estimated
88.9 per cent of the total population lives in rural areas. The region is home to 56 ethnic
groups, with their own distinct geographical locations, languages, cultures and social
identities. According to the 2007 Census, the region’s population was 14.93 million and
estimated to reach 19.53 million in 2016. The region has an estimated cattle population size
of 8,815,689 (with average cattle holding of 4.4 per household).
3.2 Survey Design
3.2.1 Quantitative research design
According to project documents, a total of 7,802 bio-digesters were constructed in the period
2015 – 2017 which constitute the survey population in targeted regions. From this population
size a representative samples were drawn. The sample size determination formula used for
the purpose of this study is:
[
]
where n is the sample size from the population, Z is statistical value of Z for a level of
significance, P is the degree of variability, d is the measure of precision and p is the estimated
male-headed and female-headed ratio of households.
By inserting the value of our parameters we determined (90% CI, 0.5 P and 5.70 d), it gives
total sample size of 200. Respondents were selected through a computerised multi-tier
random sampling technique per region.
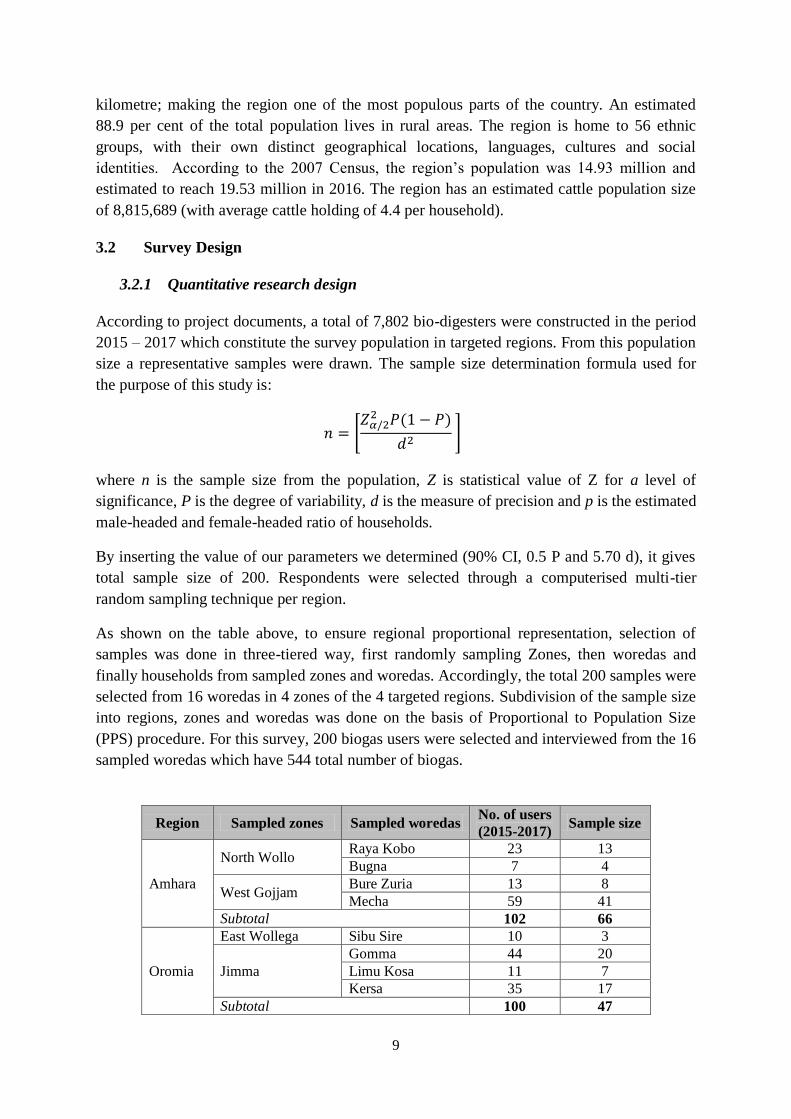
As shown on the table above, to ensure regional proportional representation, selection of
samples was done in three-tiered way, first randomly sampling Zones, then woredas and
finally households from sampled zones and woredas. Accordingly, the total 200 samples were
selected from 16 woredas in 4 zones of the 4 targeted regions. Subdivision of the sample size
into regions, zones and woredas was done on the basis of Proportional to Population Size
(PPS) procedure. For this survey, 200 biogas users were selected and interviewed from the 16
sampled woredas which have 544 total number of biogas.
Region Sampled zones Sampled woredas No. of users
(2015-2017) Sample size
Amhara
North Wollo Raya Kobo 23 13
Bugna 7 4
West Gojjam Bure Zuria 13 8
Mecha 59 41
Subtotal 102 66
Oromia
East Wollega Sibu Sire 10 3
Jimma
Gomma 44 20
Limu Kosa 11 7
Kersa 35 17
Subtotal 100 47

10
Tigray
SE Tigray
Enderta 111 22
Hintalo 90 17
Degua Temben 22 3
West Tigray Wolkayit 3 2
Subtotal 226 44
SNNP
Kembata Tembaro
Hadero 71 26
Angecha 12 5
Kacha Birra 27 10
Gedeo Wonago 6 2
Subtotal 116 43
Total 544 200
Table 1: Sample sizes by survey woredas
3.2.2 Qualitative research activities
The qualitative approach describes and explains study phenomena in detail, based on a
limited number of observations. Thematic analysis of the qualitative data was conducted
throughout the survey. At the end, qualitative findings were discussed in the context of the
quantitative outcomes to help explain converging and diverging information and contributing
to the validation of results. For this study, in each survey region, two key informants
interviews, and 1 focus group discussion were held. Data from qualitative tools were used to
obtain information from within a community and to produce a valid estimate of the target
group’s opinion with regard biogas.
Key Informant Interviews (KIIs): A total of eight KIIs conducted with office representatives
from RBPCUs, Agriculture Office, TVET, Rural Technology Office, Women and Children’s
Affairs Office, Environmental Protection Office, MFI and Mason. KIIs with these sector
offices and stakeholders are conducted at woreda level except for RBPCU that exists only at
regional level.
Focus Groups Discussions (FGDs): a total of 4 focus group discussions were conducted with
biogas users in selected woredas of survey regions. The discussions were guided by FGD
guideline prepared in advance and facilitated by skilled moderators.
3.2.3 Data collection process
Both quantitative and qualitative data were collected by experienced and well-trained data
collectors. As recommended in the ToR, a total of 8 enumerators to conduct the quantitative
survey and 4 qualitative data collectors to facilitate FGDs and conduct KIIs were employed.
Sex of data collectors was also duly considered to capture gender aspects accurately, and to
ensure women feel free to voice their views and opinions. All data collectors were also fluent
in the language of the survey areas. Data collectors travelled in a team of three so that they
help each other and quality is maintained. The quantitative data was collected using
Electronic Data Capturing Method (EDCM) and to this effect, smart phones with well-
developed survey application (Akvo flow) were employed.
11
4. SURVEY FINDINGS
4.1 Household characteristics
4.1.1 Respondents’ profile
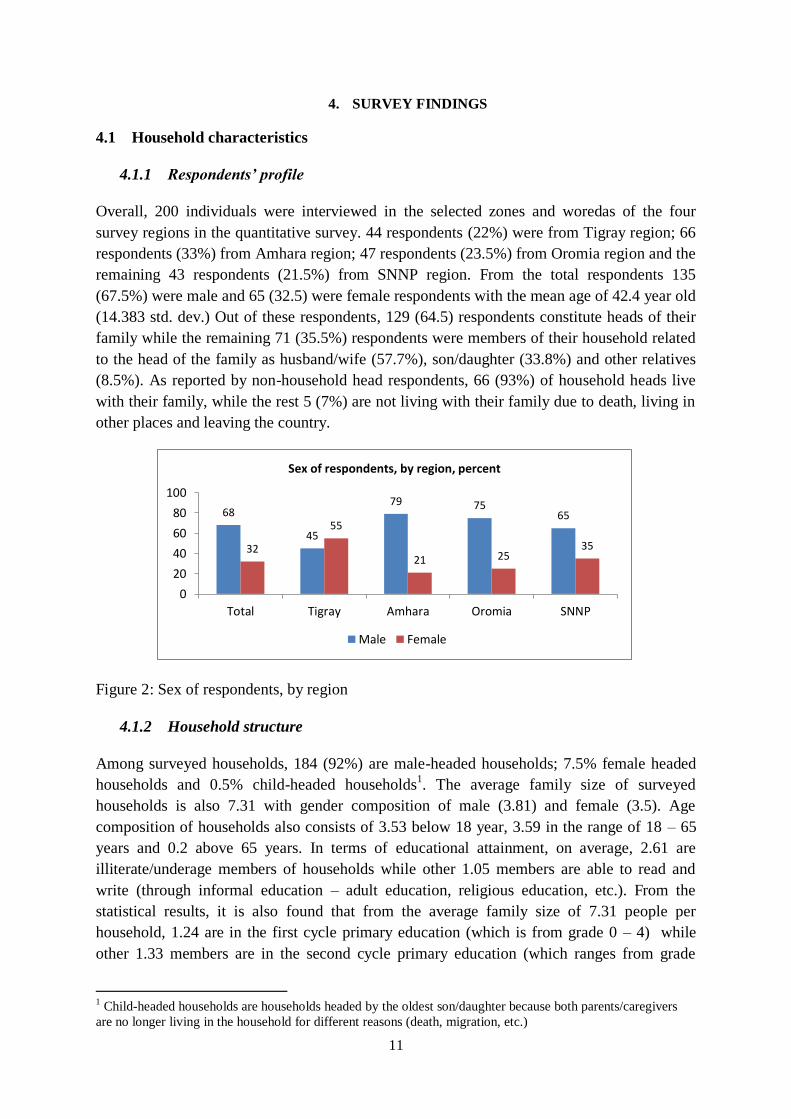
Overall, 200 individuals were interviewed in the selected zones and woredas of the four
survey regions in the quantitative survey. 44 respondents (22%) were from Tigray region; 66
respondents (33%) from Amhara region; 47 respondents (23.5%) from Oromia region and the
remaining 43 respondents (21.5%) from SNNP region. From the total respondents 135
(67.5%) were male and 65 (32.5) were female respondents with the mean age of 42.4 year old
(14.383 std. dev.) Out of these respondents, 129 (64.5) respondents constitute heads of their
family while the remaining 71 (35.5%) respondents were members of their household related
to the head of the family as husband/wife (57.7%), son/daughter (33.8%) and other relatives
(8.5%). As reported by non-household head respondents, 66 (93%) of household heads live
with their family, while the rest 5 (7%) are not living with their family due to death, living in
other places and leaving the country.
Figure 2: Sex of respondents, by region
4.1.2 Household structure
Among surveyed households, 184 (92%) are male-headed households; 7.5% female headed
households and 0.5% child-headed households1. The average family size of surveyed
households is also 7.31 with gender composition of male (3.81) and female (3.5). Age
composition of households also consists of 3.53 below 18 year, 3.59 in the range of 18 – 65
years and 0.2 above 65 years. In terms of educational attainment, on average, 2.61 are
illiterate/underage members of households while other 1.05 members are able to read and
write (through informal education – adult education, religious education, etc.). From the
statistical results, it is also found that from the average family size of 7.31 people per
household, 1.24 are in the first cycle primary education (which is from grade 0 – 4) while
other 1.33 members are in the second cycle primary education (which ranges from grade
1 Child-headed households are households headed by the oldest son/daughter because both parents/caregivers
are no longer living in the household for different reasons (death, migration, etc.)
68
45
79 75 65
32
55
21 25 35
0
20
40
60
80
100
Total Tigray Amhara Oromia SNNP
Sex of respondents, by region, percent
Male Female

12
levels 4 – 8). Others (0.75 people per household) are found in the grade levels of 8 – 12. Only
few (0.39 members of family per household) have attended education above grade 12.
Region
Number of family members by age and sex (average)
Below 18 years Ages 18 – 65 Above 65 Total
family size Male Female Male Female Male Female
Tigray 1.95 1.89 1.57 1.41 .07 .09 6.98
Amhara 1.91 1.55 2.00 1.77 .14 .14 7.50
Oromia 1.53 1.68 1.70 1.66 .13 .06 6.77
SNNP 1.79 1.84 2.26 1.93 .07 .05 7.93
Total 1.81 1.72 1.89 1.70 .11 .09 7.31
Table 2: Number of family members by age and sex
4.1.3 Livelihood
Agriculture is the dominant sector which the livelihood of majority of surveyed communities
based in. The majority of respondents (97%) reported that agriculture is their household’s
major source of income. In the surveyed households, some members also earn income from
employment activities, own business such as petty trades and daily labour works to support
household livelihoods. Next to agriculture, small business activities the second important
economic activities followed by daily labour works. Some of respondents from Tigray,
Oromia and SNNP regions reported that agriculture is not among the major income sources
of their household. However, they still keep animals, which is the basic requirement for
biogas installation and operation. Exceptionally, in Tigray region, 61.4% of respondents have
reported that daily labour activities are among the major sources of income for their family. It
is mainly attached with availability of commercial farms and high labour demand from the
industrial sector in the region.
Figure 3: Households' major income sources
97 96 100 98 93
7 7 2 6 16 17
2 6
38 23
15
61
2 2 3 11
0
20
40
60
80
100
120
Total Tigray Amhara Oromia SNNP
Households' major income sources
Agriculture Employed Own business Daily labor Other

13
4.1.4 Animal holdings
For proper feeding and effective operation of the biogas plants, it is recommended biogas
users to own certain number of cattle to get the minimum required amount of input.
According the Program Implementation Document (PID) of the National Biogas Program of
Ethiopia (NBPE) the minimum number of cattle required for 4M3 biogas plant is 4, while the
number increases to 6, 8 and 10 cattle for 6M3, 8M
3 and 10M
3 biogas plants respectively.
Looking into the statistical results from the quantitative data regarding households’ cattle
holdings, the average is 5.33 cow/oxen, 1.38 equines, 2.07 goats/sheep and 5.68 of calf,
poultry, etc. Biogas users from Oromia and Amhara regions have the average number of
cattle above the minimum requirements for the minimum plant size. Considering only large
animals (cow, oxen and equines), the average number of cattle surveyed biogas users possess
seems inadequate, especially for biogas plants larger than 4M3. The relationship between
households’ cattle holdings and plant feeding/plant performance will be investigated further.
Region Number of livestock (Mean)
Cow/oxen Sheep/goats Equines Poultry
Tigray 3.33 2.09 1.36 6.16
Amhara 5.47 1.74 .49 5.55
Oromia 8.10 3.33 3.62 5.95
SNNP 3.89 1.12 .31 5.14
Total 5.33 2.07 1.38 5.68
Table 3: Number of livestock
4.1.5 Access to water
Access to clean water is also another dimension of effective biogas operation which should
be considered duly in the decision making process to own biogas plant. The minimum daily
water requirement ranges from 20 – 50 litres depending on the size of the biogas. For the 4M3
biogas plant, the minimum daily water requirement is 20 litres, for the 6M3 30 litres, for 8M
3
40 litres and for 10M3 50 litres. Selection of potential biogas users is therefore made on the
basis of households’ access to the daily water requirement in a maximum of 15 minutes
waking distance radius. Accordingly, the study investigated biogas users’ access to water to
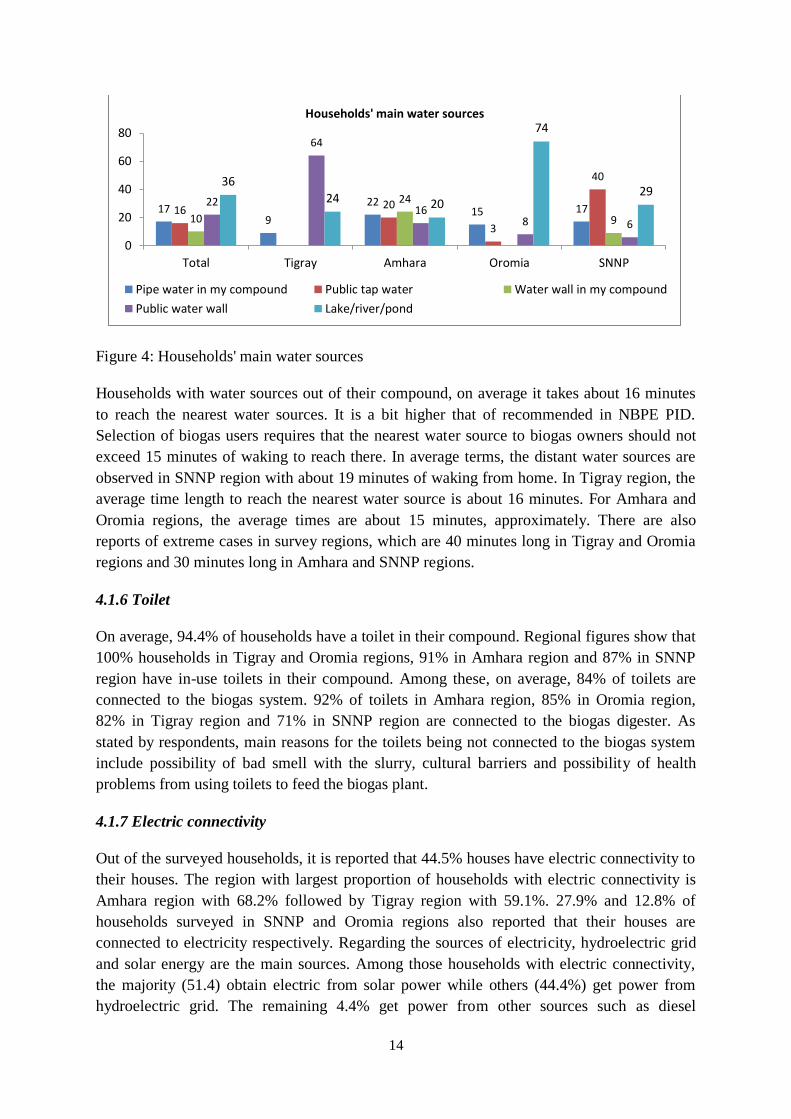
feed their plant. As the statistical results show, majority of biogas users (36%) use
lakes/rivers/ponds as the main source of water for household uses. 22% of respondents have
also reported that public water walls are their main water sources. As per the statistical
findings, about 17% of biogas users have pipe water in their compound and other 10% of
users have water wall in their compound. The remaining 16% of households use public tap
water for their households water need. In Tigray region public water wall is the main water
source for about 64% of surveyed households. In Amhara region the main source of water is
water walls in users’ compound. Above 74% of biogas users in Oromia region get water from
lakes/rivers/ponds. 40% of surveyed households also use public tap water as the main source
of water for their household uses.
14
Figure 4: Households' main water sources
Households with water sources out of their compound, on average it takes about 16 minutes
to reach the nearest water sources. It is a bit higher that of recommended in NBPE PID.
Selection of biogas users requires that the nearest water source to biogas owners should not
exceed 15 minutes of waking to reach there. In average terms, the distant water sources are
observed in SNNP region with about 19 minutes of waking from home. In Tigray region, the
average time length to reach the nearest water source is about 16 minutes. For Amhara and
Oromia regions, the average times are about 15 minutes, approximately. There are also
reports of extreme cases in survey regions, which are 40 minutes long in Tigray and Oromia
regions and 30 minutes long in Amhara and SNNP regions.
4.1.6 Toilet
On average, 94.4% of households have a toilet in their compound. Regional figures show that
100% households in Tigray and Oromia regions, 91% in Amhara region and 87% in SNNP
region have in-use toilets in their compound. Among these, on average, 84% of toilets are
connected to the biogas system. 92% of toilets in Amhara region, 85% in Oromia region,
82% in Tigray region and 71% in SNNP region are connected to the biogas digester. As
stated by respondents, main reasons for the toilets being not connected to the biogas system
include possibility of bad smell with the slurry, cultural barriers and possibility of health
problems from using toilets to feed the biogas plant.
4.1.7 Electric connectivity
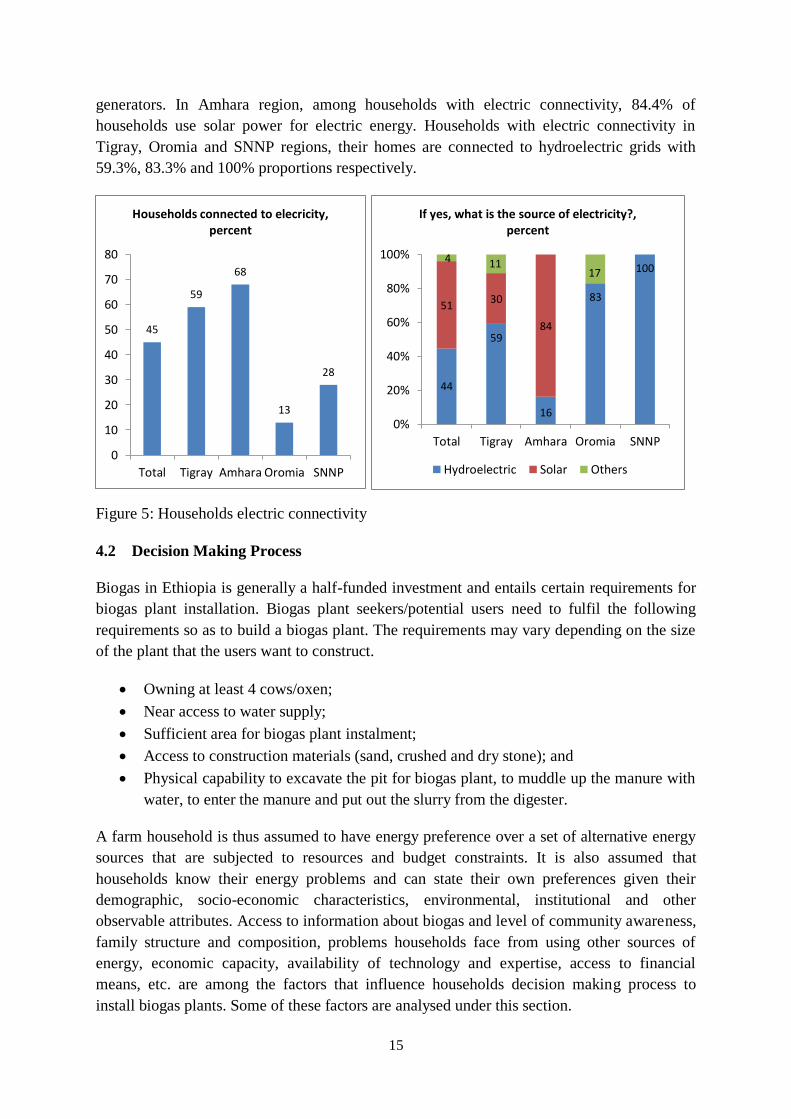
Out of the surveyed households, it is reported that 44.5% houses have electric connectivity to
their houses. The region with largest proportion of households with electric connectivity is
Amhara region with 68.2% followed by Tigray region with 59.1%. 27.9% and 12.8% of
households surveyed in SNNP and Oromia regions also reported that their houses are
connected to electricity respectively. Regarding the sources of electricity, hydroelectric grid
and solar energy are the main sources. Among those households with electric connectivity,
the majority (51.4) obtain electric from solar power while others (44.4%) get power from
hydroelectric grid. The remaining 4.4% get power from other sources such as diesel
17 9
22 15 17 16 20
3
40
10
24
9
22
64
16 8 6
36
24 20
74
29
0
20
40
60
80
Total Tigray Amhara Oromia SNNP
Households' main water sources
Pipe water in my compound Public tap water Water wall in my compound
Public water wall Lake/river/pond
15
generators. In Amhara region, among households with electric connectivity, 84.4% of
households use solar power for electric energy. Households with electric connectivity in
Tigray, Oromia and SNNP regions, their homes are connected to hydroelectric grids with
59.3%, 83.3% and 100% proportions respectively.
Figure 5: Households electric connectivity
4.2 Decision Making Process
Biogas in Ethiopia is generally a half-funded investment and entails certain requirements for
biogas plant installation. Biogas plant seekers/potential users need to fulfil the following
requirements so as to build a biogas plant. The requirements may vary depending on the size
of the plant that the users want to construct.
Owning at least 4 cows/oxen;
Near access to water supply;
Sufficient area for biogas plant instalment;
Access to construction materials (sand, crushed and dry stone); and
Physical capability to excavate the pit for biogas plant, to muddle up the manure with
water, to enter the manure and put out the slurry from the digester.
A farm household is thus assumed to have energy preference over a set of alternative energy
sources that are subjected to resources and budget constraints. It is also assumed that
households know their energy problems and can state their own preferences given their
demographic, socio-economic characteristics, environmental, institutional and other
observable attributes. Access to information about biogas and level of community awareness,
family structure and composition, problems households face from using other sources of
energy, economic capacity, availability of technology and expertise, access to financial
means, etc. are among the factors that influence households decision making process to
install biogas plants. Some of these factors are analysed under this section.
45
59
68
13
28
0
10
20
30
40
50
60
70
80
Total Tigray Amhara Oromia SNNP
Households connected to elecricity, percent
44
59
16
83
100
51 30
84
4 11 17
0%
20%
40%
60%
80%
100%
Total Tigray Amhara Oromia SNNP
If yes, what is the source of electricity?, percent
Hydroelectric Solar Others

16
4.2.1 Access to utilization of information about biogas
Household decision making process to install biogas plant at household level starts with
getting information about the new system and their perception about the pros and cons of the
technology. There are actually several stakeholders from federal to kebele (the lowest
administrative unit) level structures responsible to promote the technology to rural
communities. These actors include government institutions (federal, regional, zone, woreda
and kebele authorities and offices), NGOs, the private sector (masons, BCEs), the mass
media microfinance institutions and cooperatives.
In survey districts, biogas users were asked about where they heard about the biogas for the
first time and gave their responses. According to the results, woreda energy offices and
technicians are the well-known promoters of the biogas technology in rural communities.
Above 81% of respondents stated that they have heard about the technology for the first time
from woreda offices and technicians. Masons (52.5%) and kebele extension workers (39.5%)
are also important information providers about the biogas in such communities. Other biogas
users also play key role in dissemination of information about biogas technology as 30.5% of
interviewed respondents reported that they got information about biogas from other users.
Significant proportion of respondents (22.5%) also heard about biogas from community
gatherings and village meetings.
Sources of information Tigray Amhara Oromia SNNP Total
Promotional brochure/poster 9.1% 6.1% 0.0% 2.3% 4.5%
Village meetings 56.8% 7.6% 19.1% 14.0% 22.5%
Woreda technicians/DAs 81.8% 74.2% 97.9% 74.4% 81.5%
Kebele technicians/workers 63.6% 39.4% 42.6% 11.6% 39.5%
From an NGO/CBO 13.6% 3.0% 2.1% 0.0% 4.5%
From mason 84.1% 68.2% 2.1% 51.2% 52.5%
From community leaders 52.3% 0.0% 4.3% 2.3% 13.0%
From friends/relatives 27.3% 19.7% 6.4% 4.7% 15.0%
Other biogas users 59.1% 33.3% 2.1% 27.9% 30.5%
Others 2.3% 1.5% 0.0% 0.0% 1.0%
Table 4: Sources of information about biogas
However, mass media were not stated as important sources of information to access biogas-
related information. Taking into account the area coverage as well as cost efficiency of these
channels, further promotional efforts should pay attention to these options to disseminate
information about biogas technology. The growing demand for electronic devices even in
rural areas is also a propelling advantage to consider such media channels for awareness
creation. Access to reliable information helps potential users make the right decision to install
biogas and operate it properly to obtain the maximum possible benefit from the technology.
Different driving motives were also mentioned by respondents that inspire them to decide
installing biogas plant for household uses. Need for lighting, cooking energy and organic
17
fertilizer are the three most important factors behind installing biogas plants by surveyed
households with 91%, 87% and 78.5% proportion of respondents respectively. Other relevant
variables considered by households to start using biogas energy include the ever growing cost
of/difficulty to get firewood and charcoal for cooking (70%), desire to save time, money and
energy users incur from using other sources of energy (70.5%), desire to improve household
sanitation (63%) and desire to improve health condition of family members (58%). Here it is
important to note that even though need for lighting was mentioned as one of main important
driving motives for installing biogas, it is observed that significant proportion of surveyed
users have electric connectivity mainly from solar energy especially in Amhara and Tigray
regions. This is discussed in FGDs and participants explained that they have started using
solar energy recently as they have found it efficient and easy to use compared to the biogas
light. However, they still use the biogas energy for lighting as well as cooking and producing
organic fertilizer. It implies that current and future biogas promotion efforts should focus on
signifying the multi-dimensional advantages besides its use for lighting purpose.
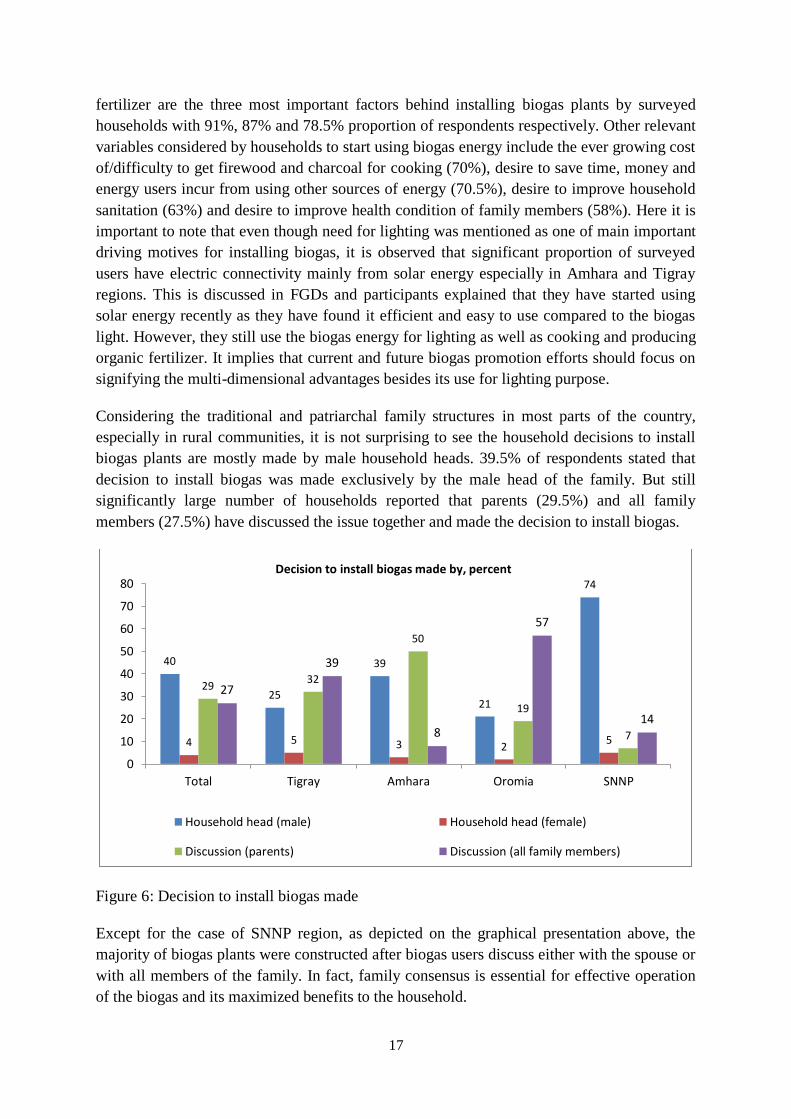
Considering the traditional and patriarchal family structures in most parts of the country,
especially in rural communities, it is not surprising to see the household decisions to install
biogas plants are mostly made by male household heads. 39.5% of respondents stated that
decision to install biogas was made exclusively by the male head of the family. But still
significantly large number of households reported that parents (29.5%) and all family
members (27.5%) have discussed the issue together and made the decision to install biogas.
Figure 6: Decision to install biogas made
Except for the case of SNNP region, as depicted on the graphical presentation above, the
majority of biogas plants were constructed after biogas users discuss either with the spouse or
with all members of the family. In fact, family consensus is essential for effective operation
of the biogas and its maximized benefits to the household.
40
25
39
21
74
4 5 3 2 5
29 32
50
19
7
27
39
8
57
14
0
10
20
30
40
50
60
70
80
Total Tigray Amhara Oromia SNNP
Decision to install biogas made by, percent
Household head (male) Household head (female)
Discussion (parents) Discussion (all family members)

18
4.2.2 Construction cost of biogas plants and financing schemes
The price of a biogas plant varies based on location and season, but the average price of a
single biogas plant is estimated to be ETB 13,000 (582.7 USD) for a biogas plant with a 6M3
gas volume, ETB 13,500 (605.1 USD) for a biogas plant with a 8M3 gas volume, and ETB
14,000 (627.5 USD) for a biogas plant with a 10M3 gas volume. Of which, half of the price is
subsidized by the federal government (10%), the regional government (5%), and the rest of
the payment is funded by the Africa Biogas Partnership Program. SNV, on the other side,
provides the technical support. Subsidies are given in the form of appliances (lamp, stove,
iron bar, gas hose, and cement) that are crucial for the proper functioning of biogas plant.
Local biogas adopters need to cover rest of the work, which is estimated to be half of the
price of a biogas plant. These include the cost of construction inputs such as sand, crushed
and dry stone, and labour cost. For those who are unable to afford the price, loan
opportunities are arranged by the microfinance institutions.
From households’ perspective, the majority of biogas users have covered what was expected
from them to build the biogas by their own resources without taking loans. Only 32% of
biogas users from Tigray and SNNP regions took loans to partly finance their plant
construction. In Tigray region, 70.5% of biogas users utilize loan mostly through multi-
purpose cooperatives and 74.5% of users in SNNP region took loans mainly from Omo
Microfinance Institution to cover part of biogas construction costs. In Amhara and Oromia
regions, biogas users finance their part of biogas construction cost from own resources
without taking loans from formal financial institutions.
Figure 7: Household loan and repayment status
However, the loan repayment status is poor both in Tigray and SNNP regions. Only 13% of
borrowers in Tigray region have fully paid their debt back while no one did in SNNP region.
Reasons related to unclear payment schedule, lack of money to pay and expecting debt
cancelation are the most frequently mentioned reasons for not paying the loan they took.
32
71 74
0
10
20
30
40
50
60
70
80
Total Tigray SNNP
Households that took loans for biogas construction
8 13
17 13
22
66 65 69
9 10 9
0
20
40
60
80
Total Tigray SNNP
Repayment status of loans
Fully paid back Repayment going onNot started yet Paying, but not regularly
19
4.3 Biogas functionality and service delivery performance
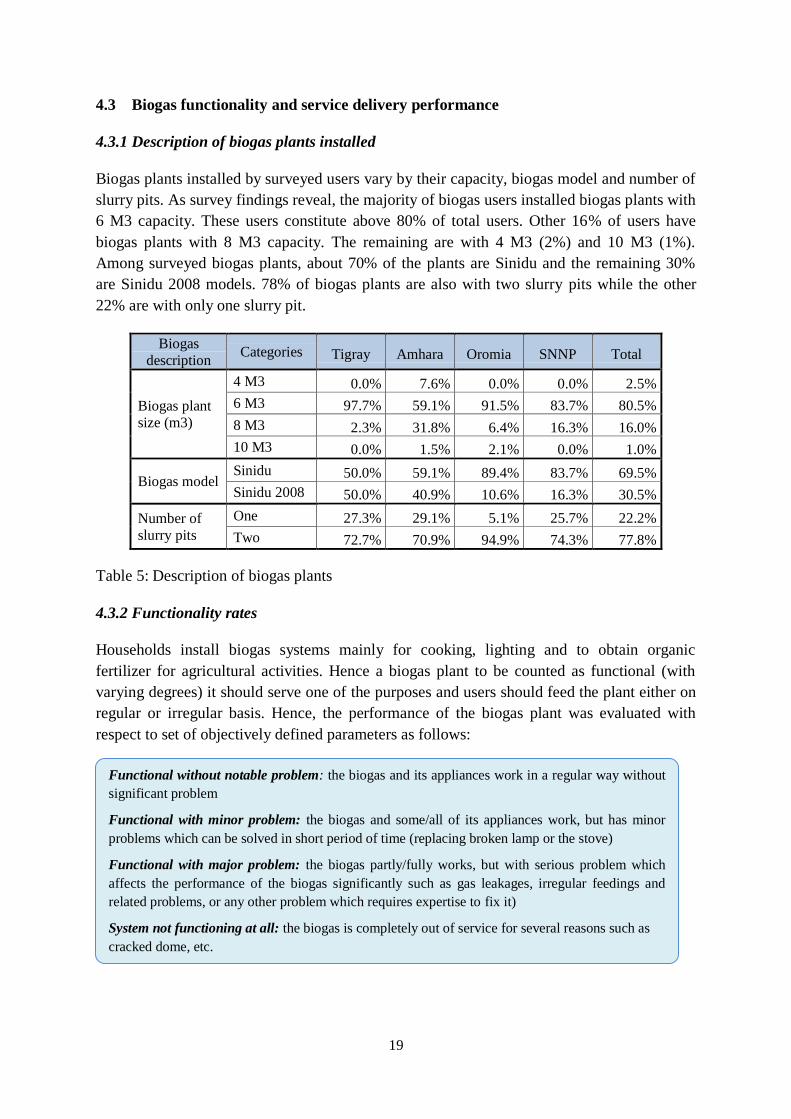
4.3.1 Description of biogas plants installed
Biogas plants installed by surveyed users vary by their capacity, biogas model and number of
slurry pits. As survey findings reveal, the majority of biogas users installed biogas plants with
6 M3 capacity. These users constitute above 80% of total users. Other 16% of users have
biogas plants with 8 M3 capacity. The remaining are with 4 M3 (2%) and 10 M3 (1%).
Among surveyed biogas plants, about 70% of the plants are Sinidu and the remaining 30%
are Sinidu 2008 models. 78% of biogas plants are also with two slurry pits while the other
22% are with only one slurry pit.
Biogas
description Categories Tigray Amhara Oromia SNNP Total
Biogas plant
size (m3)
4 M3 0.0% 7.6% 0.0% 0.0% 2.5%
6 M3 97.7% 59.1% 91.5% 83.7% 80.5%
8 M3 2.3% 31.8% 6.4% 16.3% 16.0%
10 M3 0.0% 1.5% 2.1% 0.0% 1.0%
Biogas model Sinidu 50.0% 59.1% 89.4% 83.7% 69.5%
Sinidu 2008 50.0% 40.9% 10.6% 16.3% 30.5%
Number of
slurry pits
One 27.3% 29.1% 5.1% 25.7% 22.2%
Two 72.7% 70.9% 94.9% 74.3% 77.8%
Table 5: Description of biogas plants
4.3.2 Functionality rates
Households install biogas systems mainly for cooking, lighting and to obtain organic
fertilizer for agricultural activities. Hence a biogas plant to be counted as functional (with
varying degrees) it should serve one of the purposes and users should feed the plant either on
regular or irregular basis. Hence, the performance of the biogas plant was evaluated with
respect to set of objectively defined parameters as follows:
Functional without notable problem: the biogas and its appliances work in a regular way without
significant problem
Functional with minor problem: the biogas and some/all of its appliances work, but has minor
problems which can be solved in short period of time (replacing broken lamp or the stove)
Functional with major problem: the biogas partly/fully works, but with serious problem which
affects the performance of the biogas significantly such as gas leakages, irregular feedings and
related problems, or any other problem which requires expertise to fix it)
System not functioning at all: the biogas is completely out of service for several reasons such as
cracked dome, etc.

20
In this definition of functionality, the national average functionality rate is 79% with slight
variations among survey regions2. Functionality details in each region are presented in the
table and graph below:
Figure 8: Functionality status of biogas plants
Respondents who replied that their biogas plant is not working properly/stopped working at
all were also asked about the nature of the problems they are facing. The reasons stated by the
respondents with respect to the functionality status of the biogas system are explained in the
following box:
2 The functionality rate of biogas plants in NBPE+ intervention woredas, namely Wolkayit and Raya Kobo is
87%. More specifically, 40% of the plants are fully functional without any significant problem, 20% with minor
problems and 27% with major problems. The remaining 13% of plants are not functional.
30 23
18
62
23 22 27
15 13
39
27 23
50
6
19 21 27
17 19 19
0
20
40
60
80
Total Tigray Amhara Oromia SNNP
Functionality status of biogas plants
Functioning without notable problem functioning with minor problems
Functioning with major problems System not functioning

21
Figure 9: Problems affecting biogas functionality
5 13
81 83
100 89
88
14 17 11
0%
10%
20%
30%
40%
50%
60%
70%
80%
90%
100%
Total Tigray Amhara Oromia SNNP
Problems stated (Functional biogas with minor problems)
Biogas stove not working
Biogas lamp not working
Unable to operate the biogas properly
44
40
52 33
18 20
18
50
2
17
18 20
18
17
18 20 11 50 33
0%
10%
20%
30%
40%
50%
60%
70%
80%
90%
100%
Total Tigray Amhara Oromia SNNP
Problems stated (Functional biogas with major problems)
Gas valves not functioning properlyProblem with water drain valveOthersPipes cracked/damagedGas not reaching appliances properly
Problem with appliances: appliances (the lamp, lantern or the stove) are not functional. This can
cause poor performance of the biogas or put the plant out of service as users become reluctant to
use the system anymore especially when spare parts are not easily accessible. But they can still
use the biogas for bio-slurry and organic fertilizer (e.g., the case of Amhara region).
Pipes cracked/broken: this also makes the gas to reduce/vanish before it gets to the appliances. If
the damage is severe, it also makes fresh air enter the dome to gradually drain the digester and kill
the bacteria. This problem significantly affects the performance of the biogas or makes the system
fail at all.
Gas valves not functioning properly: if the valves at the dome, at the lamp or at the stove are not
working properly, it is not possible to control gas flow and it causes poor outputs. It can also
damage the appliances, especially the lantern, due to unbalanced flow of gas.
Water drain valve not functioning properly: If water drain is not checked periodically, it can
cause serious problem by causing accumulation of water in the pipe. Usually users forget to check
it on regular bases and it affects the performance of the biogas seriously.
Gas not reaching the appliances properly for unknown reason: this refers to the situation in
which the plant generates gas as required, but the gas doesn’t reach appliances properly due to
several reasons such as blocked pipes (e.g. by slurry blockage or installation problem).
Biogas digester cracked/damaged: due to poor quality of construction or materials used and
natural/man-made disaster. Usually, this problem makes the system to fail.
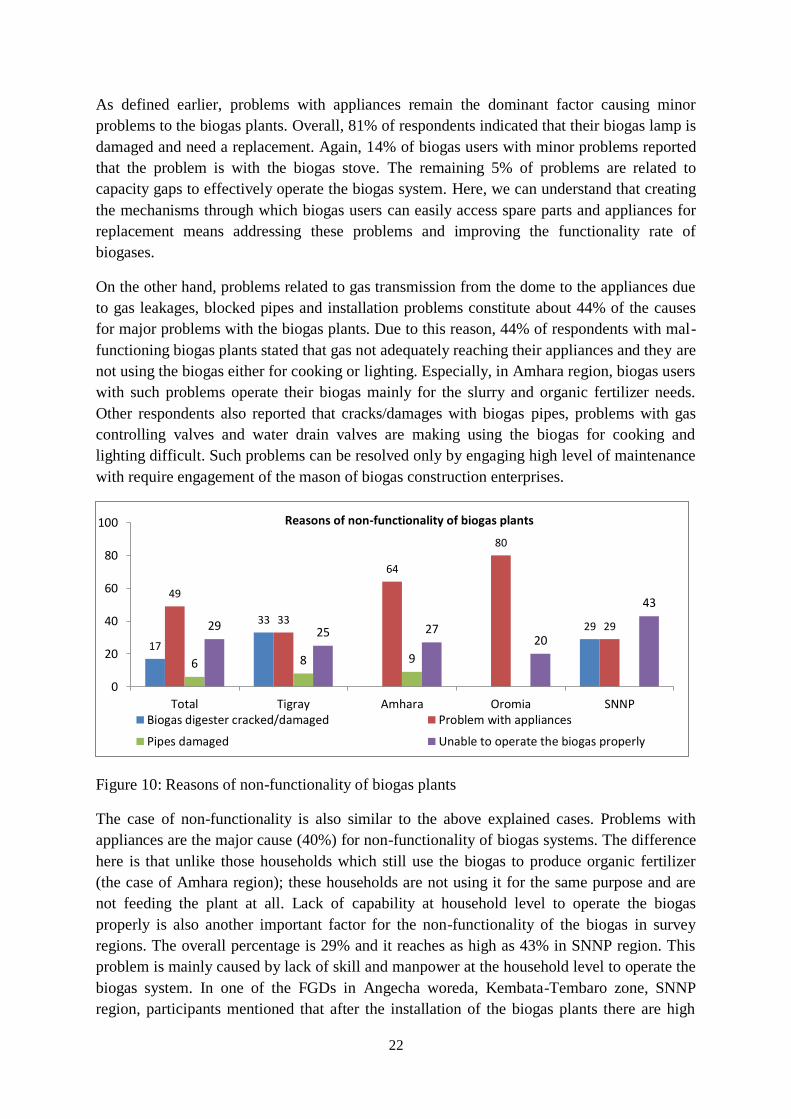
22
As defined earlier, problems with appliances remain the dominant factor causing minor
problems to the biogas plants. Overall, 81% of respondents indicated that their biogas lamp is
damaged and need a replacement. Again, 14% of biogas users with minor problems reported
that the problem is with the biogas stove. The remaining 5% of problems are related to
capacity gaps to effectively operate the biogas system. Here, we can understand that creating
the mechanisms through which biogas users can easily access spare parts and appliances for
replacement means addressing these problems and improving the functionality rate of
biogases.
On the other hand, problems related to gas transmission from the dome to the appliances due
to gas leakages, blocked pipes and installation problems constitute about 44% of the causes
for major problems with the biogas plants. Due to this reason, 44% of respondents with mal-
functioning biogas plants stated that gas not adequately reaching their appliances and they are
not using the biogas either for cooking or lighting. Especially, in Amhara region, biogas users
with such problems operate their biogas mainly for the slurry and organic fertilizer needs.
Other respondents also reported that cracks/damages with biogas pipes, problems with gas
controlling valves and water drain valves are making using the biogas for cooking and
lighting difficult. Such problems can be resolved only by engaging high level of maintenance
with require engagement of the mason of biogas construction enterprises.
Figure 10: Reasons of non-functionality of biogas plants
The case of non-functionality is also similar to the above explained cases. Problems with
appliances are the major cause (40%) for non-functionality of biogas systems. The difference
here is that unlike those households which still use the biogas to produce organic fertilizer
(the case of Amhara region); these households are not using it for the same purpose and are
not feeding the plant at all. Lack of capability at household level to operate the biogas
properly is also another important factor for the non-functionality of the biogas in survey
regions. The overall percentage is 29% and it reaches as high as 43% in SNNP region. This
problem is mainly caused by lack of skill and manpower at the household level to operate the
biogas system. In one of the FGDs in Angecha woreda, Kembata-Tembaro zone, SNNP
region, participants mentioned that after the installation of the biogas plants there are high
17
33 29
49
33
64
80
29
6 8 9
29 25 27 20
43
0
20
40
60
80
100
Total Tigray Amhara Oromia SNNP
Reasons of non-functionality of biogas plants
Biogas digester cracked/damaged Problem with appliances
Pipes damaged Unable to operate the biogas properly

23
probabilities that adult/young members of rural households migrate to other countries looking
for better opportunities. In such cases, the households become unable to properly manage
their system and discontinue feeding the plant at all.
4.3.3 Performance of functional biogas systems
Cooking, lighting and organic fertilizer are the most relevant purposes of biogas energy being
demanded by rural households. Biogas plants which are functioning without any significant
problems are believed to serve all these purposes on the basis of the feeding patterns by the
users. The usage of those biogas systems with minor and major problems depends on the
amount of gas generated and available for use and the functionality of appliances attached to
the biogas system.
As evidenced from survey results, biogas plants with minor problems are used mainly for
cooking purposes, implying that only the stove is working at the time of the interview.
Meaning, the biogas lamp is the one having problem most of the times. Biogas plants with
major problems are mainly used for generating organic fertilizer and it is evidenced mainly
from statistical figures in Amhara region. To these households, producing organic fertilizer
from biogas plant is equally important benefit they obtain from the technology. Most of the
households use the biogas energy to cook wat (sauce), boil water and make coffee. The
applicability of biogas energy to bake injera and other purposes which require large amount
of gas and special appliances are at the very infant stage of development to be sued by biogas
users. Only 5% of respondents stated that they use biogas energy to bake injera and they all
are found in Amhara region. Most of the users do not feel comfortable for not being able to
use the biogas energy to cook anything they want to cook. During the time of interview, most
of the gages (54%) that measure the amount of gas generated from the plant are five and
below five. 16% of the gages also read gas level in the range of 5 – 7 and 23% reads gas level
above 7 at the time of observation.
4.3.4 Biogas feeding patterns
Family size biogas plant is sited within the homestead that is usually near to the cattle shed
and the tasks of collection, stirring and feeding the substrates into the biogas digester are
largely performed by members of household to whom the biogas system belong. Biogas
feeding pattern is also among critical factors influencing the biogas system performance.
In survey areas, the majority of biogas users (45%) feed their plant once a day. 28% of them
also reported that they feed their plant weekly on average. Other 22% of the users also feed
their plant in two days. Only 5% of surveyed households report that they feed their biogas
twice a day with water and dung to generate gas and bio-slurry. Exceptionally, 90% of
households in Oromia region feed their biogas daily while 51% of users feed weekly in
Tigray region.

24
Figure 11: Frequency, households feed their biogas
Respondents were also asked why they feed their biogas plant in the stated intervals.
According to the results, the majority of respondents (67% on average) claim that that is the
only amount of dung they have to feed their biogas. Other 17% of respondents also replied
that that is the amount of water available for biogas feeding. Only 11% of respondents
reported that that is the capacity of their bio digester with respect to the amount of gas they
need for household uses. The amount of dung and water these households feed their biogas
plant at a time is also presented in the table below.
Region Statistics
Amount of input feeding at a time by biogas plant size (m3)
4 M3 6 M
3 8 M
3 10 M
3
Dung
(kg)
Water
(ltr.)
Dung
(kg)
Water
(ltr.)
Dung
(kg)
Water
(ltr.)
Dung
(kg)
Water
(ltr.)
Tigray
Mean 25.61 22.58
Std. Dev. 2.999 3.093
N 33 33
Amhara
Mean 22.00 17.00 24.29 21.61 27.95 25.71 30.00 30.00
Std. Dev. 4.472 4.472 4.454 3.614 2.924 3.273 . .
N 5 5 28 28 21 21 1 1
Oromia
Mean 25.27 22.43 35.00 20.00 35.00 30.00
Std. Dev. 4.073 3.254 . . . .
N 37 37 1 1 1 1
SNNP
Mean 26.38 21.72 26.67 24.17
Std. Dev. 3.986 3.348 2.582 2.041
N 29 29 6 6
Total
Mean 22.00 17.00 25.39 22.13 27.93 25.18 32.50 30.00
Std. Dev. 4.472 4.472 3.914 3.305 3.126 3.186 3.536 .000
N 5 5 127 127 28 28 2 2
Recommended
feeding amount
Minimum 20 20 30 30 40 40 50 50
Maximum 40 40 60 60 80 80 100 100
Table 6: Amount of input feeding at a time by biogas plant size
5 6 3 11
45
21 27
90
46
22 27 31
5
20 28
51
36
3
23
0
20
40
60
80
100
Total Tigray Amhara Oromia SNNP
Frequency, households feed thier biogas
Twice a day Once a day In two days Weekly
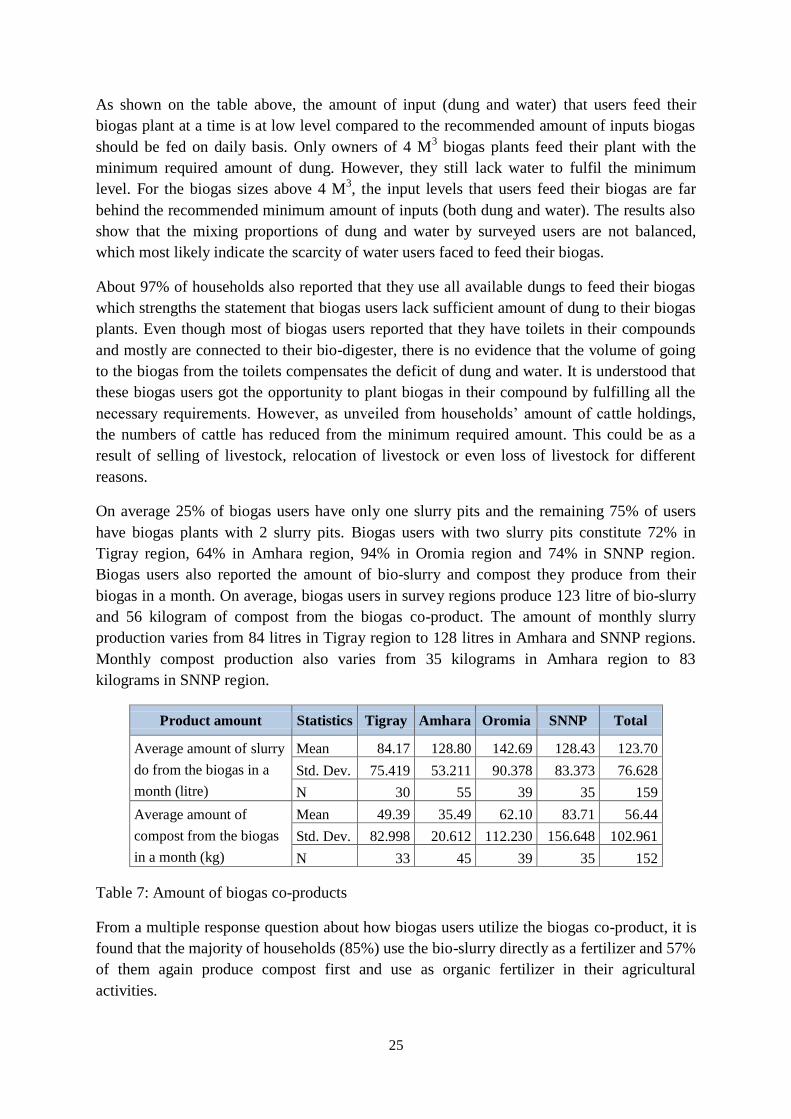
25
As shown on the table above, the amount of input (dung and water) that users feed their
biogas plant at a time is at low level compared to the recommended amount of inputs biogas
should be fed on daily basis. Only owners of 4 M3 biogas plants feed their plant with the
minimum required amount of dung. However, they still lack water to fulfil the minimum
level. For the biogas sizes above 4 M3, the input levels that users feed their biogas are far
behind the recommended minimum amount of inputs (both dung and water). The results also
show that the mixing proportions of dung and water by surveyed users are not balanced,
which most likely indicate the scarcity of water users faced to feed their biogas.
About 97% of households also reported that they use all available dungs to feed their biogas
which strengths the statement that biogas users lack sufficient amount of dung to their biogas
plants. Even though most of biogas users reported that they have toilets in their compounds
and mostly are connected to their bio-digester, there is no evidence that the volume of going
to the biogas from the toilets compensates the deficit of dung and water. It is understood that
these biogas users got the opportunity to plant biogas in their compound by fulfilling all the
necessary requirements. However, as unveiled from households’ amount of cattle holdings,
the numbers of cattle has reduced from the minimum required amount. This could be as a
result of selling of livestock, relocation of livestock or even loss of livestock for different
reasons.
On average 25% of biogas users have only one slurry pits and the remaining 75% of users
have biogas plants with 2 slurry pits. Biogas users with two slurry pits constitute 72% in
Tigray region, 64% in Amhara region, 94% in Oromia region and 74% in SNNP region.
Biogas users also reported the amount of bio-slurry and compost they produce from their
biogas in a month. On average, biogas users in survey regions produce 123 litre of bio-slurry
and 56 kilogram of compost from the biogas co-product. The amount of monthly slurry
production varies from 84 litres in Tigray region to 128 litres in Amhara and SNNP regions.
Monthly compost production also varies from 35 kilograms in Amhara region to 83
kilograms in SNNP region.
Product amount Statistics Tigray Amhara Oromia SNNP Total
Average amount of slurry
do from the biogas in a
month (litre)
Mean 84.17 128.80 142.69 128.43 123.70
Std. Dev. 75.419 53.211 90.378 83.373 76.628
N 30 55 39 35 159
Average amount of
compost from the biogas
in a month (kg)
Mean 49.39 35.49 62.10 83.71 56.44
Std. Dev. 82.998 20.612 112.230 156.648 102.961
N 33 45 39 35 152
Table 7: Amount of biogas co-products
From a multiple response question about how biogas users utilize the biogas co-product, it is
found that the majority of households (85%) use the bio-slurry directly as a fertilizer and 57%
of them again produce compost first and use as organic fertilizer in their agricultural
activities.

26
4.4 Users’ training and after-sale services
As clearly stated in the PID, training is an integral part of the program for smooth and
effective implementation. The document recognized that training at different levels of
program stakeholders is required as the program is new that entails a new technology and a
new approach towards promotion, dissemination and effective operation of the technology. In
the program document, it is mentioned that a one day pre-construction and one day post
construction users’ training will be delivered to biogas owners. After-sale services have also
been emphasized including proper instruction of the user on the operation of the plant and
maintenance as well as a guarantee of one year on appliances and two years on the civil
structure of the plant. The guarantee provision includes at least two visits with an annual
interval, starting six months after the completion of the plant.
Among surveyed biogas users about 65% of them reported that they/member of their family
have got trainings on biogas. However, as discussed in FGDs and KIIs conducted in selected
survey areas with selected informants, these trainings are mostly the post-construction
orientations provided to biogas users about the operation of the biogas. It implies that most of
the biogas users did not receive any kind of pre-construction and post construction trainings
as planned in the PID. Masons and woreda technicians are those who deliver trainings/post-
construction orientations to biogas users. 62% of respondents stated that they have got these
trainings/orientations from the mason and other 36% of respondents obtained trainings and
orientations from woreda technicians.
As reported by respondents, major topics addressed in the trainings/orientations include
operating biogas (93%), using biogas co-products (90%), advantages of biogas technology
(89%), maintain and troubleshooting biogas problems (63%) and obtaining assistance from
biogas service providers (61%). All of the respondents (100%) who received
trainings/orientations from masons and woreda technicians found the contents covered in the
trainings highly relevant for effective operation of and maximized benefits from their biogas
plant.
Distribution of printed materials to biogas users seems inadequate as revealed from surveyed
results. Only few of biogas users replied that they have received resources such as brochures
(19%), warranty card (39%) and users’ manual (46%). As reflected in key informants’
interview in survey areas, there are some attempts to produce and distribute information
convoying materials at woreda offices and distributed to biogas users, but have never been
adequate. Taking into account expansion of primary and higher level education in the
country, it is important to pay attention to produce and distribute information materials to be
used by household members of biogas users.
Other important segment of biogas users’ service is after-sale service. After-sale service
includes proper instruction of the user on the operation of the plant and maintenance as well
as a guarantee of one year on appliances and two years on the civil structure of the plant3.
3 EREDPC/SNV Ethiopia, NBPE, Program Implementation Document (PID), p. 34
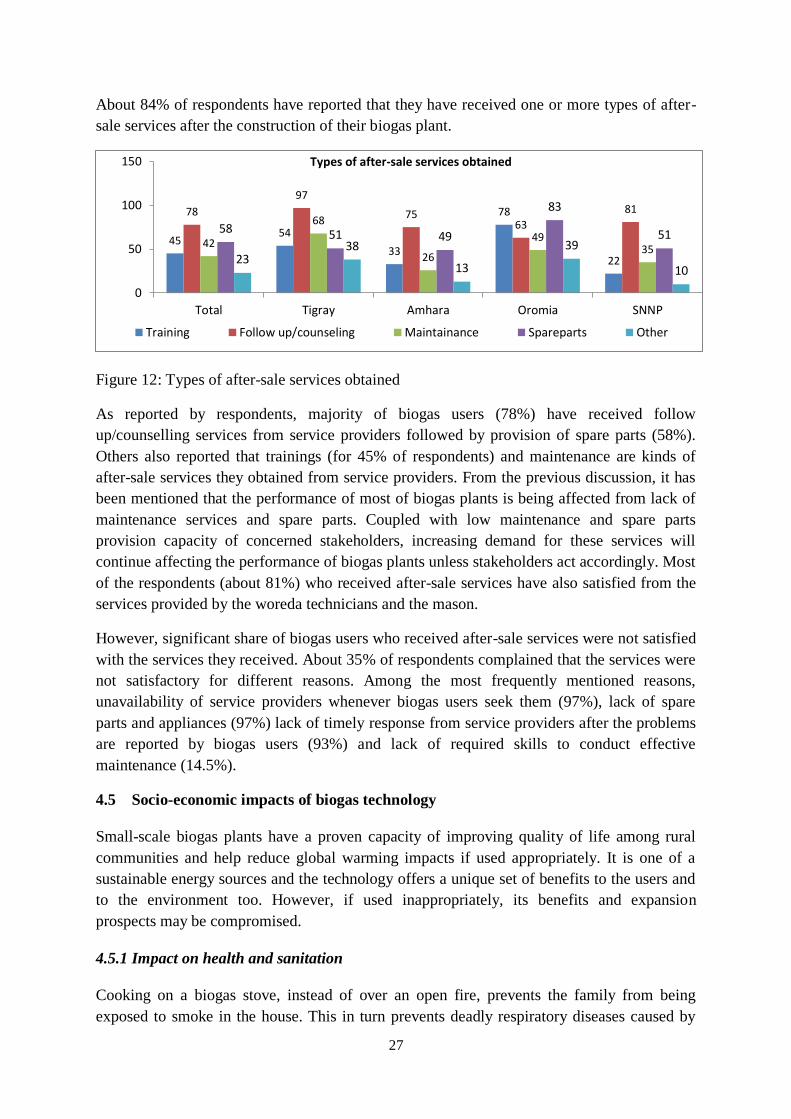
27
About 84% of respondents have reported that they have received one or more types of after-
sale services after the construction of their biogas plant.
Figure 12: Types of after-sale services obtained
As reported by respondents, majority of biogas users (78%) have received follow
up/counselling services from service providers followed by provision of spare parts (58%).
Others also reported that trainings (for 45% of respondents) and maintenance are kinds of
after-sale services they obtained from service providers. From the previous discussion, it has
been mentioned that the performance of most of biogas plants is being affected from lack of
maintenance services and spare parts. Coupled with low maintenance and spare parts
provision capacity of concerned stakeholders, increasing demand for these services will
continue affecting the performance of biogas plants unless stakeholders act accordingly. Most
of the respondents (about 81%) who received after-sale services have also satisfied from the
services provided by the woreda technicians and the mason.
However, significant share of biogas users who received after-sale services were not satisfied
with the services they received. About 35% of respondents complained that the services were
not satisfactory for different reasons. Among the most frequently mentioned reasons,
unavailability of service providers whenever biogas users seek them (97%), lack of spare
parts and appliances (97%) lack of timely response from service providers after the problems
are reported by biogas users (93%) and lack of required skills to conduct effective
maintenance (14.5%).
4.5 Socio-economic impacts of biogas technology
Small-scale biogas plants have a proven capacity of improving quality of life among rural
communities and help reduce global warming impacts if used appropriately. It is one of a
sustainable energy sources and the technology offers a unique set of benefits to the users and
to the environment too. However, if used inappropriately, its benefits and expansion
prospects may be compromised.
4.5.1 Impact on health and sanitation
Cooking on a biogas stove, instead of over an open fire, prevents the family from being
exposed to smoke in the house. This in turn prevents deadly respiratory diseases caused by
45 54
33
78
22
78
97
75 63
81
42
68
26
49 35
58 51 49
83
51
23 38
13
39
10
0
50
100
150
Total Tigray Amhara Oromia SNNP
Types of after-sale services obtained
Training Follow up/counseling Maintainance Spareparts Other

28
smoke. Above 45% of respondents expressed that they/members of their household have
faced health problem/accident from using firewood for household energy needs. The
proportion of household faced these problems reach as high as 66% in Oromia region. The
most common types of health problems and accidents biogas users experienced before
installing biogas plants include suffocation from smoke (92%), eye disease (78%), external
body parts injury/burning (48%), respiratory disease (37%), fire accidents (25%), malaria
(18%) and asthma (12%).
Figure 13: Changes in household health status
Among respondents who faced the above listed health related problems from using firewood
as family energy source, most of them have reported that the situation has greatly improved
after installing the biogas. 98% respondents affected from smoke suffocation expressed that
the problem has reduced after the biogas. 97% of biogas user affected from external body
parts injury also reported that the situation has now improved significantly. 94 % of
respondents also reported that eye disease problem is now reduced significantly because of
the biogas technology. Malaria, respiratory disease and asthma have reduced similarly as a
result of the biogas at household level. Overall, 89% of respondents (94% in Tigray region,
93% in Amhara region, 79% in Oromia region and 91% in SNNP region) has reported that
the health condition of their family members have improved after they started using biogas.
4.5.2 Impacts on violence against women and girls
From biogas users which used to collect firewood for household energy demand, 70.5% of
respondents reported that adult females are the one who collect firewood on regular basis.
49.4% of them again stated that not only adult females, but girls also collect firewood to the
household from the forest. 30%, 23% and 22% of these respondents also stated that adult
males, boys and all members of households who have time to do so collect firewood,
respectively. Besides, household members faced problems in collecting firewood including
bearing extra work burden by women and girls (84%), children being late from school and
shortage of time for study (68%), children stay without food and water (58%) and others.
45
27
47
66
37
0
20
40
60
80
Total Tigray Amhara Oromia SNNP
Households faced health problem/accident from using firewood
before the biogas
89 94 93
79
91
70
75
80
85
90
95
100
Total Tigray Amhara Oromia SNNP
Does health condition of family members inproved after the biogas

29
Figure 14: Household members who used to collect firewood and animal dung
After the introduction of biogas technology in their household, 68% of respondents stated that
abuse and violence against women and girls has highly reduced. Other 20% and 10% of
respondents reported that the violence and abuse against women and girls has slightly and
fully reduced, respectively. As per quantitative results 93% of respondents reported that
biogas has helped women to be involved in social and income generating activities. Again,
91% of respondents stated that using biogas for cooking reduced women’s time to cook
which women otherwise use for agriculture/IGA (71%), (adult) education (61%), social
works (56%) and to spend with rest (41%).
4.5.3 Impact of biogas on households’ energy expenditure
Reduction in households’’ monthly energy expenditure is also another benefit users possibly
enjoy from their biogas plants. Out of the surveyed biogas users, 57% of them reported that
their monthly energy expenditure has reduced due to using biogas energy. The percentages of
households who reported the same in Tigray, Amhara, Oromia and SNNP regions are 64%,
60%, 47% and 57% respectively. On average, households have saved about 110 ETB per
month from their energy expenditure. The amount of money saved from household monthly
energy expenditure for regions is ETB 127 for Tigray region; ETB 93 for Amhara region,
ETB 126 for Oromia region and ETB 107 for SNNP region.
The proportion of biogas users who have reported their energy expenditure has reduced and
the amount of money saved per month might seem low. However, it is not because firewood
is not the dominant source of energy before the biogas. Rather, it shows that rural households
not only purchase firewood from the market, (mostly) they also collect firewood from the
forests by their own power without paying for it.
4.5.4 Impact of biogas on children’s education and study time
By using biogas light, students have also an opportunity to study during evening and night.
65% of respondents reported that children begun to study in the evening and night which was
not common in rural communities before the installation of the biogas plant. In Tigray region
51% of respondents, in Amhara region 58%, in Oromia region 92% and in SNNP region 66%
of respondents expressed that their children became able to study their education during
evening and night periods by using biogas lights.
30 30 31 40
18
71 87
74 68 53 49
67 54
32 44
23 17 22 24 29 22 7
24 32
23
0
50
100
Total Tigray Amhara Oromia SNNP
Household members who used to collect firewood and animal dung
Adult males Adult females Girls Boys All

30
As reported by survey respondents, the average study hours of children in the evening/during
the night has improved from about 2 hours and 30 minutes to 3 hours and 20 minutes. That
means children’s study time in the evening and during the night by 50 minutes on average.
The change varies from 30 minutes in Amhara region to an hour and 55 minutes in Oromia
region. The changes in Tigray and SNNP regions are an hour and six minutes and an hour
and 10 minutes respectively.
4.5.5 Impact of biogas on agricultural productively
The co-product of the biogas generation process is enriched organic compound which is
perfect supplement to, or substitute for, chemical fertilizers. The fertilizers discharged from
the digester can accelerate plant growth and resilience to disease, whereas commercial
fertilizers contain chemicals that have toxic effects and can cause food poisoning, among
other things. Bio-slurry is therefore an integral part of biogas operation that users seriously
take in the decision making as well as operation of their biogas plants. Accordingly, biogas
has significantly changed users’ agricultural production as depicted in the table below.
Indicators Tigray Amhara Oromia SNNP Total
Before After Before After Before After Before After Before After
Area covered
(hectare) 0.78 0.62 0.63 0.7 0.67 0.6 0.49 0.68 0.65 0.7
Chemical
fertilizer used
(kg)
69.58 64.24 96.11 94 198.5 79.08 51.94 62.43 105.2 77.52
Organic fertilizer
used (kg) 79.8 114.5 30.5 219.3 32.7 231.8 139.1 132.4 69.5 181.9
Yield amount
(quintal) 13.15 11.88 10.79 15.42 13.64 13.03 8.39 11.69 11.43 13.32
Productivity
(area/yield) 16.85 19.16 17.12 22.02 20.35 21.71 17.12 17.19 17.58 19.02
Table 8: Impact of biogas on agricultural productivity
As shown in the table, biogas technology and the organic fertilizer farmers obtain as co-
product has improved users’ agricultural productivity from 17.58 quintals of product per
hectare to 19.02 quintals of agricultural product per hectare. Demand for chemical fertilizer
has also significantly reduced from 105 kilogram to 77.52 kilogram after the biogas. In
contrast utilization of organic fertilizer for crop production has significantly improved from
the average amount of 69 kilograms before the biogas to 181 kilograms after the biogas.

31
Figure 15: Impact of organic fertilizer
Biogas technology has also significant impact on intensification of pastes and demand for
chemical fertilizers. The above couple of diagrams indicate to what level biogas reduces farm
paste and demand for chemical fertilizer. As statistical figures show, 67% of organic fertilizer
users reported that paste has reduced in their farm where they applied organic fertilizer and
84% of organic fertilizer users stated that demand for chemical fertilizers has reduces
significantly. The impact of biogas technology in paste control is much appreciated in
Amhara region where 67% of respondents reported that paste coverage has highly reduced.
4.5.6 Impact of biogas on creating employment opportunities
Alternatively, collection of fuel wood takes a big working time share in rural area and keep
people (especially school going children and women) away from other productive pursuits.
This way to reduce traditional biomass energy consumption can lead to saving time and
offering better opportunities. Household members used to waste about 3 hours a week to
collect firewood/animals dung. The person could distribute their saving time and utilize these
couple of time for other productive purposes, including handy craft activities, agricultural
activities, small business, livestock rearing, home gardening, better care to child education,
recreation, etc.
Types of activities Tigray Amhara Oromia SNNP Total
Education (adults education) 84.0% 52.8% 78.4% 36.4% 60.8%
To get rest 64.0% 24.5% 78.4% 15.2% 42.6%
For social works 72.0% 47.2% 81.1% 39.4% 58.1%
For agriculture 96.0% 54.7% 94.6% 51.5% 70.9%
IGAs (petty trade, handicrafts, etc) 4.0% 34.0% 27.0% 51.5% 31.1%
Table 9: Employment opportunities created as a result of biogas
11
36
6 8
39
45
17 29
62
28
14
67
21
21 1
5 21 5 6
50
8
0
20
40
60
80
100
Total Tigray Amhara Oromia SNNP
Howfar using organic fertilizer from the the biogas reduced pastes?
No change Slightly reducedHighly reduced WorsenedDon't know
13 18 6
18 8
59 68
67 53
54
25 9
17 29 38
3 4 11
0
20
40
60
80
100
Total Tigray Amhara Oromia SNNP
Howfar using organic fertilizer from the the biogas reduced demand for chem.
fertilizer?
No change Slightly reduced
Highly reduced Don't know
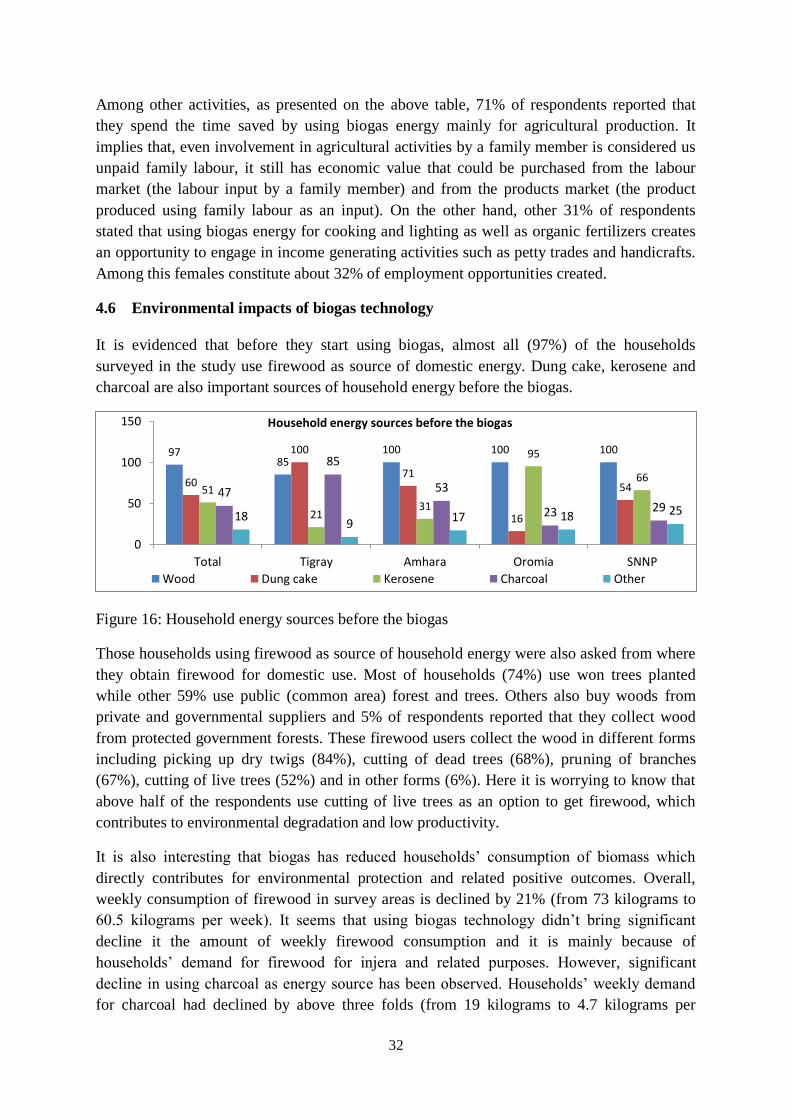
32
Among other activities, as presented on the above table, 71% of respondents reported that
they spend the time saved by using biogas energy mainly for agricultural production. It
implies that, even involvement in agricultural activities by a family member is considered us
unpaid family labour, it still has economic value that could be purchased from the labour
market (the labour input by a family member) and from the products market (the product
produced using family labour as an input). On the other hand, other 31% of respondents
stated that using biogas energy for cooking and lighting as well as organic fertilizers creates
an opportunity to engage in income generating activities such as petty trades and handicrafts.
Among this females constitute about 32% of employment opportunities created.
4.6 Environmental impacts of biogas technology
It is evidenced that before they start using biogas, almost all (97%) of the households
surveyed in the study use firewood as source of domestic energy. Dung cake, kerosene and
charcoal are also important sources of household energy before the biogas.
Figure 16: Household energy sources before the biogas
Those households using firewood as source of household energy were also asked from where
they obtain firewood for domestic use. Most of households (74%) use won trees planted
while other 59% use public (common area) forest and trees. Others also buy woods from
private and governmental suppliers and 5% of respondents reported that they collect wood
from protected government forests. These firewood users collect the wood in different forms
including picking up dry twigs (84%), cutting of dead trees (68%), pruning of branches
(67%), cutting of live trees (52%) and in other forms (6%). Here it is worrying to know that
above half of the respondents use cutting of live trees as an option to get firewood, which
contributes to environmental degradation and low productivity.
It is also interesting that biogas has reduced households’ consumption of biomass which
directly contributes for environmental protection and related positive outcomes. Overall,
weekly consumption of firewood in survey areas is declined by 21% (from 73 kilograms to
60.5 kilograms per week). It seems that using biogas technology didn’t bring significant
decline it the amount of weekly firewood consumption and it is mainly because of
households’ demand for firewood for injera and related purposes. However, significant
decline in using charcoal as energy source has been observed. Households’ weekly demand
for charcoal had declined by above three folds (from 19 kilograms to 4.7 kilograms per
97 85
100 100 100
60
100
71
16
54 51
21 31
95
66
47
85
53
23 29 18
9 17 18 25
0
50
100
150
Total Tigray Amhara Oromia SNNP
Household energy sources before the biogas
Wood Dung cake Kerosene Charcoal Other

33
week). This can be explained straight forward by the fact that biogas energy can effectively
substitute charcoal energy with the more safe and healthy energy source.
Biomass usage Tigray Amhara Oromia SNNP Total
Before After Before After Before After Before After Before After
Weekly firewood usage (kg) 74 56 75.5 64.5 69.5 62 71.5 58 73 60.5
Weekly charcoal usage (kg) 24.2 8.2 24.5 6 10.5 0.7 15 4.2 19 4.7
Reduction in Biomass Consumption
Biomass type Before After Reduction Reduction/
Year, Kg
Reduction/Year, Kg - fuel
wood equivalent (20%)4
Wood (kg/ week) 73 60.5 12.5 650 650
Charcoal (kg/week) 19 4.7 14.3 743 3,718
Total
4,368
Table 10: Households' biomass usage
The decline in biomass usage in survey regions also follow similar pattern. Due to inability of
the existing biogas plants to be used for baking injera, almost all of the respondents use
biomass as alternative source of energy along with the biogas. 78.3% of respondents reported
that they use biomass for cooking sometimes while other 20% of respondents use biomass all
the time.
Household respondents (48%) also stated that forest coverage is increasing in their locality.
In contrary, 40% of other respondents claimed that forest coverage is reducing. Those who
said forest coverage is increasing mentioned that expansion of alternative energy sources
(95%), improving plantation (77%), and other factors contributed to the increasing trend of
forest coverage in survey area. 73% of surveyed users also reported that other people are still
cutting and using wood for fuel which further complicates environmental problems we are
facing these days.
4.7 Users level of satisfaction from their biogas plant and its services
The beneficiaries only become satisfied when the biogas plant smoothly functions and the gas
produced is sufficient, which is directly related to associated benefits like time saving in
firewood collection, cooking, decrease in indoor smoke etc. Besides, the satisfaction is also
directly linked with the post installation services. Surveyed households have been therefore
asked about how far they are satisfied with the biogas and its related features and their
responses are presented in the following diagrams.
4 The conversion efficiency of conventional kilns are ranging 10 – 20 % (Wiskerke, 2008) and in some cases
can go up to 30+ % (CDM, AMS-II.G. Version 10.0). In this case 20% conversion efficiency is used.

34
Figure 17: Users' level of satisfaction from biogas services
Regarding cooking services, 66.5% of respondents are highly satisfied while other 31.7%
satisfied to some extent. Overall, about 98% of respondents have enjoyed a certain level of
satisfaction from using biogas energy for cooking purposes. Only 2% of biogas users reacted
that they are not totally satisfied from the cooking services of the biogas energy. Using biogas
for lighting is, in contrary the benefit that significant proportions of users are dissatisfied
about. While 45% of respondents reported that they are highly satisfied from the biogas light,
other 39% are those who are satisfied to some level. The remaining 16% of respondents never
satisfied with the biogas light.
64 45 44
76 79
34
46 56
24 21 2 9
0
20
40
60
80
100
Total Tigray Amhara Oromia SNNP
Level of users' satisfaction from using biogas for cooking
Highly satisfied Satisfied Not satisfied
45 36 44
59
33
39 36
50 32
42
16 27
6 9 25
0
20
40
60
80
100
Total Tigray Amhara Oromia SNNP
Level of users' satisfaction from using biogas for lighting
Highly satisfied Satisfied Not satisfied
54 36
16
70 75
43 59
78
26 25 3 5 6 3
0
20
40
60
80
100
Total Tigray Amhara Oromia SNNP
Level of users' satisfaction from using biogas byproducts
Highly satisfied Satisfied Not satisfied
61 64
22
76 67
39 26
78
23 33
0
20
40
60
80
100
Total Tigray Amhara Oromia SNNP
Level of users' satisfaction from saved time, money and labor
Highly satisfied Satisfied Not satisfied
35
5. CONCLUSION AND RECOMMENDATION
5.1 Conclusion
The government of Ethiopia is striving for rapid economic growth and better living standards
of the people via poverty reduction and food self-sufficiency policies. Expansion of
alternative energy sources is one of the accentuated developmental agendas of Ethiopia. In
view of the fact that biogas is one of the alternative renewable energy sources, the Ethiopian
government of had launched consecutive 5-year biogas programs since 2009 with the aim of
promoting biogas energy for domestic uses. Until April 11, 2019, a total of 23,802 household
size bio-digesters were constructed. This Biogas Users Survey was conducted with the aim of
collecting relevant data to evaluate the impact of domestic biogas digester installations as
experienced or perceived by the users.
Survey findings show that biogas users installed biogas plants with 4, 6, 8 and 10 m3 sizes on
the basis of shared investment scheme with the government to cover construction costs. Local
biogas adopters need to cover rest of the work, which is estimated to be half of the price of a
biogas plant. From the survey, it’s found that 79% of installed biogas plants are functional
with different degrees of functionality. 30% of the systems are functioning without
significant problem, 22% are functioning with minor problems and other 27% are
functioning, but with major problems. 21% of the plants are found totally not functional.
Most of the stated problems associated to mal-functionality of the biogas plants include
problems with appliances, pipes, fittings and valves, lack of skills to operate the biogas, lack
of spare parts to replace broken appliances, crack down of bio-digesters, lack of inputs, etc.
lack of inputs and adequate after-sale services are also areas which require due concern with
program implementers.
Biogas technology has significant potential to mitigate several problems related to ecological
imbalance, minimizing crucial fuel demand, improving hygiene and health, and thus,
resulting in an overall improvement in the quality of life in rural and semi-urban areas. In the
study it is found that biogas technology has brought significant positive changes in the
socioeconomic conditions of rural households and supports environmental protection efforts.
It helped users to improve their health condition, reduced women and children work burden
allowed them to be involved valuable economic/social activities. It also significantly reduced
their vulnerability for violence and helped children to study their education for longer time in
the evening and during the night using biogas light. Biogas has reduced expenditures
households incur for energy as well as chemical fertilizer and improved farmers’ agricultural
productivity. It also reduced households’ woody biomass consumption. Most of surveyed
biogas users are also satisfied with the benefits of the biogas energy.
36
5.2 Recommendations
Information dissemination and awareness creation: access to and utilization of alternative
and renewable energy sources is at an infant stage in the country and the majority of rural
population still depends on woody biomass for energy needs. Coupled with growing
population pressure and environmental depletion, there is a great opportunity to promote and
expand biogas technology in rural communities as renewable and sustainable source of
energy. However, the potentials of this new technology don’t seem well-internalized not
alone by the communities, even by the current biogas users. As survey results revealed,
information dissemination efforts are insufficient and available information sources are very
limited. Awareness helps potential users to have complete information and make informed
decisions to use biogas which in turn will have direct implication on the performance and
functionality of the biogas after the construction. Hence it is important to consider all
available channels, especially with wider coverage such as national and local mass media to
promote the technology and build community awareness.
Users’ trainings are critical: the technology is generally new and the effort is to promote
this new technology in rural and semi-urban areas, where educated manpower is scarce.
There is no also accumulated/capitalized knowledge and experience regarding this
technology at community level in rural societies, because the technology is introduced very
recently. As study results indicated, the proportion of respondents that haven’t received any
kind of training (except the post-construction orientation) is very large. Hence, due attention
should be given to pre-construction and post-construction trainings tailored with the specific
needs of rural communities. Refresher trainings and experience sharing visits must also be
integral parts of the users’ capacity building efforts. Standardized training manuals should be
available to training facilitators and periodic training programs should be organized to the
current biogas users. Model biogas users could also be identified in every village and use
their potential to train other users at grassroots level.
Provide adequate after-sale services: no matter what the level of support from the
government and other stakeholders is, the performance of the biogas plants and their
functionality ultimately depends on the users’ commitment and capability to use the
technology. However, considering the educational level of family heads/family members in
rural communities, biogas users can hardly address all the problems and issues emerged with
their biogas system by themselves. So they need continuous follow-up and support to make
them effectively operate their biogas system and enjoy its benefits to the maximum possible
level. However, as discussed with program implementers in survey areas, the emphasis given
to attract new biogas users to join the program is much higher than the attention given to the
existing biogas users, which is somehow contradicting. Caution must be taken not to push as
much current biogas users as newly attracted users. Significant number of respondents
reported that they haven’t received important after-sale services or they were not satisfied
with the services provided.
37
Improve accessibility of spare parts and appliances: since the biogas sub-sector is
underdeveloped and at an infant stage in the country, so far it doesn’t develop the market that
supply materials and spare parts, which calls strong hands of the government and all relevant
stakeholders to fill the market gap. As evidenced from survey results, the performance and
functionality of existing biogas plants are highly compromised due to unavailability of
necessary spare parts and materials locally. When the owners are not able to use their biogas
for intended purposes properly (mostly due to lack of materials and spare parts), they lack
interest to maintain the functionality of their biogas and gradually they might cease feeding
and operating it. Hence, it is critical to find the mechanism through which biogas-related
materials and parts are accessible to rural communities easily.
Improve local infrastructure and capacity of technicians at woreda level: woreda
technicians are the most important actors in serving the biogas users at grassroots level, as
they are at the lowest structure of the program and have direct contact with biogas users. As
mentioned by respondents, woreda technicians are the one who provided after-sale services to
the majority of biogas users, not masons or BCEs. At the same time, it has been observed that
significant numbers of respondents were not satisfied with the services they received, mainly
due to unavailability of service providers (masons/BCEs) whenever they need the services.
From woreda technicians, it has also been reflected that, the current infrastructure and
capacity of the woreda offices are not adequate to accommodate the growing demand for
services from biogas users. Capacities of woreda offices in terms of logistics, structures and
systems need to be strengthened to enhance ensure after-sale services are delivered properly
by masons/BCEs and effective monitoring and follow-up mechanisms are in place. Existing
technicians also need refresher trainings skill enhancement exposures to better serve the
biogas users.
Strengthen existing information and communication system: For such newly introduced
technologies with large expansion prospects, effective service delivery system and
communication mechanisms are required. Information must be collected continuously,
analysed properly and utilized effectively, especially at regional level. The existing users’
database needs to be updated and should including the functionality status of biogas plants.
Appropriate and sufficient supervision and monitoring system should be in place by SNV to
make sure that the services provided in the field comply with the standards set at the PID.
Lower level structures complain that the responses from higher level structures of the
program are usually inadequate. The monitoring is particularly needed to make sure that the
services promised to biogas users in the PID reach the users in reality.

38
Annexes

39
1. References
Boers W, Workneh K, Esthete G. National biogas programme ethiopia programme
implementation document. 2008.
CDM, AMS-II.G. Small-scale Methodology: Energy efficiency measures in thermal
applications of non-renewable biomass, Version 10.0
CSA. Annual agricultural sample survey 2012/2013: livestock and livestock characteristics,
2; 2012.
CSA. Annual agricultural sample survey 2012/2013: farm management practices. 2013.
CSA, Population Projection of Ethiopia for All Regions At Wereda Level from 2014 - 2017.
Addis Ababa : CSA.
Esthete G, Sonder K, ter Heegde F. Report on the feasibility study of a national programme
for domestic biogas in Ethiopia. 2006.
Federal Democratic Republic of Ethiopia, Climate-Resilient Green Economy (CRGE)
Strategy, Addis Ababa, 2011
Gebreegziabher Z. Household fuel consumption and resource use in rural–urban Ethiopia.
Wageningen: Wageningen University; 2007.
Gebreegziabher Z. Interview with Dr. Zenebe Gebreegziabher, Senior Research Fellow at
EDRI; 2014.
IEA. Ethiopia's Final Consumption ((2011)), ⟨http://www.iea.org/Sankey/index.
html#?c=Ethiopia&s=Finalconsumption; 2014
NL Agency, Making charcoal production in Sub Sahara Africa sustainable, NL Energy and
Climate Change, The Netherlands, December 2010.
Simons L. Fortune Cooker: Leon Simons at TEDxUtrechtUniversity. Utrecht, The
Netherlands: TEDx Utrecht University; 2012.
Wiskerke, W. (2008). Towards a sustainable biomass energy supply for rural livelihoods in
semi-arid areas. Shinyaya, Utrecht, University of Utrecht.
Wolde-Ghiorgis W. Renewable energy for rural development in Ethiopia: the case for new
energy policies and institutional reform. Energy Policy 2002;30:1095–105.
http://dx.doi.org/10.1016/S0301-4215(02)00061-7.
Worku M. Interview with Mogues Worku, Executive Director of LEM – Ethiopia; 2014.

40
2. Data collection tools
SNV NETHERLANDS DEVELOPMENT ORGANIZATION
[BIOGAS USERS’ SURVEY (BUS)]
[NATIONAL BIOGAS PROGRAM OF ETHIOPIA]
[JANUARY 2019]
QUESTIONNAIRE IDENTIFICATION NUMBER
[___|___|___|___|___]
Introduction:
“My name is [name of the enumerator] and I’m working for MoWIE, NBPE and we’re interviewing
people here in your locality in order to find out information from biogas users about the performance
of biogas digesters, maintenance service, satisfaction level of program participants, etc.. The survey
will help the program obtain timely and relevant information to be used for future interventions in
order to improve the benefits of using biogas technology to the users and farther the effectiveness of
the program.”
Confidentiality and consent:
As you are a biogas user, I’m going to ask you some questions. Your answers are completely
confidential and will never be used for purposes other than biogas program improvement endeavors.
your honest answers to these questions will help us better understand the existing situation regarding
effectiveness of biogas technology in your locality. We would greatly appreciate your help in
responding to this survey. The survey will take about 45 minutes. Would you be willing to
participate?”
_________________________________________
(Signature of interviewer certifying that informed consent has been given verbally by respondent)
INTERVIEWER’S INFORMATION
Name of interviewer
Date of the interview
Time of the interview Started [_______] Ended [_______]
Signature of the interviewer
Name of the supervisor
Signature of the supervisor
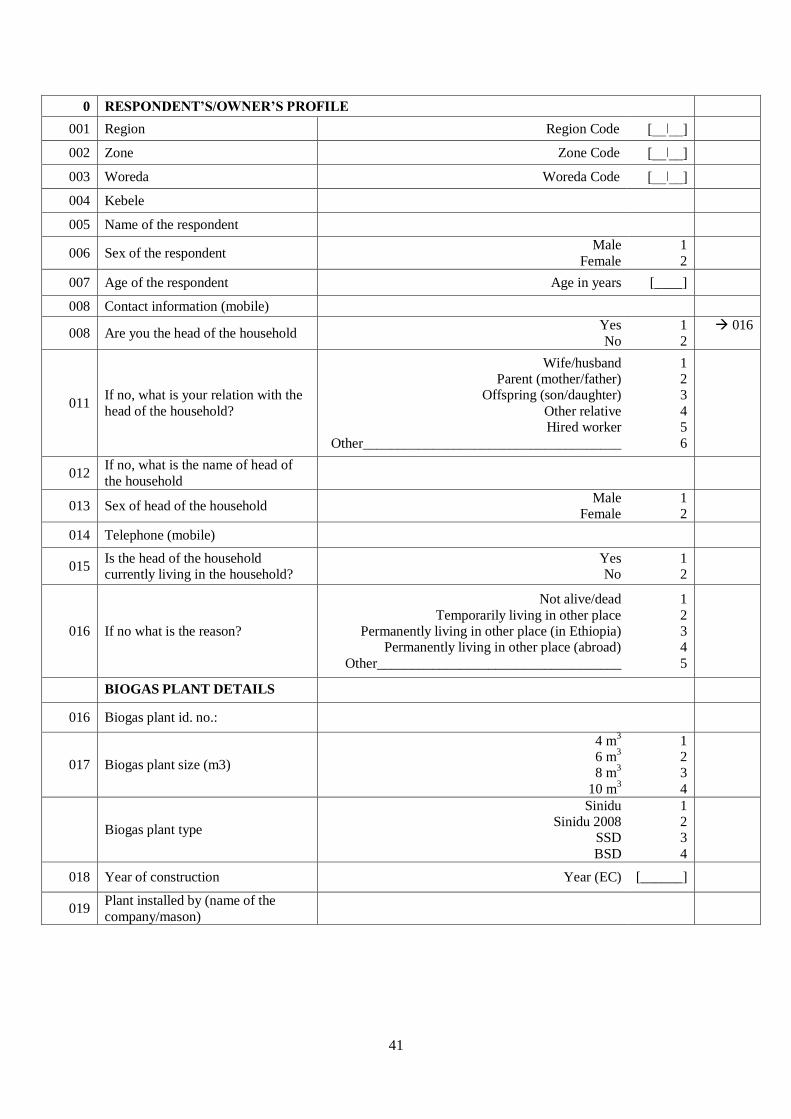
41
0 RESPONDENT’S/OWNER’S PROFILE
001 Region Region Code [__ǀ__]
002 Zone Zone Code [__ǀ__]
003 Woreda Woreda Code [__ǀ__]
004 Kebele
005 Name of the respondent
006 Sex of the respondent Male
Female
1
2
007 Age of the respondent Age in years [____]
008 Contact information (mobile)
008 Are you the head of the household Yes
No
1
2
016
011 If no, what is your relation with the
head of the household?
Wife/husband Parent (mother/father)
Offspring (son/daughter)
Other relative Hired worker
Other_____________________________________
1 2 3
4 5
6
012 If no, what is the name of head of
the household
013 Sex of head of the household Male
Female 1 2
014 Telephone (mobile)
015 Is the head of the household currently living in the household?
Yes No
1 2
016 If no what is the reason?
Not alive/dead
Temporarily living in other place Permanently living in other place (in Ethiopia)
Permanently living in other place (abroad)
Other___________________________________
1
2 3 4
5
BIOGAS PLANT DETAILS
016 Biogas plant id. no.:
017 Biogas plant size (m3)
4 m3
6 m3
8 m3
10 m3
1 2 3
4
Biogas plant type
Sinidu Sinidu 2008
SSD
BSD
1 2 3
4
018 Year of construction Year (EC) [______]
019 Plant installed by (name of the
company/mason)
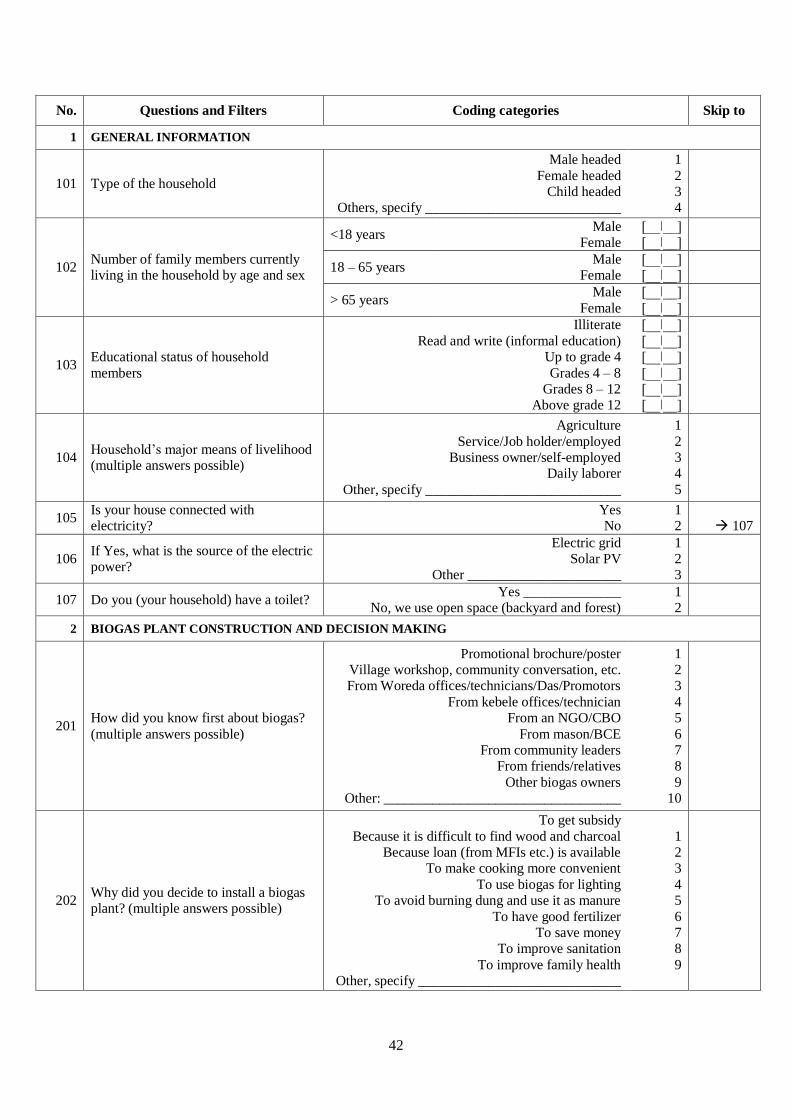
42
No. Questions and Filters Coding categories Skip to
1 GENERAL INFORMATION
101 Type of the household
Male headed
Female headed Child headed
Others, specify ____________________________
1
2 3 4
102 Number of family members currently living in the household by age and sex
<18 years Male
Female [__ǀ__] [__ǀ__]
18 – 65 years Male
Female [__ǀ__] [__ǀ__]
> 65 years Male
Female
[__ǀ__]
[__ǀ__]
103 Educational status of household
members
Illiterate
Read and write (informal education) Up to grade 4
Grades 4 – 8 Grades 8 – 12
Above grade 12
[__ǀ__]
[__ǀ__] [__ǀ__]
[__ǀ__] [__ǀ__] [__ǀ__]
104 Household’s major means of livelihood (multiple answers possible)
Agriculture
Service/Job holder/employed Business owner/self-employed
Daily laborer
Other, specify ____________________________
1
2 3 4
5
105 Is your house connected with electricity?
Yes No
1 2
107
106 If Yes, what is the source of the electric power?
Electric grid Solar PV
Other ______________________
1 2 3
107 Do you (your household) have a toilet? Yes ______________
No, we use open space (backyard and forest) 1 2
2 BIOGAS PLANT CONSTRUCTION AND DECISION MAKING
201 How did you know first about biogas?
(multiple answers possible)
Promotional brochure/poster Village workshop, community conversation, etc. From Woreda offices/technicians/Das/Promotors
From kebele offices/technician From an NGO/CBO
From mason/BCE From community leaders
From friends/relatives
Other biogas owners Other: __________________________________
1 2 3
4 5
6 7 8
9 10
202 Why did you decide to install a biogas plant? (multiple answers possible)
To get subsidy
Because it is difficult to find wood and charcoal Because loan (from MFIs etc.) is available
To make cooking more convenient
To use biogas for lighting To avoid burning dung and use it as manure
To have good fertilizer To save money
To improve sanitation
To improve family health Other, specify _____________________________
1 2 3
4 5
6 7 8
9
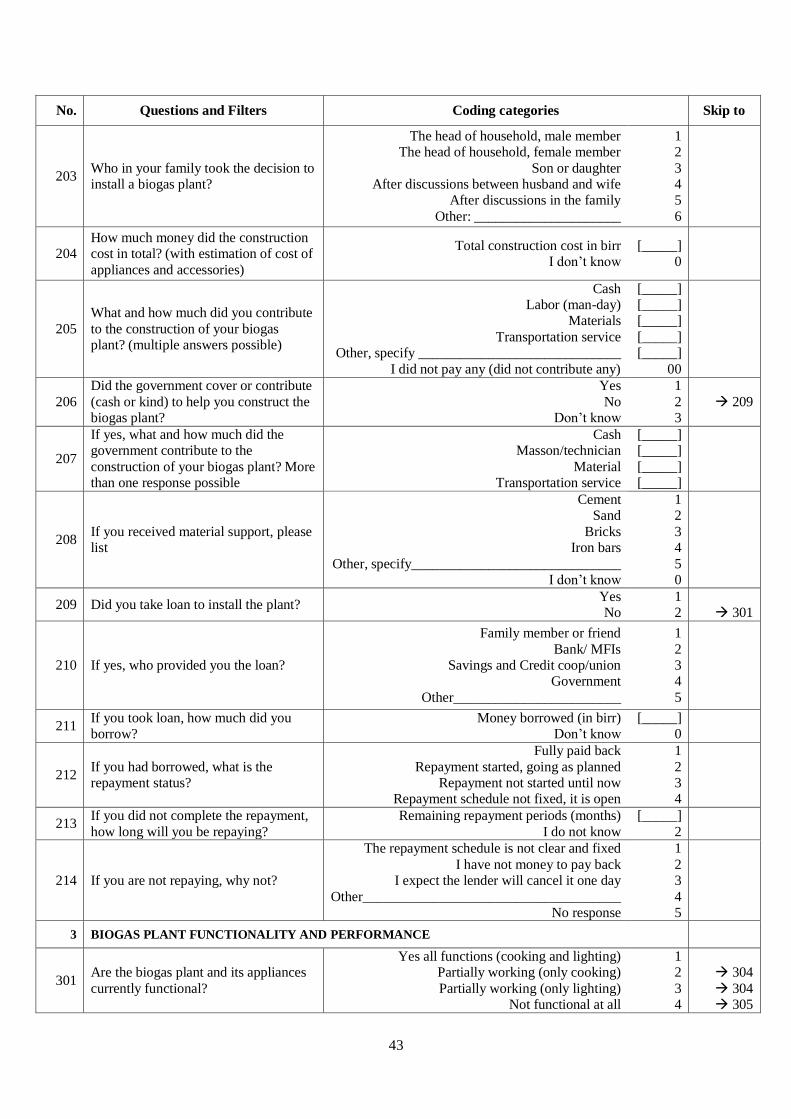
43
No. Questions and Filters Coding categories Skip to
203 Who in your family took the decision to install a biogas plant?
The head of household, male member The head of household, female member
Son or daughter After discussions between husband and wife
After discussions in the family
Other: _____________________
1 2
3 4 5
6
204 How much money did the construction cost in total? (with estimation of cost of
appliances and accessories)
Total construction cost in birr I don’t know
[_____] 0
205
What and how much did you contribute
to the construction of your biogas plant? (multiple answers possible)
Cash Labor (man-day)
Materials
Transportation service Other, specify _____________________________
I did not pay any (did not contribute any)
[_____] [_____] [_____]
[_____] [_____]
00
206
Did the government cover or contribute
(cash or kind) to help you construct the biogas plant?
Yes
No Don’t know
1
2 3
209
207
If yes, what and how much did the government contribute to the
construction of your biogas plant? More than one response possible
Cash Masson/technician
Material Transportation service
[_____] [_____]
[_____] [_____]
208 If you received material support, please list
Cement Sand
Bricks Iron bars
Other, specify______________________________ I don’t know
1 2
3 4
5 0
209 Did you take loan to install the plant? Yes No
1 2
301
210 If yes, who provided you the loan?
Family member or friend
Bank/ MFIs Savings and Credit coop/union
Government
Other________________________
1
2 3 4
5
211 If you took loan, how much did you borrow?
Money borrowed (in birr) Don’t know
[_____] 0
212 If you had borrowed, what is the repayment status?
Fully paid back
Repayment started, going as planned Repayment not started until now
Repayment schedule not fixed, it is open
1
2 3 4
213 If you did not complete the repayment,
how long will you be repaying?
Remaining repayment periods (months)
I do not know
[_____]
2
214 If you are not repaying, why not?
The repayment schedule is not clear and fixed
I have not money to pay back I expect the lender will cancel it one day
Other_____________________________________ No response
1
2 3
4 5
3 BIOGAS PLANT FUNCTIONALITY AND PERFORMANCE
301 Are the biogas plant and its appliances
currently functional?
Yes all functions (cooking and lighting) Partially working (only cooking)
Partially working (only lighting) Not functional at all
1 2
3 4
304
304 305
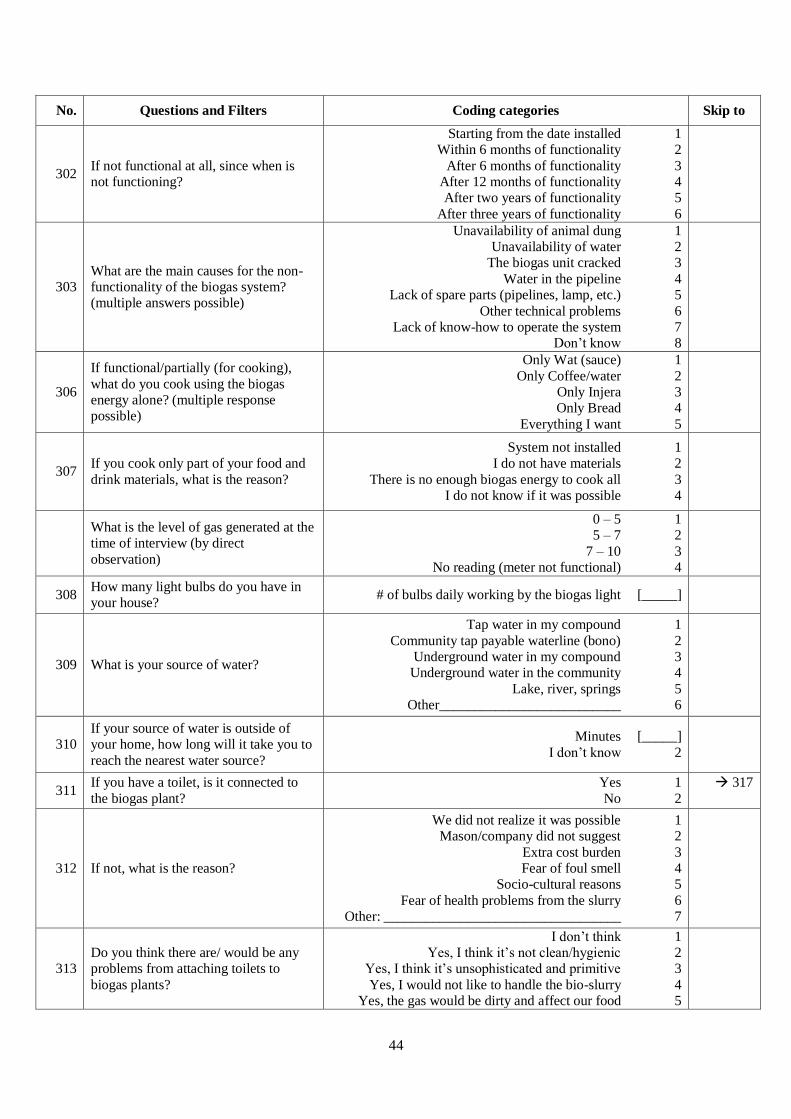
44
No. Questions and Filters Coding categories Skip to
302 If not functional at all, since when is not functioning?
Starting from the date installed Within 6 months of functionality
After 6 months of functionality After 12 months of functionality After two years of functionality
After three years of functionality
1 2
3 4 5
6
303 What are the main causes for the non-functionality of the biogas system? (multiple answers possible)
Unavailability of animal dung Unavailability of water
The biogas unit cracked
Water in the pipeline Lack of spare parts (pipelines, lamp, etc.)
Other technical problems Lack of know-how to operate the system
Don’t know
1 2 3
4 5
6 7 8
306
If functional/partially (for cooking),
what do you cook using the biogas energy alone? (multiple response possible)
Only Wat (sauce)
Only Coffee/water Only Injera Only Bread
Everything I want
1
2 3 4
5
307 If you cook only part of your food and
drink materials, what is the reason?
System not installed I do not have materials
There is no enough biogas energy to cook all I do not know if it was possible
1 2
3 4
What is the level of gas generated at the time of interview (by direct
observation)
0 – 5 5 – 7
7 – 10 No reading (meter not functional)
1 2
3 4
308 How many light bulbs do you have in your house?
# of bulbs daily working by the biogas light [_____]
309 What is your source of water?
Tap water in my compound
Community tap payable waterline (bono) Underground water in my compound Underground water in the community
Lake, river, springs Other__________________________
1
2 3 4
5 6
310 If your source of water is outside of your home, how long will it take you to
reach the nearest water source?
Minutes
I don’t know
[_____]
2
311 If you have a toilet, is it connected to
the biogas plant?
Yes
No
1
2
317
312 If not, what is the reason?
We did not realize it was possible Mason/company did not suggest
Extra cost burden Fear of foul smell
Socio-cultural reasons
Fear of health problems from the slurry Other: __________________________________
1 2
3 4 5
6 7
313 Do you think there are/ would be any problems from attaching toilets to
biogas plants?
I don’t think Yes, I think it’s not clean/hygienic
Yes, I think it’s unsophisticated and primitive
Yes, I would not like to handle the bio-slurry Yes, the gas would be dirty and affect our food
1 2 3
4 5
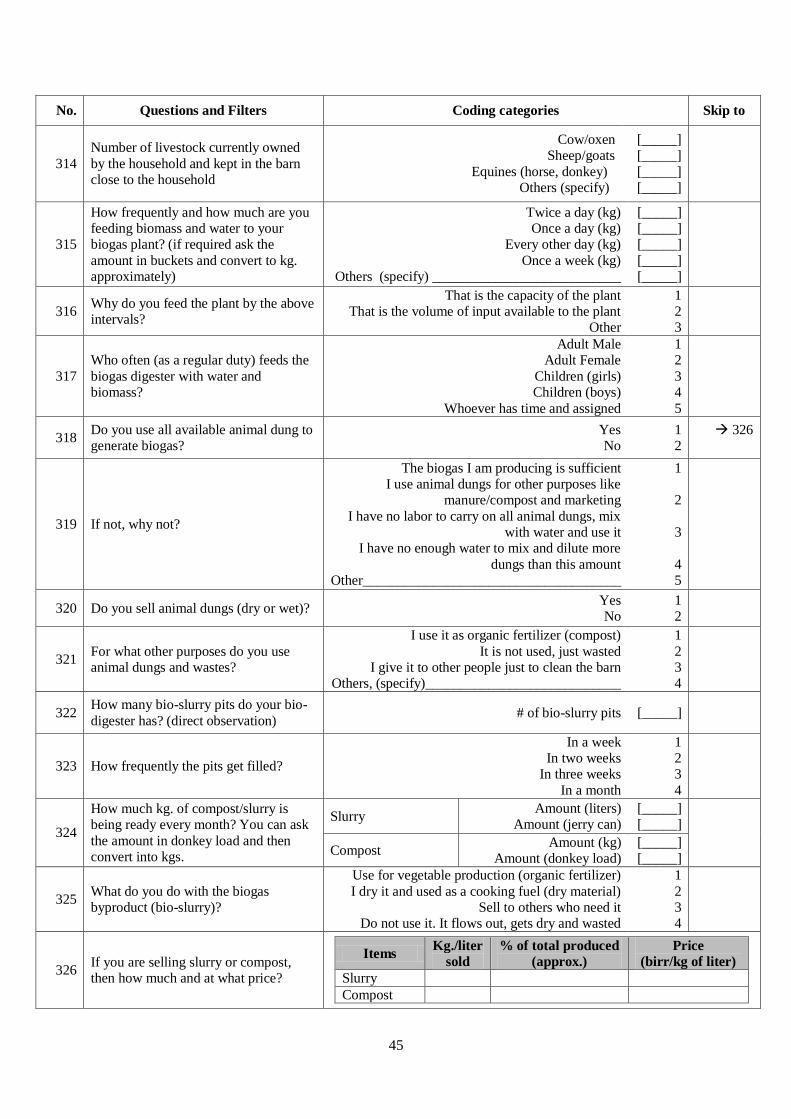
45
No. Questions and Filters Coding categories Skip to
314
Number of livestock currently owned
by the household and kept in the barn close to the household
Cow/oxen Sheep/goats
Equines (horse, donkey) Others (specify)
[_____] [_____]
[_____] [_____]
315
How frequently and how much are you feeding biomass and water to your biogas plant? (if required ask the
amount in buckets and convert to kg. approximately)
Twice a day (kg) Once a day (kg)
Every other day (kg)
Once a week (kg) Others (specify) ___________________________
[_____] [_____] [_____]
[_____] [_____]
316 Why do you feed the plant by the above intervals?
That is the capacity of the plant That is the volume of input available to the plant
Other
1 2 3
317
Who often (as a regular duty) feeds the
biogas digester with water and biomass?
Adult Male Adult Female
Children (girls) Children (boys)
Whoever has time and assigned
1 2
3 4
5
318 Do you use all available animal dung to generate biogas?
Yes No
1 2
326
319 If not, why not?
The biogas I am producing is sufficient I use animal dungs for other purposes like
manure/compost and marketing
I have no labor to carry on all animal dungs, mix with water and use it
I have no enough water to mix and dilute more
dungs than this amount Other_____________________________________
1
2
3
4 5
320 Do you sell animal dungs (dry or wet)? Yes
No 1 2
321 For what other purposes do you use animal dungs and wastes?
I use it as organic fertilizer (compost)
It is not used, just wasted I give it to other people just to clean the barn
Others, (specify)____________________________
1
2 3 4
322 How many bio-slurry pits do your bio-
digester has? (direct observation) # of bio-slurry pits [_____]
323 How frequently the pits get filled?
In a week In two weeks
In three weeks
In a month
1 2 3
4
324
How much kg. of compost/slurry is being ready every month? You can ask
the amount in donkey load and then convert into kgs.
Slurry Amount (liters)
Amount (jerry can) [_____] [_____]
Compost Amount (kg)
Amount (donkey load) [_____] [_____]
325 What do you do with the biogas byproduct (bio-slurry)?
Use for vegetable production (organic fertilizer)
I dry it and used as a cooking fuel (dry material) Sell to others who need it
Do not use it. It flows out, gets dry and wasted
1
2 3 4
326 If you are selling slurry or compost, then how much and at what price?
Items Kg./liter
sold
% of total produced
(approx.)
Price
(birr/kg of liter)
Slurry
Compost
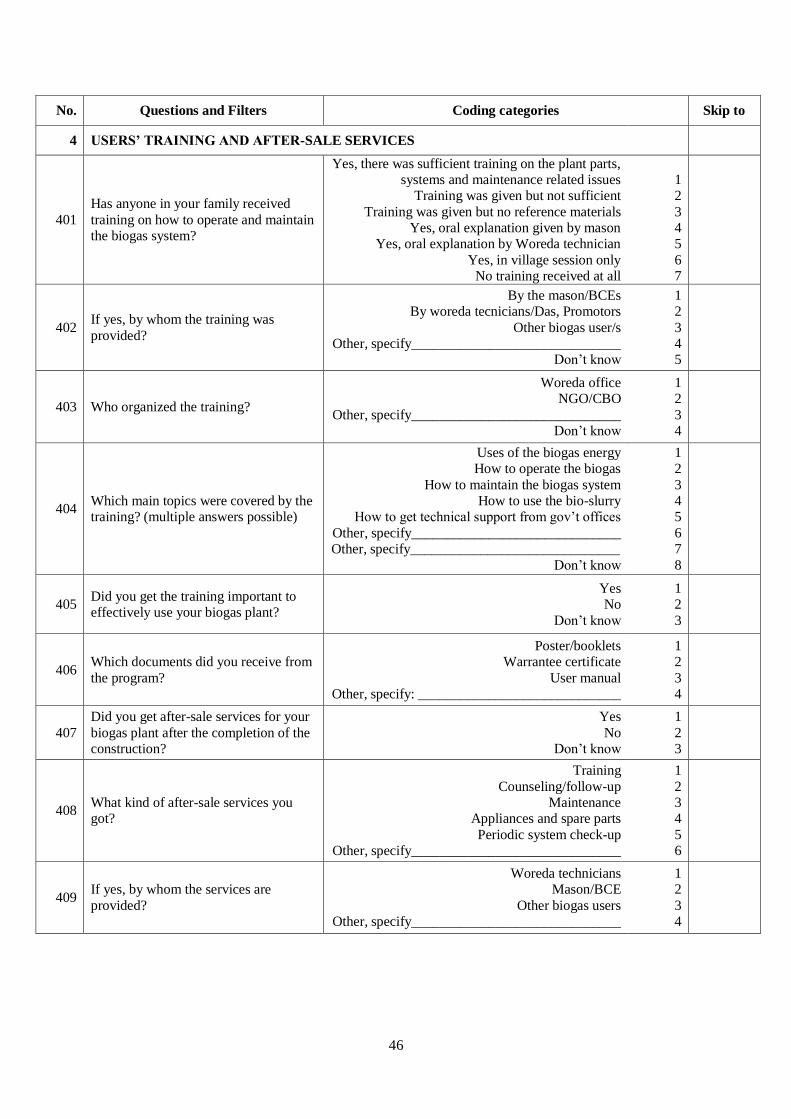
46
No. Questions and Filters Coding categories Skip to
4 USERS’ TRAINING AND AFTER-SALE SERVICES
401
Has anyone in your family received
training on how to operate and maintain the biogas system?
Yes, there was sufficient training on the plant parts, systems and maintenance related issues
Training was given but not sufficient
Training was given but no reference materials Yes, oral explanation given by mason
Yes, oral explanation by Woreda technician
Yes, in village session only No training received at all
1 2
3 4 5
6 7
402 If yes, by whom the training was
provided?
By the mason/BCEs By woreda tecnicians/Das, Promotors
Other biogas user/s Other, specify______________________________
Don’t know
1 2
3 4 5
403 Who organized the training?
Woreda office NGO/CBO
Other, specify______________________________ Don’t know
1 2
3 4
404 Which main topics were covered by the training? (multiple answers possible)
Uses of the biogas energy How to operate the biogas
How to maintain the biogas system How to use the bio-slurry
How to get technical support from gov’t offices
Other, specify______________________________ Other, specify______________________________
Don’t know
1 2
3 4 5
6 7
8
405 Did you get the training important to effectively use your biogas plant?
Yes No
Don’t know
1 2
3
406 Which documents did you receive from
the program?
Poster/booklets Warrantee certificate
User manual Other, specify: _____________________________
1 2
3 4
407
Did you get after-sale services for your
biogas plant after the completion of the construction?
Yes
No Don’t know
1
2 3
408 What kind of after-sale services you got?
Training
Counseling/follow-up Maintenance
Appliances and spare parts
Periodic system check-up Other, specify______________________________
1
2 3 4
5 6
409 If yes, by whom the services are
provided?
Woreda technicians Mason/BCE
Other biogas users Other, specify______________________________
1 2
3 4
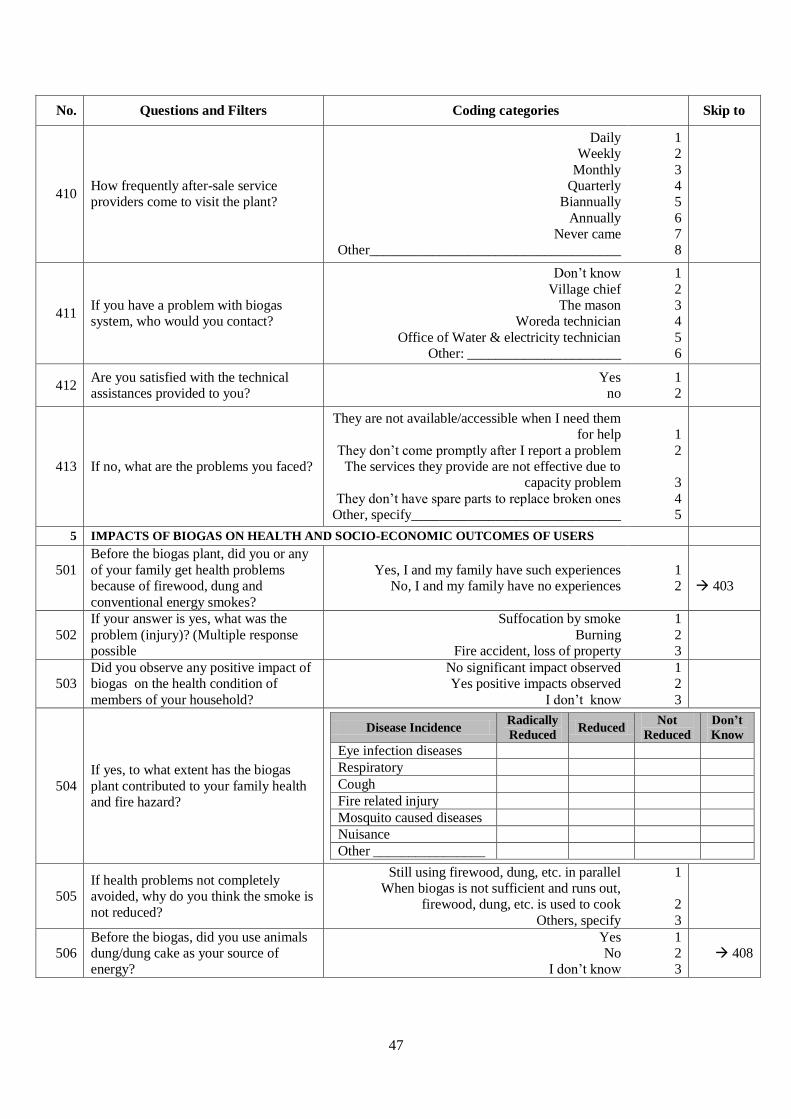
47
No. Questions and Filters Coding categories Skip to
410 How frequently after-sale service providers come to visit the plant?
Daily Weekly
Monthly Quarterly
Biannually
Annually Never came
Other____________________________________
1 2
3 4 5
6 7 8
411 If you have a problem with biogas system, who would you contact?
Don’t know
Village chief The mason
Woreda technician
Office of Water & electricity technician Other: ______________________
1
2 3 4
5 6
412 Are you satisfied with the technical assistances provided to you?
Yes no
1 2
413 If no, what are the problems you faced?
They are not available/accessible when I need them for help
They don’t come promptly after I report a problem The services they provide are not effective due to
capacity problem
They don’t have spare parts to replace broken ones Other, specify______________________________
1
2
3
4 5
5 IMPACTS OF BIOGAS ON HEALTH AND SOCIO-ECONOMIC OUTCOMES OF USERS
501
Before the biogas plant, did you or any
of your family get health problems because of firewood, dung and
conventional energy smokes?
Yes, I and my family have such experiences No, I and my family have no experiences
1 2
403
502
If your answer is yes, what was the
problem (injury)? (Multiple response possible
Suffocation by smoke
Burning Fire accident, loss of property
1
2 3
503 Did you observe any positive impact of biogas on the health condition of
members of your household?
No significant impact observed Yes positive impacts observed
I don’t know
1 2
3
504
If yes, to what extent has the biogas
plant contributed to your family health and fire hazard?
Disease Incidence Radically
Reduced Reduced
Not
Reduced
Don’t
Know
Eye infection diseases
Respiratory
Cough
Fire related injury
Mosquito caused diseases
Nuisance
Other ________________
505 If health problems not completely avoided, why do you think the smoke is
not reduced?
Still using firewood, dung, etc. in parallel When biogas is not sufficient and runs out,
firewood, dung, etc. is used to cook
Others, specify
1
2
3
506 Before the biogas, did you use animals dung/dung cake as your source of energy?
Yes No
I don’t know
1 2 3
408

48
No. Questions and Filters Coding categories Skip to
507 If yes, what were the impacts of preparing dung? (Multiple response possible)
Takes long time & compete with other activities
including schooling It has sanitation and hygiene related problems
We used to carry long distances to dispose
Other ___________________________________
1 2 3
4
508 Have any members of your family suffered from biogas originated fire
accidents during last 12 Months?
Yes
No
1
2
412
509 Before the biogas, did you use firewood as your source of energy?
Yes No
I don’t know
1 2 3
510 If yes, who did mostly collect the firewood?
Adult Male
Adult Female Both
Children (girls)
Children (boys)
1
2 3 4
5
511 If Yes, how long did it take to collect the firewood in a day?
≤ 1 hour 1 – 3 hours 3 – 6 hours
6 – 9 hours It takes the whole day
1 2 3
4 5
512
What problems and disadvantages have
you and your family being experienced during wood, dung cake and other biomass collection and transportation?
(multiple answers possible)
Children and women had extra burdens Girls & women were exposed to abuse & violence
Injuries while collecting and carrying wood Exposed to wild animal attacks
Children used to be late from school, shortage of
time for study Children stay without food and water in forests
1 2
3 4
5 6
513
To what extent has abuses and violence
against girls and women reduced because of the biogas plant?
Totally avoided (removed) Significantly reduced
Reduced Remained the same
1 2
3 4
514
To what extent has the biogas plant
helped women to engage in social and productive activities?
Significantly assisted
Moderately assisted Remained the same
1
2 3
515
Do you save any time by cooking with
your biogas stove instead of wood or charcoal?
Yes No
1 2
416
516 If yes, how much time did you save? Time saved (minutes per day)
Don’t know/no response [_____]
0
517 How do the family members use time saved due to biogas installation?
(multiple answers possible)
Literacy classes
Recreation Social works
Agricultural Work
Study Income Generating Activity
1
2 3 4
5 6
518 Do you save any money by cooking with your biogas stove instead of wood
or charcoal?
Yes
No
1
2
419
519 If yes, how much money did you save? Birr saved per month
Don’t know/no response [_____]
0
520 Do your children study in the evening and night without limit using the biogas
light?
Yes Sometimes yes, because there is shortage of energy
No
1 2
3

49
No. Questions and Filters Coding categories Skip to
521 How long do you children study using the biogas light?
They study until they are tired They study until mid-night and starting early in the
morning They study only until family affairs including
eating finished
1
2
3
522 For how many hours do your children study in the evening
Study hours BEFORE the biogas (hrs.) Study hours AFTER the biogas (hrs.)
[____] [____]
523
Using the table below, record what and how much were the three major crops the user produced with/without
chemical/organic fertilizer before and after the biogas.
Before the biogas After the biogas
Crop Area
(hctr.)
Fertilizer used (kg) Yield
(quintal) Crop
Area
(hctr.)
Fertilizer used (kg) Yield
(quintal) Chem. Orgn. Chem. Orgn.
524 What are the impacts of slurry manure application on the incidences of insects
and diseases on crops?
No Effect Decreased a little Decreased greatly
Don't know
1 2 3
4
525 Have you decreased the use of chemical fertilizers after you install your biogas system?
No
Decreased a little Decreased greatly
Don't know
1
2 3 4
6 LOCAL/GLOBAL ENVIRONMENTAL IMPACT OF BIOGAS
601
What were your sources of domestic energy (cooking, lighting and heating) before the biogas plant? (Multiple
response possible)
Wood
Dung cake Kerosene
LPG
Electricity Other sources, specify _______________
1
2 3 4
5 6
602 If you used to collect and use wood as energy sources, what were the sources
of the wood?
Own trees planted Public (common area) forest and trees
Government forest (protected) Buying from private and government forest
1 2
3 4
603 If you used firewood before biogas, how did you collect firewood?
(multiple answers possible)
Pick up dry twigs Pruning of branches
Cutting of live trees Cutting of dead trees
1 2
3 4
604
What is the estimated amount of woody
biomass you use for your domestic cooking and lighting energy? (ask them daily consumption and change to month
if it is easier)
Items (expenses/month) Before the
biogas Current
Wood (human/animal load)
Charcoal (sack)
605
Has your total energy expenditure
reduced since your biogas system was installed?
Yes
No
1
2
507
606 If yes, how much it was reduced? Birr per month
Don’t know/unable to estimate [_____]
0
607 Do you still use wood, dung or charcoal for cooking?
Yes, I always use wood, dung or charcoal to cook
Yes, sometimes I use a wood, dung or charcoal to cook
No, I fully cook with biogas
1 2 3
509

50
No. Questions and Filters Coding categories Skip to
608 Why do you still use wood, dung cake or charcoal for cooking?
Because there is no enough biogas to cooking even small things
Because the biogas energy is not helpful to bake injera and bread
Because I need wood/dung cake/ charcoal to
prepare some special dishes (e.g. grilling meat) or liquor
1
2
3
609
How has the forest or tree coverage
changed over past years in your surrounding (the source of firewood or
charcoal)?
Increased Decreased The same
1 2 3
511 511
610
If your answer is increasing forest
cover, what are the main reasons? (Multiple response possible)
Increasing # of households are using alternative energy sources
More trees are being planted and lands are closed Individuals plant trees every year on their lands
All are causes for increased forest cover
1
2 3 4
611 Do other people from your neighbor cut and use wood for their energy needs?
Yes No
1 2
7 BIOGAS USERS SATISFUCTION FROM THE PROGRAM
701 Is your biogas system properly functioning?
Yes, without a problem Yes, but with some minor problems Yes, but with some major problems
Not functional at all
1 2 3
4
603
603
702
If Yes, but with some minor/major
problems, what are these problems you are facing with your plant?
Shortage of water Shortage of animal dung
Shortage of other biomasses to feed the plant Lack of technical skill expert to maintain the
system
Lack of money to maintain the system Not interested to function it
1 2
3
4
5
703
What are the main advantages of the biogas compared to conventional fuel
(e.g.: wood)? (More than one possible answer)
Cooking is faster Cooking is more convenient
Kitchen is cleaner Cleaning dishes is easier/faster
Less problems from smoke Don’t need to collect wood or prepare dung cake Absence of abuse and violence against girls and
women Others: _________________________________
1 2
3 4
5 6
7 8
704
How much you are satisfied with your biogas plant?
1= not satisfied, 2= partially satisfied,
3= fully satisfied
Satisfaction with the plant 1 2 3
Cooking service
Lighting service
Slurry use
Time saving
Health benefits
Environmental benefits
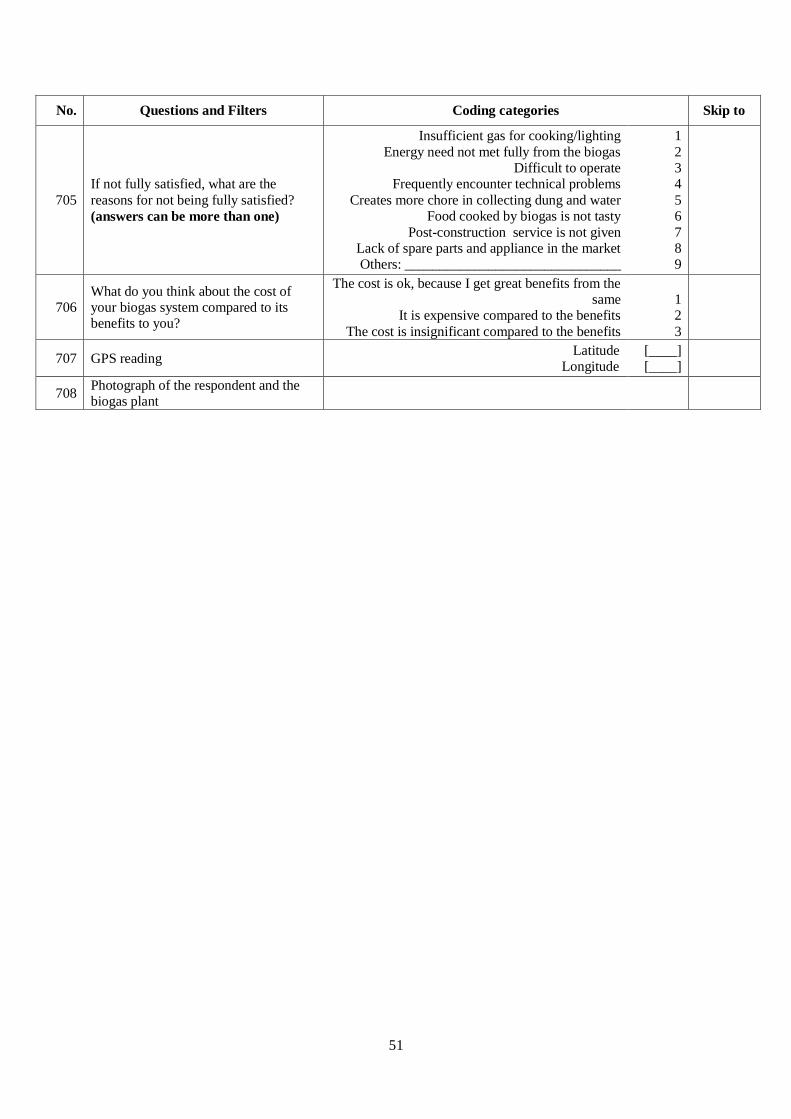
51
No. Questions and Filters Coding categories Skip to
705
If not fully satisfied, what are the
reasons for not being fully satisfied?
(answers can be more than one)
Insufficient gas for cooking/lighting
Energy need not met fully from the biogas Difficult to operate
Frequently encounter technical problems
Creates more chore in collecting dung and water Food cooked by biogas is not tasty
Post-construction service is not given Lack of spare parts and appliance in the market Others: _______________________________
1
2 3 4
5 6
7 8 9
706 What do you think about the cost of your biogas system compared to its benefits to you?
The cost is ok, because I get great benefits from the same
It is expensive compared to the benefits
The cost is insignificant compared to the benefits
1 2
3
707 GPS reading Latitude
Longitude [____] [____]
708 Photograph of the respondent and the biogas plant

52
Focus Group Discussion Guiding Questions
What are the sources of information and the status of public awareness about biogas
technology?
Probe: Who and how provide information about biogas technology in the locality? How far the
information is relevant and the means is appropriate?
How a decision to have a biogas plant is made and how was the construction process?
Probe: Why and who decides to have a biogas plant in your households? How did communities
finance the construction of the plant? Which inputs were difficult to get and how did you manage to
get them? Are there financial facilities providing loan/credit services to help biogas plant
construction in your locality? Is the credit/loan service adequate and relevant?
How far biogas plants are functional and serving energy needs in the locality?
Probe: For what purposes biogas energy is being used mostly by users? Is there a difference among
family members in using the biogas energy for their particular purposes (for example women for
cooking, men and children for lighting)? How much bio-slurry biogas users produce? For what
purposes bio-slurry is being used in the locality? What are the advantages of using the bio-slurry?
Are toilets attached to biogas plants in the locality? If yes how it is helpful? If not, why? How do you
evaluate the training, follow-up and technical support provision efforts by the woreda technician and
the mason? What are major problems with biogas plants related to feeding, repair, etc.? How do you
manage solving these problems?
Benefits from using biogas plants and users’ satisfaction level
Probe: What major benefits people get from using biogas plants (from lighting, cooking, fertilizer,
and etc. points of views in terms of money, time, health, environment, productivity, etc.. Before/after
comparison is important)? Are people generally satisfied with these benefits from their biogas plants?
If yes, how? If not, why not? Do biogas plant owners still use other traditional energy sources like
fuel wood, dung, etc.? If yes, why? Do you observe any health problems or improvements in health
condition in your household from using biogas? What are the impacts of biogas energy on
agricultural production, children’s education, women’s participation in social as well as economic
activities? Do you still use biomasses for our energy needs? How much? Why? How do you observe
the impacts of biogas energy in improving environmental condition? How far you are satisfied with
biogas technology? What are factors for user’s satisfaction?
Do you have any additional comments?
Probe: What are your suggestions to the program to convince other farmers to invest for this biogas
system? Do you have any other suggestions for improving the biogas program?

53
KII Guiding questions
1. What is the mission of your organization in serving people in this area?
2. What your organization does, particularly with regards to Biogas Technology?
3. What is the relationship between your organization and the MoWIE regarding the national
biogas program design, planning and implementation and monitoring?
4. If you have any information, how far people in this locality are using biogas technology?
5. What positive impacts have been observed in the lives of people in this area?
6. What your organization does in promoting the technology and maximizing positive impacts of
biogas in this locality?
7. How do you evaluate the performance of the biogas program in Ethiopia (successes and gaps)?
8. What do you think are the reasons for success and factors that hindered the successful
implementation of the program (if not to your level of expectation and to its program plan and
budget)?
9. To what extent has the GoE/MoWIE/NBPE used your products and services to effectively and
efficiently implement and manage the biogas program?
10. What are the challenges and opportunities of promoting biogas technology in this area?
11. Considering the current biogas technology and its demand as a renewable energy sources, food
security, public health and related social and climatic benefits as well as based on your
experience, what do you recommend to GoE so that it can make the utmost benefit out of this
technology?
54
3. Survey Methodology
Defining the survey population
Our survey population, from which we are draw our sample households constitutes:
• Households in Amhara, Oromia, Tigray and SNNP regional states (survey regions)
• With bio-digester plants built with the support of NBPE
• With biogas plants constructed in the period 2015 – 2017
According to project documents, a total of 7,802 bio-digesters were constructed in the period
2015 – 2017 and the owners of these biogas plants establish our survey population. Number
of biogas plants built in each project period for each region is presented in the table below.
Region 2015 2016 2017 Total
Oromia 364 736 756 1,856
Amhara 601 724 1,330 2,655
SNNPR 513 603 503 1,619
Tigray 782 490 400 1,672
Total 2,260 2,553 2,989 7,802
Based on these numbers, our sample size, the randomization process and its distribution
among survey areas on the basis of Proportional to Population Size (PPS) procedure are
discussed below.
Sample size determination
The factors and parameters that must be considered in determining the sample size are many
but they revolve chiefly around the measurement objectives of the survey. Sample size
determination in terms of the key estimates desired, target population, precision and
confidence level wanted and clustering is discussed below.
1. Z statistic (Z): In these studies, investigators present their results with 90% confidence
intervals (CI).
2. Degree of Variability (P): The other factor, the degree of variability in the attributes being
measured, refers to the distribution of attributes in the population. The more heterogeneous
a population, the larger the sample size required to obtain a given level of precision. The
less variable (more homogeneous) a population, the smaller the sample size. A proportion
of 50% indicates a greater level of variability than either 20% or 80%. This is because
20% and 80% indicate that a large majority do not or do, respectively, have the attribute of
interest. Because a proportion of 0.5 indicates the maximum variability in a population, it
is often used in determining a more conservative sample size, that is, the sample size may
be larger than if the true variability of the population attribute were used. Accordingly, as
we are conducting the survey in four different regions, we use 50% (0.5) degree of
variability to ensure maximum representation of the population in all survey areas.
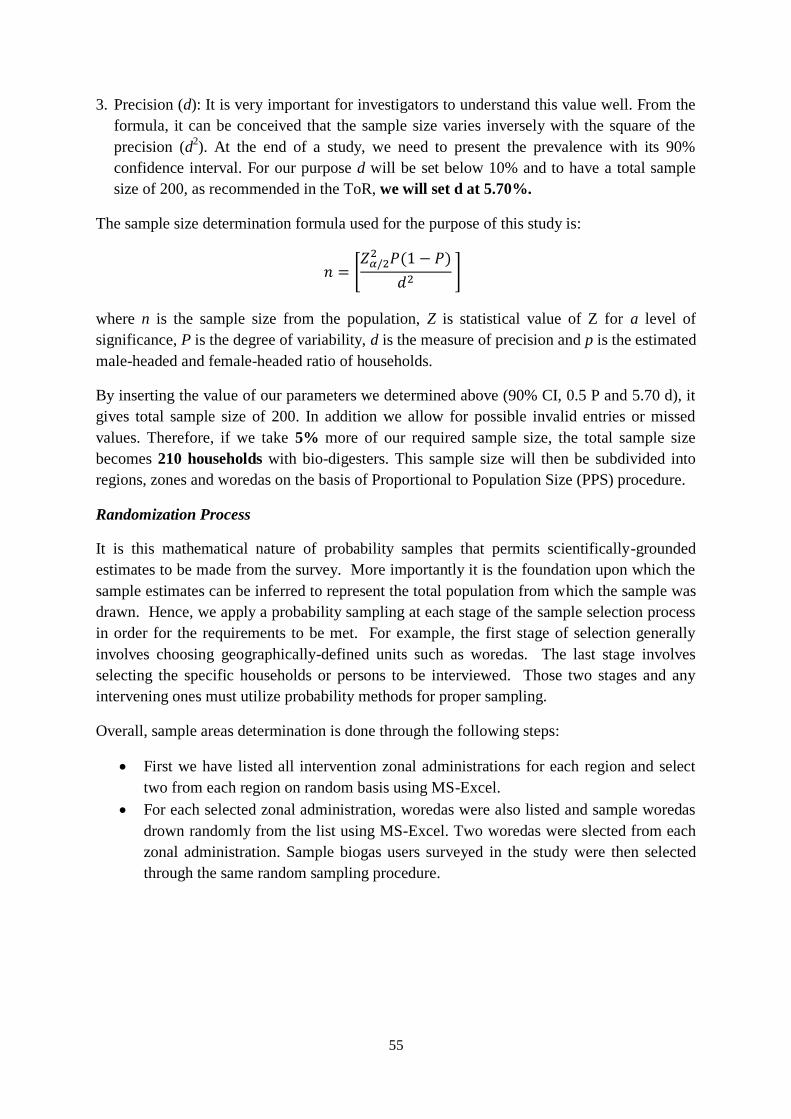
55
3. Precision (d): It is very important for investigators to understand this value well. From the
formula, it can be conceived that the sample size varies inversely with the square of the
precision (d2). At the end of a study, we need to present the prevalence with its 90%
confidence interval. For our purpose d will be set below 10% and to have a total sample
size of 200, as recommended in the ToR, we will set d at 5.70%.
The sample size determination formula used for the purpose of this study is:
[
]
where n is the sample size from the population, Z is statistical value of Z for a level of
significance, P is the degree of variability, d is the measure of precision and p is the estimated
male-headed and female-headed ratio of households.
By inserting the value of our parameters we determined above (90% CI, 0.5 P and 5.70 d), it
gives total sample size of 200. In addition we allow for possible invalid entries or missed
values. Therefore, if we take 5% more of our required sample size, the total sample size
becomes 210 households with bio-digesters. This sample size will then be subdivided into
regions, zones and woredas on the basis of Proportional to Population Size (PPS) procedure.
Randomization Process
It is this mathematical nature of probability samples that permits scientifically-grounded
estimates to be made from the survey. More importantly it is the foundation upon which the
sample estimates can be inferred to represent the total population from which the sample was
drawn. Hence, we apply a probability sampling at each stage of the sample selection process
in order for the requirements to be met. For example, the first stage of selection generally
involves choosing geographically-defined units such as woredas. The last stage involves
selecting the specific households or persons to be interviewed. Those two stages and any
intervening ones must utilize probability methods for proper sampling.
Overall, sample areas determination is done through the following steps:
First we have listed all intervention zonal administrations for each region and select
two from each region on random basis using MS-Excel.
For each selected zonal administration, woredas were also listed and sample woredas
drown randomly from the list using MS-Excel. Two woredas were slected from each
zonal administration. Sample biogas users surveyed in the study were then selected
through the same random sampling procedure.
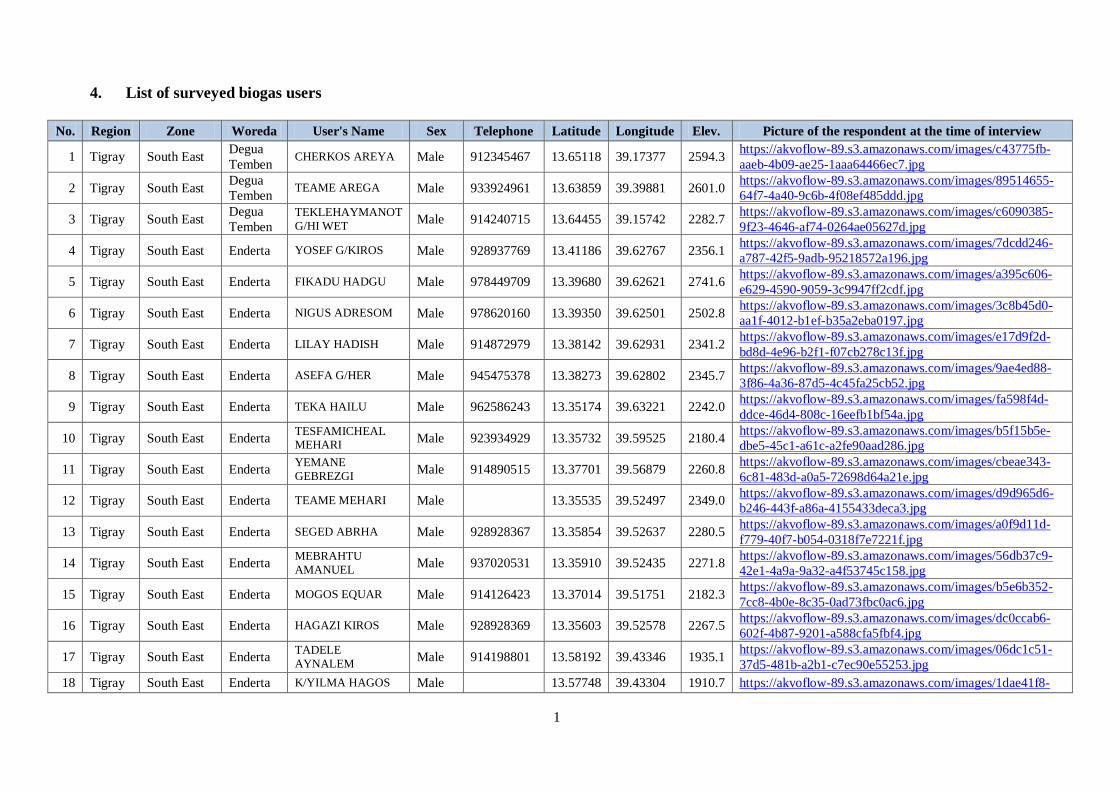
1
4. List of surveyed biogas users
No. Region Zone Woreda User's Name Sex Telephone Latitude Longitude Elev. Picture of the respondent at the time of interview
1 Tigray South East Degua
Temben CHERKOS AREYA Male 912345467 13.65118 39.17377 2594.3
https://akvoflow-89.s3.amazonaws.com/images/c43775fb-
aaeb-4b09-ae25-1aaa64466ec7.jpg
2 Tigray South East Degua
Temben TEAME AREGA Male 933924961 13.63859 39.39881 2601.0
https://akvoflow-89.s3.amazonaws.com/images/89514655-
64f7-4a40-9c6b-4f08ef485ddd.jpg
3 Tigray South East Degua
Temben
TEKLEHAYMANOT
G/HI WET Male 914240715 13.64455 39.15742 2282.7
https://akvoflow-89.s3.amazonaws.com/images/c6090385-
9f23-4646-af74-0264ae05627d.jpg
4 Tigray South East Enderta YOSEF G/KIROS Male 928937769 13.41186 39.62767 2356.1 https://akvoflow-89.s3.amazonaws.com/images/7dcdd246-
a787-42f5-9adb-95218572a196.jpg
5 Tigray South East Enderta FIKADU HADGU Male 978449709 13.39680 39.62621 2741.6 https://akvoflow-89.s3.amazonaws.com/images/a395c606-
e629-4590-9059-3c9947ff2cdf.jpg
6 Tigray South East Enderta NIGUS ADRESOM Male 978620160 13.39350 39.62501 2502.8 https://akvoflow-89.s3.amazonaws.com/images/3c8b45d0-
aa1f-4012-b1ef-b35a2eba0197.jpg
7 Tigray South East Enderta LILAY HADISH Male 914872979 13.38142 39.62931 2341.2 https://akvoflow-89.s3.amazonaws.com/images/e17d9f2d-
bd8d-4e96-b2f1-f07cb278c13f.jpg
8 Tigray South East Enderta ASEFA G/HER Male 945475378 13.38273 39.62802 2345.7 https://akvoflow-89.s3.amazonaws.com/images/9ae4ed88-
3f86-4a36-87d5-4c45fa25cb52.jpg
9 Tigray South East Enderta TEKA HAILU Male 962586243 13.35174 39.63221 2242.0 https://akvoflow-89.s3.amazonaws.com/images/fa598f4d-
ddce-46d4-808c-16eefb1bf54a.jpg
10 Tigray South East Enderta TESFAMICHEAL MEHARI
Male 923934929 13.35732 39.59525 2180.4 https://akvoflow-89.s3.amazonaws.com/images/b5f15b5e-
dbe5-45c1-a61c-a2fe90aad286.jpg
11 Tigray South East Enderta YEMANE
GEBREZGI Male 914890515 13.37701 39.56879 2260.8
https://akvoflow-89.s3.amazonaws.com/images/cbeae343-
6c81-483d-a0a5-72698d64a21e.jpg
12 Tigray South East Enderta TEAME MEHARI Male
13.35535 39.52497 2349.0 https://akvoflow-89.s3.amazonaws.com/images/d9d965d6-
b246-443f-a86a-4155433deca3.jpg
13 Tigray South East Enderta SEGED ABRHA Male 928928367 13.35854 39.52637 2280.5 https://akvoflow-89.s3.amazonaws.com/images/a0f9d11d-
f779-40f7-b054-0318f7e7221f.jpg
14 Tigray South East Enderta MEBRAHTU
AMANUEL Male 937020531 13.35910 39.52435 2271.8
https://akvoflow-89.s3.amazonaws.com/images/56db37c9-
42e1-4a9a-9a32-a4f53745c158.jpg
15 Tigray South East Enderta MOGOS EQUAR Male 914126423 13.37014 39.51751 2182.3 https://akvoflow-89.s3.amazonaws.com/images/b5e6b352-
7cc8-4b0e-8c35-0ad73fbc0ac6.jpg
16 Tigray South East Enderta HAGAZI KIROS Male 928928369 13.35603 39.52578 2267.5 https://akvoflow-89.s3.amazonaws.com/images/dc0ccab6-
602f-4b87-9201-a588cfa5fbf4.jpg
17 Tigray South East Enderta TADELE
AYNALEM Male 914198801 13.58192 39.43346 1935.1
https://akvoflow-89.s3.amazonaws.com/images/06dc1c51-
37d5-481b-a2b1-c7ec90e55253.jpg
18 Tigray South East Enderta K/YILMA HAGOS Male
13.57748 39.43304 1910.7 https://akvoflow-89.s3.amazonaws.com/images/1dae41f8-
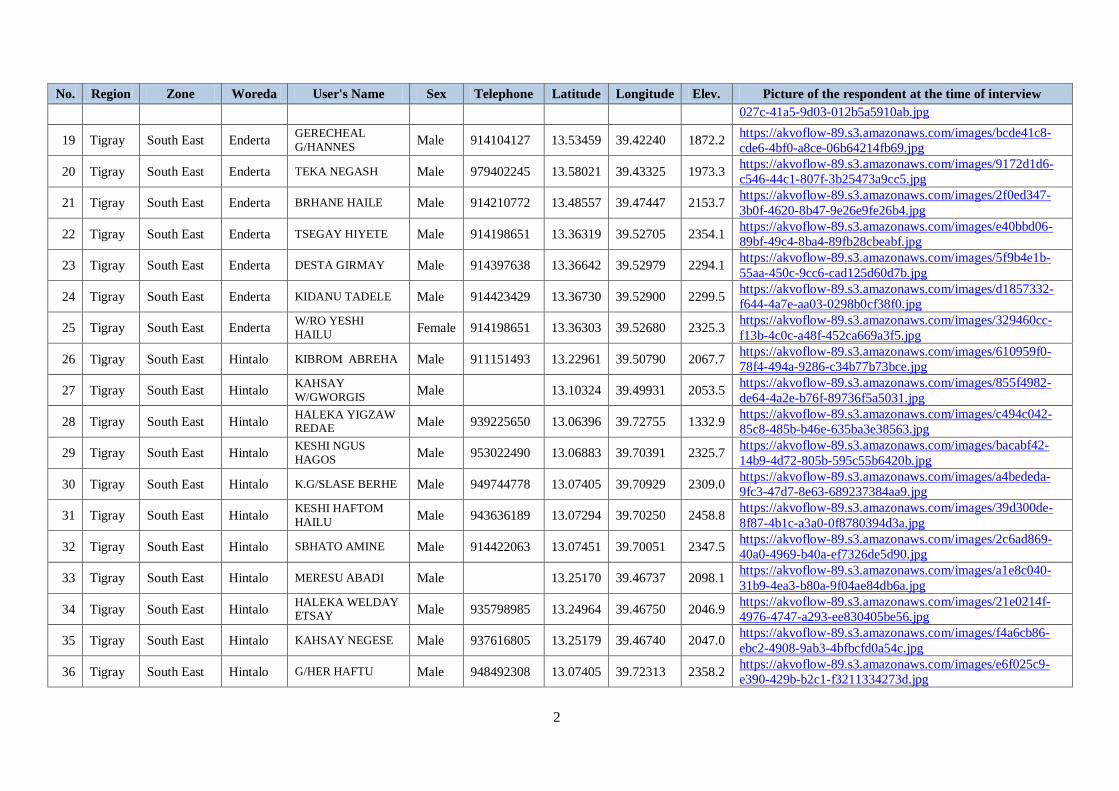
2
No. Region Zone Woreda User's Name Sex Telephone Latitude Longitude Elev. Picture of the respondent at the time of interview
027c-41a5-9d03-012b5a5910ab.jpg
19 Tigray South East Enderta GERECHEAL
G/HANNES Male 914104127 13.53459 39.42240 1872.2
https://akvoflow-89.s3.amazonaws.com/images/bcde41c8-
cde6-4bf0-a8ce-06b64214fb69.jpg
20 Tigray South East Enderta TEKA NEGASH Male 979402245 13.58021 39.43325 1973.3 https://akvoflow-89.s3.amazonaws.com/images/9172d1d6-
c546-44c1-807f-3b25473a9cc5.jpg
21 Tigray South East Enderta BRHANE HAILE Male 914210772 13.48557 39.47447 2153.7 https://akvoflow-89.s3.amazonaws.com/images/2f0ed347-
3b0f-4620-8b47-9e26e9fe26b4.jpg
22 Tigray South East Enderta TSEGAY HIYETE Male 914198651 13.36319 39.52705 2354.1 https://akvoflow-89.s3.amazonaws.com/images/e40bbd06-
89bf-49c4-8ba4-89fb28cbeabf.jpg
23 Tigray South East Enderta DESTA GIRMAY Male 914397638 13.36642 39.52979 2294.1 https://akvoflow-89.s3.amazonaws.com/images/5f9b4e1b-
55aa-450c-9cc6-cad125d60d7b.jpg
24 Tigray South East Enderta KIDANU TADELE Male 914423429 13.36730 39.52900 2299.5 https://akvoflow-89.s3.amazonaws.com/images/d1857332-
f644-4a7e-aa03-0298b0cf38f0.jpg
25 Tigray South East Enderta W/RO YESHI
HAILU Female 914198651 13.36303 39.52680 2325.3
https://akvoflow-89.s3.amazonaws.com/images/329460cc-
f13b-4c0c-a48f-452ca669a3f5.jpg
26 Tigray South East Hintalo KIBROM ABREHA Male 911151493 13.22961 39.50790 2067.7 https://akvoflow-89.s3.amazonaws.com/images/610959f0-
78f4-494a-9286-c34b77b73bce.jpg
27 Tigray South East Hintalo KAHSAY
W/GWORGIS Male
13.10324 39.49931 2053.5
https://akvoflow-89.s3.amazonaws.com/images/855f4982-
de64-4a2e-b76f-89736f5a5031.jpg
28 Tigray South East Hintalo HALEKA YIGZAW REDAE
Male 939225650 13.06396 39.72755 1332.9 https://akvoflow-89.s3.amazonaws.com/images/c494c042-
85c8-485b-b46e-635ba3e38563.jpg
29 Tigray South East Hintalo KESHI NGUS
HAGOS Male 953022490 13.06883 39.70391 2325.7
https://akvoflow-89.s3.amazonaws.com/images/bacabf42-
14b9-4d72-805b-595c55b6420b.jpg
30 Tigray South East Hintalo K.G/SLASE BERHE Male 949744778 13.07405 39.70929 2309.0 https://akvoflow-89.s3.amazonaws.com/images/a4bededa-
9fc3-47d7-8e63-689237384aa9.jpg
31 Tigray South East Hintalo KESHI HAFTOM
HAILU Male 943636189 13.07294 39.70250 2458.8
https://akvoflow-89.s3.amazonaws.com/images/39d300de-
8f87-4b1c-a3a0-0f8780394d3a.jpg
32 Tigray South East Hintalo SBHATO AMINE Male 914422063 13.07451 39.70051 2347.5 https://akvoflow-89.s3.amazonaws.com/images/2c6ad869-
40a0-4969-b40a-ef7326de5d90.jpg
33 Tigray South East Hintalo MERESU ABADI Male
13.25170 39.46737 2098.1 https://akvoflow-89.s3.amazonaws.com/images/a1e8c040-
31b9-4ea3-b80a-9f04ae84db6a.jpg
34 Tigray South East Hintalo HALEKA WELDAY ETSAY
Male 935798985 13.24964 39.46750 2046.9 https://akvoflow-89.s3.amazonaws.com/images/21e0214f-
4976-4747-a293-ee830405be56.jpg
35 Tigray South East Hintalo KAHSAY NEGESE Male 937616805 13.25179 39.46740 2047.0 https://akvoflow-89.s3.amazonaws.com/images/f4a6cb86-
ebc2-4908-9ab3-4bfbcfd0a54c.jpg
36 Tigray South East Hintalo G/HER HAFTU Male 948492308 13.07405 39.72313 2358.2 https://akvoflow-89.s3.amazonaws.com/images/e6f025c9-
e390-429b-b2c1-f3211334273d.jpg
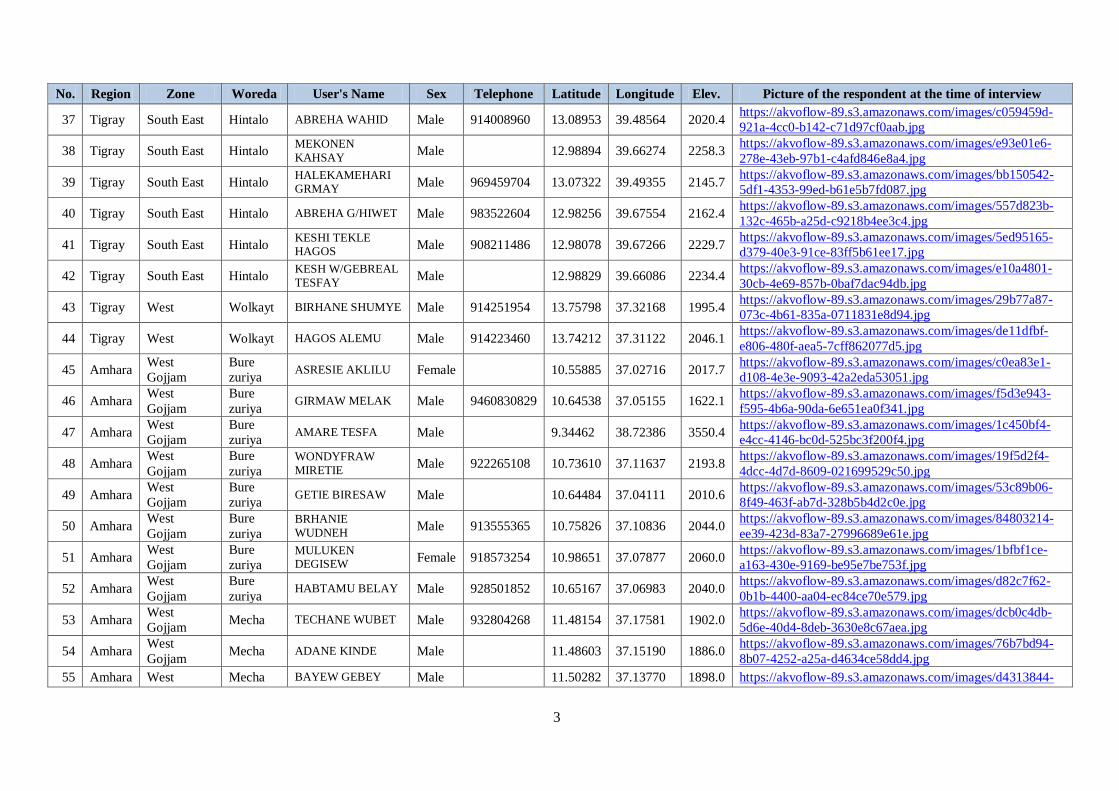
3
No. Region Zone Woreda User's Name Sex Telephone Latitude Longitude Elev. Picture of the respondent at the time of interview
37 Tigray South East Hintalo ABREHA WAHID Male 914008960 13.08953 39.48564 2020.4 https://akvoflow-89.s3.amazonaws.com/images/c059459d-
921a-4cc0-b142-c71d97cf0aab.jpg
38 Tigray South East Hintalo MEKONEN
KAHSAY Male
12.98894 39.66274 2258.3
https://akvoflow-89.s3.amazonaws.com/images/e93e01e6-
278e-43eb-97b1-c4afd846e8a4.jpg
39 Tigray South East Hintalo HALEKAMEHARI GRMAY
Male 969459704 13.07322 39.49355 2145.7 https://akvoflow-89.s3.amazonaws.com/images/bb150542-
5df1-4353-99ed-b61e5b7fd087.jpg
40 Tigray South East Hintalo ABREHA G/HIWET Male 983522604 12.98256 39.67554 2162.4 https://akvoflow-89.s3.amazonaws.com/images/557d823b-
132c-465b-a25d-c9218b4ee3c4.jpg
41 Tigray South East Hintalo KESHI TEKLE HAGOS
Male 908211486 12.98078 39.67266 2229.7 https://akvoflow-89.s3.amazonaws.com/images/5ed95165-
d379-40e3-91ce-83ff5b61ee17.jpg
42 Tigray South East Hintalo KESH W/GEBREAL
TESFAY Male
12.98829 39.66086 2234.4
https://akvoflow-89.s3.amazonaws.com/images/e10a4801-
30cb-4e69-857b-0baf7dac94db.jpg
43 Tigray West Wolkayt BIRHANE SHUMYE Male 914251954 13.75798 37.32168 1995.4 https://akvoflow-89.s3.amazonaws.com/images/29b77a87-
073c-4b61-835a-0711831e8d94.jpg
44 Tigray West Wolkayt HAGOS ALEMU Male 914223460 13.74212 37.31122 2046.1 https://akvoflow-89.s3.amazonaws.com/images/de11dfbf-
e806-480f-aea5-7cff862077d5.jpg
45 Amhara West
Gojjam
Bure
zuriya ASRESIE AKLILU Female
10.55885 37.02716 2017.7
https://akvoflow-89.s3.amazonaws.com/images/c0ea83e1-
d108-4e3e-9093-42a2eda53051.jpg
46 Amhara West
Gojjam
Bure
zuriya GIRMAW MELAK Male 9460830829 10.64538 37.05155 1622.1
https://akvoflow-89.s3.amazonaws.com/images/f5d3e943-
f595-4b6a-90da-6e651ea0f341.jpg
47 Amhara West
Gojjam
Bure
zuriya AMARE TESFA Male
9.34462 38.72386 3550.4
https://akvoflow-89.s3.amazonaws.com/images/1c450bf4-
e4cc-4146-bc0d-525bc3f200f4.jpg
48 Amhara West
Gojjam
Bure
zuriya
WONDYFRAW
MIRETIE Male 922265108 10.73610 37.11637 2193.8
https://akvoflow-89.s3.amazonaws.com/images/19f5d2f4-
4dcc-4d7d-8609-021699529c50.jpg
49 Amhara West
Gojjam
Bure
zuriya GETIE BIRESAW Male
10.64484 37.04111 2010.6
https://akvoflow-89.s3.amazonaws.com/images/53c89b06-
8f49-463f-ab7d-328b5b4d2c0e.jpg
50 Amhara West
Gojjam
Bure
zuriya
BRHANIE
WUDNEH Male 913555365 10.75826 37.10836 2044.0
https://akvoflow-89.s3.amazonaws.com/images/84803214-
ee39-423d-83a7-27996689e61e.jpg
51 Amhara West
Gojjam
Bure
zuriya MULUKEN DEGISEW
Female 918573254 10.98651 37.07877 2060.0 https://akvoflow-89.s3.amazonaws.com/images/1bfbf1ce-
a163-430e-9169-be95e7be753f.jpg
52 Amhara West
Gojjam
Bure
zuriya HABTAMU BELAY Male 928501852 10.65167 37.06983 2040.0
https://akvoflow-89.s3.amazonaws.com/images/d82c7f62-
0b1b-4400-aa04-ec84ce70e579.jpg
53 Amhara West
Gojjam Mecha TECHANE WUBET Male 932804268 11.48154 37.17581 1902.0
https://akvoflow-89.s3.amazonaws.com/images/dcb0c4db-
5d6e-40d4-8deb-3630e8c67aea.jpg
54 Amhara West
Gojjam Mecha ADANE KINDE Male 11.48603 37.15190 1886.0
https://akvoflow-89.s3.amazonaws.com/images/76b7bd94-
8b07-4252-a25a-d4634ce58dd4.jpg
55 Amhara West Mecha BAYEW GEBEY Male 11.50282 37.13770 1898.0 https://akvoflow-89.s3.amazonaws.com/images/d4313844-
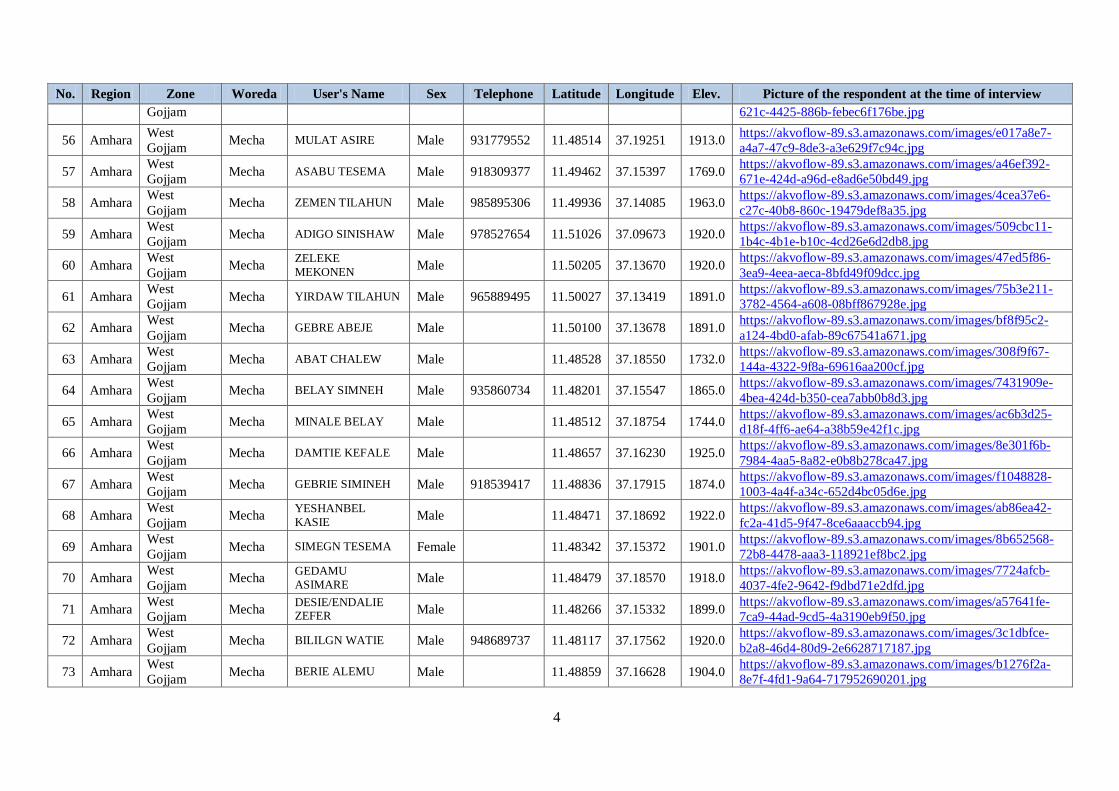
4
No. Region Zone Woreda User's Name Sex Telephone Latitude Longitude Elev. Picture of the respondent at the time of interview
Gojjam 621c-4425-886b-febec6f176be.jpg
56 Amhara West
Gojjam Mecha MULAT ASIRE Male 931779552 11.48514 37.19251 1913.0
https://akvoflow-89.s3.amazonaws.com/images/e017a8e7-
a4a7-47c9-8de3-a3e629f7c94c.jpg
57 Amhara West
Gojjam Mecha ASABU TESEMA Male 918309377 11.49462 37.15397 1769.0
https://akvoflow-89.s3.amazonaws.com/images/a46ef392-
671e-424d-a96d-e8ad6e50bd49.jpg
58 Amhara West
Gojjam Mecha ZEMEN TILAHUN Male 985895306 11.49936 37.14085 1963.0
https://akvoflow-89.s3.amazonaws.com/images/4cea37e6-
c27c-40b8-860c-19479def8a35.jpg
59 Amhara West
Gojjam Mecha ADIGO SINISHAW Male 978527654 11.51026 37.09673 1920.0
https://akvoflow-89.s3.amazonaws.com/images/509cbc11-
1b4c-4b1e-b10c-4cd26e6d2db8.jpg
60 Amhara West
Gojjam Mecha
ZELEKE
MEKONEN Male
11.50205 37.13670 1920.0
https://akvoflow-89.s3.amazonaws.com/images/47ed5f86-
3ea9-4eea-aeca-8bfd49f09dcc.jpg
61 Amhara West
Gojjam Mecha YIRDAW TILAHUN Male 965889495 11.50027 37.13419 1891.0
https://akvoflow-89.s3.amazonaws.com/images/75b3e211-
3782-4564-a608-08bff867928e.jpg
62 Amhara West
Gojjam Mecha GEBRE ABEJE Male 11.50100 37.13678 1891.0
https://akvoflow-89.s3.amazonaws.com/images/bf8f95c2-
a124-4bd0-afab-89c67541a671.jpg
63 Amhara West
Gojjam Mecha ABAT CHALEW Male 11.48528 37.18550 1732.0
https://akvoflow-89.s3.amazonaws.com/images/308f9f67-
144a-4322-9f8a-69616aa200cf.jpg
64 Amhara West
Gojjam Mecha BELAY SIMNEH Male 935860734 11.48201 37.15547 1865.0
https://akvoflow-89.s3.amazonaws.com/images/7431909e-
4bea-424d-b350-cea7abb0b8d3.jpg
65 Amhara West
Gojjam Mecha MINALE BELAY Male 11.48512 37.18754 1744.0
https://akvoflow-89.s3.amazonaws.com/images/ac6b3d25-
d18f-4ff6-ae64-a38b59e42f1c.jpg
66 Amhara West
Gojjam Mecha DAMTIE KEFALE Male 11.48657 37.16230 1925.0
https://akvoflow-89.s3.amazonaws.com/images/8e301f6b-
7984-4aa5-8a82-e0b8b278ca47.jpg
67 Amhara West
Gojjam Mecha GEBRIE SIMINEH Male 918539417 11.48836 37.17915 1874.0
https://akvoflow-89.s3.amazonaws.com/images/f1048828-
1003-4a4f-a34c-652d4bc05d6e.jpg
68 Amhara West
Gojjam Mecha
YESHANBEL
KASIE Male 11.48471 37.18692 1922.0
https://akvoflow-89.s3.amazonaws.com/images/ab86ea42-
fc2a-41d5-9f47-8ce6aaaccb94.jpg
69 Amhara West
Gojjam Mecha SIMEGN TESEMA Female 11.48342 37.15372 1901.0
https://akvoflow-89.s3.amazonaws.com/images/8b652568-
72b8-4478-aaa3-118921ef8bc2.jpg
70 Amhara West
Gojjam Mecha
GEDAMU
ASIMARE Male 11.48479 37.18570 1918.0
https://akvoflow-89.s3.amazonaws.com/images/7724afcb-
4037-4fe2-9642-f9dbd71e2dfd.jpg
71 Amhara West
Gojjam Mecha
DESIE/ENDALIE ZEFER
Male 11.48266 37.15332 1899.0 https://akvoflow-89.s3.amazonaws.com/images/a57641fe-
7ca9-44ad-9cd5-4a3190eb9f50.jpg
72 Amhara West
Gojjam Mecha BILILGN WATIE Male 948689737 11.48117 37.17562 1920.0
https://akvoflow-89.s3.amazonaws.com/images/3c1dbfce-
b2a8-46d4-80d9-2e6628717187.jpg
73 Amhara West
Gojjam Mecha BERIE ALEMU Male
11.48859 37.16628 1904.0
https://akvoflow-89.s3.amazonaws.com/images/b1276f2a-
8e7f-4fd1-9a64-717952690201.jpg

5
No. Region Zone Woreda User's Name Sex Telephone Latitude Longitude Elev. Picture of the respondent at the time of interview
74 Amhara West
Gojjam Mecha
AMILAKU ASIMARE
Male 918082076 11.48379 37.18297 1912.0 https://akvoflow-89.s3.amazonaws.com/images/54700cba-
3ed5-411a-b94e-3a882bb459b2.jpg
75 Amhara West
Gojjam Mecha MISGANEW DEGIE Male 955168376 11.41597 37.04802 1927.0
https://akvoflow-89.s3.amazonaws.com/images/9dfa2799-
c908-4b68-9142-81ee54220b78.jpg
76 Amhara West
Gojjam Mecha TAZEBEW CHANE Male
11.48926 37.16410 1834.0
https://akvoflow-89.s3.amazonaws.com/images/cccaf07a-
8f06-480f-b53e-8a3c46e32219.jpg
77 Amhara West
Gojjam Mecha
GIZACHEW
BIYAZIN Male 934643711 11.48303 37.15989 1972.0
https://akvoflow-89.s3.amazonaws.com/images/a3f3392b-
666e-4320-92d4-513d45663569.jpg
78 Amhara West
Gojjam Mecha HABITAMU ADIS Male 918133812 11.30536 37.03843 2026.0
https://akvoflow-89.s3.amazonaws.com/images/5974c3a9-
9aaf-401e-9fa3-a4569ca81f07.jpg
79 Amhara West
Gojjam Mecha
KESS/WOLDIE
SEWUNET Male 985246500 11.22155 37.08310 2111.0
https://akvoflow-89.s3.amazonaws.com/images/de926996-
b11f-4abb-ae89-d7250547b3a3.jpg
80 Amhara West
Gojjam Mecha
KETELE WONDALE
Male
11.48413 37.16206 1898.0 https://akvoflow-89.s3.amazonaws.com/images/1eaf7d2b-
cec0-401d-b662-7c3705525e00.jpg
81 Amhara West
Gojjam Mecha YIZENGIE AMARE Male
11.50336 37.13730 1877.0
https://akvoflow-89.s3.amazonaws.com/images/55e8d97b-
2bc3-41cb-84b3-2a95a26ce1c1.jpg
82 Amhara West
Gojjam Mecha TEGEGNE FIKADIE Male 948777087 11.49124 37.14668 2057.0
https://akvoflow-89.s3.amazonaws.com/images/c7f05148-
16f2-45a9-af7f-6386dffbccf1.jpg
83 Amhara West
Gojjam Mecha
WUBAYE
YISIMAW Male
11.14773 37.09072 2173.0
https://akvoflow-89.s3.amazonaws.com/images/1a4a6859-
6947-483e-8741-72e2baed7a44.jpg
84 Amhara West
Gojjam Mecha YIHUNE MEKANET Male 973758844 11.18406 37.06115 2098.0
https://akvoflow-89.s3.amazonaws.com/images/0cee9e6f-
03bf-4e1c-9949-3001910f9fc3.jpg
85 Amhara West
Gojjam Mecha SEMIE GETIE Male 11.48866 37.17707 1904.0
https://akvoflow-89.s3.amazonaws.com/images/f84bd474-
40a4-409c-993c-4609b4f63ea2.jpg
86 Amhara West
Gojjam Mecha ZEMEN AMARE Male 11.48351 37.17707 2088.0
https://akvoflow-89.s3.amazonaws.com/images/929eab43-
27e2-460e-abda-79c7cbf650aa.jpg
87 Amhara West
Gojjam Mecha SEMIE BABIL Male 11.48471 37.18297 1904.0
https://akvoflow-89.s3.amazonaws.com/images/bd6e59dc-
3b4a-4c35-8472-9a4e63b272ff.jpg
88 Amhara West
Gojjam Mecha ALEMU NIBRRT Male 11.50124 37.13542 1852.0
https://akvoflow-89.s3.amazonaws.com/images/ebf181b1-
5648-4fd7-a7f7-46393fee27b8.jpg
89 Amhara West
Gojjam Mecha
BAZEZEW
LIJALEM Male 11.57347 37.36436 69.9
https://akvoflow-89.s3.amazonaws.com/images/e3d60c9f-
3e7c-4421-96ff-ddc2d6f0aa89.jpg
90 Amhara West
Gojjam Mecha TAFERE ATANAW Male 963941381 11.50100 37.13678 1891.0
https://akvoflow-89.s3.amazonaws.com/images/9c29f5f6-
bd19-4416-a86b-650c9fe0d8c7.jpg
91 Amhara West
Gojjam Mecha AMESHE DEGU Male 11.14773 37.09072 2173.0
https://akvoflow-89.s3.amazonaws.com/images/c5557500-
5d86-41e6-95b6-5f5f60259a4a.jpg
92 Amhara West Mecha ALELIGN MOGES Male 11.48836 37.17915 1874.0 https://akvoflow-89.s3.amazonaws.com/images/a4a2f477-
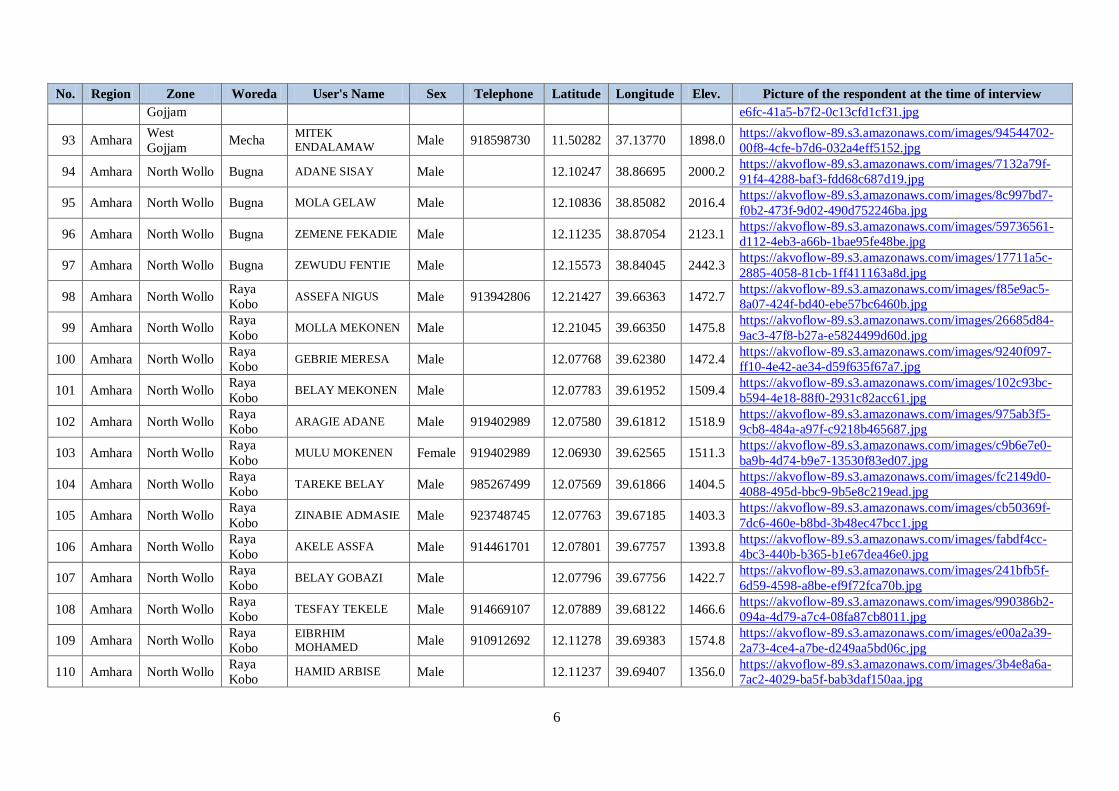
6
No. Region Zone Woreda User's Name Sex Telephone Latitude Longitude Elev. Picture of the respondent at the time of interview
Gojjam e6fc-41a5-b7f2-0c13cfd1cf31.jpg
93 Amhara West
Gojjam Mecha
MITEK
ENDALAMAW Male 918598730 11.50282 37.13770 1898.0
https://akvoflow-89.s3.amazonaws.com/images/94544702-
00f8-4cfe-b7d6-032a4eff5152.jpg
94 Amhara North Wollo Bugna ADANE SISAY Male
12.10247 38.86695 2000.2 https://akvoflow-89.s3.amazonaws.com/images/7132a79f-
91f4-4288-baf3-fdd68c687d19.jpg
95 Amhara North Wollo Bugna MOLA GELAW Male
12.10836 38.85082 2016.4 https://akvoflow-89.s3.amazonaws.com/images/8c997bd7-
f0b2-473f-9d02-490d752246ba.jpg
96 Amhara North Wollo Bugna ZEMENE FEKADIE Male
12.11235 38.87054 2123.1 https://akvoflow-89.s3.amazonaws.com/images/59736561-
d112-4eb3-a66b-1bae95fe48be.jpg
97 Amhara North Wollo Bugna ZEWUDU FENTIE Male
12.15573 38.84045 2442.3 https://akvoflow-89.s3.amazonaws.com/images/17711a5c-
2885-4058-81cb-1ff411163a8d.jpg
98 Amhara North Wollo Raya
Kobo ASSEFA NIGUS Male 913942806 12.21427 39.66363 1472.7
https://akvoflow-89.s3.amazonaws.com/images/f85e9ac5-
8a07-424f-bd40-ebe57bc6460b.jpg
99 Amhara North Wollo Raya
Kobo MOLLA MEKONEN Male
12.21045 39.66350 1475.8
https://akvoflow-89.s3.amazonaws.com/images/26685d84-
9ac3-47f8-b27a-e5824499d60d.jpg
100 Amhara North Wollo Raya
Kobo GEBRIE MERESA Male
12.07768 39.62380 1472.4
https://akvoflow-89.s3.amazonaws.com/images/9240f097-
ff10-4e42-ae34-d59f635f67a7.jpg
101 Amhara North Wollo Raya
Kobo BELAY MEKONEN Male
12.07783 39.61952 1509.4
https://akvoflow-89.s3.amazonaws.com/images/102c93bc-
b594-4e18-88f0-2931c82acc61.jpg
102 Amhara North Wollo Raya
Kobo ARAGIE ADANE Male 919402989 12.07580 39.61812 1518.9
https://akvoflow-89.s3.amazonaws.com/images/975ab3f5-
9cb8-484a-a97f-c9218b465687.jpg
103 Amhara North Wollo Raya
Kobo MULU MOKENEN Female 919402989 12.06930 39.62565 1511.3
https://akvoflow-89.s3.amazonaws.com/images/c9b6e7e0-
ba9b-4d74-b9e7-13530f83ed07.jpg
104 Amhara North Wollo Raya
Kobo TAREKE BELAY Male 985267499 12.07569 39.61866 1404.5
https://akvoflow-89.s3.amazonaws.com/images/fc2149d0-
4088-495d-bbc9-9b5e8c219ead.jpg
105 Amhara North Wollo Raya
Kobo ZINABIE ADMASIE Male 923748745 12.07763 39.67185 1403.3
https://akvoflow-89.s3.amazonaws.com/images/cb50369f-
7dc6-460e-b8bd-3b48ec47bcc1.jpg
106 Amhara North Wollo Raya
Kobo AKELE ASSFA Male 914461701 12.07801 39.67757 1393.8
https://akvoflow-89.s3.amazonaws.com/images/fabdf4cc-
4bc3-440b-b365-b1e67dea46e0.jpg
107 Amhara North Wollo Raya
Kobo BELAY GOBAZI Male
12.07796 39.67756 1422.7
https://akvoflow-89.s3.amazonaws.com/images/241bfb5f-
6d59-4598-a8be-ef9f72fca70b.jpg
108 Amhara North Wollo Raya
Kobo TESFAY TEKELE Male 914669107 12.07889 39.68122 1466.6
https://akvoflow-89.s3.amazonaws.com/images/990386b2-
094a-4d79-a7c4-08fa87cb8011.jpg
109 Amhara North Wollo Raya
Kobo
EIBRHIM
MOHAMED Male 910912692 12.11278 39.69383 1574.8
https://akvoflow-89.s3.amazonaws.com/images/e00a2a39-
2a73-4ce4-a7be-d249aa5bd06c.jpg
110 Amhara North Wollo Raya
Kobo HAMID ARBISE Male
12.11237 39.69407 1356.0
https://akvoflow-89.s3.amazonaws.com/images/3b4e8a6a-
7ac2-4029-ba5f-bab3daf150aa.jpg

7
No. Region Zone Woreda User's Name Sex Telephone Latitude Longitude Elev. Picture of the respondent at the time of interview
111 Oromia East
Wollega Sibu Sire LAMI GEMEDA Male
9.04322 36.86832 1845.0
https://akvoflow-89.s3.amazonaws.com/images/735b52ba-
b9a2-4d42-9668-24f1f40c2d91.jpg
112 Oromia East
Wollega Sibu Sire FANTA GUDEYA Male 924404250 9.03791 36.86307 1822.0
https://akvoflow-89.s3.amazonaws.com/images/bb228ddc-
6946-4ba3-8671-1175709a18f3.jpg
113 Oromia East
Wollega Sibu Sire YADESA GEBDA Male
8.95747 36.85822 1513.0
https://akvoflow-89.s3.amazonaws.com/images/aff90043-
4847-4ee7-b38e-9e00ae8233d4.jpg
114 Oromia Jimma Gomma SIRBA MITIKU Male 917265548 7.91112 36.69776 1505.4 https://akvoflow-89.s3.amazonaws.com/images/ac770642-
bb5c-49b8-9aaf-968386c5411f.jpg
115 Oromia Jimma Gomma SALI SHERIF Male 917230258 7.92020 36.71978 1560.1 https://akvoflow-89.s3.amazonaws.com/images/cf8350fd-
a00a-4c44-bc14-1d0d6bba7464.jpg
116 Oromia Jimma Gomma SHARAFU ABA
MACHA Male 917104006 7.92056 36.72603 1603.4
https://akvoflow-89.s3.amazonaws.com/images/f32799c8-
7665-4b40-81e1-88756ebdbcb3.jpg
117 Oromia Jimma Gomma SHE ABBA BULGU Male 925718213 7.92171 36.72009 1574.0 https://akvoflow-89.s3.amazonaws.com/images/69fe1683-
dca1-48af-8988-894fea6ebb93.jpg
118 Oromia Jimma Gomma ZAKIR FEDLU Male 917805444 7.97008 36.70277 1863.8 https://akvoflow-89.s3.amazonaws.com/images/5664919e-
2aa7-4bee-b951-ccdc61ad0c6f.jpg
119 Oromia Jimma Gomma MAMED ABBA MECHA
Male 934264380 7.92991 36.70099 1575.4 https://akvoflow-89.s3.amazonaws.com/images/1f4e8f60-
7616-4d2b-b276-896c54c56453.jpg
120 Oromia Jimma Gomma NEGASH ABBA
GOJAM Male 917315503 7.86497 36.65517 1555.7
https://akvoflow-89.s3.amazonaws.com/images/27040cb9-
1419-4a73-ad9d-c3edabfe1ae6.jpg
121 Oromia Jimma Gomma JABAL ABBA FIXA Male 917510317 7.83109 36.63973 1675.6 https://akvoflow-89.s3.amazonaws.com/images/c6b1ba3f-
db3d-4c97-ad88-cf9cc0bdf340.jpg
122 Oromia Jimma Gomma ADNAN ABA
DURA Male 917125028 7.89056 36.53624 1703.7
https://akvoflow-89.s3.amazonaws.com/images/24e59174-
b805-4fbc-9c6d-332d3f83ac92.jpg
123 Oromia Jimma Gomma MAHAMED ABA DEGA
Male 910794639 7.89167 36.53672 1713.4 https://akvoflow-89.s3.amazonaws.com/images/0a86914e-
d0e2-4503-b08e-0b3624b0ba36.jpg
124 Oromia Jimma Gomma JUNEDI ABBA
MECHA Male 913927171 7.88145 36.63335 1433.3
https://akvoflow-89.s3.amazonaws.com/images/cd3d1dd2-
aea4-4afb-b774-8560ba397edd.jpg
125 Oromia Jimma Gomma ABA NAGA ABA GOJAM
Male 917053833 7.91516 36.50652 1835.0 https://akvoflow-89.s3.amazonaws.com/images/bce8148b-
f1bf-4ebb-8bf8-b06736449337.jpg
126 Oromia Jimma Gomma UMAR ABA RAGO Male 904069474 7.91660 36.50769 1824.2 https://akvoflow-89.s3.amazonaws.com/images/d4ed97b6-
7375-45c4-9135-d32aee376478.jpg
127 Oromia Jimma Gomma ZINABU ABA DAGA
Male 913293111 7.94090 36.51047 1726.1 https://akvoflow-89.s3.amazonaws.com/images/53b04445-
f2f6-40b7-9ff7-928dcd630462.jpg
128 Oromia Jimma Gomma TARFA EJERSO Male
7.93152 36.51057 1783.9 https://akvoflow-89.s3.amazonaws.com/images/2d94e03e-
ac29-41b2-8dc8-b6561a0ca4e3.jpg
129 Oromia Jimma Gomma HAJAJI
SH/ABDALLA Male 963445851 7.94298 36.53078 1601.2 https://akvoflow-89.s3.amazonaws.com/images/49594e7b-

8
No. Region Zone Woreda User's Name Sex Telephone Latitude Longitude Elev. Picture of the respondent at the time of interview
d112-4fd3-b8e8-de3a5ea85cd7.jpg
130 Oromia Jimma Gomma A/TEMAM A/DIBA Male 940266283 7.93891 36.53139 1641.6 https://akvoflow-89.s3.amazonaws.com/images/a7011e92-
5167-47c2-8481-a1ec1e9d0c9e.jpg
131 Oromia Jimma Gomma TADALE AYALEW Male 917757346 7.94753 36.51918 1707.2 https://akvoflow-89.s3.amazonaws.com/images/e8e5a49f-
d76c-4894-9acb-e2419eb99545.jpg
132 Oromia Jimma Gomma KADIR HAJI Male 917067853 7.91795 36.56212 1770.4 https://akvoflow-89.s3.amazonaws.com/images/f6ff8ec3-
6832-4fbe-afc8-7a555b22fc34.jpg
133 Oromia Jimma Gomma QASIMA ABA BULGU
Male 917202940 7.91978 36.56048 1737.8 https://akvoflow-89.s3.amazonaws.com/images/c38c014f-
9d88-4386-9cd9-e526e34c1585.jpg
134 Oromia Jimma Kersa ABA TEMAM ABA
BULGU Male 932760756 7.72877 37.09152 1800.0
https://akvoflow-89.s3.amazonaws.com/images/cbd91f37-
8276-4d1b-85ff-a6e99e32c4b7.jpg
135 Oromia Jimma Kersa ABAZINAB ABASAMBI
Male
7.76101 36.90324 2386.0 https://akvoflow-89.s3.amazonaws.com/images/4a3023d9-
fdde-4bd4-8daf-75d186a3b467.jpg
136 Oromia Jimma Kersa AMIN ABA TEMAM Male 917782882 7.72846 37.09117 1801.0 https://akvoflow-89.s3.amazonaws.com/images/d8af7f8e-
b120-4571-806e-21f4597acedc.jpg
137 Oromia Jimma Kersa MAHAMAD ABAJEBAL
Male
7.74967 36.89394 2351.0 https://akvoflow-89.s3.amazonaws.com/images/f3a84857-
c917-4e67-a065-dfd3fef1b8b1.jpg
138 Oromia Jimma Kersa ABA JIHAD
ABAFILBA Male
7.62156 36.91028 1833.0
https://akvoflow-89.s3.amazonaws.com/images/a617777d-
57b4-43b6-ac51-b6edf0b6818e.jpg
139 Oromia Jimma Kersa AMIN ABAFOGI Male
7.62207 36.91438 1784.0 https://akvoflow-89.s3.amazonaws.com/images/8a1e57f9-
a5c6-42cd-915e-5614a9390784.jpg
140 Oromia Jimma Kersa ABA RESHAD ABA
GOJAM Male
7.62548 36.91098 1882.0
https://akvoflow-89.s3.amazonaws.com/images/31208a90-
5fc3-4ac7-9121-661f2bdda5cf.jpg
141 Oromia Jimma Kersa ABABIYA ABA SAMBI
Male 949585408 7.76108 36.90188 2338.0 https://akvoflow-89.s3.amazonaws.com/images/3fc69a3f-
edc0-4196-b408-e628b8d287f5.jpg
142 Oromia Jimma Kersa NASIR ABANIGDI Male
7.69354 36.97797 1785.0 https://akvoflow-89.s3.amazonaws.com/images/5775c8d0-
a087-4c98-b231-ede708930042.jpg
143 Oromia Jimma Kersa HAJI A/WARI
A/MORKI Male
7.83797 37.16586 2106.0
https://akvoflow-89.s3.amazonaws.com/images/654c6faf-
b83d-4238-ba9a-04f1f339b4bb.jpg
144 Oromia Jimma Kersa ABATEMAM
ABAFOGI Male
7.73148 37.14073 1720.0
https://akvoflow-89.s3.amazonaws.com/images/d2411b37-
0c7a-4439-83c6-2fdbc0e33b7d.jpg
145 Oromia Jimma Kersa HAJI KEDIR A/JOBIR
Male
7.85407 37.15508 2138.0 https://akvoflow-89.s3.amazonaws.com/images/c89077ed-
e358-43b7-b36a-ebca094b33b5.jpg
146 Oromia Jimma Kersa ABA FAJI ABA
WARI Male
7.70832 37.07761 1722.0
https://akvoflow-89.s3.amazonaws.com/images/325b232d-
0474-4005-8b39-3f53bfe76edd.jpg
147 Oromia Jimma Kersa ABAJEBEL ABAWARI
Male
7.70008 36.97756 1802.0 https://akvoflow-89.s3.amazonaws.com/images/5a34c7af-
2067-43ab-ad70-80258649dfe4.jpg

9
No. Region Zone Woreda User's Name Sex Telephone Latitude Longitude Elev. Picture of the respondent at the time of interview
148 Oromia Jimma Kersa ABDALLAHI ABAZINAB
Male
7.75967 36.90304 2323.0 https://akvoflow-89.s3.amazonaws.com/images/25bd12b8-
a7cc-4c61-ba77-7f460cb91f1d.jpg
149 Oromia Jimma Kersa SEFU ABADIGA Male 960889781 7.75641 36.90193 2329.0 https://akvoflow-89.s3.amazonaws.com/images/d492f627-
9af6-4f3a-9095-6ba3633505f7.jpg
150 Oromia Jimma Kersa ABA OLI ABABULGU
Male
7.70264 36.96230 1815.0 https://akvoflow-89.s3.amazonaws.com/images/827b687f-
9cc8-4952-b972-df9698218d43.jpg
151 Oromia Jimma Limu
Kosa NIGUSSIE DESSIM Male 917327860 7.94690 36.84307 2018.1
https://akvoflow-89.s3.amazonaws.com/images/eadf9cd9-
367e-4575-b2c7-d9edf19a3b5c.jpg
152 Oromia Jimma Limu
Kosa WORKE CHANIE Male
8.01748 36.84997 1245.2
https://akvoflow-89.s3.amazonaws.com/images/829ea6c8-
fc1a-432d-80fc-00ae199c9e03.jpg
153 Oromia Jimma Limu
Kosa ALI GOBA Male 917248897 7.99990 36.84822 1990.7
https://akvoflow-89.s3.amazonaws.com/images/c2835b0e-
d414-4d3b-ae8e-1b8e4d5e1c49.jpg
154 Oromia Jimma Limu
Kosa ZERIHUN ESHETU Male 917015905 7.95348 36.84489 2019.0
https://akvoflow-89.s3.amazonaws.com/images/81800d0c-
9ab7-4b54-a8b0-f198c60ff28d.jpg
155 Oromia Jimma Limu
Kosa JUNDI KEDIR Male 917161866 7.99816 36.88267 1701.6
https://akvoflow-89.s3.amazonaws.com/images/51c3fe81-
1592-4200-8111-c0f30c347d47.jpg
156 Oromia Jimma Limu
Kosa YAIKOB ABA BULGU
Male 917009073 8.06599 36.92600 1649.2 https://akvoflow-89.s3.amazonaws.com/images/7b01562e-
8c23-4651-9fb4-76bd269e15ec.jpg
157 Oromia Jimma Limu
Kosa
GEBEYEHU
ASNAKE Male 917259698 8.14880 36.97892 1714.7
https://akvoflow-89.s3.amazonaws.com/images/70e00088-
c970-4076-bf8e-8102ae61b928.jpg
158 SNNP Gedeo Wonago AMANUEL GETU Male 916931559 6.31663 38.22496 1863.5 https://akvoflow-89.s3.amazonaws.com/images/d805c973-
1ab4-4c01-bf4b-ecc9e4be6ed9.jpg
159 SNNP Gedeo Wonago FANTU BONEYA Male
6.33297 38.22661 1769.7 https://akvoflow-89.s3.amazonaws.com/images/7f0a2e8d-
f337-499c-8ac9-31163114398c.jpg
160 SNNP Kembata
Tembaro Angecha TADES KEFATO Male 910839647 7.34991 37.84430 2115.2
https://akvoflow-89.s3.amazonaws.com/images/1185956b-
75e5-4985-b7a1-50ed381ddfa4.jpg
161 SNNP Kembata
Tembaro Angecha
AMARECH
MATHEWOS Female
7.34579 37.86115 2306.0
https://akvoflow-89.s3.amazonaws.com/images/ff4faf37-
9161-4b60-a586-aef238b33151.jpg
162 SNNP Kembata
Tembaro Angecha ALEMBO GODEBO Female
7.46120 37.90981 158.6
https://akvoflow-89.s3.amazonaws.com/images/9d9bf63f-
841d-46b5-a4d7-f6dc84490622.jpg
163 SNNP Kembata
Tembaro Angecha WOLDE ABO Male
7.34527 37.86120 2368.1
https://akvoflow-89.s3.amazonaws.com/images/fddd0b4a-
2253-4908-b19c-94e3916dc46e.jpg
164 SNNP Kembata
Tembaro Angecha
ABREHAM LEAMANGO
Male
7.34539 37.95090 2235.0 https://akvoflow-89.s3.amazonaws.com/images/3aef6734-
0154-4b0b-9f83-324d88a5623b.jpg
165 SNNP Kembata
Tembaro Hadero
AYELCH
CHEKEBO BIKE Female 913646013 7.20945 37.63607 1565.9
https://akvoflow-89.s3.amazonaws.com/images/dfa9a241-
d077-4d38-be1a-7b05a3e71cf5.jpg
166 SNNP Kembata Hadero ASETER CHERINET Female 916349037 7.20916 37.63243 1609.7 https://akvoflow-89.s3.amazonaws.com/images/61096385-

10
No. Region Zone Woreda User's Name Sex Telephone Latitude Longitude Elev. Picture of the respondent at the time of interview
Tembaro e6cb-4249-ba6e-0c6d28862dc0.jpg
167 SNNP Kembata
Tembaro Hadero BEKELE BATISO Male
7.21089 37.63959 1527.4
https://akvoflow-89.s3.amazonaws.com/images/1eeb32f3-
f104-4fed-8560-c82f8cc8d81b.jpg
168 SNNP Kembata
Tembaro Hadero DESELGN ABEBE Male
7.24417 37.71217 1815.2
https://akvoflow-89.s3.amazonaws.com/images/f6b107a9-
aac9-476d-9fc4-8f7587c595f3.jpg
169 SNNP Kembata
Tembaro Hadero ASERAT ASEFAW Male
7.19208 37.68363 1632.8
https://akvoflow-89.s3.amazonaws.com/images/6e075643-
00e1-4396-85e6-dca613c9136b.jpg
170 SNNP Kembata
Tembaro Hadero DEMISSE SHGUTE Male 926083583 7.21623 37.61845 1566.0
https://akvoflow-89.s3.amazonaws.com/images/25a5247e-
cd72-40d8-bf07-62b9a7d00dac.jpg
171 SNNP Kembata
Tembaro Hadero
DESALEGN
DEBENICHO Male 925525693 7.22605 37.61895 1584.4
https://akvoflow-89.s3.amazonaws.com/images/36f9402f-
6e11-4b20-8388-87c46a0f30c1.jpg
172 SNNP Kembata
Tembaro Hadero WORIKU WATARO Male 929523677 7.22396 37.61583 1902.1
https://akvoflow-89.s3.amazonaws.com/images/e739b7b3-
97c7-4860-8d10-4df9cb29d5d3.jpg
173 SNNP Kembata
Tembaro Hadero
MELEKAM
DENEKE Female 916282696 7.18887 37.66390 1644.6
https://akvoflow-89.s3.amazonaws.com/images/5defd7a8-
de94-473a-91bb-29b5a98ece85.jpg
174 SNNP Kembata
Tembaro Hadero TADESSE ELORE Male
7.20370 37.61407 37.6
https://akvoflow-89.s3.amazonaws.com/images/aff31308-
9e8a-4f32-90ac-e542d0fd8011.jpg
175 SNNP Kembata
Tembaro Hadero DAWIT BEYAMO Male
7.20981 37.64589 1730.0
https://akvoflow-89.s3.amazonaws.com/images/424d509c-
e62c-4680-b042-ec4465183a0b.jpg
176 SNNP Kembata
Tembaro Hadero KEBEDE ERGANO Male
7.20370 37.95206 1794.0
https://akvoflow-89.s3.amazonaws.com/images/90451884-
584c-4ec7-bbff-2c6e3465ec8b.jpg
177 SNNP Kembata
Tembaro Hadero
DESALEGN
DIGAMO Male
7.21438 37.77999 1778.0
https://akvoflow-89.s3.amazonaws.com/images/c503b2d0-
4287-4083-a04f-01c5b899a243.jpg
178 SNNP Kembata
Tembaro Hadero DESTA TADESSE Male 925684172 7.20741 37.61215 1702.0
https://akvoflow-89.s3.amazonaws.com/images/93239fa0-
b25d-43f8-a543-7e87aafa2247.jpg
179 SNNP Kembata
Tembaro Hadero MICHAEL DETEBO Male
7.20156 37.95382 1695.0
https://akvoflow-89.s3.amazonaws.com/images/14e289a8-
01c2-4c20-9f1d-c5fe4f65b197.jpg
180 SNNP Kembata
Tembaro Hadero
MATHEWOS
JABANGA Male 923406926 7.21802 37.82035 1806.0
https://akvoflow-89.s3.amazonaws.com/images/369f377c-
fa40-4078-9e1b-14582a32a783.jpg
181 SNNP Kembata
Tembaro Hadero
MATHEWOS
MADEBO Male
7.20916 37.63243 1723.0
https://akvoflow-89.s3.amazonaws.com/images/7f094fb3-
f493-4842-9561-cd97a35144af.jpg
182 SNNP Kembata
Tembaro Hadero
YOHANES UKANSO
Male 916716367 7.21965 37.81896 1759.0 https://akvoflow-89.s3.amazonaws.com/images/4771f891-
03ba-43b1-9eba-e179388c0fee.jpg
183 SNNP Kembata
Tembaro Hadero TEFERA TEDASA Male 910149424 7.18600 38.08696 1670.0
https://akvoflow-89.s3.amazonaws.com/images/64482b77-
d26c-4c78-974d-1314cc518c7c.jpg
184 SNNP Kembata
Tembaro Hadero TERAFA HERANO Male 916282513 7.17902 37.83797 1492.0
https://akvoflow-89.s3.amazonaws.com/images/2c2b1f5a-
7f75-443e-9996-63199b40354a.jpg
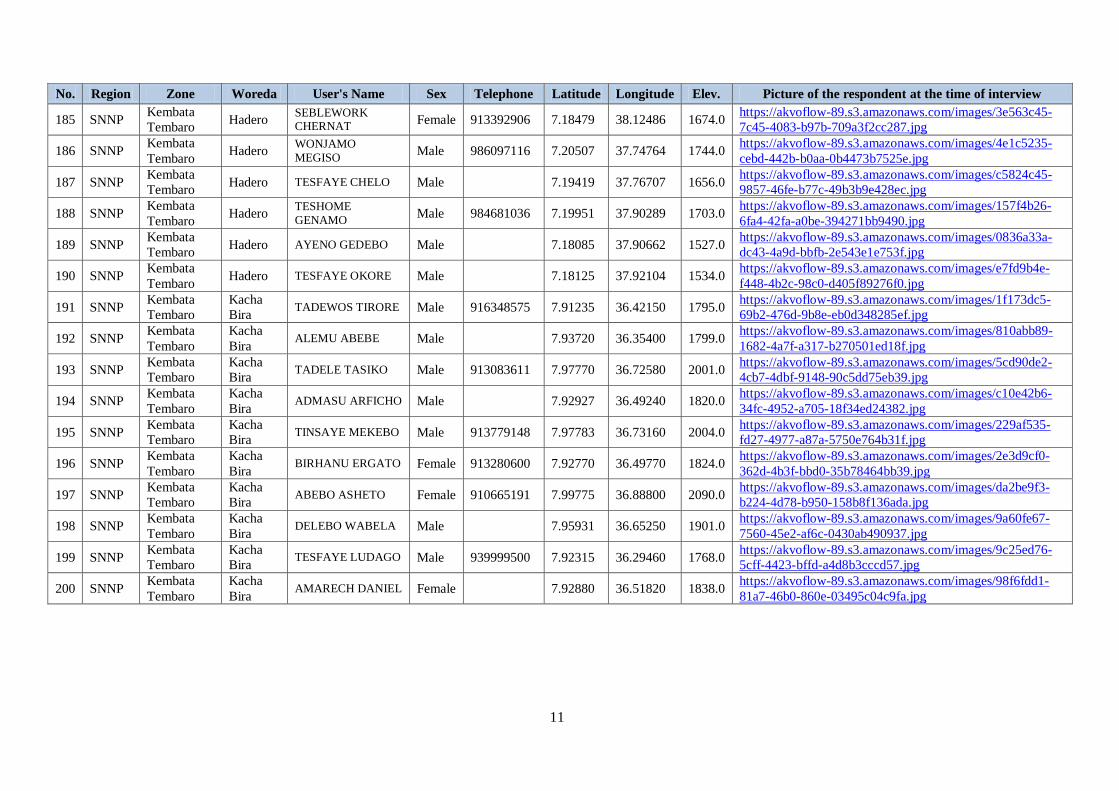
11
No. Region Zone Woreda User's Name Sex Telephone Latitude Longitude Elev. Picture of the respondent at the time of interview
185 SNNP Kembata
Tembaro Hadero
SEBLEWORK CHERNAT
Female 913392906 7.18479 38.12486 1674.0 https://akvoflow-89.s3.amazonaws.com/images/3e563c45-
7c45-4083-b97b-709a3f2cc287.jpg
186 SNNP Kembata
Tembaro Hadero
WONJAMO
MEGISO Male 986097116 7.20507 37.74764 1744.0
https://akvoflow-89.s3.amazonaws.com/images/4e1c5235-
cebd-442b-b0aa-0b4473b7525e.jpg
187 SNNP Kembata
Tembaro Hadero TESFAYE CHELO Male
7.19419 37.76707 1656.0
https://akvoflow-89.s3.amazonaws.com/images/c5824c45-
9857-46fe-b77c-49b3b9e428ec.jpg
188 SNNP Kembata
Tembaro Hadero
TESHOME
GENAMO Male 984681036 7.19951 37.90289 1703.0
https://akvoflow-89.s3.amazonaws.com/images/157f4b26-
6fa4-42fa-a0be-394271bb9490.jpg
189 SNNP Kembata
Tembaro Hadero AYENO GEDEBO Male
7.18085 37.90662 1527.0
https://akvoflow-89.s3.amazonaws.com/images/0836a33a-
dc43-4a9d-bbfb-2e543e1e753f.jpg
190 SNNP Kembata
Tembaro Hadero TESFAYE OKORE Male
7.18125 37.92104 1534.0
https://akvoflow-89.s3.amazonaws.com/images/e7fd9b4e-
f448-4b2c-98c0-d405f89276f0.jpg
191 SNNP Kembata
Tembaro
Kacha
Bira TADEWOS TIRORE Male 916348575 7.91235 36.42150 1795.0
https://akvoflow-89.s3.amazonaws.com/images/1f173dc5-
69b2-476d-9b8e-eb0d348285ef.jpg
192 SNNP Kembata
Tembaro
Kacha
Bira ALEMU ABEBE Male
7.93720 36.35400 1799.0
https://akvoflow-89.s3.amazonaws.com/images/810abb89-
1682-4a7f-a317-b270501ed18f.jpg
193 SNNP Kembata
Tembaro
Kacha
Bira TADELE TASIKO Male 913083611 7.97770 36.72580 2001.0
https://akvoflow-89.s3.amazonaws.com/images/5cd90de2-
4cb7-4dbf-9148-90c5dd75eb39.jpg
194 SNNP Kembata
Tembaro
Kacha
Bira ADMASU ARFICHO Male
7.92927 36.49240 1820.0
https://akvoflow-89.s3.amazonaws.com/images/c10e42b6-
34fc-4952-a705-18f34ed24382.jpg
195 SNNP Kembata
Tembaro
Kacha
Bira TINSAYE MEKEBO Male 913779148 7.97783 36.73160 2004.0
https://akvoflow-89.s3.amazonaws.com/images/229af535-
fd27-4977-a87a-5750e764b31f.jpg
196 SNNP Kembata
Tembaro
Kacha
Bira BIRHANU ERGATO Female 913280600 7.92770 36.49770 1824.0
https://akvoflow-89.s3.amazonaws.com/images/2e3d9cf0-
362d-4b3f-bbd0-35b78464bb39.jpg
197 SNNP Kembata
Tembaro
Kacha
Bira ABEBO ASHETO Female 910665191 7.99775 36.88800 2090.0
https://akvoflow-89.s3.amazonaws.com/images/da2be9f3-
b224-4d78-b950-158b8f136ada.jpg
198 SNNP Kembata
Tembaro
Kacha
Bira DELEBO WABELA Male
7.95931 36.65250 1901.0
https://akvoflow-89.s3.amazonaws.com/images/9a60fe67-
7560-45e2-af6c-0430ab490937.jpg
199 SNNP Kembata
Tembaro
Kacha
Bira TESFAYE LUDAGO Male 939999500 7.92315 36.29460 1768.0
https://akvoflow-89.s3.amazonaws.com/images/9c25ed76-
5cff-4423-bffd-a4d8b3cccd57.jpg
200 SNNP Kembata
Tembaro
Kacha
Bira AMARECH DANIEL Female
7.92880 36.51820 1838.0
https://akvoflow-89.s3.amazonaws.com/images/98f6fdd1-
81a7-46b0-860e-03495c04c9fa.jpg

1