report of the 2012 concentrated inspection campaign (cic ... tokyo mou report fss cic (public...
TRANSCRIPT

November, 2013
Report of the 2012 Concentrated Inspection Campaign (CIC) on Fire Safety Systems

2 | P a g e
Executive Summary
The Tokyo MOU on Port State Control (TMOU) carried out a joint Concentrated Inspection Campaign (CIC) with the Paris MOU on Port State Control (PMOU) on fire safety systems between September 1 and November 30, 2012. During the campaign, 17 TMOU and 27 PMOU member states focussed on compliance with SOLAS Chapter II-2 requirements on inspected ships. This report documents the results of the campaign for the TMOU Maritime Authorities. Results for the PMOU Maritime Authorities are documented separately. A total of 8,274 inspections were carried out during the CIC involving 7,449 individual ships. Of these, 6,606 inspections were conducted with a CIC questionnaire (80%). The overall detention rate for inspections conducted with a questionnaire was 3.3% (217 ships were detained). The CIC-topic detention rate was 2.3% (150 ships were detained). 69% of the detentions were CIC-topic related.
Considering both the questionnaire and deficiency data, the most positive results were reported for Question 7, which asked whether a test of the sprinkler system triggers an automatic visual and audible alarm for the section. The least favourable results were reported for Question 3, which asked if portable extinguishers were ready for use in locations as per the fire plan, and Question 5a, which asked if fire protection systems, fire fighting systems and appliances were maintained ready for use. Offshore supply ships had the highest CIC-topic related detention rate (5.7%), followed by Ro-Ro passenger ships (4%) and general cargo/multipurpose ships (3.8%). A number of ship types had “zero” CIC-topic related detentions. Younger ships had the lowest detention rate (1%) and older ships the highest detention rate (6%). The rate increased steadily from ships less than 11 years old to ships over 30 years old. Ships from 86 flag states were inspected during the CIC. The flag state with the highest detention rate (CIC-topic related) was Equatorial Guinea (50%). 53 of the 86 flag states (63%) did not have any detentions. The overall results of ship detentions was consistent with the risk profiling methodology of the TMOU – very high risk ships comprised (by far) the largest percentage of ships detained per inspection. Of the TMOU member states, China by far conducted the most inspections (2,099), followed by Japan (1,587), Korea, Republic of (798) and Indonesia (676). The least number of inspections were conducted by Fiji (8) followed by Papua New Guinea (27). The objective of the CIC was to provide indications as to the industry’s level of compliance with specific aspects of SOLAS Chapter II-2 on Fire Protection, Fire Detection and Fire Extinction arrangements vessels regardless of type. New provisions were introduced in July 2002 and deficiencies related to fire safety account for 14% of total deficiencies with the Paris and Tokyo MOU. The TMOU concludes that the CIC has indeed provided sound evidence supporting that the industry has in general achieved a good level of compliance with the specific provisions of SOLAS Chapter II-2 pertaining to fire safety systems. Despite the fact 69% of the detentions were CIC-topic related, when the overall CIC-topic related detention rate is compared to the broader TMOU PSC rate that was published in the 2011 Annual Report on Port State Control, the results are highly favourable – the CIC-related detention rate is less than half that of the broader TMOU PSC rate. Key recommendations pertain to the TMOU continuing, during normal PSC inspections, to put emphasis on the Chapter II-02 requirements that had the least favourable results of the CIC, and continuing to reduce the inconsistencies between the questionnaire and deficiency data by emphasizing the importance of properly completing CIC documentation during training sessions.
3 | P a g e
Table of Contents Page
Section 1: Introduction
1.1 Purpose of this Report
1.2 Objective of the CIC
1.3 Scope of the CIC
1.4 General Remarks
……………………………………
……………………………………
……………………………………
……………………………………
4
4
4
5
Section 2: Summary Analysis, Conclusions and Recommendations
2.1 Summary Analysis
2.2 Conclusions
2.3 Recommendations
……………………………………
……………………………………
……………………………………
5
7
7
Section 3: CIC Questionnaire Results
3.1 Analysis
3.1.1 Response to CIC Questionnaire
3.1.2 Analysis of Answers to Questionnaire
3.1.3 Number of Inspections and Number of Ships in CIC
3.1.4 Specification of CIC-Topic Related Deficiencies
3.1.5 Analysis of CIC-topic Related Deficiencies (ISM-Related Deficiencies)
3.1.6 Number of Ships to Number of Inspections in CIC
3.1.7 Number of Inspected Ships per Risk Profile
3.1.8 Number of Inspected Ships and Detentions per Ship Type
3.1.9 Number of Inspected Ships and Detentions per Flag State
3.1.10 Number of Inspections and Detentions per Recognized Organization
3.1.11 Ship Age Overview
3.2 Results on Former CIC on Same Subject
3.3 Results Other CIC Participants
……………
……………
……………
……………
……………
……………
……………
……………
……………
……………
……………
……………
……………
……………
8
8
10
10
12
14
15
15
17
18
19
19
19
20
Annex 1: CIC Questionnaire
Annex 1.1 Inspection Form of CIC
Annex 1.2 Table - Inspections and Detentions per Flag State
Annex 1.3 Table Inspections and Detentions Per Recognized Organization
…………………………..
…………………………..
…………………………..
22
23
27

4 | P a g e
Introduction
1.1 Purpose of this Report
This report documents the results of the Concentrated Inspection Campaign (CIC) on Fire Safety Systems (SOLAS CH II-2) which was carried out by 17 member Maritime Authorities of the Tokyo Memoranda of Understanding (MOU) on Port State Control between September 1 and November 30, 2012. The CIC was carried out jointly by the Paris MOU on Port State Control which involved 27 additional Maritime Authorities (44 in total). CIC results for the Paris MOU are documented in a separate report; however, a summary comparison between the Tokyo and Paris MOU results is provided in Section 3.3 of this report.
1.2 Objective of the CIC The SOLAS Convention specifies minimum standards for the construction, equipment and operation of ships, compatible with their safety. Ch II-2 relates to Construction - Fire Protection, Fire Detection, and Fire Extinction arrangements on board ships and includes detailed fire safety provisions for all ships and specific measures for passenger ships, cargo ships and tankers.
Revised SOLAS Chapter II-2 adopted by IMO Resolution MSC .99(73) entered into force on 1 July 2002 and generally applies to ships constructed on or after 1 July 2002. However, some regulations of the revised SOLAS Chapter II-2 apply to all ships (including ships constructed before 1 July 2012 - existing ships). Applicable requirements to existing ships are outlined in paragraph 2 of Regulation 1 of revised SOLAS Chapter II-2.
Principles of the updated provisions include:
Division of the ship into main and vertical zones by thermal and structural boundaries; Separation of accommodation spaces from the remainder of the ship by thermal and
structural boundaries; Restricted use of combustible materials; Detection of any fire in the zone of origin; Containment and extinction of any fire in the space of origin; Protection of the means of escape or of access for fire-fighting purposes; Ready availability of fire-extinguishing appliances; and, Minimization of the possibility of ignition of flammable cargo vapour.
The objective of the CIC was to provide indications as to the industry’s level of compliance with specific aspects of SOLAS Chapter II-2 on Fire Protection, Fire Detection and Fire Extinction arrangements on board ships regardless of type. It was also intended to help raise awareness of fire safety related issues. Deficiencies related to fire safety account for 14% of total deficiencies with the Paris and Tokyo MOU and a CIC on the fire safety systems of all types of ships has never been done.
1.3 Scope of the CIC
The CIC targeted 12 aspects of compliance provisions that are considered critical to shipboard fire safety systems. Areas include:
Compliance with the requirements of the SOLAS convention for fire safety systems; Ensuring fire fighting equipment is readily available and maintained at all times; and, Ensuring the master, officers and crew are familiar with FSS equipment and have received
training in carrying out their duties.

5 | P a g e
The CIC was designed to examine specific areas and not intended to detract from the normal coverage of Port State Control Inspections. As such, it was conducted in conjunction with the regular Port State Control targeting and inspection activities.
Member Maritime Authorities were provided with a standardized questionnaire format to record and report their results against the 12 targeted compliance provisions that comprised the CIC. In addition, Port State Control Officers (PSCOs) were required to indicate if the ship was detained as a result of the CIC. The questionnaire required a “Yes” (Satisfactory) or “No” (Unsatisfactory) response to each question. In some cases a “N/A” (Not Applicable) answer was acceptable. For each “No” answer, participants were directed to document the deficiency using the appropriate deficiency code on Form B of the PSC inspection report. For six of the questions, a “No” answer was serious enough that the ship could be considered for detention.
1.4 General Remarks General remarks pertaining to this report include:
For the purpose of this report, a detention is an inspection containing at least one deficiency that is considered a ground for detention.
Except for Table 2, the tables contained in this report take into account the total number of inspections conducted during the CIC - those conducted with a CIC questionnaire and those conducted without. As such, the detention rates that comprise the analysis relate to the total number of inspections, not just those that were conducted with a CIC questionnaire. In order to facilitate comparison with the CIC results from the PMOU, an additional row has been added to each table (as appropriate) which reports separately (summary results only) the number of inspections which were conducted with CIC questionnaires and the associated detention rates.
Summary, Conclusions and Recommendations 2.1 Summary The following summarizes the results of the CIC:
7,449 individual ships and a total of 8,274 inspections were conducted during the CIC. Of these, 6,606 inspections were conducted with a CIC questionnaire (80%).
Of the ship inspections conducted with a CIC questionnaire, 217 ships were detained of which 150 or 69% were CIC-topic related. The overall detention rate of ships inspected with a CIC questionnaire (percentage of detentions per inspection) was 3.3%. The CIC-topic related detention rate was 2.3%.
Responses to Question 4, which asked does the test of automatic audible alarm sound prior to release of a fixed gas fire-extinguishing medium into spaces in which personnel normally work, reported the most favourable results of all questions – only 93 unsatisfactory responses were recorded representing 1.4% of inspections.
The least favourable results were reported for Question 5a, which asked if fire protection systems, fire fighting systems and appliances were maintained ready for use – 724 unsatisfactory responses were recorded representing 11% of inspections. An unsatisfactory response to Question 5a was a potentially detainable violation.
Deficiency 07110 (related to Question 3), which pertains to fire-fighting equipment and appliances, accounted for the most number of reported inspection deficiencies at 15% of the total. This was closely followed by Deficiency 07108 (related to Question 5a), pertaining to ready availability of fire-fighting equipment which accounted for 11% of the total reported deficiencies. Deficiency 08103 (related to Question 7), which pertains to fire alarms, accounted for the least number of reported inspection deficiencies at 1% of the total.

6 | P a g e
The deficiency rate for CIC-topic related deficiencies was not included in the data set for this analysis.
By ship type, offshore supply ships had the highest CIC-topic related detention rate (5.9%), followed by Ro-Ro passenger ships (4%) and general cargo/multipurpose ships (3.8%). A number of ship types had “zero” CIC-topic related detentions.
By ship age, younger ships had the lowest detention rate (1%) and older ships the highest detention rate (6%). The rate increased steadily from ships less than 11 years old to ships over 30 years old.
The vast majority of the ships inspected were only inspected once (90%). Of the remaining ships, 9% were inspected twice, 1% three times, and a total of 6 ships were inspected four times.
With respect to CIC-topic related detentions, the flag state with the highest percentage of ships detained were Equatorial Guinea (50%). This was followed by the Cook Islands and Tanzania (both had 33%), Togo (25%) and Korea, DPR (13%). The remaining flag states were 7% and under, and 53 of the 86 flag states (63%) did not have any detentions.
By ship risk categories, the CIC results are consistent with what would be expected in accordance with the risk profiling breakdown. This helps support the validity of the risk profiling methodology used by the TMOU. For general detentions and CIC-topic related detentions, ships considered very high risk comprised (by far) the largest percentage of ships detained per inspection. High risk ships accounted for the second most detained ships, followed by medium and low risk ships.
There were a total of 7,787 inspections of ships where the certificate was recorded as issued by the RO. Only six (6) CIC-topic related detentions were recorded that had a deficiency linked to one of the three certificates. This equates to a very low detention rate of only 0.08%. By comparison, the detention rate for the overall CIC (CIC-topic related deficiencies) was 2.3% which means that ships for which ROs have the delegated authority to perform inspections and certifications on behalf of the member Maritime Authority performed significantly better than the broader CIC results.
Of the TMOU member states, China by far conducted the most inspections (2,099), followed by Japan (1,587), Korea, Republic of (798) and Indonesia (676). The least number of inspections were conducted by Fiji (8) followed by Papua New Guinea (27). With respect to CIC-topic related detentions, Hong Kong detained the highest percentage of ships at a rate of 6%, followed by China at 3%. Four member states detained 2% of ships and five member states detained 1% of ships. Four member states did not detain any vessels for CIC-related deficiencies.
The analysis also revealed there are inconsistencies between the questionnaire data and the deficiency and detention data. These inconsistencies are common in all CICs. Several reasonable explanations exist however which support the conclusion that the questionnaire and the deficiency data are both correct but just not necessarily associated with each other in all cases. Independently and/or taken together, both results provide valuable information to TMOU Maritime Authorities as to the industry’s level of compliance with specific aspects of SOLAS Chapter II-2 on Fire Protection, Fire Detection and Fire Extinction arrangements onboard ships.
It is also noted that there are inconsistencies in the number of individual ships reported in a number of tables within the report. Since the number of individual ships is not a key indicator used in the analysis, the inconsistencies are not considered critical; however, such misalignment of data does raise some concern as to the validity of the overall data.
7 | P a g e
2.2 Conclusions
The objective of the CIC was to provide indications as to the industry’s level of compliance with specific aspects of SOLAS Chapter II-2 on Fire Protection, Fire Detection and Fire Extinction arrangements vessels regardless of type. New provisions were introduced in July 2002. It was also the intent of the CIC to help raise awareness of fire safety related issues. During the campaign, 69% of the detentions were CIC-topic related, which if considered in isolation would lead to a conclusion that the industry has not achieved an acceptable level of compliance with SOLAS Chapter II-2 requirements. However, the TMOU now monitors and publishes a key indicator for measuring the inspection compliance performance of ships as part of their broader PSC inspection regime which can be compared to the CIC results - percentage of detentions per inspection (detention rate). Although the TMOU also tracks and publishes deficiency rates (average number of deficiencies per inspection) for its broader PSC inspection regime, deficiency rate data was not included in the CIC analysis for the TMOU. The overall detention rate for the CIC (CIC-topic related) was 2.3%. This compares very favourably to the latest overall TMOU PSC detention rate of 5.46% reported for 20111. Given the highly positive results of the CIC detention rates (CIC-topic related) compared the results of the broader TMOU inspection regime reported for 2011, the TMOU concludes that the CIC has indeed provided sound evidence supporting that the industry has in general achieved a good level of compliance with the specific provisions of SOLAS Chapter II-2 pertaining to fire safety systems. In addition, every vessel that was inspected received the benefit of enhanced awareness of fire safety related issues. Nonetheless, the fact 69% of the detentions during the campaign were CIC-topic related is significant, and specific areas covered by the CIC that did not perform within acceptable standards still merit further attention. 2.3 Recommendations The following recommendations are offered for consideration:
1. The TMOU continue, during normal PSC inspections, to put emphasis on the specific areas covered by the CIC that had the least favourable results.
CIC Questionnaire Results
3.1 Analysis 3.1.1 Response to CIC questionnaire
1 TMOU 2011 Annual Report

8 | P a g e
Table 1 Response to CIC questionnaire
‘YES’
‘NO’
N/A
Blank
Total # of inspections
% ‘NO’ of total # of
inspections
Q1 Does the Fire Control Plan meet the requirements? 6314 95.6% 292 4.4% 6606 4.4%
Q2a Do the fire fighters’ outfits including personal equipment comply with the requirements? 6211 94.7% 347 5.3% 48 0.7% 6606
5.3%
Q2b Do the Emergency Escape Breathing Devices (EEBD) comply with the requirements? 6392 97.9% 139 2.1% 75 1.1% 6606
2.1%
Q3 Are the portable extinguishers ready for use in locations as per the fire plan?
6464 98.2% 116 1.8% 26 0.4% 6606
1.8%
Q4*
Does the test of automatic audible alarm sound prior to release of a fixed gas fire-extinguishing medium into spaces in which personnel normally work? 5919 98.5% 93 1.5% 594 9.0%
6606
1.4%
Q5a* Are the fire protection systems, fire fighting-systems and appliances maintained ready for use? 5882 89.0% 724 11% 6606
11%
Q5b
Is there a maintenance plan onboard to show that fire protection systems and fire- fighting systems and appliances (as appropriate) have been properly tested and inspected? 6244 94.5% 362 5.5%
6606
5.5%
Q6*
Is the crew familiar with the location and operation of fire-fighting systems and appliances that they may be called upon to use? 6331 95.8% 275 4.2%
6606
4.2%
Q7 Does the test of the sprinkler system trigger an automatic visual and audible alarm for the section? 2449 97.9% 53 2.1% 4104 62.1% 6606
0.8%

9 | P a g e
‘YES’
‘NO’
N/A
Blank
Total # of inspections
% ‘NO’ of total # of
inspections
Q8*
Does the activation of any detector or manually operated call point initiate a visual and audible fire signal at the control panel on the bridge or control station? 6265 97.6% 156 2.4% 185 2.8%
6606
2.4%
Q9 Is the lighting in escape routes, including the Low Location Lighting systems where applicable properly maintained? 6084 96.5% 222 3.5% 300 4.5%
6606 3.4%
Q10* Is the Emergency Fire pump, capable of producing at least two jets of water? 6302 98.4% 100 1.6% 204 3.1% 6606 1.5%
Q11 Are the Isolating valves of the fire main marked, maintained and easily operable? 6042 94.1% 377 5.9% 187 2.8% 6606 5.7%
Q12* Where a fire drill was witnessed was it found to be satisfactory? 3284 92.6% 262 7.4% 3060 46.3% 6606 4.0%
Q13 Was the ship detained as a result of the CIC? 217 3.3% 6389 96.7% 6606 96.7%
* ‘NO’ means: the ship may be considered for detention. The details of any detention should be appropriately entered on the PSC report B.

10 | P a g e
3.1.2. Analysis of answers to questionnaire Table 1 above reveals that during the period of the CIC, a total of 6,606 inspections were carried out using the CIC questionnaire. The number of unsatisfactory responses per question ranges from 53 to 724 representing from 0.8% to 10.96% of total inspections respectively. Responses to Question 4, which asked does the test of automatic audible alarm sound prior to release of a fixed gas fire-extinguishing medium into spaces in which personnel normally work, reported the most favourable results of all questions – only 93 unsatisfactory responses were recorded representing 1.4% of inspections. Question 10, Is the Emergency Fire pump, capable of producing at least two jets of water, reported the next most favourable results with only 100 unsatisfactory responses representing 1.6% of inspections. The least favourable results were reported for Question 5a, which asked if fire protection systems, fire fighting systems and appliances were maintained ready for use – 724 unsatisfactory responses were recorded representing 11% of inspections. An unsatisfactory response to Question 5a was a potentially detainable violation. Question 12, which asked Where a fire drill was witnessed was it found to be satisfactory, reported the next least favourable results with 262 unsatisfactory responses representing 7.4% of inspections. Question 5b reported 362 unsatisfactory responses (5.5% of inspections) and Question 2a reported 347 unsatisfactory responses (5.3% of inspections). Chart 1 below summarizes the CIC questionnaire results in order starting with the least favourable question response.
Please note that although it was the intent of the questionnaire at Question 13 to respond “YES” only to those inspections that resulted in detentions due to CIC-topic related deficiencies, PSCOs instead recorded the number of detentions of ships for which inspections were performed using a CIC questionnaire (217 detentions), which included both CIC-topic and non-CIC-topic related detentions. Based on the Form B/Notice of Detention for the Master paperwork, the actual number of vessels that were detained for CIC-topic related deficiencies was 150. This is the figure that is used throughout the rest of the report. 3.1.3. Number of inspections and number of ships in CIC Table 2 Number of inspections and number of ships in CIC

11 | P a g e
Individual ships
inspected during CIC
Inspections performed with a CIC
questionnaire
Inspections without a CIC questionnaire
Inspections 7449 6606 1668
Inspections with detentions 335 217 118
Detentions with CIC-topic related deficiencies
147 150 0
Table 2 reveals that a total of 8,274 inspections were conducted during the CIC, of which the vast majority were performed with the CIC questionnaire (6,606 or 80%). A total of 335 ships were detained. Of the ships that were inspected with a CIC questionnaire, a total of 217 ships were detained of which 150 were related to CIC-topic deficiencies. CIC-topic related deficiencies therefore accounted for 69% of the total ships detained which were inspected with a CIC questionnaire. The detention rate for CIC-topic related deficiencies was 2.3%.

12 | P a g e
3.1.4. Specification of CIC-topic related deficiencies Table 3 Specification of CIC-topic related deficiencies
CIC-topic related deficiencies Inspections Detentions
CIC-topic related
Detentions CIC-topic related with RO responsibility
(# of inspections with this deficiency) One inspection can have multiple deficiencies
(# of inspections with this deficiency recorded as ground for detention)
(# of inspections with this deficiency recorded as ground for detention and RO related)
01309 Does the Fire Control Plan meet the requirements?
177 0 0
07111
Do the fire fighters’ outfits including personal equipment comply with the requirements?
354 6 0
07112
Do the Emergency Escape Breathing Devices (EEBD) comply with the requirements?
194 0 0
07110 Are the portable extinguishers ready for use in locations as per the fire plan?
659 8 1
07109
Does the test of automatic audible alarm sound prior to release of a fixed gas fire-extinguishing medium into spaces in which personnel normally work?
386 21 0
07108
Are the fire protection systems, fire fighting-systems and appliances maintained ready for use?
470 15 1
07124
Is there a maintenance plan onboard to show that fire protection systems and fire- fighting systems and appliances (as appropriate) have been properly tested and inspected?
305 4 0
07123
Is the crew familiar with the location and operation of fire-fighting systems and appliances that they may be called upon to use?
227 16 0

13 | P a g e
CIC-topic related deficiencies Inspections Detentions
CIC-topic related
Detentions CIC-topic related with RO responsibility
(# of inspections with this deficiency) One inspection can have multiple deficiencies
(# of inspections with this deficiency recorded as ground for detention)
(# of inspections with this deficiency recorded as ground for detention and RO related)
08103
Does the test of the sprinkler system trigger an automatic visual and audible alarm for the section?
49 5 0
07106
Does the activation of any detector or manually operated call point initiate a visual and audible fire signal at the control panel on the bridge or control station?
410 23 2
07120
Is the lighting in escape routes, including the Low Location Lighting systems where applicable properly maintained?
301 3 2
04102 Is the Emergency Fire pump, capable of producing at least two jets of water?
183 34 0
07113 Are the Isolating valves of the fire main marked, maintained and easily operable?
393 26 0
04109 Where a fire drill was witnessed was it found to be satisfactory?
171 34 0
TOTAL 4,279 195 6

14 | P a g e
3.1.5. Analysis of CIC-topic related deficiencies
Deficiency 07110 (related to Question 3), which pertains to fire-fighting equipment and appliances, accounted for the most number of reported inspection deficiencies at 15% of the total. This was closely followed by Deficiency 07108 (related to Question 5a), pertaining to ready availability of fire-fighting equipment which accounted for 11% of the total reported deficiencies, and Deficiency 07106 (related to Question 8), pertaining to fire detection and alarm systems, which accounted for 10%. Deficiency 08103 (related to Question 7), which pertains to fire alarms, accounted for the least number of reported inspection deficiencies at 1% of the total. Deficiency 04109 (fire drills), and Deficiency 04102 (emergency fire pump and its pipes) and Deficiency 1309 (fire control plan) accounted for the next least number of reported inspection deficiencies with each contributing 4% to the total. Note, this analysis reveals there are some inconsistencies between the deficiency results and the questionnaire results which raise some questions. For example, Deficiency 07110 which pertains to Question 3 was the most used deficiency code, yet according to the questionnaire results Question 3 reported the fourth most favourable results of all questions. Another example pertains to Deficiency 07106, which is the code for non-compliance with Question 8. According to the deficiency results, Deficiency 07106 is the third most used code, yet according to the questionnaire results Question 8 reported the sixth most favourable results of all questions. The CIC instructions require that for each unsatisfactory answer in the questionnaire, Inspectors are to provide the detail of any deficiencies on the PSC Form B. The questionnaire also specifically notes for each question, the deficiencies that apply. It is thus reasonable to expect that there should be good correlation between the results of the questionnaire and the results of the deficiencies in terms of most favourable to least favourable; yet, the correlation is only 0.23. Chart 2 below shows the comparison of the questionnaire and deficiency results for all CIC questions. It reveals that the number of “No” responses in the questionnaire exceeds the number of reported deficiencies for over half the questions. In some cases, the gap is significant.
The inconsistencies that exist between the questionnaire data and the deficiency data are found in every CIC. One explanation may be that in some instances PSCOs are completing the questionnaire but are not doing the extra step for the unsatisfactory

15 | P a g e
answers and filling out the PSC Report Form B. Another explanation may be that given that the CIC is carried out in conjunction with the normal PSC inspections, perhaps in some cases PSCOs are filling out the questionnaire independent of the PSC Report Form B. It could also be a combination of both explanations.
The above explanations support that both the questionnaire and the deficiency data are likely correct but just not necessarily associated with each other in all cases. For this reason, it is the opinion of the TMOU that even though the deficiency and questionnaire data is not necessarily consistent, it does not diminish the validity of the overall results of the CIC. Independently and/or taken together, both results provide valuable information to TMOU Maritime Authorities as to the industry’s level of compliance with specific aspects of SOLAS Chapter II-2 on Fire Protection, Fire Detection and Fire Extinction arrangements on board ships. 3.1.6. Number of ships to number of inspections in CIC Table 4 Number of ships to number of inspections in CIC campaign
# of inspections performed per ship # of ships % of total
1 6704 90% 2 671 9% 3 68 1% 4 6 0%
TOTAL 7449* * It is noted that the total number of individual ships in Table 4, 6, 7 and Annex 1.2 is not a sum total of the column, as the approach to individual ship calculation is not summing, but regional identification calculations. Table 4 reveals that the vast majority of the ships inspected during the CIC (90%) were only inspected once. Of the remaining ships, 9% were inspected twice, 1% three times, and a total of 6 ships were inspected four times. 3.1.7. Number of inspected ships per Ship Risk Profile Table 5 Number of inspected ships per Ship Risk Profile
Target Factor # of inspections
# of detentions
detention as % of
inspections
detentions CIC-topic related
detentions CIC-topic related as
% of inspections
Low 2375 34 1.4% 9 0.04%
Medium 3427 115 3.4% 48 1.4%
High 2313 153 6.6% 71 3.1%
Very high 159 45 28.3% 22 13.8% TOTAL 8274 347 4.2% 150 1.8% TOTAL FOR CIC QUESTIONNAIRE INSPECTIONS
6606 217 3.3% 150 2.3%

16 | P a g e
The CIC results shown in Table 5 above, which identify the number and percentage of ship detentions falling in each of the ship risk profile categories, are consistent with what would be expected in accordance with the risk profiling breakdown. This helps support the validity of the risk profiling methodology used by the TMOU. For general detentions and CIC-topic related detentions, ships considered very high risk comprised (by far) the largest percentage of ships detained per inspection. High risk ships accounted for the second most detained ships, followed by medium and low risk ships.
17 | P a g e
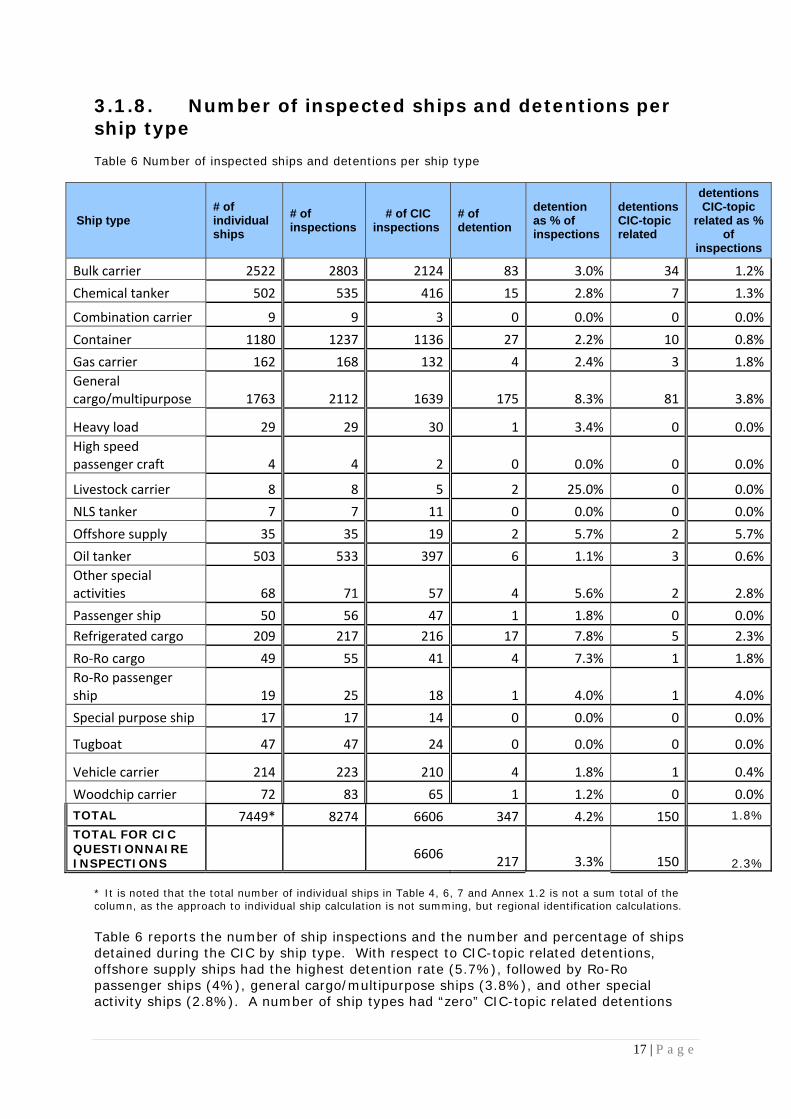
3.1.8. Number of inspected ships and detentions per ship type Table 6 Number of inspected ships and detentions per ship type
Ship type # of individual ships
# of inspections
# of CIC inspections
# of detention
detention as % of inspections
detentions CIC-topic related
detentions CIC-topic
related as % of
inspections
Bulk carrier 2522 2803 2124 83 3.0% 34 1.2%Chemical tanker 502 535 416 15 2.8% 7 1.3%
Combination carrier 9 9 3 0 0.0% 0 0.0%Container 1180 1237 1136 27 2.2% 10 0.8%Gas carrier 162 168 132 4 2.4% 3 1.8%General cargo/multipurpose 1763 2112 1639 175 8.3% 81 3.8%
Heavy load 29 29 30 1 3.4% 0 0.0%High speed passenger craft 4 4 2 0 0.0% 0 0.0%
Livestock carrier 8 8 5 2 25.0% 0 0.0%NLS tanker 7 7 11 0 0.0% 0 0.0%Offshore supply 35 35 19 2 5.7% 2 5.7%Oil tanker 503 533 397 6 1.1% 3 0.6%Other special activities 68 71 57 4 5.6% 2 2.8%Passenger ship 50 56 47 1 1.8% 0 0.0%Refrigerated cargo 209 217 216 17 7.8% 5 2.3%Ro‐Ro cargo 49 55 41 4 7.3% 1 1.8%Ro‐Ro passenger ship 19 25 18 1 4.0% 1 4.0%Special purpose ship 17 17 14 0 0.0% 0 0.0%
Tugboat 47 47 24 0 0.0% 0 0.0%
Vehicle carrier 214 223 210 4 1.8% 1 0.4%Woodchip carrier 72 83 65 1 1.2% 0 0.0%TOTAL 7449* 8274 6606 347 4.2% 150 1.8% TOTAL FOR CIC QUESTIONNAIRE INSPECTIONS
6606 217 3.3% 150
2.3% * It is noted that the total number of individual ships in Table 4, 6, 7 and Annex 1.2 is not a sum total of the column, as the approach to individual ship calculation is not summing, but regional identification calculations. Table 6 reports the number of ship inspections and the number and percentage of ships detained during the CIC by ship type. With respect to CIC-topic related detentions, offshore supply ships had the highest detention rate (5.7%), followed by Ro-Ro passenger ships (4%), general cargo/multipurpose ships (3.8%), and other special activity ships (2.8%). A number of ship types had “zero” CIC-topic related detentions

18 | P a g e
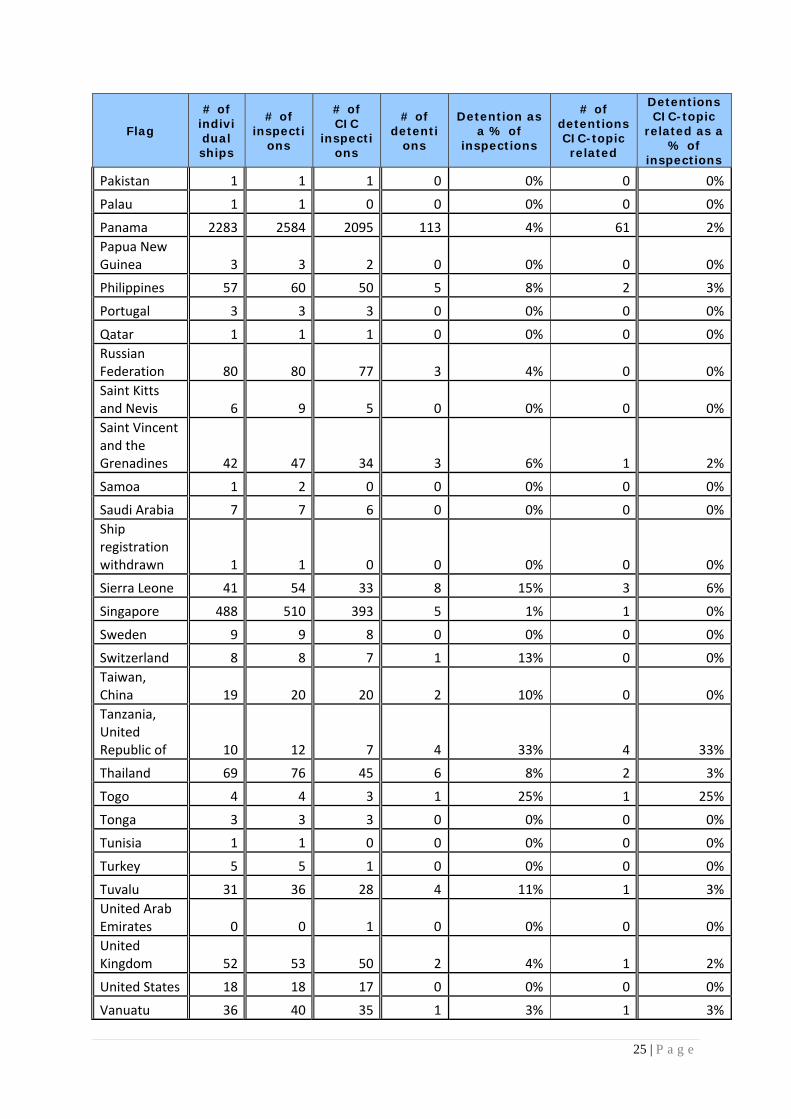
including combination carriers, heavy load ships, high speed passenger crafts, livestock carriers, NLS tankers, passenger ships, special purpose ships, tugs and woodchip carriers. It is important to note that the sample sizes (number of ships inspected) of the top two ship types detained (offshore supply ships and Ro-Ro passenger ships) were very low compared to the third most detained ship type (general cargo/multipurpose), as well as compared to several other ship types including chemical tankers, bulk carriers, and container ships. There were only 35 inspections of offshore supply ships compared to 2,112 general cargo/multipurpose ship inspections, 535 chemical tanker inspections, 2,803 bulk carrier inspections, and 1,237 container inspections. The detention rate for chemical tankers was 1.3%, bulk carriers was 1.2% and container ships 0.8%. Although smaller sample sizes do not invalidate the results in anyway, it does however provide less certainty as to how widespread a finding may be within a specific ship type. If available, comparing the data in Table 6 with the total number of ships that comprise the overall convention ship fleet by ship type would help improve this uncertainty and bring more precision to the analysis. If only vessel types with a relatively larger sample size are considered in the analysis, general cargo/multipurpose ships become the ship type with the highest percentage of detentions followed by bulk carriers and container ships. 3.1.9 Inspections and detentions per Flag State The table in Annex 1.2 presents the number of inspections and number and percentage of ships detained during the CIC by flag state. Ships from 86 different flag states were inspected during the CIC. With respect to CIC-topic related detentions, the flag state with the highest percentage of ships detained were Equatorial Guinea (50%). This was followed by the Cook Islands and Tanzania (both had 33%), Togo (25%) and Korea, DPR (13%). The remaining flag states were 7% and under, and 53 of the 86 flag states (63%) did not have any detentions. The flag states with the highest percentage of ships detained had relatively smaller sample sizes (number of ships inspected) compared to other flag states. Again, as mentioned previously, smaller sample sizes do not make the results any less valid but rather reduces the certainty as to how widespread a finding may be, in this case, for a particular flag state. If available, including the number of ships that comprise each flags convention fleet in the Annex 1.2 table would help improve this uncertainty and bring more precision to the results.

19 | P a g e
3.1.10 Inspections and detentions per Recognized Organization
The table in Annex 1.5 presents the number of inspections (by vessel certificate – 502, 504 and 513) and number of CIC-topic related detentions by Recognized Organization (RO). It shows there were a total of 7,787 inspections of ships where the certificate was recorded as issued by the RO and only five (6) CIC-topic related detentions which had a deficiency linked to one of the three certificates. This equates to a very low detention rate of only 0.08%. By comparison, the detention rate for the overall CIC (CIC-topic related deficiencies) was 2.3% which means that ships for which ROs have the delegated authority to perform inspections and certifications on behalf of the member Maritime Authority performed significantly better than the broader CIC results. The ROs with the detentions were Nippon Kaiji Kyokai (2), Bureau Veritas (1), International Ship Classification (1), Union Bureau of Shipping (1) and “Other” (1). Nippon Kaiji Kyokai ships also had by far the largest number of inspections (2,417) comprising 31% of RO ships inspected. 3.1.11 Ship age overview Table 7 ship age overview
Ship age # of
individual ships
# of inspections
# of CIC inspections
# of detentions
Detention as a % of
inspections
Detentions CIC-topic
related
Detentions CIC-topic
related as a % of
inspections
< 6 Years 2515 2729 2166 60 2% 25 1%6-11 Years 2020 2202 1789 74 3% 32 1%12-17 Years 1142 1270 1044 47 4% 21 2%18-23 Years 844 947 771 52 5% 23 2%24-29 Years 655 799 585 74 9% 30 4%30-35 Years 219 256 193 31 12% 15 6%>35 Years 61 71 58 9 13% 4 6%
TOTAL 7449* 8274 6606 347 4.2% 150 1.8% TOTAL FOR CIC QUESTIONNAIRE INSPECTIONS
6606 217 3.3% 150
2.3% * It is noted that the total number of individual ships in Table 4, 6, 7 and Annex 1.2 is not a sum total of the column, as the approach to individual ship calculation is not summing, but regional identification calculations. Table 7 reports the number of ship inspections and the number and percentage of ships detained during the CIC by ship age. By ship age, the data clearly indicates that the rate of ship detention per inspection increases with ship age. For ships less than 11 years old, the rate of detention was 1% and the rate steadily increases to where ships over 30 years old have a rate of detention of 6% per inspection.
3.2 Results on former CICs on same subject Not applicable – this is the first CIC for this subject matter.

20 | P a g e
3.3 Results other CIC participants Table 8 Results other CIC participants
PMOU TMOU
# of inspections with CIC Questionnaire 4,014 6,606
# of detentions 160 217
Detentions as a % of inspections 4.0% 3.3%
Detentions with CIC-topic related deficiencies
103 150
Detentions with CIC-topic related deficiencies as a % of inspections
2.6%
2.3%
Detentions with CIC-topic related deficiencies as a % of detentions
64%
69%
CIC Question reporting the most favourable results
Q3 Q4
CIC Question reporting the least favourable results
Q12 Q5a and Q12
Ship type reporting the least favourable results*
Cargo/multipurpose ships
Cargo/multipurpose ships
Ship age reporting the most favourable results
< 6 years <11 years
Ship age reporting the least favourable results
>35 years > 30 years
RO ships detention rate for CIC-topic related detentions
0.5% 0.09%
# of RO responsibility ship inspections during CIC
3419 7787
Most recent published annual detention rate for broader PSC inspection regime
3.28% 5.46%
* Taking into consideration sample sizes.

21 | P a g e
Table 8 reveals that TMOU member states conducted 39.2% more inspections with CIC questionnaires than PMOU member states during the three months of the campaign. However, detentions as a percentage of inspections were 17.5% higher for the PMOU overall and 11.5% higher for CIC-topic related detentions. Nonetheless, the proportion of detentions with CIC-topic related deficiencies as a percentage of total detentions was higher for TMOU inspections by 5%. Cargo/multipurpose ships were the most problematic ship type for both the TMOU and PMOU and older ships had the highest rate of detention in both cases. There was a slight difference however in the PMOU and TMOU results with respect to inspections of RO responsibility ships. Although only 3419 RO recorded responsibility issuing ship certificates were conducted by PMOU member states, the detention rate for CIC-topic related deficiencies was five times higher than TMOU. In stark contrast, TMOU member states inspected 7,043 RO recorded responsibility issuing ship certificates (the vast majority of all ships inspected by TMOU member states) and the detention rate for CIC-topic related deficiencies was low at 0.09%. This result is below the PMOU results for the CIC, but also better than the TMOU broader PSC inspection results reported annually. Overall, both the PMOU and TMOU CIC results faired better than their respective broader PSC inspection results, thus both authorities conclude that the CIC has indeed provided sound evidence supporting that the industry has in general achieved a good level of compliance with the specific provisions of the SOLAS Chapter II-2 pertaining to fire safety systems.

22 | P a g e
Annex 1 CIC Questionnaire
Annex 1.1 Inspection form of the CIC

23 | P a g e
Annex 1.2 Inspections and Detentions per Flag State
Table Annex 1.2 Inspections and detentions per Flag State
Flag
# of individual ships
# of inspecti
ons
# of CIC
inspections
# of detenti
ons
Detention as a % of
inspections
# of detentions CIC-topic related
Detentions CIC-topic
related as a % of
inspections Antigua and Barbuda 142 148 139 8 5% 2 1%
Argentina 1 1 1 0 0% 0 0%
Australia 1 1 0 0 0% 0 0%
Bahamas 173 183 162 4 2% 1 1%
Bangladesh 7 7 5 0 0% 0 0%
Barbados 4 4 3 1 25% 0 0%
Belgium 3 4 4 0 0% 0 0%
Belize 91 111 86 14 13% 6 5%Bermuda (GB) 8 10 7 0 0% 0 0%
Brazil 1 1 1 0 0% 0 0%
Cambodia 302 419 284 62 15% 20 5%
Canada 1 1 1 0 0% 0 0%Cayman Islands (GB) 26 29 22 1 3% 1 3%
China 253 273 212 4 1% 2 1%
Comoros 1 1 1 0 0% 0 0%
Cook Islands 3 3 1 1 33% 1 33%
Croatia 5 5 5 0 0% 0 0%
Curacao 7 7 8 0 0% 0 0%Cyprus 130 136 115 2 1% 2 1%
Denmark 33 33 28 1 3% 0 0%Dominica 3 3 1 0 0% 0 0%
Ecuador 1 1 1 0 0% 0 0%
Egypt 5 5 5 0 0% 0 0%Equatorial Guinea 1 2 1 1 50% 1 50%
Ethiopia 1 1 1 1 100% 0 0%
Finland 1 1 1 0 0% 0 0%
France 12 12 11 0 0% 0 0%
Germany 55 56 53 2 4% 1 2%Gibraltar (GB) 19 20 18 1 5% 0 0%

24 | P a g e
Flag
# of individual ships
# of inspecti
ons
# of CIC
inspections
# of detenti
ons
Detention as a % of
inspections
# of detentions CIC-topic related
Detentions CIC-topic
related as a % of
inspections
Greece 79 84 67 1 1% 1 1%Hong Kong, China 706 784 634 2 0% 1 0%
India 27 28 20 0 0% 0 0%
Indonesia 37 43 24 6 14% 3 7%Iran, Islamic Republic of 1 1 1 0 0% 0 0%Isle of Man (GB) 46 47 38 1 2% 0 0%
Israel 1 1 1 0 0% 0 0%
Italy 29 32 23 0 0% 0 0%
Jamaica 3 4 2 0 0% 0 0%
Japan 51 52 42 2 4% 0 0%
Kiribati 41 50 41 4 8% 3 6%Korea, Democratic People's Republic of 41 46 27 9 20% 6 13%Korea, Republic of 348 375 333 2 1% 0 0%
Kuwait 6 6 5 0 0% 0 0%Lao People's Democratic Republic 1 1 0 0 0% 0 0%
Liberia 539 575 468 20 3% 6 1%Libyan Arab Jamahiriya 2 2 1 0 0% 0 0%
Lithuania 1 1 0 0 0% 0 0%
Luxembourg 2 2 3 0 0% 0 0%
Malaysia 57 60 41 3 5% 3 5%Maldives 2 3 2 0 0% 0 0%
Malta 172 189 146 4 2% 1 1%Marshall Islands 403 441 327 11 2% 3 1%Moldova, Republic of 1 1 0 0 0% 0 0%
Mongolia 28 30 21 3 10% 2 7%
Myanmar 1 1 1 0 0% 0 0%
Netherlands 33 36 29 3 8% 0 0%
New Zealand 1 1 1 0 0% 0 0%
Norway 56 58 50 2 3% 2 3%
25 | P a g e
Flag
# of individual ships
# of inspecti
ons
# of CIC
inspections
# of detenti
ons
Detention as a % of
inspections
# of detentions CIC-topic related
Detentions CIC-topic
related as a % of
inspections
Pakistan 1 1 1 0 0% 0 0%
Palau 1 1 0 0 0% 0 0%
Panama 2283 2584 2095 113 4% 61 2%Papua New Guinea 3 3 2 0 0% 0 0%
Philippines 57 60 50 5 8% 2 3%
Portugal 3 3 3 0 0% 0 0%
Qatar 1 1 1 0 0% 0 0%Russian Federation 80 80 77 3 4% 0 0%Saint Kitts and Nevis 6 9 5 0 0% 0 0%Saint Vincent and the Grenadines 42 47 34 3 6% 1 2%
Samoa 1 2 0 0 0% 0 0%
Saudi Arabia 7 7 6 0 0% 0 0%Ship registration withdrawn 1 1 0 0 0% 0 0%
Sierra Leone 41 54 33 8 15% 3 6%
Singapore 488 510 393 5 1% 1 0%
Sweden 9 9 8 0 0% 0 0%
Switzerland 8 8 7 1 13% 0 0%Taiwan, China 19 20 20 2 10% 0 0%Tanzania, United Republic of 10 12 7 4 33% 4 33%
Thailand 69 76 45 6 8% 2 3%
Togo 4 4 3 1 25% 1 25%
Tonga 3 3 3 0 0% 0 0%
Tunisia 1 1 0 0 0% 0 0%
Turkey 5 5 1 0 0% 0 0%
Tuvalu 31 36 28 4 11% 1 3%United Arab Emirates 0 0 1 0 0% 0 0%United Kingdom 52 53 50 2 4% 1 2%
United States 18 18 17 0 0% 0 0%
Vanuatu 36 40 35 1 3% 1 3%
26 | P a g e
Flag
# of individual ships
# of inspecti
ons
# of CIC
inspections
# of detenti
ons
Detention as a % of
inspections
# of detentions CIC-topic related
Detentions CIC-topic
related as a % of
inspections
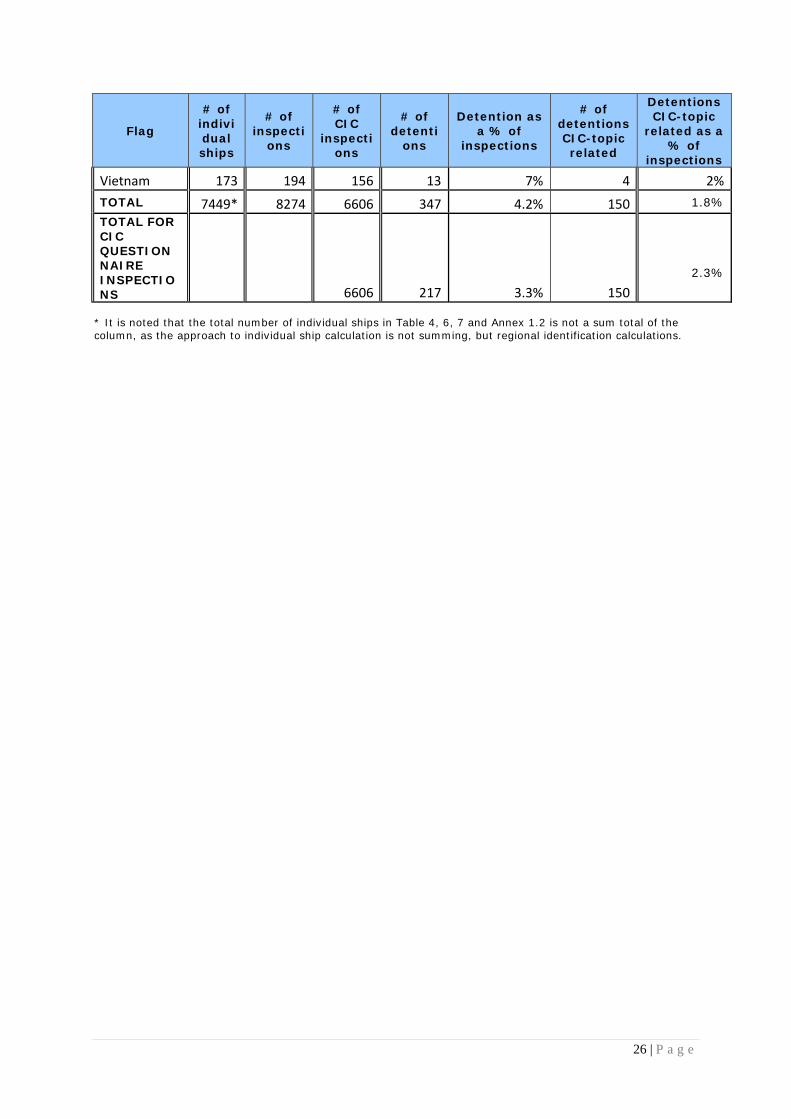
Vietnam 173 194 156 13 7% 4 2%TOTAL 7449* 8274 6606 347 4.2% 150 1.8% TOTAL FOR CIC QUESTIONNAIRE INSPECTIONS 6606 217 3.3% 150
2.3%
* It is noted that the total number of individual ships in Table 4, 6, 7 and Annex 1.2 is not a sum total of the column, as the approach to individual ship calculation is not summing, but regional identification calculations.

27 | P a g e
Annex 1.3 Inspections and detentions per Recognized Organization
Table Annex 1.3 Inspections and detentions per Recognized Organization
Issuing authority Inspection*
Detentions CIC-topic related
with RO responsibility**
502 – Cargo Ship Safety Equipment
504 – Cargo Ship
Safety
513 – Passenger
Ship Safety
Alpha Register of Shipping 1 0 0 0American Bureau of Shipping 523 1 1 0Bureau Veritas 490 7 1 1China Classification Society 602 1 4 0China Corporation Register of Shipping 40 0 0 0Croatian Register of Shipping 5 0 0 0Det Norske Veritas 429 2 6 0
Germanischer Lloyd 615 6 2 0Global Marine Bureau Inc. 89 15 0 0Global Shipping Bureau 3 0 0 0Indian Register of Shipping 6 0 0 0Inspeccion y Clasificacion Maritima (INCLAMAR) 2 0 0 0Intermaritime Certification Services, S.A. 77 1 0 0International Naval Surveys Bureau 5 0 0 0International Register of Shipping 51 0 1 0International Ship Classification 64 0 0 1Isthmus Bureau of Shipping, S.A. 70 4 0 0Korea Classification Society 45 5 0 0Korea Ship Safety Technology Authority 1 0 0 0Korean Register of Shipping 701 3 19 0Lloyd's Register 557 12 13 0National Shipping Adjuster Inc. 4 0 0 0Nippon Kaiji Kyokai 2408 5 4 2No class 1 0 0 0Other 39 3 0 1Overseas Marine Certification Services 38 0 0 0Panama Bureau of Shipping 3 1 0 0Panama Maritime Documentation Services 79 0 0 0Panama Shipping Registrar Inc. 15 0 0 0Polski Rejestr Statkow (Polish Register of Shipping) 6 0 0 0

28 | P a g e
Issuing authority Inspection*
Detentions CIC-topic related
with RO responsibility**
502 – Cargo Ship Safety Equipment
504 – Cargo Ship
Safety
513 – Passenger
Ship Safety
PT Biro Klasifikasi Indonesia 2 0 1 0Registro Internacional Naval, S.A. 2 0 0 0Registro Italiano Navale 90 0 6 0Rinave Portuguesa 1 0 0 0
Russian Maritime Register of Shipping 105 1 1 0Ship Classification Of Malaysia 1 0 0 0Singclass International 5 0 0 0Sing‐Lloyd 12 0 0 0Union Bureau of Shipping 201 19 0 1Universal Maritime Bureau Ltd 50 4 0 0
Universal Shipping Bureau Inc. 5 0 0 0Vietnam Register of Shipping 194 1 0 0TOTAL 7637 91 59 6
* Number of inspections where the certificate is recorded as issued by the RO ** Number of inspections where the RO issued the certificate and a deficiency covered by that certificate was recorded as detainable and RO related