report of the provostial advisory group on faculty gender pay … · 2019-04-26 · report of the...
TRANSCRIPT
Report of the Provostial Advisory Group on
Faculty Gender Pay Equity: University of
Toronto
Analysis conducted by: Professor Dwayne
Benjamin; Professor Alison Gibbs; Professor
Joanne Oxley; Dr. Julia Rabinovich; and
Boriana Miloucheva
April 15, 2019

Report of the Provostial Advisory Group on Faculty Gender Pay Equity, April 15, 2019 2
Contents
Introduction 3
Summary of Main Findings 5
Tenured and Tenure Stream Faculty 5
Continuing Stream Teaching Stream Faculty 5
Faculty at the University of Toronto 6
Tenured and Tenure Stream Faculty 6
Continuing Stream Teaching Stream Faculty 6
Methodology for Estimating the Gender-Based Pay Gap 7
Gender–Based Pay Gap Analysis – Tenured and Tenure Stream Faculty 9
Gender-Based Pay Gap and Experience 9
Gender-Based Pay Gap and Field of Study (Academic Unit) 11
Gender-Based Pay Gap, Complete Linear Regression Model 12
Gender-Based Pay Gap Analysis – Continuing Stream Teaching Stream Faculty 18
Conclusion 22
References 23
Report of the Provostial Advisory Group on Faculty Gender Pay Equity, April 15, 2019 3
Introduction
This is the report of the University of Toronto’s Provostial Advisory Group on Gender Pay Equity. The Provostial Advisory Group, comprising faculty, academic administrators, and staff,1 was convened in the fall of 2016 by the Vice-President & Provost, Cheryl Regehr and charged with conducting a detailed analysis of the salaries of full-time continuing appointed faculty to determine whether, and to what extent, there exists a significant gender-based pay gap among University of Toronto faculty. This report is provided following two years of substantive analysis. The detailed analysis reflects the strength of the institution’s commitment to identifying any gap in faculty salaries that is attributable to gender.
The issue of gender pay equity at universities in Canada and peer institutions internationally has received significant study over the last decade. Institutions such as the University of British Columbia (2010, 2012), Western University (2005, 2009), the University of Waterloo (2016), and McMaster University (2014) have recently conducted studies of faculty salaries with respect to gender. In addition, a number of peer institutions internationally have also conducted analyses of faculty salaries by gender, most notably the London School of Economics and the University of California, Berkeley. All of these studies have documented gender-based pay gaps that cannot be fully explained by factors such as experience, rank, academic discipline or field of study, and research productivity. The Berkeley study, in particular, provides a detailed and comprehensive overview of the methodology used in gender pay equity studies, including a discussion of academic salaries more generally in research-intensive public universities.2 To address the gender-based pay gaps identified at their
1 The full Provostial Advisory Group included: Professor Sioban Nelson, Vice-Provost, Faculty & Academic Life (to June 30, 2018); Professor Heather Boon, Vice-Provost, Faculty & Academic Life (from July 1, 2018); Professor Dwayne Benjamin, Faculty of Arts & Science, Dept. of Economics and Vice-Dean Graduate
Education; Michelle Broderick, Senior Academic Research Analyst, Office of Planning & Budget; Professor Ken Corts, Rotman Faculty of Management, Vice-Dean Faculty & Research; Steve Dyce, Human Resources and Equity, Director, Pensions and Benefits (to January 2019); Kate Enros, Director Academic HR Services & Faculty Relations; Professor Alison Gibbs, Faculty of Arts & Science, Department of Statistical Sciences; Phil Harper, Human Resources and Equity, HR Research & Reporting Specialist; Jane Harrison, Director, Office of the Vice-Provost, Faculty & Academic Life; Professor John Magee, Faculty of Arts & Science, Vice-Dean Faculty & Academic Life; Professor Joanne Oxley, Rotman Faculty of Management, Associate Dean, Faculty; Julia Rabinovich, Senior Projects Officer, Office of the Vice-Provost, Faculty & Academic Life.
2 “Report on the UC Berkeley Faculty Salary Equity Study,” Office of the Vice-Provost for the Faculty, January 2015.

Report of the Provostial Advisory Group on Faculty Gender Pay Equity, April 15, 2019 4
institutions, many of these universities have made one-time, across the board corrections to the base salaries of women faculty of between $2,000-$3,000.
In the past, the University of Toronto has conducted reviews of faculty salaries on the basis of gender and has made adjustments to salaries where they were found to be anomalous. In the fall of 2016, the Provostial Advisory Group on Gender Pay Equity was charged with undertaking the most comprehensive study to date of the salaries of men and women full-time, appointed faculty at the University of Toronto. The analysis was undertaken by an expert group including faculty members who are distinguished for their knowledge and expertise in this area, a staff member, and a graduate student.3
This analysis is based on payroll and other employee data from the University of Toronto’s Human Resources Information System (HRIS)4, and examines gender pay equity for two groups of faculty:
1. Full-time tenured and tenure stream faculty (2015-16 data);5 and 2. Full-time continuing and continuing stream teaching stream faculty (2016-17).6
The analysis does not include part-time faculty, faculty on contractually limited term appointments (CLTAs), and librarians. In addition, the analysis excludes clinical faculty, faculty in the phased retirement program, and those on long-term disability leave lasting longer than one year.
The objective of this study was to develop a statistical model that allows us to identify the closest peer-to-peer comparisons of men and women faculty salaries, taking into account individual differences in experience,7 field of study,8 and other relevant factors.9
3 Professors Dwayne Benjamin (Economics), Alison Gibbs (Statistics), and Joanne Oxley (Management); Dr. Julia Rabinovich; and Boriana Miloucheva. 4 Where necessary, these data were supplemented with data drawn from other University databases. 5 The most current data at the time this study commenced. 6 Data on continuing stream teaching stream faculty were not available prior to 2016-17. 7 For the purpose of this study, measured as “years since highest degree” and rank. 8 For the purpose of this study only, we use “field of study” and academic unit interchangeably, measured as the academic unit in which the faculty member holds their primary budgetary appointment. 9 See footnote 10.
Report of the Provostial Advisory Group on Faculty Gender Pay Equity, April 15, 2019 5
Summary of Main Findings
The report of the Provostial Advisory Group found the following:
Tenured and Tenure Stream Faculty
1. On average, tenured and tenure stream women faculty at the University of Toronto earn 1.3% less than comparably situated faculty who are men, after controlling for experience, field of study, and other relevant factors10. Our analysis indicates that the overall raw average difference in salary between men and women tenure stream faculty of 12% is largely explained by the fact that women in the tenure stream at the University of Toronto have fewer years of experience and work in lower paying fields of study.
Continuing Stream Teaching Stream Faculty
2. There is no statistically significant difference between the salaries of men and women continuing stream teaching stream faculty. This result holds for all levels of pay, and is robust across all model specifications.
10 The complete regression model includes three additional controls: experience prior to hire; administrative positions; Canada Research Chair/University Professorship. See p. 13 of the report for details.

Report of the Provostial Advisory Group on Faculty Gender Pay Equity, April 15, 2019 6
Faculty at the University of Toronto
Tenured and Tenure Stream Faculty
Tenured and tenure stream faculty data were collected for the 2015-16 academic year, covering the 2,081 full-time tenured and tenure stream faculty at the University as of September 2015.
Table 1. Breakdown of tenured and tenure stream faculty by rank (2015-16)
Number of faculty Percentage women
Assistant Professor11 383 43%
Associate Professor 733 45%
Professor 965 27%
All tenured and tenure stream faculty
2,081 36%
Women comprised 36% of faculty in the tenure stream in 2015-16. These women tend to be younger and hold more junior tenure stream faculty positions compared to men. For example, just 34% of women hold the rank of Professor, versus 53% of men.12
Base salary figures (used in all of the analysis reported below) exclude any payments that faculty may receive for services that are additional to normal faculty workload, such as administrative stipends or payments for overload teaching responsibilities.
Continuing Stream Teaching Stream Faculty
Teaching stream faculty data were collected for the academic year 2016-17, covering the 336 full-time continuing stream teaching stream faculty as of September 2016.
Women comprised 50% of faculty in the continuing stream teaching stream in 2016-17. Men and women are similarly distributed across the rank of Assistant Professor, Teaching Stream
11 This includes faculty members at the rank of Assistant Professor (Conditional). 12 Faculty Gender Equity Report, 2015-16 and 2016-17, Office of the Vice-Provost, Faculty & Academic Life, p. 7 and 8, http://www.faculty.utoronto.ca/wp-content/uploads/2018/10/Faculty-Gender-Equity-Report-2015-16-and-2016-17.pdf

Report of the Provostial Advisory Group on Faculty Gender Pay Equity, April 15, 2019 7
and Associate Professor, Teaching Stream, with the majority of men and women teaching stream faculty (73-74%) holding the rank of Associate Professor, Teaching Stream.13
Table 2. Breakdown of continuing stream teaching stream faculty by rank (2016-17)14
Number of faculty Percentage women
Assistant Professor, Teaching Stream 15 90 51% Associate Professor, Teaching Stream 246 50% All teaching stream faculty 336 50%
Methodology for Estimating the Gender-Based Pay Gap
The gender pay equity analysis includes data on full-time tenured and tenure stream and continuing stream teaching stream faculty at the University of Toronto. This report uses data from the University of Toronto Human Resources Information System (HRIS) which includes data on each employee of the University.
Based on previous analyses by peer and other Canadian institutions, and relying on existing literature on the subject (particularly within the field of Labour Economics), we developed an approach to the gender pay equity analysis that is appropriate for the University of Toronto.
1. The data for tenured and tenure stream faculty and continuing stream teaching stream faculty are analyzed separately, based on the distinct nature of each stream.
2. The gender-based pay gap is estimated as a percentage difference in earnings between men and women. To calculate this percentage difference, we regress the natural log of the annual salary on a gender indicator variable, which equals one if the individual is a woman.16
13 As of September 2016, no teaching stream faculty had been promoted to the rank of Professor, Teaching Stream. 14 Faculty Gender Equity Report, 2015-16 and 2016-17, Office of the Vice-Provost, Faculty & Academic Life, p. 11 15 This includes faculty members at the rank of Assistant Professor, Teaching Stream (Conditional). 16 Because salaries at the University of Toronto have approximately a log-normal distribution, working with log-transformed salaries allows for direct estimation of percentage differences, and improves statistical inference. This is the conventional approach taken in gender pay equity studies. Using raw dollar salary amounts in place of log-transformed salaries yields the same results.
Report of the Provostial Advisory Group on Faculty Gender Pay Equity, April 15, 2019 8
3. Since there are differences in the level of experience of women and men at the University of Toronto (e.g., the proportion of women and men varies across academic ranks) and differences across fields of study, the gender-based pay gap cannot be properly estimated by looking only at the raw differences in earnings between men and women. Thus, in addition to gender, we include in our analysis controls for other relevant factors that predictably influence faculty compensation, most notably experience (measured as years since highest degree and academic rank), and field of study (measured as academic unit). Controlling for these other factors allows us to make closer peer-to-peer comparisons of the salaries of men and women faculty, and to isolate average differences in pay between men and women that can be directly attributable to gender.
The figures in this report present point estimates for the percentage difference in earnings between men and women based on different model specifications, as well as 95% confidence intervals for these estimates.17 If a confidence interval does not contain a value of 0, the estimated pay gap is considered to be statistically significant and we can reject the ‘null’ hypothesis, that there is no difference in earnings between men and women.
The gender indicator variable is coded “1” for women and “0” for men. Thus, a negative gap in salary should be interpreted as an indication that women faculty, on average, are paid lower salaries than their colleagues who are men.
17 The confidence interval indicates the range of values within which we can be 95% confident the true value of the wage gap lies.
Report of the Provostial Advisory Group on Faculty Gender Pay Equity, April 15, 2019 9
Gender–Based Pay Gap Analysis – Tenured and Tenure Stream Faculty
Gender-Based Pay Gap and Experience
Academic salaries are highly correlated with experience (years since highest degree and academic rank). As we discuss above, since women tend to hold more junior faculty positions than men, this will be reflected in the raw gender-based pay gap. Consequently, we would expect the average pay gap associated with gender differences to decrease once we account for experience (years since highest degree and academic rank).
Figure 1 presents estimates of the gender-based pay gap using four different model specifications:
1. The ‘raw’ gender-based pay gap, i.e., the average gender-based pay gap with no additional controls;
2. The average gender-based pay gap controlling for the number of years since highest degree;18
3. The average gender-based pay gap controlling for academic rank; and 4. The average gender-based pay gap controlling both for the number of years since
highest degree and academic rank.
18 The results of prior studies suggest that the effects of experience may diminish with years of experience. This model thus includes a variable for the number of years since highest degree, and a variable for the number of years since highest degree squared, to allow for a possible non-linear effect. Note that the sample size decreases by two in this model, relative to the model without controls, as there are two faculty members who do not have a date of highest degree in the data.
Report of the Provostial Advisory Group on Faculty Gender Pay Equity, April 15, 2019 10
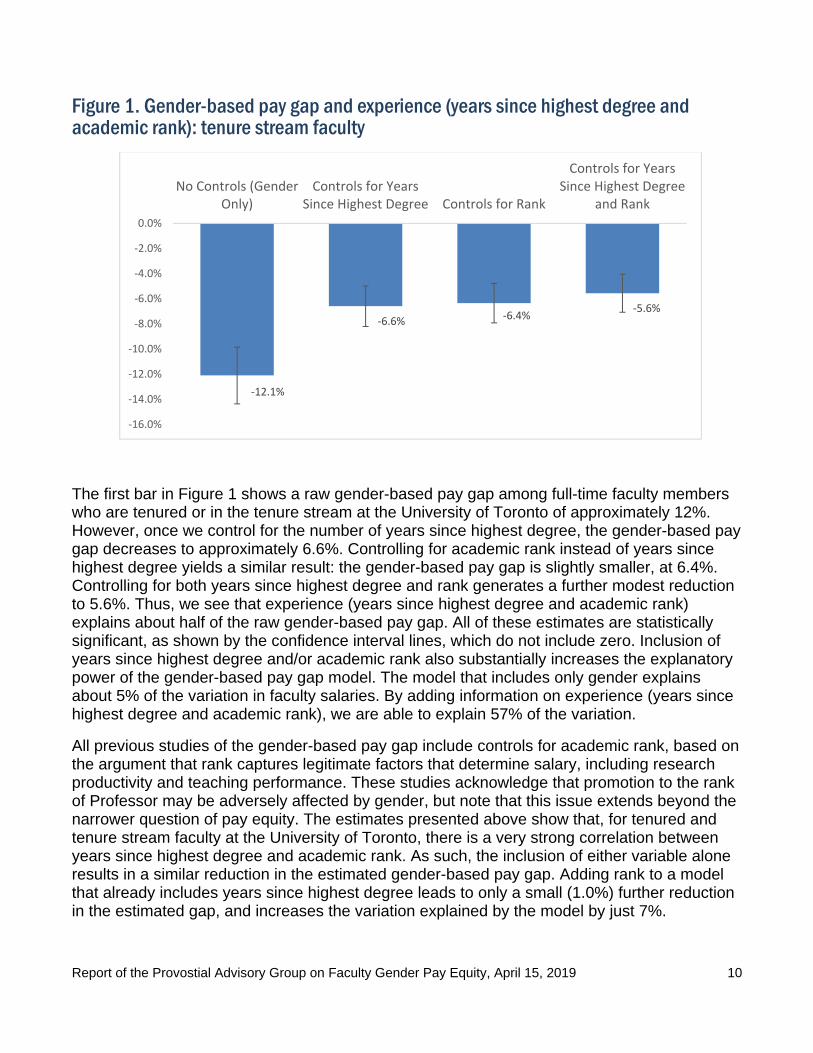
Figure 1. Gender-based pay gap and experience (years since highest degree and academic rank): tenure stream faculty
The first bar in Figure 1 shows a raw gender-based pay gap among full-time faculty members who are tenured or in the tenure stream at the University of Toronto of approximately 12%. However, once we control for the number of years since highest degree, the gender-based pay gap decreases to approximately 6.6%. Controlling for academic rank instead of years since highest degree yields a similar result: the gender-based pay gap is slightly smaller, at 6.4%. Controlling for both years since highest degree and rank generates a further modest reduction to 5.6%. Thus, we see that experience (years since highest degree and academic rank) explains about half of the raw gender-based pay gap. All of these estimates are statistically significant, as shown by the confidence interval lines, which do not include zero. Inclusion of years since highest degree and/or academic rank also substantially increases the explanatory power of the gender-based pay gap model. The model that includes only gender explains about 5% of the variation in faculty salaries. By adding information on experience (years since highest degree and academic rank), we are able to explain 57% of the variation.
All previous studies of the gender-based pay gap include controls for academic rank, based on the argument that rank captures legitimate factors that determine salary, including research productivity and teaching performance. These studies acknowledge that promotion to the rank of Professor may be adversely affected by gender, but note that this issue extends beyond the narrower question of pay equity. The estimates presented above show that, for tenured and tenure stream faculty at the University of Toronto, there is a very strong correlation between years since highest degree and academic rank. As such, the inclusion of either variable alone results in a similar reduction in the estimated gender-based pay gap. Adding rank to a model that already includes years since highest degree leads to only a small (1.0%) further reduction in the estimated gap, and increases the variation explained by the model by just 7%.
‐12.1%
‐6.6% ‐6.4%‐5.6%
‐16.0%
‐14.0%
‐12.0%
‐10.0%
‐8.0%
‐6.0%
‐4.0%
‐2.0%
0.0%
No Controls (GenderOnly)
Controls for YearsSince Highest Degree Controls for Rank
Controls for YearsSince Highest Degree
and Rank
Report of the Provostial Advisory Group on Faculty Gender Pay Equity, April 15, 2019 11
Gender-Based Pay Gap and Field of Study (Academic Unit)
Faculty salaries vary significantly across different fields of study (academic units), in part reflecting differences in exposure to competition and market forces.19 The raw gender-based pay gap shown in Figure 1 may therefore be partially explained by differences in the distribution of men and women across fields of study (academic units), particularly if men are overrepresented in higher paying fields.20 Indeed, at the University of Toronto, there are large differences between Faculties, and between units within multi-department Faculties, in the proportion of faculty who are women. The proportion of women in particular academic units varies from 11% in Economics, to 18% in Management, 40% in Music, and 91% in Nursing.21 For the purpose of this study, we use the academic unit where faculty hold their majority appointment as an indicator of the field of study. 22
Figure 2 shows the results of our analysis investigating the impact of field of study (academic unit) on the gender-based pay gap by comparing the results of four different model specifications:
1. The ‘raw’ gender-based pay gap, i.e., the average gender-based pay gap with no additional controls, replicated from Figure 1;
2. The average gender-based pay gap controlling only for academic unit; 3. The average gender-based pay gap controlling for academic unit and academic rank; 4. The average gender-based pay gap controlling for academic unit and years since
highest degree; 5. The average gender-based pay gap controlling for academic unit, years since highest
degree, and rank.
19 The Berkeley gender pay equity report (UC Berkeley, 2015) has an illuminating discussion of the emergence of pay differences across disciplines, and how they intersect with salary determination at public universities. 20 On the “outsized proportion of men in higher-paying fields” see a recent article in Nature, Chris Woolston, January 22, 2019. 21 See Faculty Gender Equity Report 2015-16 and 2016-17. 22 See footnote 8.

Report of the Provostial Advisory Group on Faculty Gender Pay Equity, April 15, 2019 12
Figure 2. Gender-based pay gap and field of study (academic unit) and experience (years since highest degree and rank): tenure stream faculty
The results in Figure 2 indicate that field of study (academic unit) accounts for a significant portion of the estimated gender-based pay gap: addition of academic unit alone reduces the average gap from 12.1% to 7.1%. Once we control for both academic unit and rank, the estimated gender-based pay gap is reduced to 2.4%. Replacing the control for rank with years since highest degree, results in a slightly smaller average gender-based pay gap of 1.5%. When we control for all three variables the average gender-based pay gap is reduced to 1.1% (95% confidence interval - 0.1 to -2.1% indicating the estimated gap is statistically different from zero). This model, explains 85% of the variation in faculty salary (in comparison to the 5% explained by gender alone).
As with the previous analysis, the estimated gender-based pay gaps resulting from these model specifications are all statistically significant, as indicated by the confidence interval lines, which do not cross zero.
Gender-Based Pay Gap, Complete Linear Regression Model
The previous analyses suggest that the gender-based pay gap at the University of Toronto is to a large extent – although not entirely - a reflection of gender-based differences in experience (years since highest degree and faculty rank) and field of study (academic unit), rather than of pay differences between similarly-situated men and women faculty. In other words, the raw differences between average salaries of men and women faculty can be largely attributed to the fact that women faculty tend to have fewer years of experience, hold more junior academic positions, and are more often appointed to academic units that typically pay lower salaries.
In order to rule out other potential influences on faculty salaries and ensure that our estimates of the gender-based pay gap are based on true peer-to-peer comparisons, we constructed a more complete regression model with three additional controls. In addition, we undertook a
‐12.1%
‐7.1%
‐2.4%‐1.5% ‐1.1%
‐16.0%
‐14.0%
‐12.0%
‐10.0%
‐8.0%
‐6.0%
‐4.0%
‐2.0%
0.0%
No Controls(Gender Only)
Controls forAcademic Unit
Controls forAcademic Unit and
Rank
Controls forAcademic Unit andYears Since Highest
Degree
Controls forAcademic Unit,
Years Since HighestDegree, and Rank
Report of the Provostial Advisory Group on Faculty Gender Pay Equity, April 15, 2019 13
variety of robustness tests to examine the potential impact of “influential observations” and outlier salaries.
The most complete regression specification includes all of the control variables from the previous models (shown in Figures 1 and 2), i.e.:
Academic unit, or ‘Home Org Unit’ (i.e., academic unit that holds a faculty member’s majority academic appointment);
Rank; Years since highest degree.
To these models we added the following: Lag between highest degree and year of appointment in the tenure stream at U of T
(indicative of experience prior to hire); An indicator variable for administrative positions held (past or present); Indicator variables reflecting whether the faculty member has received a Canada
Research Chair (CRC) or a University Professorship. All of these variables can have an impact on salary and we thus wanted to explore how they might affect our analysis. We note that most previous faculty gender pay equity studies conducted by other universities have also included some type of additional proxy for faculty research productivity. For example, the London School of Economics study includes internal research productivity scores23 and the University of Waterloo uses a 5-year average merit score.24 The closest University of Toronto equivalent to these research productivity scores would be the research component of the progress through the ranks (PTR) score, which assesses faculty research productivity for the purposes of calculating merit-based salary increases. PTR scores are calculated separately by each academic unit and are not reported centrally in a meaningful standardized format. We are therefore not able to include a measure for research productivity in our regressions. We nonetheless note that the London School of Economics gender-based pay equity study did not find evidence of any significant gender-based difference in research productivity,25 and, as such, we do not believe this to be a significant omission from our model specification.
Figure 3 shows the results of our analysis building to the fully specified model by comparing the results of five different model specifications:
23 “The Gender and Ethnicity Earnings Gap At LSE: The LSE Equity, Diversity and Inclusion Taskforce,” September 2016 24 University of Waterloo, “Salary Anomaly Working Group Analysis and Findings,” May 26, 2016. 25 “The Gender and Ethnicity Earnings Gap At LSE: The LSE Equity, Diversity and Inclusion Taskforce,” September 2016
Report of the Provostial Advisory Group on Faculty Gender Pay Equity, April 15, 2019 14
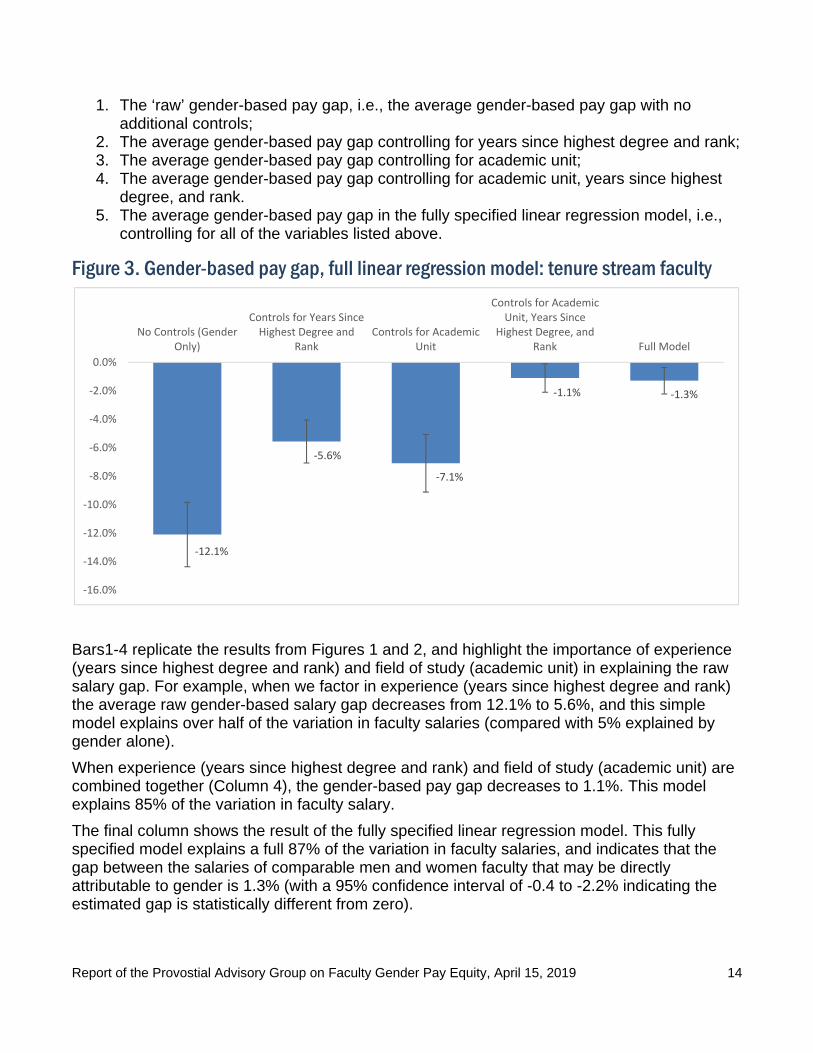
1. The ‘raw’ gender-based pay gap, i.e., the average gender-based pay gap with no additional controls;
2. The average gender-based pay gap controlling for years since highest degree and rank; 3. The average gender-based pay gap controlling for academic unit; 4. The average gender-based pay gap controlling for academic unit, years since highest
degree, and rank. 5. The average gender-based pay gap in the fully specified linear regression model, i.e.,
controlling for all of the variables listed above.
Figure 3. Gender-based pay gap, full linear regression model: tenure stream faculty
Bars1-4 replicate the results from Figures 1 and 2, and highlight the importance of experience (years since highest degree and rank) and field of study (academic unit) in explaining the raw salary gap. For example, when we factor in experience (years since highest degree and rank) the average raw gender-based salary gap decreases from 12.1% to 5.6%, and this simple model explains over half of the variation in faculty salaries (compared with 5% explained by gender alone).
When experience (years since highest degree and rank) and field of study (academic unit) are combined together (Column 4), the gender-based pay gap decreases to 1.1%. This model explains 85% of the variation in faculty salary.
The final column shows the result of the fully specified linear regression model. This fully specified model explains a full 87% of the variation in faculty salaries, and indicates that the gap between the salaries of comparable men and women faculty that may be directly attributable to gender is 1.3% (with a 95% confidence interval of -0.4 to -2.2% indicating the estimated gap is statistically different from zero).
‐12.1%
‐5.6%
‐7.1%
‐1.1% ‐1.3%
‐16.0%
‐14.0%
‐12.0%
‐10.0%
‐8.0%
‐6.0%
‐4.0%
‐2.0%
0.0%
No Controls (GenderOnly)
Controls for Years SinceHighest Degree and
RankControls for Academic
Unit
Controls for AcademicUnit, Years Since
Highest Degree, andRank Full Model

Report of the Provostial Advisory Group on Faculty Gender Pay Equity, April 15, 2019 15
Gender-based Pay Gap: Robustness Analysis
In order to ensure that our estimates are robust and are not sensitive to the influence of outliers (e.g., a small number of faculty with extremely high or low salaries), we ran a series of robustness tests as follows. Figure 4, below, shows the results of three different regression models used in these tests:
1. The fully specified linear regression model; 2. The fully specified linear regression model excluding top 5% of earners; and 3. The fully specified linear regression model excluding 5% of the most influential
observations.26 Figure 4. Gender-based pay equity gap –robustness analysis: tenure stream faculty
These additional analyses indicate that the size of the estimated gender-based pay gap in the fully specified linear regression model is not especially sensitive to outliers or influential
26The motivation for excluding the top 5% of earners is that very high salaries may dominate the overall picture, distorting the average. Similarly, excluding the 5% most influential observations is a conventional assessment of robustness to a small number of observations (not necessarily high earners) who drive the main results. The idea in such an exercise is to assess the reliability of the regression as representing the overall data, rather than being driven by a small number of observations.
‐1.3%‐1.2%
‐1.5%
‐2.5%
‐2.0%
‐1.5%
‐1.0%
‐0.5%
0.0%
All Observations Excluding Top 5% of EarnersExcluding 5% of Most Influential
Observations
Report of the Provostial Advisory Group on Faculty Gender Pay Equity, April 15, 2019 16
observations. This is evident from the fact that the estimated gap in salary is very similar across all three specifications (and they are statistically indistinguishable from one another). 27
Differences in the Gender-Based Pay Gap by Salary Level
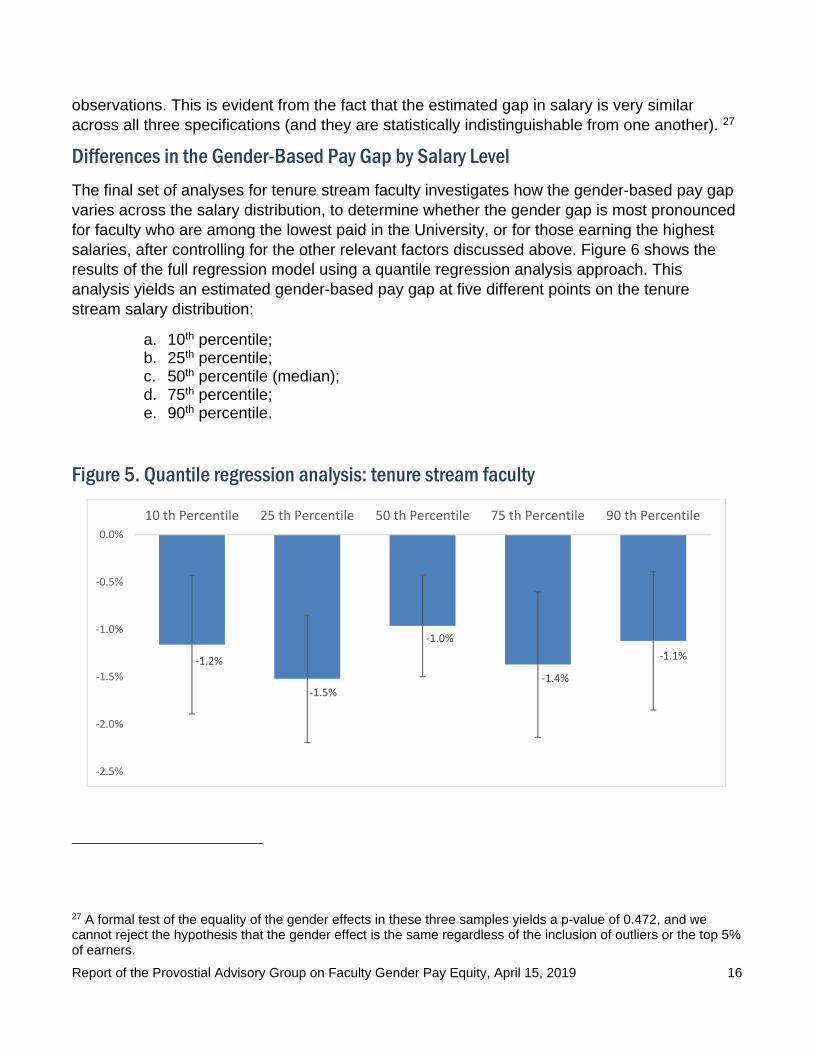
The final set of analyses for tenure stream faculty investigates how the gender-based pay gap varies across the salary distribution, to determine whether the gender gap is most pronounced for faculty who are among the lowest paid in the University, or for those earning the highest salaries, after controlling for the other relevant factors discussed above. Figure 6 shows the results of the full regression model using a quantile regression analysis approach. This analysis yields an estimated gender-based pay gap at five different points on the tenure stream salary distribution:
a. 10th percentile; b. 25th percentile; c. 50th percentile (median); d. 75th percentile; e. 90th percentile.
Figure 5. Quantile regression analysis: tenure stream faculty
27 A formal test of the equality of the gender effects in these three samples yields a p-value of 0.472, and we cannot reject the hypothesis that the gender effect is the same regardless of the inclusion of outliers or the top 5% of earners.
‐1.2%
‐1.5%
‐1.0%
‐1.4%
‐1.1%
‐2.5%
‐2.0%
‐1.5%
‐1.0%
‐0.5%
0.0%
10 th Percentile 25 th Percentile 50 th Percentile 75 th Percentile 90 th Percentile
Report of the Provostial Advisory Group on Faculty Gender Pay Equity, April 15, 2019 17
The results in Figure 5 show that in the full linear regression model (controlling for years since highest degree, rank, academic unit, and other factors that may influence salary) the gender-based pay gap is relatively stable across the salary distribution. There is no obvious pattern in the magnitude of the differences across the range, all of the differences lie between 1% and 1.5%, and all are statistically significant, as indicated by confidence intervals that do not include zero. Note, however, that a 1% salary difference is a much larger dollar value for high paid women than for lower paid women.
Report of the Provostial Advisory Group on Faculty Gender Pay Equity, April 15, 2019 18
Gender-Based Pay Gap Analysis – Continuing Stream Teaching Stream Faculty
Similar to the analysis of the tenured and tenure stream faculty, we adopt a staged approach to examining the gender-based pay gap for full-time continuing stream teaching stream faculty. First, we look at the raw differences in salary between men and women. Then we look at how other relevant factors (experience and field of study) may explain the differences in salary, allowing us to estimate a gender-based pay gap based on peer-to-peer comparisons of faculty salaries for men and women.
The role and rank of teaching stream faculty at the University of Toronto has changed over the past number of years, culminating in the Special Joint Advisory Committee (SJAC) and the amendments to the Policy and Procedures on Academic Appointments (PPAA) introduced in 2015. The SJAC agreement resulted in changes to the rank of full-time teaching stream faculty and a clear distinction between continuing and non-continuing appointment types in the teaching stream. Consequently, data for continuing stream teaching stream faculty is for the 2016-17 academic year, the first year in which accurate teaching stream data are available.
To control for any impact of these changes to the teaching stream, the gender-based pay gap models which include academic rank also include an interaction of rank and an indicator variable related to years of employment.28 The addition of the interaction term allows us to account for any differential impact of rank on salary for those teaching stream faculty who have been appointed within the past nine years and those who were appointed ten or more years ago.
Figures 6 and 7 show results from nine linear regression model specifications in which log salary is regressed on a variety of control variables to assess the sensitivity of the estimated gender effect. As mentioned before, the log-transformed salary analysis allows us to estimate the gender-based pay gap as a percentage difference in earnings between men and women.
Figure 6 is comparable to Figure 1 above and looks at the impact of gender and experience by focusing on the following:
1. The ‘raw’ gender-based pay gap, i.e., the average gender-based pay gap with no additional controls;
2. The average gender-based pay gap controlling for years since highest degree; 3. The average gender-based pay gap controlling for rank; 4. The average gender-based pay gap controlling for years since highest degree and rank.
28 This variable is defined as “0” for those faculty members who have been employed in the University for less than 10 years and “1” for those who have been employed in the University for 10 years or longer.
Report of the Provostial Advisory Group on Faculty Gender Pay Equity, April 15, 2019 19
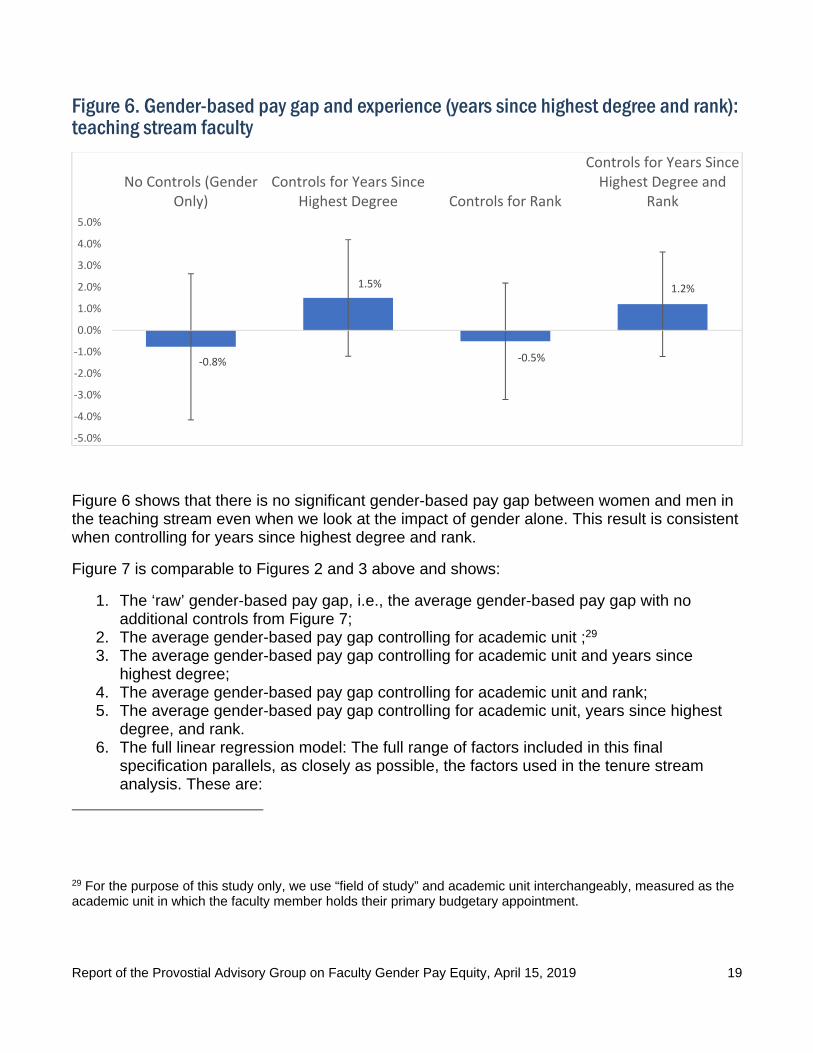
Figure 6. Gender-based pay gap and experience (years since highest degree and rank): teaching stream faculty
Figure 6 shows that there is no significant gender-based pay gap between women and men in the teaching stream even when we look at the impact of gender alone. This result is consistent when controlling for years since highest degree and rank.
Figure 7 is comparable to Figures 2 and 3 above and shows:
1. The ‘raw’ gender-based pay gap, i.e., the average gender-based pay gap with no additional controls from Figure 7;
2. The average gender-based pay gap controlling for academic unit ;29 3. The average gender-based pay gap controlling for academic unit and years since
highest degree; 4. The average gender-based pay gap controlling for academic unit and rank; 5. The average gender-based pay gap controlling for academic unit, years since highest
degree, and rank. 6. The full linear regression model: The full range of factors included in this final
specification parallels, as closely as possible, the factors used in the tenure stream analysis. These are:
29 For the purpose of this study only, we use “field of study” and academic unit interchangeably, measured as the academic unit in which the faculty member holds their primary budgetary appointment.
‐0.8%
1.5%
‐0.5%
1.2%
‐5.0%
‐4.0%
‐3.0%
‐2.0%
‐1.0%
0.0%
1.0%
2.0%
3.0%
4.0%
5.0%
No Controls (GenderOnly)
Controls for Years SinceHighest Degree Controls for Rank
Controls for Years SinceHighest Degree and
Rank
Report of the Provostial Advisory Group on Faculty Gender Pay Equity, April 15, 2019 20
Rank; Experience within the University, as measured by an indicator variable indicating 10
or more years employed at the University of Toronto; Field of study (as measured by academic unit);30 Years since highest degree;31 Lag between highest degree and year of appointment at the University of Toronto,
(indicative of prior experience); An indicator variable, reflecting whether the faculty member holds a PhD; An interaction term between the indicator variable reflecting experience within the
University and rank; An indicator variable reflecting whether the faculty member is a recipient of a
President’s Teaching Award.
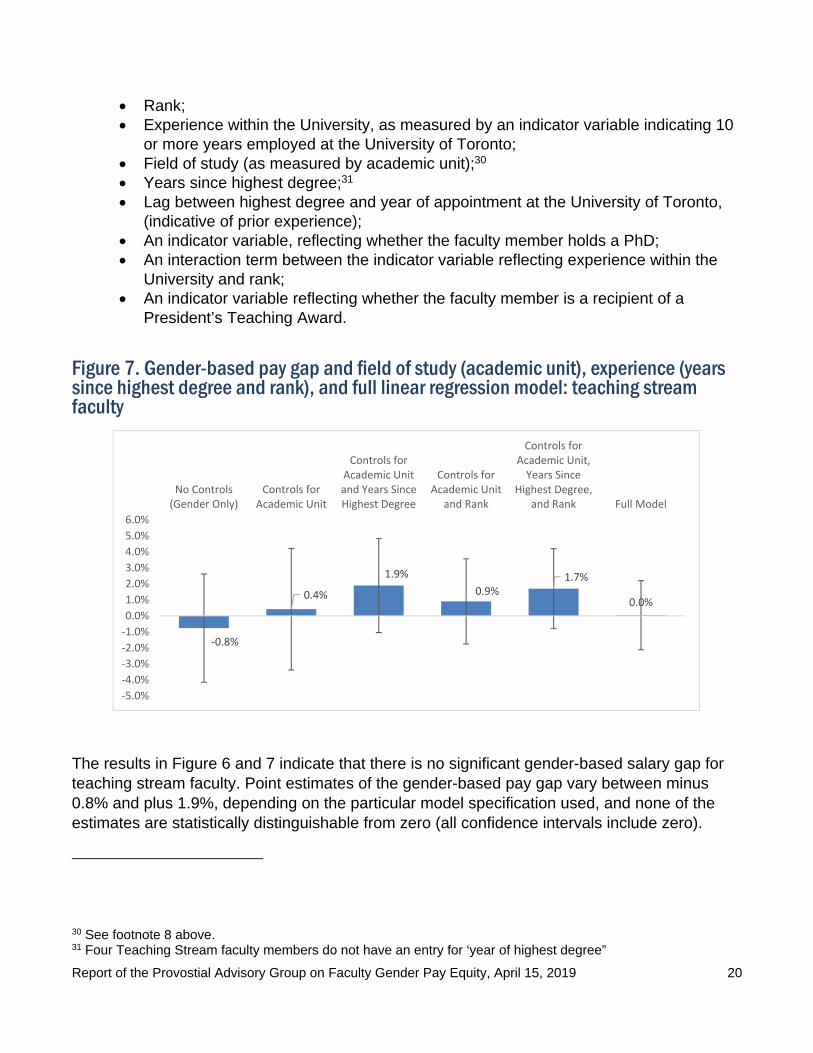
Figure 7. Gender-based pay gap and field of study (academic unit), experience (years since highest degree and rank), and full linear regression model: teaching stream faculty
The results in Figure 6 and 7 indicate that there is no significant gender-based salary gap for teaching stream faculty. Point estimates of the gender-based pay gap vary between minus 0.8% and plus 1.9%, depending on the particular model specification used, and none of the estimates are statistically distinguishable from zero (all confidence intervals include zero).
30 See footnote 8 above. 31 Four Teaching Stream faculty members do not have an entry for ‘year of highest degree”
‐0.8%
0.4%
1.9%
0.9%1.7%
0.0%
‐5.0%
‐4.0%
‐3.0%
‐2.0%
‐1.0%
0.0%
1.0%
2.0%
3.0%
4.0%
5.0%
6.0%
No Controls(Gender Only)
Controls forAcademic Unit
Controls forAcademic Unitand Years SinceHighest Degree
Controls forAcademic Unit
and Rank
Controls forAcademic Unit,Years Since
Highest Degree,and Rank Full Model
Report of the Provostial Advisory Group on Faculty Gender Pay Equity, April 15, 2019 21
Moreover, gender alone explains just 0.06% of the variation in salary while the full model explains 88% of the variation in salary.
The absence of a gender-based pay gap is robust across all model specifications. The differences in salary between teaching stream faculty can be explained by other factors, such as experience (years since highest degree and rank) and field of study (academic unit), but the impact of gender on faculty salary is statistically indistinguishable from zero in all models, and does not depend on the inclusion of control variables.
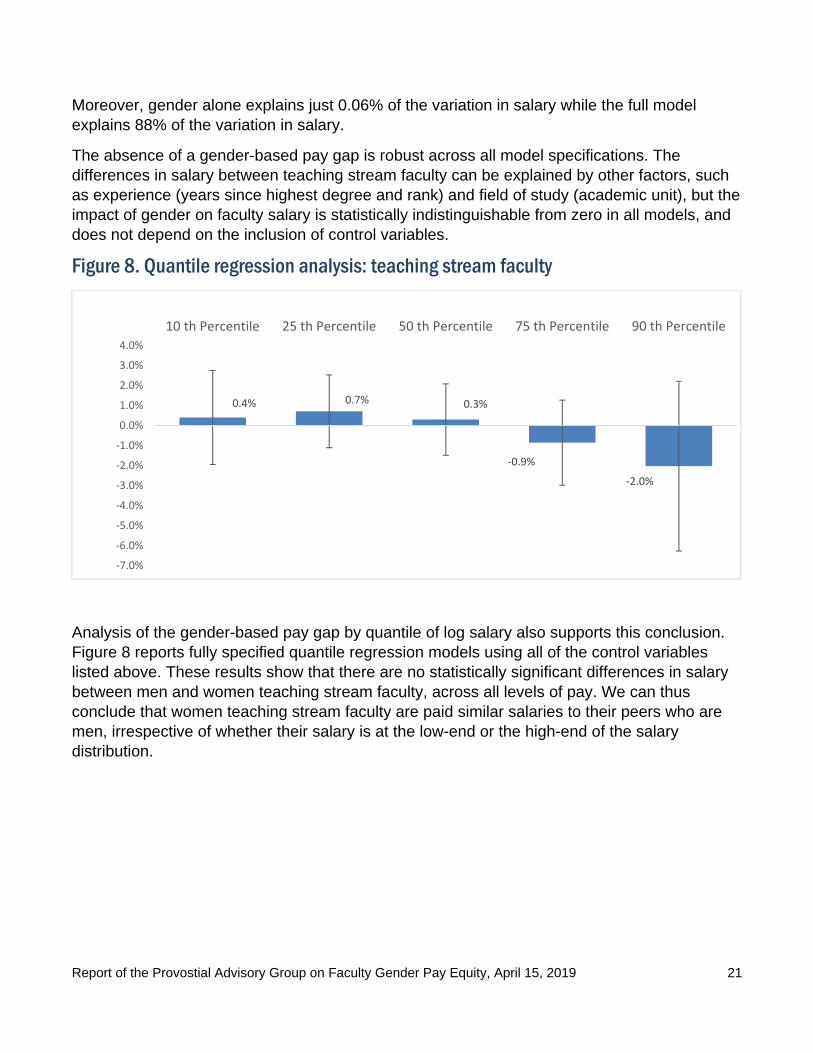
Figure 8. Quantile regression analysis: teaching stream faculty
Analysis of the gender-based pay gap by quantile of log salary also supports this conclusion. Figure 8 reports fully specified quantile regression models using all of the control variables listed above. These results show that there are no statistically significant differences in salary between men and women teaching stream faculty, across all levels of pay. We can thus conclude that women teaching stream faculty are paid similar salaries to their peers who are men, irrespective of whether their salary is at the low-end or the high-end of the salary distribution.
0.4% 0.7% 0.3%
‐0.9%
‐2.0%
‐7.0%
‐6.0%
‐5.0%
‐4.0%
‐3.0%
‐2.0%
‐1.0%
0.0%
1.0%
2.0%
3.0%
4.0%
10 th Percentile 25 th Percentile 50 th Percentile 75 th Percentile 90 th Percentile

Report of the Provostial Advisory Group on Faculty Gender Pay Equity, April 15, 2019 22
Conclusion
The analysis of the salaries of men and women faculty in the tenure stream at the University of Toronto found that, on average, tenured and tenure stream women faculty at the University of Toronto earn 1.3% less than comparably situated faculty who are men, after controlling for experience, field of study, and other relevant factors32. Our analysis indicates that the overall raw average difference in salary between men and women tenure stream faculty of 12% is largely explained by the fact that women in the tenure stream at the University of Toronto have fewer years of experience and work in lower paying fields of study.
The analysis of the salaries of men and women faculty in the teaching stream at the University of Toronto finds that there is no statistically significant difference between the salaries of men and women continuing stream teaching stream faculty. This result holds for all levels of pay, and is robust across all model specifications.
32 The complete regression model includes three additional controls: experience prior to hire; administrative positions; Canada Research Chair/University Professorship. See p. 13 of the report for details.
Report of the Provostial Advisory Group on Faculty Gender Pay Equity, April 15, 2019 23
References
1. Kessler, Anke S.; and Pendakur, Krishna, Department of Economics, Simon Fraser
University. “Gender Disparity in Faculty Salaries at Simon Fraser University.” 2015. 2. LSE Equity, Diversity and Inclusion Taskforce, London School of Economics. “The Gender
and Ethnicity Earnings Gap at LSE.” 2016. 3. McMaster University. “An Analysis of Gender Equity in MUFA Faculty Salaries.” 2015. 4. Office of the Vice-Provost, Faculty & Academic Life, University of Toronto. “Faculty Gender
Equity Report, 2015-16 and 2016-17.” http://www.faculty.utoronto.ca/wp-content/uploads/2018/10/Faculty-Gender-Equity-Report-2015-16-and-2016-17.pdf
5. Pay Equity (Data) Working Group, University of British Columbia. “An Analysis of the Gender Pay Gap in Professorial Salaries at UBC.” 2010.
6. University of California Berkeley, Office of the Vice-Provost for the Faculty. “Report on the University of California, Berkeley, Faculty Salary Equity Study.” January 2015.
7. University of Guelph, Ontario, Office of the Provost & Vice-President Academic. “Faculty Salary Anomaly Review.” 2018.
8. University of Victoria. “Summary Report of the Joint Committee on Gender Pay Equity at the University of Victoria.” 2014
9. University of Waterloo. “Salary Anomaly Working Group: Analysis and Findings.” 2016. 10. University of Western Ontario. “Gender-based Salary Anomaly Study.” 2009. 11. Warman, Casey; Woolley, Francis; and Worswick, Christopher. “The Evolution of Male-
Female Earnings Differentials in Canadian Universities, 1970-2001.” The Canadian Journal of Economics. Volume 43, No. 1, February 2010, pp. 347-372.
12. Woolston, Chris. “Scientists’ Salary Data Highlight US$18,000 Gender Pay Gap.” Nature. January 22, 2019.