report of the public service pay commission - rte.ie · 2 report of the public service pay...
TRANSCRIPT

An Coimisiún um Pána Seirbhíse Poiblí
PUBLIC SERVICEPAY COMMISSION
Report of the Public Service Pay Commission
May 2017


May 2017 Report of the Public Service Pay Commission 1
ContentsChairman’s Foreword 2Executive Summary 4Terms of Reference 7
Chapter 1: Introduction and Methodology 10Chapter 2: Financial Emergency Measures in the
Public Interest Acts 2009-2015 16Chapter 3: Economic Context 20Chapter 4: Comparisons of Public Service and
Private Sector Pensions 30Chapter 5: Comparisons of Public Service and
Private Sector Earnings 40Chapter 6: Recruitment and Retention in the Public Service 56Chapter 7: Security of Tenure 68Chapter 8: Wider Policy Issues 70Chapter 9: Conclusions 74
Appendix A: Membership of PSPC and List of Meetings 78Appendix B: List of Submissions Received 79Appendix C: Methodology 80Appendix D: Financial Emergency Measures in the
Public Interest Acts 2009-2015 86Appendix E: Milliman Review of Actuarial Submissions 89Appendix F: Comparisons of Public Service and
Private Sector Earnings 113Appendix G: Recruitment and Retention in the Public Service 138Appendix H: Acronyms 141Appendix I: Bibliography 143
Report of the Public Service Pay Commission May 20172
This �rst report of the Public Service Pay Commission is issued against the background of the stated intention of the Minister for Public Expenditure and Reform to commence negotiations with Public Service Trade Unions and Staff Representative Associations on public service pay. The objective of those negotiations will be to conclude a collective agreement to extend the current Public Service Stability Agreement on its expiry in 2018. This report is intended to inform and thereby facilitate that process.
The task undertaken by the Commission in the preparation of this report was signi�cantly different to that assigned to earlier bodies which examined the pay of public servants. Unlike those bodies, we were not asked to examine the job content of particular grades, nor were we asked to recommend what the appropriate level of pay should be for any identi�ed group or category. Rather, in accordance with our terms of reference, the purpose of this �rst report of the Commission is to address questions relating to public service pay in the context of the Financial Emergency Measures in the Public Interest Acts 2009-2015 (FEMPI legislation).
The FEMPI legislation was a response to the unprecedented economic crisis from which we are now emerging. The justi�cation of the measures introduced pursuant to that legislation is directly linked to the continuance of the economic circumstances which made them necessary. The current Public Service Stability Agreement began the process of unwinding some of these emergency measures in relation to pay. As the economic recovery proceeds, questions relating to the ongoing justi�cation for the remaining measures will undoubtedly arise. The timing and pace of any further legislative change are not matters upon which this Commission can express an opinion. They are, however, questions that could appropriately be addressed in the context of the proposed negotiations on a new public service pay agreement.
The rationale underlying the establishment of the Commission is that pay policy in the public service should be based on independently veri�ed information concerning the true value of the remuneration package available to public servants. It should also be in�uenced by reference to fair comparison with similar employments both nationally and internationally. In this report, we present factual data obtained from a variety of sources which has been robustly and objectively analysed. It shows the measurable value of public service pay and its relative position vis-à-vis comparable employment in the private sector and in public administration in other countries with which fair comparison can be drawn.
We were also asked to have regard to problems that have emerged in some segments of the public service in relation to the recruitment and retention of certain categories of personnel. Such problems as have been identi�ed in that regard will have to be addressed in the context of future pay policy and in the negotiations that will follow the publication of this report.
It is not possible to produce data on either the appropriate overall value to be ascribed to public service remuneration, or to draw appropriate comparisons, to a standard of mathematical exactitude without engaging in a detailed job content evaluation. In our view, however, the information contained in this report provides an accurate and reliable indication of where public service remuneration, at the different levels, is now comparatively positioned. We trust that this information will inform and assist the negotiators on both sides in their upcoming pay negotiations.
Chairman’s Foreword
May 2017 Report of the Public Service Pay Commission 3
The task assigned to the Commission was more complex than many of us anticipated on our appointment. Identifying fair and appropriate comparators upon which to base our conclusions was dif�cult and time consuming. The members of the Commission were required to carefully examine and evaluate the papers and other material submitted and to discuss and analyse an abundance of data. We are indebted to the many organisations and representative bodies who made carefully formulated and helpful submissions on the matters coming within our terms of reference. A full list of bodies and organisations who made submissions is appended to this report. All of these submissions have been read, discussed and taken into account by the Commission in reaching our conclusions. Copies of all submissions are being published on the Commission’s website. I would particularly like to thank the Central Statistics Of�ce for supporting the work of the Commission through their provision of statistical data and expertise upon which a substantial amount of this report has been based.
Responsibility for providing the Commission with research and other material, implementing decisions and drafting this report rested with our Secretariat. It comprised an excellent and dedicated team of Civil Servants led by the Secretary to the Commission, David Denny. David brought to this role an accumulated wealth of experience in public administration, combined with wisdom and courtesy, which was an invaluable resource upon which I and the other members of the Commission depended. I also wish to place on record our appreciation of the work performed on our behalf by the other members of the Secretariat, Susan McKiernan, James Maher, Karen Murphy, Evan Coady, Brian Cahill, Angelena Hollingsworth and Róisín McCann.
The Commission was required to work to a very tight timeframe. In order to produce and present this report on time, the members of the Secretariat were required to work long hours and over public holiday weekends. They did so willingly and without complaint. On my own behalf and that of my colleagues I wish to place on record our particular appreciation of their work in that regard.
Finally, I wish to record my appreciation of the dedicated work of my colleagues in producing this report. They each made a very substantial and generous commitment in terms of their time and in prioritising the work of the Commission over their many other commitments. For me, it was a singular pleasure to work, as Chairman, with such dedicated and knowledgeable individuals.
Kevin Duffy
Chairman, Public Service Pay Commission
Dated:

Report of the Public Service Pay Commission May 20174
Context
The Public Service Pay Commission (the Commission) was established to advise Government on public service remuneration policy. The public service employs over 300,000 public servants across a range of employments and professions across the various sectors of the Civil Service, Local Authorities, Non-Commercial State Agencies and in the health, education, justice and defence sectors. The Commission has broad terms of reference and the initial task set for us is to provide inputs on how the unwinding of the Financial Emergency Measures in the Public Interest (FEMPI) legislation 2009 to 2015 should proceed.
This legislation currently forms the overarching legal framework for public service pay policy. Decisions on all matters relating to FEMPI legislation are a matter for the Oireachtas, nevertheless it is clear that as the economic circumstances of the country improve the continued justi�cation for the emergency measures provided for in this legislation will come into question.
The Commission in its deliberations has focused on the evolution of pay trends in the public service and private sectors, public service remuneration levels and how these compare to the private sector and, where possible, internationally. We have also addressed questions in relation to the value that should be ascribed to public service pensions in measuring overall remuneration and the value of the degree of security of tenure available to public servants relative to others.
As required by our terms of reference, the Commission has had full regard to the state of the national �nances in its deliberations. We are conscious that public service pay and pensions must compete with other demands on the public purse in respect of both capital and current expenditure.
This report sets out certain observations that will provide an input to the unwinding of FEMPI and upcoming public service pay negotiations. However, the content, phasing and implementation of any future agreement must have full regard to the current and future prospects and challenges for the national economy.
Methodology
To assist in our deliberations, we invited submissions and met with interested parties. The Commission met a total of 14 times.
In addition to published data, we were also provided with assistance from the Central Statistics Of�ce. The Commission engaged Milliman Consulting Actuaries to independently review the submissions received in respect of public service pensions.
All submissions received by the Commission are available on our website.
Unwinding FEMPI
A critical factor in any future pay agreement and/or unwinding of FEMPI will be the State’s ability to pay in the context of competing pressures on the public purse.
Having reviewed the evidence presented to us in relation to pay levels and pay movements in the wider economy, we are of the view that there is a basis for parties to enter into negotiations for a further collective agreement to extend the Lansdowne Road Agreement.
As control of the Public Service Pay Bill is a central determinant of Government budgetary policy, it will be a matter for the parties to negotiate a timeframe that will provide for the orderly unwinding of the FEMPI legislation having regard to:
• Maintaining sustainable national �nances and competitiveness
• Other Government spending priorities
• The Public Service Reform agenda
• Equity considerations on public service pay.
Executive Summary
May 2017 Report of the Public Service Pay Commission 5
Pensions
The value of public service pensions was examined in detail in 2007, however, there have been signi�cant developments in occupational pensions and in the economy since then and all parties considered it important to re-examine the topic in some detail. Updated actuarial costings were submitted by a number of parties including DPER and these were all considered by our own actuarial advisers. There was broad agreement on methodology and approach by all parties. A key �nding is that on average the value provided to employees by the mainstream Single Public Service pension scheme is on a par with employers’ contributions to current private sector de�ned contribution pensions (the position of those employees without occupational pension schemes is noted as a wider societal issue which goes beyond the focus of our remit). There are now estimated to be some 50,000 public servants in this scheme, which was commenced at the beginning of 2013 and is the default scheme for all new appointees since then. In the case of the earlier (pre-2013) legacy pension schemes, these were in 2007, considered to be on average 12% more valuable than private sector pensions, with this 12% therefore effectively re�ected in pay levels at that time.
On the basis of current analysis our advice is now that:
• Standard accrual legacy public service pension schemes are now, depending on assumptions made, worth more than private sector pensions (There are currently some 243,000 public servants in these pension schemes which are now closed to new entrants).
• ‘Fast accrual’ public service pensions (where members accrue full pension faster than 40 years) are more valuable again than standard accrual legacy schemes, with the quantum of the additional value depending on the speci�c scheme.
• Pensions for members of the standard accrual Single Public Service Pension Scheme are currently on a par with private sector de�ned contribution pension schemes.
It will ultimately be a matter for the parties to the collective bargaining process to assess all of the information provided in this report and to agree on an evaluation to be ascribed to public service pensions in measuring overall remuneration. In the Commission’s opinion and having regard to all of the information provided to us, the value could reasonably be �xed with a range of between 12% and 18% for the pre-2013 standard accrual cohort of public servants. The Commission notes that there are greater costs associated with the provision of fast accrual pension schemes. The level of additional cost varies depending on the scheme involved.
The Commission believes that the values identi�ed for those on legacy standard accrual pension schemes and fast accrual schemes should be addressed by providing for an increased employee contribution for those who continue to bene�t from those schemes. The rate of increase, and the grades and categories to which it should apply is a matter for negotiation between the parties taking account of the level of bene�ts accruing. The Commission believes that it would be reasonable to apply any agreed adjustments in pension contributions in conjunction with the discontinuance of the Pension Related Deduction (PRD) which is a provision of the FEMPI Acts.
Pay
The subject matter of this initial report did not require the Commission to undertake a job evaluation exercise or a detailed ‘like for like’ comparison with the private sector. The last such exercise was carried out in 2007. It broadly found public service pay compared well with private sector pay (with 15 exceptions from the 109 grades examined).
This report focuses on how pay and earnings have changed since that time.
Report of the Public Service Pay Commission May 20176
In the period since 2007, the �nancial crash affected the public service and private sector in different ways. Broadly the private sector reduced numbers (or hours worked) but reduced average pay for those who remained in employment by less than the reduction in average pay rates for those in the public service. The public service reduced numbers more slowly but cut basic pay a number of times in addition to various productivity measures such as increasing working hours and other measures.
International comparisons were examined, however, the methodological differences in international data outside of the EU and data limitations in EU data, speci�cally the difference in what was estimated for Eurostat in 2014 and the Census 2016 results, make it dif�cult to draw de�nitive conclusions on international earnings comparisons.
Private sector pay has recovered and the evidence suggests that by 2014 average public service earnings were approaching parity with private sector earnings when account is taken of differences in educational quali�cations, experience and a number of other relevant employee and employer characteristics. Indeed, earnings of public servants at higher pay levels were in some cases signi�cantly below private sector levels.
As of 2014, pay for public service employees at lower levels appeared still to be higher than private sector pay levels for people with similar characteristics. We note the evidence that pay settlements across the private sector in recent years have provided pay increases in the range of 1.5% to 2.5% annually, depending on the sector and the employer’s ability to pay.
Tenure
Security of tenure has a value. However no satisfactory scienti�c evidence has been identi�ed that could reasonably be used for assigning to it a speci�c monetary value. This is consistent with the �ndings of the Public Service Benchmarking Body in 2007 who considered it inappropriate to apply a further discount in respect of security of tenure.
Recruitment and Retention
In general, evidence suggests that there are not signi�cant recruitment dif�culties to the various large scale public service vocational streams. However, there are problems in the case of some speci�c and specialist groups across the public service. This includes those groups that are internationally in demand, particularly in the health sector.
Previous �exibilities that existed around pay scales in specialist and scarce skills areas may need to be revisited.
Where there are signi�cant problems attracting candidates in particular work streams there may be a bene�t in looking at the various structural and organisational constraints within such streams.
There is evidence that some senior level leadership positions are increasingly �nding it dif�cult to attract a wide candidature, which suggests there may be structural issues that need examination at these levels.
More broadly we suggest that consideration should be given to commissioning a more comprehensive examination of underlying dif�culties in recruitment and retention in those sectors and employment streams where dif�culties are evident.
Items not within Terms of Reference
A number of speci�c issues were raised by stakeholders that related to issues in particular sectors or employment streams. Given that our immediate terms of reference are essentially pan-public service, it was not possible to address such issues. In some cases, these related to outstanding pay adjudications or recommendations, in others they concerned structural issues relating to working conditions in particular employment streams. The Commission believes that the parties should give consideration to providing some appropriate mechanism by which these matters can be addressed.

May 2017 Report of the Public Service Pay Commission 7
Terms of ReferenceThe Public Service Pay Commission (PSPC) is established to advise Government on Public Service remuneration1 policy.
Purpose
The Commission is to provide an initial report to Government in Quarter 2 of 2017 on public service remuneration in the context of the Financial Emergency Measures in the Public Interest Acts 2009 – 2015.
The �ndings of the Commission will contribute to and inform Government’s considerations in relation to Public Service remuneration and would assist the Department of Public Expenditure and Reform in discharging its negotiation function on behalf of Government.
The Pay Commission will consider such other remuneration matters as it may be asked to consider by the Minister for Public Expenditure and Reform from time to time, including:
1. Providing objective analysis on the appropriate pay levels for identi�able groups within the public sector;
2. Comparing appropriate rates for identi�able groups with prevailing private sector/market rates. This should have regard to evidence on recruitment and retention trends in respect of each group;
3. Comparing appropriate rates for identi�able groups within the public service with their equivalents in other jurisdictions, particularly where internationally traded skillsets are required, having due regard to differences in living costs;
4. Providing objective analysis on the appropriate pay levels for of�ceholders’ pay and pensions.
1 Remuneration is de�ned as basic salary, allowances and all other bene�ts in cash or in kind, together with general terms in regard to superannuation, paid leave etc.
When reaching its �ndings the Commission shall have regard to:
a. The superannuation and other bene�ts applying in the public service;
b. Security of tenure, where it applies to public servants;
c. Pay comparisons taking account of relevant characteristics;
d. The public service reform agenda;
e. Evidence on recruitment and retention within the public service;
f. Any other relevant matters including impact on national competitiveness and sustainable national �nances and equity considerations;
g. Any other issues as they are determined by Government.
Initial Work Programme
For its initial report the Commission will be asked to provide inputs on how the unwinding of the Financial Emergency Measures in the Public Interest legislation should proceed having regard to:
• The evolution of pay trends in the public and private sectors based on published data;
• A comparison of pay rates for identi�able groups within the public service with prevailing non-public sector market rates;
• International rates and comparisons where possible;
• The state of the national �nances.
Following this initial report the Government will give consideration to what other matters the Commission may be asked to consider in due course.

Report of the Public Service Pay Commission May 20178
Procedures
In progressing its work, the PSPC should utilise and analyse existing datasets and reports, as prepared and published by existing state and other agencies as appropriate. The PSPC may also undertake or commission additional research or data gathering where further information is required to comprehensively progress its terms of reference. The PSPC may invite relevant stakeholders to make submissions to the Commission to further assist its considerations.
The PSPC must publish its �ndings and the evidence on which these are based.
The PSPC will not take the place of direct negotiations between Government and employee representatives.

May 2017 Report of the Public Service Pay Commission 9
Chapter 1:
Introduction and Methodology
Report of the Public Service Pay Commission May 201710
Establishment and Operation of the Commission
1.1 On 17 October 2016 the Minister for Public Expenditure and Reform, Paschal Donohoe, T.D., announced the establishment of a Public Service Pay Commission on a non–statutory basis. The role of this Commission is to be advisory in nature. The first task set for the Commission was to furnish an initial report in the second quarter of 2017 for the purpose of providing input on how the unwinding of the Financial Emergency Measures in the Public Interest legislation (FEMPI) should proceed.
1.2 As the Minister indicated, the Government will retain the ability to negotiate directly with its employees in respect of pay. We understand that the Government will enter negotiations on an extension to the Public Service Stability Agreement. The Commission’s work is not intended to duplicate the dispute resolution and adjudicative functions of the industrial relations institutions of the State or to offset the process of collective bargaining as the primary mode of pay determination in the public service. Rather, our role is to provide evidence-based objective analysis on pay matters to assist the parties on negotiating an extension to the current Public Service Stability Agreement.
1.3 The following members were appointed to the Commission:
• Chairman - Kevin Duffy
• Marian Corcoran
• Ultan Courtney
• Ruth Curran
• Noel Dowling
• Seán Lyons
• Peter McLoone
1.4 This initial report of the Commission is focused on how the unwinding of the Financial Emergency Measures in the Public Interest 2009-2015 Acts (FEMPI Acts) should proceed, having regard to:
• The evolution of pay trends in the public and private sectors based on published data;
• A comparison of pay rates for identi�able groups within the public service with prevailing non-public sector market rates;
• International rates and comparisons where possible;
• The state of the national �nances.
1.5 The terms of reference also note that the Commission may be asked by the Minister for Public Expenditure and Reform, from time to time, to consider other remuneration matters including:
• Providing objective analysis on the appropriate pay levels for identi�able groups within the public sector;
• Comparing appropriate rates for identi�able groups with prevailing private sector/market rates. This should have regard to evidence on recruitment and retention trends in respect of each group;
• Comparing appropriate rates for identi�able groups within the public service with their equivalents in other jurisdictions, particularly where internationally traded skillsets are required, having due regard to differences in living costs;
• Providing objective analysis on the appropriate pay levels for of�ceholders’ pay and pensions.
Chapter 1:Introduction and Methodology

May 2017 Report of the Public Service Pay Commission 11
1.6 The Commission sought written submissions from interested parties. Submissions were received from in excess of 30 respondents. In addition, meetings were held with a number of bodies and organisations so as to explore further points raised in their submissions. We carried out comparative analysis of pay in the public service and the private sector, and between the public sector in Ireland and other countries. As part of our work we sought supplementary information on recruitment and retention in the public service. We also engaged actuarial advisers to evaluate submissions received, on the relative value of public service pensions, to assist us in our deliberations. We were supported in our work by a small secretariat seconded from the Civil Service. All submissions received by the Commission are published on the Commission’s website http://paycommission.gov.ie/. The remainder of this chapter sets out the methodological approaches adopted by the Commission for its analysis of pay, pensions, recruitment and retention, and security of tenure in the public service and the private sector.
Structure of Report
1.7 The overarching legal context for public service pay is, currently, the FEMPI legislation 2009 to 2015 and this is set out in Chapter 2 of this report. Chapter 3 covers the economic context for the report. Chapter 4 covers the matter of the relative value of public service pensions vis-à-vis private sector pensions. An outline of earnings movements in the public service and private sector, and a summary of a number of econometric analyses of the public-private earnings differential is covered in Chapter 5, along with information on international pay comparisons. Our terms of reference require us to look at recruitment and retention issues in the public service and this is addressed in Chapter 6. Security of tenure is discussed in Chapter 7 and a number of wider policy issues raised are set out in Chapter 8. The conclusions of our deliberations are covered in Chapter 9. Detailed analyses and supporting documentation are set out in the various appendices to this report.
Public Pay Policy Architecture
1.8 The architecture of public pay policy between the late 1980s and mid 2000s was characterised by Social Partnership agreements which provided for pay adjustments that were of general application across the economy and, in some instances, for an element of local bargaining. In addition to the base adjustments in pay provided under these agreements, a practice developed of processing special or grade pay claims. Due to the long established interlocking relativities in the public service, settlement of many ‘special claims’ effectively led to a series of consequential pay increases. This process made it virtually impossible to deal with the pay of any one group in the public service in isolation from the others. In an effort to limit these claims the Public Service Benchmarking Body (‘the Benchmarking Body’) was established as a provision in the Programme for Prosperity and Fairness (2000-2003). The �rst Benchmarking Body report was published in 2002 and a second Benchmarking Body report issued in 2007. The Benchmarking Body sought to introduce a new method of pay determination in the public service based on a comparison between the pay of jobs of certain agreed public service reference grades and that of jobs of similar size and complexity in the private sector. The Benchmarking Body also aimed to ensure equity between public service and private sector workers by examining all the main public service groups at the same time. The Benchmarking Body dealt with the pay of public servants up to the level of Principal Of�cer in the Civil Service, and equivalent grades elsewhere in the public service. Throughout this period the pay of more senior grades (including of�ceholders, the Judiciary, etc.) continued to be a matter for the Review Body on Higher Remuneration.
1.9 The process of national centralised bargaining through social partnership effectively ended with the onset of the economic recession. Collective bargaining arrangements were retained in the public service with the conclusion of Public Service Agreements between the Government and the public service trade unions and employee associations. The �rst two agreements (Public Service Agreement, 2010-2014 (Croke Park Agreement - CPA) and Public Service Stability Agreement, 2013-2016 (Haddington Road Agreement - HRA) aimed to contribute to the restoration of the Government �nances by reducing the General Government De�cit through a reduction in the public service pay and pensions bill and increases in productivity while committing to not applying compulsory redundancy. The approach taken, while not without critics, is credited with being one of the factors which helped the public
Report of the Public Service Pay Commission May 201712
�nances emerge from the EU-IMF programme of �nancial support (also known as the Troika Programme) without industrial unrest in the public service. The most recent Agreement (Lansdowne Road Agreement - LRA) extended the Public Service Stability Agreement and provided a mechanism to deliver partial re-adjustment of pay over the 2015 to 2018 period, at a total cost to the State of €844 million in 2018.
Methodology
1.10 The Commission has been tasked with undertaking an analysis of remuneration in the public service and how it has evolved compared to the private sector. Detailed ‘like for like’ analyses of jobs and pay rates across the economy were carried out in 2002 and 2007 by the Benchmarking Body. These reports examined the work, remuneration, bene�ts, and conditions of employees in the public service and the private sector. It is important to state that we have not been asked to undertake a similar exercise.
1.11 The Commission has used all available data to understand how public service and private sector earnings have progressed since the last full cross-sectoral comparison exercise was carried out. In undertaking that exercise we obtained the assistance of the Central Statistics Of�ce (CSO), which has statutory obligations to report on both short-term and structural earnings and labour costs statistics in Ireland. Using CSO’s earnings statistics has allowed for various analyses to be undertaken to understand the dynamics of public service and private sector earnings since the last job evaluation exercise, and make comparisons between the two sectors. Speci�cally, we requested that the CSO provide a number of alternative aggregations of published data. These aggregations adhered to the CSO’s data protection and data con�dentiality criteria. Further details of the data provided by the CSO are set out in Appendix C. The following data aggregations were sought from the CSO:
• Earnings, Hours and Employment Costs Survey (EHECS): The Commission requested that EHECS data be provided in annual averages, aggregated by public service and private sector, classifying Commercial State Agencies as private sector and including payment in kind in the earnings �gures.
• National Employment Survey (NES): The Commission requested that NES data be provided with public service earnings net of the Pension Related Deduction (PRD), aggregated by public service and private sector, and aggregated by decile.
• Earnings Analysis using Administrative Data Sources (EAADS): The Commission requested that EAADS data be provided with public service earnings net of PRD, aggregated by public service and private sector, and aggregated by decile.
• Job Churn: The Commission sought that Job Churn data be provided for the public service NACE sectors and aggregated by public sector and private sector.
• Public-Private Pay Differential Econometric Models: The Commission asked for additional public-private pay differential econometric model speci�cations which removes size and union membership from the model for the years 2011 to 2014.
1.12 With access to published CSO and Eurostat statistics (e.g. Structure of Earnings Survey), additional aggregates from the CSO, public-private econometric analyses output, and Chartered Institute for Personnel and Development Ireland (CIPD)/Industrial Relations News (IRN) survey results, the Commission aimed to examine public service1 and private sector earnings since the last job evaluation exercise was undertaken, by carrying out:
• Trend analysis: to provide an indication of how average earnings evolved over the period.
• Sectoral analysis: to illustrate the diversity in the economy and the structural differences between the economic sectors.
• Distributional analysis: to highlight the structural differences between the public service and private sector and to illustrate changes in earnings over time along the earnings distribution.
• International analysis: to illustrate how the Irish public sector compares to its EU counterparts in terms of average earnings.
1 In the Commission’s report the public service refers to those employees in the Civil Service, Local Authorities, education sector, Garda Síochána, health sector, Defence Forces and Non-Commercial State Agencies. Commercial State Agencies are considered to be private sector, as remuneration in these organisations is not determined by Government and is not subject to Financial Emergency Measures in the Public Interest (FEMPI) legislation. The private sector refers to employees of private enterprises and Commercial State Agencies in NACE sectors B to S.

May 2017 Report of the Public Service Pay Commission 13
• Econometric analysis: to compare public service and private sector earnings while accounting for employee characteristics (e.g. gender, age, occupation, etc.) and employer characteristics (size, sector).
• Pay settlements analysis: to provide an indication of pay settlements that have been agreed in the private sector.
1.13 In order to assess the submissions we received on the value of public service pensions, the Commission engaged actuarial consultants, Milliman, following a competitive procurement process. The actuarial consultants independently reviewed these submissions. They have prepared a written report setting out the relevant �ndings, which is available in Appendix E. The actuarial consultants reviewed the methodology, assumptions, key judgements and conclusions set out in the actuarial submissions received by the Commission. The review of these factors was carried out at a high level and did not encompass detailed validation of actuarial calculations in individual submissions. The Commission has assumed that all of the technical papers compiled by actuarial consultants and those submitted to the Commission by interested parties have been completed to professional standards.
1.14 In reaching our �ndings we are required to examine recruitment and retention issues in the public service. In response to submissions made by interested parties, we sought and obtained supplementary supporting information and data from these parties. Of�cial statistics on employment in the public service, in whole time equivalents (WTE), were sourced from DPER for the period from 2008 to 2016. DPER also provided data on recruitment since the end of the moratorium on recruitment in the public service. The Public Appointments Service (PAS) furnished us with information on competitions which they have run for public service positions in recent years. Since information on employee retention in the public service is not held centrally, the CSO provided their Job Churn statistics, which set out the number of hires, separations, and job stayers in �rms from 2011 to 2014 (i.e. those taking new jobs, leaving or staying and the �rms in which these jobs are located in the Irish labour market). This data is aggregated by age, sector and public sector/private sector. Job Churn statistics are examined for the three main public service sectors: public administration and defence, education, and human health and social work.
1.15 Our terms of reference provide that in reaching our �ndings, we should have regard to security of tenure, where it applies to public servants. The approach we have taken is to consider the different factors which would have to be taken into account and the extent to which security of tenure can be ascribed to public service employment.

Report of the Public Service Pay Commission May 201714

May 2017 Report of the Public Service Pay Commission 15
Chapter 2:
Financial Emergency Measures in the Public Interest Acts 2009-2015

Report of the Public Service Pay Commission May 201716
2.1 This chapter sets out the background to the introduction of the Financial Emergency Measures in Public Interests Acts 2009-2015. It also outlines the pay and pension measures contained in these Acts.
2.2 After the global �nancial crisis began in 2008 and Ireland entered into recession, the then Government introduced a series of public spending cutbacks and reforms to stabilise the public �nances. The public service pay and pensions bill accounted for 35% of current expenditure and needed to be reduced to contribute to the consolidation measures. To achieve this reduction in the pay and pensions bill, emergency legislation was introduced. The FEMPI legislation was predicated on the �scal emergency and was enacted to provide signi�cant and immediate reductions in overall Government expenditure. The pay and pensions savings associated with the FEMPI legislation are estimated at some €2.2 billion. In addition to the FEMPI legislation the Government also introduced a number of other pay saving and productivity measures which are set out in the Appendix D.
2.3 As the recitals to the �rst FEMPI Act makes clear the rationale and justi�cation for these measures relies on the acute �nancial dif�culties facing the economy at that time.
2.4 While the question of when these emergency measures will no longer be required is not a direct matter for the Commission, the initial work programme which the Commission has been asked by Government to undertake is speci�cally to provide inputs on the unwinding of the FEMPI legislation having regard to:
• The evolution of pay trends in the public and private sectors based on published data;
• A comparison of pay rates for identi�able groups within the public service with prevailing non-public sector market rates;
• International rates and comparisons where possible;
• The state of the national �nances.
The FEMPI Acts 2009-2015
2.5 The FEMPI legislation comprises of a number of discrete enactments, as follows:
• Financial Emergency Measures in the Public Interest Act 2009
• Financial Emergency Measures in the Public Interest (No. 2) Act 2009
• Financial Emergency Measures in the Public Interest Act 2010
• Financial Emergency Measures in the Public Interest (Amendment) Act, 2011
• Financial Emergency Measures in the Public Interest Act 2013.
The �rst steps in the unwinding of FEMPI measures were provided for by the FEMPI Act 2015.
The FEMPI Act 2009 introduced a number of measures, the main one being the introduction of a new deduction from the remuneration of pensionable public servants, the Pension Related Deduction (PRD), sometimes referred to as the ‘Pension Levy’. The effects on individuals’ pay varied but was, on average about 7% of salaries, yielding some €900 million annually. In addition, the 2009 Act contained measures allowing public service bodies to reduce
Chapter 2: Financial Emergency Measures in the Public Interest Acts 2009-2015

May 2017 Report of the Public Service Pay Commission 17
the professional fees paid by them to external service providers, implementing changes in the early child care supplement and facilitating the payment of grants under the Farm Waste Management Scheme on a phased basis. With respect to the professional fees reduction measure, section 9(13) of the Act provides that the Minister for Health may review the operation, effectiveness and impact of the amounts and rates of payments to health professionals �xed by regulation under the Act and consider the appropriateness of same.
The FEMPI 2009 (No. 2) Act applied percentage reductions to the gross pay levels of the majority of public servants in 2010 to facilitate a reduction in the gross pay bill cost of public servants (Exchequer funded and Local Authorities) by some €1 billion in 2010. The reductions ranged between 5 per cent and 20 per cent and were effective from 1 January 2010. The Act was amended by the FEMPI (Amendment) Act 2011. The main purpose of this Act was to apply the terms of the FEMPI Acts 2009 to serving members of the judiciary. The 2011 Act also made provision for the reduction of salary rates for newly appointed members of the judiciary and to further reduce the salaries of certain of�ceholders.
The FEMPI 2010 Act introduced the Public Service Pension Reduction which was a reduction that was applied to public service pensions in payment above speci�ed exemption thresholds. It also provided for a reduction in pay rates of members of the Government and a reduction to the National Minimum Wage.
The FEMPI 2013 Act implemented a further pay reduction for public servants earning annual salaries of more than €65,000 and effected a reduction in public service pensions over €32,500.
The FEMPI 2015 Act commenced the gradual unwinding of certain pay and pensions measures contained in the 2009 to 2013 FEMPI Acts.
The LRA extends the Public Service Stability Agreement to 2018 and is implemented through the Financial Emergency Measures in the Public Interest Act, 2015. The Agreement:
• extends the terms including the productivity and reform measures of the HRA out to July 2018
• introduces measures to restore a portion of the reduction in take-home pay of public servants on a phased basis to 2019 (Details are set out in Appendix D).
Figure 2.1 sets out the impacts of the FEMPI legislation on a selection of pay levels, further details of the impacts of the FEMPI legislation on various pay levels are set out in Appendix D (Table D.1). That table shows that staff on pay levels up to €28,000 have already received back the bulk of the FEMPI pay cuts. This was in accordance with the terms of the CPA and the HRA which committed to giving priority to staff earning up to €35,000.
Figure 2.1: Impact of FEMPI Legislation 2009-2015
€1,6
36
€3,1
09
€8,3
65 €14,
702
€23,
905 €2
9,83
9
€2,0
00
€1,9
00
€1,9
00
€4,6
46
€6,8
37
€8,3
94
€23,000 €32,000 €61,000 €70,000 €100,000 €120,000
Renumeration levels in 2015
FEMPI Reductions 2009 to 2013 LRA Bene�ts (FEMPI 2015)
Report of the Public Service Pay Commission May 201718
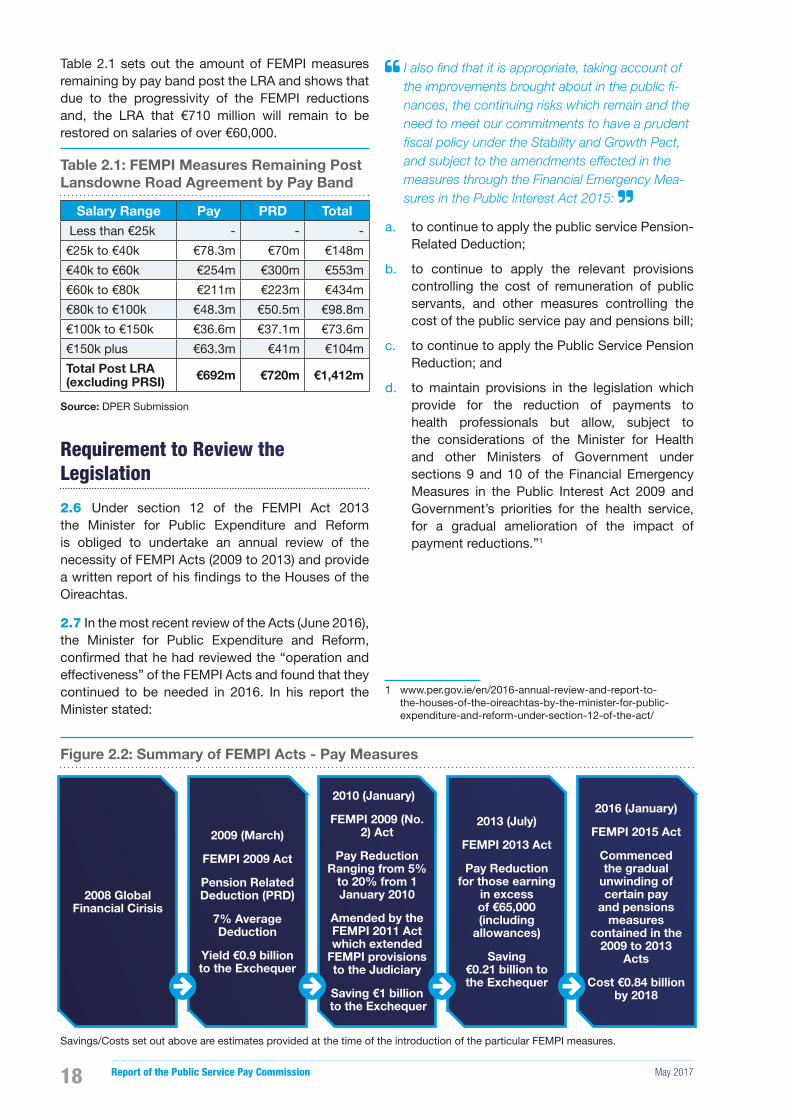
Table 2.1 sets out the amount of FEMPI measures remaining by pay band post the LRA and shows that due to the progressivity of the FEMPI reductions and, the LRA that €710 million will remain to be restored on salaries of over €60,000.
Table 2.1: FEMPI Measures Remaining Post Lansdowne Road Agreement by Pay Band
Salary Range Pay PRD Total Less than €25k - - -
€25k to €40k €78.3m €70m €148m
€40k to €60k €254m €300m €553m
€60k to €80k €211m €223m €434m
€80k to €100k €48.3m €50.5m €98.8m
€100k to €150k €36.6m €37.1m €73.6m
€150k plus €63.3m €41m €104m
Total Post LRA (excluding PRSI) €692m €720m €1,412m
Source: DPER Submission
Requirement to Review the Legislation
2.6 Under section 12 of the FEMPI Act 2013 the Minister for Public Expenditure and Reform is obliged to undertake an annual review of the necessity of FEMPI Acts (2009 to 2013) and provide a written report of his �ndings to the Houses of the Oireachtas.
2.7 In the most recent review of the Acts (June 2016), the Minister for Public Expenditure and Reform, con�rmed that he had reviewed the “operation and effectiveness” of the FEMPI Acts and found that they continued to be needed in 2016. In his report the Minister stated:
I also find that it is appropriate, taking account of the improvements brought about in the public fi-nances, the continuing risks which remain and the need to meet our commitments to have a prudent fiscal policy under the Stability and Growth Pact, and subject to the amendments effected in the measures through the Financial Emergency Mea-sures in the Public Interest Act 2015:
a. to continue to apply the public service Pension-Related Deduction;
b. to continue to apply the relevant provisions controlling the cost of remuneration of public servants, and other measures controlling the cost of the public service pay and pensions bill;
c. to continue to apply the Public Service Pension Reduction; and
d. to maintain provisions in the legislation which provide for the reduction of payments to health professionals but allow, subject to the considerations of the Minister for Health and other Ministers of Government under sections 9 and 10 of the Financial Emergency Measures in the Public Interest Act 2009 and Government’s priorities for the health service, for a gradual amelioration of the impact of payment reductions.”1
1 www.per.gov.ie/en/2016-annual-review-and-report-to-the-houses-of-the-oireachtas-by-the-minister-for-public-expenditure-and-reform-under-section-12-of-the-act/
Figure 2.2: Summary of FEMPI Acts - Pay Measures
2008 Global Financial Cirisis
2010 (January)
FEMPI 2009 (No. 2) Act
Pay Reduction Ranging from 5%
to 20% from 1 January 2010
Amended by the FEMPI 2011 Act which extended
FEMPI provisions to the Judiciary
Saving €1 billion to the Exchequer
2009 (March)
FEMPI 2009 Act
Pension Related Deduction (PRD)
7% Average Deduction
Yield €0.9 billion to the Exchequer
2013 (July)
FEMPI 2013 Act
Pay Reduction for those earning
in excess of €65,000 (including
allowances)
Saving €0.21 billion to the Exchequer
2016 (January)
FEMPI 2015 Act
Commenced the gradual
unwinding of certain pay
and pensions measures
contained in the 2009 to 2013
Acts
Cost €0.84 billion by 2018
Savings/Costs set out above are estimates provided at the time of the introduction of the particular FEMPI measures.

May 2017 Report of the Public Service Pay Commission 19
Chapter 3:
Economic Context
Report of the Public Service Pay Commission May 201720
3.1 This chapter outlines the main indicators of the fiscal and economic environment to provide the national finance context for the forthcoming negotiations on the extension of the Public Service Stability Agreement. The recession had very severe impacts on the level of consumption and the labour market. These developments, added to the global financial crisis, led to a severe downturn in the national finances through a very substantial increase in the budget deficit and in the national debt. The measures taken to stabilise the national finances included a reduction in public service numbers and pay.
3.2 Since 2012 the �scal and economic indicators have improved, unemployment is continuing to decrease, GDP growth has improved and the �scal position of the State, while still burdened by signi�cant levels of debt, has entered into the preventative arm of the Stability and Growth Pact and is projected to have a budget surplus from 2019. Public service numbers and pay bill have also been gradually increasing since 2014. The national �nances continue on a positive trajectory indicating that there will be less constraining circumstances in the period after 2018; however risks, not limited to but including the impact of Brexit, and competing expenditure pressures from a number of areas within the economy are arising simultaneously. The amount of public expenditure to be allocated to public service is a matter for Government, who also need to take account of the other competing pressures on the public purse.
3.3 The terms of reference of the Commission require inputs on the state of the national �nances. In all well managed economies the �scal position and performance of the economy are important factors in the consideration of public expenditure planning. Public service pay is one of the key components of
public expenditure. This chapter aims to present the economic and �scal developments in Ireland over the 2007 to 2016 period and outline the projected outlook of key �scal and economic indicators to assess the level of constraint on the national �nances. Due to the voted nature of certain aspects of the national �nances it is not possible to assess the precise scope for expenditure on public service pay in any given year. This chapter summarises the submissions from interested parties regarding the state of the national �nances and competitiveness, the second part of the chapter analyses the main indicators for the �scal environment, the third part considers the economic environment, the fourth part presents the identi�able risks associated with both the �scal and economic environment and �nally the conclusions are offered.
Issues raised with Commission by parties
3.4 We received a number of submissions that commented on the current economic and national �nance situation. The following section brie�y notes some of the points made in these submissions. All submissions are available on the Commission’s website (http://paycommission.gov.ie).
3.5 The DPER submission to the Commission emphasised that a recovering economy is not a recovered economy. Their assessment is that the �scal position of the State remains exposed. DPER stressed that budgetary forecasts indicate that gross debt is still considered excessive under the EU �scal rules which reduces the State’s ability to absorb any economic or �scal shocks that may occur. They also pointed to the fact that the current level of expenditure is not fully supported by the tax base. The evidence DPER used to support this suggestion was the General Government Balance, which in 2017 is projected to be over €1 billion in de�cit. Finally, the DPER submission underlined committed exchequer funding on:
• Capital Investment funding which will grow from €4.2 billion in 2016 to €7.2 billion in 2021
• Demographic expenditures which will grow by €450 million over the 2017 to 2018 period and have the potential to grow by a further €450 million by 2021
Chapter 3:Economic Context
May 2017 Report of the Public Service Pay Commission 21
• Carry over budget measures in 2018 from Budget 2017 of €450 million to cover the full year costs of measures such as the social welfare payment increases
• Public service pay allocations for 2017 and 2018, under the Lansdowne Road Agreement, are estimated to cost €557 million. A further €20 million has been allocated for implementation of the Agreement with the INTO and TUI on new entrant teacher pay. Budget 2017 also provided €430 million for additional recruitment of staff in 2017.
3.6 The Public Services Committee of the Irish Congress of Trade Union’s (‘the Public Services Committee’) submission recognised that the Commission must consider the ability of the State to pay its employees. However they emphasised that there is no single objective �gure or set of �gures that can be said to mark the point of sustainability in the national �nances. This submission also noted that the ability of the State to pay its employees is dependent upon its ability and willingness to raise revenue and in the context of a growing economy additional revenue will be generated. The Public Services Committee emphasised that “it is neither fair nor tenable to suggest that the cost of additional public employees (or other investment in public services) should be borne by public servants, through the suppression of their wages, rather than through taxation which is paid by public servants and all other citizens and users of public services.”
3.7 Regarding competitiveness, the Public Services Committee’s submission argued that a competitive economy depends on an effective public service. They highlighted the fact that the 12 pillars that make up the World Economic Forum’s Global
Competitiveness Rankings do not focus on labour costs but rather on outcomes of public policy such as the macroeconomic environment or infrastructure. The submission also stated that the public service must be in a position to recruit and to retain its share of high quality employees. They noted that if improvements in competitiveness are viewed in the narrow sense of labour costs and if labour costs in the public service are seen as an overhead to be driven down, this will make Ireland less competitive by reducing the public service’s ability to recruit and retain high quality people.
Fiscal Environment
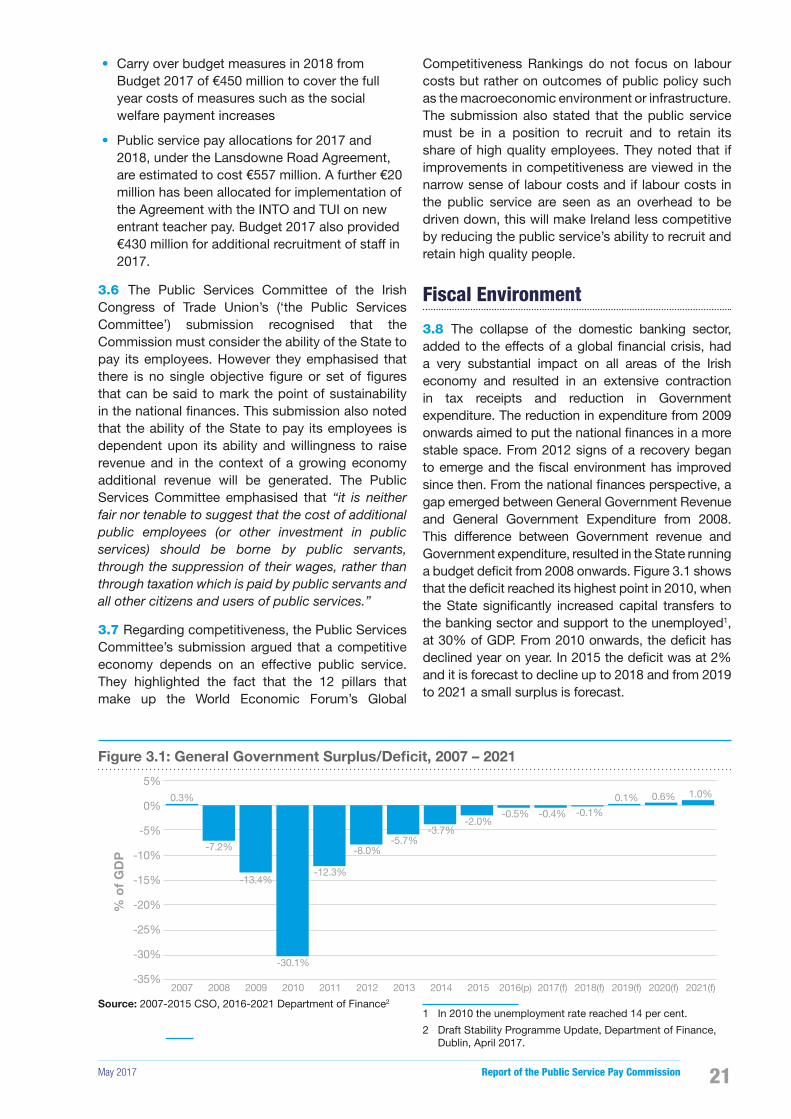
3.8 The collapse of the domestic banking sector, added to the effects of a global �nancial crisis, had a very substantial impact on all areas of the Irish economy and resulted in an extensive contraction in tax receipts and reduction in Government expenditure. The reduction in expenditure from 2009 onwards aimed to put the national �nances in a more stable space. From 2012 signs of a recovery began to emerge and the �scal environment has improved since then. From the national �nances perspective, a gap emerged between General Government Revenue and General Government Expenditure from 2008. This difference between Government revenue and Government expenditure, resulted in the State running a budget de�cit from 2008 onwards. Figure 3.1 shows that the de�cit reached its highest point in 2010, when the State signi�cantly increased capital transfers to the banking sector and support to the unemployed1, at 30% of GDP. From 2010 onwards, the de�cit has declined year on year. In 2015 the de�cit was at 2% and it is forecast to decline up to 2018 and from 2019 to 2021 a small surplus is forecast.
1 In 2010 the unemployment rate reached 14 per cent.
2 Draft Stability Programme Update, Department of Finance, Dublin, April 2017.
Figure 3.1: General Government Surplus/Deficit, 2007 – 2021
5%
0%
-5%
-10%
-15%
-20%
-25%
-30%
-35%
% o
f G
DP
2007 2008 2009 2010 2011 2012 2013 2014 2015 2016(p) 2017(f) 2018(f) 2019(f) 2020(f) 2021(f)
0.3%
-7.2%
-13.4%
-30.1%
-12.3%
-8.0%-5.7%
-3.7%-2.0%
-0.5% -0.4% -0.1%0.1% 0.6% 1.0%
Source: 2007-2015 CSO, 2016-2021 Department of Finance2

Report of the Public Service Pay Commission May 201722
3.9 Table 3.1 presents the General Government Balance in 2015 and the forecasted General Government Balance from 2016 to 2021. Total revenue, which is primarily sourced from taxes such as income tax, VAT and corporation tax, is expected to have exceeded 2007 levels for the �rst time in 2016 at €73.1 billion and is forecast to continue increasing over the medium term. Total expenditure on items such as compensation of employees, social payments and interest expenditure is forecast to decline slightly in 2016 and then increase in each year up to 2021. The General Government Balance is forecast to be negative up to 2018, after which it is forecast to turn positive. As a percentage of GDP the General Government Balance is estimated to be 1% in 2021. Exchequer returns for Q1 2017 indicate that the exchequer de�cit is continuing to decline primarily due to increased tax receipts, which is partially offset by increased expenditure. Tax revenues continue to increase year on year and total revenue stood at €14.4 billion at the end of Q1 2017, which was a year on year increase of 3.2%. However total revenues were below the pro�le for Q1 by 2.4% (€355 million). Expenditures in Q1 2017 increased by 4.1% year on year to €16.1 billion but were 3.2% (€533 million) below pro�le. Gross expenditure on public services are down 0.9% (€130 million) on the pro�le but are up some 5.5% (€709 million) year on year.
3.10 Ireland’s Government expenditure strategy operates within national and EU �scal frameworks to safeguard the management of the national �nances. A key element of this framework is the Stability and Growth Pact (SGP), the objective of which is to ensure that Governments can plan �scal policy based on stable and sustainable levels of expenditure and revenues rather than leave �scal and expenditure policy exposed to the boom-bust cycle. Between 2009 and 2016 Ireland’s �scal framework had been
operating in the Excessive De�cit Procedure (EDP) of the SGP. In 2016, Ireland successfully exited the EDP and moved into the ‘Preventive Arm’ of the SGP. Ireland is now in the same �scal framework as 21 other EU Member States, where Government de�cits remain lower than 3% of GDP. Ireland is also required to comply with the SGP debt reduction benchmark, which requires Member States to reduce their debt, by 5% on average per year, until such a time as the debt is below 60% of GDP. However Ireland is not fully subject to this requirement until 2019.
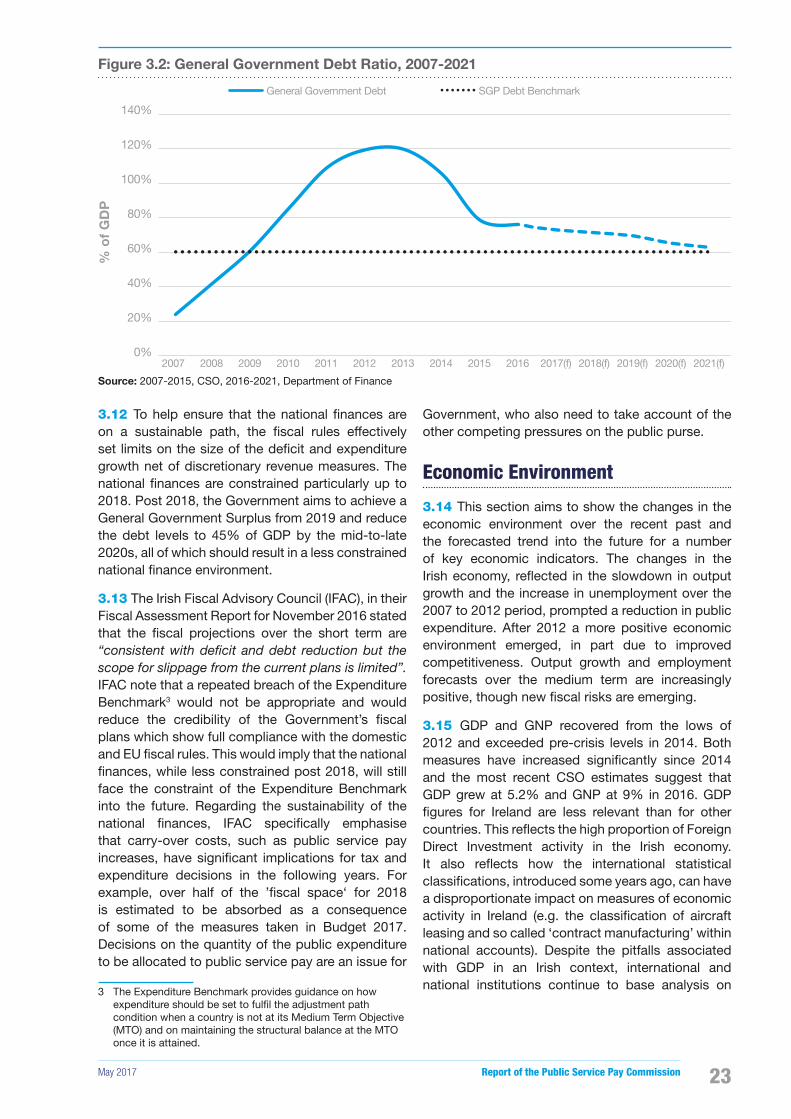
3.11 As Figure 3.2 illustrates, public debt peaked in 2012 at approximately 120% of GDP and has fallen to below 80% in 2015. It must be stressed while factors such as the much lower de�cit have played an important role in reducing the debt ratio since its peak in 2012, the sharp fall in 2015 mainly re�ects the substantial increase in GDP (see the section on economic environment below for a discussion of GDP issues). Real economic growth was lower for 2015 than GDP growth would suggest, so the real economy’s ability to service the debt was lower than it might appear given the raw numbers. Reducing the debt further, as forecast by the Department of Finance, will improve the �scal robustness, reduce the amount of interest paid, particularly with the current low level of interest rates and insulate against Ireland’s openness to external economic shocks. For
example, further signi�cant devaluations in Sterling or a restrictive trade agreement between the EU and UK following Brexit could have a major impact on trade, particularly for the agriculture and food processing sectors.
Table 3.1: General Government Balance, 2015 – 2021
2015 2016 (P) 2017 (F) 2018 (F) 2019 (F) 2020 (F) 2021 (F)
Million (unless otherwise stated)
Total Revenue €70,547 €73,105 €75,191 €78,090 €80,744 €83,944 €87,452
Total Expenditure €75,580 €74,434 €76,314 €78,385 €80,436 €82,336 €84,101
General Government Balance (GGB) -€5,033 -€1,329 -€1,122 -€295 €308 €1,608 €3,351
- GGB % of GDP -2.0% -0.5% -0.4% -0.1% 0.1% 0.5% 1.0%
P = Provisional, F = Forecast
Source: 2015 CSO, 2016-2021 Department of Finance
May 2017 Report of the Public Service Pay Commission 23
Figure 3.2: General Government Debt Ratio, 2007-2021
General Government Debt SGP Debt Benchmark
140%
120%
100%
80%
60%
40%
20%
0%
% o
f G
DP
2007 2008 2009 2010 2011 2012 2013 2014 2015 2016 2017(f) 2018(f) 2019(f) 2020(f) 2021(f)
Source: 2007-2015, CSO, 2016-2021, Department of Finance
3.12 To help ensure that the national �nances are on a sustainable path, the �scal rules effectively set limits on the size of the de�cit and expenditure growth net of discretionary revenue measures. The national �nances are constrained particularly up to 2018. Post 2018, the Government aims to achieve a General Government Surplus from 2019 and reduce the debt levels to 45% of GDP by the mid-to-late 2020s, all of which should result in a less constrained national �nance environment.
3.13 The Irish Fiscal Advisory Council (IFAC), in their Fiscal Assessment Report for November 2016 stated that the �scal projections over the short term are “consistent with deficit and debt reduction but the scope for slippage from the current plans is limited”. IFAC note that a repeated breach of the Expenditure Benchmark3 would not be appropriate and would reduce the credibility of the Government’s �scal plans which show full compliance with the domestic and EU �scal rules. This would imply that the national �nances, while less constrained post 2018, will still face the constraint of the Expenditure Benchmark into the future. Regarding the sustainability of the national �nances, IFAC speci�cally emphasise that carry-over costs, such as public service pay increases, have signi�cant implications for tax and expenditure decisions in the following years. For example, over half of the ’�scal space‘ for 2018 is estimated to be absorbed as a consequence of some of the measures taken in Budget 2017. Decisions on the quantity of the public expenditure to be allocated to public service pay are an issue for
3 The Expenditure Benchmark provides guidance on how expenditure should be set to ful�l the adjustment path condition when a country is not at its Medium Term Objective (MTO) and on maintaining the structural balance at the MTO once it is attained.
Government, who also need to take account of the other competing pressures on the public purse.
Economic Environment
3.14 This section aims to show the changes in the economic environment over the recent past and the forecasted trend into the future for a number of key economic indicators. The changes in the Irish economy, re�ected in the slowdown in output growth and the increase in unemployment over the 2007 to 2012 period, prompted a reduction in public expenditure. After 2012 a more positive economic environment emerged, in part due to improved competitiveness. Output growth and employment forecasts over the medium term are increasingly positive, though new �scal risks are emerging.
3.15 GDP and GNP recovered from the lows of 2012 and exceeded pre-crisis levels in 2014. Both measures have increased signi�cantly since 2014 and the most recent CSO estimates suggest that GDP grew at 5.2% and GNP at 9% in 2016. GDP �gures for Ireland are less relevant than for other countries. This re�ects the high proportion of Foreign Direct Investment activity in the Irish economy. It also re�ects how the international statistical classi�cations, introduced some years ago, can have a disproportionate impact on measures of economic activity in Ireland (e.g. the classi�cation of aircraft leasing and so called ‘contract manufacturing’ within national accounts). Despite the pitfalls associated with GDP in an Irish context, international and national institutions continue to base analysis on
Report of the Public Service Pay Commission May 201724
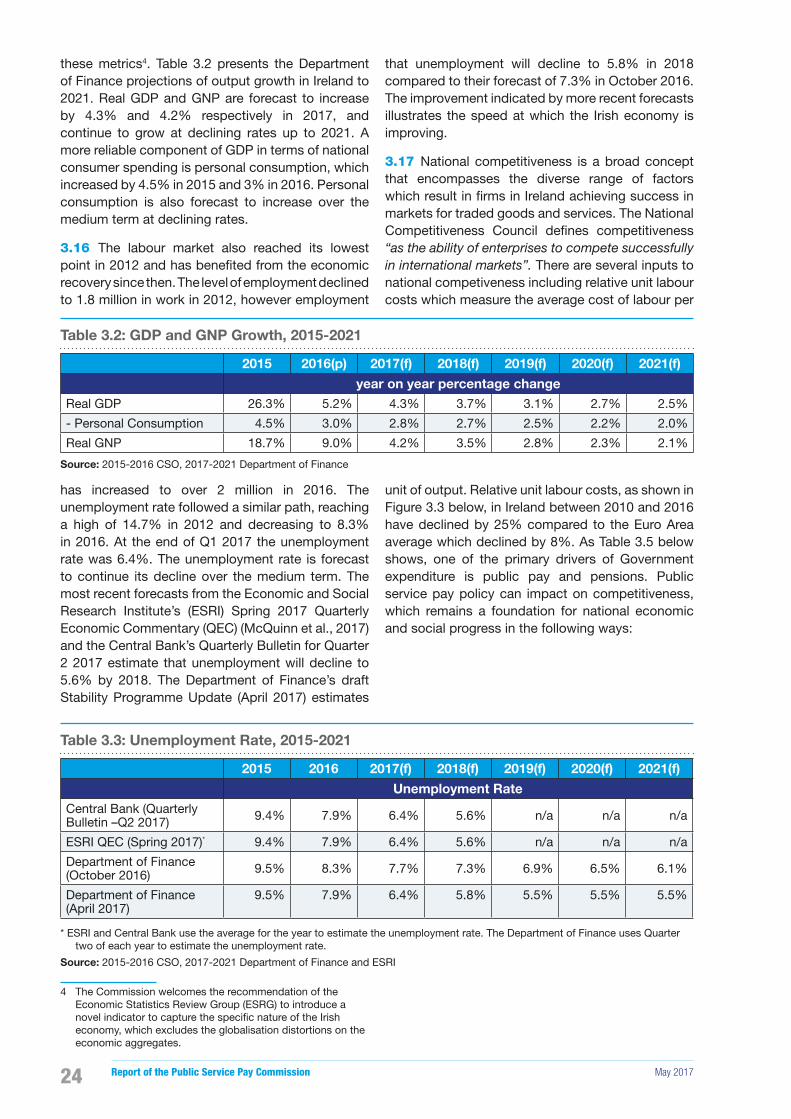
these metrics4. Table 3.2 presents the Department of Finance projections of output growth in Ireland to 2021. Real GDP and GNP are forecast to increase by 4.3% and 4.2% respectively in 2017, and continue to grow at declining rates up to 2021. A more reliable component of GDP in terms of national consumer spending is personal consumption, which increased by 4.5% in 2015 and 3% in 2016. Personal consumption is also forecast to increase over the medium term at declining rates.
3.16 The labour market also reached its lowest point in 2012 and has bene�ted from the economic recovery since then. The level of employment declined to 1.8 million in work in 2012, however employment
has increased to over 2 million in 2016. The unemployment rate followed a similar path, reaching a high of 14.7% in 2012 and decreasing to 8.3% in 2016. At the end of Q1 2017 the unemployment rate was 6.4%. The unemployment rate is forecast to continue its decline over the medium term. The most recent forecasts from the Economic and Social Research Institute’s (ESRI) Spring 2017 Quarterly Economic Commentary (QEC) (McQuinn et al., 2017) and the Central Bank’s Quarterly Bulletin for Quarter 2 2017 estimate that unemployment will decline to 5.6% by 2018. The Department of Finance’s draft Stability Programme Update (April 2017) estimates
4 The Commission welcomes the recommendation of the Economic Statistics Review Group (ESRG) to introduce a novel indicator to capture the speci�c nature of the Irish economy, which excludes the globalisation distortions on the economic aggregates.
that unemployment will decline to 5.8% in 2018 compared to their forecast of 7.3% in October 2016. The improvement indicated by more recent forecasts illustrates the speed at which the Irish economy is improving.
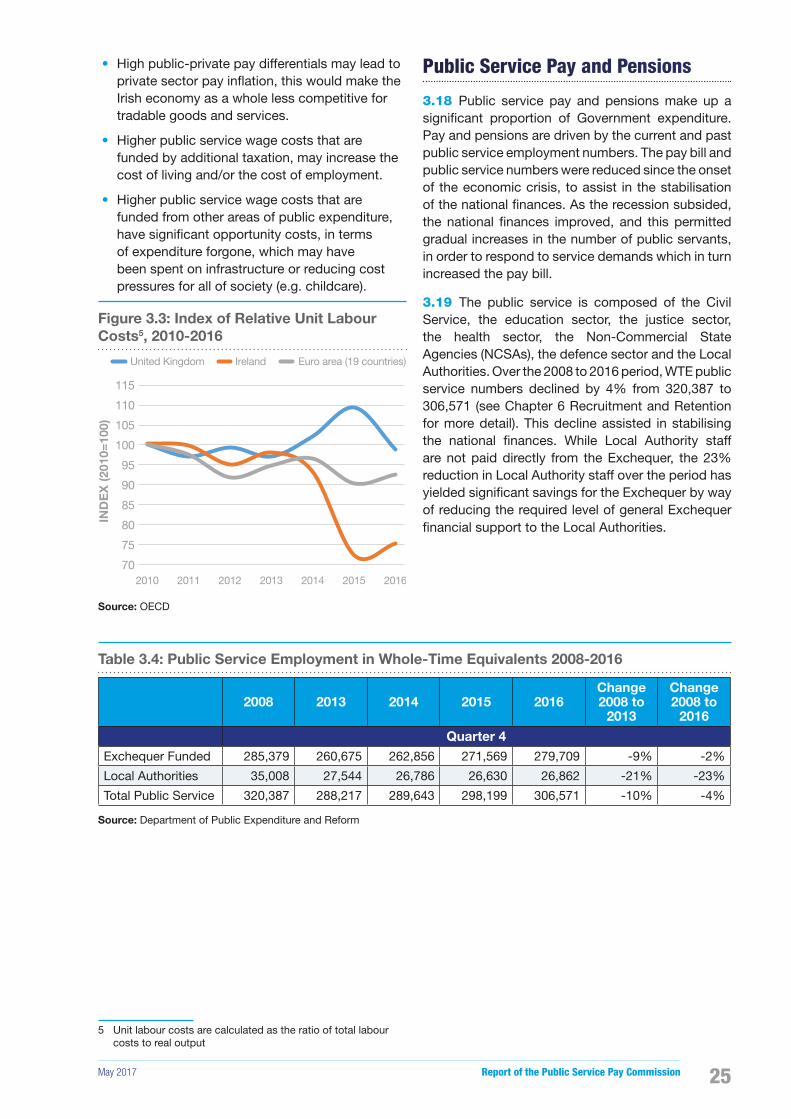
3.17 National competitiveness is a broad concept that encompasses the diverse range of factors which result in �rms in Ireland achieving success in markets for traded goods and services. The National Competitiveness Council de�nes competitiveness “as the ability of enterprises to compete successfully in international markets”. There are several inputs to national competiveness including relative unit labour costs which measure the average cost of labour per
unit of output. Relative unit labour costs, as shown in Figure 3.3 below, in Ireland between 2010 and 2016 have declined by 25% compared to the Euro Area average which declined by 8%. As Table 3.5 below shows, one of the primary drivers of Government expenditure is public pay and pensions. Public service pay policy can impact on competitiveness, which remains a foundation for national economic and social progress in the following ways:
Table 3.2: GDP and GNP Growth, 2015-2021
2015 2016(p) 2017(f) 2018(f) 2019(f) 2020(f) 2021(f)
year on year percentage changeReal GDP 26.3% 5.2% 4.3% 3.7% 3.1% 2.7% 2.5%
- Personal Consumption 4.5% 3.0% 2.8% 2.7% 2.5% 2.2% 2.0%
Real GNP 18.7% 9.0% 4.2% 3.5% 2.8% 2.3% 2.1%
Source: 2015-2016 CSO, 2017-2021 Department of Finance
Table 3.3: Unemployment Rate, 2015-2021
2015 2016 2017(f) 2018(f) 2019(f) 2020(f) 2021(f)
Unemployment RateCentral Bank (Quarterly Bulletin –Q2 2017) 9.4% 7.9% 6.4% 5.6% n/a n/a n/a
ESRI QEC (Spring 2017)* 9.4% 7.9% 6.4% 5.6% n/a n/a n/a
Department of Finance (October 2016) 9.5% 8.3% 7.7% 7.3% 6.9% 6.5% 6.1%
Department of Finance (April 2017)
9.5% 7.9% 6.4% 5.8% 5.5% 5.5% 5.5%
* ESRI and Central Bank use the average for the year to estimate the unemployment rate. The Department of Finance uses Quarter two of each year to estimate the unemployment rate.
Source: 2015-2016 CSO, 2017-2021 Department of Finance and ESRI
May 2017 Report of the Public Service Pay Commission 25
• High public-private pay differentials may lead to private sector pay in�ation, this would make the Irish economy as a whole less competitive for tradable goods and services.
• Higher public service wage costs that are funded by additional taxation, may increase the cost of living and/or the cost of employment.
• Higher public service wage costs that are funded from other areas of public expenditure, have signi�cant opportunity costs, in terms of expenditure forgone, which may have been spent on infrastructure or reducing cost pressures for all of society (e.g. childcare).
Figure 3.3: Index of Relative Unit Labour Costs5, 2010-2016
70
75
80
85
90
95
100
105
110
115
2010 2011 2012 2013 2014 2015 2016
IND
EX
(201
0=10
0)
United Kingdom Ireland Euro area (19 countries)
Source: OECD
5 Unit labour costs are calculated as the ratio of total labour costs to real output
Public Service Pay and Pensions
3.18 Public service pay and pensions make up a signi�cant proportion of Government expenditure. Pay and pensions are driven by the current and past public service employment numbers. The pay bill and public service numbers were reduced since the onset of the economic crisis, to assist in the stabilisation of the national �nances. As the recession subsided, the national �nances improved, and this permitted gradual increases in the number of public servants, in order to respond to service demands which in turn increased the pay bill.
3.19 The public service is composed of the Civil Service, the education sector, the justice sector, the health sector, the Non-Commercial State Agencies (NCSAs), the defence sector and the Local Authorities. Over the 2008 to 2016 period, WTE public service numbers declined by 4% from 320,387 to 306,571 (see Chapter 6 Recruitment and Retention for more detail). This decline assisted in stabilising the national �nances. While Local Authority staff are not paid directly from the Exchequer, the 23% reduction in Local Authority staff over the period has yielded signi�cant savings for the Exchequer by way of reducing the required level of general Exchequer �nancial support to the Local Authorities.
Table 3.4: Public Service Employment in Whole-Time Equivalents 2008-2016
2008 2013 2014 2015 2016Change 2008 to
2013
Change 2008 to
2016 Quarter 4 Exchequer Funded 285,379 260,675 262,856 271,569 279,709 -9% -2%
Local Authorities 35,008 27,544 26,786 26,630 26,862 -21% -23%
Total Public Service 320,387 288,217 289,643 298,199 306,571 -10% -4%
Source: Department of Public Expenditure and Reform
Report of the Public Service Pay Commission May 201726
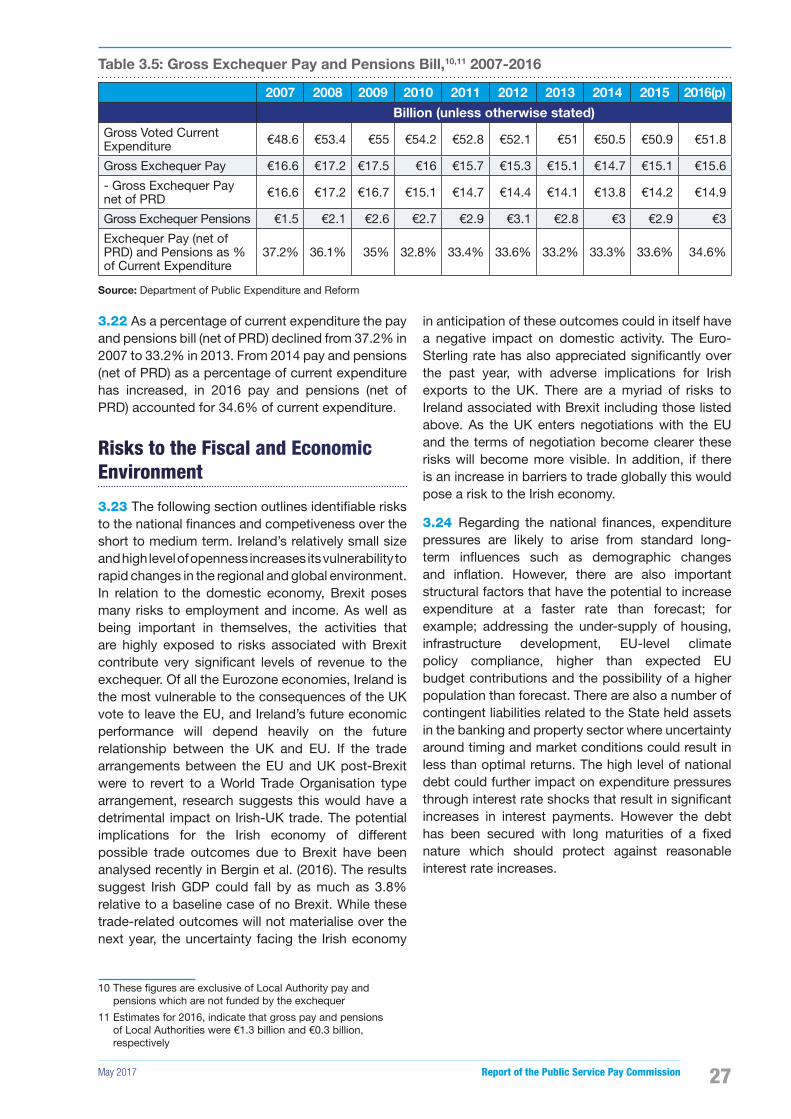
3.20 The gross public service pay bill net of PRD decreased by 9% from €16.6 billion in 2007 to €15.6 billion in 2016. There was a steep decline in gross pay (net of PRD) from the peak of €17.2 billion in 2009 to the lowest point of €13.8 billion in 2014. The savings on the pay bill were a result of the 2009-2013 retrenchment measures, a moratorium on recruitment introduced 2009 and a reduction in the headcount over the period. According to 2015 data from Eurostat, employee compensation as a percentage of General Government Expenditure in Ireland was 25% compared to 21% for the Euro Area (19 countries) and 21% for the UK. However Ireland’s General Government Expenditure as a percentage of GDP at 29.4%, lagged somewhat behind the average for the Euro Area (48.5%) and the UK (42.9%) indicating the relatively low level of General Government Expenditure in Ireland in 2015.
3.21 Conversely, the gross exchequer public service pension bill has doubled from €1.5 billion in 2007 to €3 billion in 20166. The peak in pension payments in 2012 was a result of higher than average number of retirees due to the expiry of the 2012 ‘grace period’7. The total costs of the public service pensions are more dif�cult to compare across a European context due to the relationship between state and occupational pensions. In addition to the PRD, public servants also pay an ongoing pension contribution which contributes between €500 million and €550 million to the Exchequer each year. Regarding the long term liabilities associated with public sector pensions, DPER carried out an actuarial valuation of the public service accrued pension liability in 20128. They estimated that the total accrued liability in respect of public service occupational pensions was €98 billion9 at December 2012. This suggests that the liability has fallen by €18 billion or by 16% since the 2011 report of the Comptroller and Auditor General which estimated that the total accrued liability in respect of public service occupational pensions was €116 billion at the end of 2009. The key reasons for the reduction were the pay and pension cuts since 2009 and the freeze of increments until after the HRA. The introduction
6 For most public servants there is a window of up to �ve years within which they can choose to retire. This means that overall annual pension bill cost patterns can be disrupted in years where there is a higher than average number of retirees. This is primarily due to the cost of the one-off retirement lump sum payments to which public servants are entitled.
7 The pensions of public servants who retired on or before 29 February 2012 were based on pay levels prevailing before the introduction of the 2010 FEMPI pay cut.
8 Accrued Liability in Respect of Public Service Occupational Pensions (2012), Department of Public Expenditure and Reform.
9 This �gure of €98 billion represents the present value of all expected future superannuation payments to current staff and their spouses in respect of service to December 2012, plus the liability for all future payments to current and preserved pensioners and to their spouses.
of the Single Public Service Pension Scheme on 1 January 2013 is also of relevance when considering future pension costs. While this new scheme does not have any immediate effect on the liability �gure it is expected over time to generate substantial long run reductions in the annual cost of pensions. Under EU Regulation (EU) 549/2013, the CSO is required to report on the gross accrued public service pension liabilities of Irish public servants as part of the National Accounts. Reporting is mandatory, commencing with an end-2015 position. Having carried out the 2012 actuarial valuation of the public service accrued pension liability, DPER has agreed to update this work on behalf of the CSO.
May 2017 Report of the Public Service Pay Commission 27
Table 3.5: Gross Exchequer Pay and Pensions Bill,10,11 2007-2016
2007 2008 2009 2010 2011 2012 2013 2014 2015 2016(p) Billion (unless otherwise stated)Gross Voted Current Expenditure €48.6 €53.4 €55 €54.2 €52.8 €52.1 €51 €50.5 €50.9 €51.8
Gross Exchequer Pay €16.6 €17.2 €17.5 €16 €15.7 €15.3 €15.1 €14.7 €15.1 €15.6
- Gross Exchequer Pay net of PRD €16.6 €17.2 €16.7 €15.1 €14.7 €14.4 €14.1 €13.8 €14.2 €14.9
Gross Exchequer Pensions €1.5 €2.1 €2.6 €2.7 €2.9 €3.1 €2.8 €3 €2.9 €3
Exchequer Pay (net of PRD) and Pensions as % of Current Expenditure
37.2% 36.1% 35% 32.8% 33.4% 33.6% 33.2% 33.3% 33.6% 34.6%
Source: Department of Public Expenditure and Reform
3.22 As a percentage of current expenditure the pay and pensions bill (net of PRD) declined from 37.2% in 2007 to 33.2% in 2013. From 2014 pay and pensions (net of PRD) as a percentage of current expenditure has increased, in 2016 pay and pensions (net of PRD) accounted for 34.6% of current expenditure.
Risks to the Fiscal and Economic Environment
3.23 The following section outlines identi�able risks to the national �nances and competiveness over the short to medium term. Ireland’s relatively small size and high level of openness increases its vulnerability to rapid changes in the regional and global environment. In relation to the domestic economy, Brexit poses many risks to employment and income. As well as being important in themselves, the activities that are highly exposed to risks associated with Brexit contribute very signi�cant levels of revenue to the exchequer. Of all the Eurozone economies, Ireland is the most vulnerable to the consequences of the UK vote to leave the EU, and Ireland’s future economic performance will depend heavily on the future relationship between the UK and EU. If the trade arrangements between the EU and UK post-Brexit were to revert to a World Trade Organisation type arrangement, research suggests this would have a detrimental impact on Irish-UK trade. The potential implications for the Irish economy of different possible trade outcomes due to Brexit have been analysed recently in Bergin et al. (2016). The results suggest Irish GDP could fall by as much as 3.8% relative to a baseline case of no Brexit. While these trade-related outcomes will not materialise over the next year, the uncertainty facing the Irish economy
in anticipation of these outcomes could in itself have a negative impact on domestic activity. The Euro-Sterling rate has also appreciated signi�cantly over the past year, with adverse implications for Irish exports to the UK. There are a myriad of risks to Ireland associated with Brexit including those listed above. As the UK enters negotiations with the EU and the terms of negotiation become clearer these risks will become more visible. In addition, if there is an increase in barriers to trade globally this would pose a risk to the Irish economy.
3.24 Regarding the national �nances, expenditure pressures are likely to arise from standard long-term in�uences such as demographic changes and in�ation. However, there are also important structural factors that have the potential to increase expenditure at a faster rate than forecast; for example; addressing the under-supply of housing, infrastructure development, EU-level climate policy compliance, higher than expected EU budget contributions and the possibility of a higher population than forecast. There are also a number of contingent liabilities related to the State held assets in the banking and property sector where uncertainty around timing and market conditions could result in less than optimal returns. The high level of national debt could further impact on expenditure pressures through interest rate shocks that result in signi�cant increases in interest payments. However the debt has been secured with long maturities of a �xed nature which should protect against reasonable interest rate increases.
10 These �gures are exclusive of Local Authority pay and pensions which are not funded by the exchequer
11 Estimates for 2016, indicate that gross pay and pensions of Local Authorities were €1.3 billion and €0.3 billion, respectively
Report of the Public Service Pay Commission May 201728
3.25 On the revenue side of the national �nances, tax concentration, speci�cally corporation tax concentration, poses the risk that if these tax receipts are volatile there is the potential for revenue to the State to be lower than forecast. IFAC12 highlight nine risks to the �scal environment in their 2016 Fiscal Assessment Report, three of which are related to tax. They speci�cally highlight the changes in the drivers, the volatility and concentration of corporation tax. A scenario where the expenditure and revenue risks materialise in similar periods would have very substantial impacts on the ability of the State to service its debt.
3.26 Finally, as a small and open economy in a single currency zone, Ireland’s business model is very much geared towards export-led growth, which, in turn, is sensitive to the evolution of cost competitiveness. If labour costs increase relative to international competitors there is a risk that there will be less demand for Irish exports. In particular, the construction sector contributed to the deterioration in competitiveness in the 2000s due to the disproportionate role it played. The growing relevance of this sector over the medium term could cause a repeat of the deterioration which was seen in the 2000s.
Chapter 3 Conclusions
3.27 The Irish economy has emerged from a challenging economic period that had severe impacts on the labour market and national �nances. Since 2012 unemployment has declined, GDP growth has increased and the �scal position of the State has continuously improved. The pay and pensions bill which accounts for over a third of current Government expenditure was also reduced to improve the national �nances. The pay bill declined from 2008 to 2014 while the pensions bill increased from 2008 to 2012, due to a number of early retirement incentives which reduced the pay bill, and has remained relatively static since 2012.
3.28 The provisional pay bill, net of PRD, for 2016 is €14.9 billion, up 8% from 2014. This increase is partly explained by the 6% increase in exchequer funded public service numbers over the 2014 to 2016 period. The pensions bill more than doubled from €1.5 billion to €3.1 billion between 2007 and 2012, however it levelled off after 2012 and is estimated to be €3 billion in 2016. The peak in the pensions bill in 2012 is explained by the higher than average number of retirees due to the expiry of the 2010 to 2012 ‘grace period’.
3.29 While the projections of the �scal and economic environment are positive in the short to medium term, risks in the form of Brexit and domestic competitiveness have the potential to pose signi�cant challenges to the Irish economy and the national �nances. Overall the constraints on the national �nances have reduced considerably since 2010, however the levels of debt remain elevated following the �scal crisis. While the medium term position is expected to continue to improve, the Commission believes that the Government must continue to act prudently regarding the management of the national �nances.
3.30 The level of resources available to the Government for discretionary spending – ‘�scal space’ – is projected to be less constrained in the period after 2018. However, decisions on the proportion of the public expenditure to be allocated to public service pay are a matter for Government, who will also need to take account of the competing pressures on the public purse and external risks facing the economy. In agreeing public service pay levels it is a matter for the parties to strike an appropriate balance between the interests of public service employees and the provision of ef�cient and adequate levels of public services, taking into account any constraints on the exchequer. There is no simple formula for balancing these interests, nor are they static over time.
12 Irish Fiscal Advisory Council, Fiscal Assessment Report, November 2016, Dublin.

May 2017 Report of the Public Service Pay Commission 29
Chapter 4:
Comparisons of Public Service and Private Sector Pensions

Report of the Public Service Pay Commission May 201730
4.1 This chapter examines the subject of public service pensions and their relative value compared to private sector occupational pensions. The terms of reference provide that when reaching its findings the Commission shall have regard to, inter alia, the superannuation and other benefits applying in the public service. The chapter first sets out the background to valuing occupational pensions and their contribution to total reward or total remuneration. We then outline some issues raised in submissions by interested parties before summarising our actuarial adviser’s review of this material. In the final section we set out our findings and conclusions in relation to the relative value of the various categories of public service pension schemes now in operation.
Background
4.2 The relative value of public service pensions was last examined in detail in 2007, in the context of the Benchmarking Body report. DPER submitted to the Commission that the relative value of public service pensions is a signi�cant part of remuneration for public servants and that the relative value of this component is higher now than it has been in the past. The 2007 Benchmarking Body report concluded that, on average, a fair rate for the employer cost of the bulk of public service pensions would be just over 20% of salary, while a comparable rate for private sector employees with occupational pensions was around 8.5%. Taking the difference between these estimates, it thus quanti�ed the average additional value of public service pensions relative
to private sector pensions as 12% of salary and applied a corresponding discount of that amount when comparing public service and private sector remuneration levels in its report.
4.3 The concept of total reward or total remuneration is well understood amongst human resource practitioners and other policymakers both in the public service and private sector. Total remuneration is the sum of an employee’s compensation package, including basic pay and all other bene�ts including superannuation. As Danzer and Dolton (2012) point out there is almost universal agreement that consideration of remuneration should include pay and pensions and all other forms of bene�ts (in cash and kind), but there is less agreement on how this should be calculated. At a minimum, remuneration encompasses two primary elements; annual earnings and cost of superannuation bene�t provision. The superannuation element of public service remuneration is signi�cant: in 2016, the cost of pensions in payment to public servants totalled in excess of €3.3 billion.1 The Commission considers that to address its terms of reference for the purposes of its initial report, it must examine the value of public service pensions.
4.4 There is an increased general awareness about the costs associated with pension provision, and some of the factors which impact on costs are readily discernible, including level of bene�t and level of employee contribution. However, the value of pension bene�ts is still dif�cult to estimate. This is partly because some elements require forecasts of uncertain variables, e.g. longevity of pensioners (current and projected), co-ordination with State contributory pension bene�ts and long term expected returns on future investments. Other relevant factors vary across individuals, for example, age and salary at entry and career progression. Various judgements and methodological assumptions have to be made. One standard simpli�cation adopted in this chapter is not to calculate actual costs for an individual member but instead to estimate the typical valuation for a grade or category of public servants as a whole.
1 Paragraph 1.1.6, Department of Public Expenditure and Reform Technical Paper, Actuarial Review of Pension Provision in the Irish Public Service and a Comparison with the Private Sector, 30 March 2017.
Chapter 4:Comparisons of Public Service and Private Sector Pensions
May 2017 Report of the Public Service Pay Commission 31
4.5 The landscape of occupational pension provision in the private sector has changed signi�cantly in the last decade. The Pensions Board Annual Report in 2006 suggested that there were slightly more private sector employees covered by de�ned bene�t pension schemes than by de�ned contribution schemes at that time. The 2007 Benchmarking Body report referenced a study by the Irish Association of Pension Funds which indicated that the share of companies with de�ned bene�t pension provision was 37% and the share offering de�ned contribution schemes had risen to 24%. The 2007 Benchmarking Report highlighted some related distinctions between public service and private sector pension provision as follows:
• All of the public service grades covered by the Benchmarking Body had de�ned bene�t pension schemes, while private sector provision composed of a declining number of de�ned bene�t pension schemes, an increasing number of de�ned contribution schemes, and �nally, many private sector employees with no occupational pension bene�t at all.
• Public service pensions increased in line with movements in salary in the respective grade of the member at retirement (‘pay parity’), while in the private sector, where pension increases took effect, they were limited to CPI increases.
4.6 The shift toward de�ned contribution schemes has continued in the private sector with the 2015 Annual Report of the Pensions Authority indicating that there are 125,955 active members of de�ned bene�t pension schemes (subject to the Funding Standard) and 281,629 active members of de�ned contribution pension schemes. Industry evidence strongly suggests de�ned bene�t pension schemes are effectively closed for new entrants in the private sector.
4.7 The Pensions Authority indicates that pension coverage in the public sector remains at 100%, with the equivalent coverage �gure for the private sector at 40%. However, public service pension provision has also changed in the decade since the 2007 Benchmarking Body report, most notably, with the introduction of the Single Public Service Pension Scheme (‘the Single Scheme’) with effect from 1 January 2013. The Single Scheme is a career-average revalued earnings pension scheme which applies to all new entrants to the public service from that date, replacing the standard �nal salary based pension provision which continues to apply for pre-2013 public service entrants. The Single Scheme is a de�ned bene�t pension scheme but it indexes members’ bene�ts to increases in CPI (rather than increases to bene�ts in payment based on pay
parity as previously applied). Minimum pension age for Single Scheme members is also speci�ed in line with the State Pension age (currently 66 years, rising to 68 years in 2028).
Issues raised with Commission by parties
4.8 Most of those who made submissions to the Commission addressed this question of public service pensions and the valuation that they should attract. In addition, we had a number of meetings at which this matter was discussed in more detail. At a meeting with DPER in November 2016, the Department proposed that the Commission should take full account of the relative value of public service pensions. It also indicated that the Department was already working on an actuarial assessment of public service occupational pension liabilities to comply with requirements in respect of EU Regulation (EU) 549/2013, the output of which would provide useful information on the expected cost of public service pension liabilities, and about the bene�ts associated with those pension obligations. Finally, DPER advised us that it intended to make a further signi�cant submission to the Commission on the matter of public service pensions. The Department wrote to us in January 2017, reiterating this intention and indicating that the early output from the actuarial assessment already underway in respect of EU Regulation (EU) 549/2013 requirements, would be used to complete an updated actuarial assessment of the value of public service pensions, drawing upon work already conducted by the Benchmarking Body in 2007.
4.9 On foot of DPER’s communications in this regard, the Commission informed other interested parties of the Department’s intention to submit an actuarial assessment of the value of public service pensions. We also invited those parties to submit their views on the matter in writing, to input into the Commission’s deliberations concerning the relative value of public service pensions.
4.10 DPER submitted its technical paper, Actuarial Review of Pension Provision in the Irish Public Service and a Comparison with the Private Sector, to the Commission on 30 March 2017. In addition, the Commission received fourteen other submissions speci�cally in respect of the relative value of public service pensions. In some instances, these submissions comprised an actuarial report in addition to an accompanying covering letter. All of these submissions, including the DPER submission and actuarial assessment are available on the Commission’s website (http://paycommission.gov.ie).

Report of the Public Service Pay Commission May 201732
Review of Actuarial Reports and Submissions Received
Scope
4.11 As noted above, the Commission received �fteen submissions in total, many of which comprised actuarial reports, in relation to the value of public service pensions. The full list of submissions can be found in Appendix B. These submissions proved extremely helpful and greatly assisted the Commission in its considerations on this matter. At an early stage, the Commission decided that it would not be appropriate to review the content of these submissions, in particular, any technical actuarial reports, without obtaining professional actuarial assistance and advice. Accordingly, we engaged actuarial consultants to independently review the submissions received by the Commission in respect of public service pensions and to prepare a written report setting out relevant �ndings.
4.12 Following a competitive procurement process, Milliman Consulting Actuaries was appointed to carry out the exercise. Milliman’s subsequent report for the Commission, Review of Actuarial Submissions, can be found in Appendix E.
4.13 Milliman was asked to review the methodology, assumptions, key judgements and conclusions set out in each of the actuarial submissions received by the Commission. This exercise was commissioned at a high level and the review did not encompass detailed validation of actuarial calculations in individual submissions received from interested parties. The Commission has assumed that all of the technical papers compiled by actuarial consultants and those submitted to the Commission by interested parties have been completed to professional standards.
Methodology
4.14 The Actuarial Review undertaken for the Commission (‘the Milliman report’) states that most submissions used a comparable methodology to calculate a value for public service and private sector pensions and that the methodologies employed appeared reasonable. The methodology most commonly used, including in the DPER report is the ‘Entry Age Method’. The ‘Entry Age Method’ calculates the effective contribution rate (as a percentage of pensionable salary) that would be required through the working life of the pension scheme member to generate the pension bene�ts due. The amount of the State Pension is then deducted from the pension amount, as appropriate, in calculating the effective contribution cost. The effective contribution rate is calculated net of employee contributions. With this method, all members are treated as new entrants. The Milliman report indicates that alternative methodologies could be used, but concludes that overall, this is a reasonable method to measure bene�ts. The Milliman report further notes that it would be important that the impact of the PRD would be taken into account, when calculating the remuneration of public servants. If not captured in the pension comparison calculations, it should be netted off public service earnings in any comparison with private sector earnings.
4.15 Various judgements and assumptions must be made when deciding upon an appropriate private sector valuation or cost for comparative purposes. The Milliman report highlights the most signi�cant judgements as follows:
• The DPER report compares pension costs of the pre-2013 public servants with private sector employees who have access to occupational pension provision (i.e. those with de�ned bene�t or de�ned contribution pensions). If all private sector employees were included, including those employees with no pension provision, then that would decrease the value of the private sector pension comparator.
• When calculating the cost of de�ned bene�t pensions in the private sector, the DPER report uses the same methodology and assumptions as those employed to value public service pensions. The same private sector de�ned bene�t pension costs were used for all grades so variations in age and salary at entry and retirement have not been re�ected. This implies that the values derived are appropriate for average-to-average comparisons but could possibly result in inappropriate comparisons in respect of particular grades.
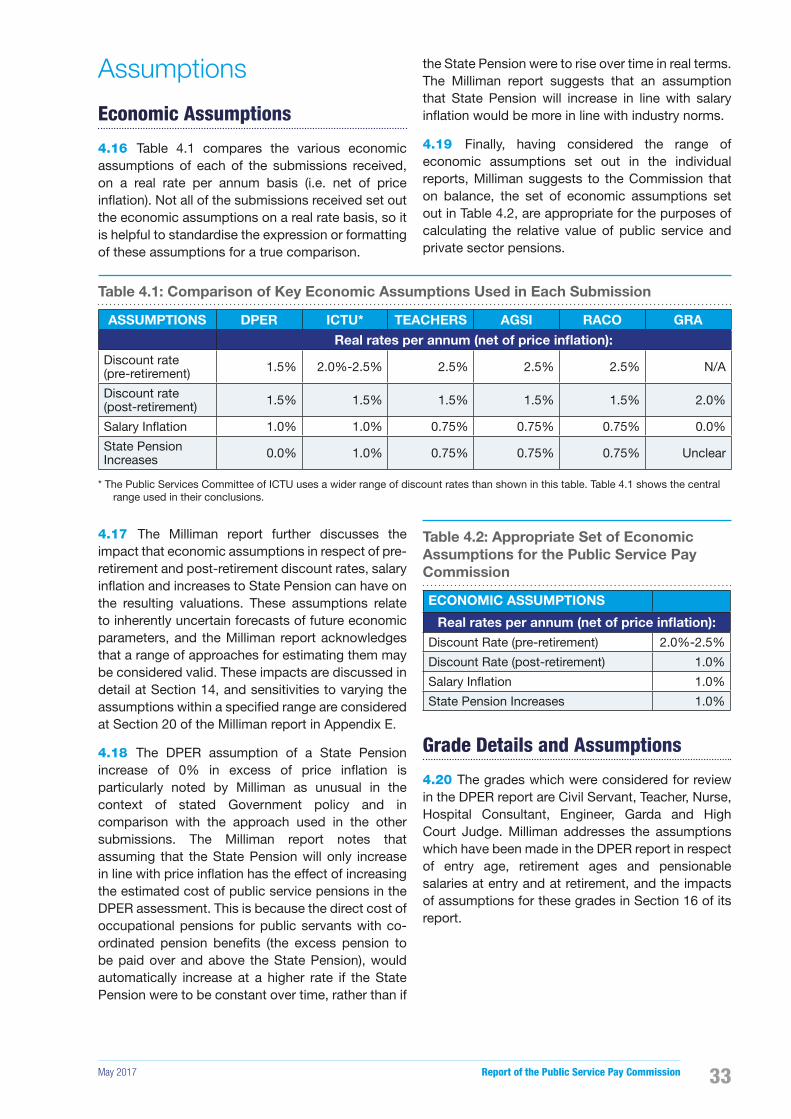
May 2017 Report of the Public Service Pay Commission 33
Assumptions
Economic Assumptions
4.16 Table 4.1 compares the various economic assumptions of each of the submissions received, on a real rate per annum basis (i.e. net of price in�ation). Not all of the submissions received set out the economic assumptions on a real rate basis, so it is helpful to standardise the expression or formatting of these assumptions for a true comparison.
4.17 The Milliman report further discusses the impact that economic assumptions in respect of pre-retirement and post-retirement discount rates, salary in�ation and increases to State Pension can have on the resulting valuations. These assumptions relate to inherently uncertain forecasts of future economic parameters, and the Milliman report acknowledges that a range of approaches for estimating them may be considered valid. These impacts are discussed in detail at Section 14, and sensitivities to varying the assumptions within a speci�ed range are considered at Section 20 of the Milliman report in Appendix E.
4.18 The DPER assumption of a State Pension increase of 0% in excess of price in�ation is particularly noted by Milliman as unusual in the context of stated Government policy and in comparison with the approach used in the other submissions. The Milliman report notes that assuming that the State Pension will only increase in line with price in�ation has the effect of increasing the estimated cost of public service pensions in the DPER assessment. This is because the direct cost of occupational pensions for public servants with co-ordinated pension bene�ts (the excess pension to be paid over and above the State Pension), would automatically increase at a higher rate if the State Pension were to be constant over time, rather than if
the State Pension were to rise over time in real terms. The Milliman report suggests that an assumption that State Pension will increase in line with salary in�ation would be more in line with industry norms.
4.19 Finally, having considered the range of economic assumptions set out in the individual reports, Milliman suggests to the Commission that on balance, the set of economic assumptions set out in Table 4.2, are appropriate for the purposes of calculating the relative value of public service and private sector pensions.
Table 4.2: Appropriate Set of Economic Assumptions for the Public Service Pay Commission
ECONOMIC ASSUMPTIONS
Real rates per annum (net of price inflation):Discount Rate (pre-retirement) 2.0%-2.5%
Discount Rate (post-retirement) 1.0%
Salary In�ation 1.0%
State Pension Increases 1.0%
Grade Details and Assumptions
4.20 The grades which were considered for review in the DPER report are Civil Servant, Teacher, Nurse, Hospital Consultant, Engineer, Garda and High Court Judge. Milliman addresses the assumptions which have been made in the DPER report in respect of entry age, retirement ages and pensionable salaries at entry and at retirement, and the impacts of assumptions for these grades in Section 16 of its report.
Table 4.1: Comparison of Key Economic Assumptions Used in Each Submission
ASSUMPTIONS DPER ICTU* TEACHERS AGSI RACO GRA
Real rates per annum (net of price inflation):Discount rate (pre-retirement) 1.5% 2.0%-2.5% 2.5% 2.5% 2.5% N/A
Discount rate (post-retirement) 1.5% 1.5% 1.5% 1.5% 1.5% 2.0%
Salary In�ation 1.0% 1.0% 0.75% 0.75% 0.75% 0.0%
State Pension Increases 0.0% 1.0% 0.75% 0.75% 0.75% Unclear
* The Public Services Committee of ICTU uses a wider range of discount rates than shown in this table. Table 4.1 shows the central range used in their conclusions.
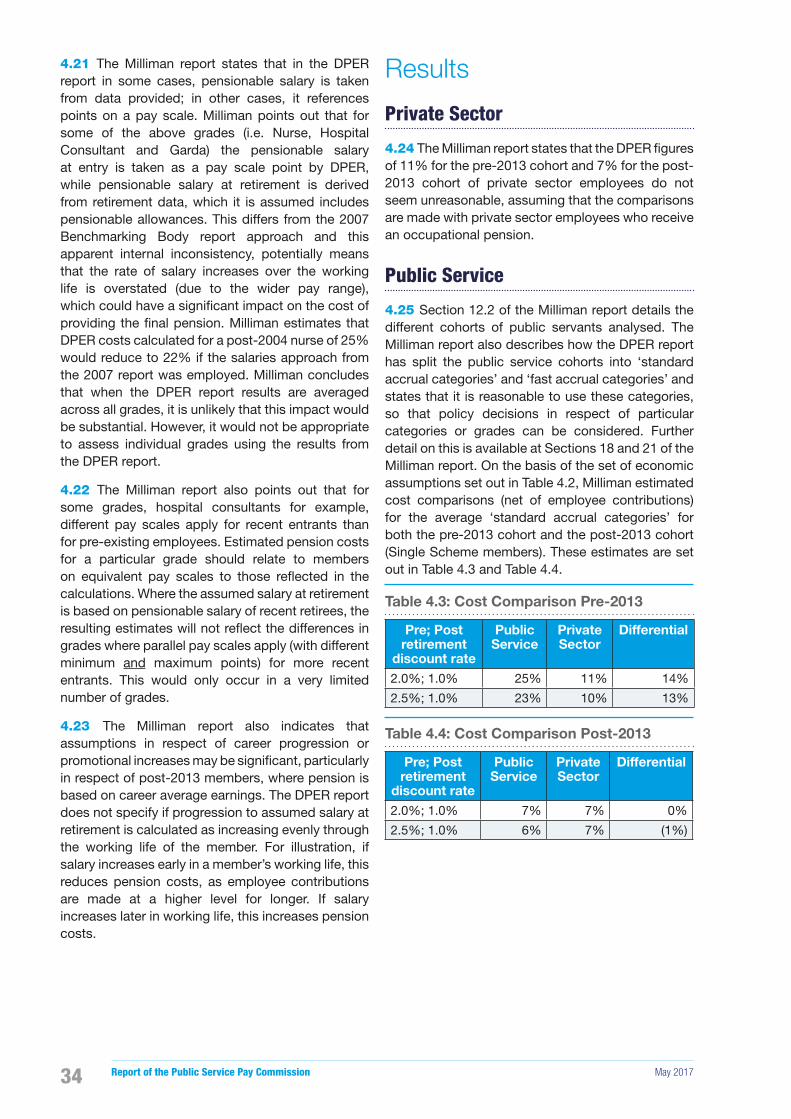
Report of the Public Service Pay Commission May 201734
4.21 The Milliman report states that in the DPER report in some cases, pensionable salary is taken from data provided; in other cases, it references points on a pay scale. Milliman points out that for some of the above grades (i.e. Nurse, Hospital Consultant and Garda) the pensionable salary at entry is taken as a pay scale point by DPER, while pensionable salary at retirement is derived from retirement data, which it is assumed includes pensionable allowances. This differs from the 2007 Benchmarking Body report approach and this apparent internal inconsistency, potentially means that the rate of salary increases over the working life is overstated (due to the wider pay range), which could have a signi�cant impact on the cost of providing the �nal pension. Milliman estimates that DPER costs calculated for a post-2004 nurse of 25% would reduce to 22% if the salaries approach from the 2007 report was employed. Milliman concludes that when the DPER report results are averaged across all grades, it is unlikely that this impact would be substantial. However, it would not be appropriate to assess individual grades using the results from the DPER report.
4.22 The Milliman report also points out that for some grades, hospital consultants for example, different pay scales apply for recent entrants than for pre-existing employees. Estimated pension costs for a particular grade should relate to members on equivalent pay scales to those re�ected in the calculations. Where the assumed salary at retirement is based on pensionable salary of recent retirees, the resulting estimates will not re�ect the differences in grades where parallel pay scales apply (with different minimum and maximum points) for more recent entrants. This would only occur in a very limited number of grades.
4.23 The Milliman report also indicates that assumptions in respect of career progression or promotional increases may be signi�cant, particularly in respect of post-2013 members, where pension is based on career average earnings. The DPER report does not specify if progression to assumed salary at retirement is calculated as increasing evenly through the working life of the member. For illustration, if salary increases early in a member’s working life, this reduces pension costs, as employee contributions are made at a higher level for longer. If salary increases later in working life, this increases pension costs.
Results
Private Sector
4.24 The Milliman report states that the DPER �gures of 11% for the pre-2013 cohort and 7% for the post-2013 cohort of private sector employees do not seem unreasonable, assuming that the comparisons are made with private sector employees who receive an occupational pension.
Public Service
4.25 Section 12.2 of the Milliman report details the different cohorts of public servants analysed. The Milliman report also describes how the DPER report has split the public service cohorts into ‘standard accrual categories’ and ‘fast accrual categories’ and states that it is reasonable to use these categories, so that policy decisions in respect of particular categories or grades can be considered. Further detail on this is available at Sections 18 and 21 of the Milliman report. On the basis of the set of economic assumptions set out in Table 4.2, Milliman estimated cost comparisons (net of employee contributions) for the average ‘standard accrual categories’ for both the pre-2013 cohort and the post-2013 cohort (Single Scheme members). These estimates are set out in Table 4.3 and Table 4.4.
Table 4.3: Cost Comparison Pre-2013
Pre; Post retirement
discount rate
Public Service
Private Sector
Differential
2.0%; 1.0% 25% 11% 14%
2.5%; 1.0% 23% 10% 13%
Table 4.4: Cost Comparison Post-2013
Pre; Post retirement
discount rate
Public Service
Private Sector
Differential
2.0%; 1.0% 7% 7% 0%
2.5%; 1.0% 6% 7% (1%)
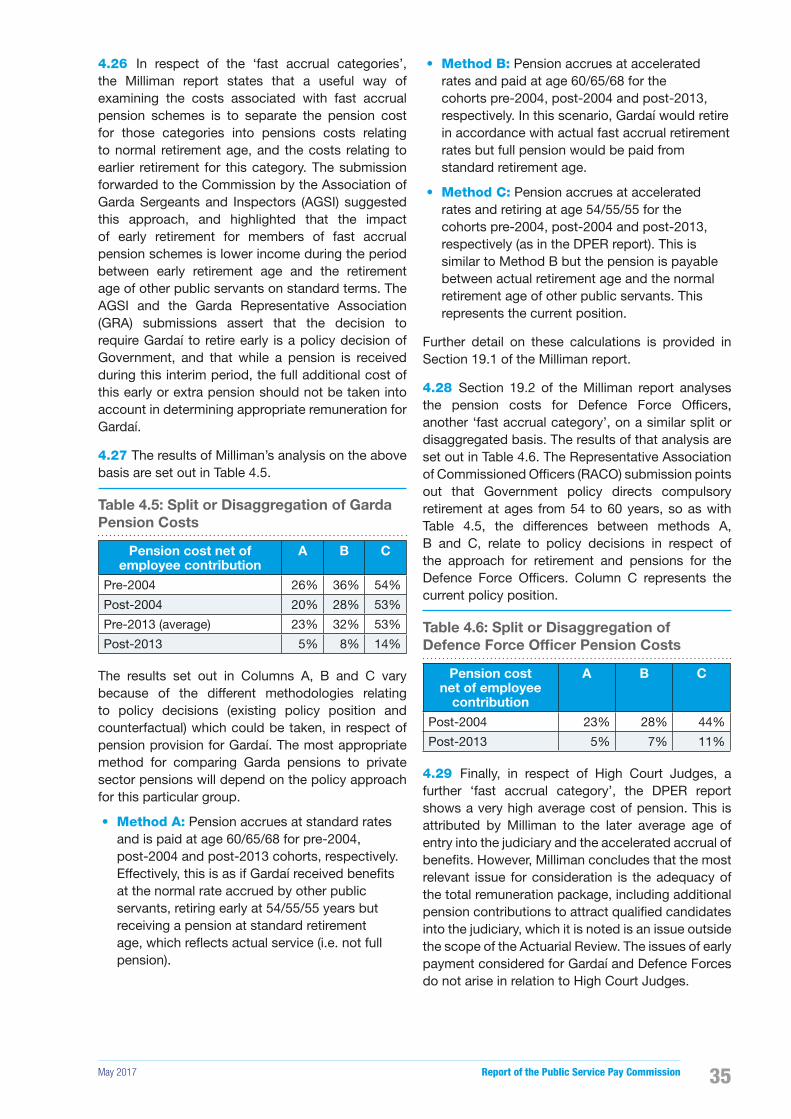
May 2017 Report of the Public Service Pay Commission 35
4.26 In respect of the ‘fast accrual categories’, the Milliman report states that a useful way of examining the costs associated with fast accrual pension schemes is to separate the pension cost for those categories into pensions costs relating to normal retirement age, and the costs relating to earlier retirement for this category. The submission forwarded to the Commission by the Association of Garda Sergeants and Inspectors (AGSI) suggested this approach, and highlighted that the impact of early retirement for members of fast accrual pension schemes is lower income during the period between early retirement age and the retirement age of other public servants on standard terms. The AGSI and the Garda Representative Association (GRA) submissions assert that the decision to require Gardaí to retire early is a policy decision of Government, and that while a pension is received during this interim period, the full additional cost of this early or extra pension should not be taken into account in determining appropriate remuneration for Gardaí.
4.27 The results of Milliman’s analysis on the above basis are set out in Table 4.5.
Table 4.5: Split or Disaggregation of Garda Pension Costs
Pension cost net of employee contribution
A B C
Pre-2004 26% 36% 54%
Post-2004 20% 28% 53%
Pre-2013 (average) 23% 32% 53%
Post-2013 5% 8% 14%
The results set out in Columns A, B and C vary because of the different methodologies relating to policy decisions (existing policy position and counterfactual) which could be taken, in respect of pension provision for Gardaí. The most appropriate method for comparing Garda pensions to private sector pensions will depend on the policy approach for this particular group.
• Method A: Pension accrues at standard rates and is paid at age 60/65/68 for pre-2004, post-2004 and post-2013 cohorts, respectively. Effectively, this is as if Gardaí received bene�ts at the normal rate accrued by other public servants, retiring early at 54/55/55 years but receiving a pension at standard retirement age, which re�ects actual service (i.e. not full pension).
• Method B: Pension accrues at accelerated rates and paid at age 60/65/68 for the cohorts pre-2004, post-2004 and post-2013, respectively. In this scenario, Gardaí would retire in accordance with actual fast accrual retirement rates but full pension would be paid from standard retirement age.
• Method C: Pension accrues at accelerated rates and retiring at age 54/55/55 for the cohorts pre-2004, post-2004 and post-2013, respectively (as in the DPER report). This is similar to Method B but the pension is payable between actual retirement age and the normal retirement age of other public servants. This represents the current position.
Further detail on these calculations is provided in Section 19.1 of the Milliman report.
4.28 Section 19.2 of the Milliman report analyses the pension costs for Defence Force Of�cers, another ‘fast accrual category’, on a similar split or disaggregated basis. The results of that analysis are set out in Table 4.6. The Representative Association of Commissioned Of�cers (RACO) submission points out that Government policy directs compulsory retirement at ages from 54 to 60 years, so as with Table 4.5, the differences between methods A, B and C, relate to policy decisions in respect of the approach for retirement and pensions for the Defence Force Of�cers. Column C represents the current policy position.
Table 4.6: Split or Disaggregation of Defence Force Officer Pension Costs
Pension cost net of employee
contribution
A B C
Post-2004 23% 28% 44%
Post-2013 5% 7% 11%
4.29 Finally, in respect of High Court Judges, a further ‘fast accrual category’, the DPER report shows a very high average cost of pension. This is attributed by Milliman to the later average age of entry into the judiciary and the accelerated accrual of bene�ts. However, Milliman concludes that the most relevant issue for consideration is the adequacy of the total remuneration package, including additional pension contributions to attract quali�ed candidates into the judiciary, which it is noted is an issue outside the scope of the Actuarial Review. The issues of early payment considered for Gardaí and Defence Forces do not arise in relation to High Court Judges.

Report of the Public Service Pay Commission May 201736
Milliman Report’s findings
4.30 The matter of the relative value of public service pensions was examined in detail in 2007. However, there have been signi�cant developments in occupational pensions and in the economy since that date and all parties now recognise the requirement to re-examine the topic in some detail. Updated actuarial reports and technical papers were submitted by a number of interested parties including DPER and the Public Services Committee. These submissions were all reviewed by the Commission’s own actuarial advisors.
4.31 The Commission has considered the �ndings of the Milliman report and notes in particular that:
• There was broad agreement on methodology and approach across all submissions.
• DPER’s costings do not seem unreasonable, assuming that it is appropriate to compare public service employees with private sector employees who have occupational pension provision.
• However, some adjustment to DPER’s costings is suggested to re�ect a range of appropriate discount rates and State Pension increases in line with salary in�ation, for both the private sector and public service cost calculations (in line with the Public Services Committee and other individual unions’ submissions).
• Accordingly, the Milliman report proposed a revised costing estimated in the range of 23-25% for pre-2013 public servants with standard accrual terms and a revised costing in the range of 10-11% for pre-2013 private sector employees. The updated differential between the estimated costs for pre-2013 public service employees and pre-2013 private sector comparators is in the range of 13-14%.
• It estimated a revised costing in the range of 6-7% for post-2013 public servants with standard accrual terms and a revised costing of 7% (with similar range of assumptions) is estimated for post-2013 private sector employees. This implies that the updated differential between the estimated costs for post-2013 public service employees and post-2013 private sector comparators is in the range of -1 to 0%.
• These valuations are an appropriate basis for considering public service pension scheme bene�ts on average. Other factors would need to be taken into account when considering individual grades.
• There are greater costs and some wider policy issues associated with the provision of ‘fast accrual categories’.
Chapter 4 Conclusions
4.32 The Commission has been asked to put a value on public service pensions relative to private sector occupational pensions. The value to be ascribed to pension schemes is not capable of precise ascertainment, as such a calculation requires long term forecasts of uncertain variables. Various judgements and methodological assumptions have to be made, and different views can reasonably be taken in relation to some of the associated decisions that are required.
4.33 The Commission is of the view that comparisons between public service and private sector pensions should be made on a ‘like for like’ basis, in so far as possible. We consider that it is reasonable to compare public service employees with private sector employees who have occupational pension provision, weighting appropriately to re�ect the compositional mix of de�ned bene�t and de�ned contribution schemes in the private sector. However, if estimates made on this basis are used when comparing total remuneration for public service and private sector employees, it is important to note that currently the majority of private sector employees do not have occupational pensions.2
4.34 Some submissions argue that there are inadequacies in occupational pension provisions in parts of the private sector and that this will not be addressed by dis-improving pension arrangements for the State’s employees. The Commission sees some merit in this argument. The issue of adequacy of pension provision in other sectors is a broader societal matter that is under consideration by the Government and the Department of Social Protection.
2 The earnings analysis (in Chapter 5) is based on all employees, whether they had occupational pensions or not. Therefore, adding together estimates of the pension premium and estimates of the earnings premium, to estimate a relative level of total remuneration, would be unreliable. This limitation was also shared by the Benchmarking Body report in 2007.

May 2017 Report of the Public Service Pay Commission 37
4.35 The Commission concludes that on average the value provided to employees by the standard accrual Single Public Service Pension Scheme is now on a par with employers’ contributions to current private sector de�ned contribution pensions. Approximate membership of the standard accrual Single Scheme was estimated at 34,000 members, at the end of December 2015. Single Scheme membership has increased signi�cantly since then and is currently estimated to be in excess of 50,000.
4.36 It is clear, that in the case of the earlier (pre-2013) legacy public service pension schemes, bene�ts are still considerably more valuable than for equivalent employees in the private sector. These bene�ts were previously assessed in 2007 to be on average 12% more valuable than private sector bene�ts and a corresponding discount of that amount was applied when comparing pay levels.
4.37 On the basis of Milliman’s analysis, standard accrual legacy public service pension schemes are now, depending on assumptions made, worth between 13%-14% more than private sector pensions for pre-2013 members. There were approximately 243,000 members in these types of schemes at the end of December 2015, which are closed to new members.
4.38 The Commission has carefully considered all of the issues raised in individual submissions received, and has noted, in particular, that small variations in the assumptions made in an actuarial assessment can have a signi�cant impact on its results. There are many possible valid approaches to deciding upon economic assumptions. The Milliman report concluded that DPER’s costings do not seem unreasonable. The Milliman report also proposed a revised set of costings for public service and private sector pension schemes based on a range of economic assumptions, which the Commission considers reasonable. The Commission considers that it would be sensible to re�ect this range of reasonable assumptions and results in its �ndings.
4.39 The Public Services Committee’s submission proposed a cost of 21% to 23% for the pre-2004 standard accrual cohort, which is also proposed in its report, as a proxy, for the pre-2013 public service as a whole. In the Commission’s opinion, based on the assumptions used in the preparation of the actuarial report upon which it is based, that submission can also be accepted as cogent.
4.40 It will ultimately be a matter for the parties to the collective bargaining process to assess all of the information provided in this chapter and to agree on a valuation to be ascribed to public service pensions in measuring overall remuneration. In the Commission’s opinion and having regard to all of the information provided to us, the value for the differential could reasonably be �xed within a range between 12%-18% (i.e. up to 6% above 2007 levels) for the pre-2013 standard accrual cohort of public servants.
4.41 The Commission notes that there are greater costs and some wider policy issues associated with the provision of fast accrual pension schemes. The level of additional cost varies depending on the scheme involved. There were approximately 23,000 members of these types of schemes at the end of December 2015.
4.42 The Commission believes that the values identi�ed for those on legacy pre-2013 standard accrual pension schemes and fast accrual schemes should be addressed by providing for an increased employee pension contribution for those who continue to bene�t from those schemes. The rate of increase and the grades and categories to which it should apply is a matter for negotiation between the parties, taking account of the level of bene�ts accruing. The Commission proposes that it would be reasonable to apply any agreed adjustments in conjunction with the discontinuance of the PRD which is a provision of the FEMPI Acts.

Report of the Public Service Pay Commission May 201738

May 2017 Report of the Public Service Pay Commission 39
Chapter 5:
Comparisons of Public Service and Private Sector Earnings

Report of the Public Service Pay Commission May 201740
5.1 This chapter outlines the evolution of earnings patterns and trends in the public service and provides earnings comparisons between the public service and private sector from 2007. As the recession developed both the public service and private sector responded with reductions in pay and numbers employed. The private sector reduced its pay bill, primarily by reducing the numbers employed and the number of hours worked. The public service reduced its pay bill, primarily by reducing earnings in a progressive manner where the higher earning cohorts experienced a greater proportionate reduction in earnings than the lower earning cohorts.
5.2 Private sector earnings declined from 2008 to 2011 and increased each year since, in 2016 average private sector earnings were 2.9% above the 2008 level. Average public service earnings declined from 2008 to 2014 and in 2016 were some 8.1% below the 2008 level. At an international level, Irish sectors that are predominantly made up of public service employees rank among the highest compared to similar European Union and European Free Trade Area countries. Looking to the public service and private sector earnings differential, controlling for a number of characteristics, the public service earnings premium has declined from 2007 to 2014 and was approaching parity. In 2014, there was a public service discount at the higher end of the earnings distribution while a premium remained at the lower end of the distribution and for women. The point at which the premium becomes a discount has decreased from 2007 to 2014 and is likely to have decreased further since. Pay settlements across
the private sector in recent years have provided pay increases in the range of 1.5% to 2.5% annually, depending on the sector and the employer’s ability to pay.
5.3 This chapter considers the evolution of earnings trends and provides earnings comparisons taking account of employee characteristics as required by the Commission’s terms of reference. The following sections outline the evidence of pay trends and comparisons across the public service and private sector from 2007 to 2016, where information is available. This analysis does not extend to a comprehensive ‘like for like’ job analysis such as those carried out in the second Benchmarking Body report in 2007. Instead, this report focuses on changes since that time in the public service and private sector based on available information. This chapter is presented as follows: the �rst section summarises the key points about pay comparisons contained in submissions received from relevant parties and also summarises the �ndings from the 2007 Benchmarking Body report. The second section analyses the trends and comparisons of earnings in the public service and private sector. Finally the conclusions of the Commission on these matters are presented.
Issues Raised with Commission by Parties
5.4 We received a number of submissions regarding matters relating to public service earnings and met with a range of interested parties so as to listen to their views and to fully understand the issues raised. The following section sets out some of the views and background data presented by the parties. All submissions received are available on the Commission’s website (http://paycommission.gov.ie/).
5.5 DPER submitted that the Commission should take account of both the range of professions and roles within the public service together with the individual characteristics of employees when analysing remuneration. According to DPER,
Chapter 5:Comparisons of Public Service and Private Sector Earnings
May 2017 Report of the Public Service Pay Commission 41
public service remuneration (i.e. compensation of employees) as a percentage of General Government Expenditure in 2015 is ahead of the European Union (EU) and Euro Area average. The DPER submission referred to a number of econometric analyses which, controlling for employee and their employers’ characteristics, considered the public private pay differential over the 2000s, all of which, according to DPER, reported a pay premium for public service employees.
5.6 The Public Services Committee submitted that comparisons of the pay of equivalent jobs, or work of equal value, in the public and private sectors should continue to inform public service pay determination. Its submission stated that the only comparison that is valid in the determination of pay is between work of a grade in the public service and the work of an exact equivalent, or those undertaking work of equal value, in the private sector. The Public Services Committee’s submission also stressed that comparison of public sector pay with averages in the private sector is not valid and creates a false narrative about comparative pay arrangements. Analysis presented by the Public Services Committee suggested that between 2000 and 2012 wage growth in the public service was above the private sector and that in 2013, private sector wage growth exceeded that of the public service. The Public Services Committee submitted that private sector wage growth since 2013 has ranged from 1% to 3.5% annually, using a range of Public Services Committee data sources.
5.7 The Public Services Committee’s submission suggested that international comparisons should be made with countries at similar level of economic development within the Eurozone and that international comparisons outside of the Eurozone should be treated with caution due to currency �uctuations. The submission emphasised that any international comparisons must be by reference to equivalent jobs or work of equal value, and must take account of the cost of living in the countries being reviewed. The Public Services Committee’s submission also suggested that employee compensation comparisons, using national accounts data, do not take account of particular countries’ accounting methods and distortions can arise when using this type of data to compare public service earnings.
5.8 Employer organisations (Ibec and Small Firms Association (SFA)) acknowledged the importance of industrial peace in the public service for society and the economy as a whole, but emphasised that this cannot be at any cost. An econometric study of 2013 Survey of Income and Living Conditions (SILC) data by Ibec suggested that the public-private pay
premium was around 12% but their analysis did not include the effects of the PRD on public servants. Ibec acknowledged that the premium has declined between 2009 and 2013, but stated that there is still a high premium for those in the bottom half of the earnings distribution (i.e. those earning around €40,000 or less). In the Ibec analysis the premium turns to a discount for the top 10% of public sector employees. Other submissions from employer organisations stated that average weekly earnings in the public sector are 50% higher than in the private sector. Regarding international comparisons employer organisations, using Eurostat data, show that Irish public service workers are still well paid in a European context.
Findings of 2007 Report in Relation to Pay
5.9 The 2007 Benchmarking Body report found that, in general, public service salaries compared well with the private sector, where remuneration was found to be below the private sector it mainly arose in the more senior grades. The 2007 Benchmarking Body recommended pay increases for a small number of groups across the public service. They made pay recommendations for 15 of 109 speci�c grades including a revised system of allowances in respect of Principals and Deputy Principals in primary schools and increases in pay ranging from 1% for Chief Technical Of�cers in the education sector to 15% for Principal Medical Of�cer in the health sector. However none of the pay recommendations of the 2007 Benchmarking Body were implemented due to the change in economic circumstances. Although some parties suggested that we address the non-implementation of these awards, we did point out to the relevant parties that pay recommendations for speci�c groups are outside the scope of the terms of reference of this report. Such matters will have to dealt with in any negotiations that Government may undertake following the publication of this report.
Earnings Analysis
5.10 This section considers earnings in the public service and private sector over the period 2007 to 2016. This time period re�ects the economy and labour market conditions from the end of the ‘Celtic Tiger’ period, through the subsequent recession and into the present period of economic recovery. As the recession developed both the public service and private sector responded with reductions in pay and numbers employed. However, the approaches taken in each sector were necessarily different. The private sector, faced with declining demand for goods and
Report of the Public Service Pay Commission May 201742
services, responded by rapidly reducing numbers employed and working hours. There were also, in some instances, reductions in pay. The public service, which saw little reduction in demand for services, relied on natural wastage and a moratorium on recruitment to reduce numbers more gradually. However, across the board reductions in pay and pension were implemented as the main instrument of reducing public service pay costs.
5.11 At a sectoral level, it is clear that the public service and private sectors have structural differences. Similarly, other sectors (e.g. construction, wholesale and retail, etc.) of the economy are structurally different, employ persons with differing characteristics, and operate in different business environments. Therefore, for example, comparing average earnings of employees in the accommodation and food services sector with that of employees in the information and communication sector would provide a misleading comparison if one did not control for differences in employee characteristics. In the same way, simple comparisons of average public service and private sector earnings would be misleading.
5.12 Comparing earnings of public service and private sector employees requires careful analysis, as differences exist in the composition of the two sectors and the characteristics of their employees (e.g. gender, occupation, experience, educational attainment, trade union membership, etc.). We were not required in this initial report to directly compare the remuneration for individual public service and private sector jobs. Instead this section compares the two sectors by tracking the trends in their earnings, illustrating changes in their earnings distribution, considering pay settlement trends in the private sector, comparing earnings in an international context and �nally making broad public-private earnings comparisons (accounting for the characteristics of employees and their employers).
5.13 This section is presented as follows, the �rst part compares trends in earnings in the public service and private sector using data from the Earnings, Hours and Employment Costs Survey (EHECS) from 2008 to 2016. Sectoral average earnings from EHECS are also presented. The second part looks at the distribution of earnings and employment in the public service and private sectors using the National Employment Survey (NES) for the period 2007 to 2010 and administrative earnings data for the period 2011 to 2014. The third part outlines pay settlement data from the Chartered Institute for Personnel and Development Ireland (CIPD) and Industrial Relations News (IRN). The fourth part considers the international comparisons of earnings across
sectors of the economy that are predominantly made up of public service employees. The �fth part considers econometric studies of the public-private sector earnings differential that have been carried out for the years 2003, 2007, 2009, 2010, 2011 and 2014. These econometric studies take account of the differences in characteristics of employees (e.g. gender, occupation, experience, educational attainment, trade union membership, etc.) and the characteristics of their employer (e.g. sector, size of organisation).The �nal part sets out certain themes that emerge from the data.
Employment in the Public Service and Private Sector
5.14 The number of people employed in a sector and the characteristics of those employees signi�cantly affects the earnings in the sector and how average earnings evolve over time. In the private sector, employment fell from 1.37 million in 2008 to a series low of 1.17 million in 2011, 14.7% below the 2008 level. As of 2016 employment in the private sector was 1.31 million, 4.4% below the 2008 level. In the public service1 employment declined from 375,400 in 2008 to 345,7002 in 2016, 7.9% lower than employment levels in 2008. Employment in the public service decreased at a slower rate than the private sector up to 2013 and has seen smaller increases in employment growth than the private sector over the period 2008-2016.
Average Earnings Patterns and Trends
5.15 Average weekly earnings in the private sector were €658 in 2008 and €677 in 2016, 2.9% higher in 2016 than in 2008. In the public service, average weekly earnings (net of the PRD) were €922 in 2008 and declined to €847 in 2016, 8.1% lower in 2016 than in 2008. Analysis that is ‘net of PRD’ reduce earnings to re�ect the impact of PRD (i.e. earnings minus PRD3). Figures for the public service in 2016 are inclusive of the LRA measures introduced from 1 January 2016, which are underpinned by the
1 The public service is considered to be all sectors that were subject to the FEMPI legislation, thus Commercial State Agencies are considered to be in the private sector for this analysis.
2 Public service employment refers to number of persons employed rather than WTE referenced elsewhere in the report.
3 The Pension Related Deduction applied to total earnings of public service bodies is the effective PRD rate each year. The PRD rates applied were: 5.92% - 2009 (0%*2 months, 7.5%*2 months, 7%*8 months); 7% - 2010, 2011 and 2012; 6.7% - 2013, 2014 and 2015; 5.6% - 2016; 5.3% - 2017, 2018.

May 2017 Report of the Public Service Pay Commission 43
FEMPI legislation. Under the terms of the LRA some FEMPI measures affecting public service earnings are being unwound in 2017 and 2018. These along with other scheduled payments to public service employees allow for the estimation of average earnings up to 20184. Figure 5.1 illustrates the trend in average weekly earnings in the private sector and public service and projections, for the public service only, from 2016 to 2018. Based upon these �gures and assumptions it is estimated that public service average weekly earnings (net of the PRD) will increase by 1.7% from 2016 to 2018. This leaves projected public service average weekly earnings 6.5% lower in 2018 than the 2008 level net of PRD and 1.3% lower than in 2008 when PRD is included.
Figure 5.1: Index of Average Weekly Earnings for the Public Service and Private Sector, 2008-20185
85
90
95
100
105
2008 2009 2010 2011 2012 2013 2014 2015 2016 2017 2018
IND
EX
(200
8=10
0)
Private Sector Public Service net of PRDEstimated Public Service net of PRD
Source: CSO, PSPC Workings
4 Using EHECS 2016 data as a base, the LRA is estimated to increase the public service pay bill by an estimated €290m in 2017 and €287m in 2018. Garda pay increases are estimated to increase the pay bill by €50m from 2017. Accelerated pay increases will have a once off impact of €120m on the pay bill in 2017, after which the pay increases are accounted for within the LRA estimates. It is assumed that public service employment will grow by 1.3% each year, the average public service employment growth of 2015 and 2016. As advised by DPER’s letter to Ibec on 16 February 2017, the analysis assumes that increment payments will not increase the total public service pay bill as savings from persons leaving the public service at higher increment points will cover the cost of incremental progression at lower levels.
5 EHECS data relating to 2016 re�ects �nal data for Q1, Q2 and Q3 and preliminary data for Q4.
5.16 Average annual earnings for full-time employees for all sectors of the Irish economy were €45,075 in 2015, according to the CSO.6 Average annual earnings in the accommodation and food service sector were €25,106 which was €19,969 less than average for all sectors. On the other side of the scale, the average annual earnings in the information and communication sector were €59,434 which was €14,359 more than the annual average for all sectors. Average annual earnings in the sectors that are predominately made up of public service employees, range from €45,020 in the human health and social work sector (€55 less than average) to €51,682 (€6,607 more than average) in the public administration and defence sector. Average annual earnings in the education sector were €51,053 (€5,978 more than average). It is evident that full-time sectoral earnings in the Irish economy are heterogeneous.
Figure 5.2: Average Annual Earnings by Sector for Full-Time Employees, 2015
€-
€10,000
€20,000
€30,000
€40,000
€50,000
€60,000
Acc
om a
nd fo
od
Ad
min
and
sup
p s
ervi
ces
Art
s, e
nter
tain
and
rec
Who
lesa
le a
nd r
etai
l tra
de
Con
stru
ctio
n
Tran
spor
tatio
n an
d s
tora
ge
Hum
an h
ealth
and
soc
ial
All
sec
tors
Ind
ustr
y
Pro
f, sc
ient
i�c
and
tec
h
Ed
ucat
ion
Pub
lic a
dm
in a
nd d
efen
ce
Fina
ncia
l and
insu
ranc
e
Info
rmat
ion
and
com
ms
Ann
ual E
arni
ngs
Source: CSO
5.17 The large differences in average earnings across sectors are due to the differing nature of business enterprises these sectors operate in; the characteristics of these enterprises and the characteristics of their employees, such as gender, occupation, experience, educational attainment, trade union membership, etc. These are the same reasons there are differences between average earnings in the public service and private sector, thus these differences are not unique to public-private sector comparisons.
6 This particular analysis does not reduce public service earnings to re�ect the impact of PRD
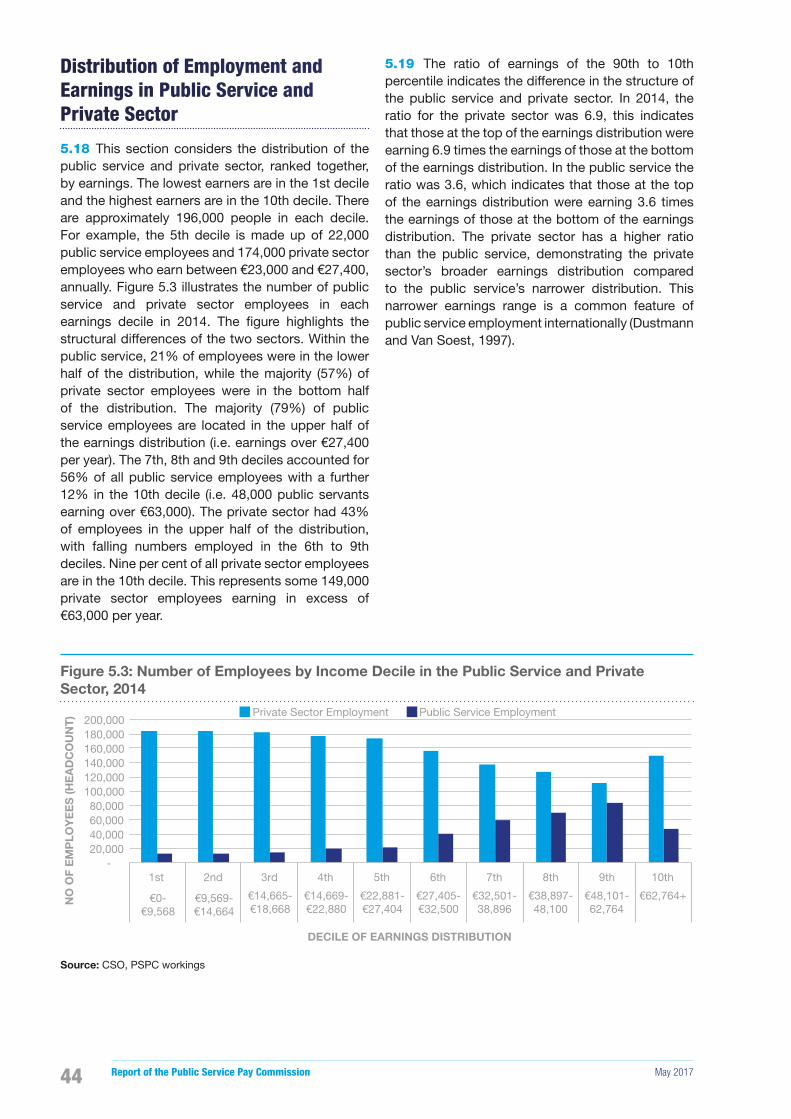
Report of the Public Service Pay Commission May 201744
Distribution of Employment and Earnings in Public Service and Private Sector
5.18 This section considers the distribution of the public service and private sector, ranked together, by earnings. The lowest earners are in the 1st decile and the highest earners are in the 10th decile. There are approximately 196,000 people in each decile. For example, the 5th decile is made up of 22,000 public service employees and 174,000 private sector employees who earn between €23,000 and €27,400, annually. Figure 5.3 illustrates the number of public service and private sector employees in each earnings decile in 2014. The �gure highlights the structural differences of the two sectors. Within the public service, 21% of employees were in the lower half of the distribution, while the majority (57%) of private sector employees were in the bottom half of the distribution. The majority (79%) of public service employees are located in the upper half of the earnings distribution (i.e. earnings over €27,400 per year). The 7th, 8th and 9th deciles accounted for 56% of all public service employees with a further 12% in the 10th decile (i.e. 48,000 public servants earning over €63,000). The private sector had 43% of employees in the upper half of the distribution, with falling numbers employed in the 6th to 9th deciles. Nine per cent of all private sector employees are in the 10th decile. This represents some 149,000 private sector employees earning in excess of €63,000 per year.
5.19 The ratio of earnings of the 90th to 10th percentile indicates the difference in the structure of the public service and private sector. In 2014, the ratio for the private sector was 6.9, this indicates that those at the top of the earnings distribution were earning 6.9 times the earnings of those at the bottom of the earnings distribution. In the public service the ratio was 3.6, which indicates that those at the top of the earnings distribution were earning 3.6 times the earnings of those at the bottom of the earnings distribution. The private sector has a higher ratio than the public service, demonstrating the private sector’s broader earnings distribution compared to the public service’s narrower distribution. This narrower earnings range is a common feature of public service employment internationally (Dustmann and Van Soest, 1997).
Figure 5.3: Number of Employees by Income Decile in the Public Service and Private Sector, 2014
-20,000 40,000 60,000 80,000
100,000 120,000 140,000 160,000 180,000 200,000
1st 2nd 3rd 4th 5th 6th 7th 8th 9th 10th
DECILE OF EARNINGS DISTRIBUTION
NO
OF
EM
PLO
YE
ES
(HE
AD
CO
UN
T) Private Sector Employment Public Service Employment
€0-€9,568
€9,569-€14,664
€14,665-€18,668
€14,669-€22,880
€22,881-€27,404
€27,405-€32,500
€32,501-38,896
€38,897-48,100
€48,101-62,764
€62,764+
Source: CSO, PSPC workings

May 2017 Report of the Public Service Pay Commission 45
Distribution of Earnings
Distribution of Earnings in the Public Service and Private Sector, 2007 to 2010
5.20 The analysis below considers the public service and private sector, ranked separately, by earnings from 2007 to 2010. The public service and private sector have large differences in the breadth of their earnings range. The private sector saw the largest earnings reductions among the lowest earners and the smallest reductions for the highest earners, while the public service saw a small increase for the lowest earners but the largest decrease for the highest earners. These trends mask the impact of compositional changes such as work pattern changes (e.g. full-time to part-time) which could shift workers to lower earning groups. Figure 5.4 illustrates the percentage change in the earnings of every 10th percentile from 2007 to 2010, net of PRD. The private sector saw earnings fall across the earnings distribution, with largest decreases in the 10th and 20th percentiles and smaller decreases in the 30th to 90th percentiles. Public service earnings, net of PRD, increased in the 10th percentile, all other percentiles have seen a decline in earnings. The changes to public service earnings show the progressive nature of the public pay reductions over the period, with the highest percentiles experiencing the largest reductions and the lower percentiles seeing the smallest reduction. However, the 40th 50th and 60th percentiles have earnings reductions greater than that of the 70th percentile.
Figure 5.4: Percentage Change in Percentile Earnings in the Public Service and Private Sector, 2007-2010
4%2%0%
-2%-4%-6%-8%
-10%-12%-14%
10th 20th 30th 40th 50th 60th 70th 80th 90th
% C
HA
NG
E IN
EA
RN
ING
S
PERCENTILE OF EARNINGS DISTRIBUTION
Private Sector Public Service (net of PRD)
Source: CSO, PSPC workings
Distribution of Earnings in the Public Service and Private Sector, 2011 to 2014
5.21 The analysis below considers the public service and private sector, ranked separately, by earnings from 2011 to 2014. This period saw private sector earnings increase across the earnings distribution with the largest increases for the highest earners (i.e. those above the 90th percentile). In contrast, the public service saw decreases in earnings for all groups above the 30th percentile with the largest decreases for the highest earners. Over the period 2011 to 2014, private sector earnings increased across the earnings distribution with increases between 1.2% and 1.5% in the 10th to the 70th percentiles with the exception of the 20th percentile where earnings increased by 2.4%. The 80th and 90th percentiles had higher increases of 2.3% and 3.6% respectively. The public service increased earnings in each of the lowest three percentiles. The 40th to 70th percentiles experienced slight declines while the 80th and 90th percentiles fell by 2% and 4% respectively.
Figure 5.5: Percentage Change in Percentile Earnings in the Public Service and Private Sector, 2011-2014
6%
4%
2%
0%
-2%
-4%
-6%
10th 20th 30th 40th 50th 60th 70th 80th 90th
% C
HA
NG
E IN
EA
RN
ING
S
PERCENTILE OF EARNINGS DISTRIBUTION
Private Sector Public Service (net of PRD)
Source: CSO, PCPC workings

Report of the Public Service Pay Commission May 201746
Pay Settlements in the Private Sector
5.22 In February 2017, the Chartered Institute for Personnel and Development Ireland (CIPD) and Industrial Relations News (IRN), published the results of their annual survey on private sector pay in 2017. The 2016 and 2017 surveys were conducted online among IRN and CIPD Ireland subscribers; a total of 536 companies completed the survey in 2017 and a total of 584 completed the survey in 2016.
CIPD and IRN Survey Sample
5.23 Just under half of the 2017 sample were companies with 250 or more employees, approximately a third of the sample were companies with 50-249 employees and about a �fth of the sample were companies with fewer than 50 employees. 34% of the companies sampled were unionised. The industry types sampled were as follows: 60% of companies were from the services sector, 17% were from the manufacturing sector, 3% were from the Commercial State Agency sector and 20% were in other sectors.
Main Findings of CIPD and IRN Survey
5.24 Regarding treatment of basic pay rates, 65% of companies increased pay in 2016. Looking at pay treatment by size, more mid-size companies increased basic pay than larger and smaller companies. Smaller companies were more likely to maintain basic rates of pay.
Table 5.1: Actual Treatment of Basic Pay by Company Size, 2016
Company Size Increased Maintained1 - 49 58% 42%
50 - 249 69% 31%
250+ 65% 35%
All 65% 35%
Source: CIPD, Private Sector Pay 2017
5.25 The size of the pay increase also differed by company size. Overall companies increased their basic pay by 2.7% in 2015 and 3% in 2016. However smaller companies increased their basic pay by an average of 3.8% in 2015 and 4.7% in 2016. Whereas increases in middle and larger companies were constant, in 2015 and 2016, at 2.7% and 2.5% respectively. Looking at unionisation, companies with union representation increased basic pay by 2.3% and those with no union representation increased pay by 3.4%. One of the theories suggested for
the difference in basic pay increases for unionised and non-unionised companies is that those with union representation might be governed by pay agreements which guarantee a certain level of basic pay increases each year whereas pay increases for those with no union representation may be dictated solely by company or individual performance which can vary widely each year.
5.26 The speci�c mix of companies and sectors in the sample are only indicative of private sector pay trends in the economy as some sectors are not represented and certain sectors are under or over represented in the sample.
Figure 5.6: Basic Pay % Increase by Company Size, 2015 and 2016
0%
1%
2%
3%
4%
5%
1-49 50-249 250+ Union Non-Union
Company Size Unionisation
% IN
CR
EA
SE
IN B
AS
IC P
AY
2016 (n=519)2015 (n=563)
Source: CIPD, Private Sector Pay 2017
5.27 In terms of basic pay sentiment for 2017, 50% of companies surveyed are planning to increase basic pay in 2017 with 25% of companies planning to maintain basic pay and 25% undecided at the time of the survey. This compares to the 2016 survey when 50% of companies planned to give increases, but in reality a greater number, some 65% did in fact give pay increases. Relative to company size, larger employers are more likely to plan increases and smaller employers are more likely to plan to maintain pay levels. Companies with a union are more likely to plan an increase.

May 2017 Report of the Public Service Pay Commission 47
Table 5.2: Company Plans Regarding Basic Pay in 2017
Increase Maintain No Decision
All 50% 25% 25%
Company Size
1-49 35% 36% 28%
50-249 52% 25% 23%
250+ 54% 21% 25%
Unionisation Union 66% 19% 15%
Non-Union 43% 28% 29%
Source: CIPD, Private Sector Pay 2017
5.28 In summary, 2016 saw increases for these companies in basic pay ranging from 2.5% to 4.2% depending on company size and unionisation. The 2016 CIPD/IRN data shows increases for middle and larger companies of 2.5% and 2.7% which are higher than the CSO annual earnings increases for the private sector of 2%. The difference in the increases is likely to be explained by the different sectoral mix in the CIPD/IRN survey compared to the CSO data. More companies increased basic pay than maintained pay, regardless of size. Looking forward to 2017, larger companies are more likely to plan increases in pay.
Themes Emerging from Analysis of Earnings Patterns and Trends
5.29 In terms of the distribution of employment by earnings, the public service and private sector show very signi�cant differences. Within the private sector 57% of employees were in the lower half of the earnings distribution compared to 21% of public service workers. The ratio of earnings of those in the 90th percentile compared to the 10th percentile in the private sector was 6.9 compared to 3.6 in the public service. Average earnings across the sectors of the economy are diverse. These �ndings are re�ective of the varied nature and composition of the Irish economy. There are a range of factors that in�uence earnings across sectors of the economy including gender, occupation, experience, educational attainment, trade union membership, etc. It can be concluded that because of these factors earnings across these different sectors in the economy vary.
5.30 The change in earnings in the economy since 2008 have been considerably different for public service and private sector employees. Public service earnings (net of PRD) saw larger decreases in average earnings than the private sector. Public service earnings levels in 2016 were 8% lower than in 2008. Forecasts for 2017 and 2018 estimate that
earnings in the public service are likely to increase by approximately 1.7%, which will bring average earnings to 6.5% lower than the 2008 level when account is taken of PRD. The public service also saw a slower decline in employment compared to the private sector which was a result of the Public Service Stability Agreements. Also, during this period the demand for some public services (e.g. social welfare and medical services) increased as a result of decreasing incomes, increasing unemployment and demographic pressures.
5.31 Firms in the private sector mostly reduced their wage bill through a rapid decline in employment and reduced working hours, resulting in less severe reductions in average earnings. Employment started recovering in 2012 and average earnings have since risen to 3% above 2008 levels in 2016. Pay settlement data from the CIPD/IRN survey of private sector companies indicates that for large companies the average pay increase per year over the last 2 years was 2.5%, CSO data indicates that average earnings increases for all employees in the private sector over the last 2 years ranged from 1.7% in 2015 to 2% in 2016.
5.32 It is evident from the distributional analyses that pay reduction measures over the 2007 to 2010 period in public service earnings were generally progressive in nature. Changes in earnings in the private sector distribution were neutral up to the 70th percentile and more regressive in nature above that point. Over the 2011 to 2014 period, public service earnings at most pay points declined whereas earnings increased, although at low levels, across the distribution for the private sector. One of the effects of the FEMPI legislation has been a reduction in the differentials between different income cohorts of public service employees. It is understood that this was done in part as a measure of social solidarity rather than on the basis of any analysis of relative changes in job responsibilities. As FEMPI measures continue to be unwound, the issue of the relative pay differentials between different cohorts will need to be considered.
International Comparators
5.33 This section aims to contextualise and consider Irish public sector earnings compared to the EU15 countries (excluding Greece7), and developed European Free Trade Area (EFTA) countries (Norway, Iceland and Switzerland) in 2014, which is the most recent year data is available. These comparisons give an indication of the earnings across sectors which are mostly made up of public sector employees. A public service and private sector breakdown is
7 Data for Greece is not available for 2014.
Report of the Public Service Pay Commission May 201748
not available from this data source, so the three public sector dominated economic sectors; public administration and defence, education, and human health and social work, are used as proxies for the public sector. There are private sector elements in each of these sectors while there are also elements of the public service not included in these three sectors.
5.34 This analysis is not a ‘like for like’ comparison of public sectors internationally. More complete and comparable public sector earnings comparisons would include characteristics such as occupational classi�cation, educational attainment, skill level, experience and trade union membership. Robust statistics about these characteristics are not available from the data used in this analysis. These unobserved characteristics would explain some of the remaining differences in earnings between the public sectors across countries. Notwithstanding these limitations, Eurostat’s Structure of Earnings Survey (SES) is still the most reliable source of data for international earnings comparisons. It should be noted that these are gross earnings and do not include adjustments for tax, social insurance or other deductions (i.e. PRD).
International ‘Public Sector’ Earnings
5.35 The aim of this international analysis is to establish whether remuneration in the public sector is unusually low compared to other countries where Irish people have the automatic right to work (i.e. the EU) or in countries where earning levels effects Irish earning levels. Research has shown that earning levels in other countries such as the UK have had signi�cant effects on the Irish labour market for many years (Curtis & FitzGerald, 1996) and evidence presented to the Commission suggests that within a limited number of sectors (e.g. health sector) there is an international labour market with staff moving to and from other countries in signi�cant numbers. Where this is the case, setting pay levels considerably lower than the international norms may impact on recruitment and retention.
5.36 Eurostat data on emigration8 indicates that 54% of Irish emigrants in 2015 migrated to a European country. The UK was the most popular destination accounting for 23% of Irish emigrants. North America and Australia & New Zealand were the next most popular destinations with 16% and 11% respectively. Ideally this analysis would focus speci�cally on EU countries as well as North America,
8 This includes all people (including public service and private sector employees) who emigrated from Ireland in 2015.
Australia & New Zealand. However there would not appear to be a consistent international data source for worldwide comparisons across sectors. The OECD collects information in relation to international earnings but due to considerable differences in methodologies across countries these are not included in this report. Therefore, this analysis uses Eurostat’s SES database to compare against similar countries within the EU and EFTA.
5.37 Data from Eurostat’s SES is used to analyse data on earnings across EU Member States and EFTA countries. The objective of the SES is to provide accurate and harmonised data on earnings across the EU for policy-making and research purposes. This analysis does not consider disaggregated variables from the SES because some variables (i.e. occupation, education, etc.) were forecast and modelled from 2011 administrative data sources, and results from Census 2016 indicates a large change in these variables over the 2011 to 2016 period. More information on this data is available in Appendix F.
5.38 Table 5.3 shows the ratio of gross earnings in sectors mostly made up of public sector employees compared to gross earnings in the general economy, as measured by earnings in the industry, construction and services sector, for each country. While the ranking of absolute earnings is informative, this measure gives an indication of the difference in the level of earnings in each of these sectors compared to the average for each individual country. In effect there are differing ratios across sectors due to the different characteristics of sectors and employees within those sectors. Looking speci�cally at sectors which are largely made up of public sector employees, the ratio for Irish public administration and defence is the 3rd highest of the 12 countries considered at 1.12, behind the Netherlands and Switzerland. This indicates that earnings in the public administration and defence sector are 12% higher than average annual earnings in Ireland. Similarly, the ratio for education is the 3rd highest of the 15 countries considered. The education ratio of 1.22 indicates that employees in the education sector earn 22% more than average annual earnings in Ireland. In terms of human health and social work, the ratio is the 5th highest (1.01) of the 17 countries considered, with Luxembourg, Spain, Iceland and Italy ranking above Ireland in 2014. The ratio for the human health and social work sector is 1% higher than average earnings in Ireland.
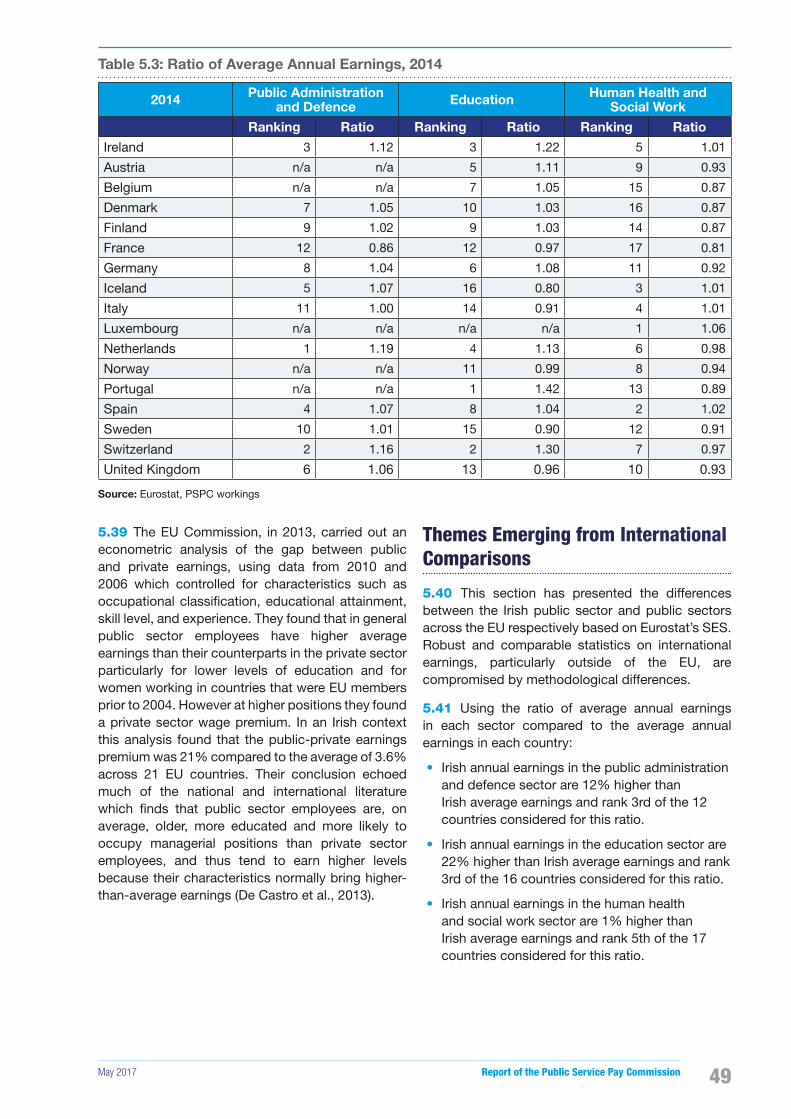
May 2017 Report of the Public Service Pay Commission 49
Table 5.3: Ratio of Average Annual Earnings, 2014
2014 Public Administration and Defence Education Human Health and
Social Work
Ranking Ratio Ranking Ratio Ranking Ratio
Ireland 3 1.12 3 1.22 5 1.01
Austria n/a n/a 5 1.11 9 0.93
Belgium n/a n/a 7 1.05 15 0.87
Denmark 7 1.05 10 1.03 16 0.87
Finland 9 1.02 9 1.03 14 0.87
France 12 0.86 12 0.97 17 0.81
Germany 8 1.04 6 1.08 11 0.92
Iceland 5 1.07 16 0.80 3 1.01
Italy 11 1.00 14 0.91 4 1.01
Luxembourg n/a n/a n/a n/a 1 1.06
Netherlands 1 1.19 4 1.13 6 0.98
Norway n/a n/a 11 0.99 8 0.94
Portugal n/a n/a 1 1.42 13 0.89
Spain 4 1.07 8 1.04 2 1.02
Sweden 10 1.01 15 0.90 12 0.91
Switzerland 2 1.16 2 1.30 7 0.97
United Kingdom 6 1.06 13 0.96 10 0.93
Source: Eurostat, PSPC workings
5.39 The EU Commission, in 2013, carried out an econometric analysis of the gap between public and private earnings, using data from 2010 and 2006 which controlled for characteristics such as occupational classi�cation, educational attainment, skill level, and experience. They found that in general public sector employees have higher average earnings than their counterparts in the private sector particularly for lower levels of education and for women working in countries that were EU members prior to 2004. However at higher positions they found a private sector wage premium. In an Irish context this analysis found that the public-private earnings premium was 21% compared to the average of 3.6% across 21 EU countries. Their conclusion echoed much of the national and international literature which �nds that public sector employees are, on average, older, more educated and more likely to occupy managerial positions than private sector employees, and thus tend to earn higher levels because their characteristics normally bring higher-than-average earnings (De Castro et al., 2013).
Themes Emerging from International Comparisons
5.40 This section has presented the differences between the Irish public sector and public sectors across the EU respectively based on Eurostat’s SES. Robust and comparable statistics on international earnings, particularly outside of the EU, are compromised by methodological differences.
5.41 Using the ratio of average annual earnings in each sector compared to the average annual earnings in each country:
• Irish annual earnings in the public administration and defence sector are 12% higher than Irish average earnings and rank 3rd of the 12 countries considered for this ratio.
• Irish annual earnings in the education sector are 22% higher than Irish average earnings and rank 3rd of the 16 countries considered for this ratio.
• Irish annual earnings in the human health and social work sector are 1% higher than Irish average earnings and rank 5th of the 17 countries considered for this ratio.

Report of the Public Service Pay Commission May 201750
5.42 Comparing this ratio across the Irish sectors, the human health and social work sector has the lowest ratio and the education sector has the highest ratio. Readers should note that there are differing ratios across sectors due to the different characteristics of sectors and employees within those sectors. The methodological differences in international data outside of the EU and data limitations in EU data, speci�cally the difference in what was estimated for Eurostat in 2014 and the Census 2016 results, make it dif�cult to draw de�nitive conclusions on international earnings comparisons.
5.43 Controlling for characteristics such as occupational classi�cation, educational attainment, skill level, and experience, the Irish public earnings premium in 2010 was amongst the highest in the European Union. However, these estimates do not remove PRD and since 2010 there have been very signi�cant earnings movements across the public service and private sector. The econometric analysis from 2011 to 2014 by the CSO shows the effects of these movements on the public-private premium for Ireland.
Econometric Analysis of Public-Private Earnings 2007-2014
5.44 At the start of this chapter we noted that simply comparing average pay or earnings levels in any two sectors tends to be misleading. In particular, averages fail to allow for differences in earnings that arise due to the varying mixtures of employee characteristics (e.g. sectors that employ more experienced or highly educated staff will also tend to pay more). Econometric analysis of public-private earnings differentials aims to correct for some of these differences and thereby facilitate more appropriate comparisons. This approach involves estimating the average premium or discount in public service earnings compared to the private sector, while taking account of employee characteristics (e.g. age, gender, occupation, experience, educational attainment) and employer characteristics (sector, size of employer). It is also possible to examine how average public-private earnings differentials vary across the earnings distribution. In 2007 econometric earnings models formed part of the second Benchmarking Body exercise. Several studies have been carried out since then, most recently by the CSO9. These econometric analyses do not replace
9 Ernst & Young and Murphy (2007) analysed NES 2003 data; Kelly, McGuinness & O’Connell undertook a similar study in 2008 focusing on 2003 and 2006 NES data. Subsequently the CSO produced similar analyses for the years 2007, 2009 and 2010 using NES data. More recently the CSO published results of an econometric analysis for 2011 to 2014 based upon linked QNHS and administrative earnings data.
detailed ‘like for like’ job analysis, as the surveys and administrative earnings datasets used in these models contain only a subset of employee and job characteristics. However, these pieces of research allow for the tracking of comparable public-private earning statistics across the earnings distribution and over time.
5.45 In this section we collect results from several recent studies to explore the evidence on how average public-private earnings differentials have developed over time in Ireland. As some of these public-private sector estimates were produced independently of each other, utilised different speci�cations and methodologies and have different data sources, they are not directly comparable with one another as absolute values. They do however provide a good indication of the trend in the public-private earning differential over the period. The public-private earning differential estimates should not be taken as absolute values, they are statistical estimates that provide insight into the evolution of public service earnings premia or discounts over time and across the earnings distribution.
5.46 The regression analysis presented in Figure 5.7 excludes PRD from public service earnings, uses data weighted to re�ect the national workforce, excludes company size as an explanatory variable and only considers permanent full-time employees aged 25 to 59. However, there are some attributes that vary among the models used. NCSAs are considered private sector in 2003 and 2006 and are considered public sector from 2007 onwards. Commercial State Agencies are considered private sector for 2003, 2006 and 2009 to 2014, but were categorised as public sector in 2007. The Commission’s remit relates only to public service employees, so public service speci�c data is preferred where available. Also, the models from which results are drawn for 2007-2014 control for union membership, whereas those for earlier years do not. More information on these models is provided in Appendices C and F.

May 2017 Report of the Public Service Pay Commission 51
Average Public-Private Sector Earnings Differential
5.47 Figure 5.7 illustrates the output for the average public-private earnings differential for each year an econometric analysis was undertaken10. From 2003 to 2006 the public service premium increased to a series high of 24% for all public service employees. Post 2006 there is a downward trend in the estimated public service earnings premium reaching parity or a small discount for public service employees in 2014. These movements re�ect changes in private sector earnings as well as the effects of cuts to public service earnings over the period (including the introduction of PRD). The public service premium for males fell at a faster pace than that of females. Public service males, net of PRD, had a discount of 3% in 2011 and reached a discount of 7% in 2014. Females continue to have a public service premium for all years and the rate of decline in the premium is low. The public service premium for females was 11% in 2009 and has declined to 7% in 2014. Drawing �rm conclusions about why the premium for women in the public service did not fall in line with the male premium is dif�cult without sector-by-sector analysis. Part of the explanation may be that the composition of female employment in the private
10 The analysis for 2011-2014 uses QNHS personal characteristics with P35 earnings data. There was a 90% match between the two sources with no obvious differences in the descriptive statistics of the matched dataset to that of the P35.
sector is weighted more toward the low pay sectors, whereas in the public service there is a large concentration of females in sectors with above average levels of earnings (e.g. health and education). Provided each group share similar characteristics (i.e. education, age, etc.) this may explain some of the variation between women in the public service and private sector.
5.48 The precise level of the estimated public service premium is somewhat sensitive to the set of controls that is included. In particular, omitting either the union membership or occupation controls tends to increase the estimated average public service premium by about six percentage points (see Appendix F). Taking the example of union membership, union members earn more on average and union representation is strong in the public service. Omitting the union membership variable would lead this extra premium to be attributed to public service employment. The premium for union membership could be attributed to the bene�ts of collective bargaining, particularly in the case of lower paid employees. It should also be noted that the relative public service premium across the earnings distribution, which we discuss in Appendix F, is not sensitive to inclusion of these variables.
Figure 5.7: Average Public-Private Earnings Gap, 2003-2014
30%
25%
20%
15%
10%
5%
0%
-5%
-10%2003 2006 2007 2009 2010 2011 2012 2013 2014
PU
BLI
C S
ER
VIC
E E
AR
NIN
GS
PR
EM
UIM
All Employees Males Females Series Break
Source: PSPC workings
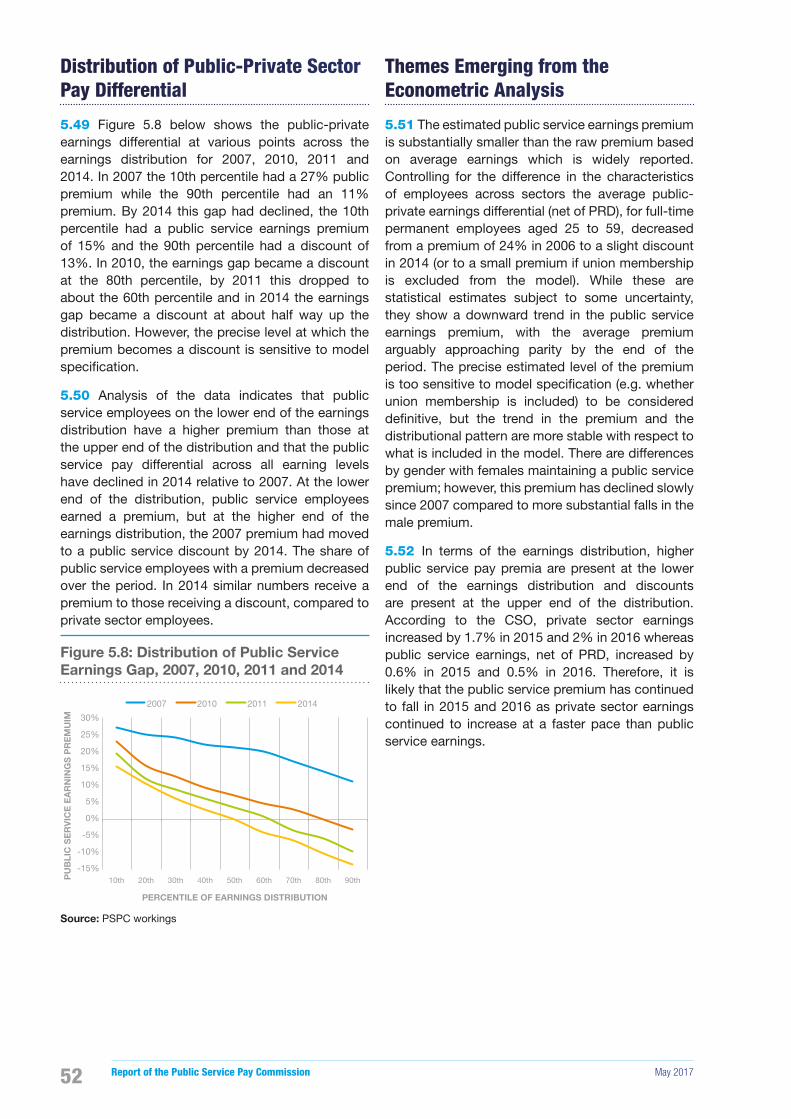
Report of the Public Service Pay Commission May 201752
Distribution of Public-Private Sector Pay Differential
5.49 Figure 5.8 below shows the public-private earnings differential at various points across the earnings distribution for 2007, 2010, 2011 and 2014. In 2007 the 10th percentile had a 27% public premium while the 90th percentile had an 11% premium. By 2014 this gap had declined, the 10th percentile had a public service earnings premium of 15% and the 90th percentile had a discount of 13%. In 2010, the earnings gap became a discount at the 80th percentile, by 2011 this dropped to about the 60th percentile and in 2014 the earnings gap became a discount at about half way up the distribution. However, the precise level at which the premium becomes a discount is sensitive to model speci�cation.
5.50 Analysis of the data indicates that public service employees on the lower end of the earnings distribution have a higher premium than those at the upper end of the distribution and that the public service pay differential across all earning levels have declined in 2014 relative to 2007. At the lower end of the distribution, public service employees earned a premium, but at the higher end of the earnings distribution, the 2007 premium had moved to a public service discount by 2014. The share of public service employees with a premium decreased over the period. In 2014 similar numbers receive a premium to those receiving a discount, compared to private sector employees.
Figure 5.8: Distribution of Public Service Earnings Gap, 2007, 2010, 2011 and 2014
30%
25%
20%
15%
10%
5%
0%
-5%
-10%
-15%10th 20th 30th 40th 50th 60th 70th 80th 90thP
UB
LIC
SE
RV
ICE
EA
RN
ING
S P
RE
MU
IM
PERCENTILE OF EARNINGS DISTRIBUTION
2007 2010 2011 2014
Source: PSPC workings
Themes Emerging from the Econometric Analysis
5.51 The estimated public service earnings premium is substantially smaller than the raw premium based on average earnings which is widely reported. Controlling for the difference in the characteristics of employees across sectors the average public-private earnings differential (net of PRD), for full-time permanent employees aged 25 to 59, decreased from a premium of 24% in 2006 to a slight discount in 2014 (or to a small premium if union membership is excluded from the model). While these are statistical estimates subject to some uncertainty, they show a downward trend in the public service earnings premium, with the average premium arguably approaching parity by the end of the period. The precise estimated level of the premium is too sensitive to model speci�cation (e.g. whether union membership is included) to be considered de�nitive, but the trend in the premium and the distributional pattern are more stable with respect to what is included in the model. There are differences by gender with females maintaining a public service premium; however, this premium has declined slowly since 2007 compared to more substantial falls in the male premium.
5.52 In terms of the earnings distribution, higher public service pay premia are present at the lower end of the earnings distribution and discounts are present at the upper end of the distribution. According to the CSO, private sector earnings increased by 1.7% in 2015 and 2% in 2016 whereas public service earnings, net of PRD, increased by 0.6% in 2015 and 0.5% in 2016. Therefore, it is likely that the public service premium has continued to fall in 2015 and 2016 as private sector earnings continued to increase at a faster pace than public service earnings.
May 2017 Report of the Public Service Pay Commission 53
Chapter 5 Conclusions
5.53 In 2007, the Benchmarking Body concluded (with a number of exceptions) that on a job for job basis, pay levels in the public service were at least as high as the private sector.
5.54 The responses of private sector and public service employers to the economic crisis varied. In the private sector demand for goods and services reduced, leading to a decline in demand for labour with private sector employment levels declining from 1.37 million in 2008 to 1.17 million in 2011. In the public service demand for labour rose due to demographic trends and an increase in demand for certain services (e.g. social welfare). This, along with the conditions set out in the Public Service Stability Agreements resulted in a slower decline in public service numbers and a more severe but progressive decline in earnings for public service employees compared to private sector employees who remained in employment. One of the effects of the FEMPI legislation has been a reduction in the differentials between different income cohorts of public service employees. It is understood that this was done in part as a measure of social solidarity rather than on the basis of any analysis of relative changes in job responsibilities. As the FEMPI measures continue to be unwound, the issue of the relative pay differentials between different cohorts will need to be considered.
5.55 As the economy emerged from the recession, private sector earnings and employment have recovered at a faster rate than the public service. The changes in public service and private sector earnings prior to 2014 have resulted in a decline in the public-private earnings premium and for higher income groups the premium has shifted to a discount. It is likely that the premium has declined further in the last two years because private sector earnings increased at a faster rate than the public service. According to the CSO private sector earnings increased by 1.7% in 2015 and 2% in 2016. Whereas public service earnings, net of PRD, increased by 0.6% in 2015 and 0.5% in 2016. Pay settlement data from CIPD and IRN indicates that across the private sector in recent years pay increases have been in the range of 1.5% to 2.5% annually, depending on the sector and the employer’s ability to pay.
5.56 Internationally, earnings in the Irish public administration and defence, education and human health and social work sectors rank among the highest in similar EU and EFTA countries in 2014. However, the methodological differences in international data outside of the EU and data limitations in EU data, speci�cally the difference in what was estimated for Eurostat in 2014 and the Census 2016 results, make it dif�cult to draw de�nitive conclusions on international earnings comparisons. The literature on international public-private sector earnings differentials �nds that public sector employees are, on average, older, more educated and more likely to occupy managerial positions than private sector employees, and thus tend to earn higher levels because their characteristics normally bring higher-than-average earnings. In an Irish context the EU Commission analysis, based on 2010 data, suggests that the public-private pay premium is amongst the highest of the 21 EU countries considered. More recent analysis based solely on Irish data suggest the Irish public service premium has declined since 2010.
5.57 Results shown earlier in this chapter, (e.g. Figure 5.8) imply that on average public servants receive signi�cantly lower gains in earnings for each additional year of experience than do their counterparts with similar backgrounds in the private sector. This pattern seems to have persisted for a considerable time. One interpretation would be that public service employment offers better earnings for those in low paid occupations or at the start of their careers, in exchange for slower earnings progression and thus lower pay for those with more experience and seniority.
5.58 While this chapter focuses speci�cally on earning rates and movements, a full comparison of public service and private sector remuneration levels needs to take into account the relative value of public service and private sector pensions and security of tenure, where appropriate. These components are covered separately in this report.

Report of the Public Service Pay Commission May 201754

May 2017 Report of the Public Service Pay Commission 55
Chapter 6:
Recruitment and Retention in the Public Service

Report of the Public Service Pay Commission May 201756
6.1 Our terms of reference require the Commission to have regard to evidence of recruitment and retention trends within the public service. This chapter firstly provides an overview of public service numbers since 2008, including the period since the introduction of the moratorium on recruitment and promotion in March 2009. The second part of the chapter sets out a brief summary of some of the issues raised in submissions received by the Commission. The third part of the chapter focuses on sectoral information regarding recruitment since the end of the moratorium. The fourth part of the chapter looks at retention rates in the public service and as this data is not readily available across the sectors, examines data produced by the CSO on job churn across broad sectors to see what information this can provide on retention. The final part of the chapter sets out concluding observations.
6.2 The Commission has received submissions and has met with a number of interested parties in order to give full consideration to this aspect of the terms of reference. The Commission also sought supplementary information in order to further explore this subject. Data on recruitment and retention can help cast light on labour market conditions. In particular, signi�cant dif�culties in recruiting and retaining staff may signal that compensation or other job characteristics are not adequate to maintain the desired level and quality of staf�ng in an area. Recruitment and retention may also affect other labour market indicators. For example, low recruitment or high net turnover in the recent past will tend to leave an imprint on current levels of staf�ng, making it important to be aware of recruitment and retention trends when interpreting data on current staf�ng shortages or surpluses.
Public Service Numbers
6.3 In March 2009, the Government introduced a moratorium on recruitment and promotion in the public service in response to the severe �scal and economic challenges which the country faced following the 2008 banking crisis. During the period 2008 to 2013 public service numbers fell from a peak of more than 320,000 whole time equivalent staff (WTE) numbers in 2008 to a low of 288,200 WTE in the fourth quarter of 2013, a reduction of approximately 10%. Budget 2015 saw a formal end to the moratorium and a resumption of targeted recruitment in the public service. Since 2013 public service numbers have increased by some 18,350 WTE, with the largest increases in the education and health sectors. Details of serving numbers by sector from Q4 2008 to Q4 2016 are set out in Table 6.1.
Chapter 6: Recruitment and Retention in the Public Service
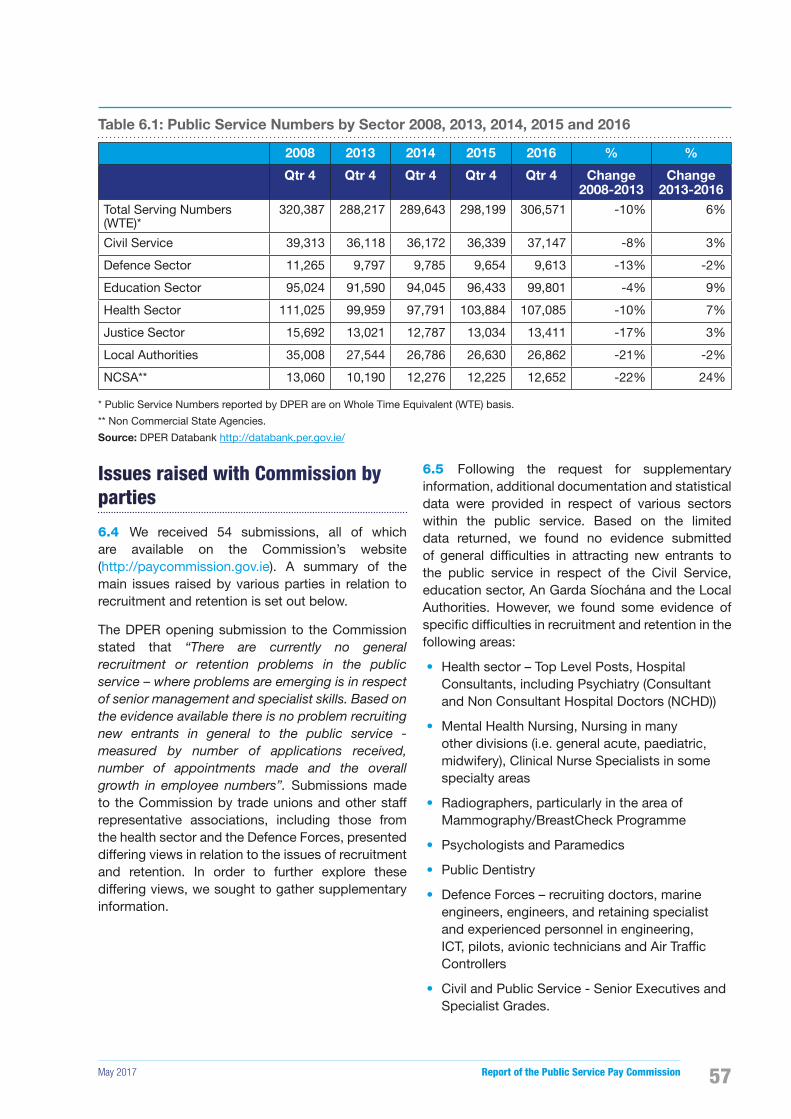
May 2017 Report of the Public Service Pay Commission 57
Table 6.1: Public Service Numbers by Sector 2008, 2013, 2014, 2015 and 2016
2008 2013 2014 2015 2016 % %
Qtr 4 Qtr 4 Qtr 4 Qtr 4 Qtr 4 Change 2008-2013
Change 2013-2016
Total Serving Numbers (WTE)*
320,387 288,217 289,643 298,199 306,571 -10% 6%
Civil Service 39,313 36,118 36,172 36,339 37,147 -8% 3%
Defence Sector 11,265 9,797 9,785 9,654 9,613 -13% -2%
Education Sector 95,024 91,590 94,045 96,433 99,801 -4% 9%
Health Sector 111,025 99,959 97,791 103,884 107,085 -10% 7%
Justice Sector 15,692 13,021 12,787 13,034 13,411 -17% 3%
Local Authorities 35,008 27,544 26,786 26,630 26,862 -21% -2%
NCSA** 13,060 10,190 12,276 12,225 12,652 -22% 24%
* Public Service Numbers reported by DPER are on Whole Time Equivalent (WTE) basis.
** Non Commercial State Agencies.
Source: DPER Databank http://databank.per.gov.ie/
Issues raised with Commission by parties
6.4 We received 54 submissions, all of which are available on the Commission’s website (http://paycommission.gov.ie). A summary of the main issues raised by various parties in relation to recruitment and retention is set out below.
The DPER opening submission to the Commission stated that “There are currently no general recruitment or retention problems in the public service – where problems are emerging is in respect of senior management and specialist skills. Based on the evidence available there is no problem recruiting new entrants in general to the public service - measured by number of applications received, number of appointments made and the overall growth in employee numbers”. Submissions made to the Commission by trade unions and other staff representative associations, including those from the health sector and the Defence Forces, presented differing views in relation to the issues of recruitment and retention. In order to further explore these differing views, we sought to gather supplementary information.
6.5 Following the request for supplementary information, additional documentation and statistical data were provided in respect of various sectors within the public service. Based on the limited data returned, we found no evidence submitted of general dif�culties in attracting new entrants to the public service in respect of the Civil Service, education sector, An Garda Síochána and the Local Authorities. However, we found some evidence of speci�c dif�culties in recruitment and retention in the following areas:
• Health sector – Top Level Posts, Hospital Consultants, including Psychiatry (Consultant and Non Consultant Hospital Doctors (NCHD))
• Mental Health Nursing, Nursing in many other divisions (i.e. general acute, paediatric, midwifery), Clinical Nurse Specialists in some specialty areas
• Radiographers, particularly in the area of Mammography/BreastCheck Programme
• Psychologists and Paramedics
• Public Dentistry
• Defence Forces – recruiting doctors, marine engineers, engineers, and retaining specialist and experienced personnel in engineering, ICT, pilots, avionic technicians and Air Traf�c Controllers
• Civil and Public Service - Senior Executives and Specialist Grades.
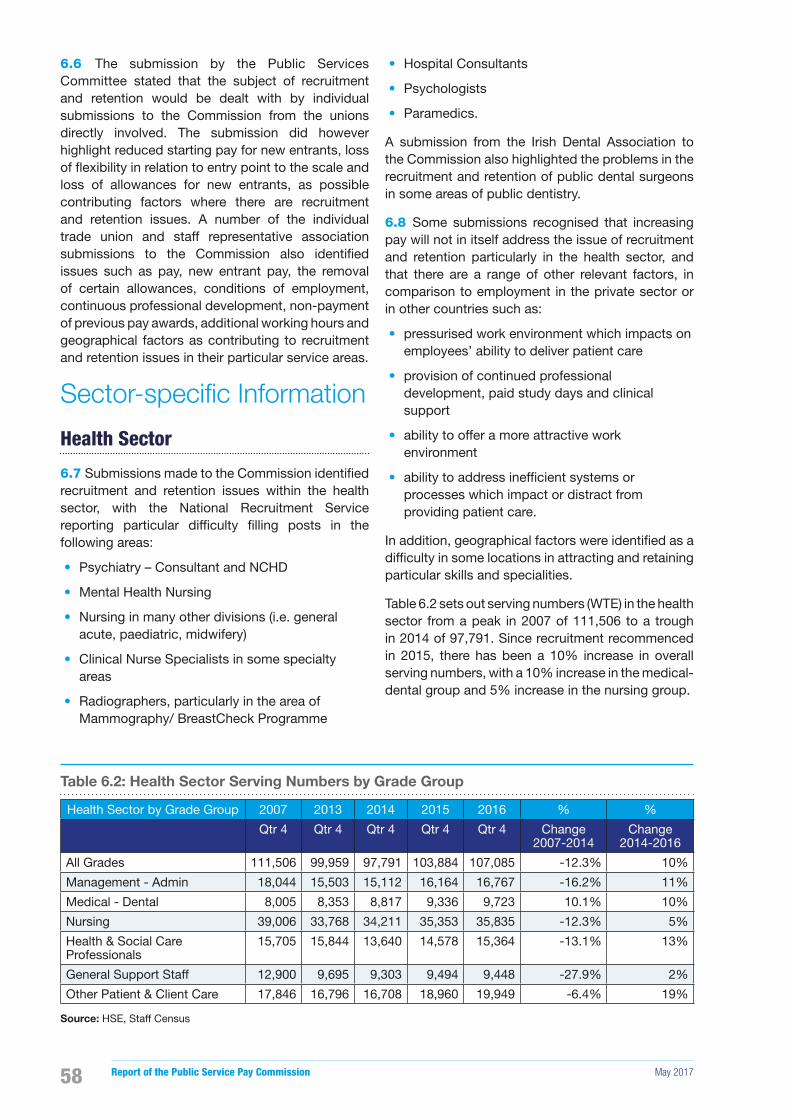
Report of the Public Service Pay Commission May 201758
6.6 The submission by the Public Services Committee stated that the subject of recruitment and retention would be dealt with by individual submissions to the Commission from the unions directly involved. The submission did however highlight reduced starting pay for new entrants, loss of �exibility in relation to entry point to the scale and loss of allowances for new entrants, as possible contributing factors where there are recruitment and retention issues. A number of the individual trade union and staff representative association submissions to the Commission also identi�ed issues such as pay, new entrant pay, the removal of certain allowances, conditions of employment, continuous professional development, non-payment of previous pay awards, additional working hours and geographical factors as contributing to recruitment and retention issues in their particular service areas.
Sector-specific Information
Health Sector
6.7 Submissions made to the Commission identi�ed recruitment and retention issues within the health sector, with the National Recruitment Service reporting particular dif�culty �lling posts in the following areas:
• Psychiatry – Consultant and NCHD
• Mental Health Nursing
• Nursing in many other divisions (i.e. general acute, paediatric, midwifery)
• Clinical Nurse Specialists in some specialty areas
• Radiographers, particularly in the area of Mammography/ BreastCheck Programme
• Hospital Consultants
• Psychologists
• Paramedics.
A submission from the Irish Dental Association to the Commission also highlighted the problems in the recruitment and retention of public dental surgeons in some areas of public dentistry.
6.8 Some submissions recognised that increasing pay will not in itself address the issue of recruitment and retention particularly in the health sector, and that there are a range of other relevant factors, in comparison to employment in the private sector or in other countries such as:
• pressurised work environment which impacts on employees’ ability to deliver patient care
• provision of continued professional development, paid study days and clinical support
• ability to offer a more attractive work environment
• ability to address inef�cient systems or processes which impact or distract from providing patient care.
In addition, geographical factors were identi�ed as a dif�culty in some locations in attracting and retaining particular skills and specialities.
Table 6.2 sets out serving numbers (WTE) in the health sector from a peak in 2007 of 111,506 to a trough in 2014 of 97,791. Since recruitment recommenced in 2015, there has been a 10% increase in overall serving numbers, with a 10% increase in the medical-dental group and 5% increase in the nursing group.
Table 6.2: Health Sector Serving Numbers by Grade Group
Health Sector by Grade Group 2007 2013 2014 2015 2016 % %
Qtr 4 Qtr 4 Qtr 4 Qtr 4 Qtr 4 Change 2007-2014
Change 2014-2016
All Grades 111,506 99,959 97,791 103,884 107,085 -12.3% 10%
Management - Admin 18,044 15,503 15,112 16,164 16,767 -16.2% 11%
Medical - Dental 8,005 8,353 8,817 9,336 9,723 10.1% 10%
Nursing 39,006 33,768 34,211 35,353 35,835 -12.3% 5%
Health & Social Care Professionals
15,705 15,844 13,640 14,578 15,364 -13.1% 13%
General Support Staff 12,900 9,695 9,303 9,494 9,448 -27.9% 2%
Other Patient & Client Care 17,846 16,796 16,708 18,960 19,949 -6.4% 19%
Source: HSE, Staff Census
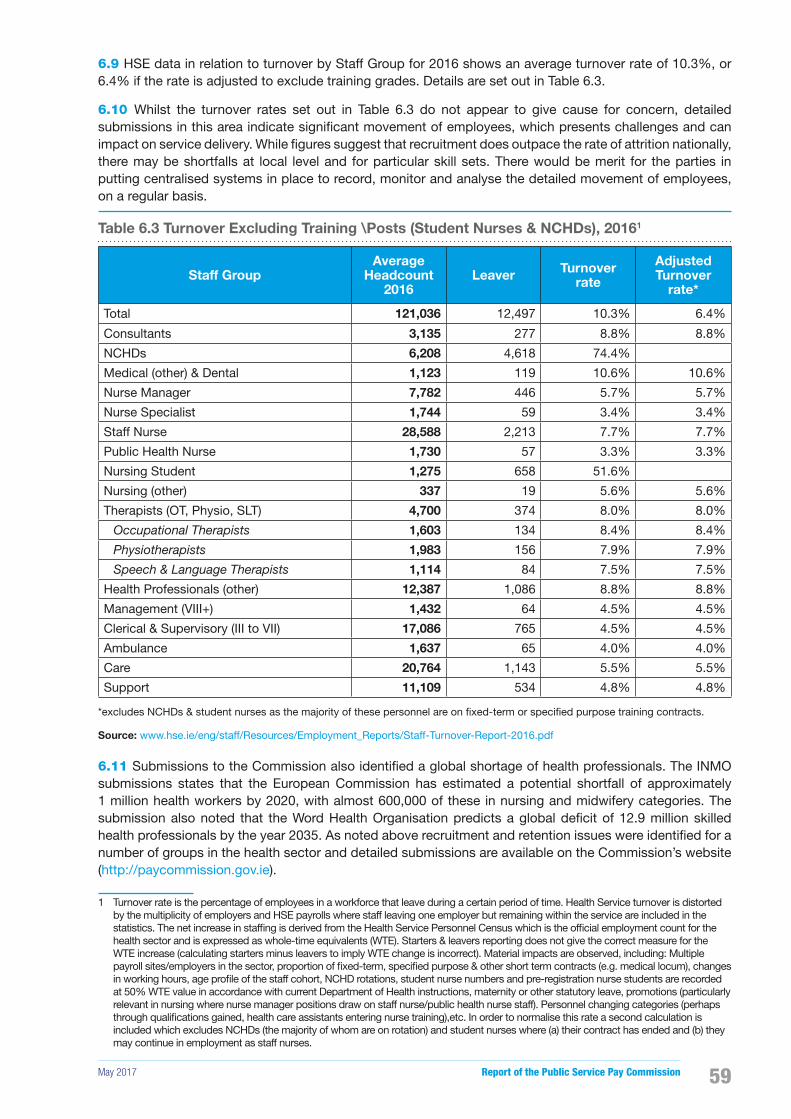
May 2017 Report of the Public Service Pay Commission 59
6.9 HSE data in relation to turnover by Staff Group for 2016 shows an average turnover rate of 10.3%, or 6.4% if the rate is adjusted to exclude training grades. Details are set out in Table 6.3.
6.10 Whilst the turnover rates set out in Table 6.3 do not appear to give cause for concern, detailed submissions in this area indicate signi�cant movement of employees, which presents challenges and can impact on service delivery. While �gures suggest that recruitment does outpace the rate of attrition nationally, there may be shortfalls at local level and for particular skill sets. There would be merit for the parties in putting centralised systems in place to record, monitor and analyse the detailed movement of employees, on a regular basis.
Table 6.3 Turnover Excluding Training \Posts (Student Nurses & NCHDs), 20161
Staff GroupAverage
Headcount 2016
Leaver Turnover rate
Adjusted Turnover
rate*
Total 121,036 12,497 10.3% 6.4%
Consultants 3,135 277 8.8% 8.8%
NCHDs 6,208 4,618 74.4%
Medical (other) & Dental 1,123 119 10.6% 10.6%
Nurse Manager 7,782 446 5.7% 5.7%
Nurse Specialist 1,744 59 3.4% 3.4%
Staff Nurse 28,588 2,213 7.7% 7.7%
Public Health Nurse 1,730 57 3.3% 3.3%
Nursing Student 1,275 658 51.6%
Nursing (other) 337 19 5.6% 5.6%
Therapists (OT, Physio, SLT) 4,700 374 8.0% 8.0%
Occupational Therapists 1,603 134 8.4% 8.4%
Physiotherapists 1,983 156 7.9% 7.9%
Speech & Language Therapists 1,114 84 7.5% 7.5%
Health Professionals (other) 12,387 1,086 8.8% 8.8%
Management (VIII+) 1,432 64 4.5% 4.5%
Clerical & Supervisory (III to VII) 17,086 765 4.5% 4.5%
Ambulance 1,637 65 4.0% 4.0%
Care 20,764 1,143 5.5% 5.5%
Support 11,109 534 4.8% 4.8%
*excludes NCHDs & student nurses as the majority of these personnel are on �xed-term or speci�ed purpose training contracts.
Source: www.hse.ie/eng/staff/Resources/Employment_Reports/Staff-Turnover-Report-2016.pdf
6.11 Submissions to the Commission also identi�ed a global shortage of health professionals. The INMO submissions states that the European Commission has estimated a potential shortfall of approximately 1 million health workers by 2020, with almost 600,000 of these in nursing and midwifery categories. The submission also noted that the Word Health Organisation predicts a global de�cit of 12.9 million skilled health professionals by the year 2035. As noted above recruitment and retention issues were identi�ed for a number of groups in the health sector and detailed submissions are available on the Commission’s website (http://paycommission.gov.ie).
1 Turnover rate is the percentage of employees in a workforce that leave during a certain period of time. Health Service turnover is distorted by the multiplicity of employers and HSE payrolls where staff leaving one employer but remaining within the service are included in the statistics. The net increase in staf�ng is derived from the Health Service Personnel Census which is the of�cial employment count for the health sector and is expressed as whole-time equivalents (WTE). Starters & leavers reporting does not give the correct measure for the WTE increase (calculating starters minus leavers to imply WTE change is incorrect). Material impacts are observed, including: Multiple payroll sites/employers in the sector, proportion of �xed-term, speci�ed purpose & other short term contracts (e.g. medical locum), changes in working hours, age pro�le of the staff cohort, NCHD rotations, student nurse numbers and pre-registration nurse students are recorded at 50% WTE value in accordance with current Department of Health instructions, maternity or other statutory leave, promotions (particularly relevant in nursing where nurse manager positions draw on staff nurse/public health nurse staff). Personnel changing categories (perhaps through quali�cations gained, health care assistants entering nurse training),etc. In order to normalise this rate a second calculation is included which excludes NCHDs (the majority of whom are on rotation) and student nurses where (a) their contract has ended and (b) they may continue in employment as staff nurses.

Report of the Public Service Pay Commission May 201760
Defence Forces
6.12 We were informed that the Defence Forces ran recruitment competitions for enlisted personnel in 2012, 2014, 2015 and 2016. Based on the number of applications for these recent campaigns there does not appear to be any evidence of problems in attracting new entrants to the Defence Forces. Tables 6.4 and 6.5 set out the numbers of applications and inductions from 2012 to 2016.
6.13 The submission from the Department of Defence and DPER states that the Defence Forces are currently experiencing a signi�cant exit of trained and experienced personnel due to the improving economy and the increased opportunities available to further develop their careers, to achieve higher levels of remuneration than those available within the service and to bene�t from better overall terms and conditions. It also states that the rate of exits imposes signi�cant resource demands in terms of the increases in recruitment, induction and training with the loss of trained personnel taking a number of years to make up, even where basic recruitment is proceeding. The submission from RACO highlighted the problems based on their member’s experiences in dealing with the challenges presented as a result of recruitment and retention dif�culties across the Defence Forces. The submission stated that exit interviews with of�cers voluntarily exiting the Defence Forces con�rmed that many specialist of�cers including Naval Service Operations, Marine Engineers, Pilots, Air Traf�c Controllers, ICT and Engineers are exiting to higher paid salaries and bene�ts in the private sector.
Table 6.4: Number of Applications, 2012-2016
Applications per Annum
2012 2014 2015 2016
10,155 7,295 5,296 4,590
Table 6.5: Number of Inductions from, 2013-2016
2013 2014 2015 2016Total Inductions
404 506 406 690
Induction* 353 443 307 590
* General Service Inductions Only
Source: Department of Defence & DPER
6.14 Table 6.6 sets out the numbers of leavers of new entrant staff over the last three years.
Table 6.6 Rates of Attrition Among New Entrant Staff, 2013-2016
2013 2014 2015 2016Total Inductions 404 506 406 690
Induction* 353 443 307 590
Discharge (Recruits)
77 107 62 128
As % 21.8% 24.2% 20.2% 21.6%
* General Service Inductions Only
Source: Department of Defence & DPER
Civil Service
6.15 The Public Appointment Service (PAS) is the main recruiter for the Civil Service and has reported that in general, there is no dif�culty in recruiting either internal or external candidates to the Civil Service up to the grade of Principal Of�cer. The volume of applications for the competitions advertised over the last number of years supports this view. Table 6.7 sets out recruitment activity in the Civil Service in 2008 and 2015.
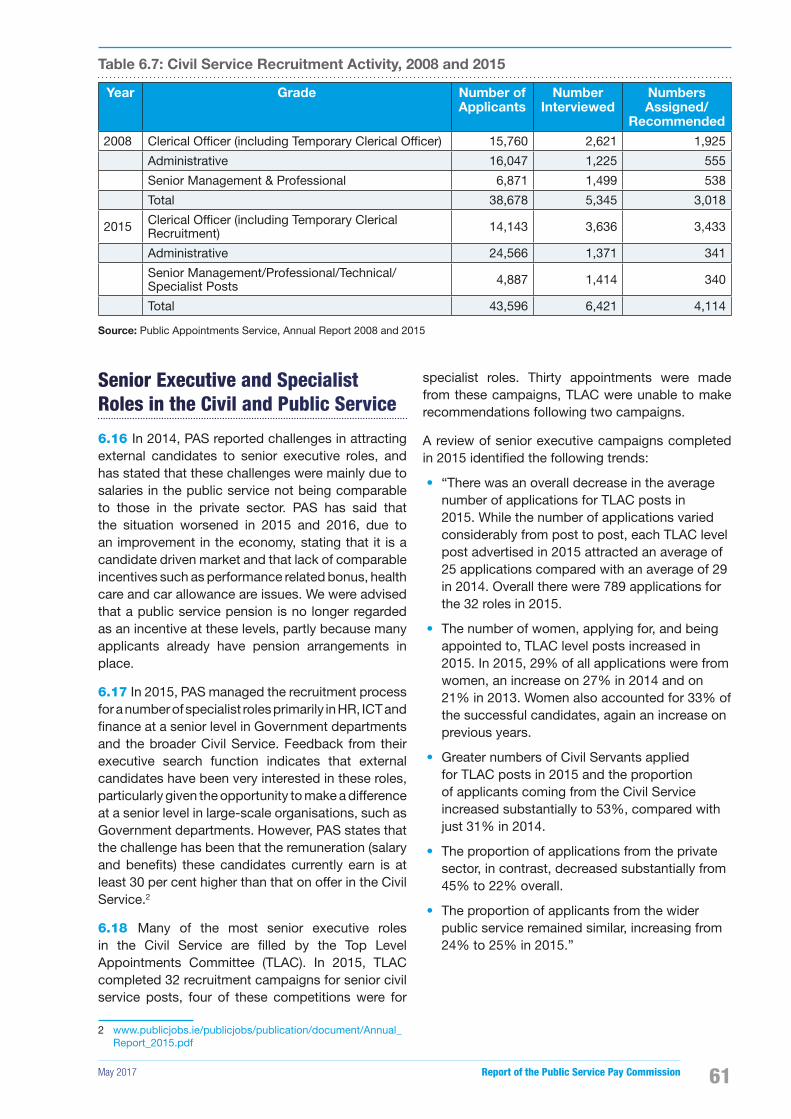
May 2017 Report of the Public Service Pay Commission 61
Table 6.7: Civil Service Recruitment Activity, 2008 and 2015
Year Grade Number of Applicants
Number Interviewed
Numbers Assigned/
Recommended2008 Clerical Of�cer (including Temporary Clerical Of�cer) 15,760 2,621 1,925
Administrative 16,047 1,225 555
Senior Management & Professional 6,871 1,499 538
Total 38,678 5,345 3,018
2015 Clerical Of�cer (including Temporary Clerical Recruitment) 14,143 3,636 3,433
Administrative 24,566 1,371 341
Senior Management/Professional/Technical/ Specialist Posts 4,887 1,414 340
Total 43,596 6,421 4,114
Source: Public Appointments Service, Annual Report 2008 and 2015
Senior Executive and Specialist Roles in the Civil and Public Service
6.16 In 2014, PAS reported challenges in attracting external candidates to senior executive roles, and has stated that these challenges were mainly due to salaries in the public service not being comparable to those in the private sector. PAS has said that the situation worsened in 2015 and 2016, due to an improvement in the economy, stating that it is a candidate driven market and that lack of comparable incentives such as performance related bonus, health care and car allowance are issues. We were advised that a public service pension is no longer regarded as an incentive at these levels, partly because many applicants already have pension arrangements in place.
6.17 In 2015, PAS managed the recruitment process for a number of specialist roles primarily in HR, ICT and �nance at a senior level in Government departments and the broader Civil Service. Feedback from their executive search function indicates that external candidates have been very interested in these roles, particularly given the opportunity to make a difference at a senior level in large-scale organisations, such as Government departments. However, PAS states that the challenge has been that the remuneration (salary and bene�ts) these candidates currently earn is at least 30 per cent higher than that on offer in the Civil Service.2
6.18 Many of the most senior executive roles in the Civil Service are �lled by the Top Level Appointments Committee (TLAC). In 2015, TLAC completed 32 recruitment campaigns for senior civil service posts, four of these competitions were for
2 www.publicjobs.ie/publicjobs/publication/document/Annual_Report_2015.pdf
specialist roles. Thirty appointments were made from these campaigns, TLAC were unable to make recommendations following two campaigns.
A review of senior executive campaigns completed in 2015 identi�ed the following trends:
• “There was an overall decrease in the average number of applications for TLAC posts in 2015. While the number of applications varied considerably from post to post, each TLAC level post advertised in 2015 attracted an average of 25 applications compared with an average of 29 in 2014. Overall there were 789 applications for the 32 roles in 2015.
• The number of women, applying for, and being appointed to, TLAC level posts increased in 2015. In 2015, 29% of all applications were from women, an increase on 27% in 2014 and on 21% in 2013. Women also accounted for 33% of the successful candidates, again an increase on previous years.
• Greater numbers of Civil Servants applied for TLAC posts in 2015 and the proportion of applicants coming from the Civil Service increased substantially to 53%, compared with just 31% in 2014.
• The proportion of applications from the private sector, in contrast, decreased substantially from 45% to 22% overall.
• The proportion of applicants from the wider public service remained similar, increasing from 24% to 25% in 2015.”
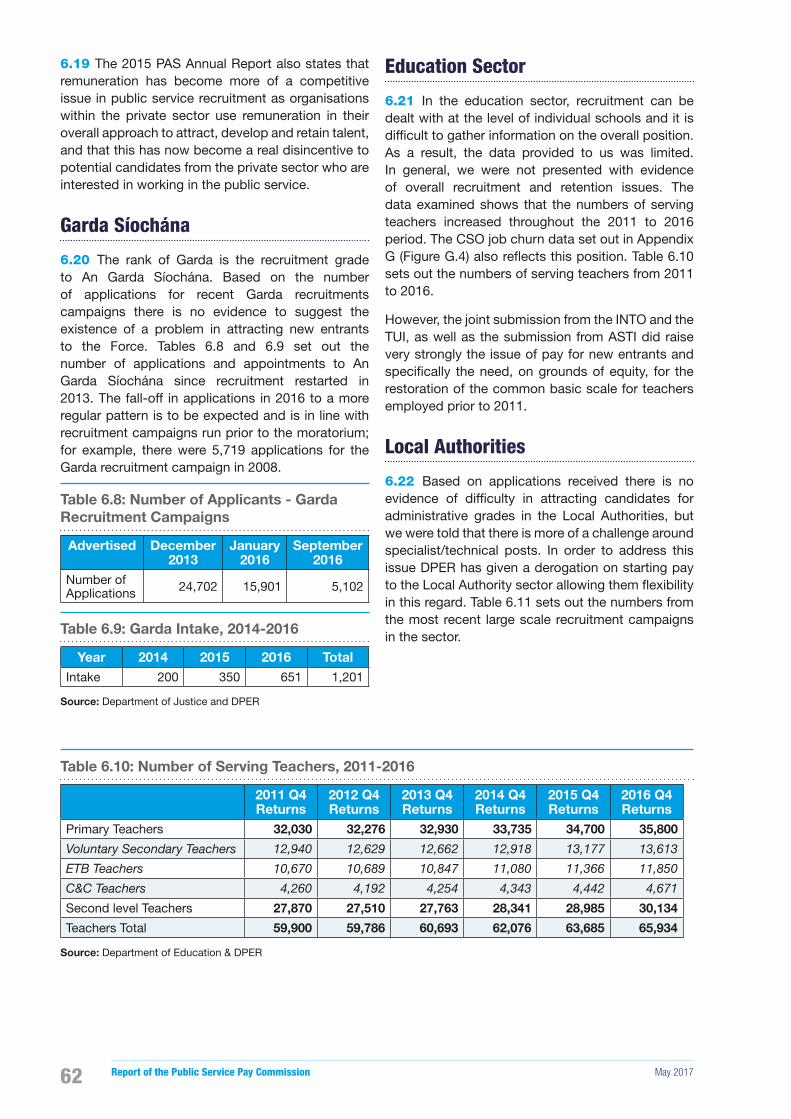
Report of the Public Service Pay Commission May 201762
6.19 The 2015 PAS Annual Report also states that remuneration has become more of a competitive issue in public service recruitment as organisations within the private sector use remuneration in their overall approach to attract, develop and retain talent, and that this has now become a real disincentive to potential candidates from the private sector who are interested in working in the public service.
Garda Síochána
6.20 The rank of Garda is the recruitment grade to An Garda Síochána. Based on the number of applications for recent Garda recruitments campaigns there is no evidence to suggest the existence of a problem in attracting new entrants to the Force. Tables 6.8 and 6.9 set out the number of applications and appointments to An Garda Síochána since recruitment restarted in 2013. The fall-off in applications in 2016 to a more regular pattern is to be expected and is in line with recruitment campaigns run prior to the moratorium; for example, there were 5,719 applications for the Garda recruitment campaign in 2008.
Table 6.8: Number of Applicants - Garda Recruitment Campaigns
Advertised December 2013
January 2016
September 2016
Number of Applications 24,702 15,901 5,102
Table 6.9: Garda Intake, 2014-2016
Year 2014 2015 2016 TotalIntake 200 350 651 1,201
Source: Department of Justice and DPER
Education Sector
6.21 In the education sector, recruitment can be dealt with at the level of individual schools and it is dif�cult to gather information on the overall position. As a result, the data provided to us was limited. In general, we were not presented with evidence of overall recruitment and retention issues. The data examined shows that the numbers of serving teachers increased throughout the 2011 to 2016 period. The CSO job churn data set out in Appendix G (Figure G.4) also re�ects this position. Table 6.10 sets out the numbers of serving teachers from 2011 to 2016.
However, the joint submission from the INTO and the TUI, as well as the submission from ASTI did raise very strongly the issue of pay for new entrants and speci�cally the need, on grounds of equity, for the restoration of the common basic scale for teachers employed prior to 2011.
Local Authorities
6.22 Based on applications received there is no evidence of dif�culty in attracting candidates for administrative grades in the Local Authorities, but we were told that there is more of a challenge around specialist/technical posts. In order to address this issue DPER has given a derogation on starting pay to the Local Authority sector allowing them �exibility in this regard. Table 6.11 sets out the numbers from the most recent large scale recruitment campaigns in the sector.
Table 6.10: Number of Serving Teachers, 2011-2016
2011 Q4 Returns
2012 Q4 Returns
2013 Q4 Returns
2014 Q4 Returns
2015 Q4 Returns
2016 Q4 Returns
Primary Teachers 32,030 32,276 32,930 33,735 34,700 35,800
Voluntary Secondary Teachers 12,940 12,629 12,662 12,918 13,177 13,613
ETB Teachers 10,670 10,689 10,847 11,080 11,366 11,850
C&C Teachers 4,260 4,192 4,254 4,343 4,442 4,671
Second level Teachers 27,870 27,510 27,763 28,341 28,985 30,134
Teachers Total 59,900 59,786 60,693 62,076 63,685 65,934
Source: Department of Education & DPER
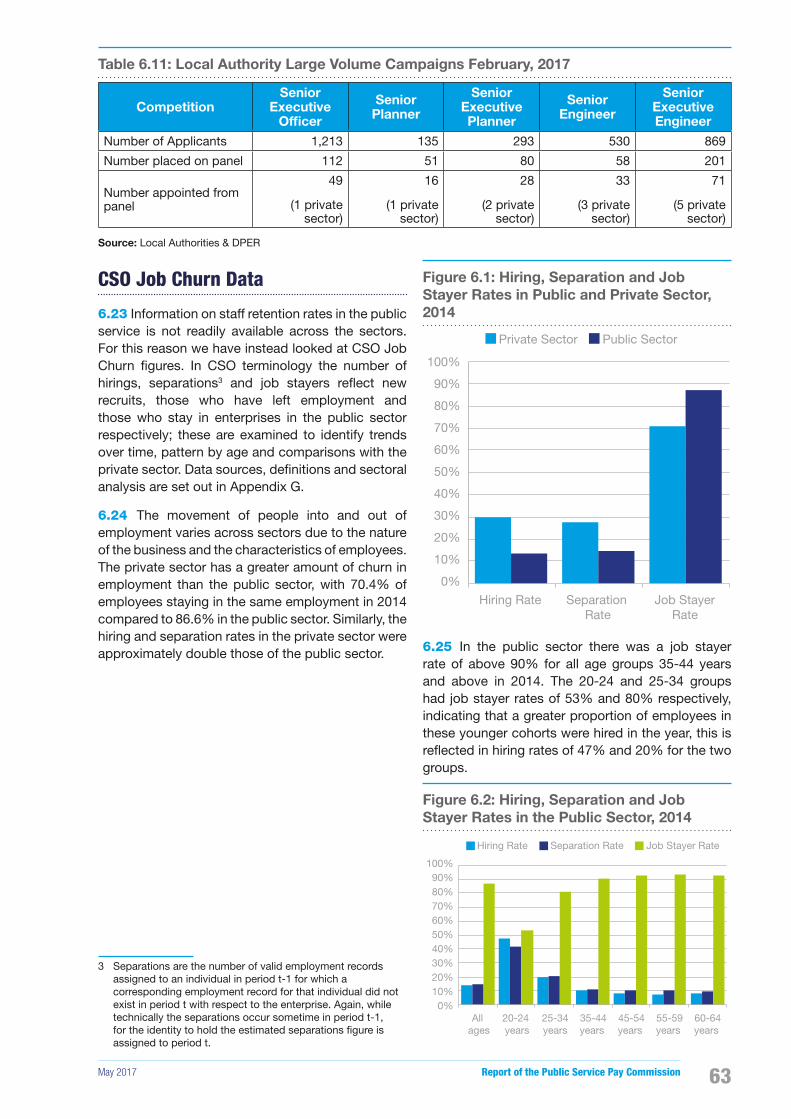
May 2017 Report of the Public Service Pay Commission 63
Table 6.11: Local Authority Large Volume Campaigns February, 2017
CompetitionSenior
Executive Officer
Senior Planner
Senior Executive Planner
Senior Engineer
Senior Executive Engineer
Number of Applicants 1,213 135 293 530 869
Number placed on panel 112 51 80 58 201
Number appointed from panel
49
(1 private sector)
16
(1 private sector)
28
(2 private sector)
33
(3 private sector)
71
(5 private sector)
Source: Local Authorities & DPER
CSO Job Churn Data
6.23 Information on staff retention rates in the public service is not readily available across the sectors. For this reason we have instead looked at CSO Job Churn �gures. In CSO terminology the number of hirings, separations3 and job stayers re�ect new recruits, those who have left employment and those who stay in enterprises in the public sector respectively; these are examined to identify trends over time, pattern by age and comparisons with the private sector. Data sources, de�nitions and sectoral analysis are set out in Appendix G.
6.24 The movement of people into and out of employment varies across sectors due to the nature of the business and the characteristics of employees. The private sector has a greater amount of churn in employment than the public sector, with 70.4% of employees staying in the same employment in 2014 compared to 86.6% in the public sector. Similarly, the hiring and separation rates in the private sector were approximately double those of the public sector.
3 Separations are the number of valid employment records assigned to an individual in period t-1 for which a corresponding employment record for that individual did not exist in period t with respect to the enterprise. Again, while technically the separations occur sometime in period t-1, for the identity to hold the estimated separations �gure is assigned to period t.
Figure 6.1: Hiring, Separation and Job Stayer Rates in Public and Private Sector, 2014
100%
90%
80%
70%
60%
50%
40%
30%
20%
10%
0%
Hiring Rate Separation Rate
Job Stayer Rate
Private Sector Public Sector
6.25 In the public sector there was a job stayer rate of above 90% for all age groups 35-44 years and above in 2014. The 20-24 and 25-34 groups had job stayer rates of 53% and 80% respectively, indicating that a greater proportion of employees in these younger cohorts were hired in the year, this is re�ected in hiring rates of 47% and 20% for the two groups.
Figure 6.2: Hiring, Separation and Job Stayer Rates in the Public Sector, 2014
100%90%80%70%60%50%40%30%20%10%
0%All
ages20-24 years
25-34years
35-44years
45-54years
55-59years
60-64years
Hiring Rate Separation Rate Job Stayer Rate
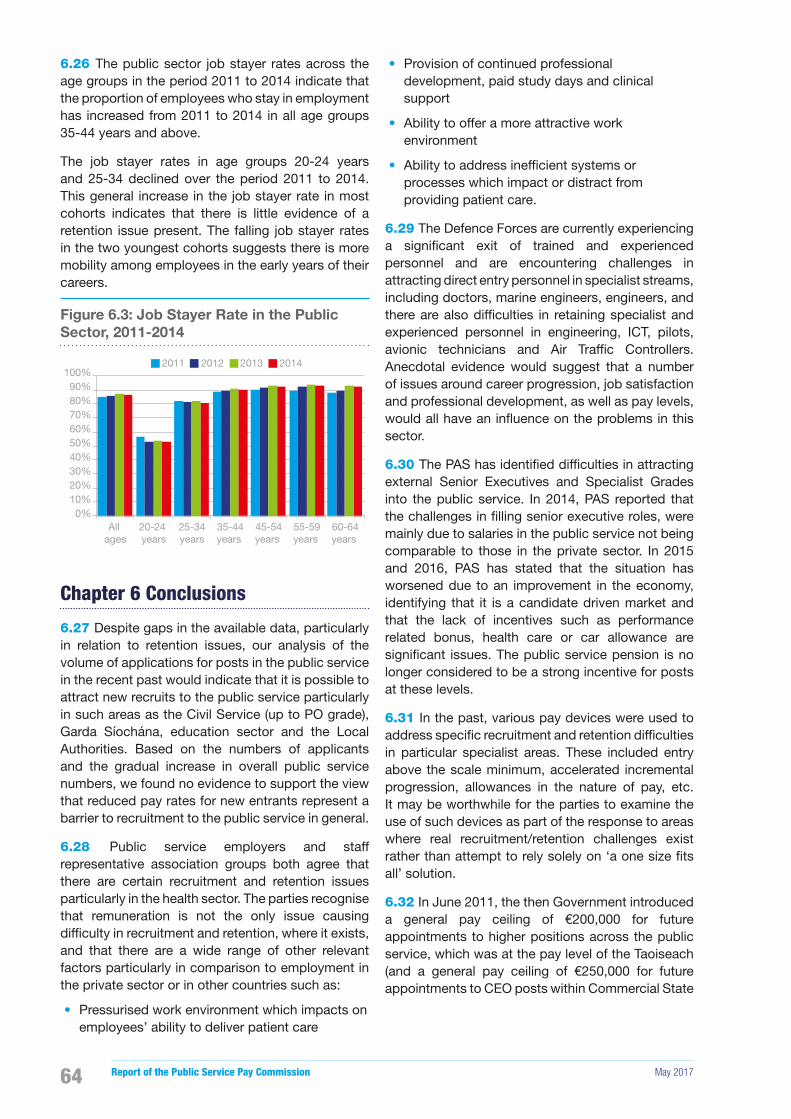
Report of the Public Service Pay Commission May 201764
6.26 The public sector job stayer rates across the age groups in the period 2011 to 2014 indicate that the proportion of employees who stay in employment has increased from 2011 to 2014 in all age groups 35-44 years and above.
The job stayer rates in age groups 20-24 years and 25-34 declined over the period 2011 to 2014. This general increase in the job stayer rate in most cohorts indicates that there is little evidence of a retention issue present. The falling job stayer rates in the two youngest cohorts suggests there is more mobility among employees in the early years of their careers.
Figure 6.3: Job Stayer Rate in the Public Sector, 2011-2014
100%90%80%70%60%50%40%30%20%10%0%
All ages
20-24 years
25-34years
35-44years
45-54years
55-59years
60-64years
2011 2012 2013 2014
Chapter 6 Conclusions
6.27 Despite gaps in the available data, particularly in relation to retention issues, our analysis of the volume of applications for posts in the public service in the recent past would indicate that it is possible to attract new recruits to the public service particularly in such areas as the Civil Service (up to PO grade), Garda Síochána, education sector and the Local Authorities. Based on the numbers of applicants and the gradual increase in overall public service numbers, we found no evidence to support the view that reduced pay rates for new entrants represent a barrier to recruitment to the public service in general.
6.28 Public service employers and staff representative association groups both agree that there are certain recruitment and retention issues particularly in the health sector. The parties recognise that remuneration is not the only issue causing dif�culty in recruitment and retention, where it exists, and that there are a wide range of other relevant factors particularly in comparison to employment in the private sector or in other countries such as:
• Pressurised work environment which impacts on employees’ ability to deliver patient care
• Provision of continued professional development, paid study days and clinical support
• Ability to offer a more attractive work environment
• Ability to address inef�cient systems or processes which impact or distract from providing patient care.
6.29 The Defence Forces are currently experiencing a signi�cant exit of trained and experienced personnel and are encountering challenges in attracting direct entry personnel in specialist streams, including doctors, marine engineers, engineers, and there are also dif�culties in retaining specialist and experienced personnel in engineering, ICT, pilots, avionic technicians and Air Traf�c Controllers. Anecdotal evidence would suggest that a number of issues around career progression, job satisfaction and professional development, as well as pay levels, would all have an in�uence on the problems in this sector.
6.30 The PAS has identi�ed dif�culties in attracting external Senior Executives and Specialist Grades into the public service. In 2014, PAS reported that the challenges in �lling senior executive roles, were mainly due to salaries in the public service not being comparable to those in the private sector. In 2015 and 2016, PAS has stated that the situation has worsened due to an improvement in the economy, identifying that it is a candidate driven market and that the lack of incentives such as performance related bonus, health care or car allowance are signi�cant issues. The public service pension is no longer considered to be a strong incentive for posts at these levels.
6.31 In the past, various pay devices were used to address speci�c recruitment and retention dif�culties in particular specialist areas. These included entry above the scale minimum, accelerated incremental progression, allowances in the nature of pay, etc. It may be worthwhile for the parties to examine the use of such devices as part of the response to areas where real recruitment/retention challenges exist rather than attempt to rely solely on ‘a one size �ts all’ solution.
6.32 In June 2011, the then Government introduced a general pay ceiling of €200,000 for future appointments to higher positions across the public service, which was at the pay level of the Taoiseach (and a general pay ceiling of €250,000 for future appointments to CEO posts within Commercial State
May 2017 Report of the Public Service Pay Commission 65
Agencies)4. Since then, senior levels of public service salary have all been within this cap with resulting compression of salary headroom at these levels. On the issue of setting senior executive pay levels by reference to the pay of of�ceholders, the 2011 Hutton Report on senior level pay in the UK public sector observed that “comparisons between the pay of senior public servants and politicians are invalid. Prime Ministers are not recruited in the same way as senior managers, their pay is not a significant factor in attracting or retaining candidates for their office, and that pay is set in a political process that need not consider the impact on recruitment or retention of high calibre people”5 If there is continued pressure on �lling senior level posts in the Irish public service, it may be appropriate to revisit the basis for the pay ceiling.
6.33 Whilst remuneration was an important factor in the recruitment and retention of talent in the public service, other signi�cant factors emerged such as working conditions and environment, ability to advance, training, size of team supports and lack of autonomy or leadership as playing a prominent role in the retention of individuals in the public service. An example which demotivated leaders and potentially disincentivised succession planning is executive team members earning more than their leader.
6.34 Recruitment may be de�ned as the attraction of talent to an organisation to ensure its overall success. The importance for every organisation, public or private of employing the right person for the right position is well documented. Failure in recruitment may lead to dif�culties and unwanted barriers for any organisation including inappropriate degrees of staf�ng or employee skills (Jones et al., 2006). However, the process of recruitment does not cease with the application of candidature and selection of the appropriate candidates but involves sustaining and retaining the employees that are selected (Silzer and Church, 2010). Talent management should be at the centre of workforce planning within the public service and should set out an organisation’s commitment to recruit, retain, and develop the most talented employees available in the job market. This is particularly important for parts of the public service with an older workforce.
4 The pay of Commercial State Agencies is outside of the remit of the Public Service Pay Commission.
5 Hutton Review of Fair Pay in the public sector, Final Report, March 2011
6.35 The terms of reference of the Commission require that for its initial report the Commission will provide inputs on how the unwinding of the FEMPI legislation should proceed and constrain the Commission from making speci�c recommendations in relation to the remuneration of particular groups of public servants. However, consideration could be given to commissioning a more comprehensive examination of underlying dif�culties in recruitment and retention in those sectors and employment streams where dif�culties are evident.

Report of the Public Service Pay Commission May 201766

May 2017 Report of the Public Service Pay Commission 67
Chapter 7:
Security of Tenure

Report of the Public Service Pay Commission May 201768
7.1 The Commission’s terms of reference provide that in reaching our findings, we shall have regard to security of tenure, where it applies to public servants. This chapter will address the key points made in submissions received by the Commission on that topic.
7.2 The Public Services Committee submitted that all the concessions which it made since the 2010 CPA were motivated primarily by a desire to protect employment and that it would be unacceptable to use this against public servants when considering the value of security of tenure. The Public Services Committee also pointed out that many non-permanent staff are not protected from redundancy and that the signi�cant numbers involved highlight the fact that tenure is now a considerably less signi�cant factor in any external comparison than it was in the past.
7.3 DPER submitted that security of tenure provides a value to public servants not generally available to private sector employees and this needs to be taken into account when considering pay.
7.4 The Commission notes the increased prevalence of �xed term and �xed purpose contracts currently within the public service and accepts that security of tenure is not a feature intrinsic to public service employment or extrinsic to private sector employment. The Commission recognises that public servants who are employed on permanent contracts are generally at lower risk of compulsory redundancy than those in the private sector.
7.5 Some of the trade union and staff associations’ oral submissions to the Commission suggested that security of tenure is now less valued, particularly by younger employees in some sectors as they are considerably more mobile and tend to have ambition toward multiple changes of employment throughout their career including working abroad.
7.6 Security of tenure also has a value to public service employers in seeking, not just to retain highly skilled experienced staff, but also to attract recruits to a career in the public service. Equally, it is recognised that service users have a strong preference to have public services delivered by a stable cohort of staff with the appropriate expertise to deliver quality services. Additionally, high levels of retention and secure employment may also have a value for the employer in circumstances where training is costly and time consuming.
7.7 Security of tenure has a value. Estimating a monetary value for any advantage in job security held by one sector compared to another would be dif�cult. There are many challenges; for example, one would need comparable data on the nature and extent of job security for different occupations; the value of job security probably varies over time and across people; and the value placed on job security by employees is affected by expectations of the future. The Commission has not identi�ed any satisfactory scienti�c evidence which could reasonably be used for assigning a speci�c monetary value to security of tenure in Ireland. This is consistent with the �ndings of the Benchmarking Body in 2007 which considered it appropriate not to apply a further discount in respect of security of tenure.
Chapter 7: Security of Tenure

May 2017 Report of the Public Service Pay Commission 69
Chapter 8:
Wider Policy Issues
Report of the Public Service Pay Commission May 201770
8.1 This chapter sets out some wider policy issues which were raised by interested parties in submissions received by the Commission. These issues included, inter alia, changes in working hours, reductions in overtime and premium payments, the lower pay scales introduced for new entrants in 2011, and the need to address outstanding pay adjudication awards. Many of the submissions received by the Commission provided a lot of detailed information and raised issues wider than those already referenced in the preceding chapters of this report. The following paragraphs provide a brief summary of some of the common issues and themes arising.
Working Hours
8.2 The Public Services Committee’s submission states that all public servants who worked less than thirty nine hours a week experienced an unpaid increase in their working time. It also submits that on average an additional two and a half hours were added to weekly working hours of public servants under the terms of the HRA. The Public Services Committee estimates this increase in working time as more than 7% for most clerical and administrative staff and states that this additional unpaid working time must be taken into account when considering changes to pay and working conditions in the public service. This issue was also raised in a number of other submissions.
8.3 The standard working hours of public servants were increased as follows:
• Those with a working week of 35 hours or less (net of rest breaks) increased to a minimum of 37 hours a week.
• Those with a working week greater than 35 hours but less than 39 hours (net of rest breaks) increased to a 39 hour week.
• Working hours of those working 39 hours or greater remained the same. However, an hour
of overtime worked each week for these grades was unpaid until 31 March 2014.1
DPER has estimated that on an annual basis some 15 million additional unpaid working hours were introduced in the public service by the HRA in July 2013 as one of a number of productivity measures agreed between the parties under the terms of that collective agreement.
8.4 We have been asked to provide inputs on how the unwinding of the FEMPI legislation should proceed. The additional unpaid hours which were introduced across the public service in 2013 are not a provision of the FEMPI legislation but were a productivity measure agreed between the parties under the terms of a collective agreement. We accept that the additional hours have a �nancial value to the employer which may be re�ected in higher service levels or reduced running costs. Accordingly, the econometric earnings analysis which the Commission examined in reaching its conclusions in relation to earnings comparisons in Chapter 5, takes into account the number of hours worked in the public service and private sector. Since the additional hours were part of a collective agreement, any changes to these arrangements would be a matter for the parties to that agreement, and are outside the scope of this report.
Overtime and Premium Payments8.5 The Public Services Committee outlined that some grades and cohorts of public servants lost premium payments as a result of the 2012 Review of Allowances and the HRA. The Public Services Committee also submitted that the HRA introduced disimprovements to overtime arrangements across the public service including a reduction in the overtime rate and a new requirement for some public servants to work an hour of unpaid overtime each week2. These issues were also raised in submissions from other interested parties.
8.6 In common with the changes to working hours, the changes to premium payments and overtime arrangements in the public service were not introduced under the terms of the FEMPI legislation. Remuneration, as de�ned in the Commission’s terms of reference, encompasses basic salary,
1 Further detail set out at Paragraph 2.4 of the Haddington Road Agreement
2 Paragraph 2.15 of the HRA provided that for those grades, currently with a working week of 39 hours or more (net of rest breaks), an hour of overtime worked each week was unpaid until 31 March 2014.
Chapter 8: Wider Policy Issues
May 2017 Report of the Public Service Pay Commission 71
allowances and all other bene�ts in cash or in kind, including superannuation. The earnings data and analysis which the Commission has taken into account in reaching its conclusions in relation to earnings comparisons in Chapter 5, considers total remuneration received by employees in the public service and the private sector (comprising regular earnings, overtime earnings, irregular earnings and payments in kind). In this manner, adjustments to premium payments and overtime earnings over the relevant time period, are captured in the Commission’s general conclusions in respect of public service pay. Our terms of reference did not extend to recommending what the appropriate level of pay (basic or premium) should be for any individual group or category of public servant for the purposes of this report. However, the importance of this matter for the parties concerned is clearly noted.
Pay of New Entrants 8.7 From the 1 January 2011, a 10% reduction in salary scales was applied for certain new entrant grades to the public service. The HRA modi�ed these provisions, whereby, the new entrant salary scales were merged with the pre-existing salary scales. This means that the majority of new entrants to the relevant grades from the 1 November 2013 are appointed to salary scales with at least two additional pay points at entry but thereafter will progress along the same incremental salary scale and to the same maximum point which applied to employees recruited before the 1 January 2011. This issue was a recurring theme across a number of submissions.
8.8 DPER submitted to the Commission that any assessment of public service remuneration must also consider how well the current remuneration package, including new entrant salaries, delivers on recruiting and retaining staff. This issue is addressed in Chapter 6 of this report, where we generally concluded that there are no signi�cant recruitment dif�culties in many parts of the public service. However, we also noted that there are some problems in the case of some speci�c and specialist roles, including those groups whose skills are in demand internationally, particularly, in the health sector. Even where the new lower scales have not caused recruitment dif�culties the argument has been made that the resultant longer scales give rise to inequities between different cohorts of recruits, with the more recent recruits taking longer to progress to the maximum point of the scale and therefore earning less over the course of their career. The Commission has noted these concerns which are clearly a signi�cant matter for the cohorts concerned on equity grounds. On the other hand, we are aware
that differences between different employee cohorts (whether in pay or superannuation) are not con�ned to the public service.
8.9 As set out in Chapter 6, this report does not undertake a full analysis of the underlying reasons for dif�culties in recruitment and retention, where they exist. Consideration could be given to commissioning a more comprehensive examination in that regard. Submissions to the Commission suggested that the reasons for recruitment and retention dif�culties, where they exist, are broader than pay, and vary from sector to sector. Notwithstanding this, previous �exibilities that existed around pay scales in specialist and scarce skills areas may need to be revisited. These �exibilities would previously have included provision for starting above the minimum point of pay scales and allowing additional increments at certain points of scale progression.
Grade Specific Issues
8.10 A number of speci�c issues were raised by trade unions and representative associations which related to outstanding pay adjudications or recommendations, for particular groups or cohorts of public servants. Given that our immediate terms of reference are essentially pan-public service it was not possible to address such issues. The Commission notes paragraph 5.3 of the LRA which provides that:
The Parties have agreed that any outstanding ad-judication findings as referred to in paragraph 1.16 of the Public Service Agreement 2010 to 2014 will be reviewed jointly by the Parties prior to the expiry of this Agreement”.
We also consider it essential that consideration be given by the parties to some architecture or process which could address such issues in a transparent and equitable manner.
8.11 Some of the submissions to the Commission suggested that it would be timely to have a comprehensive ‘like for like’ job analysis, which should include comparisons with private sector and overseas rates of remuneration, where the circumstances of particular grades have, according to the submissions, changed signi�cantly. The question of how such a matter would be addressed could form part of the forthcoming negotiations between the parties.

Report of the Public Service Pay Commission May 201772
Public Service Reform
8.12 Our broad terms of reference provide that the Commission must have regard to the public service reform agenda. The Commission recognises that a modern agile and �exible public service must continue to implement public service reform on an ongoing basis if it is to meet the evolving demands of society. The Commission considers that where pay adjustments are implemented in the public service, they must continue to be contingent on the delivery of reform and continuous improvements in productivity, in addition to other relevant criteria.

May 2017 Report of the Public Service Pay Commission 73
Chapter 9:
Conclusions

Report of the Public Service Pay Commission May 201774
The purpose of this report is to provide inputs into how the unwinding of the FEMPI Legislation should proceed having regard to the matters referred to in our terms of reference in respect of our initial work programme.
This report contains detailed information and analysis on the relative position of public service pay vis-à-vis pay in comparable employment in the private sector and, in so far as information is available, internationally. We have also provided peer-reviewed information on the value to be ascribed to public service pension schemes in comparison to the value of pensions that are available to employees in the private sector who are provided with occupational pension cover. We have also considered matters relating to recruitment and retention in public service employments. While we did not identify any overall problem in that regard, there are dif�culties in recruiting and retaining key staff in certain areas.
Having regard to all of the circumstances now prevailing the Commission has concluded as follows:
1. A critical factor in any future pay agreement and/or unwinding of FEMPI will be the State’s ability to pay in the context of competing pressures on the public purse.
Having reviewed the evidence presented to us in relation to pay levels and pay movements in the wider economy, we are of the view that there is a basis for parties to enter into negotiations for a further collective agreement to extend the Lansdowne Road Agreement.
As control of the Public Service Pay Bill is a central determinant of Government budgetary policy, it will be a matter for the parties to negotiate a timeframe that will provide for the orderly unwinding of the FEMPI legislation having regard to:
• Maintaining sustainable national �nances and competitiveness
• Other Government spending priorities
• The Public Service Reform agenda
• Equity considerations on public service pay.
2. The Commission believes the values identi�ed for those on legacy standard accrual pension schemes and fast accrual schemes should be addressed by providing for an increased employee contribution for those who continue to bene�t from those schemes. The rate of increase, and the grades and categories to which it should apply, is a matter for negotiation between the parties, taking account of the level of bene�ts accruing. The Commission believes that it would be reasonable to apply any agreed adjustments in pension contributions in conjunction with the discontinuance of the Pension Related Deduction (PRD), which is a product of the FEMPI Acts.
It will ultimately be a matter for the parties to the collective bargaining process to assess all of the information provided in this report and to agree on a valuation to be ascribed to public service pensions in measuring overall remuneration. In the Commission’s opinion and having regard to all of the information provided to us, that value could reasonably be �xed within a range of between 12% and 18% for the pre-2013 standard accrual cohort of public servants. The Commission notes that there are greater costs associated with the provision of fast accrual pension schemes. The level of additional cost varies depending on the scheme involved.
3. Security of tenure has a value. However, no satisfactory scienti�c evidence has been identi�ed that could reasonably be used for assigning to it a speci�c monetary value. This is consistent with the �ndings of the Public Service Benchmarking Body in 2007 who considered it inappropriate to apply a further discount in respect of security of tenure.
4. In general, evidence suggests that there are not signi�cant dif�culties with regard to recruitment to the various large scale public service vocational streams. However, there are problems in the case of some speci�c and specialist groups across the public service. This includes the Defence Forces and those groups whose skills are in demand internationally, particularly in the health sector.
Chapter 9: Conclusions
May 2017 Report of the Public Service Pay Commission 75
In the context of addressing issues identi�ed in relation to recruitment and retention in the public service the previous �exibilities that existed around pay scales in specialist and scarce skills areas may need to be revisited. Where there are signi�cant problems attracting candidates in particular work streams there may be bene�t in looking at the various structural and organisational constraints within such streams. There is some evidence that it is becoming dif�cult to attract a suf�ciently wide pool of suitable candidates for some senior level leadership positions. This suggests there may be structural issues that need examination at these levels.
More broadly we suggest that consideration should be given to commissioning a more comprehensive examination of underlying dif�culties in recruitment and retention in those sectors and employment streams where dif�culties are evident.
5. A number of speci�c issues were raised by various parties that related to issues in particular sectors or employment streams. Given that our immediate terms of reference are essentially pan-public service it was not possible to address such issues in this report. In some instances these matters related to outstanding pay adjudications or recommendations, in others they concerned structural issues relating to working conditions in particular employment streams.
The Commission believes that the parties should give consideration to providing some appropriate mechanism by which these matters can be addressed.
6. The Commission recognises that a modern agile and �exible public service must continue to implement public service reform on an ongoing basis if it is to meet the evolving demands of a modern society. The Commission considers that where adjustments to pay are implemented in the public service, they must continue to be contingent on the delivery of reform and continuous improvements in productivity, in addition to other relevant criteria.

Report of the Public Service Pay Commission May 201776

May 2017 Report of the Public Service Pay Commission 77
Appendices

Report of the Public Service Pay Commission May 201778
Members
Kevin Duffy (Chairman)
Marian Corcoran
Ultan Courtney
Ruth Curran
Noel Dowling
Seán Lyons
Peter McLoone
Brief biographies of the Commission members are available on our website (http://paycommission.gov.ie)
Meetings1. 8th November 2016
2. 21st November 2016
3. 12th December 2016
4. 19th December 2016
5. 9th January 2017
6. 31st January 2017
7. 7th February 2017
8. 22nd February 2017
9. 7th March 2017
10. 21st March 2017
11. 11th April 2017
12. 21st April 2017
13. 25th April 2017
14. 28th April 2017
Minutes of these meetings will be available on our website (http://paycommission.gov.ie)
Appendix A:Membership of PSPC and List of Meetings

May 2017 Report of the Public Service Pay Commission 79
In addition to the interested parties listed below who made submissions, several members of the public also made submissions on a wide range of issues. The interested parties highlighted in bold met with the Commission during the consultation process. All submissions will be available on our website (http://paycommission.gov.ie).
Main submissions1. ACESA
2. AHCE (2 submissions)
3. AJI
4. Alliance of Retired Public Servants
5. Ambulance Education Of�cers Association
6. ASTI
7. Brothers of Charity Services Ireland
8. CPSU
9. DPER (3 submissions)
10. GRA
11. HSE
12. Ibec
13. ICTU Public Services Committee (3 submissions)
14. IHCA (2 submissions)
15. IMO (2 submissions)
16. INMO
17. INTO and TUI (joint submission)
18. Irish Dental Association
19. Medical Laboratory Scientists Association
20. National Ambulance Service Representative Association
21. National Federation of Voluntary Bodies
22. PAS
23. PDFORRA
24. PNA (2 submissions)
25. RACO
26. Senior Civil Service Association
27. SIPTU (4 submissions)
28. Small Firms Association
Pension submissions1. ACESA
2. AGSI (2 submissions)
3. AJI
4. ARCO
5. DPER
6. GRA (2 submissions)
7. ICTU Public Services Committee
8. IHCA (2 submissions)
9. INTO and TUI (joint submission) (2 submissions)
10. RACO (2 submissions)
Appendix B: List of Submissions Received

Report of the Public Service Pay Commission May 201780
Introduction
This appendix sets out the methodological approaches adopted by the Commission for its analysis of pay, pensions, recruitment and retention and security of tenure in the public service and the private sector.
Background to the Public Service Pay Commission
The Commission has been tasked with undertaking an analysis of remuneration in the public service and how it has evolved compared to the private sector. Similar exercises were carried out in 2002 and 2007, when coherent comparisons of jobs and pay rates across the economy were made. These reports examined the work, pay, bene�ts, and conditions of employees in the public service and the private sector. The Commission is not tasked with this type of detailed ‘like for like’ job analysis exercise, as it is not speci�ed in the Commission’s terms of reference. Without the aid of this ‘like for like’ exercise the Commission must use all available data to understand how public service and private sector earnings have progressed since the last full cross-sectoral comparison exercise was carried out. The CSO has a statutory obligation to report on both short-term and structural earnings, and labour costs statistics in Ireland. Using CSO’s earnings statistics allows for various analyses to be undertaken to understand the dynamics of public service and private sector earnings since the last job evaluation exercise and comparisons to be made between the two sectors. In relation to the relative value of public service pensions, the Commission engaged actuarial consultants to independently review the submissions received in respect of public service pensions. The actuarial consultants have prepared a written report setting out relevant �ndings, which is available in Appendix E.
Data Aggregations Request to the CSO
CSO Aggregations for PSPC: The CSO publishes earnings data in standardised formats and aggregations, and provides users with alternative aggregations of published data upon request. The
Commission requested that the CSO provide a number of alternative aggregations of published data. These aggregations adhered to the CSO’s data protection and data con�dentiality criteria.
Earnings, Hours and Employment Costs Survey (EHECS): The Commission requested that EHECS data be provided in annual averages, aggregated by public service and private sector, classifying Commercial State Agencies as private sector, and including payment in kind in the earnings �gures.
National Employment Survey (NES): The Commission requested that NES data be provided with public service earnings net of PRD, aggregated by public service and private sector, and aggregated by decile.
Earnings Analysis using Administrative Data Sources (EAADS): The Commission sought that EAADS data be provided with public service earnings net of PRD, aggregated by public service and private sector, and aggregated by decile.
Job Churn: The Commission requested that Job Churn data be provided for the public service NACE sectors and aggregated by public sector and private sector.
Public-Private Pay Differential Econometric Models: The Commission asked for additional public-private pay differential econometric model speci�cations which remove size and union membership from the model for the years 2011 to 2014.
Types of Pay Analysis
With access to published CSO and Eurostat statistics (e.g. Structure of Earnings Survey), additional aggregates from the CSO, public-private econometric analyses output, and CIPD/IRN survey results, the Commission aimed to examine public service and private sector earnings since the 2007 benchmarking exercise was undertaken, by carrying out:
• Trend analysis: to provide an indication of how average earnings evolved over the period.
• Sectoral analysis: to illustrate the diversity in the economy and the structural differences between the economic sectors.
Appendix C:Methodology
May 2017 Report of the Public Service Pay Commission 81
• Distributional analysis: to highlight the structural differences between the public service and private sector and to show changes in earnings over time across the earnings distribution.
• International analysis: to illustrate how the Irish public sector compares to its EU counterparts in terms of average earnings.
• Econometric analysis: to compare public service and private sector earnings while accounting for employee characteristics (gender, age, occupation, union membership, etc.) and employer characteristics (size, sector).
• Pay settlements analysis: to give an indication of pay settlements that have been agreed in the private sector.
Methodology
Trend Analysis
The CSO undertakes a quarterly establishment survey called the Earnings, Hours and Employment Costs Survey (EHECS). The survey produces short-term earnings and labour costs statistics for the purpose of monitoring changes in the labour market in Ireland and across the European Union. EHECS data was available from Q1 2008 to Q4 2016 on a quarterly and annual basis.
EHECS data relating to 2016 re�ects �nal data for Q1, Q2 and Q3, and preliminary data for Q4.
All employees, full-time, part-time and apprentices/trainees are included in the average earnings �gures. The CSO employment �gures refer to headcount of employees rather than whole-time-equivalents (WTE). The data was presented annually in this report in order to remove seasonal �uctuations and aid interpretation. This survey provides average earnings, hours, and employment �gures of �rms with 3 or more employees for economic sectors. It also provided these averages for the public service and private sector. Due to the compositional differences of the public service and private sector, comparing the average earnings of the two sectors is misleading. Instead the Commission looked at the trends in average earnings in the sectors, illustrating how the two sectors have evolved since 2008. In this report earnings are considered to be: Regular earnings + overtime earnings + irregular earnings + payments in kind. This is the total remuneration received by employees in the public service and private sector. Employer pension contributions are not included in these �gures.
An estimate of the PRD is subtracted from the earnings of the public service for relevant years to provide average earnings estimates excluding PRD. An estimate of the PRD is subtracted from total earnings of public sector bodies each year. The effective PRD rates applied were: 5.92% - 2009 (0%*2 months, 7.5%*2 months, 7%*8 months); 7% - 2010, 2011 and 2012; 6.7% - 2013, 2014 and 2015; 5.6% - 2016; 5.3% - 2017 and 2018.
Earnings projections for the public service are undertaken in the report using EHECS 2016 data as a base. The measures in the LRA are estimated to increase the public service pay bill by €290 million in 2017 and €287 million in 2018. Garda pay increases are estimated to increase the pay bill by €50 million from 2017. Accelerated pay increases are estimated have a once off impact of €120 million on the pay bill in 2017, after which the pay increases are accounted for within the LRA estimates. It is assumed that public service employment will grow by 1.3% each year, the average public service employment growth of 2015 and 2016. As advised by DPER’s letter to Ibec on 16 February 2017, the analysis assumes that increment payments will not increase the total public service pay bill, as savings from persons leaving the public service at higher increment points will cover the cost of incremental progression at lower levels.
In the Commission’s report the public service refers to employees in the Civil Service, Local Authorities, education sector, Garda Síochána, health sector, Defence Forces, and NCSAs. Commercial State Agencies are considered to be private sector, as remuneration in these organisations is not subject to the FEMPI legislation. The private sector refers to employees of private enterprises and Commercial State Agencies in NACE sectors B to S.
References to the public sector in the Commission’s report, with the exception of the international analysis, refers to employees in the Civil Service, Local Authorities, education sector, Garda Síochána, health sector, Defence Forces, NCSAs and Commercial State Agencies. In the international analysis the public sector refers to the three public service dominated economic sectors (public administration and defence, education, and human health and social work) which are used as proxies for the public service.
Report of the Public Service Pay Commission May 201782
Sectoral Analysis
The earnings and labour costs data available from EHECS can be categorised by NACE economic sector, public/private sector, and employment status. NACE Rev .2 is the latest classi�cation system for economic activities. Each enterprise is allocated a NACE code based upon the dominant activity within the �rm. Earnings and labour costs data is summarised and published by these NACE1 groupings. Public service bodies are mostly categorised in the NACE sectors of public administration and defence, education, and human health and social work activities. Sectoral averages provide insight into the diverse nature of the Irish economy.
Earnings Distribution
The CSO carried out the NES in 2003, 2006, 2007 and 2009. Output for 2010 was produced based upon NES 2009 data and 2010 administrative earnings data. EAADS was published by the CSO in February 2017. This provided average earnings data for the years 2011 to 2014 based upon the Revenue P35 �le and CSO Business Register. These two sources of structural earnings data allow the production of the public service and private sector earnings distributions for the years 2007 to 2010 and 2011 to 2014. This report analyses these distributions to provide insight into the structural differences between the public service and private sector, as well as the impact of earnings movements across the earnings distribution over time.
International Comparisons
Irish public service pay is compared to that of EU15 countries (excluding Greece), and developed European Free Trade Area countries (EFTA) (Norway, Iceland and Switzerland) using the Structure of Earnings Survey (SES) in 2014. The SES is a standardised earnings survey of employees which provides comparable average earnings statistics. A public service and private sector breakdown is not available from this data source, so the three public service dominated economic sectors (public administration and defence, education, and human health and social work) are used as proxies for the public service. There are private sector elements in each of these sectors, while there are also elements of the public service not included in these three sectors.
The objective of the SES is to provide accurate and harmonised data on earnings in EU Member States, Candidate Countries, and EFTA countries
1 European industrial activity classi�cation (NACE Rev.2)
for policy-making and research purposes. The SES is a large enterprise sample survey providing detailed and comparable information on the relationships between the level of remuneration and individual characteristics of employees and those of their employer. The statistics of the SES refer to enterprises with at least 10 employees operating in all areas of the economy2, as de�ned in the Statistical classi�cation of economic activities in the European Community (NACE). The international analysis focuses on all workers in companies with 10 employees or more and includes manual workers and non-manual workers3.
However, in 2014, this has been carried out using administrative data in Ireland. In the absence of a full structural survey on earnings in Ireland for 2014, an alternative approach was undertaken by the CSO to deliver the relevant aggregate SES data to Eurostat for 2014. This approach used a combination of administrative data and other CSO data to build the required aggregate outputs - such administrative data included the Revenue P35L �le, the CSO Business Register, Department of Social Protection records, and Census of Population 2011. As not all the required data was available from the combination of these sources, it was necessary for the CSO to model and forecast some variables (occupation, education, hours worked, full-time/part-time, etc.). As an example, occupation and educational attainment indicators are sourced from the Census of Population 2011 and re�ect individuals’ characteristics in 2011, not the reference period of 2014. However, an initial analysis of the Census of Population 2016 results indicates a large change in both occupations and education over the period 2011 to 2016, and therefore it is unrealistic to assume that 2011 disaggregated data accurately re�ects the reference period 2014. Consequently, disaggregated variables from the SES such as occupational classi�cation, education, etc. have not been analysed in this report.
The international analysis is not a ‘like for like’ comparison of public sectors. More complete and comparable public sector earnings comparisons would include characteristics such as occupational classi�cation, educational attainment, skill level, experience, and trade union membership. Robust statistics about these characteristics are not available from the data used in this analysis. These
2 Information on public administration is available from some countries on a voluntary basis.
3 Non-manual workers includes managers, professionals, technicians, associate professionals, clerical support, service and sales workers. Manual workers include agriculture, forestry, �shing, craft, trade, plant, machine operators, machine assemblers, elementary and armed forces occupations.

May 2017 Report of the Public Service Pay Commission 83
unobserved characteristics would explain some of the differences in earnings between the public sectors across countries. Notwithstanding these limitations, Eurostat’s SES is still the most reliable source of data for international earnings comparisons. It should be noted that these are gross earnings and do not include adjustments for tax, social insurance or other deductions (i.e. PRD).
Econometric Analysis
Public-private earnings econometric analysis using NES 2003 data was previously used to supplement the detailed ‘like for like’ exercise carried out by the Benchmarking Body in 2007. This analysis provided a public-private earnings differential which accounted for employee and employer characteristics. The Commission uses output from similar published econometric analyses undertaken using NES data for the years 2003, 2007, 2009 and 2010, and using matched QNHS and administrative earnings data for the years 2011 to 2014.
These analyses do not provide a comprehensive ‘like for like’ comparison between the public service and private sector but do provide a statistical estimate of the public-private pay differential accounting for employee and employer characteristics. The Commission utilises published research output to construct a time series of the public-private pay differential from 2003 to 2014. This time series combines output from the most similar econometric models available over the time period. There are inconsistencies in the model speci�cations chosen, but the time series provides a good indication of the direction and magnitude of changes to the public-private pay differential over the period 2003 to 2014. Quantile regression outputs from these analyses provide the Commission with an understanding of the public-private pay differential across the earnings distribution. Tracked over time these earnings differential distributions provide further insight into how pay has evolved in the public service and private sector. Table C.1 provides a summary of the public-private econometric analyses used in the report.
Table C.1: Summary of Public-Private Econometric Analysis (2003-2014)
Title Year(s) Data Source
Institution/ Author
Model Specification used by the Commission
Benchmarking, Social Partnership and Higher Remuneration: Wage Settling Institutions and the Public-Private Sector Wage Gap in Ireland
2003 and 2006
National Employment Survey
ESRI - Elish Kelly Seamus McGuinness Philip O’Connell
1. Full time employees aged 25 to 592. State Agencies included in the private sector3. Size not included in the model4. Trade Union membership not included in the
model5. Weighted
National Employment Survey – Supplementary Analysis 2009 & 2010
2007 National Employment Survey
CSO 1. Full time employees aged 25 to 592. State Agencies included in the public sector3. Size not included in the model4. Trade Union membership included in the model5. Weighted
Speci�c Analysis of the Public/Private Sector Pay Differential for National Employment Survey 2009 & 2010 Data
2009 and 2010
National Employment Survey
CSO 1. Full time employees aged 25 to 592. Commercial State Agencies included in the
private sector3. Size not included in the model4. Trade Union membership included in the model5. Earnings exclude PRD6. Weighted
Econometric analysis of the public/private sector pay differential 2011 to 2014
2011 to 2014
Matched QNHS and administrative earnings data
CSO 1. Full time employees aged 25 to 592. Commercial State Agencies included in the
private sector3. Size not included in the model4. Trade Union membership included in the model5. Earnings exclude PRD6. Weighted
Source: PSPC Workings

Report of the Public Service Pay Commission May 201784
Pay Settlements
The CIPD and IRN published the results of their annual survey on private sector pay in February 2017. The survey aimed to capture the treatment of basic pay rates in private sector companies and categorise the output by size, sector, and union membership. This survey provides data on recent pay movements in the private sector. Table C.2 summarises the sample of the survey in 2016 and 2017.
Table C.2: CIPD/IRN Survey Sample, 2016 and 2017
2016 2017Total Sample Size 584 536
Company Size % %
251 + 52 47
51-250 30 34
1 to 50 19 19
Company Type % %
Services 66 60
Manufacturing 25 17
Other/Both 9 20
Commercial State Agencies 3
Unionisation % %
Unionised 37 34
Non-Unionised 63 66
Pension Analysis
The value placed upon pensions in this report is the full cost of superannuation bene�t provision. The value of pension bene�ts is dif�cult to estimate. This is partly because some elements require forecasts of uncertain variables, e.g. longevity of pensioners (current and projected), coordination with State contributory pension bene�ts and long term expected returns on future investments. Other relevant factors vary across individuals, for example age and salary at entry and career progression. Various judgements and methodological assumptions have to be made. One standard simpli�cation adopted in this report is not to calculate actual costs for an individual member but instead to estimate the typical valuation for a grade or category of public servants as a whole.
The Commission engaged actuarial consultants, Milliman, following a competitive procurement process. The actuarial consultants have independently reviewed the submissions received by the Commission in respect of public service pensions and they have prepared a written report setting out relevant �ndings. Milliman’s Review of Actuarial Submissions can be found in Appendix E. The full list of pension submissions can be found in Appendix B.
The actuarial consultants reviewed the methodology, assumptions, key judgements, and conclusions set out in each of the actuarial submissions received by the Commission. The review of these factors was carried out at a high level and did not encompass detailed validation of actuarial calculations in individual submissions. The Commission has assumed that all of the technical papers compiled by actuarial consultants and those submitted to the Commission by interested parties have been completed to professional standards.
The methodology used to calculate the cost of bene�ts in most submissions is the ‘Entry Age Method’. This method is consistent with that used in the 2007 report. The cohorts analysed in the Milliman Report are as follows:
• A member who joined the public service up to and including 31 March 2004 (Pre 2004)
• A member who joined the public service between 1 April 2004 and 31 December 2012 (Post 2004)
• A member who joined the public service on or after 1 January 2013 (Post 2013).
Recruitment and Retention
In order to assess whether there are recruitment and retention problems arising in any area of the public service, the Commission sought evidence of these issues from interested parties and from available statistics. Recruitment and retention issues were highlighted to the Commission through submissions received and through meetings with a number of interested parties. The Commission sought supplementary supporting information and data from these stakeholders, and also requested veri�cation of claims from of�cial sources. Of�cial statistics on employment in the public service, in WTE, were sourced from DPER from 2008 to 2016. DPER also provided data on recruitment since the end of the moratorium, while the Public Appointments Service (PAS) provided information on competitions they carried out for public service positions in recent years. The CSO produces Job

May 2017 Report of the Public Service Pay Commission 85
Churn statistics which provide the number of hires, separations, and job stayers in �rms from 2011 to 2014 (i.e. those taking new jobs, leaving or staying and the �rms in which these jobs are located in the Irish labour market). This data is aggregated by age, sector and public service/private sector. Job churn statistics are examined for the three main public service sectors: public administration and defence, education, and human health and social work. The data provides insight into potential recruitment and retention issues arising in the public service.
Security of Tenure
Security of tenure is the value placed upon the reduced risk of an individual losing their job. The approach we have taken is to consider the different factors which would have to be taken into account and the extent to which security of tenure can be ascribed to public service employment.
Report of the Public Service Pay Commission May 201786
Initial Restoration Measures Provided for in the FEMPI 2015 Act
The Public Service Stability Agreement 2013 to 2018 (HRA & LRA) underpinned by the Financial Emergency Measures in the Public Interest Act (FEMPI) 2015 made provision for the following measures:
Pension Related Deduction (PRD): Exemption threshold changes as follows:
• 2015 increase from €15,000 p.a. to €17,500 p.a.
• 1 January 2016 increase from €17,500 p.a.to €26,083 p.a.
• 1 January 2017 increase from €26,083 p.a. to €28,750 p.a.
Pay increases as follows:
• 1 January 2016 annualised salaries up to €24,000 to increase by 2.5%
• 1 January 2016 annualised salaries from €24,001 up to €31,000 to increase by 1%
• 1 September 2017 all annualised salaries up to €65,000 to increase by €1,000.1
1 In order to address the anomalies which arose following the recent Labour Court Recommendations for certain Garda Associations, the Government has agreed to an additional payment which provides for a proportionate increase in the annualised payment of €1,000 for the period 1 April 2017 to 31 August 2017 inclusive, for Civil and Public Servants who are on annualised salaries up to €65,000, are parties to the Lansdowne Road Agreement and who do not stand to bene�t from the Labour Court Recommendations (CD/16/321 and CD/16/322).
Over €65k Pay Restoration: Those on salaries over €65,000 p.a. to get the additional cuts imposed under the FEMPI Act 2013 restored as follows:
• €65,000 to €110,000: half on 1 April 2017, half on 1 January 2018
• Over €110,000: one third on 1 April 2017, one third on 1 Apr 2018, and one third on 1 April 2019.
Appendix D:Financial Emergency Measures in the Public Interest Acts 2009-2015

May 2017 Report of the Public Service Pay Commission 87
Table D.1: Impact of FEMPI Measures and LRA Benefits
2015
R
emun
erat
ion
(Pre
-LR
A
Res
tora
tio
n)
Red
ucti
on
Und
er F
EM
PI
2009
Act
(PR
D)
Red
ucti
on
Und
er F
EM
PI
2009
(No
. 2)
Act
(PA
Y)
Red
ucti
on
Und
er F
EM
PI
2013
Act
.
Tota
l FE
MP
I R
educ
tio
n LR
A B
enefi
t%
Ben
efit
% t
o b
e R
esto
red
U
nder
LR
A
€22,
000
€325
€1,1
58€0
€1,4
83€1
,875
8.5%
126%
€23,
000
€425
€1,2
11€0
€1,6
36€2
,000
8.7%
122%
€24,
000
€525
€1,2
63€0
€1,7
88€2
,125
8.9%
119%
€25,
000
€625
€1,3
16€0
€1,9
41€1
,875
7.5%
97%
€26,
000
€725
€1,3
68€0
€2,0
93€1
,985
7.6%
95%
€27,
000
€825
€1,4
21€0
€2,2
46€2
,095
7.8%
93%
€28,
000
€925
€1,4
74€0
€2,3
99€2
,152
7.7%
90%
€29,
000
€1,0
25€1
,541
€0€2
,566
€2,1
617.
5% 84
%
€30,
000
€1,1
25€1
,622
€0€2
,747
€2,1
707.
2% 79
%
€31,
000
€1,2
25€1
,703
€0€2
,928
€2,1
797.
0% 74
%
€32,
000
€1,3
25€1
,784
€0€3
,109
€1,9
005.
9% 61
%
€40,
000
€2,1
25€2
,432
€0€4
,557
€1,9
004.
8% 42
%
€70,
000
€5,1
75€5
,453
€4,0
74€1
4,70
2€4
,646
6.6%
32%
€80,
000
€6,2
25€6
,643
€4,7
83€1
7,65
1€5
,280
6.6%
30%
€100
,000
€8,3
25€9
,058
€6,5
22€2
3,90
5€6
,837
6.8%
29%
€120
,000
€10,
425
€11,
153
€8,2
61€2
9,83
9€8
,394
7.0%
28%
Sou
rce:
Dep
artm
ent
of P
ublic
Exp
end
iture
and
Ref
orm
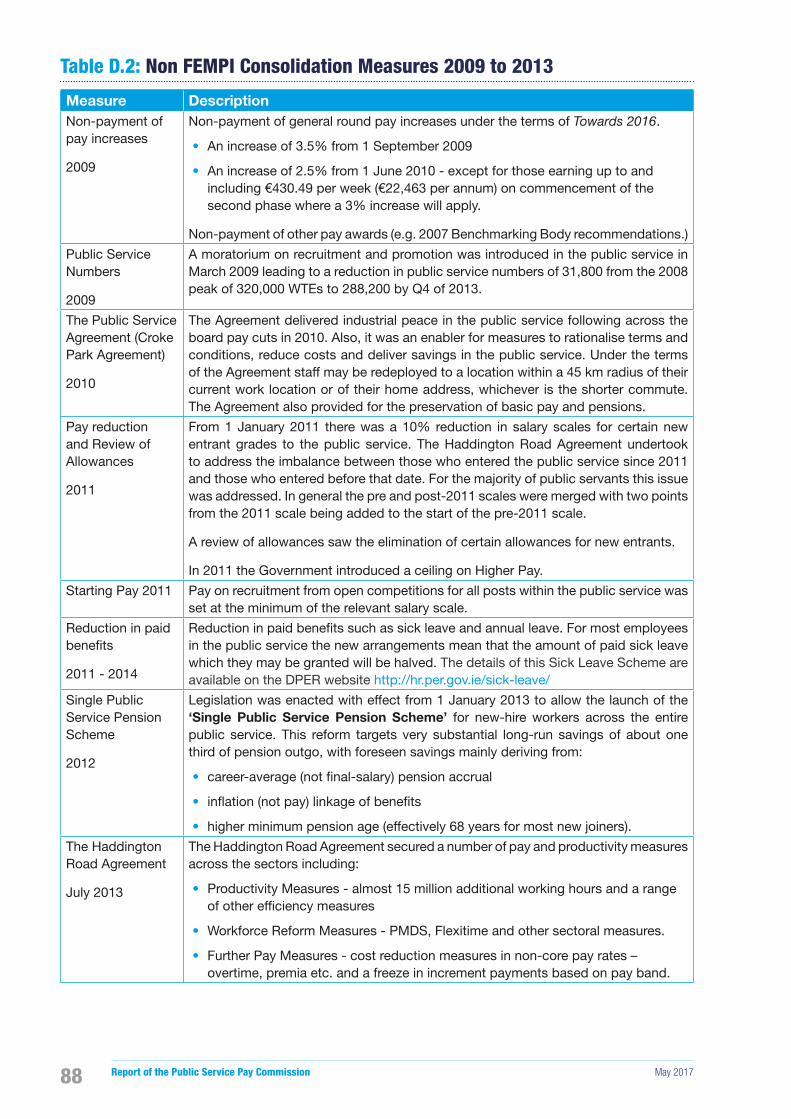
Report of the Public Service Pay Commission May 201788
Table D.2: Non FEMPI Consolidation Measures 2009 to 2013
Measure DescriptionNon-payment of pay increases
2009
Non-payment of general round pay increases under the terms of Towards 2016.
• An increase of 3.5% from 1 September 2009
• An increase of 2.5% from 1 June 2010 - except for those earning up to and including €430.49 per week (€22,463 per annum) on commencement of the second phase where a 3% increase will apply.
Non-payment of other pay awards (e.g. 2007 Benchmarking Body recommendations.)
Public Service Numbers
2009
A moratorium on recruitment and promotion was introduced in the public service in March 2009 leading to a reduction in public service numbers of 31,800 from the 2008 peak of 320,000 WTEs to 288,200 by Q4 of 2013.
The Public Service Agreement (Croke Park Agreement)
2010
The Agreement delivered industrial peace in the public service following across the board pay cuts in 2010. Also, it was an enabler for measures to rationalise terms and conditions, reduce costs and deliver savings in the public service. Under the terms of the Agreement staff may be redeployed to a location within a 45 km radius of their current work location or of their home address, whichever is the shorter commute. The Agreement also provided for the preservation of basic pay and pensions.
Pay reduction and Review of Allowances
2011
From 1 January 2011 there was a 10% reduction in salary scales for certain new entrant grades to the public service. The Haddington Road Agreement undertook to address the imbalance between those who entered the public service since 2011 and those who entered before that date. For the majority of public servants this issue was addressed. In general the pre and post-2011 scales were merged with two points from the 2011 scale being added to the start of the pre-2011 scale.
A review of allowances saw the elimination of certain allowances for new entrants.
In 2011 the Government introduced a ceiling on Higher Pay.
Starting Pay 2011 Pay on recruitment from open competitions for all posts within the public service was set at the minimum of the relevant salary scale.
Reduction in paid bene�ts
2011 - 2014
Reduction in paid bene�ts such as sick leave and annual leave. For most employees in the public service the new arrangements mean that the amount of paid sick leave which they may be granted will be halved. The details of this Sick Leave Scheme are available on the DPER website http://hr.per.gov.ie/sick-leave/
Single Public Service Pension Scheme
2012
Legislation was enacted with effect from 1 January 2013 to allow the launch of the ‘Single Public Service Pension Scheme’ for new-hire workers across the entire public service. This reform targets very substantial long-run savings of about one third of pension outgo, with foreseen savings mainly deriving from:
• career-average (not �nal-salary) pension accrual
• in�ation (not pay) linkage of bene�ts
• higher minimum pension age (effectively 68 years for most new joiners).
The Haddington Road Agreement
July 2013
The Haddington Road Agreement secured a number of pay and productivity measures across the sectors including:
• Productivity Measures - almost 15 million additional working hours and a range of other ef�ciency measures
• Workforce Reform Measures - PMDS, Flexitime and other sectoral measures.
• Further Pay Measures - cost reduction measures in non-core pay rates – overtime, premia etc. and a freeze in increment payments based on pay band.

May 2017 Report of the Public Service Pay Commission 89
Appendix E: Milliman Review of Actuarial Submissions
Milliman Client Report
7 Grand Canal Grand Canal Street Lower Dublin 2 D02 KW81 IRELAND Tel +353 (0)1 647 5900 milliman.ie
20 April 2017
Public Service Pay Commission Review of actuarial submissions
Prepared for: Public Service Pay Commission
Prepared by: Aisling Barrett Dermot Corry
Milliman Client Report
7 Grand Canal Grand Canal Street Lower Dublin 2 D02 KW81 IRELAND Tel +353 (0)1 647 5900 milliman.ie
20 April 2017
Public Service Pay Commission Review of actuarial submissions
Prepared for: Public Service Pay Commission
Prepared by: Aisling Barrett Dermot Corry
Report of the Public Service Pay Commission May 201790
Milliman Client Report
Public Service Pay Commission Review of actuarial submissions
20 April 2017
2
TABLE OF CONTENTS
EXECUTIVE SUMMARY 3 1 Scope 3 2 Methodology 3 3 Assumptions 3 4 Results 4 5 Conclusion 5
SCOPE 6 6 Introduction 6 7 Background 6 8 Scope 6 9 Reliances and Limitations 6 10 Structure of report 7
METHODOLOGY 8 11 General Approach 8 12 Public Service Benefits 8 13 Private Sector Benefits 9
ASSUMPTIONS 12 14 Economic Assumptions 12 15 Mortality assumptions 14 16 Grade details 15 17 Other assumptions 15
RESULTS 16 18 Results 16 19 Fast Accrual Categories 18 20 Sensitivities 21 21 Conclusion 23
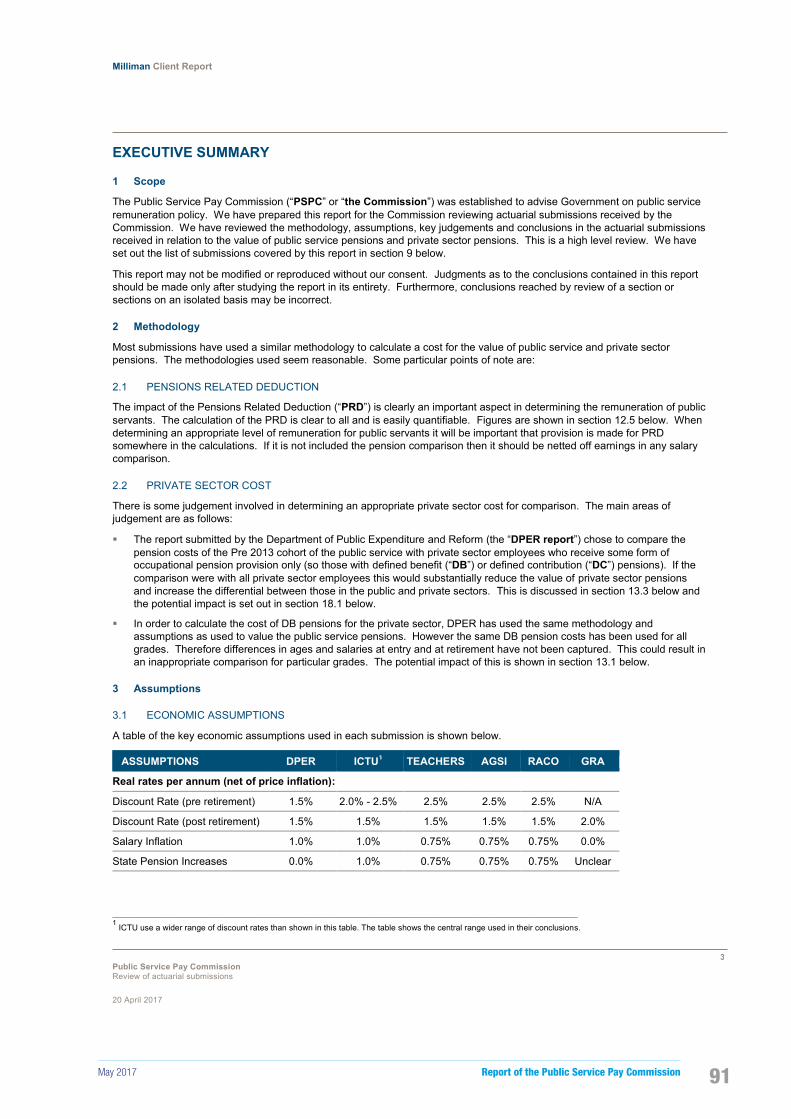
May 2017 Report of the Public Service Pay Commission 91
Milliman Client Report
Public Service Pay Commission Review of actuarial submissions
20 April 2017
3
EXECUTIVE SUMMARY
1 Scope
The Public Service Pay Commission (“PSPC” or “the Commission”) was established to advise Government on public service remuneration policy. We have prepared this report for the Commission reviewing actuarial submissions received by the Commission. We have reviewed the methodology, assumptions, key judgements and conclusions in the actuarial submissions received in relation to the value of public service pensions and private sector pensions. This is a high level review. We have set out the list of submissions covered by this report in section 9 below.
This report may not be modified or reproduced without our consent. Judgments as to the conclusions contained in this report should be made only after studying the report in its entirety. Furthermore, conclusions reached by review of a section or sections on an isolated basis may be incorrect.
2 Methodology
Most submissions have used a similar methodology to calculate a cost for the value of public service and private sector pensions. The methodologies used seem reasonable. Some particular points of note are:
2.1 PENSIONS RELATED DEDUCTION
The impact of the Pensions Related Deduction (“PRD”) is clearly an important aspect in determining the remuneration of public servants. The calculation of the PRD is clear to all and is easily quantifiable. Figures are shown in section 12.5 below. When determining an appropriate level of remuneration for public servants it will be important that provision is made for PRD somewhere in the calculations. If it is not included the pension comparison then it should be netted off earnings in any salary comparison.
2.2 PRIVATE SECTOR COST
There is some judgement involved in determining an appropriate private sector cost for comparison. The main areas of judgement are as follows:
The report submitted by the Department of Public Expenditure and Reform (the “DPER report”) chose to compare the pension costs of the Pre 2013 cohort of the public service with private sector employees who receive some form of occupational pension provision only (so those with defined benefit (“DB”) or defined contribution (“DC”) pensions). If the comparison were with all private sector employees this would substantially reduce the value of private sector pensions and increase the differential between those in the public and private sectors. This is discussed in section 13.3 below and the potential impact is set out in section 18.1 below.
In order to calculate the cost of DB pensions for the private sector, DPER has used the same methodology and assumptions as used to value the public service pensions. However the same DB pension costs has been used for all grades. Therefore differences in ages and salaries at entry and at retirement have not been captured. This could result in an inappropriate comparison for particular grades. The potential impact of this is shown in section 13.1 below.
3 Assumptions
3.1 ECONOMIC ASSUMPTIONS
A table of the key economic assumptions used in each submission is shown below.
ASSUMPTIONS DPER ICTU1 TEACHERS AGSI RACO GRA
Real rates per annum (net of price inflation):
Discount Rate (pre retirement) 1.5% 2.0% - 2.5% 2.5% 2.5% 2.5% N/A
Discount Rate (post retirement) 1.5% 1.5% 1.5% 1.5% 1.5% 2.0%
Salary Inflation 1.0% 1.0% 0.75% 0.75% 0.75% 0.0%
State Pension Increases 0.0% 1.0% 0.75% 0.75% 0.75% Unclear
_______________________________________________________________________________ 1 ICTU use a wider range of discount rates than shown in this table. The table shows the central range used in their conclusions.

Report of the Public Service Pay Commission May 201792
Milliman Client Report
Public Service Pay Commission Review of actuarial submissions
20 April 2017
4
These assumptions can have a significant impact on results and are discussed in detail in section 14 below. In general there are many possible valid approaches to setting economic assumptions and the assumptions used in the submissions are all valid approaches. Sensitivities to the assumptions are set out in section 20 below.
However we note that the DPER report assumes State Pension increase of 0% in excess of price inflation. This is unusual in the context of stated Government policy and in comparison with approaches taken in other reports.
We have suggested an appropriate set of economic assumptions as shown below.
ASSUMPTIONS
Real rates per annum (net of price inflation):
Discount Rate (pre retirement) 2.0% - 2.5%
Discount Rate (post retirement) 1.0%
Salary Inflation 1.0%
State Pension Increases 1.0%
3.2 GRADE DETAILS
The DPER report sets out the assumed entry ages, retirement ages and pensionable salaries at entry and at retirement used in its calculations. These assumptions can have a considerable impact on the results for individual grades. In general, we have not validated the salaries and ages assumed since we do not have the relevant data. However in section 16 below we discuss some particular considerations in relation to the assumptions used for grades in the DPER report. The issues discussed include:
In some cases, pensionable salary is taken from data provided. In other cases, it is taken from the pay scale. The pay scale figures do not seem to have been adjusted for pensionable allowances. These pensionable allowances can be significant. Particularly where an inconsistent approach has been taken to salary at entry and at retirement. A narrower salary range will give rise to a much lower cost than a wider salary range. Therefore an assessment of individual grades using the results in the DPER report may not be appropriate. However when averaged across all grades, this is unlikely to have a significant impact on the average cost.
In some cases the salary at retirement is based on the pensionable salary at retirement for recent retirees and the salary at entry is taken from the starting point on the pay scale. This may not be appropriate for recent entrants whose salary scales are lower than for those recently retiring.
4 Results
4.1 PRIVATE SECTOR
The figures of 11% (for the Pre 2013 cohort) and 7% (for the Post 2013 cohort) proposed by the DPER report do not seem unreasonable, assuming that it is deemed appropriate to compare public service members with private sector employees who receive some form of occupational pension provision only. This is discussed further in section 18.1 below.
4.2 PUBLIC SERVICE
The DPER report has split the grades used into “standard accrual categories” (civil servant, teacher, nurse, engineer) and “fast accrual categories” (Garda, high court judge). It is reasonable to split the grades in this manner so that policy decisions in relation to particular grades can be considered.
4.2.1 Standard Accrual Categories
The results presented in the various submissions for the standard accrual categories vary as would be expected with the variations in assumptions used. We have estimated a range of results for the average standard accrual categories in section 5 and 21 below.
4.2.2 Fast Accrual Categories
The report submitted by the Association of Garda Sergeants and Inspectors (the “AGSI report”) states that the impact of early retirement is that its members will receive lower earnings over the period between the early retirement age of Gardaí and the standard retirement age of other public servants. The AGSI report suggests separating the pension cost for Gardaí into that

May 2017 Report of the Public Service Pay Commission 93
Milliman Client Report
Public Service Pay Commission Review of actuarial submissions
20 April 2017
5
relating to normal retirement and that relating to earlier retirement. This is a useful way of examining the costs and we have presented some results on this basis in section 19.1 below.
We have also calculated estimated costs using a similar split for Defence Force Officers in section 19.2 below.
We discuss the high court judge in section 19.3 below. The most relevant fact to consider here is whether the total remuneration package, including the additional pension contributions, is adequate to attract suitably qualified candidates into the judiciary. This is a wider policy issue that is outside the scope of this report.
5 Conclusion
On the basis of an appropriate set of assumptions as set out in section 3.1 above, we have estimated a cost comparison for the average standard accrual category for the Pre 2013 cohort as set out below.
COST COMPARISON PRE 2013
Pre; Post retirement discount rate Public Service Private Sector Differential
2.0%; 1.0% 25% 11% 14%
2.5%; 1.0% 23% 10% 13%
On the basis of the same set of assumptions, we have estimated a cost comparison for the average standard accrual category for the Post 2013 cohort as set out below.
COST COMPARISON POST 2013
Pre; Post retirement discount rate Public Service Private Sector Differential
2.0%; 1.0% 7% 7% 0%
2.5%; 1.0% 6% 7% (1%)
We believe that these are an appropriate basis for considering public service pension scheme members on average. More details on these calculations are set out in section 21 below.
However considerations for particular grades may apply. Any consideration of individual grades would need to take into account:
The use of consistent entry ages in both the public service and private sector calculation;
The use of pensionable salaries at entry and at retirement that include pensionable allowances (in both the public service and private sector calculations);
The likelihood of promotional increases occurring earlier or later in the member’s working life;
The resulting impact of the PRD for that grade;
Any adjustment needed to split the cost between standard and early retirement;
Any policy decisions particular to that grade. This is particularly relevant to the faster accrual categories of employee.

Report of the Public Service Pay Commission May 201794
Milliman Client Report
Public Service Pay Commission Review of actuarial submissions
20 April 2017
6
SCOPE
6 Introduction
Milliman Limited (“Milliman”) has prepared this report for the Public Service Pay Commission (“PSPC” or “the Commission”) on its review of actuarial submissions received by the Commission.
7 Background
The Commission was established to advise Government on public service remuneration policy. The Commission is to provide an initial report to Government in Quarter 2 of 2017 on public service remuneration in the context of the Financial Emergency Measures in the Public Interest Acts 2009 - 2015.
The Commission has been asked by Government to take full account of the question of superannuation in the public service in delivery of its initial report. The Government considers the relative value of public service pensions to be a significant component of remuneration and that the value of this element is greater now than it has been historically.
8 Scope
As set out in the letter of engagement dated 3 April 2017, the scope of our work is as follows:
1. Review of submissions: We will review the methodology, assumptions, key judgements and conclusions in the actuarial submissions received in relation to the value of public sector pensions and private sector pensions. This will be a high level review. We will not carry out detailed validation of calculations.
2. Writing report: We will write a report setting out the findings of our review of the actuarial submissions received.
3. Commission meeting & report: We will meet the Commission on 11 April 2017 to discuss our findings and observations. We will peer review the final report of the Commission once it is available.
This report is that mentioned in item 2 above setting out the findings of our review of the actuarial submissions received.
9 Reliances and Limitations
This report was based on data available to us at, or prior to, 5 April 2017, and takes no account of developments after that date. This report is covered by the terms of business set out in the letter of engagement between the Commission and Milliman dated 4 April 2017.
This report is not intended to guide or determine any specific individual situation and persons should consult qualified professionals before taking specific actions. None of the authors, their employer nor the Commission shall have any responsibility or liability to any person or entity with respect to damages alleged to have been caused directly or indirectly by the content of this report.
This report may not be modified or reproduced without our consent. Judgments as to the conclusions contained in this report should be made only after studying the report in its entirety. Furthermore, conclusions reached by review of a section or sections on an isolated basis may be incorrect. All rights reserved.
Differences between the projections and actual amounts depend on the extent to which future experience conforms to the assumptions made for the analysis. The assumptions we have used have, in our view, been made on the basis of reasonable hypotheses. It is certain, however, that actual experience will not conform exactly to the assumptions used in this analysis. Actual amounts will differ from projected amounts to the extent that actual experience deviates from expected experience. Such variations in experience could have a significant effect on the results and conclusions of this report. No warranty is given that the assumptions made in this report will be reflected in actual future experience.
We have not validated the calculations presented in the submissions. We have conducted a high level review of the methodology, assumptions and conclusions in the submissions.
In carrying out our work and producing this report, reliance has been placed upon, but not limited to, the following information:
Department of Public Expenditure and Reform: Actuarial Review of Pension Provision in the Irish Public Service and a Comparison with the Private Sector (“DPER report”);
Report prepared for ICTU Public Services Committee: Public Sector Pension Cost Comparison (“ICTU report”);
Report on the value to newly employed early career teachers of participation in the Single Public Service Pension Scheme (January 2017) (“Single Scheme Teachers report”);
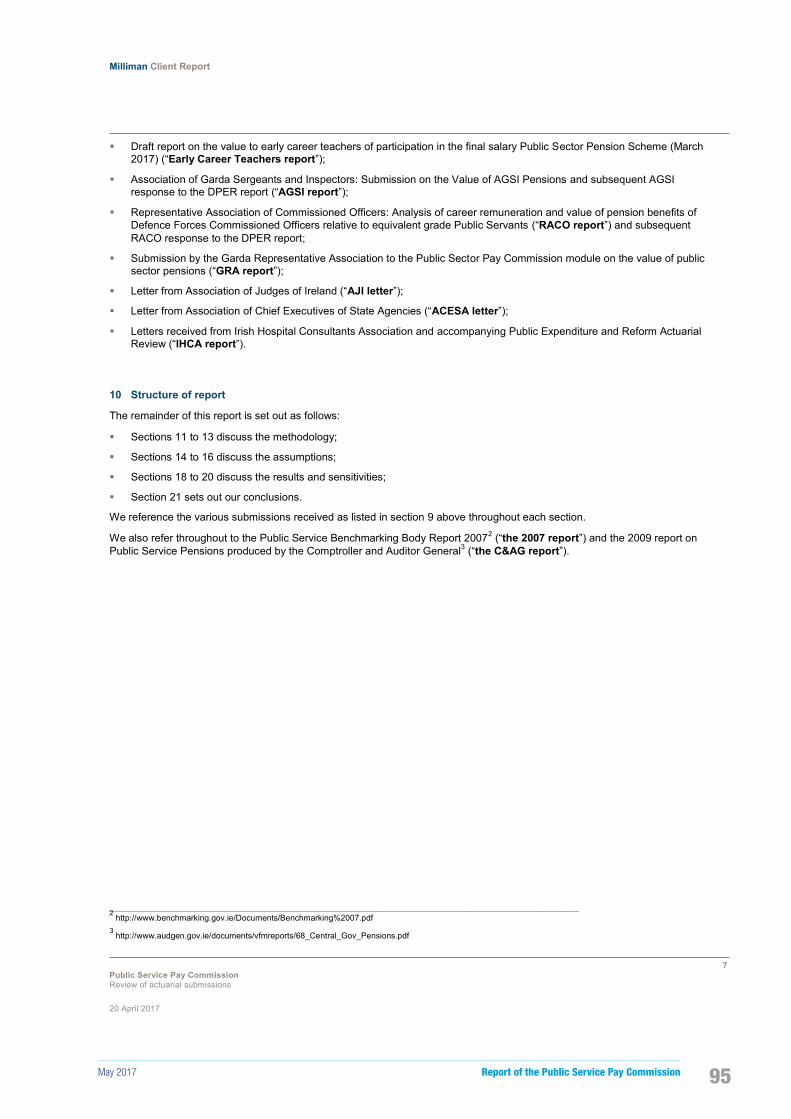
May 2017 Report of the Public Service Pay Commission 95
Milliman Client Report
Public Service Pay Commission Review of actuarial submissions
20 April 2017
7
Draft report on the value to early career teachers of participation in the final salary Public Sector Pension Scheme (March 2017) (“Early Career Teachers report”);
Association of Garda Sergeants and Inspectors: Submission on the Value of AGSI Pensions and subsequent AGSI response to the DPER report (“AGSI report”);
Representative Association of Commissioned Officers: Analysis of career remuneration and value of pension benefits of Defence Forces Commissioned Officers relative to equivalent grade Public Servants (“RACO report”) and subsequent RACO response to the DPER report;
Submission by the Garda Representative Association to the Public Sector Pay Commission module on the value of public sector pensions (“GRA report”);
Letter from Association of Judges of Ireland (“AJI letter”);
Letter from Association of Chief Executives of State Agencies (“ACESA letter”);
Letters received from Irish Hospital Consultants Association and accompanying Public Expenditure and Reform Actuarial Review (“IHCA report”).
10 Structure of report
The remainder of this report is set out as follows:
Sections 11 to 13 discuss the methodology;
Sections 14 to 16 discuss the assumptions;
Sections 18 to 20 discuss the results and sensitivities;
Section 21 sets out our conclusions.
We reference the various submissions received as listed in section 9 above throughout each section.
We also refer throughout to the Public Service Benchmarking Body Report 20072 (“the 2007 report”) and the 2009 report on Public Service Pensions produced by the Comptroller and Auditor General3 (“the C&AG report”).
_______________________________________________________________________________ 2 http://www.benchmarking.gov.ie/Documents/Benchmarking%2007.pdf 3 http://www.audgen.gov.ie/documents/vfmreports/68_Central_Gov_Pensions.pdf

Report of the Public Service Pay Commission May 201796
Milliman Client Report
Public Service Pay Commission Review of actuarial submissions
20 April 2017
8
METHODOLOGY
11 General Approach
The methodology used to calculate the cost of benefits in most submissions is the “Entry Age Method” as defined in the DPER report. This method is consistent with that used in the 2007 report. This method calculates the effective contribution (as a percentage of pensionable salary4) that would be required to be paid throughout the working life of the member to generate the pension and lump sum due. The amount of the State Pension is then deducted from the pension amount in calculating the cost of the public service pension. This ensures an appropriate comparison with the private sector who will also receive the State Pension.
The Entry Age Method treats all members as new entrants and costs the pension for the entire working life of a member. This is a suitable approach for more recent joiners but may be less appropriate for members with longer service.
Several possible alternative methods could be used. However overall this is a reasonable measure of benefits.
12 Public Service Benefits
12.1 GRADES SELECTED
The grades select for review by the DPER report are:
Civil Servant;
Teacher;
Nurse;
Engineer;
Hospital Consultant;
Garda;
High Court Judge.
Assumptions in relation to salary levels, ages etc. for these grades are discussed in section 16 below.
12.2 ACCRUAL CATEGORIES AND COHORTS
The cohorts analysed are as follows:
A member who joined the public service before 31st March 2004 (“Pre 2004”);
A member who joined the public service between 1st April 2004 and 31st December 2012 (“Post 2004”);
A member who joined the public service on or after 1st January 2013 (“Post 2013”).
Appendix 3 of the DPER report details the benefits that are appropriate to each cohort.
The DPER report groups the Pre 2004 and Post 2004 cohorts together as (“Pre 2013”). This is based on a weighted average of 66.6% of the Pre 2004 cohort and 33.3% of the Post 2004 cohort. However it can be useful to examine these separately due to differences in retirement age (typically 60 for Pre 2004 and 65 for Post 2004) and resulting cost calculations.
For Post 2013 members the main changes are that the pension is based on career average earnings (instead of those at retirement) and pensions are indexed in line with price inflation (instead of salary inflation). This has a significant impact on the cost of pensions and has been highlighted in the various submissions.
The DPER report has split the grades used into “standard accrual categories” (civil servant, teacher, nurse, engineer) and “fast accrual categories” (Garda, high court judge).
12.3 HOSPITAL CONSULTANT
The hospital consultant grade has been included as a standard accrual category but is excluded from the average presented for this category. This is due to the faster rate of salary increase for hospital consultants which gives rise to higher costs (because contributions received are based on a lower level of pensionable salary throughout the member’s working life and
_______________________________________________________________________________ 4 The terms “pensionable salary” and “salary” are used interchangeably throughout this report.

May 2017 Report of the Public Service Pay Commission 97
Milliman Client Report
Public Service Pay Commission Review of actuarial submissions
20 April 2017
9
pensions paid are based on pensionable salary at retirement). It may be reasonable also to separately consider such members with wider ranges of pensionable salary from entry to retirement.
The IHCA report notes that the cost of the State Pension and the PRSI contributions made are not included in the analysis. For grades on higher salaries, the level of the State Pension is lower as a percentage of salary. The assessment of public sector pensions only considers the cost in excess of the State Pension which will be a significantly higher percentage of salary for higher paid grades since the State Pension is a flat amount. This point is valid when comparing public service pension costs among the different grades of public servants considered. It is also valid if comparing with an average private sector pension. In section 13.1 below we note that it would be more appropriate to compare each grade with private sector figures using the same ages and salaries at entry and at retirement. If a public sector hospital consultant was compared with a private sector employee with the same salary at entry and retirement then this would be a reasonable comparison and the point in the IHCA report would not be relevant. This is because highly paid individuals in the private sector also pay disproportionately higher PRSI contributions relative to the benefits received. This is a feature of the PRSI system and is not directly relevant to considerations of public service pension costs.
The IHCA report also notes that tax is likely to be paid on a hospital consultant’s pension in retirement due to the standard fund threshold. This can have significant tax implications. In the private sector typically higher earners would limit pension contributions to ensure that income is not taxed twice. This is not possible within the public service pension scheme.
12.4 FAST ACCRUAL CATEGORIES
We have discussed the approach to the fast accrual categories in section 19 below.
12.5 PENSIONS RELATED DEDUCTION
A Pensions Related Deduction (“PRD”) is applied to the remuneration of pensionable public servants. From 1 January 2017 the rate of deduction is 10% of remuneration in excess of €28,750 and 10.5% of any amount in excess of €60,000. This has not been included in the pension cost calculated by DPER (although the impact for each grade has been calculated). The impact of the PRD is shown below as shown in the DPER report.
PRD
Civil
Servant Teacher Nurse Engineer Average Hospital
Consultant Garda High Court
Judge
PRD 5% 5% 5% 6% 5% 9% 4% 9%
The impact of PRD is clearly an important aspect in determining the remuneration of public servants. The DPER report does not include the PRD in calculating the net employer cost of pensions. The calculation of the PRD is clear to all and is easily quantifiable. When determining an appropriate level of remuneration for public servants it will be important that provision is made for PRD somewhere in the calculations.
13 Private Sector Benefits
13.1 DEFINED BENEFIT PENSION COST
DPER has calculated a cost for private sector Defined Benefit (“DB”) pensions of 22% of salary. The ICTU report also calculates a private sector pension cost for a range of discount rates.
In order to calculate the cost of DB pensions for the private sector, DPER has used the same methodology and assumptions as used to value the public service pensions. However the same DB pension costs has been used for all grades. Therefore differences in ages and salaries at entry and at retirement have not been captured. This could result in an inappropriate comparison for particular grades. The 2007 report calculated equivalent private sector comparison figures for each grade using the same ages and salaries at entry and at retirement. Later ages at entry and wider salary ranges in particular will impact costs.
Using the DPER assumptions, we have estimated the range of private DB pension costs that could apply for each grade in the table below.
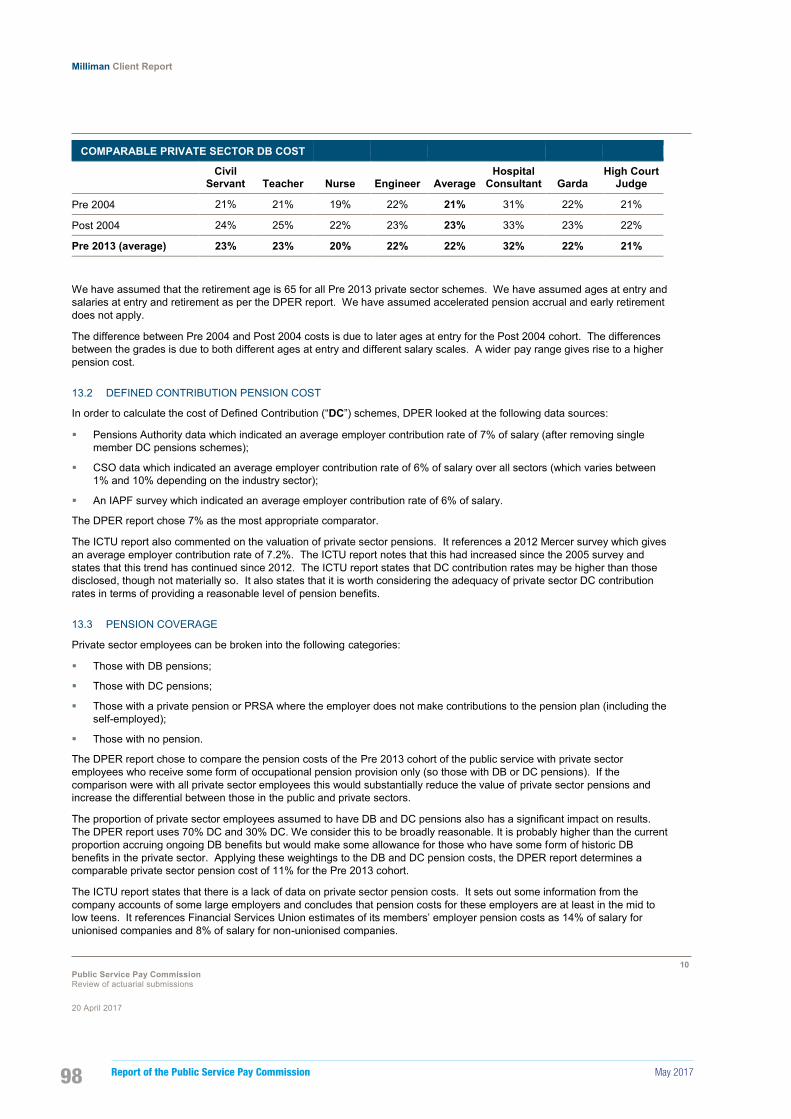
Report of the Public Service Pay Commission May 201798
Milliman Client Report
Public Service Pay Commission Review of actuarial submissions
20 April 2017
10
COMPARABLE PRIVATE SECTOR DB COST
Civil
Servant Teacher Nurse Engineer Average Hospital
Consultant Garda High Court
Judge
Pre 2004 21% 21% 19% 22% 21% 31% 22% 21%
Post 2004 24% 25% 22% 23% 23% 33% 23% 22%
Pre 2013 (average) 23% 23% 20% 22% 22% 32% 22% 21%
We have assumed that the retirement age is 65 for all Pre 2013 private sector schemes. We have assumed ages at entry and salaries at entry and retirement as per the DPER report. We have assumed accelerated pension accrual and early retirement does not apply.
The difference between Pre 2004 and Post 2004 costs is due to later ages at entry for the Post 2004 cohort. The differences between the grades is due to both different ages at entry and different salary scales. A wider pay range gives rise to a higher pension cost.
13.2 DEFINED CONTRIBUTION PENSION COST
In order to calculate the cost of Defined Contribution (“DC”) schemes, DPER looked at the following data sources:
Pensions Authority data which indicated an average employer contribution rate of 7% of salary (after removing single member DC pensions schemes);
CSO data which indicated an average employer contribution rate of 6% of salary over all sectors (which varies between 1% and 10% depending on the industry sector);
An IAPF survey which indicated an average employer contribution rate of 6% of salary.
The DPER report chose 7% as the most appropriate comparator.
The ICTU report also commented on the valuation of private sector pensions. It references a 2012 Mercer survey which gives an average employer contribution rate of 7.2%. The ICTU report notes that this had increased since the 2005 survey and states that this trend has continued since 2012. The ICTU report states that DC contribution rates may be higher than those disclosed, though not materially so. It also states that it is worth considering the adequacy of private sector DC contribution rates in terms of providing a reasonable level of pension benefits.
13.3 PENSION COVERAGE
Private sector employees can be broken into the following categories:
Those with DB pensions;
Those with DC pensions;
Those with a private pension or PRSA where the employer does not make contributions to the pension plan (including the self-employed);
Those with no pension.
The DPER report chose to compare the pension costs of the Pre 2013 cohort of the public service with private sector employees who receive some form of occupational pension provision only (so those with DB or DC pensions). If the comparison were with all private sector employees this would substantially reduce the value of private sector pensions and increase the differential between those in the public and private sectors.
The proportion of private sector employees assumed to have DB and DC pensions also has a significant impact on results. The DPER report uses 70% DC and 30% DC. We consider this to be broadly reasonable. It is probably higher than the current proportion accruing ongoing DB benefits but would make some allowance for those who have some form of historic DB benefits in the private sector. Applying these weightings to the DB and DC pension costs, the DPER report determines a comparable private sector pension cost of 11% for the Pre 2013 cohort.
The ICTU report states that there is a lack of data on private sector pension costs. It sets out some information from the company accounts of some large employers and concludes that pension costs for these employers are at least in the mid to low teens. It references Financial Services Union estimates of its members’ employer pension costs as 14% of salary for unionised companies and 8% of salary for non-unionised companies.

May 2017 Report of the Public Service Pay Commission 99
Milliman Client Report
Public Service Pay Commission Review of actuarial submissions
20 April 2017
11
The 11% proposed by the DPER report for the Pre 2013 cohort does not seen unreasonable, assuming the appropriate comparison is with private sector employees who receive some form of occupational pension provision only.
For Post 2013 members, the DPER report compares the cost to private sector employees in DC schemes only. This reflects the fact that most new entrants to private sector employment since 2013 are unlikely to enter a DB pension scheme. This is a reasonable comparison.

Report of the Public Service Pay Commission May 2017100
Milliman Client Report
Public Service Pay Commission Review of actuarial submissions
20 April 2017
12
ASSUMPTIONS
14 Economic Assumptions
A table of the key economic assumptions used in each submission is shown below.
ASSUMPTIONS DPER ICTU TEACHERS AGSI RACO GRA
Nominal Rates per annum:
Discount Rate (pre retirement) 3.5% 3.5% - 4.0% 4.0% 4.0% 4.0% N/A
Discount Rate (post retirement) 3.5%5 2.5%6 3.0% 3.0% 3.0% 3.5%
Salary Inflation 3.0% 2.5% 2.25% 2.25% 2.25% 1.5%
State Pension Increases 2.0% 2.5% 2.25% 2.25% 2.25% Unclear
Inflation Rate 2.0% 1.5% 1.5% 1.5% 1.5% 1.5%
Real rates per annum (net of price inflation):
Discount Rate (pre retirement) 1.5% 2.0% - 2.5% 2.5% 2.5% 2.5% N/A
Discount Rate (post retirement) 1.5% 1.5% 1.5% 1.5% 1.5% 2.0%
Salary Inflation 1.0% 1.0% 0.75% 0.75% 0.75% 0.0%
State Pension Increases 0.0% 1.0% 0.75% 0.75% 0.75% Unclear
Nominal rates (including inflation) and real rates (in excess of inflation) have both been shown for consistency as both types have been quoted in submissions. (The assumptions quoted in the ICTU report are actually net of salary inflation.)
Note that the inflation rate assumed is not a significant assumption, since both the investment returns and salary increases are assumed to be related to inflation.
However the discount rate used (in excess of inflation) and the salary inflation assumed (in excess of inflation) can have a significant impact on results. Therefore it is the comparison of the real rates shown above that is important. Both the public service and private sector costs are affected by these assumptions.
We are proposing the following set of assumptions as an appropriate basis. We have used these in our calculations set out in section 21 below.
ASSUMPTIONS
Real rates per annum (net of price inflation):
Discount Rate (pre retirement) 2.0% - 2.5%
Discount Rate (post retirement) 1.0%
Salary Inflation 1.0%
State Pension Increases 1.0%
Each of these items is discussed in more detail in the following paragraphs.
_______________________________________________________________________________ 5 The DPER report notes that the use of a single discount rate pre and post retirement is broadly equivalent to using a higher rate pre retirement and lower rate post retirement. 6 The ICTU report presents results on a range of pre and post retirement discount rates, however the final results shown are based on the discount rates included here.

May 2017 Report of the Public Service Pay Commission 101
Milliman Client Report
Public Service Pay Commission Review of actuarial submissions
20 April 2017
13
14.1 PRE RETIREMENT DISCOUNT RATE
There are several possible approaches to the discount rate. All submissions reviewed have used an approach reflecting the assumed investment return on notional assets held. This approach is consistent with the approach used for funded schemes in the private sector. The actual rates assumed are shown in the table above. The actual rates differ due to changes in assumptions in relation to assumed investment return on bonds and equities. This is an area of considerable debate.
The ICTU suggestion that a range of costs is considered depending on a range of discount rates is sensible. Note that this will impact the private sector cost in addition to the public service cost, although to a lesser extent.
There are accounting standards issued by the International Public Sector Accounting Standards Board (“IPSAS”). The C&AG report used an assumption based on the IPSAS 25 standard. This has since been replaced by the IPSAS 39 standard which sets out the standard to be applied when accounting for employee benefits. This states that the discount rate used should reflect the time value of money and that market yields at the reporting date on government bonds would normally provide the best approximation of the time value of money. The currency and term of the bonds selected should be consistent with the currency and estimated term of the benefits. If this approach was used this would result in a significantly lower discount rate and a significantly higher pension cost, both for the public service and the DB cost component of the private sector. The DPER report calculates a nominal return on long dated euro area government bonds of 1.6% which is equivalent to a negative real discount rate of (0.4%).
As mentioned in the DPER report, another possible approach to the discount rate is to use an approach consistent with International Accounting Standard (“IAS”) 19. In this case, the yield on high quality bonds would be used. DPER calculates an appropriate rate of 2.0% - 2.5% which is equivalent to a real discount rate of 0.0% - 0.5%.
An appropriate range of real discount rates to consider could be as follows:
1.5% - 2.5% using the approach used by funded schemes in the private sector;
0.25% as per the IAS 19 approach;
(0.4 %) as per the IPSAS 39 standard.
The discount rate has a significant impact on results. See section 20.1 below for sensitivities to this assumption. On balance the central range of 2.0% - 2.5% used by ICTU seems reasonable and is broadly consistent with the approach used in 2007.
14.2 POST RETIREMENT DISCOUNT RATE
Typically post retirement discount rates will be lower than pre retirement discount rates reflecting the likelihood that asset investments will move to use the best matching assets. Typically bond rates would be used post retirement and any equity risk premium assumed would be removed since assets are unlikely to be invested in equities post retirement.
Most submissions adjusted the post retirement discount rate, with the exception of the DPER submission which maintained the same discount rate. DPER notes that the use of 3.5% both pre and post retirement is broadly equivalent to using 5.0% pre retirement and 2.0% post retirement.
Again the ICTU suggestion that a range of costs is considered depending on a range of discount rates seems sensible, noting that this will impact the DB pension cost component of the private sector cost in addition to the public service cost. See section 20.1 below for sensitivities to this assumption. On balance a real discount rate post retirement of approximately 1% seems reasonable.
14.3 SALARY INFLATION RATE
The salary inflation rate used should reflect expectations of future salary increases in excess of inflation. The DPER report and ICTU report use an assumption of 1.0% which seems reasonable. This assumption has a significant impact on the result. See section 20.2 below for sensitivities to this assumption.
14.4 STATE PENSION INCREASES
For all submissions with the exception of the DPER report it is assumed that the State Pension will increase in line with salary inflation. DPER has assumed that the State Pension will increase in line with price inflation.
The National Pensions Framework7 published in 2010 stated that the Government is seeking to sustain the value of the State Pension (Contributory) at 35% of average earnings. Although there is a stated policy to maintain the value of the SPC at 35% of average earnings, no guarantees have been provided to either current or future pensioners that this will always be the case.
_______________________________________________________________________________ 7 http://www.welfare.ie/en/downloads/nationalpensionsframework_en.pdf
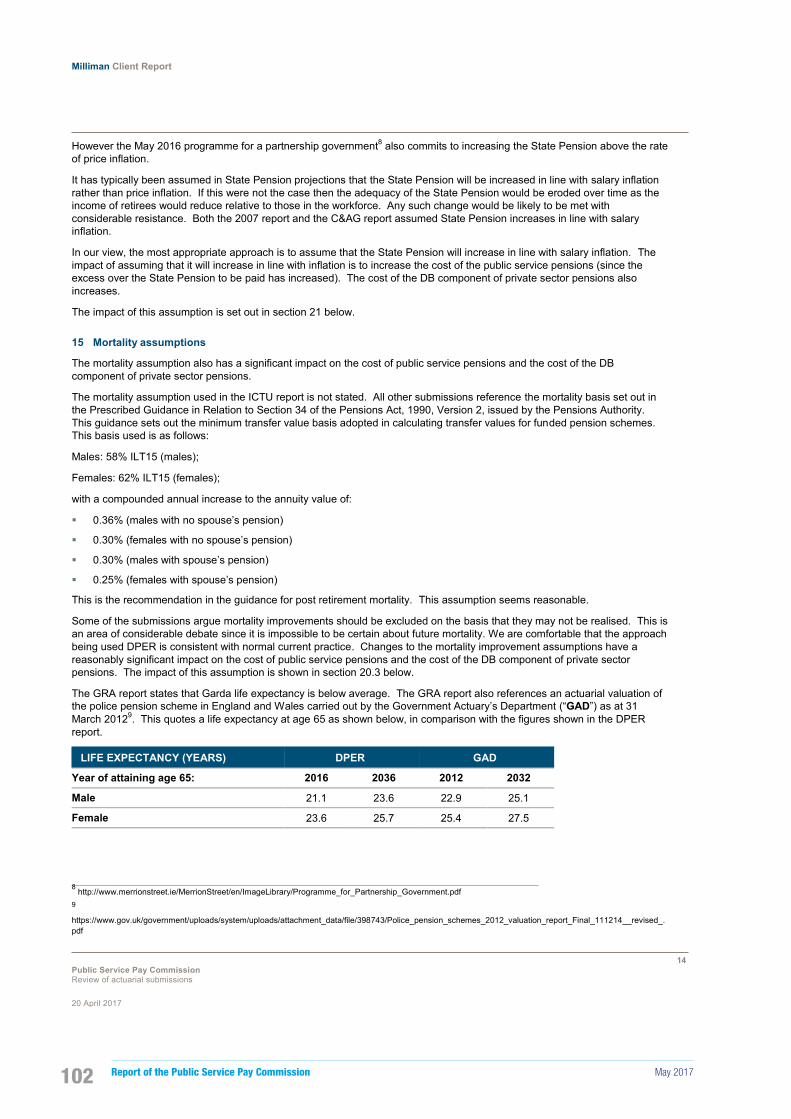
Report of the Public Service Pay Commission May 2017102
Milliman Client Report
Public Service Pay Commission Review of actuarial submissions
20 April 2017
14
However the May 2016 programme for a partnership government8 also commits to increasing the State Pension above the rate of price inflation.
It has typically been assumed in State Pension projections that the State Pension will be increased in line with salary inflation rather than price inflation. If this were not the case then the adequacy of the State Pension would be eroded over time as the income of retirees would reduce relative to those in the workforce. Any such change would be likely to be met with considerable resistance. Both the 2007 report and the C&AG report assumed State Pension increases in line with salary inflation.
In our view, the most appropriate approach is to assume that the State Pension will increase in line with salary inflation. The impact of assuming that it will increase in line with inflation is to increase the cost of the public service pensions (since the excess over the State Pension to be paid has increased). The cost of the DB component of private sector pensions also increases.
The impact of this assumption is set out in section 21 below.
15 Mortality assumptions
The mortality assumption also has a significant impact on the cost of public service pensions and the cost of the DB component of private sector pensions.
The mortality assumption used in the ICTU report is not stated. All other submissions reference the mortality basis set out in the Prescribed Guidance in Relation to Section 34 of the Pensions Act, 1990, Version 2, issued by the Pensions Authority. This guidance sets out the minimum transfer value basis adopted in calculating transfer values for funded pension schemes. This basis used is as follows:
Males: 58% ILT15 (males);
Females: 62% ILT15 (females);
with a compounded annual increase to the annuity value of:
0.36% (males with no spouse’s pension)
0.30% (females with no spouse’s pension)
0.30% (males with spouse’s pension)
0.25% (females with spouse’s pension)
This is the recommendation in the guidance for post retirement mortality. This assumption seems reasonable.
Some of the submissions argue mortality improvements should be excluded on the basis that they may not be realised. This is an area of considerable debate since it is impossible to be certain about future mortality. We are comfortable that the approach being used DPER is consistent with normal current practice. Changes to the mortality improvement assumptions have a reasonably significant impact on the cost of public service pensions and the cost of the DB component of private sector pensions. The impact of this assumption is shown in section 20.3 below.
The GRA report states that Garda life expectancy is below average. The GRA report also references an actuarial valuation of the police pension scheme in England and Wales carried out by the Government Actuary’s Department (“GAD”) as at 31 March 20129. This quotes a life expectancy at age 65 as shown below, in comparison with the figures shown in the DPER report.
LIFE EXPECTANCY (YEARS) DPER GAD
Year of attaining age 65: 2016 2036 2012 2032
Male 21.1 23.6 22.9 25.1
Female 23.6 25.7 25.4 27.5
_______________________________________________________________________________ 8 http://www.merrionstreet.ie/MerrionStreet/en/ImageLibrary/Programme_for_Partnership_Government.pdf 9 https://www.gov.uk/government/uploads/system/uploads/attachment_data/file/398743/Police_pension_schemes_2012_valuation_report_Final_111214__revised_.pdf

May 2017 Report of the Public Service Pay Commission 103
Milliman Client Report
Public Service Pay Commission Review of actuarial submissions
20 April 2017
15
We have not validated these life expectancy figures and the years shown are not consistent so the comparison is not fully appropriate. However it is clear that the life expectancy in the mortality assumptions used in the GAD report are higher than those used in the DPER report. The UK figures are based on experience of police in the UK. We don’t have equivalent experience in Ireland. However there would appear to be no prima facia evidence to support the assertion that Gardaí have lower life expectancy than other public servants.
16 Grade details
In the DPER report, assumptions have been made in relation to entry ages, retirement ages and pensionable salaries at entry and at retirement. These assumptions can have a considerable impact on the results for individual grades. In general, we have not validated the salaries and ages assumed since we do not have the relevant data. However we discuss below some particular considerations in relation to the assumptions used for particular grades in the DPER report.
16.1 PENSIONABLE ALLOWANCES
In some cases, pensionable salary is taken from data provided. In other cases, it is taken from the pay scale. The pay scale figures do not seem to have been adjusted for pensionable allowances. These pensionable allowances can be significant. For some grades (Nurse, Hospital Consultant and Garda), the pensionable salary at entry was taken from the pay scale and the pensionable salary at retirement was taken from the data (and presumably included pensionable allowances). This inconsistency could mean that the level of salary increase over the working life is overstated. This can have a significant impact on the cost of providing the final pension.
For example, for a nurse the salary at entry of €29,500 is taken from the pay scale but the salary at retirement of €59,800 was provided by the HSE based on recent retirements. In the 2007 report, a nurse’s salary at entry including pensionable allowances was assumed to be €37,000 and the salary at retirement was assumed to be €52,000. This suggests a much narrower pay range which reduces the cost. We estimate that DPER cost calculated for a Post 2004 cohort nurse of 25% would reduce to 22% if the salaries from the 2007 report were used.
Therefore an assessment of individual grades using the results in the DPER report may not be appropriate. However when averaged across all grades, this is unlikely to have a significant impact on the average cost.
16.2 COMPARABLE PAY SCALES
We note that for hospital consultants, for example, the salary at retirement is based on the pensionable salary at retirement for recent retirees. This may not be appropriate for recent entrants whose salary scales are lower than for those recently retiring. The IHCA report also notes that the salary scales of future retirees will be lower than those based on recent consultant retirements. Similar considerations may apply to other grades. The calculated pension costs for a particular grade should only be considered in conjunction with members on equivalent pay scales to those used for the calculation.
16.3 PROMOTIONAL INCREASES
The DPER report lists pensionable salary at entry and at retirement. It is not clear if the salary is assumed to increase evenly throughout the working life of the member. If increases in salary occur earlier in the working life of a member, this reduces the pension cost. This is because contributions received would be based on a higher level of pensionable salary throughout the member’s working life. (Conversely, if increases in salary occur later, this increases the cost). The impact of this could be reasonably significant overall. It is particularly significant for Post 2013 members where the pension is based on career average earnings. The IHCA report also notes this issue and states that a high proportion of salary increases occur in the early years of employment for consultants.
17 Other assumptions
There are many other assumptions made in the calculation of the pension costs. We have focussed on the assumptions that have the most significant impact on the results. Therefore we have not analysed any other assumptions used.

Report of the Public Service Pay Commission May 2017104
Milliman Client Report
Public Service Pay Commission Review of actuarial submissions
20 April 2017
16
RESULTS
18 Results
In this section we have referenced the results contained in the various submissions along with some estimates that we have calculated. We have not validated the calculations in the various submissions. We have conducted a high level review of the methodology, assumptions and results.
18.1 PRIVATE SECTOR
The DPER report shows a cost of 22% for private sector DB pensions and a cost of 7% for private sector DC pensions. The weightings applied assume that 30% of private sector employees have a DB pension and 70% have a DC pension. This gives a weighted average private sector cost of 11% (Pre 2013).
Post 2013 the DC cost of 7% is used.
The impact of varying the assumed weightings is shown in the table below as per the DPER report.
COST OF PRIVATE SECTOR PENSION
Weightings:
100% DB 22%
30% DB; 70% DC 11%
100% DC 7%
As noted in section 13 above, the DPER report compares the pension costs of the Pre 2013 cohort of the public service with private sector employees who receive some form of occupational pension provision only (so those with DB or DC pensions). If a wider comparison were used this would significantly impact the cost.
The ICTU report presents a range of costs for private sector DB pensions varying by the pre and post retirement discount rate assumed. Taking the same discount rates as the DPER report, the ICTU report shows a cost of 22% which is consistent.
The ICTU report sets out some information from the company accounts of some large employers and concludes that pension costs for these employers are at least in the mid to low teens. It references Financial Services Union estimates of its members employer pension costs as 14% of salary for unionised companies and 8% of salary for non-unionised companies.
The figures of 11% (for the Pre 2013 cohort) and 7% (for the Post 2013 cohort) proposed by the DPER report do not seem unreasonable, assuming that it is deemed appropriate to compare public service members with private sector employees who receive some form of occupational pension provision only.
18.2 PUBLIC SERVICE
18.2.1 Standard Accrual Categories
The table below sets out the results calculated in the DPER report for each grade in the standard accrual category.
DPER RESULTS
Pension cost net of employee contribution
Civil Servant Teacher Nurse Engineer Average
Hospital Consultant
Pre 2004 29% 30% 30% 36% 31% 50%
Post 2004 24% 26% 25% 29% 26% 39%
Pre 2013 (average) 27% 29% 28% 33% 29% 46%
Post 2013 8% 9% 8% 10% 9% 14%

May 2017 Report of the Public Service Pay Commission 105
Milliman Client Report
Public Service Pay Commission Review of actuarial submissions
20 April 2017
17
The ICTU report calculates the cost for a civil servant only (since this was closest to the cost for the public service as a whole in the 2007 report). The ICTU report presents a range of costs for private sector DB pensions varying by the pre and post retirement discount rate assumed. Taking the same discount rates as the DPER report, the costs calculated in the ICTU report are shown below.
ICTU RESULTS
Pension cost net of employee contribution
Civil Servant
Pre 2004 25%
Post 2004 22%
Pre 2013 (average) 23.5%
Post 2013 8%
The ICTU results are reasonably comparable with the costs calculated in the DPER report. We expect the main difference is the assumption in relation to future increases in the State Pension as discussed in section 14.4 above. (There may also be some differences in mortality assumptions.)
The Single Scheme Teachers report calculates a range of costs for teachers in the Post 2013 cohort. Allowing for mortality improvements and a starting age similar to that assumed in the DPER report the cost calculated is 6.7% gross of the PRD which is comparable with the 9% shown above for Post 2013 teachers. The lower cost in the Single Scheme Teachers report is likely to be due to the higher discount rate assumed.
The Early Career Teachers report calculates a range of costs for Post 2004 teachers. Allowing for mortality improvements and a starting age similar to that assumed in the DPER report the cost calculated is 16.3% gross of the PRD which is comparable with the 26% shown above for Post 2013 teachers. The lower cost in the Early Career Teachers report report is likely to be due to both the higher discount rate assumed and the lower salary inflation assumed.

Report of the Public Service Pay Commission May 2017106
Milliman Client Report
Public Service Pay Commission Review of actuarial submissions
20 April 2017
18
19 Fast Accrual Categories
The DPER report has split the grades used into “standard accrual categories” (civil servant, teacher, nurse, engineer) and “fast accrual categories” (Garda, high court judge). It is reasonable to split the grades in this manner so that policy decisions in relation to particular grades can be considered.
The DPER report notes that a significantly higher than average notional employer contribution rate is calculated for fast accrual categories. It states that this can be largely attributed to the shorter time periods (with associated higher accrual rates) over which Gardaí and judges can accrue their retirement benefits than is standard amongst public service employees. Gardaí also receive their retirement benefits from an earlier age than most other public service employees.
19.1 GARDA
The AGSI report suggests that the approach adopted by DPER overstates the cost of pensions for Gardaí. It suggests that the decision to require Gardaí to retire earlier than other public servants is a policy decision of Government. This policy decision leads to Gardaí having lower earnings during the period between their actual retirement and the retirement age of other public servants. While a pension is received during this interim period, the AGSI do not consider that the full additional cost of this extra pension should be taken into account in determining appropriate remuneration. Rather they point to the loss of earnings during this interim period compared with those who can continue to work. The GRA report also points to this lower earnings period.
The GRA report adjusts the pension for jobseekers benefit and jobseekers allowance on the basis that this would be payable to private sector employees if unemployed. However it is worth noting that the jobseekers allowance is means tested.
The decision on appropriate benchmarks and on what pension should be funded for Gardaí in light of their shorter working life is outside the scope of our work.
The AGSI report suggests separating the pension cost for Gardaí into that relating to normal retirement and that relating to earlier retirement. This is a useful way of examining the costs and we have presented some results on this basis below.
The table below sets out the results calculated in the DPER report for a Garda.
DPER RESULTS
Pension cost net of employee contribution Garda
Pre 2004 54%
Post 2004 53%
Pre 2013 (average) 53%
Post 2013 14%
Using the DPER assumptions we have calculated an estimated split of pension costs according to the following 3 methods:
A: Pension accruing at standard rates and retiring at age 60 / 65 / 68 for the cohorts Pre 2004, Post 2004 and Post 2013 respectively. Effectively this is the cost if Gardaí received benefits at the normal rate accrued by other Public Servants. In this scenario Gardaí would cease employment at 54 / 55 / 55 and receive a pension at age 60 / 65 / 68 that reflected their actual service. Since they would have less than 40 years’ service, they would not receive a full pension.
B: Pension accruing at accelerated rates and retiring at age 60 / 65 / 68 for the cohorts Pre 2004, Post 2004 and Post 2013 respectively. In this scenario Gardaí would retire at 54 / 55 / 55 but would receive a full pension at 60 / 65 / 68 as appropriate. So the pension is payable from the same age as A above but the amount of the pension is larger.
C: Pension accruing at accelerated rates and retiring at age 54 / 55 / 55 for the cohorts Pre 2004, Post 2004 and Post 2013 respectively (as per the DPER report). This is similar to B above but the pension is also payable between the actual retirement age to the normal retirement age of other public servants.
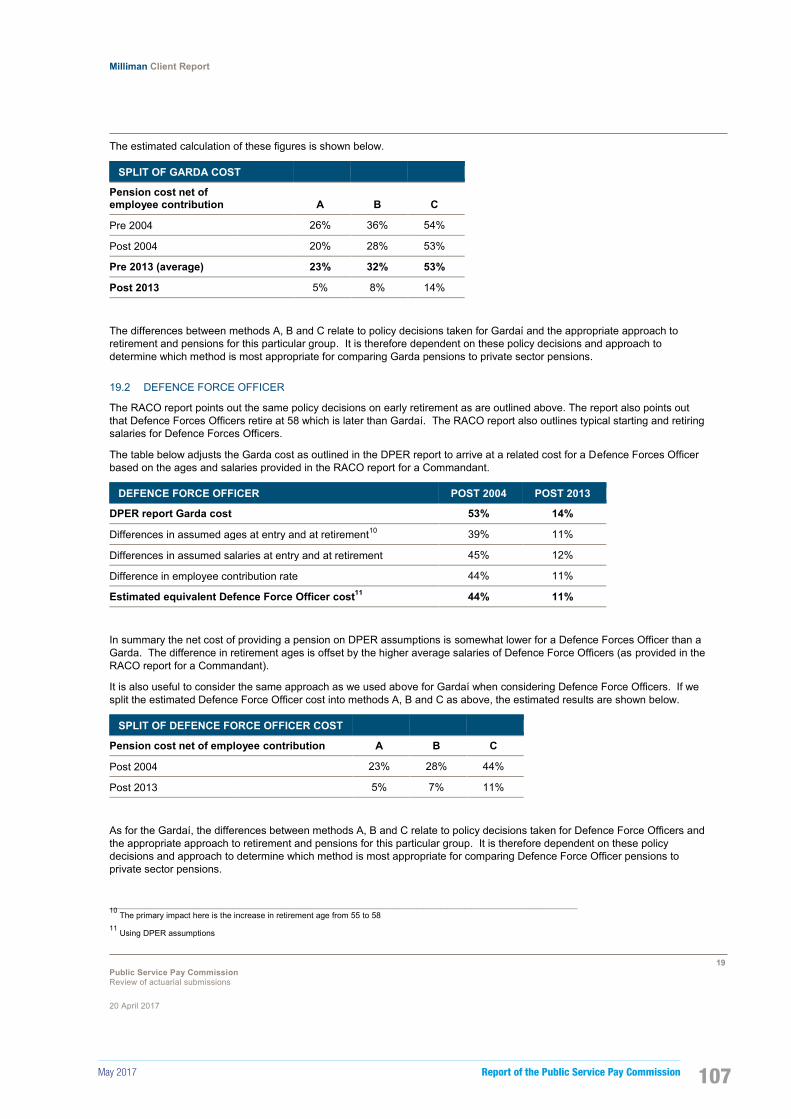
May 2017 Report of the Public Service Pay Commission 107
Milliman Client Report
Public Service Pay Commission Review of actuarial submissions
20 April 2017
19
The estimated calculation of these figures is shown below.
SPLIT OF GARDA COST
Pension cost net of employee contribution A B C
Pre 2004 26% 36% 54%
Post 2004 20% 28% 53%
Pre 2013 (average) 23% 32% 53%
Post 2013 5% 8% 14%
The differences between methods A, B and C relate to policy decisions taken for Gardaí and the appropriate approach to retirement and pensions for this particular group. It is therefore dependent on these policy decisions and approach to determine which method is most appropriate for comparing Garda pensions to private sector pensions.
19.2 DEFENCE FORCE OFFICER
The RACO report points out the same policy decisions on early retirement as are outlined above. The report also points out that Defence Forces Officers retire at 58 which is later than Gardaí. The RACO report also outlines typical starting and retiring salaries for Defence Forces Officers.
The table below adjusts the Garda cost as outlined in the DPER report to arrive at a related cost for a Defence Forces Officer based on the ages and salaries provided in the RACO report for a Commandant.
DEFENCE FORCE OFFICER POST 2004 POST 2013
DPER report Garda cost 53% 14%
Differences in assumed ages at entry and at retirement10 39% 11%
Differences in assumed salaries at entry and at retirement 45% 12%
Difference in employee contribution rate 44% 11%
Estimated equivalent Defence Force Officer cost11 44% 11%
In summary the net cost of providing a pension on DPER assumptions is somewhat lower for a Defence Forces Officer than a Garda. The difference in retirement ages is offset by the higher average salaries of Defence Force Officers (as provided in the RACO report for a Commandant).
It is also useful to consider the same approach as we used above for Gardaí when considering Defence Force Officers. If we split the estimated Defence Force Officer cost into methods A, B and C as above, the estimated results are shown below.
SPLIT OF DEFENCE FORCE OFFICER COST
Pension cost net of employee contribution A B C
Post 2004 23% 28% 44%
Post 2013 5% 7% 11%
As for the Gardaí, the differences between methods A, B and C relate to policy decisions taken for Defence Force Officers and the appropriate approach to retirement and pensions for this particular group. It is therefore dependent on these policy decisions and approach to determine which method is most appropriate for comparing Defence Force Officer pensions to private sector pensions.
_______________________________________________________________________________ 10 The primary impact here is the increase in retirement age from 55 to 58 11 Using DPER assumptions
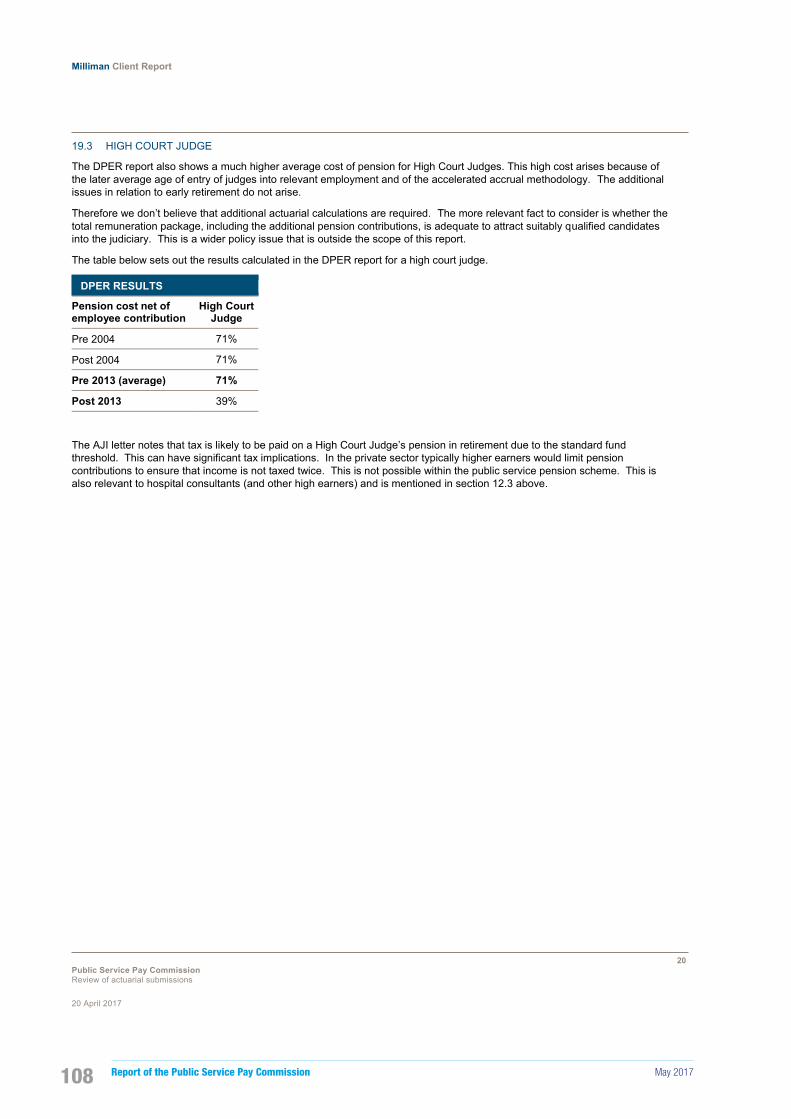
Report of the Public Service Pay Commission May 2017108
Milliman Client Report
Public Service Pay Commission Review of actuarial submissions
20 April 2017
20
19.3 HIGH COURT JUDGE
The DPER report also shows a much higher average cost of pension for High Court Judges. This high cost arises because of the later average age of entry of judges into relevant employment and of the accelerated accrual methodology. The additional issues in relation to early retirement do not arise.
Therefore we don’t believe that additional actuarial calculations are required. The more relevant fact to consider is whether the total remuneration package, including the additional pension contributions, is adequate to attract suitably qualified candidates into the judiciary. This is a wider policy issue that is outside the scope of this report.
The table below sets out the results calculated in the DPER report for a high court judge.
DPER RESULTS
Pension cost net of employee contribution
High Court Judge
Pre 2004 71%
Post 2004 71%
Pre 2013 (average) 71%
Post 2013 39%
The AJI letter notes that tax is likely to be paid on a High Court Judge’s pension in retirement due to the standard fund threshold. This can have significant tax implications. In the private sector typically higher earners would limit pension contributions to ensure that income is not taxed twice. This is not possible within the public service pension scheme. This is also relevant to hospital consultants (and other high earners) and is mentioned in section 12.3 above.

May 2017 Report of the Public Service Pay Commission 109
Milliman Client Report
Public Service Pay Commission Review of actuarial submissions
20 April 2017
21
20 Sensitivities
20.1 DISCOUNT RATE
As set out in section 14.1 above, a possible range of real discount rates to consider could be as follows:
(0.4%) as per the IPSAS 39 standard;
0.25% as per the IAS 19 approach;
1.5% - 2.5% using the approach used by funded schemes in the private sector (pre retirement) and a 1.0% discount rate post retirement
In this section we estimate the impact of using this range of discount rates on the calculated pension costs.
20.1.1 Private Sector
Applying the same weightings of 30% DB pension and 70% DC pension and the DC cost of 7% gives a range for the cost of private sector pensions for the Pre 2013 cohort comparable as follows:
PRIVATE SECTOR COST
Pre; Post retirement discount rate Cost
(0.4%); (0.4%) 17%
0.25%; 0.25% 15%
1.5%; 1.0% 12%
2.5%; 1.0% 10%
The discount rate doesn’t impact the Post 2013 cohort comparable of the 7% DC pension cost.
20.1.2 Public Service
We estimate that the average cost of Pre 2013 pensions in the public service would vary as follows under this range of discount rates:
PUBLIC SERVICE COST
Pre; Post retirement discount rate Pre 2013 Post 2013
(0.4%); (0.4%) 56% 14%
0.25%; 0.25% 45% 12%
1.5%; 1.0% 32% 8%
2.5%; 1.0% 26% 6%
20.1.3 Comparison
The comparison between public and private sector costs would therefore vary as follows under this range of discount rates:
COST COMPARISON PRE 2013
Pre; Post retirement discount rate Public Service Private Sector Differential
(0.4%); (0.4%) 56% 17% 39%
0.25%; 0.25% 45% 15% 30%
1.5%; 1.0% 32% 12% 20%
2.5%; 1.0% 26% 10% 16%

Report of the Public Service Pay Commission May 2017110
Milliman Client Report
Public Service Pay Commission Review of actuarial submissions
20 April 2017
22
COST COMPARISON POST 2013
Pre; Post retirement discount rate Public Service Private Sector Differential
(0.4%); (0.4%) 14% 7% 7%
0.25%; 0.25% 12% 7% 5%
1.5%; 1.0% 8% 7% 1%
2.5%; 1.0% 6% 7% (1%)
This illustrates the significant impact of the discount range approach on pension costs and comparisons.
20.2 SALARY INFLATION
The DPER report shows the impact on results of salary inflation on the Pre 2013 cohort as follows:
DPER RESULTS – PRE 2013
Pension cost net of employee contribution
Civil Servant Teacher Nurse Engineer Average
Hospital Consultant Garda
High Court Judge
Base Case 27% 29% 28% 33% 29% 46% 53% 71%
+0.5% Salary increases 34% 36% 36% 41% 37% 54% 65% 79%
- 0.5% Salary increases 21% 22% 22% 26% 23% 38% 42% 63%
As can be seen, the impact of the assumption for future salary inflation has a significant impact on the Pre 2013 pension costs.
The DPER report shows a very minor impact on the Post 2013 cohort for changes in salary inflation. This is because pension increases for this cohort are in line with price inflation and not salary inflation (although we would expect some impact since it affects salaries during the working life of the member).
20.3 MORTALITY
The DPER report shows the impact on results of life expectancy on the Pre 2013 cohort as follows:
DPER RESULTS – PRE 2013
Pension cost net of employee contribution
Civil Servant Teacher Nurse Engineer Average
Hospital Consultant Garda
High Court Judge
Base Case 27% 29% 28% 33% 29% 46% 53% 71%
Life expectancy + 1 year 28% 30% 30% 35% 31% 48% 55% 74%
Life expectancy - 1 year 26% 27% 27% 31% 28% 43% 50% 67%
The DPER report also calculates the impact of life expectancy on the Post 2013 cohort however this does not show a significant impact for this cohort with an impact of 1% or less for all grades except the High Court judge. (For the High Court judge the base figure of 39% for the Post 2013 cohort increases to 41% with a 1 year increase in life expectancy and falls to 36% with a 1 year decrease in life expectancy).
The Single Scheme Teachers report also calculates the impact of mortality improvements. In this report the impact on the cost is calculated to be just under 1%.

May 2017 Report of the Public Service Pay Commission 111
Milliman Client Report
Public Service Pay Commission Review of actuarial submissions
20 April 2017
23
21 Conclusion
21.1 PRIVATE SECTOR
We believe the cost of private sector costs shown in the DPER report is reasonable, although some adjustments could be made for the following:
A consideration of an appropriate range of discount rates;
State Pension increases in line with salary inflation.
As discussed in sections 14.1 and 14.2 above, an appropriate pre retirement discount rate range might be 2.0% - 2.5% and an appropriate post retirement discount rate might be 1.0%.
We therefore estimate that the average private sector cost using this range of discount rates and allowing for State Pension increases in line with salary inflation would be as shown in the table below.
PRIVATE SECTOR COST
Pre; Post retirement discount rate Cost
2.0%; 1.0% 11%
2.5%; 1.0% 10%
The impact of the change in State Pension increases is not material for the private sector cost. We believe these costs present a reasonable basis for comparison with public service pension costs for the Pre 2013 cohort.
For the Post 2013 cohort, the comparison to a 7% private sector DB pension cost is reasonable.
21.2 PUBLIC SERVICE
We believe the cost of public service pensions shown in the DPER report is reasonable, although some adjustments could be made for the following:
A consideration of an appropriate range of discount rates;
State Pension increases in line with salary inflation.
We therefore estimate that the average public service cost using this range of discount rates and allowing for State Pension increases in line with salary inflation would be as shown in the table below.
PUBLIC SERVICE AVERAGE COST
Pre; Post retirement discount rate Pre 2013 Post 2013
2.0%; 1.0% 25% 7%
2.5%; 1.0% 23% 6%
Consideration of the PRD which is calculated to be 5% on average for the standard accrual categories may also be appropriate.
21.3 COMPARISON
Cost comparisons allowing for these adjustments are shown in the table below for the Pre 2013 cohort.
COST COMPARISON PRE 2013
Pre; Post retirement discount rate Public Service Private Sector Differential
2.0%; 1.0% 25% 11% 14%
2.5%; 1.0% 23% 10% 13%

Report of the Public Service Pay Commission May 2017112
Milliman Client Report
Public Service Pay Commission Review of actuarial submissions
20 April 2017
24
Cost comparisons allowing for these adjustments are shown in the table below for the Post 2013 cohort.
COST COMPARISON POST 2013
Pre; Post retirement discount rate Public Service Private Sector Differential
2.0%; 1.0% 7% 7% 0%
2.5%; 1.0% 6% 7% (1%)
We believe that these are an appropriate basis for considering public service pension scheme members on average.
However considerations for particular grades may apply. Any consideration of individual grades would need to take into account:
The use of consistent entry ages in both the public service and private sector calculation;
The use of pensionable salaries at entry and at retirement that include pensionable allowances (in both the public service and private sector calculations);
The likelihood of promotional increases occurring earlier or later in the member’s working life;
The resulting impact of the PRD for that grade;
Any adjustment needed to split the cost between standard and early retirement;
Any policy decisions particular to that grade. This is particularly relevant to the faster accrual categories of employee.
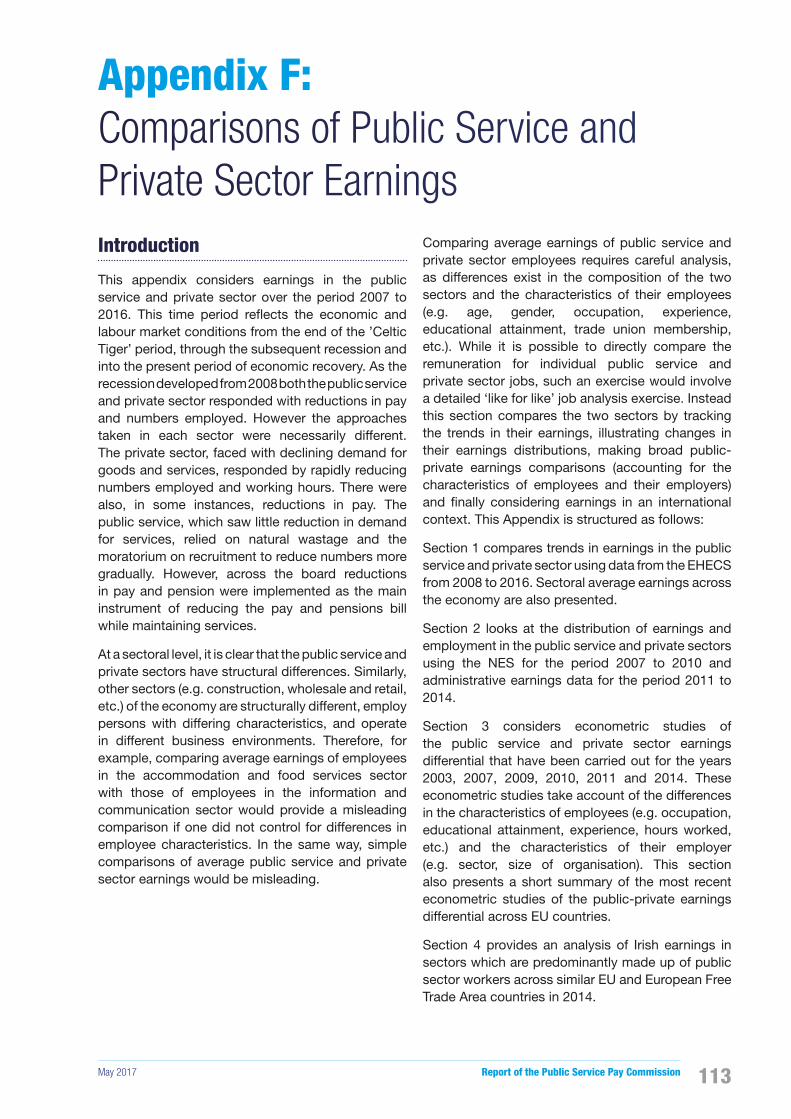
May 2017 Report of the Public Service Pay Commission 113
Introduction
This appendix considers earnings in the public service and private sector over the period 2007 to 2016. This time period re�ects the economic and labour market conditions from the end of the ’Celtic Tiger’ period, through the subsequent recession and into the present period of economic recovery. As the recession developed from 2008 both the public service and private sector responded with reductions in pay and numbers employed. However the approaches taken in each sector were necessarily different. The private sector, faced with declining demand for goods and services, responded by rapidly reducing numbers employed and working hours. There were also, in some instances, reductions in pay. The public service, which saw little reduction in demand for services, relied on natural wastage and the moratorium on recruitment to reduce numbers more gradually. However, across the board reductions in pay and pension were implemented as the main instrument of reducing the pay and pensions bill while maintaining services.
At a sectoral level, it is clear that the public service and private sectors have structural differences. Similarly, other sectors (e.g. construction, wholesale and retail, etc.) of the economy are structurally different, employ persons with differing characteristics, and operate in different business environments. Therefore, for example, comparing average earnings of employees in the accommodation and food services sector with those of employees in the information and communication sector would provide a misleading comparison if one did not control for differences in employee characteristics. In the same way, simple comparisons of average public service and private sector earnings would be misleading.
Comparing average earnings of public service and private sector employees requires careful analysis, as differences exist in the composition of the two sectors and the characteristics of their employees (e.g. age, gender, occupation, experience, educational attainment, trade union membership, etc.). While it is possible to directly compare the remuneration for individual public service and private sector jobs, such an exercise would involve a detailed ‘like for like’ job analysis exercise. Instead this section compares the two sectors by tracking the trends in their earnings, illustrating changes in their earnings distributions, making broad public-private earnings comparisons (accounting for the characteristics of employees and their employers) and �nally considering earnings in an international context. This Appendix is structured as follows:
Section 1 compares trends in earnings in the public service and private sector using data from the EHECS from 2008 to 2016. Sectoral average earnings across the economy are also presented.
Section 2 looks at the distribution of earnings and employment in the public service and private sectors using the NES for the period 2007 to 2010 and administrative earnings data for the period 2011 to 2014.
Section 3 considers econometric studies of the public service and private sector earnings differential that have been carried out for the years 2003, 2007, 2009, 2010, 2011 and 2014. These econometric studies take account of the differences in the characteristics of employees (e.g. occupation, educational attainment, experience, hours worked, etc.) and the characteristics of their employer (e.g. sector, size of organisation). This section also presents a short summary of the most recent econometric studies of the public-private earnings differential across EU countries.
Section 4 provides an analysis of Irish earnings in sectors which are predominantly made up of public sector workers across similar EU and European Free Trade Area countries in 2014.
Appendix F:Comparisons of Public Service and Private Sector Earnings

Report of the Public Service Pay Commission May 2017114
Section 1: Earnings Trends 2008 to 2016
Trends in the Labour Market
The private sector determine wages based upon the supply and demand for labour, as well as other factors such as �rms’ �nances, the economic climate, in�ation, local agreements and negotiations with trade unions and staff. This is largely a free market without interference by Government, but supported by institutions of the State, such as the Workplace Relations Commission and the Labour Court. Supply and demand in the labour market means that when there is excess labour supply and/or low labour demand, there is downward pressure on wages. High demand for labour and/or low supply of labour puts upward pressure on wages. There are many different types of jobs with varying skills and experience requirements, thus there are many different labour markets in existence in the private sector each with their own unique labour market dynamics.
Public service pay is determined by Government policy, the state of the national �nances and negotiations between trade unions and the Government. Public service pay is, for the most part, subject to labour market supply and demand. The pay determination processes of these two sectors are very different and thus the evolution of earnings over time will inherently be different.
Data Source
EHECS is a quarterly survey of �rms with 3 or more employees carried out by the CSO. It provides short-term earnings and labour costs data for the purpose of monitoring change in the labour market in Ireland and across the European Union.
EHECS data is available from Q1 2008 to Q4 2016 on a quarterly and annual basis. The data is presented annually in this report in order to remove seasonal �uctuations and aid interpretation.
The data collected by EHECS includes regular earnings, overtime earnings, irregular earnings (e.g. bonuses, allowances, back dated pay), contracted paid hours, overtime paid hours, employment, redundancy payments, statutory social contributions (PRSI), payments in kind (cost of housing, car, stock options, health insurance), employers contributions to pensions, training expenses and grants/subsidies.
Earnings aggregations referenced in this report refer to: Regular earnings + overtime earnings + irregular earnings + payments in kind.
Public Service / Private Sector
For the purpose of this report the public service refers to those employees in the Civil Service, Local Authorities, Education, Garda Síochána, Health Services, Defence Forces and NCSAs. Commercial State Agencies are considered to be private sector as remuneration in these organisations is not subject to FEMPI legislation. The private sector refers to employees of private enterprises and Commercial State Agencies in NACE sectors B to S.
Derived Variables
Earnings data, in some cases, is presented net of the public service PRD. This report refers to average earnings and hours, which have been derived as follows:
• Average Weekly Earnings: Total annual earnings divided by the average number of persons employed divided by 52 weeks.
• Average Hourly Earnings: Total annual earnings divided by total paid hours in the year.
• Average Weekly Paid Hours: Total annual paid hours divided by the average number of persons employed divided by 52. Total paid hours include contracted hours plus overtime hours.
Pension Related Deduction
The PRD was introduced in 2009 on a progressive basis and is still deducted from public service gross earnings. As EHECS cannot apply the PRD at an individual employee level the effective PRD rate, provided by DPER, is applied to the earnings of all public service enterprises. These average PRD rates are:
• 2009 = 5.92%1
• 2010 to 2012 = 7%
• 2013 to 2015 = 6.7%
• 2016 = 5.6%
• 2017 & 2018 = 5.3%
1 The PRD for 2009 = 5.92%(0%*2 months, 7.5%*2 months, 7%*8 months)

May 2017 Report of the Public Service Pay Commission 115
Average Employment
The number of people employed in a sector and the characteristics of those employees signi�cantly affects the earnings in the sector and how earnings evolve over time. In the private sector average employment decreased signi�cantly in 2009 (-10.3%) followed by subsequent decreases in 2010 (-3.8%) and 2011 (-1.1%), leaving average employment at 1.17 million, a decline of 14.8% from the 2008 level. Since 2011 average employment has increased each year to 2016 where it stood at 1.31 million, 4.4% below the 2008 level (see Figure F.1).
Employment in the public service decreased at a slower rate than the private sector from 2008 to 2011. These decreases were followed by more pronounced decreases in employment in 2012 and 2013, bringing public service employment to a series low of 334,900 in 2014, 10.8% below the 2008 level of 375,100. In 2015 and 2016 public service employment began to increase, with employment reaching 345,700 in 2016, 7.9% lower than employment in 2008 (see Figure F.1).
Figure F.1: Index of Employment for the Public Service and Private Sector, 2008-2016
80
85
90
95
100
105
2008 2009 2010 2011 2012 2013 2014 2015 2016
IND
EX
(20
08=1
00)
Private sector Public Service
Source: CSO, PSPC workings
The movements in employment experienced in both the public service and private sector have signi�cant effects on average earnings. For example, early retirement incentives tend to remove higher earners from the sector, thus dragging down average earnings. Recruitment embargos restrict the number of new entrants, putting upward pressure on average earnings as new entrants would have tended to be lower earners. Similarly, redundancies and recruitment affect average earnings in different ways depending on the characteristics of the employees that are let go or hired.
Average Weekly Earnings
Across the time period 2008 to 2016, public service average weekly earnings ranged between 47% and 33% higher than those in the private sector and between 40% and 25% higher net of the PRD22. As discussed previously averages are heavily affected by the different composition and characteristics of those working in each sector. Thus, simple earnings comparisons are misleading. The trends in public service and private sector earnings can however be useful as they illustrate how earnings have evolved over the period in the two structurally different labour markets.
Private sector average weekly earnings were €658 in 2008. With the onset of the �nancial crisis and recession in Ireland, earnings fell in each year to 2011 where they reached their lowest level of €636 per week. From 2011 private sector earnings increased each year, reaching €677 per week in 2016, 2.9% higher than the 2008 level and 6.3% higher than the 2011 series low.
In the public service average weekly earnings increased in 2009 to €949 per week, this was followed by decreases in 2010 and 2011. Public service earnings, net of PRD, decreased in 2009, 2010 and 2011 to a series low of €834 per week, a fall of 9.5% from the 2008 level. Average earnings increased in 2012 before falling again in 2013 and 2014. Public service earnings, net of PRD, increased in 2015 and 2016 to €847, 8.1% below 2008 levels.
2 Analysis that is ‘net of PRD’ reduces pay to re�ect the impact of PRD (i.e. earnings minus PRD)

Report of the Public Service Pay Commission May 2017116
Figure F.2 illustrates these trends, where in the private sector earnings decrease from 2008 to 2011 and the recovery in earnings after this point is evident. This can be compared to the larger cuts in earnings (when PRD is included) of the public service in 2009 and 2010, after which earnings have remained relatively �at.
Figure F.2: Index of Average Weekly Earnings for the Public Service and Private Sector, 2008-20163
85
90
95
100
105
2008 2009 2010 2011 2012 2013 2014 2015 2016
IND
EX
(20
08 =
100)
Private SectorPublic ServicePublic Service net of PRD
Source: CSO, PSPC workings
Average Hourly Earnings
Average hourly earnings re�ect changes in employees’ pay and the number of paid hours worked by employees in each sector. The private sector recorded average hourly earnings of €19.81 in 2008. Hourly earnings increased in 2009 and 2010, decreased in 2011 and then increased each year to 2016, to €20.96, 5.8% higher than in 2008.
In the public service average hourly earnings increased in 2009 before falling signi�cantly in 2010. Public service hourly earnings, net of PRD, fell in both 2009 and 2010. There were slight increases in 2011 and 2012, followed by decreases in hourly earnings in 2013, 2014 and 2015, followed by an increase in 2016. This left average hourly earnings net of PRD at €26.62, 10.1% lower than the 2008 level (see Figure F.3).
3 EHECS data relating to 2016 re�ects �nal data for Q1, Q2 and Q3 and preliminary data for Q4
Figure F.3: Index of Hourly Earnings for the Public Service and Private Sector, 2008-2016
85
90
95
100
105
110
2008 2009 2010 2011 2012 2013 2014 2015 2016
IND
EX
(200
8 =
100
)
Private SectorPublic Service
Public Service net of PRD
Source: CSO, PSPC workings
Average Weekly Paid Hours
The average number of weekly paid hours worked by employees in the public service and private sectors are illustrated in Figure F.4. In the private sector average weekly paid hours decreased by 3.1% in 2009. The average hours continued to fall each year to 2013 after which increases were seen from 2014 to 2016. In 2016 average weekly paid hours were 32.3 hours, 2.7% lower than in 2008.
The public service saw average weekly paid hours fall each year from 2008 to 2011, from 31.1 hours to 30.4 hours. Since 2011, average weekly paid hours have increased each year, with 31.8 hours recorded in 2016, 2.2% higher than the 2008 level.
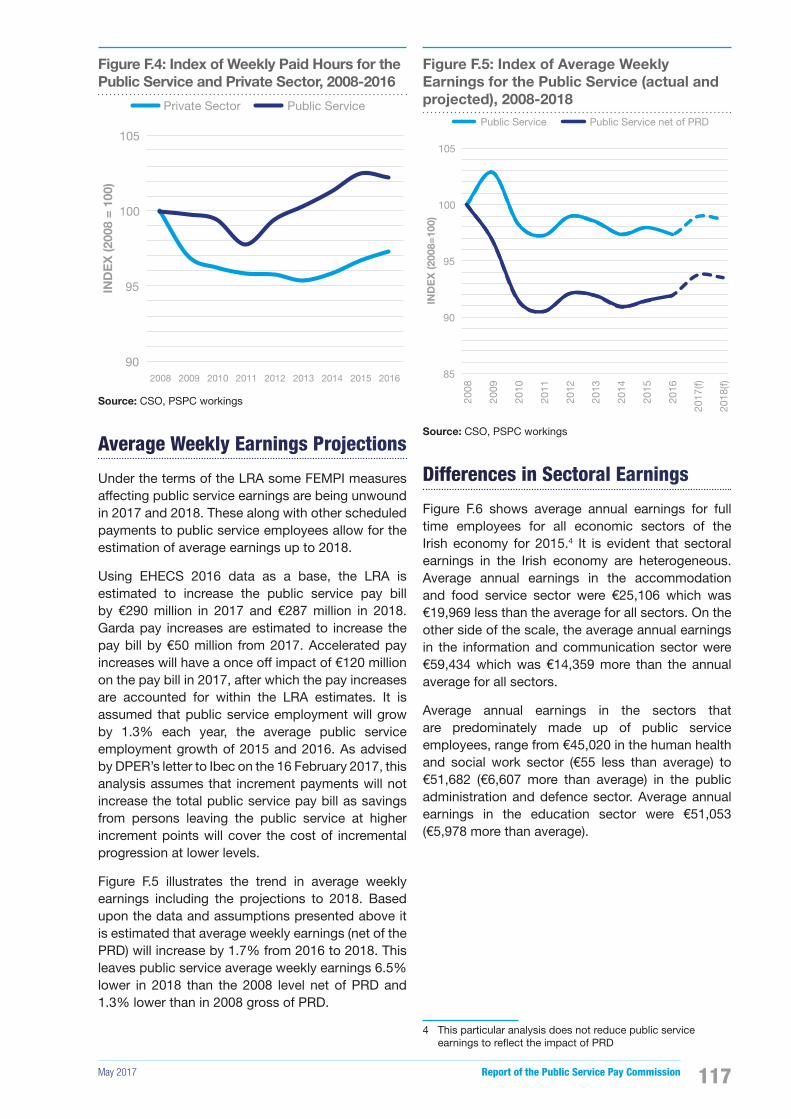
May 2017 Report of the Public Service Pay Commission 117
Figure F.4: Index of Weekly Paid Hours for the Public Service and Private Sector, 2008-2016
90
95
100
105
2008 2009 2010 2011 2012 2013 2014 2015 2016
IND
EX
(200
8 =
100
)Private Sector Public Service
Source: CSO, PSPC workings
Average Weekly Earnings Projections
Under the terms of the LRA some FEMPI measures affecting public service earnings are being unwound in 2017 and 2018. These along with other scheduled payments to public service employees allow for the estimation of average earnings up to 2018.
Using EHECS 2016 data as a base, the LRA is estimated to increase the public service pay bill by €290 million in 2017 and €287 million in 2018. Garda pay increases are estimated to increase the pay bill by €50 million from 2017. Accelerated pay increases will have a once off impact of €120 million on the pay bill in 2017, after which the pay increases are accounted for within the LRA estimates. It is assumed that public service employment will grow by 1.3% each year, the average public service employment growth of 2015 and 2016. As advised by DPER’s letter to Ibec on the 16 February 2017, this analysis assumes that increment payments will not increase the total public service pay bill as savings from persons leaving the public service at higher increment points will cover the cost of incremental progression at lower levels.
Figure F.5 illustrates the trend in average weekly earnings including the projections to 2018. Based upon the data and assumptions presented above it is estimated that average weekly earnings (net of the PRD) will increase by 1.7% from 2016 to 2018. This leaves public service average weekly earnings 6.5% lower in 2018 than the 2008 level net of PRD and 1.3% lower than in 2008 gross of PRD.
Figure F.5: Index of Average Weekly Earnings for the Public Service (actual and projected), 2008-2018
85
90
95
100
105
2008
2009
2010
2011
2012
2013
2014
2015
2016
2017
(f)
2018
(f)
IND
EX
(200
8=10
0)
Public Service Public Service net of PRD
Source: CSO, PSPC workings
Differences in Sectoral Earnings
Figure F.6 shows average annual earnings for full time employees for all economic sectors of the Irish economy for 2015.4 It is evident that sectoral earnings in the Irish economy are heterogeneous. Average annual earnings in the accommodation and food service sector were €25,106 which was €19,969 less than the average for all sectors. On the other side of the scale, the average annual earnings in the information and communication sector were €59,434 which was €14,359 more than the annual average for all sectors.
Average annual earnings in the sectors that are predominately made up of public service employees, range from €45,020 in the human health and social work sector (€55 less than average) to €51,682 (€6,607 more than average) in the public administration and defence sector. Average annual earnings in the education sector were €51,053 (€5,978 more than average).
4 This particular analysis does not reduce public service earnings to re�ect the impact of PRD
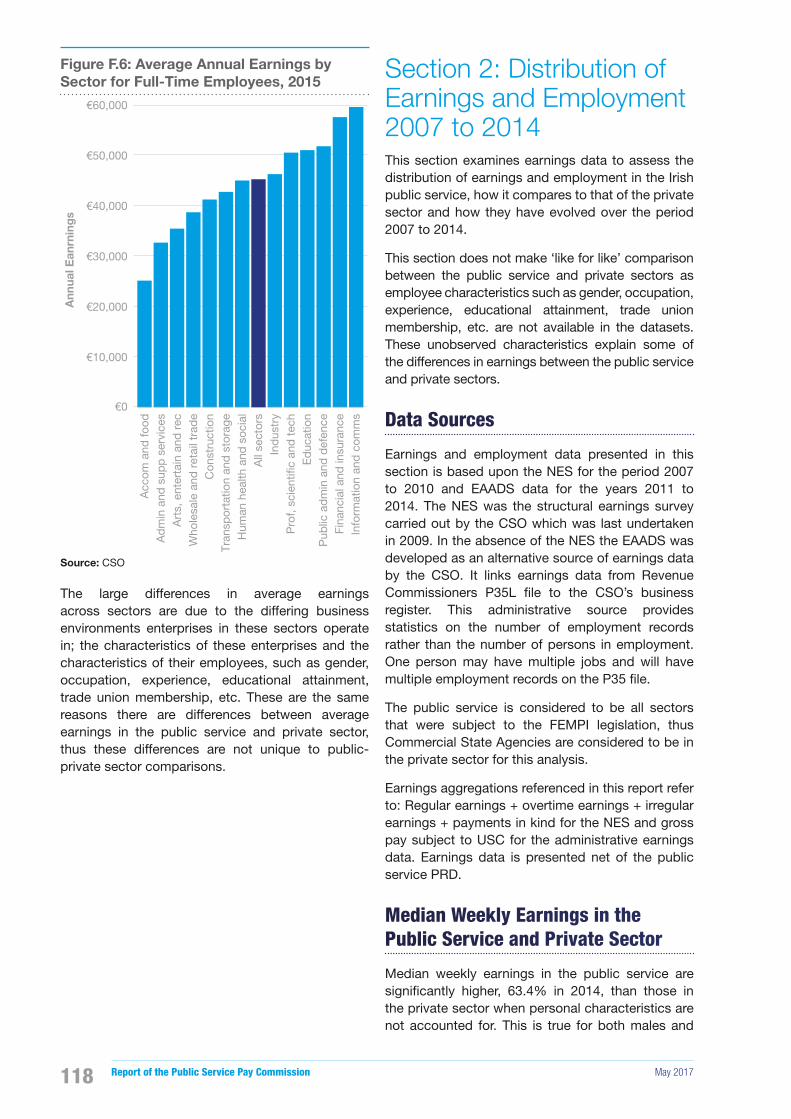
Report of the Public Service Pay Commission May 2017118
Figure F.6: Average Annual Earnings by Sector for Full-Time Employees, 2015
€10,000
€0
€20,000
€30,000
€40,000
€50,000
€60,000
Acc
om a
nd fo
odA
dm
in a
nd s
upp
ser
vice
sA
rts,
ent
erta
in a
nd r
ecW
hole
sale
and
ret
ail t
rad
eC
onst
ruct
ion
Tran
spor
tatio
n an
d s
tora
geH
uman
hea
lth a
nd s
ocia
lA
ll se
ctor
sIn
dus
try
Pro
f, sc
ient
i�c
and
tec
hE
duc
atio
nP
ublic
ad
min
and
def
ence
Fina
ncia
l and
insu
ranc
eIn
form
atio
n an
d c
omm
s
Ann
ual E
anrn
ing
s
Source: CSO
The large differences in average earnings across sectors are due to the differing business environments enterprises in these sectors operate in; the characteristics of these enterprises and the characteristics of their employees, such as gender, occupation, experience, educational attainment, trade union membership, etc. These are the same reasons there are differences between average earnings in the public service and private sector, thus these differences are not unique to public-private sector comparisons.
Section 2: Distribution of Earnings and Employment 2007 to 2014This section examines earnings data to assess the distribution of earnings and employment in the Irish public service, how it compares to that of the private sector and how they have evolved over the period 2007 to 2014.
This section does not make ‘like for like’ comparison between the public service and private sectors as employee characteristics such as gender, occupation, experience, educational attainment, trade union membership, etc. are not available in the datasets. These unobserved characteristics explain some of the differences in earnings between the public service and private sectors.
Data Sources
Earnings and employment data presented in this section is based upon the NES for the period 2007 to 2010 and EAADS data for the years 2011 to 2014. The NES was the structural earnings survey carried out by the CSO which was last undertaken in 2009. In the absence of the NES the EAADS was developed as an alternative source of earnings data by the CSO. It links earnings data from Revenue Commissioners P35L �le to the CSO’s business register. This administrative source provides statistics on the number of employment records rather than the number of persons in employment. One person may have multiple jobs and will have multiple employment records on the P35 �le.
The public service is considered to be all sectors that were subject to the FEMPI legislation, thus Commercial State Agencies are considered to be in the private sector for this analysis.
Earnings aggregations referenced in this report refer to: Regular earnings + overtime earnings + irregular earnings + payments in kind for the NES and gross pay subject to USC for the administrative earnings data. Earnings data is presented net of the public service PRD.
Median Weekly Earnings in the Public Service and Private Sector
Median weekly earnings in the public service are signi�cantly higher, 63.4% in 2014, than those in the private sector when personal characteristics are not accounted for. This is true for both males and

May 2017 Report of the Public Service Pay Commission 119
females; however median earnings for females in the public service were 86.9% higher than females in the private sector in 2014 compared to 59.0% higher for males.
Distribution of Employment in Public Service and Private Sector
Figure F.7 illustrates the number of public service and private sector employees, ranked together by earnings, in 2014. The public service has 21% of employees in the lower half of the distribution, in contrast 57% of private sector employees are in the bottom half of the distribution. From the 6th to the 9th deciles public service employment increases while the number of private sector employees in each decile falls. This trend ends with the 10th decile illustrating a divergence between public service and private sector. The 10th decile represents 9% of private sector employees and 12% of public service employees.
Ratio of High to Low Earners in Public Service and Private Sectors
Figure F.8 illustrates the ratio of earnings of the 90th to 10th percentile, indicating the difference in the distribution of earnings in the public service
and private sector, ranked separately, over the period 2008 to 2014. Over the period the private sector has a higher ratio than the public service, demonstrating the private sector’s broad earnings distribution compared to the public service’s narrower distribution. This narrower earnings range is a common feature of public service employment internationally (Dustmann and Van Soest, 1997).
In 2014 the ratio for the private sector was 6.9, this indicates that those at the top of the earnings distribution were earning 6.9 times the earnings of those at the bottom of the earnings distribution. In the public service the ratio was 3.6, which indicates that those at the top of the earnings distribution were earning 3.6 times the earnings of those at the bottom of the earning distribution. From 2008 to 2010 the private sector ratio increased while the public service ratio decreased. These movements indicate that the private sector earnings dispersion expanded over those years while the difference between the top and bottom earners in the public service narrowed.
Over the period 2011 to 2014 the public service ratio has continued to fall, further indicating a narrowing of the earnings gap between the high and low earners. At the same time the private sector ratio increased in 2012 and remained relatively �at to 2014.
Figure F.7: Numbers Employees by Decile in the Public Service and Private Sector, 2014
20,000
40,000
60,000
80,000
100,000
120,000
140,000
160,000
180,000
200,000
1st 2nd 3rd 4th 5th 6th 7th 8th 9th 10th
€0-€9,568
€9,569-€14,664
€14,665-€18,668
€14,669-€22,880
€22,881-€27,404
€27,405-€32,500
€32,501-38,896
€38,897-48,100
€48,101-62,764
€62,764+
NU
MB
ER
OF
EM
PLO
YE
ES
(HE
AD
CO
UN
T)
Private Sector Employment Public Service Employment
-
Source: CSO, PSPC workings

Report of the Public Service Pay Commission May 2017120
Figure F.8: Ratio of 90th to 10th Earnings Percentile in the Public Service and Private Sector, 2007-2014
0
1
2
3
4
5
6
7
8
2007 2008 2009 2010 2011 2012 2013 2014
National EmploymentSurvey
Administrative P35Earnings Data
RA
TIO
90T
H:1
0TH
PE
RC
EN
TIL
E
Private Sector Public Service (net of PRD) Series Break
Source: CSO, PSPC workings
Distribution of Earnings in Public Service and Private Sector, 2007 to 2010
The public service and private sector have large differences in the breadth of their earnings range. This section considers the public service and private sector, ranked separately, by earnings from 2007 to 2010.
Figure F.9 illustrates the percentage change in the earnings of every 10th percentile from 2007 to 2010, in public service earnings net of PRD. The private sector saw earnings fall across the earnings distribution, with the largest decreases in the lower percentiles and the smallest decreases in higher percentiles. The 20th percentile had the largest decrease from 2007 to 2010, falling 6.6% while the 70th percentile had the smallest decrease of 2.4%.
Public service earnings, net of PRD, increased in the 10th percentile from 2007 to 2010. All other percentiles have seen earnings decrease in the period. The changes to public service earnings show the progressive nature of the pay cuts over the period, with the highest percentiles experiencing the largest reduction and the lower percentiles seeing the smallest reduction and some increases. However, the 40th, 50th and 60th percentiles have earnings reductions greater than that of the 70th percentile.
Figure F.9: Percentage Change in Percentile Earnings of the Public Service and Private Sector, 2007-2010
%
%
%
%
%
10th 20th 30th 40th 50th 60th 70th 80th 90th % C
HA
NG
E I
N E
AR
NIN
GS
PERCENTILE OF EARNINGS DISTRIBUTION
Private Sector Public Service (net of PRD)
Source: CSO, PSPC workings
Distribution of Earnings in Public Service and Private Sector, 2011 to 2014
Figure F.10 considers the public service and private sector, ranked separately, by earnings from 2011 to 2014.
Over the period 2011 to 2014 private sector earnings increased across the earnings distribution, with increases between 1.2% and 1.5% in the 10th to the 70th percentiles, with the exception of the 20th percentile where earnings increased by 2.4%. The 80th and 90th percentiles had increases of 2.3% and 3.6% respectively. The public service increased earnings in each of the bottom three percentiles. The 40th to 70th percentiles experienced slight declines while the 80th and 90th percentiles fell by 2.0% and 4.0% respectively.
Figure F.10: Percentage Change in Percentile Earnings of the Public Service and Private Sector, 2011 to 2014
%
%
%
%
%
%
%
10th 20th 30th 40th 50th 60th 70th 80th 90th
% C
HA
NG
E I
N E
AR
NIN
GS
PERCENTILE OF EARNINGS DISTRIBUTION
Private Sector Public Service (net of PRD)
Source: CSO, PSPC workings
May 2017 Report of the Public Service Pay Commission 121
It is evident from these distribution analyses that changes in public service earnings have generally been progressive in nature, with the smallest earnings reductions and the largest earnings increases seen in the lower end of the distribution, while the largest decreases in earnings were in the upper percentiles. Changes in earnings across the private sector distribution illustrate the regressive nature of changes in earnings in that sector. The lower percentiles in the private sector experienced the highest cuts to earnings in the period 2007 to 2010 while the upper end of the distribution received the largest increases in earnings in the period 2011 to 2014.
Section 3: Econometric analysis of public-private earnings 2007 to 2014Econometric analyses of the public-private sector earnings differential have been undertaken in Ireland since 2004 when Boyle et al. (2004) carried out analysis of the public–private earnings differential using data from 1994 to 2001. The aim of this type of research is to identify the premium or discount attributable to the public service when compared to the private sector, while taking account of employee characteristics (e.g. gender, occupation, experience, educational attainment, trade union membership, etc.) and employer characteristics (sector, size class). Boyle et al. (2004) analysed European Community Household Panel data from 1994 to 2001; Ernst & Young and Murphy (2007) analysed NES 2003 data; Kelly et al. undertook a similar study in 2008 focusing on 2003 and 2006 NES data. Subsequently the CSO produced similar analyses for the years 2007, 2009 and 2010 using NES data. More recently the CSO published results of an econometric analysis for 2011 to 2014 based upon linked Quarterly National Household Survey (QNHS) and administrative earnings data.
The studies restricted the data to full-time, permanent employees aged between 25 and 59 and applied various model speci�cations in line with international best practice. Each analysis produced a range of outputs based upon the various model speci�cations chosen.
These econometric analyses do not replace job evaluations as the NES and the linked QNHS and administrative earnings dataset do not allow comparisons to be made between public service and private sector job content on a detailed ‘like for like’ basis. These pieces of research allow for the tracking of comparable public-private earning statistics across the earnings distribution and over time.
Results from several recent studies are presented to explore the evidence on how average public-private earnings differentials have developed over time in Ireland. As some of these public-private sector estimates were produced independently of each other, utilised different speci�cations and methodologies and have different data sources, they are not directly comparable with one another as absolute values. They do however provide a good indication of the trend in the public-private earnings differential over the period. The public-private sector differential estimates should not be taken as absolute values, they are statistical estimates that provide insight into the evolution of public service earnings premia or discounts over time and across the earnings distribution.
The Ordinary Least Squares (OLS) regression analysis presented below used the log of average weekly earnings, excludes PRD from public service earnings, uses data weighted to re�ect the national workforce, excludes company size as an explanatory variable and only considers permanent full-time employees aged 25-59. However there are some attributes that vary among the models used. NCSAs are considered private sector in 2003 and 2006, and are considered public sector from 2007 onwards. Commercial State Agencies are considered private sector for 2003, 2006 and 2009 to 2014, but were categorised as public sector in 2007. Also, the models from which results are drawn for 2007-2014 control for union membership, whereas those for earlier years do not. The Commission’s remit relates only to public service employees (i.e. excluding Commercial State Agencies but including NCSAs), so public service speci�c data is preferred where available.
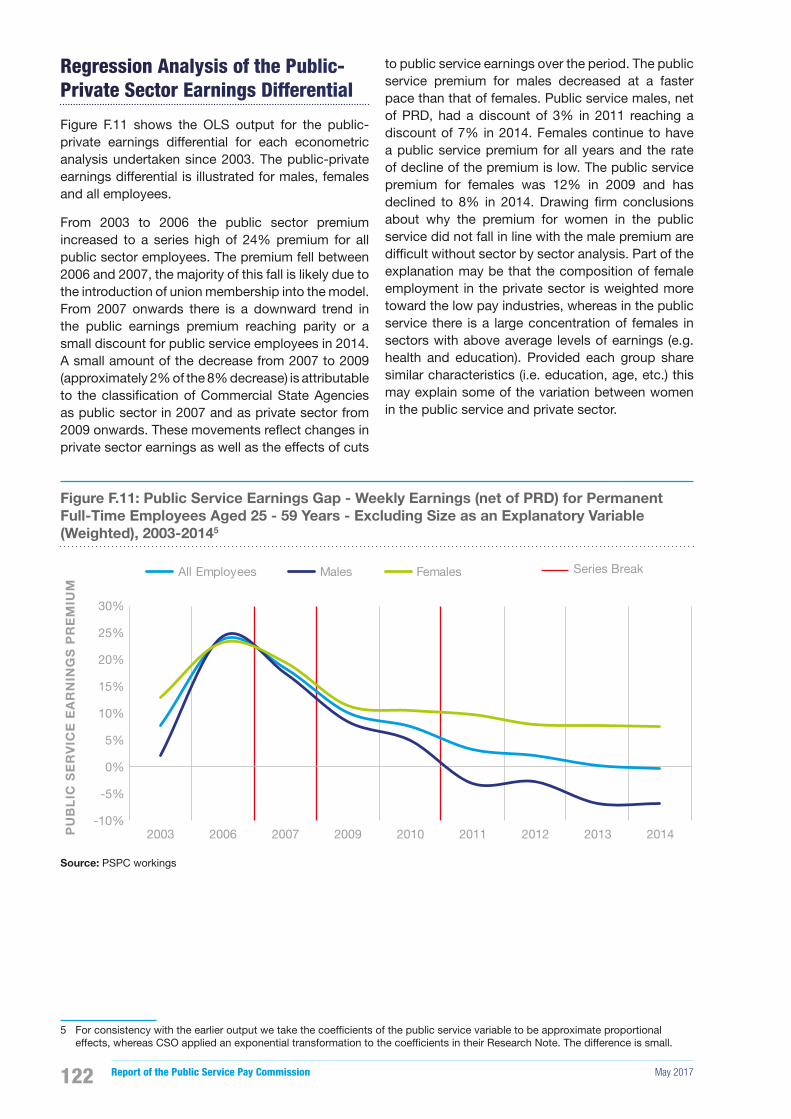
Report of the Public Service Pay Commission May 2017122
Regression Analysis of the Public-Private Sector Earnings Differential
Figure F.11 shows the OLS output for the public-private earnings differential for each econometric analysis undertaken since 2003. The public-private earnings differential is illustrated for males, females and all employees.
From 2003 to 2006 the public sector premium increased to a series high of 24% premium for all public sector employees. The premium fell between 2006 and 2007, the majority of this fall is likely due to the introduction of union membership into the model. From 2007 onwards there is a downward trend in the public earnings premium reaching parity or a small discount for public service employees in 2014. A small amount of the decrease from 2007 to 2009 (approximately 2% of the 8% decrease) is attributable to the classi�cation of Commercial State Agencies as public sector in 2007 and as private sector from 2009 onwards. These movements re�ect changes in private sector earnings as well as the effects of cuts
to public service earnings over the period. The public service premium for males decreased at a faster pace than that of females. Public service males, net of PRD, had a discount of 3% in 2011 reaching a discount of 7% in 2014. Females continue to have a public service premium for all years and the rate of decline of the premium is low. The public service premium for females was 12% in 2009 and has declined to 8% in 2014. Drawing �rm conclusions about why the premium for women in the public service did not fall in line with the male premium are dif�cult without sector by sector analysis. Part of the explanation may be that the composition of female employment in the private sector is weighted more toward the low pay industries, whereas in the public service there is a large concentration of females in sectors with above average levels of earnings (e.g. health and education). Provided each group share similar characteristics (i.e. education, age, etc.) this may explain some of the variation between women in the public service and private sector.
Figure F.11: Public Service Earnings Gap - Weekly Earnings (net of PRD) for Permanent Full-Time Employees Aged 25 - 59 Years - Excluding Size as an Explanatory Variable (Weighted), 2003-20145
-10%
-5%
0%
5%
10%
15%
20%
25%
30%
2003 2006 2007 2009 2010 2011 2012 2013 2014PU
BL
IC S
ER
VIC
E E
AR
NIN
GS
PR
EM
IUM
All Employees Males Females Series Break
Source: PSPC workings
5 For consistency with the earlier output we take the coef�cients of the public service variable to be approximate proportional effects, whereas CSO applied an exponential transformation to the coef�cients in their Research Note. The difference is small.
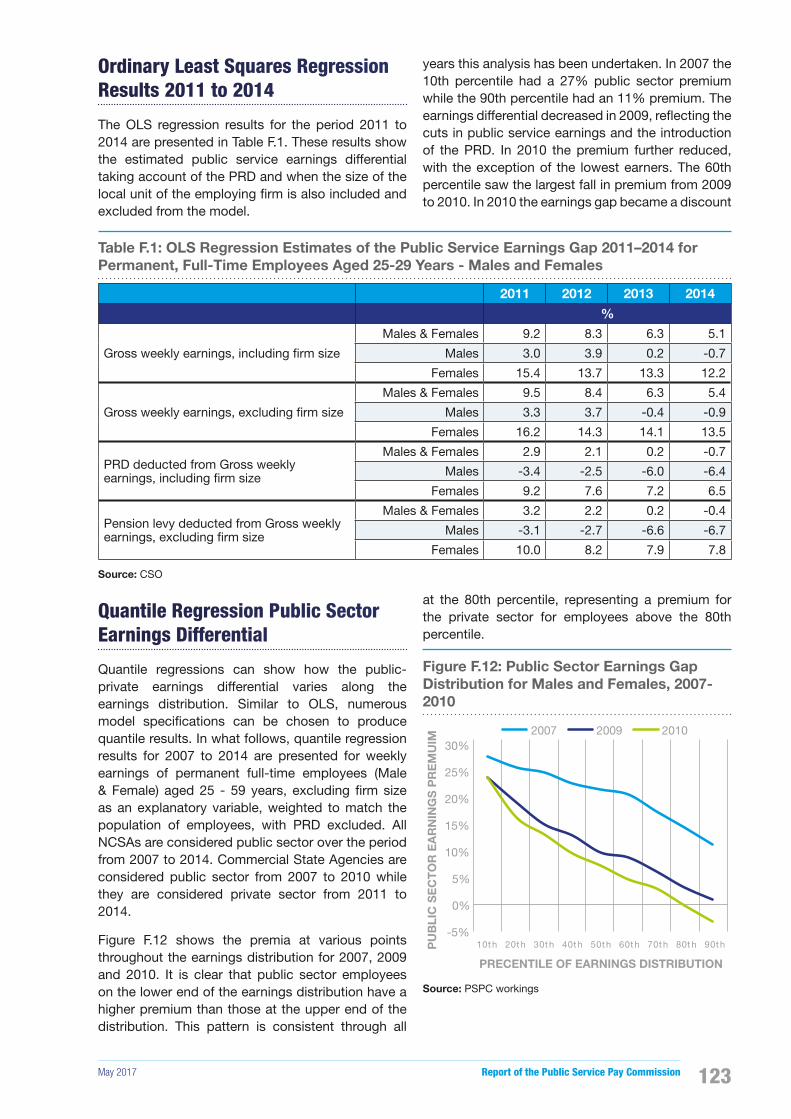
May 2017 Report of the Public Service Pay Commission 123
Ordinary Least Squares Regression Results 2011 to 2014
The OLS regression results for the period 2011 to 2014 are presented in Table F.1. These results show the estimated public service earnings differential taking account of the PRD and when the size of the local unit of the employing �rm is also included and excluded from the model.
Quantile Regression Public Sector Earnings Differential
Quantile regressions can show how the public-private earnings differential varies along the earnings distribution. Similar to OLS, numerous model speci�cations can be chosen to produce quantile results. In what follows, quantile regression results for 2007 to 2014 are presented for weekly earnings of permanent full-time employees (Male & Female) aged 25 - 59 years, excluding �rm size as an explanatory variable, weighted to match the population of employees, with PRD excluded. All NCSAs are considered public sector over the period from 2007 to 2014. Commercial State Agencies are considered public sector from 2007 to 2010 while they are considered private sector from 2011 to 2014.
Figure F.12 shows the premia at various points throughout the earnings distribution for 2007, 2009 and 2010. It is clear that public sector employees on the lower end of the earnings distribution have a higher premium than those at the upper end of the distribution. This pattern is consistent through all
years this analysis has been undertaken. In 2007 the 10th percentile had a 27% public sector premium while the 90th percentile had an 11% premium. The earnings differential decreased in 2009, re�ecting the cuts in public service earnings and the introduction of the PRD. In 2010 the premium further reduced, with the exception of the lowest earners. The 60th percentile saw the largest fall in premium from 2009 to 2010. In 2010 the earnings gap became a discount
at the 80th percentile, representing a premium for the private sector for employees above the 80th percentile.
Figure F.12: Public Sector Earnings Gap Distribution for Males and Females, 2007-2010
-5%
0%
5%
10%
15%
20%
25%
30%
10th 20th 30th 40th 50th 60th 70th 80th 90thPU
BLI
C S
EC
TO
R E
AR
NIN
GS
PR
EM
UIM
PRECENTILE OF EARNINGS DISTRIBUTION
2007 2009 2010
Source: PSPC workings
Table F.1: OLS Regression Estimates of the Public Service Earnings Gap 2011–2014 for Permanent, Full-Time Employees Aged 25-29 Years - Males and Females
2011 2012 2013 2014
%
Gross weekly earnings, including �rm size
Males & Females 9.2 8.3 6.3 5.1
Males 3.0 3.9 0.2 -0.7
Females 15.4 13.7 13.3 12.2
Gross weekly earnings, excluding �rm size
Males & Females 9.5 8.4 6.3 5.4
Males 3.3 3.7 -0.4 -0.9
Females 16.2 14.3 14.1 13.5
PRD deducted from Gross weekly earnings, including �rm size
Males & Females 2.9 2.1 0.2 -0.7
Males -3.4 -2.5 -6.0 -6.4
Females 9.2 7.6 7.2 6.5
Pension levy deducted from Gross weekly earnings, excluding �rm size
Males & Females 3.2 2.2 0.2 -0.4
Males -3.1 -2.7 -6.6 -6.7
Females 10.0 8.2 7.9 7.8
Source: CSO

Report of the Public Service Pay Commission May 2017124
Figure F.13 shows the premia/discounts at various points throughout the earnings distribution for 2011 to 2014. Again the public service premium was highest for those at the lower end of the earnings distribution. There was very little difference in the size of the premia at each decile between 2011 and 2012, at the 50th percentile the earnings gap was 3.4% in 2011 and 2.9% in 2012 and the percentile at which the earnings gap became a discount was the 61st percentile in 2011 and the 63rd percentile in 2012.
Between 2012 and 2013 the earnings gap decreased across each decile and particularly at the lower end of the earnings distribution, with the difference narrowing above the 50th percentile. In 2014 the earnings gap increased for the lowest on the distribution while it was very similar to 2013 from the 20th to the 40th percentile of earnings, with the public service discount increasing beyond that point. In 2013 the earnings gap became a discount at the 53rd percentile and in 2014 at the 49th percentile.
Figure F.13: Public Service Earnings Gap Distribution for Males and Females, 2011-2014
-15%
-10%
-5%
0%
5%
10%
15%
20%
25%
10t h 20t h 30th 40th 50th 60th 70th 80th 90th
PU
BLI
C S
ER
VIC
E E
AR
NIN
GS
PR
EM
IUM
PERCENTILE OF EARNINGS DISTRIBUTION
2011 2012 2013 2014
Source: CSO
Figure F.14 illustrates the public-private earnings differential at various points on the earnings distribution for male employees from 2007 to 2010. There was a signi�cant fall in the premia across the entire distribution between 2007 and 2009, with the largest fall in the premium seen on the upper end of the distribution. From 2009 to 2010 there is little change in the public sector premia up to the 30th percentile after which point the 2010 premia are lower compared to 2009 and become a discount at the 70th percentile.
Figure F.14: Public Sector Earnings Gap Distribution for Males, 2007-2010
-5%
0%
5%
10%
15%
20%
25%
30%
10th 20th 30th 40th 50th 60th 70th 80th 90thPU
BLI
C S
EC
TO
R E
AR
NIN
GS
PR
EM
IUM
PERCENTILE OF EARNINGS DISTRIBUTION
2007 2009 2010
Source: PSPC workings
The premia for males for each of the four years from 2011 to 2014 are illustrated in Figure F.15. In 2011 the earnings gap became a discount at the 46th percentile. This dropped to the 44th in 2012, the 28th in 2013 and in 2014.
Figure F.15: Public Service Earnings Gap Distribution for Males, 2011-2014
-20%
-15%
-10%
-5%
0%
5%
10%
15%
10th 20th 30th 40th 50th 60th 70th 80th 90th
PU
BLI
C S
ER
VIC
E E
AR
NIN
GS
PR
EM
IUM
PERCENTILE OF EARNINGS DISTRIBUTION
2011 2012 2013 2014
Source: CSO
Figure F.16 illustrates the public-private earnings differential at various points on the earnings distribution for female employees from 2007 to 2010. There was a signi�cant fall in the premium at the upper end of the earnings distribution between 2007 and 2009, with the 90th percentile premium falling from 15% to 2%. The scale of the fall in the public sector premium decreased further down the earnings distribution and below the 14th percentile the premium increased between 2007 and 2009. From 2009 to 2010 there was a consistent fall in the public sector earnings premium between the 20th and 70th percentiles. The public sector premium for females reached parity with the private sector above the 80th percentile in 2010.

May 2017 Report of the Public Service Pay Commission 125
Figure F.16: Public Sector Earnings Gap Distribution for Females, 2007-2010
35%
30%
25%
20%
15%
10%
5%
0%
-5%10th 20th 30th 40th 50th 60th 70th 80th 90thP
UB
LIC
SE
CT
OR
EA
RN
ING
S P
RE
MIU
M
PERCENTILE OF EARNINGS DISTRIBUTION
2007 2009 2010
Source: PSPC workings
Figure F.17 shows the public service premia for females for the period 2011 to 2014. The size of the earnings gap at each decile has not changed as much for females between the four years as it did for males. In 2011 the earnings gap became a discount at the 78th percentile. This remained the case in 2012, and 2013 and dropped to the 69th percentile in 2014.
Figure F.17: Public Service Earnings Gap Distribution for Females, 2011-2014
35%30%25%20%15%10%5%0%
-5%-10%-15%
10th 20th 30th 40th 50th 60th 70th 80th 90th
PU
BLI
C S
ER
VIC
E E
AR
NIN
GS
PR
EM
IUM
PERCENTILE OF EARNINGS DISTRIBUTION
2011 2012 2013 2014
Source: CSO
Robustness Tests6
The precise level of the estimated public service premium is somewhat sensitive to the set of controls that is included. In particular, omitting size class, union membership or occupation controls tends to increase the estimated average public service premium. Taking the example of union membership, union members earn more on average and union representation is strong in the public service. Omitting the union membership variable would lead to this extra premium being attributed to the public service. The premium for
6 The analysis for the robustness tests includes PRD in public service earnings (i.e. excluding Commercial State Agencies), uses data weighted to re�ect the national workforce, includes company size as an explanatory variable and only considers permanent full-time employees aged 25-59
union membership could be attributed to the bene�ts of collective bargaining, particularly in the case of lower paid employees. Union membership should theoretically be included in the model if it re�ects an independent pay determining factor in the context of public service and private sector employees. However, the instability of the public service coef�cient as union membership is included or excluded from the model raises some doubt about how well the public service effect is identi�ed. However, when analysing the trend in public-private earnings differentials, the inclusion or exclusion of speci�c variables is less important than the consistency of the model chosen over time. This analysis presents the most consistent results available to illustrate these trends.
Figure F.18 illustrates that the public service earnings differential is approximately 6 percentage points higher when union membership is excluded from the model. This effect is consistent over the years 2011 to 2014. It should also be noted that the relative public service premium across the income distribution is not sensitive to inclusion of these variables (see Figure F.19).
Figure F.18: Public-Private Earnings Gap including and excluding Union Membership (2011-2014)
12%
10%
8%
6%
4%
2%
0%
-2%2011 2012 2013 2014
PU
BLI
C S
ER
VIC
E E
AR
NIN
GS
PR
EM
IUM
Original Without Trade Union
Figure F.19: Public-Private Earnings Gap Across Percentiles of the Earnings Distribution (2014)
25%
20%
15%
10%
5%
0%
-5%
-10%10th 20th 30th 40th 50th 60th 70th 80th 90th P
UB
LIC
SE
RV
ICE
EA
RN
ING
S P
RE
MIU
M
PERCENTILE OF EARNINGS DISTRIBUTION
Without Occupation Without Trade Union Membership
Original
Source: CSO

Report of the Public Service Pay Commission May 2017126
Findings Emerging from Irish Econometric Analysis
The estimated public service earnings premium is substantially smaller than the raw premium in average earnings which is widely reported. Controlling for the difference in the characteristics of employees, the earnings differential between the public service and private sector declined in the period 2007 to 2014. The public-private earnings differential fell most signi�cantly from 2007 to 2010 with the introduction of public service pay cuts and the PRD. The precise estimated level of the premium is too sensitive to model speci�cation (e.g. whether union membership is included) to be provide a de�nitive premium, but the trend in the premium and the distributional pattern are stable with respect to the models presented.
Higher public service earnings premia are present at the lower end of the earnings distribution and discounts are present at the upper end of the distribution. Over the period the point at which the public service premium became a discount has decreased. It is likely that the premium has continued to decrease in 2015 and 2016 as private sector earnings continued to increase at a faster pace than public service earnings.
The Gap between Public and Private Earnings: International Evidence
In the context of subdued economic growth, European governments attempted to consolidate national �nances and strengthen their �scal positions. There is a large volume of literature that analyses the public-private earnings gap using micro-data for individual EU countries, including the recent analysis by the CSO of the Irish public-private earnings differential discussed above. Most of these studies conclude that there exists a signi�cant earnings differential between the two sectors. Moreover, this public service premium is generally found to be higher for women than for men, and higher at the lower end of the income distribution.
Two recent studies, Giordano et al. (2011) and De Castro et al. (2013), have assessed the size of the earnings gap between the public and private sectors across EU countries.
Giordano et al. (2011) investigated the public-private earning differentials in ten Euro Area countries7 using micro-data taken from the EU-SILC database. Their study focuses on the period from 2004-2007. Their
7 Austria, Belgium, France, Germany, Greece, Ireland, Italy, Portugal, Slovenia and Spain
results suggest a conditional earnings differential in favour of the public sector that is generally higher for women, for workers at the low end of the earnings distribution and workers in the education and public administration sectors rather than in the health sector. Notable differences emerge across countries, with Greece, Ireland, Italy, Portugal and Spain exhibiting higher public sector premiums than other countries.
De Castro et al. (2013) considered the public-private earnings differentials in 26 European countries using micro-data taken from the Structure of Earnings Survey in 2010. Their analysis �nds that public sector employees earn on average higher earnings than their counterparts in the private sector. This result is observed in most of the countries assessed in this study, namely Austria, Belgium, Cyprus, Germany, Spain, Greece, Ireland, Italy, Luxembourg, Poland, Portugal and Slovenia. By contrast, privately-employed workers appear to enjoy higher earnings in Bulgaria, the Czech Republic, Denmark, Estonia, Finland, France, Hungary, Latvia and Slovakia. The highest positive earnings gaps in the public sector are found in Cyprus, Ireland, Luxembourg, and to a lesser extent in Belgium, Germany, Spain, Italy and Portugal. This study �nds a public sector premium that is higher for older workers, and lower skilled workers typically occupying lower job positions. Contrary to other empirical papers, this study does not �nd evidence of a higher positive earning gap for women. However, in most cases women in countries that became EU members after 2004 tend to have lower earnings in the public sector than their male counterparts, whereas in countries that became EU Member States prior to 2004 the opposite is true.
In summary, studies focusing on EU countries in the late 2000s �nd a public sector premium for the majority of EU countries. Both studies �nd a higher earnings differential for those in the public sector that occupy jobs at the lower end of the earnings distribution and for women in countries that were members of the EU prior to 2004. In relation to Ireland, these studies �nd a public-private premium among the highest in the EU.
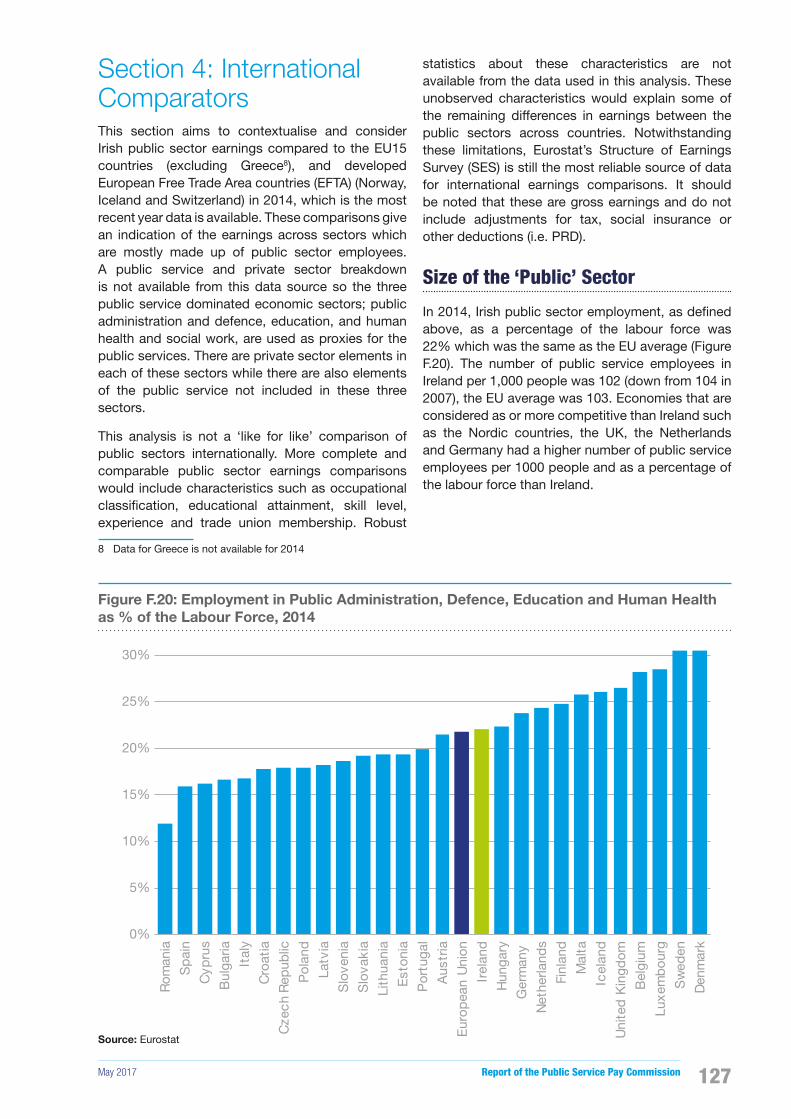
May 2017 Report of the Public Service Pay Commission 127
Section 4: International ComparatorsThis section aims to contextualise and consider Irish public sector earnings compared to the EU15 countries (excluding Greece8), and developed European Free Trade Area countries (EFTA) (Norway, Iceland and Switzerland) in 2014, which is the most recent year data is available. These comparisons give an indication of the earnings across sectors which are mostly made up of public sector employees. A public service and private sector breakdown is not available from this data source so the three public service dominated economic sectors; public administration and defence, education, and human health and social work, are used as proxies for the public services. There are private sector elements in each of these sectors while there are also elements of the public service not included in these three sectors.
This analysis is not a ‘like for like’ comparison of public sectors internationally. More complete and comparable public sector earnings comparisons would include characteristics such as occupational classi�cation, educational attainment, skill level, experience and trade union membership. Robust
8 Data for Greece is not available for 2014
statistics about these characteristics are not available from the data used in this analysis. These unobserved characteristics would explain some of the remaining differences in earnings between the public sectors across countries. Notwithstanding these limitations, Eurostat’s Structure of Earnings Survey (SES) is still the most reliable source of data for international earnings comparisons. It should be noted that these are gross earnings and do not include adjustments for tax, social insurance or other deductions (i.e. PRD).
Size of the ‘Public’ Sector
In 2014, Irish public sector employment, as de�ned above, as a percentage of the labour force was 22% which was the same as the EU average (Figure F.20). The number of public service employees in Ireland per 1,000 people was 102 (down from 104 in 2007), the EU average was 103. Economies that are considered as or more competitive than Ireland such as the Nordic countries, the UK, the Netherlands and Germany had a higher number of public service employees per 1000 people and as a percentage of the labour force than Ireland.
Figure F.20: Employment in Public Administration, Defence, Education and Human Health as % of the Labour Force, 2014
Source: Eurostat
35%
30%
25%
20%
15%
10%
5%
0%
Rom
ania
Sp
ain
Cyp
rus
Bul
garia
Ital
y
Cro
atia
Cze
ch
Rep
ublic
Pol
and
Latv
ia
Slo
veni
a
Slo
vaki
a
Lith
uani
a
Est
onia
Por
tuga
l
Aus
tria
Eur
opea
n U
nion
Irel
and
Hun
gary
Ger
man
y
Net
herla
nds
Finl
and
Mal
ta
Icel
and
Uni
ted
Kin
gdom
Bel
gium
Luxe
mb
ourg
Sw
eden
Den
mar
k

Report of the Public Service Pay Commission May 2017128
International ‘Public Sector’ Earnings
The aim of this international analysis is to establish whether remuneration in the public sector is unusually low compared to other countries where Irish people have the automatic right to work (i.e. the EU) or in countries where earning levels effects Irish earnings levels. Research has shown that earning levels in other countries such as the UK have had signi�cant effects on the Irish labour market for many years (Curtis & FitzGerald, 1996) and evidence presented to the Commission suggests that within a limited number of sectors, (e.g. health sector), there is an international labour market with staff moving to and from other countries in signi�cant numbers. Where this is the case, setting pay levels considerably lower than the international norms may impact on recruitment and retention.
Data on emigration9 from Eurostat indicates that 54% of Irish emigrants in 2015 migrated to a European country. The UK was the most popular destination accounting for 23% of Irish emigrants. North American and Australia & New Zealand were the next most popular destinations with 16% and 11% respectively.
Figure F.21: Emigration by Country of Next Usual Residence, 2015
31%
23%16%
11%
19%
EU (excluding UK)
UK
North America
Australia & New Zealand
Other
Source: Eurostat
9 This includes all people who emigrated from Ireland in 2015, including public service and private sector employees.
Ideally this analysis would focus speci�cally on EU countries as well as North America, Australia and New Zealand. However there would not appear to be a consistent international data source for worldwide comparisons across sectors. The OECD collects information in relation to international earnings but due to considerable differences in methodologies across countries these are not included in this report. Therefore this analysis uses Eurostat’s SES database to compare against similar countries within the EU and the European Free Trade Area (EFTA).
Data Sources and Definitions
Data from Eurostat’s SES is used to analyse data on earnings across EU Member States and EFTA countries. The objective of the SES is to provide accurate and harmonised data on earnings across the EU for policy-making and research purposes. The statistics of the SES refer to enterprises with at least 10 employees operating in all areas of the economy10 de�ned in the Statistical Classi�cation of Economic Activities in the European Community (NACE).
In 2014 in Ireland, this survey was carried out using P35 and Census 2011 administrative data. As not all the required data was available from administrative sources, it was necessary to model and forecast some variables (i.e. occupation, education, hours worked, full-time/part-time, etc.). An initial analysis of Census of Population 2016 results indicates a large change in these variables over the period 2011 to 2016. Therefore it is unrealistic to assume that 2011 data accurately re�ects the reference period 2014. Consequently disaggregated variables from the SES such as occupational classi�cation, education, etc. have not been analysed in this report.
All earnings reported and analysed in this analysis are in Eurostat’s Purchasing Power Standard (PPS) which is an arti�cial currency unit. Purchasing power parity means equalising the purchasing power of two currencies by taking into account the cost of living and in�ation differences. Theoretically, one PPS can buy the same amount of goods and services in each country.
10 Information on public administration is only available from some countries on a voluntary basis.

May 2017 Report of the Public Service Pay Commission 129
Analysis of International ‘Public Sectors’
Table F.2 shows the rankings of average annual earnings for the industry, services and construction sector (i.e. excluding public admin and defence11), public administration and defence sector, the education sector and the human health and social work sector.
11 Public administration and defence are excluded because not all countries report these �gures and including the sector would result in a null value for a number of countries.
Ireland had the 9th highest average annual earnings of the 17 countries considered in the industry construction and service sectors which is the broadest measure of average earnings in each country. Irish average earnings in the public administration and defence sector were the 3rd highest of the 12 countries that reported earnings for this sector. Average annual earnings in the education sector were the 2nd highest of the 16 countries analysed. Within the human health and social work sector, Irish average annual earnings rank 4th compared to the 17 countries analysed.
Table F.2: Ranking of Average Annual Earnings, 2014
2014Industry,
Construction and Services
Public Administration and Defence
Education Human Health and Social Work
Ireland 9 3 2 4
Austria 6 n/a 4 7
Belgium 3 n/a 5 9
Denmark 7 4 7 10
Finland 11 7 9 13
France 14 12 10 16
Germany 4 4 6 8
Iceland 10 6 16 6
Italy 13 10 14 11
Luxembourg 1 n/a n/a 1
Netherlands 8 2 3 3
Norway 5 n/a 8 5
Portugal 17 n/a 15 17
Spain 16 11 13 14
Sweden 12 8 11 12
Switzerland 2 1 1 2
United Kingdom1 15 9 12 15
Source: Eurostat
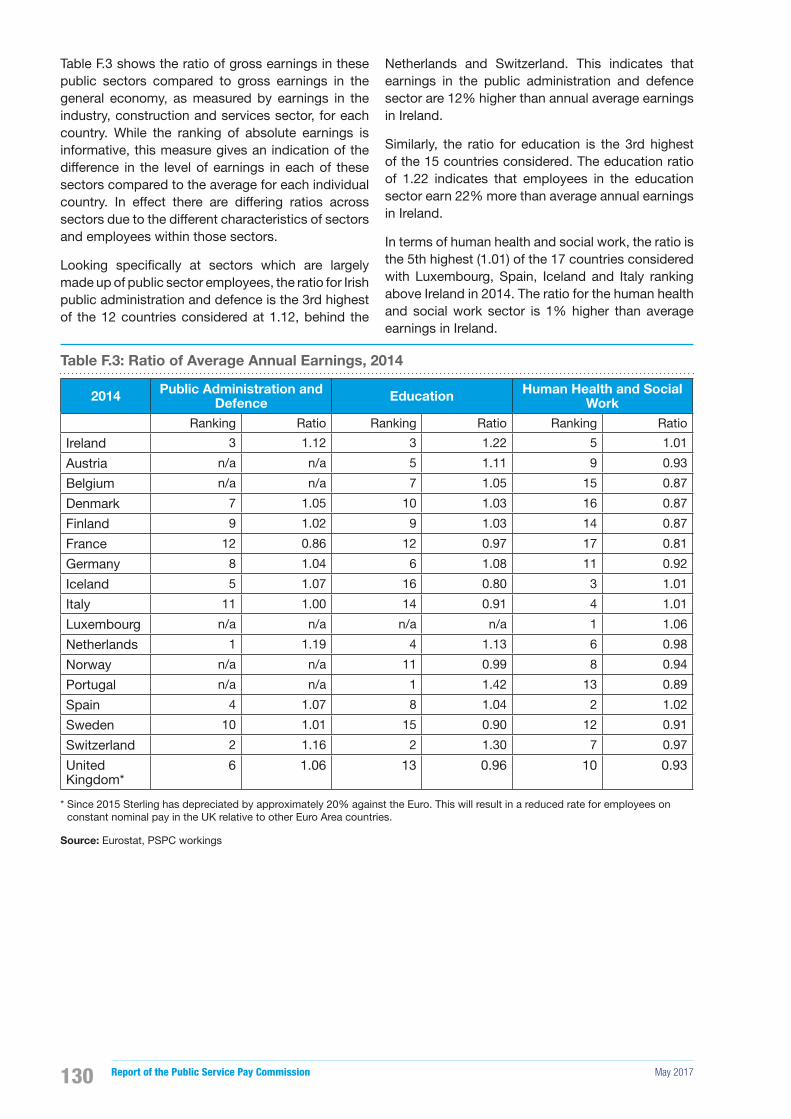
Report of the Public Service Pay Commission May 2017130
Table F.3 shows the ratio of gross earnings in these public sectors compared to gross earnings in the general economy, as measured by earnings in the industry, construction and services sector, for each country. While the ranking of absolute earnings is informative, this measure gives an indication of the difference in the level of earnings in each of these sectors compared to the average for each individual country. In effect there are differing ratios across sectors due to the different characteristics of sectors and employees within those sectors.
Looking speci�cally at sectors which are largely made up of public sector employees, the ratio for Irish public administration and defence is the 3rd highest of the 12 countries considered at 1.12, behind the
Netherlands and Switzerland. This indicates that earnings in the public administration and defence sector are 12% higher than annual average earnings in Ireland.
Similarly, the ratio for education is the 3rd highest of the 15 countries considered. The education ratio of 1.22 indicates that employees in the education sector earn 22% more than average annual earnings in Ireland.
In terms of human health and social work, the ratio is the 5th highest (1.01) of the 17 countries considered with Luxembourg, Spain, Iceland and Italy ranking above Ireland in 2014. The ratio for the human health and social work sector is 1% higher than average earnings in Ireland.
Table F.3: Ratio of Average Annual Earnings, 2014
2014 Public Administration and Defence Education Human Health and Social
Work Ranking Ratio Ranking Ratio Ranking Ratio
Ireland 3 1.12 3 1.22 5 1.01
Austria n/a n/a 5 1.11 9 0.93
Belgium n/a n/a 7 1.05 15 0.87
Denmark 7 1.05 10 1.03 16 0.87
Finland 9 1.02 9 1.03 14 0.87
France 12 0.86 12 0.97 17 0.81
Germany 8 1.04 6 1.08 11 0.92
Iceland 5 1.07 16 0.80 3 1.01
Italy 11 1.00 14 0.91 4 1.01
Luxembourg n/a n/a n/a n/a 1 1.06
Netherlands 1 1.19 4 1.13 6 0.98
Norway n/a n/a 11 0.99 8 0.94
Portugal n/a n/a 1 1.42 13 0.89
Spain 4 1.07 8 1.04 2 1.02
Sweden 10 1.01 15 0.90 12 0.91
Switzerland 2 1.16 2 1.30 7 0.97
United Kingdom*
6 1.06 13 0.96 10 0.93
* Since 2015 Sterling has depreciated by approximately 20% against the Euro. This will result in a reduced rate for employees on constant nominal pay in the UK relative to other Euro Area countries.
Source: Eurostat, PSPC workings

May 2017 Report of the Public Service Pay Commission 131
Themes Emerging from International Comparisons
This section has presented the differences between the Irish public sector and public sectors across the EU based on Eurostat’s SES. Robust and comparable statistics on international earnings, particularly outside of the EU, are compromised by methodological differences. It should be noted that these comparisons are of gross earnings and do not include adjustments for taxes, social insurance or the PRD. It should also be noted that this analysis does not include characteristics such as occupational classi�cation, educational attainment, skill level, and experience, which in the case of certain variables is due to large change in these variables over the period 2011 to 2016. These unobserved characteristics would explain some of the remaining differences in earnings between the public sectors across countries.
Controlling for characteristics such as occupational classi�cation, educational attainment, skill level, and experience, the Irish public earnings premium in 2010 was amongst the highest in the European Union. However, this does not include the effect of PRD and since then there have been very signi�cant pay movements across the public service and private sector. The econometric analysis from 2011 to 2014 by the CSO, which is outlined in detail in the sections above, for Ireland shows the effects of these movements on the public-private premium. The conclusion of the EU Commission’s analysis echoed much of the national and international literature which �nds that public sector employees are, on average, older, more educated and more likely to occupy managerial positions than private sector employees, and thus tend to earn higher levels because their characteristics normally bring higher-than-average earnings (De Castro et al., 2013).
The size of the Irish public sector, as de�ned above, in terms of employees as a percentage of the labour force and relative to the population in each country, is at the EU average in 2014. In general, Irish average annual earnings in these sectors rank among the highest in similar EU and EFTA countries in 2014. Earnings across all sectors of the Irish economy are the 9th highest compared to the 17 countries considered. Looking at the ranking of average annual earnings in each of the sectors in 2014 against other countries considered in the analysis:
• Irish public administration and defence sector was the 3rd highest ranked of the 12 countries considered;
• Irish education sector was the 2nd highest ranked of the 16 countries considered; and
• Irish human health and social work sector was the 4th highest of 17 countries considered.
Using the ratio of average annual earnings in each sector compared to the average annual earnings in each country:
• Irish annual earnings in the public administration and defence sector are 12% higher than Irish average earnings and rank 3rd of the 12 countries considered for this ratio;
• Irish annual earnings in the education sector are 22% higher than Irish average earnings and rank 3rd of the 16 countries considered for this ratio; and
• Irish annual earnings in the human health and social work sector are 1% higher than Irish average earnings and rank 5th of the 17 countries considered for this ratio.
Readers should note that there are differing ratios across sectors due to the different characteristics of sectors and employees within those sectors. The methodological differences in international data outside of the EU and data limitations in EU data, speci�cally the difference in what was estimated for Eurostat in 2014 and the Census 2016 results, make it dif�cult to draw de�nitive conclusions on international earnings comparisons.

Report of the Public Service Pay Commission May 2017132
Summary Tables
Earnings Hours and Employment Costs Tables
Table F.4: Average Annual Earnings, 2008-2016
2008 2009 2010 2011 2012 2013 2014 2015 2016
Private Sector €34,198 €33,643 €33,381 €33,092 €33,487 €33,564 €33,924 €34,492 €35,183
Public Service €47,949 €49,339 €47,136 €46,644 €47,463 €47,227 €46,705 €46,981 €46,677
Public Service net of PRD
€47,949 €46,418 €43,836 €43,379 €44,141 €44,063 €43,576 €43,833 €44,063
Source: CSO, PSPC workings
Table F.5: Average Weekly Earnings, 2008-2016
2008 2009 2010 2011 2012 2013 2014 2015 2016
Private Sector €658 €647 €642 €636 €644 €645 €652 €663 €677
Public service €922 €949 €906 €897 €913 €908 €898 €903 €898
Public service net of PRD
€922 €893 €843 €834 €849 €847 €838 €843 €847
Source: CSO, PSPC workings
Table F.6: Projected Average Weekly Earnings, 2017-2018
2017 (f) 2018 (f)
Public Service €913 €910
Public Service net of PRD €864 €862
Source: PSPC workings
Table F.7: Average Weekly Paid Hours, 2008-2016
2008 2009 2010 2011 2012 2013 2014 2015 2016
Private Sector 33 32 32 32 32 32 32 32 32
Public Service 31 31 31 30 31 31 32 32 32
Source: CSO, PSPC workings
Table F.8: Employment (‘000), 2008-2016
2008 2009 2010 2011 2012 2013 2014 2015 2016
Private Sector 1,373 1,231 1,184 1,170 1,176 1,196 1,225 1,265 1,312
Public Service 375 370 363 358 342 338 335 337 346
Source: CSO, PSPC workings

May 2017 Report of the Public Service Pay Commission 133
Earnings Distribution Tables
Table F.9: Public-Private Weekly Earnings and Employment Distribution, 2014
Average Weekly Earnings (Max of Decile) Public Service Employment Private Sector Employment
10th €184 13,178 183,168
20th €282 12,537 183,805
30th €359 14,836 181,515
40th €440 18,857 177,628
50th €527 22,160 174,033
60th €625 40,643 155,718
70th €748 59,495 136,851
80th €925 68,992 127,351
90th €1,207 84,276 112,074
100th : 47,566 148,780
Source: CSO, PSPC workings
Table F.10: Public-Private Annual Earnings and Employment Distribution, 2014
Average Annual Earnings (Max of Decile)
Public Service Employment Private Sector Employment
10th €9,568 13,178 183,168
20th €14,664 12,537 183,805
30th €18,668 14,836 181,515
40th €22,880 18,857 177,628
50th €27,404 22,160 174,033
60th €32,500 40,643 155,718
70th €38,896 59,495 136,851
80th €48,100 68,992 127,351
90th €62,764 84,276 112,074
100th : 47,566 148,780
Source: CSO, PSPC workings
Table F.11: Public Service Weekly Earnings Distribution, 2007-2014
Public Service net of PRD (€)
National Employment Survey P35 Earnings Analysis
2007 2008 2009 2010 2011 2012 2013 2014
10th 406 404 416 415 331 328 331 349
20th 548 553 549 535 493 493 499 510
30th 644 652 627 610 597 600 602 608
40th 741 746 709 682 683 682 683 682
50th 832 845 778 752 772 773 773 768
60th 912 957 872 837 866 866 868 863
70th 1,011 1,080 976 934 981 978 978 977
80th 1,160 1,241 1,110 1,054 1,113 1,098 1,095 1,091
90th 1,409 1,509 1,313 1,245 1,320 1,314 1,287 1,267
Source: CSO, PSPC workings

Report of the Public Service Pay Commission May 2017134
Table F.12: Private Sector Weekly Earnings Distribution, 2007-2014
Private Sector (€)
National Employment Survey P35 Earnings Analysis
2007 2008 2009 2010 2011 2012 2013 2014
10th 248 277 240 232 169 165 166 171
20th 365 388 355 339 249 247 248 255
30th 443 460 439 420 326 323 324 331
40th 516 527 505 493 391 386 388 396
50th 595 600 580 573 462 458 462 470
60th 683 688 672 662 546 541 546 555
70th 798 796 777 776 656 651 656 666
80th 962 949 938 935 817 815 823 836
90th 1,264 1,220 1,240 1,231 1,134 1,143 1,151 1,175
Source: CSO, PSPC workings
Table F.13: Public Service Annual Earnings Distribution, 2007-2014
Public Service net of PRD (€)
National Employment Survey P35 Earnings Analysis
2007 2008 2009 2010 2011 2012 2013 2014
10th 21,112 21,018 21,621 21,590 17,212 17,056 17,212 18,148
20th 28,506 28,777 28,528 27,844 25,636 25,636 25,948 26,520
30th 33,462 33,887 32,583 31,736 31,044 31,200 31,304 31,616
40th 38,545 38,783 36,880 35,450 35,516 35,464 35,516 35,464
50th 43,256 43,952 40,471 39,112 40,144 40,196 40,196 39,936
60th 47,398 49,774 45,358 43,516 45,032 45,032 45,136 44,876
70th 52,559 56,173 50,762 48,559 51,012 50,856 50,856 50,804
80th 60,324 64,522 57,721 54,814 57,876 57,096 56,940 56,732
90th 73,242 78,447 68,284 64,723 68,640 68,328 66,924 65,884
Source: CSO, PSPC workings
Table F.14: Private Sector Annual Earnings Distribution, 2007-2014
Private Sector (€)
National Employment Survey P35 Earnings Analysis
2007 2008 2009 2010 2011 2012 2013 2014
10th 12,903 14,404 12,480 12,049 8,788 8,580 8,632 8,892
20th 18,980 20,152 18,439 17,605 12,948 12,844 12,896 13,260
30th 23,010 23,903 22,802 21,841 16,952 16,796 16,848 17,212
40th 26,840 27,425 26,281 25,626 20,332 20,072 20,176 20,592
50th 30,940 31,200 30,173 29,805 24,024 23,816 24,024 24,440
60th 35,490 35,750 34,931 34,439 28,392 28,132 28,392 28,860
70th 41,496 41,384 40,400 40,368 34,112 33,852 34,112 34,632
80th 50,002 49,327 48,777 48,618 42,484 42,380 42,796 43,472
90th 65,737 63,450 64,493 64,000 58,968 59,436 59,852 61,100
Source: CSO, PSPC workings

May 2017 Report of the Public Service Pay Commission 135
Table F.15: Ratio of Earnings, 2007-2014
Public Service Private Sector 90:10 90:10
Earnings Ratio Earnings Ratio
National Employment Survey
2007 3.5 5.1
2008 3.7 4.4
2009 3.2 5.2
2010 3 5.3
P35 Analysis
2011 4 6.7
2012 4 6.9
2013 3.9 6.9
2014 3.6 6.9
Source: CSO, PSPC workings
International Earnings Table
Table F.16: EU and EFTA Country Earnings in Purchasing Power Standard, 2014
Industry, construction and services (except public administration,
defence)
Public administration and defence
Education Human health and social work
Belgium €42,048 : €44,036 €36,538
Denmark €39,698 €41,831 €40,898 €34,414
Germany €40,332 €41,831 €43,470 €37,159
Ireland €37,612 €42,293 €46,006 €37,911
Spain €29,672 €31,799 €30,752 €30,293
France €33,508 €28,972 €32,477 €27,083
Italy €33,524 €33,572 €30,355 €33,805
Luxembourg €48,997 : : €51,831
Netherlands €39,613 €47,009 €44,943 €38,834
Austria €40,062 : €44,469 €37,411
Portugal €21,156 : €30,063 €18,865
Finland €36,567 €37,448 €37,674 €31,776
Sweden €35,706 €35,955 €32,144 €32,650
United Kingdom
€32,361 €34,150 €31,033 €30,044
Iceland €37,379 €39,857 €29,883 €37,702
Norway €40,166 : €39,674 €37,852
Switzerland €48,455 €56,342 €62,817 €46,889
Source: Eurostat

Report of the Public Service Pay Commission May 2017136
Econometrics Tables
Table F.17: Ordinary Least Squares Regression Model: Gross weekly earnings (net of PRD) Permanent Full-Time employees aged 25-59 years - Public-Private Coefficient, 2003-2014
2003 2006 2007 2009 2010 2011 2012 2013 2014
All Employees
8.0% 26.6% 20.1% 10.5% 7.7% 3.2% 2.1% 0.2% -0.4%
Males 2.1% 27.4% 19.1% 8.8% 5.1% -3.1% -2.7% -6.6% -6.7%
Females 14.0% 26.0% 21.0% 12.0% 10.9% 10.0% 8.2% 7.9% 7.8%
Source: CSO, PSPC workings
Table F.18: Quantile Regression Model: Gross weekly earnings (net of PRD) Permanent Full-Time employees aged 25-59 years (Males and Females) - Public-Private Coefficient, 2007-2014
2007 2009 2010 2011 2012 2013 2014
10th 27.0% 23.1% 23.0% 19.5% 16.3% 13.2% 15.3%
20th 25.0% 18.6% 15.8% 11.9% 12.9% 9.5% 10.4%
30th 24.0% 14.6% 12.7% 8.7% 7.8% 5.4% 5.9%
40th 22.0% 12.6% 9.3% 6.1% 4.5% 2.9% 2.9%
50th 21.0% 9.5% 7.1% 3.4% 2.9% 0.5% -0.2%
60th 20.0% 8.5% 4.6% 0.7% 0.7% -1.3% -3.8%
70th 17.0% 5.9% 2.9% -3.5% -2.1% -4.5% -6.1%
80th 14.0% 3.0% -0.2% -5.9% -5.0% -6.5% -10.0%
90th 11.0% 0.9% -3.1% -9.7% -9.4% -11.0% -13.2%
Source: CSO, PSPC workings
Table F.19: Quantile Regression Model: Gross weekly earnings (net of PRD) Permanent Full-Time employees aged 25-59 years (Males only) - Public-Private Coefficient, 2007-2014
2007 2009 2010 2011 2012 2013 2014
10th 27.0% 19.9% 19.1% 12.2% 10.2% 6.4% 6.4%
20th 24.0% 13.0% 12.5% 5.8% 7.7% 3.1% 2.6%
30th 21.0% 9.2% 8.5% 5.2% 4.5% -0.6% -0.4%
40th 20.0% 7.8% 6.4% 1.5% 1.2% -3.6% -4.4%
50th 18.0% 5.9% 4.4% -0.9% -1.7% -6.4% -8.3%
60th 17.0% 5.2% 2.3% -4.2% -4.3% -7.9% -9.2%
70th 16.0% 2.7% 0.0% -7.8% -6.6% -9.9% -10.3%
80th 12.0% 1.3% -2.2% -11.8% -9.1% -12.6% -13.6%
90th 12.0% -0.4% -2.4% -17.0% -14.6% -15.7% -16.6%
Source: CSO, PSPC workings

May 2017 Report of the Public Service Pay Commission 137
Table F.20: Quantile Regression Model: Gross weekly earnings (net of PRD) Permanent Full-Time employees aged 25-59 years (Females only) - Public-Private Coefficient, 2007-2014
2007 2009 2010 2011 2012 2013 2014
10th 27.0% 28.7% 29.6% 29.2% 25.8% 19.7% 26.8%
20th 27.0% 24.4% 20.8% 19.2% 21.2% 15.6% 21.0%
30th 27.0% 19.9% 15.8% 14.6% 13.9% 13.0% 15.6%
40th 24.0% 15.9% 12.3% 10.2% 10.5% 10.4% 11.2%
50th 23.0% 12.1% 8.8% 6.8% 7.9% 7.6% 8.7%
60th 20.0% 10.0% 5.7% 5.0% 5.4% 6.1% 4.0%
70th 18.0% 7.5% 4.0% 1.9% 3.1% 2.9% -0.3%
80th 16.0% 4.0% 2.5% -0.7% -1.3% -1.4% -6.2%
90th 15.0% 1.8% -1.7% -4.3% -4.5% -8.0% -10.6%
Source: CSO, PSPC workings
Table F.21: Distribution of annual earnings (net of PRD) of Permanent Full-time Employees aged 25-59
2011 2012 2013 2014
10th €16,197 €15,600 €16,381 €15,580
20th €21,772 €21,167 €21,853 €21,330
30th €26,422 €26,002 €26,439 €26,137
40th €30,512 €30,225 €30,706 €30,346
50th €35,002 €34,841 €35,216 €34,731
60th €40,255 €40,218 €40,562 €40,078
70th €46,720 €46,667 €46,896 €46,687
80th €55,304 €55,047 €54,924 €54,586
90th €68,667 €68,840 €68,930 €68,788
Source: CSO, PSPC workings
(Footnotes)
1 Since 2015 the Sterling has depreciated by approximately 20% against the Euro. This will result in a reduced rate for employees on constant nominal pay in the UK relative to other Euro Area countries.
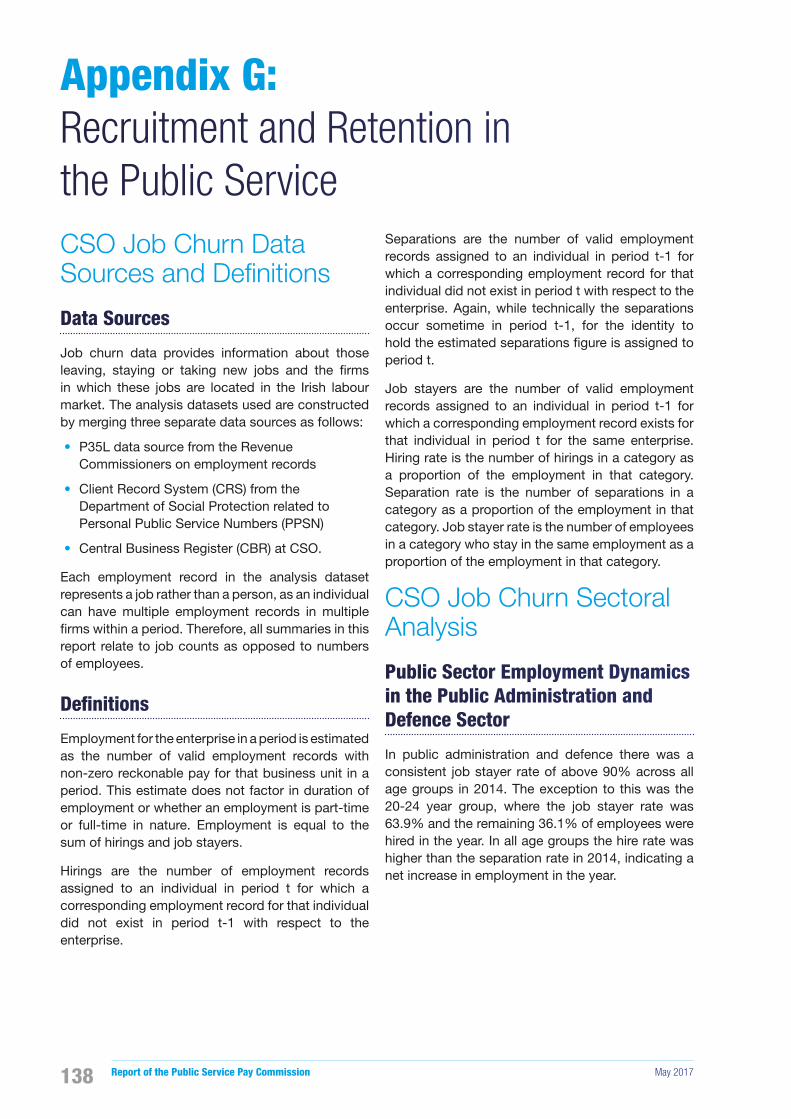
Report of the Public Service Pay Commission May 2017138
CSO Job Churn Data Sources and Definitions
Data Sources
Job churn data provides information about those leaving, staying or taking new jobs and the �rms in which these jobs are located in the Irish labour market. The analysis datasets used are constructed by merging three separate data sources as follows:
• P35L data source from the Revenue Commissioners on employment records
• Client Record System (CRS) from the Department of Social Protection related to Personal Public Service Numbers (PPSN)
• Central Business Register (CBR) at CSO.
Each employment record in the analysis dataset represents a job rather than a person, as an individual can have multiple employment records in multiple �rms within a period. Therefore, all summaries in this report relate to job counts as opposed to numbers of employees.
Definitions
Employment for the enterprise in a period is estimated as the number of valid employment records with non-zero reckonable pay for that business unit in a period. This estimate does not factor in duration of employment or whether an employment is part-time or full-time in nature. Employment is equal to the sum of hirings and job stayers.
Hirings are the number of employment records assigned to an individual in period t for which a corresponding employment record for that individual did not exist in period t-1 with respect to the enterprise.
Separations are the number of valid employment records assigned to an individual in period t-1 for which a corresponding employment record for that individual did not exist in period t with respect to the enterprise. Again, while technically the separations occur sometime in period t-1, for the identity to hold the estimated separations �gure is assigned to period t.
Job stayers are the number of valid employment records assigned to an individual in period t-1 for which a corresponding employment record exists for that individual in period t for the same enterprise. Hiring rate is the number of hirings in a category as a proportion of the employment in that category. Separation rate is the number of separations in a category as a proportion of the employment in that category. Job stayer rate is the number of employees in a category who stay in the same employment as a proportion of the employment in that category.
CSO Job Churn Sectoral Analysis
Public Sector Employment Dynamics in the Public Administration and Defence Sector
In public administration and defence there was a consistent job stayer rate of above 90% across all age groups in 2014. The exception to this was the 20-24 year group, where the job stayer rate was 63.9% and the remaining 36.1% of employees were hired in the year. In all age groups the hire rate was higher than the separation rate in 2014, indicating a net increase in employment in the year.
Appendix G: Recruitment and Retention in the Public Service
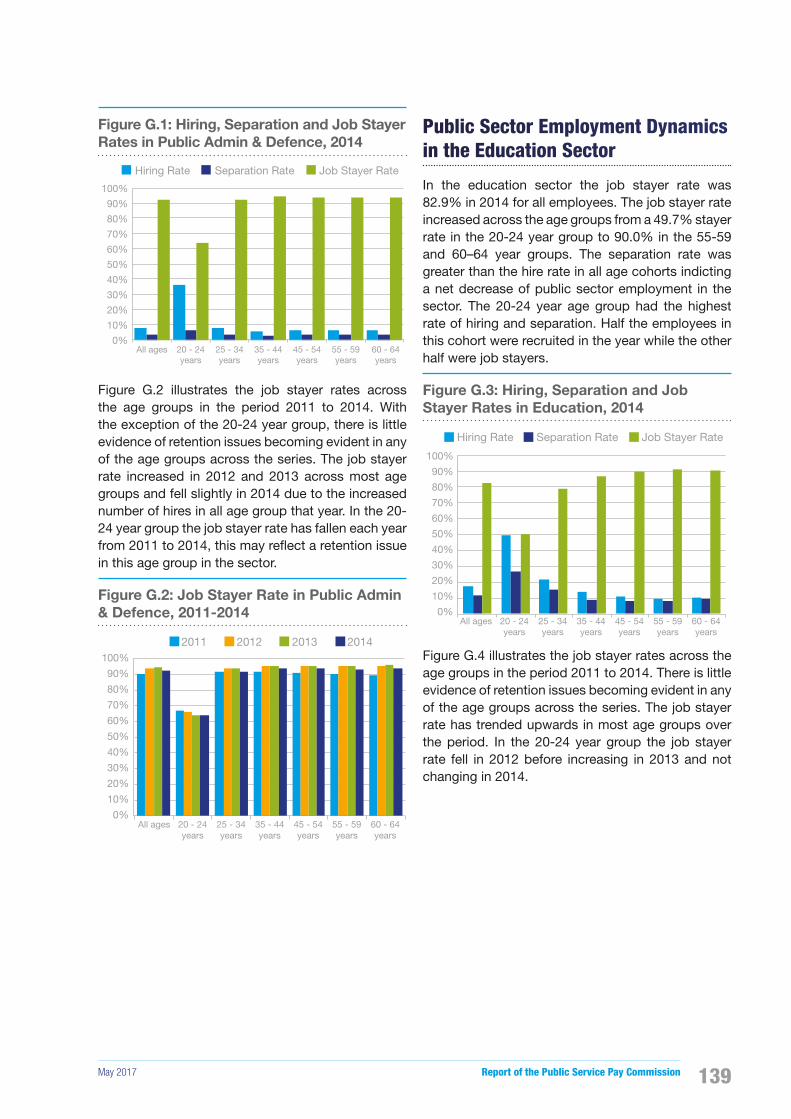
May 2017 Report of the Public Service Pay Commission 139
Figure G.1: Hiring, Separation and Job Stayer Rates in Public Admin & Defence, 2014
0%
10%
20%
30%
40%
50%
60%
70%
80%
90%
100%
All ages 20 - 24years
25 - 34years
35 - 44years
45 - 54years
55 - 59years
60 - 64years
Hiring Rate Separation Rate Job Stayer Rate
Figure G.2 illustrates the job stayer rates across the age groups in the period 2011 to 2014. With the exception of the 20-24 year group, there is little evidence of retention issues becoming evident in any of the age groups across the series. The job stayer rate increased in 2012 and 2013 across most age groups and fell slightly in 2014 due to the increased number of hires in all age group that year. In the 20-24 year group the job stayer rate has fallen each year from 2011 to 2014, this may re�ect a retention issue in this age group in the sector.
Figure G.2: Job Stayer Rate in Public Admin & Defence, 2011-2014
0%
10%
20%
30%
40%
50%
60%
70%
80%
90%
100%
2011 2012 2013 2014
All ages 20 - 24years
25 - 34years
35 - 44years
45 - 54years
55 - 59years
60 - 64years
Public Sector Employment Dynamics in the Education Sector
In the education sector the job stayer rate was 82.9% in 2014 for all employees. The job stayer rate increased across the age groups from a 49.7% stayer rate in the 20-24 year group to 90.0% in the 55-59 and 60–64 year groups. The separation rate was greater than the hire rate in all age cohorts indicting a net decrease of public sector employment in the sector. The 20-24 year age group had the highest rate of hiring and separation. Half the employees in this cohort were recruited in the year while the other half were job stayers.
Figure G.3: Hiring, Separation and Job Stayer Rates in Education, 2014
Hiring Rate Separation Rate Job Stayer Rate
0%
10%
20%
30%
40%
50%
60%
70%
80%
90%
100%
All ages 20 - 24years
25 - 34years
35 - 44years
45 - 54years
55 - 59years
60 - 64years
Figure G.4 illustrates the job stayer rates across the age groups in the period 2011 to 2014. There is little evidence of retention issues becoming evident in any of the age groups across the series. The job stayer rate has trended upwards in most age groups over the period. In the 20-24 year group the job stayer rate fell in 2012 before increasing in 2013 and not changing in 2014.

Report of the Public Service Pay Commission May 2017140
Figure G.4: Job Stayer Rate in Education, 2011-2014
0%
10%
20%
30%
40%
50%
60%
70%
80%
90%
100%2011 2012 2013 2014
All ages 20 - 24years
25 - 34years
35 - 44years
45 - 54years
55 - 59years
60 - 64years
Public Sector Employment Dynamics in the Human Health and Social Work Sector
In 2014, 88.7% of public sector employees in the Human Health and Social Work sector were job stayers. New recruits accounted for 11.3% of employees while 8.7% of employees had left employment from the previous year. The job stayer rate increases across the age groups. From a low of 45.7% in the 20-24 year group up to 96.5% in the 60-64 year group. Hirings were greater than separations overall and three of the age cohorts saw separations equal to or greater than hirings. The two youngest age groups account for the majority of the employment churn in the sector, with the 20-24 year group having a hiring rate of 54.3% and a separation rate of 24.6% in the year. The 25-34 year group had a hiring rate or 22.8% and a separation rate of 16.8%.
Figure G.5: Hiring, Separation and Job Stayer Rates in Human Health and Social Work, 2014
0%
10%
20%
30%
40%
50%
60%
70%
80%
90%
100%
All ages 20 - 24years
25 - 34years
35 - 44years
45 - 54years
55 - 59years
60 - 64years
Hiring Rate Separation Rate Job Stayer Rate
The trend in the job stayer rate has been similar in most age cohorts in the period 2011 to 2014, with the rate falling in 2012 increasing in 2013 before falling or staying level in 2014. The two youngest age groups have experienced a different trend, as the job stayer rate has fallen each year in both groups. This indicates a potential retention issues in this cohort as fewer employees are staying in employment in the sector in the early part of their careers.
Figure G.6: Job Stayer Rate in Human Health and Social Work, 2011-2014
0%
10%
20%
30%
40%
50%
60%
70%
80%
90%
100%2011 2012 2013 2014
All ages 20 - 24years
25 - 34years
35 - 44years
45 - 54years
55 - 59years
60 - 64years
May 2017 Report of the Public Service Pay Commission 141
Acronyms
ACESA – Association of Chief Executives of State Agencies
AGSI – Association of Garda Sergeants and Inspectors
AHCE – Association of Hospital Chief Executives
AJI – Association of Judges of Ireland
ARCO – Association of Retired Commissioned Of�cers
ASTI – Association of Secondary Teachers, Ireland
CIPD – Chartered Institute for Personnel and Development Ireland
CPA – Croke Park Agreement
CPSU – Civil Public and Services Union
CSO – Central Statistics Of�ce of Ireland
DPER – Department of Public Expenditure and Reform
EAADS – Earnings Analysis using Administrative Data Sources
EDP – Excessive De�cit Procedure
EFTA – European Free Trade Area
EHECS – Earnings, Hours and Employment Costs Survey
ESRI – Economic and Social Research Institute
EU – European Union
FEMPI – Financial Emergency Measures in the Public Interest
GDP – Gross Domestic Product
GNP – Gross National Product
GRA – Garda Representative Association
HRA – Haddington Road Agreement
HSE – Health Service Executive
ICTU – Irish Congress of Trade Unions
IFAC – Irish Fiscal Advisory Council
IHCA – Irish Hospital Consultants Association
IMF – International Monetary Fund
IMO – Irish Medical Organisation
INMO – Irish Nurses and Midwives Organisation
Appendix H: Acronyms
Report of the Public Service Pay Commission May 2017142
INTO – Irish National Teachers’ Organisation
IRN – Industrial Relations News
LRA – Lansdowne Road Agreement
NCC – National Competitiveness Council
NCHD – Non-Consultant Hospital Doctor
NCSA – Non-Commercial State Agencies
NES – National Employment Survey
OECD – Organisation for Economic Co-operation and Development
PAS – Public Appointments Service
PDFORRA – Permanent Defence Force Other Ranks Representative Association
PNA – Psychiatric Nurses Association
PRD – Pension Related Deduction
PSPC – Public Service Pay Commission
PSPR – Public Service Pension Reduction
QEC – Quarterly Economic Commentary
QNHS – Quarterly National Household Survey
RACO – Representative Association of Commissioned Of�cers
SES – Structure of Earnings Survey
SFA – Small Firms Association
SGP – Stability and Growth Pact
SILC – Survey of Income and Living Conditions
SIPTU – Services Industrial Professional and Technical Union
TLAC – Top Level Appointments Committee
TUI – Teachers’ Union of Ireland
VAT – Value Added Tax
WTE – Whole Time Equivalents
May 2017 Report of the Public Service Pay Commission 143
Bergin, A., Conefrey, T., FitzGerald, J., Kearney, I. and Žnuderl, N. (2013) ‘The HERMES-13 Macroeconomic Model of the Irish Economy’, ESRI Working Paper No. 460. Dublin: The Economic and Social Research Institute.
Bergin, A., Garcia-Rodriguez, A., McInerney, N., Morgenroth, E. and Smith, D. (2016) ‘Modelling the Medium to Long Term Potential Macroeconomic Impact of Brexit on Ireland’, ESRI Working Paper No. 548. Dublin: The Economic and Social Research Institute.
Boyle, G., McElligott, R. and O’Leary, J. (2004) ‘Public-Private Wage Differentials in Ireland, 1994-2001’, ESRI Quarterly Economic Commentary, Special Article. Summer 2004. Dublin: The Economic and Social Research Institute.
Central Statistics Of�ce (2009) National Employment Survey 2007 Supplementary Analysis. Cork: Central Statistics Of�ce.
Central Statistics Of�ce (2012) National Employment Survey 2009 and 2010 Supplementary Analysis. Cork: Central Statistics Of�ce.
Curtis, J. and Fitzgerald, J. (1996) ‘Real Wage Convergence in an Open Labour Market’, The Economic and Social Review, 27(4), pp. 321-340.
Danzer, A.M. and Dolton, P.J. (2012) ‘Total Reward and Pensions in the UK in the Public and Private Sectors’, Labour Economics, 19, pp. 584-594.
De Castro, F., Salto, M. and Steiner, H. (2013) ‘The Gap between Public and Private Wages: new evidence for the EU’, European Economy, Economic Papers 508.
Department of Finance (2017) Ireland’s Stability Programme April 2017 Update: Incorporating the Department of Finance’s Spring Forecasts. Available at: http://www.�nance.gov.ie/sites/default/files/20170410%20Draft%20SPU%20final.pdf (accessed 21 April 2017).
Dustmann, C. and Van Soest, A. (1997) ‘Wage Structures in the Private and Public Sectors in West Germany’, Fiscal Studies, 18(3), pp. 225-247.
Ernst & Young and Murphy, A. (2007) ‘An Econometric Study of Earnings Based on National Employment Survey 2003 Data’, Report to the Public Service Benchmarking Body.
Foley, P. and O’Callaghan, F. (2009) ‘Investigating the Public-Private Wage Gap in Ireland using Data from the National Employment Survey’, Journal of the
Statistical and Social Inquiry Society of Ireland, Vol. XXXIX, pp. 23-52.
Giordano, R., Depalo, D., Pereira, M.C., Eugène, B., Papapetrou, E., Pérez, J.J., Reiss, L. and Roter, M. (2011) ‘The public sector pay gap in a selection of Euro area countries’, European Central Bank, Working Paper Series No. 1406.
Hutton, W. (2011) Hutton Review of Fair Pay in the Public Sector: Final Report. Available at: http://webarchive.nationalarchives.gov.uk/20130129110402/http:/www.hm-treasury.gov.uk/d/hutton_fairpay_review.pdf (accessed 21 April 2017).
Irish Fiscal Advisory Council (2016) Fiscal Assessment Report: November 2016. Available at: http://www.fiscalcouncil.ie/wp-content/uploads/2016/11/FAR_301116_Final.pdf (accessed 21 April 2017).
Jones, D.A., Shultz, J.W. and Chapman, D.S. (2006) ‘Recruiting Through Job Advertisements: The Effects of Cognitive Elaboration on Decision Making’, International Journal of Selection and Assessment, 14(2), pp. 167-179.
Kelly, E., McGuinness, S., and O’Connell, P. (2008) ‘Benchmarking, Social Partnership and Higher Remuneration: Wage Settling Institutions and the Public-Private Sector Wage Gap in Ireland’, ESRI Working Paper No. 270. Dublin: The Economic and Social Research Institute.
McQuinn, K., Foley, D. and Kelly, E. (2017) Quarterly Economic Commentary, Spring 2017. Dublin: The Economic and Social Research Institute.
Of�ce of National Statistics (2014) Public and Private Sector Earnings - November 2014. London: Of�ce of National Statistics.
Public Appointments Service (2015) Annual Report. Available at: https://www.publicjobs.ie/publicjobs/publication/document/Annual_Report_2015.pdf (accessed 21 April 2017).
Public Service Benchmarking Body (2007) Report of the Public Service Benchmarking Body. Dublin: The Stationary Of�ce.
Silzer, R.F. and Church, A.H. (2010) ‘Identifying and Assessing High Potential Talent – Current Organisational Practices’, in Silzer, R.F. and Dowell, B.E. (Eds.) Strategy Driven Talent Management: A Leadership Imperative. San Francisco: Jossey Bass.
Appendix I: Bibliography

Report of the Public Service Pay Commission May 2017144


Public Service Pay Commission3rd Floor,St. Stephen’s Green House,Earlsfort Terrace,Dublin [email protected]