report of the state budget crisis task force
TRANSCRIPT

Report of the State Budget Crisis Task Force
VIRGINIA REPORT

More information is available at www.statebudgetcrisis.org State Budget Crisis Task Force, December 2012
This is a report of the State Budget Crisis Task Force, prepared by Task Force member Carol O'Cleireacain in cooperation with the Task Force’s partners in Virginia — The Centers on the Public Service of George Mason University’s Department of Public and International Affairs, including Paul Posner, Frank Shafroth, James J. Regimbal, and Darrene L. Hackler.

Table of Contents
A Statement from the Task Force Co-Chairs ................................................................................ 3
Foreword ......................................................................................................................................... 6
Summary ........................................................................................................................................ 7
Introduction .................................................................................................................................... 9
The Rules and Politics of Budgeting .......................................................................................... 11 The Process ............................................................................................................................................................ 11 Future Budget Outlook ........................................................................................................................................... 12
Medicaid ...................................................................................................................................... 14 State Cost Containment Strategies ...................................................................................................................... 14 Impact of Affordable Care Act (ACA) Implementation on State Medicaid Spending .......................................... 14
Retirement Promises .................................................................................................................. 16 Pensions ................................................................................................................................................................. 16 Other Post-Employment Benefits .......................................................................................................................... 19 Retirement Funding Conclusions .......................................................................................................................... 19
Revenue Erosion and Volatility .................................................................................................. 20 Volatility .................................................................................................................................................................. 20 Erosion .................................................................................................................................................................... 20 Tax Expenditures .................................................................................................................................................... 20
Local Government ....................................................................................................................... 22
The Use of Nonrecurring Actions in Budgeting ......................................................................... 23
Planning, Budgeting, and Reporting: Managing Over the Business Cycle ............................. 24 Process ................................................................................................................................................................... 24 Rules ....................................................................................................................................................................... 24 Issues for Concern ................................................................................................................................................. 24
Education .................................................................................................................................... 25 The State of the State’s K-12 Education .............................................................................................................. 26 Higher Education .................................................................................................................................................... 26 Looking to the Future ............................................................................................................................................. 27
Funding Transportation Infrastructure ...................................................................................... 28 What Are the Needs? ............................................................................................................................................. 28 Inadequacies of the Present Financing System ................................................................................................... 28 What Are the Funding Options? ............................................................................................................................ 30

Reports of the State Budget Crisis Task Force Virginia
2
Debt .............................................................................................................................................. 32 Future Risks ............................................................................................................................................................ 34
Conclusion ................................................................................................................................... 36
Endnotes ...................................................................................................................................... 38

Reports of the State Budget Crisis Task Force Virginia
3
Paul A. Volcker and Richard Ravitch introduced the July 2012 Full Report of the State Budget Crisis Task Force with the
following statement:

Reports of the State Budget Crisis Task Force Virginia
4
Reports of the State Budget Crisis Task Force Virginia
5

Reports of the State Budget Crisis Task Force Virginia
6
Foreword
Former New York Lieutenant Governor Richard Ravitch and former Federal Reserve Board Chair Paul Volcker created the
State Budget Crisis Task Force because of their growing concern about the long-term fiscal sustainability of the states and
the persistent structural imbalance in state budgets, which was accelerated by the financial collapse of 2008.
After extensive planning and fundraising in 2010 and early 2011, Messrs. Ravitch and Volcker recruited a board of
individuals with extensive and varied careers in public service and public policy. The Task Force was officially launched in
April 2011.
In addition to the co-chairs, the board of the State Budget Crisis Task Force includes these members:
NicholasF.Brady JosephA.Califano,Jr.
PhillipL.Clay DavidCrane
PeterGoldmark RichardP.Nathan
AliceM.Rivlin MarcV.Shaw
GeorgeP.Shultz
The executive director of the Task Force is Donald Boyd, on leave from his responsibilities as senior fellow at the Rockefeller
Institute of Government. Ravitch and Boyd worked together to assemble a core team of experts with budget and financial
planning experience at the national, state, and local levels and practical experience derived from the management of
previous fiscal crises. The names of the full project team can be found on the Acknowledgements page at the end of this
report.
The Task Force decided to focus on the major threats to states’ fiscal sustainability. Since it was not feasible to study each
of the fifty states in depth, we decided to target six states — California, Illinois, New Jersey, New York, Texas, and Virginia —
for in-depth, onsite analysis. In each state, the core team worked closely with experts who were deeply familiar with the
substance, structure, procedures, documents, and politics of the state’s budget. The names of budget experts consulted in
each state can be found on the Acknowledgements page at the end of this report. The core team and state experts
conducted detailed inquiries into major issue areas including Medicaid, pensions, tax revenues, debt, the fiscal problems of
local governments, and state budgeting and planning procedures. In doing so, the core team and state experts reviewed
budget documents and data from the respective states and interviewed key budget officials.
The Task Force released its main report in July 2012, focusing on issues that cut across the six states. The Task Force also
is preparing reports on individual states, including this report on Virginia.

Reports of the State Budget Crisis Task Force Virginia
7
Summary
The problems that threaten other states the Task Force studied also threaten Virginia; but, most of the problems are less
worrisome thanks to the state’s sound financial management and good fortune. The two exceptions are potential cuts in
federal spending and chronically unmet transportation needs.
It is Virginia’s good fortune to border the nation’s capital. Federal spending cushioned it through the last two downturns and
helped foster longer run growth: from 2000 to 2010, gross state product grew by 60 percent, pushed by federal spending
growth of 107 percent. This advantage carries with it great risk: Virginia is more dependent on federal spending than any
other state. If $1 trillion in defense cuts currently under consideration were implemented in proportion to current defense
spending, Virginia could lose 122,800 jobs and $7.3 billion in wages.
Virginia’s Medicaid program is limited to the federal minimum requirement for eligibility. The state ranks forty-eighth in the
nation in per capita Medicaid spending. Only 11 percent of the state’s population is enrolled, versus 20 percent nationally.
The aging population and rising health care costs will place continued upward pressure on Medicaid spending. If Virginia
expands Medicaid eligibility under the Affordable Care Act, Medicaid costs will rise further but the uninsured population will
fall.
The fiscal strain to fund pensions and other retiree benefits is greater for local governments, which pay about three
quarters of contributions, than for the state. While Virginia’s funding ratios are slightly worse than the national average, the
lower pension benefits and more conservative investment assumptions result in lower budgetary risks to the state than in
many other states. The state enacted recent reforms which commit it to begin paying its full actuarial contribution by 2018,
increase employee contributions, and lower pension benefits for new hires. Health benefits for Virginia’s retirees are less
expensive and better funded than those in most states.
Virginia takes the lead among the Task Force study states in assessing, monitoring, and planning infrastructure, but the
state has failed to address a transportation funding crisis for more than two decades. Forty-four percent of Virginia’s bridges
are structurally deficient or functionally obsolete, 74 percent of highway miles are below “good” condition, and 20.5 percent
of interstate roads are deficient. While these huge needs are clear, maintenance has taken precedence over the past
decade. The real costs from the lack of capital investment in transportation are: shipping and travel delays, congestion,
pollution, and diminished economic growth. Without a revenue source to fund transportation infrastructure, these costs will
mount. The state has been unable to agree on new or increased transportation revenue. As a result, it relies greatly on the
volatile income tax and has deprived itself of opportunities to fund infrastructure using its AAA bond rating. The poster child
of this problem is the gasoline tax — Virginia’s main revenue for transportation — which has not been increased for 24 years
and whose buying power has declined by 45 percent. Only Alaska has gone longer without raising the gas tax rate.
Local governments face fiscal stress. They have used up reserves, reduced benefits, frozen salaries, deferred capital and
equipment purchases, and made deep cuts, even to K-12 education. The recession accelerated the decline in state aid as a
share of the state budget and that aid is not likely to be restored quickly — if ever — to the prerecession share. Local
governments have difficulty increasing the property tax, their largest local revenue source, given the continuing real estate
sluggishness. Reduced state aid takes the greatest toll on poorer areas outside the “urban crescent,” whose weak local tax

Reports of the State Budget Crisis Task Force Virginia
8
bases make it difficult to maintain quality schools, improve infrastructure, and attract business. This may not pose a fiscal
risk to the state, but it presents major policy challenges for state and local officials.
Public education has been critical to Virginia’s economic development, but the state has reduced its support for K-12
education significantly since the recession. Virginia ranks thirty-first in the nation in average teacher pay, and local
governments will have difficulty raising pay to attract quality teachers given cuts in state aid and stress on property taxes.
The state has sharply curtailed its support for higher education. As a result, in 2010 Virginia ranked fortieth in state support
per full-time-equivalent student but nineteenth for its tuition and fees. The de facto privatization of flagship public
universities has become a statewide issue of great concern. For Virginia to continue to be a world class business
destination, it needs to finance a world class education system.
Virginia’s fiscal management and institutions are stronger than most. The state regularly prepares six-year financial plans
and capital improvement plans, although its capital planning processes are not fully coordinated. Virginia’s overall strong
fiscal management contributes to its AAA credit rating. The state usually balances its budget with minimal nonrecurring
revenues. It saves in good times and stabilizes revenues automatically in recessions via its constitutionally set rainy day
fund, which voters strengthened after the Great Recession by raising the cap on its savings. Like all states the Task Force
studied, Virginia has used gimmicks and nonrecurring resources, but to a lesser extent than other states and usually only
when the economy is struggling.
Virginia manages its debt carefully to meet its debt service and retain its AAA credit rating. The debt has been rising and
there are some risks. Moody’s has placed the state on its watch list with a “negative outlook” due to the effects from
potential federal deficit reduction actions. The administration currently expects to borrow $4 billion for road construction
and public-private partnerships. The plan counts on the partnerships to attract billions of dollars of toll-backed private
investment to build projects the state could not afford otherwise.
Compared to other states in the Task Force study, Virginia does not have a structural budget problem. But, it faces fiscal
challenges. Virginia’s own projections show that general fund revenues will not be adequate to fund prior debt service and
pension obligations, keep up with health care costs, restore cuts in local aid, improve health and education services, and
maintain and improve transportation and other infrastructure.
The future has arrived. Virginia has the seventh highest per capita personal income in the nation; it also is a relatively low-
tax state — ranked forty-third by the Tax Foundation. Will the state’s leaders determine which crucial public investments
must be made? Will they make the case to taxpayers for the need to raise revenues and use the golden AAA credit to
leverage those revenues for tomorrow’s infrastructure?

Reports of the State Budget Crisis Task Force Virginia
9
Introduction
Location is everything, and Virginia has fully benefited from its site on the Atlantic seaboard, at the southern end of the
northeast population corridor, within easy reach of a large portion of American markets. Its ports are rarely closed in the
winter; its marine products industry is the largest on the Atlantic coast and fourth largest in the nation.1 Not by accident, the
nation’s capital — the seat of power and spending — is right next door.
Virginia’s two largest urban areas are both highly dependent on the federal government. The largest and fastest growing is
the Northern Virginia portion of the Washington, DC, metro area and is characterized by the large number of people
employed in both civilian and military work with the federal government. For example, investments by the Defense
Advanced Research Projects Agency (DARPA) — especially with its collaborative relationships with the National Science
Foundation, Virginia Tech, and George Mason University — and its innovations, such as the Internet, have been a critical
driver to the Northern Virginia economy. The state worked hard to retain the agency after a threatened move to Maryland
during the last base closure process; most observers see the ends as having justified the costs of that decision. At the
opposite end of the state is the Virginia Beach-Norfolk-Newport News metro area, spanning Hampton Roads, which has
large military installations and major port facilities — combining its two locational prizes.2
Now, Virginia is at a pivot point. Not poor, it currently ranks seventh in the nation in per capita personal income. But, there
are large regional differences. Northern Virginia has some of the wealthiest localities in the country: America’s top three
most affluent counties are Loudoun, Fairfax, and Arlington.3 Southside and southwest Virginia and some of the older central
cities are considerably poorer, requiring higher levels of state support, particularly for public education and health and
human services.4
Cushioned during both recent downturns, Virginia’s economy has grown significantly faster and maintained a lower rate of
unemployment than the nation, driven largely by the growth in federal spending — particularly defense and homeland
security in the aftermath of September 11, 2001.5 Virginia received more federal procurement spending in fiscal year (FY)
2010 than any other state: 32 percent of Virginia’s economy came from direct federal expenditures or obligations.6 Over the decade 2000 to 2010, the gross state product grew 60 percent, as it was pushed by federal spending in Virginia, growing 107 percent and federal Department of Defense (DOD) spending growing an even faster 137 percent.7
But clouds loom on the horizon. In fiscal year 2011, Virginia’s personal income grew at a slower pace than the U.S. Virginia has the highest dependency on federal spending of any state in the nation. Direct federal expenditures in Virginia, including
retirement/disability payments, other direct aid to individuals, grants to government entities, procurement contracts, and
federal salaries and wages, totaled $136.1 billion in FY 2010.8 If the proposed $1 trillion of DOD spending cuts were to be implemented over the next decade in proportion to current state defense expenditures, the loss to Virginia could be 122,800 jobs, $7.3 billion in wages, and $10.5 billion in annual gross state product.9 Global Insight, the state’s economic
consultant, expects that with federal downsizing the state’s growth will underperform the nation over the next several years.
This slowdown already seems to be occurring. Moody’s placed the Commonwealth of Virginia on credit watch in the wake of
the U.S. Budget Control Act, due to the significant footprint of federal government spending and employment.

Reports of the State Budget Crisis Task Force Virginia
10
Virginia has made enormous economic strides. Recently, it was ranked by Education Week: Quality Counts as having the
fourth best system of K-12 public education in the nation. It has a well-respected system of higher education and ranks
sixth in the nation in percent of those age twenty-five years and older with at least a bachelor’s degree. It is viewed as a
well-managed AAA-rated state. Most outside observers rank the business climate in the top tier of states.10 This has not
been by accident. In the 1960s, the state established and funded a community college system. In the 1970s, it brought in
an income tax to fund improvements to K-12 public education as mandated by a new state constitution.11 In 1986, a
political coalition substantially increased funding for transportation. In 2004, the governor and the Virginia General
Assembly modernized the tax code and raised some modest amounts of revenue.
Virginia has a history of a conservative population pushing its government to improve its efficiency and live within its
existing revenues. It is very difficult to raise taxes, even though Virginia is a relatively low tax state.12 Moreover, after doing
the hard work of a $1.7 billion biennial tax increase in 2004 to better align revenues and spending, the state has engaged
in successive policies that have more than neutralized the tax increase, leaving a weaker tax structure, generally.13 In the
face of mounting congestion costs, the gasoline tax, Virginia’s main revenue for transportation, remains at 17.5 cents per
gallon, which has not been changed for twenty-four years.
Which way will Virginia turn as its population ages, federal spending slows, traffic congestion worsens, and economic
recovery remains weak? Will there be the leadership to make the tough choices? Will it strengthen its advantages in an era
of government austerity?

Reports of the State Budget Crisis Task Force Virginia
11
The Rules and Politics of Budgeting
The Process Virginia uses a biennial budget process with line-item appropriations for each year of the biennium. In every even-numbered
year, a new budget is adopted in the spring for the two-year period beginning on July 1 of that year. Revisions, with new
data, are made to the original biennial appropriation act each subsequent year. In reality, new budgets are adopted each
year.
The technical aspects of Virginia’s budget making process reflect an almost textbook concept of best practices and are
fairly transparent. The record of budget responsibility is likely the result of a long-standing culture of fiscal responsibility,
characterized by the longest held AAA credit rating in the nation. Many independent observers rate Virginia as one of the
best managed states in the country.14
Two-year budget estimates are made of revenues and spending for budget development and projections over six years for
long-range budget planning purposes, using econometric modeling and subject to professional review and adjustment, if
necessary, by the Governor’s Advisory Board of Economists and the Governor’s Advisory Council on Revenue Estimates. The
Department of Planning and Budget (DPB) coordinates the spending side of the budget plan, based on the state’s strategic
planning process (even-numbered years produce a six-year financial spending plan). Before inclusion in the budget, capital
planning is coordinated and vetted by a Six-Year Capital Outlay Plan Advisory Committee composed of both executive and
legislative branch members.
Budget adoption requires significant effort and compromise by both the governor and the General Assembly. Each house
produces its own substitute for the governor’s budget, which go to conference, usually producing a compromise after a
couple of weeks. Until 2012, a conference committee report on the budget had never been rejected in modern times.15
There has been only one instance in modern times when no budget was adopted. In 2001, the General Assembly failed to
agree on a budget, clashing over the amount of appropriations to be made for the car tax relief program. However, the
budget enacted in 2000 provided sufficient spending authority for fiscal year 2002. In the next year’s session, the General
Assembly used a “caboose” budget bill to adopt the spending actions made by the governor to keep the state budget in
balance. With this one exception, a compromise has always been reached prior to July 1, therefore no disruptions to agency
expenditures have ever occurred. The governor must sign the “enrolled” budget bill to become law. First, the governor may
propose amendments or veto items in the budget bill. Amendments must be approved by a majority vote of each body.
Vetoes must be rejected by two-thirds of each chamber’s members or they will be sustained. The governor is given
discretionary authority in Part §4-1.01 of the budget to reduce appropriations by up to 15 percent for any state agency or
institution in the event of a revenue shortfall.
Most budget decisions are incremental in nature, but consensus decision-making becomes more difficult when the state
faces major budget decisions or partisan politics. For example, in 2004 Governor Mark Warner persuaded the Virginia
General Assembly to increase general fund taxes by about $800 million per year. Instead of enacting a budget by April, it
took until June and required 17 members of the House of Delegates to break ranks with their party to vote for the tax
measure. Recent transportation funding initiatives provide an example of where consensus has proven elusive. Several
unsuccessful attempts were made in the last decade to increase ongoing transportation revenues. The last major

Reports of the State Budget Crisis Task Force Virginia
12
transportation revenue increase in Virginia was 1987, excluding transfers from the general fund. Even when the governor
and Senate agreed on new transportation revenues, they could not convince the house — with majorities of the same party
in both chambers — to go along.
Virginia is the only state that will not allow a consecutive two-term governor. As a result, seniority-laden legislative money
committees tend to have greater institutional budget power and leverage in policy making than might otherwise be the
case. There has been much discussion as to whether the Commonwealth is a “strong governor” state. The governor has
great appointment abilities and significant budget powers through forecasting and the development process, amendment
and veto power, and in execution, since the obligation to balance the budget is on a cash basis over a two-year and six-
month period, and the appropriations are considered, by law, to be maximum amounts. On the other hand, the governor is
forced to implement priorities in short order. Newly elected, the governor enters office in the middle of a biennial budget
cycle set by the predecessor, gets full control over presenting the next budget to set priorities, but can only try to impose
them on the next governor. A one-term governor may be prone to “fix” a problem to the detriment of the next governor.16 A
single-term governor is more likely to be able to avoid “ownership” of a problem and pass it on to the successor, hindering
implementation of the state’s long-term plans.
Future Budget Outlook Virginia is fortunate to produce a six-year financial plan. This uses a long-term trend-line forecast of real revenue growth
while largely continuing spending policies in the governor’s proposed budget for 2012-2014. It does not assess the impact
from continuing these budget policies over the six-year period.17 The state is assuming average real growth in general fund
revenues of slightly less than 3 percent — near the historic average.18 No tax increases or revenue enhancements are
projected for either the general fund or transportation trust fund. There is no solution for the shortage in transportation trust
fund revenues, as the plan assumes the governor’s proposed transfer of 0.25 cents of the general fund sales tax to
transportation, which failed in the 2012 General Assembly.
The recession caused agency budget cuts, and few restorations of those agency cuts have been made.19 The state budget
commits to make up for one-time actions used during the recession. Priority uses for available revenues are: formula-driven
filling of the Revenue Stabilization Fund (about $150 million to $200 million per biennia); debt service; and returning to
adequate funding of retirement contributions (teacher and state employee pension funds).20 Most remaining available
revenues are used for the state Medicaid program, expected to continue growing faster than overall general fund revenues.
No assumptions are made about the potential additional general fund costs required from the new federal health care law
scheduled to go into effect in FY 2014. While the federal government is expected to pick up the bulk of the cost of
potentially 426,000 new Medicaid participants in Virginia, the state previously forecast an additional state cost of $1.5
billion to $2.2 billion annually through 2020. Due to the uncertainty about the new health care law’s implementation, these
potential added costs are not built into the six-year financial plan.21
Several risks are inherent in this financial plan. First, it assumes direct federal support will continue to increase, which none
of the fiscal analysts project. Second, it does not assume any additional debt authorizations through FY 2018. This seems
unlikely: many projects in the adopted six-year capital outlay plan do not have funding sources; the financial plan has no
provision for capital appropriations. According to the December 2011 Report of the Debt Capacity Advisory Committee,
$466.83 million in new debt could be authorized in each of FY 2012 and FY 2013 within the self-imposed 5 percent cap.
Third, localities — especially K-12 public education — will need help: from FY 2002 to FY 2010 the state share of local

Reports of the State Budget Crisis Task Force Virginia
13
programs declined from 33 percent to 29 percent and will not be able to continue on this trajectory.22 Indeed, the 2012
General Assembly recognized this; it added $212 million to K-12 funding in 2012-2014 above the introduced budget,
reduced in FY 2013 and FY 2014 the expected amount to be recouped from the previously enacted “clawbacks” in aid,
allowed localities to phase in the pension contribution rate increases, and defeated two actions which would have cut local
tax revenue.23
In sum, based on trend growth, general fund revenues likely will not be adequate to fund obligations from prior years (debt
service and employee retirement liabilities); keep up with health care costs and improve health outcomes; maintain and
modernize transportation and other infrastructure; and improve traditional services, such as K-12 and higher education.
Although Virginia is a growing state, the financial plan assumes little investment in infrastructure. Local governments will
face reducing service quality or raising local taxes significantly. College tuition and fees and health care fees and insurance
premiums will continue to rise faster than growth in personal income.

Reports of the State Budget Crisis Task Force Virginia
14
Medicaid
Virginia’s Medicaid program is limited to the federal minimum requirement for eligibility. The state ranks forty-eighth in the
nation in Medicaid spending per capita and forty-eighth in the number of Medicaid recipients as a percentage of state
population.
According to the Kaiser State Health Care Facts, only 11 percent of the population is enrolled in the program, compared to
20 percent nationwide. Virginia’s income threshold for nonpregnant adults is very low — less than 30 percent of federal
poverty. As a result, only 16 percent of the state’s Medicaid population is low-income adults (compared to the national 26
percent).24 Since Virginia provides coverage to relatively few nonpregnant adults, the result is that a high percentage of the
adults it does cover in any given year have a hospitalization (a birth), generating high costs in that year. According to the
most recently available Kaiser data (2009), Virginia’s average cost per enrollee is 6 percent higher than the national
average. However, when broken down by group, it is 20 percent lower for the aged and 4 percent lower for the disabled; it is
14 percent higher for children and 30 percent higher for those low-income adults.25 Over all, the cost per enrollee was
$5,758, a bit higher than the national average of $5,337.
The federal reimbursement rate is 50 percent. The bulk of the state funding share comes from the state’s general fund,
with the remainder from tobacco taxes, a portion of the Master Tobacco Settlement Agreement, and Medicaid recoveries
from prior payments. In FY 2009, 2010, and 2011, the federal reimbursement rate was temporarily increased; depending
on the quarter, the revised rate ranged from 56.9 percent to 61.6 percent, where the increase above 50 percent was
funded by the federal American Recovery and Reinvestment Act (ARRA). In FY 2011, the last year in which ARRA funds were
available, total spending for Virginia Medicaid was $7.2 billion, of which the federal government reimbursed the state $4.2
billion. In FY 2012, when the reimbursement rate reverted to the normal 50 percent, the state had to absorb not only the
loss of ARRA funds but also the growth in program spending between FY 2009 and 2012 — about 7.9 percent, compared to
the growth nationwide of 7.1 percent. The Medicaid share of the total annual general fund budget has grown from 15
percent in FY 2009 to 21 percent in FY 2012. Enrollment growth in Virginia appears to have been near normal for state
programs over the recent decade.26
State Cost Containment Strategies Compared to many other states, Virginia has not made major efforts at reducing rising costs by eliminating optional benefits
or enacting provider assessments. It has implemented several provider cost saving policies and also managed care. During
FY 2010 and FY 2011, Virginia’s cost saving policies included freezing and/or reducing various components of provider
payments for inpatient hospital care, nursing homes, residential psychiatric services, therapeutic day treatment rates, and
pharmacy reimbursement rates.27 The state estimates the value of reforms/savings at more than $27 million in FY 2012,
rising to more than $80 million in FY 2014.28
Impact of Affordable Care Act (ACA) Implementation on State Medicaid Spending Virginia, given the latitude provided to states in the Supreme Court decision, has not yet decided whether to expand its
Medicaid eligibility. As indicated in the previous discussion of the Six-Year Financial Plan, the state projects that, if
implemented, enrollment would increase by 270,000 to 425,00029 between 2014 and 2022, and would increase annual

Reports of the State Budget Crisis Task Force Virginia
15
state funding requirements by $1.5 billion to $2.2 billion.30 The increased cost of expanded eligibility to the state is not
insignificant.

Reports of the State Budget Crisis Task Force Virginia
16
Retirement Promises
Pensions31
Virginia has eighteen public pension systems, one of which — the Virginia Retirement System (VRS) — is administered at the
state level, with the rest administered by local governments.32 Local systems accounted for 17 percent of public retirement
system assets in Virginia in 2010, which is about the same as for the nation as a whole.33 About 60 percent of the assets of
local systems are in Fairfax County, and most of the remainder is in systems in Arlington, Norfolk, and Newport News.
Elsewhere in Virginia, most local governments contribute to the Virginia Retirement System. Because about 75 percent of
pension contributions in Virginia are made by local governments, pension-related fiscal stress in Virginia has its largest
direct impact on localities.34 However, the state also is affected by and reacts to pension-related stress, and Virginia has
underpaid its pension contributions substantially in recent years as one means of deferring costs.
The Virginia Retirement System was established in 1942, covering state employees, teachers, and school administration
employees formerly enrolled in the Retired Teachers’ Fund. It now consists of four separate systems: (1) the Virginia
Retirement System for teachers, state employees, and employees of participating political subdivisions; (2) the State Police
Officers’ Retirement System (SPORS); (3) the Virginia Law Officers’ Retirement System (VaLORS); and (4) the Judicial
Retirement System (JRS).
Funded Status The funded status of Virginia’s public retirement systems is somewhat lower than the national average — 70 percent,
compared to 74 percent.35 The table below compares Virginia with the nation’s 126 major state and local retirement plans
and those in the six study states.36 Although Virginia’s percentage underfunding is worse than the national average, the
unfunded liability per capita is slightly lower because public pension benefits in Virginia are lower, on average, than benefits
in the nation as a whole.
In 2000, the Virginia Retirement System plans were fully funded as a whole, reflecting in part the strong stock market of the
1990s. However, their funding status has deteriorated over the past decade due to market downturns, a loose state
funding policy, and adoption of more conservative actuarial assumptions through two reductions in the assumed earnings
rate (from 8 percent to 7.5 percent in 2005 and 7.5 percent to 7.0 percent in 2010). By 2010, with liabilities discounted by
7 percent, the plans had reported a combined funded ratio of just 70 percent.
The movement to an assumed return of 7 percent in 2010 placed VRS among the lowest, and therefore most conservative,
return assumption used by the 126 major plans in the Public Fund Survey, where it remains.37 In addition, the VRS
assumption of 2.5 percent inflation is also the lowest used by plans in the Public Fund Survey. These combined
assumptions — nominal investment return of 7 percent and 2.5 percent inflation — gives VRS an assumed real rate of
return of 4.5 percent, which puts it at the median real rate of return assumption for plans in the survey.

Reports of the State Budget Crisis Task Force Virginia
17
Table 1 | Funded Status of Major Retirement Systems Nationally and in Study States
State and Local Government Retirement System Funded Status Major State Plans and Local Plans
Amounts in $ billions
Plan Name (Asset Value Year) Actuarial Liabilities
Market Value of Assets
Unfunded Liability (Surplus)
Using Market Value of Assets
Funded Ratio Using
Market Value of
Assets (%)
Unfunded Liability ($ per capita)
United States Totals, 126 Plans $3,442.8 $2,551.2 $891.5 74.1% $2,882.1
Totals for Six Study States $1,542.2 $1,156.0 $386.2 75.0% $3,459.2 California $597.4 $461.6 $135.8 77.3% $3,635.9 Illinois $187.6 $95.0 $92.5 50.7% $7,205.7 New Jersey $120.2 $77.6 $42.6 64.6% $4,838.6 New York $348.0 $301.2 $46.8 86.6% $2,411.8 Texas $214.0 $167.7 $46.3 78.3% $1,835.2 Virginia $75.1 $52.9 $22.2 70.4% $2,770.1
Source: Public Fund Survey (www.publicfundsurvey.org) for actuarial liabilities, accessed June 19, 2012; market value of assets provided by the National Association of State Retirement Administrators, June 19, 2012; unfunded liabilities and funded ratios calculated by Task Force.
In June 2012 the Governmental Accounting Standards Board adopted new reporting guidelines for public pension liabilities
and expenses which require pension systems to calculate liabilities by discounting the “unfunded” portion using a high-
grade municipal bond yield (typically lower than the earnings assumption currently used by most systems).38 The Center for
Retirement Research at Boston College estimated that funded ratios for the vast majority of plans would fall from 76
percent to 57 percent if the then-proposed rules had been in place in 2010, but VRS liabilities would not change from those
that were reported.39
Contribution Requirements and History Generally, shortfalls in investment income relative to assumed returns are the largest cause of underfunding. Virginia has
compounded this problem by habitually failing to pay actuarially determined contributions. Since 2000, the statutory rate
has averaged only about 80 percent of the actuarially required contribution (ARC) rate, and in recent years it has been lower
still.
The general assembly has overridden recommendations from the VRS actuary, substituting its own assumptions to
calculate a statutory contribution rate, which it then uses as the basis for contributions. As noted in a bond disclosure
document in fiscal year 2012, “The General Assembly is again funding less than the rate determined by the actuary by
extending the funding period for these groups from 20 years to 30 years, increasing the investment return assumption from
7.50% to 8.00% and increasing the inflation assumption from 2.50% to 3.00%.” Further, in some cases reductions in

Reports of the State Budget Crisis Task Force Virginia
18
contributions that would have benefited funds outside the general fund have instead been diverted to the general fund.
During the recent fiscal crisis, such moves provided Virginia with cash savings of more than $1 billion — savings that will
come at the expense of future budgets.
Current pension underfunding together with changes in actuarial assumptions are leading public pension funds around the
country to increase their annual required contributions. According to analysis prepared for the Task Force by the Center for
Retirement Research, annual contributions to VRS from the state and local governments will have risen by nearly 66
percent (approximately $981 million) from fiscal year 2011 to fiscal year 2013, and will rise by another $166 million by
2015. However, this falls short of actuarially required funding. To achieve full payment of the ARC, funding would have to
rise by yet another 14 percent.40
Many analysts consider retirement systems’ discount rates and earnings assumptions to be too optimistic, as discussed in
the Task Force’s July report.41 Discounting liabilities at 5 percent, according to The Center for Retirement Research, would
require contributions to the VRS state component to rise by nearly 65 percent.42 While pension systems are unlikely to
discount their liabilities at these rates, this demonstrates the risk being taken by assuming higher rates of return, which, if
not achieved, eventually would require even higher contributions to provide promised benefits.
Recent Legislation The Virginia legislature has passed several measures in recent years intended to control pension costs and ensure
adequate funding.
Effective for VRS new hires as of July 2010, the normal retirement age was increased from sixty-five to the Social Security
Normal Retirement Age, the early retirement age was increased from fifty-five to sixty, the final average salary calculation
was increased from the highest thirty-six consecutive months of service to the highest sixty months, and the base cost-of-
living adjustment (COLA) was decreased to the first 2 percent of the Consumer Price Index from the first 3 percent. Newly
hired state employees were also required to make a 5 percent member contribution. Additionally, on June 25, 2011,
members of the original plan were given a 5 percent salary increase and also required to make the 5 percent member
contributions, which generally had been paid by employers.
In 2012 the state enacted more substantial changes, including a new hybrid plan for state and local employees hired on or
after January 1, 2014. The hybrid plan combines a scaled back defined benefit plan with mandatory enrollment in a new
defined contribution plan. The hybrid is expected to reduce employer contributions by about $3.6 billion over twenty years.
Legislation enacted in 2012 also required all local government employees to pay a mandatory 5 percent member
contribution by 2016, similar to the previously enacted legislation that applied primarily to state employees. That legislation
also commits the General Assembly to contribute an increasing portion of the ARC actuarially determined by the VRS board,
until reaching 100 percent by July 1, 2018. Assuming the General Assembly complies with this requirement, it no longer
would be able to set its own assumptions and thereby pay less than the VRS board requested; however, the appropriation
act can override all other statutes.43
Outlook and Risks Since 2000, Virginia has underfunded its pension contributions. The failure of the financial markets to generate the
assumed returns on invested assets and the recessions also have resulted in unfunded pension liabilities and generated
Reports of the State Budget Crisis Task Force Virginia
19
increases in required contributions, which the state has chosen to avoid and defer. While the increase required to get on a
path to full funding is not as large relative to the budget as it is in some states, it represents a necessary claim on revenues.
And, if investment returns fall short of even the lowered assumptions, contributions will have to rise by much more.
Other Post-Employment Benefits44 Pensions are one form of deferred compensation that employers provide for their employees. Governments also provide
“other post-employment benefits” (OPEB) such as health care to retirees and their dependents. Virginia offers health
insurance to retirees who are eligible for and receiving an annuity from VRS or a benefit from an Optional Retirement Plan,
provided they meet certain other requirements. The state employee health insurance plan is only available to state retirees
(local retirees and public school retirees may or may not be covered by their respective employers’ health insurance
plans).45
Most governments fund these benefits on a pay-as-you-go basis rather than saving in advance through a funded plan. In
recent years, they compute an ARC and report it in their financial statements, but they simply annually budget and pay the
costs of the actual benefits for current retirees. Virginia is an important exception. It has a partially funded plan and until
recently contributed the ARC.46 A combination of relatively low benefits and some effort at advance funding means that
Virginia’s OPEB plans are relatively well funded. In 2012, Virginia had a lower unfunded OPEB liability, at $213 per capita,
than all but twelve other states.47
Retirement Funding Conclusions The Task Force noted in its July 2012 report:
Pension systems and states need to account clearly for the risks they assume and more fully disclose
the potential shortfalls they face. States and retirement systems should develop and adopt rules for
responsible management of these systems and mechanisms to ensure that required contributions are
paid. States should begin to use dedicated systems of reserves to save for the ongoing health benefits
they expect to provide to retirees and should monitor the ability of their local jurisdictions to do the
same.48
Virginia, in an effort to balance its budgets in tough times, has failed to fund fully the actuarially required pension
contributions. As a result, it is currently stressed by underfunded pension liabilities and rising pension contributions. Retiree
health care costs have been a lesser issue.

Reports of the State Budget Crisis Task Force Virginia
20
Revenue Erosion and Volatility About two-thirds of total general fund revenue ($16 billion to $17 billion per year) is from the income tax. The sales and use
tax accounts for about one-fifth; the corporate tax raises about 5 percent of the revenues; insurance, recordation, and other
excises round out the remainder.
Volatility Recession-driven declines in individual income tax receipts and accompanying spending pressures (SCHIP, Medicaid
enrollees) generated historic budget shortfalls — more than $11 billion — between FY 2009 and FY 2012.49 For the first time in recorded history, Virginia experienced back-to-back declines in general fund revenues (FY 2009 and FY 2010). The
decline in revenue in FY 2009 (9.2 percent) was more than double the declines of the previous recession.50
Erosion The sales and use tax has not kept up with the times. The economy is now services-based, with a growing share of goods
purchased via the Internet or outside the geographic boundaries, so the existing tax base looks increasingly less like the
modern economy.51 Compared to most other states, Virginia’s sales tax has a relatively narrow base, although there are
additional communications sales and use and admissions taxes. In 2010, the national median state sales tax base
represented roughly 34 percent of personal income, compared to a bit less than 27 percent in Virginia.52 Nationwide, sales
tax bases have shrunk in relation to the economy; by 2010, the coverage of Virginia’s sales tax base was roughly one-third
lower than its median coverage during the period 1970 to 2010.53 Consensus estimates indicate that expanding the base
to personal (but not professional) services and amusements would yield about $110 million to $125 million annually and
might be possible.54
The corporate income tax, while volatile, is small at 6 percent of the general fund, and the share of total tax revenue paid by
corporations has declined by half since the 1970s.55 In FY 2006, 87 percent was collected from multistate corporations,
giving the state increasingly less control over the base.56 By 2008, more than 60 percent of corporate tax filers had zero
corporate income tax liability.57
Tax Expenditures Virginia does not collect an estimated $2 billion in revenues (240 percent of total state corporate tax revenues) due to
credits, deductions, exemptions, etc.58 These provisions of the tax code are not subject to the legislative authorization and
appropriation process nor listed as specific expenditures in the state budget; but, like an entitlement program, they are a
large and growing drain on state revenues. The General Assembly has passed or changed 60 tax expenditures since
1990.59 In its most recent session, it passed 20 tax expenditure bills, either creating new or renewing or expanding existing
credits or deductions — from wine production to spaceport activities to teleworking, long-term care insurance, and clean fuel
vehicle job creation.60 Little analysis is available to the General Assembly or transparency for taxpayers.61 The state is
moving toward a more comprehensive approach to analysis and transparency on tax expenditures. In 2012 Virginia enacted
a requirement for sunset provisions on tax credit bills; it now requires tax writing committees to hold public hearings
following the release of evaluations of tax expenditures.62

Reports of the State Budget Crisis Task Force Virginia
21
The gasoline tax, Virginia’s main revenue for transportation, is levied at 17.5 cents per gallon, which has not been changed for 24 years. Only Alaska has gone longer than Virginia (and Oklahoma) without raising the gas tax rate. The buying power of
Virginia’s gas tax revenue has declined 45 percent in this period; it would take a 14.5 cent increase to restore the real value
of the gas tax revenue — $580.3 million annually.63 The inability to agree upon new or increased revenues for
transportation has two pernicious effects on the state’s revenue stability. It imposes greater general fund reliance on the
income tax (and its volatility). And, it deprives Virginia of taking complete advantage of its AAA-credit rating, resulting in less
investment and greater dependence on outsourcing (public-private partnerships), where the costs of capital are higher.

Reports of the State Budget Crisis Task Force Virginia
22
Local Government
Local government is comprised of ninety-five counties, thirty-nine incorporated cities, and thirty-six incorporated towns.
Cities and counties traditionally provide all services not provided by the Commonwealth. Uniquely, Virginia’s cities and
counties are independent and their land areas do not overlap. Each city and county levies and collects its own taxes and
provides its own services. Towns, on the other hand, are parts of counties and levy and collect taxes for town purposes;
their residents are also subject to county taxes. The largest expenditures for local governments are public education;
generally, each county and city constitutes a separate school district. Counties, cities, and towns typically provide police and
fire protection, water and sewer
services, and recreational
facilities.64
The recent deep recession
accelerated the relative decline in
state aid for local programs. As a
result of the continuing real estate
recession, local governments,
dependent on real property tax
revenues for over 50 percent of
their local revenues, find it difficult
to make up for declining state aid.
They have used up reserves;
reduced benefits; frozen salaries;
deferred capital and equipment
purchases; and made deep cuts to
local programs, including K-12
public education.
State aid for locally administered
programs is not expected to be quickly restored to prerecession levels — if ever — as a percent of the Commonwealth’s
budget. The state introduced clawbacks of general aid during the recession which will be worth $50 million in FY 2013 and
$45 million in FY 2014, a reduction from the introduced budget and the current biennium. It will take several biennia for the
state to restore funding to local governments; state aid will still remain below fiscal year 2009 levels, particularly as a
percent of the total general fund budget.65 The reduced level of state aid to localities particularly affects poorer areas with
weak local tax bases — outside the “urban crescent” (which runs from Northern Virginia down I-95 to the Richmond region
and traveling east to Hampton Roads) — making it difficult to maintain quality schools, improve infrastructure, and attract
business.
Figure 1 | State Categorical Aid as Percent of Local Expenditures
26%
27%
28%
29%
30%
31%
32%
33%
34%
2000 2001 2002 2003 2004 2005 2006 2007 2008 2009 2010 2011
Source: APA Comparative Reports on Local Revenues and Expenditures, Fiscal Years 2000-2011.

Reports of the State Budget Crisis Task Force Virginia
23
The Use of Nonrecurring Actions in Budgeting
Virginia generally balances its budget during good times with minimal use of nonrecurring revenues. It saves in good times
and stabilizes its revenues in recession — automatically, through the constitutional Revenue Stabilization Fund (RSF), its
rainy day fund.66 The RSF is a targeted budget stabilizer, linked to the economy. Deposits occur any year when revenue
growth exceeds the average during the previous six years and continue at a rate of half the difference in the growth rates
until the fund reaches 15 percent of the average annual collections of the previous three years. It is permanent; withdrawals equal 50 percent of the existing balance, so the balance can never fall to zero. As a result of recent experience,
the Legislature proposed and the voters agreed, in November 2010, to raise the cap from 10 percent to 15 percent.67 The
RSF is a rules-driven system, which has proved to be a reliable mechanism for generating and using reserves.
The recent recessions hit the state hard: the cumulative total of budget shortfalls was at least $12 billion. The largest (in
biennium 2008-2010) was about $5.8 billion. The 2010 General Assembly faced a budget shortfall of nearly $4.5 billion in
balancing the 2010-2012 biennium budgets, some of which was because not all of the actions taken to balance the FY
2010 budget resulted in ongoing base budget reductions, so the 2010-2012 base operating budget exceeded available
revenues by about $1.6 billion.
During 2002 to 2012, Virginia permanently cut spending and raised taxes. The 2004 legislative session enacted a $1.5
billion tax increase because by the 2004 session, the governor and General Assembly were still facing an ongoing
imbalance between revenues and current services spending for the 2004-2006 biennium. These tax increases and the
strength of the economy eliminated the need for nonrecurring budget actions in Virginia until 2009.68
In response to the recessions, the state passed down its pain by cutting education aid and imposing “temporary” clawbacks
of aid to localities.69 Virginia also relied on a number of nonrecurring actions. The largest was the appropriation of $2.8
billion of federal stimulus funds. The RSF provided $1.6 billion over three biennia: 2000-2002; 2002-2004; and 2008-
2010. It reached its highest balance, $1.2 billion, in 2007. Since FY 2008, withdrawals have been approximately $1.13
billion (about 15 percent of the estimated budget gaps for FY 2008-2010).
Another large source of one-time actions involved suppression of payments for employee costs. The most important was
simply lowering the actuarial rate for pension contribution by legislative fiat; also the state suspended, lowered, or moved to
the next fiscal year pension contributions or insurance payments.70
Virginia sped up sales tax collections and accelerated other revenues by changing payment dates, pushing tax audits
forward, and offering several tax amnesties. It substituted debt for the more traditional pay-go financing on capital projects
and for some fund balances to capture the cash. Also, it transferred funds in and out of the general fund in order to ensure
cash was available for balance.

Reports of the State Budget Crisis Task Force Virginia
24
Planning, Budgeting and Reporting: Managing Over the Business Cycle
Process The technical aspects of Virginia’s budget making process reflect best practices. There are two-year budget estimates and
projections over six years for long-range budget planning purposes.71 The Department of Planning and Budget (DPB)
coordinates the spending side of the budget plan and the Department of Taxation prepares the revenue forecasts. The
Office of the Secretary of Finance reviews both.72 The governor is required to submit to the General Assembly a Six-Year
Financial Plan prior to every even-number year and a six-year Capital Improvement Plan (CIP) in every odd-numbered year.73
The CIP details the ongoing and emerging infrastructure needs of the state, alternative methods of financing, performance
indicators on capital project completion, and high-priority capital projects for the period. The capital planning process is
threefold: capital outlays undergo budget development; legislative review; and, finally, execution. However, the plan does
not guarantee project funding.
Rules General fund budgets must be balanced on a cash basis over a biennial, not annual basis. Virginia’s Comprehensive Annual
Financial Report, or CAFR, provides audited results using accrual based generally accepted accounting practices (GAAP).74
To illustrate the differences between the two methods of accounting, in fiscal year 2010 Virginia had a general fund cash
net surplus of $47.4 million. On a GAAP basis, this cash basis surplus turned into a $674.3 million deficit, primarily due to
accrued but unpaid tax refunds, Medicaid claims, and other items payable.75
(See the Nonrecurring Actions section for discussion of the rules-based Revenue Stabilization Fund.)
Issues for Concern The Six-Year Improvement Program (SYIP) is the Commonwealth Transportation Board’s primary program to allocate future
spending.76 Historically, the Commonwealth Transportation Board (CTB) is responsible for transportation decision-making,
but its role is diminished under the 1995 Public-Private Transportation Act (PPTA), whose projects do not require CTB
approval. As a result, PPTA projects have been initiated before proposals have been included in the SYIP; PPTA projects may
have little or no relation to the fiscally constrained SYIP;77 even using traditional state funding, PPTA projects have
leapfrogged other projects in the SYIP. Transportation planning experts fear that the PPTA has moved the capital planning
process from one that considers the best financing and build alternatives before decisions are made to one that advances
the public-private partnership alternative first.
The main challenges facing Virginia’s public budget are driven by demographics — a growing and aging population,
urbanization, and regional disparities. Some of the consequences have been addressed in this paper — for example, the
rising demands of Medicaid and employee pensions and health benefits. Below are three others: education, transportation
infrastructure, and public debt.

Reports of the State Budget Crisis Task Force Virginia
25
Education
Providing aid to public education, particularly K-12 education, is an important role for state government and it will continue
to be. Yet the funding is under stress. A large and sustained reduction in property tax revenues, due to a weak economy or
legal limits placed on local taxes, could put pressure on states to replace the localities’ lost revenues supporting K-12
education. At the same time, continued growth in relatively uncontrollable spending items, such as Medicaid, pension
contributions, and OPEB payments, could continue to crowd out “normal” state funding for both K-12 and higher education.
The overriding question for K-12 education in Virginia is whether continued progress can be achieved with fewer resources
available. Virginia has significantly reduced its support for public education since the recession. Figure 2 illustrates the
decline in state support per pupil since FY 2009. Localities already provide school divisions $3.1 billion more than their
required local effort to meet the state’s minimum required standards of quality. Analysts within Virginia indicate that it is
unlikely that localities will be able
to provide much additional
assistance to schools given the
stress on property tax revenues
resulting from lower real estate
valuations and the continued
reduction in state resources
made available to local
governments — a conclusion
echoed nationally in the Full
Report of the State Budget Crisis
Task Force.
Study after study confirms that
the most important controllable
factor in K-12 education is the
quality of the teacher. Virginia
does not pay its teachers
particularly well: it ranks thirty-
first in average teacher pay,
according to National Education
Association rankings, even as the state ranks seventh in per capita personal income. The state has not incorporated a pay
raise for teachers in its budget since FY 2008 and the six-year financial plan does not anticipate a state-funded raise for
teachers until FY 2016 (2.0 percent). So, local governments are on the hook to try to attract quality teachers as they are still
dealing with the effects of a real estate recession. They are unlikely to be able to increase pay significantly to attract higher
quality teachers.
Figure 2 | State Per Pupil Funding Projections (All Funds)
$5,274
$5,000
$4,513 $4,569
$4,719 $4,730
$4,000
$4,200
$4,400
$4,600
$4,800
$5,000
$5,200
$5,400
2009 2010 2011 2012 2013 2014
Source: James J. Regimbal, “Virginia’s Challenges in the Next Decade,” unpublished paper, April 2012.

Reports of the State Budget Crisis Task Force Virginia
26
The State of the State’s K-12 Education Virginia was recently given an overall grade of “B” (ranking it fourth best in the country) by Education Week’s Quality Counts
2012 Report.78 This ranking is based on the performance of states in six broad areas: the role of education in promoting
success at various stages of life; K-12 student achievement; rigor and quality of academic standards, assessments and
accountability systems; teacher preparation, licensure, and evaluation; school finance; and alignment of state policies
related to school, college, and workforce readiness. Virginia’s highest category grade was an A for the Commonwealth’s
Standards of Learning, assessment, and accountability program. The lowest category grade was a C for K-12 achievement,
up from a C- in 2011. Grades for achievement were based largely on the performance of students on national tests and
progress toward closing achievement gaps. Virginia tends to do well in advanced placement testing, but has a high poverty
gap in achievement results.79
A gap shows up in graduation statistics as well. Virginia had an on-time graduation rate of 86.6 percent and an overall
cohort completion rate of 89.9 percent for the twelfth grade Class of 2011.80 On-time graduation rates varied from 94.7
percent for Asian students and 89.7 percent for white students, to 80.3 percent for black students and 79.1 percent for
Hispanic students. The 2012 Quality Counts report ranked Virginia twenty-eighth in high school graduation rates and near
the bottom (forty-eighth) in the change in graduation rates between the classes of 2000 and 2008. A high school diploma is
essential for further education and success in the increasingly competitive global economy.
Higher Education The State Council on Higher Education, in its 2011-12 report on “Tuition and Fees at Virginia’s State-Supported Colleges
and Universities,” noted that “The Virginia Higher Education Opportunity Act of 2011 calls for more college graduates so
that the Commonwealth will be in a better position to compete successfully in the marketplace of the future…. Will the
Commonwealth have the resources and
the will to become a full partner in this
endeavor or will the de-facto privatization
of our public system of higher education
continue?”
Figure 3 illustrates that the declining
state general fund support received by
higher education institutions in Virginia
has been replaced by steep increases in
tuition and fees. This trend is echoed
nationally as illustrated in the Full Report
of the State Budget Crisis Task Force.
In FY 2010 Virginia ranked fortieth in
state support per full-time equivalent
(FTE) student and nineteenth in tuition
and fee revenue per student, while at the
same time ranking seventh in per capita
personal income. Whether Virginia will
Figure 3 | Average Funding Per FTE Student at Four-Year Institutions (Constant Dollars)
$0
$2,000
$4,000
$6,000
$8,000
$10,000
$12,000
1993 1995 1997 1999 2001 2003 2005 2007 2009 2011
General Fund per In-State FTE
Nongeneral Fund per Total FTE
Source: State Council of Higher Education for Virginia.

Reports of the State Budget Crisis Task Force Virginia
27
sustain the excellent reputation its higher education institutions currently enjoy without increasing state resources is a
matter for public policy: whether Virginia’s electorate determines it can afford to provide more support to higher education.
Elite flagship public universities are already on the road to de facto privatization, and recent concerns over the future
direction of the University of Virginia indicate that this is an issue of widespread engagement throughout the state — both
inside and outside the university community.
Looking to the Future Education is critical to Virginia’s future economic development, and affordability has become a key issue. Higher education
is seen as the key to better jobs, higher incomes, and a growing economy. Enrollment in Virginia’s four-year institutions of
higher education grew 21 percent from FY 2000 to 2010, double the 10 percent overall growth in population.81 However,
affordability is now a key issue. In FY 2010, state appropriations provided $5,065 per FTE student, while tuition and fee
revenue provided $5,894 in higher education funding. By contrast, North Carolina provided $8,413, while tuition and fee
revenue provided $2,010 in funding.82
As the Task Force report indicated, community colleges and local universities will continue to depend heavily on state and
local support. Two-year community colleges are a crucial component to train young people, immigrants, and workers
returning to the labor force for jobs and to prepare them to succeed at four-year universities. These institutions face rising
cyclical demand when the economy is bad and also face an ongoing demand from immigrants seeking language and other
skills.83 Affordability is now an issue for community colleges in Virginia. State support per FTE students at Virginia
community colleges declined 32.3 percent from FY 1992 to FY 2012, while tuition increased by 57.5 percent in constant
dollars.84
The Council on Virginia’s Future (an official advisory board to the governor and the General Assembly supporting a
“roadmap” for Virginia’s future) has documented the huge differences in median income between high school dropouts and
college graduates and cited the state’s K-12 and higher education systems as contributors for Virginia’s business success.
It determined that “the relationship between education and economic prosperity has strengthened … as technology and
innovation play increasingly important roles in competitiveness and growth. The strong relationship between educational
attainment at an individual level … is mirrored at the state level: A higher level of educational attainment generally means a
higher level of statewide per capita income. Virginia’s future economic prosperity and well-being depend directly on its
ability to increase educational attainment and workforce skills across the Commonwealth.”85 For Virginia to continue to be a
world class business destination, it will need to continue to finance a world class education system.

Reports of the State Budget Crisis Task Force Virginia
28
Funding Transportation Infrastructure86
Among the states in this study, Virginia takes the lead in assessing, monitoring, and planning infrastructure. However, the
state clearly has a transportation funding crisis that it has been unsuccessful in addressing for more than two decades.
Virginia has the nation’s third largest system of state-maintained highways, after North Carolina87 and Texas, because it
owns the rural roads.88 An aggressive bridge inspection and safety program, tracking the inventory and conditions, goes
beyond federal requirements. But recording an inventory does not guarantee that assets are in a state of good repair.
According to the Federal Highway Administration (FHWA), 44 percent of Virginia’s bridges are structurally deficient or
functionally obsolete and 74 percent of all highway roads are below good condition. State assessments in 2008 identified
as deficient 20.5 percent of interstate roads and 29 percent of secondary roads.89
What are the Needs? Generally, funding needs may be defined as the gaps between available funding and estimated future costs: The larger the
gaps, the greater the needs. Virginia’s needs assessment are contained in its long-range plan, updated every five years.
Highways and Bridges According to the 2011 Virginia Department of Transportation (VDOT) annual report, the capital needs for surface
transportation (roads and bridges only) for FY 2013-2014 is estimated to be $2.38 billion for maintenance and operation
and reconstruction.90 Bridges will require a total of $1.2 billion for FY 2013 and FY 2014.91 According to the state’s long-term transportation plan (VTRANS2035), current interstate and primary systems do not meet the target and have shown no
improvement. “The anticipated cost to repair deficient pavements is estimated to be $278 to $389 million annually.”92 The
prior report, VTRANS2025, placed the total cost at $74.2 billion.93
Public Mass Transit According to VDOT, capital investment needs between 2010 and 2035 total $8.7 billion simply to achieve a state of good
repair at current levels of service.94 Estimated capital needs for 2005-2025 vary depending on assumptions of ridership
growth and system expansion, with estimates from various scenarios ranging from $7.7 billion to $23.9 billion in total
needs, with operating costs ranging from $16.8 billion to $26.0 billion.95 Transit maintenance needs are growing, too: the
“investment backlog is currently estimated to be approximately $290 million, increasing to $3.7 billion by 2035.”96
Inadequacies of the Present Financing System Inadequate funding has proved chronic and resulted in the substitution of capital funds for operations and maintenance
and a growing dependence on federal funds.
The state’s transportation systems are funded through a variety of dedicated funds encompassed in the overarching
Commonwealth Transportation Fund (CTF).97 The funding sources include dedicated state taxes and fees and federal funds.
The uses are allocated among the Highway Maintenance and Operating Fund (HMOF), the Transportation Trust Fund (TTF),
and the Priority Transportation Fund (PTF) for debt service (Federal Highway Reimbursement Anticipation Notes and the
new Commonwealth of Virginia Transportation Capital Projects Bonds). Federal revenues are allocated to construction or
transit.

Reports of the State Budget Crisis Task Force Virginia
29
The HMOF, established in 1987, is the primary source of upkeep and safety for the roads. A major source of its funds is the
fixed-rate gasoline tax (15 cents of the 17.5 cents per gallon), which was last adjusted 24 years ago and would require a
14.5 cent per gallon tax increase to restore the purchasing power of the previous adjustment. It also receives 2 percentage
points of the 3 percent motor vehicle sales and use tax and $26 of the $40.75 annual vehicle license fee, as well as some
miscellaneous revenues. These revenues do not keep pace with the economy and, beginning in 2002, the HMOF moved
from transferring surplus revenues to construction funds to requiring transfers from them in order to meet maintenance
needs. “For the cumulative period from FY2002 through FY2012, more than $3 billion in state transportation funds originally intended for construction have been diverted to maintenance purposes. An additional $1.1 billion in federal funds that could have been used for construction have been diverted to maintenance.”98
The Transportation Trust Fund (TTF), established in 1987, finances construction of all types (highways, bridges, mass
transit, ports, aviation) and is in no better shape. Revenue sources, in addition to federal aid, are one-half cent of the (4
cent) retail sales and use tax, 1 percent additional tax on motor vehicle sales, 2.5 cents from the 17.5 cent per gallon gas
tax, $3 of the $40.75 vehicle registration fee, bonds, and some “others.” Except for an increase in the vehicle license fee
and bonds, the rates on the other state taxes and fees are the same as they were in 1987. The revenues are distributed by
formula to the Construction Fund, the Mass Transit Fund, the Airport Fund, and the Port Fund.99
VDOT submits a CTF budget report which identifies the estimated revenues and the distribution of the revenues to the
related transportation agencies and programs based on the most recent official state revenue forecast and estimated
federal funding. After two years of decline, total general fund revenue grew 5.8 percent in FY 2011 to $15.0 billion. Virginia
expects below-trend growth for the next three years: 4.6 percent in FY 2012, 3.3 percent in FY 2013, and 4.5 percent in FY
2014.100
The SYIP, created and updated annually, provides a longer-term guide to fund allocations across modes of transportation
and other programs for the immediate fiscal year. The SYIP for FY 2012 to 2017, adopted by the Commonwealth
Transportation Board in June 2011 and signed into law earlier that year, consists of a construction program totaling $10.4
billion, including more than 900 projects recommended for funding through the governor's transportation legislation. It is
not clear where the resources will come from.
The inability of state resources to meet transportation needs is generating ongoing political, economic, and regional
tension.101 The fight over the size of anticipated tolls to pay for the Silver Line transit to Dulles Airport is a classic example of
the regional claims, conflicts between roads and transit, and heightened claims for federal (and further state) financial
help.102 As public transit ridership continues to grow, the state share of total transit funding (currently 17 percent of total
operating costs) is falling.103 Local funds and fares already pay for more than 50 percent of transit costs statewide and almost
two-thirds in Northern Virginia.104 Although, in 2011, the General Assembly created the Intercity Passenger Rail Operation and
Capital Fund, it did not provide a dedicated funding source.105
Virginia has not managed to adopt a permanent funding source to meet its growing transportation needs. Governor McDonnell’s
$3.3 billion Omnibus Transportation Funding Bill jump-started the projects, but effectiveness diminishes, and “unless the
governor is able to make good on his pledge to find new sustainable revenue by FY2017, construction funding levels will be less
than in FY2011.”106

Reports of the State Budget Crisis Task Force Virginia
30
What are the Funding Options? The state continues to rely on some limited alternatives. These include increased use of public-private partnerships (P3)
and tolling. These will not do the job; they are widely recognized as partial and inadequate solutions. Even strong supporters
of P3 recognize they serve in a limited space — large scale projects that can generate strong revenues, typically toll roads
and bridges. Further, P3s are subject to changing market conditions, such as bank lending and credit assistance, not to
mention assessments of financial, construction, and political risk and changing public attitudes towards tolls. Since the
1995 initial legislation, P3s’ promises, and limitations, have become better known in Virginia. For example, Hampton
Road’s $1.2 billion Downtown/Mid-town Tunnel/MLK Extension required $395 million in state supported bonds.107 The new
Infrastructure Bank represents another partial solution. In essence, this will act as a revolving loan fund for smaller projects.
The goal is $1 billion in capitalization, which began with less than $300 million in an initial authorization in 2011.
As Bob Chase, president of the Northern Virginia Transportation Alliance, put it, “for nearly a quarter of a century Virginians
have been paying less than what it actually costs to maintain and improve their transportation network, and it shows in
poorly maintained and congested roads.”108 He puts the funding requirement at a “minimum of $600 million per year to restore stability to the HMOF and an additional $500 million to $1 billion per year to ensure a robust construction program….”109
The options for the required amount of increased state revenues for transportation are well known, as ways in which to
raise a large amount of money are limited. Some are more likely to be politically acceptable than others. They have been
avoided so far. Chase summarized the most obvious ones:110
Increase the Gas Tax ■ 1 cent per gallon = $51.7 million in FY 2013, rising to $54.2 million in FY 2016
■ Restoring to 1987 purchasing power (18 cents per gallon) = $1 billion per year
■ 10 cents per gallon = $500 million per year (enough to stop TTF transfer from construction to maintenance)
Instead of raising the rate, the tax could be levied as a percent of value rather than as cents per gallon at whatever
percentage rate would raise the required revenue. Alternatively, the retail sales tax could be applied to gasoline sales, too.
Increase the State Sales and Use Tax In 1987 the state raised an additional half a percentage point on the 3 percent rate and dedicated it to the TTF. The entire
tax today is 4 percent to the state and a local 1 percent. The dedicated portion to the TTF remains 0.5 percent. One
percentage point would raise about $835 million in FY 2013, growing to more than $1 billion in FY 2016. Proposals to
dedicate more of the existing tax take or a portion of the growth to the TTF have been criticized as robbing the general fund
and other types of spending.
Increase the Motor Vehicle Sales and Use Tax The tax on new or used cars is 3 percent. This is less than the retail sales tax of 4 percent on other consumer goods; it is
also less than applicable taxes in bordering states, with the exception of North Carolina. An additional 1 percentage point
would generate an average of about $150 million per year from FY 2013 to FY 2016, hardly an adequate amount. Raising
the required amount would involve a very significant change in the size and impact of this tax, which might create both
political and enforcement issues.
Reports of the State Budget Crisis Task Force Virginia
31
Increase the Individual Income Tax While many may agree with Chase’s view that this is the least politically likely, it does represent the most broadly based of
these funding options as well as offering strong equity and efficiency arguments. A 10 percent surcharge on the existing
income tax would generate annually about $1 billion and would bring future revenue growth to match the economy. The
estimated impact on the average taxpayer would be about $250 per year (about $1 per workday), before federal
deductibility. Exempting those with low incomes would still yield substantial revenue.
As Chase points out, no one wants to pay higher taxes; but, the costs of not raising the required revenue to make necessary
infrastructure investments are very high. “Time is money and … once lost can never be regained. The single highest most
onerous transportation tax currently paid by Virginians is congestion cost.”111 Realistically, there are no quick fixes, as major
transportation projects are long term.
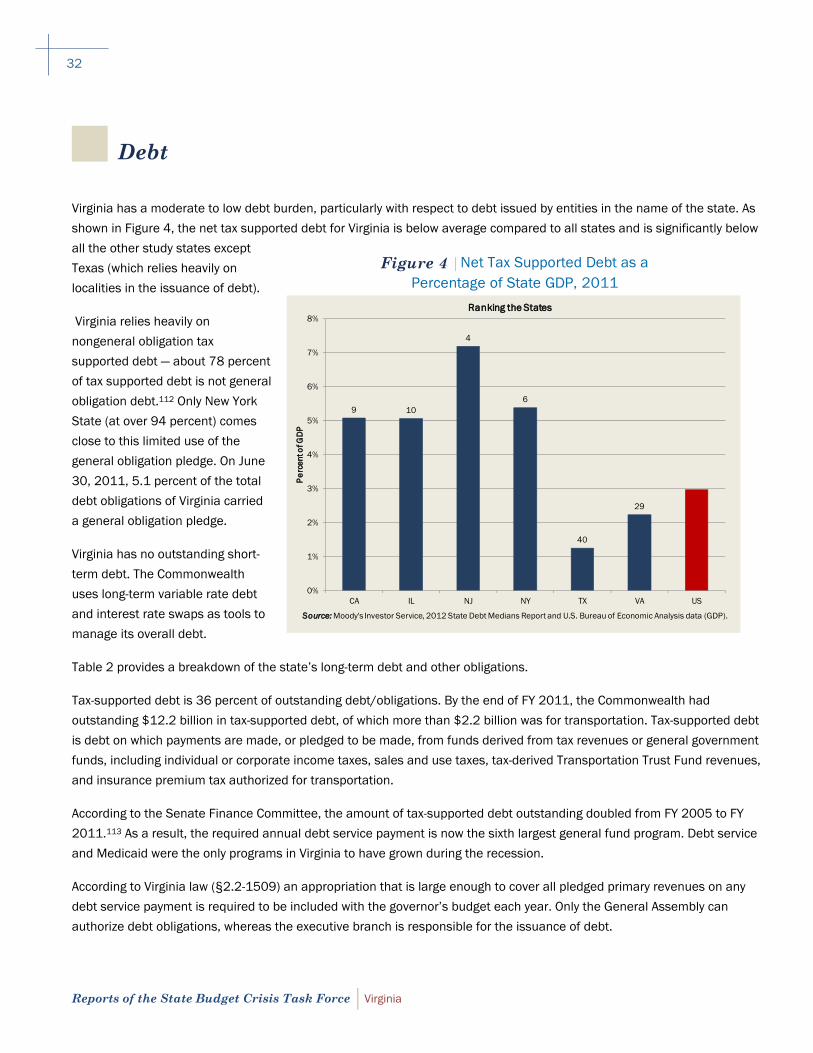
Reports of the State Budget Crisis Task Force Virginia
32
Debt
Virginia has a moderate to low debt burden, particularly with respect to debt issued by entities in the name of the state. As
shown in Figure 4, the net tax supported debt for Virginia is below average compared to all states and is significantly below
all the other study states except
Texas (which relies heavily on
localities in the issuance of debt).
Virginia relies heavily on
nongeneral obligation tax
supported debt — about 78 percent
of tax supported debt is not general
obligation debt.112 Only New York
State (at over 94 percent) comes
close to this limited use of the
general obligation pledge. On June
30, 2011, 5.1 percent of the total
debt obligations of Virginia carried
a general obligation pledge.
Virginia has no outstanding short-
term debt. The Commonwealth
uses long-term variable rate debt
and interest rate swaps as tools to
manage its overall debt.
Table 2 provides a breakdown of the state’s long-term debt and other obligations.
Tax-supported debt is 36 percent of outstanding debt/obligations. By the end of FY 2011, the Commonwealth had
outstanding $12.2 billion in tax-supported debt, of which more than $2.2 billion was for transportation. Tax-supported debt
is debt on which payments are made, or pledged to be made, from funds derived from tax revenues or general government
funds, including individual or corporate income taxes, sales and use taxes, tax-derived Transportation Trust Fund revenues,
and insurance premium tax authorized for transportation.
According to the Senate Finance Committee, the amount of tax-supported debt outstanding doubled from FY 2005 to FY
2011.113 As a result, the required annual debt service payment is now the sixth largest general fund program. Debt service
and Medicaid were the only programs in Virginia to have grown during the recession.
According to Virginia law (§2.2-1509) an appropriation that is large enough to cover all pledged primary revenues on any
debt service payment is required to be included with the governor’s budget each year. Only the General Assembly can
authorize debt obligations, whereas the executive branch is responsible for the issuance of debt.
Figure 4 | Net Tax Supported Debt as a Percentage of State GDP, 2011
9 10
4
6
40
29
0%
1%
2%
3%
4%
5%
6%
7%
8%
CA IL NJ NY TX VA US
Pe
rcen
t of G
DP
Ranking the States
Source: Moody's Investor Service, 2012 State Debt Medians Report and U.S. Bureau of Economic Analysis data (GDP).
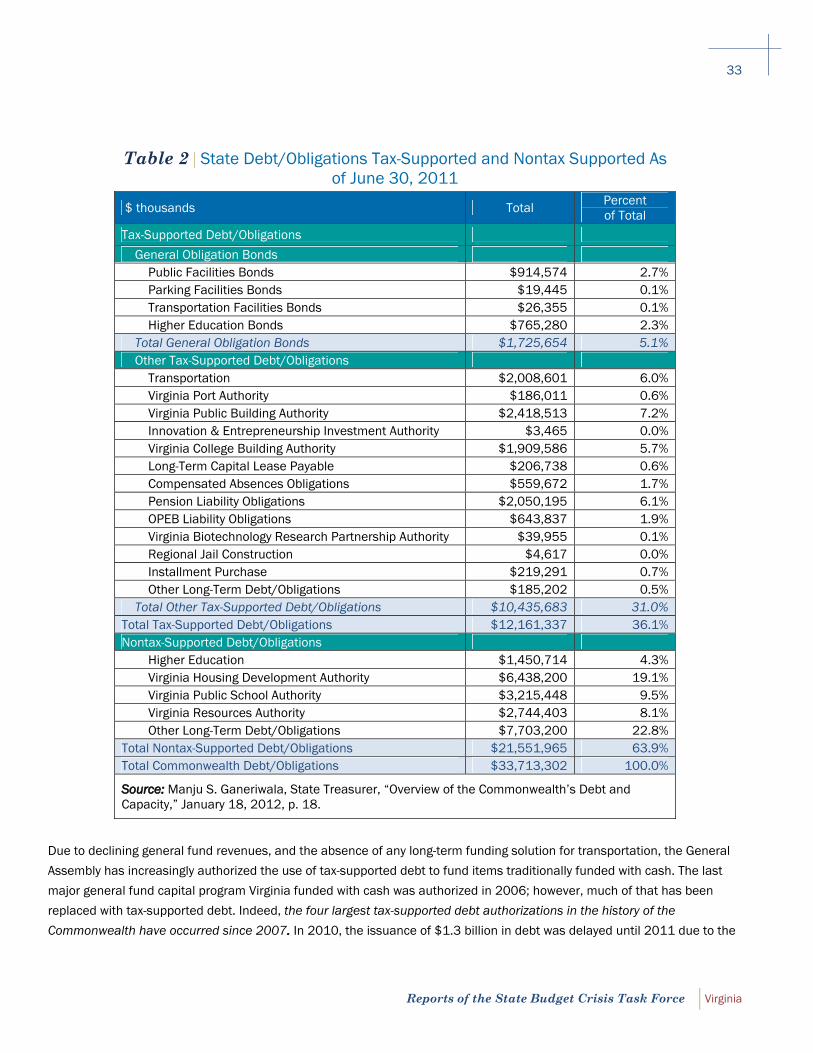
Reports of the State Budget Crisis Task Force Virginia
33
Table 2 | State Debt/Obligations Tax-Supported and Nontax Supported As of June 30, 2011
$ thousands Total Percent of Total
Tax-Supported Debt/Obligations
General Obligation Bonds Public Facilities Bonds $914,574 2.7% Parking Facilities Bonds $19,445 0.1% Transportation Facilities Bonds $26,355 0.1% Higher Education Bonds $765,280 2.3%
Total General Obligation Bonds $1,725,654 5.1% Other Tax-Supported Debt/Obligations
Transportation $2,008,601 6.0% Virginia Port Authority $186,011 0.6% Virginia Public Building Authority $2,418,513 7.2% Innovation & Entrepreneurship Investment Authority $3,465 0.0% Virginia College Building Authority $1,909,586 5.7% Long-Term Capital Lease Payable $206,738 0.6% Compensated Absences Obligations $559,672 1.7% Pension Liability Obligations $2,050,195 6.1% OPEB Liability Obligations $643,837 1.9% Virginia Biotechnology Research Partnership Authority $39,955 0.1% Regional Jail Construction $4,617 0.0% Installment Purchase $219,291 0.7% Other Long-Term Debt/Obligations $185,202 0.5%
Total Other Tax-Supported Debt/Obligations $10,435,683 31.0% Total Tax-Supported Debt/Obligations $12,161,337 36.1% Nontax-Supported Debt/Obligations
Higher Education $1,450,714 4.3% Virginia Housing Development Authority $6,438,200 19.1% Virginia Public School Authority $3,215,448 9.5% Virginia Resources Authority $2,744,403 8.1% Other Long-Term Debt/Obligations $7,703,200 22.8%
Total Nontax-Supported Debt/Obligations $21,551,965 63.9% Total Commonwealth Debt/Obligations $33,713,302 100.0%
Source: Manju S. Ganeriwala, State Treasurer, “Overview of the Commonwealth’s Debt and Capacity,” January 18, 2012, p. 18.
Due to declining general fund revenues, and the absence of any long-term funding solution for transportation, the General
Assembly has increasingly authorized the use of tax-supported debt to fund items traditionally funded with cash. The last
major general fund capital program Virginia funded with cash was authorized in 2006; however, much of that has been
replaced with tax-supported debt. Indeed, the four largest tax-supported debt authorizations in the history of the Commonwealth have occurred since 2007. In 2010, the issuance of $1.3 billion in debt was delayed until 2011 due to the

Reports of the State Budget Crisis Task Force Virginia
34
self-imposed 5 percent cap from the Virginia Debt Capacity Model.114 The Commonwealth’s ability to issue additional tax-
supported debt is also restricted by the availability of revenues for payment of debt service. According to the state treasurer,
general fund debt service on current issues, as well as authorized but not yet issued debt, will likely be more than $600
million by FY 2015.115
Nontax supported debt makes up 63.9 percent of all debt in the Commonwealth and was $21.6 billion at the end of FY
2011. The majority of this debt is issued by various authorities that are created under state law to issue bonds to finance
programs considered to provide a benefit to the public. The largest of these authorities is the Virginia Housing Development
Authority, which has $6.4 billion in debt outstanding, secured by various mortgages. Other issuers include the Virginia
Public School Authority and the Virginia Resources Authority. Colleges and teaching hospitals also issue bonds secured by
fees paid for services. These bonds do not use state taxes to pay principal and interest. In each case, the debt of these
authorities is secured only by the revenues of the issuing body. No tax revenues are used to support this debt and it is not
considered a legal obligation of the Commonwealth. However, $684.0 million of the total carries a “moral obligation”
promise by the Commonwealth to consider funding any deficiencies in debt service reserves from tax revenues.116 To date,
no such deficiencies have occurred.
In the education arena, bond or note debt service payments are made from the state Literary Fund. The Literary Fund is a
permanent and perpetual school fund established in the constitution of Virginia. A shortfall can occur if there is not enough
money in the Literary Fund to cover the debt services due on the pledged primary revenues. Revenues to the Literary Fund
are derived primarily from criminal fines, fees, and forfeitures; unclaimed and escheated property; unclaimed lottery
winnings; and repayments of prior Literary Fund loans. The Literary Fund provides low-interest loans for school construction,
grants under the interest rate subsidy program, debt service for technology funding, and support for the state’s share of
teacher retirement required by the state’s standards of quality.
Future Risks As indicated previously, debt service on tax supported debt is expected to continue to increase in future fiscal years. Virginia
manages its debt capacity very carefully in order to meet its debt service while retaining its long-standing AAA credit rating.
Virginia, one of the few states with top credit ratings, has maintained its AAA credit rating since 1938, longer than any other
state.117
However, there are several risks to the credit rating and to Virginia’s ability to borrow to meet its growing capital needs.
To retain the state’s credit rating is a top priority of fiscal management. The bond rating agencies are known to take a close
look at a state’s ability to control debt when assessing the overall quality of credit. Factors taken into account to determine
the credit rating include, but are not limited to, economic outlook and diversity, efficiency of government, and fiscal
responsibility.118
Debt capacity management was introduced formally in 1990, in a report issued by the secretary of finance entitled “An
Assessment of Debt Management in Virginia.” The Debt Capacity Model119 is used to calculate the affordability of tax-
supported debt. The model takes into account bonds that have already been authorized and revenue estimates that are
presented with the introduction of every state budget. It calculates the total amount of additional debt that can be taken on,
projecting out to as long as ten years, subject, of course, to the common risks associated with long-term forecasting. As a

Reports of the State Budget Crisis Task Force Virginia
35
parameter, the model suggests that tax-supported debt payments should never exceed 5 percent of general tax revenues in
a given year. This 5 percent ratio was endorsed by the Commonwealth in 1991 and has been used as a standard ever
since.
In the wake of the Standard and Poor’s downgrade of the United States in August of 2011, the Commonwealth currently
holds a higher credit rating than the U.S. government. However, Moody’s has placed the Commonwealth, along with some
other states, on its watch list with a “negative outlook” due to federal actions in the wake of the Budget Control Act of 2011
and a potential significant sequestration of federal defense spending.120 As noted at the beginning of this report, DOD
spending, especially for research and development, in the Commonwealth is so significant that a sequester would pose
great risk to jobs, earnings, and economic activity in Virginia.
As indicated in the transportation infrastructure section in this report, concern is growing regarding the Commonwealth’s
failure to address important capital needs. Governor McDonnell has turned to debt as road construction funds are eroded
by inflation and maintenance needs while revenues have stagnated. The administration expects to borrow $4 billion for
road construction and P3s to fill the gap. The plan counts on the P3s to attract billions of dollars of toll-backed private
investment to build projects the state could not afford otherwise. In December 2011 the state unveiled, together with
private-sector partners, the $2.1 billion financing plan for the Midtown-Downtown Tunnel project to link Norfolk to
Portsmouth (part of a much larger set of P3 projects) which is supported already with $395 million in state bonds.121

Reports of the State Budget Crisis Task Force Virginia
36
Conclusion
All the states in the Task Force study confront the same challenges facing the U.S. economy. These include the likely
prolonged delay before the national economy returns to anything close to the trend growth path which predated the
financial crisis. Another stems from the budgetary pressures exerted by national demographic forces — the greying of the
population and its implications for funding health care for all citizens and pensions for public employees. In addition, states
are the arena in which the growing competitive pressures exerted by globalization are played out, requiring a nimble,
modern economy. States need to nurture a skilled, flexible labor force, possess up-to-date infrastructure, and maintain
fiscal competitiveness. These three elements are the vital qualities needed for attracting foreign investment and retaining
or creating good jobs at good wages. Like all states, Virginia will need to adapt to a reduction in the growth of federal
spending, particularly defense and procurement cuts. Each state is situated differently and brings a different history,
political culture, budget environment, and fiscal reality to these challenges.
Virginia has much going for it. It has a well-functioning government in which planning and budgeting reflect best practices.
The governance and budgeting culture generally result in compromise and meet basic requirements. The state has the
highest and longest standing strong credit rating of any state. Compared to the other five states in the Task Force study,
Virginia does not have a structural budget problem. It generally balances its budget in good times with the minimal use of
nonrecurring revenues. It has a “model” rainy day fund. When recessions required the use of significant one-time resources,
such as not adequately paying its obligation to its pension plans, it committed to ending that behavior and has made a
number of adjustments to assumptions and benefits going forward.
However, the state faces fiscal challenges. It is not possible to return to prerecession levels of funding and services without
changes in tax policy and spending priorities. At the same time, the demographics and rising costs are driving up spending
on health care, pensions, and transportation. The fiscal future is all about money. Will state and local officials have the
resources necessary to maintain the fruits of a growing economy and quality of life both in the near and longer term?
Even the most efficient government cannot sustain a healthy state without a fiscal policy that provides the required
resources and investments to meet commitments and future needs. Local governments face reducing service quality or
raising local taxes significantly. The state’s planning documents indicate that Virginia’s general fund revenues will not be
adequate to fund obligations from prior years (debt service and pensions), keep up with health care costs, restore recession
slashes to local aid, improve health and education services, and maintain and improve transportation and other
infrastructure.
Virginia is not poor. It currently ranks seventh in the nation in per capita personal income and is home to America’s three
most affluent counties — Loudoun, Fairfax, and Arlington. At the same time, the state limits its Medicaid program to the
federal minimum requirement for eligibility, which ranks it close to the bottom (forty-eighth) nationally in Medicaid (spending
and recipients) per capita. Affluence and major investments led to clear improvements in K-12 education, but quality
results require quality teachers. Virginia does not pay its teachers particularly well. Enrollment in four-year institutions of
higher education has grown at twice the pace of the population. But real state funding has been falling and tuition rising,
making affordability now a key issue.

Reports of the State Budget Crisis Task Force Virginia
37
Virginians recognize there is a transportation crisis; congestion is choking the economy. But the state has not managed to
adopt a permanent funding source to meet it. Even as ridership grows, the state’s share of transit funding falls; local funds
and fares pay for more than half of transit costs statewide and almost two-thirds in Northern Virginia. As for the highways,
the state has diverted construction funds to cover maintenance for the past decade. The gas tax has not been raised for
twenty-four years — inaction that starves the transportation system of resources.
Virginia is a relatively low tax state. The future has arrived. Will the state’s leaders determine which crucial public
investments must be made? And, on their watch, will they make the case to taxpayers for the need to raise revenues and
use the golden AAA credit to leverage those revenues for tomorrow’s infrastructure?

Reports of the State Budget Crisis Task Force Virginia
38
Endnotes 1 Commonwealth of Virginia, Official Statement for General Obligation Bond Issue [“OS”] October 13, 2010, p. C-15.
2 The economy is diverse. The Hampton Roads area also has a manufacturing and tourism economy. Richmond — the third largest urban area —
houses the capital and the financial industry, including the Fifth District Federal Reserve Board. About one-third of the state’s land is used for farming
and agriculture. See Commonwealth of Virginia, Official Statement for General Obligation Bond Issue [“OS”] October 13, 2010, Appendix C, for further
details.
3 Arlington, where about 40 percent of the households are single persons, leapfrogged from the fifth spot to the third in 2011. Carol Morello and Ted
Mellnik, “Seven of nation’s 10 most affluent counties are in Washington region,” The Washington Post, September 20, 2012,
http://www.washingtonpost.com/local/seven-of-nations-10-most-affluent-counties-are-in-washington-region/2012/09/19/f580bf30-028b-11e2-
8102-ebee9c66e190_story.html.
4 Poverty has also been growing in Northern Virginia. See Carol Morello and Annie Gowen, “Poverty grows in high-income Washington suburbs,” The
Washington Post, September 21, 2012, http://www.washingtonpost.com/local/poverty-grows-in-high-income-washington-
suburbs/2012/09/21/271af814-0406-11e2-8102-ebee9c66e190_story.html.
5 James J. Regimbal, Jr., “Virginia’s Challenges in the Next Decade,” unpublished paper, April 2012. Virginia’s unemployment rate has averaged at
least 1.5 percentage point less than that of the U.S., although the spread approached 3 percentage points at the height of the Great Recession. It
was 2.7 percentage points in September 2011. See Stephen S. Fuller, Center for Regional Analysis, School of Public Policy, George Mason University,
The Impact of Potential Federal Spending Reductions on the Commonwealth of Virginia Economy. Presentation at the Virginia House of Delegates
House Appropriations Committee Annual Retreat, November 15, 2011, p. 6, http://hac.virginia.gov/committee/files/2011/11-15-
11/VA_Federal_Spending_Impacts.pdf.
6 Census data provided by Regimbal, Jr., “Virginia’s Challenges in the Next Decade.” See also Stephen S. Fuller, The Regional Economic Impact of Proposed Reductions in Defense Spending. Testimony Before the House Armed Services Committee on the Economic Consequences of Defense
Sequestration, October 26, 2011, http://www.aia-aerospace.org/assets/testimony_10262011_fuller.pdf.
7 Fuller, The Impact of Potential Federal Spending Reductions on the Commonwealth of Virginia Economy.
8 Regimbal, Jr., “Virginia’s Challenges in the Next Decade,” p. 3.
9 Fuller, The Impact of Potential Federal Spending Reductions on the Commonwealth of Virginia Economy.
10 In 2011, CNBC and Forbes ranked Virginia as number 1 or 2 in overall business climate in the United States, reflecting a good labor supply, a
business-friendly regulatory environment (including being a Right-to-Work state), good quality of life, and relatively low business costs and taxes.
11 Richard G. Salmon, “The Evolution of Virginia Public School Finance: From the Beginnings to Today’s Difficulties,” The Virginia News Letter 86, 3, June
2010, http://www.coopercenter.org/sites/default/files/publications/Virginia%20News%20Letter%202010%20Vol.%2086%20No%202_0.pdf.
12 For 2009, the Federation of Tax Administrators ranked Virginia 43 in total state-local tax burden as a percent of personal income. See
http://www.taxadmin.org/Fta/rate/09stl_pi.html.
13 James J. Regimbal, Jr., “Forecasting 2012-14 Finances for Virginia’s Localities,” VML Finance Forum, Richmond, December 1, 2011,
http://www.vml.org/CONF/11FinanceForumPPTs/Regimbal.pptx.
14 Richmond Times-Dispatch, PolitiFact Virginia, April 2007, http://www.politifact.com/virginia/statements/2011/apr/07/tim-kaine/tim-kaine-says-
virginia-named-best-managed-state-b/.
15 The first conference report was rejected.
16 For example, Governor McDonnell plugged a hole in the current six-year transportation plan using additional debt; when this debt financing runs out,
ceteris paribus, the transportation financing problems in Virginia will be even more severe.

Reports of the State Budget Crisis Task Force Virginia
39
17 James J. Regimbal, Jr., “Evaluating the Multi-Year Projections of Virginia’s Revenues and Expenditures,” unpublished paper for the Task Force,
February 2012.
18 Inflation is forecast to be less than two percent through FY 2018. Ibid.
19 No assumptions are provided about state government’s employment levels, but from the generally flat agency expenditure plans, little additional net
hiring is likely planned. Ibid.
20 The assumed contributions are likely to be too low as they are based on an 8 percent investment earnings assumption, while the Virginia Retirement
System actuaries use 7 percent.
21 Department of Medical Assistance Services, Analysis Federal Health Reform’s Potential Impact on Virginia Medicaid, presentation to the Senate
Finance Committee Health and Human Resources Subcommittee, June 21, 2010,
http://sfc.virginia.gov/pdf/health/2010%20Session/062110%20DMAS%20-%20Ford.pdf.
22 This plan implicitly assumes the downward trend continues — possibly to 25 percent by FY 2018. Localities’ own revenues are 54 percent reliant on
real property taxes; many have used up their reserves. They also have to increase employer retirement funding and will be considering tax/fee
increases.
23 The General Assembly defeated the exemption of new equipment for three years from the machinery and tools tax, estimated at $900M/year, and a
cap on the Business, Professional and Occupational License (BPOL), an estimated $650M/year. James J. Regimbal, Jr., Virginia’s Economic Trends and Impact on Local Budgets, Fiscal Analytics, Ltd presentation, May 31, 2012, p. 17, http://www.vml.org/WNEW/12Docs/FiscalPortraitStateLocalGvtsVA2012.pdf.
24 For example, it is mandatory to cover caretaker adults, but the optional income methodology used by Virginia results in an eligibility level that is “very
close to the minimum allowed.” Department of Medical Assistance Services, Medicaid 2012 Briefing, presentation to Senate Finance Committee
Subcommittee on Health & Human Resources, September 20, 2012, p. 5,
http://sfc.virginia.gov/pdf/committee_meeting_presentations/2012%20Interim/092012_No2_DMAS.pdf.
25 Kaiser data as provided from Scott Crawford, deputy director of finance, Department of Medical Assistance Service, Commonwealth of Virginia, by
email, August 14, 2012.
26 Total growth in enrollment between 2001 and 2011 was 68 percent according to the Department of Medical Assistance Services (DMAS), February
2012. The Kaiser State Health Facts shows a growth rate of 45 percent between 2000 and 2009, slightly less than the national growth rate of 48
percent in the same period.
27 The following site provides a quick overview of state Medicaid actions for FY 2011/12: The Kaiser State Health Facts, “Virginia: Medicaid Budget
Actions,” http://www.statehealthfacts.org/profileind.jsp?cat=4&sub=49&rgn=48. An in-depth analysis with explanations is contained in Vernon K.
Smith et al., Moving Ahead Amid Fiscal Challenges: A Look at Medicaid Spending, Coverage and Policy Trends: Results from a 50-State Medicaid Budget Survey for State Fiscal Years 2011 and 2012, Appendix A-2, Kaiser Commission on Medicaid and the Uninsured, October 2011,
http://www.kff.org/medicaid/8248.cfm.
28 These include expansions of managed care, cost containment for long-term care, audit recoveries, and other future actions. See Department of
Medical Assistance Services, Medicaid 2012 Briefing, p. 17.
29 Depends on assumptions about the take-up of benefits by those newly eligible and those currently eligible.
30 This is somewhat higher than the estimate by the Kaiser Center for Medicaid and the Uninsured of $900 million or 3.1 percent in 2019. Some of the
difference in the estimates is the increase in state costs in 2020-2022 as the federal share for newly eligible enrollees diminishes; some is the fact
that the state does not include potential state savings from Department of Human Services reductions; some is that the state assumes a higher take-
up rate than the Kaiser analysis. Regardless, as of September 2012, the Department of Medical Assistance Services is “re-estimating the impact of
the now-optional expansion, but these estimates are not yet available.” See Department of Medical Assistance Services, Medicaid 2012 Briefing, p.
22.
31 This section draws heavily on Keith Brainard, “Pensions and OPEB in Virginia, Prepared for the Task Force on the State Budget Crisis,” November 30,
2011, and on analysis prepared for the Task Force by the Center for Retirement Research at Boston College.

Reports of the State Budget Crisis Task Force Virginia
40
32 Task Force analysis of data from the U.S. Bureau of the Census.
33 The State Budget Crisis Task Force, Full Report, July 2012, Table 9, p. 32, http://www.statebudgetcrisis.org/wpcms/wp-content/images/Report-of-
the-State-Budget-Crisis-Task-Force-Full.pdf.
34 The local share of contributions is based on U.S. Bureau of the Census, 2010 Annual Survey of Public-Employee Retirement Systems, Table 2a,
http://www.census.gov/govs/retire/. The share of general fund spending is provided by Robert Schultze, executive director of the Virginia Retirement
System, September 10, 2012.
35 There is near consensus in the economics profession that these methods use inappropriate discount rates which, under current market conditions,
underestimate liabilities significantly. See the discussion of this issue in the Full Report of the State Budget Crisis Task Force, July 2012, and the brief
discussion later in this document.
36 These plans account for approximately 85 to 90 percent of the assets of the nation’s 3,400 systems.
37 According to Keith Brainard, executive director of the National Association of State Retirement Administrators, the Indiana Public Retirement System
recently announced it will use a rate of 6.75 percent for its fiscal year 2012 valuation.
38 See Governmental Accounting Standards Board Statements 67 and 68, adopted June 25, 2012. Details can be found at www.GASB.org.
39 The impact would vary dramatically from plan to plan, depending on its specific circumstances and contribution behavior. For example, in California
the funded ratio of CalSTRS was estimated to drop from 59.7 percent to 41.2 percent. Alicia H. Munnell et. al., How Would GASB Proposals Affect State and Local Pension Reporting? Working Paper (Boston, MA: Center for Retirement Research at Boston College, June 2012),
http://crr.bc.edu/wp-content/uploads/2012/06/wp_2012-17.pdf.
40 Based upon comments provided by Robert Schultze, executive director of the Virginia Retirement System, September 26, 2012, and on analysis
prepared for the Task Force by the Center for Retirement Research at Boston College.
41 Under current practice, the rate used to discount future benefit payments and the assumed investment earnings rate are one and the same, although
in concept they need not be the same.
42 This is a smaller percentage increase than for most other plans, reflecting the Virginia Retirement System’s current discount rate of 7 percent, which
is lower than that of most other systems.
43 See Chapter 701 of the Laws of 2012, Virginia (http://lis.virginia.gov/cgi-bin/legp604.exe?121+ful+CHAP0701). Also, based in part on comments
provided by Robert Schultze, executive director of the Virginia Retirement System, September 10, 2012. The law “commits” the General Assembly to
future contributions, stating that “The General Assembly shall set contribution rates that are at least.…” As a practical matter, however, the General
Assembly could change the law.
44 This section relies heavily on Brainard, “Pensions and OPEB in Virginia.”
45 For details see Richard C. Kearney et al., “At a Crossroads: The Financing and Future of Health Benefits for State and Local Government Retirees”
(Washington, DC: Center for State & Local Government Excellence, July 2009), http://slge.org/wp-content/uploads/2011/12/At_a_Crossroads.pdf.
46 Virginia maintains five programs that have OPEB liabilities. Three of those (life insurance, health insurance credit, and disability insurance) are
regularly funded annually at 80 to 90 percent of their respective ARCs. They have substantial assets in their respective trust funds. Two of the trusts
(Line of Duty, and Pre-Medicare Retiree Health Insurance) are strictly pay as you go. The state made an attempt to place contributions into those
trusts but abandoned the effort in 2010. No substantial assets are set aside for those two trusts. (Based on correspondence with Robert Schultze,
executive director of the Virginia Retirement System, September 26, 2012.)
47 Joshua Franzel and Alexander Brown, “Understanding Finances and Changes in Retiree Health Care,” Government Finance Review 28, 1 (February
2012), http://slge.org/wp-content/uploads/2012/03/Understanding_Finances_Franzel_Brown_Feb_2012.pdf.
48 State Budget Crisis Task Force, Report of the State Budget Crisis Task Force: Full Report, July 2012, p. 85,
http://www.statebudgetcrisis.org/wpcms/wp-content/images/Report-of-the-State-Budget-Crisis-Task-Force-Full.pdf.
Reports of the State Budget Crisis Task Force Virginia
41
49 Sara C. Okos, “Richmond, We Have a Problem: Modernizing Virginia’s Outdated Revenue System,” The Virginia News Letter, Weldon Cooper Center
for Public Service, 87, 9 (December 2011), http://www.coopercenter.org/sites/default/files/publications/Virginia%20News%20Letter%202011%20Vol.%2087%20No%209.pdf.
50 Secretary Brown, Joint Money Committee presentation, Governor’s Advisory Council on Revenue Estimates Appendix, December 17, 2010.
51 In 2010, services made up over two-thirds of personal consumption expenditures.
52 John Mikesell, “The Disappearing American Retail Sales Tax,” National Tax Association, November 2011, Table 2.
53 Ibid. While shrinkage was typical, most other states started and ended with broader sales tax bases than Virginia. Nationwide, the median sales tax
coverage for states was 47 percent during the 1970-2010 period, ending at 34 percent in 2010.
54 In October 2003, James J. Regimbal, Jr., estimated $120 million, which he reported fits with two previous estimates, one by the state Department of
Taxation ($110 million) and one by the Weldon Cooper Center ($125 million). Inflation will have increased that estimate a bit. In addition, one should
note that Virginia levies taxes on a number of categories of economic activity, such as insurance premiums, public service gross receipts, and
communications sales separate from the sales tax. See James J. Regimbal, Jr., What is the Potential for Expanding Virginia’s Sales Tax Base? Fiscal
Analytics, October 2003.
55 Okos, “Richmond, We Have a Problem.”
56 Virginia Joint Legislative Audit and Review Commission, “Review of Virginia’s Corporate Income Tax System,” November 2010.
57 Virginia Department of Taxation, Annual Report, Fiscal Year 2010, http://www.tax.virginia.gov/documents/AnnualReportFY2010_04252011.pdf.
58 Senate Finance Committee, “2011 Session Budget Outlook,” November 18-19, 2010, Staunton, Virginia,
http://sfc.virginia.gov/pdf/retreat/2010_Retreat/2b_Budget_Outlook.pdf.
59 Ibid.
60 Okos, “Richmond, We Have a Problem.”
61 As noted by James Bacon, a tax expenditure report should contain the intended purpose of each tax break, who benefits and how much they get, and
an estimate of total cost. A solid tax expenditure report can shed light on underperforming programs or those that cost more than was anticipated
when established, and highlight programs that are meeting or exceeding expectations and yield a high return on investment. See James Bacon, “A
21st Century Revenue System for Virginia,” Bacon’s Rebellion, December 21, 2011, http://www.baconsrebellion.com/2011/12/a-21st-century-
revenue-system-for-virginia.html.
62 Virginia joins a number of states requiring evidence-based reviews of tax expenditures to gauge success and to create processes that encourage
lawmakers to take the reviews seriously. See Institute on Taxation and Economic Policy, Five Steps Toward a Better Tax Expenditure Debate, October
2012, http://www.itep.org/pdf/fivesteps_1012.pdf.
63 “Building a Better Gas Tax: How to Fix One of State Government’s Least Sustainable Revenue Sources,” Institute on Taxation and Economic Policy,
December 2011, http://www.itepnet.org/bettergastax/bettergastax.pdf.
64 Commonwealth of Virginia. Official Statement for General Obligation Bond Issue [“OS”] October 13, 2010, p. c-14.
65 The Six-Year Financial Plan projects it will be FY 2016 before general fund total dollar support for K-12 education is restored to FY 2009 levels, even
with increasing student numbers. See http://dpb.virginia.gov/forms/20120206-1%5C2012_GFSix-YearPlan.pdf.
66 Established in 1992.
67 A 15 percent cap would have provided almost $600 million more in the last recession; if it had been in place in 2006, the state would have had
thirty-nine days of general fund revenue compared to the twenty-five days through the 10 percent cap. See Michael Cassidy and Sarah Okos, Building a Better Rainy Day Fund: Virginia’s New 15-percent Cap on Reserves, The Commonwealth Institute, February 2011, http://www.thecommonwealthinstitute.org/wp-content/uploads/2011/08/110203_building_better_rainy_day_fd_REPORT.pdf.

Reports of the State Budget Crisis Task Force Virginia
42
68 The tax increase consisted primarily of a one-half cent sales tax increase, a phased-in 30 cent tobacco tax increase, a 10 cent recordation tax
increase, with a means test for the existing income tax age deduction, and the elimination of several corporate tax benefits, according to this
legislative report: http://leg1.state.va.us/041/bud/FinalSum/Rev30.PDF.
69 The clawbacks are still in place, but apparently on a declining path. They amounted to $50 million per year for the 2008-2010 biennium and $60
million per year in the 2010-2012 biennium and will be $50 million in FY 2013 and $45 million in FY 2014.
70 A small savings came from a one day furlough of state employees.
71 These use econometric modeling and are subject to professional review and adjustment, if necessary, by the Governor’s Advisory Board of
Economists and the Governor’s Advisory Council on Revenue Estimates.
72 Richard D. Brown, “Governor McDonnell’s Proposed 2012-2014 Budget: Economic Outlook & Revenue Forecast — A Briefing for the Senate Finance,
House Finance, and House Appropriations Committees, December 19, 2011, http://www.finance.virginia.gov/KeyDocuments/JMCMaterials/JMC-
Dec2011.pdf.
73 §2.2-1503.1 of the Code of Virginia. http://dpb.virginia.gov/forms/forms.cfm?search=Six-
Year%20General%20Fund%20Financial%20Plan%20Fiscal%20Years%202013%20to%202018. There are a number of other important institutions
and advisory committees and considerable transparency in Virginia’s multiyear planning process and output, including the Council on Virginia’s
Future, the Debt Capacity Advisory Committee, the Six-Year Capital Outlay Plan Advisory Committee, and the Commonwealth Transportation Board:
http://lis.virginia.gov/cgi-bin/legp604.exe?121+ful+SB535+pdf.
74 Virginia Department of Accounts, 2010 Comparative Annual Financial Report,
http://www.doa.virginia.gov/Financial_Reporting/CAFR/2010/2010_CAFR.cfm.
75 Virginia Financial Perspective for the Fiscal Year Ended June 30, 2010, December 15, 2010, pp. 8-10,
http://www.doa.virginia.gov/Financial_Reporting/PAFR/2010_PAFR.pdf.
76 This covers funding for rail, public transportation, commuter assistance, bicycle, pedestrian, interstate and primary highway projects, and bridges and
culverts. It allocates funds for the first year of the SYIP but only estimates for the remaining five years. The SYIP has always funded major interstate,
public-private, and mass transit projects, and, for the first time in several years, it addresses needs on the primary, secondary, and urban systems:
http://www.virginiadot.org/business/resources/local_assistance/Financial_changes_Cardinal.pdf.
77 James J. Regimbal. Jr., An Analysis of the Evolution of the Public-Private Transportation Act of 1995. Fiscal Analytics Ltd. December 2004,
http://www.southernenvironment.org/uploads/publications/va_ppta_report_jan05.pdf.
78 Education Week: Quality Counts 2012 State Report Cards, http://www.edweek.org/ew/qc/2012/16src.h31.html?intc=EW-QC12-LFTNAV.
79 James J. Regimbal, Jr., “Virginia’s Challenges in the Next Decade.”
80 Ibid. Data accessed at http://www.doe.virginia.gov/statistics_reports/graduation_completion/cohort_reports/index.shtml.
81 James J. Regimbal, Jr., “Virginia’s Challenges in the Next Decade.”
82 State Council of Higher Education for Virginia. Agenda Book, September 19-20, 2011, p. 19,
http://www.schev.edu/SCHEV/AgendaBooks/2011Sept/AgendaBook0911.pdf.
83 States are expected to move from a K-12 system of education to a K-14 system as California has already done.
84 State Council of Higher Education for Virginia. Agenda Book, September 19-20, 2011, p. 17.
85 Council on Virginia’s Future. Educational Attainment in Virginia. Issue Insight No. 5 (December 2009), p. 5,
http://www.future.virginia.gov/docs/issueinsights/insight5-edattainmentva.pdf.
86 The Task Force Report on Infrastructure provides general indicators of the conditions of other major types of infrastructure (dams, drinking and waste
water, schools, higher education, and other public structures); data on spending trends and estimated needs for improvement; and a comparison of
Virginia with the study’s other states.

Reports of the State Budget Crisis Task Force Virginia
43
87 Virginia, along with Delaware, North Carolina, and West Virginia, has county roads under the purview of the state department of transportation (DOT).
See page 1 and figure 1 of http://www.virginiadot.org/business/resources/local_assistance/GMU_Devolution_Study_Final.pdf and
http://ntl.bts.gov/lib/37000/37000/37019/98-r29.pdf for more history.
88 This amounts to 95 percent of the roads. In 1932 with the Byrd Road Act, counties had the option to give the state responsibilities for maintenance
and construction for all local roads. Originally four counties opted out; today only Arlington and Henrico Counties remain out. Independent cities and
towns were not included.
89 The VTrans2035 report states current performances on interstate and primary systems do not meet the target; trends have shown no improvement.
See VTrans 2035, Virginia’s Long-Range Multimodal Transportation Plan. VTrans2035, Report to the Governor and General Assembly, January 2010,
http://vtrans.org/resources/VTrans_2035_Report.pdf.
90 Virginia Department of Transportation. VDOT Annual Report HB 1825 and SB 1005 (2011), last modified November 2011,
http://www.virginiadot.org/projects/resources/annual_report_2011.pdf.
91 This is to maintain a performance target of no more than 8 percent rated structurally deficient in each district. Of this amount, $916.4 million is for
replacement; the remaining $291.3 million covers maintenance ($88.4 million preventative, $188.2 corrective, $14.6 million rehabilitation).
92 VTrans2035, Virginia’s Long-Range Multimodal Transportation Plan, p. 66.
93 Bob Chase, “Virginia’s Transportation Funding Crisis,” The Virginia News Letter 87, 8 (November 2011), p. 4.
94 VTrans 2035 Virginia’s Long-Range Multimodal Transportation Plan.
95 These come from a planning study. See “Final Report: Rail, Public Transportation, and TDM Needs Assessment,” prepared for Virginia Department of
Rail and Public Transportation by Cambridge Systematics, Inc., June 2004, http://www.drpt.virginia.gov/activities/files/VA-Transit-Needs-Complete-
06-2005.pdf.
96 VTrans 2035, Virginia’s Long-Range Multimodal Transportation Plan, p. 47 and p. 69.
97 The CTF contains the revenues for the four major transportation agencies: Virginia Department of Transportation (VDOT), Virginia Department of Rail
and Public Transportation (DRPT), Virginia Port Authority, and Virginia Department of Aviation.
98 Chase, “Virginia’s Transportation Funding Crisis,” p. 3.
99 The 78.7 percent distributed to the Construction Fund is managed by VDOT and allocated through formulas for construction. The 14.7 percent
provided to the Mass Transit Fund supports transit operations, capital, and special programs and is managed by the DRPT. The Airport Fund’s 4.2
percent is provided to the Aviation Board and 2.4 percent to the Port Fund is managed by the Virginia Port Authority.
100 Commonwealth of Virginia, 2012-2014 Biennial Budget, Revenue Forecast,
http://dpb.virginia.gov/budget/buddoc12/pdf/parta/revenueforecast2012.pdf.
101 See Chase, “Virginia’s Transportation Funding Crisis,” Table 2, p. 4, for the daunting completion costs for the SYIP highway projects by regions.
102 There is currently no federal funding for Phase 2 of the Silver Line; the state is providing $150 million. Tolls are expected to cover 75 percent of the
estimated $2.7 billion cost of Phase 2. The cost of a one-way full-toll is projected to rise in January 2013 to $2.75, increase to $4.50 in 2015, and
increase by $2 every five years. Local residents want the tolls burden not to exceed 25 percent of the Phase 2 cost. The Metropolitan Washington
Airports Authority is looking to a federal loan. A class action lawsuit argues that the agency does not have the right to toll drivers to pay for trains. See
http://transportationnation.org/2012/09/18/breaking-federal-money-could-stave-off-dulles-toll-road-toll-hike-if-the-loan-comes-through/.
103 The state share is expected to fall further as important new transit service begins (e.g., the Tide in Norfolk, the Silver Line in the Dulles corridor, Mark-
and BRAC-related service, Radford, AltaVista, and startups in other small communities). Insufficient operating funds in 2011 resulted in
overcrowding, higher fares, reduced frequency of services, fewer routes served, and increased reliance on local funding and fares.
104 Northern Virginia Transportation Commission, “Funding Public Transit in Northern Virginia,” January 18, 2005, slide 10,
http://www.thinkoutsidethecar.org/pdfs/January%2018,%202005%20Draft%20Funding%20Public%20Transit%20in%20Northern%20Virginia.pdf.
105 Chase, “Virginia’s Transportation Funding Crisis,” p. 5.

Reports of the State Budget Crisis Task Force Virginia
44
106 Ibid, p. 6.
107 Ibid, p. 7 provides a fair discussion of the limitations of P3 and tolling.
108 Ibid, p. 10.
109 Ibid, p. 9.
110 Ibid, pp. 9-11.
111 For example, estimates are that time lost due to road congestion in 2010 cost $654 per car-commuting motorist in the Virginia Beach/Hampton
Road region and $1,495 per commuting motorist in the Northern Virginia/metro DC region. See Ibid, p. 12, for further details and sourcing.
112 As calculated by Moody’s Investor Services in its 2011 State Debt Medians Report, June 3, 2011,
http://www.vermonttreasurer.gov/sites/treasurer/files/pdf/bonds/Moody's%20State%20Debt%20Medians%202011-corrected.pdf.
113 It grew by $5.7 billion, or 98 percent. Senate Finance Committee, “Overview of Virginia’s Use of Debt,” November 18, 2011, p. 15,
http://sfc.virginia.gov/pdf/retreat/2011%20Retreat/Presentation_Final%20PDF%20for%20Website/8.Debt%20%28FINAL%29.pdf.
114 The Debt Capacity Model, administered by the Debt Capacity Advisory Committee (DCAC), is an estimate of the commonwealth’s capacity to authorize
and issue new tax-supported debt. The model is used to advise the governor and General Assembly on the amount of additional tax-supported debt
that could be prudently authorized and issued in each of the next two years.
115 Manju S. Ganeriwala, State Treasurer, “Overview of the Commonwealth’s Debt Capacity,” January 18, 2012, p. 14.
116 A moral obligation bond is a type of revenue bond that is protected against future default through the use of reserves to support the bond if the
issuing government is not able to fulfill the moral obligation. The moral obligation is not legally binding; however, if the bond were to default, the
issuing body would likely receive a downgrade to its overall credit rating, making future borrowing more difficult and expensive. See www.msrb.org.
117 Credit ratings do change. For example, in December 2010 there were eight states with the highest ratings; there were ten in December 2011. (See
Table 22 in Joint Legislative Audit and Review Commission, Virginia Compared to the Other States. The 2011 edition, comparing as of December
2010, is accessed at http://jlarc.state.va.us/reports/Rpt410.pdf; the 2012 edition, comparing as of December 2011, is accessed at
http://jlarc.virginia.gov/reports/Rpt419.pdf.)
118 Rating agencies evaluate states on a standard ten-point scale that focuses on outstanding general obligation debt. See ibid.
119 “Report of the Debt Capacity Advisory Committee,” December 18, 2009.
120 On December 7, 2011, Moody’s revised South Carolina and Tennessee’s ratings to stable, but reiterated that the “outlooks for Maryland, New
Mexico, and Virginia remain negative due to the high concentrations of federal government employment and federal procurement.” See Moody’s
Investors Services, Outlook to Stable for Most Aaa-Rated Muni Credits Linked to U.S., December 7, 2011, http://www.moodys.com/research/Moodys-Outlook-to-Stable-for-Most-Aaa-Rated-Muni-Credits--PR_232892.
121 The plan proposes a public-private partnership under which the Elizabeth River Crossings (ERC) project will impose tolls of $1.59 for cars during off-
peak hours and higher charges for trucks and cars during peak hours. In future years, the ERC will raise tolls at an annual rate of 3.5 percent or the
Consumer Price Index, whichever is higher. The ERC will begin collecting tolls in 2012, five years before the project is complete and the public
experiences any benefit from it. Those revenues will flow to the ERC for the next 58 years. See James A. Bacon, “Perfecting P3s Still Takes Work,”
Bacon’s Rebellion, December 19, 2011, http://www.baconsrebellion.com/2011/12/perfecting-p3s-still-takes-work.html.

ACKNOWLEDGEMENTS
Advisory Board Chairs
Richard Ravitch
Paul A. Volcker
Members
Nicholas F. Brady
Joseph A. Califano, Jr.
Philip L. Clay
David Crane
Peter Goldmark
Richard P. Nathan
Alice M. Rivlin
Marc V. Shaw
George P. Shultz
Task Force Donald Boyd Executive Director
G. Edward DeSeve
Suzanne Garment Counsel
Peter Kiernan
Donald Kummerfeld
Carol O’Cleireacain
Haley E. Rubinson
Jonathan Cavalieri
Lucy Dadayan
Pat Fuchs
Lisa Montiel
Nicole Wiktor
State Partners California
California Forward
James P. Mayer
Fred Silva
Illinois The Institute of Government and Public Affairs at the University of Illinois
David F. Merriman
Richard F. Dye
Andrew Crosby
Nancy W. Hudspeth
Martin Luby
New Jersey
Richard F. Keevey
New York The Nelson A. Rockefeller Institute of Government
Robert Ward
Brian Stenson
Texas
Billy Hamilton
Vicki Anderson
Virginia The Center on the Public Service of George Mason University’s Department of Public and International Affairs
Paul Posner
Frank Shafroth
Jim Regimbal
Darrene L. Hackler
Funders The work of the Task Force was made possible form a number of generous funders. We would like to thank all of them for their support–those listed alphabetically below as well as those wishing to remain anonymous.
The Community Foundation The Nathan Cummings Foundation of New Jersey The Ewing Marion Kauffman The Open Society Foundations Foundation
The Fund for New Jersey The Peter G. Peterson Foundation
The Geraldine R. Dodge The Robert Wood Johnson Foundation Foundation
The John D. and Catherine T. MacArthur Foundation
We appreciate the financial support from the funders and the research and analysis prepared by State Partners. All conclusions and opinions expressed within are the responsibility of the Task Force.

www.statebudgetcrisis.org