report of the steering commit n urbanis...
TRANSCRIPT

RepComUrb
Twelf(2012
PlannGoveNew Nove
C
port ommitanis
fth Fiv2-2017
ning CernmenDelhi –
ember,
Confidentia
of thttee osatio
ve Yea)
Commint of In– 110 , 2012
al Working
he Ston n
ar Plan
issionndia 001 (In
g Draft – N
teerin
n
ndia)
Not for cir
ng
rculation
0

Table of Contents Executive Summary 2
1 Urbanisation and Economic Growth 17
1.1 India is set to Urbanise at an Accelerated Pace 17
1.2 Cities are the Engines of Inclusive Growth 19
1.3 Urban Growth has Positive Linkages with Rural Growth 19
2 Present State of Urban India 20
2.1 Higher Incidence of Urban Poverty 20
2.2 Poor State of Basic Service Delivery 20
2.3 Overview of Existing Urban Development Schemes 22
3 Vision for Indian Cities 26
3.1 Key Constituents of India’s Urban Future 26
3.2 Goals and Vision for the 12th FYP 27
4 Strategies for the 12th Five Year Plan 31
4.1 Governance 31
4.2 Urban Planning 39
4.3 Funding Urban Infrastructure 53
4.4 Capacity Building 62
4.5 Sector Specific Recommendations 69
Appendix 1: Sources of increase in urban population in past years 84
Appendix 2: Urbanization level and per capita income relationship 85
Appendix 3: Comparison of urban and rural sector productivity 86
Appendix 4: Share of urban GDP 87
Appendix 5: Trends in urban poverty 88
Appendix 6: Unsustainable levels of air pollution 89
0
1
Appendix 7: Projections for quality of urban service in business as usual scenario 92
Appendix 8: Potential financing models for metro 93
Appendix 9: 20 year investment estimates for urban development1 94
Appendix 10: Three scenarios for investment in Indian urban development 95
Appendix 11: Summary of PPP models 105
Appendix 12: Calculations and assumptions for investments needed for transport sector 106
Appendix 13: Affordable Housing 111
Appendix 14: Estimates of urban PPP potential 119
Appendix 15: Land based Instruments 121
Appendix 16: Lack of explicit demand for capacity building and non-utilization of allocated budget 134
Appendix 17: Component wise break up of proposed investment requirement for capacity building scheme 137
Appendix 18: Draft advisory note for Municipal Cadre 143
Appendix 19: Proposed scope of Urban Transport Act 156
Annexure A: Reducing Poverty In Urban India: Select State-Level Approaches 159
Annexure B: Cases studies on urban PPPs 164

Executive Summary India is set to urbanise at an unprecedented pace and scale. As per census estimates, India’s urban population has grown from 290 million in 2001 to 377 million in 2011; accounting for over 30 percent of the country’s population. This is driven by increase in population of existing urban centers, emergence of new urban centers across the country and migration from rural to urban areas.
Urbanisation has shown significant positive linkages with economic growth. Urban India accounted for 62 to 63 percent of the country’s GDP in 2009–10. This growth in urban areas also creates opportunities for the rural economy and helps improve its productivity, especially in rural areas adjacent to urban centres.
While the true scale of urbanisation is yet to unfold, Indian cities are struggling at the current levels. Quality of life in our cities is poor as the majority of citizens find it difficult to avail of sustainable livelihood opportunities and basic services. For example 24 percent of the urban population lives in slums and many slum dwellers do not have access to basic sanitation facilities and potable water. The modal share of public transport in India is only 22 percent and share of buses was only 1.1 percent of total registered vehicles in 2001. Unfortunately, the lack of suitable livelihood opportunities further deteriorates the quality of life for many including the physically challenged, e.g. 26 percent of the urban population lived below the monthly consumption of Rs. 539 in 2004–05.
To overcome these issues, the government has stepped up its focus and launched multiple schemes to facilitate urban renewal and development. This includes the flagship schemes of Jawaharlal Nehru National Urban Renewal Mission (JNNURM), Rajiv Awas Yojana (RAY), Swarna Jayanti Shahari Rozgar Yojana (SJSRY) among many others. While these initiatives have renewed focus on the urban sector, they have also highlighted several critical issues that impede urbanisation.
Hence, a comprehensive assessment of urban objectives and strategies is needed to steer planned, inclusive and sustainable urban development. Exhibit 1 lays out the key constituents of India’s urban agenda.
2

EXHIBIT 1
Key constituents of India’s urban future
Planned, inclusive and sustainable urban development
Such a vision should encompass slum-free cities, less than 10 percent urban poor, 100 percent access to water and sanitation, more than 50 percent share of public transport and 75 percent of new commercial buildings to be energy efficient. To enable this, interventions that strengthen policies, institutions and schemes are required in the areas of governance, planning, funding and capacity building, with innovation as a cross-cutting theme.
Key recommendations
Governance ■ Vest executive municipal authority to Mayor and extend the
term to 5 years: Mayor should have executive municipal authority and corresponding accountability. While the local conditions should determine whether the cities should adopt a Mayor–in–Council or an Executive Mayor system, in either case, the Mayor’s term should be extended to five–years instead of the current one to two year term.
■ Set up a municipal services regulator: An independent utility regulator should be set up at the state level to advise, regulate, monitor and adjudicate on desired levels and pricing of service delivery, equitable access to all urban citizens and, the roles and responsibilities of all utility providers.
Des
ired
outc
omes
Nec
essa
ry e
nabl
ers
Build capacity across all levels
Promote innovation in urban management10
Strengthen local governance systems
Integrate planning organisations and processes
Build capacity across all levels
Financially empower ULBs
1 2 3 4 5
Affordable housing
Sustainable livelihood
and enterprise
Universal access to water and sanitation
Quality and
affordable public
transport
Clean and healthy environ-
ment
6
7
8
9
3

■ Introduce Citizen Charters: Every municipality in the metropolitan area should produce a citizen’s charter. It should contain comprehensive information on service levels for all urban services, time limits for approvals relating to regulatory services such as licenses and permits and the relief available to the citizens in case of non-adherence. Information technology should also be used for time efficient provisioning of urban services. An important area of reform would be that the ULBs should design transparent single window clearance system for all building proposal approvals.
■ Corporatisation of service delivery: In large metropolitan areas and cities, the corporatisation of service delivery including public transport at city level should be considered. Some of the government agencies can be carved out to function efficiently under an empowered board that facilitates quick decision–making.
■ Clarify roles of ULBs and parastatals: It is necessary to create a sustainable and acceptable platform for ULBs and parastatals to work together. An example of this could be a service level agreement (SLA) led contractual arrangement between the two.
■ Set up Lok–Ayuktas/Ombudsman: It is essential to bring local office bearers, councillors and other office bearers under the purview of an Ombudsman or the Lok–Ayukta.
■ Merge MoUD and MoHUPA into one ministry: Urban development, housing and poverty alleviation are inter–related subjects and hence a unified approach should be considered.
Planning:
■ Participatory Planning process: Adopt the “smart growth” principle centred around individuals that focuses on compact, mixed-use development and transit oriented planning with a range of housing choices in an environmentally friendly manner. An important aspect of urban planning should be involvement of community with an overriding objective of making cities engines of inclusive growth. Participatory planning should be a pre-requisite for any endeavour for urban renewal.
■ Incentivise strategic densification: Strategic densification with mixed land use as a planning strategy needs to be pursued to accommodate future urbanization needs. In addition to this, mandating inclusionary zoning and providing higher Floor Space Index (FSI) with provision for amalgamation of plots to make the economics of affordable housing viable should be considered.
■ Establish a Guaranteed Land Title Act: Implementing a system of property title certification is one of the mandatory reforms under the
4

JNNURM. The Ministry of Urban Development has undertaken a comprehensive exercise under Project PLATINUM (Partnership for Land Title in Urban Management) for implementation of Guaranteed Land Title. Pilot projects are required to be taken to take this reform forward.
■ Land Readjustment (LR): In essence a participatory tool, LR to a great extent, avoids the public discontent and protests that land acquisition may generate. It involves efforts from public authorities such as the redrawing of boundaries and the associated adjustment of property rights. It could also be used for redevelopment purposes in urban areas as illustrated by the example of C-Ward in Mumbai.
■ Implement the 74th Constitutional Amendment and constitute the District Planning Committees (DPCs) and Metropolitan Planning Committees (MPCs): The MPC/DPC should create the 20 year spatial development plan for the region including peri-urban/rural areas. This Spatial Development Plan should then be used by the ULBs as a guiding framework to create the second tier of plan for the city through participatory processes at the Ward Committee/Area Sabha level.
■ Restructure the role of Metropolitan Development Authorities (MDAs): MDAs should function as the technical arm of the MPC/DPC and leverage its technical capabilities of being a metropolitan level planner and regulator. It may also be the appellate authority for conflict resolutions on the Spatial Plans for all ULB plans in the metropolitan region.
■ Include peri-urban areas in urban planning: Exclusion of peri-urban areas, which in reality are centres of intense economic activities with huge potential to generate jobs, has led to haphazard development around many of the cities. As the boundaries of cities continuously expand, this would eventually necessitate expensive ‘retrofits’ in future. A robust mechanism to ensure city level and regional plans for holistic and sustainable development of city is a must.
■ Establish State Planning Boards (SPBs): All states must constitute and strengthen State Planning Boards and mandate them with the preparation of state-wide strategic Spatial Development Plans (SDPs). It should also approve the plans of DPCs and MPCs and act as the arbitrator for conflicting land uses.
Funding
5

■ Substantially increase investment in the urban sector: Historically, India has under-invested in urban areas leading to a poor quality of life for urban citizens. To address this, India needs to significantly step-up its investments. The High Powered Expert Committee Report (HPEC) on Urban Infrastructure and Services (2011) estimated the total capital investments in urban infrastructure at about Rs. 39 lakh crores over the next 20 years with 56% investment in urban transport sector. However significant investment in capacity building is required to effectively utilize this money.
■ Introduce a Local Bodies Finance List in the Constitution: A Constitutional Amendment to create a ‘Local Bodies Finance List’ should be made. It should clearly outline the revenue streams for ULBs including tax & non-tax revenues.
■ Ensure revenue sharing from states to ULBs: Revenue sharing by states should be enforced constitutionally. According to HPEC, states should share 25 percent of the state revenues with rural and urban local bodies. This can be fine–tuned by SFCs based on the level of economic activity, population, severity of urban issues and other relevant factors. The Committee is of the opinion that financial sustainability of ULBs and predictability of municipal finance are pre-requisite for their attracting private investments. In this regard, the Committee fully endorses the recommendations contained in the HPEC report for broad based revenue sharing by the States with ULBs through appropriate amendments of the Constitution /other measures.
■ Different working groups have estimated the requirement of
budgetary support for urban sector in the 12th plan as follows:
PARTICULARS IN RS. CR
(A)URBAN TRANSPORT (EXCLUDING CAPACITY BUILDING): ESTIMATED BY THE WORKING GROUP ON URBAN TRANSPORT
80,843
(B) BUDGETARY SUPPORT REQUIRED UNDER JNNURM ( INCLUDING URBAN TRANSPORT): WORKING GROUP ON FINANCING
1,44,000
6

URBANISATION
(C ) RAJIV AWAS YOJANA AND ANY OTHER SCHEME OF SLUM REHABILITATION: (ESTIMATED BY WORKING GROUP ON FINANCING URBANISATION
1,06,694
(D) NATIONAL URBAN LIVELIHOOD MISSION (ESTIMATED BY THE MINISTRY OF HOUSING AND URBAN POVERTY ALLEVIATION
20,000
(E) NATIONAL CAPACITY BUILDING SCHEME (INCLUDING CAPACITY BUILDING FOR URBAN TRANSPORT) ESTIMATED BY THE WORKING GROUP ON CAPACITY BUILDING
18,000
■ Establish a comprehensive approach to facilitate PPPPs: A
massive push is needed to attract private investment in all areas of urban infrastructure, both for large infrastructure projects and in bulk water supply, waste water recycling, treatment of MSW and treatment or urban sewerage. This should be done under an extended ‘4P’ framework—People-Private-Public Partnerships as experience across the world indicates that in urban renewal and management, the role of ‘People’ in design of projects and partnerships is crucial, much more so than in large infrastructure projects such as highways, airports, power, power plants, etc in which ‘People’ have a relatively limited role in the ongoing governance of the projects and their outcomes. Therefore best practices and model documents for ‘PPPP’ must be evolved and deployed for India’s urban management agenda to succeed. This would improve the ownership of these projects and would facilitate an effective R&R component of the project. These PPPP projects may become more viable if a subvention from property and other urban taxes is imaginatively used to meet any financial gap in the projects where felt necessary.
7

■ Reforms in property taxes: Property tax should be restructured as a general benefit tax. For constructed properties, it should be determined using an area-based capital valuation system. Also, to avoid land hoarding, a ‘vacant land’ tax should be formalized for all land including government land.
■ Encourage pricing of FSI: It is recommended that beyond minimum FSI given as development rights, additional FSI should be selectively provided and charged for. Also, the charges for additional FSI & land-use conversions should be determined professionally and should be at least 50 percent of the area rate in the concerned area. The revenue so generated be suitably ring-fenced for funding infrastructure projects to sustain higher FSI
■ Put in place a robust land monetization framework: An institutional framework to tackle the issues related to land must be put in place urgently to be able to unlock land value in a significant way. However, the framework needs to be transparent and accountable with due attention to the needs of the poor and marginalised sections.
■ Determine user charges to cover the O&M costs: User charges must be levied for all measurable services where beneficiaries are easily identifiable. Appropriate level of user charges should be determined by the proposed Municipal Services Regulator. Also, there should be a tiered structure of user charges, where higher levels of consumption should be tagged with a higher tariff.
■ Set up a city/state level development fund: Proceeds accruing to ULBs from innovative sources like land monetisation and other land based instruments should be pooled into a ‘ring fenced’ city development fund and then used only for urban infrastructure projects for respective cities and not for any other purpose. In view of the capital intensity of transport projects, it is suggested that the fund may have two parts- a) Fund marked for urban transport projects and b) fund for other infrastructure projects. To start with, such fund may be created in metropolitan cities. For smaller cities, such fund may be created at state level or by pooling some of the cities.
Capacity Building ■ Create a Municipal Cadre: A Municipal Cadre, covering the key
areas of modern day urban governance and capable of meeting the ever increasing complexities in city management should be created. Suitable recruitment rules, training environment and an attractive career path should be put in place. States need to be suitably incentivised by the centre for creation of municipal cadres.
8

■ Create a separate division for Capacity Building at MoUD: Dedicated leadership is essential for a large scale capacity building program to succeed. It should look into the aspects of demand creation, augmenting supply side, strengthening linkages between institutions and cities, identifying new areas of capacity building, evaluating the impact of programmes etc. .
■ Address supply side gap in capacity building Supply side constraints posed major hurdle to capacity creation under 11th plan. For addressing supply side constraints, preference should be accorded to re-orienting and augmenting such capacities in the existing institutions, both at the national and the state level. However, wherever necessary, separate institutions may also be created.
■ Assessment to ascertain gap in capacity: the Committee has observed that the present capacity building efforts are not aligned to the gap in the capacity available at different levels. Hence assessment to ascertain the deficit in capapcity at different levels should be immediately taken up.
Sector specific recommendations Urban poverty, housing and slum rehabilitation
■ Enable provision of security of tenure: Rajiv Awas Yojana, a key scheme, launched in 2011 for rehabilitation of slums, envisages provision of tenure security to slum dwellers. This should form a key element of strategy to ensure inclusive growth in 12th plan as it would facilitate transition of urban poor from informal to formal sector.
■ Facilitate the creation of social/rental housing: The focus on provision of rental/social housing stock for the migrant population is a critical element in making our cities more inclusive. It must include individual rental units, shared rental units as well as dormitory and night shelter options.
■ Revitalise and reorient the role of State Housing Boards (SHBs): Encourage SHBs to develop multiple partnerships with the private sector for construction of affordable housing. State governments should also support the SHBs by providing land as per the metropolitan/city master plan.
■ Delivery of affordable housing through corporatized agency: At the metropolitan level there is no specific agency that is responsible for the delivery of affordable housing stock. It is proposed that a corporatised agency that functions with an empowered board
9

steers the development and delivery of such stock in the top 20 metropolitan areas.
■ Adopt and implement the Model Street Vendors Bill, 2009: States and cities should adopt and implement this bill designed to protect the livelihoods of street vendors by regulating street vending. This will enable the creation of physical legal spaces for the informal economy and recognise and support natural markets of street vendors with a non–eviction guarantee.
■ Launch National Urban Livelihood Mission: It is well known that agglomeration and densification of economic activities (and habitations) in urban conglomerations stimulate economic efficiencies and provide more opportunities for earning livelihoods. Opportunities for entrepreneurship and employment increase when urban concentration takes place, in contrast to the dispersed and less diverse economic possibilities in rural areas. Thus urbanization, if properly managed enables faster inclusion of more people in the growth process. However, to fully harness this potential of our cities to create wealth for urban poor, it is necessary that multipronged strategy is adopted which may include skill development, creation of facilitative environment for self employment, provision of institutional credit to urban poor. Simultaneously, it should be ensured that municipal and city level legislations are suitably aligned to create gainful employment on one hand and facilitate transition of the people engaged in informal sector to formal sector on the other.
Urban Transport
■ Establish/strengthen a Unified Metropolitan Transport Authority (UMTA): An UMTA’s should be set up to focus on creating metropolitan level transportation plans which should be integrated with spatial and land use plans created by MPC/DPC.
■ Establish a new department of UT in MoUD: Being capital intensive by nature, urban transport will attract the highest share of investment in urban sector in the coming years. To manage this scale and complexity, it is recommended that a separate department should be set up within MoUD, with a full time Secretary in–charge to exclusively focus on urban transport issues and drive implementation across the country.
■ Comprehensive Urban Transport (UT) Act for legislative support: A law should be put in place to provide the necessary framework for setting–up UMTAs including clear articulation of its responsibilities, management of safety issues etc. The UMTAs
10

should be based in the city and should report to MPC/DPC. This central act can be used by the states to frame rules for urban transport. Urban transport should be placed under Concurrent List by amending the constitution to provide constitutional support to the UT Act Water supply and sanitation
■ Universalisation of access to water and sanitation to urban areas: This involves the universal coverage of all urban population for the minimum levels of safe drinking and household-use water along with a clean toilet, sewerage, storm water drainage and solid waste management. The provisioning of basic water and sanitation should be de-linked from issues of land tenure and legal status. This basic service should be extended to recent and temporary/seasonal migrants as well. These services should be provided on the clear understanding that this provision does not automatically translate into legal entitlements in other spheres, especially as regards legal rights to the land and/or dwelling space. Further any decisions as to whether the slums is to be legalized or not should be made irrespective of the provision of basic services.
■ Reduction in unaccounted for water: A systematic approach for identification and reduction of leakage and preventive maintenance would be promoted as an integral part of the operation & maintenance of the water supply system on a regular basis. This would help save precious quantities of treated water and increase revenues to make systems self-sustaining. Such measures can often obviate the need for immediate augmentation of capacities of the existing schemes, which are very often quite capital intensive, while triggering significant improvements in service delivery.
■ 100% metering of water supply: Metering is essential for recovery of reasonable user charges and conservation. It acts as an incentive for those who wish to conserve water and a disincentive to those who waste water. Metering helps increasing the total quantum of water available and consequently increases the quantum of water available for supply and increases the overall revenue. Metering also leads to reduction of wasteful use of water and increases efficiency and sustainability of the water supply system that is an important O&M function.
■ Ensure 24x7 water supply: Yet another priority is to move towards continuous water supply. Intermittent supply leads to sucking of external pollution into the system during non-supply hours due to inadequate pressure, causing health hazards.
11
■ Address structural dysfunctionalities through reforms For meeting the aforesaid target, it is necessary that structural issues facing the sectors are addressed through completion of reforms mandated under JNNURM. These issues include high levels of non-revenue water, low level of metering, intermittent supply, inadequate quality, low sustainability etc. The poor, particularly those living in slums and squatter settlements, are generally deprived of potable water. The implementing Ministry should work with states and ULBs to introduce operational, financial and institutional reforms related to water sector and these reforms under JNNURM-II.
■ The issue of allocation of water resource between rural and urban India needs to be addressed in ways that reduce intra-national tension: In many instances, growth of urban and Industrial sectors increases consumption of water which may give rise to conflicting claims on allocation of water across different sectors. It is imperative that while all efforts are made to conserve water for augmenting its availability, Indian cities and industries re-invent their water strategy with an aim to grow with minimal water and minimal waste generation.
■ To cut the costs of water supply and distribution losses, focus on building, renewing and replenishing local water sources, including groundwater. As cities expand their water footprint which implies sourcing water from distance sources, the cost of water supply as well as transportation losses and leakages rise. Committing a larger capital investment in creating such infrastructure also leaves utilities with very little money to maintain these networks which further compounds the problem. It is necessary therefore that all efforts should be made to develop source of water close to where people need supply. The city sources are it water bodies, which capture rain or floodwaters from rivers as well as its underground water aquifers. There is an urgent need to protect and nurture these sources. Such measures may include bringing specific legislations apart from taking up specific projects under JNNURM.
■ Include ground water in water supply calculations: While preservation and re-charging of ground water are increasingly receiving attention of city planners, there is a tendency to exclude this source from urban water planning. In absence of universal access to piped water supply, people are forced to rely on ground water extraction. Another problem is perverse incentivisation for substitution of piped water supply by ground water extraction in
12

■ Take an integrated view of water supply and sanitation:
Investment in sewage should be a function of investment in water supply as any augmentation of water supply also leads to increase in sewage generation. It is therefore necessary that planning of a water supply project should also include provision for treatment of sewage. Discharge of untreated sewage, besides making cities and our water bodies unhygienic also significantly raises the cost of treatment of water. The guiding principle should be to incentivise cost saving innovations in building sewage network, reduce the length of sewage network and to treat the waste water as resource by turning it into water for irrigation or use in the industry.
■ Set real and hard targets for affordable recycling and re-use of treated waste water : Recycling and re-use of waste water is already in practice. This is required to be scaled up in a planned way. Re-use of waste water after its treatment in agriculture and other sectors should be properly planned for optimal utilization of this scarce resource.
Recommended schemes for urban development
MAJOR SCHEMES FOR URBAN RENEWAL AT A GLANCE
STATE SECTOR ACA SCHEME:
JNNURM : THE KEY PRINCIPLES THAT SHOULD BE CONSIDERED WHILE DESIGNING THIS SCHEME ARE:
■ COVER ALL LARGE AND SMALL CITIES. HOWEVER, THE RESOURCE ALLOCATION SHOULD BE DONE IN A MANNER IN WHICH LARGE METROPOLITAN AREAS AND CITIES ARE EQUIPPED WITH POLICY AND LEGISLATIVE FRAMEWORKS TO RAISE APPROXIMATELY UP TO 80 PERCENT OF THEIR INVESTMENT REQUIREMENT. TIER 2 CITIES SHOULD BE PROVIDED WITH FURTHER ASSISTANCE FROM THE CENTRAL GOVERNMENT I.E. APPROXIMATELY 50 PERCENT OF THEIR INVESTMENT REQUIREMENT AND TIER 3 AND TIER 4 CITIES WILL REQUIRE EVEN MORE ASSISTANCE AS THEY HAVE CHRONICALLY UNDERINVESTED IN URBAN INFRASTRUCTURE AND ADMINISTRATION.
13

■ HIGHER TOTAL OUTLAY OF RS. 1,62,000 CRORES FOR THE NEXT 5 YEARS
■ ENSURE A “FORMULA-BASED” SHARING OF THE STATE’S REVENUES WITH ULBS
■ INCENTIVISE ULBS TO STIMULATE THEIR OWN REVENUES THROUGH INCREASED PPP, EFFICIENT TAX COLLECTION, MONETISATION OF URBAN LAND, PRICING OF FSI AND ACCESSING DEBT MARKETS
■ FACILITATE PPPS BY: – PROVIDING GUIDELINES ON AVAILABLE MODELS AND
THEIR APPLICABILITY TO DIFFERENT SITUATIONS (E.G. GROSS COST MODEL FOR PPP IN BUS TRANSPORT)
– ENCOURAGING CREATION OF PLANS FOR TRANSITIONING TO PPP FOR SMALLER CITIES BY IDENTIFYING FEW VIABLE PROJECTS
■ PROPOSE A MODEL PROCESS FOR AGGREGATION AND MONETISATION OF LAND ASSETS
■ EMPHASISE THE IMPORTANCE OF SPATIAL PLANNING; EARMARK ~10 PERCENT OF THE PROGRAM FUNDS FOR PLANNING RELATED ACTIVITIES
■ INCENTIVISE ULBS FOR TIMELY COMPLETION OF PROJECTS ■ ENSURE THAT DETAILED PROJECT REPORTS (DPRS)
INCLUDE THE O&M COMPONENT AND ARE NOT RESTRICTED TO ASSET CREATION
JAWAHARLAL NEHRU NATIONAL URBAN RENEWAL MISSION ( JNNURM) MAY HAVE FOLLOWING COMPONENTS:
• URBAN INFRASTRUCTURE AND GOVERNANCE (UIG) • RAJIV AWAS YOJANA (RAY)
A. THE KEY PRINCIPLE OF RAY SHOULD BE
– IN-SITU DEVELOPMENT THROUGH INCREMENTAL UP-GRADATION AND/OR REDEVELOPMENT OF SLUMS
– CREATION OF RENTAL HOUSING STOCK, AS 30 PERCENT OF TOTAL AFFORDABLE HOUSING STOCK
– PROVISION OF BASIC SERVICES OF WATER AND SANITATION
– ACCESS TO FINANCING THROUGH A CREDIT MORTGAGE GUARANTEE FUND
– TO BE IMPLEMENTED IN CITIES HAVING POPULATION OF
14

MORE THAN 5 LAKHS
B.
• SLUM REHABILITATION IN CITIES NOT COVERED UNDER RAY
- THE SCHEME WILL BE LARGELY IN THE NATURE OF IN-SITU INCREMENTAL IMPROVEMENT OF SLUM
-THE SCHEME TO HAVE SEPARATE FUNDING OPTION FOR CITIES OF DIFFERENT SIZES.
C.
• NATIONAL MISSION ON CAPACITY BUILDING FOR URBAN DEVELOPMENT:
D. INSUFFICIENT CAPACITY AND CAPABILITY AT THE STATE AND ULB LEVEL HAVE BEEN IDENTIFIED AS KEY CHALLENGES IN RE-VITALISING THE URBAN SECTOR. IT IS RECOMMENDED THAT A SEPARATE FLAGSHIP SCHEME UNDER THE OVERALL FRAMEWORK OF JNNURM MAY BE LAUNCHED TO ADDRESS THIS FUNDAMENTAL ISSUE. SUCH A SCHEME MAY INCLUDE:
■ ADMINISTRATIVE AND TRAINING SUPPORT TO PROPOSED MUNICIPAL CADRE
■ CREATION OF COMPREHENSIVE HUMAN RESOURCE STRATEGIES AT THE CENTRAL AND STATE LEVEL
■ SETTING UP OF VARIOUS INSTITUTES/CENTRES OF EXCELLENCE FOR URBAN MANAGEMENT, WITH AT LEAST 1 TO 2 THAT HAVE INVESTMENT AND INVOLVEMENT OF THE PRIVATE SECTOR
■ ACCELERATION OF THE MISSION MODE PROJECT FOR IMPLEMENTATION OF E-GOVERNANCE INITIATIVES
• THE TOTAL OUTLAY SUGGESTED FOR THIS SCHEME IS RS. 18,000 CRORES WITH RS. 5,000 CRORES EARMARKED FOR CAPACITY BUILDING INITIATIVES IN URBAN TRANSPORT SECTOR.
E.
F. CENTRALLY SPONSORED SCHEMES 1) NATIONAL URBAN LIVELIHOOD MISSION HAVING TWO
ADDITIONAL COMPONENTS: • SCHEME FOR SUPPORT TO STREET VENDORS
15
• SCHEME FOR ASSISTANCE TO THE STATES FOR PROVISION OF SHELTERS.
■ THE EXISTING SJSRY SCHEME IS PROPOSED TO BE RE-LAUNCHED AS NULM WITH THE FOLLOWING GUIDING PRINCIPLES: – BUILD SKILLS THAT ARE RELEVANT TO SECTORS WITH
GROWING EMPLOYMENT OPPORTUNITIES AS WELL AS TO LOCAL SOCIO-ECONOMIC CONDITIONS
– COLLABORATE WITH PUBLIC AND PRIVATE VOCATIONAL TRAINING INSTITUTIONS TO SKILL THE URBAN POOR
– ADDRESS THE ISSUES OF FINANCIAL, POLICY AND LEGAL EXCLUSION
– FACILITATE SYSTEMATIC ACCESS TO RAW MATERIALS AND MARKETS
– IDENTIFY AND LEVERAGE SYNERGIES WITH WORK BEING DONE BY NATIONAL SKILLS DEVELOPMENT CORPORATION (NSDC) IN THIS AREA
– CREATE NEW FINANCIAL PRODUCTS AND SERVICES TO CATER TO THE NEEDS OF SELF – EMPLOYED AND MICRO–ENTERPRISE CONSTITUENCIES
G. 2) NATIONAL MISSION ON SUSTAINABLE HABITAT 3) SCHEME FOR MECHANICAL CLEANING OF SEPTIC TANKS
ETC.
16
1 Urbanisation and Economic Growth The launch of the Jawaharlal Nehru National Urban Renewal Mission in 2005 signalled the growing importance of urban areas and the urgent need for urban reforms and renewal. Cities have been at the heart of India’s economic success – urban India accounted for 62 to 63 percent of the country’s GDP in 2009–10 as per Mid Term Appraisal of the 11th plan. Based on developmental experiences around the world, it is evident that cities will only matter more in the future as they steer growth. According to estimates by the High Powered Expert Committee on Urban Infrastructure and Services, the contribution of urban areas is expected to rise to 75 percent of GDP in 2030.
It is well known that agglomeration and densification of economic activities (and habitations) in urban conglomerations stimulates economic efficiencies and provides more opportunities for earning livelihoods. Possibilities for entrepreneurship and employment increase when urban concentration takes place, in contrast to the dispersed and less diverse economic possibilities in rural areas. This enables faster inclusion of more people in the growth process and is therefore more inclusive. There is no doubt that the condition of the poor in rural India must continue to get major attention but the urban sector development should not be viewed as negating such attention or weakening it in any way. On the contrary, we must acknowledge that there is a synergistic relationship between rural prosperity and the continuum of urban development from small towns through larger cities to metros. A holistic approach to spatial development is needed if the country wishes to achieve more inclusive growth.
To effectively manage and benefit from this unstoppable and irreversible phenomenon India needs to increasingly invest in its cities. The immediate priorities are to strengthen the governance systems, make cost- saving innovations both in terms of materials and processes, build capacity and capability across all tiers of government, systematically plan the growth and shape of its cities. This is essential, as citizens with rising disposable income would increasingly demand and deserve a decent quality of life and it will also make the Indian cities more competitive and inclusive. Acting on all of these fronts is imperative if India aspires to fully unleash the potential of its demographic dividend and accelerate industralisation.
1.1 India is set to Urbanise at an Accelerated Pace Census data shows that India’s urban population has grown from 290 million in 2001 to 377 million in 2011, which accounts for over 30 percent of the country’s population. The number of urban cities and
17
towns has also increased from 5,161 in 2001 to 7,935 in 2011. The number of 1 million plus cities has grown from 35 in 2001 to 53 in 2011.
Report of the High Power Executive Committee (2011) estimated that by 2031, India will have more than 87 metropolitan areas and the country’s urban population is likely to soar to over 600 million, adding about 225 million people to present urban population. This pace and scale of urbanisation is unprecedented for India and will be the fastest in the world outside of China.
The population growth of urban India is mainly organic, together with reclassification of rural areas and expansion of city boundaries. According to the High Powered Expert Committee 2011, direct migration to urban areas accounts for 20 to 25 percent of the increase in urban population (Appendix 1).
CLASSIFICATION OF AREAS AS URBAN
DEFINITION OF AN “URBAN” AREA IS A WIDELY DEBATED ISSUE ACROSS THE WORLD WITH MULTIPLE DEFINITIONS BEING USED BY DIFFERENT COUNTRIES. AS PER THE CENSUS DEFINITION, FOR AN AREA TO BE CLASSIFIED AS URBAN IN INDIA, IT SHOULD HAVE:
■ MINIMUM POPULATION OF 5,000 ■ AT LEAST 75 PERCENT OF MALE POPULATION ENGAGED IN
NON-AGRICULTURAL SECTORS ■ MINIMUM POPULATION DENSITY OF 400 PER SQUARE
KILOMETER
HOWEVER, STATE GOVERNMENTS HAVE THE FLEXIBILITY TO DECLARE A PARTICULAR AREA AS AN URBAN TERRITORY FOR ADMINISTRATIVE PURPOSES. GIVEN THE FACT THAT TRADITIONALLY, THE CENTRAL GOVERNMENT HAS INVESTED MORE IN RURAL AREAS THAN IN URBAN AREAS, MANY AREAS SHY AWAY FROM DECLARING THEMSELVES AS “URBAN” DESPITE MEETING ALL THE DEFINED CONDITIONS. THIS IS EVIDENT FROM THE FACT THAT THE NUMBER OF CENSUS TOWNS IN INDIA HAVE INCREASED FROM 1,362 IN 2001 TO 3,894 IN 2011. BUT THE NUMBER OF STATUTORY TOWNS HAS NOT INCREASED DRAMATICALLY DURING THIS TIME. IN 2001 THERE WERE 3799 STATUTORY1 TOWNS AND IN 2011 THERE ARE 4041
1 Towns with municipality, corporation, cantonment board, notified town area committee etc
18

SUCH TOWNS. THIS SUGGESTS THAT SEVERAL AREAS CONTINUE TO OPERATE WITHOUT AN URBAN LOCAL BODY, NOTIFIED TOWN AREA COMMITTEE ET AL
IT IS RECOMMENDED THAT CENSUS TOWNS ARE INCENTIVISED TO BECOME STATUTORY TOWNS TO ENABLE PLANNED URBANISATION.
1.2 Cities are the Engines of Inclusive Growth Urbanization is an inevitable part of a nation’s economic development. The relationship between GDP growth and urbanisation exists because high population density provides scale benefits that boost productivity, which in turn enhances growth–a virtuous cycle. States with the fastest growth rates have had the highest urbanisation rates. The closeness of firms, individuals and institutions gives rise to agglomeration economies that play an important role in lowering the costs to the firms. The High Powered Executive Committee (HPEC) report also emphatically points to the statistically significant relationship between higher urbanization levels and higher per capita income (Appendix 2).
The jobs in urban India, particularly in manufacturing and service sectors, are estimated to be twice as productive as those in rural India (Appendix 3). Cities will act as engines of growth and it is estimated by HPEC 2011 that the share of urban GDP will increase to 70-75 percent in 2030 (Appendix 4).
1.3 Urban Growth has Positive Linkages with Rural Growth India is poised to take advantage of growth synergy that exists between urban and rural areas. As urbanization takes place the demand for non–cereal category of food i.e. vegetables, lentils, milk, eggs, etc., grows because of the increase in the per capita income and the expenditure. This will lead to investment in infrastructure, logistic, processing, packaging and organized retailing.
Cities already account for the bulk of India’s tax revenue. In the future, the contribution of cities to taxes will further increase as their contribution to GDP increases. So the economic well being of India is largely dependent on its cities and therefore it is important to enable sufficient spending on the development of the entire economy – rural and urban.
19

2 Present State of Urban India India is on track to witness an unprecedented pace and scale of urbanisation. However, even at the current pace and scale, India is struggling. The delivery of urban infrastructure and basic services is insufficient to provide citizens with a decent quality of life. Urban India is underserved by utilities, suffers from inadequate housing stock, and is highly congested and polluted. As discussed earlier, addition of over 225 million people to urban India over the next 20 years will put enormous stress on the urban system if not managed well. Left unattended, the risk from the ongoing deterioration in the quality of life in urban India will compromise productivity, deter investors’ and eventually curtail economic growth.
2.1 Higher Incidence of Urban Poverty NSSO Report No. 508 (2004-05) estimated that the number of urban poor had increased by 35 percent from 1973 to 2004. Approximately 81 million i.e. 26 percent of the estimated 310 million urban dwellers were below the monthly consumption of Rs. 539 in 2004–05 (Appendix 5). In addition, 40–45 million people were living on the borders of this level of consumption2.
In 2004–05 approximately 80 percent of the urban poor were either self–employed or casually employed. Typically, a high degree of uncertainty clouds such livelihood means, and often results in highly variable income inflows. This constraints the access of the urban poor to any form of institutional and market finance.
2.2 Poor State of Basic Service Delivery Across all major quality of life indicators, India’s cities fall well short of not only the levels of service to which international cities aspire but also even basic standard of living. This is demonstrated through a systematic benchmarking effort conducted by the authors of the HPEC Report 2011.
Affordable Housing3: Housing is a basic service around which all others revolve. However, India lags significantly on this front.
■ HPEC 2011 estimated that approximately 24 percent of India’s urban population resides in slums. The proportion of slum dwellers
2 Based on report of the sub-group on Urban Poverty 3 Globally, housing is considered affordable if a minimum amount of personal space and basic
amenities is accessible at 20 to 40 percent of gross monthly household income for either rent or mortgage. Historically, the Indian government has defined basic housing units as between 250 and 275 square feet i.e. an average of 50 to 60 square feet per capita
20
in large metropolitan areas is higher. For example, according to Census 2011, 66 percent of the population in Mumbai Metropolitan Region (MMR) lives in slums.
■ Not all slum dwellers are poor but the extreme scarcity of housing for low income groups has led to them living in slums.
■ Many slum dwellers do not have access to basic sanitation facilities and potable water.
Water supply: Inadequate coverage, intermittent supply, low pressure and poor quality are some of the key features of water supply in the urban India.
■ Only 64 percent of urban population is covered by individual connections and./or standposts in India compared with 91 percent in China, 86 percent in South Africa and 80 percent in Brazil
■ Duration of water supply is 1 to 6 hours in India as compared to 24 hours in Brazil and China and 22 hours in Vietnam
Sewerage and sanitation: The problem of sanitation is much worse in urban areas than in rural areas due to high population density and congestion. The sewerage network across cities is also very poor.
■ 94 percent of urban cities and towns do not even have a partial sewerage network
■ 18 percent of urban households do not have access to any form of a latrine facility and defecate in the open
■ Only 21 percent of the waste water generated is treated compare with 57 percent in South Africa
Solid waste management: Infrequent collection, limited segregation and partial processing are some of the characteristics of the solid waste management system, even though the quantum of waste generated is significantly lower compared to other countries.
■ Only 50 percent waste collection coverage in smaller cities compared with benchmark of 100 percent
■ Less than 30 percent solid waste is segregated Urban roads and transport: Highly inadequate and poor quality of urban roads and transport system lead to significant lags in productivity.
■ Public transport in India accounts for only 22 percent of the modal share compared with 49 percent in Philippines, Venezuela and Egypt.
■ The share of buses has decreased from 11 percent of total registered vehicles in 1951 to 1.1 percent in 2001
21

■ Only 20 percent roads have storm water drains compared to the benchmark of 100 percent
Environment: Indian cities struggle with poor quality of air (Appendix 6) and few parks and open spaces.
■ Nearly half of the cities have critical levels of PM10 particles ■ NO2 levels are increasing in the Indian cities and have already
exceeded the standard limits in many locations Rapid urbanisation has resulted in very poor quality of life in its cities but worse is ahead if India continues with current unplanned approach. As McKinsey Global Institute Report 2010 highlighted the quality of life will deteriorate sharply putting the current rate of economic growth at risk (Appendix 7). Thus it is important to realise that urbanisation is not an option but a necessity which is crucial for growth.
2.3 Overview of Existing Urban Development Schemes In the Eleventh Plan, the Government of India stepped up its focus on the urban development. This has resulted in several centrally sponsored schemes aimed at urban renewal. Some of the key initiatives in this area are:
■ Jawaharlal Nehru National Urban Renewal Mission (JNNURM): As the central government’s flagship scheme, JNNURM, focused on delivery of urban infrastructure and basic services to the urban poor. To maintain focus more than 70 percent of the central budgetary resources were allocated across all 65 Mission cities which included megacities, state capitals and cities of historical and tourism interest. Small and medium towns were also covered, though on a smaller scale. The scheme had the following four components: – Urban Infrastructure and Governance (UIG): To provide for
urban infrastructure projects relating to water supply, sewerage, SWM, roads etc in 65 mission cities
– Basic services to the Urban Poor (BSUP): To provide social housing and slum development projects in 65 mission cities
– Urban Infrastructure and Development Scheme for Small and Medium Towns (UIDSSMT): To provide urban infrastructure projects in small and medium towns
– Integrated Housing and Slum Development Programme (IHSDP): To provide social housing and slum development in non-mission cities & towns
A dominant guiding principle of the scheme was to incentivise key urban reforms by states and ULBs across governance, accounting, adoption
22
of technology, property tax reform, user charge rationalization etc. in accordance with the spirit of 74th Constitutional Amendment Act. The rationale for pushing for reforms was to decentralise decision making, institutional and financial strengthening of city level governments, appropriate pricing of the urban infrastructural services, addressing the issue of distortion in urban land and property market, professionalization of urban planning and focussed approach towards providing basic services to urban poor. It was felt that reform in these areas would make the city government smart, self sufficient and would enable them to leverage their funds to attract private capital in providing urban infrastructure and civic amenities.
The Mid Term Appraisal of the 11th plan noted that JNNURM has been effective in renewing focus on the urban areas. Much of the investment has flowed into provision of basic services like water supply, sewerage and drainage, which are essential to inclusiveness. Also the program allowed ULBs to raise their aspirations by taking on projects at a much higher scale. Many states have experimented with new programmes to generate investment resources and build new capabilities at the state level (e.g. appointment of city managers in Bihar, creation of new planning systems in Gujarat etc).
However, the success of the scheme was not replicated across all the states. The Mid Term Appraisal also highlighted delay in implementation of the projects and over all poor financial progress under the scheme. Key factors for this were the unwillingness to adopt the conditionality based reforms and the lack of sufficient capacity and capability at state and ULB level to develop and execute projects.
In addition to this, it was also felt that the mission needed to do more on:
– Pushing states and ULBs to diversify their sources of funds by increasing inflows from user charges, monetization of urban land and property tax collections
– Accelerating the pace and depth of reforms related to the constitution and empowerment of MPC/DPCs, implementation of e-governance systems, improving the levy and collection efficiency of property taxes, and rationalisations of user charges.
– Facilitating effective utilisation of capacity building funds as states indicated difficulties in accessing these leading to low uptake against allocation
– Monitoring projects sanctioned under JNNURM to ensure timely physical implementation. Typically, ULBs face challenges in getting mandatory clearances, procuring contractor capacity, managing input costs and achieving financial closure leading to significant delays
23

– Ensuring a shift from ‘project–based strategies and implementation’ to holistic urban planning and renewal taking an integrated view of city’s development
■ Urban Transport: The National Urban Transport Policy (NUTP) sought to promote integrated land use and transport planning. It also offered assistance from the central government for investments in public transport infrastructure and encouraged capacity building at the institutional and individual level. In addition to this policy, central government also enhanced its financial support for preparation of Detailed Project Reports (DPRs) for urban transport projects from 40 to 80 percent as per Mid Term Appraisal of 11th plan. The scheme covered a wide gamut of urban transport matters including integrated land use and mobility plans, Intelligent Transport System (ITS) and public transport linked awareness campaigns. Under the 11tth plan, multiple Metro Rail projects have been sanctioned across Bengaluru, Chennai, Hyderabad, Mumbai, Kolkata and Delhi in accordance with the recommendation of NUTP for encouraging public transport. In Delhi, phase-II has been completed and phase-III has been sanctioned. In the NCR region, the urban mobility has received a big boost due to extension of metro network to Gurgaon, NOIDA and Ghaziabad. The extension of Delhi metro to Faridabad is also under implementation. A major achievement has been awarding of Hyderabad and Mumbai metro line project on PPP mode indicating the suitability of the sector in attracting private capital.
Another major achievement in the 11th five year plan has been funding for the first time by the central govt for Modern ITS enabled city buses which has completely transformed the urban transport scene beyond transforming the industry as well.
The Bus Rapid Transport project implemented in Ahmedabad has showcased a very cost effective mode of BRTS system which can be taken up in all million plus cities.
■ Rajiv Awas Yojana (RAY): As discussed earlier, BSUP and IHSDP components of JNNURM were aimed at facilitating housing and slum development projects across all cities and towns. Building upon these initiatives, in 2009, the Honourable President announced the Rajiv Awas Yojana (RAY), to take a holistic view of providing housing for the poor. The guiding principles of the scheme, which has been launched in June 2011 after a series of extensive consultation with stakeholders includes ‘Whole City All Slum Approach’ providing of property rights to the slum dwellers and ‘in-situ’ rehabilitation of slums to retain the livelihood
24

opportunity. Currently, the Phase-I of the scheme is under implementation with a total allocation of Rs. 5,000 crores for the first two years. The current scheme is in the nature of pilot project and based on its learning, a comprehensive phase-II of the scheme would be launched under the 12th plan.
■ Swarna Jayanti Shahari Rozgar Yojana (SJSRY): SJSRY, housed under the MoHUPA with a total outlay of Rs. 1750 crore under 11th plan period, encourages urban self–employment through the provision of subsidies and loans for skill development in partnership with state governments. While the uptake of funds has been good, identification of BPL families as well as absorption of the beneficiaries in formal sector is an issue.
■ National Mission Mode project for E-Governance in municipalities: This project aimed at providing single window services to citizens through web based platforms, to increase the efficiency and accountability of ULBs to their citizens. The project was approved to be implemented as a part of JNNURM for 65 Mission cities. However, in absence of a national architecture of the web based platform, the states have been following their own course posing difficulties for national level integration at a future date. Besides this, there are significant variations in progress achieved among different states.
While these initiatives have renewed focus on the urban sector, they have also highlighted several critical issues that impede planned urbanisation. These issues span across specific areas – capacity, governance, planning, funding, and sectors – affordable housing, public transport, sustainable enterprise, water and sanitation.
25

3 Vision for Indian Cities
3.1 Key Constituents of India’s Urban Future
Given the increasing importance of India’s cities, it is critical for the nation to promote and facilitate the development of inclusive and sustainable cities. These cities will not only become the engines of the country’s economic growth, but they will also be home to about 600 million population by 2031. India must dramatically step up its performance on delivering basic urban services, bolster its governance systems, planning and funding policies, institutions, and capacity and capability.
EXHIBIT 2
Key constituents of India’s urban future
Planned, inclusive and sustainable urban development
To meet the challenges of planned, inclusive and sustainable growth, Indian cities must ensure seamless delivery of five basic services to citizens over the next 10 to 15 years. These include:
■ Affordable housing, ■ Sustainable livelihood and enterprise, ■ Universal access to water and sanitation, ■ Quality and affordable public transport and
Des
ired
outc
omes
Nec
essa
ry e
nabl
ers
Build capacity across all levels
Promote innovation in urban management10
Strengthen local governance systems
Integrate planning organisations and processes
Build capacity across all levels
Financially empower ULBs
1 2 3 4 5
Affordable housing
Sustainable livelihood
and enterprise
Universal access to water and sanitation
Quality and
affordable public
transport
Clean and healthy environ-
ment
6
7
8
9
26

■ Clean and healthy environment. Given the increasing pressure on cities, delivering these services will be no easy task. It will require undertaking bold reforms and administrative actions across four fronts, with innovation cutting across all of them:
■ Governance ■ Urban planning ■ Funding ■ Capacity Building
3.2 Goals and Vision for the 12th FYP As discussed earlier, India significantly lags on provisioning basic services. To achieve its vision of inclusive and sustainable cities, the central and state governments need to act quickly and decisively. The rest of this section expands on the end-state vision and goals for 12th Five–Year Plan.
2. Affordable Housing: 24 percent of India’s urban population lives in slums. Contrary to this, India must aspire to have slum free cities where even the weaker sections of the society have access to basic quality housing at affordable prices.
3. Sustainable livelihood and enterprise: Many urban citizens face high economic vulnerability due to the high share of informal employment leading to highly variable income. Going forward, it is critical to address this issue and create sustainable opportunities for livelihood and reduce the share of urban poor to less than 10 percent of total urban population
4. Universal access to water and sanitation: Basic facilities like water and sanitation form the bedrock of basic living conditions. Without these, the quality of life deteriorates significantly with increased incidence of health issues. India must strive to provide 100 percent access to potable water and sanitation to all the urban citizens with particular focus on processing and recycling.
5. Quality and affordable public transport: In the last few years, the modal share of private transport has increased notably while that of public transport has declined. This has not only led to congestion in urban roads but has also adversely impacted the environment. India should seek to increase its share of public transport to 60 to 70 percent of the modal mix. Equally important is the need to create far more open spaces to augment the use of non-motorized transport forms. Over the next 5 years, India must go–all–out to: ■ Increase the modal share of public transport to about 60 percent
of motorized trips & 35 percent of total trips including walk
27

■ Increase the modal share of cycling by approximately 5 percent
METRO – A TRANSFORMATIONAL APPROACH TO PUBLIC TRANSPORT
HIGH CAPACITY METRO RAILS ARE ALREADY IN USE IN INDIA AND ARE PROVING TO BE SUCCESSFUL IN ADDRESSING THE ISSUES OF PUBLIC TRANSPORT. HOWEVER, IT IS A HIGHLY CAPITAL INTENSIVE MODE OF TRANSPORT AND HENCE SHOULD BE FIRST DEPLOYED IN LARGE METROPOLITAN AREAS.
WHEN TO DEPLOY A METRO BASED SYSTEM?
GIVEN THE HIGH CAPITAL COSTS, HIGH RIDERSHIP IS A MUST FOR A METRO SYSTEM TO BECOME ECONOMICALLY VIABLE. THOUGH SUCH RIDERSHIP IS A MULTI- DETERMINANT VARIANT, INCLUDING POPULATION, PER CAPITA DISPOSABLE INCOME, DENSIFICATION IN CITY, AVAILABILITY AND OPPORTUNITY COST OF LAND, MORPHOLOGY OF THE CITY AND IMPORTANTLY, ASPIRATION OF PEOPLE REVEALED THROUGH POLITICAL DEMAND, METRO RAIL PROJECT IS RECOMMENDED IN CITIES WHICH ORDINARILY HAVE:
■ PEAK HOUR PEAK DIRECTION TRAFFIC (PHPDT) OF MORE THAN 15,000 FOR AT LEAST 5 KMS OF CONTINUOUS LENGTH BY 2021
■ TOTAL POPULATION OF MORE THAN 2 MILLION AS PER 2011 CENSUS
■ AVERAGE TRIP LENGTH OF MORE THAN 7-8 KMS FOR MOTORIZED TRIPS
■ AT LEAST 1 MILLION RIDERSHIP PER DAY ON ORGANIZED PUBLIC TRANSPORT
THESE CRITERIA ARE IN THE NATURE OF GUIDELINES AND ARE NOT TO BE CONSTRUED AS ENTITLEMENT FOR A METRO PROJECT. AS HUGE PUBLIC MONEY IS INVOLVED IN CONSTRUCTION OF THESE PROJECTS, A THOROUGH COST- BENEFIT ANALYSIS TO CHOOSE AN OPTIMUM MODE OF TRANSPORT TO ENSURE VALUE-FOR-MONEY AND AVAILABILITY OF FUND IS TO BE ENSURED IN CASE OF EVERY PROJECT.
FUNDING THE INVESTMENTS FOR METRO SYSTEMS
GLOBAL EXPERIENCES SUGGEST THAT METRO RAIL TRANSIT HAVE BEEN LARGELY DEVELOPED IN PUBLIC SECTOR (AN
28

ANALYSIS OF 132 CITIES WORLDWIDE SHOWS THAT 113 CITIES (~88 PERCENT) HAVE METROS WHICH ARE DEVELOPED AND OPERATED IN PUBLIC SECTOR MODE). AS MRTS ALIGNMENT USUALLY RESULT IN A SIGNIFICANT RISE IN VALUE OF THE REAL ESTATE ALONG ITS ZONE OF INFLUENCE, GOVERNMENT ENTITIES PROMOTING METRO RAIL HAVE USED THIS RESOURCE TO FUND OTHER URBAN INFRASTRUCTURE. THE EFFICIENCY GAINS THROUGH PPP HAVE BEEN BROUGHT IN AT O&M STAGE. HOWEVER, GIVEN THE HUGE REQUIREMENT OF CAPITAL AND WILLINGNESS AS WELL AS CAPABILITY OF THE PRIVATE CAPITAL TO UNDERTAKE SUCH PROJECTS, IN HIGH DENSITY CORRIDORS, PROJECTS WHICH ARE VIABLE ON THEIR OWN (WITH ADMISSIBLE VIABILITY GAP FUNDING) MAY BE ENCOURAGED UNDER PPP MODE. HOWEVER, PROJECTS WHICH ARE FINANCIALLY NOT VIABLE WITHOUT PROVIDING ADDITIONAL REAL-ESTATE DEVELOPMENT RIGHTS ETC., SHOULD PRIMARILY BE FUNDED BY GOVERNMENT. THE CENTRAL GOVERNMENT MAY SUITABLY CONTRIBUTE IN FUNDING SUCH PROJECTS PREFERABLY THROUGH GRANT. APPROPRIATE ARRANGEMENTS HOWEVER NEED TO BE PLACED FOR DENSIFICATION ACROSS SUCH CORRIDORS AND USE OF THE ENHANCED VALUE OF THE REAL ESTATE FOR FUNDING OTHER INFRASTRUCTURE PROJECTS (APPENDIX 8).
WHEREVER PROJECTS ARE TO BE DEVELOPED UNDER PUBLIC SECTOR, APART FROM EQUITY FUNDING, LONG TENURED DEBT FINANCING SHOULD BE FACILITATED THROUGH GOVERNMENT GUARANTEE AND INTEREST SUBSIDIES TO THE SPV.
6. Clean and healthy environment: Clean environment is another key factor that affects the quality of life in Indian cities. Our vision is to create green cities with energy efficient buildings and controlled levels of air pollution with real time monitoring to aid public health. The 12th FYP should ensure: ■ 75 percent of all new commercial buildings during 2012–17
comply with Energy Conservation Building Code (ECBC) ■ 20 percent of the existing commercial building stock should
become energy efficient ■ Additional 10 million square meters of built up area in
commercial and residential sector should receive a Green Rating for Integrated Habitat Assessment (GRIHA) All household appliances in use should meet standards set by the Bureau of Energy Efficiency
29

7. Governance: We must strengthen governance at the city level to increase administrative efficiency, effectiveness, responsiveness, citizen friendliness, transparency and accountability.
8. Urban Planning: India must swiftly move towards an integrated planning approach based on the smart growth principles. The planning process should integrate both top–down and bottom–up plans developed through participatory structures and processes. Involvement of people in the planning process has the obvious advantage of ensuring the ownership of the developmental effort on one hand and ensuring the optimal use of scarce resources.
9. Capacity Building: The 12th Five–Year Plan should expressly endeavour to build capacity and capability across all levels of government to successfully tackle the managerial and policy challenges stemming from this scorching pace of urbanisation. We should work towards skilling city administration resources in key areas of modern day urban management like planning, stakeholder management, working with private sector, project development and management etc.
10. Funding: In the past, ULBs have predominantly depended on central and state government transfers and grants. Going forward, they need to cultivate new and sustainable own revenue streams to help finance the urban infrastructure investments. We envisage financially stable and vibrant local administrations that can also access market funds on the back of their own financial strength.
11. Innovation, research and development: As discussed earlier, the trend of urbanisation will place huge capital investment requirements on the country. Hence, it is critical to promote innovation, research and development in low cost technologies tailored to Indian context. To facilitate this, a strong network of research and innovation institutes focusing on urban issues and technologies needs to be created. In high priority areas, funding by Central Govt may be provided for developmental orders with Govt of India taking all the risk of development of low cost indigenous technologies.
30
4 Strategies for the 12th Five Year Plan For India to achieve its vision of inclusive and sustainable urban development, concerted efforts on all the five enablers are essential. In this section, we present the policies, institutions and schemes recommended to strengthen these enablers, with particular emphasis on governance, urban planning, funding and capacity building. In addition to this, specific actions are also required to address issues in delivery of essential urban services such as affordable housing, sustainable livelihoods, water and sanitation, transport and a healthy environment.
4.1 Governance
4.1.1 Challenges in Urban Governance: India’s urban governance system is challenged by deficits across five fronts that in turn have led to weak governance. These include:
4.1.1.1 Absence of a robust legal and institutional framework: Several areas in the realm of governance are affected by the lack of an appropriate legal and institutional framework. Notwithstanding 74 CAA, some of the State laws still do not unequivocally mandate the devolution of functions, functionaries and funds to ULBs. Consequently, there is significant variation in the devolution of power to the third–tier of government by states. Also, the flow of funds from states to ULBs is not fully in sync with the provision of Article 243 W and the Twelfth Schedule. Metropolitan Planning Committees are yet to evolve as per the spirit of the 74th Constitutional Amendment Act. In the current scenario, city mayors lack the powers and tenure to be truly accountable for delivery of urban services. Finally, the absence of measures to enforce accountability for councillors and local office bearers has further weakened urban governance.
Turning to the organisation of ULBs, in most states either the respective state agencies or para-statals are in–charge of urban service delivery instead of ULBs. This maze-like structure is the result of historically weak technical capabilities and staffing of ULBs. To further accentuate matters, ULBs are not empowered to coordinate and control the role and functions of these para-statals and other agencies, often leading to a multiplicity of agencies and duplication of resources. Finally, the non–standardisation of norms for classifying ULBs leads to a severe disconnect between the city’s development plan and actual development on the ground in states.
31

In the context of public private partnerships, model legislations for urban PPP projects that identify executable projects and address related issues need to be strengthened.
4.1.1.2 Inadequate capacity and capability: Insufficient capacity and capability lies at the heart of India’s urban challenges. At the outset, there is a pressing need to sensitise and educate elected local representatives, i.e., Councillors regarding relevant laws, and their roles and responsibilities related to various Government policies and programmes. At the administrative level, poor capacity and capability is evident through the absence of a professional and sensitive municipal cadre that impedes planning, and service delivery. Most ULBs across the country do not have the required expertise to develop public private partnerships, manage projects and their finances. Consequently, their ability to implement reforms and projects is constrained. Training materials in use are outdated and the delivery of web–based training programmes is conspicuous by its absence.
4.1.1.3 Weak financial framework: The 74th Constitutional Amendment introduced two features to strengthen municipal finances, namely, the setting up of State Finance Commissions (SFC) every five years to bring certainty, clarity and consolidation in transfers to ULBs and the inclusion of measures to augment the State Consolidated Fund to supplement ULB resources as per the Central Finance Commission. In several states the recommendations made by SFCs have not been implemented. Further, the flow of finances to local bodies is not predictable, regular and does not follow clear devolution concomitant with their responsibilities. Apart from poor maintenance of data, the effective functioning of State Finance Commissions is hindered by the absence of financial and technical expertise.
4.1.1.4 Limited use of technology: So far, the use of information technology and the penetration of essential e–governance systems in ULBs is low and largely sporadic. Most of the initiatives undertaken do not necessarily converge with existing state level initiatives in e-governance.
4.1.1.5 Unclear participatory processes: Public participation in urban governance is insufficient. For example, the roles of ward committees and area sabhas are not clearly outlined and there is a wide variation in the functioning of ward committees across states. In Kerala, for example, the tasked to be performed by Ward Committees are outlined in the rules whereas in
32

Maharashtra, these committees function as zonal committees for which some specific functions have been assigned. Further in some cases, states have also clubbed several wards together to form a single ward committee. There are not enough fora at which local government officials and civil society collectively review service delivery, ongoing projects and prioritise future development plans. This issue is further compounded by inadequate public disclosure of information e.g. provision of services against benchmarks, audited quarterly financial statements, concessions and licenses.
4.1.2 Strengthening Urban Governance: Governance is a critical issue that must be adequately addressed during the 12th Five–Year Plan period. This is essential to meet the growing expectations of the citizens and to cope with rapid and unprecedented levels of urbanisation. Presently, there is a governance deficit of varying degrees across the ULBs. It is imperative to strengthen the urban governance systems for which a series of policy changes and institutional measures are essential.
KEY RECOMMENDATIONS ON GOVERNANCE
■ VEST EXECUTIVE MUNICIPAL AUTHORITY TO MAYOR AND EXTEND THE TERM TO 5 YEARS
■ SET UP A MUNICIPAL SERVICES REGULATOR ■ INTRODUCTION OF CITIZEN CHARTERS ■ CORPORATISATION OF SERVICE DELIVERY ■ CLARIFY ROLES OF ULBS AND PARASTATALS ■ SET UP LOK-AYUKTAS/OMBUDSMAN ■ MERGE MOUD AND MOHUPA INTO ONE MINISTRY
4.1.2.1 Policy/legislative changes required
4.1.2.1.1 Vest executive municipal authority to Mayor and extend the term to 5 years: There should be a convergence of various citizen centric functions under the Mayor for every city. The local conditions should determine whether the cities should adopt a Mayor–in–Council or an Executive Mayor system. In either case, the Mayor’s term should be extended to five–years and the Mayor should be
33
considered as the executive head of the city, establishing single point accountability. Also Mayor should be vested with appropriate powers (e.g. head of MPC) to make change happen
4.1.2.1.2 Introduce Citizen Charters: As per the 74th Amendment to the Constitution and the recommendations therein, a lot of responsibility is placed on the shoulders of the municipalities. As a result the MPC should ensure that every municipality in the metropolitan area produces a citizen’s charters within six months. Such a charter should contain comprehensive information on service levels for all urban services, including specification of time limits for approvals relating to regulatory services such as licenses and permits. The charter should also specify the relief available to the citizens in case of non-adherence as prescribed in the report of the 2nd Administrative Reforms Commission. The service level benchmarks for e-governance adopted by the Ministry of Urban development can also be taken as guidance in this regard.
4.1.2.1.3 Corporatise service delivery in selected areas: In large metropolitan areas and cities, the corporatisation of service delivery should be considered. For example, BEST is headed by a general manager, who acts as the CEO and has complete operational autonomy. Also the presence of BEST committee allows quick decision making. The elected municipal bodies may procure services after entering into a MoU with such bodies.The agencies could be a part of the government as they are carved out of government departments. The corporatisation of appropriate functions could vary based on local conditions. Finally, within such agencies, select functions could be opened up for private sector participation.
4.1.2.1.4 Merge MOUD and MHUPA into one ministry: Following the Mid–Term Appraisal of JNNURM, one option to unify efforts at the central level is to combine the Ministries of Urban Development and the Ministry of Housing and Urban Poverty Alleviation to create a single, unified ministry for managing the urban affairs. Urban development, housing and poverty alleviation are inter–related subjects that need to be treated through a unified approach. This view was expressed by stakeholders at all levels during the Planning Commission’s appraisal process.
34

4.1.2.1.5 Adhere to service level benchmarks through use of IT: ULBs should be empowered so that they can flexibly choose from a number of alternatives on how the service is to be provided. Whatever the chosen institutional form for service delivery, Information Technology (IT) can play an important role in improving governance. With municipal administration becoming increasingly complex, the benefits of IT adoption are becoming more and more visible across several municipalities. For example, cities in Andhra Pradesh provide a number of basic services online including tap connection status, status of garbage pick-ups, sanitation tenders, and building plan status. Consequently, the use of IT tools and e–governance should be strengthened and adopted in all ULBs and for this, whatever skill up gradation is required, should be done. Implementation of the proposed Mission Mode Project on E-Governance, in municipalities, in all class one cities during 12th Plan through SLNAs is strongly recommended. In addition, the adoption and replication of best practices related to IT interventions across ULBs including benchmarks developed by MoUD for this purpose should be actively considered. Provisioning of funds for development of these resources in terms of hardware, software and personnel should be done during the 12th Five Year Plan. Further, the adoption of state–wide solutions following a cluster approach for smaller municipalities for ensuring sustainability and efficiency should be evaluated.
4.1.2.1.6 Strengthen the public disclosure law: Most States have enacted amendments to the Municipal Laws to make public disclosure compulsorily with respect to certain prescribed items. Accordingly, in some ULBs it is now mandatory to disclose information pertaining to subjects like the authorities competent to grant permissions, concessions and licenses, quarterly financial statements, services provided by the ULBs, city development plans et al. However, to make public disclosure law more meaningful and useful, it is necessary to frame rules to eliminate ambiguity about the information, periodicity and the manner in which it has to be disclosed. In addition to this, spatial development plans may also be connected to outcome measurements, e.g. per capita litres of water per day embedded in plans. Priorities for infrastructure, as outlined in the plan, may be linked to expected outcomes and these outcomes may be used as
35

SLBs. This information must be placed on the website of the ULB. Collectively reports across all ULBs must be placed on the MPC/DPC’s website.
4.1.2.1.7 Regular annual audit of ULB accounts: As recommended by the 13th Finance Commission the accounts of ULBs should be audited annually by the Director of Local Fund Account Audit under the technical guidance and supervision of the Accountant General. Separately, a system of social audits for various schemes and development works done by ULBs should be undertaken along the lines of those for the MGNRES.
4.1.2.1.8 Working with the National Mission on Sustainable Habitat: This mission should be given impetus in the 12th Five–Year Plan and be used as the vehicle for promoting environmental sustainability. The Mission should be implemented through appropriate changes in the legal and regulatory framework e.g. development controls and regulations, building byelaws, city development plans, appropriate modal shifts in public transport through city mobility plans and implementation of pilot projects.
4.1.2.1.9 Fiscal responsibility framework at the municipal level: Adoption and monitoring of prudent financial management in the ULBs should be institutionalised through appropriate legislation. Such an act should include: ■ A medium term fiscal plan, to set forth a five year
rolling target for ULB level fiscal indicators and adherence to performance codes/standards
■ Creation of an expenditure stream only against a matching revenue stream
■ Fixation of ceiling on revenue expenditure ■ Ensuring proper procedure for preparation, submission
and audit of accounts and proper scrutiny of audit reports
■ Measures to enforce compliance to the provisions of the Act
4.1.2.2 New institutional measures necessary to facilitate transparent and effective urban governance
4.1.2.2.1 Provide a stable accountability platform to coordinate the activities of para-statals with ULBs: Given the multiplicity of agencies and the duplicity of efforts, it is
36

necessary to create an acceptable and sustainable accountability platform for different agencies to work together. For para-statals to work with the ULBs, one option could be for the para-statals to work as outsourcing agencies wherein the output parameters / deliverables are clearly specified and agreed upon. The delivery of these then can then be monitored through a Memorandum of Understanding (MoU) or Service Level Agreements (SLA). Besides this, there could be a number of variable models between these options and the administrative modalities can be devised by states in accordance with state specific conditions to ascertain the nature of control the ULBs should have with respect to the designated agency.
APPROACH FOR MANAGING MULTIPLICITY OF INSTITUTIONS
A COMMON REFRAIN IN URBAN GOVERNANCE IS THE PROBLEM OF FRAGMENTED AND/OR OVERLAPPING INSTITUTIONAL RESPONSIBILITIES. WHILE URBAN PLANNING AND PROVISION OF MOST MUNICIPAL SERVICES REQUIRES DEEP FUNCTIONAL AND TECHNICAL EXPERTISE, ON THE OTHER HAND, CITIZENRY HAS BEEN INCREASINGLY DEMANDING ACCOUNTABILITY. BALANCING THESE OBJECTIVES HAS EMERGED AS A KEY CHALLENGE IN RECENT TIMES. A STARK EXAMPLE OF THIS IS THE CO-EXISTENCE OF PARASTATAL BODIES (E.G. DEVELOPMENT AUTHORITIES, WATER SUPPLY & SEWERAGE BOARDS, PWD ETC.) ALONG WITH ULBS.
THE ROLES AND RESPONSIBILITIES OF DIFFERENT INSTITUTIONS IN SUCH SITUATIONS SHOULD BE CLARIFIED ALONG FIVE PRINCIPAL DIMENSIONS:
■ UNIQUE PURPOSE: EACH INSTITUTION SHOULD HAVE A CLEARLY DEFINED “UNIQUE” PURPOSE FOR ITSELF AND SHOULD BE INCLUSIVE AND IN LINE WITH PEOPLE’S ASPIRATIONS. TYPICALLY IT SHOULD NOT OVERLAP WITH ANY OTHER INSTITUTION AT THE SAME FEDERAL LEVEL
■ MEASURE OF EFFECTIVENESS: IN LINE WITH THE UNIQUE PURPOSE, RELEVANT MEASURES OF EFFECTIVENESS SHOULD BE PUT IN PLACE. THESE WILL NOT ONLY HELP IN CREATING EXTERNAL ACCOUNTABILITY FOR THE INSTITUTION AS A WHOLE, BUT WILL ALSO PROVIDE GUIDANCE TO THE INDIVIDUAL EMPLOYEES TO DISCHARGE THEIR DUTIES.
37
■ EXCLUSIVE DECISION RIGHTS: THE DECISIONS WHICH THE INSTITUTION IS EMPOWERED TO TAKE AND WHICH OTHERS ARE REQUIRED TO FOLLOW MUST BE SPECIFIED. THESE DECISIONS RIGHTS MUST BE RECONCILED WITH DECISION RIGHTS GRANTED TO OTHER INSTITUTIONS.
■ EXPERTISE & CAPABILITIES: EMPOWERING ANY INSTITUTION WITH CERTAIN DECISION RIGHTS ALONE IS NOT ENOUGH. THE CRITICALLY NECESSARY CAPABILITIES/EXPERTISE REQUIRED BY THE INSTITUTION TO PERFORM ITS FUNCTIONS AND FULFIL ITS PURPOSE MUST BE DEFINED, ALONG WITH PROCESSES FOR ENSURING IT WILL HAVE THESE CAPABILITIES.
■ INTER LINKAGES WITHIN THE ECOSYSTEM: LASTLY, IT IS CRITICAL TO UNDERSTAND THE INTER-LINKAGES WITH OTHER INSTITUTIONS IN A COMPLEX, MULTI-INSTITUTIONAL ENVIRONMENT. A PARTICULAR INSTITUTION MAY HAVE DIFFERENT TYPES OF RELATIONSHIPS WITH OTHER INSTITUTIONS. THESE COULD RANGE FROM BEING A REGULATOR, TO HAVING A CONTRACTUAL ARRANGEMENT OR SERVING AS A TECHNICAL ADVISOR.
4.1.2.2.2 Set up a municipal services regulator: An independent utility regulator should be set up at the state level to advise, regulate, monitor and adjudicate on desired levels and pricing of service delivery, equitable access to all urban citizens and roles and responsibilities of all utility providers. An independent regulatory mechanism has the potential to not only provide comfort to the private investors but also induce efficiency and equity in urban services delivery. The GoI may provide suitable financial assistance to the State Governments for setting up such regulatory bodies.
4.1.2.2.3 Set up Lok–Ayuktas/Ombudsman at state and city levels: It is essential to bring local office bearers, councillors and other office bearers under the purview of an Ombudsman or the Lok–Ayukta. The mandate for this office should be defined by a well structured legislation. This has also been recommended by the 13th Finance Commission and is a key measure for states to be eligible for the Performance Grant with effect from 2011–12. Further the non–officials of ULBs should also be declared as public servants under the provisions of different Laws. The Ombudsman would look into complaints of corruption and maladministration against functionaries of local bodies, both elected members and officials. The Ombudsman
38

would mediate conflicts between citizens and specific authorities. They would also assist in mediation or arbitration conducted by the MPC/DPC or Development Authority to reconcile interagency conflicts or irregularities in plan enforcement.
For the Ombudsman, the term ‘Public Servant’ should be defined appropriately in the respective state legislations. The Ombudsman should have the authority to investigate cases and submit report to competent authorities for taking action. Such competent authorities should normally take action as recommended. In case of disagreement, reasons must be recorded in writing and be placed in the public domain.
The office of the Ombudsman will have to be established in such a manner as to ensure that there will be no conflict with the existing set-up under the Lok-Ayukta Act or Prevention of Corruption Act.
4.1.2.2.4 Set–up Area Sabhas and Ward Committees to decentralise urban governance and ensure people’s participation in planning: At the heart of a decentralised system of governance is the functioning of appropriately empowered Ward Committees, and the constitution of “Area Sabhas”. There should be Ward Committees and Area Sabhas for each of the functions devolved to ULBs. This ensures that executive power is located at the ULB and Ward Committee levels, while participatory and accountability mechanisms are created with the Area Sabhas. The link between the Area Sabha and the Ward Committees is established through the Area Sabha Representatives who are also the members of the Ward Committee. Also the Area Sabhas and Ward Committees should also ensure enforcement of the municipal plan. They should act as the first level of enforcement, closest to the actual incidents of violations. The Ward Committee must be authorised to hold hearings, serve notices, recommend appropriate punitive action against violators of notified plans and steps for reversal of the violation to the municipal corporation/council, or panchayat
4.2 Urban Planning India’s antiquated urban planning systems coupled with the incomplete implementation of the 74th Constitutional Amendment have led to urban
39

chaos and decay in most of the large metropolitan areas in the country. To achieve inclusive and sustainable urban growth there is a pressing need to completely overhaul existing planning systems. India must adopt the Smart Growth principle that concentrates growth in select city centres that are transit–oriented, compact, offer mixed income housing, and focus on public transport including non–motorised transport. Additionally, new cities should be planned on national transport and industrial corridors, use of the twin city concept should be encouraged, and effective measures to integrate peri–urban areas should be devised.
4.2.1 Challenges in Urban Planning: So far, India’s urban planning system has been impeded by the following issues:
4.2.1.1 Lack of integration between spatial and socio–economic planning: Spatial planning in many states in India is carried out by town planning departments or development authorities. These plans lay out, for the entire urban areas, the road network, land use zoning, and development control regulations. However, in many cases, these are exercises in engineering undertaken for regulatory purposes rather than producing a plan with people’s participation which can give expression to the socio economic aspiration of the people. As a parallel process, the state governments undertake planning for many sectors at the state, district, and city level. Most of the sectoral (socio-economic) planning efforts are focused on program and project formulation and have very weak spatial planning components. The most recent additions in the context of urban planning are the plans required under JNNURM and other GOI programs (City Development Plan, Comprehensive Mobility Plan, City Sanitation Plan, etc).
4.2.1.2 Lack of a regional planning approach that integrates peri–urban and rural areas with metropolitan areas in a regional planning framework: The present approach focuses on only the core area of the city, without a proper vision and strategy to integrate the peri-urban and rural areas within a regional framework. As a result, most cities are facing serious issues of haphazard development in the urban periphery, environmental degradation and depletion of natural resources.
4.2.1.3 Lack of linkages between master plans, and financing & operating strategy: Master Plans are not supported by systematic financial and operating strategies that focus on using a city’s assets to raise funds. Consequently, plan implementation has suffered from significant time lags. Contrary
40

to this, planned urban development leads to increases in tax bases, especially those related to land.
4.2.1.4 Unplanned developments such as SEZs and Townships have unforeseen consequences. The lack of a regional planning approach results in major new developments coming up in random locations resulting in unforeseen consequences with respect to infrastructure adequacy, overcrowding of existing urban centres, environment and other considerations. An example of this is the slum and squatter settlements around industrial estates and special economic zones due to absence of planned EWS housing, informal workplaces and vending.
4.2.1.5 Lack of clarity on institutional roles: The existing institutional framework does not clearly define the roles and responsibilities between state governments, parastatals like Water Supply and Sewerage Boards, Urban Development Authorities, District Planning Committees/Metropolitan Planning Committees, and urban and rural local bodies regarding plan preparation, implementation and monitoring.
4.2.1.6 Lack of capacity and enabling tools: A major impediment to effective regional and urban planning system in India is the lack of skilled human resources and enabling tools such as GIS/GIS-enabled Management Information Systems (MIS). The plan process is also often not participatory. The lack of accountability coupled with limited participation from citizens and elected local representatives has also hindered the effectiveness of the planning and implementation processes
4.2.1.7 Social exclusion resulting from non-inclusive master plans and unaffordable, underdeveloped rental markets: Current approaches to planning have resulted in a sharp divide between income groups in terms of access to housing and basic services. Legal and mortgageable ownership of housing has become unaffordable and rental markets are underdeveloped, resulting in large sections of the urban poor living in un-serviced and unsafe housing.
4.2.1.8 Rigid and deterministic planning process: Master plans have aimed to be too detailed and therefore, even after years of plan preparation exercise, zonal plans have not been completed. As a result, the growth of cities has taken the planners by surprise and the livability of cities has degraded with congestion and environmental degradation.
41

4.2.2 Moving Towards Planned Urbanisation: The 12th Five–Year Plan period should lay the foundation of urban planning systems that are in consonance with the 73rd and 74th Constitutional Amendments and reflect the following five elements of the smart growth principle: True and active citizen participation Focus on mixed land use Provision of mixed income housing integrated with transportation, Increased use of public transport including non–motorised
transport, and Integration of peri–urban and rural areas with cities and
metropolitan areas To embed such planning systems, a series of policy changes and institutional arrangements across the central and state governments are essential. But these alone are not sufficient and need to be strengthened with significant financial support required for creation and strengthening of institutions, centres of excellence and support cells to help MPC/DPCs with preparation of Strategic Spatial Development Plans for metropolitan areas, cities and towns. 10 percent of the new and improved JNNURM (NIJNNURM) funds should be earmarked for strategic planning initiatives and related activities.
KEY RECOMMENDATIONS ON URBAN PLANNING
■ INCENTIVISE STRATEGIC DENSIFICATION ■ ESTABLISH A GUARANTEED LAND TITLE ACT ■ FOCUS ON LAND READJUSTMENT ■ FULLY IMPLEMENT THE 74TH CONSTITUTIONAL
AMENDMENT AND CONSTITUTE THE DISTRICT PLANNING COMMITTEES (DPCS) AND METROPOLITAN PLANNING COMMITTEES (MPCS)
■ RESTRUCTURE THE ROLE OF METROPOLITAN DEVELOPMENT AUTHORITIES (MDAS)
■ ESTABLISH STATE PLANNING BOARDS (SPBS) ■ ESTABLISH A UNIFIED METROPOLITAN TRANSPORT
AUTHORITY (UMTA) DULY SUPPORTED BY A TECHNICAL SECRETARIAT COMPRISING OF URBAN TRANSPORT EXPERTS
42

4.2.2.1 A series of reforms, especially by state governments to fully devolve power to the third–tier of government are imperative
Central Government Related
4.2.2.1.1 Introduce a policy to incentivise strategic densification of cities/new towns on growth corridors: Indian cities have the lowest Floor Space Index (FSI) in the world. Strategic densification as a planning strategy should be pursued to accommodate future urbanisation needs. Incentives that encourage states and cities to pursue this strategy for future urban development should be introduced. In addition to this, mandating inclusionary zoning and providing higher FSI to make the economics of affordable housing viable should be considered. To make the cities inclusionary and efficient, it is also imperative to promote a mixed land use pattern with granular FSI, rather than the current practice of using blanket FSI.
4.2.2.1.2 Establish a Guaranteed Land Title Act as per the Ministry of Urban Development’s Framework Law 2011: India urgently requires a robust system to establish and protect land rights. This would reduce the transaction cost for land, facilitate its monetisation while reducing the number of land related litigations. Infrastructure development requires acquisition of land, and without clarity on rights and boundaries, projects become expensive and get delayed. There are two important aspects to land title: first, the formal recognition by the state of property rights through a system of titles; and second, the facilitation by the state, of efficient trade in rights, through a process of registration. Both of these elements exist in India, but in an incomplete form. While Indian law requires compulsory registration of sale of land, the Indian Registration Act of 1908 doesn’t ask the registration authority to verify history of the land or ownership from the seller, thereby putting the buyer at risk. Hence land registration is not registration of title, but a deed of transaction. It is a fiscal instrument for the state, allowing it to collect a “fee”, not providing the statutory support of certainty to title. Neither does the Transfer of Property Act, 1882 require verification of ownership.
43

In addition, Section 18 of the Registration Act does not demand compulsory registration of all land related transactions. State legislation on land acquisition, court decrees, land orders, heir–ship partitions, mortgages, agreements to sell, etc, do not require mandatory registration. The provision related to land in the Indian Contract Act of 1872, does not require contracts to be registered. All of these forces weaken land records and security of tenure. What we have in India today is a presumed ownership to land that is questionable and can be challenged on multiple fronts.
Implementing a system of property title certification is one of the mandatory reforms under the Jawaharlal Nehru National Urban Renewal Mission (JNNURM). States are expected to implement the reform within the Mission period. The Ministry of Urban Development has undertaken a comprehensive exercise under Project PLATINUM (Partnership for Land Title in Urban Management) for implementation of Guaranteed Land Title. The recommendations on moving land management and registration closer to local governments are also consistent with the recommendations of the 2nd Administrative Reforms Committee.
4.2.2.1.3 Land Readjustment: In recent times, acquiring of land for urban expansion and industrial development has been a matter of intense public debate. Given the absence of robust land valuation systems and mechanisms to facilitate land assembly, India may want to consider alternative options in the short to medium term. Strong institutions governing land use conversion, property rights definition and adjudication, land valuation will emerge as land market matures. Till then, land readjustment (LR) is gaining acceptance as an alternative to land acquisition as it has many advantages for land assembly. In essence a participatory tool, LR avoids the public discontent and protests that land acquisition may generate to a great extent. LR involves efforts from public authorities such as the redrawing of boundaries and the associated adjustment of property rights. It is most commonly used to expand urban boundaries on the periphery of cities and could also be used for redevelopment purposes in urban areas as illustrated by the C-Ward example in Mumbai. However, the application of LR is context specific and its success and acceptability is grounded in three main enablers: ■ Well–defined property rights
44

■ Streamlined, independent, and transparent evaluation processes
■ Strong judicial system to address public concerns.
TOWN PLANNING SCHEMES IN GUJARAT HEAVILY BORROW FROM LAND READJUSTMENT IN GERMANY AND ENABLE JOINT DEVELOPMENT BETWEEN LANDOWNERS AND MUNICIPALITIES. HOWEVER, TPSS HAVE NOT BEEN USED AT SCALE OUTSIDE OF GUJARAT DUE TO LACK OF ENABLING LEGISLATIONS IN OTHER STATES.
IN MUMBAI’S C–WARD THE SPIRIT OF LAND READJUSTMENT IS AT WORK. THE CONSTRUCTION OF MULTI-STORY BUILDINGS WOULD FREE UP SPACE THAT WAS USED FOR PUBLIC AMENITIES. TENANTS WOULD BE GIVEN THE SAME SPACE THEY HAD ORIGINALLY AND 10 PERCENT OF THE LAND IS RESERVED FOR INFRASTRUCTURE TO BE DEVELOPED.
State Government Related
4.2.2.1.4 Fully implement the 74th Constitutional Amendment and constitute the District Planning Committees (DPCs) and Metropolitan Planning Committees (MPCs): The State Election Commission (SEC) shall be vested with the authority to conduct the process of constituting the MPC/DPC. The 73rd and 74th Amendments to the Constitution of India mandate that a minimum of 2/3rds of the MPC shall be constituted of elected representatives from the metropolitan region, provided that not less than two-thirds of the members of such Committee shall be elected by, and from amongst, the elected members of the Municipalities and Chairpersons of the Panchayats in the Metropolitan area in proportion to the ratio between the population of the municipalities and of the panchayats in that area. Similarly, a minimum of 4/5ths of the DPC shall be elected by, and from amongst, the elected members of the District Panchayat and of the Municipalities in the district in proportion to the ratio between the population of the rural areas and of the urban areas in the district. The remaining 1/3rd and 1/5th of the MPC and DPC should be kept open
45

for nomination. This will enable experts, who are not elected representatives, to become members of the MPC/DPC. Also, those elected representatives ineligible for selection in the 2/3rd and 4/5ths quota (such as MLAs, MPs, and in the case of the DPC, the elected representatives from the intermediate and village panchayats), can be nominated within this non-elected category. Currently, DPCs are dysfunctional in most States and the nominees are usually the MLAs, who do not attend meetings.
Once constituted, the MPC/DPC should create the spatial development plan for the region including any rural areas that may lie within the district boundary but outside the municipal limits of an urban area. This plan should have the greatest longevity with a 20+ year perspective with a formal review frequency of 5 years. This Spatial Development Plan should then be used by the ULBs as a guiding framework to create the second tier of plan for the city. The timeline of the ULB Spatial plans should also be synchronized with the timing of the MDP/DDP.
4.2.2.1.5 Revise the nomenclature of ‘Master Plan’ to ‘Spatial and Development Plan’: This a more appropriate term as it captures the development and spatial aspects of the plan. The change in nomenclature is important as it provides focus on what the plan is expected to deliver. It captures the “socio-economic” development planning prevailing in rural plans, along with the “spatial” land use zoning that has been the predominant focus of urban plans.
4.2.2.1.6 Modify State Town Planning Acts, and Municipal Laws: Most State Planning Acts are legacy legislations adopted from colonial influence, guided in part by two Model Acts brought out by the Ministry of Urban Development, GoI: the Model Town and Country Planning Law of 1960; the model Regional and Town Planning and Development Law of 1966 and its update of 1985. These Acts need to be reviewed and revised to address the current challenges of urbanisation as well as to reflect recent policy recommendations to allow regional decentralisation and citizen participation. To adopt a regional planning approach, Metropolitan plans should be binding on municipal plans at an overall level. Moreover, the metropolitan plans should integrate top–
46
down and bottom–up plans, reinforcing the concept of ‘urban development regions’ around the municipal boundaries and should be consistent with the natural resource endowment. This will allow Municipalities to plan for immediate hinterlands and peri-urban spaces outside their jurisdiction and help exercise a certain control over the development and land-use patterns of the emerging and future urban spaces. These ‘development regions/metropolitan regions’ may have the same provisions ascribed to the municipalities as the ‘development/planning areas’ in the Town and Country Planning Act. A model town planning act should be framed so that the state government may amend their existing Acts to incorporate best practices in urban planning.
4.2.2.1.7 Transfer the planning functions to urban local bodies (ULBs): Each of the existing as well as proposed municipalities in a district or metropolitan area must have a Planning Cell that provides technical support. Even if not fully staffed, it must have the minimum resources that can provide for the day-to-day planning and design requirements of the municipality. This cell should also establish and oversee contractual arrangements with external planning service providers (from within or outside government) as needed. Further, each municipality must mandatorily fulfil its obligation to produce a spatial plan within a specified time period. The Spatial Development Plans prepared by a municipality should be submitted to the MPC/DPC. Any directions given by the MPC/DPC from the point of view of ensuring the fulfilment of requirements and imperatives of the notified Metropolitan/District SDP should be complied with as these should be binding on the municipality. The spatial plan which fully complies with such directions (if any) shall be approved by the concerned municipal corporation/council. This will not only ensure compliance with the requirements of regional planning, but will also safeguard the power of the individual ULBs to approve the SDPs prepared by them without submitting it to the State Government for final approval.
4.2.2.1.8 Create a single window for all plan sanctions and approvals: Each municipality should have its own "Single-Window Service Centres." All plan sanctions and approvals from centre, state, and local governments should be facilitated through this one-window. Multiple sets of plans
47

can be submitted for multiple approvals through this window. Also, in cases where a particular area has a blanket clearance, then project specific clearances in that area may not be required. An example of this could be a residential project in an area which is already declared residential by the SDP. Any violations however, may be checked through a decentralised enforcement approach. Similarly, in the case of development projects in the panchayats, a common district/metropolitan single-window service centre can be conceived, and local governments can be brought under one umbrella by establishing ‘one stop service centres.’
State governments should set up an "Urban Services Streamlining Task Force" to examine and suggest simplification of Development Control Regulations, procedures and transparency in all ULB plan sanctioning activities.
4.2.2.1.9 Decentralise enforcement of spatial and development plans: Empowering local bodies to plan must also extend to plan enforcement otherwise they will be unable to carry out their plan. The enforcement should follow a decentralized bottom-up approach consisting of: ■ The Ward Committee (WC)/Panch as the first level of
enforcement, closest to the actual incidents of violations. The Ward Committee must be authorised to hold hearings, serve notices, recommend appropriate punitive action against violators of notified plans and steps for reversal of the violation to the municipal corporation/council, or panchayat
■ The Municipal Corporation or Council/Panchayat should be the second level of enforcement, acting upon recommendations from the WC/Panch, and as the first appellate authority to address disputes arising out of WC decisions
■ The MPC/DPC should form the third level of enforcement, acting on the municipality/panchayat recommendations, and as the appellate authority to address disputes on municipality/panchayat decisions. Any disputes that cannot be settled by MPC/DPC can be resolved by the courts.
4.2.2.1.10 Amend Land Use Conversion (LUC) Norms as per spatial plans: Any LUC approval at the level of the district or metropolitan city must follow the spatial plans of the
48

Metropolitan/District and local governments. If a change to the plan is proposed, it must be routed through the Panchayat/Municipality concerned, and approved through consensus. This process is important to ensure that the approvals process is transparent and efficient and it passes a high bar of reason and consensus while being subject to objections/suggestions. This call for review of the current land use conversion policy. While doing so, possibility of allowing automatic land use conversion for properties falling under development zones may be explored to simplify the process. This is especially important for development controls over land, and extensions to cities that requires public financing of infrastructure development. The ability to unlock the potential of land for urban infrastructure has a very large dependency on the spatial development planning authorities in three ways: land acquisition for public projects, development charges, and planning instruments such as Floor Space Index (FSI) and Transfer of Development Rights (TDRs). Policies on these fronts must be articulated without delay.
4.2.2.2 Institutions to fully implement the 74th Constitutional Amendment and to execute various policy changes at the central, state and regional and local level are required.
Central Government Level
4.2.2.2.1 Set–up a National Spatial Planning Division at the Planning Commission with arms at MOUD and MHUPA: There is an urgent need to formulate a National Spatial Strategy covering the National Transportation Grids, National Priority Cities and Proposed New Cities along emerging industrial and high–tech growth corridors connected with a high–speed rail network. Such endeavour could be initiated by MoUD and MoHUPA in consultation with all the stakeholders. Strategic plans for National Priority Cities should be fully funded by the centre and those for state priority cities and GEM cities should be funded equally by the centre and the states. Given the multidisciplinary nature of the proposed division, it may be considered to house it within the Planning Commission.
State Government Level
4.2.2.2.2 Restructure the role of the Metropolitan Development Authority to function as the technical arm of the Metropolitan Planning Committee: Development
49

Authorities (DA) are currently responsible for creating “structure plans” for the metropolitan region and of the metropolitan cities. To this end, the Development Authorities’ technical capabilities as a metropolitan level planner and regulator must be leveraged appropriately. However, the role of the Metropolitan Development Authority needs to be restructured–it should act as technical arm of the MPC. The Metropolitan Development Authority under the aegis of the Metropolitan Planning Committee may be vested with the responsibility of enforcing and regulating the Development Plan, and be the appellate authority for conflict resolutions on the Spatial Plans for all Local Planning Authorities in the metro region. This is in keeping with the letter and spirit of the Constitutional Amendment Act where the DA's role is to facilitate the planning process. Planning for a city may include the city proper and peripheral area, say 5-8 kilometres. Given the revised mandate of Development Authority, it is critical that it is relieved from the responsibilities related to project implementation and land development so as to avoid any conflict of interest between the roles of planner/regulator, and that of project implementer or developer. This includes its role as an infrastructure developer for region, and as a land bank owner in the region. Finally, it is recommended that the Chief Planning Officer and his establishment in the district ought to become part of the technical support system of the DPC.
4.2.2.2.3 Establish State Planning Boards (SPBs): All states must constitute and strengthen State Planning Boards and mandate them with the preparation of state-wide strategic Spatial Development Plans (SDPs). The main duties of the Board towards facilitating the planning process include inter alia: ■ Overseeing that spatial development plans for the state
are prepared in a timely manner as prescribed; ■ Approving plans of DPCs and MPCs; preparing plans
by default when there is no acting Planning Authority; and
■ Acting as the arbitrator for conflicting land uses between plans.
The State Town and Country Planning Department (TCPD) could provide technical Assistance to the State Planning Board to conduct its duties. In addition to this, SPB may
50

also external expertise in the form of empanelled spatial planning experts.
The constitution of the Board should ensure appropriate political representation, with the State Minister for Planning, as the Chairperson, and the Principle Secretary, Planning as Secretary to the SPB.
The recommendations of the State Planning Board must drive the investment priorities of the State Planning Commission (SPC). The Chairperson of the SPB should be part of the SPC to facilitate informed decision making on the investment priorities based on the spatial development plan of the SPB.
4.2.2.2.4 Strengthen the Unified Metropolitan Transport Authority (UMTA): In keeping with the 2nd Administrative Reforms Commission metropolitan cities should set up the UMTA and the aforesaid recommendations of the Commission should be accepted and implemented subject to legislative clearances. UMTA’s should focus on creating city level transportation plans which should be integrated with spatial and land use plans of the city and should report to MPC/DPC.
4.2.2.2.5 Create an Urban Spatial Data Centre (SDC): It is imperative to assimilate reliable and updated spatial data, for effective decision–making, preparation of spatial plans, sharing between departments, and for urban management. The value of GIS spans across land records, land management, municipal tax charges, monitoring services such as water supply, roads, waste management, etc. This data is essential and unfortunately, does not fully exist today. For example, high quality maps are required for effective metropolitan area planning. The Metropolitan Spatial Data Cell can be linked to the State SDC such that the base maps rest with the SDC, but the MSDC can overlay data layers and modify them as required.
Regional and Local Body Level
4.2.2.2.6 Create dedicated urban environmental planning cells: Urban planning cells should be created in all the mega cities (population more than 4 million) to provide technical support to the ULBs in dealing with environmental issues. The proposed cell shall draft an urban environment policy and prepare a 3 year city environment plan. Urban Environmental Information Reports should be used in the
51

smaller cities to provide input to respective ULBs on environmental issues.
STRATEGY FOR DEVELOPMENT OF SATELLITE TOWNS
INDIA SHOULD FACILITATE THE GROWTH OF SATELLITE TOWNS AND THE TWIN–CITY CONCEPT.
A MAJOR METRO ATTRACTS THE BULK OF MIGRATION AND HIGHWAY CORRIDOR DEVELOPMENT ALL AROUND IT. IF THE REGION IS PLANNED AND DEVELOPED PROACTIVELY, SATELLITE TOWNS AROUND SUCH MAGNET CITIES CAN BECOME CATCHMENT AREAS FOR FURTHER URBANISATION. SUCH A STRATEGY DISTRIBUTES THE PRESSURE, AND INCREASES THE ABILITY TO PROVIDE FOR A BETTER QUALITY OF LIFE OVERALL. THE MCKINSEY GLOBAL INSTITUTE (MGI) REPORT ON INDIA’S URBANISATION ESTIMATED THE POTENTIAL OF CREATING 25 SUCH SATELLITE TOWNS, EACH WITH A POPULATION OF 0.5 TO 1 MILLION. THE POTENTIAL CANDIDATES FOR THIS CAN BE IDENTIFIED ON THE BASIS OF:
■ POTENTIAL FOR ECONOMIC SUSTAINABILITY ■ EXISTING ROAD/RAIL NETWORKS ■ EXISTING AND ANTICIPATED INFRASTRUCTURE,
ESPECIALLY WATER AND POWER ■ STRATEGIC LOCATION FOR RURAL ACCESS ■ EXISTING SOCIAL INFRASTRUCTURE ■ ENVIRONMENTAL IMPACT AND FEASIBILITY ■ IN ORDER TO FACILITATE SUCCESSFUL DEVELOPMENT OF
THESE SATELLITE TOWNS, BEST PRACTICE PLANNING AND GOVERNANCE SYSTEMS SHOULD BE IMPLEMENTED. THIS SHOULD BE SUPPLEMENTED WITH ADEQUATE FINANCING RIGHT FROM THE STAGE OF INCEPTION. SECONDLY, THE GOVERNMENT SHOULD BECOME AN ACTIVE FACILITATOR ESPECIALLY IN THE PROVISION OF INFRASTRUCTURE WITH LONG LEAD TIMES SUCH AS BULK WATER, ELECTRICITY AND TRUNK TRANSPORTATION CONNECTIVITY.
52

4.3 Funding Urban Infrastructure Indian cities lag in the provision of basic services to citizens. Looking ahead, urban infrastructure assets will be further stressed through the significant rise in urban population. Multiple sources of funding need to be tapped to finance current and future requirements.
4.3.1 Challenges in Financing Urban Infrastructure: Multiple issues have resulted in significantly lower per capita expenditure in urban areas. Key issues responsible for this are:
4.3.1.1 Inadequate investment from the central government: In 2011-12, India invested 0.7 percent of GDP in the urban sector. While this was significantly higher than investments made before, it is still much less than other emerging economies. For example, China invested as much as 2.7 percent of their GDP in the urban sector during 2000-07.
4.3.1.2 Lack of stable and predictable transfers from state governments: Despite the constitution of State Finance Commissions, most of the SFCs are plagued by inadequate technical and financial support. While the SFCs have made recommendations, most states have not implemented a formula based revenue sharing arrangement with ULBs. Some states have partly devolved funds, while some others have cited strained resource base as the reason for non-compliance.
4.3.1.3 Low share of own revenues for ULBs: The share of own revenue for ULBs has declined significantly from 63 percent in 2002-03 to 53 percent in 2007-08 as estimated by High Power Committee Report 2011. This is driven by the underperformance of both tax based and other revenue streams. HPEC report quoted a survey of 36 cities that highlighted the issues in collection of property taxes around poor assessment rate, weak collection efficiency, flawed methods for property valuation, loss on account of exemptions and poor enforcement. Also, user charges remain low, which coupled with collection inefficiency has resulted in low share of non-tax based own revenues for ULBs.
4.3.1.4 Limited private sector participation: Private investors have also shied away from investing in urban infrastructure. This is
53

largely due to poor governance at the ULB level, leading to a perception of uncertainty for private investors. Also, there is lack of clear guidelines for PPP, which makes it tough for ULBs to design projects which are viable for PPP.
4.3.1.5 Dysfunctional framework for land monetisation: Conversion charges, betterment charges, impact fee and development charges are the most commonly used land based revenue streams presently in use. Most of these methods face the challenge in estimating the right amount of fee/charge. Another revenue source i.e. charging for additional Floor Space Index to generate additional revenues is not common across ULBs in India. Furthermore, large unutilised land blocks belonging to central, state and local governments can be monetised. Some of these land assets are located in prime areas and are contributing to urban sprawl.
4.3.1.6 Scarce use of debt instruments: Local agencies seldom use debt financing to fund their requirements. While this is partly driven by lack of a vibrant debt market in India, the fundamental issue is that most ULBs are not bankable because of their limited ability to raise revenues. Further, many small ULBs do not have the strong balance sheets and ability to pay the transaction costs associated with debt financing.
4.3.2 A Comprehensive Framework for Financing Urban Infrastructure Investments: The High Powered Expert Committee Report (HPEC) on Urban Infrastructure and Services (2011) estimated the total capital investments in urban infrastructure at about Rs. 39 lakh crores over the next 20 years (Appendix 9). This estimate includes urban roads, mass transit systems, renewal and redevelopment, water and sanitation infrastructure, storm water drains. In addition to this, about Rs. 19 lakh cr is needed for O&M expenditure of the assets created. However, the estimates above exclude the capital required for building the required affordable housing stock and cost of land. To achieve these, successor programme of JNNURM should:
■ Have a total outlay of Rs. 1,62,000 Cr for the next five years (Appendix 10)
■ Stress on governance and financial reforms at the state level and ensure clear formula based devolution of funds from states to ULBs
■ Incentivise ULBs to stimulate their own revenues
54

■ Put in place systematic guidelines for PPP to help ULBs choose the most optimal mode of PPP for a particular project. One potential solution is laid out in Appendix 11.
■ Facilitate PPPs in smaller cities by encouraging the creation of a city specific transition plan with a list of pilot projects for PPP
■ Propose a model process for aggregating and monetising land assets
In addition to this, two separate schemes should be launched by the central government to address the issues of: ■ National Urban Poverty Alleviation Mission, and ■ Capacity building at all levels of urban administration
■ Different working groups have estimated the requirement of budgetary support for urban sector in the 12th plan as follows:
PARTICULARS IN RS. CR
(A)URBAN TRANSPORT (EXCLUDING CAPACITY BUILDING): ESTIMATED BY THE WORKING GROUP ON URBAN TRANSPORT
80,843
(B) BUDGETARY SUPPORT REQUIRED UNDER JNNURM ( INCLUDING URBAN TRANSPORT): WORKING GROUP ON FINANCING URBANISATION
1,44,000
(C ) RAJIV AWAS YOJANA AND ANY OTHER SCHEME OF SLUM REHABILITATION: ( WORKING GROUP ON FINANCING URBANISATION
1,06,694
(D) NATIONAL URBAN LIVELIHOOD MISSION (ESTIMATE BY THE MINISTRY OF HOUSING AND URBAN POVERTY ALLEVIATION
20,000
(E) NATIONAL CAPACITY 18,000
55
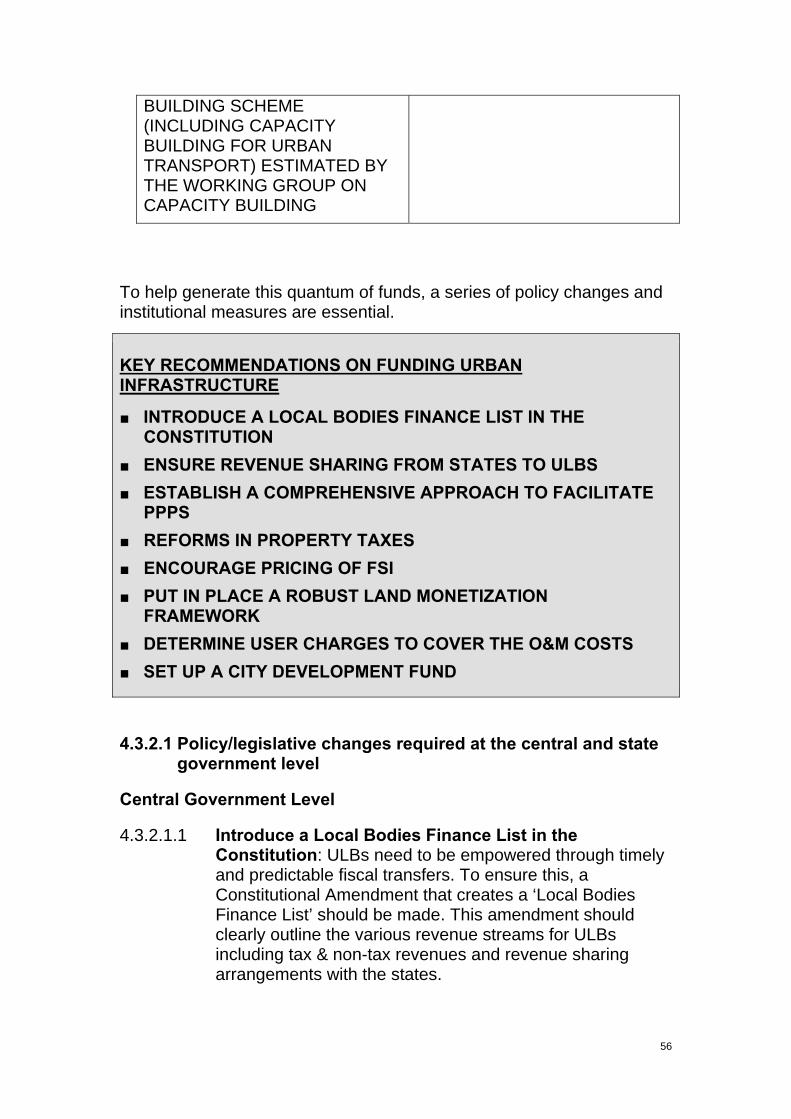
BUILDING SCHEME (INCLUDING CAPACITY BUILDING FOR URBAN TRANSPORT) ESTIMATED BY THE WORKING GROUP ON CAPACITY BUILDING
To help generate this quantum of funds, a series of policy changes and institutional measures are essential.
KEY RECOMMENDATIONS ON FUNDING URBAN INFRASTRUCTURE
■ INTRODUCE A LOCAL BODIES FINANCE LIST IN THE CONSTITUTION
■ ENSURE REVENUE SHARING FROM STATES TO ULBS ■ ESTABLISH A COMPREHENSIVE APPROACH TO FACILITATE
PPPS ■ REFORMS IN PROPERTY TAXES ■ ENCOURAGE PRICING OF FSI ■ PUT IN PLACE A ROBUST LAND MONETIZATION
FRAMEWORK ■ DETERMINE USER CHARGES TO COVER THE O&M COSTS ■ SET UP A CITY DEVELOPMENT FUND
4.3.2.1 Policy/legislative changes required at the central and state government level
Central Government Level
4.3.2.1.1 Introduce a Local Bodies Finance List in the Constitution: ULBs need to be empowered through timely and predictable fiscal transfers. To ensure this, a Constitutional Amendment that creates a ‘Local Bodies Finance List’ should be made. This amendment should clearly outline the various revenue streams for ULBs including tax & non-tax revenues and revenue sharing arrangements with the states.
56
In terms of own tax revenues, ULBs should have exclusive rights to collect property, entertainment, professional and advertisement tax and retain all of their proceeds. Other taxes such as motor vehicle tax and stamp duty should also be passed on to ULBs. Non-tax revenues should include user charges, trade license fee and land value based instruments like FSI charge/ Betterment charge/ Development charge or Impact fee, while octroi and entry taxes should be abolished in all states.
4.3.2.1.1.1 Industrial towns that do not fall within the purview of democratic local governments need to equitably share revenues with adjoining areas as these cities draw significant resources from the proximate local area. These provisions should be exercised with due diligence and should be applied transparently.
4.3.2.1.2 Ensure revenue sharing from states to ULBs: Apart from this, revenue sharing by states should be enforced constitutionally. According to HPEC, states should share 25 percent of the GST equivalent with ULBs. This can be fine–tuned by SFCs based on the level of economic activity, population, severity of urban issues and other relevant factors.
4.3.2.1.3 Establish a comprehensive approach to facilitate PPPs: As much as 13-23 percent of investments in urban infrastructure in the 12th FYP can be raised through PPPs (Appendix 14). This would roughly translate to about 250-300 PPP projects in the urban sector each year. For this to happen, a pipeline of about 600-800 PPP projects must be in place. Also, many PPP projects in urban infrastructure are long term prjects with annuity payments extending up to 10 to 20 years. This implies that any central government support to ULBs in such projects should cut across multiple Five–Year Plan periods. To facilitate this enabling policy should be put in place so that such long term annuity based projects can be easily executed with financial assistance from central government. Also, a group of transaction advisors can be empanelled to reduce the time taken by ULBs in awarding a project on PPP basis.
4.3.2.1.4 Renew HUDCO’s focus on urban housing and infrastructure: In the recent years, HUDCO’s focus has shifted to financing power, gas and other large infrastructure projects. It is recommended that HUDCO re-
57

focuses on financing low cost housing and other urban infrastructure projects. To enable this, it is important for HUDCO to have a professional board and modern management structure. Also the benefits of an infrastructure finance company, like access to long term finance, should be extended to HUDCO. Finally, to ensure accountability, its activities should be regulated directly by the RBI.
4.3.2.1.5 Create a ‘Regulatory Guidelines Handbook for Municipal Borrowing’: A handbook should be created based on consultation with key stakeholders, which should specify regulations relating to lenders and lending instruments, mixed or shared authority and responsibility between the central and state government and the ex ante borrowing activities of municipalities and ex post procedures relating to municipal default and insolvency.
4.3.2.1.6 Support cost cutting innovations: Given the huge requirement of funds, it is imperative that cost cutting innovation both, in the field of materials and processes is incentivised. Also dissemination of best practices should be encouraged through strengthening of initiatives like project PEARL.
State Government Level
4.3.2.1.7 Reforms in property taxes: Property tax is likely to be the largest component of the proposed ‘exclusive taxes’ for ULBs. Property tax should be restructured as a general benefit tax and components like water and sewerage services should be charged as separate user charges. Property tax on constructed property should be determined using an area-based valuation system which factors in location, type of construction and type of use to determine the slab rate per square foot. ULBs should be allowed to fix the tax rate, subject to a ceiling specified by law. Also, to avoid land hoarding, a ‘vacant land’ tax should be formalized. This should be based on ready-reckoner capital value and can be charged at 0.5 percent of the total value. Finally, service charges should be levied on properties owned by the Union and State governments.
To increase collection efficiency, a property inventory should be created through a micro–level GIS mapping effort conducted with support from ISRO/NRSA. Also, an active and accurate register of tax-payers should be
58

maintained to minimize leakages. Ward committees and Area Sabhas should be leveraged to ensure compliance and local community organisations like RWAs should be incentivised for timely payment of property taxes.
4.3.2.1.8 Encourage pricing of FSI: Pricing additional FSI is another source of land-based financing available to ULBs. Many cities are already levying these charges in some form. For example, Hyderabad has a ‘city level impact fee for high rise buildings’ and Ahmedabad has a systematic approach to sell a limited amount of additional FSI (0.45). It is recommended that beyond minimum FSI given as development rights, additional FSI should be selectively provided and charged for. This should be a part of the balanced strategy for expanding the effective supply of prime land and in the process raise funds to finance urban infrastructure improvements. Also, the charges for additional FSI & land-use conversions should be determined professionally and should be at least 50 percent of the area rate in the concerned area.
.
4.3.2.1.9 Put in place a robust land monetisation framework: Land is a key driver for urbanisation both as a factor and as a resource that can be monetised. An institutional framework to tackle the issues related to land must be put in place urgently to be able to unlock land value in a significant way (Appendix 15). Some features of such a model process could include: ■ Preparation of Master Plan using a standardised
approach on a regular basis ■ Ensuring land patterns are maintained as per approved
Master Plans ■ Sequencing the land development process to generate
resources for infrastructure creation ■ Delineate the roles and responsibilities of Urban
Development Authorities and ULBs in the land management process
However, the framework needs to be transparent and accountable with due attention to the needs of the poor and marginalised sections. Government land should primarily be used for providing for the poor, open spaces, roads and urban infrastructure. Land readjustment policies should be used to pool in private land into this framework.
59
4.3.2.1.10 Determine user charges to cover the O&M costs: User charges must be levied for all measurable services where beneficiaries are easily identifiable. Appropriate level of user charges should be determined by the proposed Municipal Services Regulator and should not only cover the O&M costs, debt servicing costs and depreciation, but also provide a minimal profit to the ULBs to facilitate creation of an equity base for ULBs over time. Also, there should be a tiered structure of user charges, where higher levels of consumption should tagged with a higher tariff. This can help manage demand of critical services like water, parking etc. Parking charges should also factor in the true value of the land.
4.3.2.2 New institutional measures necessary to facilitate funding of urban infrastructure
Central Government Level
4.3.2.2.1 Establish a National Registry for Government Land: Management of government land in urban areas has huge potential and needs to be streamlined. As a first step in this direction, it is critical to build an inventory of such land. These surveys can be done using GIS mapping technologies and should be conducted with support from ISRO/NRSA.
State Government Level
4.3.2.2.2 Set up a city development fund: Proceeds from all the revenue sources of ULBs should be pooled into a ‘ring fenced’ city development fund. The idea of ring-fencing is to ensure that the funds are used only for urban infrastructure projects for respective cities and not for any other purpose. However, a suitable arrangement will have to be worked out for sharing the resources between metropolitan and municipal agencies.
4.3.2.2.3 Bolster State Finance Commissions: For financial devolution and imparting predictability to the municipal finances, the State Finance Commissions need to be further strengthened. Besides suitable financial assistance from GoI to such endeavours, there is also a need for revamping MIS at municipal level.
60

4.3.2.2.4 Set up state financial intermediaries to pool resources for smaller ULBs: As discussed earlier, smaller ULBs find it difficult to access capital markets, largely due to their weaker balance sheets and inability to bear the transaction costs. To solve for this, each state should set up a State Financial Intermediary on a PPP basis, on the lines of Tamil Nadu Urban Development Fund (TNUDF), which can then pool funding requirements of smaller ULBs in the state and provide economies of scale.
4.3.2.2.5 Robust value for money framework for PPP: Given the envisaged scale of private investments, it will be critical to create a robust value for money framework to benchmark costs quoted by the private sector for management of urban services. However, it is critical to design a framework that is acceptable to various government stakeholders.
61
An Indicative Municipal Finance List • ‛Exclusive taxes’ – Property tax, including vacant land tax – Profession tax – Entertainment tax* – Advertisement tax* • ‛Revenue-shared taxes’ – All taxes on goods and services levied by the state government** • Non-tax revenue – User charges – Trade licensing fee – FSI charge/Betterment charge/Impact fee/Development charge * if not subsumed under the GST. ** including value added tax (VAT)/sales tax, stamp duty, electricity, purchase tax, luxury tax, taxes on lottery, betting and gambling, entry laxes in lieu of octroi, etc. Note: FSI stands for floor space index. Source- HPEC report, March 2011

4.4 Capacity Building Lack of sufficient capacity across all levels of government lies at the centre of India’s urban development challenges. The Mid–Term Appraisal of the 11th plan highlighted that many states have lagged in programme utilisation due to lack of enabling capacity. Similarly, the High Powered Expert Committee Report (HPEC) on Urban Infrastructure and Services (2011) and the McKinsey Global Institute (MGI) report (2010) expressed serious concern over lack of the capacity in Urban Local Bodies.
4.4.1 Challenges in Capacity Building Key issues identified in this area are:
4.4.1.1 Capacity building is accorded very low priority and is largely limited to administrative training. An organisational strategy for urban capacity building at the state and ULB level is lacking. This is evident through the absence of formal structures, dedicated cadres, staffing norms, organisational procedures, job descriptions and pay scales. Commitment to a common vision and mission, shared norms and values amongst staff and budgetary support are also low. Likewise, communication channels with the private sector and civil society in their current form are not very effective.
4.4.1.2 Lack of explicit demand for specialised skills at the state and ULB level. Key areas in which substantial capacity gaps exist today, include land management, valuation and monetisation, accounting, service level benchmarking, architecture, transport, planning and heritage conservation, socio–economic development, public health, operations and maintenance, project implementation & monitoring and contract management. In addition certain specific skills will be required to address environmental issues identified under the National Mission for Sustainable Habitat. These include augmentation of capacity for construction and certification of green buildings, integrated transport and land use planning, implementation and certification of efforts in areas such as rain water harvesting, recycling and reuse of waste water, waste recovery, disaster management and climate change. The lack of demand is quite clear from the outlay from the different schemes (Appendix 16).
4.4.1.3 Lack of credible supply side institutions that provide specialised training and facilitate experiential learning.
62

While the initiative under 11th plan has resulted in emergence of such institutions, lack of such institution still remains to be a bottleneck. Programmes at the existing Administrative Training Institutes (ATIs) predominantly focus on general administration rather than the specific issue of urban management. Training is primarily classroom based and not suitable to the requirements of urban managers.
4.4.1.4 Limited central assistance to support capacity building. The Mid–Term Appraisal of the JNNURM outlines that developing soft infrastructure, which is a critical pre-requisite for the cities and states to steer inclusive and sustainable urban development, has decidedly been left to the states. It emphasizes the need for the central government to play a more proactive role in providing assistance to states and cities to build this soft infrastructure.
4.4.2 Addressing the Capacity Deficit: Tackling the capacity challenge should be a key endeavour during the 12th Five–Year Plan period. To achieve visible outcomes a series of policies and institutional measures that proactively steer capacity building efforts at the central, state and ULB level are essential. These efforts should be supported by predictable financing, precede project implementation and be an integral part of the urban development agenda. It should also promote active dialogue and consultations with multiple stakeholders and use of Information Communication Technologies. With a view to emphasise the importance of capacity building it is important to ensure that it receives the much needed attention, finances and leadership across all levels of Government. To ensure this, a Comprehensive Capacity Building Scheme with an outlay of Rs. 18,000 crores should be launched that should have Rs. 5000 crores earmarked for the urban transport sector (Appendix 17). In addition to this, it is highly desirable to have a state component in the scheme to create a sense of ownership.
The scheme could fund various capacity building programmes e.g. preparation of comprehensive human resource policies including the creation of the municipal cadre, provisioning of staff, implementation of e-governance initiatives and setting up of world–class urban management institutes.
To deliver visible outcomes, the scheme needs to be supplemented with a series of policy reforms and institutional measures, especially at the central and state government level.
63
KEY RECOMMENDATIONS ON CAPACITY BUILDING
■ CREATE A MUNICIPAL CADRE ■ CREATE A SEPARATE DIVISION FOR CAPACITY BUILDING AT
MOUD ■ CREATE A NETWORK OF 50 INSTITUTIONS AND CENTRES OF
EXCELLENCE ■ LAUNCH FIVE INDIAN INSTITUTES OF URBAN MANAGEMENT
(IIUMS)
4.4.2.1 Policy reforms required to bolster capacity building: Five key policies are required to help address the demand–supply gaps.
4.4.2.1.1 National Level Capacity Building Framework: The Government of India needs to evolve a Comprehensive Capacity Building framework that addresses issues such as staffing, training and skill development, institutional issues and finances. The framework should be designed in accordance with the modern day responsibilities of ULBs, for example up-skilling to work with private sector. This framework could then be used by states to determine actual requirements based on the ULB level assessment and any specific requirements not covered within the ambit of this framework.
4.4.2.1.2 State Level Capacity Building Strategy: States also need to evolve a human resource strategy for ULBs by detailing staffing norms, cadre rules that reflect service delivery and governance norms to be met by ULBs. This strategy should address existing gaps and needs and be dynamic enough to meet future needs, incentivise knowledge and skill development and provide an environment for using the acquired skills. Likewise, ULBs should also prepare capacity building plans outlining their needs that should integrate with the overall state level plan.
4.4.2.1.3 Creating a municipal cadre: Given the personnel in ULBs do not have the necessary technical and planning skills, the creation of a municipal cadre is essential (Appendix 18). The HPEC report has also suggested the need to establish a municipal cadre, covering the key areas of modern day urban governance and, capable of meeting the ever
64

increasing complexities in city management. The functional domain of urban bodies may be restructured as (i) General Administration & Tax Collection, (ii) Planning & Regulations (iii) Water & Sewerage Service (iv) Heath (v) Sanitation and Solid Waste Management (vi) Public Works and Civic Amenities (vii) Urban Forestry & Recreational Infrastructure (viii) Urban Poverty Alleviation & Social Welfare, (ix) Public Education, (x) Land Valuation, (xi) Environment (xii) Urban Transport and Urban Transport Planner (xiii) Finance and (xiv) Other Services and Support Functions. The training along these domains can also be facilitated by creating dedicated departments/courses for urban issues in reputed universities and colleges.
To ensure that this cadre attracts top quality talent, it is important that the Recruitment Rules provide for at least 25 percent direct recruitment in Category A posts and 50 percent in Category B. Creating such a cadre would also facilitate experiential sharing. A career path can also be put in place by allowing functionaries to move to higher levels of local bodies based on their experience. Other systems such as the Voluntary Technical Corps also need to be encouraged.
Finally, given the limited paying capacity of local bodies especially in small and medium towns, there is need to provision for financing cadres from plan funds in the 12th Five–Year Plan.
4.4.2.1.3.1 While creating municipal cadres will benefit the country in the medium to long term, in the short–term policies that enable recruitment from the private sector and support hiring external consultants through a fast–track process should be introduced. To accelerate this process, states can consider creating a list for “Empanelled urban practice professional institutions”. This will streamline the procurement process and will enable ULBs to access external talent in a timely manner. Outsourcing may be facilitated for activities such as development of City Development Plans, Master Plans, Resource Mobilisation Plans, Information System Improvement Plans, Water and Energy audits, and Utility Mapping.
4.4.2.1.4 Establishment of a Reform and Performance Cell at the Central and State Level: A dedicated unit to address issues such as implementation of reforms, dissemination of best practices across areas of solid waste management,
65

water supply, sewerage, revenue mobilisation, planning, disaster management, PPP, accessing municipal bond market, formulation of master plans and CDPs needs to be set up. This unit should comprise urban planners, municipal finance experts, IT personnel, public health engineers’ et al. This cell could also undertake activities like declaring existing leading institutions as Centres of Excellence, establishing new schools of planning and enhancing capacity of existing ones, and producing a cohort of professionals and training resources to carry out critical urban development functions.
4.4.2.2 Institutional measures required in the short to medium, and medium to long term
The Central Government needs to:
4.4.2.2.1 Create a separate division for Capacity Building at MoUD and MoHUPA Dedicated leadership is essential for a large scale capacity building program to succeed. Various aspects related to demand creation, augmenting supply side, strengthening linkages between institutions and cities, identifying new areas of capacity building, evaluating the impact of programmes etc calls for effective stewardship and oversight. The Ministry of Rural Development has a Joint Secretary level officer especially entrusted with training and capacity building of Panchayati Raj Institutions (PRIs). A similar approach is recommended as there is an urgent need to augment the planning, monitoring, and evaluation of capacity building initiatives.
4.4.2.2.2 Create a network of 50 institutions and centres of excellence: Of these 1 to 2 should be apex level institutions and have investment and involvement from the private sector. Such an institution can help strengthen the network of existing institutions like the Engineering Staff College of India (subsidiary organisation of the Institution of Engineers (India), Indian Water Works Association, Association of Metropolitan Development Authorities, All India Mayors Council, etc.) and also assist with setting up of five Indian Institutes of Urban Management.
4.4.2.2.3 Launch five Indian Institutes of Urban Management (IIUMs): The Government of India in partnership with state governments and the private sector should set up five Indian Institutes of Urban Management (IIUMs). These institutions can prepare a future generation of urban
66

managers/regulators with world class training in urban issues. These institutes could also be used to upgrade the skills of existing personnel in the urban sector and to train officers from the Indian Administrative Service (IAS) who could then be deputed systematically in cities and towns.
4.4.2.2.4 Set up a Steering Committee to integrate various capacity building initiatives: Since urban development is a multidisciplinary, context–specific area, capacity building initiatives of various other ministries could have an impact on the overall level of capacity development in the sector. This could include the Department of Economic Affairs and the Planning Commission in the area of PPP, the Ministry of Environment and Forests, and the Ministry of Water Resources in areas such as water and sewage treatment, solid waste management, the Ministry of Power et al. A steering committee under the Chairmanship of Member, Planning Commission in charge of the urbanisation may be constituted for identifying synergies across such efforts.
4.4.2.2.5 Re-orient the activities of existing organisations namely IIPA, NIUA, RCUES: The Indian Institute of Public Administration (IIPA) along with the Administrative Training Institutes (ATIs) should be tasked with the preparation of standardised training modules and testing of training modules before they are circulated across the country to ensure they are in synchronisation with current requirements. The National Institute of Urban Affairs (NIUA) focus should be renewed such that it is capable of assisting the MoUD with policy formulation, providing advisory services to the states on a variety of urban governance dimensions, and implementing high end capacity building activities for policymakers. The Regional Centres of Urban and Environment Studies (RCUES) should conduct active research related to policy support to cities and also disseminate various policies and programs of Government of India and State Governments. These centres should carry out capacity building programs in respect of new initiatives and priorities identified by the MoUD.
4.4.2.2.6 Recognise innovation in urban affairs: Institute awards like the National Urban Water Awards in areas like urban planning, administrative effectiveness, service improvement, fiscal performance, urban transport, citizens interface to facilitate sharing of best practices and to encourage and accord prestige to innovators in the urban sector.
67

4.4.2.2.7 Facilitate information sharing between urban managers: Continue to support and strengthen the Urban Resource Link project, designed by the Administrative Staff College of India in partnership with the World Bank Institute, to provide timely, relevant and quality information related to urban issues. The Urban Resource Link is a web based interactive platform for enabling urban managers to access information. This effort could be strengthened by facilitating linkages across cities working on similar issues and providing avenues for networking through a series of regular seminars and road-shows.
4.4.2.2.8 Collaborate with IITs to facilitate use of ICT in urban management: Self learning packages which simulate real life situations relating to operations and maintenance need to be developed in areas like water supply and sanitation, solid waste management and urban planning.
4.4.2.2.9 Enter into PPP arrangements for capacity building: The government’s network of 1817 Industrial Training Institutes (ITIs) and the 3338 Industrial Training Centres run by the private sector could be roped in to up-skill and re-skill ULB personnel. These efforts could be supplemented by identifying synergies with the National Skill Development Corporation (NSDC).
Likewise State Governments should:
4.4.2.2.10 Set–up/strengthen Training Institutes: While establishment of a separate institute for capacity building in the urban sector is the preferred option for all states, states with relatively low urbanisation rates should at least establish an urban cell in the existing Administrative Training Institutes (ATI’s). This should be factored into a state’s capacity building strategy. The state governments should make a significant contribution towards establishing these centers to create a sense of ownership. Alternatively, the state governments can enter into Memoranda of Understanding (MoUs) with other institutions such as Administrative Staff College of India (ASCI), CEPT University, Centre for Science and Environment (CSE), The Energy Research Institute (TERI), Management Development Institute (MDI), Centre for Good Governance (CGG), Tata Institute for Social Sciences (TISS), All India Institute of Local self Government (AIILSG), Centre for Urban Studies of IIPA, the Human Settlements, Management Institute of the Housing, Institute of Urban
68

Transport and Urban Development Corporation or some of the other state level institutes which have the capacity to serve the needs of states.
4.4.2.2.11 Set–up/strengthen City Manager Associations: The states should support establishment and strengthening of City Managers Associations . Networking among such associations for fostering professional networks among city managers and others involved in service delivery functions is necessary.
4.4.2.2.12 Create a State Level Nodal Agency (SLNA) for E-Governance responsible for overall execution: The SLNA should be the nodal agency for implementation and monitoring of e-Governance initiatives for all the ULBs in the state. The e-governance package should contain at a minimum, the following six components – Accounting, Payroll, Procurement and Tendering, Works Management, Property Tax, Birth and Death details. SLNA should identify key officials for rollout of e-governance across the state and corresponding ULBs, coordinate with the ULBs to identify training needs through a standard template, consolidate the gap findings with reference to training needs of all participating ULBs in the state and coordinate with MoUD to prepare and execute the training plan for all the ULBs at the state level.
4.5 Sector Specific Recommendations All the above mentioned recommendations will help bolster the enablers of urbanisation and help create a platform for delivering desired sector specific outcomes. However, in addition to this, we will need specific initiatives, which build on top of these enablers, to accelerate the provision of basic services to India’s urban citizens.
KEY SECTOR SPECIFIC RECOMMENDATIONS
■ ENABLE PROVISION OF SECURITY OF TENURE FOR HOUSING
■ FACILITATE THE CREATION OF SOCIAL/RENTAL HOUSING ■ REVITALISE AND REORIENT THE ROLE OF STATE HOUSING
BOARDS (SHBS) ■ FOR SMALL AND MEDIUM TOWNS, ADOPT A STRATEGY OF
69

COMMUNITY BASED INCREMENTAL IMPROVEMENT COUPLED WITH PROVISION OF BASIC SERVICES LIKE WATER SUPPLY AND SANITATION.
■ CREATE A CORPORATIZED AGENCY FOR DELIVERY OF AFFORDABLE HOUSING
■ ADOPT AND IMPLEMENT THE MODEL STREET VENDORS BILL, 2009
■ COMPREHENSIVE URBAN TRANSPORT (UT) ACT FOR LEGISLATIVE SUPPORT
4.5.1 Affordable Housing The recently announced Rajiv Awas Yojana (RAY) programme was launched in July 2011 with vision to make Indian cities slum–free. Set up in a mission mode, the programme primarily focuses on in–situ development either through incremental up-gradation and/or redevelopment of slums, creation of rental housing stock, provision of basic services to the urban poor, and access to finance through the launch of the Credit Mortgage Guarantee Fund. The scheme should have a convergence with various other schemes in urban sector including JNNURM. Although the first two years of the programme comprise the pilot phase, emphasis on the following policy and institutional fronts could improve the program efficacy.
4.5.1.1 Legislative and/or policy measures required to bolster RAY
4.5.1.1.1 Enable provision of security of tenure: Although RAY intends to provide full–fledged property rights, a graded approach to tenure security with property rights as the penultimate outcome in the longer term should be the principle for RAY. Strategies for security of tenure should enable the slum dwellers to leverage their dwelling for incremental home improvements.
4.5.1.1.2 Institute clear land acquisition strategies: Clear land acquisition strategies need to be evolved based on a city’s size and urban poverty headcount. Consequently, four different approaches for land acquisition are recommended.
■ In cities where land is more likely to be available, land banks should be developed so that the state/city can
70

use them for infrastructure development and/or social rental housing development as the size of the cities increases over the long term. A partnership approach with land owner will solve many issues in land acquisition
■ Second, the urban poor also need to be seen in terms of occupational segments, e.g. bidi workers. Land acquisition and development strategies should consider the space needs of various occupational segments identified.
■ Third, in all such efforts, the allocation of land for housing for those living on un-tenable land must be prioritized without which approvals of projects for land development should not be given
■ Finally, higher FAR for low and middle-income housing development should be provided to help households living above the poverty line in slums to move to the formal housing market.
4.5.1.1.3 Facilitate the creation of social/rental housing: The focus of RAY on provision of rental/social housing stock for the migrant population is a critical element of a long–term preventive strategy. It was felt that social rental housing needs to form a vital component of every city’s housing strategy for the urban poor and must include individual rental units, shared rental units as well as dormitory and night shelter options, taking into consideration the livelihood needs of the homeless. However, the delivery mechanism and maintenance arrangement of such rental housing stock would need to be designed carefully in view of the poor track record of public housing agencies in assets management. Of the total stock created under RAY, at least 30 percent should be rental, and 5 percent should be dormitories. Dormitories can be set up in industrial and commercial areas that see a significant influx of migrant workers. Drawing from learnings from international examples, such as the UK, India can set up not–for–profit organisations to manage and maintain rental housing stock.
4.5.1.1.4 Involve Community in slum rehabilitation and avoid “one- size- fit-all’ strategy: While it is desirable that in slums which are located on prime urban land having multiple socially productive uses every effort should be made to economise on land use through higher FSI, involvement of
71

community in designing slum rehabilitation is also of crucial importance. Besides community participation, guiding principles of designing slum improvement may be to explore the possibility of channelizing community savings, re-use of building materials and other innovative method of reducing the cost of new dwelling units. In those cases where slums are not on prime urban land, incremental improvement in exisiting dwelling units along with provision of basic services like water supply, sanitation, power connection etc. may be adopted.
Build affordable housing stock in peri–urban areas: RAY should also make provisions for affordable housing for the urban poor in peri-urban areas. The provision of affordable housing in peri-urban areas must be accompanied by the provision of basic services as well as functional transport linkages into the city
4.5.1.1.4 Promote non–eviction of urban street vendors: Non eviction policy should be put in place in combination with a land policy aiming at the provision of developed lands for the urban poor. Land acquisition and development strategies should be implemented with the caveat that evictions for the purpose of the common social good may occur, but there should be commensurate provisions for resettlement and rehabilitation of urban citizens affected by the project. This should be equally binding on central government and private lands. Revision to building byelaws to allow for “informal housing, informal work places” and “incremental development improvements”: Existing bye–laws are anti–poor as they assume that cities are formal spatial units. Building bye-laws need to recognize ‘informality’ and lay down standards for informal settlements as well. Any revision of these bye-laws should consider how incremental housing can be successfully incorporated into such bye–laws.
4.5.1.1.5 Planning for affordable housing: Master plans should include and recognise the development of informal spaces. Inclusionary zoning for affordable housing should be mandatory in master plans. Further, to promote incremental housing, minimum standards for housing and infrastructure as well as the environmental and social infrastructure should be clearly articulated. Community structures should be strengthened for land readjustment especially for network services and social facilities, planning and O&M of services.
72

4.5.1.1.6 PPP for affordable housing: The IHSUP programme should be revamped to a graded subsidy system with 4 percent subsidy for loans between Rs. 1 lakhs and Rs. 2 lakhs and 3 percent subsidy for loans beyond Rs. 2 lakhs and upto Rs. 3 lakhs. Public institutions of the state governments such as Housing Boards, Development Authorities, Improvement Trusts should be allowed to mobilise a larger beneficiary group.
4.5.1.1.6.1 Further measures to facilitate private sector participation should be introduced. Additional FAR grant and the provision of using some part of the developed area for commercial purposes could be provided to developers interested in slum redevelopment projects targeted at the EWS and LIG segments.
4.5.1.1.7 Increase the corpus of the Credit Mortgage Guarantee Fund: The corpus should be suitably enhanced and the policy should be fine – tuned such that allocated funds are used to underwrite similar funds created for this purpose by the private sector. This will generate significant additional capital for the sector and stimulate on–the–ground demand for affordable housing stock.
4.5.1.2 Institutional measures to strengthen RAY
4.5.1.2.1 Revitalise and reorient the role of State Housing Boards: Efforts should be made to revive the role of State Housing Boards (SHBs) and Development Authorities. They should be encouraged to develop multiple partnerships with the private sector for construction of affordable housing. State governments should provide the necessary impetus by preparing state housing plans that are integrated into the overall metropolitan/city master plan and outline the roles of the SHBs. They should provide a larger quantum of guarantee to social housing programmes to enable SHBs to access a larger quantum of loan assistance from Housing Finance Institutions. SHBs should also work with the state governments to acquire land at appropriate locations that can be used for the creation of affordable housing stock. The activities of SHBs can be broad based so that cross–subsidisation opportunities may be made available to them.
4.5.1.2.2 Create a corporatized agency for delivery of affordable housing under the Metropolitan Development Authority: At the metropolitan level there is no specific agency that is responsible for the delivery of affordable housing stock. The State Government may constitute a corporatised agency that
73
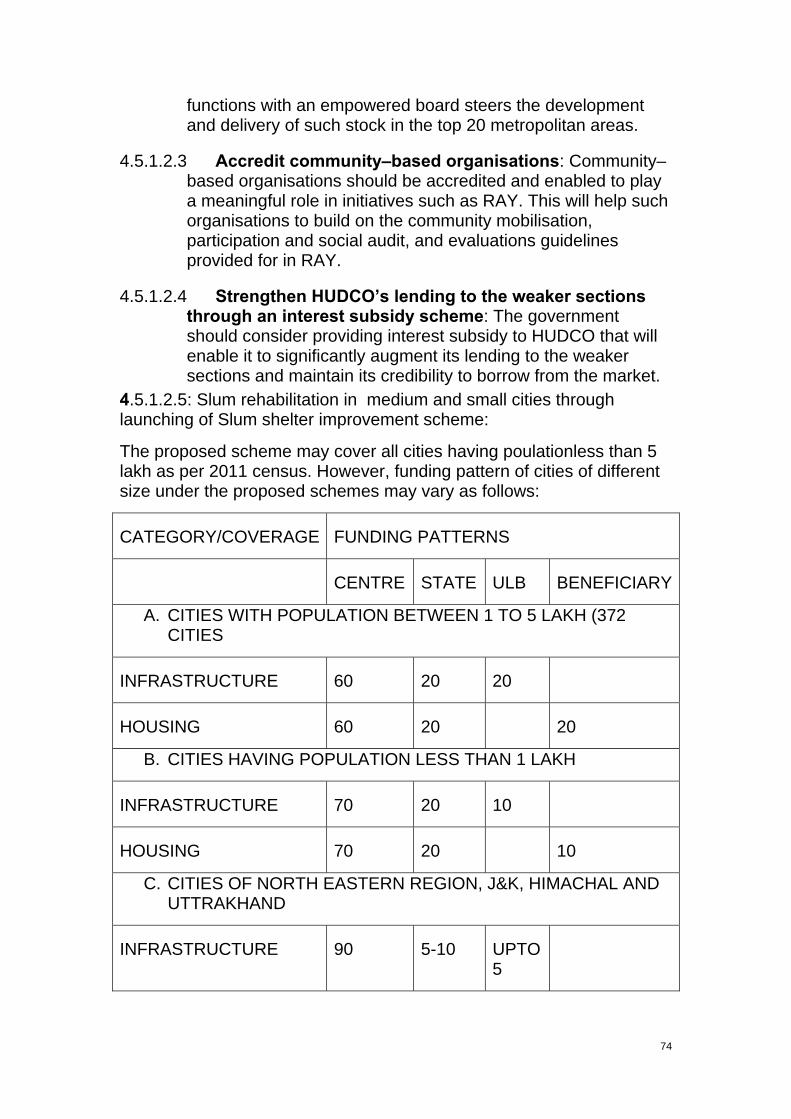
functions with an empowered board steers the development and delivery of such stock in the top 20 metropolitan areas.
4.5.1.2.3 Accredit community–based organisations: Community–based organisations should be accredited and enabled to play a meaningful role in initiatives such as RAY. This will help such organisations to build on the community mobilisation, participation and social audit, and evaluations guidelines provided for in RAY.
4.5.1.2.4 Strengthen HUDCO’s lending to the weaker sections through an interest subsidy scheme: The government should consider providing interest subsidy to HUDCO that will enable it to significantly augment its lending to the weaker sections and maintain its credibility to borrow from the market.
4.5.1.2.5: Slum rehabilitation in medium and small cities through launching of Slum shelter improvement scheme:
The proposed scheme may cover all cities having poulationless than 5 lakh as per 2011 census. However, funding pattern of cities of different size under the proposed schemes may vary as follows:
CATEGORY/COVERAGE FUNDING PATTERNS
CENTRE STATE ULB BENEFICIARY
A. CITIES WITH POPULATION BETWEEN 1 TO 5 LAKH (372 CITIES
INFRASTRUCTURE 60 20 20
HOUSING 60 20 20
B. CITIES HAVING POPULATION LESS THAN 1 LAKH
INFRASTRUCTURE 70 20 10
HOUSING 70 20 10
C. CITIES OF NORTH EASTERN REGION, J&K, HIMACHAL AND UTTRAKHAND
INFRASTRUCTURE 90 5-10 UPTO 5
74

HOUSING 90 5 5
A. CENSUS TOWN
ONE TIME GRANT OF RS. 1 CR FOR CORE INFRASTRUCTURE. IN ADDITION, FUNDS FROM ALL THE SCHEMES OF RURAL DEVELOPMENT MAY CONTINUE TO REMAIN ADMISSIBLE UNDER 12TH PLAN PERIOD.
Water supply and sanitation ■ Universalisation of access to water and sanitation to urban
areas: This involves the universal coverage of all urban population for the minimum levels of safe drinking and household-use water along with a clean toilet, sewerage, storm water drainage and solid waste management. The provisioning of basic water and sanitation should be de-linked from issues of land tenure and legal status. This basic service should be extended to recent and temporary/seasonal migrants as well. These services should be provided on the clear understanding that this provision does not automatically translate into legal entitlements in other spheres, especially as regards legal rights to the land and/or dwelling space. Further any decisions as to whether the slums is to be legalized or not should be made irrespective of the provision of basic services.
■ Reduction in unaccounted for water: A systematic approach for identification and reduction of leakage and preventive maintenance would be promoted as an integral part of the operation & maintenance of the water supply system on a regular basis. This would help save precious quantities of treated water and increase revenues to make systems self-sustaining. Such measures can often obviate the need for immediate augmentation of capacities of the existing schemes, which are very often quite capital intensive, while triggering significant improvements in service delivery.
■ 100% metering of water supply: Metering is essential for recovery of reasonable user charges and conservation. It acts as an incentive for those who wish to conserve water and a disincentive to those who waste water. Metering helps increasing the total quantum of water available and consequently increases the quantum of water available for supply and increases the overall revenue. Metering also leads to reduction of wasteful use of water and increases efficiency and sustainability of the water supply system that is an important O&M function.
75

■ Ensure 24x7 water supply: Yet another priority is to move towards continuous water supply. Intermittent supply leads to sucking of external pollution into the system during non-supply hours due to inadequate pressure, causing health hazards.
■ Address structural dysfunctionalities through reforms For meeting the aforesaid target, it is necessary that structural issues facing the sectors are addressed through completion of reforms mandated under JNNURM. These issues include high levels of non-revenue water, low level of metering, intermittent supply, inadequate quality, low sustainability etc. The poor, particularly those living in slums and squatter settlements, are generally deprived of potable water. The implementing Ministry should work with states and ULBs to introduce operational, financial and institutional reforms related to water sector and these reforms under JNNURM-II.
■ The issue of allocation of water resource between rural and urban India needs to be addressed in ways that reduce intra-national tension: In many instances, growth of urban and Industrial sectors increases consumption of water which may give rise to conflicting claims on allocation of water across different sectors. It is imperative that while all efforts are made to conserve water for augmenting its availability, Indian cities and industries re-invent their water strategy with an aim to grow with minimal water and minimal waste generation.
■ To cut the costs of water supply and distribution losses, focus on building, renewing and replenishing local water sources, including groundwater. As cities expand their water footprint which implies sourcing water from distance sources, the cost of water supply as well as transportation losses and leakages rise. Committing a larger capital investment in creating such infrastructure also leaves utilities with very little money to maintain these networks which further compounds the problem. It is necessary therefore that all efforts should be made to develop source of water close to where people need supply. The city sources are it water bodies, which capture rain or floodwaters from rivers as well as its underground water aquifers. There is an urgent need to protect and nurture these sources. Such measures may include bringing specific legislations apart from taking up specific projects under JNNURM.
■ Include ground water in water supply calculations: While preservation and re-charging of ground water are increasingly receiving attention of city planners, there is a tendency to exclude
76

this source from urban water planning. In absence of universal access to piped water supply, people are forced to rely on ground water extraction. Another problem is perverse incentivisation for substitution of piped water supply by ground water extraction in case the water tariff is perceived to be high. There is therefore an urgent need to map groundwater and include this resource in water planning of a city for its sustainable utilization. .
■ Take an integrated view of water supply and sanitation: Investment in sewage should be a function of investment in water supply as any augmentation of water supply also leads to increase in sewage generation. It is therefore necessary that planning of a water supply project should also include provision for treatment of sewage. Discharge of untreated sewage, besides making cities and our water bodies unhygienic also significantly raises the cost of treatment of water. The guiding principle should be to incentivise cost saving innovations in building sewage network, reduce the length of sewage network and to treat the waste water as resource by turning it into water for irrigation or use in the industry.
■ Set real and hard targets for affordable recycling and re-use of treated waste water : Recycling and re-use of waste water is already in practice. This is required to be scaled up in a planned way. Re-use of waste water after its treatment in agriculture and other sectors should be properly planned for optimal utilization of this scarce resource.
4.5.2 Sustainable Livelihoods and Enterprise The Swarna Jayanti Shahari Rozgara Yojana (SJSRY) should be replaced with the National Urban Livelihood Mission (NULM) to build capacities and skills in sectors that have growing employment opportunities and are relevant to local socio–economic conditions. In its design NULM should deal with important issues like financial exclusion, policy and legal exclusion, and lack of access to information and technology, raw materials and markets. It should also develop linkages with the organisations like the National Skills Development Corporation and other private sector organisations including vocational training institutions that can actually train and hire the urban poor
77

to meet their growing capacity needs. To achieve this outcome, it is imperative to undertake the following policy changes.
4.5.2.1 Policy changes required
4.5.2.1.1 Enactment and implementation of a suitable Act on livelihood promotion of street vendors and adoption of a no-eviction strategy: This will enable the creation of physical legal spaces for the informal economy and recognise and support natural markets of street vendors with a non–eviction guarantee. For this, a no eviction policy should be put in place in combination with a land policy aiming at the provision of developed lands for the urban poor. This strategy should be implemented with the caveat that evictions for the purpose of the common social good may occur, but with provisions for resettlement and rehabilitation of project affected persons. The strategy should cover central government and private lands.
4.5.2.1.2 Formalise participation of informal workers in the economy: Informal sector workers should be organised into associations or federations such as trade unions, cooperatives, and must be formally recognised. Similarly workers guilds and self–help groups should be recognised as fee paying organisations and must have the capacity to negotiate with utilities like DISCOMs and water supply boards to provide services at specified locations by paying user charges.
4.5.2.1.3 Design new financial strategies and products to meet the needs of the urban poor: Typically poor cash flow hinders the success of micro–enterprises, women, children and also those belonging to minorities or SC/ST caste groups. Thus innovative products and services that help meet the needs of the informal economy e.g. branchless banking, business–correspondents, and micro–finance should be created. Workers guilds and self help groups should be provided with a package of financial services including micro–credit for working capital and assets, micro–insurance for life, health and livelihoods.
4.5.2.1.4 Institute relevant skill–building programmes: Funding and resources for skill development and upgradation with a focus on trades that are relevant for self and wage employment should be accorded a high priority. As state governments implement NULP, they should work to create strong linkages with the National Skills Development Corporation, industry, vocational training institutes and guilds to keep abreast with market demand for skill training. These skill building initiatives
78
should also be in sync with local socio–economic conditions and needs.
4.5.2.2 Convergence of schemes forsocial protection of the urban poor A large number of programmes are being implemented by the Government for upliftment of poor in the country. At present, multiple ministries (e.g. health, education etc) are driving separate initiatives aimed at the poor across rural and urban areas. To increase their effectiveness, convergence in these efforts are required. In addition, ULBs have the potential to emerge as an interface between the Citizenry on one hand and the State and national Government on one hand for ensuring better outcome of these initiatives.
4.5.2.3 Policy/legislative changes required at the state government level
4.5.2.3.1 Re-use treated sewage for industrial applications: Cities should be encouraged (or may be made mandatory) to meet part of their water supply, at least for industrial use, by reusing/recycling waste water. Incentives may be provided to users (through water tariff, property tax etc) to recycle and reuse treated wastewater. These should also be incorporated in building bye-laws for new constructions.
Urban Transport 4.5.3 Quality and Affordable Public Transport
To achieve the stated goals of about 60 percent share of public transport in all motorized trips in the 12th FYP, it is essential to provide a significant boost to the sector. In addition, to the proposed capacity building scheme with a standalone component for urban transport, the NIJNNURM should:
■ Provide for PPP arrangements in bus transport systems based on a gross cost model
■ Launch of a public bicycle sharing program in 40 cities ■ Institute scientific management of intermediate transport like
autos/taxis
79

■ Provision for street hawkers/vendors in the spatial plans to minimise encroachment on the roads meant for urban transport
■ Focus on designing hierarchical road networks, integrated with public transport
■ Improve existing road surface in terms of drainage ■ Direct construction of goods terminals and bye-passes
outside the cities ■ Introduce ITS for mobility planning, traffic management and
enforcement ■ Provide incentives for innovation in urban transport including
development of low cost indigenous technologies tested through pilot projects
■ Development plan to incorporate cycle tracks network with parking facilitiy
4.5.3.1 Policy/legislative changes required at the central government level
4.5.3.1.1 Comprehensive UT Act for legislative support: There is no legislation at present that covers the requirements of urban transport comprehensively. However, such an act is essential and should provide the necessary framework for setting–up UMTAs including clear articulation of its responsibilities, management of safety issues etc (Appendix 19). This central act then can be used by states to frame rules for urban transport. Urban transport should be placed under Concurrent List by amending the constitution to provide constitutional support to the UT Act.
4.5.3.1.2 Consider policy to disincentivise usage of luxury vehicles: Based on the global “polluter pays principle”, it is recommended that an additional urban transport tax may be considered on luxury vehicles. This tax can be levied on an annual basis and can be collected through insurance companies for existing vehicles and directly on the purchase of new luxury vehicles. As the coverage of public transport improves in Indian cities, suitable disincentive to private cars may be introduced. Congestion pricing may also be explored as a means to reduce or stagger traffic on busy corridors and generate revenue for further expansion of public transport. .
80

4.5.3.2 New institutions needed to support provision of quality public transport
Central government level
4.5.3.2.1 Establish a new department of UT in MoUD: Being capital intensive by nature, urban transport will attract the highest share of investment in urban sector in the coming years. To manage this scale and complexity, it is recommended that a separate department should be set up within MoUD, with a full time Secretary in–charge to exclusively focus on urban transport issues and drive implementation across the country.
4.5.3.2.2 Set–up the National Urban Rail Transit Corporation: Central government should form NURTC to assist states in building their MRTS schemes. NURTC should be the Apex body for laying down technical standards and act as a Regulatory body. NURTC can either take up such projects on a turnkey basis or act as general consultants to the SPVs set up by states for executing MRTS projects. Apart from this, NURTC can also help the states with technical evaluation of DPRs, disseminating best practices, training personnel for operation of metro systems, monitoring safety and quality of services in cases where O&M is outsourced. NURTC will also be responsible for research and standardisation for rail transit in the country.
Also a special wing in Research Design and Standards Organisation of Ministry of railways (fully funded by MoUD) may be set up to provide lateral technical support to NURTC.
4.5.3.2.3 Set–up the National Urban Rail Transit Authority: Central government should form NURTA to assist states in building their MRTS schemes. NURTA should be the Apex body for laying down technical standards and act as a Regulatory body. NURTA can either take up such projects on a turnkey basis or act as general consultants to the SPVs set up by states for executing MRTS projects. Apart from this, NURTA can also help the states with technical evaluation of DPRs, disseminating best practices, training personnel for operation of metro systems, monitoring safety and quality of services in cases where O&M is outsourced. NURTA will also be responsible for research and standardisation for rail transit in the country.
Also a special wing in Research Design and Standards Organisation of Ministry of railways (fully funded by MoUD)
81

may be set up to provide lateral technical support to NURTA. ( we may discuss these)
State government level
4.5.3.2.4 Create new departments of UT in state urban development ministries: Similar to the recommended department of urban transport at the MoUD level, states should also institute a dedicated department for urban transport within the Municipal Administration and Urban Development ministry. This will help bring focus on the urban transport agenda for the state at large and key cities in particular.
4.5.3.2.5 Institute a safety commission for rail/guided and road transport: Safety is a critical issue in urban transport. To address this, a state level commission may be set up for performing safety audits of all the rail based mass transit systems in the state. The audit shall be performed in accordance with the guidelines and standards laid down by the recommended NURTA.
4.5.3.2.6 Set–up a safety commission for road transport: Despite the stated goal of increasing the share of public transport, roads will continue to be the backbone of urban transport. A dedicated commission is recommended to perform safety audits of road vehicles, urban roads and hazardous locations to reduce accidents, fatalities and injuries.
4.5.4 Clean and Healthy Environment Promoting green buildings, appliances and closely monitoring and controlling air pollution can go a long way in ensuring a clean environment for the urban citizens. The NIJNNURM should:
■ Develop technology packages suitable for Indian waste, including hazardous non-municipal waste like bio-medicals, paints, injection syringes etc
■ Expand and strengthen pollution monitoring network ■ Incentivise enforcement of air quality monitoring protocol for
collection of credible data ■ Provide R&D support for evolution of green materials and
techniques
82
4.5.4.1 Policy/legislative changes required at the city level
4.5.4.1.1 Regular inspection of environmental performance of buildings: Environmental performance of buildings should be monitored at a regular interval. To achieve this, the city administration should put in place a systematic process with the frequency of inspection clearly defined. This will also require creation of a pool of monitors who have the necessary expertise to validate building performance.
4.5.4.1.2 Empower municipalities to take up green building initiatives: Local bodies should be empowered to take up and execute green building projects. This could be done on similar lines to Pimpri Chinchwad Municipal Corporation (PCMC) model that leveraged GRIHA to provide concessions in the premium charges and property taxes to builders and flat owners qualifying under GRIHA.
83

Appendix 1: Sources of increase in urban population in past years
SOURCE: CENSUS OF INDIA; HIGH POWERED EXPERT COMMITTEE (2011), REPORT ON INDIAN
URBAN INFRASTRUCTURE AND SERVICES. GOVERNMENT OF INDIA
84

Appendix 2: Urbanization level and per capita income relationship
NOTE: PCGSDP STANDS FOR PER CAPITA GROSS STATE DOMESTIC PRODUCT.
SOURCE: ESTIMATES BASED ON CENSUS OF INDIA DATA AND CSO; HIGH POWERED EXPERT COMMITTEE (2011), REPORT ON INDIAN URBAN INFRASTRUCTURE AND SERVICES. GOVERNMENT OF INDIA
85

Appendix 3: Comparison of urban and rural sector productivity
NOTE: THE URBAN PRODUCTIVITY LEVELS FOR 1983-84 ARE DERIVED USING THE URBAN
SHARE OF GDP FOR 1980-81. FOR 2004-05, URBAN SHARE OF GDP IS AN ESTIMATE, BASED ON INTERPOLATION.
SOURCE: CSO AND NSSO, AND ESTIMATES; HIGH POWERED EXPERT COMMITTEE (2011), REPORT ON INDIAN URBAN INFRASTRUCTURE AND SERVICES. GOVERNMENT OF INDIA
86

Appendix 4: Share of urban GDP
SOURCE: CSO AND ELEVENTH FIVE YEAR PLAN; HIGH POWERED EXPERT COMMITTEE (2011),
REPORT ON INDIAN URBAN INFRASTRUCTURE AND SERVICES. GOVERNMENT OF INDIA
87

Appendix 5: Trends in urban poverty
SOURCE: NATIONAL SAMPLE SURVEY ORGANISATION (NSSO) REPORT NO. 508: LEVEL AND
PATTERN OF CONSUMER EXPENDITURE. 2004-05
88

Appendix 6: Unsustainable levels of air pollution Particulate pollution: Tiny particles of less than 10 micron size that go deep into the lungs are more dangerous than the coarser particulate matter. These show persistently high levels. Out of 130 cities monitored in 2008, about 109 cities (83 per cent) have exceeded the annual average standard of 60 microgram per cubic metre for protecting human health (notified in 2009). Severity of pollution varies across regions and cities. According to the air quality classification system developed by the Central Pollution Control Board (CPCB), 70 cities (54 percent) have critical levels that exceed the new annual average standard by 1.5 times; 39 cities have high pollution (1–1.5 times the annual standard), and only 20 cities have recorded low levels, i.e. s 50 per cent below the standard.
GRAPH: STATUS OF PM10 LEVELS Nearly half of the cities (residential areas) are critically polluted
Note: * From 2008 onwards new standard of 60 microgram per cubic metre has been applied
Air quality classification computed on the basis of standard for residential areas.
12. Cities with annual average level more than 50 per cent of the standard is termed as 'critical pollution level',
13. Up to 50 per cent above the standard is termed ‘high pollution level’
14. From 50 per cent of the standard to the standard limit is termed ‘moderate pollution level’
15. Below 50 per cent is termed 'low pollution level’, i.e. from 0-30 _g/m3.
SOURCE: BASED ON CPCB AIR QUALITY STATISTICS
89

GRAPH: PM10 TREND 35 METRO CITIES
SOURCE: ANON 2011, LEVEL OF AIR POLLUTION IN METRO CITIES, MINISTRY OF ENVIRONMENT AND FORESTS, 15-MARCH, 2011
Nitrogen oxide levels are rising: Nitrogen dioxides NO2is emerging as a new health threat. The CPCB’s National Ambient Air Quality Status for 1998 had reported only 5 locations in India that had exceeded the standard for NO2. But by 2008 around 19 monitoring locations exceeded the applicable annual average standard.
GRAPH: STATUS OF NO2 LEVELS
NO2 is an emerging threat in many cities
NOTE: * FROM 2008 ONWARDS NEW STANDARD OF 40 MICROGRAM PER CUBIC METRE HAS BEEN ADOPTED.
SOURCE: BASED ON CPCB DATA
90

When we apply the CPCB's new health based air quality standards for NO2 (40 microgram per cubic metre) the data reveals that as many as 62 locations and about 15 cities exceed the standard. In many other cities NO2 levels are rising steadily, and the levels are higher in the eastern cities. Cities that exceed the annual mean standard are Asansol, Kolkata, Delhi, Jamshedpur and Meerut. However the trend for past three years indicates that NO2 levels are increasing in many cities.
SOURCE: ANON 2011, LEVEL OF AIR POLLUTION IN METRO CITIES, MINISTRY OF ENVIRONMENT AND FORESTS, 15-MARCH, 2011
SUMMARY ■ The national ambient air quality status report by CPCB for 2009 and
2010 is still awaited, but other recent data on annual average levels of SO2, NO2 and PM10 for 35 cities indicates that several cities exceed the PM10 standard and NO2 levels also shows an increase in some cities. Of the total selected 35 metro cities by MOEF, the PM10 levels are below the annual standard of 60 microgram per cubic metre in only three cities namely Chennai, Madurai and Kochi. In terms of annual PM10 levels during 2010 Delhi has the highest level followed by Ludhiana, Amritsar, Allahabad, Kanpur, Lucknow, Meerut, Patna, Faridabad, Agra, Jamshedpur, Asansol, Indore among others.
■ India’s NAAQS is close to WHO’s Interim Target – 1 which is 70 micrograms per cubic metre as annual mean.
91

Appendix 7: Projections for quality of urban service in business as usual scenario
SOURCE: UNITED NATIONS; HANDBOOK OF BENCHMARKS, MINISTRY OF URBAN DEVELOPMENT; W. SMITH, TRANSPORTATION POLICIES AND STRATEGIES IN URBAN INDIA; NATIONAL COUNCIL FOR APPLIED ECONOMIC RESEARCH; MCKINSEY GLOBAL INSTITUTE ANALYSIS; MCKINSEY GLOBAL INSTITUTE (2010), INDIA’S URBAN AWAKENING: BUILDING INCLUSIVE CITIES, SUSTAINING ECONOMIC GROWTH, MCKINSEY AND COMPANY
92

Appendix 8: Potential financing models for metro
93
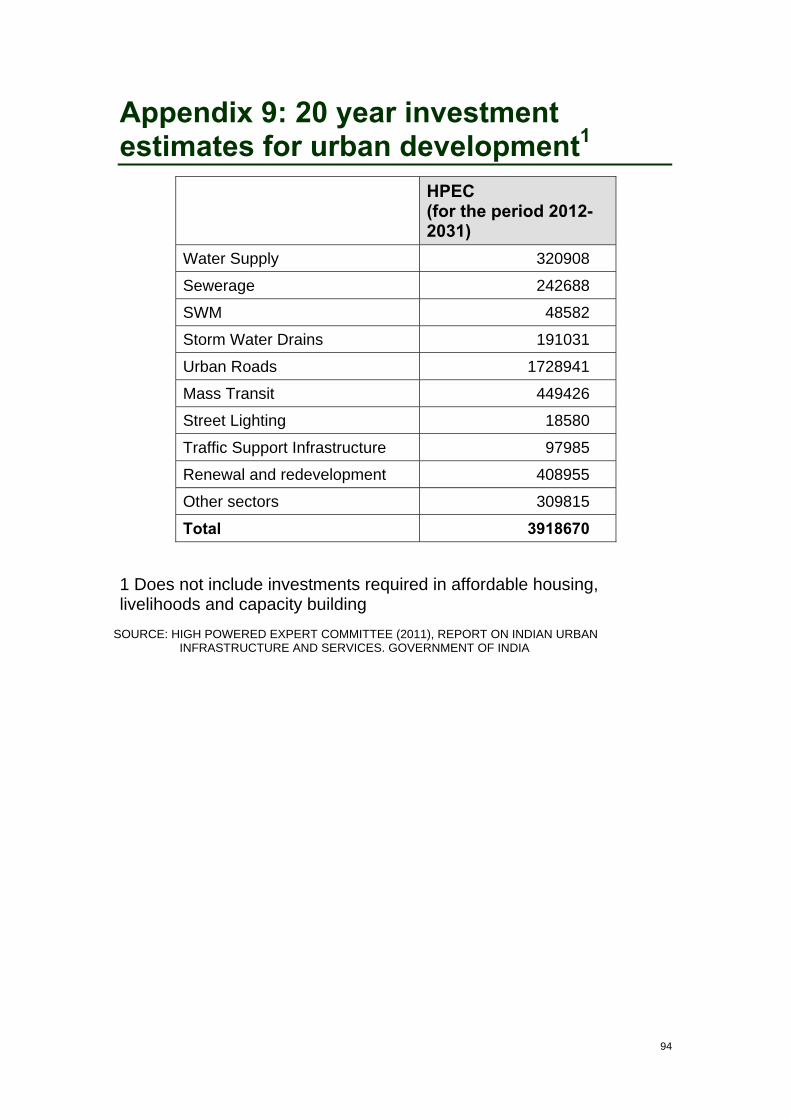
Appendix 9: 20 year investment estimates for urban development1
HPEC (for the period 2012-2031)
Water Supply 320908
Sewerage 242688
SWM 48582
Storm Water Drains 191031
Urban Roads 1728941
Mass Transit 449426
Street Lighting 18580
Traffic Support Infrastructure 97985
Renewal and redevelopment 408955
Other sectors 309815
Total 3918670
1 Does not include investments required in affordable housing, livelihoods and capacity building
SOURCE: HIGH POWERED EXPERT COMMITTEE (2011), REPORT ON INDIAN URBAN INFRASTRUCTURE AND SERVICES. GOVERNMENT OF INDIA
94

95
Appendix 10: Three scenarios for investment in Indian urban development SCENARIO ANALYSIS 1 The following three scenarios are presented in this Report:
■ Scenario 1: Investment targets covered in 20 years using HPEC phasing plan
■ Scenario 2: Investment targets covered in 20 years with backlog covered in 15 years
■ Scenario 3: Investment targets covered in 20 years with backlog covered in 10 years
2 In all the three scenarios presented, it is to be noted that, the annual and cumulative current expenditures are different as a result of the phasing of the investment requirements. The cumulative current expenditure for the 20 year period is highest in scenario 3, where the investments are front loaded in the first 10 years to cover the backlog in services.
Scenario 1: Investment targets covered in 20 years using HPEC phasing plan 3 Table 1 sets out the ULB financing framework if the investments are
to be spread out over 20 years as per the HPEC phasing plan.
4 HPEC financing framework was modified to reflect the mix of instruments that has been used. Estimates for revenue shared taxes have been taken from HPEC report but phased out over 5 years to factor in implementation time lag resulting in some revenues continuing to accrue to para-statals. It is assumed that only 50 per cent of the projected revenue shared taxes will be devolved by the states in the first year of the 12th Plan; 67 per cent in 2nd year; 75 per cent 3rd year; and 100 per cent from the year 4 onwards.

Table 1: Investments over 20 years using HPEC phasing plan
2012-13 2013-14 2014-15 2015-16 2016-17 2017-18 2018-19 2019-20 2020-21 2021-22
Total Revenue 1.19 1.23 1.26 1.32 1.34 1.36 1.39 1.41 1.44 1.46
Own Revenue 0.74 0.83 0.89 1.03 1.05 1.07 1.10 1.12 1.15 1.17
Exclusive Taxes 0.33 0.33 0.34 0.34 0.35 0.35 0.36 0.36 0.37 0.37
Revenue-shared Taxes 0.23 0.31 0.36 0.49 0.50 0.51 0.53 0.54 0.56 0.57
Non-Tax Revenue 0.19 0.19 0.20 0.20 0.21 0.21 0.22 0.22 0.23 0.23
Other Revenue 0.46 0.41 0.37 0.29 0.29 0.29 0.29 0.29 0.29 0.29
Transfers from SFC 0.10 0.10 0.10 0.10 0.10 0.10 0.10 0.10 0.10 0.10
Grants-in-aid from State Governments 0.06 0.06 0.06 0.06 0.06 0.06 0.06 0.06 0.06 0.06
Transfers from CFC 0.08 0.08 0.08 0.08 0.08 0.08 0.08 0.08 0.08 0.08
Grants-in-aid from GoI 0.05 0.05 0.05 0.05 0.05 0.05 0.05 0.05 0.05 0.05
Revenues of entities other than ULBs 0.17 0.12 0.08 0.00 0.00 0.00 0.00 0.00 0.00 0.00
Total Revenue Expenditure 0.90 0.90 0.90 0.90 0.91 0.91 0.92 0.93 0.95 0.96
Annuity Payments 0.00 0.00 0.01 0.02 0.04 0.06 0.10 0.13 0.16 0.20
Debt Repayment 0.02 0.04 0.07 0.09 0.11 0.11 0.11 0.11 0.11 0.11
Revenue reductions on the account of PPP 0.00 0.00 0.00 0.00 0.01 0.01 0.01 0.01 0.02 0.02
Investible surplus of ULBs 0.27 0.29 0.28 0.30 0.28 0.26 0.24 0.22 0.20 0.17
Capital Expenditure 0.75 0.79 0.85 0.90 0.96 0.99 1.03 1.06 1.10 1.14
Deficit(-)/Surplus(+) -0.47 -0.50 -0.56 -0.60 -0.68 -0.73 -0.79 -0.85 -0.91 -0.97
PPP 0.02 0.03 0.05 0.07 0.09 0.10 0.10 0.10 0.11 0.11
Annuity 0.04 0.08 0.12 0.17 0.23 0.24 0.25 0.26 0.26 0.27
Borrowing 0.09 0.09 0.09 0.09 0.09 0.00 0.00 0.00 0.00 0.00
Land based Instruments 0.07 0.07 0.12 0.16 0.17 0.17 0.18 0.19 0.19 0.20
Unfunded Deficit(-) -0.26 -0.23 -0.18 -0.11 -0.10 -0.22 -0.26 -0.30 -0.34 -0.39
* CAPACITY BUILDING AND RENEWAL AND REDEVELOPMENT COSTS INCLUDED UNDER CAPITAL EXPENDITURE.
96

97
TABLE 1: INVESTMENTS OVER 20 YEARS USING HPEC PHASING PLAN (CONTD.)
2022-23 2023-24 2024-25 2025-26 2026-27 2027-28 2028-29 2029-30 2030-31 2031-32
Total Revenue 1.49 1.51 1.54 1.57 1.60 1.63 1.66 1.69 1.72 1.76
Own Revenue 1.20 1.22 1.25 1.28 1.31 1.34 1.37 1.40 1.43 1.47
Exclusive Taxes 0.38 0.38 0.39 0.39 0.40 0.40 0.41 0.41 0.42 0.42
Revenue-shared Taxes 0.59 0.60 0.62 0.64 0.66 0.68 0.70 0.72 0.74 0.77
Non-Tax Revenue 0.24 0.24 0.25 0.25 0.26 0.26 0.27 0.27 0.28 0.28
Other Revenue 0.29 0.29 0.29 0.29 0.29 0.29 0.29 0.29 0.29 0.29
Transfers from SFC 0.10 0.10 0.10 0.10 0.10 0.10 0.10 0.10 0.10 0.10
Grants-in-aid from State Governments 0.06 0.06 0.06 0.06 0.06 0.06 0.06 0.06 0.06 0.06
Transfers from CFC 0.08 0.08 0.08 0.08 0.08 0.08 0.08 0.08 0.08 0.08
Grants-in-aid from GoI 0.05 0.05 0.05 0.05 0.05 0.05 0.05 0.05 0.05 0.05
Revenues of entities other than ULBs 0.00 0.00 0.00 0.00 0.00 0.00 0.00 0.00 0.00 0.00
Total Revenue Expenditure 0.97 0.98 0.99 1.00 1.01 1.01 1.02 1.02 1.02 1.02
Annuity Payments 0.23 0.26 0.29 0.31 0.34 0.36 0.38 0.37 0.36 0.35
Debt Repayment 0.09 0.07 0.04 0.02 0.00 0.11 0.11 0.11 0.11 0.11
Revenue reductions on the account of PPP 0.02 0.02 0.02 0.03 0.03 0.03 0.03 0.03 0.03 0.03
Investible surplus of ULBs 0.18 0.18 0.19 0.21 0.23 0.12 0.13 0.16 0.20 0.25
Capital Expenditure 1.14 1.14 1.14 1.14 1.14 1.14 1.14 1.14 1.14 1.14
Deficit(-)/Surplus(+) -0.97 -0.96 -0.95 -0.93 -0.91 -1.02 -1.01 -0.98 -0.93 -0.89
PPP 0.11 0.11 0.11 0.11 0.11 0.06 0.06 0.05 0.05 0.05
Annuity 0.27 0.27 0.27 0.27 0.27 0.15 0.14 0.13 0.12 0.12
Borrowing 0.00 0.00 0.00 0.00 0.00 0.46 0.00 0.00 0.00 0.00
Land based Instruments 0.20 0.21 0.21 0.21 0.22 0.15 0.15 0.14 0.13 0.13
Unfunded Deficit(-) -0.38 -0.37 -0.35 -0.33 -0.31 -0.19 -0.67 -0.65 -0.63 -0.60

5 In this scenario, a capital investment of Rs. 3.95 lakh crore is envisaged over the next Plan period.
6 Under Scenario 1, given that all other financing instruments have been considered, this unfunded deficit would have to be covered by the Government of India in the form of the next phase of JNNURM, henceforth referred to as NIJNNURM. This would amount to Rs. 78274crore as NIJNNURM for the next Plan Period, or an average of Rs. 15654 crore per annum for the next 5 years.
Scenario 2: Investment targets covered in 20 years with backlog covered in 15 years 7 Table 2 below presents a modified phasing plan to that of the HPEC,
considering an aggressive attempt at covering the service backlog in 15 years and the total investment targets covered in 20-years.
8 In this scenario, a capital investment of Rs. 4.6 lakh crore is envisaged over the next Plan period.
9 After the use of the various financing instruments, ULBs will still face a deficit, an average of 0.35 per cent of GDP over the 12th Plan Period.
10 Under Scenario 2, given that all other financing instruments have been considered, this unfunded deficit would have to be covered by the Government of India in the form of the NIJNNURM. This would amount to about Rs. 1.62 lakh crore as NIJNNURM for the next Plan Period, or an average of Rs. 32,408 crore per annum for the next 5 years.
98

Table 2: Investments over 20 years with backlog covered in 15 years
2012-13 2013-14 2014-15 2015-16 2016-17 2017-18 2018-19 2019-20 2020-21 2021-22
Total Revenue 1.19 1.23 1.26 1.32 1.34 1.36 1.39 1.41 1.44 1.46
Own Revenue 0.74 0.83 0.89 1.03 1.05 1.07 1.10 1.12 1.15 1.17
Exclusive Taxes 0.33 0.33 0.34 0.34 0.35 0.35 0.36 0.36 0.37 0.37
Revenue-shared Taxes 0.23 0.31 0.36 0.49 0.50 0.51 0.53 0.54 0.56 0.57
Non-Tax Revenue 0.19 0.19 0.20 0.20 0.21 0.21 0.22 0.22 0.23 0.23
Other Revenue 0.46 0.41 0.37 0.29 0.29 0.29 0.29 0.29 0.29 0.29
Transfers from SFC 0.10 0.10 0.10 0.10 0.10 0.10 0.10 0.10 0.10 0.10
Grants-in-aid from State Governments 0.06 0.06 0.06 0.06 0.06 0.06 0.06 0.06 0.06 0.06
Transfers from CFC 0.08 0.08 0.08 0.08 0.08 0.08 0.08 0.08 0.08 0.08
Grants-in-aid from GoI 0.05 0.05 0.05 0.05 0.05 0.05 0.05 0.05 0.05 0.05
Revenues of entities other than ULBs 0.17 0.12 0.08 0.00 0.00 0.00 0.00 0.00 0.00 0.00
Total Revenue Expenditure 0.90 0.90 0.91 0.93 0.96 0.98 1.01 1.03 1.06 1.09
Annuity Payments 0.00 0.00 0.01 0.02 0.04 0.06 0.10 0.13 0.16 0.20
Debt Repayment 0.01 0.01 0.02 0.02 0.03 0.03 0.03 0.03 0.03 0.03
Reduction in Revenues on the account of PPP 0.00 0.00 0.00 0.00 0.01 0.01 0.01 0.01 0.02 0.02
Investible surplus of ULBs 0.29 0.32 0.32 0.34 0.31 0.28 0.24 0.20 0.17 0.13
Capital Expenditure 0.78 0.87 0.97 1.08 1.21 1.25 1.30 1.35 1.40 1.45
Deficit(-)/ Surplus(+) -0.50 -0.55 -0.66 -0.75 -0.90 -0.97 -1.06 -1.14 -1.23 -1.32
PPP 0.02 0.03 0.05 0.07 0.09 0.10 0.10 0.10 0.11 0.11
Annuity 0.04 0.08 0.12 0.17 0.23 0.24 0.25 0.26 0.26 0.27
Borrowing 0.03 0.03 0.03 0.03 0.03 0.00 0.00 0.00 0.00 0.00
Land based Instruments 0.07 0.07 0.12 0.16 0.17 0.17 0.18 0.19 0.19 0.20
Unfunded Deficit(-) -0.35 -0.35 -0.34 -0.33 -0.38 -0.47 -0.53 -0.60 -0.67 -0.74
99

100
Table 2: Investments over 20 years with backlog covered in 15 years (contd.)
2022-23 2023-24 2024-25 2025-26 2026-27 2027-28 2028-29 2029-30 2030-31 2031-32
Total Revenue 1.49 1.51 1.54 1.57 1.60 1.63 1.66 1.69 1.72 1.76
Own Revenue 1.20 1.22 1.25 1.28 1.31 1.34 1.37 1.40 1.43 1.47
Exclusive Taxes 0.38 0.38 0.39 0.39 0.40 0.40 0.41 0.41 0.42 0.42
Revenue-shared Taxes 0.59 0.60 0.62 0.64 0.66 0.68 0.70 0.72 0.74 0.77
Non-Tax Revenue 0.24 0.24 0.25 0.25 0.26 0.26 0.27 0.27 0.28 0.28
Other Revenue 0.29 0.29 0.29 0.29 0.29 0.29 0.29 0.29 0.29 0.29
Transfers from SFC 0.10 0.10 0.10 0.10 0.10 0.10 0.10 0.10 0.10 0.10
Grants-in-aid from State Governments 0.06 0.06 0.06 0.06 0.06 0.06 0.06 0.06 0.06 0.06
Transfers from CFC 0.08 0.08 0.08 0.08 0.08 0.08 0.08 0.08 0.08 0.08
Grants-in-aid from GoI 0.05 0.05 0.05 0.05 0.05 0.05 0.05 0.05 0.05 0.05
Revenues of entities other than ULBs 0.00 0.00 0.00 0.00 0.00 0.00 0.00 0.00 0.00 0.00
Total Revenue Expenditure 1.11 1.13 1.15 1.17 1.18 1.15 1.11 1.07 1.03 0.99
Annuity Payments 0.23 0.26 0.29 0.31 0.34 0.36 0.38 0.37 0.36 0.35
Debt Repayment 0.02 0.02 0.01 0.01 0.00 0.03 0.03 0.03 0.03 0.03
Reduction in Revenues on the account of PPP 0.02 0.02 0.02 0.03 0.03 0.03 0.03 0.03 0.03 0.03
Investible surplus of ULBs 0.10 0.08 0.07 0.06 0.05 0.07 0.12 0.19 0.27 0.36
Capital Expenditure 1.48 1.50 1.53 1.56 1.59 0.81 0.75 0.70 0.66 0.62
Deficit(-)/Surplus(+) -1.37 -1.42 -1.46 -1.50 -1.54 -0.74 -0.64 -0.51 -0.38 -0.25
PPP 0.11 0.11 0.11 0.11 0.11 0.06 0.06 0.05 0.05 0.05
Annuity 0.27 0.27 0.27 0.27 0.27 0.15 0.14 0.13 0.12 0.12
Borrowing 0.00 0.00 0.00 0.00 0.00 0.13 0.00 0.00 0.00 0.00
Land based Instruments 0.20 0.21 0.21 0.21 0.22 0.15 0.15 0.14 0.13 0.13
Unfunded Deficit(-) -0.79 -0.83 -0.87 -0.91 -0.94 -0.25 -0.29 -0.19 -0.08 0.03

Scenario 3: Investment targets covered in 20 years with backlog covered in 10 years 11 Table 3 below presents the scenario where the investments are made
over the next 20 years with backlog covered in 10 years.
12 In Scenario 3, a capital investment of Rs. 6.0 lakh crore is envisaged over the next Plan period.
13 After the use of the various financing instruments, ULBs will still face a deficit, an average of 0.70 per cent of GDP over the 12th Plan Period.
14 The unfunded deficit would have to be covered by the Government of India in the form of the NIJNNURM. This would amount to about Rs. 3.3 lakh crore as NIJNNURM for the next Plan Period, or an average of Rs. 66225 crore per annum for the next 5 years.
101

Table 3: Investment targets covered in 20 years with backlog covered in 10 years
2012-13 2013-14 2014-15 2015-16 2016-17 2017-18 2018-19 2019-20 2020-21 2021-22
Total Revenue 1.19 1.23 1.26 1.32 1.34 1.36 1.39 1.41 1.44 1.46
Own Revenue 0.74 0.83 0.89 1.03 1.05 1.07 1.10 1.12 1.15 1.17
Exclusive Taxes 0.33 0.33 0.34 0.34 0.35 0.35 0.36 0.36 0.37 0.37
Revenue-shared Taxes 0.23 0.31 0.36 0.49 0.50 0.51 0.53 0.54 0.56 0.57
Non-Tax Revenue 0.19 0.19 0.20 0.20 0.21 0.21 0.22 0.22 0.23 0.23
Other Revenue 0.46 0.41 0.37 0.29 0.29 0.29 0.29 0.29 0.29 0.29
Transfers from SFC 0.10 0.10 0.10 0.10 0.10 0.10 0.10 0.10 0.10 0.10
Grants-in-aid from State Governments 0.06 0.06 0.06 0.06 0.06 0.06 0.06 0.06 0.06 0.06
Transfers from CFC 0.08 0.08 0.08 0.08 0.08 0.08 0.08 0.08 0.08 0.08
Grants-in-aid from GoI 0.05 0.05 0.05 0.05 0.05 0.05 0.05 0.05 0.05 0.05
Revenues of entities other than ULBs 0.17 0.12 0.08 0.00 0.00 0.00 0.00 0.00 0.00 0.00
Total Revenue Expenditure 0.91 0.93 0.96 1.01 1.08 1.15 1.24 1.34 1.45 1.57
Annuity Payments 0.00 0.00 0.01 0.02 0.04 0.06 0.10 0.13 0.16 0.20
Debt Repayment 0.00 0.00 0.00 0.00 0.00 0.00 0.00 0.00 0.00 0.00
Reduction in Revenues on the account of PPP 0.00 0.00 0.00 0.00 0.01 0.01 0.01 0.01 0.02 0.02
Investible surplus of ULBs 0.28 0.31 0.29 0.28 0.22 0.14 0.04 -0.07 -0.19 -0.32
Capital Expenditure 0.84 1.02 1.22 1.47 1.77 1.97 2.19 2.43 2.70 3.00
Deficit(-)/Surplus(+) -0.56 -0.71 -0.93 -1.19 -1.55 -1.83 -2.15 -2.50 -2.90 -3.33
PPP 0.02 0.03 0.05 0.07 0.09 0.10 0.10 0.10 0.11 0.11
Annuity 0.04 0.08 0.12 0.17 0.23 0.24 0.25 0.26 0.26 0.27
Borrowing 0.00 0.00 0.00 0.00 0.00 0.00 0.00 0.00 0.00 0.00
Land based Instruments 0.07 0.07 0.12 0.16 0.17 0.17 0.18 0.19 0.19 0.20
Unfunded Deficit(-) -0.44 -0.53 -0.65 -0.79 -1.07 -1.33 -1.63 -1.96 -2.33 -2.74
102

103
Table 3: Investment targets covered in 20 years with backlog covered in 10 years (contd.)
2022-23 2023-24 2024-25 2025-26 2026-27 2027-28 2028-29 2029-30 2030-31 2031-32
Total Revenue 1.49 1.51 1.54 1.57 1.60 1.63 1.66 1.69 1.72 1.76
Own Revenue 1.20 1.22 1.25 1.28 1.31 1.34 1.37 1.40 1.43 1.47
Exclusive Taxes 0.38 0.38 0.39 0.39 0.40 0.40 0.41 0.41 0.42 0.42
Revenue-shared Taxes 0.59 0.60 0.62 0.64 0.66 0.68 0.70 0.72 0.74 0.77
Non-Tax Revenue 0.24 0.24 0.25 0.25 0.26 0.26 0.27 0.27 0.28 0.28
Other Revenue 0.29 0.29 0.29 0.29 0.29 0.29 0.29 0.29 0.29 0.29
Transfers from SFC 0.10 0.10 0.10 0.10 0.10 0.10 0.10 0.10 0.10 0.10
Grants-in-aid from State Governments 0.06 0.06 0.06 0.06 0.06 0.06 0.06 0.06 0.06 0.06
Transfers from CFC 0.08 0.08 0.08 0.08 0.08 0.08 0.08 0.08 0.08 0.08
Grants-in-aid from GoI 0.05 0.05 0.05 0.05 0.05 0.05 0.05 0.05 0.05 0.05
Revenues of entities other than ULBs 0.00 0.00 0.00 0.00 0.00 0.00 0.00 0.00 0.00 0.00
Total Revenue Expenditure 1.49 1.41 1.34 1.27 1.20 1.16 1.11 1.07 1.02 0.98
Annuity Payments 0.23 0.26 0.29 0.31 0.34 0.36 0.38 0.37 0.36 0.35
Debt Repayment 0.00 0.00 0.00 0.00 0.00 0.00 0.00 0.00 0.00 0.00
Reduction in Revenues on the account of PPP 0.02 0.02 0.02 0.03 0.03 0.03 0.03 0.03 0.03 0.03
Investible surplus of ULBs -0.25 -0.18 -0.11 -0.04 0.04 0.09 0.14 0.23 0.31 0.40
Capital Expenditure 0.69 0.65 0.61 0.57 0.53 0.81 0.75 0.70 0.66 0.62
Deficit(-)/Surplus(+) -0.94 -0.82 -0.71 -0.61 -0.50 -0.72 -0.61 -0.48 -0.35 -0.21
PPP 0.11 0.11 0.11 0.11 0.11 0.06 0.06 0.05 0.05 0.05
Annuity 0.27 0.27 0.27 0.27 0.27 0.15 0.14 0.13 0.12 0.12
Borrowing 0.00 0.00 0.00 0.00 0.00 0.00 0.00 0.00 0.00 0.00
Land based Instruments 0.20 0.21 0.21 0.21 0.22 0.15 0.15 0.14 0.13 0.13
Unfunded Deficit(-) -0.35 -0.23 -0.12 -0.01 0.10 -0.35 -0.27 -0.15 -0.04 0.08

15 What is emerging from these three scenarios is that the resource mobilization from instruments like PPP, borrowing and land based instruments need to scaled up to fund this magnitude of investment requirements. Under each of the scenarios presented, the share of non-conventional resources that need to be/are likely to be mobilized is different as a result of the capital investment phasing under each of the scenarios. This would require a concerted effort from all tiers of the government.
16 The below table summarises the impact of the investment scenarios on service coverage of water supply, sewerage and urban transport.
Population coverage by 2021 (Million)
Scenario 1 (HPEC)
Scenario 2 (backlog covered in 15 yrs)
Scenario 1 (backlog covered in 10 yrs)
Water Supply 327 374 464
Sewerage 263 357 464
Urban Transport*
95 126 200
*URBAN TRANSPORT ESTIMATES ARE ONLY FOR METROPOLITAN CITIES AND HENCE COVERAGE IS ALSO CALCULATED FOR THESE CLASSES OF CITIES.
104

Appendix 11: Summary of PPP models
Management Contracts
Annuity Payment Contracts
Unitary Charge Contracts
User Fee Based with VGF
Free Standing/ User Fee Based (including those with real estate)/
Water Distribution
Sewerage network
Bulk water supply Sewerage treatment Secondary/ tertiary treatment
Bulk water supply and distribution to industrial areas
MSW collection and transportation MSW disposal (landfill) Integrated MSW project
MSW Treatment
Urban roads Storm water drains
Multi-level Car Parks Bus/ Truck Terminals
Bus services/ BRTS/ Rail based Systems
Bus services/ BRTS/ Rail based Systems
E-Services Parks and gardens
E-Services Parks and gardens E-Services
Street lighting
105

Appendix 12: Calculations and assumptions for investments needed for transport sector URBAN TRANSPORT REQUIREMENT - 12TH PLAN - NETWORK LENGTHS, NO. OF BUSES, FACILITIES
NOTE: FOR UP-GRADATION OF STREET NETWORK, 25 PERCENT OF THE NETWORK IS
SELECTED FOR THE PLAN PERIOD. THE REQUIREMENTS FOR PEDESTRIAN & BICYCLE FACILITIES 100 PERCENT HAS BEEN TAKEN.
106

URBAN TRANSPORT REQUIREMENT - 12TH PLAN – ASSUMPTIONS AND RATES
107

NOTES:
1. ABOUT 30-40 PERCENT TRIPS ARE EXPECTED TO BE PERFORMED ON NMV.
2. SMALLER CITIES WILL HAVE IPTS PERFORMING SIGNIFICANT ROLE AS PUBLIC TRANSPORT
3. 25 PERCENT OF EXISTING ROADS ARE TO BE UPGRADED DURING THE PLAN PERIOD
4. 100 PERCENT OF NETWORK TO BE COVERED WITH PEDESTRIAN /NMT FACILITIES
5. METRO REQUIREMENT IS HIGHER IN LARGE CITIES. MAJOR EXPENDITURES COVERED UPFRONT IN THIS PLAN.
108
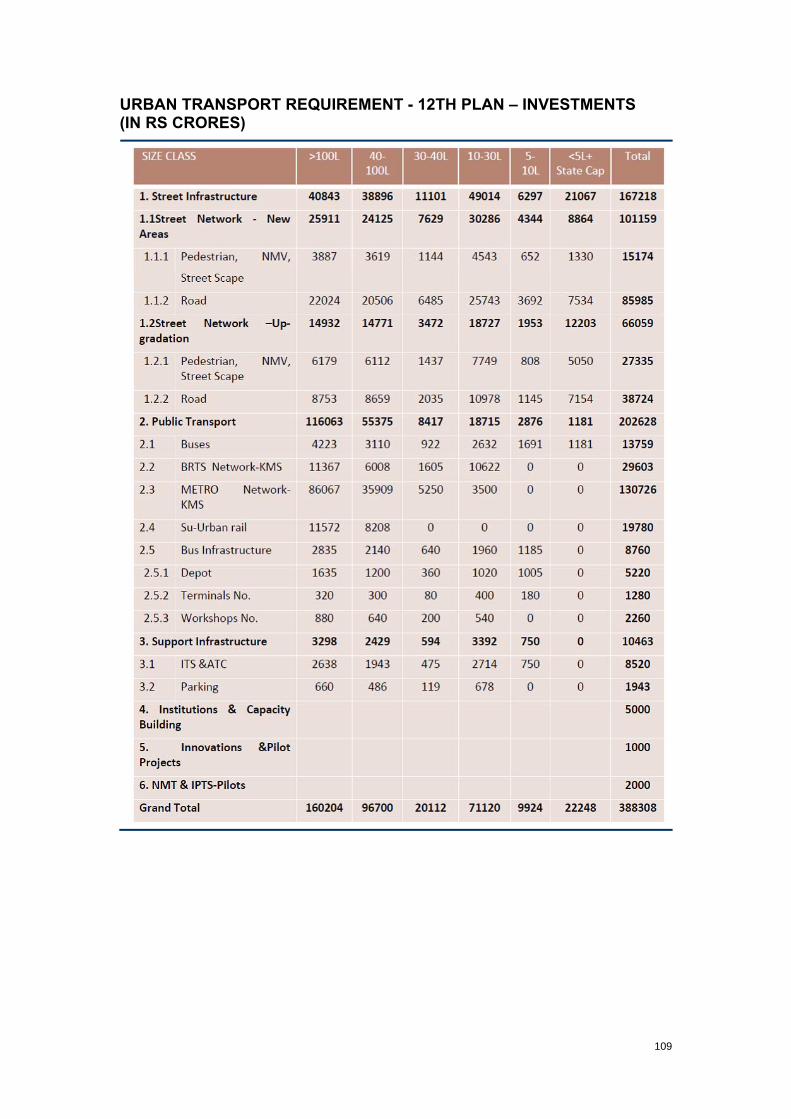
URBAN TRANSPORT REQUIREMENT - 12TH PLAN – INVESTMENTS (IN RS CRORES)
109

URBAN TRANSPORT REQUIREMENT - 12TH PLAN – FUND RESOURCE ALLOCATION (RS IN CR)
110
Appendix 13: Affordable Housing 1.1 INTRODUCTION The long neglected urban India persists with an estimated 25 percent of the urban population subsists below poverty line and majority of them reside in slums and squatters. According to Ministry of Housing and Poverty Alleviation (MHUPA) India has a short fall of 24.71 million and expected to reach 26.5 million by 2012. Most of the housing shortage is for EWS and LIG Sections which does not seem to be getting translated into economic demand due to lower affordability by the poor (99 percent of the housing shortage of 24.7 million as at the end of the 10th Plan pertains to the Economically Weaker Sections (EWS) and Low Income Groups (LIG) sectors). The ever increasing demand for housing and consequent development of slums drags down the productivity of the city and its potential contribution to economic growth.
1.2 ESTIMATES OF INVESTMENT REQUIREMENTS FOR AFFORDABLE HOUSING This section presents the national level investment estimates for the affordable housing. The methodology adopted for the estimation exercise is described below:
■ Projection of the housing shortages. – Population projections made by the High Powered Expert
Committee were used to arrive at the number of urban households (a household size of 5 is assumed)
– The methodology of the Technical Group on Estimation of Housing Shortage for the 11th Five Year Plan, constituted by the Ministry of Housing and Urban Poverty Alleviation, was adopted to arrive at the housing shortages for the 12th Plan Period.
– The Technical Group has projected a shortage of 26.53 million housing units at the end of the 11th plan, i.e. in the year 2011-12. This shortage was taken as the base year shortage at the beginning of the 12th plan. Out of this shortage, the congestion factor contributes to 12.67 million of households and need for fresh housing contributes to 16.29 units. □ Based on the projected urban population in the year (HPEC,
2011) and a household size of 5, the projected number of households for the year 2016-17 is 84.4 million.
□ Pucca housing is assumed to grow at 2.4 per cent per annum annually (basis for this) from the base year. Semi-Pucca and Kutcha housing are assumed to grow at 1.87 and 3.2 per cent per annum annually (assumed to be in the same ratio of 2012
111
as reported by the Technical Group of 11th plan, not clear, are the growth rates the same as assumed in the 11th plan).
■ Projection of the slum housing for RAY – The above estimates summarise the overall housing shortage in
urban areas. Considering the huge backlogs of urban infrastructure as well as housing, separate estimates for housing have been prepared.
– Slum population projections made by the Pronob Sen Committee were used to arrive at the number of urban slum households at the end of the 12th Plan Period (a household size of 5 is assumed).
– Using NSSO (2008-09) data, type of housing in the slums was calculated. □ According to 65th round of NSSO (2008-09), pucca housing in
slum areas is about 57 per cent, semi pucca is about 29 per cent, serviceable Kutcha is about 10 per cent and unserviceable Kutcha is about 3 per cent. These ratios were applied to arrive at the proportion of slum housing in each of these categories for 2011-12.
□ All the semi pucca and kutcha housing are considered for new housing
□ In addition, the problem of congestion within pucca houses will also need to be addressed. The 58th Round of NSSO data shows that in the slums as many as 44 per cent of the homes, with at least one married couple, did not have separate room for the married couple. The same percentage has been applied on the 2011-12 slum housing stock to estimate the number of pucca houses with problems of congestion.
■ Unit cost assumptions for Affordable Housing and RAY – For the estimation purposes, unit cost of Rs. 3.5 lakh has been
considered for housing and Rs. 1.2 lakh for infrastructure. – For upgrading infrastructure in existing slums, a cost of Rs 70000
per household has been assumed, based on the estimates prepared by HPEC (2011).
– The overall investment requirement for affordable housing consist of the following elements
– Cost of constructing fresh housing units @Rs 3.5 lakh – Cost of providing infrastructure for fresh housing units @Rs 1.2
lakh per household – Cost of upgrading infrastructure in existing slums @70000 Rs
per household
112

– Cost of addressing congestion in slums as well as in non slum areas @Rs 60,000 per housing unit
SUMMARY TABLES
Table 1: Investment estimates for Affordable Housing
Slum areas
Non slum areas Total Unit Cost
Total Cost
Units Million Million Million Rs Rs crore
Need for fresh housing units
10.61 5.68 16.29 350000 570150
Incremental housing to address congestion
4.78 7.89 12.67 60000 76020
Provision of infrastructure for new housing units
10.61 5.68 10.61 120000 127320
Up gradation of infrastructure in existing slums
10.85 0.00 10.85 70000 75950
Housing Cost (New+ up gradation) 646170 Infrastructure Cost 203270 Grand Total 849440
113

Table 2: Investment estimates for RAY
RAY 1 RAY 2 RAY 3
250 cities Class I cities (excluding cities covered under RAY 1)
Rest of the cities (1000 cities-RAY 1 cities-RAY 2 cities)
Total Unit Cost Total Cost
Units Million Million Million Million Rs Rs crore
Cities covered
250 444 378
Need for fresh housing units
6.19 1.86 NA 8.04
350000 281538
Incremental housing to address congestion
2.79 0.84 NA 3.62 60000 21739
Provision of infrastructure for new housing units
6.19 1.86 NA 8.04 120000 96527
Up gradation of infrastructure in existing slums
6.34 1.90 1.64 9.87 70000 69093
Total Housing Cost (New housing + incremental housing) 303277
Total Infrastructure Cost 165621
Grand Total 468897
114

Table 3: Investment Estimates for 12th Plan (50 percent of the Total Requirements)
RAY 1 RAY 2 RAY 3 250 cities Class I cities
(excluding cities covered under RAY 1)
Rest of the cities (1000 cities-RAY 1 cities-RAY 2 cities)
Total (Rs crore)
Housing 116663 34976 0.00 151638
Infrastructure
59304 17780 5726 82810
Total 234449
115

Table 4: Financing of RAY for the 12th Plan (Scenario-1)
RAY 1 RAY 2 RAY 3 250
cities Class I cities (excluding cities covered under RAY 1)
Rest of the cities (1000 cities-RAY 1 cities-RAY 2 cities)
Total (Rs crore)
Support to Housing from GoI
RAY Subsidy (@ Rs 75000 per new housing and @35000 up gradation)
28085 8420 0 36505
Interest Subsidy (5 per cent)
14615 4382 0 18997
Subvention to cover the operational cost of the loan (4 per cent of the loan amount)
3543 1062 0 4605
Credit Guarantee Corpus (5 percent NPA and 90 percent Risk Cover)
3986 1195 0 5181
Support to Infrastructure from GoI(@50 per cent of Infrastructure costs)
Support to Infrastructure from GoI
29652 8890 2863 41405
Total Government of India Support
79882 23949 2863 106694
116

Table 5: Financing of RAY for the 12th Plan - Scenario 2 RAY 1 RAY 2 RAY 3 250 cities Class I cities
(excluding cities covered under RAY 1)
Rest of the cities (1000 cities-RAY 1 cities-RAY 2 cities)
Total (Rs crore)
Support to Housing from GoI
RAY Subsidy (@ 50 percent of new housing cost and @35000 up gradation)
59028 17697 0 76725
Interest Subsidy (5 per cent)
9510 2851 0 12361
Subvention to cover the operational cost of the loan (4 per cent of the loan amount)
2305 691 0 2997
Credit Guarantee Corpus (5 percent NPA and 90 percent Risk Cover)
2594 778 0 3371
Support to Infrastructure from GoI(@50 per cent of Infrastructure costs)
Support to Infrastructure from GoI
29652 8890 2863 41405
Total Government of India Support
103089 30906 2863 136859
=
117

Table 6: Financing for the 12th Plan RAY
(scenario 1)
RAY (scenario 2)
non slum areas
Rs crore
Support to Housing from GoI
Housing Subsidy 36505 76725 35108
Interest Subsidy (5 per cent) 18997 12361 13194
Subvention to cover the operational cost of the loan (4 per cent)
4605 2997 3519
Credit Guarantee Corpus (5 percent NPA and 90 percent Risk Cover)
5181 3371 3958
Support to Infrastructure from GoI (@50 per cent of Infrastructure costs)
Support to Infrastructure from GoI
41405 41405 0
Total GoI Support 106694 136859 55779
118

Appendix 14: Estimates of urban PPP potential 1 The following types of PPPs, also highlighted above, have been
considered for the purpose of determining the urban PPP potential:
□ Take or Pay □ User charge based □ User charge + VGF □ Performance based annuity
2 The following assumptions have been applied to arrive at the PPP potential:
□ the 8 core sectors used in the HPEC estimates have been considered
□ only Class I cities (1 lakh and above) have been considered for PPP investments
□ For Class IA, 20 per cent in Year 1, 30 per cent in Year 2, 40 per cent in Year 3, 50 per cent in Year 4 and 60 per cent thereafter of all urban infrastructure projects that are amenable to PPPs. In the case of Class IB and IC, 10 per cent in Year 1, 20 per cent in Year 2, 30 per cent in Year 3, 40 per cent in Year 4 and 50 per cent thereafter of all urban infrastructure projects that are amenable to PPPs.
□ The same assumptions have been used for annuity projects. □ The annuity computation also factors in the debt servicing
component, computed as 20 per cent of the first year annuity amounts will be serviced in Year 3, and 20 per cent of 1st year and 20 per cent of second year in Year 4.
□ It is assumed that capital investments from PPP will be the same in all the scenarios (The potential resources from PPP are worked out based on scenario 2. These are applied across the other scenarios).
3 Currently, roughly 2 per cent of all urban infrastructure projects (about 50 projects) are being under taken in PPP mode. The Working Group’s proposal of about 13-23 per cent (across scenarios) to be done through PPPs, while appearing to be ambitious and reflecting a substantial increase in private sector participation, must be treated as a target that ULBs must work towards. Without such targets and a clear roadmap for achieving these targets, it will be difficult to break away from the current
119

landscape of largely public exchequer led spending on urban infrastructure.
4 While about 13-23 per cent from PPP may be less compared to other infrastructure sectors which are able to attract private capital of about 40-50 per cent of the total requirement, with the multiple challenges of managing projects as well as the political economy, the urban sector would require sufficient cushion to be able to absorb changes to the manner in which infrastructure is planned, financed, built and managed.
5 Historically, the urban sector has largely been financed by the public exchequer, with momentum for private participation only having picked up in the last few years with the thrust provided by JNNURM. The next Plan period should focus on the twin objectives of sustaining the momentum gained of using private players and at the same time devoting sufficient energy towards enhancing capacities of ULBs to be able to manage PPP projects. Towards this end, the Working Group views 13-23 per cent of the total investment coming from the private sector as an ambitious yet achievable target.
120

Appendix 15: Land based Instruments 1 CURRENT LANDSCAPE 1.1 Land based financing has been categorized into 4 categories by
G Peterson in his book Unlocking land values: land lease/ sales, density authorisation, land asset management and developer exactions. Land sale/lease has been the norm in the country with state agencies effecting the transition from agriculture to non-agricultural land for various developments in the urban areas. Density authorisation has been difficult in India as the incidence of the exaction does not have the requisite opportunity for collection. Land asset management has not been effective in our context as the valuation of land assets is neither determined nor updated in any manner. Developer exactions in India have largely been low and have failed to provide for enough for the development and operations of supporting infrastructure. In this context, it is relevant to examine what are the issues affecting the monetization of land for urbanization and seek directions to address the same using case analyses.
1.2 Evidence suggests that land especially in and around urban areas can be tapped for generating resources for supporting urbanization. Sales from MMRDA land auctions in just one complex (Bandra-Kurla complex) in January 2006 was a staggering Rs.23.0 billion, which was two times more than the total infrastructure investment made by the Mumbai Municipal Corporation, during 2004-05 (which was only Rs.10.4 billion) and four times more than MMRDA’s own infrastructure investment in 2004-05 which was a mere Rs.5.4 billion. Some land transactions in recent time have been making news as much for the value they have generated as for the controversies that surround them. If land value is to be tapped for financing urbanization many issues need to be sorted out. While there are changes in the offing with the proposed draft Land Acquisition Act, there are a host of regulatory and process challenges that may need detailed attention.
1.3 There are more than 150 Development Authorities, of them 35 area Metropolitan Development Authorities, and 28 Housing Boards in the country. They have been mandated with the implementation of the Master Plan as formulated by the State Town and Country Planning Departments from time to time. For the purpose, they raise resources by the sale/ lease of Land. They can also collect development charges and some fees for various approvals that they have been charged with.
1.4 The information on the activities of Development Authorities who are primarily responsible for raising revenue through land based
121
instruments has been limited and very few studies have covered the subject of land monetization. The Report on Monetizing Land done for the 13th Finance Commission by Kala Seetharam Sridhar (Land as a Municipal Financing Option: A Pilot Study from India) has presented a case for financing urbanization using land based instruments. As per the study, about 15 per cent of ULB revenues have in the 10 years (1998-99 to 2007-08) come from the sale / lease of land by Development Authorities in the cities of Kolkata, Bangalore and Ahmedabad.
1.5 The Working Group has therefore used a case analysis approach to develop insights into the issues affecting the monetization of land in India.
1.6 The Working group has worked out the contribution from land based instruments on a normative basis ascribing a value to fresh serviced land which is added to the urban land pool every year. If a charge of Rs. 10 per sft of built up land is charged over and above the recovery of basic infrastructure costs, it would contribute Rs. 4403 Cr p.a. which is 0.07 percent of GDP. This works out to be 10 percent of total ULB expenditure. Accordingly, the revenues from land based instruments are assumed to be 5 per cent of total expenditure in first two years of 12th Plan period and 8 per cent in 3rd year of 12th Plan; and subsequently 10 per cent. It is also assumed that the revenues from land based instruments will be the same across the scenarios (taking Scenario 2 as the base).
2 LAND LEASE/ SALES
Green-field development of land for urbanization is taken up by the
Development Authority in the country. Land is usually acquired under the Land Acquisition Act by the District Collector, this is
transferred to the Development Authority on payment of a consideration equivalent to the cost of acquisition, which is usually a time consuming process. Cities in Gujarat and Indore in Madhya Pradesh have innovated with procurement of land for development
on a sharing/ pooling basis. This usually takes less time and is more equitable to the original land-owners. After the procurement of land has been substantial, the Development Authority develops
the land by creating infrastructure in consonance with a Master Plan duly prepared and notified by Town and Country Planning
Department of the state government.
122

Case Study I: Gujarat’s Participative Policy for Landowners in Industrial Estates ■ In the participative policy, besides paying the landowners the
market price of their land, GIDC will share with them the price at which it allots the developed land to the industrial units. Thus the landowners will continue to receive a share in the resources generated from the land of the industrial estate.
■ Under this policy, GIDC will acquire 80-90 per cent of the land with the consent of the landowners. The market price to be offered will be determined by CEPT University, ensuring neutrality and professionalism in price determination.
■ The land falling within 300 metres of the outer limit of the ‘gamtal’ will not be acquired for the estate, but will be left for future expansion of the ‘gamtal’, to let the landowner get the benefit of residential and commercial development of their land.
■ When GIDC transfer the developed plots to industry, it will pay to the landowners 10 per cent difference between its allotment price to industry and the price at which it has purchased the land from them.
■ The landowners will also be given developed commercial plot in the Industrial Estate built on their land to the extent of 1 percent (one per cent) of the land acquired at a token price of Rs.1 per square metre, ensuring the landowner continue to share the fruits of industrialization even after the transfer of the land by GIDC to industry.
■ Such landowner will be entitled to one time financial assistance equivalent to 750 days minimum agricultural wages for loss of livelihood (Rs.75,000).
■ A landholder who becomes a marginal farmer as a result of land acquisition will be entitled to one time financial assistance equivalent to 500 days minimum agricultural wages (Rs.50,000).
■ As per a Gujarat Government policy which allows a landowner whose entire land has been acquired under Land Acquisition Act to be considered as a landowner for up to two years after the acquisition, giving the landowner to purchase alternative land elsewhere within two years.
■ GIDC has, in its new policy, announced an ambitious scheme for capacity building and skill enhancement with a view to enable local people getting ample of employment opportunities.
■ GIDC will, at its cost, sponsor one person between the age of 18 and 45 in each family of landowner for training in ITI in a course for
123

up to 2 years. The trainee will get stipend and expenses for the entire course, which is estimated to be about Rs.70,000 per trainee.
■ GIDC will also endeavour to obtain employment for one member of each landowner family who sell their land for industries.
■ GIDC will partner all the landowners who sell their land at the market price determined by CEPT University and share with them the resources generated from the estate.
■ GIDC will also share the proceeds with the Village Panchayats. 3 percent of the difference between GIDC’s allotment price of the estate and the price at which it has purchased land from the landowners will be deposited in a separate bank account of the Village Panchayat. This amount will be utilized for pro-public projects in the villages.
Case Study II: Scheme No 114 of the Indore Development Authority 2.1 The Working Group studied the case of development of Scheme
no 114 of the Indore Development Authority (IDA) to understand the value that accrues and is available for exaction by the Development Authority.
2.2 IDA’s progress within a period of 5 years from 2003 to 2008 has been very impressive selling more than 6000 plots with land assets growing from 22,106 ha to 37,236 ha and collections from sale / lease growing from Rs. 2.59 crore to Rs. 7.57 crore. Further, IDA has obtained 4000 acres of land on sharing / pooling basis directly from farmers along the Super corridor, in a record time of less than 5 years. Currently, IDA is developing about 500 acres of land every year at an average cost of development of Rs. 3,000/- per sqm.
Scheme No 114, Indore Development Authority
Location
■ The scheme No 114-I is situated 8 kms to the North of Indore on Agra Bombay Road.
Scheme Background
■ Residential Scheme declared on 5.09.1984 by IDA U/S 50(1) Madhya Pradesh Gram Tatha Nagar Nivesh Adhiniyam, 1973.
■ Total Area: 102.110 Ha.
124
Value transition• Agriculture land value (per sqm): Rs. 20/- (1984)
Rs. 7000/- (2011) within Master Plan Area
Rs. 800/- (2011) outside Master Plan Area
• Average value of compensation against acquisition (1984-1992) per sqm:
30 /- ORIGINAL Rs. 200/- AFTER REFERANCE
• Development cost intimated by IDA (1986) per sqm:
Rs. 220/-
• Land Value at commencement of disposal (2002) per sqm:
Rs. 650/-
• Land Value at peak disposal (2005-06) per sqm:
Rs. 8000/- to 10000/-
• Land Value at current disposal (95% of scheme allotted) per sqm:
Rs. 20000/-

■ Planned Area: 91.518 Ha (Other area has been exempted or approved as Co-operative Society and some area is under Court Stay)
Land Use
■ The Net Residential Plot Area was 33.363 Ha (53.18 percent) of the Net Planning Area. The Residential Plots range from 32sqm to 315 Sqm.
Land Assembly
■ Land was assembled by means of Land Acquisition Act 1894. Land was acquired for 91.113 Ha excluding the area exempted from the scheme and area under court stay. Of the total, 17.894 Ha was Nazul Land (government land situated in the area of a municipality) and remaining 73.219 Ha was under Private Ownership.
■ Compensation paid for the acquisition of the land was @ of 7.5 lacs/Ha. Taking total cost of Acquisition to 683 Lakhs. Land was awarded to Indore Development Authority in Dec 1992.
■ But after decision of court in reference cases the acquisition cost was enhanced to 200 /- per sqmt i.e 20 lakhs per Hectare
Land Development
■ Land Development was started in Jan 1995. ■ The Total Development cost of the Scheme was Rs 12.5/sqft on the
Gross Land, which was to the tune of 844 Lacs inclusive of the diversion charges and other administrative charges (e.g. cost incurred in litigations and other procedures). Total Cost of the Scheme was 1527 Lakhs, which was Rs 37.55/sqft for the Net Plotted Land.
■ Development is done by IDA itself with Tendering procedure on Contract basis allocated to private contractors.
Disposal
■ The plots are disposed as per Vyayan Viniyam 1987. A mandatory 15 percent reservation of the developed Plots is for EWS as per State Housing Policy 1995.
■ The land allocation is as follows:
Plot Size %EWS (Blw. 40Sqm) 34.86LIG (40-80Sqm) 5.67MIG (80-120Sqm) 30.99 HIG (Abv. 120Sqm) 28.48 Total 100%
125
Post Disposal
■ IDA to hand over the scheme to IMC for maintenance after once sizable amount of plots had been developed. IDA has no role in Control of Development and enforcement of Building Bye-Laws which vests with IMC.
■ IDA levied maintenance charges of 2 percent of the Premium, which was added to the price.
■ If the allotee kept the plot vacant for more than 2 years from date of allotment he needed to take extension for 2 years with nominal charges failing which the allotment stands cancelled. Additional penalty is taken from allotees who keep vacant the plot for more than 4 years, which is in the form of Rs 500-1000 per year.
Lessons Learnt on Land Lease/Sale ■ Master Plan and its Administration (scale & timing) determine the
outcome of land valuation. The value of a plot of land appreciates considerably by its inclusion in the Master Plan area. Master plan, the most accepted and legally valid planning instrument, needs to be prepared in a standardized fashion with consistency and unfailing regularity. Master Plans need to go beyond the spatial planning and include socio-economic, ecological and other relevant aspects. The scope of the Plan needs to plan for the city in its regional setting and the agency that is responsible for Master Planning should have a regional focus. Land use planning needs to be hierarchical with various regional and local agencies contributing to it.
■ Land value in a developed urban context is substantial and can be tapped for financing urbanization. This value is determined by the interplay of a number of factors, the timing and sequence of each of which produces widely different value realizations. Assembly of land is a time consuming exercise with eventual development also taking anywhere between 1-7 years in the case of Indore. In Haryana, HUDA Constituted in 1977; has developed 30 Urban estates in different towns; totaling 277 Sq Km. averaging 8.14 Sq Km per year. Ahmedabad Urban Development Authority (AUDA) has demonstrated a capacity of executing 122 Sq Km in 33 years at an average of 3.69 Sq Km per year. The details are mentioned in the table below:
Duration Number of schemes Area developed
1978 to 1999 18 2300 ha (23 sq km)
126

1999 to till date 50 5028 ha (50 sq km)
Under preparation 47 4890 ha (~49 sq km)
■ However, urbanization is set to grow and at a pace which may be difficult to keep abreast with. It has been assumed that the pace of urbanization would require about 500 sq km of additional land per year for about 100 high growing urban centers, averaging about 5 sq km per annum per town. To provide for this growth, it is important to put in place a model process for aggregating land for urbanization. Some features of such a model process could include: – Preparation of Master Plan in a standardized manner on a
regular basis – Ensuring land patterns as per approved Master Plans – Sequencing of the land development process to generate
resources for infrastructure creation – Delineate the roles and responsibilities of Urban Development
Authorities and ULBs in the land management process In addition, a well articulated pricing policy for acquisition/ pooling, streamlined dispute resolution mechanism, streamlined diversion process, rationalized delimitation of urban areas, may be some of the other measures that may be required to come up with a model process for procurement and development of land for urbanization.
■ Value realization through land lease by Auction is the preferred mode. Leasing leads to a realization of a fixed sum upfront and a regular annual charge in addition to the premium which may be quoted at the time of the auction. The revenues accruing from such leasing can be utilized for the development of more land in accordance with the Master Plan.
DENSIFICATION AUTHORIZATIONS Value capture builds on the principle that the benefits of urban infrastructure investment are capitalized into land values. Because public investment creates the increase in land values, many land economists argue that government should share in the capital gain to help pay for its investment. Public authorities have used a variety of instruments to capture the gains in land value created by infrastructure investment. Charges against additional FSI and betterment levies, which impose a one-time tax on gains in land value, are one such instrument. Such levies in India have not been very effective largely due to a lack of a defined incidence which would prompt the beneficiaries to
127

come to the Development Authorities for an approval / clearance. Thus even where such levies have been imposed they have not been effectively collected. The case is different in the case of Municipal bodies in Gujarat, Andhra Pradesh or Tamil Nadu which exercise their right to withdraw water supply or other services in case of a default in the payment of such charges. Planned Redensification / redevelopment of an existing area of low density is a measure of capturing value so created on account of the development of infrastructure and concomitant appreciation of real estate in such areas in an organized manner. While such experiments have been taken up in most parts of the country, Madhya Pradesh has formalized this in the form of a Redensification Scheme issued in 2005. The Working Group has studied the Development of Central Business District in South TT Nagar of Bhopal under the Redensification Scheme as a case to understand the value capture that has been possible on account of the development.
Case Study 3: New CBD at Bhopal Case Study on Development of New CBD at Bhopal
Background MP Housing Board (MPHB) had identified 32 acres of land in the heart of the city of Bhopal for redevelopment under the Re-densification Scheme of the Government of Madhya Pradesh (GoMP). There were government houses, schools, other amenities and infrastructure etc. situated on this land. The project involved integrated development – commercial and residential - of this land in public private partnership. The site is situated in South TT Nagar locality of Bhopal abutting the road from New Market to Mata Mandir on the west and Link Road 1 on the north. Project Proposal Initially, redevelopment of this land was approved by the Empowered Committee of GoMP in the following manner:
■ Portion of land that touches the road from New Market to Mata Mandir on the west side and Link Road on the north side, measuring 11.77 Acre was to be developed for commercial activities. ■ portion of land behind the land identified for commercial activity measuring 9.7 Acre was to be
developed as multistoried complexes for residential purposes.
128

Out of the remaining land, 1.3 Acre was to be used for semi public activities and 9.20 Acre for internal development – roads, utilities, parks, green areas. A layout plan for redevelopment of 32 Acre as per the above has been prepared by MPHB. As per the decision of the Empowered committee, out of 32 Acre of land at the site, only 15 Acre of land was taken up for redevelopment under the scope of this Agreement. The development of this 15 Acre was to be largely for commercial purposes. However, while preparing plans for redevelopment of this 15 Acre land, the layout of the entire 32 Acre was prepared and reviewed so that the redevelopment on the balance 17 Acre of land would be in harmony with the development over this 15 Acre.
129

Redensification scheme The Redensification Scheme was formulated by the Housing and Environment Department; Government of Madhya Pradesh in 2005 MPHB was designated as the Executing Agency to implement the project. An Empowered Committee headed by the Chief Secretary was constituted to make decisions with respect to clearances and approvals under the scheme. Model for Development The land of 15 Acre was bid out on 30 years lease to be renewed every 30 years for perpetuity without payment of any lease premium. Master Plan changes There was need to unlock the commercial potential at few sites in the cities through re-densification. There were ageing government houses, schools, other amenities and infrastructure etc. situated on this land. Some of which were occupied. The project involved integrated development- commercial and residential - of this land in PPP. Under the Scheme, the Project has been allotted a global FSI of 2.5 for development The Empowered Committee (EC) conveyed its consent on the commercial and commensurate residential use of the Project to the Town and Country Planning Office for obtaining approval in the Land Use Plan. EC agreed to the shifting of the Primary and Middle School as proposed by MPHB. Developer was free to sub-lease the developed property Concession Terms Development Agreement was structured on Concession cum Lease basis. An initial Concession Period facilitated the Developer to enter the site to construct common infrastructure and to take the necessary approvals upon payment of initial amount. The lease shall become operational only when the total amount bid has been deposited with Government of Madhya Pradesh Valuation and reserve price In 2005, MPHB auctioned a land parcel ~ 5.9 acres in MP Nagar The highest bidder - Dainik Bhaskar - paid a price of Rs. 65 crore for the site In addition, since the said plot was not part of the re-densification scheme, the selected bidder was also required to pay an annual lease rental equivalent to 7.5 percent of the sale value of the project
130

Area 5.9 Acres
Sale Price 65 Rs crore
Land Cost 11 Rs crore per acre
Lease Rent 7.5% of Sale Value
0.83 Rs crore per acre
NPV of Lease Rentals* 3.30 Rs crore per acre
Effective Land Cost 14.30 Rs crore per acre
*Based on an equity cost of capital of 25%; Time period ~30 years
Based on guideline rates issued by the District Collector in 2005, the reserve price was estimated to be Rs. 67 crore, however, given the above illustration, the empowered committee pegged the reserve price for the redevelopment at Rs. 225 crore
Value realization
MPHB transferred the site of the Project – 15 Acre - vacated and provided possession of the site free of encumbrances to the private sector partner for a bid price of Rs. 338 Crores in April 2008.
Lessons Learnt on Densification Authorization It is evident from the case that densification authorizations are better taken up in an organized manner and as per a Master Plan. Our cities need to be enabled for adequate densification. Redevelopment, reconstruction and readjustment cases internationally have shown that:
■ Urban redevelopment policies can check the sprawl ■ Results in a transit supportive urban form
131
■ Enhancement of efficient utilization of building lots by using extra FAR
■ Development right could be transferred to densify the older areas with ageing built stock
■ Redensification needs dedicated effort, pooling mechanisms, robust planning process, infrastructure upgradation and sharing of value.
LAND ASSET MANAGEMENT 4.1 In India, Union Government Departments and Organizations have
been the largest owner of landed property in the country. These lands were mostly acquired / allotted, when these areas were under-developed and there were minimal land requirements from other industries and developmental activities. However, most of these land parcels are in a position to command hefty premia as on date, with land prices having shot up due to the enhanced pace of development. These land parcels also face the threat of illegal occupation, land grabbing, encroachments and permanent alienation. There is, thus, a need to have a transparent and rational framework for management and allocation of Government lands, including through sale, leases and public private partnerships (PPPs).
4.2 Many Union Government Departments and Union Public Sector Undertakings (CPSUs) have framed their own policies with the approval of the competent authority with regard to transfer or alienation of land. There are few CPSUs like NTC, etc., which sold off their surplus land to raise additional funds. Delhi Metro Rail Corporation (DMRC) and the Ministry of Civil Aviation / Airport Authority of India (AAI) also have or are in the process of developing policies to better exploit their land resources. Indian Railways have also established the Rail Land Development Authority (RLDA) as a statutory authority for development of vacant railway land for commercial use for the purpose of generating revenue through non-tariff measures. Ministry of Shipping (MoS) have their own approved land allotment policy with respect to land owned by port trusts.
Land asset management recognizes that the balance sheets of many public entities already are top-heavy with urban land and property assets. At the same time the cities in which the property is located suffer acute infrastructure shortages. Under these conditions it makes sense for public authorities to exchange land assets for infrastructure assets. They can do this by selling or leasing publicly owned land and using the proceeds to finance infrastructure investment. There is a large quantum of land available with CPSUs and other government agencies in urban areas which can be traded
132

in such a manner. However, this needs to be done with caution, also given the lack of a comprehensive database on the availability of land. A comprehensive registry of urban land at all levels of government is needed as a first step towards putting land based instruments to good use. Standardization of valuation processes would be key to monetizing land in a city/urban area.
DEVELOPER EXACTIONS Developer exactions require developers to go beyond installing infrastructure facilities at their own site. They oblige a developer to finance part or all of the costs of external infrastructure needed to deliver public services to the site. Thus developers are required to build subdivision roads and also help pay for major access highways to the area. They may be required to help pay for the trunk lines that deliver water and for wastewater removal and treatment systems. In India, this has taken the form of development charges. While the development authority constructs the infrastructure, it collects these charges from the developers/ end consumers. Often these charges are very low and do not cover the cost of the infrastructure required to develop the area. The main issues that affect the recovery of infrastructure expense through the levy of various charges are listed hereunder:
■ Need to move to a normative calculation of Development charges to hasten the process of Urbanization (currently project to project basis requiring time)
■ Capture adequate share of value for infrastructure development and operation
■ Rationalize the timing and sequence of charges and levies ■ Automatizing the transition from development to O&M is desirable
for continued delivery of effective urban services ■ Collection of multiple charges for the same incidence / event (say,
conversion from agricultural to residential) may be simplified by having a one point banking interface
133

Appendix 16: Lack of explicit demand for capacity building and non-utilization of allocated budget CAPACITY BUILDING PROGRAMME UNDER JNNURM (DECEMBER 2005 – 2012)
S.no Details of capacity building program
Budget allocation (Rs. in lakhs)
Expenditure (Rs. in lakhs)
Jawaharlal Nehru National Urban Renewal Mission (JNNURM)
1 Rapid Training Program 738 346
2 IRMA 11400 70
3 PEARL 85 25
4 Credit Rating of Cities 507 486
5 CDP Reimbursement 1,300 95
6 DPR Reimbursement 23,000 1,727
7 PIU & PMU 3,523 541
8 Regional Capacity Building Hub (Post RTP)
551 -
9 PMES Implementation & Training 50
10 City Volunteer Technical Corps 1,300 -
11 TAG 456 90
12 National Mission Mode Project - E-Governance in Cities
72,700 729
13 Community Participation Fund 9,000 400
14 Reform Appraisal & Monitoring Agencies
Total 1,24,204 4,509
134

ALLOCATION/EXPENDITURE FOR CAPACITY BUILDING – MINISTRY OF HOUSING & URBAN POVERTY ALLEVIATION (DECEMBER 2005 – 2012)
S.no
Details of capacity building PROGRAM
Budget allocation (Rs. In Lakhs)
Expenditure (Rs. in Lakhs)
Basic Services for Urban Poor 1 DPR
Reimbursement 836
859 2 PMU 3,054
5323 PIU 4,412 1,742
4 Third Party Inspection & M it i
1,518
5 Resource Centres
22,000
IHSDP
6 DPR Reimbursement
22
7 PMU
8 PIU 3,690
9 Third Party Inspection & Monitoring
2,217
10 Resource Centres
11 Capacity Building Program
201
Total 37,749 3,334
135

136
CAPACITY BUILDING FOR URBAN LOCAL BODIES (CBULB) PROGRAMME OF MINISTRY OF URBAN DEVELOPMENT 11TH PLAN (NOVEMBER 2009 – MARCH 2012)
S.no Details of capacity building program
Budget allocation (Rs. in Lakhs)
Expenditure (Rs. in Lakhs)
Capacity Building for Urban Local Bodies (CBULB) of MoUD 1 Centers of Excellence 3,668
2,180 2 Service Level
Benchmarking - NTSU 206
103 3 Capacity Building - UD 1,403
877 4 Information System
Improvement Plan 1,360
865 Total
6,637
4,025 Source: Report of the Working Group on Capacity Building

Appendix 17: Component wise break up of proposed investment requirement for capacity building scheme 1.0
OUTPUT 1 - PROFESSIONALIZING URBAN MANAGEMENT THROUGH CREATION OF A MUNICIPAL CADRE, CITY MANAGERS WHO CAN MANAGE AND GOVERN CITIES ESPECIALLY IN URBAN PLANNING, E GOVERNANCE/IT, MUNICIPAL INFRASTRUCTURE AND SERVICE DELIVERY
Activity proposed Deliverable Time frame Unit Unit cost (Rs. in Lakh)
Total cost (Rs. In Lakh)
1.1
Municipal Cadre Creation of Municipal Cadre in all 700 Class-I Cities
2012-14 ULB 7 50,000
1.2 Creation of separate division for Capacity Building within the Ministry of Urban Development and strengthening of CPHEEO and TCPO.
Establishment of a division and enhancement of the manpower of CPHEEO and TCPO
2011-13 - 2,000 2,000
1.3 Comprehensive Capacity Building Framework
Development of Capacity Building Framework at GOI level
2011-12 - - -
1.4 Support for Establishment of a Dedicated Unit for Urban Management at the State Level
Establishment of a Dedicated Unit for Urban Management at the State Level
2012-14 Per state 200 5,600
1.5 Support for Establishment of City Managers Associations at the State level
Support Existing City Managers Association in States like, Karnataka, Tamil Nadu, Maharashtra, Orissa, Madhya Pradesh, Rajasthan, Uttarakhand, Gujarat and in other cases establishment of City Managers Associations
2012-14 One for all North Eastern States and one each for all bigger States
250 4500
137

1.0 OUTPUT 1 - PROFESSIONALIZING URBAN MANAGEMENT THROUGH CREATION OF A MUNICIPAL CADRE, CITY MANAGERS WHO CAN MANAGE AND GOVERN CITIES ESPECIALLY IN URBAN PLANNING, E GOVERNANCE/IT, MUNICIPAL INFRASTRUCTURE AND SERVICE DELIVERY
Total cost
Unit cost (Rs. In Activity proposed Deliverable Time frame Unit (Rs. in Lakh) Lakh)
1.6 Training for approximately 1,00,000 Elected Representatives in all Urban Local Bodies
All the elected representatives in all ULBs are trained in the initial 2 years of their elected term
2012-17 Per Person 0.1 10,000
1.7 Support to GoI for Impact Evaluation of various Urban Development Programmes, including Capacity Building
2012-17 - 2,500 2,500
1.8 Establishment of National Level Database
2012-2014 - 10,000 10,000
2.0 OUTPUT 2 - ENHANCING CAPACITIES/SUPPLY SIDE/AGENCIES TO PROVIDE STATE OF THE ART SKILLS AND RESOURCES TO MEET REQUIRED DEMANDS OF CITY MANAGERS AND ASSOCIATED AGENCIES THEREBY ENHANCING THEIR CAPACITIES TO IMPROVE CITY MANAGEMENT, GOVERNANCE REFORMS, MUNICIPAL INFRASTRUCTURE AND SERVICE DELIVERY
2.1 Creating a Network of 50 Institutions/Centre of Excellence (CoE) to address capacity gaps
Network of institutions to provide specialised capacity
2012-17 Per centre 500 25,000
2.2 Collaborating with Indian Institute of Information Technology(10 Nos) to facilitate use of ICT in urban management
ICT tools developed for Urban Management using ERP,SCM,CRM solutions
2012-17 Per IICT- Region
100 1,000
2.3 Standard Training Module (50 Nos) for Class Room Training to be prepared and given to State Level Training Institutions
Standardised Training Modules developed to meet the requirements of State Level Institutions
2012-14 Module 50 2,500
2.4 Development and implementation of a Training of Trainers Framework
All Trainers covered and trained to meet the demands and needs of Capacity Building
2012-13 - 1,500 1, 500
138

1.0 OUTPUT 1 - PROFESSIONALIZING URBAN MANAGEMENT THROUGH CREATION OF A MUNICIPAL CADRE, CITY MANAGERS WHO CAN MANAGE AND GOVERN CITIES ESPECIALLY IN URBAN PLANNING, E GOVERNANCE/IT, MUNICIPAL INFRASTRUCTURE AND SERVICE DELIVERY
Total cost
Unit cost (Rs. In Activity proposed Deliverable Time frame Unit (Rs. in Lakh) Lakh)
2.5 Reorienting the functioning of three Regional Centres for Urban Environmental Studies(RCUES) and the Centre for Urban Studies(IPA)
RCUES are developed as an important component in the Hub and Spokes Model, by developing them as Regional Hubs
2012-17 per centre 500 2,000
2.7 Support to states (28) for urban centres in Administrative Training Institutes/ existing State Institute of Urban Studies.
Urban Centres established in all the 28 ATIs
2012-17 per state 500 14000
2.8 Re-orientation of activities of National Institute of Urban Affairs(NIUA) including enhancement of Technical skills
Transformation of NIUA as a premier National Think Tank and Knowledge Hub for higher end Capacity Building
2012-17 - 10,00 1,000
2.9 Capacity Building through PPP arrangements with Industrial Training Institutes and other organisations
700 class I cities are networked with ITIs/other institutions to meet skilling and re-skilling for tradesmen and technical personnel in regular operation and maintenance including better septic tank construction, masonry, plumbing, etc.
2012-14 Per City/ Per Institute
50 35,000
2.10 Support for Utility Mapping for Infrastructure Services in selected Cities
2012-17 - 5,000 5,000
3.0 OUTPUT 3 - INSTITUTIONALISE THE USE OF APPROPRIATE TOOLS AND PROCESSES TO ENABLE BETTER PLANNING AND IMPLEMENTATION OF MUNICIPAL INFRASTRUCTURE, SERVICE DELIVERY AND GOVERNANCE REFORMS.
3.1 E-Governance in Class-I Cities All 7 modules covered under the 2012-17 Per city Unit cost will 400,000
139

1.0 OUTPUT 1 - PROFESSIONALIZING URBAN MANAGEMENT THROUGH CREATION OF A MUNICIPAL CADRE, CITY MANAGERS WHO CAN MANAGE AND GOVERN CITIES ESPECIALLY IN URBAN PLANNING, E GOVERNANCE/IT, MUNICIPAL INFRASTRUCTURE AND SERVICE DELIVERY
Total cost
Unit cost (Rs. In Activity proposed Deliverable Time frame Unit (Rs. in Lakh) Lakh) - Need Assessment and Training Need Analysis, Content Development, Training Programme Design and Implementation, Monitoring and Implementation
Reform Programme are to be covered under the E-governance programme in all 700 Class-I Cities
differ from city to city
3.2 Project Development Facility for Urban Areas under PPP
Atleast 100 projects are developed under PPP
2012-17 Per City 100 10,000
3.3 Support for Preparation of Master Plan for all Statutory Towns
Availability of Master Plan to control and aid their development through formulation of spatial planning instrument
2012-17 Per City Million Plus Cities-50-@600 lakhs/city Other Class-I Cities-550@150 lakhs per city Other Cities - 3440@ 22.5 lakhs per city
94,950
3.4 Support for preparation of City Sanitation Plan for all Class-I Cities
700 CSPs formulated 2012-17 per city 20 14,000
3.5 Support for preparation of Information System Improvement Plans and Service Improvement Plans within the SLB Framework
700 ISIPs formulated for investment to pave way for Performance Improvement Plan
2012-17 per class-I City
50 35,000
3.6 Support for Preparation of Resource Mobilisation Plans
Resource Mobilisation Plans created for all 700 Class-I Cities
2012-17 per class-I City
25 17500
140

1.0 OUTPUT 1 - PROFESSIONALIZING URBAN MANAGEMENT THROUGH CREATION OF A MUNICIPAL CADRE, CITY MANAGERS WHO CAN MANAGE AND GOVERN CITIES ESPECIALLY IN URBAN PLANNING, E GOVERNANCE/IT, MUNICIPAL INFRASTRUCTURE AND SERVICE DELIVERY
Total cost
Unit cost (Rs. In Activity proposed Deliverable Time frame Unit (Rs. in Lakh) Lakh)
3.7 Support for Preparation of CDPs CDP prepared for all Class I cities 2012-17 700 25 17,500
3.8 State Finance Commission(SFC)Cells
SFC cells created in all the States to support SFCs
2012-17 Per State 200 5,600
3.9 Support Water Testing Labs and Meter Testing Labs
Setting up of Water Testing Laboratory in all 700 Class-I Cities
2012-14 Per Class-I City
30 21,000
3.10 Support for Initiation of a scheme for rating of water fixtures and fittings
National Rating for Water Fixtures and Fitting Developed and rating done for all the major manufacturers in the country
2012-17 - 1,000 1,000
3.11 Support for pilot projects in Water and Energy Audit
2012-17 100 projects 50 5,000
3.12 Support for Creation of Forum for Citizen's Participation
2012-17 Per Class-I City
30 21,000
3.13 Support for Metropolitan Planning Committees
2012-17 50 2 crore per city
10,000
4.0 OUTPUT 4 - PROVIDE SUSTAINED MECHANISMS FOR KNOWLEDGE SHARING MANAGEMENT ON URBAN DEVELOPMENT/MANAGEMENT THROUGH PEER LEARNING, TAUGHT COURSES, KNOWLEDGE PRODUCTS, EXPERENTIAL LEARNING AND TRAINING.
4.1 Urban Resource Network - a Self Updating Database of Best Practices and Knowledge Platform for Capacity Building Tools
Best Practices developed and disseminated for replication Creation of Capacity Building Tools
2012-13 National - 5,000
4.2 Exposure Visits and Experiential Learning among Urban Managers (within the country and abroad)
All officers in the top operational and administrative hierarchy of ULBs to undergo an exposure visit
2012-17 per city 50 2,500
141

142
1.0
OUTPUT 1 - PROFESSIONALIZING URBAN MANAGEMENT THROUGH CREATION OF A MUNICIPAL CADRE, CITY MANAGERS WHO CAN MANAGE AND GOVERN CITIES ESPECIALLY IN URBAN PLANNING, E GOVERNANCE/IT, MUNICIPAL INFRASTRUCTURE AND SERVICE DELIVERY
Activity proposed Deliverable Time frame Unit Unit cost (Rs. in Lakh)
Total cost (Rs. In Lakh)
4.3 Exposure trip for Mayors of Million Plus Cities (within the country and abroad)
Mayors of million plus cities taken to the selected Cities in the identified countries to foster local governance network and understand democratic functioning of the ULBs in other countries
2012-17 per city 50 2,500
4.4 Creation and fostering of National Urban Innovation Network through support for National Urban Water Awards and Institution of Urban Awards in other areas, like Urban Planning, Governance, Service Improvement, Exemplary performance in Fiscal Management and Citizens Interface
Peer learning will be promoted through information exchange and experience sharing.
2012-14 National Network
25,000 25,000
5.0 OUTPUT 5 - STRENGTHENING INSTITUTIONAL FRAMEWORK TO ENSURE BETTER GOVERNANCE AND SERVICE DELIVERY
5.1 Support for Establishment of Municipal Service Regulator
Municipal Regulator established in all the States to support the functions like Water Supply, SWM and others
2012-17 Per State 200 5,600
Rs 1379750 lakhs

Appendix 18: Draft advisory note for Municipal Cadre Secretary (UD)
Dear ………..
As you are aware, under the Constitution Seventy-Fourth Amendment Act, 1992 there is a mandatory provision for constitution of Municipalities in all the urban areas by the State Government. The Act provides for constitution of three types of municipalities i.e. Nagar Panchayats for a transitional area i.e. to say an area in transition from a rural area to an urban area, a municipal council for a smaller urban area and a municipal corporation for a larger urban area. It further specifies that “a transitional area” “a smaller urban area” or “a larger urban area” means such area as the Governor may, having regard to the population of the area, the density of the population therein, the revenue generated for local administration, the percentage of employment in non-agricultural activities, the economic importance or such other factors as he may deem fit, specify by public notification for this purpose. 2. Provision under the 74th Constitutional Amendment Act and reforms under JNNURM envisage a significant role for the change in the process of planning and delivery of urban infrastructure services. However, in reality several state govt. agencies and parastatals play a significant role. Often these organizations work independent of the ULBs thereby leading to uneasy relations. For instance, Public Health Engineering Departments or Water Boards are responsible for water supply, Town Planning Departments and Urban Development Authorities are responsible for spatial planning and development, Police for traffic management etc. In some cases, several organizations including the ULBs are jointly responsible. For example, maintenances of roads is the responsibility of the both ULBs and State PWD. Such overlapping functions and divided responsibilities make accountability very difficult. It is also important to recognize that most ULBs lack the institutional resources to discharge functions delegate to them under the Constitution. 3. As is well known, most of the ULBs do not have adequate institutional strength and capacities to meet emerging challenges of urban growth particularly in the larger cities. The municipal systems designed decades ago continue even today with only marginal changes. Administrative and structural reforms mandated under JNNURM are to be undertaken by ULBs with a view to revamp the organizational structure and improve the municipal performance. Administrative reforms include streamlining processes for public disclosure, administration of user charges, resource management, personal
143

management, internal systems and processes, citizen interface processes. Structural reforms include creation of cadre of municipal staff for different discipline, decentralization of municipal administration, organizational structure review, and optimization of staffing pattern. As of March 2011, only 21 and 27 cities respectively out of 65 had achieved administrative and structural reforms. 4. All the States have amended the Municipal Acts and laws in conformity with the constitutional provision and ULBs have also been constituted in most of the cities. It was expected that the states will undertake a comprehensive review of the municipal legislation and bring changes in conformity with 74th Constitutional Amendment Act. However, only a few states have taken the opportunity to review the functional domain of the urban local bodies in conformity with the constitutional provision as indicated in the Twelfth Schedule. Kerala, West Bengal, Tamil Nadu, Maharashtra, Gujarat, Haryana, Madhya Pradesh and Punjab have amended the municipal laws comprehensively in terms of Constitution and Composition of municipalities, empowered subject matter Committees, functional domain, structural changes etc. As on March 2011, eleven states transferred all the 18 functions listed in Twelfth Schedule to the urban local bodies, sixteen States had transferred the City Planning functions and 17 States assigned water supply and sanitation functions to the local bodies. In this regard, the situation varies considerably from state to state. Every State needs to conduct a review in this regard and address issues thereof. 5. Since municipalities are required to provide better urban services to the citizens and also to ensure planned development of the urban areas, there is a need to have a dedicated Municipal Cadre to meet the requirement of functional domain of the urban local bodies. Significant increase in urban population as well as financial transactions of ULB and implementation of urban reforms alongwith centrally sponsored/externally aided projects are added responsibilities of ULBs. These challenges necessitate separate municipal cadres in administrative, accounts, engineering and other technical services. Creation of Municipal Cadre will help in improving the performance of the urban local bodies and attract qualified people to the services. A Cadre will facilitate career opportunities for the persons working in the municipalities and sharing of experiences across cities. An analysis of the Recruitment Rules for officers and employees in urban local bodies in the states of Karnataka, Maharashtra, Kerala, West Bengal, Andhra Pradesh and Haryana reveal that these rules mainly contain details on classification of posts, appointing authority for various categories of post, methods of recruitment, minimum qualifications, proportion of appointment by direct recruitment, by promotion or deputation, service conditions etc. The Municipal Bodies are vested with a long list of
144

functions delegated to them by the State Governments under the Municipal Legislation and accordingly the recruitment rules have provisions for appointment of specific posts at various levels. These functions broadly relate to public health, welfare, regulatory aspects, public safety, public works, development activities etc. Provisions in the recruitment rules also specify the requirements of various categories of posts as per the functions of the local bodies. However, there is no clear-cut provision for creation of specific common Municipal Cadre at the State level either in the Municipal legislation or in the Recruitment Rules framed there under. A review of the recruitment rules of some of the states reveals the following: (i) In most of the ULBs, population has been adopted as a norm for creation of posts in various sections of the municipalities in view of the services to be rendered to the population. In some states like Andhra Pradesh, income of ULBs has been adopted as a norm for creation of posts in accounts section of ULB; (ii) In most of the States, Recruitment Rules are applicable for officers and employees connected with affairs of urban local bodies in the state except for the provincial civil service officers appointed to posts in Urban Local Bodies and the persons employed on work charge basis; (iii) For Group A posts, government is the appointing authority. Director Municipal Administration or other officers empowered by the state government is competent to appoint Group B and C Posts. Deputy Commissioner or an officer empowered by the state government is competent to appoint group D posts; (iv) In States like Maharashtra, for the purpose of seniority in respect of A and B category, it is a state wise cadre, for Group C it is region wise cadre and for others it is ULB wise; (v) Generally, direct requirement is through State Public Service Commission or Director of Municipal Administration as the govt. decides from time to time; (vi) In many states there is a common recruitment of officers and staff in the Municipal Corporations and they are transferable while it is separate for municipalities. In Maharashtra, there is a separate Act for each of the Municipal Corporations and other municipalities are constituted under Maharashtra Municipal Council, Nagar Panchayat and Industrial Township Act. Group A officers are liable to be transferred anywhere in the state of Maharashtra. Group B officers are liable to be transferred within the same revenue division and Group C and D officers are liable to be transferred within the same district. 6. As a first step in this direction, State government should therefore, create the municipal cadre considering the following issues:
145

I. Municipal Cadre in sync with functional domain The experiences show that the existing staff in the municipalities is posted in various sections as per the work load from time to time. The need is to assess the functional requirements keeping in view the adequacy or redundancy of staff in a particular section. With the changing requirement of urban areas and as per the provisions of 74th Constitutional Amendment Act particularly the functions listed in twelfth Schedule, the functional domain of urban bodies may be restructured under the following heads:
General Administration & Tax Collection Planning & Regulations Water & Sewerage Service Health Sanitation and Solid Waste Management Public Works and Civic Amenities Urban Forestry & Recreational Infrastructure Urban Poverty Alleviation & Social Welfare Public Education Other Services and Support Functions
Each main head may be sub-divided into sub-heads as per the local conditions and the requirement of municipal staff may be worked out accordingly.
II. Classification of Municipalities The 74th Constitutional Amendment Act provides for three types of municipalities namely Corporation, Municipal Council and Nagar Panchayat. But there is no uniformity in classification of municipalities in the state. Even the nomenclature also varies from state to state. It would be advisable that all the municipalities should be reclassified into three categories i.e. Municipal Corporation for large urban areas of 5 lakh and above; Municipal Council for urban areas of 1 lakh to 5 lakh; and Nagar Panchayat for towns below 1 lakh population. For mega cities we may have Greater Municipal Corporation. This will help in assessing the requirement of municipal cadre in various types of municipalities. III. Norms and Standards for creation of Municipal posts The analysis of existing recruitment rules for urban local bodies in various states reveal that there is no standard norm or criteria of creation for a specific post. For Administrative, Accounts, Technical and Engineering posts norms have been formulated for State Departments which need to be followed while working out requirement of posts in
146

various section of the municipalities. Similarly, hierarchy of posts in different sections should also follow the pattern established in the State Departments. Indicative norms are given in the Annexure. IV. Separate Cadre for Municipal Corporations and other Municipalities As is prevalent in many of the states it would be logical to have separate municipal cadre for Greater Municipal Corporation and the Municipal Corporation considering a complexity of the problems and issues to be addressed in the larger cities. For municipal councils and nagar panchayats there could be a separate municipal cadre as the requirement in these towns is of a lower order. V. Deployment of State Cadre Officer for Chief Executive In most of the state’s, Chief Executives of the Municipal Corporations for the large municipalities are either from the Indian Administrative Services or Provincial Administrative Services which has been working satisfactory particularly in view of the coordination of various functions at city level. This may be kept in view while working out the municipal cadre. VI. Provision for lateral entry The existing recruitment rules have provision for taking the officer on deputation from various state government departments such as public works department, town planning and other technical services. Similar provision is required to be retained while working out the municipal cadre as lateral entry at senior level and would provide benefit of the experiences of the experts for improving the functioning of the urban local bodies. VII. Equivalency in Cadre Post and Service Conditions The recruitment rules of various state government show that the scale of some of the post in urban local bodies are not at par in the state government officers and the service conditions also differ between local bodies and state government department. In order to attract the right kind of talent in the municipal cadre the position of the municipal officer should be at par with the state government officer and the service conditions should also be same. Suggested norms for staffing patterns are given in the annexure (Norms for Staffing Pattern). Creation of municipal cadre will go a long way to ensure orderly, integrated and coordinated development of urban areas. I would therefore urge you to take immediate action to facilitate the creation of a municipal cadre in your State.
…Sd/- Secretary (UD)
147

Norms for Staffing Pattern Norms for employing officers and staff in various grade of municipalities are based on population of the municipalities, levels of services and utilities provided, number of assessies, amount of annual transactions, users and beneficiaries of schemes and programmes and the general workload. Keeping in view the proposed cadre strength in various categories of municipalities in Andhra Pradesh, Haryana, Karnataka, staffing norms are suggested in Municipal Corporation, Municipal Council and Nagar Panchayats. An indicative list of staffing pattern is given in Table.
148
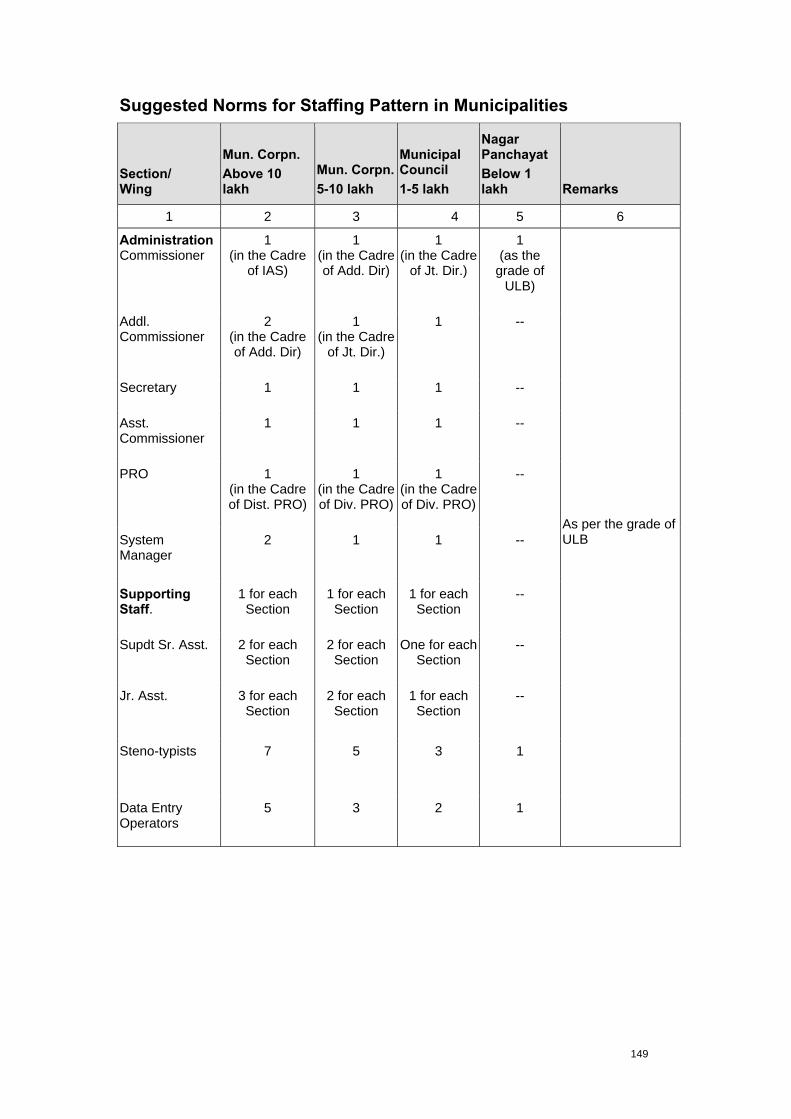
Suggested Norms for Staffing Pattern in Municipalities
Section/ Wing
Mun. Corpn. Above 10 lakh
Mun. Corpn.5-10 lakh
Municipal Council 1-5 lakh
Nagar Panchayat Below 1 lakh Remarks
1 2 3 4 5 6
Administration Commissioner
1 (in the Cadre
of IAS)
1 (in the Cadre of Add. Dir)
1 (in the Cadre
of Jt. Dir.)
1 (as the
grade of ULB)
As per the grade of ULB
Addl. Commissioner
2 (in the Cadre of Add. Dir)
1 (in the Cadre
of Jt. Dir.)
1 --
Secretary 1 1 1 --
Asst. Commissioner
1 1
1 --
PRO 1 (in the Cadre of Dist. PRO)
1 (in the Cadre of Div. PRO)
1 (in the Cadre of Div. PRO)
--
System Manager
2 1 1 --
Supporting Staff.
1 for each Section
1 for each Section
1 for each Section
--
Supdt Sr. Asst. 2 for each Section
2 for each Section
One for each Section
--
Jr. Asst. 3 for each Section
2 for each Section
1 for each Section
--
Steno-typists 7 5 3 1
Data Entry Operators
5 3 2 1
149

Suggested Norms for Staffing Pattern in Municipalities
Section/ Wing Mun. Corpn. Above 10 lakh
Mun. Corpn. 5-10 lakh
Municipal Council 1-5 lakh
Nagar Panchayat Below 1 lakh Remarks
1 2 3 4 5 6
Revenue Addl. Commi-ssioner
1 -- -- --
At least one RI in every ULB
Dy. Commi-ssioner
-- 1 1 --
Rev. Officer 2 for each circle
1 for each circle
1 1 for 4 Bill Collector
Revenue Inspector
1 for 4 Bill Collector
1 for 4 Bill Collector
1 for 4 Bill Collector
1 for 3000 Assess- ments
Bill Collector 1 for 3000 Assessments
1 for 3000 Assess-ments
1 for 3000 Assess-ments
150
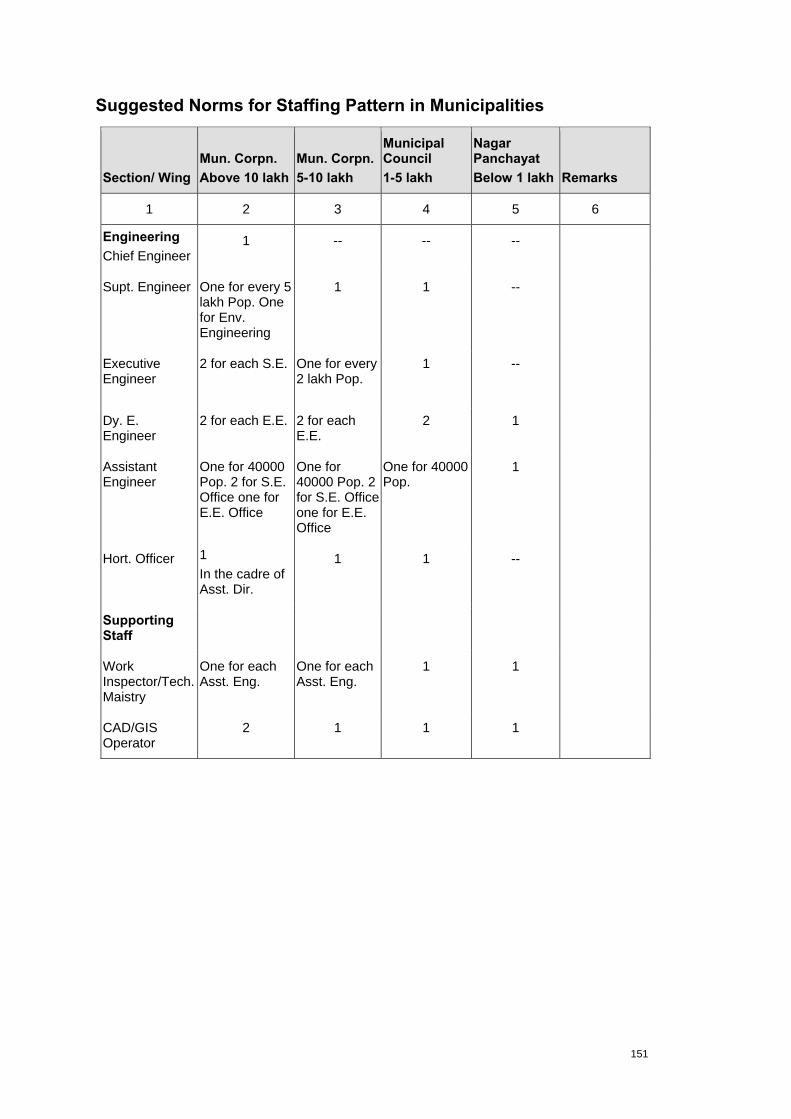
Suggested Norms for Staffing Pattern in Municipalities
Section/ Wing Mun. Corpn. Above 10 lakh
Mun. Corpn.5-10 lakh
Municipal Council 1-5 lakh
Nagar Panchayat Below 1 lakh Remarks
1 2 3 4 5 6
Engineering Chief Engineer
1 -- -- --
Supt. Engineer One for every 5 lakh Pop. One for Env. Engineering
1 1 --
Executive Engineer
2 for each S.E. One for every 2 lakh Pop.
1 --
Dy. E. Engineer
2 for each E.E. 2 for each E.E.
2 1
Assistant Engineer
One for 40000 Pop. 2 for S.E. Office one for E.E. Office
One for 40000 Pop. 2 for S.E. Office one for E.E. Office
One for 40000 Pop.
1
Hort. Officer 1 In the cadre of Asst. Dir.
1 1 --
Supporting Staff
Work Inspector/Tech. Maistry
One for each Asst. Eng.
One for each Asst. Eng.
1 1
CAD/GIS Operator
2 1 1 1
151

Suggested Norms for Staffing Pattern in Municipalities
(Income Range per Annum)
Section/ Wing
Mun. Corpn. Above 10 lakh (Rs. 500 Crore)
Mun. Corpn.5-10 lakh (50-100 Crores)
Municipal Council 1-5 lakh (20-50 Crores)
Nagar Panchayat Below 1 lakh (Upto 3 Crores) Remarks
1 2 3 4 5 6
Accounts Examiner of Accounts
1 1 -- --
The post will be as per income of ULB
Accounts Officer
2 1 1 --
Junior Accounts Officer
2 1 1 --
Sr. Accountant 2 under each JAO
1 under each JAO
1 under each JAO
1
Junior Accountant
2 under each Sr. Acctt.
1 under each Sr. Acctt.
1 under each Sr. Acctt.
1
152

Suggested Norms for Staffing Pattern in Municipalities
Section/ Wing Mun. Corpn. Above 10 lakh
Mun. Corpn.5-10 lakh
Municipal Council 1-5 lakh
Nagar Panchayat Below 1 lakh Remarks
1 2 3 4 5 6
Public Health and Sanitation
In addition one Sanitary Super-visor for each landfill site with supporting staff
Chief Medical Officer
1 1 -- --
Asstt. Medical Officer
One for each circle
One for each circle
-- --
Municipal Health Officer
-- -- 1 1
Sanitary Supervisor
One for every 5 Sanitary Inspector
One for every 5 Sanitary Inspector
One for every 5 Sanitary Inspector
1
Sanitary Inspector
One for every 40000 Pop.
One for every 40000 Pop.
One for every 40000 Pop.
1
Supporting Staff Health Asstt.
One for every one lakh Pop.
One for every one lakh Pop.
One for every lakh Pop.
1
Sanitary Maistry
Three for one Sanitary Inspector
Three for every lakh Pop.
Three for every lakh Pop.
3
One Pump house operator for each shift of 8 hours One person each for Booster Station, Filter Bed, Mother Tank and STP for each shift of 8 hours.
153

Suggested Norms for Staffing Pattern in Municipalities
Section/ Wing Mun. Corpn. Above 10 lakh
Mun. Corpn.5-10 lakh
Municipal Council 1-5 lakh
Nagar Panchayat Below 1 lakh Remarks
1 2 3 4 5 6
Town planning
Chief City Planner
1 -- -- -- In the Cadre of Director
Transport Planner
1 1 -- -- In the Cadre of Dy. Dir.
City Planner One for every 10 lakh Pop.
1 -- -- In the Cadre of Dy. Dir.
Dy. City Planner
Two for each City Planner
2 1 -- In the Cadre of Dy. Dir.
Town Planning Officer
Two for each Dy. City Planner
4 2 1 In the Cadre of Dy. Dir.
Town Planning Supervisor
One for every 60000 Pop.
One for every 60000 Pop.
One for every 60000 Pop.
1
Building Oversees
One for every 40000 Pop.
One for every 40000 Pop.
One for every 40000 Pop.
1
Supporting Staff
CAD/GIS Operator
4 2 2 1
Tracer One for every 2 lakh
One for every 2 lakh
1 1
Town Surv. 4 2 1 1
154

Suggested Norms for Staffing Pattern in Municipalities
Section/Wing Mun. Corpn. Above 10 lakh
Mun. Corpn.5-10 lakh
Municipal Council 1-5 lakh
Nagar Panchayat Below 1 lakh Remarks
1 2 3 4 5 6
Legal wing
Chief Legal Officer
1 -- -- --
Law Officer 2 1 -- --
Dist. Attorney 2 1 -- --
Legal Asst. 4 2 1 1
Fire wing
Chief Fire Officer
1 -- -- --
Div. Fire Officer
2 1 -- --
Sub Fire Officer
4 1 1 1
155

Appendix 19: Proposed scope of Urban Transport Act The proposed urban transport act should facilitate the following;
SETTING UP A DEDICATED AUTHORITY (UMTA)/CELLS FOR URBAN TRANSPORT An autonomous authority; ‘Unified Metropolitan Transport Authority’ in cities with population in excess of one million and an UMTA for a group of smaller cities. When a city is too small to support a professional team by itself, the State Government should provide such a cell either at its HQ or region wise when the State is large.
UMTA should be an executive body governed by a Board made up of heads of various departments in the city, local elected leaders and eminent citizens. It should be supported by a team of professionals with a Chief Executive. UMTA should be based in the city and should report to the MPC/DPC envisaged under the 74th amendment to the constitution for inter-sectoral coordination. Until MPC/DPC is constituted, this authority should report to the relevant department at the State HQ.
The cells for small cities should be located in the Municipality or the Urban development authority depending on who carries the responsibility for UT.
UMTA should be empowered to set up ‘Special Purpose Vehicles’ for various functions or components of urban transport.
UMTA/CELLS shall be empowered to undertake the following tasks;
Policy functions such as formulation of Policy, Strategy and financing for the city
Regulatory Functions excluding those currently assigned to RTOs under the Motor Vehicles act such as Setting Standards, adherence to safety standards, adherence to environmental standards, Fixation of fares/tariffs. Registration, Licensing, Inspection and Testing of vehicles and drivers and Enforcement of rules and regulations (Including removal of Encroachments) is presently the job of the transport department and will continue to be so.
Integrated and holistic planning for urban transport such as comprehensive integrated transport planning of all components of Urban Transport on a city/agglomeration wide basis for implementation including Integrated land-use transport planning with inputs from the urban development authority. This will include planning for an integrated
156

city wide multimodal public transport system for the city, mass rapid transit, planning of bus routes, terminals and interchange points, intermediate public transport, NMT and Transport Demand Management. It will also plan goods movement in the city.
Planning of road network and associated infrastructure in conjunction with planning of city wide public transport system. Infrastructure includes roads and associated facilities such as road furniture, Traffic Signals, Road Intersections, Flyovers, Grade Separators, Bridges, Bye Passes and facilities for Pedestrians, Bicycles, and Terminals for Inter-modal Transfers and Parking.
Organizing and coordinating services i.e. franchising/route allocation, Contract Monitoring, coordination of services, Ensuring supply of services to meet demand, Provisioning of new supplies, Monitor the work assigned to implementing agencies. All service providers including rail transit and BRT will be controlled by UMTA. Transport department and Municipality should issue permits to buses, Para transit and personalized transports advised by UMTA. (Note: Construction, operation and maintenance of mass rapid transit modes, bus services and all other infrastructure will continue through existing city agencies.)
Common Services such as Inter- modal coordination and integration, Resolution of day to day matters, Dispute resolution, Public relations, Security services, Management of revenue sharing arrangement. Provision and management of common facilities i.e. depots and terminals, ‘Passenger Information System’, integrated ticketing, data management, Management of multimodal Interchanges, Last mile connectivity, planning movements around MRT stations, co-ordination with other agencies, and planning of future extensions.
Traffic Engineering and Management; traffic police should be responsible for enforcement. The planning of traffic engineering and management measures should be with UMTA/cells. The road markings and installation of traffic signs should continue with the Municipal Corporation and the Public Works Department.
Safety, security, environment, education and training and the need to conserve energy are important and crucial issues that need coordinated and dedicated attention.
Miscellaneous such as Capacity building to upgrade skills of city officials, Creating a Date base for the city, Participating in country wide Research, Technology upgrade and use of Technology to manage urban transport.
157

FINANCIAL MATTERS UMTA shall be empowered to undertake the following tasks;
Receive all funds for providing urban transport services and infrastructure and allocating them to various city agencies to implement/operate all UT related activities as per a phased plan and prioritization of projects
Raise capital; acquire, hold and develop land; utilize the space on its land for commercial purpose; lease the properties developed by it; carry out all incidental and ancillary activities
Fix its fare tariff and revise it from time to time.
Receive loans and grants by Central/State Government, maintain the necessary reserve funds and publish its accounts that will be audited by the appropriate authority.
Determine Liability of the Authority in cases of death and injury to passengers, and the procedure of determination of compensation.
Impose penalties for offences and irregularities concerning travel without proper ticket, drunkenness, smoking, making nuisance, obstructing UT services, attempting to cause hurt to the traveling public, endangering their safety, carrying of dangerous and offensive goods and destroying properties of the Authority.
Setting up co-ordination committees,
The act should exempt the Authority from electricity tax, income tax, and stamp duty, taxes by local bodies and introduction of dedicated levies (through governmental action) on non-user beneficiaries.
SAFETY ISSUES Act should specify appointment of commissioners of safety who would inspect the fitness of the UT system and recommend sanctioning their opening for public carriage
Act should detail the powers of Government to sanction opening of MRT system, closing an opened section of MRT and its re-opening after fulfillment of conditions laid down for the purpose.
Act should specify the requirement to keep accident records in a specific format and to carry out enquires into accidents
158

Annexure A: Reducing Poverty In Urban India: Select State-Level Approaches Under the 74th Constitution Amendment Act, urban poverty alleviation has been entrusted to ULBs, as per the XII Schedule. However, most of the ULBs lack the financial resources to provide basic services or undertake comprehensive poverty alleviation programs. Nevertheless, various State governments including Andhra Pradesh (MEPMA) Kerala (Kudumbashree) and Gujarat (UMEED) etc; have evolved innovative solutions to creating choices for the urban poor through various approaches for urban poverty alleviation. A common element in these approaches has been the adoption of a Mission approach, focus on building community structures and integration of skills & livelihoods as central components of the program.
MISSION FOR THE ELIMINATION OF POVERTY IN MUNICIPAL AREAS (MEPMA), GOVERNMENT OF ANDHRA PRADESH Andhra Pradesh Urban Services for the Poor (APUSP), a flagship programme (2000-08) of the Government of Andhra Pradesh addressed the challenges of municipal service delivery in 42 class 1 towns and resulted in improvements in livelihoods and access to basic services for about 3 million poor people in the slums of Andhra Pradesh. The State Government of Andhra Pradesh scaled up APUSP reforms across the state through creation of a Mission for the Elimination of Poverty in Municipal Areas (MEPMA).MEPMA is nodal agency for convergence of all services targeted towards the urban poor (Youth welfare, Minority, BC, SC, ST, Labour, Health, Women & Child welfare, Civil Supplies etc.), RAY, and the Street Vendors Policy among others
The mission adopted the following strategy to converge with various programmes:
■ Building organizations of the poor as CBOs ■ Empowering the poor by building their capacities ■ Creating highly trained social capital at grass root level in health,
education, livelihoods, vulnerability etc. ■ Access to Credit for the poor by facilitating interface between CBOs
and bankers (Town Level Bankers committee with SHGs) ■ Taking up placement linked livelihood programmes on continuous
basis; and
159

■ Services under 7-point Charter (Security of land tenure, improved housing, sanitation, water supply, health, education & social security system), etc.
The progress under this Mission has been remarkable and nearly, 25 lakh members are involved in 2.5 lakh Self Help Groups spread across all the municipalities in the State. 90 percent percent of the urban poor living in 7520 Slums in the State have been organized into SHGs. Bank linkages of Rs. 1481.08 crores have been established. Around 5100 micro-enterprises have been grounded
Kudumbashree- State Poverty Eradication Mission, Government of Kerala Kudumbashree is a State Poverty Eradication Mission of Government of Kerala, launched in May 1998. It seeks to eradicate absolute poverty through concerted community action under the leadership of local governments, by facilitating organization of the poor for combining self-help with demand-led convergence of available services and resources to tackle the multiple dimensions and manifestations of poverty, holistically.
It is one of the largest women's movement in Asia, with nearly, 37.37 lakh poor families brought under the community based organisations (CBOs) consisting of 2.05 lakh Neighbourhood Groups (NHGs), 17,578 Area Development Societies (ADSs) and 1,061 Community Development Societies (CDSs) both in rural & urban. The Mission has mobilized a sum of Rs. 1,688 crores as thrift and disbursed loans amounting to Rs.4,195 crores to the members of NHGs, and assisted more than 25 thousand women to establish their individual enterprises in urban areas.
Approach adopted for Urban Poverty Alleviation by both the Missions Both the models emphasize the need for bottom-up & convergent approach for urban poverty alleviation through building and empowering organizations of the poor.
160

Livelihood Generation Initiatives by Government of Gujarat (UMEED)
UMEED is an ongoing initiative under the Rs 13,000-crore Garib Samruddhi Yojana of the Gujarat Government82. The program aims at achieving sustained reduction in the vulnerability and poverty of the poor. In 2005, SAATH partnered with Ahmedabad Municipal Corporation and American India Foundation (AIF) to pilot an innovative employability-training program called “UDAAN,” aimed at underprivileged youth ages 18 to 35 years. UDAAN successfully trained and placed over 900 youth in service sector domains like customer relations and sales, hotel management, bed side patient attendant, and others.
After the successful pilot of UDAAN, on recommendation of the Government of Gujarat to replicate the program across all major towns of Gujarat, it was renamed “UMEED”. The program runs on a Public-
161

Private-Partnership mode, & is jointly run by four organizations- SAATH, CAP Foundation, Aid-et-Action and Skill Pro Foundation. The program adopts the following beneficiary selection criteria:
■ The age of the student should be in the range of 18-35 years. ■ The minimum qualification of the aspirant should be at least 7th
class. Table: Below shows the employability model adopted by UMEED for training
Based on the market scan, the program delivers trainings to youth from vulnerable families across Gujarat in areas like business process outsourcing, bedside patient assistance, customer relations, information technology, life skills like English, time and budget managements, and then places graduates at Indian companies. The three-month training program costs Rs. 4,500. Beneficiaries pay Rs. 500 towards the cost, while the rest of it is born by donors and the government. Over 19,000 youth have been trained & placed in north and central Gujarat in 46 training centers. Placement rates are as high as 85 percent and average starting salaries are Rs. 3,000 per month. SOURCE: HTTP://WWW.SAATH.ORG/SAATH/INDEX.PHP?OPTION=COM_CONTENT&VIEW=
ARTICLE&ID = 71&ITEMID=78
Rajasthan Mission on Skill and Livelihoods (RMoL) A similar initiative has been undertaken by Government of Rajasthan named “Rajasthan Mission on Skill and Livelihoods (RMoL)83”, which
162

aims at creating a large number of livelihood opportunities for the poor, increasing labour force and to increase the income levels of working poor in the state. The mission runs on a Public-Private-Partnership mode, and collaborates with the government departments such as Technical Education Department, Fisheries Department, Agriculture Department of Labour and Employment Department, as well as with NGOs and other national and international organizations.
163

Annexure B: Cases studies on urban PPPs 1. 24X7 WATER SUPPLY IN 3 CITIES OF KARNATAKA
CASE OVERVIEW Country: India
Centre/State/ULB: 29 select wards in three pilot cities of Gulbarga, Belgaum and Hubli-Dharwad, Karnataka
Sector: Urban Basic Services Sub-Sector: Water Supply
Award Date: April 2005
Type of concession: Performance based management contract. Project preparation (Stage I) and contracting out of construction (Stage II) within a period of 1 year 9 months followed by operation and maintenance (O&M) for 2 years
Stakeholders:
Contracting Authority
Karnataka Urban Water Supply and Drainage Board (KUWSDB) Karnataka Urban Infrastructure Development Finance Company Limited (KUIDFC) Municipal administrations of Gulbarga, Belgaum and Hubli-Dharwad
Concessionaire Joint Venture between Compagnie Generale Des Eaux (CGE) and Seureca
Oversight Arrangement
Concessioning Authority through a technical auditor – Fichtner Consulting Engineers India Private Limited
Present Status of Project: Initial stages were delayed and O&M began in mid 2008
Project timeline
2000 World Bank project (technical and financial assistance) for water supply and sewerage in northern districts of Karnataka, with KUIDFC as the nodal agency
2002 Initiation of the Karnataka Urban Water Sector Improvement Project (KUWASIP)
2003-04 Conduct of a two stage competitive bidding process
164

2005 Selection of Concessionaire and commencement of preparatory stage by the Concessionaire
2008 Completion of stages I and II and commencement of O&M stage
PPP CONTEXT
Enabling environment Constitution of the KUIDFC in 1993 as a public company with the mandate to assist Urban Local Bodies (ULBs) in the State for planning, financing and developing urban infrastructure. KUIDFC acts as the State nodal agency for anchoring externally aided projects in infrastructure.
Commencement of World Bank (WB) project (financial and technical assistance) in 2000, for addressing institutional/infrastructural deficiencies in the neglected northern districts of Karnataka – including a Water Supply and Sanitation Component. The project envisaged development of management contracts, wherein private operators would undertake planning, design and management of services in various ULBs in these districts. KUIDFC was the nodal agency for the project.
Initiation of the Karnataka Urban Water Sector Improvement Project (KUWASIP) by KUIDFC in 2002 under the WB programme, and decision to demonstrate 24X7 supply through a pilot project (Phase I) in three cities of Gulbarga, Belgaum and Hubli-Dharwad. The project was aligned with the strategies enunciated by the Urban Drinking Water and Sanitation Policy (2002) of the Government of Karnataka.
Amendment of the Karnataka Municipal Corporations Act in January 2005, making provisions for private sector participation in municipal water supply and allowing deputation of ULB employees to private companies in case of PPP projects.
Sectoral context Coverage of water supply (average) in the 3 pilot cities was as low as 50 percent. Per capita consumption in Gulbarga was 46 litres/capita/day (LPCD) and that in the other 2 cities about 123 LPCD, as against the accepted standard of 135 LPCD.
Service reliability was low with average supply in the range of 2-6 hours of water supply once in 3-5 days
The system was also plagued with revenue losses due to lack of consumption-based billing, collection inefficiencies and dilapidation of existing supply systems leading to high operating costs.
165
PROJECT DEVELOPMENT
Project conceptualization KUWASIP was to be piloted in select wards of 3 cities of Gulbarga, Belgaum and Hubli-Dharwad in Phase I and subsequently scaled up in Phase II to cover these cities entirely and include other cities.
Water sector PPPs typically present risks such as lack of adequate/accurate information regarding the existing systems leading to inaccurate investment and revenue forecasts. In order to de-risk the project for the private sector, the project was envisaged as a management contract – involving the private party from the preparatory stage itself and engaging their services for planning, contracting out of capital works and operation and maintenance (O&M) - without passing on the investment or revenue risk. Assets remained with the ULBs, Concessionaire was not responsible for investments or tariff fixation, and even during the O&M phase, the Concessionaire was to carry out operations through ULB staff deputed for the project period.
Role of the private sector was to demonstrate feasibility of 24X7 services in the pilot zones through the following stages:
Stage I: Conducting background studies, establish conditions and needs and developing an optimum ‘Improvement plan’.
Stage II: Procurement of contractors for carrying out works as envisaged within the ‘Improvement plan’ and management of such contracts
Stage III: Conducting O&M of the new system
Capital Expenditure (Capex) permissible in Phase II was capped at Rs.42 Crore by the Concessioning authority based on internal estimates of KUWSDB and actual availability of funds, setting a limit within which the Concessionaire was to suggest strategic improvements so as to achieve specific output targets.
Project development The project structure was formulated by KUIDFC, with assistance from the WB and detailed project development was conducted through a Transaction Advisor4 . A tariff design study for continuous water supply was carried out in the pilot cities and the tariff structure was reformed, replacing the prevalent system of flat rates with a consumption-based telescopic system.
4Infrastructure Development Corporation (Karnataka) Limited (iDeCK)
166

A rigorous process of sensitization of users to the new tariff regime was undertaken through ‘mock bills’, which were served alongside the flat rate bills for a period of 6 months. Stakeholder workshops were also organized, attended by WB staff and senior officers from the Government of Karnataka and the KUIDFC
Procurement procedure Procurement was based on a global competitive bid under the guidelines of the World Bank. A two stage bidding process (qualification followed by selection) was followed, with the lowest quote for O&M fee as the bid parameter. The project was awarded in February 2005 to a Joint Venture between Compagnie Generale Des Eaux and Seureca (both subsidiaries of Veolia Water) based on their quote of Rs.28 Crore (of which Rs.22.4 Crore was fixed remuneration and Rs.5.6 Crore was the maximum allowable bonus).
CONTRACTUAL ARRANGEMENTS
Proposed Contractual Structure A single contract was signed for all three ULBs
167

MAN
UFAC
TURE
RW
ater
Met
ers
IT C
ONS
ULTA
NTB&
C So
ftwar
e
CONT
RACT
OR
Layin
g of
pip
elin
es
Operator output obligations Implementation was structured into three stages of which the first two (preparation and construction) were to be completed within a period of 1 year and 9 months, followed by the third stage of O&M for a period of 2 years
Preparatory Stage
Undertaking all necessary surveys including topography study, door to door customer survey, demand estimation, network information and need identification. Preparation of an Improvement Plan for achieving the following targets (Capex not exceeding Rs.42 Crore):
Noda
l age
ncy
for t
he K
UWAS
IP
proj
ect u
nder
the
WB
prog
ram
me
KUID
FC
Stat
e ag
ency
for w
ater
sup
ply
and
drai
nage
KUW
SDB
GUL
BARG
APA
RTIC
IPAT
ING
ULB
BELG
AUM
PART
ICIP
ATIN
G U
LB
HUBL
I-DHA
RWAD
PART
ICIP
ATIN
G U
LB
Concessioning Authority
Stag
e 1:
Prep
arat
ory
stud
ies
and
deve
lopm
ent o
f ‘Im
prov
emen
t Pla
n’
JV B
ETW
EEN
CG
E-SE
UREC
A
Stag
e 2:
Cont
ract
ing
out w
orks
pl
anne
d un
der
‘Impr
ovem
ent P
lan’
Max
Cap
ex –
42 C
rore
Stag
e 3:
O&M
of t
he n
ew s
yste
m
Conc
essi
onai
re
60%
ass
ured
O&M
fe
e pa
ymen
t
Select
CONC
ESSI
ON
AGRE
EMEN
T
Colle
ctin
g an
d tra
nsfe
rring
use
r ch
arge
reve
nue
Manage
40%
per
form
ance
ba
sed
fee
paym
ent
24X7
sup
ply
USER
S
Paym
ent o
f bills
Paym
ent o
f fee
s
Stti
df
il
tit
ifft
INDE
PEND
ENT
AUDI
TOR
Mon
itor p
roje
ct p
rogr
ess
Repo
rting
24%GoK WB
76%Funding for KUWASIP
168

Provision of continuous (24X7) water supply at adequate pressure
Reduction of systemic water losses
sumers
oftware
Metering and meter reading of all con
Development of Billing and Collection (B&C) S
Development of customer database and provision of Customer Services
Construction Stage
Procurement of contractors for undertaking following
ing of pipelines and
er for Water meters and
ltant for development of B&C
works envisaged under the Improvement Plan and management of such works:
Selection of contractor for laymonitoring of the work
Selection of manufacturprocurement of meters
Selection of an IT consusoftware and its installation
O&M Stage and meet the following
24X7 supply at adequate pressure to all
12 hours and no
thly billing of all
onsumers
d customer
ace within 24
bligations of the Concessioning Authority r all Capital and
to the
Undertake O&M of the systemtargets:
Ensuringconnected properties and stand posts
Emergency stoppages – not to exceed more than 4 instances in a year
Metering, meter reading and monconsumers using B&C Software
Collection of user charges from c
Reduction of systemic water losses to 20 litres/connection/day within 2 years
Address new connection requests ancomplaints within a specified period
Repairing leaks appearing on the surfhours
OThe Concessioning Authority was responsible foOperating Expenditure (Opex), timely hand over of infrastructure Concessionaire, deputation of ULB staff to the Operator and setting tariffs.
169

Regulatory and monitoring arrangements The project was monitored as per contract by KUWSDB and KUIDFC,
ulting Engineers India
le for all Capex (not ore) and Opex. The project was funded partly by the partly through State Government grants (24
s
a to the system
60 percent of the fixed remuneration of Rs.22.4 Crore was paid as a d
through a technical auditor, M/s Fichtner ConsPrivate Limited, appointed for the purpose
Project financials The Concessioning Authority was responsibexceeding Rs.42 CrWB (76 percent) andpercent). Revenue from user charges accrued directly to the ULB(though collection was to be done by the Concessionaire)
The Concessionaire received payments in the form of O&M fees on‘Performance based deferred payment system’. According
guaranteed sum in 15 quarters and the remaining 40 percent was linketo achievement of project milestones.
Project risks and allocation
Investment Risk
oncessioning Authority since it was responsible for all Capital and Operating Expenditure. However Capex was capped at Rs.42 Crore by the
Borne by the C
Concessioning Authority
Operating Risk
All design, construction, and operating risks were borneby the Concessionaire.
Performance risk
Borne by the Concessionaire since 40 percent of the O&M fees were directly linked to achievement of specified outcomes. Penalties (maximum of 10 percent) were also included in the contract.
Disputes resolutll disputes were to be resolved amicably through direct discussion
event of non resolution, the dispute processes as prescribed under the
7 in the demonstration zones, KUIDFC is now planning to upscale the system to cover all the remaining areas in the three ULBs on a PPP basis.
ion mechanism Abetween the parties involved. In thewas to be settled through arbitrationArbitration and Conciliation Act, 1996.
PARTNERSHIP IN PRACTICE With the successful implementation of the 24X
170

PROJECT OUTCOMES
Service outputs The project has achieved 24X7 water supply at adequate pressure for all connected households in the pilot areas. 24,400 connections have
ng a population of about 1.79 lakhs. Public minated, with a few exceptions where their
non-drinking purposes
been established coveristand posts have been eliuse is restricted to
Bulk supply and per capita consumption levels have improved in all 3 pilot cities:
City Bulk Supply in MLD Service Level (LPCD) Before After Before After Initiative Initiative Initiative Initiative
Belgaum 57 84 123 182 Gulbarga 25 55 46 101 Hubli 111 113 123 125 -Dharwad
Wat has imp 0- inconsistent) to 6-22m. Incr sure has inated the ed for wat umps (in c of 2 st uses) and st , leading st savin househo
pe0
e. This has led to substantial water savings for the
ally
er pressure roved from 5m (eased pres elim ne er p ase orey ho
rations
orage to co gs for lds.
OWater losses due to leakage have been reduced from as high as 5percent in non-project zones to less than 10 percent within the demo zones. 100 percent metering has been completed and volumetric billing has led to reduction in water usage and wastage as was prevalent in the flat rate regimKUWSDB and the surplus is now rerouted to other deficient areas.
Many unauthorized connections have been authorized, and there is anincreased demand from landlords for obtaining a separate connection for their tenants.
Revenue for the ULBs through user charges has improved substantiwith almost 90 percent convergence achieved between the quantity of water supplied and billed as of 2009.
User interface Customer interface has improved substantially with reduction in response times and almost 100 percent redressal of complaints through a 24X7 customer service centre. A robust customer database has also been created and integrated with the B&C software.
171

Urban poor The tariff structure imposed under the project includes pro-poor considerations such as (i) no deposit for availing new connections in case of houses less than 600sq.ft in area (ii) minimum lifeline supply of 8000 litres per household and (iii) provision of water free-of-charge through public kiosks through involvement of NGOs and CBOs.
wn
ally due to public non acceptance. However this
).
n procurement processes during Stage II, the
tation.
s in
more on the efficiencies brought in by the private sector as a &M agency rather than the financing aspect of
project development also plays a crucial role in ensuring desired
will
ase
Project shortcomings The project was delayed (by more than a year) in Stage II which involved contracting out works as envisaged under the Improvement plan, primarily due to the detailed procurement specifications laid doby the World Bank
The Project suffered initiwas addressed by KUIDFC and the World Bank, by undertaking systematic Information, Education and Communication activities (IEC
Legal/contractual issues Following the delay iperiod of the concession had to be suitably extended to accommodate the delay. No other issues have emerged during project implemen
LESSONS LEARNT The case represents one of the more successful water sector PPPthe country. A major reason for the success was the innovative risk allocation, wherein investment/revenue risks for the private sector were eliminated – thereby incentivizing private participation, and focusing
management and OPPPs.
Remuneration mechanism can play an important role in ensuring projectoutcomes. In this case the performance based deferred payment system ensured that the PPP partner carried the system design and management risk, thereby ensuring quality of services rendered.
Proper outcomes. In this case the adoption of a consumption based tariff system (standard for all users in the pilot zones) to complement the proposed continuous supply system not only makes the system financially sustainable for the ULB in the long run but will also curb wastage of water (further reducing system costs). Standardizationalso help avoid the kind of tariff anomalies and inconsistencies encountered in the Buenos Aires Water Concessions (refer 4.2 of cstudy on Buenos Aires Water and Sewerage Concessions).
172

The role of proper IEC in achieving project outcomes cannot be understated. In this case the acceptance of the project by citizens and their willingness to pay as per the new tariff system was largely result of extensive stakeholder discussions conducted by WB, Government of Karnataka and KUIDFC officials.
the
ULB: Alandur, Chennai Metropolitan Area in Tamil Nadu
Sector: Urban Basic Services
ge
Award Date: 2000
Type and Period of concession: Composite Engineering- Build-Operate-Transfer (BOT)
2. UNDERGROUND SEWERAGE SYSTEM ALANDUR
CASE OVERVIEW Country: India
Sub-Sector: Sewera
Procurement-Construction (EPC) andContract for 14 years
Stakeholders:
Contracting Authority
Alandur Municipality Tamil Nadu Urban Infrastructure Financial Services Limited (TNUIFSL) as nodal agency
Concessionaire Joint Venture (JV) between IVRCL Infrastructure and Projects Limited and Blacke
logies Limited Durr & Wabag TechnoOversight Arrangement
h
NUIFSL etc
Limited
Through ULB on a weekly basis and througofficials such as Commissioner of Municipal Administration, Chief Executive of Ton a monthly basis M/s Consulting Engineering Services was appointed as Project Management Consultant (PMC) for detailed supervision andquality control
Present Status of Pr 005 and project has been
Project timeline
oject: Construction was completed in March 2operationalised.
1996 Conceptualization of the project by the Chairman of Alandur Municipality
173

1997 Government of Tamil Nadu (GoTN) scheme for upgrading sewerage in 12 cities including Alandur
oval of the Alandur project (as proposed by the ty) and handing over project development to
ApprmunicipaliTNUIFSL
1998 o. 69 permitting ULBs to undertake
e or
Government Order NPPPs for service provision Resolution of Alandur Municipality to collect advancone time connection fees and monthly user charges fsewerage
1999 of one time advance connection fees from
for selection of
Collection users Two stage bidding process Concessionaire
2000 re and Projects Limited and Blacke Durr &
Award of the concession to a JV between IVRCL InfrastructuWabag Technologies Limited
2005 on of the underground Treatment
Completion of constructisewerage system and a part of the SewagePlant (STP)
PPP CONTE
E ng enThe Governm for
ndertaking f sewerage in 12 cities, in order to address s appalling condition in the State – only 1/5th of the urban population in
ess to formal sewerage and the remaining had to tanks or other night soil disposal methods. Alandur
cities and this expedited the sanctioning
itive y
tanks.
XT
nabli vironment ent of Tamil Nadu (GoTN) prepared a scheme in 1997
improvement ouitthe State had accdepend on septicwas one of the identified process when the Alandur Sewerage Project was submitted by the municipality for approval.
GoTN issued Order No 69 in May 1998, allowing ULBs to deliver services through PPPs, subject to conditions such as use of competbids, no retrenchment of existing staff and regulation of cost of deliver(should not increase unduly due to private interests).
Sectoral context At the time of the sewerage concession, Alandur Municipality wascomprised of 19,800 households, and 98 percent of the households had water-based sanitation facilities – latrines had septic tanks or holding
174

The municipality collected sewage periodically in tankers and disposed it in low lying areas outside the municipal limits. Sullage and sewage overflow from household septic tanks was let out into the open storm
ulating eventually in a stagnant pond on the south-
water in the area.
mponents: the underground sewerage system (UGS) and a STP and was initially intended to be achieved
Previous instances of Sewage Treatment Plants (STPs) operated by roblems due to inefficiency of the staff
and relative lack of experience of handling the technology involved.
lly
, so as to ensure that the UGS and
nd
age
ipality)
t k to the
Concessionaire’s liability under the EPC component to complete a
water drains, accumeastern corner of the town.
Both of these disposal systems led to extremely unhygienic conditions (mosquito infestation and spread of diseases) and to contamination ofground
PROJECT DEVELOPMENT
Project conceptualization The project envisaged two co
through a regular EPC contract. The following considerations promptedthe use of a PPP arrangement:
public agencies had run into p
Allocating both components on a Build-Operate-Transfer basis would have increased the investment risk for the private operator substantiaand led to possible discouragement of bidders. However, it was important to execute both components through the same agency (whether as a BOT or otherwise)STP were developed/integrated simultaneously.
A mixed contract could be developed, wherein part of the investment risk was allocated to the Concessionaire, reducing the overall costs aresultant debt liabilities of the Alandur Municipality.
The project was thus innovatively structured into two components:
A regular EPC contract for construction of the underground sewersystem, with a maintenance obligation for the contractor of 5 years (upfront investment to be borne by Alandur Munic
BOT contract for finance, construction and long term operation & maintenance (O&M) of a Sewage Treatment Plant (STP) for 14 years (annuity-like payment by ULB).
The Municipality paid the Concessionaire (BOT component) on the basis of per unit of sewage treated, and in order to further de-risk the project committed to a ‘take-or-pay’ arrangement, obligating the Municipality to deliver a minimum quantum of sewage or pay for it. Ishould however be noted that this obligation was tied-bac
175
certain proportion of the UGS within a given time. Upfront capital cfor undertaking such a large project (annual municipal budget of Alandwas only about 7 percent of the
osts ur
expected project costs during project
f llion 7.
itted the
. CMA and GoTN approved the project (refer 1.1) and
udies in 1997-98 through M/s Services Limited, including engineering studies,
n
mil
their
nt, the
l
f the Mayor, Chairman of Alandur
preparation) were met (at least partially) through beneficiary contributions in terms of connection fees collected at the outset of the project.
The final system was to be designed to serve an ultimate population o300,000 persons in 2027 – receiving an intermediate flow of 12 militres per day (MLD) in 2012 and an ultimate flow of 24 MLD by 202
Project development The Chairman of Alandur municipality, Mr. R S Bharati initiated the project in 1996, obtained the approval of the council and submproject to the Commissionerate of Municipal Administration (CMA) for approvalappointed TNUIFSL as the nodal agency for developing the project, considering the lack of capacity at the ULB level to develop a project of this magnitude.
TNUIFSL conducted background stConsulting Engineeringproject design, location of facilities, user willingness to pay etc.
TNUIFSL structured the funding mechanism through soft loans from theTamil Nadu Urban Finance and Infrastructure Development Corporatio(TUFIDCO) and from the TNUIFSL under the World Bank initiated TaNadu Urban Development Fund (TNUDF), grants from GoTN and beneficiary contribution in the form of user deposits.
The contractual structure was formulated by TNUIFSL along with Transaction Advisor5 , who also managed the bid process. The final contract was approved by the World Bank (part of the loans were from the World Bank funded TNUDF).
At the request of TNUIFSL, Alandur Municipality vide resolution dated 28 July, 1998 resolved to collect advance one time connection charges and levy monthly user charges after completion of the project.
In order to encourage one time connection fee paymemunicipality issued public notices in September 1999. Meetings were also conducted to allay public fears regarding privatization and a speciaaccount was created for administering the funds of the project in order to ensure transparency. The fund was to be monitored through a monitoring committee comprised o
5 M/s Kirloskar Consultants Limited
176

Municipality and 3 representatives from Resident Welfare Associations(RWAs).
Procurement procedure
s: fixed price for construction of sewerage network and lease P. Within the consortium, IVRCL was
r both
Procurement of Concessionaire for the project was based on a competitive bid. Tender submission for technical proposals ended in October 1999 and that for financial proposals ended in December 1999. The contract – composite contract including both the EPC and BOT components for a total period of 14 years - was awarded to a JV between IVRCL Infrastructure and Projects Limited and Blacke Durr & Wabag Technologies Limited, based on a cumulative score of two bid parameterperiod for operating the STentrusted the responsibility of carrying out construction works fothe UGS and the STP and Wabag was entrusted with the task of conducting electro-mechanical works. Wabag was also responsible for O&M of the STP throughout the lease period.
177

CONTRACTUAL ARRANGEMENTS
Proposed contractual structure
Operator Output Obligations The obligations of the Concessionaire were as follows:
As part of EPC Component
(5 years)
Construct all main sewer lines, 50 km of branch sewer lines and, commission and test all sewers, pumping stations, pump sets and pumping mains with a period of 3 years (March 2000 to March 2003).
Construct the remaining 50 km of branch sewer lines within the next 1 year and undertake O&M of the entire
ALANDUR ULB
JV (all private)Concessionaire
Concessioning Authority
DESI
GN
CAPE
X
O&M
O&M
CAPE
X
DESI
GN
CONS
TRUC
TIO
N
SEW
ERAG
E SY
STEM
UGS
STP
BOT
EPC
TUFI
DCO
TNUI
FSL
Go GrLo Proj
Deve
loLo
TN ant
an ect
pmen
t
an
USER
S
Fixe
d Pa
ymen
t per
MLD
‘Tak
e-or
-Pay
’–en
sure
min
imum
sew
age
and
pay
for i
t
Providi
ng se
rvice
conn
ectio
ns
Adva
nce
conn
ectio
n fe
es
Mon
thly
user
cha
rges
178

system for a defect liability period of 1 year thereafter (March 2003 to March 2005).
As part of BOT Component
(14 years lease)
Period for this phase includes period for EPC phase
Finance and construct the first part of the STP (12 MLD capacity – half of 24 MLD total as specified within contract) and integrate the facility with the newly laid UGS system within a period of 3 years (March 2000 to March 2003 to coincide with the construction of first phase of UGS).
Finance and Construct the remaining 12 MLD facility when the inflow of sewage reached 9.6 MLD or 1 and a half years prior to completion of lease period whichever came earlier.
Conduct O&M of the entire STP facility for the entire lease period of 14 years in accordance with treatment norms and specifications set out by the Tamil Nadu Pollution Control Board (TNPCB).
Obligations of the concessioning authority Obligations of the Concessioning Authority included:
Provision of design (completed before bidding) for the UGS system
Operation of the UGS system so as to ensure a minimum inflow of sewage to the STP as agreed within the contract (minimum inflow commitments increased every year and was specified in the contract)
Obtaining and handing over land free of encumbrances to the Concessionaire for the STP.
Regulatory and monitoring arrangements M/s Consulting Engineering Services Limited was appointed as Project Management Consultant (PMC) with funding from a grant fund from TUFIDCO for detailed supervision and quality control.
Alandur municipality undertook review of progress on a weekly basis in addition to a monthly review by officials such as the Commissioner of Municipal Administration, and Chief executive of TNUIFSL.
Project financials Investments by the Concessionaire (except land acquisition) were restricted to the BOT component of the contract. The Concessionaire was to be remunerated on a per MLD basis by the Alandur Municipality. The Municipality was obligated to deliver a minimum quantum of sewage or pay for it, subject to the system working through its ‘take-or-
179

pay’ commitment. Treatment of sewage above the minimum specified was paid extra on the fixed per MLD basis.
The minimum guaranteed sewage inflow gradually increased (annually) and the price per MLD decreased as the volume of flow increased. Values in year 1, year 7 and the last year of the lease are as given below:
Year Minimum Guaranteed flow of sewage (MLD) Price per MLD (INR)
1 5.97 4932
7 8.52 3772
14 10.15 3587
For the construction of the UGS system the Alandur Municipality was liable to bear the cost of Rs.250 million as per the bid amount.
Part of the public funding required for the project was obtained through one-time advanced collection of connection fees as user deposits – Rs.5,000 per household and Rs.10,000 from non-domestic entities. Overall public funding for the project was structured as follows:
No Item Amount INR’ 00,000 Percentage
1 Rupee Term Loan from TUFIDCO
1600 47.1
2 Rupee Term Loan from TNUIFSL (under TNUDF)
400 11.8
3 Deposit Collection (one time connection charges)
800 23.5
4 Gap funding by GoTN 300 8.8
5 Interest from deposits 200 5.9
6 Grant fund for supervision from TUFIDCO
100 2.9
TOTAL 3400 100
Revenue from monthly user charges accrued directly to the Alandur Municipality and the municipality had to escrow a proportion of such
180

revenues for debt servicing of TUFIDCO and TNUIFSL debts. Following user charge structure was adopted:
No
Domestic Connections Commercial and Industrial connections
Plinth Area (sq.ft)
Monthly Tariff (INR)
Plinth Area (sq.ft)
Monthly Tariff (INR)
1 Less than 500
60 Less than 500
200
2 500 - 1500 80 500 - 1500 400 3 1500 -
3000 100 1500 -
3000 600
4 More than 3000
120 More than 3000
1000
Project risks and allocation
Investment Risk
Borne by the Concessioning Authority through fixed payments for construction of the UGS system and through minimum guaranteed payment in the case of the BOT component. Additional guarantees were provided by the GoTN and TNUIFSL in case of Alandur municipality not being able to pay as per commitment.
Design Risk Design risk for the system was borne by the Municipality since the system had to be constructed as per design specifications evolved before the bidding process
Construction Risk
The Concessioning Authority bore the risk of land acquisition and timely handover to the Concessionaire for the STP. All other time and cost overruns were borne by the Concessionaire
Performance Risk
The Concessionaire bore all risks for maintenance and operations (in case of STP) and had to ensure specified performance, for the municipality to honour its ‘take-or-pay’ commitment
Disputes resolution mechanism All disputes were to be resolved amicably through direct discussion between the parties involved. In the event of non resolution the dispute
181

was to be settled through arbitration processes as prescribed under the Arbitration and Conciliation Act, 1996.
PARTNERSHIP IN PRACTICE
Project outcomes The project has been successful in developing a comprehensive sewerage solution for the municipality and has been able to achieve most of its targets.
The project has provided the city with a cost-effective and affordable sanitation solution, since the graded tariff system has allowed even poor residents to obtain connections. 43 percent of the contributions to the user deposits came from slum dwellers seeking connections.
The STP has been operationalised and is running as per norms resulting in indirect environmental and health benefits for the city.
Project shortcomings While the project execution has been proceeding smoothly, the Alandur Municipality has not been able to keep pace as envisaged in the form of delays in providing service connections to users. This would affect the committed sewage inflow to the STP resulting in redundant public expenditure due to the ‘take-or-pay’ commitment.
The ULB has also been facing problems regarding public unwillingness to pay monthly user charges, even though the arrangement was well publicized and endorsed by the users earlier.
Legal/contractual issues Most contractual issues emerging in the form of delays in completion due to delays in TNPCB approvals and inadequate provision of service connections to users by the Alandur Municipality have been resolved through discussions and negotiation.
LESSONS LEARNT Alandur Sewerage Project was the first for its kind in the sector undertaken on a PPP basis. The STP developed under the project is also the first STP to be built through a BOT arrangement.
The success of the PPP essentially lies in its innovative structuring. The composite contract structure (mixed EPC and BOT) allowed sharing of the investment risks - encouraging private participation on one hand and reducing the financial burden for the ULB on the other. The project was also able to bring in necessary efficiency and technological skill for handling of the STP facility.
182

The project was path breaking in its participatory interface between the ULB and the community, collecting a substantial part of the upfront investment requirements from advance beneficiary contribution. Proper IEC and development of transparent and credible structures such as the separate project account monitored through a committee with representations from not only the ULB but also the political wing and the citizens played a crucial role in ensuring the success of the beneficiary contribution drives. In fact the beneficiary deposits were almost double than was expected initially (80 million instead of 40 million) reducing the loan component from TNUIFSL by half.
3. MANILA WATER AND SEWERAGE CONCESSIONS
CASE OVERVIEW Country: Philippines
ULB: Metro Manila (Region) – comprising 12 cities and 5 municipalities
Sector: Urban Basic Services
Sub-Sector: Water Supply and Sewerage
Award Date: August 1997 (including financial closure)
Type and Period of concession: Operations and Maintenance (O&M) concession (two separate agreements) for 25 years
Stakeholders
Contracting Authority
Public Utility for Metro Manila: Metropolitan Water Works and Sewerage System (MWSS)
Concessionaire The city was divided into two service areas. West zone was awarded to Maynilad Water Services Inc. (Maynilad), and the East Zone to Manila Water Company Inc. (Manila Water).
Oversight Arrangement
Special body constituted for the project period - MWSS Regulatory Office (MWSS-RO)
Present Status of Project: Manila Water continues to be the Concessionaire for the East Zone and Maynilad for the West Zone. Maynilad went through a change of ownership in 2007.
Project timeline
1994 Advisory Technical Assistance (TA) by ADB and creation of the MWSS Privatization Committee, mandated to guide the privatization process
183

1995 Enactment of the Water Crisis Act (WCA), empowering the President to privatize water utilities in the country
1996 Increase in water tariff and reduction in staff of public utility prior to the bidding process
1997 Award of the concession to two separate Concessionaires for the East and West service areas through an international competitive bid Asian Financial Crisis – Heavy Forex losses to Concessionaires
2001 Contractual amendment introducing mechanisms for facilitating recovery of losses incurred by Concessionaires
2002 Filing of termination suit by West Zone Concessionaire to the International Arbitration Panel (IAP), asserting MWSS failure to meet its obligations
2003 Counter petition by MWSS IAP ruling - forbidding termination of the contract
2005 Listing of the East Zone Concessionaire (Manila Water) on the Philippines Stock Exchange
2007 Reconstitution of the West Zone Concessionaire (Maynilad) through a public bid
PPP CONTEXT
Enabling environment In order to forestall economic bankruptcy and address the international debt burden, several initiatives were undertaken in the Philippines in the 1990s, for reducing public expenditure and monopoly and encouraging private investments in infrastructure. Chief amongst these (and which set the background for the Manila Water concessions) were:
Constitution of a Committee on Privatization (COP) mandated to privatize State owned enterprises
Enactment of the Foreign Investments Act of 1991
Enactment of the Build-Operate-Transfer Law of 1993
Creation of an MWSS Privatization Committee (1994) for guiding the privatization process
Enactment of the Water Crisis Act (WCA) of 1995, empowering the President to privatize water utilities in the country
184

Sectoral context As of 1997, the coverage of water supply networks in the Metro Manila region (approximately 11 million population) was about 59 percent and that of sewerage as low as 8 percent.
The prevalent system suffered from rampant leakages, faulty and inadequate metering, and illegal connections leading to as much as 58 percent of Non-Revenue Water (NRW). Revenue loss was further compounded due to inefficient billing and collection, despite relatively high personnel to connections ratio of 9.8/1000.
The sector also lacked adequate investments, and the MWSS was heavily indebted on account of decades of inefficiency and provision of price subsidy to consumers.
PROJECT DEVELOPMENT
Project conceptualization Engagement with the private sector was expected to plug existing gaps in investments, and quality/coverage of services within a specific time frame and without overburdening consumers with high user charges by bringing in requisite efficiency in revenue collection and minimizing losses. An Area concession model (O&M concession) was chosen, transferring all operational and investment responsibilities to the Concessionaire without transferring ownership of assets.
Project development President Ramos was the key political driving force behind the MWSS privatization (empowered by the WCA), overseeing proceedings up till the financial closure in August 1997.
Advisory Technical Assistance (TA) provided by the Asian Development Bank (ADB) in 1994 formed the background for the privatization process and led to the constitution of the MWSS Privatization Committee.
The committee conducted background research and proposed a model based on study visits of England, France and Argentina for reviewing their water privatization models. International Finance Corporation (IFC) was appointed as the Transaction Advisor and advised the Government on policy/legal matters, sectoral requirements and contractual structure. The structure was approved at various levels including the COP, a Special Advisory Committee to the President (created for the duration of project development) and finally the President himself.
In order to encourage bidders the existing water tariff was increased by 38 percent (award was based on lowest tariff proposed) and MWSS
185
labour force was reduced by 30 percent, since it was binding on the Concessionaires to absorb the existing staff as part of the contract.
Procurement procedure The service area was divided into two zones – the Eastern and Western regions – each of which was to be allotted in the form of 25 year O&M concessions to separate bidders. It should be noted that base conditions for the two concessions were different:
(i) The MWSS debt liability was split in a 9:1 ratio (refer 3.5 for details) between the West and East Zones making the West Zone Concessionaire responsible for a major proportion of the debt.
(ii) The West zone contained infrastructure in a much worse state, and a large un-connected and low-income population. In comparison, the Manila Water zone had a much more viable situation.
The concessions were awarded through an international competitive bid, based on the lowest quotes for tariffs (bid parameter). The West zone was awarded to Maynilad Water Services Inc. (Maynilad), a consortium between Benpres (Philippines) and the Lyonnaise des Eaux (France), who committed a 74 percent reduction in prevalent tariffs for the East Zone. The East Zone was awarded to Manila Water Company Inc. (Manila Water), a consortium between Ayala (Philippines) and International Water (U.K./U.S.), who committed a 44 percent reduction in prevalent tariffs for the West Zone.
186

CONTRACTUAL ARRANGEMENTS
Proposed contractual structure
EXHIBIT 3
Operator output obligations The Concessionaire was responsible for all operations and creation of new infrastructure to meet output specifications provided in the contract. The contract specified targets for coverage, water pressure, reliability
Concessioning authority
Hand
over
of all
opera
tion
respo
nsibi
lities
Owne
rship
of all
asse
ts cr
the pr
oject
Take
final
decis
ions o
n re
matte
rs thr
ough
the B
oard
MWSS
al eated
unde
r
gulat
ory
of Tr
ustee
s
MWSS
-RO
Board
of
Oversight Arrangement
Monit
oring
apro
vision
s
Griev
ance
re
Tariff
Rate
re
Repo
rting t
oreg
ulator
y de Tr
ustee
s
nd en
force
ment
of co
ntrac
tual
dress
al
basin
g
the M
WSS
BoT
perio
dicall
y for
final
cision
s
Plann
ing fo
r and
achie
vem
phys
ical ta
rgets
Abso
rb lab
our o
f MW
SS
Capit
al Inv
estm
ents
Opera
tion a
nd M
ainten
ance
Billin
g and
tariff
colle
ction
Debt-
servi
cing o
f MW
SS d
ent o
f
ebts
MANI
LA W
ATER
East
Zone
MAYN
ILAD
Wes
t Zon
e
Concessionaire
USER
S
Conc
essio
n Fee
s
Settin
g pen
alties
Tariff
regu
lation
Servi
ces
User
Charg
es
Prote
ction
from
Hand
ing ov
er op
eratio
ns
187

and quality, reduction in NRW, renewal and expansion of the sewerage system and customer service. Key outputs included:
■ Increasing water supply coverage from the then current - 67 percent (for both service areas) to 96 percent by 2006
■ Increasing supply reliability to 24 hours and achieving water pressure of 16 psi
■ Improving sewerage coverage in the East Zone from 13 percent to 55 percent and in the West Zone from 7 percent to 66 percent.
Obligations of the concessioning authority Obligations of the Concessioning Authority included peaceful and timely transfer of all operations, assets and human resource to the Operator.
Regulatory and monitoring arrangements A separate regulatory body was created within MWSS, called MWSS Regulatory Office (MWSS-RO). The body was responsible for enforcing the provisions of the contract, setting appropriate penalties for non-compliance, implementing rate revisions, and dealing with complaints.
Project financials The contractual commitments of the Concessionaires were output based and not investment based. The Concessionaire was responsible for all capital/operational investments required to meet these targets.
The Concessionaires were to reimburse the Government for the transaction cost and pay concession fees to the MWSS. The concession fee included components for servicing the existing debts of MWSS and meeting a part of the operational costs of the MWSS (its BoT and remaining staff) and the MWSS-RO. Debt servicing liability was split in a 9:1 ratio between Maynilad and Manila Water.
All investments were to be recovered through user charges (tariffs), which accrued entirely to the Concessionaires. The tariff included all operating and capital costs, cost of borrowing, foreign exchange variations, and concession fee payments. Procedures for periodic tariff revision (to be carried out by the MWSS-RO) were also stipulated within the concession agreement.
The Concessionaire was granted an income tax holiday (6 years), preferential tariffs on import of capital equipment, tax benefits on locally produced equipment and exemptions from local and franchise taxes.
188

Project risks and allocation
Investment Risk
Associated with forecasting demand for services (since revenue was tariff based), was borne by the operator and the contract did not provide any guarantees to that effect. The tariff was also regulated by the MWSS-RO.
Performance risk
Borne by the operator through mechanisms for penalties for non-compliance with contractual commitments and through annually renewable performance bonds.
Currency risk
Currency risk was a crucial component of the contract, since the MWSS debt (borne by the Concessionaire) was US$ denominated. The Forex risk was split between the Concessionaires and consumers, introducing tariff adjustment mechanisms to reflect Forex fluctuations thereby passing the risk to consumers, while shielding consumers from extreme escalations by spreading collections over the 25 year span of the project.
Force Majeure
The MWSS was obliged to compensate the Concessionaire for investments made up till the date of termination, in case of early termination due to changes in policy.
Disputes resolution mechanism An appeals panel was set up for minor disputes; with the regulator, the Concessionaire and the appeal chairman each appointing one member on the panel. In the event of major disputes, the matter could be referred to the Internal Arbitration Panel (IAP).
PARTNERSHIP IN PRACTICE Two unforeseen events occurring at the outset, threatened the success of the privatization initiative. First, water availability reduced by 30 percent due to an unprecedented draught and second, the Philippine Peso devalued during the Asian Financial Crisis (1997); almost doubling the MWSS’s dollar denominated debt-burden and increasing the Concessionaires’ liabilities twofold. Despite measures by the Government to keep the concessions afloat, the two Concessionaires followed completely different trajectories – while Maynilad filed for bankruptcy in 2003, was handed over to MWSS in the interim and went through a change of ownership in 2007; Manila Water was financially successful and is a listed company on the Philippines Stock Exchange. Immediately upon reconstitution Maynilad repaid its outstanding debts (January 2008) and initiated several steps to improve its service
189

coverage and reliability, and reduce NRW - targeting major outcomes by 2012.
PROJECT OUTCOMES Service Outputs
The serviced population increased from 7.5 to 9.5 million and supply network (length of pipelines) improved from 4500 to 6300 km for both concessions in the first four years of the contract
The percentage of consumers with 24 hour service reliability in the East zone increased from 26 to 98 percent by 2006. This factor improved in the West zone after re-organization of Maynilad, with 60 percent of consumers availing the facility by 2008.
Sewerage networks have improved in both service areas, through rehabilitation of existing facilities and construction of new facilities for treatment of waste water.
Operations
Operational efficiency in terms of worker productivity improved for both concessions, and NRW in the successful East zone concession reduced from 39 percent to 24 percent by 2007.
Urban Poor
Both the Concessionaires launched separate programmes for bringing hard-to-reach urban poor localities within the service network. About 1.5 million poor households have been brought under the service network through Manila Water schemes and about 0.5 million through Maynilad schemes.
PROJECT SHORTCOMINGS Despite increases in coverage and other aspects of service delivery indicated in the previous section, output targets up till 2009 for water supply and sewerage in both service areas remain unachieved.
Since the awards were based on lowest quote for tariffs, the project was expected to significantly reduce the cost burden on consumers. However, as indicated in the following table Manila Water rates increased by 540 percent and Maynilad rates by 325 percent by 2006.
Year
Average Base Tariff (PHP per cubic metre) Manila Water Maynilad
Pre-Privatization 8.56 8.56 Post-Privatization
190

1997/98 2.32 4.96 2000 2.76 6.13 2002 4.51 11.39 2003 10.06 11.39 2004 10.40 11.39 2006 14.94 21.12
Maynilad failed to pay concession fees (towards MWSS debt-service) to the MWSS between 2001 and 2007. This increased the debt burden of MWSS since it had to borrow on several occasions in order to address its maturing debt liabilities.
In the course of implementation it was realised that the pre-bid data provided by the Concessioning Authority was incorrect leading to anomalies in the investment forecasts of the Concessionaires. On the other hand tariff quotes of the Concessionaires (bid parameter) were later criticized as being too low and unrealistic, resulting in a series of tariff hikes during the course of implementation.
Legal/Contractual Issues A contractual amendment was enacted in 2001 to address the unforeseen increase in the MWSS debt-servicing liabilities of the Concessionaires during the financial crisis. The Original contract, while loading such losses on the consumers, shielded them from extreme escalations in the short term by spreading such collections over the project duration. This provision was amended, enabling the Concessionaires to recover losses within 15 months instead of 22 years, passing the Forex risk entirely to the consumers.
The amendment reduced several output commitments so as to enable the Concessionaires to meet targets.
The amendment also reduced the autonomy of the MWSS-RO, and deemed that the RO would report to the MWSS Board of Trustees, who in turn took final decisions on all regulatory matters. The regulatory body was thus subservient to the decisions and interests of the contracting party. This was further compounded through repeated political intervention throughout the implementation period (in several cases overruling the decisions of the MWSS-RO).
Despite the contractual amendment and substantial increases in tariffs, Maynilad filed for termination of contract to the IAP in December 2002, blaming the government for the firm’s inability to sustain operations in the West Zone, followed by a counter petition by MWSS in 2003. The IAP ruled in 2003 that neither party could terminate the contract and
191

directed Maynilad to compensate MWSS for unpaid concession fees (refer 4.2). Maynilad formally declared bankruptcy in November 2003 and Benpres (lead consortium member) relinquished its shares in Maynilad to MWSS in lieu of the unpaid compensation fees in 2005. This led to the eventual change of ownership of Maynilad through a public bid in 2007.
Difference In Performance: Manila Water And Maynilad As mentioned in 2.3 there were differences in the two contracts in the sharing of the debt liability as well as in the nature of the concession areas leading to differences in the initial conditions of the two Concessionaires. Some of the key reasons that may have led to the differential performance of the two Concessionaires are as follows:
Manila Water (East Zone) Maynilad (West Zone) a Sharing of debt liability:
Debt service liability of MWSS debt was shared in a 9:1 ratio between Maynilad and Manila Water
Manila Water carried only 10 percent of the debt liability
Maynilad carried 90 percent liability and hence experienced a large hike in its debt liabilities (debt being dollar denominated) during the Asian Financial Crisis
b Third-party sub-contracting:
The concession did not enforce the use of competitive bidding processes for sub-contracting works to third parties.
However, with the exception of a single contract, all procurement (third party) was through open competitive bids significantly lowering the price of services obtained through third parties.
In the case of Maynilad most sub contracts were related-party contracts awarded to associates of the International firm involved in the consortium, leading to higher procurement costs and heavy Forex losses.
c Internal financial management (during the financial crisis) Manila Water focussed on
domestic lenders for capital expenditure, obtaining small loans from multiple banks.
Maynilad on the other hand opted for large loans from international lending agencies. While this helped
192

While this affected capital investments in the initial years leading to restricted performance, the company was able to protect itself from immediate financial risk and subsequently take aggressive steps to achieve its targets. The company also focussed on crucial targets such as reduction of NRW which were central to improving company revenues.
the company to make large capital investments, it also increased the Forex burden during the financial crisis. Investments were also not directed properly (for instance towards plugging revenue losses due to NRW) with the result that the NRW increased from 64 percent to 69 percent between 1997 and 2003, reducing the potential revenue for the company.
LESSONS LEARNT Need for robust sectoral needs and investment analysis prior to the bidding process, so as to allow all parties in a PPP structure to make informed assumptions and set accurate output forecasts. In this case lack of accurate information from the Concessioning Authority and unrealistic bids from the Concessionaires led to tariff escalations during implementation – hampering the initial objective of the project.
Need for proper risk allocation even during contractual amendments as this could seriously impact the expected outcomes of projects. In the Manila Case, the amendment resulted in transferring the Currency risk, initially allocated on a long term shared basis, entirely from the Concessionaires to the public.
Need for ensuring transparency in third party contracting, so as to avoid unearned gains for operators and unwarranted escalation of project costs. In this case the eventual financial failure of Maynilad could be attributed, at least in part, to the lack of such transparency
Need for ensuring autonomy of regulatory bodies/arrangements in order to eliminate regulatory bias and protect project interests. In the Manila case though the original contract envisaged a neutral regulatory arrangement, subsequent amendments did not uphold the strategic importance of such an arrangement, leading to eventual disputes and compromising project outcomes.
On the positive side the experience also highlights the possibility of bringing hitherto excluded urban poor communities within the service network through PPP arrangements, on account of issues of efficiency and economic returns involved within the process
193

Despite its shortcomings the project also highlights the substantial efficiency gains that can be achieved through PPP arrangements. For instance, coverage for the two service areas increased by 30 percent in the first five years, a significant improvement considering that MWSS would have achieved this in 30 years based on their historical performance.
4. ‘JOHANNESBURG WATER’ MANAGEMENT CONCESSION
CASE OVERVIEW Country: South Africa
ULB: Greater Johannesburg
Sector: Urban Basic Services
Sub-Sector: Water Supply and Sewerage
Award Date: 2001
Type and Period of concession: Management Contract for 5 years
Stakeholders:
Contracting Authority
Johannesburg Water (JW), Public company setup as the Water Service Provider for Greater Johannesburg
Concessionaire Johannesburg Water Management Company (JOWAM)
Oversight Arrangement
Independent Auditors contracted by JW to monitor performance of JOWAM Indirect Regulation through Change Management Unit (CMU) and Shareholder Unit (SHU) set up to monitor the service delivery and financial performance respectively of JW
Present Status of Project: The project was completed successfully in 2006 and operations were handed over to JW staff.
Project timeline:
1999 Establishment of an Advisory Board of Specialists to help setup JW and to assist with the contract design and selection process for a private partner to manage the utility
2000 Constitution of JW as an autonomous Water Service Provider Company to be fully owned by
194

the Municipal Administration of Greater Johannesburg
2001 Award of a five year management contract to JOWAM for managing JW
2006 Successful completion of the management contract
PPP CONTEXT
Enabling environment In the late 1990s Johannesburg undertook several administrative reforms in order to consolidate numerous separate administrations and restructure the city’s approach to service provision. The following reforms undertaken during the period formed the background for the ‘Johannesburg Water’ Management Contract:
Adoption of the iGoli 2002 plan, which categorized all municipal functions into Utilities, Agencies and Corporate Departments (UACs), all entirely owned by the City Administration (CA) but set up as independent companies, accountable to the City Council through stipulated service delivery targets.
Creation of a Contract Management Unit (CMU) as an oversight body to monitor and evaluate performance of UACs and creation of a separate Shareholder Unit (SHU) to monitor the financial performance of the units.
Consolidation of seven separate water utilities serving different jurisdictions in the city into one autonomous company, Johannesburg Water (JW). In 2000, agreements were signed between the City of Johannesburg and the new company, transferring the city’s water infrastructure assets and 2500 employees to the company and setting the service targets to be achieved.
Sectoral context The following was the status of water supply and sanitation in Greater Johannesburg (3.2 million population approximately) during the inception of JW.
Inadequate coverage of water and sanitation facilities - at an aggregate level 9 percent lacked access to adequate water supply and 15 percent to adequate sanitation. The prevalent system also suffered from severe distributional inequities and the shortfall was very high in the informal settlements.
195
Very high Unaccounted-for-Water (UfW), estimated at 43 percent and a high incidence of non payment by users leading to heavy revenue losses.
Unacceptable levels of environmental non-compliance, especially at sludge handling facilities
Poor customer interface and customer relations management
Lack of capacity within the newly formed company - JW, to handle critical technical functions; an issue compounded by lack of robust sectoral data for effective management and monitoring
This formed the backdrop for initiating a management contract for operating the company in its nascent stage.
PROJECT DEVELOPMENT
Project conceptualization As a part of the administrative reform process, there was an urgent need to infuse the newly formed UACs with an efficient work culture. In the case of JW, there was a need to increase the internal capacity of the staff, improve operational and financial performance and consolidate the integration of seven separate water utilities into a single efficiently managed autonomous unit. In order to achieve this it was opted to initiate a five year management contract, wherein the private party was expected to provide management expertise and support to the JW in critical areas and to transfer human resource competence to JW staff within the contract period.
Project development The Municipal Administration established an Advisory Board of Specialists in 1999 to help setup JW. The Board also assisted with the contract design and selection process for appointing a private partner to manage the new company.
Procurement procedure In 2001, the management contract was awarded to the Johannesburg Water Management Company (JOWAM) through an international competitive bid. JOWAM was a Joint Venture between Ondeo (a water subsidy of Suez), Northumbrian Water and Water and Sanitation Services South Africa (a subsidiary of Ondeo). The award was based on their lowest bid for subsidy support from the Municipal Administration and lowest quote for incentive based payment (fixed proportion of annual revenues of JW). JOWAM also had a strong technical proposal including a strategy for building internal capacities and gradually reducing its staff over the contract period.
196

CONTRACTUAL ARRANGEMENTS
Proposed contractual structure
Operator output obligations The indicators for monitoring of JOWAM’s performance were set out in the management contract. These included annual targets (reset every year in consultation with JOWAM) for:
Capacity Enhancement of JW employees and human resource development
Reduction in waste water spillage and overflow
Improvements in customer service and complaint redressal
JOHANNESBURG CITY COUNCIL
JOHA
NNES
BURG
W
ATER
Owne
d by
City
Cou
ncil
Serv
ice
Agre
emen
t With
City
Cou
ncil
Man
agem
ent C
ontra
ct fo
r Fiv
e Ye
ars
CMU
Mon
itor S
ervic
e De
liver
y St
anda
rds
Com
plia
nce
with
pub
lic
legi
slatio
ns a
nd p
olici
es
Tarif
f Set
ting
Proc
ess
SHU
Mon
itor C
orpo
rate
G
over
nanc
e
Fina
ncia
l Via
bility
of t
he
Publ
ic Co
mpa
ny
Sect
or R
egul
ator
s
Publ
ic C
ompa
nyRe
ports
Polic
ies
Capa
city
enha
ncem
ent o
f em
ploy
ees
Redu
ctio
n of
was
tewa
ter s
pilla
ge
Impr
ovem
ents
in c
usto
mer
ser
vice
Impl
emen
tatio
n of
cap
ital in
vest
men
t plan
s
Impr
ovem
ents
in o
pera
tions
and
facil
ities
JOW
AM
Concessionaire
Inde
pend
ent A
udito
rM
onito
ring
Perfo
rman
ce o
f JOW
AM
Regu
latio
n
Repo
rts
Fixe
d fe
eIn
cent
ives
Man
agem
ent
Indi
rect
regu
latio
n th
roug
h re
gula
tion
of c
ompa
ny
Indi
rect
regu
latio
n th
roug
h se
tting
of w
elfa
re p
olici
es
197

Implementation of annual capital investment plans
Improvements in operations and facilities
JOWAM was expected to deploy 13 professionals (including at executive management levels) and phase them out over the period of the contract, after ensuring adequate skill transfer to JW staff. Operational decisions of JOWAM had to comply with policy decisions of the City Administration (single shareholder of JW).
Regulatory and monitoring arrangements The performance of JOWAM was directly linked to the performance of the managed entity (Johannesburg Water). Thus while JOWAM’s performance was directly monitored by the JW Board through an Independent Auditor, in reality its performance was also regulated through the regulatory arrangements operating upon JW.
These included (i) the Change Management Unit (CMU) created in 2001 to monitor service delivery standards, compliance with local government and National legislation, and the tariff setting process of JW and (ii) the Shareholder Unit (SHU) created in 2003 to monitor corporate governance and financial viability of JW. Both the CMU and the SHU directly reported to the City Administration (CA) of Greater Johannesburg.
Project financials The contractual commitments of JOWAM were restricted to management of JW and did not include any financial investments.
Compensation was structured through a fixed management fee which was to be paid by JW to JOWAM on a monthly basis, irrespective of the performance of JOWAM.
In addition to this JOWAM was entitled to two types of incentive payments. ‘Incentive A’ was determined by performance against the five parameters described in 3.2 earlier. ‘Incentive B’ referred to the fixed percentage (0.18 percent as per JOWAM bid) of the annual revenues of JW which were to accrue to JOWAM.
Project risks and allocation
Revenue Risk
The contract safeguarded JOWAM from revenue risks through a guarantee of fixed monthly management fees
Performance Risk
Borne by JOWAM since the incentive based payments were directly linked to operator performance and improvement of financial performance of JW
198

Policy Risk Though not formally allocated as per contract, policy risk was borne by JOWAM since its performance was susceptible to policy decisions of the City Administration (CA), which was the single shareholder of the managed company, JW. No compensation was envisaged in case of changes in policy of the CA or default at their end in complying with their separate agreement with JW.
Disputes resolution mechanism All disputes emanating from the contract were to be resolved through the CMU and the SHU.
PARTNERSHIP IN PRACTICE In the five years of the contract period JOWAM successfully achieved its contractual targets including transfer of skills to the JW employees before withdrawing from the utility.
Project outcomes Operations
Quality of water improved due to regular monitoring and testing (500 samples per month) resulting in 99 percent bacteriological compliance.
Treatment of Wastewater improved from 940 million to 1.01 billion litres per day and compliance with effluent standards increased from 82 to 98 percent. Wastewater overflow at treatment sites also improved from 646 to 138 spills per year by 2005.
UfW reduced from 43 to 35 percent and the percentage of water meters read by authorities increased from 50 to 94 percent by 2006. As a consequence revenue collection increased from 56 percent to over 105 percent (including arrears)
Other improvements included power and chemical savings, reduction in staff overtime and absenteeism.
Financial management
Asset management improved through development of an asset register and a maintenance plan
Approximately 98 percent of the capital budgets were realized into actual expenditure and the company’s credit rating improved from ‘BBB+’ at the start of the contract to ‘A’.
199

JW, which was bankrupt at the start of the management contract, registered profits for the first time in 2005-06 (final year of the management contract)
User interface
Citizen interface and grievance redressal improved, with 90 percent of all calls being answered in 30 seconds through the call centre set up for the purpose.
Response time also improved with 80 percent of network repairs getting completed within 48 hours of notice and 80 percent of blocked sewers attended within 24 hours.
Transfer of skills
Transfer of skills to JW employees and the gradual phasing out of JOWAM staff was achieved successfully as reported by CMU. This was achieved through active involvement of JW employees in all projects, delegation of responsibilities and periodic training and mentoring.
Project Shortcomings The management contract fulfilled its contractual targets to a large extent. However, since the CA played the dual role of being a public agency and the single shareholder of JW, this led to conflicts between the subsidy policies of the Administration and the efficiency objectives of the management agency.
Legal/contractual issues While the management contract largely fulfilled contractual expectations, the results were restricted on account of non compliance by the CA with certain transfer terms that were part of the its agreement with JW (during the constitution of JW). The agreement provided for transfer of all billing functions to JW. In effect however, only the top 14,000 consumers were transferred, giving JW control over only 30 percent of its revenues. It was only after three years of operation that 60 percent consumers were transferred to the company. The resultant lack of control of JW over a large proportion of its revenue base restricted the capacity of the management agency, JOWAM to address commercial losses and erroneous business processes in a comprehensive manner.
LESSONS LEARNT The experience highlights the possibility of engaging the private sector for strengthening the capacities of public utilities (particularly newly constituted public companies where there is a need to inculcate an
200

efficient work culture), and using management contracts as catalysts for developing efficient public companies.
Importance of ensuring the autonomy of management consultants in order to achieve expected efficiency gains from management contracts. In this case the extent of improvements was heavily restricted due to dependence of the management agency on both (i) the compliance of the CA with its commitments (separate agreement) to the managed company and (ii) the policy regime of the CA.
Need for ensuring phasing out of management consultants and transfer of adequate skills and capacities to the managed company so as to sustain the efficiencies produced through management contracts beyond the period of the project.
5. MUNICIPAL SOLID WASTE COLLECTION AND TRANSPORTATION – NEW DELHI MUNICIPAL COUNCIL
CASE OVERVIEW Country: India
ULB: 12 Select Circles of the New Delhi Municipal Council (NDMC), Delhi
Sector: Urban Basic Services
Sub-Sector: Solid Waste Management (SWM)
Award Date: September 2006
Type of concession: Build-Operate-Transfer (BOT) Concession for a period of 8 years
Stakeholders
Contracting Authority
New Delhi Municipal Council (NDMC)
Concessionaire M/s Ramky Energy and Environment Limited Oversight Arrangement
Concessioning Authority and Independent Agency - M/s SENES Consultants India Pvt. Ltd – for detailed project monitoring
Present Status of Project: The project is operational and is meeting expected outcomes.
Project timeline
1996 Supreme Court judgement issuing several directives to the Municipal Corporation of Delhi (MCD) and NDMC for proper conduct of Solid
201

Waste Management 1998 Supreme Court judgement reprimanding NDMC
and MCD for non compliance with earlier directives, and setting up the Asim Burmon Committee, whose recommendations were used to formulate the Municipal Solid Waste (Management and Handling) Rules 2000
2004 Appointment of a transaction advisor and conduct of technical and feasibility studies
2005 Competitive bidding process with lowest quote for tipping fee as the bid parameter
2006 Award of the contract to M/s Ramky Energy and Environment Limited
PPP CONTEXT The following formed the background for the NDMC Waste Management Concession:
The Supreme Court of India made a series of judgements (in the Dr. B L Wadehra versus Union of India case, 1996 and the case of the writ petition filed by Almitra H Patel, 1998) - upholding the right of citizens of Delhi to live in a clean city, emphasizing the statutory obligation of NDMC and the MCD towards waste management and issuing directives towards efficient management of wastes in the city.
As part of the proceedings in the Almitra Patel case, the Supreme Court set up a Committee in 1996 under the chairmanship of Mr. Asim Burmon to make recommendations towards SWM in urban areas. Based on the recommendations, the Ministry of Environment and Forests notified the Municipal Solid Waste (Management and Handling) Rules, 2000. These rules are time bound, hold the Urban Local Bodies (ULBs) accountable and prescribe penalties for non-compliance and non-performance.
The existing system of waste management through NDMC staff was fraught with issues such as high manpower and operation costs, inefficiencies in collection and transportation, technologically archaic equipment and installations, mixing of wastes reducing efficacy of land fills and treatment plants etc.
Analysis of the system suggested that a large proportion of the cost incurred was on account of collection and transportation – Rs.556 (54 percent) out of an average cost of Rs.1029 per metric ton (MT). Analysis also indicated that costs could be significantly lower if such functions were carried out by a private operator.
202

PROJECT DEVELOPMENT
Project conceptualization In order to overcome capacity and financial constraints and to develop an efficient SWM system, the NDMC opted to engage the private sector for managing labour intensive tasks of collection and transportation of wastes. This was envisaged as part of a larger strategy, where better segregation would be practised at source, collected at the household level through rag pickers organized through NGOs, and collected, further segregated and transported separately to existing landfill and treatment sites by the operator. The project was expected to facilitate better collection/transportation at lower costs and increase the efficiency of post processing of wastes.
Project development The NDMC established an Advisory Committee for facilitating the decision making process, ensuring stakeholder participation, facilitating approvals and co-coordinating with various associated departments. The Committee was headed by the Chairman of NDMC and comprised of the Project Director, various technical advisors and a representative of the Health Department (Anchor Department).
Technical studies were conducted through a Transaction Advisor6 to review the gaps in existing mechanisms and ascertain the quantum of wastes to be handled by the private agency in addition to feasibility and value for money analysis.
Procurement procedure The contract was awarded in the form of an 8 year concession for 12 selected circles within NDMC through a competitive bidding process in 2006. Pre-qualification criteria included (other than financial profile of company) the experience of bidders in any of the following criteria:
Collection-transportation of at least 20000 tonnes/annum or annual billings of at least Rs.10 million from collection-transportation of any kind of wastes for each of the last 2 financial years
Handling of a fleet of at least 20 goods vehicles for each of the last 2 financial years
Transportation of at least 1 Lakh tonnes per annum of minerals, metals and materials such as iron ore, steel, coal, sand for each of the last 2 financial years
6 Infrastructure Development Finance Company Limited (IDFC)
203

Development of at least one core sector project with a project cost of at least Rs.150 million for government agencies in the last 5 financial years
The award – based on the lowest quote for tipping fee payable by NDMC (bid parameter) – was made to M/s Ramky Energy and Environment Limited based on their quote of Rs.468 per MT as the tipping fee.
CONTRACTUAL ARRANGEMENTS
Proposed contractual structure
TREA
TMEN
T SI
TE
SPEC
IFIE
D LO
CATI
ONS
LAND
FILL
INDE
PEND
ENT
AGEN
CYM
onito
r pro
ject
pro
gres
s
Ove
rsig
ht A
rran
gem
ent
Operator output obligations The contract detailed the scope of services to be provided by the Operator as follows:
COLL
ECTI
ON
SEG
REG
ATIO
NTR
ANSP
ORT
ATIO
N
WASTESM
SW
LAND
SCAP
E
WAS
TE
Mon
itor s
egre
gatio
n le
vels
CONS
TRUC
TIO
NDE
BRIS
Repo
rting
–pa
rticu
larly
se
greg
atio
n le
vels
NDM
C
Enco
urag
e So
urce
seg
rega
tion
Hand
over
pro
ject
facil
ities
RAM
KY
Conc
essi
onai
re
Colle
ctio
n an
d tra
nspo
rtatio
n
Cape
x/O
pex
Deve
lopi
ng b
uilt
facil
ities
such
as
trans
fer s
tatio
ns
Payment of tipping fees
Conc
essi
onin
g Au
thor
ity
Tipp
ing
fee
calcu
late
d on
the
basis
of s
egre
gatio
n ac
hiev
ed
204

Provision of new facilities such as street corner bins, garbage stations and equipment and vehicles
Collection of Municipal Solid Waste (MSW) and Landscape Waste (LW) from street corner bins and garbage stations and provision of sorting facilities for segregating bio-degradable and non-degradable components of MSW
Transportation of MSW to Treatment or Landfill facility and LW to Treatment facility and ensuring that construction debris is not mixed with the MSW
Deployment of requisite manpower for carrying out various functions, and providing them with uniforms and safety equipment
Adherence to segregation benchmarks and transportation of degradable and non-degradable wastes in separate colour coded vehicles
Provision of a Workshop facility outside the NDMC area for servicing and maintenance of vehicles
Operation and Maintenance of all project facilities in accordance with requirements as notified by the Independent Engineer.
Conduct of awareness campaigns in collaboration with NDMC to sensitize citizens to practice source segregation of wastes
Development of a Complaint Handling Cell and establishment of standard protocol for grievance redressal
Handover vacant and peaceful possession of project facilities (excluding equipment and vehicles) free of cost and in good operating condition at the end of the Concession period.
Obligations of the concessioning authority Obligations of NDMC as per contract included peaceful and timely handover of all related project facilities free of all encumbrances within 15 days and granting and facilitating timely approvals required by the Concessionaire for carrying out his obligations.
Regulatory and monitoring arrangements M/s SENES Consultants India Pvt. Ltd was appointed as an independent monitoring agency for the project. Responsibilities of the agency included:
Monitoring of performance under project and approving (where required as per contract) the design, implementation and maintenance of facilities
205

Reporting to both the parties involved on various physical, technical and financial aspects of the project based on field visits and inspections
Verification of weighing equipment and testing of MSW at treatment/landfill facility to measure segregation levels
Review matters related to safety and environmental management and assisting the parties in amicable settlement of disputes
Project financials All investments (including built facilities such as transfer stations and obtaining land for the purpose) were to be made by the Concessionaire.
The Concessionaire was to recover his investments through tipping fees, payable monthly by the NDMC on a tonnage basis. While a base fee was fixed as per contract, the tipping fee was calculated through a prescribed formula using factors such as actual segregation achieved and penalty for non-compliance with segregation benchmarks. An escalation rate for the tipping fee was also incorporated within the contract.
The Concessionaire was entitled to further recovery of investments through the sale of recyclable and other material collected.
Revenue from all advertisements (except at NDMC dhalaos which were contracted on a BOT basis prior to this contract) was to be shared on a 3:1 basis between the Concessionaire and NDMC.
Project risks and allocation
Construction Risk
Including time and cost overruns due to contractor default, was borne by the operator. Only certain approvals and risks due to unforeseen conditions were shared between the Concessionaire and NDMC. Overruns due to delays in handover by NDMC, including removal of encumbrances obstructing free access to sites, was borne by NDMC.
Operating Risk
Including design of the system, procurement, operation and maintenance of equipment, management of nuisance such as birds/animals at dhalaos, ensuring segregation of wastes at dhalaos before transportation etc. were borne by the Operator. Allied factors such as closure/shifting of prevalent landfill site which could affect operations were borne by NDMC
Revenue Risk
Borne by the Concessionaire since tipping fee was based on tonnage and segregation levels achieved
206

and the NDMC did not guarantee complete source segregation or a minimum quantum of waste supply.
Performance Risk
Borne by the operator through a performance guarantee for a period of 18 months from the date appointed as per contract. The tipping fee also took into consideration performance of the operator in terms of level of segregation achieved.
Force Majeure
The Concessionaire was protected against Political Force Majeure such as changes in laws regarding segregation, and other regulations affecting operations.
Disputes resolution mechanism All disputes were to be resolved amicably through direct discussion between the parties involved (with the help of the independent oversight body where needed). In the event of non-resolution the dispute was to be settled through arbitration processes as prescribed under the Arbitration and Conciliation Act, 1996.
PARTNERSHIP IN PRACTICE Notwithstanding initial delays during the bid process, the project has been successful in meeting general expected outcomes. Segregation benchmarks have however not been achieved, largely because of inadequate monitoring at the primary stage of the waste collection chain. Such segregation was initially envisaged through a mix of source segregation by residents and segregation through ragpickers (co-ordinated through NGOs). This has however not been achieved.
LESSONS LEARNT Importance of structuring operator obligations in a way that monitoring is in-built into the structure and quality services are ensured. In this case the linking of tipping fee with other obligations such as maintenance of a certain level of segregation of waste acts as a monitoring device.
While the project has largely been successfully implemented, the expected levels of segregation have not been achieved. It was expected that a larger city level strategy where community groups would practice source segregation and undertake primary collection could be implemented. The efficiency of the private partner to deliver segregated wastes was contingent upon the efficiency of such a primary system. It was also thought that the private partner would work actively with the community groups and stakeholders like rag pickers to ensure that the waste segregation targets are achieved. However, lack of adequate efforts to operationalise and incentivise such systems, have led to non-achievement of segregation benchmarks. It is also clear that NDMC
207

also has a critical role to play in this process and cannot leave it entirely to the private partner.
6. SANITARY LANDFILL AT MAVALLIPURA BANGALORE
CASE OVERVIEW Country: India
ULB: Bangalore, Karnataka
Sector: Urban Basic Services
Sub-Sector: Solid Waste Management
Award Date: August 2004
Type and Period of concession: Build-Operate-Transfer contract for 20 years followed by post closure monitoring for 15 years
Stakeholders:
Contracting Authority
Bruhat Bengaluru Mahanagara Palike (BBMP)
Concessionaire M/s Ramky Enviro Engineers Limited Oversight Arrangement
Through the Concessioning Authority and through the Independent Engineer appointed for regular monitoring.
Present Status of Project: The project is operational presently.
PPP CONTEXT The Ministry of Environment and Forests notified the Municipal Solid Waste (Management and Handling) Rules in 2000. These rules are time bound, hold the Urban Local Bodies (ULBs) accountable and prescribe penalties for non-compliance and non-performance; triggering among other things the need for improved waste disposal practices such as scientific disposal and sanitary land filling.
Total generation of Municipal Solid Waste (MSW) in Bangalore at the time of commissioning of the project was about 2500 tons per day (including compostable and recyclable wastes). The city did not have a properly designed system for disposal and the wastes generated were disposed off at open dumping facilities on the outskirts of the city. This led to issues such as unhygienic conditions, pollution of ground water due to percolation of pollutants from the garbage into the earth, nuisance due to scavenging birds etc. There was clearly a need to implement a scientific disposal system for the city.
208

PROJECT DEVELOPMENT
Project conceptualization The project envisaged a simple procedure for handling MSW generated in the city – rendering the wastes ‘inert’ followed by sanitary landfill of the inert residual matter. The landfill project was proposed for a capacity of 1000 tons per day spread over two sites. The first project (subject of this case) was for a 100 acres site at Mavallipura to handle 400 tons of MSW per day. Engagement with a private partner was expected to bring the required technical capacity and experience to the project, and the Concessionaire was to be responsible for design, construction, operation and long term maintenance (20 years when the site would be operational and 15 years after closure of the site due to saturation) of the land fill. BBMP undertook the task of delivering the wastes to the site. Since no direct revenues (except possible sale of composts and recyclables) were to accrue from the project, it was decided to pay the Concessionaire on a ‘tipping fee per ton’ basis.
Between 2001 and 2004, the Government of Karnataka (GoK) through the BBMP, the Transaction Advisor7 and the Bangalore Agenda Task Force (BATF), which comprised of a team of experts in MSW management, undertook activities for setting up scientific land fills for the waste generated within the City. About 111 acres of land spread across nine sites within the Bangalore district was available for the purpose (allotted in 2000 by the Revenue Department, GoK).
BBMP conducted several background studies for the project through the Transaction Advisor including feasibility study, location analysis, capacity and expected duration for saturation of chosen site, quantum of wastes to be handled by the private player etc.
Preliminary investigations of feasibility of allotted lands for the purpose of developing landfills revealed that 7 out of the 9 sites could not be used due to various environmental and social (proximity to existing habitation and public resistance) reasons. The final sites were decided after conducting detailed Environmental Impact Assessment, commitments from the BBMP to relocate certain existing functions outside the mandatory 500m buffer zone (as per MSW 2000 Rules) and after additional acquisition of land since the allotted lands at the chosen sites was inadequate.
Detailed layout and drawings were prepared by the public agency for the land fill site and the use of the designs was optional for the Concessionaire. In any case the responsibility for the design was borne by the Concessionaire.
7 Infrastructure Development Corporation (Karnataka) Limited (IDeCK)
209

Review of the progress of project development activities was carried out on a weekly basis. The meeting was attended by representatives of BBMP, BATF, and the Transaction Advisor who discussed the various activities undertaken and action to be taken during the development stage. Whenever bottlenecks emerged, the matter would be taken up and resolved at the higher level with the Commissioner, BBMP or Secretary, Urban Development Department or any other senior office of the relevant Government Department.
Procurement procedure Procurement of the Concessionaire was based on a two stage (RfQ followed by RfP) competitive bidding process. The final contract was awarded to M/s Ramky Enviro Engineers Limited in August 2004, based on their lowest quote for tipping fee per ton of residual inert matter going into the landfill (bid parameter).
210

CONTRACTUAL ARRANGEMENTS
3.1 Proposed contractual structure
LAND
FILL
RAM
KY
DURI
NG
OPER
ATIV
E PH
ASE
POST
CLO
SURE
PH
ASE
DEVE
LOPM
ENT
TREA
TMEN
T
LAND
FIL
LING
CAPP
ING
MAI
NTEN
ANCE
Trea
tmen
t and
land
fillin
g of
iner
t res
idual
waste
Long
term
dec
ompo
sition
of
was
tes
SATU
RATI
ONCo
nce
Operator output obligations The Concessionaire was responsible for
Finalizing the design after consultations with the Independent Engineer appointed for the project and after approval from the BBMP within 90 days of commencement of contract
Financing and undertaking all construction work for the waste processing unit and landfill facility. Completing at least one cell of the landfill (ready for receipt of inert waste) within 10 months from the signing of contract
ssio
naire
LAND
TRAN
SPOR
T OF
W
ASTE
S
BBM
P
Conc
essio
ning
Auth
ority
Paym
ent o
f tipp
ing fe
es p
er to
n of
iner
t was
te la
nd fil
led
Gu
aran
teed
qua
ntum
of w
aste
INDE
PEND
ENT
Mon
itor p
rojec
t pro
g
Over
sight
Arra
nge AGE
NCY
ress
men
t
Repo
rting
211

Processing the waste transported by the BBMP (maximum of 600 tons per day beyond which the Concessionaire could decline to process the excess) to the designated site, making it inert and disposing the inert residual matter at the same site through sanitary land filling technique.
Conversion of amenable portions of the MSW into compost/manure and supplying a fixed 500 tons to the BBMP per year
Carrying out procedures as per the specifications prescribed in the MSW Rules 2000 and obtaining necessary clearances from the Karnataka Pollution Control Board (KPCB) on a periodic basis.
Continuing operations for 20 years or up till the saturation of the landfill (whichever comes earlier)
‘Capping’ the landfill upon saturation and undertaking ‘post closure maintenance’ for the next 15 years
Handover of the project facility in good operating condition and free of cost at the end of the contract period
Obligations of the concessioning authority The Concessioning Authority was responsible for the following:
Handing over peaceful possession of chosen site for the project to the Concessionaire within a period of 15 days from the start of the concession.
Supplying a minimum quantity of 400 tons of MSW per day at own costs. Supplying only inert waste to the Concessionaire up till the completion of the first landfill cell.
Regulatory and monitoring arrangements The BBMP monitored the performance of the Concessionaire as per the provisions of the contract. M/s Tetra Tech India Limited was appointed as the Independent Engineer for:
Conducting regular monitoring
Approving (where required as per contract) the design, implementation and maintenance of project facilities
Reporting to both the parties involved on various physical, technical and financial aspects of the project based on field visits and inspections,
Granting completion certificates, verifying weighing equipment, monitoring of compliance with prescribed methods for land filling, verification of extent of saturation of the landfill and reviewing matters related to safety and environmental management
Assisting the parties in amicable settlement of disputes.
212

Project financials All investments for constructing, operating and maintaining the site for the project period (including investments required during post-closure maintenance phase) were borne by the Concessionaire.
Revenue for the Concessionaire was essentially through ‘tipping fees’ per ton of inert residual waste landfilled at the site. 85 percent of the tipping fee was paid immediately, and 15 percent was to be paid upon successful post closure maintenance of the site. A separate ‘Post Closure Performance Account’ was created and the Concessionaire was to receive the remaining 15 percent in the form of 60 quarterly payments over 15 years.
BBMP guaranteed a minimum supply of waste (400 tons per day) to the Concessionaire, failing which the BBMP had to bear charges for the remaining quantum.
The Concessionaire was expected to work towards obtaining carbon credits through management of greenhouse gas emissions. Benefits of the carbon credits (when available) would be shared equally between the Concessionaire and BBMP.
Proceeds from sale of manure developed from the MSW accrued entirely to the Concessionaire (except the minimum annual supply of 500 tons to the BBMP). Proceeds from sale of recyclables also accrued to the Concessionaire.
Project risks and allocation
Construction Risk
Including time and cost overruns was borne by the operator. Overruns due to delays in handover of land by BBMP, including removal of encumbrances obstructing free access to the site was borne by BBMP.
Operating Risk
Borne by the Concessionaire since operations and procedures were to be conducted as specified in the contract and in accordance with various environmental and MSW rules.
Performance Risk
Borne by the Concessionaire since the contract specified the output parameters to be achieved and penalties could be imposed in case of default. This was further allocated through a Performance Guarantee valid for a period of 24 months from the date appointed as per contract
Investment Risk
All capital and O&M expenditure was borne by the operator for developing and managing the landfill facility
213

Revenue Risk
Even though payment was based on a ‘tipping fee per ton’ basis, the revenue risk for the Concessionaire was mitigated through assured quantum of waste supply by the BBMP. The Concessionaire however bore the ‘payment risk’ from the BBMP since no separate fund was created for the project so as to ensure timely payments
Policy Risk The Concessionaire was protected against changes in laws and policies that could affect their operations.
Disputes resolution mechanism All disputes were to be resolved amicably through direct discussion between the parties involved (with the help of the independent oversight body where needed). In the event of non-resolution the dispute was to be settled through arbitration processes as prescribed under the Arbitration and Conciliation Act, 1996.
PARTNERSHIP IN PRACTICE The land fill presently treats and disposes almost 200-300 tons of MSW per day. While this is lesser than originally envisaged (refer 4.2) the facility is by and large meeting its commitments.
Project shortcomings The project originally envisaged a facility spread over 3 sites with a capacity to handle 1000 tons of MSW per day. This first project at Mavallipura required 100 acres of land to be made available to the Concessionaire. In reality however only 70 acres were eventually handed over since the BBMP realized that 30 acres of the proposed site were not under its possession. As a result the project handles approximately 200-300 tons of MSW per day instead of the earlier objective of 400 tons and above.
Local villagers living in the vicinity of the landfill have objected to the project, both through resistance before the start of the project as well as during the operation phase by locking up the facility on some occasions. The primary concern of the villagers is the run-off of leachate during heavy rains.
Legal/contractual issues There were no formal disputes, though the issues mentioned above caused concern. Matters have been settled between BBMP, the
214

Concessionaire, and the local villagers through repeated and ongoing negotiations.
LESSONS LEARNT The failure of the BBMP to hand over committed quantum of land for the sanitary landfill has resulted in both reduced capacity of the scheme as also reduced revenue expectations for the private Concessionaire (quantum has reduced but period of concession has remained the same). Though the issue was resolved amicably it could have had very serious consequences for the future of the project since the very basis of the revenue forecasts had been changed. The importance of gaining possession of adequate land before committing to the obligation cannot be understated.
The project also highlights the importance of committed efforts by Public Authorities to ensure implementation of a project. The procedure of weekly meetings amongst project stakeholders to ascertain project progress and regular monitoring and intervention by top management followed in the case became a trendsetter for all future projects.
The project provided a unique opportunity to levy appropriate user charges, create a revenue stream for future recurring and capital expenses for SWM and create a framework which would be sustainable for the ULB in the long run. However due to certain logistical reasons the BBMP has not been to implement such user fees.
Importance of proper information, education and communication (IEC) so as to avoid resistances from other stakeholders. This is particularly important in sectors such as waste management due to the ‘nuisance’ value and ‘not in my back yard (NIMBY)’ syndrome associated with its processes.
The complaints of the citizens may nevertheless have been justified and as such projects of this nature should insist on incorporating environmental safeguards and if required insist on use of more appropriate and safe technologies.
7. EXPRESS METRO RAIL LINK FROM NEW DELHI RAILWAY STATION TO AIRPORT
CASE OVERVIEW Country: India
ULB: New Delhi
Sector: Urban Transport
Sub-Sector: Transit Systems
215

Award Date: January 2008
Type and Period of concession: Build-Operate-Own-Transfer (BOOT) Concession for 30 years
Stakeholders:
Contracting Authority
Delhi Metro Rail Corporation Limited (DMRC), a Joint Venture between Government of India (GoI) and Government of National Capital Territory of Delhi (GNTCD)
Concessionaire Special Purpose vehicle (SPV) – Delhi Airport Metro Express Private Limited (DAMEPL) – formed between Reliance Infrastructure and CAF, Spain
Oversight Arrangement
Through the Concessioning Authority and through Independent Assessors appointed for ascertaining safety of the installed systems.
Present Status of Project: The project is expected to be operationalised by September 2010.
Project timeline:
2007 Competitive bidding process for selection of Concessionaire
2008 Award of the contract to DAMEPL – SPV between Reliance Infrastructure and CAF, Spain
2010 Expected completion of the Delhi Airport Metro express project
PPP CONTEXT The Airports Authority of India (AAI) forecast a steep growth in air traffic to be handled at the IGI airport in Delhi due to the Commonwealth Games to be held in the city in 2010. Annual traffic is estimated to grow from 12 million passengers in 2004-05 to 40 million by 2011-12 (233 percent growth).
At present the movement of passengers between the Airport and the City is largely through taxis and private cars, with a limited number of passengers using buses for the purpose. Due to heavy congestion the average travel speed is as low as 20-25 kmph and the average travel time ranges between 40 minutes to an hour (during peak hours). The condition is expected to worsen despite improvements in roads.
216

In order to address this issue, the AAI proposed a metro rail link between the city and the airport, and requested the DMRC to undertake the project as a part of the ongoing Delhi Metro project. DMRC, a Joint Venture between GoI and GNCTD, has already completed 65.1 km of Metro Rail for Delhi in Phase I and has taken up the airport link project as part of the 121 km stretch being developed as part of Phase II. The project is targeted to be completed before the start of the Commonwealth Games in October 2010.
PROJECT DEVELOPMENT
Project conceptualization Metro rails involve very high construction and maintenance costs, and high investment risks due to low returns. Such projects are thus unattractive for the private sector and are usually undertaken through EPC contracts. To address this, the Delhi Airport Metro Express (DAME) project was structured innovatively – employing the EPC mode for all civil constructions and a PPP mode for installing and operating the actual rail service. This structure was aimed at sharing the investment risk between the public and private sectors, thereby making the project attractive and utilising private expertise for developing a high quality facility in a time bound manner.
A preliminary Origin-Destination (O-D) Survey revealed that the maximum airport traffic originated in the Connaught Place (CP) area and its vicinity and hence the rail link has been proposed between New Delhi Railway Station (close proximity to CP) and the airport – attracting commuters from the northern, north western, central and trans-Yamuna areas of Delhi. Connection to a railway station is also expected to facilitate direct transit for passengers using Delhi as a connecting point en-route to their destinations.
Project development Various primary surveys were undertaken by the Transaction Advisor8 to supplement available secondary data regarding existing traffic volume, O-D of passengers coming to the airport, willingness to shift to the proposed rail link etc. Environmental Impact Assessment was also conducted for the proposed alignment. The willingness surveys indicated that 82 percent of the respondents were likely to shift to the new facility.
Feasibility studies were also undertaken including demand forecasts and detailed cost estimates for civil, electrical and telecommunications works, rolling stock, environmental impact mitigation, rehabilitation etc.
8 M/s Feedback Ventures
217

at 2006 prices, both for capital and operation and maintenance (O&M) expenditure.
Procurement procedure Procurement of Concessionaire was based on a two stage competitive bid. Criteria for eligibility included, in addition to financial profile of bidding consortia, technical criteria as follows:
The Applicants must have prior experience of developing or operating and maintaining rail based urban transport system or should have been a major equipment supplier for a rail based urban transport system
The Applicant should have installed systems including testing and commissioning for major Rail system/operated and or maintained Major Metro Rail/Rail/supplied electro-mechanical or signaling equipments including Rolling Stock in the last ten years.
Works less than Rs.300 Crore were not considered for the selection
Delhi Airport Metro Express Private Limited (DAMEPL) – an SPV formed between Reliance Infrastructure and CAF, Spain was awarded the 30 year contract in January 2008, on the basis of their highest quote for annual concession fees to be paid to DMRC (bid parameter).
218
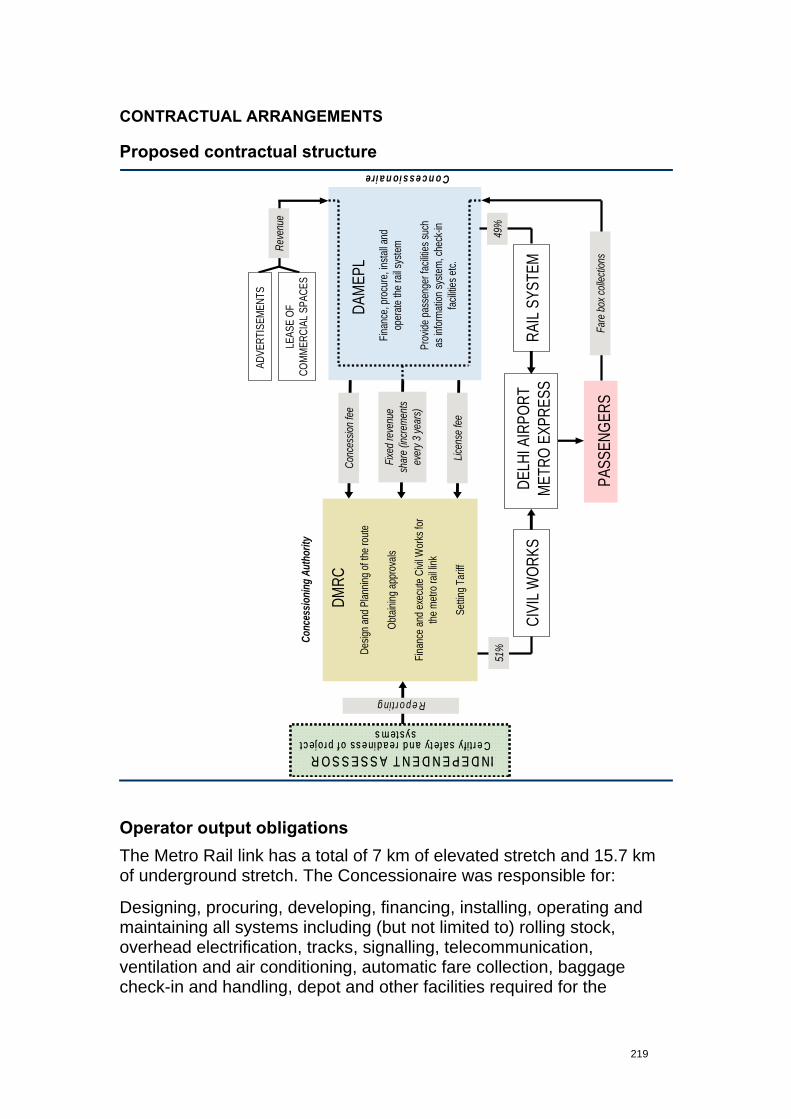
CONTRACTUAL ARRANGEMENTS
Proposed contractual structure
Desig
n and
Plan
ning
Obtai
ning a
ppr
Finan
ce an
d exe
cute
the m
etro r
ail
Settin
g Ta
DMRC
of th
e rou
te
ovals
Civi
l Wor
ks fo
r lin
k
riff
Finan
ce, p
rocu
re, in
stall a
nd
oper
ate th
e rail
syste
m
Prov
ide pa
ssen
ger f
acilit
ies su
ch
as in
forma
tion s
ystem
, che
ck-in
fac
ilities
etc.
DAME
PL
Concessionaire
PASS
ENGE
RSPA
SSEN
GERS
DELH
I AIR
PORT
ME
TRO
EXPR
ESS
horit
yCo
nces
sioni
ng A
ut
Conc
essio
n fee
ADVE
RTIS
EMEN
TS
CIVI
L WOR
KSRA
IL SY
STEM
49%
Fixed
reve
nue
shar
e (inc
reme
nts
ever
y 3 ye
ars)
Fare
box c
ollec
tions
LEAS
E OF
COMM
ERCI
AL S
PACE
S
Reve
nue
Licen
se fe
e
51%
Reporting
INDEPENDENT ASSESSORCertify safety and readiness of project
systems
INDEPENDENT ASSESSORCertify safety and readiness of project
systems
Operator output obligations The Metro Rail link has a total of 7 km of elevated stretch and 15.7 km of underground stretch. The Concessionaire was responsible for:
Designing, procuring, developing, financing, installing, operating and maintaining all systems including (but not limited to) rolling stock, overhead electrification, tracks, signalling, telecommunication, ventilation and air conditioning, automatic fare collection, baggage check-in and handling, depot and other facilities required for the
219

successful operation of the link. Making available 8 trains (as per specifications) with 6 coaches each for the rail link service.
Providing state-of-the-art passenger facilities such as cushioned seats with armrests, overhead baggage compartments, access to real time updated flight information through display boards, CCTV cameras for surveillance and security and airline and baggage check-in facilities at all stations along the rail link.
Equipping each station along the rail link with fully automated access for passengers from the ground to the trains through lifts and escalators and provision of adequate parking facilities at such stations
O&M of the entire system (including periodic testing) for 30 years (including construction time) as per the detailed O&M manual developed in consultation with DMRC.
Obligations of the concessioning authority Obligations of the Concessioning Authority included provision of land, obtaining clearances, setting of the tariff, construction of all civil work for the project and timely handover of the same to the Concessionaire.
Regulatory and monitoring arrangements The Concessionaire was to submit to the DMRC, monthly progress reports during the construction period, and maintenance reports (in accordance with the O&M manual) thereafter. The Concessionaire will appoint Independent Assessors as the Commission of Rail Safety may require, for certifying that all project systems are ready and capable for safe operation.
Project financials All capital expenditure for the civil works required for the rail link was to be borne by DMRC. Investments for the rail system and all allied infrastructure was to be borne by the Concessionaire. O&M costs for the entire system including civil works were borne by the Concessionaire. Of a total project cost of Rs. 5800 Crore, Rs.2915 Crore was to be borne by DMRC and the remaining Rs.2885 Core by the Concessionaire.
Recovery of investments for the Concessionaire was envisaged through fare box collections (Rs.15/person/trip), advertisement revenue, lease of commercial spaces (built along side the rail infrastructure), and from other sources such as vending machines, retail outlets etc.
The Concessionaire would pay the DMRC Rs.10,000 per annum as licence fee in consideration of grant of site and right of way (ROW) under the project. The Concessionaire would also pay a Concession fee (bid parameter) of Rs.51 Crore to DMRC per year (to be cumulatively
220

increased by 5 percent every year). In addition to this the Concessionaire will share a percentage of its revenue with DMRC as follows:
Period Percentage of shared revenue 1st to 5th year 1 percent 6th to 10th year 2 percent 11th to 15th year 3 percent 16th to 30th year (end of concession)
5 percent
Project risks and allocation
Construction Risk
Including time and cost overruns due to contractor default, was borne by the operator. Overruns due to delays completion and handover of civil works was borne by DMRC.
Operating Risk
Including design of the system, procurement, and O&M of equipment and systems, was borne by the Operator. Design risks for overall route plan and the civil works undertaken were borne by the DMRC.
Performance Risk
Borne by the Concessionaire (excepting for Civil Works) through a Performance Guarantee, initially valid for a period of 5 years and renewable from time to time.
Investment Risk
Shared between the two parties, since DMRC was responsible for civil works and the Concessionaire for costs of procuring, installing and operating the rail link system
Revenue Risk
Including demand risk was borne by the Concessionaire since revenues were based on fare box collections and revenue from advertisements, lease of commercial spaces etc. DMRC did not assure fixed returns. Besides the Concessionaire had to pay DMRC a fixed annual concession and license fee irrespective of the revenue generated.
Force Majeure
The Concessionaire was protected through provisions for commensurate extensions in the concession period as deemed adequate to compensate for the time lost on account of a
221

Force Majeure event.
Disputes resolution mechanism All disputes were to be resolved amicably through direct discussion between the parties involved (with the help of the independent oversight body where needed). In the event of non-resolution the dispute was to be settled through arbitration processes as prescribed under the Arbitration and Conciliation Act, 1996.
PARTNERSHIP IN PRACTICE
Project outcomes The project is not yet operational. However, expected outcomes from the project include the following:
Approximately 42,000 passengers will be able to avail the facility on a daily basis by September 2010
Travel time will be reduced substantially – from the present average of one hour to around 18 minutes. Air bound passengers will be able to reduce time spent at the airport through check-in facilities at the stations
Both international and domestic passengers will find it convenient to use the service, since the metro station at the airport is proposed to be built close to terminals 3 and 4 which will handle both international and domestic traffic after 2010
Passengers will be able to avail of the improved services at a nominal rate of Rs.15 per trip leading to substantial per trip cost savings in comparison to using taxis or private vehicles.
Project Shortcomings Project implementation is underway and so far there have been no major shortcomings.
Legal/contractual issues Despite a robust environmental impact analysis conducted at the outset, objections against the project have been raised on several occasions. The Delhi Urban Arts Commission (DUAC) had objected to the proposed route, which passed through heritage and environmentally sensitive areas, particularly the underground section leading up to Dhaula Kuan. Similarly the Home Ministry objected to the underground high speed tunnel between CP and the Airport, citing possible security concerns for the administrative zones. DMRC modified the plan and the revised proposal has been cleared by a group of ministers.
222

The Bureau of Civil Aviation had objected to the direct baggage check-in facility to be provided at the metro stations along the route, citing security concerns. This has now been overcome with the Delhi Airport developer – Delhi International Airport Limited (DIAL) constructing a separate secure tunnel to ensure contamination free transfer of checked-in luggage to the respective aircrafts.
LESSONS LEARNT The project demonstrates that even financially unattractive projects with low returns on investments can be undertaken through private participation through a good risk sharing arrangement. The decision of DMRC to take on the investment risk for civil works, thereby reducing the overall risk for the operator made the project viable for the private partner.
The project has been able to bring in almost half of the investment required for the project from the private sector, and obtain technical expertise for building a world class facility. The Concessioning Authority will also be able to recover a large proportion of its own initial investments through the various concession fees and shares of revenue accruing from the Concessionaire.
The importance of robust project development and obtaining all necessary clearances and conducting stakeholder consultations so as to arrive at a consensus on the project layout cannot be understated. Objections raised during the course of project implementation can lead to substantial time and cost overruns and revenue losses to both parties involved in the arrangement.
8. INDORE CITY BUS CONCESSIONS
CASE OVERVIEW Country: India
ULB: Indore, Madhya Pradesh (MP)
Sector: Urban Transport
Sub-Sector: Transit Systems
Award Date: 2005
Type and period of concession: Separate contracts for bus operations, advertisement and pass vending (renewable every 5 years)
223

Stakeholders:
Contracting Authority
Indore City Transport Services Limited (ICTSL) – Special Purpose Vehicle (SPV) between Indore Municipal Corporation (IMC) and Indore Development Authority (IDA)
Concessionaire The SPV manages 3 sets of private operators: Bus Operators: Dayajeet Nimay Logistics Private Limited, Rama Jyoti Travels, Anam Travels, Priyadarshani Transport Service - each operating on designated routes Pass Issuing Agency: R Square Systems and Solutions Advertising Agency: Giriraj Advertising and Marketing Services
Oversight Arrangement
Concessioning Authority
Present Status of Project: The project is running successfully since 2006.
Project timeline:
Dec 2005 Constitution of the ICTSL as a SPV for implementing a bus public transport system
Dec 2005 Conduct of background studies, design of routes and system and finalization of bus model
Dec 2005 Bidding process for selection of private Bus Operators
Jan 2006 Bidding process for selection of Advertisement Agency and Pass Issuing Agency
Jan 2006 Successful launch of the Bus Transport System
PPP CONTEXT Indore (largest metropolis in MP) has experienced rapid economic and demographic growth in the past couple of decades, resulting in substantial increases in the workforce and resultant travel demand.
Public transport in Indore is essentially road based, and prior to the ‘Bus Concessions’ it was restricted to privately operated mini buses (Nagar Sewas), tempos and auto rickshaws. As a disintegrated and non-regulated system, it was perpetually plagued by problems of overcrowding and non-reliability.
224

In the absence of a good public system, the city experienced an increase in private transport (accounting for 51 percent of trips), albeit without a commensurate increase in the carrying capacity of existing roads leading to frequent bottlenecks. There was an urgent need for implementing an efficient mass transport system.
The sector lacked a specialized regulatory agency to implement and monitor an integrated road transport solution. In order to address this Indore City Transport Services Limited (ICTSL) was constituted in 2005 as an SPV with equal contributions from IMC and IDA. Management was entrusted to a Board of Directors, with the District Collector as the Executive Director. The SPV was a thinly capitalized entity - expected to lead private operators under a unified bus system for the city.
PROJECT DEVELOPMENT
Project conceptualization The project was envisaged as a city level bus system, which integrated various private operators under a single system - designed, managed and regulated through ICTSL. Key features of the proposed system were:
Standardized and colour coded ultra modern buses plying along select high traffic routes of the city
Improved compliance with schedules due to real time tracking of vehicles, through a Global Positioning System (GPS) based On Line Bus Tracking System (OLBTS) managed from a central control point
Computerized ticketing and Pass Vending (allowing user unlimited travel on any route for a month)
GPS based Passenger Information System for displaying arrival times and other information through LED displays installed at bus stops
Project development The Collector of Indore, Mr. Vivek Aggarwal, acted as the chief architect and champion for the Indore Bus Concession Model, conceptualizing the framework based on his studies of bus systems in Curitiba (Brazil) and Bogota (Columbia). He was also instrumental in the formation of ICTSL (December 2005), which was to anchor and regulate the proposed system.
Implementation of the project was proposed within a very short period of 56 days and hence all system design and studies were undertaken in-house and completed within a fortnight of constitution of the SPV
225

Background studies included analysis of financial feasibility, and surveys to finalize bus routes which would provide maximum passenger traffic. 18 routes were finalized in consultation with the Road and Transport Authority (RTA).
A movement system was designed as a hub-spoke pattern to cover both personal and workplace commuting requirements. Bus routes and buses were to be colour coded for ease of identification.
Ultramodern low-floor TATA buses were selected as the standard model to be procured by operators.
A pre-bid meeting was hosted on December 20, 2005 to introduce the business aspects of the project and address queries, so as to encourage private bidders.
Procurement procedure Competitive bidding process for selection of bus operators was held in December 2005 for each of the bus routes. The following companies: Dayajeet Nimay Logistics Private Limited, Rama Jyoti Travels, Anam Travels, Priyadarshani Transport Service were selected for operating on designated routes, based on the quotes for highest monthly premium to be paid to ICTSL.
Competitive bidding process for pass issuance agency was held in January 2005. Square Systems and Solutions was selected on the basis of their quote for cost per pass.
Competitive bidding process for advertising agency was held in January 2005. Giriraj Advertising and Marketing Services was selected on the basis of its quote for highest revenue offered per bus per month.
226

CONTRACTUAL ARRANGEMENTS
Proposed contractual structure
Operator output obligations
Bus Operators Procure and maintain buses as per specifications laid down in the contract (ultramodern low-floor TATA Starbus) Operate buses on fixed routes and as per predetermined schedules
Pass Issuance Agency
Set up Instant Pass Centres throughout the city and administer computerized vending of uniform monthly passes Issue a minimum of 15,000 passes in a month so as to ensure a minimum revenue stream
Advertisement Agency
Provide all advertisement equipment, generate and manage in bus advertisement and ensure a fixed monthly revenue stream to the ICTSL and the bus operators.
Concessioning authority
System Planning and management, tariff fixation
Management of Revenue Sharing arrangement
GPRS based real time bus tracking
Passenger Information System
Common ticketing Facilities
Advertisements through LEDs at bus stops
ICTSL (SPV)
Procure and maintain buses as per predefined
specifications
Operation buses on fixed routes
BUS OPERATORS
Con
cess
iona
ire
USERS
Con
cess
iona
ire
Generate and manage In-Bus advertisement
ADVERTISEMENT AGENCIES
CITY CORPORATION
Fixed amount per bus per day
Set up pass centres
Issue fixed rate passes
PASS AGENCIES
Pass revenue
83-88% of ICTSL share of pass
revenue 80% of all pass revenues
60% of fixed per bus per day
advertisement revenues
Con
cess
iona
ire 20% ICTSL – 80% Bus operator
40% ICTSL – 60% Bus operator
Provision of bus stops
Share of revenue from bus stop advertising
Revenue through monthly passes
Revenue through fare-box collections
Efficient mass bus transport system
227

Obligations of the concessioning authority Act as a regulator for the entire system, administer tariff fixation/revision, monitor quality and standard of services, and undertake planning and route management
Provide and maintain allied infrastructure such as bus stops (through IMC), GPS based passenger information system and common ticketing facilities
Manage the revenue sharing arrangement between operators
Regulatory and monitoring arrangements Regulation was through the SPV and the powers vested in it through executive orders of the Government.
Project financials All investments towards procurement and operation of buses, setting up of pass vending systems and advertising media were to be made by the respective private parties.
Investments for allied infrastructure (except bus stops developed by the IMC) were made by ICTSL
The following revenue streams and revenue-sharing mechanisms were envisioned as part of the project:
Revenue from fare-box collections: accrued entirely to Bus Operators for the specified bus routes
Revenue from passes: was shared on 80-20 basis between Bus Operators and ICTSL. ICTSL would retain 12.2 percent of its share in case of a new pass and 17 percent in case of a renewed pass and the remaining was given back to the pass issuance agency
Revenue from in-bus advertisement: accrued to the advertising agency and a fixed sum of Rs.25,000 was to be paid to ICTSL per bus per month. 60 percent of such advertisement revenue was shared by ICTSL with the Bus Operators
Revenue from advertisement at bus stops: and through ICTSL installed LEDs for displaying public information was shared between ICTSL and IMC
A monthly premium (bid amount) was paid by bus operators to ICTSL
228

Project risks and allocation The operators bore the investment and revenue risk since travel demand is variable and the Concessioning Authority did not guarantee fixed minimum payment to any of the Concessionaires. The risk was mitigated in part for the bus operators through the revenue sharing arrangements (described in 3.5).
Disputes resolution mechanism The ICTSL Board of Directors was responsible for settlement of all disputes arising from the contracts
PARTNERSHIP IN PRACTICE The project has been hailed as a major success and many organizations/cities have studied it with a view to replicate it.
Project outcomes The SPV operates 110 ultramodern buses through private operators in Indore. Success of the bus initiative has prompted ICTSL to expand into new systems such as a Bus Rapid Transit (BRT) System and a network of CNG call cabs.
Users have benefitted through direct benefits such as better facilities, increased reliability and ease of accessibility. The project has also brought in allied benefits such as time and cost savings (for people using private transport previously) and improvement in quality of services offered by competing mini buses and auto rickshaws
The project has generated high and steady revenues for ICTSL with minimal asset holding in the system
Bus operators have also gained advantages since there is no competition on the routes they operate.
The model has been replicated in all major cities in the State such as Bhopal, Gwalior and Ujjain as well as in other cities/States such as Raipur and Bilaspur (Chhattisgarh) and Ludhiana and Jalandhar (Punjab).
Project shortcomings The contract did not prescribe any particular formula (indexing or otherwise) for calculating periodic increases in bus fares. Decisions on fare revisions are the mandate of the ICTSL Board of Directors and its acceptance is subject to mutual understanding between the two parties.
The existing bus system is focused on high capacity arterial routes of the city. The system does not service all areas of the city and expansion through the same model may be difficult due to smaller roads, problems
229

230
of congestion and possible lack of enthusiasm from private parties due to lesser profits.
Legal/contractual issues The project has been operating smoothly since January 2006 and no legal or contractual complications have emerged during implementation.
LESSONS LEARNT The current case illustrates that PPP arrangements can be employed even in sectors such as city bus transport, which are typically seen as loss-making public services.
Robust institutional structuring and risk distribution has been the key to the success of the Indore Bus Concessions. ICTSL as an overall regulatory body assesses demands, plans routes, regulates tariffs, and monitors daily performance through a permanent team appointed for the purpose. This has allowed the system to achieve optimum functional distribution and run efficiently, despite the presence of a number of different private operators within the arrangement.
The project is also an excellent illustration of the manner in which all possible revenue streams (bus operation, advertising etc.) have been tapped and captured under a single system, with a revenue sharing mechanism that allows all private operators to get adequate returns.
Indore city started with a ‘clean slate’ since a State Transport Corporation was not already operational. In cities where such corporations do exist, extensive financial and manpower investment is already ‘sunk in’ and such an arrangement may be infeasible. Many such corporations are also hampered by not having the freedom to fix fares. Only those corporations, such as Bangalore Metropolitan Transport Corporation (BMTC) at Bengaluru, which have a reasonably better fare regime, manage to show profits in operations. As such replicability of the model in other cities may largely depend upon availability of such enabling preconditions.