report on annual survey of industriestte.delhigovt.nic.in/doit/des/archive/iip/asi2003-04.pdf-3- 10...
TRANSCRIPT

GOVERNMENT OF NCT OF DELHI
REPORT ON ANNUAL SURVEY OF INDUSTRIES
2003-2004
DIRECTORATE OF ECONOMICS & STATISTICS
ROOM NO. 148, OLD SECRETARIAT, DELHI – 110 054

PREFACE
The present report on Annual Survey of Industries (ASI) 2003-2004 of the Govt. of NCT of Delhi, Twenty Sixth in the series, being issued by the Directorate of Economics & Statistics, is based on data collected from the returns furnished to the National Sample Survey Organisation by the factories registered under Sections 2 m (i) & 2 m (ii) of the Factories Act, 1948. The report consists of two parts. The Part-I contains introduction, concepts and definitions and brief analysis of the industrial structure in the National Capital Territory, while Part-II is devoted to statistical tables. The report provides a comprehensive data on characteristics of the industrial activity. The report also contains important characteristics relating to capital structure, capital formation, employment pattern, input, output, value added by manufacture etc. It also highlights the distribution of principal characteristics by the employment size, capital size and type of ownership/organisation and by size of capital. The report has been prepared by Annual Survey of Industries Unit of the Directorate of Economics & Statistics under the guidance of Dr. R.N. Sharma, Dy. Director and Sh. J.P. Bageshwar, Research Officer.
Data scrutiny, Entry, validation and processing has been done by the EDP unit under the guidance of Sh. K.S. Bansal, System Analyst of this Directorate. The strenuous efforts made by Sh. Mahender Singh, Statistical Assistant of ASI unit of this Directorate are highly appreciated. The valuable co-operation, extended by Delhi Region of the Field Operations Division of the National Sample Survey Organisation of the Government of India through collection of data from the factories and providing clarification on scrutiny points is gratefully acknowledged. I hope the data published in this report will be useful to the Planners and Policy makers. Suggestion for improvement in the content of tables etc. in our future ASI reports are welcome. June, 2006
Dr. B K SHARMA DIRECTOR

CONTENTS CHAPTER DESCRIPTION Page
I Introduction 1 II Concepts & Definition 9 III General Review of Industrial Activity in 2003-2004 14
PART-II STATISTICAL TABLES
I Principal characteristics at a glance ASI- 2003-2004 33 II Important Characteristics by Major Industry Groups
(2 digit level of NIC – 1998) 34-38
III Important Characteristics by Major Industry Groups(3 digit of NIC-1998)
39-48
VI Principal Characteristics by Employment size and Capital Size 49-51 V Principal Characteristics by type of ownership and Type of
Organisation 52-53
VI Principal characteristics by size of Capital (2 digit level of NIC-1998)
54-56
VII General pattern of cost of production by size of capital 57 VIII General pattern of cost of production in different Industries 58 IX Principal Characteristics by year of initial production 59 X Distribution of worker and employees by Major Industry Groups 60 XI Distribution of factories according to type of Organisation 61 XII Distribution of factories according to type of Ownership 62 XIII Distribution of factories according to year of Initial Production 63 XIV Fixed capital by Major Industry Groups 64 XV Distribution of expenses on sale 65
Annexure-I

CHAPTER – I
INTRODUCTION
The Annual Survey of Industries (ASI) is the principal source of industrial
statistics in Delhi. It provides statistical information to assess and evaluate objectively
and realistically the change in the growth, composition and structure of the organised
manufacturing (Factory Sector) comprising activities associated with manufacturing
processes, repair services, personal services, sanitary services, generation and
transmission of electricity, gas, water supply and cold storages. Industrial sector occupies
an important position in Delhi’s economy and plays a pivotal role in the rapid and
planned economic development.
The Annual Survey Industries is conducted annually under the statutory
provisions of the collection of Statistical Act, 1953 and the rules framed there under in
1959. The work of collection of Industrial Statistics from the organised industrial sector
(Factory –Sector) has been entrusted to the Field Operations Division (FOD) of the
National Sample Survey Organisation ( NSSO) , Government of India. Under the
arrangement , provision has been made for the supply of a copy of each of the ASI
returns submitted by the factories to the NSSO (FOD) to the Directorate of Economics &
Statistics for use of State Government.
COVERAGE
2. Coverage of the Annual Survey of Industries extends to the entire Factory Sector,
comprising industrial units (called factories) registered under section 2(m)(i) and
2(m)(ii) of the Factories Act.1948, wherein a "Factory", which is the primary
statistical unit of enumeration for the ASI is defined as:-
"Any premises" including the precincts thereof:-

-2-
(i) wherein ten or more workers are working or were working on any day of the
preceding twelve months, and in any part of which a manufacturing process is
being carried on with the aid of power or is ordinarily so carried on,
or
(ii) wherein twenty or more workers are working or were working on any day of the
preceding twelve months, and in any part of which a manufacturing process is
being carried on without the aid of power or is ordinarily so carried on, but does
not include a mine subject to the operation of the Mines Act,1952, or a railway
running shed.
The "manufacturing process" referred to above has been defined under section 2(k) of
the Factories Act, 1948 as:-
“Any process” for- (i) making, altering, ornamenting, finishing, packing, oiling, washing, cleaning,
breaking up, demolishing or otherwise treating or adapting any article or
substance with a view to its use, sale, transport, delivery or disposal
or
(ii) pumping oil, water or sewage;
(iii) generating, transforming or transmitting power;
or
(iv) composing types for printing by letter press, lithography, photogravure or other
similar process or book binding; or
(v) constructing, reconstructing, repairing, refitting, finishing or breaking up ships or
vessels;
In addition to section 2(m)(i) & 2(m)(ii) of the Factories Act, 1948, electricity
units registered with the Central Electricity Authority and Bidi & Cigar units, employing

-3-
10 or more workers with the aid of power and 20 or more workers without the aid of
power and registered under the Bidi & Cigar Workers (Conditions of Employment) Act,
1966 are also covered in ASI.
Unit of Enumeration
The primary unit of enumeration in the survey is a factory in the case of
manufacturing industries, a workshop in the case of repair services, an undertaking or a
licensee in the case of electricity, gas and water supply. The owner of two or more
establishments located in the same state and pertaining to the same industry group and
belonging to same scheme (census or sample) is, however, permitted to furnish a single
consolidated return, termed as 'Joint Return'. Such consolidated returns are a common
feature in the case of bidi and cigar establishments, electricity and certain public sector
undertakings.
ASI Frame
The ASI frame is based on the lists of registered factories/units maintained by the
Chief Inspector of Factories in each state and those maintained by registration authorities
in respect of bidi and cigar establishments and electricity under-takings. The frame is
being revised once in three years from 1989-90 but updated every year by the regional
offices of the Field Operations Division of NSSO in consultation with the Chief Inspector
of Factories in the state. At the time of revision, the names of the de-registered factories
are removed from the ASI frame and those of the newly registered factories are added. In
updation, only new registrations are added to the existing frame. Inspite of regular
updating of the frame, quite a number of small-sized factories selected for the survey are
found to be non-existing in the field and are termed as deleted factories. However, such
factories are not taken into consideration for the purpose of tabulation and analysis in this
report.
All the factories in the frame have been classified into two sectors, viz., the
census sector and the sample sector.

-4-
The Census Sector consists of the following categories:
(i) Units having 100 or more workers and
(ii) All factories covered under Joint return and contributing significantly in terms of
GVA.
Sample sector : All industrial units of the entire ASI frame minus the Industrial units of
the Census Sector will form the sample sector.
In ASI 1999-2000, all electricity undertakings other than captive units have been kept
outdside the purview of ASI. All departmental undertakings such as Railway workshop
etc have also been kept outside the preview of ASI.
Sampling Design and Sample Allocation
For ASI 1997-98, a new sampling design recommended by the technical group
headed by Prof. Arijit Chowdhury , ISI, Calcutta, has been adopted. The same sampling
design has been followed for ASI 2003-04 also, with stratum as state x 4-digit level of
NIC-1998.
For sampling of industries from those in the sample sector, first the total sample
size ‘n’ was determined considering the following approach.
Let x be a suitable industrial characteristics, say ‘NVA’ of an industry bearing a 4 digit
industry code.
Let X be the mean of “x” for all the ‘N’ industries in the frame of the sample sector as
a whole and σ be the corresponding standard deviation.
-5-
Let x be sample mean of ‘x’ calculated for a simple random sample (SRS) of size ‘n’
taken with replacement from the population noted above.
For large ‘n’ it can be assumed on the basis of Cetral Limit Theorem that
)(/)( xXx σ− is distributed approximately as a standard normal deviate.
Now sample size ‘n’ was to be worked out such that
Prob. }{ XpXx .≤− = 0.99
Or prob . }{ )(/.)(/ xXpxXx σσ ≤− = 0.99
Where nx /)( σσ =
by C.L.T. it followes that
)//( nXp σ = 3 (say)
so n=( 29p ).(C.V)2 where CV (Co-off. Of variation) = Xσ
using CV based on 1998-99 observed data set of ASI for the newly defined sample sector
as the population CV and choosing the value of p= 1/10, the sample size n for each
industry (4 digit level of NIC-1998) is determined.
The total sample size ni; for the i th state is then allocated in the proportion of no.
of factories in the state.
Thus, total sample size ni in the ith state is ni = n. '''
NN i
Where N′ = Total no. of factories in the sample sector at all India level.
iN ′ = Total no. of factories in the sample sector at the ith state / U.T. level

-6-
If iN ′ =<8, then complete enumeration is done and for the case of iN ′ > 8, a minimum
value of 4 of the sample size is maintained.
ESTIMATION PROCEDURE
The total ASI population is divided into two major categories viz Census (C ) and
Sample (S ). In each state the sample sector S is divided into no. of strata at 4-digit level
of NIC-98. The estimation procedure is described as under:
NOTATION
Let
Nj = Number of units considered for selection from the jth stratum of sample Sector
jN ′ = Number of units reported to be existent in the frame for the jth stratum of S
nj = Number of sample units selected from the jth stratum of S
jn′ = Number of sample units reporting in the jth stratum of S
Mj = Multiplier for the jth stratum of S
Tc = Aggregate of characteristics of the units reporting under census sector C
Tj = Aggregate of a characteristics of the reporting units of jth stratum in S
T = Aggregate of a characteristics for the factory sector as a whole in a State/
Union Territory.
-7-
The estimate of T for any characteristics is given by
T = Tc + ∑j
Mj Tj
Where Mj = j
j
nN'
' . In case jN ′ and jn′ are not known, Mj can be estimated by
using the formula Mj = j
j
nN
with the assumption that
j
j
NN′ =
j
j
nn′
Thus, according to the above estimation procedure, separate multipliers were built
up for sample sector for the entire Delhi.
Reference Period
Reference period for ASI 2003-2004 was the accounting year of the factory,
ending on any day during the fiscal year 2003-2004. Thus in ASI 2003-2004 data
collected from respective establishment relate to their accounting year ended on any day
between 1st April, 2003 and 31st March, 2004. Survey was conducted in the year 2004-
2005 (October, 2004 to March, 2005).
Schedule of Enquiry
The schedule for ASI 2003-2004 is more or less similar to the ASI schedule
2002-03, and it aims to collect data on assets and liabilities, employment and labour cost,
receipts, expenses, input items - indigenous and imported, products and by-products,
distributive expenses etc.

-8-
CLASSIFICATION OF INDUSTRIES
The NIC - 1970 was followed to classify factories from ASI 1973-74 to ASI
1988-89. NIC - 1987 had been introduced and followed till ASI 1997-98. New series of
classification, i.e. NIC - 1998 has been introduced from ASI 1998-99. All the factories in
the ASI frame are accordingly classified in their appropriate industry groups on the basis
of the value of the principal product manufactured by them. This way a unit gets
classified in one and only one industry group even though it might be manufacturing
products belonging to different industries. The estimates for different aggregates
presented at two or three digit level in this report correspond to the NIC 1998.
LIMITATION
As data relating to less than 3 units in an industry group cannot be published (with
a view to safeguard its secrecy) , the data in respect of such industrial units has been
combined with the nearest sub-group or group keeping the nearness in the line of
production , as far as possible.
Also , the results presented in this report are subject to some limitations. Firstly ,
these are mainly based on the summary block characteristics and do not take into account
all the details provided in the inner blocks of the schedule. Secondly , as the figures were
rounded upto the nearest integer at various levels of aggregates during the course of
tabulation, there might be slight variation in the totals presented at higher level of
aggregation and the sums of corresponding constituents shown in different tables.

-9-
CHAPTER - II
CONCEPTS AND DEFINITIONS
REGISTERED FACTORY is one which is registered under sections 2m (i) and 2m (ii)
of the Factories Act, 1948. The Sections 2m (i) and 2m (ii) refer to any premises
including the precincts thereof (a) wherein ten or more workers are working, or were
working on any day of the preceding twelve months, and in any part of which a
manufacturing process is being carried on with the aid of power, or is ordinarily so
carried on or (b) wherein twenty or more workers are working or were working on any
day of the preceding twelve months and in any part of which a manufacturing process is
being carried on without the aid of power, or is ordinarily so carried on.
FIXED CAPITAL represents the depreciated value of fixed assets owned by the
factory as on the closing day of the accounting year. Fixed assets are those which have a
normal productive life of more than one year. Fixed capital includes land including
leasehold land, buildings, plant and machinery, furniture and fixtures, transport
equipment, water system and roadways and other fixed assets such as hospitals, schools
etc. used for benefit of factory personnel.
PHYSICAL WORKING CAPITAL is the total inventories comprising of raw
materials and components, fuels and lubricants, spares, stores, semi-finished goods and
finished goods as on the closing day of the accounting year. However, it does not include
the stock of the materials, fuels, stores etc. supplied by others to the factory for
processing and finished goods processed by the factory from raw materials supplied by
others.

-10-
INVESTED CAPITAL is the total of fixed capital and physical working capital.
WORKING CAPITAL is the sum of the physical working capital as already
defined above and the cash deposits in hand and at bank and the net balance receivable
over amounts payable at the end of the accounting year. Working capital, however,
excludes unused overdraft facility, fixed deposits irrespective of duration, advances for
acquisition of fixed assets, loans and advances by proprietors and partners irrespective of
their purpose and duration, long-term loans including interest thereon and investments.
PRODUCTIVE CAPITAL is the total of fixed capital and working capital as defined
above.
GROSS VALUE OF PLANT OF MACHINERY represents the total original
(undepreciated) value of installed plant and machinery at the end of the accounting year.
It includes the book value of the newly installed plants and machinery and the
approximate value of rented in plants and machinery at the time of renting- in but
excludes the value of rented- out plants and machinery. Total value of all the plants and
machinery acquired on hire - purchase basis is also included.
WORKERS are defined to include all persons employed directly or through any agency
whether for wages or not and engaged in any manufacturing process or in cleaning any
part of the machinery or premises used for manufacturing process or in any other kind of
work incidental to or connected with the manufacturing process or the subject of the
manufacturing process. Labour engaged, in the repair and maintenance or production of
fixed assets for factory's own use or labour employed for generating electricity or
producing coal, gas etc. are included.
EMPLOYEES include all workers defined above and persons receiving wages and
holding supervisory or managerial positions engaged in administrative office, store

-11-
keeping section and welfare section, sales department as also those engaged in purchase
of raw materials etc. or purchase of fixed assets for the factory and watch and ward staff.
MAN-HOURS represent the total number of hours worked and the number of
hours paid for, during the accounting year. It is obtained by summing-up the number of
persons of specified categories attending in each shift-hour over all the shifts worked on
all days.
WAGES AND SALARIES are defined to include all remuneration in monetary terms
and also payable more or less regularly in each pay period to workers as compensation
for work done during the accounting year. It includes (a) direct wages and salary (i.e.,
basic wages/salaries, payment of overtime, dearness, compensatory, house rent and other
allowances) ; (b) remuneration for the period not worked (i.e., basic wages, salaries and
allowances payable for leave period, paid holiday, lay off payments and compensation for
unemployment, if not paid from sources other than employers) ; (c) bonus and ex-gratia
payment paid both at regular and less frequent intervals ( i.e., incentive bonuses, good
attendance bonuses, productive bonuses, profit sharing bonuses, festival or year-end
bonuses etc.). It excludes lay off payments, which are made (1) from trust or other
special funds set up exclusively for this purpose i.e. payment not made by the employer.
It also excludes imputed value of benefits. (2) In kind, Employer's contribution to old
age benefits and other Group benefits. Travelling and other expenditure incurred for
business purposes and reimbursed by the employer are excluded. The wages are
expressed in terms of gross value i.e., before deduction for fines, damages, taxes,
provident fund, employee's state insurance contribution etc.
TOTAL EMOLUMENTS is defined as the sum of wages and salaries, employers
contribution as provident fund and other funds and workmen and staff welfare expenses
as defined above.

-12-
FUELS CONSUMED represents total purchase value of all items of fuels such as
coal. Liquefied petroleum gas, petrol, electricity, lubricants, water etc. consumed by the
factory during the accounting year but excluding the items which directly enter into the
manufacturing process.
MATERIALS CONSUMED represents the total delivered value of all items of
raw materials, components, chemicals, packing materials and stores which actually enter
into the production process of the factory during the accounting year. It also includes the
cost of all materials used for the construction of building etc. for the factory's own use.
It, however, excludes all intermediate products consumed during the accounting year.
Intermediate products are those products, which are produced by the factory but are
subject to further manufacturing.
TOTAL INPUT comprises total value of fuels, materials consumed as well as
expenditure such as cost of contract and commission work done by others on materials
supplied by the factory, cost of materials consumed for repair and maintenance of
factory's fixed assets including cost of repairs and maintenance work done by others to
the factory's fixed assets, inward freight and transport charges, rate and taxes (excluding
income tax), postage, telephone and telex expenses, insurance charges, banking charges,
cost of printing and stationery and purchase value of goods sold in the same condition as
purchased.
EX-FACTORY VALUE of all products and by-products manufactured is attained at
the rate of net sale-value which is obtained by deducting sale-tax, excise duties and other
distributive expenses from actual sale value (inclusive of subsidies etc.) with respect to
each of the items.
TOTAL OUTPUT comprises total ex-factory value of products and by-products
manufactured as well as other receipts such as receipts from non-industrial services
rendered to others, work done for others on material supplied by them, value of electricity

-13-
produced and sold, sale value of goods sold in the same condition as purchased, addition
in stock of semi-finished goods and own construction.
DEPRECIATION is consumption of fixed capital due to wear and tear and
obsolescence during the accounting year and is taken as provided by the factory owner or
is estimated on the basis of cost of installation and working life of the fixed assets.
SEMI-FINISHED GOODS refer to the imputed value of all materials which
have been partially processed by the factory but which are not usually sold without
further processing. It includes the work in progress for materials supplied by others, but
excludes the value of semi-finished fixed assets produced for factory's own use
NET VALUE ADDED is arrived by deducting total input and depreciation from
total output.

-14 –
CHAPTER-III
GENERAL REVIEW OF INDUSTRIAL ACTIVITY IN 2003-2004 This chapter highlights the main findings of the survey which inter-alia covers the
main sectors of economic activity namely , Manufacturing & Repairing and other service
activities.
Principal Characteristics of the organised industries (Registered Factory) taken
together in Delhi during the year 2003-2004 is as below:
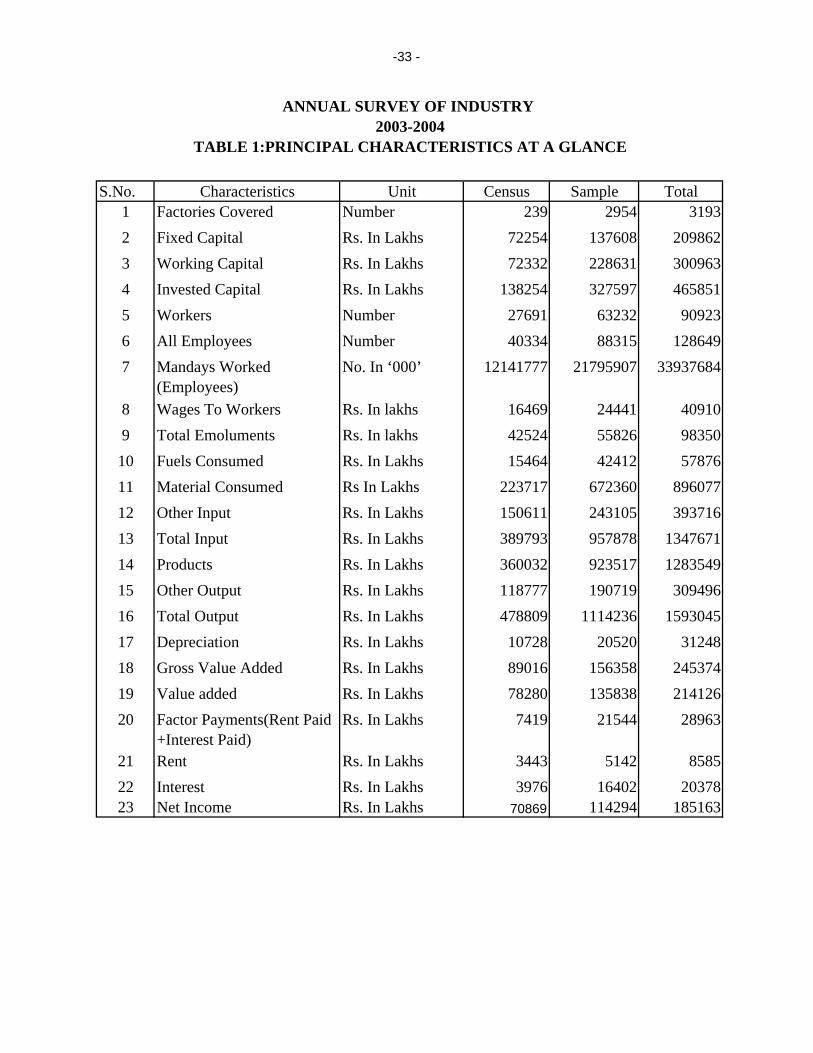
Table 1: Important characteristics of the organised industrial (Factory) sector during
2003-2004 S No Characteristics Unit 2003-2004
1 Factory Working Number 3193 2 Fixed Capital Rs. in lakh 209862 3 Working Capital “ 300962 4 Productive Capital “ 510825 5 Invested Capital “ 465851 6 Outstanding Loans “ 180601 7 Man days worked (E) No. in lakh 339 8 Workers Number 90923 9 All Employees Number 128649 10 Wages to Workers Rs. in lakh 40910 11 Total Emoluments “ 98350 12 Total Input “ 1347671 13 Total Output “ 1593045 14 Gross Value added “ 214126 15 Depreciation “ 31248 16 Net Value added “ 182878 17 Factor payments (Rent paid + Interest
Paid) “ 288963
18 Net income “ 185163 CONCENTRATION OF FACTORIES
The summary results revealed that during the reference period of ASI 2003-2004, the
larger number of factories were engaged in manufacturing of wearing apparel dressing and
dying of fur (17.71%) followed by manufacture of fabricated material product except
machinery (8.55%), manufacture of machinery and equipment (8.49%), and manufacture of

-15 – rubber and plastic product (6.66%), manufacture of Publishing, Printing and Reproduction of
Recorded media (6.42%) These five industries together have accounted 45.7 percent of the
total working factories, provided employment to 58.24 percent of the total employees and
utilized 51.98 percent of fixed capital stock. Their share in the gross value of output and net
value added by manufacture were 37.33 and 44.84 percent respectively.
DISTRIBUTION OF FACTORIES BY TYPE OF ORGANISATION, OWNERSHIP,
POWER & YEAR OF INITIAL PRODUCTION
In the following paragraphs, some of the characteristics of the factories covered in the
survey, like organisation, ownership and the year of initial production have been analyzed.
(a) ORGANISATION : The distribution of the factories covered according to the various
types of organisation is given in the table 2
Table 2 : Factories classified by type of organisation No. of Factories covered S .No Type of Organisation
Census Sample Total 1 Individual Proprietorship 36 953 989 (15.06) (32.26) (30.97) 2 Joint Family (HUF) 0 26 26 (0.88) (0.81) 3 Partnership 74 1001 1075 (30.96) (33.89) (33.67) 4 Public Limited Company 50 103 153 (20.92) (3.49) (4.79) 5 Private Limited Company 79 871 950 (33.05) (29.49) (29.75) 6 Govt. Deptt. Enterprises 0 0 0 7 Public Corporation 0 0 0 8 Co-operative Societies 0 0 0 9 Others 0 0 0
TOTAL 239 2954 3193 (100.00) (100.00) (100.00) (Figures in parenthesis indicate percentage to total)

-16 – The study of the table-2 reveals that:
(1) Factories under the group ‘partnership’ numbering 1075 (33.67 %) were the highest in the
factory sector, was followed by individual proprietorship 989 (30.97%), Private Limited
Company 950 (29.75%), Public Limited Company 153 (4.79%), Joint Family (HUF) 26
(0.81% ) in that order.
(2) In the Census Sector, Pvt. Ltd. Company 79 (33.05%), the Partnership 74 (30.96%),
Public Limited Company 50 (20.92%), Individual Proprietorship 36 (15.06%) and other
organisation as Joint Family (HUF), Govt. Deptt. , Public Corporation & Co-op Society
are Nil.
(3) The pattern in the Sample sector, however was slightly different i.e. Partnership 1001
(33.89%) occupied the top position, Individual Proprietorship 953 (32.26%), Private Ltd.
Company 871 (29.49%), Public Ltd. Company 103 (3.49%), Joint Family (HUF) 26
(0.88%) in that order.
(b) OWNERSHIP The distribution of factories by types of ownership is given below:
Table 3: Factories classified by type of ownership No. of Factories covered S. No Type of Ownership
Census Sample Total 1 Wholly Central Govt. 0 1 1 (0.03) (0.03) 2 Wholly State/Local Govt. 0 1 1 (0.03) (0.03) 3 Central/State/Local Govt. 0 2 2 (0.08) (0.07) 4 Joint Sector (Public) 1 1 2 (0.42) (0.03) (0.06) 5 Joint Sector (Private) 1 0 1 (0.42) (0.00) (0.03) 6 Wholly Private Enterprises 237 2949 3186 (99.16) (99.84) (99.79)
TOTAL 239 2954 3193 (100.00) (100.00) (100.00) (Figures in parenthesis indicate percentages to the total) The study of the table 3 reveals that out of 3193 factories covered under ASI 2003-
2004, 3186 units (237 in the Census Sector and 2949 in the Sample sector), representing
99.79% of the total belonged to wholly Private Enterprises. On the other hand only 4 units

-17 – (i.e. 0 unit in Census Sector and 4 in the Sample sector) belonged to wholly Govt. Enterprises
(Central / State /Local Government). Out of the remaining 3 factories (2 census sector and 1
sample sectors), 2 Factories belong to the Joint sector Public and 1 factories to the Joint
sector Private.
(c) Year of Initial Production
The distribution of factories classified according to their year of initial production has
been presented in the table as follows:
Table-4 : Factories classified according to their year of initial production S.No. Year of Initial Production No. of Factories covered
Census Sample Total 1 1910 & Earlier 1 26 27 (0.42) (0.88) (0.85) 2 1911-1920 1 5 6 (0.42) (0.17) (0.19) 3 1921-1930 1 7 8 (0.42) (0.24) (0.25) 4 1931-1940 4 10 14 (1.67) (0.34) (0.44) 5 1941-1950 2 13 15 (0.84) (0.44) (0.47) 6 1951-1960 4 194 198 (1.67) (6.57) (6.20) 7 1961-1970 5 308 313 (2.09) (10.43) (9.80) 8 1971-1980 46 631 677 (19.25) (21.36) (21.20) 9 1981-1990 77 872 949 (32.22) (29.52) (29.72)
10 1991-2000 69 732 801 (28.87) (24.78) (25.09)
11 2001 & above 29 156 185 (12.13) (5.28) (5.79) TOTAL 239 2954 3193 (100.00) (100.00) (100.0)
(Figures in parenthesis indicate percentages to total) It would be seen from the table 4 that:-
(1) Out of total 3193 units covered, only 70 (2.19 %) has started their production before
1951, while the remaining 3123 units (97.81%) started their production after the
advent of the planning era in 1951. The number of units set-up during 1951-60, 1961-

-18 –
70, 1971-80, 1981-1990, 1991-2000 and 2001 onwards were 198 (6.20%), 313
(9.80%), 677 (21.20%), 949 (29.72%) , 801 (25.09%), 185 (5.79%) respectively.
(2) In the Census Sector, the maximum number of 77 units (32.22%) were set up in the
period 1981-90, while 69 units (28.87%) during 1991-2000, 46 units (19.25%) during
1971-80, 5 units (2.09%) in 1961-70 and 1 units (0.42%) in 1910 & earlier and 4 units
(1.67%) in 1931-40 and 4 units (1.67%) in 1951-60. Only 2 units (0.84%) were setup
in 1911-30, 1941-50 respectfully.
(3) In the Sample Sector, the maximum numbers of 872 units (29.52%) started their
production during the period 1981-1990. On the other hand 732 units (24.78%) started
their production during 1991-2000, 631 units (21.36%) during the period 1971-1980,
308 units (10.43%) during the period 1961-70, 194 units (6.57%) during the period
1951-60,156 units (5.28%) during 2001 and above and 26 (0.88%) during 1910 and
earlier in the descending order. The remaining 35 units were set up in 1911-1950.
(d ) CAPITAL STRUCTURE
During the reference period 2003-2004, the fixed capital invested in the factories
covered under the survey was estimated at Rs. 2098.62 crore, productive capital Rs. 5108.25
crore and invested capital Rs.4658.51 crore. These were lower by 14.29, 15.53 and 13.31
percent respectively compared to those estimated during the corresponding period of 2002-
2003. From the investment angle industries such as Mfg. of Wearing Apparel Dressing and
Dying of fur, Mfg. of Food Products and Beverage, Mfg. of Rubber and Plastic Product,
Mfg. of Chemical Products, Mfg. of Machinery and Equipment etc. were the most important
ones. These industries among themselves shared 47.88 percent of fixed capital, 54.14 percent
of invested capital and 52.94 percent of working capital deployed in all the industries taken
together.
Table-5 given below depicts the relative share of the census and sample sector in the
capital structure , as also certain important ratios, and derived ratios.
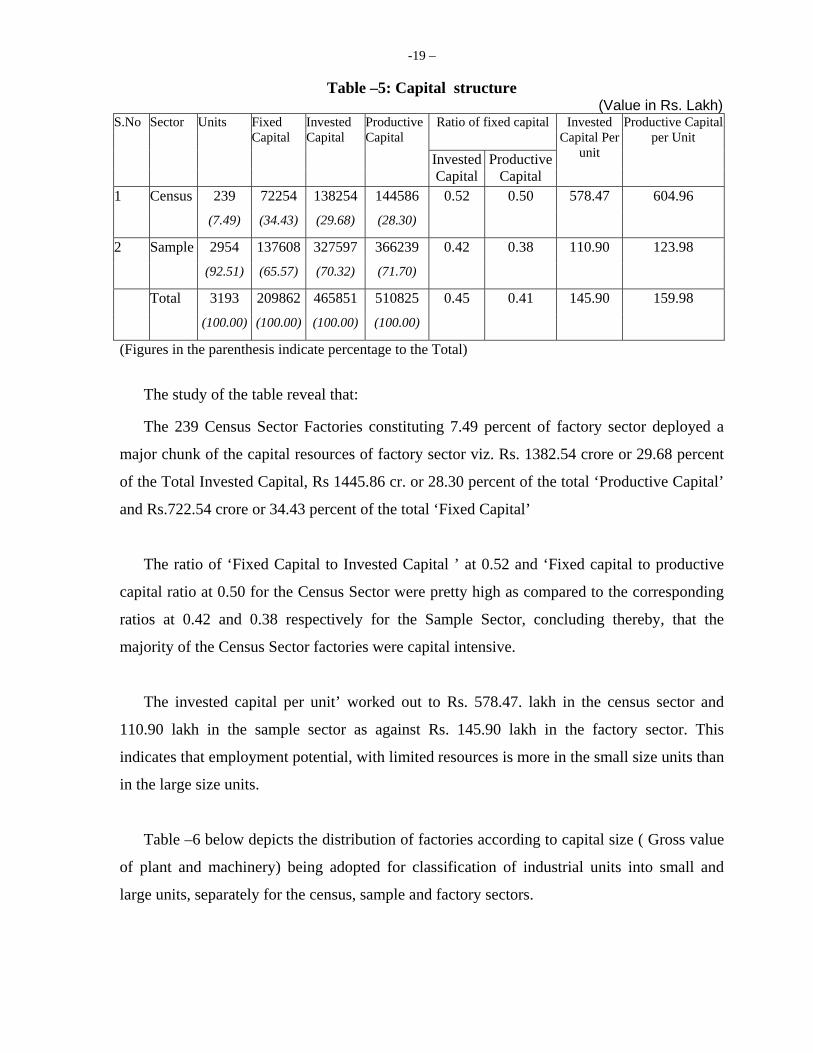
-19 –
Table –5: Capital structure (Value in Rs. Lakh)
Ratio of fixed capital S.No Sector Units Fixed Capital
Invested Capital
Productive Capital
Invested Capital
Productive Capital
Invested Capital Per
unit
Productive Capital per Unit
1 Census 239 72254 138254 144586 0.52 0.50 578.47 604.96
(7.49) (34.43) (29.68) (28.30)
2 Sample 2954 137608 327597 366239 0.42 0.38
(92.51) (65.57) (70.32) (71.70)
110.90
123.98
Total 3193 209862 465851 510825 0.45 0.41 145.90 159.98
(100.00) (100.00) (100.00) (100.00)
(Figures in the parenthesis indicate percentage to the Total)
The study of the table reveal that: The 239 Census Sector Factories constituting 7.49 percent of factory sector deployed a
major chunk of the capital resources of factory sector viz. Rs. 1382.54 crore or 29.68 percent
of the Total Invested Capital, Rs 1445.86 cr. or 28.30 percent of the total ‘Productive Capital’
and Rs.722.54 crore or 34.43 percent of the total ‘Fixed Capital’
The ratio of ‘Fixed Capital to Invested Capital ’ at 0.52 and ‘Fixed capital to productive
capital ratio at 0.50 for the Census Sector were pretty high as compared to the corresponding
ratios at 0.42 and 0.38 respectively for the Sample Sector, concluding thereby, that the
majority of the Census Sector factories were capital intensive.
The invested capital per unit’ worked out to Rs. 578.47. lakh in the census sector and
110.90 lakh in the sample sector as against Rs. 145.90 lakh in the factory sector. This
indicates that employment potential, with limited resources is more in the small size units than
in the large size units.
Table –6 below depicts the distribution of factories according to capital size ( Gross value
of plant and machinery) being adopted for classification of industrial units into small and
large units, separately for the census, sample and factory sectors.
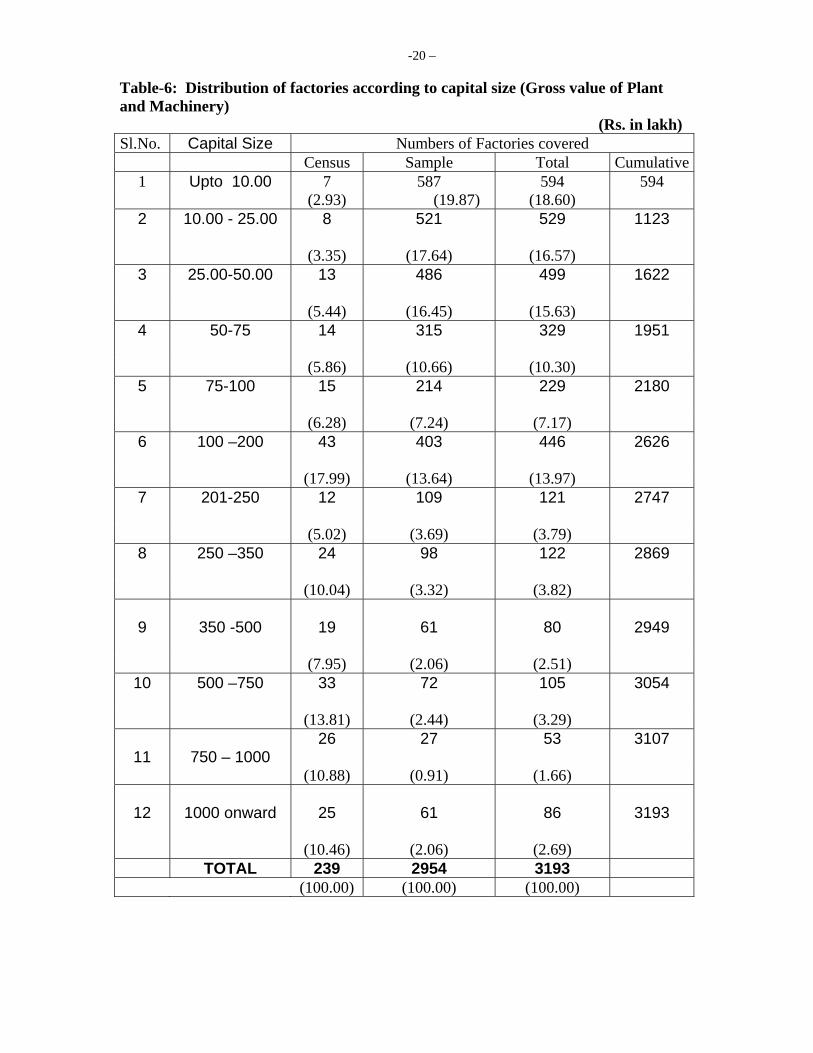
-20 – Table-6: Distribution of factories according to capital size (Gross value of Plant and Machinery)
(Rs. in lakh) Sl.No. Capital Size Numbers of Factories covered
Census Sample Total Cumulative1 Upto 10.00 7 587 594 594 (2.93) (19.87) (18.60) 2
10.00 - 25.00 8
521 529 1123
(3.35) (17.64) (16.57) 3
25.00-50.00
13
486
499
1622
(5.44) (16.45) (15.63) 4
50-75
14
315
329
1951
(5.86) (10.66) (10.30) 5
75-100
15
214
229
2180
(6.28) (7.24) (7.17) 6
100 –200
43
403
446
2626
(17.99) (13.64) (13.97) 7
201-250
12
109
121
2747
(5.02) (3.69) (3.79) 8
250 –350
24
98
122
2869
(10.04) (3.32) (3.82)
9
350 -500
19
61
80
2949
(7.95) (2.06) (2.51) 10
500 –750
33
72
105
3054
(13.81) (2.44) (3.29)
11 750 – 1000 26
27
53
3107
(10.88) (0.91) (1.66)
12
1000 onward
25
61
86
3193
(10.46) (2.06) (2.69) TOTAL 239 2954 3193 (100.00) (100.00) (100.00)
-21 –
The perusal of table-6 reveals that 2180 (68.27%) units have an investment of less than
Rs.1.00 crore in the Plant and Machinery. While there were only 1013 (31.73%) unit have an
investment of over Rs.1.00 crore in the Plant & Machinery.
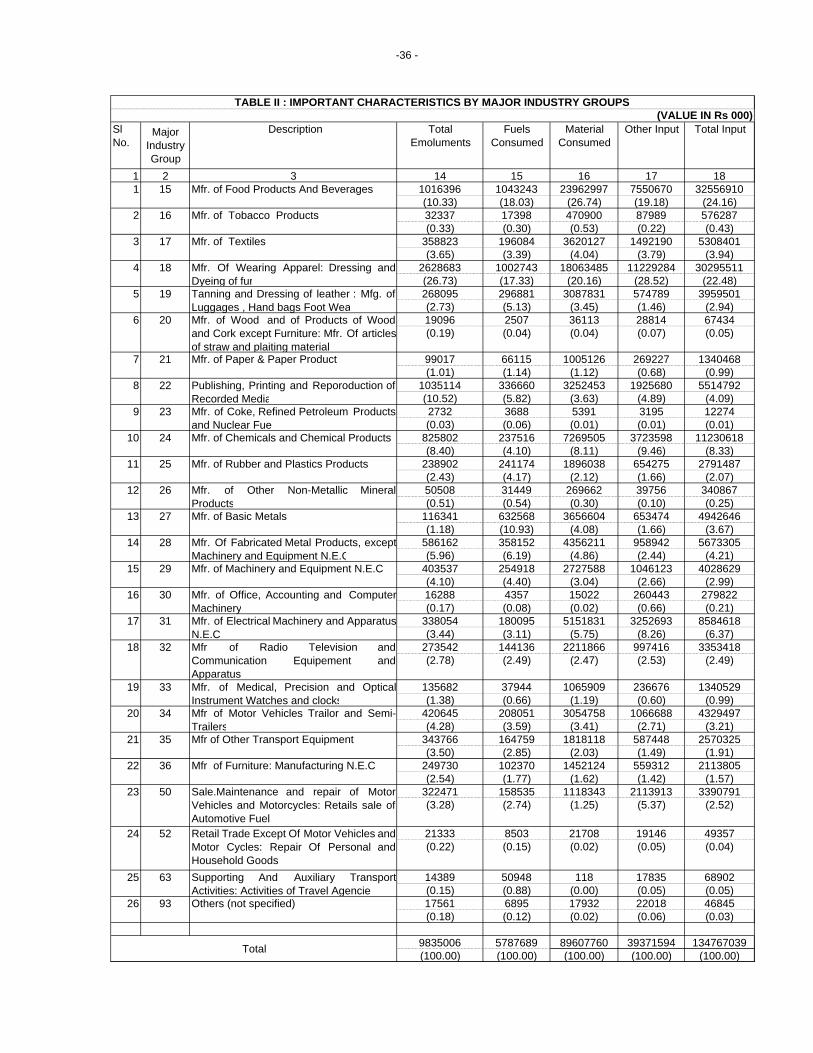
Details of ‘Invested’, ‘Productive’ and ‘Fixed Capital’ their percentage distribution
and certain important derived ratios at the Major Industry Groups and Industry Groups at 2
digit level of National Industrial Classification (NIC-1998) have been shown in table II
given in part II of the report.
The study of these tables reveals that:
(i) Among the Major Industry Groups, the highest contribution amounting to Rs. 1220.33
crore (26.20%) in the invested capital and Rs. 488.01 crore (23.25%) in the fixed
capital in the factory sector was that of Major Industry Group 18 -Mfg. of Wearing
Apparel dressing and dying of fur.
(ii) The lowest contribution on the other hand was that of Major Industry Group 52 –
Retail Trade except of Motor vehicles & Motor cycles, repair of personal and House
hold, contributing Rs. 814 lakh (0.17%) in the invested capital and 746 lakh (0.36%)
in the fixed capital in the factory sector.
(iii) The Fixed Capital and Invested capital ratio at 5.12 in the Major Industry Group 24 -
Mfg. of chemical and chemical products were the highest, while in the Major Industry
Group 63 Supporting and Auxiliary Transfer Activities 1 was the lowest.
(d) EMPLOYMENT
The number of persons employed in the Factory Sector during 2003-2004 worked out to
128649 of these 90923 (70.68%) were workers engaged exclusively in the production and/or
repair services and the remaining 37726 (29.32%) were other employees including
supervisory, managerial, clerical and auxiliary staff, working proprietors and unpaid family
workers. As against this, the corresponding figures for the year 2002-2003 were 85522 and
42110 indicating a increase of 6.32 percent and decrease of 10.41 percent respectively in the
year 2003-2004.

-22 –
Table –7 below shows employment, mandays worked and certain important ratios
derived therefrom separately for the census, sample and factory sectors.
TABLE 7 :EMPLOYMENT STRUCTURE AND SOME IMPORTANT RATIOS
Units Total Workers Mandays MandaysCovered Employees
(No.) (No.) Worked
‘000’
Average Employment per
unit Per year
per
S.No Sector
Worker Employee Employee
1 Census 239 (7.49)
40334 (31.35)
27691(30.46)
12141777(35.78)
116 169 301
2 Sample 2954 (92.51)
88315 (68.65)
63232(69.54)
21795907(64.22)
21 30 246
3 Total 3193 (100.00)
128649 (100.00)
90923(100.00)
33937684(100.00)
28 40 264
(Figures in parenthesis indicate percentage to the total) The perusal of table 7 reveals that:- (i) Out of the 90923 workers in the factory sector 27691 workers (30.46%) were engaged
in the census sector while the remaining 63232 workers (69.54%) were employed in
sample sector.
(ii) The per unit employment of workers in the census sector was 116 compared to 21 in
the sample sector and 28 in the factory sector. The corresponding averages in the case
of all employees worked out to 169, 30 and 40 for census, sample and factory sectors
respectively.
(iii) The respective shares of Census and sample sector factories in the total mandays
worked in the factory sector was 35.78 percent and 64.22 percent respectively.
(iv) Mandays worked per employees per year in the census sector was 301 as compared to
246 in the sample sector and 264 in the factory sector.
The table-8 depicts the distribution of factories covered according to the employment
size of workers in census , sample and factory sectors as revealed by ASI 2003-2004.

-23 – Table –8 : Distribution of factories according to size of employment (workers)
No. of factories covered S.No. Size of Employment
(workers) Census Sample Total Cumulative Total
0 2 155 157 1 (0.84) (5.25) (4.93)
157 (4.92)
1 to 9 4 162 166 2 (1.67) (5.49) (5.19)
323 (10.11)
10 to 19 0 282 282 3 (9.55) (8.85)
605 (18.96)
20 to 49 19 896 915 4 (7.95) (30.34) (28.68)
1521 (47.63)
50 to 99 27 762 789 5
(11.30) (25.80) (24.73) 2310
(72.36) 100 to 199 59 507 565 6
(24.69) (17.17) (17.72) 2876
(90.08) 200 to 299 45 119 163 7
(18.83) (4.00) (5.10) 3038
(95.18) 8 300 - 399 15 28 43 3082 (6.28) (0.95) (1.35) (96.53) 9 400 - 499 28 24 52 3133 (11.72) (0.81) (1.62) (98.16)
10 500 & above 40 19 59 3193 (16.74) (0.64) (1.84) (100.00)
239 2954 3193 TOTAL (100) (100) (100)
The study of the table –8 reveals that :-
(i) The maximum number of 915 units forming 28.68 percent of the factory sector,
employed 20 to 49 workers each. The employment size group 50 to 99 workers
with 789 units (24.73%) come next followed by 565 units (17.72%) employing
100 to 199 workers each. Out of 3193 factories covered 157 units or (4.93%) had
no workers i.e. nil employment during the year 2003-2004.
(ii) Within the census sector, 25 out of 239 units have less than 50 workers each. 4
units between 1 –19 workers. Again 27 out of 239 (11.30%) of the census sector
employed 50-99 workers, 59 out of 239 ( 24.69%) between 100-199 workers.
(iii) In the sample sector, 49.39 percent of the units (1459 out of 2954 ) employed over
50 workers each. As many as 599 units forming 20-27 percent of total units in the
sample sector employed less than 20 workers each, including 155 units (5.25%)
reporting nil employment. Further, 896 units constituting 30.33 percent of the
sample sector reported employment between 20 to 49 workers. Detail information
regarding employment in various major industry group is given in table III in part
–II of the report.

-24 –
(e) EMOLUMENTS
A total sum of Rs. 983.50 crore was paid as emoluments to all employees during 2003-
2004 of which Rs.409.10 crore were paid as wages to workers and remaining Rs.574.40 crore
represented payment to other employees bonus and value of benefits in kind etc. The share of
census and sample sector factories in the case of the total emoluments to all employees was
Rs. 425.24 crore (43.24%) and Rs. 558.26 crore (56.73%) respectively. whereas in the case of
wages to workers it was Rs.164.69 crore (40.26%) and Rs. 244.41 crore (59.74%)
respectively.
The total emoluments paid to all employees , wages to workers and some important
derived ratios have been indicated in the table 9 given below:-
Table 9 : Emoluments, Wages and some important derivations (Value in Rs. Lakh)
Average Sector Units Covered
Total Emoluments
Total Wages Emolument per
Employee Wages per
Worker
(1) (2) (3) (4) (5) (6) Census 239 42524 16469 105430 59474
(7.49) (43.24) (40.26)
Sample 2954 55826 24441 63212 38653
(92.51) (56.76) (59.74)
Total 3193 98350 40910 76448 44994
(100.00) (100.00) (100.00) (Figures in parenthesis indicate percentages to the total) The above table reveals that the employees as well as workers in the census sector
were better paid than those in sample sector. The census sector constituted only 7.49 percent
of the factory sector, claimed 40.26 percent of the wages paid to employees. The average
emoluments per employee per man-day for the census sector worked out to Rs. 350.23 as
against Rs. 256.13 for the sample sector and Rs. 289.80 for the factory sector. The reasons for
the difference in the emoluments in the two sectors is obvious. The factories in the census
sector are generally highly mechanised and employ a greater percentage of skilled persons
who are better paid than others.

-25 – The comparative position in respect of total emoluments paid to all employees, salaries
and wages paid to workers etc. , the major industry groups has been indicated in table II ,
given in part – II of the report. Some of the salient features revealed from the study of this
table are :
(i) The total emoluments paid to all employees were the maximum at Rs. 26286.83 lakh
(26.73%) in the Major Industry Group 18- Mfg. of wearing apparel dressing and
dying of fur followed by 10351.14 lakh (10.52%) in the Major Industry Group 22-
Manufacture of Publishing Printing and Reproduction of Recorded Media, The two
groups together shared over (37.25%) of the total emoluments paid in the factory
sector.
(ii) The average emoluments per employee per annum Rs. 133508 were the maximum in
the Major Industry Group 30-Mfg. of Office Accounting and computer machinery
while these were lowest at Rs. 53399 in the Major Industry Group, 18- mfg. of
wearing apparel dressing and dying of fur. However, the average emoluments per
employee per year for the factory sector worked out to Rs. 76448.
(iii) The total wages of Rs. 13312.13 lakh (32.54%) paid to the workers in the Major
Industry Group 18-Mfg. of Wearing Apparel Dressing and Dying of fur were the
maximum. The Major Industry Group 15-Mfg. of Food product and beverages with
Rs. 3862.47 lakh (9.44%) came next. The two group together accounted for 41.98
percent of the total wages paid in the factory sector.
(f) INPUTS
Inputs, in any industrial activity mainly consists of consumption of raw materials and
stores (used for manufacture, repair and maintenance purposes), ‘fuels’ purchase for industrial
and non-industrial services , consumption of products reported for sale during the previous
year but used for further manufacture in the current year, ‘consumption of fixed capital’ (i.e.
depreciation) and the ‘value of labour inputs’ (i.e. payment made to various categories of
employees).

-26 – The total value of the inputs, other than labour input and depreciation in the factory
sector worked out to Rs.13476.71 crore. Out of this, consumption of materials being the
principal components accounted for Rs 8960.77 crore (66.49 %) of the total value of input.
The remaining 4515.94 crore were shared by ‘fuels’ and ‘other inputs’ their relevant values
being Rs.578.77 crore (4.29%) and Rs.3937.16 crore (29.21%) respectively.
The table below indicates the percentage consumption of different components of inputs
in the census, sample & factory sectors.
TABLE 10 : MATERIALS , FUELS & OTHER INPUTS (Value in Rs. Lakh)
Consumption of Various Components Sector Units Total Input Materials % Fuels % Other Inputs %
(1) (2) (3) (4) (5) (6) (7) (8) (9) Census 239 389793 223717 (57.39) 15464 (3.97) 150611 (38.64) (7.49) (28.92) (24.97) (26.72) (38.25) Sample 2954 957878 672360 (70.19) 42412 (4.43) 243105 (25.38) (92.51) (71.08) (75.03) (73.28) (61.75) Total 3193 1347671 896077 (66.49) 57876 (4.29) 393716 (29.21)
(100.00) (100.00) (100.00) (100.00) (100.00) (Figures in parenthesis indicate percentages to the Total)
The perusal of the table-10 reveals some of interesting facts which are as under:-
(1) The census sector factories , constituting 7.49 percent of the total factories covered shared
28.92 percent of the total inputs, while the sample sector, forming 92.51 percent of the
factories accounted for only 71.08 percent of the total inputs.
(2) The percentage share in the total consumption of ‘materials’ ‘fuels’ and ‘other inputs’ in
the case of census sector was 24.97 percent, 26.72 percent and 38.25 percent respectively.
The relevant percentages in the case of sample sector were 75.03 percent , 73.28 percent
and 61.75 percent in that order.
(3) Within the two sectors, the percentage share of the constituents of ‘total inputs’ varied
considerably. In the census sector ‘material consumed’, ‘fuel consumed’ and ‘other inputs’
accounted for 57.39 percent 3.97 percent and 38.64 percent respectively compared to

-27 –
70.19 percent, 4.43 percent and 25.38 percent respectively for the sample sector as against
66.49 percent, 4.29 percent and 29.21 percent respectively for the factory sector.
Some of the salient features revealed by the study of the results of the survey detailed in
table II given in part II of the report are as follows:-
(i) Major Industry Group 18 –Manufacturing of wearing apparel dressing and dying of
fur 22.48% of the total inputs in the factory sector. While 15-Manufacturing of food
products and beverages, 22-Publishing, Printing and Reproduction of Recorded media,
24 – Manufacturing of chemical and chemical product, 28- Mfg. Of Fabricated Metal
product except Machinery and Equipment NEC respectively shares 24.16 percent, 4.09
percent,8.33 percent , 4.21 percent of total inputs. These five industry groups together
accounted for 63.27 percent of the total inputs in the factory sector.
(ii) Within the Major Industry Groups, the percentage share of 'Material Consumed' to
total input of the Major Industry Groups varied considerably. It was the highest in the
Major Industry Group 15-Mfg. of Food products and beverages and the lowest at
43.92 percent in the Major Industry Group 23- Mfg. Of Coke Refined Petroleum
product and Nuclear Fuel .
(g) DEPRECIATION
Depreciation means ‘consumption of fixed capital’ during the manufacturing process. It
is estimated on the basis of cost and ‘productive life’ of the fixed assets concerned.
As shown in table II of part II the total estimated value of depreciation for all the fixed
assets in the factory sector, as per ASI 2003-2004 worked out to Rs. 31248 lakh. From this
Rs. 10728 lakh or 34.33 percent was in the census sector while the sample sector factories,
constituting 20520 lakh or 65.67 percent of the total factories covered The average rate of
depreciation calculated on the basis of ‘total fixed capital engaged in the production activity
during the survey year, worked to 14.89 percent in the factory sector, 14.85 percent in the
census sector and 14.91 percent in the sample sector.

-28 – The table-11 given below depicts the average rate of depreciation as percentage of
fixed capital in some major industry groups.
TABLE 11: DEPRECIATION RATES IN SOME IMPORTANT MAJOR INDUSTRY GROUPS
(Value in Rs. Lakh) S. No.
Major Industry
NIC Group
Description Factories Covered
Fixed Capital
Depre- ciation
Percentage rate of
Depreciation
(1) (2) (3) (4) (5) (6) (7) 1 15 Mfr. Of Food Products and Beverages 111 27714 3678 11.77 2 16 Mfr. Of Tobacco Products 17 629 113 0.36 3 17 Mfr. Of Textiles 133 7473 1525 4.88 4 18 Mfr. Of Wearing Apparel, Dressing and Dyeing of fur 575 48800 8645 27.72
5 19 Mfr. of Tanning and Dressing of Leather 143 8461 1654 5.29 6 20 Mfr. Of Wood & Wood Products 6 111 29 0.09 7 21 Mfr. Of Paper & Paper Products 57 3144 387 1.24 8 22 Publishing, Printing 205 24517 3607 11.54 9 23 Mfr. Of Coke, Refined Petroleum Product 4 35 6 0.02 10 24 Mfr. Of Chemicals & Chemical Products 130 10284 1602 5.14 11 25 Mfr. Of Rubber & Plastics Products 219 5702 873 2.80 12 26 Mfr. Of Other Non-Metallic Mineral Products 31 463 92 0.30 13 27 Mfr. Of Basic Metals 162 2493 464 1.48 14 28 Mfr. Of Fabricated Metals products 283 22088 1502 4.81 15 29 Mfr. Of Machinery And equipment n.e.c. 271 7982 1098 3.52 16 30 Mfr. Of Office, Accounting and computing machinery 6 715 108 0.35 17 31 Mfr. Of Electrical Machinery and apparatus 199 5597 831 2.66 18 32 Mfr. Of Radio, Television and communication
equipment 85 5186 799 2.56
19 33 Mfr. Of Medical, Precision and Optical instruments, watches and clocks
47 2390 278 0.89
20 34 Mfr. Of Motor Vehicles, Trailers and Semi Trailers 161 8148 1131 3.62 21 35 Mfr. Of Other Transport equipment 94 4969 1020 3.27 22 36 Mfr. Of Furniture 86 4470 801 2.56 23 50 Sale, Maintenance And Repair 140 6002 802 2.56 24 52 Retail Trade Except Of Motor vehicles 6 746 77 0.25 25 63 Supporting And Auxiliary Transport activities 18 1303 79 0.25 26 93 Other Service Activities 7 10638 188 0.06
Total 3193 209861 31248 100.00 (h) OUTPUT
Output in an industry includes products, by-products and services generated during the
industrial process. The value of total output worked out to Rs. 15930.45 crore. The worth of
products and by-products is 12835.49 crore whereas Rs. 3094.96 crore is worth of ‘other
output’ including services rendered to others and sale value of goods sold in the same
condition, as purchased.

-29 – The relative contribution of the census and sample sectors in the ‘total output’ ,
‘products and by-products’ and some important ratios derived therefrom have been shown in
the table given below:-
Table 12: Output and some important related ratios Value in lakh
Output Output per Sector Units Product and
By- Product
Other Output
Total Output
Output Input ratio
Worker per
Annum
Employee per man
days Rs.
Output invested capital ratio
Census 239 360032 118777 478809 1.23 17.29 4112.48 3.46 (28.05) (38.38) (30.06) Sample 2954 923517 190719 1114236 1.16 17.62 4663.02 3.40 (71.95) (61.62) (69.94) Total 3193 1283549 309496 1593045 1.18 17.52 4488.17 3.42 (100.00) (100.00) (100.00) (Figures in parenthesis indicate percentages) The study of the tables reveals that :
(i) The Census Sector constituting 30.06 percent of the ‘total output’ in the Factory
Sector, while its share in the case of ‘Products and by-Products’, and ‘other output’
worked out to 28.05 percent and 38.38 percent respectively.
(ii) The ‘output’ per unit ‘Invested Capital’ at 3.46 in the Census Sector was higher as
compared to 3.40 in the Sample Sector and 3.42 in the Factory Sector.
(iii) The average ‘value of output per worker’ was higher in the Sample sector than in
factory and sample sector. The relevant figures for Census Sector, Sample Sector and
Factory Sector are Rs. 17.29 lakh, Rs. 17.62 lakh and Rs. 17.52 lakh respectively.
(iv) ‘Production per manday’, being the measure of the productivity in an industrial
activity, ‘Productivity’ in the Sample Sector at Rs. 4663.02 was higher compared to
Rs. 4112.48 in the Census Sector and Rs. 4488.17 in the Factory Sector.
(v) Output-Input ratio, on the other hand, was 1.23 in census sector, 1.16 in Sample
sector and 1.18 in Factory sector.
The details of ‘output’, ‘Products and by-Products’, and ‘other output’, etc. within
Major Industry Groups are indicated in table-II of the Report. The study thereof reveals that:-

-30 –
(i) The contribution of Major Industry Group 18-Mfr. of Wearing Apparel : Dressing
and dyeing of fur, approx. at Rs. 3671.67 crore worth of output accounting for
23.05 percent of the total output was the maximum. Major Industry Groups, 15-
Mfg. of Food Products and Beverages 22.12 percent and Mfr. of chemicals and
chemical products 8.65 percent came next in that order. These three Major
Industry Groups together attributes 53.82 percent of the total output in the factory
sector.
TABLE 13: GENERAL PATTERN OF COST OF PRODUCTION COST AS PERCENTAGE OF VALUE OF OUTPUT
(value in Rs. lakh) Census Sample Factory
S.NO.
COST CONSTITUENTS
Value % Value % Value % 1 Value of output 478809 100 1114236 100 1593045 100
Value of Input (a) Materials & Stores 223717 46.72 672360 60.34 896077 56.24
(b) Fuels 15464 3.23 42412 3.81 57876 3.63 (c ) Other Inputs 150611 31.46 243105 21.82 393716 24.71
2
Total Input (a+b+c) 389792 81.41 957877 85.97 1347669 84.60 3 Employees
Emoluments 38094 7.96 47077 4.23 85171 5.35
4 Factor Payment 7419 1.55 21544 1.93 28963 1.82 5 Depreciation 10728 2.24 20520 1.84 31248 1.96 6 Total cost 446033 93.15 1047018 93.57 1493051 93.72
The study of table 13 reveals that:- (1) The ‘pattern of the cost of production’ in factories in the census and the sample sectors
differed substantially particularly in respect of share of fuels , emoluments , depreciation
and factor payments in their respective total cost structure in the two sectors. The ‘gross
profit output ratio’ in the census, sample and factory sectors differed significantly. The
relevant figures for the three sectors during 2003-2004 were 6.85 percent in the census
sector , 6.03 percent in the sample sector and 6.28 percent in the factory sector.
(2) The ‘total value of inputs’ (materials, fuels and other inputs taken together) constituted
81.41 percent of the ‘total value of output’ in the census sector, 85.97 percent in the
sample sector and 84.60 percent in the factory sector.

-31 – (3) The contribution of materials and stores components of inputs 56.24 percent of the total
output. The relevant figures were 46.72 percent for the census sector and 60.34 percent for
the sample sector .
(4) The share of ‘fuels’ also varied substantially in the three sectors. It was only 3.23 percent
of the value of output in the census sector, 3.81 percent in the sample sector and 3.63
percent in the factory sector.
(5) The other important factor of the cost viz. ‘emoluments’ formed only 7.96 percent of
‘total output’ in the census sector, 4.23 percent in the sample sector and 5.35 percent in
the factory sector.
(6) The percentage contribution of factor payments was 1.55 percent of ‘total value of output’
in the census sector, 1.93 percent in the sample sector and 1.82 percent in the factory
sector.
(g) VALUE ADDED BY MANUFACTURER
Value added by manufacture is a measure of the relative importance of the industrial
sector in State / National economy as well as a measure of the relative importance of a
particular industry within the industrial sector itself. It is used to measure the contribution of
Industrial Sector in the State / National domestic product. Measured in term of ‘value added
by manufacture’ the contribution of the organised Industrial sector (factory sector) in the state
domestic product of Delhi during the year 2003-2004 worked out to Rs. 2141.28 crore.
TABLE 14: VALUE ADDED BY MANUFACTURE AND SOME IMPORTANT
RATIO (Value in Rs. Lakh)
Sector Units covered
Value added
Invested capital
Value added
Invested capital ratio
Value added
Input ratio
Value added Output ratio
Value added per
worker Rs.
Value added per employee
Rs. Census 239 78289 138254 0.57 0.20 0.16 282723 194102
(7.48) (36.56) (29.68)
Sample 2954 135839 327597 0.41 0.14 0.12 214826 153812
(93.52) (63.44) (70.32)
Total 3193 214128 465851 0.46 0.16 0.13 235504 166443
(100.00) (100.00) (100.00)
(Figures in parenthesis indicate percentage to the total)

-32 – The study of the table reveals that :- (i) The share of the Census Sector, constituting 7.48 percent of the total factories covered,
was Rs 782.89 crore or 36.56 percent of the ‘total value added by manufacture while it
worked out to Rs. 1358.39 crore or 63.44 percent of the total for the Sample Sector, forming
92.52 percent of the Factory Sector.
(ii) ‘Value added – Invested Capital ratio’ or the ‘Value added per unit of Invested
Capital’, was 0.41 in the Sample Sector , 0.57 in the Census Sector and 0.46 in the Factory
Sector indicating relatively better return on the Invested Capital in the Census Sector.
(iii) The “Value added per worker’ at Rs. 282723 in the Census sector was higher as
compared to Rs 214826 in the Sample Sector and Rs. 235504 in the Factory Sector.
(iv) The ‘Value added per employee’ in the sample, Census and Factory Sectors were
Rs.194102, 153812 and 166443 respectively.
NOTE:-
The report is based on the number of returns actually received by this office from NSSO
(FOD) , Ministry of Statistics & Program Implementation, Govt. of India.

PART – II
-33 -
S.No. Characteristics Unit Census Sample Total1 Factories Covered Number 239 2954 31932 Fixed Capital Rs. In Lakhs 72254 137608 2098623 Working Capital Rs. In Lakhs 72332 228631 3009634 Invested Capital Rs. In Lakhs 138254 327597 4658515 Workers Number 27691 63232 909236 All Employees Number 40334 88315 1286497 Mandays Worked
(Employees)No. In ‘000’ 12141777 21795907 33937684
8 Wages To Workers Rs. In lakhs 16469 24441 409109 Total Emoluments Rs. In lakhs 42524 55826 9835010 Fuels Consumed Rs. In Lakhs 15464 42412 5787611 Material Consumed Rs In Lakhs 223717 672360 89607712 Other Input Rs. In Lakhs 150611 243105 39371613 Total Input Rs. In Lakhs 389793 957878 134767114 Products Rs. In Lakhs 360032 923517 128354915 Other Output Rs. In Lakhs 118777 190719 30949616 Total Output Rs. In Lakhs 478809 1114236 159304517 Depreciation Rs. In Lakhs 10728 20520 3124818 Gross Value Added Rs. In Lakhs 89016 156358 24537419 Value added Rs. In Lakhs 78280 135838 21412620 Factor Payments(Rent Paid
+Interest Paid)Rs. In Lakhs 7419 21544 28963
21 Rent Rs. In Lakhs 3443 5142 858522 Interest Rs. In Lakhs 3976 16402 2037823 Net Income Rs. In Lakhs 70869 114294 185163
2003-2004ANNUAL SURVEY OF INDUSTRY
TABLE 1:PRINCIPAL CHARACTERISTICS AT A GLANCE

-34 -
1 2 3 4 5 6 7 8111 2771386 2042659 4814044 2821734
(3.47) (13.21) (7.98) (10.33) (9.38)17 62924 66038 128962 31951
(0.53) (0.3) (0.26) (0.28) (0.11)133 747298 789868 1537167 620092
(4.15) (3.56) (3.09) (3.3) (2.06)565 4880098 7323200 12203298 6998204
(17.69) (23.25) (28.61) (26.2) (23.25)143 846122 917276 1763398 1379493
(4.47) (4.03) (3.58) (3.79) (4.58)6 11063 26373 37436 29389
(0.19) (0.05) (0.1) (0.08) (0.1)
57 314420 300801 615221 281096(1.77) (1.5) (1.18) (1.32) (0.93)205 2451715 629924 3081639 1590911
(6.42) (11.68) (2.46) (6.62) (5.29)4 3458 1141 4599 17693
(0.13) (0.02) (0) (0.01) (0.06)122 1028359 4234246 5262605 4948524
(3.84) (4.9) (16.54) (11.3) (16.44)213 570239 463812 1034050 439393
(6.66) (2.72) (1.81) (2.22) (1.46)28 46280 86481 132761 85104
(0.88) (0.22) (0.34) (0.28) (0.28)162 249315 640570 889885 831386
(5.06) (1.19) (2.50) (1.91) (2.76)273 2208771 1224959 3433730 1440964
(8.55) (10.52) (4.79) (7.37) (4.79)271 798170 1111171 1909340 726726
(8.49) (3.80) (4.34) (4.10) (2.41)6 71529 68423 139952 267582
(0.19) (0.34) (0.27) (0.30) (0.89)199 559710 1338803 1898513 1781208
(6.22) (2.67) (5.23) (4.08) (5.92)85 518619 513176 1031795 472246
(2.67) (2.47) (2.00) (2.21) (1.57)47 239028 340938 579966 632096
(1.47) (1.14) (1.33) (1.24) (2.10)160 814754 649476 1464230 1534800
(5.05) (3.88) (2.54) (3.14) (5.10)91 496934 1792617 2289552 2062739
(2.85) (2.37) (7.00) (4.91) (6.85)86 446993 458111 905104 277931
(2.70) (2.13) (1.79) (1.94) (0.92)140 600189 562161 1162351 712461
(4.38) (2.86) (2.20) (2.50) (2.37)6 74640 6757 81397 7101
(0.20) (0.36) (0.03) (0.17) (0.02)18 130313 1 130313 81865
(0.56) (0.62) (0.00) (0.28) (0.27)45 43834 9889 53723 23586
(1.41) (0.21) (0.04) (0.12) (0.08)
3193 20986161 25598871 46585031 30096275(100.00) (100.00) (100.00) (100.00) (100.00)
Supporting And Auxiliary Transport Activities: Activities of Travel AgenciesOthers (not specified)
Mfr of Other Transport Equipment
Mfr of furniture: Manufacturing N.E.C
Sale.Maintenance and repair of Motor Vehicles and Motorcycles: Retails sale of Automotive FuelRetail Trade Except Of Motor Vehicles And MotorCycles: Repair Of Personal And HouseHold Goods
Mfr. of Electrical Machinery and Apparatus N.E.CMfr. of Radio Television and Communication Equipement and ApparatusMfr. of Medical, Precision and Optical Instrument Watches and clocksMfr of Motor Vehicles Trailor and Semi-Trailers
Mfr. of Basic Metals
Mfr. of Fabricated Metal Products, except Machinery and Equipment N.E.CMfr. Of Machinery and Equipment N.E.C
Mfr. of Office, Accounting and Computer Machinery
Mfr. of Coke, Refined Petroleum Products and Nuclear FueMfr. of Chemicals and Chemical Products
Mfr. of Rubber and Plastics Products
Mfr. of Other Non-Metallic Mineral Products
Mfr. of Food Products And Beverages
Mfr. of Tobacco Products
Mfr. of Textiles
Mfr. of Wearing Apparel: Dressing and Dyeing of furTanning and Dressing of leather : Mfg. of Luggages , Hand bags Foot WeaMfr. of Wood and of Products of Wood and Cork except Furniture: Mfr. Of articles of straw and plaiting materialsMfr. of Paper & Paper Product
Publishing, Printing and Reporoduction of Recorded Media
TABLE II : IMPORTANT CHARACTERISTICS BY MAJOR INDUSTRY GROUPS
Major Industry Group
Description No.of Factories Covered
Fixed Capital Physical Working Capital
(VALUE IN Rs 000)Sl. No.
Invested Capital
Working Capital
1
2
3
4
5
6
7
8
9
10
11
12
13
14
15
16
17
18
19
15
16
17
18
19
20
21
22
23
24
25
26
27
28
29
30
31
32
33
20 34
21 35
22 36
23 50
24 52
25 63
26 93
Total
27

-35 -
1 2 3 9 10 11 12 13932575 2592460 5105 8002 386247(5.16) (7.64) (5.61) (6.22) (9.44)
132692 116336 326 441 12615(0.73) (0.34) (0.36) (0.34) (0.31)
594174 1350180 3033 4502 144253(3.29) (3.98) (3.34) (3.50) (3.53)
4229396 10340931 39135 49227 1331213(23.42) (30.47) (43.04) (38.26) (32.54)
1097903 1307343 3424 4360 150421(6.08) (3.85) (3.77) (3.39) (3.68)86199 65189 174 222 8033(0.48) (0.19) (0.19) (0.17) (0.20)
307713 414038 1079 1419 49241(1.70) (1.22) (1.19) (1.10) (1.20)
1324206 2569703 4958 8939 298287(7.33) (7.57) (5.45) (6.95) (7.29)243 8277 20 27 1317
(0.00) (0.02) (0.02) (0.02) (0.03)2721487 2060058 2900 6867 137383(15.07) (6.07) (3.19) (5.34) (3.36)443772 1259624 2891 4292 112312(2.46) (3.71) (3.18) (3.34) (2.75)59861 224891 578 774 27332(0.33) (0.66) (0.64) (0.60) (0.67)
526915 620947 1512 2153 65511(2.92) (1.83) (1.66) (1.67) (1.60)
509897 2062258 5303 7036 323409(2.82) (6.08) (5.83) (5.47) (7.91)
875669 1587307 3616 5433 172518(4.85) (4.68) (3.98) (4.22) (4.22)
186620 37125 53 122 2712(1.03) (0.11) (0.06) (0.09) (0.07)
1166594 1409408 3420 4882 151887(6.46) (4.15) (3.76) (3.79) (3.71)
515224 857415 1793 2953 83228
(2.85) (2.53) (1.97) (2.30) (2.03)174636 485468 1139 1636 58662(0.97) (1.43) (1.25) (1.27) (1.43)
1068842 1386338 3266 4673 165144(5.92) (4.08) (3.59) (3.63) (4.04)
361103 920979 2219 3031 166013(2.00) (2.71) (2.44) (2.36) (4.06)
253967 829392 2097 2842 92099(1.41) (2.44) (2.31) (2.21) (2.25)
412336 1235886 2525 4129 134609(2.28) (3.64) (2.78) (3.21) (3.29)
2018 55917 95 189 5535(0.01) (0.16) (0.10) (0.15) (0.14)
44122 66223 122 226 5199(0.24) (0.20) (0.13) (0.18) (0.13)32023 73991 140 271 5857(5.64) (4.59) (6.50) (4.75) (6.98)
18060187 33937684 90923 128648 4091037(100.00) (100.00) (100.00) (100.00) (100.00)
Supporting And Auxiliary TransportActivities: Activities of Travel AgenciesOthers (not specified)
Mfr of Other Transport Equipment
Mfr of furniture: Manufacturing N.E.C
Sale.Maintenance and repair of MotorVehicles and Motorcycles: Retails sale ofAutomotive FueRetail Trade Except Of Motor Vehicles AndMotorCycles: Repair Of Personal AndHousehold Goods
Mfr. of Electrical Machinery and ApparatusN.E.CMfr of Radio Television andCommunication Equipement andApparatusMfr. of Medical, Precision and OpticalInstrument Watches and clocksMfr of Motor Vehicles Trailor and Semi-Trailers
Mfr. of Wood and of Products of Woodand Cork except Furniture: Mfr. of articlesof straw and plaiting materialsMfr. of Paper & Paper Product
Publishing, Printing and Reporoduction ofRecorded Media
Mfr. of Office, Accounting and ComputerMachinery
Mfr. of Tobacco Products
Mfr. of Textiles
Mfr. of Wearing Apparel: Dressing andDyeing of furTanning and Dressing of leather : Mfg. ofLuggages , Hand bags Foot Wea
(VALUE IN Rs 000)Wages To Workers
Mfr. of Basic Metals
Mfr. of Fabricated Metal Products, exceptMachinery and Equipment N.E.CMfr. of Machinery and Equipment N.E.C
TABLE II : IMPORTANT CHARACTERISTICS BY MAJOR INDUSTRY GROUPS
Major Industry Group
Description
Mfr. of Coke, Refined Petroleum Productsand Nuclear FueMfr. of Chemicals and Chemical Products
Mandays worked
Employees (No)
Workers (No)
Mfr. of Rubber and Plastics Products
Mfr. of Other Non-Metallic MineralProducts
Outstanding Loan
Employees (No)
1 15
Sl. No.
Mfr. of Food Products And Beverages
2 16
3 17
4 18
5 19
6 20
7 21
8 22
9 23
10 24
11 25
12 26
13 27
14 28
15 29
16 30
17 31
18 32
19 33
20 34
21 35
22 36
23 50
24 52
25 63
26 93
Total
-36 -
1 2 3 14 15 16 17 181016396 1043243 23962997 7550670 32556910(10.33) (18.03) (26.74) (19.18) (24.16)32337 17398 470900 87989 576287(0.33) (0.30) (0.53) (0.22) (0.43)
358823 196084 3620127 1492190 5308401(3.65) (3.39) (4.04) (3.79) (3.94)
2628683 1002743 18063485 11229284 30295511(26.73) (17.33) (20.16) (28.52) (22.48)268095 296881 3087831 574789 3959501(2.73) (5.13) (3.45) (1.46) (2.94)19096 2507 36113 28814 67434(0.19) (0.04) (0.04) (0.07) (0.05)
99017 66115 1005126 269227 1340468(1.01) (1.14) (1.12) (0.68) (0.99)
1035114 336660 3252453 1925680 5514792(10.52) (5.82) (3.63) (4.89) (4.09)2732 3688 5391 3195 12274(0.03) (0.06) (0.01) (0.01) (0.01)
825802 237516 7269505 3723598 11230618(8.40) (4.10) (8.11) (9.46) (8.33)
238902 241174 1896038 654275 2791487(2.43) (4.17) (2.12) (1.66) (2.07)50508 31449 269662 39756 340867(0.51) (0.54) (0.30) (0.10) (0.25)
116341 632568 3656604 653474 4942646(1.18) (10.93) (4.08) (1.66) (3.67)
586162 358152 4356211 958942 5673305(5.96) (6.19) (4.86) (2.44) (4.21)
403537 254918 2727588 1046123 4028629(4.10) (4.40) (3.04) (2.66) (2.99)16288 4357 15022 260443 279822(0.17) (0.08) (0.02) (0.66) (0.21)
338054 180095 5151831 3252693 8584618(3.44) (3.11) (5.75) (8.26) (6.37)
273542 144136 2211866 997416 3353418(2.78) (2.49) (2.47) (2.53) (2.49)
135682 37944 1065909 236676 1340529(1.38) (0.66) (1.19) (0.60) (0.99)
420645 208051 3054758 1066688 4329497(4.28) (3.59) (3.41) (2.71) (3.21)
343766 164759 1818118 587448 2570325(3.50) (2.85) (2.03) (1.49) (1.91)
249730 102370 1452124 559312 2113805(2.54) (1.77) (1.62) (1.42) (1.57)
322471 158535 1118343 2113913 3390791(3.28) (2.74) (1.25) (5.37) (2.52)
21333 8503 21708 19146 49357(0.22) (0.15) (0.02) (0.05) (0.04)
14389 50948 118 17835 68902(0.15) (0.88) (0.00) (0.05) (0.05)17561 6895 17932 22018 46845(0.18) (0.12) (0.02) (0.06) (0.03)
9835006 5787689 89607760 39371594 134767039(100.00) (100.00) (100.00) (100.00) (100.00)
Sale.Maintenance and repair of MotorVehicles and Motorcycles: Retails sale ofAutomotive FuelRetail Trade Except Of Motor Vehicles andMotor Cycles: Repair Of Personal andHousehold GoodsSupporting And Auxiliary TransportActivities: Activities of Travel AgenciesOthers (not specified)
Mfr. of Food Products And Beverages
Mfr. of Tobacco Products
(VALUE IN Rs 000) Description Other InputFuels
Consumed
TABLE II : IMPORTANT CHARACTERISTICS BY MAJOR INDUSTRY GROUPS
Total Emoluments
Mfr. of Other Non-Metallic MineralProductsMfr. of Basic Metals
Mfr. Of Fabricated Metal Products, exceptMachinery and Equipment N.E.C
Mfr. of Electrical Machinery and ApparatusN.E.CMfr of Radio Television andCommunication Equipement andApparatusMfr. of Medical, Precision and OpticalInstrument Watches and clocksMfr of Motor Vehicles Trailor and Semi-TrailersMfr of Other Transport Equipment
Mfr of Furniture: Manufacturing N.E.C
Mfr. of Machinery and Equipment N.E.C
Mfr. of Office, Accounting and ComputerMachinery
Mfr. Of Wearing Apparel: Dressing andDyeing of furTanning and Dressing of leather : Mfg. ofLuggages , Hand bags Foot Wea
Mfr. of Rubber and Plastics Products
Total InputSl No.
Major Industry Group
Material Consumed
Mfr. of Wood and of Products of Woodand Cork except Furniture: Mfr. Of articlesof straw and plaiting materialMfr. of Paper & Paper Product
Mfr. of Textiles
Publishing, Printing and Reporoduction ofRecorded MediaMfr. of Coke, Refined Petroleum Productsand Nuclear FueMfr. of Chemicals and Chemical Products
11 25
12 26
13
1 15
2 16
3 17
4 18
5 19
6 20
7 21
8 22
9 23
10 24
27
14 28
15 29
16 30
17 31
18 32
19 33
20 34
21 35
22 36
23 50
24 52
25 63
26 93
Total

-37 -
1 2 3 19 20 21 22 2328917877 6325374 35243251 367771 2318569
(22.53) (20.44) (22.12) (11.77) (10.83)575537 33757 609294 11287 21719(0.45) (0.11) (0.38) (0.36) (0.10)
5799033 662395 6461428 152474 1000553(4.52) (2.14) (4.06) (4.88) (4.67)
34773730 1942954 36716685 864507 5556667(27.09) (6.28) (23.05) (27.67) (25.95)
4404986 310679 4715665 165373 590791(3.43) (1.00) (2.96) (5.29) (2.76)40471 38980 79452 2867 9151(0.03) (0.13) (0.05) (0.09) (0.04)
1374163 202210 1576373 38708 197197(1.07) (0.65) (0.99) (1.24) (0.92)
3951756 3754676 7706431 360680 1830959(3.08) (12.13) (4.84) (11.54) (8.55)7051 14556 21607 624 8709(0.01) (0.05) (0.01) (0.02) (0.04)
10480513 3304942 13785454 160165 2394671(8.17) (10.68) (8.65) (5.13) (11.18)
2681980 542250 3224230 87349 345394(2.09) (1.75) (2.02) (2.80) (1.61)
412294 38672 450966 9199 100901(0.32) (0.12) (0.28) (0.29) (0.47)
4792270 847496 5639766 46377 650742(3.73) (2.74) (3.54) (1.48) (3.04)
6373647 638805 7012453 150215 1188934(4.97) (2.06) (4.40) (4.81) (5.55)
3924891 893783 4818674 109844 680201(3.06) (2.89) (3.02) (3.52) (3.18)22216 209979 232194 10844 -58472(0.02) (0.68) (0.15) (0.35) -(0.27)
6446364 3124798 9571162 83055 903488(5.02) (10.10) (6.01) (2.66) (4.22)
3250789 871251 4122040 79870 688752(2.53) (2.82) (2.59) (2.56) (3.22)
1586696 116604 1703299 27832 334939(1.24) (0.38) (1.07) (0.89) (1.56)
4537419 615472 5152891 113112 710282(3.54) (1.99) (3.23) (3.62) (3.32)
1924430 1289297 3213727 101988 541415(1.50) (4.17) (2.02) (3.26) (2.53)
2005059 535961 2541020 80100 347114(1.56) (1.73) (1.60) (2.56) (1.62)69276 4392926 4462202 80152 991260(0.05) (14.19) (2.80) (2.56) (4.63)
0 91793 91793 7744 34693 (0.30) (0.06) (0.25) (0.16)
2485 86627 89112 7947 12264(0.00) (0.28) (0.06) (0.25) (0.06)
0 63363 63363 4744 11775(0.20) (0.04) (0.15) (0.05)
128354933 30949600 159304532 3124828 21412668
(100.00) (100.00) (100.00) (100.00) (100.00)
Sale.Maintenance and repair of Motor Vehiclesand Motorcycles: Retails sale of AutomotiveFuelRetail Trade Except Of Motor Vehicles AndMotorCycles: Repair Of Personal AndHousehold GoodsSupporting And Auxiliary Transport Activities:Activities of Travel AgenciesOthers (not specified)
Mfr. Of Machinery and Equipment N.E.C
Mfr. Of Office, Accounting and ComputerMachineryMfr. of Electrical Machinery and ApparatusN.E.C
Mfr. of Other Non-Metallic MineralProducts
Mfr. Of Fabricated Metal Products, exceptMachinery and Equipment N.E.C
Mfr. of Basic Metals
Publishing, Printing and Reporoduction ofRecorded MediaMfr. of Coke, Refined Petroleum Productsand Nuclear FueMfr. of Chemicals and Chemical Products
Mfr. of Food Products And Beverages
Mfr. of Tobacco Products
Mfr. of Textiles
Mfr. Of Wearing Apparel: Dressing andDyeing of furTanning and Dressing of leather : Mfg. ofLuggages , Hand bags Foot WeaMfr. of Wood and of Products of Woodand Cork except Furniture: Mfr. Of articlesof straw and plaiting materialsMfr. of Paper &Paper Product
Mfr. of Rubber and Plastics Products
Other OutputProducts Depreci-ationTotal OutputSl. NO.
Major Industry Group
Mfr of Radio Television and CommunicationEquipement and ApparatusMfr. of Medical, Precision and OpticalInstrument Watches and clocksMfr of Motor Vehicles Trailor and Semi-TrailersMfr of Other Transport Equipment
Mfr of Furniture: Manufacturing N.E.C
TABLE II : IMPORTANT CHARACTERISTICS BY MAJOR INDUSTRY GROUPS (VALUE IN Rs 000)
Value added
1 15
Description
2 16
3 17
4 18
5 19
6 20
7 21
8 22
9 23
10 24
11 25
12 26
13 27
14 28
15 29
16 30
17 31
18 32
19 33
20 34
21 35
22 36
23 50
24 52
25 63
26 93
Total

-38 -
1 2 3 24 25 26 27119261 115551 234812 2083757(13.89) (5.67) (8.11) (11.25)2292 12574 14866 6853(0.27) (0.62) (0.51) (0.04)28990 90176 119166 881387(3.38) (4.43) (4.11) (4.76)
181791 572038 753830 4802837(21.18) (28.07) (26.03) (25.94)22994 87146 110140 480651(2.68) (4.28) (3.80) (2.60)848 3128 3976 5175
(0.10) (0.15) (0.14) (0.03)
20042 38586 58628 138568(2.33) (1.89) (2.02) (0.75)55366 99876 155242 1675717(6.45) (4.90) (5.36) (9.05)
79 0 79 8630(0.01) (0.00) (0.00) (0.05)78930 230660 309590 2085081(9.19) (11.32) (10.69) (11.26)6297 48560 54857 290537(0.73) (2.38) (1.89) (1.57)5114 7374 12488 88412(0.60) (0.36) (0.43) (0.48)18050 81763 99813 550930(2.10) (4.01) (3.45) (2.98)37671 96339 134010 1054923(4.39) (4.73) (4.63) (5.70)30353 82716 113068 567132(3.54) (4.06) (3.90) (3.06)3195 4039 7234 -65705(0.37) (0.20) (0.25) -(0.35)34412 135796 170209 733280(4.01) (6.66) (5.88) (3.96)16891 54157 71049 617704(1.97) (2.66) (2.45) (3.34)5426 13929 19354 315584(0.63) (0.68) (0.67) (1.70)41642 147054 188697 521585(4.85) (7.22) (6.52) (2.82)41338 46542 87880 453535(4.82) (2.28) (3.03) (2.45)21825 34870 56695 290419(2.54) (1.71) (1.96) (1.57)82741 31161 113902 877358(9.64) (1.53) (3.93) (4.74)
2287 1074 3361 31332(0.27) (0.05) (0.12) (0.17)148 984 1132 11131
(0.02) (0.05) (0.04) (0.06)436 1760 2196 9579
(0.05) (0.02) (0.03) (0.09)
858419 2037853 2896274 18516392(100.00) (100.00) (100.00) (100.00)
25 63 Supporting And Auxiliary Transport Activities:Activities of Travel Agencies
26 93 Others (not specified)
23 50 Sale.Maintenance and repair of Motor Vehiclesand Motorcycles: Retails sale of AutomotiveFuel
24 52 Retail Trade Except Of Motor Vehicles AndMotorCycles: Repair Of Personal And
21 35 Mfr of Other Transport Equipment
22 36 Mfr of Furniture: Manufacturing N.E.C
19 33 Mfr. of Medical, Precision and OpticalInstrument Watches and clocks
20 34 Mfr of Motor Vehicles Trailor and Semi-Trailers
17 31 Mfr. of Electrical Machinery and ApparatusN.E.C
18 32 Mfr of Radio Television and CommunicationEquipement and Apparatus
15 29 Mfr. of Machinery and Equipment N.E.C
16 30 Mfr. of Office, Accounting and ComputerMachinery
13 27 Mfr. of Basic Metals
14 28 Mfr. of Fabricated Metal Products, exceptMachinery and Equipment N.E.C
11 25 Mfr. of Rubber and Plastics Products
12 26 Mfr. of Other Non-Metallic MineralProducts
9 23 Mfr. of Coke, Refined Petroleum Productsand Nuclear Fue
10 24 Mfr. of Chemicals and Chemical Products
7 21 Mfr. of Paper & Paper Product
8 22 Publishing, Printing and Reporoduction ofRecorded Media
5 19 Tanning and Dressing of leather : Mfg. ofLuggages , Hand bags Foot Wea
6 20 Mfr. of Wood and of Products of Woodand Cork except Furniture: Mfr. Of articlesof straw and plaiting materials
3 17 Mfr. of Textiles
4 18 Mfr. Of Wearing Apparel: Dressing andDyeing of fur
1 15 Mfr. of Food Products And Beverages
2 16 Mfr. of Tobacco Products
Rent Interest Factor Payment (24+25)
Net Income
TABLE II : IMPORTANT CHARACTERISTICS BY MAJOR INDUSTRY GROUPS
Sl. NO.
Major Industry Group
Description(VALUE IN Rs 000)

-39
1 2 3 4 5 6 710 149535 318893 468427 180336
5 424372 17520 441891 15324
54 525890 1160810 1686700 1127674
36 1101775 497672 1599447 1350394
6 569815 47765 617580 148006
17 62924 66038 128962 31951
32 96617 71762 168379 -181274
75 536374 633860 1170234 762378
27 136606 86776 223382 67513
564 4857800 7320671 12178470 6969680
7 44572 37316 81888 74395
136 801551 879959 1681510 1305098
2 2234 15057 17291 17851
4 8830 11316 20145 11537
57 314420 300801 615221 281096
16 764742 67663 832405 952137
189 1686973 562260 2249233 638774
4 3458 1141 4599 17693
15 74133 805905 880038 618697
107 954226 3428341 4382566 4329826
34 30778 47045 77823 54642
179 539461 416766 956227 384751
12 14702 34654 49356 43278
17 31578 51827 83405 41826
109 153698 384310 538007 448788
34 49604 175975 225578 308586
18 46014 80286 126299 74012
58 104026 192531 296557 136425
215 2104745 1032428 3137173 1304539
71 241449 307446 548895 217572
148 361379 626473 987852 302371
52 195341 177251 372593 206783
6 71529 68423 139952 267582
153 Manufacture of Grain Mill Products, Starches and Strach, Products, and Prepared Animals Feeds
154 Manufacture of Other Food Products
151 Production Processing and preservation of Meat, Fish, Fruit, Vegetables, Oils, and Fats
152 Manufacture of Dairy Products ( Production of Raw Milk is classified in class121)
155 Manufature of Beverages
160 Manufacture of Tobacco Products
171 Spinning Weaving and Finishing of Textiles
172 Manufacture of Other Textiles
173 Manufacture of Knitted and Crocheted Fabrics and Articles
181 Manufacture of wearing Apparel, except Fur Apparel
191 Tanning and Dressing of Leather, Mfr. Of Luggage Handbags, Saddlery & Hareness
192 Manufacture of Footwear
201 Saw Milling and Planing of Wood
202 Manufacture of Products of Wood ,Straw and Plaiting Materials
210 Manufacture of Paper and Paper Products
221 Publishing
222 Printing and Service activities related to Printing
232 Manufacture of Refined Petroleum products
Manufacture of Plastic Products
261 Manufacture of Glass and Glass Products
Manufacture of Basic Chemicals
242 Manufacture of Other Chemical Products
251 Manufacture of Rubber Products
241
269 Manufacture of Non-Metallic Products N.E.C
271 Manufacture of Basic Iron & Steel
272 Manufacture of Basic Precious and Non-Ferrous Metals
273 Costing of Metals
281 Manufacture of Structural Metal Products, Tanks, Reservoirs and Steam Generators
289 Manufacture of Other Fabricated Metal Products; Metal Working Service Activities
291 Manufacture of General Purpose Machinery
292 Manufacture of Special Purpose Machinery
293 Manufacture of Domestic Appliances, N.E.C
300 Manufacture of Office, Accounting and Computer
4
Sl. No.
Industry Group
Description Working Capital
ANNUAL SURVEY OF INDUSTRY 2003-2004
1
2
3
TABLE III : IMPORTANT CHARACTERISTICS BY MAJOR INDUSTRY GROUPS (3 Digit Of NIC 1998) (value in 'Rs.000)
No. of factories Fixed Capital Physical Working Capital
Invested Capital
5
6
7
8
18
19
20
13
14
15
16
21
22 252
23
24
25
26
31
32
27
28
29
30
17
9
10
11
12
33

-40
1 2 3 4 5 6 7
Sl. No.
Industry Group
Description Working Capital
ANNUAL SURVEY OF INDUSTRY 2003-2004TABLE III : IMPORTANT CHARACTERISTICS BY MAJOR INDUSTRY GROUPS
(3 Digit Of NIC 1998) (value in 'Rs.000)No. of factories Fixed Capital Physical
Working Capital
Invested Capital
37 43833 60373 104206 49365
42 115702 331207 446909 577463
71 248509 680412 928921 716752
7 23145 25455 48601 27217
21 40156 83136 123292 35159
21 88364 158220 246585 375251
18 167091 79117 246207 133814
23 73528 89145 162673 92968
44 278000 344915 622914 245464
35 214016 322095 536111 607544
3 15726 10378 26104 10159
9 9287 8465 17751 14393
7 923 1110 2033 382
154 813831 648366 1462197 1534418
351 1 1019 1785 2803 -31
16 27511 15610 43121 3340
4 197869 1638158 1836027 1711977
70 270535 137065 407600 347453
30 46831 70379 117210 63324
57 400162 387732 787894 214606
125 591548 543828 1135376 655837
15 8642 18333 26975 56624
6 74640 6757 81397 7101
18 130313 1 130313 81865
44 19923 42465 35656 26857
Total 3193 20986160 25598871 46585031 30096275
Machinery311 Manufacture of Electric Motors, Generators and
Transformers312 Manufacture of Electricity Distribution and Control
Apparatus313 Manufacture of Insulated Wire and Cable
314 Manufacture of Accumulators, Primary cells and Primary Batteries
315 Manufacture of Electric Lamps and Lighting Equipment
319 Manufacture of Other Electricals Equipment N.E.C
321 Manufacture of Electronic Valves and Tubes and Other electronic Components
322 Mfr.of T.V and Radio transmitters and Apparatus for Line Telephony and line Telegraphy
323 Mfr. Of T.V and Radio Receivers, Sound or Video Recording or Reproducing or Apparatus, and
331 Mfr. Of Medical Appliances and instruments and Appliances for measuring, checing, testing,
332 Manufacture of optical Instruments and photographicequipment
333 Manufacture of watches and Clocks
526 Repair of Personal and Household Goods
369 Manufacturing N.E.C
502 Maintenance and Repair of Household Goods
504
352 Mfr. Of Railway and tramway locomotives and Rolling stock
Retail Sale of Automotive Fuel
359 Mfr of Transport Equipment
361 Mfr of Furniture
Building and repair of Ships & Boats
353
630 Supporting and Auxiliary Transport Activities of Travel Agencies
Others
Mfr. Of Air Craft and Space Craft
342 Mfr. Of bodies (coach work) for Motor Vehicles; Mfr. Of Trailers and Semi-Trailers
343 Manufacture of Parts and Accessories for Motor Vehicles and their Engines
37
38
39
40
34
35
36
41
42
43
44
45
46
47
48
49
50
51
54
52
53
55
56
57
58

-41
1 2 3 9 10 11 12146266 228957 456 762 50010
11987 241508 304 701 50513
487093 488342 996 1500 48098
88943 1339204 2930 4062 213982
198285 294448 419 977 23644
132692 116336 326 441 12615
28726 172740 376 587 16646
508573 935622 2079 3103 98411
56875 246461 582 827 29382
4229396 10336288 39131 49212 1331027
27110 50424 115 165 4473
1070793 1256919 3309 4195 145948
14002 3372 7 12 243
72197 61817 167 210 7790
307713 414038 1079 1419 49241
269708 990757 1083 3605 98629
1054498 1578946 3875 5335 199658
243 8277 20 27 1317
130346 79828 157 281 8010
2591141 1980230 2743 6586 129373
43036 188928 504 669 18845
400735 1070696 2388 3623 93467
15645 80019 202 271 9975
44216 144873 377 504 17357
346697 408931 989 1418 42964
109017 151966 365 512 16204
71201 60050 158 224 6343
124312 292498 761 1050 31044
385585 1769760 4542 5987 292365
208238 498247 1149 1680 56446
380555 801862 1857 2769 84666
286876 287198 610 984 31406
186620 37125 53 122 2712
45373 155932 420 571 19198
96782 414080 1016 1401 45116
769026 482197 1078 1686 45079
25408 38255 100 128 3957
19478 127652 286 439 15129
Employees (No.)
Wages to Workers
Outstanding LoanS. No.
Industry Group
Description Mandays Worked
E l
Workers (No.)
315 Manufacture of Electric Lamps and Lighting Equipment
313 Manufacture of Insulated Wire and Cable
314 Manufacture of Accumulators, Primary cells and Primary Batteries
311 Manufacture of Electric Motors, Generators and Transformers
312 Manufacture of Electricity Distribution and Control Apparatus
293 Manufacture of Domestic Appliances, N.E.C
300 Manufacture of Office, Accounting and Computer Machinery
291 Manufacture of General Purpose Machinery
292 Manufacture of Special Purpose Machinery
281 Manufacture of Structural Metal Products, Tanks, Reservoirs and Steam Generators
289 Manufacture of Other Fabricated Metal Products; Metal Working Service Activities
272 Manufacture of Basic Precious and Non-Ferrous Metals
273 Costing of Metals
269 Manufacture of Non-Metallic Products N.E.C
271 Manufacture of Basic Iron & Steel
252 Manufacture of Plastic Products
261 Manufacture of Glass and Glass Products
242 Manufacture of Other Chemical Products
251 Manufacture of Rubber Products
Printing and Service activities related to Printing
232 Manufacture of Refined Petroleum products
241 Manufacture of Basic Chemicals
Manufacture of Products of Wood ,Straw and Plaiting MaterialsManufacture of Paper and Paper Products
221 Publishing
Tanning and Dressing of Leather, Mfr. Of Luggage Handbags, Saddlery & Hareness
192 Manufacture of Footwear
201 Saw Milling and Planing of Wood
173 Manufacture of Knitted and Crocheted Fabrics and Articles
181 Manufacture of wearing Apparel, except Fur Apparel
171 Spinning Weaving and Finishing of Textiles
172 Manufacture of Other Textiles
155 Manufature of Beverages
160 Manufacture of Tobacco Products
153 Manufacture of Grain Mill Products, Starches and Strach, Products, and Prepared Animals Feeds
154 Manufacture of Other Food Products
151 Production Processing and preservation of Meat, Fish, Fruit, Vegetables, Oils, and Fats
152 Manufacture of Dairy Products ( Production of Raw Milk is classified in class121)
1
2
3
4
8
9
10
5
6
7
222
210
11
12
13
14
191
202
18
19
20
15
16
17
21
22
23
24
25
26
27
28
29
30
31
32
33
34
35
36
37
38
ANNUAL SURVEY OF INDUSTRY 2003-2004TABLE III : IMPORTANT CHARACTERISTICS BY MAJOR INDUSTRY GROUPS
(3 Digit Of NIC 1998) (value in 'Rs.000)

-42
1 2 3 9 10 11 12
Employees (No.)
Wages to Workers
Outstanding LoanS. No.
Industry Group
Description Mandays Worked
E l
Workers (No.)
ANNUAL SURVEY OF INDUSTRY 2003-2004TABLE III : IMPORTANT CHARACTERISTICS BY MAJOR INDUSTRY GROUPS
(3 Digit Of NIC 1998) (value in 'Rs.000)
210527 191292 519 658 23408
159769 349357 642 1165 28022
87296 108175 322 415 12710
268159 399884 830 1373 42496
154068 427314 992 1432 52227
6962 13352 25 47 1139
13606 44802 122 157 5296
521 18377 55 68 2745
1068321 1367961 3211 4605 162399
351 0 1963 2 6 172
47403 117012 310 406 15253
49563 176297 306 505 79319
264137 625706 1601 2115 71268
55051 214762 453 699 24267
198917 614630 1643 2143 67832
405264 1152859 2325 3850 121931
7072 83027 200 279 12679
2018 55917 95 189 5535
44122 66223 122 226 5199
5578 71717 140 243 5857
Total 18060187 33937684 90923 128648 4091037
502 Maintenance and Repair of Household Goods
359 Mfr of Transport Equipment
369 Manufacturing N.E.C
361 Mfr of Furniture
352 Mfr. Of Railway and tramway locomotives and Rolling stock
353 Mfr. Of Air Craft and Space Craft
343 Manufacture of Parts and Accessories for Motor Vehicles and their Engines
333
Building and repair of Ships & Boats
332 Manufacture of optical Instruments and photographic equipmentManufacture of watches and Clocks
342 Mfr. Of bodies (coach work) for Motor Vehicles; Mfr. Of Trailers and Semi-Trailers
323 Mfr. Of T.V and Radio Receivers, Sound or Video Recording or Reproducing or Apparatus, and Assciated Goods
331 Mfr. Of Medical Appliances and instruments and Appliances for measuring, checing, testing, navigating and other
321 Manufacture of Electronic Valves and Tubes and Other electronic Components
322 Mfr.of T.V and Radio transmitters and Apparatus for Line Telephony and line Telegraphy
319 Manufacture of Other Electricals Equipment N.E.C39
40
41
42
43
44
52
45
46
47
48
58 Other Service Activities
53
54
55
57
56 526 Repair of Personal and Household Goods
630 Supporting and Auxiliary Transport Activities of Travel Agencies
504 Retail Sale of Automotive Fuel
49
50
51

-43 -
1 2 13 14 15 16 17117535 115406 1405099 216073 1736579
205889 181763 3807675 5301527 9290965
119926 377694 14146525 426430 14950649
474010 259786 4163951 1432696 5856434
99037 108594 439747 173943 722284
32337 17398 470900 87989 576287
45138 44911 924998 342998 1312907
254216 133865 2370691 939071 3443626
61514 18404 327625 218710 564739
2626638 1001647 18060297 11220695 30282639
12294 20194 132757 62165 215116
255801 276686 2955075 512624 3744385
633 351 0 21604 21955
18463 2156 36113 7210 45478
99017 66115 1005126 269227 1340468
607013 60581 502827 1064030 1627438
428100 276079 2749625 861650 3887354
2732 3688 5391 3195 12274
23457 57241 2391260 781746 3230247
802344 180274 4878245 2941852 8000371
31812 33218 182788 26750 242756
207090 207957 1713250 627525 2548731
19777 8991 208941 18948 236879
30731 22458 60722 20808 103987
73513 497155 2178302 242738 2918194
32722 95324 1273281 381642 1750247
10106 40088 205022 29095 274205
63284 33083 691730 138598 863411
522879 325069 3664481 820344 4809894
135466 82290 795545 207107 1084942
Production Processing and preservation of Meat, Fish, Fruit, Vegetables, Oils, and Fats
1 151
2 152 Manufacture of Dairy Products ( Production of Raw Milk is classified in class121)
3
ANNUAL SURVEY OF INDUSTRY 2003-2004
S. No.
Major Industry group
Description Total InputTotal Emolu- ments
Fuel Consumed
Material Consumed
Other Input
TABLE III : IMPORTANT CHARACTERISTICS BY MAJOR INDUSTRY GROUPS (3 Digit Of NIC 1998) (value in 'Rs.000)
153 Manufacture of Grain Mill Products, Starches and Strach, Products, and Prepared Animals Feeds
4 154 Manufacture of Other Food Products
5 155 Manufature of Beverages
6 160 Manufacture of Tobacco Products
Spinning Weaving and Finishing of Textiles
8 172 Manufacture of Other Textiles
7 171
9 173 Manufacture of Knitted and Crocheted Fabrics and Articles
10 181 Manufacture of wearing Apparel, except Fur Apparel
Tanning and Dressing of Leather, Mfr. Of Luggage Handbags, Saddlery & Hareness
12 192 Manufacture of Footwear
11 191
13 201 Saw Milling and Planing of Wood
14 202 Manufacture of Products of Wood ,Straw and Plaiting Materials
17 222 Printing and Service activities related to Printing
15 210 Manufacture of Paper and Paper Products
16 221 Publishing
18 232 Manufacture of Refined Petroleum products
19 241 Manufacture of Basic Chemicals
20 242 Manufacture of Other Chemical Products
21 251 Manufacture of Rubber Products
22 252 Manufacture of Plastic Products
23 261 Manufacture of Glass and Glass Products
24 269 Manufacture of Non-Metallic Products N.E.C
25 271 Manufacture of Basic Iron & Steel
26 272 Manufacture of Basic Precious and Non-Ferrous Metals
27 273 Costing of Metals
28 281 Manufacture of Structural Metal Products, Tanks, Reservoirs and Steam Generators
29 289 Manufacture of Other Fabricated Metal Products; Metal Working Service Activities
30 291 Manufacture of General Purpose Machinery

-44 -
1 2 13 14 15 16 17
ANNUAL SURVEY OF INDUSTRY 2003-2004
S. No.
Major Industry group
Description Total InputTotal Emolu- ments
Fuel Consumed
Material Consumed
Other Input
TABLE III : IMPORTANT CHARACTERISTICS BY MAJOR INDUSTRY GROUPS (3 Digit Of NIC 1998) (value in 'Rs.000)
195501 121632 1287608 288018 1697257
72570 50996 644436 550999 1246430
16288 4357 15022 260443 279822
34751 12196 122064 43527 177787
99139 39433 1052090 226057 1317580
118178 92374 3007143 2898914 5998431
9314 8365 83873 5458 97696
32452 9259 272496 28916 310671
44221 18469 614165 49821 682454
123037 79422 404654 56977 541052
27475 10834 320950 29659 361444
123030 53880 1486262 910779 2450922
122394 33046 1037957 223649 1294651
3464 1108 12761 2468 16337
9824 3791 15191 10559 29540
3711 737 8108 390 9235
416934 207314 3046650 1066298 4320262
351 859 304 1043 3897 5245
23607 12994 143431 17141 173566
176934 20165 473919 218830 712914
142368 131295 1199726 347580 1678600
65954 15746 262430 81819 359995
183776 86623 1189694 477494 1753811
297817 151580 1083196 2041217 3275992
24654 6955 35147 72696 114798
21333 8503 21708 19146 49357
14389 50948 118 17835 68902
16214 5841 17919 7106 30866
Total 9835006 5787689 89607760 39371594 134767039
Repair of Personal and Household Goods56 526
31 292 Manufacture of Special Purpose Machinery
32 293 Manufacture of Domestic Appliances, N.E.C
33 300 Manufacture of Office, Accounting and Computer Machinery
34 311 Manufacture of Electric Motors, Generators and Transformers
35 312 Manufacture of Electricity Distribution and Control Apparatus
36 313 Manufacture of Insulated Wire and Cable
37 314 Manufacture of Accumulators, Primary cells and Primary Batteries
38 315 Manufacture of Electric Lamps and Lighting Equipment
39 319 Manufacture of Other Electricals Equipment N.E.C
40 321 Manufacture of Electronic Valves and Tubes and Other electronic Components
41 322 Mfr.of T.V and Radio transmitters and Apparatus for Line Telephony and line Telegraphy
42 323 Mfr. Of T.V and Radio Receivers, Sound or Video Recording or Reproducing or Apparatus, and
43 331 Mfr. Of Medical Appliances and instruments and Appliances for measuring, checing, testing,
44 332 Manufacture of optical Instruments and photographic equipment
45 333 Manufacture of watches and Clocks
46 342 Mfr. Of bodies (coach work) for Motor Vehicles; Mfr. Of Trailers and Semi-Trailers
47 343 Manufacture of Parts and Accessories for Motor Vehicles and their Engines
48 Building and repair of Ships & Boats
49 352 Mfr. Of Railway and tramway locomotives and Rollingstock
50 353 Mfr. Of Air Craft and Space Craft
51 359 Mfr of Transport Equipment
52 361 Mfr of Furniture
53 369 Manufacturing N.E.C
54 502 Maintenance and Repair of Household Goods
55 504 Retail Sale of Automotive Fuel
57 630 Supporting and Auxiliary Transport Activities of TraveAgencies
58 712 Other Service Activities

-45 -
1 2 18 19 20 21 221900785 17381 1918166 26239 155348
4223648 5225610 9449258 100769 57524
15195862 319147 15515009 50445 513915
6887103 525942 7413045 130834 1425778
710479 237294 947772 59484 166004
575537 33757 609294 11287 21719
1426129 234436 1660565 23811 323846
3690735 389464 4080199 112856 523716
703148 39322 742470 20536 157195
34752751 1942127 36694879 859778 5552462
238633 14778 253411 6383 31912
4166354 295900 4462254 158990 558879
0 29961 29961 274 7732
40471 9019 49490 2593 1419
1374163 202210 1576373 38708 197197
452675 2286951 2739626 126822 985366
3499081 1467725 4966805 233858 845593
7051 14556 21607 624 8709
2517636 937667 3455303 14020 211036
7962876 2367275 10330151 146145 2183634
255872 31942 287814 6034 39023
2426108 510308 2936416 81315 306370
288453 15091 303544 3673 62991
123841 23581 147423 5526 37910
2719048 426642 3145689 29093 198403
1793727 405519 2199245 10487 438511
279496 15335 294831 6797 13829
940015 76594 1016609 20277 132922
5433632 562211 5995844 129938 1056012
1215953 122687 1338641 39448 214251
1822862 271082 2093944 52516 344172
886076 500013 1386089 17880 121778
22216 209979 232194 10844 -58472
Sl. No.
Industry Group
Description Value AddedProducts Other Output Total Output Depreciation
300
291
292
293
272
273
281
289
252
261
269
271
232
241
242
251
173
181
191
192
155
160
171
172
151
152
153
154
Manufacture of Domestic Appliances, N.E.C
Manufacture of Office, Accounting and Computer Machinery
Manufacture of Structural Metal Products, Tanks, Reservoirs and Steam GeneratorsManufacture of Other Fabricated Metal Products; Metal Working Service ActivitiesManufacture of General Purpose Machinery
Manufacture of Special Purpose Machinery
Manufacture of Non-Metallic Products N.E.C
Manufacture of Basic Iron & Steel
Manufacture of Basic Precious and Non-Ferrous MetalsCosting of Metals
Manufacture of Other Chemical Products
Manufacture of Rubber Products
Manufacture of Plastic Products
Manufacture of Glass and Glass Products
Publishing
Printing and Service activities related to Printing
Manufacture of Refined Petroleum products
Manufacture of Basic Chemicals
Manufacture of Footwear
Saw Milling and Planing of Wood
Manufacture of Products of Wood ,Straw and Plaiting MaterialsManufacture of Paper and Paper Products
Manufacture of Other Food Products
Manufacture of Knitted and Crocheted Fabrics and ArticlesManufacture of wearing Apparel, except Fur ApparelTanning and Dressing of Leather, Mfr. Of Luggage Handbags, Saddlery & Hareness
ANNUAL SURVEY OF INDUSTRY 2003-2004TABLE III : IMPORTANT CHARACTERISTICS BY MAJOR INDUSTRY GROUPS
(3 Digit Of NIC 1998) (value in 'Rs.000)
Manufacture of Other Textiles
Manufature of Beverages
Manufacture of Tobacco Products
Spinning Weaving and Finishing of Textiles
Production Processing and preservation of Meat, Fish, Fruit, Vegetables, Oils, and FatsManufacture of Dairy Products ( Production of Raw Milk is classified in class121)Manufacture of Grain Mill Products, Starches and Strach, Products, and Prepared Animals Feeds
1
2
3
4
8
9
10
5
6
7
222
210
221
11
12
13
14
201
202
18
19
20
15
16
17
21
22
23
24
25
26
27
28
29
30
31
32
33
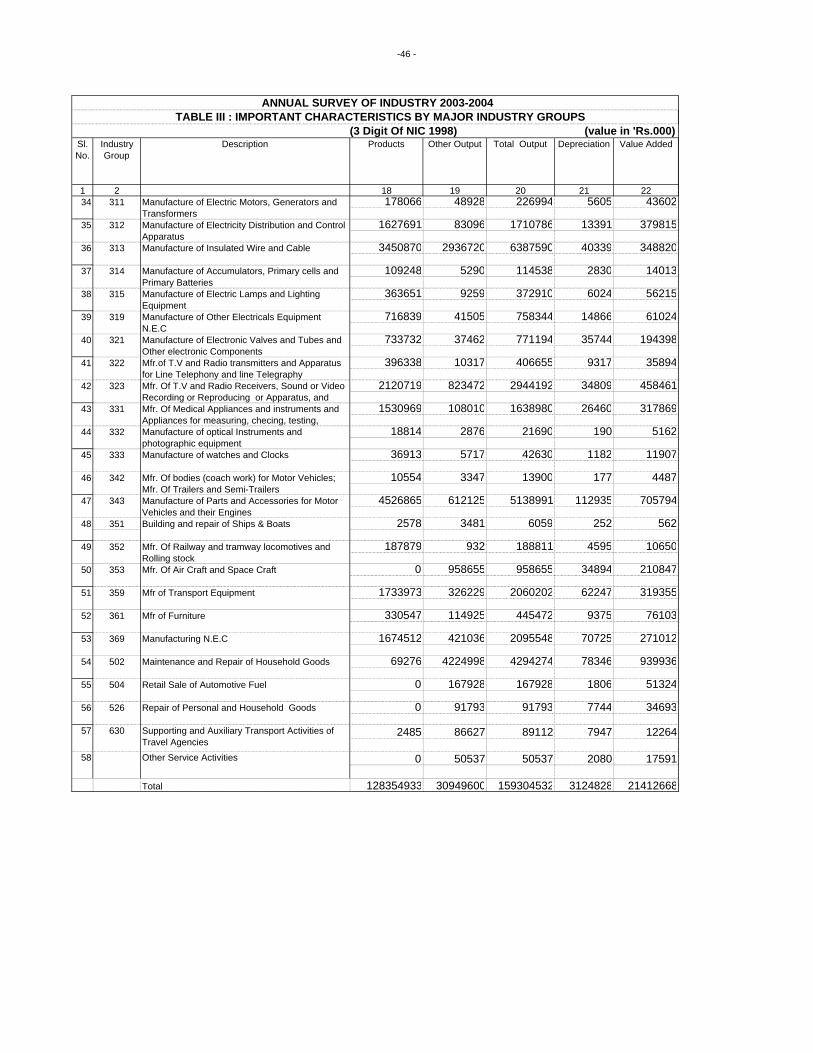
-46 -
1 2 18 19 20 21 22
Sl. No.
Industry Group
Description Value AddedProducts Other Output Total Output Depreciation
ANNUAL SURVEY OF INDUSTRY 2003-2004TABLE III : IMPORTANT CHARACTERISTICS BY MAJOR INDUSTRY GROUPS
(3 Digit Of NIC 1998) (value in 'Rs.000)
178066 48928 226994 5605 43602
1627691 83096 1710786 13391 379815
3450870 2936720 6387590 40339 348820
109248 5290 114538 2830 14013
363651 9259 372910 6024 56215
716839 41505 758344 14866 61024
733732 37462 771194 35744 194398
396338 10317 406655 9317 35894
2120719 823472 2944192 34809 458461
1530969 108010 1638980 26460 317869
18814 2876 21690 190 5162
36913 5717 42630 1182 11907
10554 3347 13900 177 4487
4526865 612125 5138991 112935 705794
351 2578 3481 6059 252 562
187879 932 188811 4595 10650
0 958655 958655 34894 210847
1733973 326229 2060202 62247 319355
330547 114925 445472 9375 76103
1674512 421036 2095548 70725 271012
69276 4224998 4294274 78346 939936
0 167928 167928 1806 51324
0 91793 91793 7744 34693
2485 86627 89112 7947 12264
0 50537 50537 2080 17591
Total 128354933 30949600 159304532 3124828 21412668
56 Repair of Personal and Household Goods526
504
315
319
352
314
321
311
312
313
353
322
323
331
502
332
342
343
359
361
369
Mfr of Furniture
Manufacturing N.E.C
Maintenance and Repair of Household Goods
Retail Sale of Automotive Fuel
Building and repair of Ships & Boats
Mfr. Of Railway and tramway locomotives and Rolling stockMfr. Of Air Craft and Space Craft
Mfr of Transport Equipment
Manufacture of optical Instruments and photographic equipmentManufacture of watches and Clocks
Mfr. Of bodies (coach work) for Motor Vehicles; Mfr. Of Trailers and Semi-TrailersManufacture of Parts and Accessories for Motor Vehicles and their Engines
Manufacture of Electronic Valves and Tubes and Other electronic ComponentsMfr.of T.V and Radio transmitters and Apparatus for Line Telephony and line TelegraphyMfr. Of T.V and Radio Receivers, Sound or Video Recording or Reproducing or Apparatus, and Mfr. Of Medical Appliances and instruments and Appliances for measuring, checing, testing,
Manufacture of Insulated Wire and Cable
Manufacture of Accumulators, Primary cells and Primary BatteriesManufacture of Electric Lamps and Lighting EquipmentManufacture of Other Electricals Equipment N.E.C
Manufacture of Electric Motors, Generators and TransformersManufacture of Electricity Distribution and Control Apparatus
34
35
36
37
38
39
40
41
42
43
44
45 333
46
47
48
49
50
51
52
53
54
55
57 630 Supporting and Auxiliary Transport Activities of Travel Agencies
58 Other Service Activities
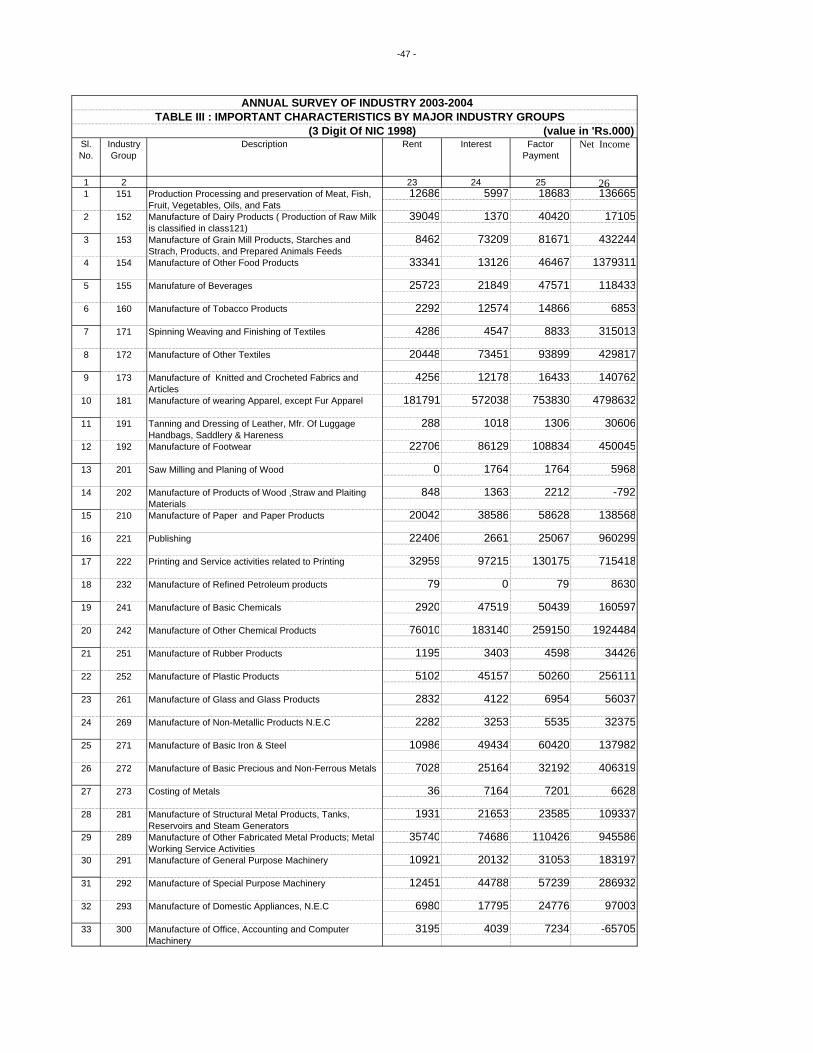
-47 -
1 2 23 24 25 2612686 5997 18683 136665
39049 1370 40420 17105
8462 73209 81671 432244
33341 13126 46467 1379311
25723 21849 47571 118433
2292 12574 14866 6853
4286 4547 8833 315013
20448 73451 93899 429817
4256 12178 16433 140762
181791 572038 753830 4798632
288 1018 1306 30606
22706 86129 108834 450045
0 1764 1764 5968
848 1363 2212 -792
20042 38586 58628 138568
22406 2661 25067 960299
32959 97215 130175 715418
79 0 79 8630
2920 47519 50439 160597
76010 183140 259150 1924484
1195 3403 4598 34426
5102 45157 50260 256111
2832 4122 6954 56037
2282 3253 5535 32375
10986 49434 60420 137982
7028 25164 32192 406319
36 7164 7201 6628
1931 21653 23585 109337
35740 74686 110426 945586
10921 20132 31053 183197
12451 44788 57239 286932
6980 17795 24776 97003
3195 4039 7234 -65705
293 Manufacture of Domestic Appliances, N.E.C
300 Manufacture of Office, Accounting and Computer Machinery
291 Manufacture of General Purpose Machinery
292 Manufacture of Special Purpose Machinery
281 Manufacture of Structural Metal Products, Tanks, Reservoirs and Steam Generators
289 Manufacture of Other Fabricated Metal Products; Metal Working Service Activities
272 Manufacture of Basic Precious and Non-Ferrous Metals
273 Costing of Metals
269 Manufacture of Non-Metallic Products N.E.C
271 Manufacture of Basic Iron & Steel
252 Manufacture of Plastic Products
261 Manufacture of Glass and Glass Products
242 Manufacture of Other Chemical Products
251 Manufacture of Rubber Products
Printing and Service activities related to Printing
232 Manufacture of Refined Petroleum products
241 Manufacture of Basic Chemicals
Manufacture of Products of Wood ,Straw and Plaiting MaterialsManufacture of Paper and Paper Products
221 Publishing
Tanning and Dressing of Leather, Mfr. Of Luggage Handbags, Saddlery & Hareness
192 Manufacture of Footwear
201 Saw Milling and Planing of Wood
173 Manufacture of Knitted and Crocheted Fabrics and Articles
181 Manufacture of wearing Apparel, except Fur Apparel
171 Spinning Weaving and Finishing of Textiles
172 Manufacture of Other Textiles
155 Manufature of Beverages
160 Manufacture of Tobacco Products
153 Manufacture of Grain Mill Products, Starches and Strach, Products, and Prepared Animals Feeds
154 Manufacture of Other Food Products
151 Production Processing and preservation of Meat, Fish, Fruit, Vegetables, Oils, and Fats
152 Manufacture of Dairy Products ( Production of Raw Milk is classified in class121)
Net Income
ANNUAL SURVEY OF INDUSTRY 2003-2004TABLE III : IMPORTANT CHARACTERISTICS BY MAJOR INDUSTRY GROUPS
(3 Digit Of NIC 1998) (value in 'Rs.000)Sl. No.
Industry Group
Description Factor Payment
Rent Interest
1
2
3
4
8
9
10
5
6
7
222
210
11
12
13
14
191
202
18
19
20
15
16
17
21
22
23
24
25
26
27
28
29
30
31
32
33
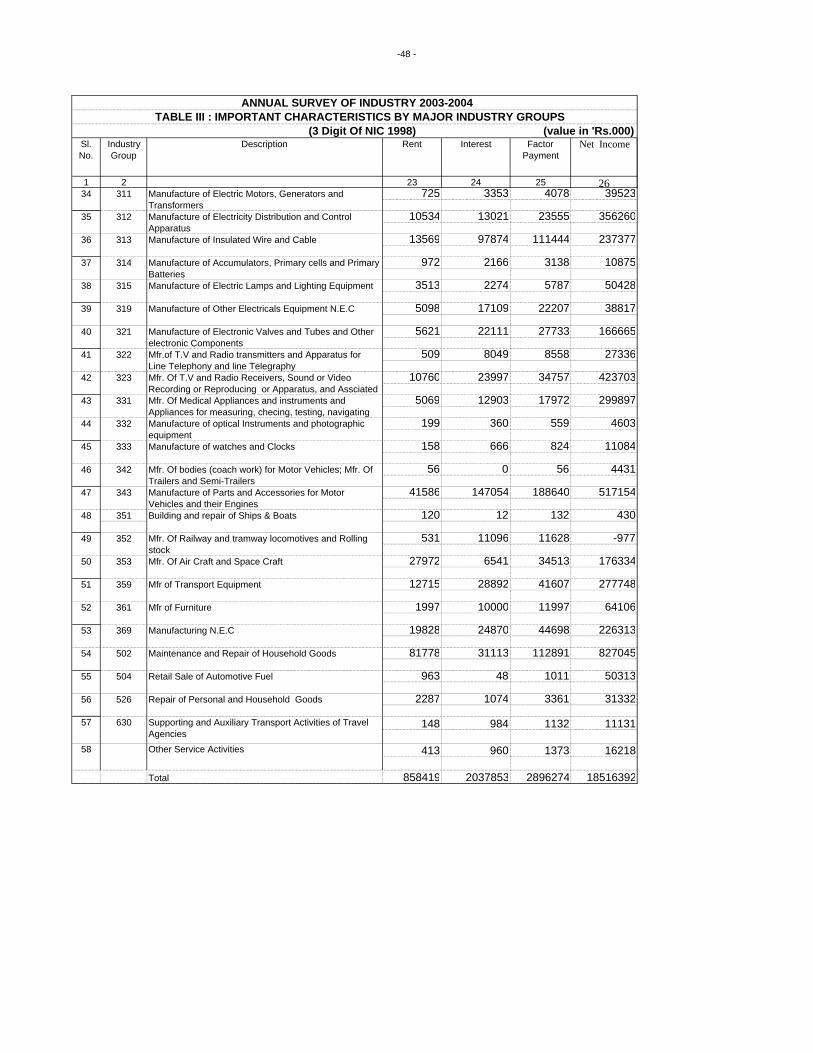
-48 -
1 2 23 24 25 26
Net Income
ANNUAL SURVEY OF INDUSTRY 2003-2004TABLE III : IMPORTANT CHARACTERISTICS BY MAJOR INDUSTRY GROUPS
(3 Digit Of NIC 1998) (value in 'Rs.000)Sl. No.
Industry Group
Description Factor Payment
Rent Interest
725 3353 4078 39523
10534 13021 23555 356260
13569 97874 111444 237377
972 2166 3138 10875
3513 2274 5787 50428
5098 17109 22207 38817
5621 22111 27733 166665
509 8049 8558 27336
10760 23997 34757 423703
5069 12903 17972 299897
199 360 559 4603
158 666 824 11084
56 0 56 4431
41586 147054 188640 517154
351 120 12 132 430
531 11096 11628 -977
27972 6541 34513 176334
12715 28892 41607 277748
1997 10000 11997 64106
19828 24870 44698 226313
81778 31113 112891 827045
963 48 1011 50313
2287 1074 3361 31332
148 984 1132 11131
413 960 1373 16218
Total 858419 2037853 2896274 18516392
359 Mfr of Transport Equipment
361 Mfr of Furniture
56 526 Repair of Personal and Household Goods
369 Manufacturing N.E.C
502 Maintenance and Repair of Household Goods
504 Retail Sale of Automotive Fuel
Mfr. Of Railway and tramway locomotives and Rolling stock
353 Mfr. Of Air Craft and Space Craft
343 Manufacture of Parts and Accessories for Motor Vehicles and their EnginesBuilding and repair of Ships & Boats
352
332 Manufacture of optical Instruments and photographic equipmentManufacture of watches and Clocks
342 Mfr. Of bodies (coach work) for Motor Vehicles; Mfr. Of Trailers and Semi-Trailers
323 Mfr. Of T.V and Radio Receivers, Sound or Video Recording or Reproducing or Apparatus, and Assciated
331 Mfr. Of Medical Appliances and instruments and Appliances for measuring, checing, testing, navigating
321 Manufacture of Electronic Valves and Tubes and Other electronic Components
322 Mfr.of T.V and Radio transmitters and Apparatus for Line Telephony and line Telegraphy
315 Manufacture of Electric Lamps and Lighting Equipment
319 Manufacture of Other Electricals Equipment N.E.C
313 Manufacture of Insulated Wire and Cable
314 Manufacture of Accumulators, Primary cells and Primary Batteries
311 Manufacture of Electric Motors, Generators and Transformers
312 Manufacture of Electricity Distribution and Control Apparatus
34
35
36
37
38
39
40
41
42
43
44
45 333
46
47
48
49
50
51
52
53
54
55
57 630 Supporting and Auxiliary Transport Activities of Travel Agencies
58 Other Service Activities

-49 -
1 2 3 4 5 6 7 8 9 10 11
0 - 4 99 189 1627 62 33 562 636 31 44 5 - 9 64 209 747 389 187 1223 1571 43 305 10 - 19 122 384 2171 1159 871 6649 8007 82 127620 - 49 222 454 1930 2591 1329 8254 10078 107 171750 - 99 54 141 1101 1430 774 4558 5683 38 1086100 & above 33 41 460 2481 1798 3012 5036 21 2003Sub-Total - (A) 594 1418 8036 8112 4992 24258 31011 323 6431
0 - 4 25 183 403 12 9 197 205 27 -19 5 - 9 37 340 853 143 116 2196 2736 55 485 10 - 19 93 999 3175 808 475 9655 10573 183 73520 - 49 238 1819 6933 3455 2123 27049 31505 455 400050 - 99 103 603 2222 2243 1359 7717 9391 132 1543100 & above 32 265 6663 16487 1388 7661 9565 95 1810Sub-Total - (B) 529 4209 20249 23148 5470 54474 63975 947 8554
0 - 4 20 261 332 7 8 143 144 34 -33 5 - 9 20 341 620 58 30 804 927 62 60 10 - 19 32 726 1835 348 228 3857 4340 124 35920 - 49 199 2962 9051 2861 1815 27755 31912 618 353950 - 99 154 1808 6140 3487 2178 17376 20928 381 3171100 & above 73 1007 5841 4244 2552 12557 17520 267 4696Sub-Total - (C) 499 7105 23819 11005 6811 62493 75771 1486 11792
0 - 4 10 260 559 0 0 4 0 46 -50 5 - 9 6 107 -123 14 16 19 32 12 1 10 - 19 7 238 755 62 53 883 912 35 -620 - 49 89 2031 6139 1183 829 16002 18350 322 202550 - 99 125 3113 9572 3728 2747 31930 38232 656 5645100 & above 93 2098 7835 4906 3372 23813 29281 455 5013Sub-Total - (D) 329 7847 24737 9893 7017 72651 86807 1526 12628
0 - 4 7 240 1096 3 45 3571 3769 49 149 5 - 9 0 0 0 0 0 0 0 0 0 10 - 19 3 259 467 49 34 926 1046 32 8820 - 49 57 2225 14117 871 644 36943 42265 415 490750 - 99 88 2828 8497 2357 1590 24935 28773 590 3248100 & above 74 2161 8593 3640 2444 25531 31219 457 5230Sub-Total - (E) 229 7713 32770 6920 4757 91907 107072 1543 13622
A
B
C
CAPITAL SIZE 10.00 LAKH TO 25.0 LAKH
CAPITAL SIZE 25.0 LAKH TO 50.0 LAKH
Table - IV : PRINCIPAL CHARACTERISTICS BY EMPLOYMENT SIZE AND CAPITAL SIZE GROSS VALUE OF PLANT & MACHINERY
Value Added
CAPITAL SIZE LESS THAN 10.00 LAKH
Productive Capital
Employees (No.)
Emoluments Input Output Deprec-iation
Employment Range(Value in Rs. Lakh)
D CAPITAL SIZE 50.0 LAKH TO 75.0 LAKH
E CAPITAL SIZE 75.0 LAKH TO 100.00 LAKH
Factories Covered
Fixed Capital

-50 -
1 2 3 4 5 6 7 8 9 10 11
Table - IV : PRINCIPAL CHARACTERISTICS BY EMPLOYMENT SIZE AND CAPITAL SIZE GROSS VALUE OF PLANT & MACHINERY
Value Added
Productive Capital
Employees (No.)
Emoluments Input Output Deprec-iation
Employment Range(Value in Rs. Lakh)
Factories Covered
Fixed Capital
0 - 4 19 732 1741 0 148 16546 17314 101 667 5 - 9 1 183 431 9 5 122 135 10 3 10 - 19 17 738 857 55 37 191 207 79 -6320 - 49 65 4923 7556 1128 1091 13341 15647 674 163350 - 99 173 8694 32404 4104 3450 133465 143662 1569 8628100 & above 170 9960 31931 12339 9534 139245 164023 2143 22635Sub-Total - (F) 446 25230 74920 17635 14265 302910 340988 4575 33503
0 - 4 5 230 425 0 0 35 5 22 -53 5 - 9 0 0 0 0 0 0 0 0 0 10 - 19 1 223 508 15 20 129 218 47 4220 - 49 12 1364 4418 245 268 4234 4167 288 -35550 - 99 23 2045 6206 704 691 6629 8430 465 1336100 & above 80 7200 22406 5918 5201 92714 108551 1314 14524Sub-Total-(G) 121 11062 33963 6882 6180 103740 121371 2136 15494
0 - 4 3 311 -2306 2 5 11 0 8 -19 5 - 9 0 0 0 0 0 0 0 0 0 10 - 19 0 0 0 0 0 0 0 0 020 - 49 21 2915 14077 339 419 11711 13826 416 169950 - 99 29 3450 7310 922 789 14457 17829 626 2746100 & above 68 9397 28484 7673 6704 53697 65662 1451 10515Sub-Total-(H) 122 16073 47565 8936 7917 79875 97317 2501 14941
0 - 4 0 0 0 0 0 0 0 0 0 5 - 9 0 0 0 0 0 0 0 0 0 10 - 19 0 0 0 0 0 0 0 0 020 - 49 3 1212 1237 124 116 1008 1148 188 -4850 - 99 12 3147 4043 565 502 15879 17504 394 1230100 & above 65 11533 30559 6369 5319 75249 87551 1885 10417Sub-Total-(I) 80 15892 35839 7058 5937 92136 106203 2467 11599
0 - 4 2 737 1544 0 0 1208 1448 146 93 5 - 9 1 657 -979 8 7 4692 4757 13 52 10 - 19 0 0 0 0 0 0 0 0 020 - 49 2 1310 1769 73 97 1295 1489 161 3350 - 99 27 3663 8170 383 270 41054 44773 420 3298100 & above 73 12892 29867 6910 5332 71233 88266 2109 14924Sub-Total-(J) 105 19259 40371 7374 5706 119483 140733 2849 18400
J CAPITAL SIZE 500.00 LAKH TO 750.00 LAKH
H
I
CAPITAL SIZE 200.00 LAKH TO 250.00 LAKH
CAPITAL SIZE 250.00 LAKH TO 350.00 LAKH
CAPITAL CAPITAL SIZE 350.00 LAKH TO 500.00 LAKH
F
G
CAPITAL SIZE 100.00 LAKH 200.00 LAKH

-51 -
1 2 3 4 5 6 7 8 9 10 11
Table - IV : PRINCIPAL CHARACTERISTICS BY EMPLOYMENT SIZE AND CAPITAL SIZE GROSS VALUE OF PLANT & MACHINERY
Value Added
Productive Capital
Employees (No.)
Emoluments Input Output Deprec-iation
Employment Range(Value in Rs. Lakh)
Factories Covered
Fixed Capital
0 - 4 0 0 0 0 0 0 0 0 0 5 - 9 1 941 926 7 5 24 44 5 15 10 - 19 0 0 0 0 0 0 0 0 020 - 49 3 1572 1756 44 41 408 661 73 18150 - 99 0 0 0 0 0 0 0 0 0100 & above 48 13742 25710 5769 5695 51645 72201 2215 18341Sub-Total-(K) 53 16255 28392 5820 5741 52077 72906 2292 18537
0 - 4 0 0 0 0 0 0 0 0 0
5 - 9 1 4871 4622 7 5 421 369 73 -125
10 - 19 6 5372 5238 21 13 427 362 112 -177
20 - 49 4 5214 5390 53 42 581 548 106 -138
50 - 99 3 1095 2059 70 69 10941 11302 125 236
100 & above 73 61248 122855 15714 23429 279295 336311 8187 48829
Sub-Total-(L) 86 77800 140164 15865 23558 291665 348892 8603 48625
ALL (A-L)0 - 4 190 3143 5421 86 248 22277 23521 464 779 5 - 9 133 7649 7097 635 371 9501 10571 273 796 10 - 19 282 8939 15006 2517 1731 22717 25665 694 225420 - 49 915 28001 74373 12967 8814 148581 171596 3823 1919350 - 99 791 30587 87724 19993 14419 308941 346507 5396 32167100 & above 882 131544 321204 92450 72768 835652 1015186 20599 158937Grand Total 3193 209863 510825 128648 98351 1347669 1593046 31248 214126
CAPITAL SIZE >1000.00 LAKH L
K CAPITAL SIZE 750.00 LAKH TO 1000.00 LAKH

1 2 3 4 5 6 7 8 9 10 11A
1 Individual Proprietorship 1 52 302 40 28 312 349 15 222 Joint Family(HUF) 0 0 0 0 0 0 0 0 03 Partmership 0 0 0 0 0 0 0 0 04 Public Limited Company 2 2213 3368 559 1709 9578 11636 306 17525 Private Limited Company 1 33 118 62 52 260 421 7 1536 Govt. Deptt. Enterprises 0 0 0 0 0 0 0 0 07 Public Corporation 0 0 0 0 0 0 0 0 08 Khadi Village Industries
Commission 0 0 0 0 0 0 0 0 09 Others 0 0 0 0 0 0 0 0 0
SUB-TOTAL (A) 4 2298 3788 661 1789 10150 12406 328 1928B
1 Individual Proprietorship 2 39 46 65 41 124 179 6 492 Joint Family(HUF) 0 0 0 0 0 0 0 0 03 Partmership 0 0 0 0 0 0 0 0 04 Public Limited Company 0 0 0 0 0 0 0 0 05 Private Limited Company 0 0 0 0 0 0 0 0 06 Govt. Deptt. Enterprises 0 0 0 0 0 0 0 0 07 Public Corporation 0 0 0 0 0 0 0 0 08 Khadi Village Industries
Commission 0 0 0 0 0 0 0 0 09 Others 0 0 0 0 0 0 0 0 0
SUB-TOTAL (B) 2 39 46 65 41 124 179 6 49
S.No
TABLE - V: PRINCIPAL CHARACTERISTICS BY TYPE OF OWNERSHIP AND TYPE OF ORGANISATION(VALUE IN Rs. Lakh)
Productive Capital
Employees (No.)
Emoluments Total Input
Type Of Ownership/ Organisation
Factories Covered
Fixed Capital Total Output
Depreciation
Value Added
TYPE OF OWNERSHIP CODE 1,2 & 4 WHOLLY CENTRAL GOVT. WHOLLY STATE OR LOCAL GOVT. AND JOINT SECTOR
TYPE OF OWNERSHIP CODE 3 CENTRAL GOVT. & STATE GOVT. LOCAL GOVT JOINTLY
-52 -

1 2 3 4 5 6 7 8 9 10 11
S.No
TABLE - V: PRINCIPAL CHARACTERISTICS BY TYPE OF OWNERSHIP AND TYPE OF ORGANISATION(VALUE IN Rs. Lakh)
Productive Capital
Employees (No.)
Emoluments Total Input
Type Of Ownership/ Organisation
Factories Covered
Fixed Capital Total Output
Depreciation
Value Added
C
1 Individual Proprietorship 0 0 0 0 0 0 0 0 02 Joint Family(HUF) 0 0 0 0 0 0 0 0 03 Partmership 0 0 0 0 0 0 0 0 04 Public Limited Company 1 278 279 31 27 55 42 13 -265 Private Limited Company 0 0 0 0 0 0 0 0 06 Govt. Deptt. Enterprises 0 0 0 0 0 0 0 0 07 Public Corporation 0 0 0 0 0 0 0 0 08 Khadi Village Industries
Commission 0 0 0 0 0 0 0 0 09 Others 0 0 0 0 0 0 0 0 0
SUB-TOTAL (C) 1 278 279 31 27 55 42 13 -26D
1 Individual Proprietorship 989 22950 57540 21992 14381 179568 221156 4710 368792 Joint Family(HUF) 26 494 1898 398 254 4757 5543 60 7253 Partmership 1075 41284 110328 50054 24072 340196 400353 8424 517334 Public Limited Company 150 56581 144083 19991 27475 386454 455506 7326 617265 Private Limited Company 949 85938 192863 35457 30312 426367 497860 10381 611136 Govt. Deptt. Enterprises 0 0 0 0 0 0 0 0 07 Public Corporation 0 0 0 0 0 0 0 0 08 Khadi Village Industries
Commission 0 0 0 0 0 0 0 0 09 Others 0 0 0 0 0 0 0 0 0
3185 207247 506712 127892 96494 1337342 1580418 30901 212176 TOTAL (A TO D) 3192 209862 510824 128648 98348 1347670 1593046 31249 214127
TYPE OF OWNERSHIP CODE 5 JOINT SECTOR PRIVATE
SUB-TOTAL (D)
TYPE OF OWNERSHIP CODE 6 WHOLLY PRIVATE
-53 -

-54 -
Factories Covered
Employees (No.)
Total output
Major Industry Group
TABLE - VI PRINCIPAL CHARACTERISTICS BY SIZE OF CAPITAL (Value in Rs. Lakh)
Factories Covered
Value Addded
Employees (No.)
Total output
Value Added
15 19 181 2950 149 13 337 9625 34216 4 50 265 23 5 89 682 9317 38 374 1683 303 28 395 3029 34318 43 2054 2587 1646 32 15201 4277 42619 23 121 539 78 14 87 770 7220 2 19 94 16 2 22 400 8421 14 124 745 78 13 153 1323 15022 26 192 503 140 32 442 1634 30123 2 10 79 6 0 0 0 024 16 175 855 128 33 870 8989 118225 32 426 2668 329 43 564 3382 41826 10 298 790 222 14 248 2127 47727 47 427 2962 402 39 405 3824 28728 41 331 1000 234 67 1282 5267 106529 75 828 2768 611 52 912 6789 111530 3 33 131 31 0 0 0 031 46 703 3667 409 31 437 2001 34132 15 188 607 88 12 168 1593 14633 22 352 955 230 12 219 1990 22834 34 272 742 143 22 303 1077 38335 18 356 1507 456 11 205 1207 18636 8 134 872 150 22 341 2059 44050 28 400 1669 477 13 186 1276 25652 3 41 216 53 1 43 170 7663 0 0 0 0 6 27 75 193 2 16 30 11 4 209 407 144
23 6 127 16 8 4 3 -3Total 594 8111 31011 6429 529 23149 63976 8553
15 9 261 4503 222 8 232 9607 37016 2 119 1570 75 2 85 1952 23817 16 472 2955 515 5 203 2960 12818 57 2246 9549 3519 54 2591 16986 294519 21 378 3372 224 25 622 5504 105920 2 181 301 -8 0 0 0 021 6 134 1007 85 1 9 17 722 23 451 2063 449 30 768 2946 55423 2 17 137 81 0 0 0 024 15 502 6095 510 14 460 6207 127525 27 420 3082 299 33 472 7353 54726 2 137 267 87 1 36 870 13527 14 171 2933 212 15 226 2397 22128 66 1061 7200 1038 28 861 4621 104929 54 1018 6967 1019 33 798 5494 79030 0 0 0 0 1 0 0 031 38 801 8568 649 23 458 5561 70632 18 363 1665 264 3 187 3980 21833 3 55 409 53 0 0 0 034 39 893 3833 796 17 416 3188 70235 26 312 1340 144 11 693 4087 111036 24 394 2562 419 5 58 307 4650 29 499 4994 1038 20 717 2769 52952 0 0 0 0 0 0 0 063 5 102 342 91 0 0 0 093 1 18 57 14 0 0 0 0
0 0 0 0 0 0 0 0Total 499 11005 75771 11795 329 9892 86806 12629
A. Capital Size Less Than 10.00 lakh
C. Capital Size 25.00 to 50.00 Lakh D. Capital Size 50.00 to 75.00 Lakh
B . Capital Size 10.00 to 25.00 Lakh

-55 -
Factories Covered
Employees (No.)
Total output
Major Industry Group
TABLE - VI PRINCIPAL CHARACTERISTICS BY SIZE OF CAPITAL (Value in Rs. Lakh)
Factories Covered
Value Addded
Employees (No.)
Total output
Value Added
15 6 241 21655 252 23 507 40045 80616 1 45 1380 130 3 53 244 -34117 11 654 8464 1249 18 740 17376 198518 34 1357 17106 2435 130 6528 76342 1109119 3 76 900 178 20 1122 11916 115820 0 0 0 0 0 0 0 021 6 191 909 120 6 272 2008 35022 9 263 2882 522 38 1102 8403 142123 0 0 0 0 0 0 0 024 10 435 3675 411 14 532 45413 301625 22 343 1304 165 24 439 3223 44126 1 55 455 87 0 0 0 027 23 349 20157 4242 21 313 14999 32528 26 610 7075 691 13 767 6134 84729 25 543 5417 566 19 672 11399 113230 0 0 0 0 0 0 0 031 11 370 4928 600 42 1378 54930 334932 10 93 320 56 20 770 16881 442533 2 138 892 189 3 176 1685 38334 7 279 1491 249 18 819 7671 90735 1 122 547 182 4 250 1026 1536 8 424 5195 785 2 101 1452 31950 12 329 2320 529 18 1001 19358 187052 0 0 0 0 0 0 0 063 0 0 0 0 5 78 475 5093 0 0 0 0 0 0 0 0
1 3 0 -16 5 16 9 -48Total 229 6920 107072 13622 446 17636 340989 33501
15 9 671 28792 682 0 0 0 016 0 0 0 0 0 0 0 017 8 415 3598 309 3 267 4866 66718 44 2563 41543 7923 27 2777 23056 329619 4 187 2071 324 19 783 4933 69020 0 0 0 0 0 0 0 021 0 0 0 0 0 0 0 022 6 528 4256 670 20 842 7302 142323 0 0 0 0 0 0 0 024 10 769 18539 2789 4 1056 6298 104325 12 409 2586 354 5 104 1172 14226 0 0 0 0 0 0 0 027 2 228 7385 742 1 33 1742 7528 4 191 1340 243 10 562 11121 141829 0 0 0 0 4 269 3283 99330 1 40 2016 -536 0 0 0 031 0 0 0 0 7 399 8141 55432 1 113 1624 176 0 0 0 033 1 159 826 241 1 49 4830 101034 5 314 4399 1298 6 601 5824 116435 3 49 558 8 7 554 9956 181936 10 225 1472 168 2 371 2054 28550 0 0 0 0 6 270 2739 36152 1 23 367 102 0 0 0 063 0 0 0 0 0 0 0 093 0 0 0 0 0 0 0 0
0 0 0 0 0 0 0 0Total 121 6884 121372 15493 122 8937 97317 14940
E. Capital Size 75.00 to 100.00 Lakh F. Capital Size 100.00 to 200.00 Lakh
H. Capital Size 250.00 to 350.00G. Capital Size 200.00 to 250.00 Lakh

-56 -
Factories Covered
Employees (No.)
Total output
Major Industry Group
TABLE - VI PRINCIPAL CHARACTERISTICS BY SIZE OF CAPITAL (Value in Rs. Lakh)
Factories Covered
Value Addded
Employees (No.)
Total output
Value Added
15 4 824 17011 1724 5 51 37232 280016 0 0 0 0 0 0 0 017 0 0 0 0 5 567 16865 383518 33 2813 46121 5900 54 5004 46898 554119 8 519 8104 837 2 223 4957 49220 0 0 0 0 0 0 0 021 2 121 1766 393 5 190 5330 29922 3 101 2821 210 8 233 4379 35523 0 0 0 0 0 0 0 024 0 0 0 0 2 118 470 -16525 10 1065 6892 794 5 50 581 -3626 0 0 0 0 0 0 0 027 0 0 0 0 0 0 0 028 0 0 0 0 8 313 6223 245229 1 129 1758 242 1 45 602 -4030 1 49 176 -80 0 0 0 031 0 0 0 0 1 336 7916 242832 2 204 3287 -392 1 8 4757 5233 3 489 5446 1015 0 0 0 034 2 103 850 167 3 54 2889 8635 5 123 5805 272 0 0 0 036 3 371 5353 358 0 0 0 050 2 66 649 44 5 181 1634 30252 1 82 165 115 0 0 0 063 0 0 0 0 0 0 0 093 0 0 0 0 0 0 0 0
0 0 0 0 0 0 0 0Total 80 7059 106204 11599 105 7373 140733 18401
15 5 1273 25421 5892 10 3425 155592 994616 0 0 0 0 0 0 0 017 1 414 2818 671 0 0 0 018 19 2181 17176 4324 38 3914 65524 652119 4 242 4091 796 0 0 0 020 0 0 0 0 0 0 0 021 4 224 2658 490 0 0 0 022 4 634 6743 1226 6 3384 33132 1103823 0 0 0 0 0 0 0 024 0 0 0 0 4 1950 41314 1375825 0 0 0 0 0 0 0 026 0 0 0 0 0 0 0 027 0 0 0 0 0 0 0 028 0 0 0 0 10 1059 20145 285329 0 0 0 0 7 218 3710 37330 0 0 0 0 0 0 0 031 0 0 0 0 0 0 0 032 2 860 6506 1855 0 0 0 033 0 0 0 0 0 0 0 034 0 0 0 0 8 619 19566 120835 5 236 4972 406 1 131 1132 81636 2 423 4084 500 0 0 0 050 5 149 4281 4050 2 330 2933 45652 0 0 0 0 0 0 0 063 2 19 0 -19 0 0 0 093 0 0 0 0 0 0 0 0
0 0 0 0 0 0 0 0Total 53 6655 78750 20191 86 15030 343048 46969
K. Capital Size 750.00 to 1000.00 L. Capital Size 1000.00 and onward
I. Capital Size 350.00 to 500.00 J. Capital Size 500.00 to 750.00

-57 -
1 2 3 4 5 6 7 8Less than 10.00 594 2143 18029 4087 24258 323 499310.00 - 25.00 529 3771 42342 8362 54474 947 547025.00 - 50.00 499 4230 46506 11757 62493 1486 681050.00 - 75.00 329 4093 50837 17721 72651 1526 701675.00 - 100.00 229 5176 67380 19351 91907 1543 4757
100.00 - 200.00 446 9707 189741 103462 302910 4575 14264200.00 - 250.00 121 4111 63835 35795 103740 2136 6181250.00 - 350.00 122 3918 58714 17244 79875 2501 7917350.00 - 500.00 80 3792 65460 22884 92136 2467 5938500.00 - 750.00 105 3389 89573 26522 119483 2849 5706750.00 - 1000.00 53 3476 35060 13541 52077 2292 57401000.00 & above 86 10073 168603 112990 291665 8603 23558
Total 3193 57877 896078 393716 1347670 31248 98350
Table - VII General Pattern of Cost of Production by size of capital
Factories Covered
Fuels Total Input
Material Other Input
Capital Range(Gross value ofPlant &Machinery )
Deprec- iation
(Value in Rs. Lakh)Emlouments

-58 -
1 2 3 4 5 6 7 8 9
15 111 10432 239630 75507 325569 3678 10164 23481216 17 174 4709 880 5763 113 323 1486617 133 1961 36201 14922 53084 1525 3588 11916618 565 10027 180635 112293 302955 8645 26287 75383019 143 2969 30878 5748 39595 1654 2681 11014020 6 25 361 288 674 29 191 397621 57 661 10051 2692 13405 387 990 5862822 205 3367 32525 19257 55148 3607 10351 15524223 4 37 54 32 123 6 27 7924 122 2375 72695 37236 112306 1602 8258 30959025 213 2412 18960 6543 27915 873 2389 5485726 28 314 2697 398 3409 92 505 1248827 162 6326 36566 6535 49426 464 1163 9981328 273 3582 43562 9589 56733 1502 5862 13401029 271 2549 27276 10461 40286 1098 4035 11306830 6 44 150 2604 2798 108 163 723431 199 1801 51518 32527 85846 831 3381 17020932 85 1441 22119 9974 33534 799 2735 7104933 47 379 10659 2367 13405 278 1357 1935434 160 2081 30548 10667 43295 1131 4206 18869735 91 1648 18181 5874 25703 1020 3438 8788036 86 1024 14521 5593 21138 801 2497 5669550 140 1585 11183 21139 33908 802 3225 11390252 6 85 217 191 494 77 213 336163 18 509 1 178 689 79 144 1132
others 45 69 179 221 468 48 175 2196
Total 3193 57877 896077 393716 1347670 31248 986350 28963
Table -VIII :General pattern of cost of production in different Industries (Value in Rs. Lakh)
Deprec- iation
Emoluments Factor Payments
Other Input
Total Input
Major Industry Groups
Factories Covered
Fuels Material

-59 -
1 2 3 4 5 6 7 8 9 10
1910 & Earlier 27 751 2698 378 339 9194 9898 108 595
1911-1920 6 1530 1983 286 371 8547 9167 17 603
1921-1930 8 4403 9316 1387 636 3794 4714 336 584
1931-1940 14 737 2673 1132 1105 9960 14572 78 4534
1941-1950 15 3264 6289 2213 5302 12132 22242 953 9157
1951-1960 198 4281 12720 4542 3254 34384 40398 763 5251
1961-1970 313 25332 45982 7526 7320 119099 133406 2376 11932
1971-1980 677 38881 86927 20928 17316 314047 359301 6308 38946
1981-1990 949 64944 168982 36278 31669 411583 488961 9696 67681
1991-2000 801 49741 135015 46307 25205 336489 401857 8240 57128
2001 & onward 185 15998 38238 7671 5831 88441 108530 2374 17716
Total 3193 209862 510823 128648 98348 1347670 1593046 31249 214127
Year of initial Production
Factories Covered
TABLE - IX: PRINCIPAL CHARACTERISTICS BY YEAR OF INITIAL PRODUCTION (Value in Rs. Lakh)
Fixed Capital
Productive Capital
Depreciation
value added
Employees (No.)
Emoluments Total Input Total Output

-60 -
1 2 3 4 5 6 7 8 9 1015 111 5105 8002 386247 1016396 2592460 46 72 12701816 17 326 441 12615 32337 116336 19 26 7332717 133 3033 4502 144253 358823 1350180 23 34 7970318 565 39135 49227 1331213 2628683 10340931 69 87 5339919 143 3424 4360 150421 268095 1307343 24 30 6149020 6 174 222 8033 19096 65189 29 37 8602021 57 1079 1419 49241 99017 414038 19 25 6977922 205 4958 8939 298287 1035114 2569703 24 44 11579723 4 20 27 1317 2732 8277 5 7 10118624 122 2900 6867 137383 825802 2060058 24 56 12025725 213 2891 4292 112312 238902 1259624 14 20 5566226 28 578 774 27332 50508 224891 21 28 6525627 162 1512 2153 65511 116341 620947 9 13 5403728 273 5303 7036 323409 586162 2062258 19 26 8330929 271 3616 5433 172518 403537 1587307 13 20 7427530 6 53 122 2712 16288 37125 9 20 13351031 199 3420 4882 151887 338054 1409408 17 25 6924532 85 1793 2953 83228 273542 857415 21 35 9263233 47 1139 1636 58662 135682 485468 24 35 8293534 160 3266 4673 165144 420645 1386338 20 29 9001635 91 2219 3031 166013 343766 920979 24 33 11341736 86 2097 2842 92099 249730 829392 24 33 8787150 140 2525 4129 134609 322471 1235886 18 29 7809952 6 95 189 5535 21333 55917 16 32 11287563 18 122 226 5199 14389 66223 7 13 63668
Others 45 140 271 5857 17561 73991 3 6 64801
Total 3193 90923 128648 4091036 9835006 33937684
Mandays Worked
Workers per Unit
Emoluments per
Employees
TABLE - X :DISTRIBUTION OF WORKERS AND EMPLOYEES BY MAJOR INDUSTRY GROUPSEmployees
per UnitMajor
Industry Groups
Factories Covered
Workers (No.)
Employees (No.)
Workers Wages (Rs.
000)
Employees Emoluments
(Rs.000)

-61 -
1 2 3 4 5 6 7 8 9 10 11
15 15 1 23 19 53 0 0 0 0 111
16 3 0 5 0 9 0 0 0 0 17
17 53 0 42 1 37 0 0 0 0 133
18 168 8 236 13 140 0 0 0 0 565
19 48 0 43 2 50 0 0 0 0 143
20 2 0 4 0 0 0 0 0 0 6
21 9 1 22 5 20 0 0 0 0 57
22 47 0 85 9 64 0 0 0 0 205
23 2 0 1 0 1 0 0 0 0 4
24 16 0 26 17 63 0 0 0 0 122
25 76 0 69 8 60 0 0 0 0 213
26 14 1 9 0 4 0 0 0 0 28
27 90 0 31 8 33 0 0 0 0 162
28 124 1 83 8 57 0 0 0 0 273
29 107 1 84 9 70 0 0 0 0 271
30 0 0 0 1 5 0 0 0 0 6
31 50 0 72 5 72 0 0 0 0 199
32 33 0 23 5 24 0 0 0 0 85
33 5 2 18 2 20 0 0 0 0 47
34 51 11 51 11 36 0 0 0 0 160
35 11 0 50 6 24 0 0 0 0 91
36 25 0 31 3 27 0 0 0 0 86
50 18 0 49 20 53 0 0 0 0 140
52 1 0 0 0 5 0 0 0 0 6
63 2 0 6 0 10 0 0 0 0 18
Others 19 0 12 1 13 0 0 0 0 45
Total 989 26 1075 153 950 0 0 0 0 3193
Others Private Ltd.
Company
Public Ltd. Company
Govt. Deptt. Enterprises
Major Industry Groups
Table-XI: DISTRIBUTION OF FACTORIES ACCORDING TO TYPE OF ORGANISATION
Public Corp.
Individual Properitorship
Joint Family (HUF)
Partner-ship
Khadi and Village
Industries commission
Total

-62 -
1 2 3 4 5 6 7 8
15 0 0 0 1 0 110 11116 0 0 0 0 0 17 1717 0 0 0 0 0 133 13318 0 0 0 0 0 565 56519 0 0 0 0 0 143 14320 0 0 0 0 0 6 621 0 0 0 0 0 57 5722 0 1 0 0 0 204 20523 0 0 0 0 0 4 424 0 0 0 0 0 122 12225 0 0 0 0 0 213 21326 0 0 0 0 0 28 2827 0 0 0 0 0 162 16228 0 0 0 0 0 273 27329 0 0 0 1 0 270 27130 0 0 0 0 0 6 631 0 0 1 0 0 198 19932 0 0 0 0 0 85 8533 0 0 0 0 0 47 4734 0 0 0 0 0 160 16035 1 0 0 0 0 90 9136 0 0 0 0 0 86 8650 0 0 0 0 1 139 14052 0 0 0 0 0 6 663 0 0 0 0 0 18 18
Others 0 0 1 0 0 44 45Total 1 1 2 2 1 3186 3193
Major Industry Group
Wholly Centrally
Govt.
Central Govt & States Jointly
Table - XII: DISTRIBUTION OF FACTORIES ACCORDING TO TYPE OF OWNERSHIP
Wholly State &
Local Govt.
TotalJoint Sector Public
Joint Sector Private
Wholly Private

-63 -
1 2 3 4 5 6 7 8 9 10 11 12 13
15 3 1 1 0 2 4 7 21 43 23 6 11116 0 0 1 0 0 0 0 2 2 9 3 1717 0 0 0 1 1 10 21 19 32 43 6 13318 0 0 0 0 0 0 17 83 158 238 69 56519 5 0 0 0 0 6 2 30 31 49 20 14320 0 0 0 0 0 0 2 2 2 0 0 621 0 0 0 0 0 2 0 24 22 4 5 5722 1 5 5 6 6 16 13 42 50 55 6 20523 0 0 0 0 0 0 0 0 1 2 1 424 0 0 0 2 0 10 7 39 40 19 5 12225 1 0 0 0 0 16 13 51 76 45 11 21326 0 0 1 0 0 4 4 6 9 1 3 2827 5 0 0 0 0 9 20 5 67 51 5 16228 4 0 0 0 0 26 36 87 69 45 6 27329 0 0 0 0 4 23 49 76 76 33 10 27130 0 0 0 0 0 0 0 1 4 1 0 631 3 0 0 0 0 24 26 44 66 30 6 19932 0 0 0 2 0 0 9 15 33 19 7 8533 0 0 0 2 0 3 8 17 8 9 0 4734 0 0 0 0 0 16 31 44 39 28 2 16035 0 0 0 0 0 8 10 28 24 20 1 9136 5 0 0 0 0 4 9 15 27 22 4 8650 0 0 0 1 2 0 26 6 51 45 9 14052 0 0 0 0 0 0 0 0 3 3 0 663 0 0 0 0 0 2 2 11 3 0 0 18
Others 0 0 0 1 0 15 1 9 13 6 0 45Total 27 6 8 15 15 198 313 677 949 800 185 3193
1931- 1940
1951- 1960
Upto 1910
1941- 1950
Table - XIII: DISTRIBUTION OF FACTORIES ACCORDING TO YEAR OF INITIAL PRODUCTION
1961- 1970
1971- 1981
2000 & Above
Total 1981- 1990
1991-2000
Major Industry Group
1911- 1920
1921- 1930

-64 -
1 2 3 4 5 6 7 8 9 10
15 111 2891 4332 13225 1768 264 136 4346 2696216 17 18 116 194 171 15 0 111 62517 133 442 1185 3721 1113 106 5 1046 761818 565 6942 8431 18942 6493 934 41 6870 4865319 143 605 751 4690 662 24 0 1635 836720 6 11 1 37 51 1 0 9 11021 57 153 207 1948 254 145 4 433 314422 205 2283 3167 14119 1839 1501 8 1463 2438023 4 10 5 17 1 0 0 1 3424 122 1127 2121 3743 1643 322 17 1238 1021125 213 548 558 3001 903 98 1 478 558726 28 11 77 159 144 14 0 51 45627 162 252 278 995 697 24 5 176 242728 273 12830 1478 4601 1514 119 18 1523 2208329 271 1398 778 3054 1684 116 1 773 780430 6 34 87 64 24 25 0 480 71431 199 692 582 2409 1160 77 7 623 555032 85 573 390 2826 741 77 0 574 518133 47 230 416 931 339 74 0 348 233834 160 564 1121 3701 1289 371 5 1098 814935 91 66 402 2427 543 60 1 1479 497836 86 72 403 2029 713 86 1 1164 446850 140 765 1491 1369 1005 155 29 1187 600152 6 430 52 144 13 28 0 79 74663 18 781 257 154 67 0 0 43 1302
Others 45 12 27 31 25 0 1 10 106Total 3193 33740 28713 88531 24856 4636 280 27238 207994
Table-XIV : FIXED CAPITAL BY MAJOR INDUSTRY GROUP
Others TotalComputer Pollution Control
(Value in Rs. Lakh)Major Industry Groups
Factories Covered
Land Building Plant & Machinery
Transport Equipment

-65 -
1 2 3 4 5 615 111 3456 388 6341 1018516 17 2844 1 202 304717 133 471 14 2030 251518 565 1129 113 15752 1699419 143 2535 0 1089 362420 6 0 0 19 1921 57 920 0 652 157222 205 274 6 1700 198023 4 0 0 1 124 122 4434 173 4447 905425 213 1192 161 1767 312026 28 56 1 176 23327 162 3216 1 337 355428 273 3755 100 3419 727429 271 1716 64 762 254230 6 24 7 10 4131 199 3397 177 1952 552632 85 2019 0 403 242233 47 1651 8 480 213934 160 2648 79 2108 483535 91 1542 41 570 215336 86 253 46 574 87350 140 0 0 9 952 6 0 0 0 063 18 0 0 0 0
Others 45 0 0 0 0Total 3193 37532 1380 44800 83712
Table - XV : DISTRIBUTION OF EXPENSES ON SALE
Major IndustryGroup
Factories Covered
Excise Sales Tax Others Total(Value in Rs. Lakh)
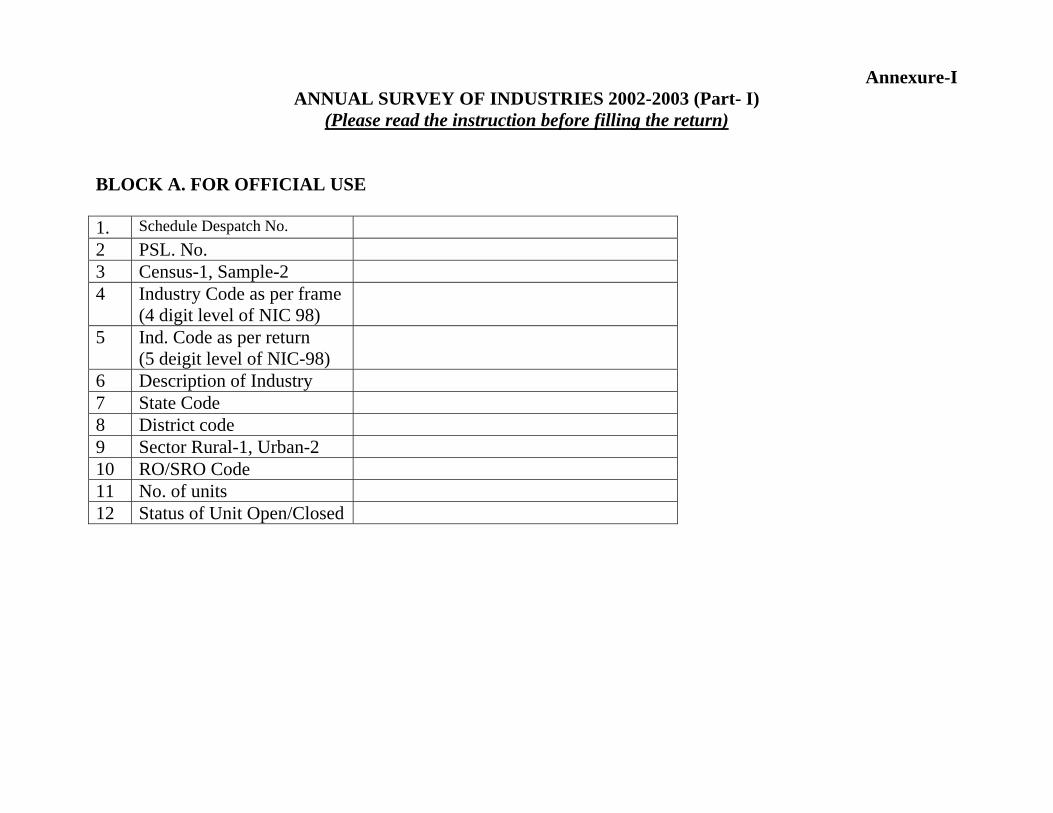
Annexure-I ANNUAL SURVEY OF INDUSTRIES 2002-2003 (Part- I)
(Please read the instruction before filling the return)
BLOCK A. FOR OFFICIAL USE 1. Schedule Despatch No. 2 PSL. No. 3 Census-1, Sample-2 4 Industry Code as per frame
(4 digit level of NIC 98)
5 Ind. Code as per return (5 deigit level of NIC-98)
6 Description of Industry 7 State Code 8 District code 9 Sector Rural-1, Urban-2 10 RO/SRO Code 11 No. of units 12 Status of Unit Open/Closed

BLOCK B. TO BE FILLED BY OWNER OF THE FACTORY 1 Name and address of the
industrial undertaking Village/Town: District: State: Pin Code:
2 Type of Organisation(code) 3 Type of ownership(code) 4 If the type of org codes are 4&5
and type of ownership code is 6, how many total number of units the company has
5 How many units located in the same state
6 Year of Initial production 7 Accounting year 8 Number of months of operation 9 Does your unit have any
computers ? (yes-1,no-2)
10 Total number of working days 11 Name & Designation of Contact
person: Tele (with STD code): FAX no: e-mail:

BLOCK C: FIXED ASSETS Gross Value (Rs.) Despreciation (Rs.) Net Value (Rs.)
Addition during the year
Sl. No Types of Assets
Opening as on
Due to revaluation
Actual Addition
Deduction & Adjustment during the year
Closing as on
Up to the year beginning
Provided during the year
Adjustment for sold/discarded during the year
Up to the year end
Opening as on
Closing as on
1 Land 2 Building 3 Plant &
Machinery
4 Transport equipment
5 Computer equipment including software
6 Pollution control equip.
7 Others 8 Sub-total
(1 to 7)
9 Capital work in progress
10 Total (1+8+9)

BLOCK D: WORKING CAPITAL & LOANS Sl.No Items Opening Rs.) Closing (Rs.) 1 Raw Material & Components 2 Fuels & Lubricants 3 Spares, Stores & Others 4 Sub-Total (1 to 3) 5 Semi-finished goods/work in
progress
6 Finished goods 7 Total inventory(4 to 6) 8 Cash in Hand at Bank 9 Sundry Debtors 10 Other current assets 11 Total current assets(7 to 10) 12 Sundry Creditors 13 Over draft, cash credit, other short
Terms loan from Banks & other financial institution.
14 Other current liabilities. 15 Total current liabilities(12 to 14) 16 Working capital(11 minus 15)* 17 Outstanding loans(excluding
interest but including deposits)**
• Give reasons in the footnote for negative values and abnormal verification in opening and closing values. ** If outstanding loans include interest, a footnote must be given

BLOCK E. EMPLOYEMNT AND LABOUR COST Sl.No
Category of staff
Mandays worked Average Number of persons worked
Wages/salaries
Bonus In (Rs.)
Contribution to provident fund and other funds (in Rs.)
Workmen & staff welfare expenses (in Rs.)
Manufactring Non-manufacturing
Total
1 Male Workers employed directly
X
2 Female Workers employed directly
X
3 Child Workers employed directly
X
4 Sub-total(1+2+3)
X
5 Workers employed through contractors
X
6 Total Workers(4+5)

7 Supervisory & managerial staff
8 Other employees
9 Unpaid family members/ proprietor/ coop. Members
10 Total employees (6+7+8)
i)Manufacturing days
ii) Non-Manufacturing days
11 Number of working days
iii) Total 12 Total cost of
Production in Rs.

BLOCK F: OTHER EXPENSES Sl. No. Items Expenditure in Rs.
(1) (2) (3) 1 Work done by others on materials supplied by
the industrial undertaking
Repair & maintenance of (i) Building (ii) Plant & machinery
2
(iii) Other fixed assets 3 Operating expenses 4 Non-operating expenses(excluding insurance
Charges)
5 Insurance Charges 6 Rent paid for building, P&M and other fixed
assets
7 Total expenses 1-6 8 Rent paid for building 9 Rent paid for land on lease or royalties on
mines, quarries and similar assets.
10 Interest paid 11 Purchase value of goods sold in the same
condition as purchased

BLOCK G : OTHER OUTPUT / RECEIPT Sl.no.
Items Receipts in Rs.
(1) (2) (3) 1 Income from services (industrial/non industrial
including work done for others on materials supplied by them)
2 Variation in stock of semi-finished goods (col.(4)minus Col(3) against item 5 in Block D
3 Value of electricity generated and sold 4 Value of own construction 5 Net balance of goods sold in the same condition as
purchased. (item 7 of BI.G minus item 10 of BI.F)
6 Rent received for Plant & machinery and other fixed assets
7 Total receipts ( 1 to 5 ) 8 Rent received for buildings 9 Rent received for land on lease or royalties on mines,
quarries and similar assets
10 Interest received 11 Sale value of goods sold in the same condition as
purchased

BLOCK H: INPUT ITEMS (INDIGENOUS ITEMS) Sl.No.
Item Description Item Code
Unit of Qty.
Qty. consumed
Purchase Value
Rate per unit (in Rs.)
(1) (2) (3) (4) (5) (6) (7) Major Five Basic Items
(Indigenous)
1 2 3 4 5 6 Other Basic items 99201 7 Total Basic items (1 to 6) 99901 8 Non-basic Chemicals- All
kinds 99203
9 Packing items 99908 10 Electricity own generated 11 Electricity purchased 99904 12 Petrol, Diesel, Oil,
Lubricants Consumed 99906
13 Coal Consumed 99907 14 Other Fuel Consumed 99204 15 Consumable store 99220 16 Total non-basic items
(8 to 15) 99920
17 Total inputs (7 to 16) 99930 18 Any additional
requirement of electricity (unmet demand)
KWH

BLOCK-I: DIRECTLY IMPORTED ITEMS Sl.no Item Description
(Major five imported items)
Item Code
Unit of Qty.
Qty.consumed Purchased Value
Rate per Unit (in Rs.)
(1) (2) (3) (4) (5) (6) (7) 1 2 3 4 5 6 Other items
imported 99221 X X
7 Total imports(consumed)(1 to 6)
99940 X X
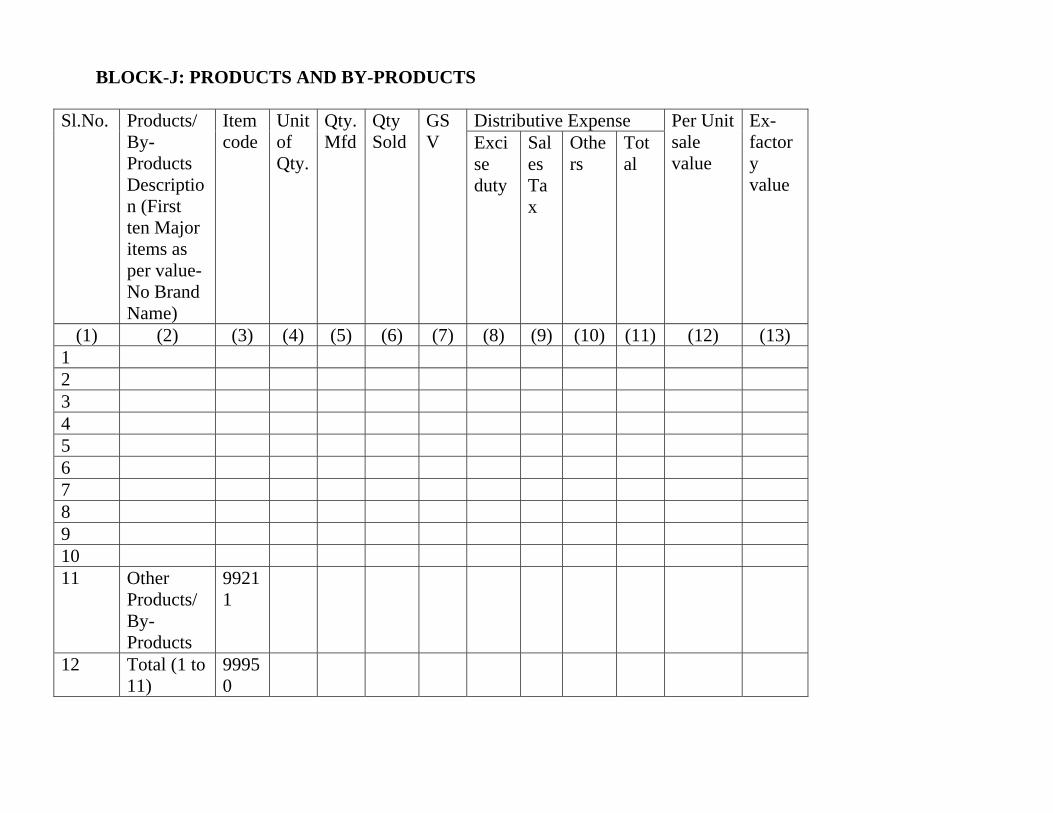
BLOCK-J: PRODUCTS AND BY-PRODUCTS
Distributive Expense Sl.No. Products/ By-Products Description (First ten Major items as per value-No Brand Name)
Item code
Unit of Qty.
Qty. Mfd
Qty Sold
GSV Exci
se duty
Sales Tax
Others
Total
Per Unit sale value
Ex-factory value
(1) (2) (3) (4) (5) (6) (7) (8) (9) (10) (11) (12) (13) 1 2 3 4 5 6 7 8 9 10 11 Other
Products/By-Products
99211
12 Total (1 to 11)
99950

FOR OFFICIAL USE ONLY
K. Particulars of field operation 1. Name of Asst. Supdt 5 Date of receipt from
factory
2.
Signature of Asstt. Supdt.
6 Date of Verification / Compliation
7 Date of Submission by Asstt. Supdt.
3 Name of Supdt. 8 Date (s) of scrutiny 4 Signature of Supdt. 9 Date of Dispatch 1. Comments of Asst. Supdt./Supdt.(Reasons for negative working capital and for any abnormal entries should be given invariably):