report on bvi radiation measurement project -...
TRANSCRIPT

Report on
BVI Radiation Measurement Project
June 2010 Communication Systems Group
Department of Electrical and Computer Engineering The University of the West Indies
St. Augustine Trinidad and Tobago
West Indies
Team Lead: Dr. Kim Mallalieu Technical Lead and Report Author: Mr. Sean Rocke
Member, Technical Team: Dr. Richelle Adams Member, Technical Team: Mr. Ravi Deonarine
Student Researcher: Mr. Orrette Baker

i
Acknowledgments
The Communication Systems Group of the Department of Electrical and Computer Engineering wish to
extend gracious thanks to the Telecommunications Authority of Trinidad and Tobago, TATT, and most
particularly Mr. Kirk Sookram and Mr. Isaf Ali for their tremendous assistance.
Thanks are also extended to Mr. Ravi Deonarine, Dr. CathyAnn Radix and Mrs Candice Simonta-Dyer,
Department of Electrical and Computer Engineering, as well as the Telecommunications Regulatory
Commission of the Virgin Islands (UK) (TRC) staff, including Mr. Tomas Lamanauskas, CEO, and Mr.
Gregory Nelson, for logistic support during measurement as well as assistance provided following the
measurement visit.
The Communications Systems Group additionally extends thanks to Mr. Paolo Vecchia, Chairman,
International Commission on Non-Ionizing Radiation Protection (ICNIRP) for the technical advice
provided in the measurement exercise.
Finally, gracious thanks are extended to the BVI public for their support, hospitality, courtesy, and
involvement in the entire exercise, without which the measurement team would not have been able to
perform the evaluation.

ii
Executive Summary
This document describes a measurement study conducted by the University of the West Indies to assist
the Telecommunications Regulatory Commission of the Virgin Islands (UK) (TRC). The study involved the
measurement of the cumulative Radiofrequency Radiation (RFR) levels in the British Virgin Islands (BVI).
Measurements were taken at various sites on the main Islands of Tortola, Virgin Gorda, Anegada and
Jost Van Dyke over a four-day period. The sites were strategically chosen to include Base Transceiver
Stations (BTS), points of population presence near BTS and at places where complaints originated. The
exercise comprised conducting measurements with a broadband field strength meter for comparison to
the general public exposure limits set by the International Commission on Non-Ionizing Radiation
Protection (ICNIRP). Spectrum scans of cellular bands were also collected to clarify the contributions of
cellular frequencies to overall levels measured at locations. In total 27 locations were visited. At all
locations measurements were taken with the broadband field strength meter, while at 26 of these
locations, a spectrum analyser was used to capture data on cellular contributions. Overall
measurements did not exceed 8%, where not more than 6% was due to the cellular bands. Upper bounds
for extended uncertainty did not exceed 35%, where not more than 25% was due to cellular. In 52% of
the cases, cellular radiation contributed between 40% to 80% of the overall levels measured.
iii
Table of Contents
Acknowledgments .......................................................................................................................................................... i
Executive Summary ....................................................................................................................................................... ii
1 Introduction .......................................................................................................................................................... 1
1.1 Summary ...................................................................................................................................................... 1
1.2 Study Objectives ........................................................................................................................................... 1
1.3 Report Organisation ..................................................................................................................................... 1
2 Description of Measurement Methodology ......................................................................................................... 2
2.1 Survey Schedule ........................................................................................................................................... 2
2.2 Survey Team ................................................................................................................................................. 2
2.3 Weather Conditions ..................................................................................................................................... 2
2.4 Survey Equipment ........................................................................................................................................ 3
2.5 Measurement Procedure ............................................................................................................................. 5
2.5.1 Preliminary Survey............................................................................................................................... 6
2.5.2 Broadband Survey ............................................................................................................................... 6
2.5.3 Narrowband Survey ............................................................................................................................. 7
2.6 Site Selection Considerations ....................................................................................................................... 9
3 Measurement Results ......................................................................................................................................... 11
3.1 Measurement Sites .................................................................................................................................... 11
3.2 Broadband Survey ...................................................................................................................................... 16
3.3 Narrowband Survey ................................................................................................................................... 20
4 Data Analysis ....................................................................................................................................................... 25
4.1 Uncertainty Analysis ................................................................................................................................... 25
4.1.1 Broadband Survey - Impact of Extended Uncertainty on Results ..................................................... 35
4.1.2 Narrowband Survey - Impact of Extended Uncertainty on Results ................................................... 36
4.2 Comparison of Results from the NBM-550 and HF6060 ............................................................................ 37
5 Discussion ........................................................................................................................................................... 40
5.1 Measurement Variations ........................................................................................................................... 40
5.2 Comparison to Other Studies ..................................................................................................................... 44
6 Recommendations .............................................................................................................................................. 46
7 Conclusion ........................................................................................................................................................... 47
8 References .......................................................................................................................................................... 49
9 Appendices.......................................................................................................................................................... 50

1
1 Introduction
1.1 Summary A University of the West Indies team assisted the Telecommunications Regulatory Commission of the
Virgin Islands (UK), TRC by conducting radiation measurements, analyzing the results, and building a
related website for dissemination of the results. The team conducted a series of radio frequency
measurements in the British Virgin Islands, during the week of February 14th 2010. Measurements were
conducted over the period Monday 15th February 2010 to Thursday 18th February 2010 in the vicinity of
cell sites on four islands: Tortola, Anegada, Virgin Gorda, and Jost van Dyke according to the schedule in
Table 1. In total, 78 measurements were taken over 27 locations on the four islands. In addition to
these measurements, spectrum data was captured at 26 locations using a spectrum analyser. The
maximum RF radiation levels measured were compared to the maximum acceptable exposure levels for
the general public, as specified in (ICNIRP 1998).
1.2 Study Objectives The objective of this study was to measure radio frequency radiation levels at various sample points in
the vicinity of cell sites on the BVI where the general public are known to execute normal activities or
have easy access to; and to compare these RF radiation levels to general exposure limits.
1.3 Report Organisation The report is organised into 8 sections, as follows:
1. Introduction
2. Measurement Methodology
3. Measurement Results
4. Data Analysis
5. Discussion
6. Recommendations
7. Conclusion
8. Appendices

2
2 Description of Measurement Methodology
2.1 Survey Schedule Table 1 – Summary of Measurement Survey Schedule
Day Island Locations Visited1 Measurements Taken2
15 – Feb – 2010 Virgin Gorda 7 15 + 7
16 – Feb - 2010 Tortola 53 22 + 5
17 – Feb – 2010 Anegada 3 12 + 3
19 – Feb - 2010 Jost van Dyke
6 13 + 6
Tortola 6 16 + 5
Total: 27 78 + 26
2.2 Survey Team Mr. Gregory Nelson, Telecommunications Regulatory Commission of the Virgin Islands (UK) (TRC)
Mr. Sean Rocke, Department of Electrical and Computer Engineering, UWI
Dr. Richelle Adams, Department of Electrical and Computer Engineering, UWI
Mr. Orrette Baker, Department of Electrical and Computer Engineering, UWI
In addition to the survey team responsible for conducting measurements on the BVI, support was also
provided through Dr. Kim Mallalieu, Head, Department of Electrical and Computer Engineering, UWI,
and Mr. Ravi Deonarine, Development Engineer, Department of Electrical and Computer Engineering, as
well as from Mr. Tomas Lamanauskas, CEO, Telecommunications Regulatory Commission of the Virgin
Islands (UK) (TRC), and the TRC staff. Technical advice was also provided from Mr. Paolo Vecchia,
Chairman, International Commission on Non-Ionizing Radiation Protection (ICNIRP). During the survey,
support was also provided at times from the BVI public.
2.3 Weather Conditions During the measurement period indicated above, the weather was mostly sunny, with some cloud
cover. Additionally, the humidity was generally low and the ground dry. These provided excellent
1 At each location, multiple readings were taken at various sectors, subject to physical accessibility.
2 The first number indicates the broadband measurements taken with the NBM-550 Broadband Field Strength Meter
which provided the primary data used for analysis. The second number indicates the spectrum data taken with the
Spectran HF6060 Spectrum Analyser.
3 A detailed analysis was performed at various points in Road Town on 16-Feb-2010. These were counted as one
location (i.e. Road Town)

3
conditions for conducting measurements as high moisture levels impact readings through signal
attenuation.
Table 2 summarises the temperature conditions experienced during the survey. As with the moisture
content in the atmosphere, temperature levels can impact readings. If necessary, adjustment factors
can be included to compensate for this. For this survey, variances due the weather were incorporated
into the in-situ factors affecting measurements, which were accounted for in the uncertainty analysis
presented in the Data Analysis section.
Table 2 – Temperature Conditions During Measurement Survey (Source: Weather.com)
Day Average High Average Low Mean
15 – Feb – 2010 270C(800F) 190C(670F) 230C(670F)
16 – Feb – 2010 270C(800F) 190C(670F) 230C(670F)
17 – Feb – 2010 270C(800F) 190C(670F) 230C(670F)
19 – Feb - 2010 270C(800F) 190C(670F) 230C(670F)
2.4 Survey Equipment For this survey, two items of equipment were used to measure the strengths of the radio frequency
fields:
the Narda NBM-550 Broadband Field Strength Meter with the ED5091 probe
the Spectran HF6060 Spectrum Analyser with HyperLOG 7060 antenna.
The NBM-550 with ED5091 probe (Figure 1) measures and displays the RF level as a percentage of
ICNIRP recommendations for occupational exposure, whereas the Spectran Analyser (Figure 2) provides
field strength information as well as percentage of limit information for comparison purposes. The
NBM-550 with ED5091 probe additionally provides a cumulative reading for all frequencies within the
range 300kHz – 50GHz, and thus also takes into consideration the combined effect of all emitters within
this spectral range. Further details of the equipment usage can be found in the Measurement
Procedure section.

4
Figure 1 - NBM-550 with ED5091 Probe used for Broadband Measurement
Figure 2 - Spectran HF6060 with HyperLOG 7060 Antenna Used for Narrowband
Measurement (Source: www.spectran.com)

5
Given the different units displayed by the two meters, conversions were necessary for comparison of
the measurements obtained. This will be elaborated on in the Measurement Results, and Data Analysis
sections.
Additional equipment used in the RF survey included a digital camera for taking pictures, a GPS unit for
logging location, a digital range-finder for obtaining distances from the measurement point to the base-
station antennas, a laptop for logging readings from the Spectran HF6060 and non-metallic tripods for
mounting the meters for acquiring RF measurements. The non-metallic tripods were used to take
readings at a fixed height and were additionally chosen (i.e. as opposed to metallic tripods) as they
would not significantly affect the RF fields at the measurement points.
2.5 Measurement Procedure Prior to the start of the survey, information provided on tower operating parameters were obtained
from the TRC, and were used to identify general hazard distances for measurements to be taken.
Calculations typically took account of operating frequencies, maximum operating power output,
antenna gain, and tower height, as was available for each site. It was noted that these were used as
guidelines since many details of the specific installations would not be known until sites were actually
visited. Additionally the geographical and environmental features at various sites such as hills, trees,
and buildings presented restrictions to measurement at certain points. The calculations however were
still used to ensure that necessary precautions would be taken in the selection of spatial sample points
for measurements before going into the field.
The survey procedure was primarily based upon Cases 1 and 2 in the Electronic Communications
Committee, ECC (02)04 “Revised Recommendation for Measuring Non-Ionising Electromagnetic
Radiation (9kHz – 300GHz)“, published by the Electronic Communications Committee (ECC). This
document provides recommendations for “in-situ measurement procedures in order to assess
electromagnetic fields for the purpose of comparison against limits for human exposure” (ECC 2007).
This allowed for maximising the amount of sites for which data could be collected in the short time in
the BVI, while also allowing further scrutiny of any sites for which measured levels were above a
stipulated decision level.
For this exercise, no specific thresholds existed in the BVI. Thus as logistics allowed, data was collected
from each site to facilitate further examination of the RF environment. Consequently, the measurement
procedure consisted of three main phases:
1. Preliminary survey
2. Broadband survey
3. Narrowband survey
6
2.5.1 Preliminary Survey
In the field, first the site was inspected to note any relevant characteristics that may impact upon
readings (e.g. the presence of obstructions - trees, buildings; reflecting objects – cars, water, metallic
structures). Next, as necessary, the NBM-550 field strength meter and isotropic broadband probe
ED5091 were used to determine spatial variation of RF fields around the site in order to identify the
position of the maximum field strength. This would also take account of hazard distances identified
previously. This sweep provided a rough idea of field strength variations on site, and was used to
determine sample points on site. At the sample point, the distance to the antenna was primarily
measured using the distance gun.
Given the transmitting frequencies of current cellular technologies, and the location of transmitting
antennas, measurements were taken in the far field of the transmitter. For the lowest frequencies
around 800MHz, corresponding to wavelengths less than 40cm, the far-field is taken at minimum
distances of 4m from the transmitting antenna (i.e. 10 x largest expected wavelength). Given the tower
heights and considering the preliminary data, in most cases it was concluded that the far-field criteria
would be satisfied. GPS coordinates were recorded along with any other relevant details about the site.
Pictures were also taken of the environment, including the transmitter site. Following this, the
broadband survey was carried out.
2.5.2 Broadband Survey
The NBM-550 meter and ED5091 probe were able to measure radiation within the range 300kHz to
50GHz, thus determining radiation levels of many possible radio frequency sources in the area. This was
deemed appropriate for the study as the total human exposure across the entire meter range could be
measured. At the identified measurement locations, the field strength meter and probe were used to
capture field strength data for 6 minutes, with 1-second sampling intervals. Within each sampling
interval the maximum, minimum, and average values for that 1-second interval were logged by the
meter. The field meter was mounted approximately 1.5 meters above the local ground level using the
non-metallic tripod. During sampling, in order to minimise perturbations to the electromagnetic fields
the team retreated from the immediate vicinity of the meter.
Measurement data was logged to the computer for subsequent analysis. As time permitted, multiple
readings were taken at a sample point. The worst-case 6-minute continuous set of logged data for each
site was compared to the exposure guideline limits. At each site multiple antennas existed to cover
different sectors. Taking this into account, readings were taken for each sector, provided that physical
access to a suitable measurement point was possible. For example, some sites were located on cliff
edges or on hills, where it was not safe to mount the equipment for measurement. A sample output
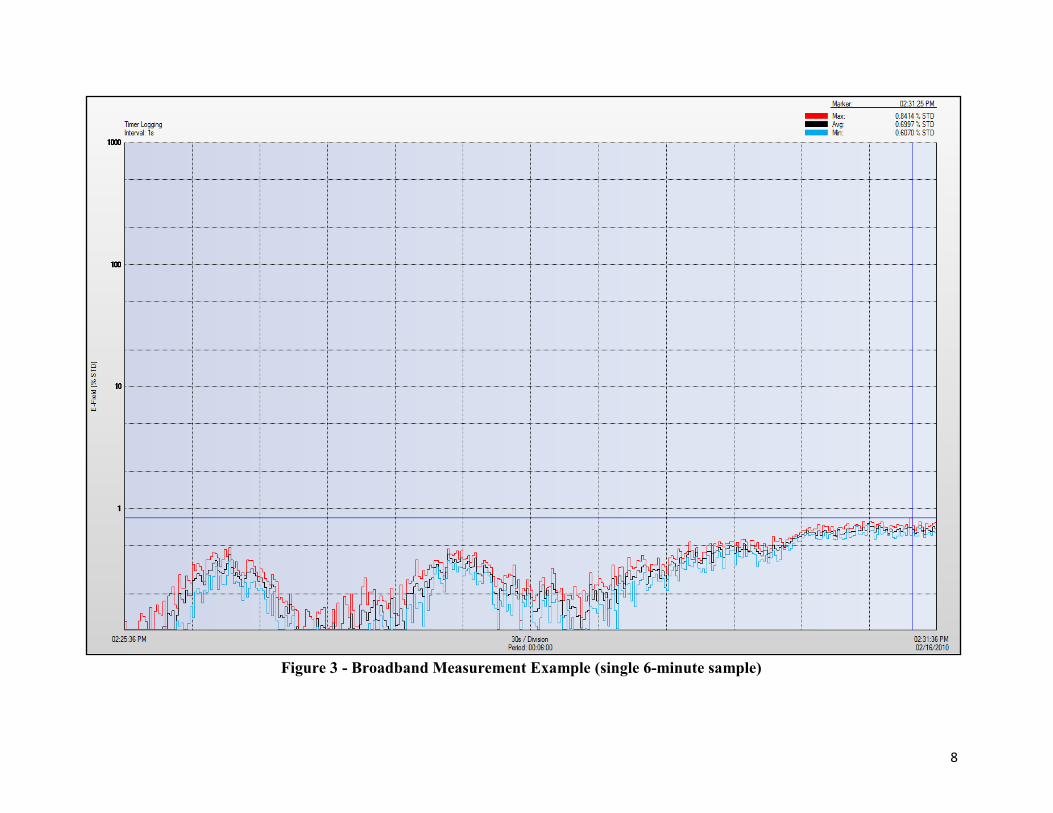
from one broadband measurement is provided in Figure 3. Data such as this was collected at each
sampling point, subjected to post-processing, and used for subsequent evaluation.
7
2.5.3 Narrowband Survey
Prior to the survey, the narrowband survey was recommended only for any sites for which further
scrutiny was required, based upon the results of the broadband survey with the NBM-550. However in
complex environments this survey was very important to gain further insight into the RF environment at
visited locations in the BVI. The output of such surveys would provide some insight into cellular
contributions to the overall levels that were obtained via the broadband survey measurements. Hence
it was decided that as logistics allowed, the narrowband survey would be executed at sites, while the
broadband survey was being carried out.
The Spectran HF6060 with HyperLOG 7060 antenna probe were able to measure radiation by frequency
within the range 700MHz to 6GHz, thus determining radiation levels by frequency for many possible
radio frequency sources in the area. This was deemed appropriate for the study as the total human
exposure contributed by cellular transmissions could be measured. While the NBM-550 was logging
300kHz – 50GHz RF radiation data for a site, the Spectran HF6060 spectrum analyser was used to log RF
radiation data across the cellular frequency ranges being measured. The analyser was placed on a
continuous sweep, and the data was logged to the laptop for subsequent analysis.
The analyser software allowed scan configurations to be stored for quick upload to the analyser. This
contained configuration data for the different spectrum bands, including those for cellular. Calibration
settings included:
the maximum and minimum frequencies for the scan (e.g. GSM 800, GSM 900, GSM 1800, GSM
1900, 3G);
the resolution bandwidth (set to 1MHz);
sample time (set to 200ms);
For the study, although focus was placed on the GSM-based services, scans were still performed to
cover the bands for 3G services to confirm the existing levels.
Additionally since conformance to exposure limits was being investigated, the meter was set to max-
hold and the manufacturer-recommended panning approach was used. In the panning approach the
antenna is slowly tilted in all directions until the maximum value stops changing completely. This
allowed quick determination of the signal maximum for a given band. The use of max-hold and panning
was also in line with the ECC recommendation that measurements with the antenna should be made in
both vertical and horizontal planes. Dominant frequencies and their signal strengths were noted during
this procedure. Additionally in complex environments this was used to pinpoint and infer the sources of
the dominant frequencies for any visible transmitters in the area being assessed.
8
Figure 3 - Broadband Measurement Example (single 6-minute sample)

9
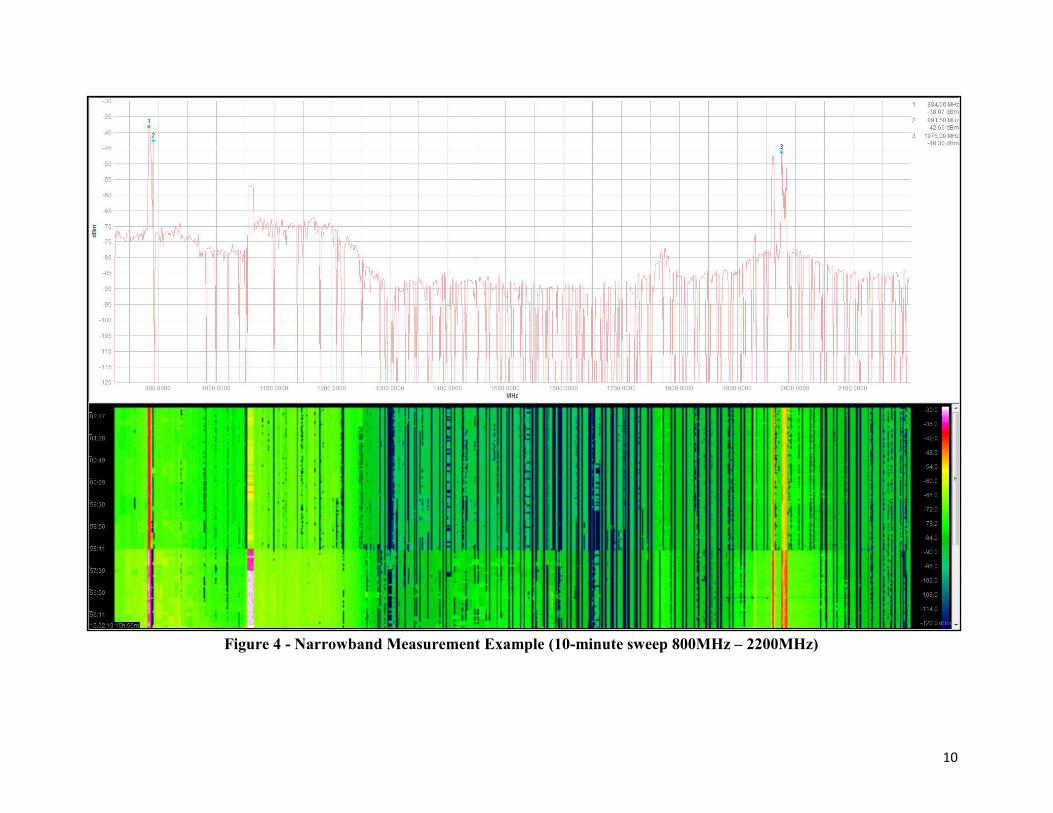
Instantaneous field strength values were logged to the computer for post-processing via the analyser
software. A sample output from one such narrowband survey is provided in Figure 4. The top graph in
the figure illustrates RF field strengths for a single spectrum sweep, while the lower portion of the figure
is a spectrogram illustrating RF field strengths (i.e. by colour) for multiple sweeps. Time increases as
one goes vertically downwards on the spectrogram. From left to right frequency increases in both
figures, and in the latter figure, a legend is provided for quick reference of spectrogram colours to signal
levels. Thus the top graph represents the results of a single horizontal line in the spectrogram, or
conversely each horizontal line in the spectrogram will produce an image like the top one.
Thus it can be used to visualise trends in the RF spectrum over time. The legend on the right illustrates
the power levels for the various colours in the spectrogram. As an example the red vertical line around
900MHz in the spectrogram represents frequencies for which higher power levels are measured,
compared to the general green areas which indicate lower levels. This line corresponds to the downlink
band for the 800 cellular band. This can quickly indicate active channels as well as spectral
characteristics at the point of measurement during the measurement intervals. With reference to the
figure, the predominantly green and yellow areas are those where power levels are higher than the
much lower blue areas. Roughly these areas correspond to GSM 900, 1800 and 1900 bands. This data
can be cross-checked against spectral allocations to get a better idea of the RF environment over time at
any desired location. It can also give an idea of the overall spectrum levels for the entire sweep.
2.6 Site Selection Considerations Given the limited time that the team would be in the BVI, and other considerations such as the time to
record data at each site, and the scheduling of other relevant activities, only a subset of all active sites
could be visited. Measurement sites were identified in collaboration with the TRC as well as for specific
requests from individuals who lodged complaints prior to and during the measurement exercise. In
some instances there were multiple transmitters, and evaluations were done by determining overall RF
levels in a given area, without identification of individual contributions by transmitter. Such
identification would have been extremely impractical in many of the complex multiple-transmitter sites,
given all constraints identified previously. Additionally, such an evaluation typically involves
considerable coordination with the operators. However at such sites, using the spectrum analyser it was
possible to obtain information on general trends and the key contributors by viewing the spectrum data,
and through use of direction finding via the panning approach. For this reason, it was recommended
that the narrowband survey should be carried out at as many sites as possible in order to collect
additional data on the RF radiation present at a given location.
10
Figure 4 - Narrowband Measurement Example (10-minute sweep 800MHz – 2200MHz)

11
The intent and the spirit of the exercise were to evaluate the levels of RF radiation that a typical person
would be exposed to in a given environment in the BVI. Thus, taking account of the above, base-station
sites were considered as either simple or complex. Simple sites were classified as those sites for which
there was a single tower in the vicinity which may have multiple co-located transmitters. Complex sites
were those where there were multiple transmitters, and these transmitters were not co-located on the
same tower. Simple sites were predominantly evaluated via broadband survey at points around the
transmitters, as would usually be done via station evaluations. Selected points depended on sector
antenna accessibility, as well as other factors such as foliage, geographical features, and location of
public passageways and settlements. However complex sites are unique with respect to the spatial
arrangement of transmitters, as well as their transmitting parameters. Thus in this case, the sites were
predominantly evaluated via broadband survey, but the intent in this case was to characterise typical
levels at major points accessible by the public. For example, in Road Town, there were numerous
transmitters mounted on rooftops creating a complex RF environment. In this case, points were
selected along the sidewalks, and walkways. Care was taken to avoid major reflections from cars during
the sampling periods, as these would affect the electromagnetic fields that were being measured.
3 Measurement Results
3.1 Measurement Sites Table 1 provided a summary of the locations visited and the measurements taken. Sites evaluated on
the four islands during the visit are illustrated in Figures 5-8. The markers indicate general
measurement locations visited at which measurements were conducted. In some instances, given the
map resolution, the markers are very close and as such would appear as one location on the maps.
Figure 5 - Measurement Locations (Anegada)

12
Figure 6 - Measurement Locations (Jost Van Dyke)
Figure 7 - Measurement Locations (Tortola)

13
Figure 8 - Measurement Locations (Virgin Gorda)
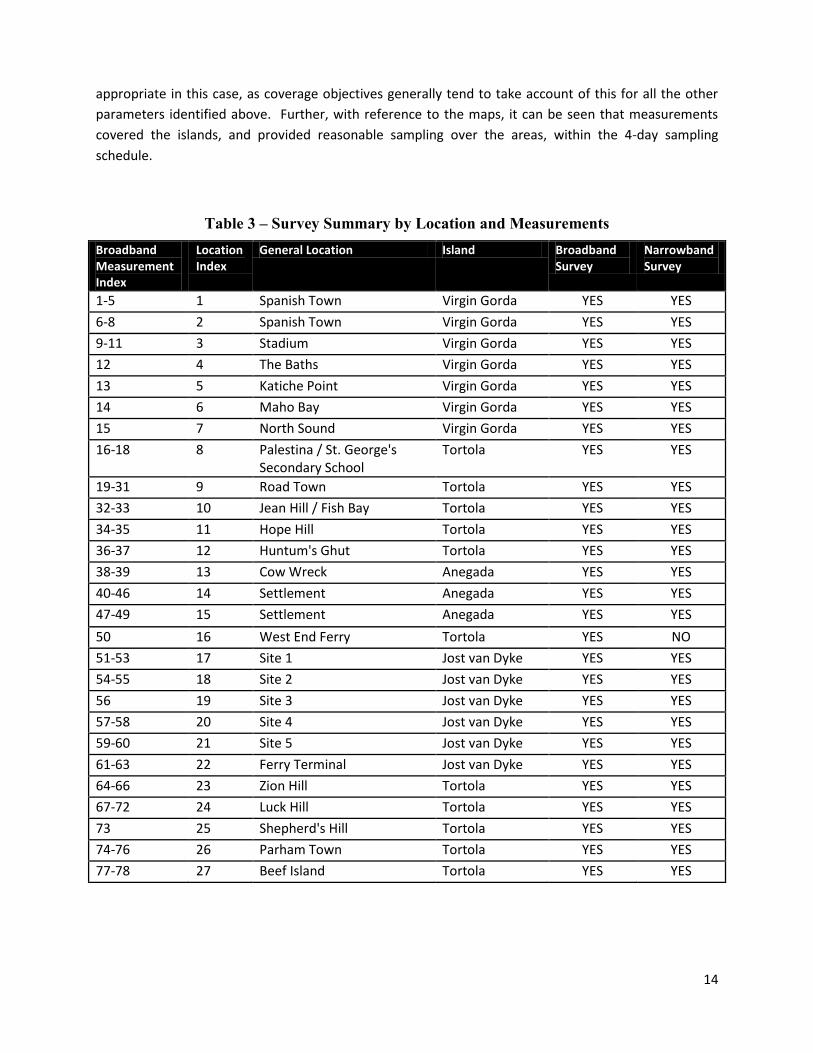
Further details of sites visited are provided in Table 3. Measurement indices were coded by the survey
team to keep track of all measurements taken. General location names were determined using the
latitude and longitude coordinates in conjunction with maps of the islands, and BTS site information
provided by the TRC. In many instances the residents were able to provide information to assist with
this. The table also indicates which surveys were performed at which sites. Based upon the previously
discussed site selection considerations, spectrum was captured for all sites, provided it was practical to
do so at the time. Thus spectrum data was captured for all sites with the exception of the West End
Ferry Terminal in Tortola, due to the scheduled departure of the ferry to Jost Van Dyke. The broadband
survey was carried out at the West End Ferry Terminal prior to departure, however. Thus the
broadband survey was executed at 27 locations, while the narrowband survey was done at 26 locations
across the four islands.
Figures 9 and 10 illustrate the percentage of measurements and locations visited by island. It must be
noted that Anegada is very flat and was unique in its geographic features compared to the other three
islands. Hence fewer readings were deemed necessary. Readings were taken in the vicinity of the BTS
sites, also taking account of the major settlement areas on Anegada. Therefore with the exception of
Anegada, the measurement and location distributions were comparable to the general surface area of
the islands, as shown in Figure 11. While parameters such as population, population density or number
(and type) of transmitter sites can also be used as bases for comparison, island area was deemed
14
appropriate in this case, as coverage objectives generally tend to take account of this for all the other
parameters identified above. Further, with reference to the maps, it can be seen that measurements
covered the islands, and provided reasonable sampling over the areas, within the 4-day sampling
schedule.
Table 3 – Survey Summary by Location and Measurements
Broadband Measurement Index
Location Index
General Location Island Broadband Survey
Narrowband Survey
1-5 1 Spanish Town Virgin Gorda YES YES
6-8 2 Spanish Town Virgin Gorda YES YES
9-11 3 Stadium Virgin Gorda YES YES
12 4 The Baths Virgin Gorda YES YES
13 5 Katiche Point Virgin Gorda YES YES
14 6 Maho Bay Virgin Gorda YES YES
15 7 North Sound Virgin Gorda YES YES
16-18 8 Palestina / St. George's Secondary School
Tortola YES YES
19-31 9 Road Town Tortola YES YES
32-33 10 Jean Hill / Fish Bay Tortola YES YES
34-35 11 Hope Hill Tortola YES YES
36-37 12 Huntum's Ghut Tortola YES YES
38-39 13 Cow Wreck Anegada YES YES
40-46 14 Settlement Anegada YES YES
47-49 15 Settlement Anegada YES YES
50 16 West End Ferry Tortola YES NO
51-53 17 Site 1 Jost van Dyke YES YES
54-55 18 Site 2 Jost van Dyke YES YES
56 19 Site 3 Jost van Dyke YES YES
57-58 20 Site 4 Jost van Dyke YES YES
59-60 21 Site 5 Jost van Dyke YES YES
61-63 22 Ferry Terminal Jost van Dyke YES YES
64-66 23 Zion Hill Tortola YES YES
67-72 24 Luck Hill Tortola YES YES
73 25 Shepherd's Hill Tortola YES YES
74-76 26 Parham Town Tortola YES YES
77-78 27 Beef Island Tortola YES YES

15
Figure 9 - Distribution of Measurements Taken by Island
Figure 10 - Distribution of Locations Visited by Island
Virgin Gorda19%
Tortola49%
Anegada15%
Jost van Dyke17%
Virgin Gorda26%
Tortola41%
Anegada11%
Jost van Dyke22%

16
Figure 11 - Distribution of Surface Area by Island
3.2 Broadband Survey The 6-minute maximum and 6-minute time-averaged maximum values were determined for the samples
at each location. With reference to the manufacturer specifications for the NBM-550 with ED5091
probe, the results are recorded as percentages of the ICNIRP occupational levels. For the frequency
range of interest, the manufacturer recommends that results should be multiplied by a factor of 5 to
reference the measured values to the corresponding reference points for general public exposure. The
results are summarised in Tables 15 and 16 as well as Figure 28 in the Appendix.
All measurements taken were then aggregated by general location. This was necessary for assessment
by location, and for comparison to spectrum scans from the narrowband survey. These location-based
groupings were then used to derive maximum and time-averaged RF exposure levels for each location
visited. The results are presented in Tables 17 and 18 in the Appendix, and are summarised in Figures
12 and 13. Figure 12 illustrates the measurements with reference to the limit at 100%, while Figure 13
provides a magnified view for closer examination of the measured values at each location.
Measurements were also aggregated by island for comparison. The results are presented in Table 4
below. Values are specified as percentages of the limits for general public exposure (ICNIRP 1998).
Table 4 – Summary of Broadband Survey by Island
Country Maximum Average Standard Deviation
Anegada 2.182% 0.753% 0.036%
Jost van Dyke 2.204% 0.764% 0.042%
Tortola 7.985% 2.720% 0.400%
Virgin Gorda 6.390% 1.774% 0.261%
Virgin Gorda17%
Tortola45%
Anegada31%
Jost van Dyke7%

17
Figure 12 - Maximum and Time-Averaged Maximum RF Exposure Levels with GPE limit (Broadband Survey)
0%
10%
20%
30%
40%
50%
60%
70%
80%
90%
100%M
eas
ure
d R
F Le
vels
(%
of
Ge
ne
ral P
ub
lic E
xpo
sure
Lim
its)
Measurement Location
Maximum
Average
General Public Exposure Limit

18
Figure 13 - Maximum and Time-Averaged Maximum RF Exposure Levels (Broadband Survey)
0%
1%
2%
3%
4%
5%
6%
7%
8%
9%M
eas
ure
d R
F Le
vels
(%
of
Ge
ne
ral P
ub
lic E
xpo
sure
Lim
its)
Measurement Location
Maximum
Average

19
Based upon the measurements taken, with reference to the tables and figures introduced previously, it
can be seen that no measurements exceeded 8% of the exposure limit for the general public. The
highest maximum RF levels were measured in Tortola, followed by Virgin Gorda, then Jost Van Dyke
then Anegada. The time-averaged readings also followed a similar trend, as did the range and spread of
the measurements taken.
On Tortola the top three maximum RF levels were observed at Shepherd’s Hill, Beef Island, and Luck Hill
in descending order. None exceeded 8% of the limits. This was interesting considering that lower levels
were observed in the capital, Road Town, where it was initially expected to be higher. The readings at
these three locations were taken in places where the general public would have access. The next
highest readings were observed on Virgin Gorda. The top three maximum RF levels were observed at
Maho Bay, Katiche Point, and Stadium in descending order. None exceeded 7% of the limits. On Jost
Van Dyke the RF levels observed did not exceed 3% of the limits. The maximum level was measured at
Site 1. A general location could not be obtained for this site, but its coordinates can be referenced in
Table 21 in the Appendix. On Anegada, the highest levels were measured at Claudia Creque Educational
Centre and also did not exceed 3% of the limits.
However these are the 1-second maximum levels observed during the 6-minute measurement. While
the 1-second maximum levels are important to note since they indicate the maximum levels that may
occur in the environment under similar conditions, these levels may be transitory. They may last for a
small fraction of the measurement time. Therefore the time-averaged levels paint a clearer picture of
what the public would be exposed to for a longer term. The time-averaged values are obtained by
taking the maximum levels in every 1-second interval and calculating the average over the entire
sampling time. This value would provide a more robust indication of the levels at the location.
Thus it is recommended that evaluations should be based on the 6-minute average of the 1-second
maximum RF radiation levels (ICNIRP 1998). This is then compared to the absolute maximum levels
experienced where the average is calculated over the maximum levels for each 1-second interval. With
reference to the standard 6-minute averages a similar trend existed in terms of the relative levels by
location. However, it is important to note the comparison of the 6-minute averages to the 1-second
maximum values obtained.
Table 5 - Distribution of Measured Values by Location (Broadband Survey)
Percentage of Limit
Percentage of time-averaged maximum values below
Percentage of 1-second maximum values below
8% 100% 100%
7% 100% 93%
6% 100% 81%
5% 93% 81%
4% 89% 70%
3% 85% 56%
2% 78% 44%
1% 63% 41%

20
Table 5 illustrates the distribution of measurements by location that were below various percentages of
the general public limits. The distribution of measurements is rounded to the nearest integer. As shown
in the table, 93% of the 1-second maximum readings were less than 7% of the limit, while 81% were less
than 5% of the limit, and 41% of the readings were below 1% of the limit. Additionally, all of the time-
averaged readings were below 6% of the acceptable exposure limits for the general public, while 93% of
the time-averaged readings by location were less than 5% of the limit, and 63% of the readings were
below 1% of the limit.
3.3 Narrowband Survey The logged data from each narrowband sweep was stored in dBm units. In order to compare the values
obtained to those for the NBM 550 it was necessary to perform several calculations to convert the
measurements into percentages of the exposure limits for the general public. Due to the amount of
data collected, the calculations were done via a computer program created for this survey. An outline of
the procedure is provided below.
For each set of measurements taken at a location, the logged data was retrieved by the computer
program. Data included antenna gains and cable insertion losses for all relevant frequencies, as well as
the actual scanned frequencies, and measured dBm values for measurement intervals. The antenna
parameters and insertion cable losses for the feeder cable were provided by the manufacturer. This also
facilitated the conversion of the units to percentage conformance by frequency. Measurement intervals
contained numerous sweeps of each spectrum band. For each single sweep, at each frequency for
which data was stored, the dBm readings were converted to Wm2 according to the formula,
2
2
300410
MHzindex f
WmS , where
10
30Loss CableGain Antenna
dBmSindex
Additionally, at each frequency the exposure limit was determined and this was used to calculate the
exposure quotient as specified in 4.11 of (ECC 2007). These were then aggregated to determine the
total exposure quotient for all scanned bands (in percentage form) as specified in 4.12 of (ECC 2007) for
each measurement sweep. Since the reference levels used were the same as that used for the
broadband survey, the results are thus expressed as percentages of the exposure limits for the general
public. This was then logged for each sweep for the entire measurement interval.
Since these values provided the maximum value for the sweep interval, which is equivalent to the
sampling interval for the broadband survey, these values were used to calculate the time-averaged
exposure due to the cellular bands. These were then compared to the values for overall exposure
provided by the broadband sweep. This provided an idea of the contribution of cellular transmissions to
the overall exposure.

21
Narrowband scans were taken at the same locations as the broadband scans for comparison. Multiple
scans were done using the previously-described panning approach, and grouped by location. The
location-based groupings were then used to derive maximum and time-averaged RF exposure levels for
each location visited. The results are presented in Tables 19 and 20 in the Appendix, and are
summarised in Figures 14 and 15 below. Figure 14 illustrates the measurements with reference to the
limit at 100%, while Figure 15 provides a magnified view for closer examination of the measured values
at each location.
Measurements were also aggregated by island for comparison. The results are presented in Table 6
below. Values are specified as percentages of the limits for general public exposure (ICNIRP 1998).
Table 6 - Summary of Narrowband Survey by Island
Country Maximum Average Standard Deviation
Anegada 1.019% 0.631% 0.468%
Jost van Dyke 0.812% 0.297% 0.259%
Tortola 5.978% 3.031% 1.806%
Virgin Gorda 5.445% 1.421% 1.859%
Based upon the measurements taken, with reference to the tables and figures introduced previously, it
can be seen that no measurements exceeded 6% of the exposure limit for the general public. The
narrowband survey was used to determine the levels due to cellular activity, and as such it was not
expected to exceed the levels captured in the broadband survey. This was because the broadband
survey represented the total from all radiation sources between 300 kHz – 50GHz, which corresponded
to the range measured with the broadband power meter and probe. The highest maximum RF levels
were measured in Tortola, followed by Virgin Gorda, then Anegada then Jost Van Dyke. This was almost
the same as that encountered in the broadband survey. The time-averaged readings also followed a
similar trend, as did the range of the measurements taken. The measurement spread was more in Virgin
Gorda than in Tortola.
On Tortola with reference to the overall maximum values experienced during measurement intervals,
the top three maximum RF levels were observed at Beef Island, Jean Hill and Shepherd’s Hill in
descending order. None exceeded 6% of the limits. This was interesting considering that lower levels
were observed in the capital, Road Town, where it was initially expected to be higher. In a similar
manner to the broadband survey, readings at these three locations were taken in places where the
general public would have access. The next highest readings were observed on Virgin Gorda. The top
three maximum RF levels were observed at Maho Bay, Katiche Point, and Stadium in descending order.
While the Maho Bay reading was above 5%, all the others were less than 2% of the limits. On Jost Van
Dyke the RF levels observed did not exceed 1% of the limit. The maximum level was measured at Site 1
as before in the broadband survey. On Anegada, the highest levels were measured at Cow Wreck in this
instance, just over 1% of the limit, in contrast to the highest level in the broadband survey being
identified at Claudia Creque Educational Centre. However the time averaged values followed a similar
trend to that of the broadband survey.

22
Figure 14 - Maximum and Average RF Exposure Levels with GPE Limit (Narrowband Survey)
0%
10%
20%
30%
40%
50%
60%
70%
80%
90%
100%M
eas
ure
d R
F Le
vels
(%
of
Ge
ne
ral P
ub
lic E
xpo
sure
Lim
its)
Measurement Location
Maximum
Average
General PublicExposure Limit

23
Figure 15 - Maximum and Average RF Exposure Levels (Narrowband Survey)
0%
1%
2%
3%
4%
5%
6%
7%M
eas
ure
d R
F Le
vels
(%
of
Ge
ne
ral P
ub
lic E
xpo
sure
Lim
its)
Measurement Location
Maximum
Average

24
With reference to the standard 6 minute averages a similar trend existed in terms of the relative levels
by location compared to that of the broadband survey. The highest levels in Tortola were measured at
Beef Island, followed by Luck Hill, then Parham Town and did not exceed 4% of the limit. Interestingly,
the highest time average reading was observed not in Tortola but in Virgin Gorda, at Maho Bay. This
was just over 3% of the limit, and can be attributed to the measurement location on the road. The
antenna was mounted on a pole along the road, and the measurement was taken at the best point
considering the spatial variation of the RF radiation readings in the preliminary survey and the fact that
the other side of the road was at the edge of a cliff. This site was evaluated on the roadway, and in
general it was concluded that the exposure would be different on a roadway as opposed to continued
exposure in a domicile or in the workplace.
Table 7 illustrates the distribution of measurements by location that were below various percentages of
the general public limits. The distribution of measurements is rounded to the nearest integer. As shown
in the table, all of the maximum readings for each scan interval were less than 6% of the limit, while 88%
were less than 5% of the limit, 54% were less than 1% of the limit and 42% were less than 0.75% of the
limit. Additionally, all of the time-averaged values were 4% of the acceptable exposure limits for the
general public, while 92% of the time-averaged readings were less than 2% of the limit, 69% were less
than 1% of the limit and 58% were less than 0.5% of the limit.
As expected, through comparison of Tables 5 and 7, a higher percentage of the readings in the
narrowband survey were below the corresponding levels in the broadband survey. This can be
accounted for by noting that the levels recorded in the narrowband survey were based upon the total
exposure due to transmissions within the cellular bands. These levels do not account for transmissions
outside of the cellular bands, such as those that were included in the broadband survey.
Table 7 - Distribution of Measured Values by Location (Narrowband Survey)
Percentage of Limit
Percentage of time-averaged maximum values below
Percentage of interval maximum values below
6% 100% 100%
5% 100% 88%
4% 100% 85%
3% 92% 77%
2% 92% 73%
1% 69% 54%
0.75% 69% 42%
0.5% 58% 38%

25
4 Data Analysis
4.1 Uncertainty Analysis In assessing compliance to exposure limits in this study measurement uncertainty is taken into account.
Measurement uncertainty arises from a variety of sources, which can be loosely classified into:
instrument-inherent uncertainty – this includes various uncertainties that arise due to the
measurement equipment employed (e.g. impedance mismatches, calibration uncertainty,
anisotropy, non-linearity, probe shaping, temperature, modulation effects, etc...), and is usually
obtained via manufacturer specifications;
sampling uncertainty – this includes various uncertainties that arise due to the individual/group
conducting measurements (e.g. procedure, sample heterogeneity, sample preparation, etc...).
Parameters contributing to the instrument-inherent uncertainty were obtained from manufacturer
specifications, while the sampling uncertainty was estimated to be +/- 2dB. The sampling uncertainty
was examined based upon multiple samples taken at locations, and rounded to the nearest integer to
account for additional uncertainties that may arise from in situ parameters. The combined impact of
these uncertainties can be expressed as either standard or extended uncertainties. Calculations were
conducted in accordance with (ECC 2007), with reference to (IC 2008), (Narda Safety Test Solutions
2007) and (Nordic Innovation Centre 2007). The combined standard uncertainty, uc, was given by
N
i
iic xucu1
2
The extended uncertainty, ue, was related to the standard uncertainty by ue = 1.96 x uc. A summary of
the calculations are shown in Tables 8 and 9 below, for the NBM-550 with ED5091 probe and the
Spectran HF6060 with HyperLOG7060 antenna respectively.
Table 8 - Summary of Uncertainty Analysis for NBM-550 with ED5091 Probe
Input Quantity Uncertainty of xi u(xi) ci (ciu(xi))2
Value Probability distribution of divisor, k
Isotropy 2.00 rectangular; k= √3 1.15 1.00 1.33
Linearity 3.00 rectangular; k= √3 1.73 1.00 3.00
Frequency Sensitivity 2.00 rectangular; k= √3 1.15 1.00 1.33
Temperature 0.50 rectangular; k= √3 0.29 1.00 0.08
Sampling Uncertainty 2.00 normal; k =1 2.00 1.00 4.00
Combined Standard Uncertainty (dB) 3.12
Combined Standard Uncertainty (linear) 2.05
Extended Uncertainty - confidence interval of 95% (dB) 6.12
Extended Uncertainty - confidence interval of 95% (linear) 4.09

26
The calculated extended measurement uncertainties were then used to determine the possible upper
and lower range limits for each measurement. For example from Table 8, for the NBM-550 with ED5091
probe, the extended uncertainty was calculated to be 6.12dB. This translates into a linear factor of 4.09.
Thus for each measurement, the lower limit was determined by dividing the ‘raw’ measurement by 4.09,
while the upper limit was determined by multiplying the ‘raw’ measurement by 4.09.
Figures 16, 17, 18, and 19 as well as Figures 29 and 30 and Tables 15 and 16 in the Appendix take
account of extended uncertainties for the measurements taken with the broadband power meter and
probe. Figures 16 and 18 illustrate the measurements with reference to the limit at 100%, while Figures
17 and 19 provide magnified views for closer examination of the measured values at each location.
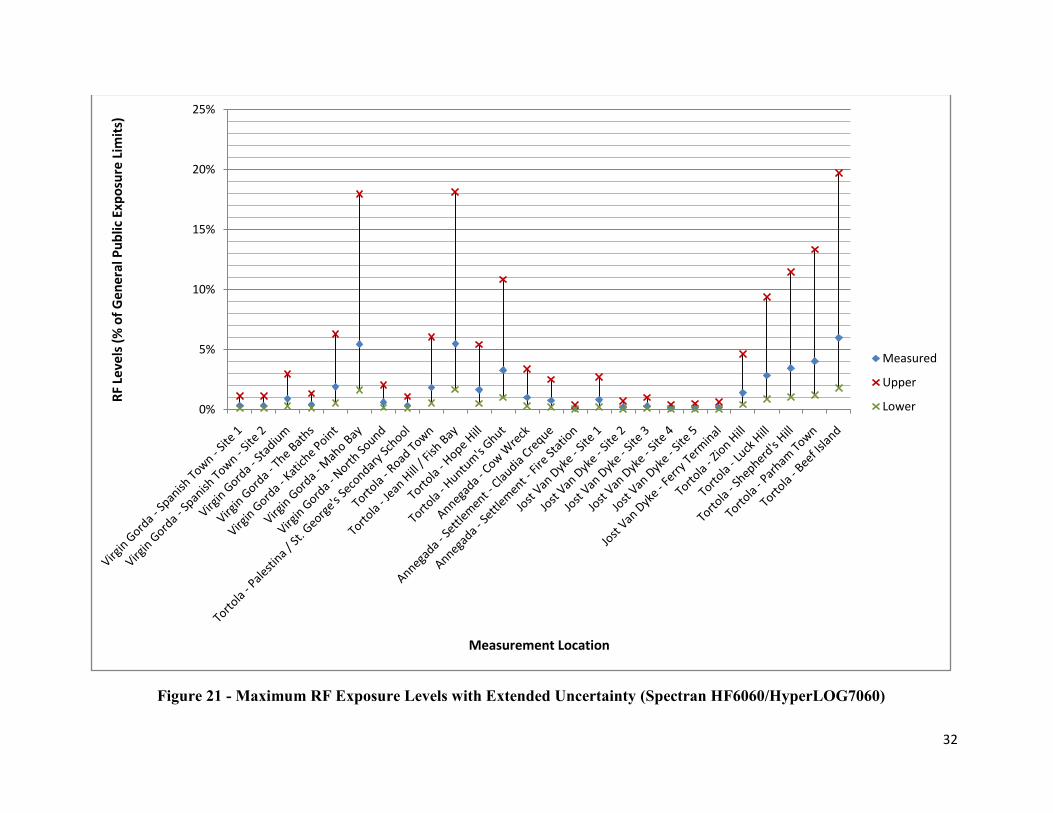
A similar approach was used for measurements made with the spectrum analyser and antenna. Figures
20, 21, 22, and 23 as well as Tables 19 and 20 in the Appendix take account of extended uncertainties
for the measurements taken with the spectrum analyser and antenna. Figures 20 and 22 illustrate the
measurements with reference to the limit at 100%, while Figures 21 and 23 provide magnified views for
closer examination of the measured values at each location.
Table 9 - Summary of Uncertainty Analysis for Spectran HF6060 with HyperLOG7060
Antenna
Input Quantity Uncertainty of xi u(xi) ci (ciu(xi))2
Value Probability distribution of divisor, k
Meter 3.00 rectangular; k= √3 1.73 1.00 3.00
Sampling Uncertainty 2.00 normal; k =1 2.00 1.00 4.00
Combined Standard Uncertainty (dB) 2.65
Combined Standard Uncertainty (linear) 1.84
Extended Uncertainty - confidence interval of 95% (dB) 5.19
Extended Uncertainty - confidence interval of 95% (linear) 3.30
To demonstrate the implications of measurement uncertainty, consider the maximum value obtained in
Jost Van Dyke in the broadband survey. The obtained measurement of 2.204% can be considered to be
the most probable value for that measurement, while there is a 95% chance that the actual value may
be between 0.539% and 9.014%. As another example, consider the maximum time-averaged level
which was measured at Beef Island in Tortola. The value measured was 5.645%. Taking account of
measurement uncertainty, it can be said that the actual level falls in the interval 1.38% to 23.09% of the
exposure limit for the general public with 95% confidence. Since this study focuses upon compliance,
reference will be made to the maximum values possible when uncertainty is considered. Thus the lower
values are ignored in the following discussion.

27
Figure 16 - Maximum RF Exposure Levels with Extended Uncertainty with GPE Limit (NBM-550/ED5091)
0%
10%
20%
30%
40%
50%
60%
70%
80%
90%
100%R
F Le
vels
(%
of
Ge
ne
ral P
ub
lic E
xpo
sure
Lim
its)
Measurement Location
Measured
Upper
Lower
General Public Exposure Limit

28
Figure 17 - Maximum RF Exposure Levels with Extended Uncertainty (NBM-550/ED5091)
0%
5%
10%
15%
20%
25%
30%
35%R
F Le
vels
(%
of
Ge
ne
ral P
ub
lic E
xpo
sure
Lim
its)
Measurement Location
Measured
Upper
Lower

29
Figure 18 - Time-Averaged RF Exposure Levels with Extended Uncertainty with GPE Limit (NBM-550/ED5091)
0%
10%
20%
30%
40%
50%
60%
70%
80%
90%
100%R
F Le
vels
(%
of
Ge
ne
ral P
ub
lic E
xpo
sure
Lim
its)
Measurement Location
Measured
Upper
Lower
General Public Exposure Limit

30
Figure 19 - Time-Averaged RF Exposure Levels with Extended Uncertainty (NBM-550/ED5091)
0%
5%
10%
15%
20%
25%R
F Le
vels
(%
of
Ge
ne
ral P
ub
lic E
xpo
sure
Lim
its)
Measurement Location
Measured
Upper
Lower

31
Figure 20 - Maximum RF Exposure Levels with Extended Uncertainty (Spectran HF6060/HyperLOG7060)
0%
10%
20%
30%
40%
50%
60%
70%
80%
90%
100%R
F Le
vels
(%
of
Ge
ne
ral P
ub
lic E
xpo
sure
Lim
its)
Measurement Location
Measured
Upper
Lower
General Public
Exposure Limit
32
Figure 21 - Maximum RF Exposure Levels with Extended Uncertainty (Spectran HF6060/HyperLOG7060)
0%
5%
10%
15%
20%
25%R
F Le
vels
(%
of
Ge
ne
ral P
ub
lic E
xpo
sure
Lim
its)
Measurement Location
Measured
Upper
Lower

33
Figure 22 - Time-Averaged RF Exposure Levels with Extended Uncertainty (Spectran HF606 / HyperLOG 7060)
0%
10%
20%
30%
40%
50%
60%
70%
80%
90%
100%R
F Le
vels
(%
of
Ge
ne
ral P
ub
lic E
xpo
sure
Lim
its)
Measurement Location
Measured
Upper
Lower
General Public
Exposure Limit

34
Figure 23 - Time-Averaged RF Exposure Levels with Extended Uncertainty (Spectran HF606 / HyperLOG 7060)
0%
2%
4%
6%
8%
10%
12%R
F Le
vels
(%
of
Ge
ne
ral P
ub
lic E
xpo
sure
Lim
its)
Measurement Location
Measured
Upper
Lower

35
4.1.1 Broadband Survey - Impact of Extended Uncertainty on Results
Based upon the measurements taken, with reference to the tables and figures introduced previously, it
can be seen that with extended uncertainty included no RF levels would exceed 35% of the exposure
limit for the general public, at 95% confidence. This stated level included the adjustment factor that
accounts for uncertainties in the measurements. However, the actual measurement noted in the
measurement exercise was lower, as indicated in Figures 16 -19. The highest maximum RF levels were
in Tortola, followed by Virgin Gorda, then Jost Van Dyke then Anegada. The time-averaged readings also
followed a similar trend, as did the range and spread of the measurements taken with extended
uncertainty considered.
On Tortola the top three maximum RF levels were observed at Shepherd’s Hill, Beef Island, and Luck Hill
in descending order. None exceeded 33% of the limits. The next highest readings were observed on
Virgin Gorda. The top three maximum RF levels were observed at Maho Bay, Katiche Point, and Stadium
in descending order. None exceeded 27% of the limit. On Jost Van Dyke the RF levels observed did not
exceed 10% of the limit. The maximum level was at Site 1. On Anegada, the highest levels were
measured at Claudia Creque Educational Centre and also did not exceed 10% of the limit when extended
uncertainty was considered.
With reference to the standard 6 minute averages a similar trend existed in terms of the relative levels
by location. None exceeded 25% of the limit. The highest readings were observed on Tortola, with the
top three locations for the island being Beef Island, Shepherd’s Hill and Parham Town, when
measurement uncertainty is considered. The next highest readings were observed on Virgin Gorda. The
top three maximum time-averaged RF levels were observed at Maho Bay, Katiche Point, and Stadium in
descending order. None exceeded 20% of the limits. On Jost Van Dyke the time-averaged RF levels
observed did not exceed 2% of the limits. The maximum level was at Site 1. On Anegada, the highest
time-averaged levels were at Claudia Creque Educational Centre. This did not exceed 1% of the limit
when extended uncertainty was considered.
All the above levels are stated with a 95%confidence, based upon the uncertainty analysis.
Table 10 - Distribution of Measured Values by Location Considering Measurement
Uncertainty (Broadband Survey)
Percentage of Limit
Percentage of time-averaged maximum values below
Percentage of 1-second maximum values below
35% 100% 100%
30% 100% 93%
25% 100% 85%
20% 93% 78%
15% 85% 63%
10% 81% 52%
5% 67% 44%
3% 59% 19%

36
Table 10 illustrates the distribution of measurements by location that were below various percentages
of the general public limits when measurement uncertainty is considered. The distribution of
measurements is rounded to the nearest integer. As shown in the table, all of the 1-second maximum
readings were below 35% of the limit for the general public, 93% of the readings were less than 30% of
the limit, while 78% were less than 20% of the limit. Over 50% of the readings were less than 10% of the
limit. Additionally, all of the time-averaged readings were less than 25% of the limit, 93% of the time-
averaged readings were less than 20% of the limit, while 81% were less than 10% of the limit and 59%
were less than 3% of the limit.
4.1.2 Narrowband Survey - Impact of Extended Uncertainty on Results
Based upon the measurements taken, with reference to the tables and figures introduced previously, it
can be seen that no RF levels exceeded 20% of the exposure limit for the general public, when extended
uncertainty is considered. The highest maximum RF levels due to cellular transmissions were in Tortola,
followed by Virgin Gorda, then Anegada then Jost Van Dyke. This was almost the same as that
encountered in the broadband survey. The time-averaged readings also followed a similar trend, as did
the range of the measurements taken. The measurement spread was more in Virgin Gorda than in
Tortola.
On Tortola with reference to the maximum values experienced during measurement intervals, the top
three maximum RF levels were observed at Beef Island, Jean Hill and Shepherd’s Hill in descending
order. None exceeded 20% of the limits when the upper bound due to extended uncertainty is
considered. This was somewhat different to the results of the broadband survey. Readings at these
three locations were taken in places where the general public would have access. Similar considerations
would hold as were discussed previously for the broadband survey.
The next highest readings were observed on Virgin Gorda. The top three maximum RF levels were
observed at Maho Bay, Katiche Point, and Stadium in descending order. While the Maho Bay reading
was above 15%, all the others were less than 7% of the limits. On Jost Van Dyke the RF levels observed
did not exceed 3% of the limits. On Anegada, the highest levels were measured at Cow Wreck in this
instance, just over 3% of the limit. However the time averaged values followed a similar trend to that of
the broadband survey. Claudia Creque Educational Centre and also did not exceed 1% of the limits.
With reference to the standard 6 minute averages a similar trend existed in terms of the relative levels
by location compared to that of the broadband survey. The highest levels in Tortola were measured at
Beef Island, followed by Luck Hill, then Parham Town and did not exceed 12% of the limit. The highest
time average reading was observed not in Tortola but in Virgin Gorda, at Maho Bay. This was just over
10% of the limit, and can be attributed to the measurement location on the road. This site was
evaluated on the roadway, and in general it was concluded that the exposure would be different on a
roadway as opposed to continued exposure in a domicile or in the workplace.
37
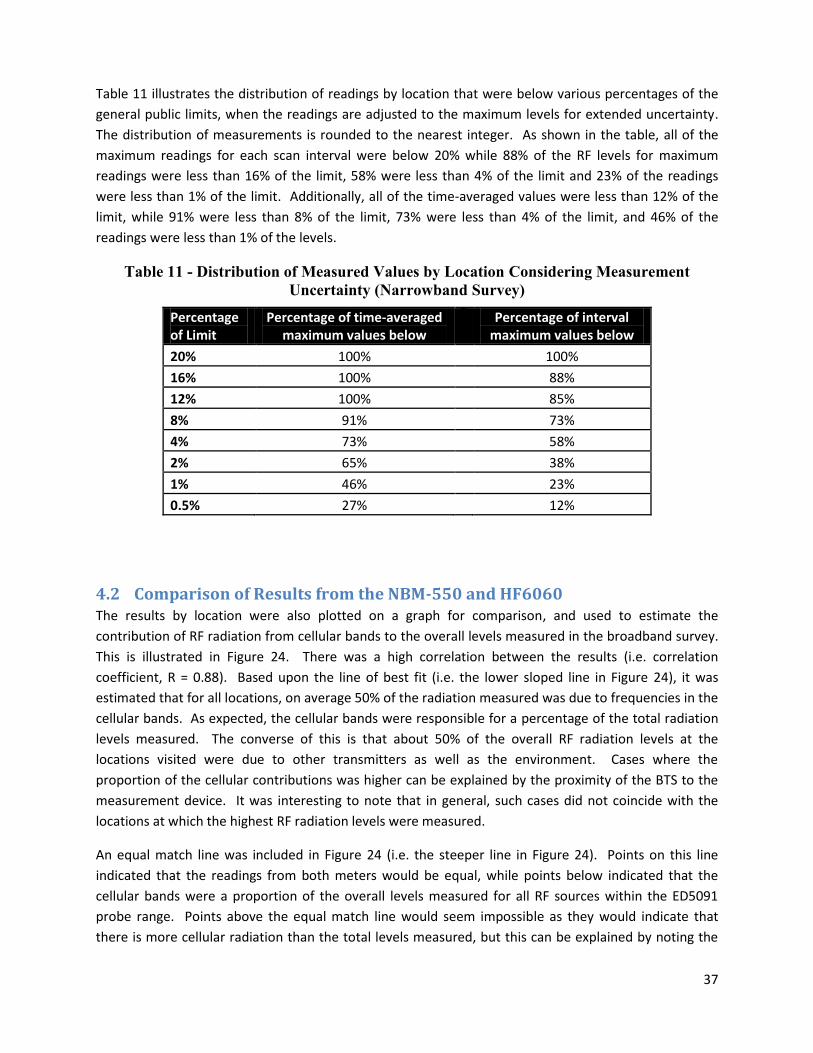
Table 11 illustrates the distribution of readings by location that were below various percentages of the
general public limits, when the readings are adjusted to the maximum levels for extended uncertainty.
The distribution of measurements is rounded to the nearest integer. As shown in the table, all of the
maximum readings for each scan interval were below 20% while 88% of the RF levels for maximum
readings were less than 16% of the limit, 58% were less than 4% of the limit and 23% of the readings
were less than 1% of the limit. Additionally, all of the time-averaged values were less than 12% of the
limit, while 91% were less than 8% of the limit, 73% were less than 4% of the limit, and 46% of the
readings were less than 1% of the levels.
Table 11 - Distribution of Measured Values by Location Considering Measurement
Uncertainty (Narrowband Survey)
Percentage of Limit
Percentage of time-averaged maximum values below
Percentage of interval maximum values below
20% 100% 100%
16% 100% 88%
12% 100% 85%
8% 91% 73%
4% 73% 58%
2% 65% 38%
1% 46% 23%
0.5% 27% 12%
4.2 Comparison of Results from the NBM-550 and HF6060 The results by location were also plotted on a graph for comparison, and used to estimate the
contribution of RF radiation from cellular bands to the overall levels measured in the broadband survey.
This is illustrated in Figure 24. There was a high correlation between the results (i.e. correlation
coefficient, R = 0.88). Based upon the line of best fit (i.e. the lower sloped line in Figure 24), it was
estimated that for all locations, on average 50% of the radiation measured was due to frequencies in the
cellular bands. As expected, the cellular bands were responsible for a percentage of the total radiation
levels measured. The converse of this is that about 50% of the overall RF radiation levels at the
locations visited were due to other transmitters as well as the environment. Cases where the
proportion of the cellular contributions was higher can be explained by the proximity of the BTS to the
measurement device. It was interesting to note that in general, such cases did not coincide with the
locations at which the highest RF radiation levels were measured.
An equal match line was included in Figure 24 (i.e. the steeper line in Figure 24). Points on this line
indicated that the readings from both meters would be equal, while points below indicated that the
cellular bands were a proportion of the overall levels measured for all RF sources within the ED5091
probe range. Points above the equal match line would seem impossible as they would indicate that
there is more cellular radiation than the total levels measured, but this can be explained by noting the
38
impact of measurement uncertainty. This was the case for 19% of the readings. Additionally,
considering that the narrowband and broadband measurements were taken at different points and at
different instants in time, small shifts in position and time can affect the measurement levels. However,
these variances were previously accounted for through measurement uncertainty.
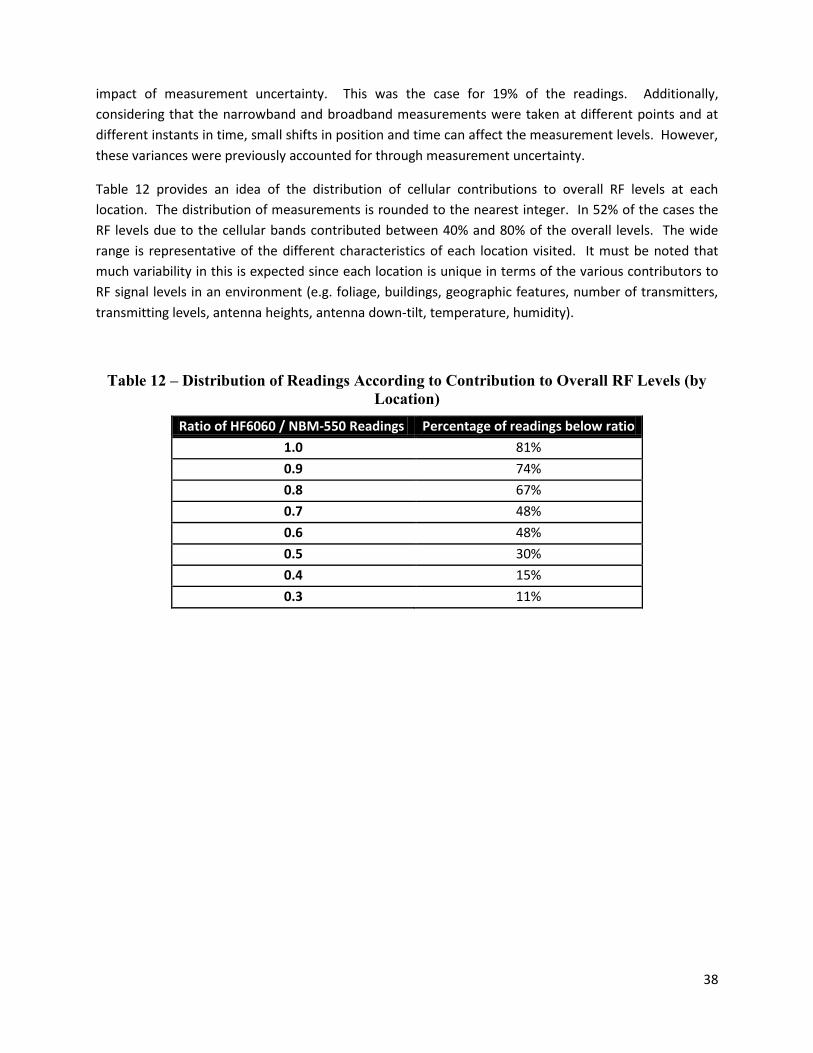
Table 12 provides an idea of the distribution of cellular contributions to overall RF levels at each
location. The distribution of measurements is rounded to the nearest integer. In 52% of the cases the
RF levels due to the cellular bands contributed between 40% and 80% of the overall levels. The wide
range is representative of the different characteristics of each location visited. It must be noted that
much variability in this is expected since each location is unique in terms of the various contributors to
RF signal levels in an environment (e.g. foliage, buildings, geographic features, number of transmitters,
transmitting levels, antenna heights, antenna down-tilt, temperature, humidity).
Table 12 – Distribution of Readings According to Contribution to Overall RF Levels (by
Location)
Ratio of HF6060 / NBM-550 Readings Percentage of readings below ratio
1.0 81%
0.9 74%
0.8 67%
0.7 48%
0.6 48%
0.5 30%
0.4 15%
0.3 11%

39
Figure 24 - Plot of Spectran Time-averaged Readings versus NBM Time-averaged Readings
0%
1%
2%
3%
4%
5%
6%
0% 1% 2% 3% 4% 5% 6%
Spec
tran
Tim
e-a
vera
ged
RF
Leve
ls (
% o
f G
ener
al P
ub
lic E
xpo
sure
Lim
its)
NBM Time-averaged RF Levels (% of General Public Exposure Limits)

40
5 Discussion
5.1 Measurement Variations While none of the levels measured exceeded the limits for general public exposure, there was
considerable variability in the levels observed over the four islands. This variability can be attributed to
several factors. These factors can be grouped as follows:
network-related
measurement-related and sampling-related
environment-related
Network-related factors include transmitting power, antenna height above ground level, antenna
orientation, and cell-site loading at the time of measurement. From site information provided by the
TRC there was not much variation in the maximum transmit powers as well as the antenna gains for the
antenna models used at sites. Additionally, using the spectrum scans it was observed that at the times
of measurement, the channels available at cell sites were not all occupied. This would also have some
bearing on the measurements, based upon the level of occupancy experienced at the time of
measurement. Occupancy levels would be statistical in nature and require detailed modelling of
network traffic. Considering the above, it is expected that the most prominent network-related factors
that impacted on measurements were the antenna heights above the ground relative to the height at
which readings were taken as well as the antenna orientation (i.e. down-tilt). In some cases the
measurement spots at a given location would depend upon accessibility of appropriate spots to set up
the equipment. However a general rule thumb would be that the further away from the transmitter an
individual is located, the lower would be their exposure to RF from cell sites.
This rule does have an additional consideration and should not be taken out of context, however. For
example, readings taken close to the bases of towers, specifically for high towers were very low. This
can be explained with reference to antenna orientation, as the steepness of the tilt angle would affect
the radiation level at a point away from the antenna. Consider the vertical antenna pattern in Figure 25.
The numbers on the circumference represent directions with respect to a vertical line at 00. The green
line represents the radiation pattern. The further from the centre of the circles the green line is, the
higher is the radiation in a particular direction. As shown, most of the radiation is directed horizontally
to the right (i.e. 900). The direction of maximum radiation can be altered by changing the antenna
orientation electrically or mechanically.
An important point to note is that while this direction of maximum radiation can be shifted to suit
coverage objectives, in most other directions the radiation is close to the centre of the graph and is thus
much lower. In fact, most of the radiation is directed between 800 and 1000, corresponding to a 200
beamwidth. For the remaining 3400 the levels are less than -10dB (i.e. 1/10th) of the maximum level at
900. At base station sites, the operator would like to maximise coverage and thus orients the antennas
to achieve this. However, as shown above, most antennas do not radiate equally in all directions, and
the radiation is directed away from the base of towers in order to cover larger areas. Thus radiation
levels at the base of towers, especially taller towers were lower than readings taken some distance

41
away. Typical antenna tilts lie within 70 of the vertical axis, indicating that antennas are never
intentionally directing their maximum radiation towards the ground.
Figure 25 - Vertical Radiation Pattern for a Typical Base Station Antenna (Source:
www.commscope.com)
Another factor affecting RF field strengths was the contribution of multiple transmitting sites to the RF
radiation levels at a particular location. Some locations were covered by RF from multiple sources, and
in these cases the overall levels were higher than some of the simpler single site locations evaluated. It
must be noted however, that in these cases the exposure to the general public was still well below the
limit. This is the overall exposure however, and care must be taken to decouple the contribution of cell
sites as opposed to other RF sources. At several sites, the levels were predominantly due to cellular
transmissions. However with reference to Figure 24 the trend is towards 50% of the overall levels in the
area being due to cellular. This implies that other sources such as broadcast signals contribute to the
overall levels measured.
One of the reasons for cellular percentages experienced may be the fact that measurements were
carried out at locations where cellular radiation would be maximum. If all the registered RF radiation
sources were taken into account when choosing measurement locations, cellular contribution may have
been significantly lower. Additionally, all readings were taken outdoors, and it is expected that
attenuation through walls would reduce readings experienced indoors due to external sources. Typically
2-3 dB of attenuation can be expected which means that the levels would be halved indoors due to the
walls. The overall indoor levels may however increase if there are sources inside such as wireless
Internet or phones. Typically these devices are certified for electromagnetic compatibility (EMC) and
electromagnetic interference (EMI), in which the device designs are evaluated in addition to their

42
transmitting powers, in order to restrict the amount of RF energy radiated. Nevertheless the
certification is based upon interoperability in RF environments, and as such their impact on overall RF
radiation levels must also be considered in assessing exposure risks to the general public.
Another factor noted at sites was that of cell sectors. Cell sites are usually divided into sectors. On the
BVI there were usually three sectors on cell towers. However there were also instances where there
were two sectors or one sector on site. The antennas used do not radiate equally in all directions at
once as is shown in Figure 26, for a horizontal antenna pattern. With reference to the pattern most of
the radiation lies between 3100 and 500 degrees, corresponding to about a 1000 beamwidth. The levels
are much lower in the remaining 2600. Thus in order to cover a full 3600 horizontally, multiple antennas
are required for coverage of all sectors. Examples of one, two, and three-sector installations are shown
in Figure 27.
Figure 26 - Horizontal Radiation Pattern for a Typical Base Station Antenna (Source:
www.commscope.com)
With reference to the horizontal pattern in Figure 20 it can be seen that readings should be taken in the
direction of maximum radiation to evaluate compliance. If readings are not taken in the direction of
maximum radiation the RF readings may be lower. Due to accessibility restrictions, or due to
obstructions in the direction of maximum radiation for some sectors the RF levels measured would vary.
However, considering the objective of this exercise, if the direction of maximum radiation is obstructed
or otherwise inaccessible (e.g. cliff edge) then the general public would also not be exposed to these
levels.
In many instances, especially in Tortola, the area is extremely hilly, posing numerous challenges for
achieving service coverage. Evaluation of cell sites at close range was impractical for cases where the

43
cell site was on a hill and isolated from the general public. As explained before, generally there would
be lower RF readings closer to the base, especially if the antennas on-site were oriented towards lower
surrounding areas. In such cases it was more practical to measure the levels in the lower areas to which
the general public would be exposed. At some sites due to the geography, transmitters were fairly close
to the general public. Examples of these were areas where the undulating land placed buildings closer
to the height at which antennas were mounted. In such instances although the RF readings were below
the limits, they were among the higher levels observed in the study. This is in part due to the
orientation as well as the proximity of the antennas. In some cases antennas were mounted on houses,
apparently by consent of the owners of the structures. An example of this is provided in Figure 27. In
such cases the antennas were oriented such that their radiation would propagate outward from the
structure, and thus the levels observed were less in directions opposite to the antenna orientation.
Figure 27 - Examples of Sector-based Installations at Cell Sites
Instrument-inherent and sampling uncertainty were addressed previously. However it is important to
note that when accounting for this factor, RF readings were well below the limit for the general public.
Environmental factors would include geographical features, temperature, humidity, presence of man-
made structures, reflective surfaces (water and metallic structures), and foliage. As discussed above and
in site selection, this can also impact upon readings as well as where and how samples were taken.

44
5.2 Comparison to Other Studies There are several studies available online that can be accessed for comparison purposes. The general
outcomes of this study were compared to two such studies done in Jamaica and Trinidad as well as one
in Canada. The first report was a RF radiation measurement exercise carried out by the Spectrum
Management Authority (SMA) in Jamaica between December 2007 and April 2008 (SMA 2008). The
levels reported were less than those reported for some sites in the BVI study. However, in many of the
cases, the levels reported were comparable, ranging from 0.024% to 5% of the ICNIRP limits. The
measurement team indicated similar reasons to those discussed above as being responsible for the
measurement spread observed. In this study, however direct comparisons should also take into account
the different methodologies employed. For example the averaging procedures used were different, as
were the distances from transmitters at which readings were taken. Additionally the geography in
Jamaica is very different from that of the BVI, and consequently the cellular network as well as the other
possible RF sources would create a different RF environment.
The outcomes of the BVI measurement exercise were also compared to the outcomes of the second set
of data mentioned previously in which measurements were taken in Trinidad and Tobago (TATT, 2008).
According to the report, readings at the sites ranged from 1/17th to 1/20000th times (i.e. 0.06% to
0.005% of) the ICNIRP limits. The distances at which these readings were recorded were also stated.
The methodology used was not indicated in the report. However, upon liaising with officials from the
Telecommunications Authority of Trinidad and Tobago, TATT, the methodology used was that suggested
by the manufacturer for the broadband probe used. Incidentally the broadband meter and probe used
were also manufactured by Narda. The measurement technique used was based upon both time and
spatial averaging at each site. The time-averaging aspect of the technique used was also similar to the
panning approach outlined in this study. However it was not based upon the 6-minute averaging
technique. Thus despite the low values observed, it must be noted that the methodologies employed
were different, and may lead to different results.
In the previous two reports the measurements were not subjected to uncertainty analysis. Since this
was recommended in (ECC 2007) and was a part of this study, it was important to review other studies
in which this was done. There were no such studies in the region that were accessible. However,
Industry Canada presented such a study in which RF levels were recorded around FM stations and
uncertainty analysis was carried out (IC 2008). Although the transmissions were for broadcast
technology and not cellular transmissions, the levels observed ranged from less than 1% to over 18% of
the limits for public exposure. When measurement uncertainty was considered the maximum exposure
levels ranged from less than 1% to over 40% of the limits. The impact of extended uncertainty was
similar to that in the BVI case. It must be noted however, that the absolute levels noted were compared
to Safety Code 6 (SC6) limits, and not ICNIRP limits. For the frequencies considered (98.5MHz,
103.1MHz, and 1073MHz) the ICNIRP limits are equivalent to those for SC6 (0.2 mWcm-2) and thus the
conclusions would be the same if the levels were compared to ICNIRP levels. For cellular frequencies,
however, it must be noted that ICNIRP limits are more restrictive than the SC6 limits at corresponding
frequencies, and thus would give higher percentage levels for cellular readings referenced to ICNIRP
limits as compared to if referenced to SC6 limits.

45
This also demonstrated that of the recommended exposure limits adopted by various administrations in
the Western Hemisphere, ICNIRP has imposed lower limits than the other main recommendations. A
study done by TATT addresses this issue further (TATT 2006). The study was used to propose limits for
Trinidad and Tobago. The recommendations coming out of the investigation were that ICNIRP limits
would be used for occupational and general public exposure limits for transmitting stations. Tables 13
and 14 illustrate a comparison of the main limits used in the Western Hemisphere (TATT 2006).
Frequency
range in
MHz
CANADA
SAFETY CODE 6
(99-EHD-237)
U.S. FCC MPE
limits—47 CFR §
1.1310
ICNIRP Reference
Levels 1998 for Time-
varying Electric and
Magnetic fields
IEEE C95.1-
2005 Electric
and Magnetic
fields
10 to 300 0.2 0.2
10 to 400 0.2 0.2
300 to 1500 f/1500 (0.2 to 1
mW/cm2
)
f/1500 (0.2 to 1
mW/cm2
)
400 to 2000 f/2000 (0.2 to 1
mW/cm2
)
f/2000 (0.2 to 1
mW/cm2
)
2000 to
300000
1
2000 to
100000
1
1500 to
100000
1 1
Table 13 - Comparison of Public MPE Limits (Source: TATT, 2006)
Frequency
Allocation
MHz
Service Maximum
Permissible
Exposure
(mW/cm2
) FCC
Occupational
Maximum
Permissible
Exposure
(mW/cm2
)
FCC
Public
Maximum
Permissible
Exposure
(mW/cm2
)
ICNIRP
Occupational
Maximum
Permissible
Exposure
(mW/cm2
)
ICNIRP
Public
54 to 216 Broadcasting 1.0 0.2 1.0 0.2
88 to 108 Broadcasting 1.0 0.2 1.0 0.2
470 to 806 Broadcasting 1.57 to 2.69
(f/300)
0.31 to 0.54
(f/1500)
1.18 to 2.02
(f/400)
0.24 to 0.40
(f/2000)
825 to 849 Cellular mobile 2.75 to 2.83
(f/300)
0.55 to 0.57
(f/1500)
2.06 to 2.12
(f/400)
0.41 to 0.42
(f/2000)
869 to 894 Cellular mobile 2.90 to 2.98
(f/300)
0.58 to 0.60
(f/1500)
2.17 to 2.24
(f/400)
0.43 to 0.45
(f/2000)
1740 to 1760 Cellular mobile 5 1 4.35 to 4.40 0.87 to 0.88
1835 to 1855 Cellular mobile 5 1 4.59 to 4.64 0.92 to 0.93
1880 to 1910 Cellular mobile 5 1 4.70 to 4.78 0.94 to 0.96
1960 to 1990 Cellular mobile 5 1 4.90 to 4.98 0.98 to 1.0
Table 14 - Broadcast and Cellular Frequency Allocations and MPE Limits (Source: TATT,
2006)

46
6 Recommendations During the week that measurements were conducted, the UWI team had the tremendous fortune to
also interact with the BVI public, as well as TRC representatives including Tomas Lamanauskas and Mr.
Gregory Nelson, and Mr. Paolo Vecchia from ICNIRP. This provided further insight into the challenges
faced with respect to RF radiation in the BVI. Contemplating these challenges in addition to the
outcomes of the measurement exercise, several recommendations were made. These are briefly
discussed following.
It is recommended that through public consultation, maximum acceptable limits for occupational
exposure and general public exposure be established in the BVI. In the Western Hemisphere, many
administrations have adopted based their limits on the ICNIRP guidelines (ICNIRP 1998) based upon
their conservative approach, compared to other recommendations. It is recommended that these be
used as a starting point for the process. A similar approach to that used in (TATT 2006) to establish
guidelines for exposure in Trinidad and Tobago can be used for this process.
The introduction of set national limits for exposure that are based upon public consultation would
additionally require that measurement methodologies for assessing the RF radiation levels at a
particular location in the BVI be adjusted accordingly. The method used in this report is recommended,
as it takes into account the considerations outlined in (ECC 2007). This would also allow for comparison
between the results of this exercise, and those of subsequent measurements conducted. A similar
approach was used in the BTS assessments in Jamaica, that were outlined in (SMA 2008). Additionally, it
is recommended that the exercise should be expanded to include all transmitting stations (i.e. both BTS
and other transmitting stations), and that this cycle should be repeated based upon the capacity to
conduct these measurements. Given that the current measurement exercise depicts a snapshot in time,
data collected through subsequent measurements would be invaluable in further characterisation of the
RF environments in the BVI.
In addition this data can be used to evaluate the impact of any new sites that may be activated in the
future. These new sites may be enhancements to the existing services or provide new services. For
example, at the locations visited, through spectrum scans no 3G services were noted during this
measurement exercise. In the event that such services are introduced, the existing data on RF levels can
be used to estimate the impact of various configurations on the RF levels at given locations. This can be
done through predictive models and verified through measurement. Based upon site evaluations,
appropriate actions can then be recommended in any given situation.
It is also recommended that a detailed spectrum audit be carried out across the BVI. Based upon the
outcomes of this measurement exercise, it was seen that on average across all locations visited
approximately 50% of the total exposure was due to sources that operate outside of the cellular bands.
Inclusion of dominant technologies other than cellular technologies can be used to also assess the main
contributors to RF levels at given locations on the BVI. This would be similar to the approach used in (IC
2008), where the main contributors are noted based upon the percentage contributions at a given

47
location. Periodic spectrum audits would also empower the TRC with additional information
characterising the BVI RF environment, which would allow them to have further information that can be
used when making decisions in the interest of the BVI public. In line with this, existing measurement
and monitoring activities by the TRC should also incorporate spectrum checks to assess spectrum
utilisation as well as RF radiation levels at sites visited. Such measurements should be made accessible
to the public, in conjunction additional data such as the measurement methods used.
When assessing sites based upon complaints, it is also recommended that both indoor and outdoor
assessments be conducted, with appropriate considerations for logistics and resources for such an
exercise. Based upon the objectives of this measurement exercise, outdoor assessments were
conducted. However, in the interest of the BVI public, a detailed assessment of complaints should
account for all possible as is reasonably practical. It is suggested that this would allow more information
can be provided to the person who made the complaint. Provision of a facility whereby the BVI public
can be informed about all significant indoor and outdoor sources that may contribute to overall RF levels
allows the public, the TRC and other parties to gain further insight into the RF environments to which
the inhabitants of the BVI are exposed to.
Additionally, in reporting measurements, reports should additionally include adjustments for
measurement uncertainties. While some may argue that this potentially overestimates RF radiation
levels, such a conservative approach facilitates a prudent approach in risk assessments (IC 2008).
Although no regional studies were found in which measurements and methodologies accounted for this,
it was a key component of data analysis in this report, and is a key recommendation in the
measurement guidelines outlined in (ECC 2007). If extended uncertainty is used, this would not only
indicate the measurements taken but also provide a range for the readings at a 95% confidence level.
Additionally, assessments which include measurement uncertainties should be based upon time-
averaged and spatially-averaged readings in characterisation of RF radiation levels at a given site. While
this provides theoretical limits, it also provides addition rigour in the evaluation process.
7 Conclusion Based upon the broadband survey, RF levels were all less than 8% of the limits for general public
exposure. The highest maximum RF levels were measured in Tortola, followed by Virgin Gorda, then
Jost Van Dyke then Anegada. Based upon the narrowband survey, the total RF levels due to cellular
bands were all less than 6% of the limits for general public exposure. The highest maximum RF levels
were measured in Tortola, followed by Virgin Gorda, then Anegada then Jost Van Dyke. When adjusted
to include extended uncertainty in the readings from the broadband survey, no RF levels exceeded 35%
of the exposure limit for the general public. The relative ranking of levels on at each location and on
each island remained the same. Similarly for the narrowband survey, when extended uncertainty is
considered, a similar trend is observed. No readings exceeded 20% of the limits when the upper bound
due to extended uncertainty is considered. In summary, with conservative limits that take account of
measurement uncertainties the limits were all below the ICNIRP limits for general public exposure.

48
Through comparison of the results of the two surveys, it was estimated that for all locations, on average
50% of the radiation measured was due to frequencies in the cellular bands. In 52% of the cases the RF
levels due to the cellular bands contributed between 40% and 80% of the overall levels. These levels
were also expected to be less if all main transmitting stations are considered. The most prominent
network-related factors that impacted on measurements were the antenna heights above the ground
relative to the height at which readings were taken as well as the antenna orientation (i.e. down-tilt).
Generally, reported transmitter powers were typical of BTS installations while RF radiation strengths due
to a transmitter decreased the further away from the transmitter an individual is located.

49
8 References ECC, Electronic Communications Committee. “Revised Recommendation for Measuring Non-Ionising
Electromagnetic Radiation (9kHz – 300GHz).” 2007.
http://www.erodocdb.dk/Docs/doc98/official/pdf/REC0204.PDF (accessed May 05, 2010).
IC, Industry Canada. “Safety Code 6 (SC6) Measurement on Triangle Mountain in Colwood, British
Columbia.” December 2008. http://www.ic.gc.ca/eic/site/smt-gst.nsf/vwapj/SC6-TriangleMountain-
dec08.pdf/$FILE/SC6-TriangleMountain-dec08.pdf (accessed May 06, 2010).
ICNIRP, International Commission on Non-Ionising Radiation Protection. “Guidelines for Limiting
Exposure to Time-Varying Electric, Magnetic, and Electromagnetic Fields (Up to 300GHz).” 1998.
http://www.icnirp.de/documents/emfgdl.pdf (accessed January 28, 2010).
Narda Safety Test Solutions. “Accounting for measurement uncertainty in the SRM-3000.” Narda Safety
Test Solutions. 2007. http://www.narda-
sts.com/pdf/fachartikel/AN_HF_1004_E_Messunsicherheit_2007_07_04.pdf (accessed February 07,
2010).
Nordic Innovation Centre. “TR 604 - Uncertainty from Sampling.” 2007.
http://www.nordicinnovation.net/nordtestfiler/tr604.pdf (accessed February 03, 2010).
SMA, Spectrum Management Authority. “Radio Frequency Radiation (RFR) Measurement Report.” April
2008. http://www.nepa.gov.jm/Radiation_MEASUREMENT_phase_1_final.pdf (accessed March 5,
2010).
TATT, Telecommunications Authority of Trinidad and Tobago. “Proposed Maximum Permissible
Exposure Limits for Radiofrequency Radiation in Trinidad and Tobago.” 6 October 2006. www.tatt.org.tt
(accessed May 2, 2010).
—. “Radio Frequency Test Results, November 2008.” November 2008. www.tatt.org.tt (accessed April 7,
2010).

50
9 Appendices
Table 15 - Summary of Broadband Survey Results by Measurement (Maximum Readings
with Measurement Uncertainty Limits) (Units - % of GP Limits)
Measurement Index
Lower Limit for Interval Maximum
Interval Maximum Upper Limit for Interval Maximum
1 0.1649 0.6745 2.7587
2 0.1291 0.5280 2.1595
3 0.1792 0.7330 2.9980
4 0.1720 0.7035 2.8773
5 0.1076 0.4400 1.7996
6 0.1004 0.4105 1.6789
7 0.1505 0.6155 2.5174
8 0.1219 0.4985 2.0389
9 0.6809 2.7850 11.3907
10 0.7939 3.2470 13.2802
11 0.9641 3.9430 16.1269
12 0.1864 0.7625 3.1186
13 1.0068 4.1180 16.8426
14 1.5623 6.3900 26.1351
15 0.1864 0.7625 3.1186
16 0.1505 0.6155 2.5174
17 0.6300 2.5765 10.5379
18 0.0716 0.2930 1.1984
19 0.1076 0.4400 1.7996
20 0.1434 0.5865 2.3988
21 0.0861 0.3520 1.4397
22 0.1076 0.4400 1.7996
23 0.1147 0.4690 1.9182
24 0.1362 0.5570 2.2781
25 0.1649 0.6745 2.7587
26 0.1577 0.6450 2.6381
27 0.1362 0.5570 2.2781
28 0.3784 1.5475 6.3293
29 0.1147 0.4690 1.9182
30 1.0286 4.2070 17.2066
31 1.0806 4.4195 18.0758
32 0.1720 0.7035 2.8773
33 1.4914 6.1000 24.9490
34 0.6599 2.6990 11.0389

51
Measurement Index
Lower Limit for Interval Maximum
Interval Maximum Upper Limit for Interval Maximum
35 0.7494 3.0650 12.5359
36 0.9312 3.8085 15.5768
37 0.7533 3.0810 12.6013
38 0.0573 0.2345 0.9591
39 0.2570 1.0510 4.2986
40 0.2007 0.8210 3.3579
41 0.1649 0.6745 2.7587
42 0.1577 0.6450 2.6381
43 0.1362 0.5570 2.2781
44 0.1147 0.4690 1.9182
45 0.5335 2.1820 8.9244
46 0.1219 0.4985 2.0389
47 0.2359 0.9650 3.9469
48 0.1076 0.4400 1.7996
49 0.1219 0.4985 2.0389
50 0.0358 0.1465 0.5992
51 0.5389 2.2040 9.0144
52 0.1792 0.7330 2.9980
53 0.1864 0.7625 3.1186
54 0.1291 0.5280 2.1595
55 0.1577 0.6450 2.6381
56 0.2007 0.8210 3.3579
57 0.1219 0.4985 2.0389
58 0.1291 0.5280 2.1595
59 0.2132 0.8720 3.5665
60 0.1219 0.4985 2.0389
61 0.2007 0.8210 3.3579
62 0.1792 0.7330 2.9980
63 0.0716 0.2930 1.1984
64 0.7564 3.0935 12.6524
65 0.1434 0.5865 2.3988
66 0.8644 3.5355 14.4602
67 0.8644 3.5355 14.4602
68 0.1720 0.7035 2.8773
69 0.2222 0.9090 3.7178
70 1.6125 6.5950 26.9736
71 1.3680 5.5950 22.8836
72 1.1649 4.7645 19.4868
73 1.9523 7.9850 32.6587

52
Measurement Index
Lower Limit for Interval Maximum
Interval Maximum Upper Limit for Interval Maximum
74 1.2159 4.9730 20.3396
75 1.1946 4.8860 19.9837
76 1.0506 4.2970 17.5747
77 1.3667 5.5900 22.8631
78 1.9169 7.8400 32.0656
Table 16 - Summary of Broadband Survey Results by Measurement (Average and
Standard Deviation of Sample Maximum with Measurement Uncertainty Limits) (Units -
% of GP Limits)
Measurement Index
Lower Limit for 6-minute Average of
Maximum
6-minute Average of Maximum
Upper Limit for 6-minute Average
of Maximum
Standard Deviation of Maximum
1 0.0705 0.2885 1.1798 0.1280
2 0.0299 0.1225 0.5010 0.1140
3 0.0735 0.3005 1.2291 0.1239
4 0.0397 0.1624 0.6642 0.1339
5 0.0336 0.1375 0.5623 0.1109
6 0.0324 0.1324 0.5416 0.1098
7 0.0430 0.1761 0.7201 0.1480
8 0.0161 0.0659 0.2694 0.0936
9 0.5371 2.1969 8.9854 0.2338
10 0.2289 0.9360 3.8284 1.1805
11 0.3075 1.2575 5.1431 1.3503
12 0.1176 0.4810 1.9674 0.1254
13 0.2694 1.1017 4.5058 1.2551
14 1.1069 4.5272 18.5163 0.9820
15 0.1064 0.4352 1.7801 0.1143
16 0.0712 0.2911 1.1905 0.1264
17 0.3717 1.5201 6.2174 0.4203
18 0.0043 0.0174 0.0713 0.0464
19 0.0222 0.0909 0.3718 0.1046
20 0.0307 0.1255 0.5134 0.1237
21 0.0094 0.0383 0.1566 0.0665
22 0.0145 0.0593 0.2425 0.0860
23 0.0104 0.0425 0.1739 0.0814
24 0.0399 0.1631 0.6672 0.1349
25 0.0599 0.2450 1.0019 0.1328
26 0.0389 0.1591 0.6505 0.1480
27 0.0100 0.0409 0.1672 0.0844
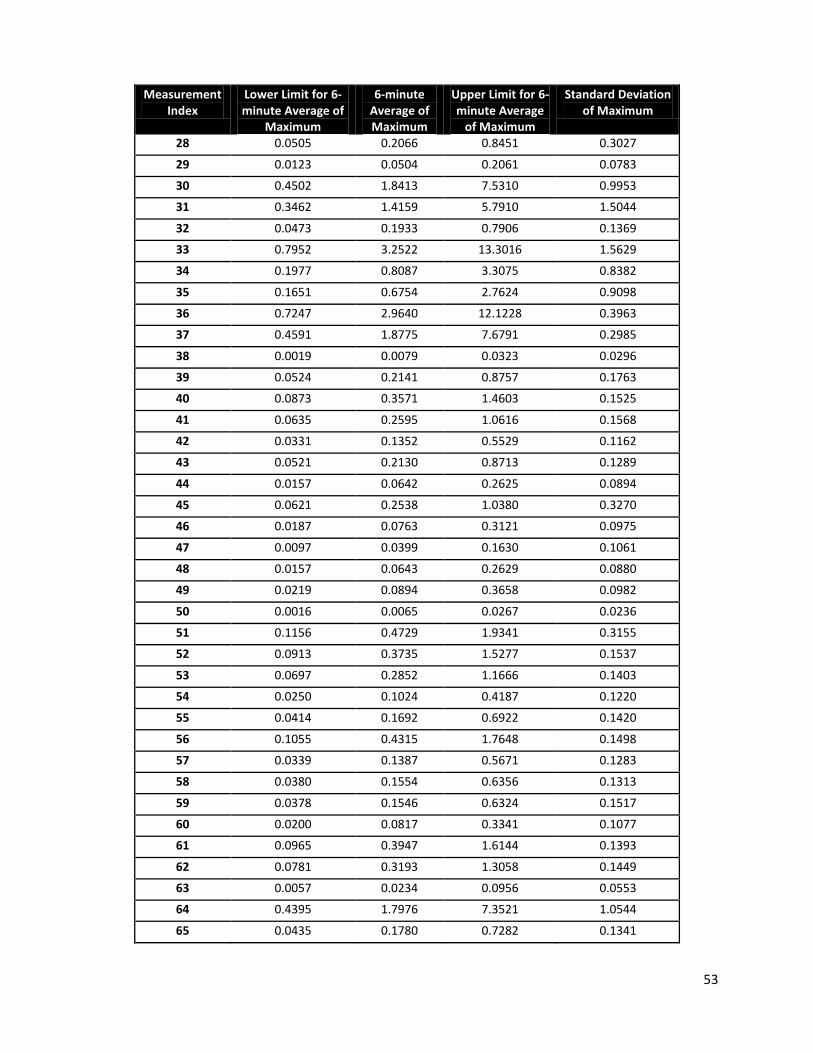
53
Measurement Index
Lower Limit for 6-minute Average of
Maximum
6-minute Average of Maximum
Upper Limit for 6-minute Average
of Maximum
Standard Deviation of Maximum
28 0.0505 0.2066 0.8451 0.3027
29 0.0123 0.0504 0.2061 0.0783
30 0.4502 1.8413 7.5310 0.9953
31 0.3462 1.4159 5.7910 1.5044
32 0.0473 0.1933 0.7906 0.1369
33 0.7952 3.2522 13.3016 1.5629
34 0.1977 0.8087 3.3075 0.8382
35 0.1651 0.6754 2.7624 0.9098
36 0.7247 2.9640 12.1228 0.3963
37 0.4591 1.8775 7.6791 0.2985
38 0.0019 0.0079 0.0323 0.0296
39 0.0524 0.2141 0.8757 0.1763
40 0.0873 0.3571 1.4603 0.1525
41 0.0635 0.2595 1.0616 0.1568
42 0.0331 0.1352 0.5529 0.1162
43 0.0521 0.2130 0.8713 0.1289
44 0.0157 0.0642 0.2625 0.0894
45 0.0621 0.2538 1.0380 0.3270
46 0.0187 0.0763 0.3121 0.0975
47 0.0097 0.0399 0.1630 0.1061
48 0.0157 0.0643 0.2629 0.0880
49 0.0219 0.0894 0.3658 0.0982
50 0.0016 0.0065 0.0267 0.0236
51 0.1156 0.4729 1.9341 0.3155
52 0.0913 0.3735 1.5277 0.1537
53 0.0697 0.2852 1.1666 0.1403
54 0.0250 0.1024 0.4187 0.1220
55 0.0414 0.1692 0.6922 0.1420
56 0.1055 0.4315 1.7648 0.1498
57 0.0339 0.1387 0.5671 0.1283
58 0.0380 0.1554 0.6356 0.1313
59 0.0378 0.1546 0.6324 0.1517
60 0.0200 0.0817 0.3341 0.1077
61 0.0965 0.3947 1.6144 0.1393
62 0.0781 0.3193 1.3058 0.1449
63 0.0057 0.0234 0.0956 0.0553
64 0.4395 1.7976 7.3521 1.0544
65 0.0435 0.1780 0.7282 0.1341

54
Measurement Index
Lower Limit for 6-minute Average of
Maximum
6-minute Average of Maximum
Upper Limit for 6-minute Average
of Maximum
Standard Deviation of Maximum
66 0.6405 2.6197 10.7144 0.3442
67 0.6405 2.6197 10.7144 0.3442
68 0.0841 0.3441 1.4074 0.1513
69 0.0552 0.2258 0.9236 0.1707
70 0.9844 4.0263 16.4675 2.1118
71 1.1388 4.6576 19.0497 0.3102
72 0.7131 2.9166 11.9291 0.7511
73 1.3775 5.6342 23.0437 1.0649
74 0.9558 3.9091 15.9882 0.3296
75 0.9871 4.0373 16.5125 0.2412
76 0.8636 3.5320 14.4459 0.3353
77 1.1122 4.5488 18.6047 0.4970
78 1.6483 6.7417 27.5734 0.4961
Table 17 - Summary of Broadband Survey Results by Location (Maximum Readings with
Measurement Uncertainty Limits) (Units - % of GP Limits)
Location Location Name Lower Limit for Interval Maximum
Interval Maximum
Upper Limit for Interval Maximum
1 Virgin Gorda - Spanish Town - Site 1 0.1792 0.7330 2.9980
2 Virgin Gorda - Spanish Town - Site 2 0.1505 0.6155 2.5174
3 Virgin Gorda – Stadium 0.9641 3.9430 16.1269
4 Virgin Gorda - The Baths 0.1864 0.7625 3.1186
5 Virgin Gorda - Katiche Point 1.0068 4.1180 16.8426
6 Virgin Gorda - Maho Bay 1.5623 6.3900 26.1351
7 Virgin Gorda - North Sound 0.1864 0.7625 3.1186
8 Tortola - Palestina / St. George's Secondary School 0.6300 2.5765 10.5379
9 Tortola - Road Town 1.0806 4.4195 18.0758
10 Tortola - Jean Hill / Fish Bay 1.4914 6.1000 24.9490
11 Tortola - Hope Hill 0.7494 3.0650 12.5359
12 Tortola - Huntum's Ghut 0.9312 3.8085 15.5768
13 Annegada - Cow Wreck 0.2570 1.0510 4.2986
14 Annegada - Settlement - Claudia Creque 0.5335 2.1820 8.9244
15 Annegada - Settlement - Fire Station 0.2359 0.9650 3.9469
16 Tortola - West End Ferry 0.0358 0.1465 0.5992
17 Jost Van Dyke - Site 1 0.5389 2.2040 9.0144
18 Jost Van Dyke - Site 2 0.1577 0.6450 2.6381
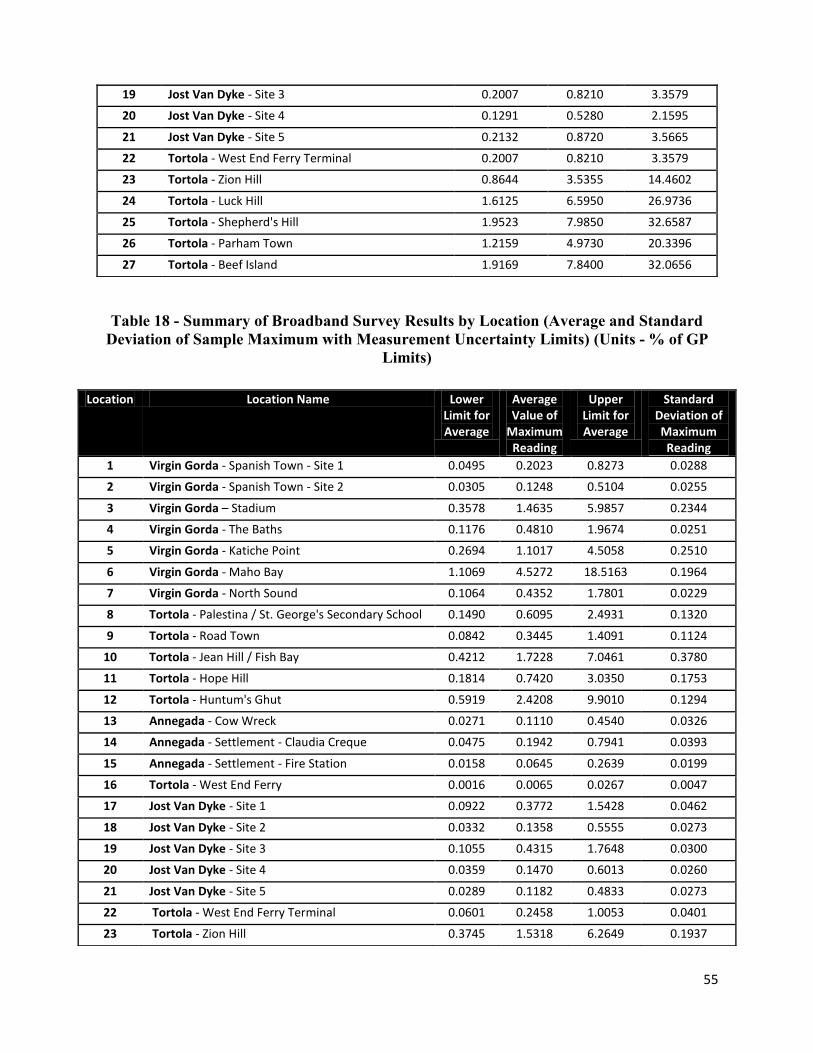
55
Table 18 - Summary of Broadband Survey Results by Location (Average and Standard
Deviation of Sample Maximum with Measurement Uncertainty Limits) (Units - % of GP
Limits)
19 Jost Van Dyke - Site 3 0.2007 0.8210 3.3579
20 Jost Van Dyke - Site 4 0.1291 0.5280 2.1595
21 Jost Van Dyke - Site 5 0.2132 0.8720 3.5665
22 Tortola - West End Ferry Terminal 0.2007 0.8210 3.3579
23 Tortola - Zion Hill 0.8644 3.5355 14.4602
24 Tortola - Luck Hill 1.6125 6.5950 26.9736
25 Tortola - Shepherd's Hill 1.9523 7.9850 32.6587
26 Tortola - Parham Town 1.2159 4.9730 20.3396
27 Tortola - Beef Island 1.9169 7.8400 32.0656
Location Location Name Lower Limit for Average
Average Value of
Maximum Reading
Upper Limit for Average
Standard Deviation of Maximum Reading
1 Virgin Gorda - Spanish Town - Site 1 0.0495 0.2023 0.8273 0.0288
2 Virgin Gorda - Spanish Town - Site 2 0.0305 0.1248 0.5104 0.0255
3 Virgin Gorda – Stadium 0.3578 1.4635 5.9857 0.2344
4 Virgin Gorda - The Baths 0.1176 0.4810 1.9674 0.0251
5 Virgin Gorda - Katiche Point 0.2694 1.1017 4.5058 0.2510
6 Virgin Gorda - Maho Bay 1.1069 4.5272 18.5163 0.1964
7 Virgin Gorda - North Sound 0.1064 0.4352 1.7801 0.0229
8 Tortola - Palestina / St. George's Secondary School 0.1490 0.6095 2.4931 0.1320
9 Tortola - Road Town 0.0842 0.3445 1.4091 0.1124
10 Tortola - Jean Hill / Fish Bay 0.4212 1.7228 7.0461 0.3780
11 Tortola - Hope Hill 0.1814 0.7420 3.0350 0.1753
12 Tortola - Huntum's Ghut 0.5919 2.4208 9.9010 0.1294
13 Annegada - Cow Wreck 0.0271 0.1110 0.4540 0.0326
14 Annegada - Settlement - Claudia Creque 0.0475 0.1942 0.7941 0.0393
15 Annegada - Settlement - Fire Station 0.0158 0.0645 0.2639 0.0199
16 Tortola - West End Ferry 0.0016 0.0065 0.0267 0.0047
17 Jost Van Dyke - Site 1 0.0922 0.3772 1.5428 0.0462
18 Jost Van Dyke - Site 2 0.0332 0.1358 0.5555 0.0273
19 Jost Van Dyke - Site 3 0.1055 0.4315 1.7648 0.0300
20 Jost Van Dyke - Site 4 0.0359 0.1470 0.6013 0.0260
21 Jost Van Dyke - Site 5 0.0289 0.1182 0.4833 0.0273
22 Tortola - West End Ferry Terminal 0.0601 0.2458 1.0053 0.0401
23 Tortola - Zion Hill 0.3745 1.5318 6.2649 0.1937

56
Table 19 - Summary of Narrowband Survey Results by Location (Maximum Readings with
Measurement Uncertainty Limits) (Units - % of GP Limits)
24 Tortola - Luck Hill 0.6027 2.4650 10.0819 0.3853
25 Tortola - Shepherd's Hill 1.3775 5.6342 23.0437 0.2130
26 Tortola - Parham Town 0.9355 3.8261 15.6488 0.0746
27 Tortola - Beef Island 1.3803 5.6452 23.0890 0.2408
Location Location Name Lower Limit for Interval Maximum
Interval Maximum
Upper Limit for Interval Maximum
1 Virgin Gorda - Spanish Town - Site 1 0.1021 0.3368 1.1116
2 Virgin Gorda - Spanish Town - Site 2 0.1031 0.3403 1.1231
3 Virgin Gorda – Stadium 0.2724 0.8989 2.9664
4 Virgin Gorda - The Baths 0.1238 0.4084 1.3477
5 Virgin Gorda - Katiche Point 0.5775 1.9059 6.2894
6 Virgin Gorda - Maho Bay 1.6501 5.4454 17.9698
7 Virgin Gorda - North Sound 0.1856 0.6126 2.0216
8 Tortola - Palestina / St. George's Secondary School 0.0996 0.3286 1.0844
9 Tortola - Road Town 0.5542 1.8287 6.0347
10 Tortola - Jean Hill / Fish Bay 1.6625 5.4861 18.1042
11 Tortola - Hope Hill 0.4987 1.6458 5.4312
12 Tortola - Huntum's Ghut 0.9958 3.2861 10.8441
13 Annegada - Cow Wreck 0.3089 1.0194 3.3640
14 Annegada - Settlement - Claudia Creque 0.2306 0.7611 2.5116
15 Annegada - Settlement - Fire Station 0.0338 0.1114 0.3676
16 Tortola - West End Ferry --- --- ---
17 Jost Van Dyke - Site 1 0.2461 0.8122 2.6802
18 Jost Van Dyke - Site 2 0.0648 0.2137 0.7053
19 Jost Van Dyke - Site 3 0.0907 0.2992 0.9874
20 Jost Van Dyke - Site 4 0.0389 0.1282 0.4232
21 Jost Van Dyke - Site 5 0.0453 0.1496 0.4937
22 Tortola - West End Ferry Terminal 0.0544 0.1795 0.5925
23 Tortola - Zion Hill 0.4238 1.3986 4.6154
24 Tortola - Luck Hill 0.8627 2.8470 9.3951
25 Tortola - Shepherd's Hill 1.0503 3.4659 11.4376
26 Tortola - Parham Town 1.2253 4.0436 13.3439
27 Tortola - Beef Island 1.8114 5.9775 19.7259
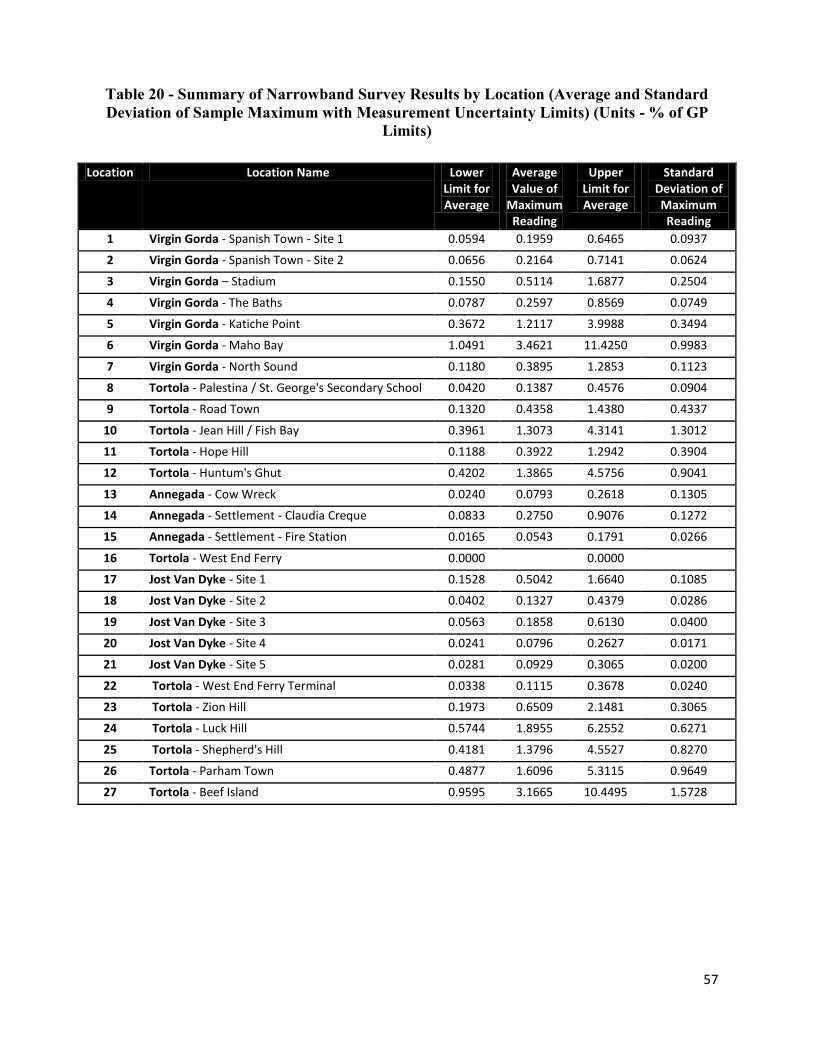
57
Table 20 - Summary of Narrowband Survey Results by Location (Average and Standard
Deviation of Sample Maximum with Measurement Uncertainty Limits) (Units - % of GP
Limits)
Location Location Name Lower Limit for Average
Average Value of
Maximum Reading
Upper Limit for Average
Standard Deviation of Maximum Reading
1 Virgin Gorda - Spanish Town - Site 1 0.0594 0.1959 0.6465 0.0937
2 Virgin Gorda - Spanish Town - Site 2 0.0656 0.2164 0.7141 0.0624
3 Virgin Gorda – Stadium 0.1550 0.5114 1.6877 0.2504
4 Virgin Gorda - The Baths 0.0787 0.2597 0.8569 0.0749
5 Virgin Gorda - Katiche Point 0.3672 1.2117 3.9988 0.3494
6 Virgin Gorda - Maho Bay 1.0491 3.4621 11.4250 0.9983
7 Virgin Gorda - North Sound 0.1180 0.3895 1.2853 0.1123
8 Tortola - Palestina / St. George's Secondary School 0.0420 0.1387 0.4576 0.0904
9 Tortola - Road Town 0.1320 0.4358 1.4380 0.4337
10 Tortola - Jean Hill / Fish Bay 0.3961 1.3073 4.3141 1.3012
11 Tortola - Hope Hill 0.1188 0.3922 1.2942 0.3904
12 Tortola - Huntum's Ghut 0.4202 1.3865 4.5756 0.9041
13 Annegada - Cow Wreck 0.0240 0.0793 0.2618 0.1305
14 Annegada - Settlement - Claudia Creque 0.0833 0.2750 0.9076 0.1272
15 Annegada - Settlement - Fire Station 0.0165 0.0543 0.1791 0.0266
16 Tortola - West End Ferry 0.0000 0.0000
17 Jost Van Dyke - Site 1 0.1528 0.5042 1.6640 0.1085
18 Jost Van Dyke - Site 2 0.0402 0.1327 0.4379 0.0286
19 Jost Van Dyke - Site 3 0.0563 0.1858 0.6130 0.0400
20 Jost Van Dyke - Site 4 0.0241 0.0796 0.2627 0.0171
21 Jost Van Dyke - Site 5 0.0281 0.0929 0.3065 0.0200
22 Tortola - West End Ferry Terminal 0.0338 0.1115 0.3678 0.0240
23 Tortola - Zion Hill 0.1973 0.6509 2.1481 0.3065
24 Tortola - Luck Hill 0.5744 1.8955 6.2552 0.6271
25 Tortola - Shepherd's Hill 0.4181 1.3796 4.5527 0.8270
26 Tortola - Parham Town 0.4877 1.6096 5.3115 0.9649
27 Tortola - Beef Island 0.9595 3.1665 10.4495 1.5728

58
Figure 28 - Maximum and Time-Averaged Maximum RF Exposure Levels by Measurement (Broadband Survey)
0%
1%
2%
3%
4%
5%
6%
7%
8%
9%
1 3 5 7 9 11 13 15 17 19 21 23 25 27 29 31 33 35 37 39 41 43 45 47 49 51 53 55 57 59 61 63 65 67 69 71 73 75 77
Mea
sure
d R
F Le
vels
(%
of
Ge
ne
ral P
ub
lic E
xpo
sure
Lim
its)
Measurement Index
Maximum
Average

59
Figure 29 - Maximum RF Exposure Levels with Extended Uncertainty by Measurement (NBM-550/ED5091)
0%
5%
10%
15%
20%
25%
1 3 5 7 9 11 13 15 17 19 21 23 25 27 29 31 33 35 37 39 41 43 45 47 49 51 53 55 57 59 61 63 65 67 69 71 73 75 77
RF
Leve
l s (
% o
f G
en
era
l Pu
blic
Exp
osu
re L
imit
s)
Measurement Index
Measured
Upper
Lower

60
Figure 30 - Time-Averaged RF Exposure Levels with Extended Uncertainty by Measurement (NBM-550/ED5091)
0%
5%
10%
15%
20%
25%
30%
1 3 5 7 9 11 13 15 17 19 21 23 25 27 29 31 33 35 37 39 41 43 45 47 49 51 53 55 57 59 61 63 65 67 69 71 73 75 77
RF
Leve
l s (
% o
f G
en
era
l Pu
blic
Exp
osu
re L
imit
s)
Measurement Index
Measured
Upper
Lower

61
Table 21 – Latitude and Longitude Coordinates for Measurement Locations
Location Index General Location Island Latitude Longitude
1 Spanish Town Virgin Gorda 18.44597 -64.43288
2 Spanish Town Virgin Gorda 18.44358 -64.43253
3 Stadium Virgin Gorda 18.44358 -64.43253
4 The Baths Virgin Gorda 18.42969 -64.44214
5 Katiche Point Virgin Gorda 18.47733 -64.41293
6 Maho Bay Virgin Gorda 18.48484 -64.41267
7 North Sound Virgin Gorda 18.49278 -64.38775
8 Palestina / St. George's Secondary School
Tortola 18.39990 -64.63849
9 Road Town Tortola 18.42273 -64.61503
10 Jean Hill / Fish Bay Tortola 18.42068 -64.60218
11 Hope Hill Tortola 18.43587 -64.59723
12 Huntum's Ghut Tortola 18.43100 -64.62469
13 Cow Wreck Anegada 18.74503 -64.40181
14 Settlement Anegada 18.72193 -64.31568
15 Settlement Anegada 18.72061 -64.32228
16 West End Ferry Tortola 18.38784 -64.70267
17 Site 1 Jost van Dyke 18.44245 -64.72689
18 Site 2 Jost van Dyke 18.44284 -64.72660
19 Site 3 Jost van Dyke 18.44306 -64.72636
20 Site 4 Jost van Dyke 18.43736 -64.73269
21 Site 5 Jost van Dyke 18.44092 -64.75621
22 Ferry Terminal Jost van Dyke 18.44379 -64.75368
23 Zion Hill Tortola 18.39390 -64.68152
24 Luck Hill Tortola 18.43636 -64.65669
25 Shepherd's Hill Tortola 18.44440 -64.56789
26 Parham Town Tortola 18.44476 -64.56039
27 Beef Island Tortola 18.44314 -64.53631