report on child care in cook county - illinois action for … summary 1 the 2016 report on child...
TRANSCRIPT
Report on Child Care in Cook County
2016
2016 Report on Child Care in Cook CountyFor FY2015 (July 1, 2014 – June 30, 2015)
Prepared By:Research DepartmentIllinois Action for Children
A Report funded in part by the Illinois Department of Human Services
4753 N. BroadwaySuite 1200Chicago, Illinois 60640www.actforchildren.org
© 2016 Illinois Action for Children

Table of Contents
South & SouthwestSuburban Cook
Executive Summary 1
Introduction: Families and Child Care in Cook County 3
What Types of Child Care Are Available in Cook County? 4
Who is Served by the Formal Child Care Sector? 6
How Much Does Child Care Cost? 13
Why Are Formal Child Care Costs so High? 16
Promoting Quality Child Care 18
How Well Does Illinois Support Families’ Access to Child Care? 19
Conclusion and Policy Options 24
References 26
Appendices
Appendix 1: The Six Cook County Regions 28
Appendix 2: Sources for Data on Child Care Providers in Cook County 29
The 2016 Report on Child Care in Cook County
ExecutiveSummary
1The 2016 Report on Child Care in Cook County
The year ending June 30, 2015 saw significant challenges and changes to the child care landscape. Short-falls in the state’s child care funding and a new political climate created uncertainty for parents and child care providers alike. Although the 2015 budget shortfall was patched, Illinois’ budgetary and economic challenges continue to mount and have since led to devastating cuts for families and potential harm to Illinois’ overall child care and early education infrastructure.1 This is a reversal of Illinois’ trend of investing in the development of a robust, integrated system of early care and education.
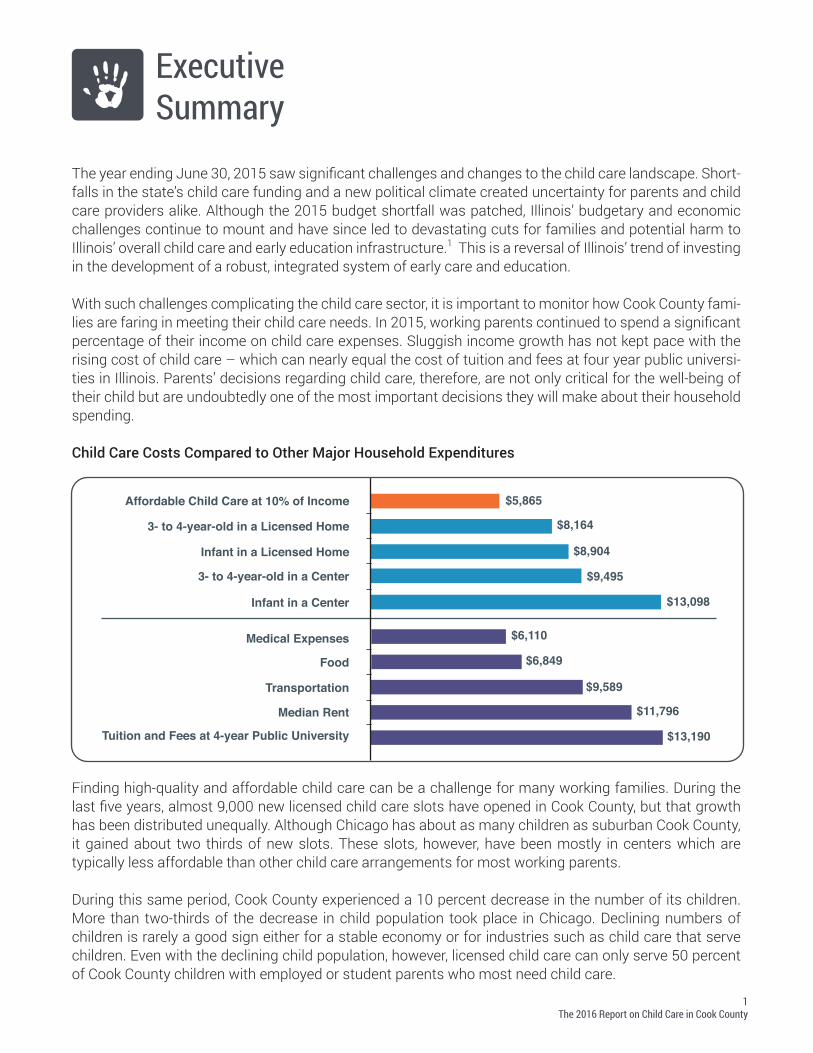
With such challenges complicating the child care sector, it is important to monitor how Cook County fami-lies are faring in meeting their child care needs. In 2015, working parents continued to spend a significant percentage of their income on child care expenses. Sluggish income growth has not kept pace with the rising cost of child care – which can nearly equal the cost of tuition and fees at four year public universi-ties in Illinois. Parents’ decisions regarding child care, therefore, are not only critical for the well-being of their child but are undoubtedly one of the most important decisions they will make about their household spending.
Child Care Costs Compared to Other Major Household Expenditures
Finding high-quality and affordable child care can be a challenge for many working families. During the last five years, almost 9,000 new licensed child care slots have opened in Cook County, but that growth has been distributed unequally. Although Chicago has about as many children as suburban Cook County, it gained about two thirds of new slots. These slots, however, have been mostly in centers which are typically less affordable than other child care arrangements for most working parents.
During this same period, Cook County experienced a 10 percent decrease in the number of its children. More than two-thirds of the decrease in child population took place in Chicago. Declining numbers of children is rarely a good sign either for a stable economy or for industries such as child care that serve children. Even with the declining child population, however, licensed child care can only serve 50 percent of Cook County children with employed or student parents who most need child care.
Affordable Child Care at 10% of Income $5,865
3- to 4-year-old in a Licensed Home $8,164
Infant in a Licensed Home $8,904
3- to 4-year-old in a Center $9,495
Infant in a Center $13,098
Food
Medical Expenses $6,110
Transportation
Median Rent
Tuition and Fees at 4-year Public University
$6,849
$9,589
$11,796
$13,190

2The 2016 Report on Child Care in Cook County
Change in the Number of Children, 2009-2014
While the declining child population has relieved some of the demand for child care, rising child care prices in Cook County make it impossible for some working families to find affordable care. The Illinois Child Care Assistance program (CCAP) continues to help eligible working families afford child care that they might otherwise be priced out of, particularly more formal types of care such as licensed family child care and center-based care. In 2015, however, the program was severely underfunded, creating a delay in payments to child care providers and a pause on intakes for new eligible families. The delay in payments sent finan-cial shockwaves throughout child care markets. Many providers were reluctant to accept parents receiv-ing CCAP, some families were kicked out of child care programs and scrambled to find other arrange-ments, and a large of number of children were left out of CCAP – even while the number of children eligible for the program has been significantly increasing since 2009. There is, however, some positive news. The State of Illinois, under the federal Race to the Top grant, has placed a greater emphasis on the quality of child care by revamping its quality rating system. The new statewide system, ExceleRate Illinois, is designed to promote quality improvement among early learning providers. The new rating system establishes a set of standards for child care providers to help infants, toddlers and preschool age children develop intellectually, physically, socially and emotionally while in their care. Cook County has already awarded a large number of licensed child care centers a high quality rating in 2015.
This report only reflects data from the year ending June 30, 2015. However, it should be noted that the financial challenges facing the child care world continue and will extend far into the coming years. At a time when the federal government and the State of Illinois hope to increase access to higher-quality child care, the challenges noted here indicate that simply maintaining the current levels of quality and afford-ability of child care may take center stage in Cook County in the years to come.
Under 6 6 to 12
Chicago Suburban Cook
-23,801-19,491
-1,163
-25,581

3The 2016 Report on Child Care in Cook County
Approximately 877,000 children under the age of 13 live in Cook County. A large proportion, and perhaps a majority, of these children receive regular care from someone other than their parents or guardians: from a relative, a friend or neighbor, a family child care home, a child care center, or a park district or other after-school program.
Families seek child care by asking relatives or friends for referrals, looking at notices and advertisements, and visiting child care centers in their communities. The State of Illinois offers a resource for families in the form of a referral service. Illinois Action for Children administers this service for families in Cook County through its Child Care Resource and Referral (CCR&R) Program, maintaining a database of child care providers who register voluntarily to be referred to parents. Child care providers supply detailed infor-mation about their programs so that referral consultants can help parents find providers who match their needs and preferences. Referral consultants help educate parents on what constitutes quality child care to better equip parents in evaluating the programs they visit. Most of the data presented in this report come from information collected for this service.
This 2016 Report on Child Care in Cook County examines the availability of child care to families in different parts of Cook County. We present the various settings in which child care takes place, the number of children that can be served in each type of care, and the fees that parents pay to different types of provid-
Introduction: Families and Child Care in Cook County
North & NorthwestSuburban Cook
North &Northwest Chicago
Central &West
Chicago
West SuburbanCook
South &SouthwestChicago
South & SouthwestSuburban Cook
ers. Challenges faced by families in relation to the cost of child care and state efforts to subsidize that care are also explored. Finally, we review policy options that could make child care more affordable and accessible to fami-lies throughout Cook County.
Examining Cook County Child Care by RegionThroughout this report we divide Cook County into six regions to show how geographic differences can affect parents’ success in finding child care. Appendix 1 provides more detailed definitions of these regions. Appendix 2 provides the sources of data cited in the report. In addition, Census and child care data for particular communities can be found on the Illinois Action for Children website.

4The 2016 Report on Child Care in Cook County
A family’s success in finding quality child care is based on many factors including the types of care avail-able where they live, the child’s age and specific needs, the hours of care needed, the amount the family can afford to pay, and the parent’s particular preferences. If we assume families have access to all types of child care, we can look at the available options in Cook County.
Parental CareMany families only use parental care. Either one parent stays home to care for the children, or both parents stagger their schedules so one can care for the children while the other works, goes to school or fulfills other responsibilities.
Formal Child Care SectorFamilies might also choose a formal child care arrangement in a child care center or a licensed family child care home. Approximately 4,900 child care providers comprise the formal child care sector.
Many home-based child care providers, especially those who provide care as an ongoing profession, choose to become licensed. This means the care provided in their homes is regulated by the Illinois Department of Children and Family Services (DCFS) and, in some cases, by a local licensing agency as well. Throughout this report, we refer to these caregivers as licensed home providers. In Illinois, a license is required when the home provider is caring for more than three children, including the caregiver’s own children, under the age of 12.
Parents also have the option of enrolling their child in a child care center. While most of these facilities are licensed by DCFS, centers such as those based in schools or affiliated with religious groups are exempt from being licensed. Center care may include all-day or part-day child care programs, before- and after-school programs (including those provided by park districts and YMCAs), and full-day summer programs for school-age children. Many parents choose center-based child care as a means for preparing their children for kindergarten with a classroom-based early learning experience.
What Types of Child Care are Available in Cook County?
Licensed Home Care • 3,478 homes in Cook CountyThis is care offered in a person’s home and regulated by the Illinois Department of Children and Family Services (DCFS). Licensed home providers may care for as many as eight children, plus an additional four school-age children during out-of-school time if an assistant is present. Providers with full-time adult assistants licensed as group homes can care for as many as 16 children.
Full-Day Center Care • 1,228 centers in Cook CountyChild care centers typically offer full-day care to serve working parents. Most are licensed through the Illinois Department of Children and Family Services (DCFS), though some connected to schools or religious institutions are exempt from licensing.

5The 2016 Report on Child Care in Cook County
Parents who may not need full-time child care but wish to prepare their 3- or 4-year-old child for kindergar-ten may consider a part-day or part-week preschool program. These programs include private, tuition-based preschools as well as free, public preschools such as Head Start and Preschool for All. Data on public and private preschool programs are not included in this report.
Informal Child Care SectorTens of thousands of caregivers provide child care through informal arrangements. Parents who need or want to look beyond parental care may choose a caregiver who can provide care in the child’s home, as a nanny does. They may also take their child to the home of someone they know well, such as a family member, close friend or neighbor, or someone they discovered through word-of-mouth or a referral service. This type of care is often referred to as Family, Friend, and Neighbor (FFN) care. When operating legally, FFN care providers are not required to have a child care license and are also called license-exempt home providers.
Parents using FFN care often have a personal relationship with their provider, and many choose FFN care so their children are with someone they know and trust. Families and FFN providers often share a common culture and language as well.
Parents also choose FFN care for economic reasons. FFN care is more affordable than center-based care or licensed home care, and many FFN providers are more flexible about if and when child care payments are made. FFN providers are more likely to offer care in the evenings, overnight, and on the weekends when other care is less available and can be more flexible with parents who receive their work schedules on short notice.2
School-Age Care • 187 programs in Cook County listed with Illinois Action for Children In addition to school-age care offered through child care centers, some schools, park districts, and programs such as the Boys and Girls clubs offer before- and/or after-school care. Most of these programs are exempt from licensing, making it difficult to get a complete count.
Family, Friend, and Neighbor (FFN) Care • Total number unknown In Cook County, about 23,000 FFN providers participated in the Illinois Child Care Assistance Program in FY 2015.Informal care provided by friends, neighbors and relatives either in the child’s home or the caregiver’s home. These providers are permitted to care for up to three unrelated children at a time without a license.

6The 2016 Report on Child Care in Cook County
The formal child care sector comprised of child care centers and licensed homes, has the capacity to care for approximately 143,000 Cook County children.3 As there are more than 599,000 children age birth-to-12 in Cook County with all parents working,4 just 24 percent of children potentially in need of child care can be served in formal child care settings. The remaining 76 percent of children in this category may be cared for by one or more of the following: license-exempt child care providers, babysitters or nannies, public or private preschool programs, older siblings or family members, parents or guardians who work part-time or stagger their work schedules, or even self-care.
While not all child care centers report their slots by age to Illinois Action for Children, the data below reflect the capacity of the 77 percent that do.5 Note the low number of infant and toddler slots compared to slots for older children.
Who is Served by the Formal Child Care Sector?
Cook County 97,490 12,408 26,854 6,323 143,075 877,197 599,321 24%
N & NW Chicago 15,608 880 3,557 1,029 21,074 157,619 104,229 20%
Central & West Chicago 14,339 886 3,909 836 19,970 97,328 64,213 31%
S & SW Chicago 21,425 1,750 10,616 2,636 36,427 191,705 134,251 27%
Chicago Total 51,372 3,516 18,082 4,501 77,471 446,652 302,693 26%
N & NW Suburban Cook 20,652 6,112 1,677 270 28,711 191,050 131,740 22%
West Suburban Cook 8,472 1,078 2,535 553 12,638 103,965 70,787 18%
S & SW Suburban Cook 16,994 1,702 4,560 999 24,255 135,530 94,101 26%
Suburban Total 46,118 8,892 8,772 1,822 65,604 430,544 296,628 22%
Children Birth to 12
with all parents working
Slots as a percent of children
potentially in need of care
Total Children
Birth to 12
Child Care
Centers
School Age
ProgramsLicensed Homes
TotalSlots
Licensed Homes - additional
school age slots
Formal Child Care Slots
Children Potentially in Need
of Child Care3
Infant Toddler 2-year-old3- to 4-year-old
SchoolAge,
Summer
Cook County 6,089 7,618 12,802 20,399 15,933 14,547 19,642
N & NW Chicago 663 951 1,902 3,113 2,426 1,984 3,405
Central & West Chicago 847 1,018 1,845 2,707 2,020 1,652 3,999
S & SW Chicago 1,300 1,615 3,116 4,778 3,760 2,615 6,781
Chicago Total 2,810 3,584 6,863 10,598 8,206 6,251 14,185
N & NW Suburban Cook 1,469 1,762 2,613 4,321 3,595 3,674 3,291
West Suburban Cook 543 671 1,152 1,939 1,639 1,589 583
S & SW Suburban Cook 1,267 1,601 2,174 3,541 2,493 3,033 1,583
Suburban Total 3,279 4,034 5,939 9,801 7,727 8,296 5,457
5-year-old& kindergar-
ten
Before & After School (full& part time)Center Slots

7The 2016 Report on Child Care in Cook County
Trends in Child Population over Time
The number of children under age 13 in Cook County decreased 10 percent from 2009 to 2014. Most of the decline was concentrated in two areas: South and Southwest Chicago and North and Northwest Suburban Cook.
Change in Number of Children by Region, 2009-20146
Chicago lost more than 49,000 children during this period. Suburban Cook County also saw a net decrease of about 20,000 children. Only one region in Cook County experienced growth in its child popula-tion; West Suburban Cook County.
Trends in Number of Licensed Care Slots over Time
Over the past five years, the number of licensed child care slots in Cook County grew by 8,941 slots, or seven percent. Almost all of the growth can be attributed to an increase in licensed center slots; during this period licensed home slots declined in almost every region of the county. The bulk of the growth in center slots was within the city of Chicago, where slots grew by 10 percent compared to just four percent in suburban Cook County.
Change in Number of Licensed Child Care Slots by Region, 2010-2015
Under 6 6 to 12
N & NWChicago
C & WChicago
S & SW Chicago
N & NW Cook
West Cook
S & SW Cook
-6,382 4,845-3 -2,022
-19,196-15,203
1,191
-16,934
-5,970
8,206
-5,479 -3,400
Center Slots Home Slots
N & NWChicago
C & WChicago
S & SW Chicago
N & NW Cook
West Cook
S & SW Cook
4,197
520 840
-455
2,0561,415
1,471
-702 -103 -5
283
-576

8The 2016 Report on Child Care in Cook County
The only region with a net loss of licensed child care slots was South and Southwest Suburban Cook County, where the loss in home slots was twice the gain in center slots.
The decline in child population along with the growth in licensed center slots suggests that Cook County has a greater capacity than it did five years ago in meeting families’ child care needs, at least in its Chicago regions. In fact there has been little change in most regions of Cook.
Percentage of Children Age 0-12 That Can be Served by Licensed Programs, 2009 & 2014
The North and Northwest Chicago region, historically the most underserved, has made most progress in increasing its child care coverage. Nevertheless, only 17 percent of children can be served in Chicago while only 15 percent can be served in Suburban Cook County. This underscores the need for more afford-able licensed care slots.
Availability of Infant Care
State licensing standards require high caregiver-to-child ratios for infant care: one caregiver for every four infants in centers and one caregiver for every three infants in homes without an assistant. Organizations such as the American Academy of Pediatrics and American Public Health Association recommend even more strict ratios of one caregiver for every three infants in child care centers and one caregiver for every two infants in large family child care homes.7 As a result, child care providers find it costly to provide infant care and may limit the number of infant slots they offer, opting to provide slots for older children instead, or charge high prices that put infant care out of reach for many parents.
2009 2014
12%
N & NWChicago
C & WChicago
S & SW Chicago
N & NW Cook
West Cook
S & SW Cook
Chicago SuburbanCook
20%
13% 14%
18%21%
18%
9%
13% 12%
20%
15%15% 17% 15%17%

9The 2016 Report on Child Care in Cook County
Overall, despite a slight decrease in suburban Cook County, the availability of infant care in Cook County has improved over the past five years. Similar to the overall trend in licensed slots, the number of infant center slots increased substantially while the number the licensed home slots declined. The result was a net gain of almost 2,100 infant slots in the city of Chicago, and a net loss of 91 slots in suburban Cook County.
Change in Total Number of Infant Slots in Centers & Licensed Homes, 2010 – 2015
The Chicago regions, in particular, saw substantial growth in their infant center slots: in North and North-west Chicago, infant center slots more than doubled, in Central and West Chicago the number of slots increased by 42 percent, and in South and Southwest Chicago they increased by two-thirds.8
Number of Infant Center Slots By Region, 2010 & 2015
Chicago Suburban Cook
2,098(9%)
-91(-1%)
2010 2015
663
N & NWChicago
C & WChicago
S & SW Chicago
N & NW Cook
West Cook
S & SW Cook
847
1,388 1,4691,300
596
1,267
259 451 543
1,276
780

10The 2016 Report on Child Care in Cook County
The level of difficulty parents encounter while looking for licensed care for their infants is dependent on the overall number of infant slots available in their community relative to the infant population.
Regions with the greatest availability of infant care have enough slots to serve 15 percent to 20 percent of their infants. These regions include the South and Southwest suburbs, Central and West Chicago, and South and Southwest Chicago.
Parents may have the most difficulty finding infant care in North and Northwest Chicago. Despite doubling its supply of infant care over the past five years, this region has slots to accommodate only seven percent of its infants.9
Percent of Infants for whom a Center or Licensed Home Slot is Available
13%North & Northwest
Suburban Cook
7%North &
Northwest Chicago
15%Central &
WestChicago
11%West Suburban
Cook 19%South &
SouthwestChicago
20%South & Southwest
Suburban Cook

11The 2016 Report on Child Care in Cook County
Availability of Care during Non-Traditional Work Hours
Many families, particularly low-income families, find the availability of child care to be limited during non-traditional work hours. Most child care programs are available only during the daytime on weekdays, but half of part-time employees and one-third of full-time employees work non-traditional schedules that include at least some evening, night, or weekend hours.10 Many employees also work schedules that vary, sometimes with little advance notice. Relatively few programs accommodate parents’ needs for evening child care, overnight care, weekend care, or care on a variable schedule.
Programs with Evening Care by Region (between 7pm–2pm)
Programs with Weekend Care by Region
Licensed homes are generally more flexible than centers in offering care during non-traditional hours. In several regions, more than half of home-based providers are licensed to provide evening care compared to, at most, 18 percent of centers. However, further study is needed to determine how many of these homes actually offer care during the evening hours for which they are licensed.
Home providers are also more likely than centers to offer weekend care, particularly homes in the South and Southwest Chicago and the South and Southwest suburbs.
The availability of weekend care in homes increased in Cook County as a whole. The number of homes reporting that they offer weekend care rose from 8 percent in 2006 to 21 percent in 2015.
Centers Licensed Homes
62%
N & NWChicago
C & WChicago
S & SW Chicago
N & NW Suburbs
West Suburbs
S & SW Suburbs
76%
3%12%
84%
7%
77%
4% 8%
47%
18%18%
Centers Licensed Homes
13%
N & NWChicago
C & WChicago
S & SW Chicago
N & NW Suburbs
West Suburbs
S & SW Suburbs
16%
2% 4%
28%
1%
29%
3% 0%
10%4%4%

12The 2016 Report on Child Care in Cook County
Programs with Overnight Care by Region (any hours between 2am–5am)
Programs Allowing Variable Schedules by Region
Very few programs offer over-night care – less than one percent of centers and just two percent of licensed homes in Cook County.
Programs offering variable hours of care are important for parents with changing work schedules. However, the majority of programs do not offer care for changing sched-ules. Only about one-third of licensed homes and 17 percent of centers say they accommodate variable schedules. In fact, many programs require parents to pay by the entire week regard-less of whether or not their child attends all week. This policy provides programs with needed financial stability but can cause hardship for parents.
Since non-traditional work schedules often go hand-in-hand with low-income jobs, most families seeking child care during non-traditional hours are also challenged by affordability issues. It is not surprising, then, that many parents turn to relatives, friends, and neighbors to care for their children. These providers offer a more flexible and affordable alternative as compared to other child care options.
Centers Licensed Homes
2%
N & NWChicago
C & WChicago
S & SW Chicago
N & NW Suburbs
West Suburbs
S & SW Suburbs
1%
0%
2%2%
0%
3%
0%
2%
1%0%
1%
Centers Licensed Homes
29%
N & NWChicago
C & WChicago
S & SW Chicago
N & NW Suburbs
West Suburbs
S & SW Suburbs
34%
16%
27%
38%
16%
39%
13%17%
25% 22%17%

13The 2016 Report on Child Care in Cook County
The cost of child care continues to rise each year. In fact, prices for most types of child care in Cook County have outpaced inflation.11
Percent Increase in the Cost of Preschool-Age Care Since 2010 Compared to Inflation
Each year, Illinois Action for Children’s Child Care Resource and Referral (CCR&R) program asks providers to report the rates they charge parents. The tables below present the rates for both centers and licensed homes for the regions of Cook County based on the child’s age.12 The final row of each table gives the maximum weekly reimbursement rate the State will pay on behalf of families eligible to receive assistance via the Illinois Child Care Assistance Program (CCAP).13
Average Weekly Rates: Full-time Child Care in a Center
How Much Does Child Care Cost?
Inflation
9%12% 11%
18%
14%
Licensed Home,Suburbs
Center,Suburbs
Licensed Home,Chicago
Center,Chicago
$232.45 $196.30 $163.60$81.80 (under 5 hrs/day)
$163.60 (5+ hrs/day)
$163.60
Infant (6 weeks to14 months)
Toddler(15 to 23 months) 2-year-old
3- to 4-year-old
SchoolAge,
Summer
Cook County $262 $247 $215 $190 $184 $128 $166
N & NW Chicago $301 $274 $225 $200 $191 $132 $181
Central & West Chicago $288 $272 $233 $201 $198 $124 $158
S & SW Chicago $217 $213 $182 $159 $156 $120 $144
Chicago $250 $239 $203 $178 $174 $123 $156
N & NW Suburban Cook $319 $294 $264 $237 $227 $144 $223
West Suburban Cook $261 $243 $216 $191 $186 $117 $156
S & SW Suburban Cook $232 $223 $200 $174 $168 $128 $151
Suburban Cook $271 $254 $229 $202 $195 $132 $173
Maximum amountreimbursed by CCAP for full-time care
5-year-old & kindergar-
ten
Before & After School

14The 2016 Report on Child Care in Cook County
Average Weekly Rates: Full-Time Child Care in a Licensed Home
For both center-based care and licensed home care, child care rates typically decrease as a child gets older because it generally costs less for providers to care for older children. In centers, more children are allowed per teacher as children get older. In licensed homes, providers are permitted to care for additional school-age children beyond the usual maximum capacity if they have a part-time assistant. The cost of care also differs by geographic area. Following the patterns of supply and demand, care is least expensive in the least economically-resourced parts of the county. This is true of center-based and licensed home care in the South and Southwest regions of Chicago and Suburban Cook County, as well as for licensed home care in the Central & West region of Chicago. Child care is most expensive in the relatively affluent regions in North and Northwest Chicago and Suburban Cook County.
The Cost of Child Care in Context
In 2014, median income for Cook County families approached pre-recession levels. However, child care costs continued to grow as family incomes declined during the recession.
Cook County Median Family Income Between 2007 and 201414
How Much Does Child Care Cost?
$65,000
$60,000
$55,000
$50,0002007 2008 2009 2010 20122011 2013 2014
$165.40 $159.20 $149.20$74.60(under 5 hrs/day)
$149.20(5+ hrs/day)
$149.20
Infant (6 weeks to14 months)
Toddler(15 to 23 months) 2-year-old
3- to 4-year-old
SchoolAge,
Summer
Cook County $178 $175 $170 $163 $161 $138 $150
N & NW Chicago $191 $184 $179 $171 $169 $156 $167
Central & West Chicago $164 $162 $155 $147 $146 $135 $137
S & SW Chicago $163 $161 $155 $147 $145 $137 $139
Chicago $168 $166 $160 $152 $150 $140 $145
N & NW Suburban Cook $225 $220 $217 $211 $208 $172 $181
West Suburban Cook $174 $171 $166 $160 $157 $139 $150
S & SW Suburban Cook $163 $160 $154 $147 $145 $130 $137
Suburban Cook $175 $172 $167 $161 $157 $135 $149
Maximum amountreimbursed by CCAP for full-time care10
5-year-old & kindergar-
ten
Before & After School

As a result, average child care costs in 2014 account for 18 percent of the median family income com-pared to just 15 percent in 2007. This is much higher than 10 percent of median income, widely consid-ered the benchmark for affordability.15 Although child care grows more affordable as a child gets older, even the cost of full-day care for a 3- to 4-year-old exceeds 10 percent of a typical Cook County family’s income. Families with two children in child care are doubly challenged.
Cost of Care for a 2-year-old as a Percentage of Median Family Income, Since 2007
Comparing the cost of child care to other major household expenses reveals that enrolling an infant in a child care center can cost about the same as sending a young adult to college16 and more than what many families pay for food, transportation17 or rent.18
Child Care Costs Compared to Other Major Household Expenditures
15The 2016 Report on Child Care in Cook County
13%
15%
14%
16%
17%
18%
19%
2007 2008 2009 2010 20122011 2013 2014
Affordable Child Care at 10% of Income $5,865
3- to 4-year-old in a Licensed Home $8,164
Infant in a Licensed Home $8,904
3- to 4-year-old in a Center $9,495
Infant in a Center $13,098
Food
Medical Expenses $6,110
Transportation
Median Rent
Tuition and Fees at 4-year Public University
$6,849
$9,589
$11,796
$13,190

16The 2016 Report on Child Care in Cook County
In a national comparison of child care affordability, Illinois was ranked as the 7th least affordable state for infant center care and ranked as the 13th least affordable state for center care for 4-year-olds.19 Within Illinois, Cook County consistently ranks among the 10 least affordable counties for infant and 4-year-old care in both centers and licensed homes.20
There is no denying that child care is expensive. To understand why child care costs are so high, however, it is critical to look at the perspective of the child care provider who all too often is working with an over-stretched budget and may have to make operational choices based more on financial need than consider-ations of quality. Like any business, child care incurs the costs of labor, occupancy, food, operating costs, and overhead. Costs specific to child care may include buying age-appropriate toys, food and equipment, home or center safety and sanitation, and professional development for staff. While parent fees are the most significant source of revenue for most child care programs, revenue may also come in the form of public and private subsidies. When cost and revenue were compared, a 1996 study found that the monthly budget for a typical child care center left room for a surplus of only 3.7 percent, less than half of the com-parable corporate rate of about nine percent during the early 1990s.21
Child care is an expensive business to run, particularly when offering high-quality care. In particular it can be costly to meet licensing standards for high quality: lower staff-to-child ratios, lower maximum group sizes, and higher pay and benefits to retain quality teachers. The table below illustrates how practices related to high-quality care result in higher costs for families.
A Comparison of 4-year-old Classrooms by State
Why Are Formal Child Care Costs so High?
Illinois Indiana Michigan Ohio Missouri Kentucky
Minimum staff-to-child ratio22
Maximum Group Size23
Teacher educationrequirement24
Average annual wage fora child care worker25
Annual price for full-timecare for a 4-year-old26
1:10
20
Completionof a CDA
$23,090
$9,567
1:12
24
A high schooldiploma or
GED
$19,830
$6,760
1:14
25
A high schooldiploma or
GED
$21,580
$7,341
1:10
No MAX
Less thana high school
diploma or
$20,010
$9,308
1:14
28
A high schooldiploma or
GED
$19,780
$5,499
1:12
No MAX
Some collegecoursework or
training in Early
Childhood Education
leading to a CDA
$21,380
$6,764

17The 2016 Report on Child Care in Cook County
In Illinois, average child care costs are significantly higher than in neighboring states ($9,567 compared to $5,499 in the lowest-priced state, Kentucky). However, note that licensing standards in Illinois require centers to have the highest adult-to-child ratios (1 to 10) and the smallest group size (20).27 To meet these high staffing and space standards, centers must charge higher tuitions. Compared to most surrounding states, Illinois also has more rigorous teacher education requirements which mean that it costs centers more to retain their well-trained staff. By contrast, the average child care center in Kentucky charges considerably less for tuition because its staffing costs are significantly lower than in other states. Among other factors, a Kentucky center can receive tuition from more children to cover its classroom costs than can centers in states where the maxi-mum group size is lower. Child care costs would be even higher if teachers in child care centers and homes were paid wages on par with other educators. On average, child care workers in the Chicago Metropolitan area earn an annual salary of $24,640, only 40 percent of the median family income in Illinois. Preschool teachers earn more, but even with an education degree they still earn $22,000 less per year than kindergarten teachers.28 Annual Mean Wage in 2014
Many believe the low wages of child care providers serve as a hidden subsidy for the child care system by keeping prices low enough for families to afford. Only with increased public investment that reflects the true cost of providing high-quality child care can Illinois’ child care industry develop and retain a highly-skilled and adequately-paid workforce.
Illinois Chicago Metropolitan area
Elementaryschool teacher
Kindergartenteacher
Preschoolteacher
Child careworker
$60,000
$80,000
$40,000
$20,000
$0

18The 2016 Report on Child Care in Cook County
Under the federal Race to the Top grant, the State of Illinois has begun a robust push to increase the qual-ity of child care by revamping its quality rating system. The new statewide system, ExceleRate Illinois, is designed “to make continuous quality improvement an everyday priority among early learning providers.” ExceleRate Illinois established a set of standards for child care providers to help infants, toddlers and preschool age children develop intellectually, physically, socially and emotionally while in their care. ExceleRate Illinois lays out a framework for early learning professionals to identify opportunities for improvement and increase their child care practice skills. It awards four Circles of Quality (in order of low to high quality): Licensed, Bronze, Silver, and Gold. In addition, ExceleRate Illinois recognizes providers who go beyond the highest Circle of Quality by granting Awards of Excellence in specific areas.
In 2015, the first months of the new rating system, 24 percent of licensed child care centers in Cook County were awarded a Circle of Quality. A significant number of licensed child care centers entered Excel-eRate Illinois with a gold circle of quality in continuation of the high quality rating they had attained in previous years. The chart presents numbers that will serve as a baseline for measuring the progress of ExceleRate Illinois for Cook County in future years.
Number of Licensed Child Care Centers in Cook County with a Circle of Quality, 2015
Promoting Quality Child Care
435
124
GoldSilverBronze
1

19The 2016 Report on Child Care in Cook County
The high cost of child care, particularly quality care, limits many families’ options when choosing child care arrangements. Without assistance, parents working low-paying jobs may experience financial strain in paying for the very child care that allows them to work or attend school. In recognizing the burden child care costs can have on families, particularly low-income families, federal and state revenue funds the Illinois Child Care Assistance Program (CCAP), which helps families afford child care that would otherwise be too costly.
About the Illinois Child Care Assistance Program
Through the Illinois Department of Human Services (IDHS), CCAP provides low-income families with access to quality, affordable child care. Eligible parents must be working or in an approved school or train-ing program and have incomes at or below 185 percent of the federal poverty level.29 CCAP is designed to give parents the choice of child care that best fits the needs of their family. CCAP reimburses the provider at the established state rate, which varies by region, age of child, and type of provider. Historically, the reimbursement rate to providers in Cook County has been significantly below the federally-recommended levels, especially for infant care and before-and-after-school care.30 Families are required to pay a portion of the cost of care through a sliding scale copayment that is based on family size and income. CCAP is primarily a voucher system administered in Cook County by Illinois Action for Children. Some child care centers, however, have direct contracts with IDHS to serve families eligible for CCAP.
How Well Does Illinois Support Families’ Access to Child Care?
For Many Families, CCAP Makes Child Care Affordable
Without CCAP, a single parent earning $10 per hour would find licensed child care options for her two-year-old prohibitively expensive, costing 41 percent to 52 percent of the family’s income.
With CCAP, the same parent is respon-sible for paying just 6 percent of the family’s income for child care in the form of a copayment.31
6%
41%
Any Care,CCAP
Licensed Home,Without CCAP
Center Care,Without CCAP
52%
Percentage of Income Needed for Child CareSingle parent earning $10 per hour
with a 2-year-old
20The 2016 Report on Child Care in Cook County
The CCAP Income Ceiling
While CCAP helps many families afford quality child care, eligibility is based on a set income ceiling (185 percent of the federal poverty level in FY15) and when a family earns just over that threshold, they no longer qualify for benefits. This income ceiling may discourage families from earning higher wages out of fear that they will no longer be able to afford the very child care that makes it possible to work or attend classes. Some families may decline wage increases (if allowed) or lose assistance and switch to less expensive care arrangements of potentially lower quality. Regardless of the quality of the new care, chang-ing care arrangements disrupts the children’s important bonds with their caregivers.
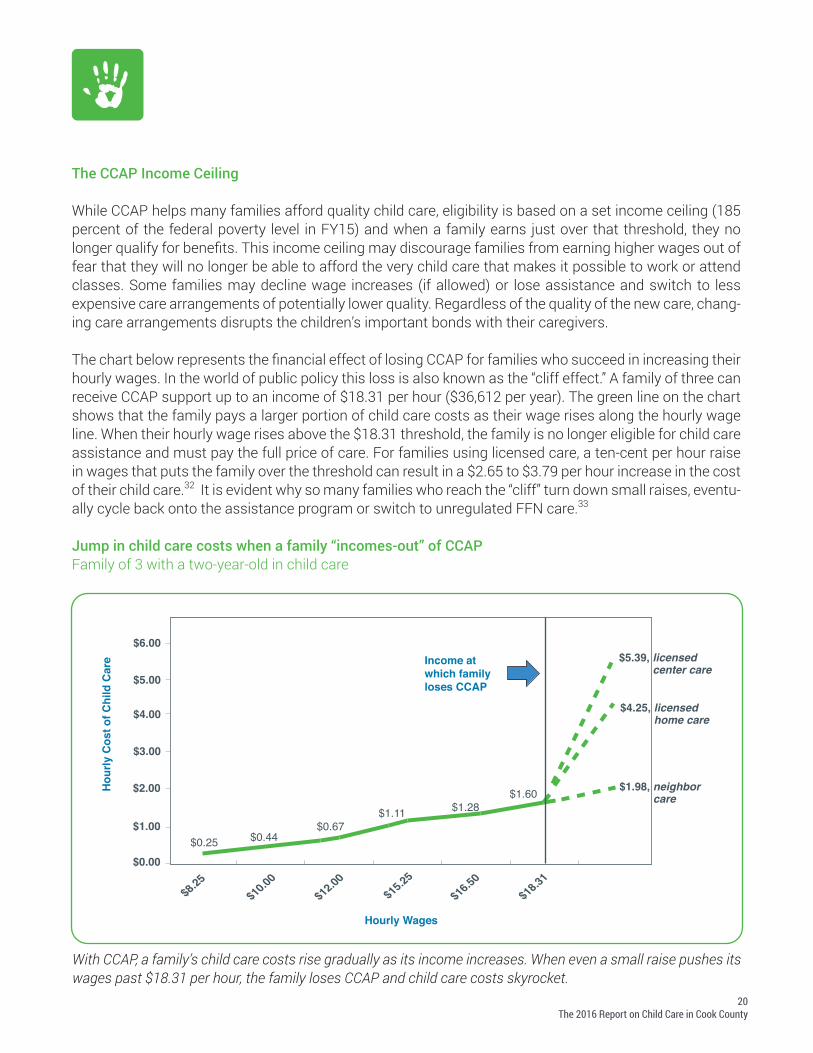
The chart below represents the financial effect of losing CCAP for families who succeed in increasing their hourly wages. In the world of public policy this loss is also known as the “cliff effect.” A family of three can receive CCAP support up to an income of $18.31 per hour ($36,612 per year). The green line on the chart shows that the family pays a larger portion of child care costs as their wage rises along the hourly wage line. When their hourly wage rises above the $18.31 threshold, the family is no longer eligible for child care assistance and must pay the full price of care. For families using licensed care, a ten-cent per hour raise in wages that puts the family over the threshold can result in a $2.65 to $3.79 per hour increase in the cost of their child care.32 It is evident why so many families who reach the “cliff” turn down small raises, eventu-ally cycle back onto the assistance program or switch to unregulated FFN care.33
Jump in child care costs when a family “incomes-out” of CCAP Family of 3 with a two-year-old in child care
$1.11 $1.28$1.60
$0.00
$1.00
$2.00
$3.00
$4.00
$5.00
$6.00
$0.25 $0.44$0.67
$8.25
$10.0
0$1
2.00
$15.2
5$1
6.50
$18.3
1
Hou
rly C
ost o
f Chi
ld C
are
Hourly Wages
Income at which family loses CCAP
$5.39, licensed center care
$4.25, licensed home care
$1.98, neighbor care
With CCAP, a family’s child care costs rise gradually as its income increases. When even a small raise pushes its wages past $18.31 per hour, the family loses CCAP and child care costs skyrocket.

21The 2016 Report on Child Care in Cook County
Twenty (20) states plus the District of Columbia have child care subsidy income eligibility rates above 200 percent of the federal poverty level, going as high as 375 percent of the federal poverty level.34 If the CCAP income ceiling were raised to 300 percent of the federal poverty level, an Illinois family of three would retain eligibility until their annual income reached $59,371. At that higher income, the family could better manage the higher child care payments even if the cost still rose by $2.65 per hour or $3.79 per hour.
The federal Child Care Development Block Grant reauthorization, passed in 2014, begins to address this. It includes a provision that requires a graduated phase out of child care assistance for families whose income increases above state eligibility limits yet falls below 85% of the state’s median income. Illinois submitted its state plan on how it will comply with federal regulations and this plan is currently under review.
Illinois Child Care Assistance Program (CCAP): Eligibility and Use
Twenty-five (25) percent of the 877,000 children in Cook County live in poverty, and 45 percent are in fami-lies earning less than 185 percent of the poverty level, meaning they are income-eligible for CCAP. Esti-mating CCAP eligibility using families’ income and employment status, we determine that as many as 73,000 children under age six and 118,000 school-age children may be eligible for but are not using CCAP. Only 31 percent of children eligible for CCAP are using it.
Children Ages Birth to 5
Cook County 410,093 25% 45% 47,612 70,085
N & NW Chicago 82,656 20% 38% 6,113 13,925
Central & West Chicago 49,055 40% 60% 7,596 11,531
S & SW Chicago 87,636 40% 63% 17,438 20,081
Chicago 219,347 32% 53% 31,147 45,536
N & NW Suburban Cook 84,714 12% 28% 3,537 11,485
West Suburban Cook 46,637 21% 44% 4,319 8,398
S & SW Suburban Cook 59,395 21% 40% 8,609 7,665
Suburban Cook 190,746 17% 35% 16,465 27,548
Number of Children
Percent in Poverty
Percent Below 185% of Poverty (income
eligible for CCAP)
Eligible for but not
participatingin CCAP
(estimate)
Children with CCAP
(June 2015)

22The 2016 Report on Child Care in Cook County
There are many possible reasons why families do not use this public support. Two-parent families may stagger their work schedules and not need child care, parents may already have free or affordable child care, families may lack awareness of CCAP, they or their provider may find the paperwork requirements burdensome, undocumented families might distrust government programs, parents may work for cash and have difficulty documenting their income, and parents may face language or cultural barriers.
Change in Children in Poverty over Time by Region, 2009-201435
Despite having fewer children in 2014 than in 2009, Cook County had more children in poverty and in this respect was no different from any other Illinois county. From 2009 to 2014, the number of Cook County children in poverty increased by over six percent.
Cook County 467,104 26% 47% 35,317 118,296
N & NW Chicago 74,963 23% 46% 3,440 19,914
Central & West Chicago 48,273 47% 70% 6,575 15,958
S & SW Chicago 104,069 39% 63% 13,881 32,983
Chicago 227,305 35% 59% 23,896 68,856
N & NW Suburban Cook 106,336 12% 28% 1,757 19,750
West Suburban Cook 57,328 20% 42% 2,831 14,448
S & SW Suburban Cook 76,135 20% 40% 6,833 15,242
Suburban Cook 239,798 17% 35% 11,421 49,440
Number of Children
Percent in Poverty
Percent Below 185% of Poverty (income
eligible for CCAP)
Eligible for but not
participating in CCAP
(estimate)
Children with CCAP
(June 2015)
Children Ages 6 to 12
Under 6 6 to 12
N & NWChicago
C & WChicago
S & SW Chicago
N & NW Cook
West Cook
S & SW Cook
-1,139 -343
888 1,672
-2,405
693
2,958
-710
4,3595,213
3781,777

23The 2016 Report on Child Care in Cook County
Suburban Cook County experienced an increase in children in poverty of about 15,500 children or 27 percent. By contrast, children in poverty decreased slightly in Chicago, largely among children under age six. Although an improving economy might account for some of this progress in Chicago, the substantial decrease in Chicago’s total child population was more than enough to account for fewer children in poverty. Despite its small decreases, Chicago retained about twice the number of poor children as subur-ban Cook County.
Change in CCAP Eligible Children over Time by Region, 2009-201436
During this same time, the number of children eligible for CCAP also increased in Cook County. All regions of Suburban Cook saw a significant increase in CCAP-eligible children, with more children falling toward poverty if not actually into poverty – with North and Northwest Suburban Cook seeing the biggest jump. Chicago also experienced an increase in the number of eligible CCAP children with North and Northwest Chicago experiencing the biggest increase. Overall, the number of CCAP eligible children in Cook County grew by over 49,000.
Under 6 6 to 12
N & NWChicago
C & WChicago
S & SW Chicago
N & NW Cook
West Cook
S & SW Cook
7,516 7,644
1,187 750
-502
1,7443,049
5,587
8,114 7,501
670
6,219

24The 2016 Report on Child Care in Cook County
Finding the right child care is one of the most important decisions that a parent faces, and with more options, the likelihood is greater that parents will succeed in finding the provider best suited for their child. However, parents’ choices are limited by costs, schedules, and availability and this is especially true for low-income parents. While CCAP helps some families access quality early childhood programs, not all families who need assistance qualify for it, and sometimes even with assistance, these child care settings can be too costly.
Many families are also limited by the number of openings in quality programs in their community, particu-larly parents seeking infant care. Other families discover that it is not just about finding openings but finding them at the right times. A growing number of families work outside the traditional Monday through Friday daytime schedule, yet most centers and licensed child care homes do not offer care in the evenings, overnight, or on weekends.
While several types of child care exist, the reality is that many families do not have real options. The follow-ing are policy strategies that advocates and policy makers could consider to improve the accessibility of quality child care for all families in Cook County and the State of Illinois:
Reduce parent copayments in the Child Care Assistance Program (CCAP)Parents’ copayments under CCAP determine how affordable child care will be. Families have more options when their copayments are based on what they can reasonably afford to spend. Lawmakers can support and monitor IDHS’ efforts to reduce parent copayments so that no eligible family pays more than 10 percent of their income toward child care copayments.
Expand income eligibility in the Child Care Assistance Program (CCAP) The child care “cliff” is the income at which parents lose CCAP eligibility due to modest wage increases and thereby experience a sharp jump in their child care costs before they are financially able to shoulder these costs. Illinois can eliminate or reduce the cliff effect by raising the maximum income limit CCAP places on eligibility - currently set at 185 percent of the federal poverty level. Lawmakers can restore income eligibility for CCAP to its 2011 level of 200 percent of the federal poverty level and work to raise income eligibility to 300 percent of the federal poverty level.
Increase access to high-quality child care for families working nontraditional hoursParents who work evenings, nights or weekends often cannot access high-quality early childhood programs that are available only during weekday and daytime hours. More flexible IDHS’ eligibility policies could take a child’s developmental needs into account and allow child care outside of a parent’s work or school hours if it supports continuity of care or enables a child to access high quality early learning programs.
Conclusion and Policy Options

25The 2016 Report on Child Care in Cook County
Fund tiered reimbursement for providers’ achievement in ExceleRate IllinoisQuality rating improvement systems, such as ExceleRate Illinois, offer standards, guidelines, resources and supports to help child care providers make sensible changes that lead to higher quality programs. When providers participate in quality rating improvement systems, parents have more high-quality programs to choose from. ExceleRate Illinois is a voluntary program and many providers opt not to partici-pate due to concern that it is too costly to achieve higher levels of quality. Legislators can ensure stable funding for ExceleRate Illinois to provide technical assistance and support for providers in navigating the quality rating system process, and to provide tiered CCAP reimbursements for providers for achieving higher levels within the system.
Raise provider reimbursement rates to target levelsThis report shows that providing child care is very expensive for providers largely due to appropriate licensing standards that impose high costs in terms of staff and facilities. This is particularly true of care for infants and toddlers. For many types of care in Cook County, CCAP reimburses providers far below the federally recommended 75th percentile of the local child care market. Providers who need to charge more than this reimbursement amount either must turn down families with CCAP or charge parents the differ-ence. This effectively prices many child care programs out of parents’ reach. By raising reimbursement rates to target levels, lawmakers can ensure that more families have access to higher-quality child care.

26The 2016 Report on Child Care in Cook County
1Effective July 1, 2016 the governor enacted administrative rule changes that limited the eligibility of new partici-pants in the Child Care Assistance Program. As a result, only 10 percent of otherwise eligible applicants could get approved for assistance. The most restrictive rules were rescinded in November 2016, but as of the writing of this report, eligibility guidelines have not been restored to their FY15 levels, and many families needing care for educa-tion and training are no longer eligible.2For a more complete discussion of FFN care, particularly as it relates to non-traditional work hours, see Choices in the Real World: The use of family, friend and neighbor child care by single Chicago mothers working nontraditional schedules, Illinois Action for Children, 2013.3Slots shown represent daytime capacity. Licensed homes have the capacity to serve an additional 17,772 children during evening hours (if they offer care during this time) while child care centers can provide an additional 4,877 evening slots.4From the 2014 American Community Survey, five-year estimates.5Comparable data for licensed homes is not reported because home providers have more flexibility in the ages of children they can enroll and the ages they serve change frequently.6Data are based on American Community Survey 2009 and 2014 5-year estimates. The 2009 data point reflects data collected during the years of 2005 through 2009, while the 2014 data point reflects data collected from 2010 through 2014.7American Academy of Pediatrics, American Public Health Association, National Resource Center for Health and Safety in Child Care and Early Education. 2011. Caring for our children: National health and safety performance standards; Guidelines for early care and education programs. 3rd edition. Elk Grove Village, IL: American Academy of Pediatrics; Washington, DC: American Public Health Association. Also available at http://nrckids.org.8Growth in infant center slots reflects the increase in the number of infant slots reported by child care centers to Illinois Action for Children’s Resource and Referral program in 2010 and 2015. 9This is meant to be a rough estimate of the supply of and demand for infant care. Not all home providers are willing to care for infants, particularly newborns, and not all parents of infants need child care or desire formal care arrangements for their infants. Number of infants is from the 2014 American Community Survey, 5-year estimates.10For more information see Working Later in Illinois: Work Schedules, Incomes and Parents’ Access to Child Care, Illinois Action for Children, 2006.11As measured by the CPI-U for June 2010 and June 2015 by the U.S. Department of Labor, Bureau of Labor Statistics; retrieved January, 2016 at http://www.bls.gov/data/home.htm 12The cost of FFN care is not reported as very little data is available on the rates charged by license-exempt providers.13CCAP reimbursement rates in effect from July 2014 through June 2015.14Median family income for a family with a child under 18; American Community Survey 1-year estimates, 2007 through 2014.15U.S. Department of Health and Human Services identifies affordable child care to be no more than 10 percent of a family’s income. http://www.acf.hhs.gov/sites/default/files/occ/fr072498.pdf16Trends in College Pricing for the 2014-2015 academic year, retrieved January 2016 at www.collegeboard.org17Data on food and transportation represent the average cost for a family of three comprising two adults and one child adjusted for inflation. Poverty In America: Living Wage Calculator, retrieved February 2016 at http://livingwage.mit.edu/
18Median family income and rent are from the 2014 American Community Survey 1-year estimates and represent Cook County
References

27The 2016 Report on Child Care in Cook County
19Child Care Aware of America. Parents and the High Costs of Child Care, Child Care Aware of America, 2015 Report. Retrieved February, 2015 at http://usa.childcareaware.org/advocacy-public-policy/resources/reports-and-research/costofcare/ 20Illinois Network of Child Care resource & Referral Agencies (INCCRRA). Illinois Families and the Cost of Child Care, FY 2013 Report. http://inccrra.com/data-a-reports/reports 21Helburn, S. W. & Howes, C. (1996). Child care cost and quality. The Future of Children: Financing Child Care, 6(2), p. 74. Retrieved March, 2014 at http://futureofchildren.org/futureofchildren/publications/docs/06_02_03.pdf 22Child Care Aware of America. (2013). We can do better: 2013 update: Ranking of state child care center regula-tions and oversight. Retrieved May 23, 2014, from http://www.naccrra.org/sites/default/files/default_site_pages/2013/wcdb_2013_one-pager_april8.pdf23Ibid 24Ibid25United States Department of Labor, Bureau of Labor Statistics, (2014). May 2014 State Occupational Employment and Wage Estimates26Child Care Aware of America. 2015 Annual Child Care in America Fact Sheet, requested from http://usa.childcareaware.org/advocacy-public-policy/resources/reports-and-research/statefactsheets/ 27“Group size” refers to the number of children assigned to a classroom or other distinct space within a larger room. 28May 2014 State Occupational Employment and Wage Estimates Illinois. Retrieved January, 2016 from www.bls.gov/oes/2014/may/oes_il.htm#39-0000; May 2014 Metropolitan and Nonmetropolitan Area Occupational Employment and Wage Estimates, Chicago-Joliet-Naperville, IL Metropolitan Division Retrieved January, 2016 from www.bls.gov/oes/2014/May/oes_16974.htm Note: Excludes special education teachers. 29Effective July 1, 2015 the governor reduced income eligibility to 50 percent of the federal poverty level through an emergency rule process. Income limits were then increased to 162 percent of the poverty level in November 2015 with the understanding that they will return to 185 percent of the poverty level when the 2016 budget is approved. 30Illinois Department of Human Services. Market Rate Survey of Licensed Child Care Programs in Illinois Fiscal Year 2014. Retrieved February, 2015 from http://www.dhs.state.il.us/page.aspx?item=82489 31Illinois Department of Human Services family copayment rates effective January 1, 2015. As family income increases, the copayment makes up a greater percentage of family income, as much as 10 percent.32Numbers reflect the rise in the cost of care for a two-year old in license home care and an infant in center care, respectively. 33The average cost of FFN care is unknown as it varies greatly by provider and child. For this chart we utilized CCAP reimbursement rates for FFN care.34The CCDF Policies Database Book of Tables: Key Cross-State Variations in CCDF Policies as of October 2015, OPRE Report 2013-22, February 2016. Retrieved February 2016 at http://www.acf.hhs.gov/sites/default/files/opre/ccdf_policies_database_2014_book_of_tables_final_11_05_15_b508_3.pdf35Data are based on American Community Survey 2009 and 2014 5-year estimates. The 2009 data point reflects data collected during the years of 2005 through 2009, while the 2014 data point reflects data collected from 2010 through 2014.36Ibid
References

28The 2016 Report on Child Care in Cook County
This report divides Cook County into six geographic regions: three in Chicago based on the 77 Chicago Community Areas, and three in suburban Cook County based on the suburban municipalities.
When presenting census data for Chicago and Cook County in this report, we built our aggregate units from data for the individual Chicago Community Areas and municipalities. Our aggregate data, therefore, may deviate somewhat from aggregate data provided by the U.S. Census.
Appendix 1: The Six Cook County Regions
North and NorthwestChicago
Albany ParkAvondaleBelmont CraginDunningEdgewaterEdison ParkForest GlenHermosaIrving ParkJefferson ParkLake ViewLincoln ParkLincoln SquareLogan SquareMontclareNorth CenterNorth ParkNorwood ParkO'HarePortage ParkRogers ParkUptownWest Ridge
Central and West Chicago
AustinEast Garfield ParkHumboldt ParkLoopLower West SideNear North SideNear South SideNear West SideNorth LawndaleSouth LawndaleWest Garfield ParkWest Town
South and SouthwestChicago
Archer HeightsArmour SquareAshburnAuburn GreshamAvalon ParkBeverlyBridgeportBrighton ParkBurnsideCalumet HeightsChathamChicago LawnClearingDouglasEast SideEnglewoodFuller ParkGage ParkGarfield RidgeGrand BoulevardGreater Grand CrossingHegewischHyde ParkKenwoodMcKinley ParkMorgan ParkMount GreenwoodNew CityOaklandPullmanRiverdaleRoselandSouth ChicagoSouth DeeringSouth ShoreWashington HeightsWashington ParkWest ElsdonWest EnglewoodWest LawnWest PullmanWoodlawn
West Suburban Cook
Bedford ParkBellwoodBerkeleyBerwynBridgeviewBroadviewBrookfieldBurr RidgeCiceroCountrysideForest ParkForest ViewHillsideHodgkinsIndian Head ParkJusticeLa GrangeLa Grange ParkLyonsMaywoodMcCookMelrose ParkNorth RiversideOak ParkRiver ForestRiversideStickneyStone ParkSummitWestchesterWestern SpringsWillow Springs
South and SouthwestSuburban Cook
AlsipBlue IslandBurbankBurnhamCalumet CityCalumet Park
Chicago HeightsChicago RidgeCountry Club HillsCrestwoodDixmoorDoltonEast Hazel CrestEvergreen ParkFlossmoorFord HeightsGlenwoodHarveyHazel CrestHickory HillsHometownHomewoodLansingLemontLynwoodMarkhamMattesonMerrionette ParkMidlothianOak ForestOak LawnOlympia FieldsOrland HillsOrland ParkPalos HeightsPalos HillsPalos ParkPark ForestPhoenixPosenRichton ParkRiverdaleRobbinsSauk VillageSouth Chicago HeightsSouth HollandStegerThorntonTinley ParkWorth
North and NorthwestSuburban Cook
Arlington HeightsBarringtonBartlettDes PlainesEast DundeeElginElk Grove VillageElmwood ParkEvanstonFranklin ParkGlencoeGlenviewGolfHanover ParkHarwood HeightsHoffman EstatesInvernessKenilworthLincolnwoodMorton GroveMount ProspectNilesNorridgeNorthbrookNorthfieldNorthlakePalatinePark RidgeProspect HeightsRiver GroveRolling MeadowsRosemontSchaumburgSchiller ParkSkokieSouth BarringtonStreamwoodWheelingWilmetteWinnetka

29The 2016 Report on Child Care in Cook County
Information on Cook County child care providers in this report comes from three different sources:
1. The Illinois Action for Children Child Care Resource and Referral (CCR&R) Program 2. The Illinois Department of Children and Family Services (DCFS)3. The Illinois Child Care Assistance Program (CCAP)
The Illinois Action for Children Child Care Resource and Referral (CCR&R) program is part of a statewide network of Resource and Referral agencies funded through the Illinois Department of Human Services (IDHS). Illinois Action for Children invites child care providers to list their programs on our database and to provide detailed information about their programs such as the rates they charge parents, the number of children they serve per age group, languages spoken, training and education they have received, and other characteristics that help referral staff match parents with providers.
Illinois Action for Children supplements its database with licensing data from DCFS. In this way, we main-tain the most comprehensive listing of child care providers in Cook County, though we do not fully capture child care that is legally exempt from licensing or the otherwise illegal care.
The third source of child care data used in this report is CCAP, which provides the best count of known license-exempt child care programs in Cook County.
Child Care Providers in Cook County in 2014: Who is Included
Appendix 2: Sources for Data on Child Care Providers in Cook County
Child Care Centers
School-Age Programs
Summer Only Programs
Licensed Homes Any family child care home that is licensed by DCFS as of June 2014.
FFN Care (License-Exempt Homes)
DescriptionType of Program
Any child care center operating for the full year or the school year and offering some or all full-time care for children under age 5. The center might provide school-age care as well. This category does not include private preschool programs or public preschools such as Head Start-only or Preschool for All-only programs. Park and recreation programs are included if their care is full-time and for the full year or school year. Data are from June 2014.
Any center that provides full-year or school-year care for children ages 5-and-over only. Includes before and after school programs and part-day programs for children in kindergarten. Programs may be center-based, school-based or at a park or recreation program. Data are from June 2014.
Any center that provides care only during the summer months. Only centers providing full-time care are included. Ninety-four (94) percent of these summer-only programs are park and recreation programs. Data are from June 2014.
License-exempt home providers participating in CCAP in June 2014. The number of partici-pating home providers varies from month to month just as the number of participating families varies. These data do not capture the large number of unknown family, friend, or neighbor caregivers throughout Cook County.
For information on early education slots in Cook County (Head Start and Preschool for All) and on child care and early education slots in regions outside of Cook County, visit the Illinois Early Childhood Asset Map (IECAM) website at iecam.crc.illinois.edu.

4753 N. BroadwaySuite 1200Chicago, Illinois 60640www.actforchildren.org
© 2016 Illinois Action for Children