report on experiments needed for kinetic model …. no.33 add… · report on experiments needed...
TRANSCRIPT

PROGRAMME “ENERGY, ENVIRONMENT AND SUSTAINABLE DEVELOPMENT”
Project SAFEKINEX: SAFe and Efficient hydrocarbon oxidation processes by KINetics and Explosion eXpertise
Contract No. EVG1-CT-2002-00072
Report on experiments needed for kinetic model development
(high pressure)
Deliverable No. 33
Addendum B
Additional experiments on the self-ignition temperature and the ignition delay time
ETHENE and METHANE
February 2006
Author: A. Claudia Fernández Giua Supervisor: Prof.Dr.Ir. H.J. Pasman

TABLE OF CONTENTS 1 INTRODUCTION ...................................................................................................................................................... 4 2 TEST APPARATUS AND PROCEDURE .............................................................................................................. 4
2.1 SET UP DESCRIPTION .................................................................................................................................... 4 2.2 PROCEDURE DESCRIPTION.......................................................................................................................... 5 2.3 SET UP VALIDATION WITH N-BUTANE EXPERIMENTS ........................................................................ 6
3 ETHENE EXPERIMENTS....................................................................................................................................... 7 3.1 INTRODUCTION .............................................................................................................................................. 7 3.2 RESULTS ........................................................................................................................................................... 7
3.2.1 EXPERIMENTS SUMMARY ......................................................................................................................... 7 3.2.2 TEMPERATURE VERSUS TIME EXPERIMENTAL PROFILES .............................................................. 13 3.2.3 INTERPRETATION AND DISCUSSION OF RESULTS ............................................................................ 18
4 METHANE EXPERIMENTS................................................................................................................................. 24 4.1 INTRODUCTION ............................................................................................................................................ 24 4.2 RESULTS ......................................................................................................................................................... 24
4.2.1 EXPERIMENTS SUMMARY ....................................................................................................................... 24 4.2.2 TEMPERATURE VERSUS TIME EXPERIMENTAL PROFILES .............................................................. 28 4.2.3 INTERPRETATION AND DISCUSSION OF RESULTS ............................................................................ 31
5 N-BUTANE-ETHENE-METHANE COMPARATIVE STUDY........................................................................ 35 6 CONCLUSIONS....................................................................................................................................................... 36 7 LITERATURE.......................................................................................................................................................... 37

LIST OF FIGURES Figure 1: Position of the thermocouples in the experimental flask................................................................... 5 Figure 2: Temperature-time profile, Exp. e62, ethene-air 19%, T4i=360ºC, SSSO ....................................... 13 Figure 3: Temperature-time profile, Exp e16, ethene-air 19%, T4i=471ºC, SO............................................. 14 Figure 4: Temperature-time profile, Exp. e25, ethene-air 19%, T4i=482ºC, PR+HF, SO+EXPL ................... 14 Figure 5: Temperature-time profile, Exp. e43, ethene-air 34%, T4i=460ºC, PR, SO+EXPL+SO................... 14 Figure 6: Temperature-time profile, Exp. e26, ethene-air 19%, T4i=491ºC, PR+HF, SO+EXPL+SOdelayed 15 Figure 7: Temperature-time profile, Exp. e75, ethene-air 40%, T4i=448ºC, SO+EXPL1+EXPL2.................. 15 Figure 8: Temperature-time profile, Exp. e78, ethene-air 19%, T4i=476ºC, SO+CF?+SO............................ 15 Figure 9: Temperature-time profile, Exp. e20, ethene-air 19%, T4i=479ºC, SO+CF?+SO............................ 16 Figure 10: Temperature-time profile, Exp. e30, ethene-air 24%, T4i=448ºC, SO(CF?)SO............................ 16 Figure 11: Temperature-time profile, Exp. e71, ethene-air 90%, T4i=390ºC, SO?,CF? ................................ 16 Figure 12: Temperature-time profile, Exp. e74, ethene-air 90%, T4i=421ºC, CF?,EXPL? ............................ 17 Figure 13: Temperature-time profile, Exp. e76, ethene-air 90%, T4i=449ºC, CF?,EXPL?+SO ..................... 17 Figure 14: IDT versus temperature ethene-air 19% ...................................................................................... 19 Figure 15: IDT versus temperature ethene-air 24% ...................................................................................... 19 Figure 16: IDT versus temperature ethene-air 29% ...................................................................................... 20 Figure 17: IDT versus temperature ethene-air 34% ...................................................................................... 20 Figure 18: IDT versus temperature ethene-air 40% ...................................................................................... 21 Figure 19: IDT versus temperature ethene-air 90% ...................................................................................... 21 Figure 20: IDT versus temperature for various ethene-air concentrations..................................................... 22 Figure 21: Temperature of the first “fast” oxidation phenomenon.................................................................. 22 (CF or EXP) versus concentration. ............................................................................................................... 22 Figure 22: Temperature-time profile, Exp. m7, methane-air 40%, T4i=502ºC, SSSO ................................... 28 Figure 23: Temperature-time profile, Exp. m10, methane-air 40%, T4i=533ºC, SO...................................... 28 Figure 24: Temperature-time profile, Exp. m14, methane-air 40%, T4i=564ºC, SO1+SO2........................... 29 Figure 25: Temperature-time profile, Exp. m15, methane-air 90%, T4i=563ºC, SO+(SO1+SO2) ................. 29 Figure 26: Temperature-time profile, Exp. m23, methane-air 40%, T4i=602ºC, 2 stage SO ......................... 29 Figure 27: Temperature-time profile, Exp. m39, methane-air 14%, T4i=634ºC, PR+-HF, SO+EXPL....... 30 Figure 28: Temperature-time profile, Exp. m20, methane-air 90%, T4i=584ºC, MCF ................................... 30 Figure 29: Temperature-time profile, Exp. m43, methane-air 90%, T4i=635ºC, MCF smooth....................... 30 Figure 30: IDT versus temperature methane-air 14% ................................................................................... 32 Figure 31: IDT versus temperature methane-air 25% ................................................................................... 32 Figure 32: IDT versus temperature methane-air 40% ................................................................................... 33 Figure 33: IDT versus temperature methane-air 90% ................................................................................... 33 Figure 34: IDT versus temperature for different methane-air concentrations % v/v....................................... 34 Figure 35: IDT versus temperature for different rich fuels mixtures n-butane-air (9,5%), ethene-air (19%) and methane-air (14%) ........................................................................................................................................ 35 LIST OF TABLES Table 1: Equipment data of the Auto Ignition Apparatus ............................................................. 5 Table 2: n-butane experiments summary.................................................................................... 6 Table 3: Flammable ranges according to BAM and ISDS ........................................................... 7 Table 4: Experiments summary, ethene-air 19% ........................................................................ 9 Table 5: Experiments summary, ethene-air 24% ...................................................................... 10 Table 6: Experiments summary, ethene-air 29% ...................................................................... 10 Table 7: Experiments summary, ethene-air 34% ...................................................................... 10 Table 8: Experiments summary, ethene-air 40% ...................................................................... 11 Table 9: Experiments summary, ethene-air 60% ...................................................................... 11 Table 10: Experiments summary, ethene-air 90% .................................................................... 11 Table 11: temperature-time ethene experiments profiles. ......................................................... 13 Table 12: Flammable ranges according to BAM and ISDS ....................................................... 24 Table 13: Experiments summary, methane-air 14% ................................................................. 25 Table 14: Experiments summary, methane-air 25% ................................................................. 25 Table 15: Experiments summary, methane-air 40% ................................................................. 26 Table 16: Experiments summary, methane-air 90% ................................................................. 26 Table 17: temperature-time methane experiments profiles. ...................................................... 28 Table 18: IDT of Slow Oxidation phenomenon before explosion............................................... 31

Project SAFEKINEX - Del No. 33, Add. B Additional experiments on the self-ignition temperature and the ignition delay time p. 4 (37)
1 INTRODUCTION
The experiments reported here have been carried out in the framework of the SAFEKINEX project, specifically as part of the additional experiments planned in Work Packages 2 and 4, Task WP2.5.3 and Tasks WP4.4. As such this report is an Addendum to Deliverable No. 331. A direct objective was to get some more information about the self ignition behaviour of the selected substances ethene and methane beside n-butane. The latter had previously been studied quite extensively and had provided an overlap between the series of experiments in steel at BAM and glass at TUD. The present series would provide the opportunity to look at another overlap situation with ethene. (Because of the high self ignition temperature of methane BAM could at the time being not determine this quantity in their equipment and no overlap in this series of experiments was possible.) The aim of the work has also been the acquisition of new Ignition Delay Time (IDT) and self-ignition temperature data for the kinetic model validation made in WP4. On the other hand, it is also intended to be a modest contribution to the better overall understanding of the different types of oxidation phenomena including both the chemistry and physics, which are mainly, Slow Oxidation, Cool Flame and Hot Flame. The experiments should be seen therefore also in support of the modelling effort of Task WP3.4. The equipment used has been the Auto Ignition Apparatus (AIT) of TU Delft, as in the experiments reported in Deliverable No. 5, “Report on experimentally determined self-ignition temperature and the ignition delay time”, and the fuels studied have been, ethene and methane at different fuel rich concentrations and in a range of temperatures of 620-930 K. As has been defined in Deliverable No. 5 the Induction time, τ, is the time lag between the completed injection of the test mixture and occurrence of any exothermic phenomena. According to the draft European standard prEN 14522 and the SAFEKINEX internal Standard Operating Procedure (SOP) a special type of induction time is the Ignition Delay Time (IDT), defined as the time lag between the completed injection of the test mixture and occurrence of ignition. In this report for simplicity reasons only the term Ignition Delay Time will be used, although in quite a few instances of Slow Oxidation an induction period is meant. As before the actual method used to determine IDT is the tangential one2.
2 TEST APPARATUS AND PROCEDURE
2.1 SET UP DESCRIPTION The complete description of the AIT apparatus is presented in Deliverable Nr. 5, “Report on experimentally determined self-ignition temperature and the ignition delay time” in its chapter 5.2. However, it has been considered that it is useful here to recall the location of the five thermocouples used, as it is shown in figure 1, and some other data summarised in table 1. It is important to note the fact that probably it has not been possible to reproduce exactly the same thermocouples position with respect to the experiments reported in Deliverable Nr. 5.
1 Strictly speaking Deliverable No. 33 was planned for experiments at higher pressure, but a good comprehension of the subject of self heating and auto-ignition required also more effort at atmospheric pressure than originally thought. 2 According to Deliverable No. 5 the induction time determined by the tangential method (τp
tan) is defined as the time interval between the moment of admission of a mixture to a test vessel and the onset of the rapid temperature rise. This characteristic time is determined by the intersection of the line of initial pressure with the tangent at the point of maximum rate of temperature rise.

Project SAFEKINEX - Del No. 33, Add. B Additional experiments on the self-ignition temperature and the ignition delay time p. 5 (37)
The experiments have been performed using the 500 ml test vessel and without stirring. For safety reasons, the filter used as a flame arrestor, was included in the circuit in all the experiments. The injection took around 0.6 s. In some experiments, adequately identified, in order to improve the temperature homogeneity inside the test vessel, a glass wool textile was placed surrounding the quartz cover of the test vessel. After several trials it was concluded that the difference between T4 and T5 didn’t decrease; in consequence the glass wool was not further used. Before starting the experiments all the thermocouples and the Pressure gauge were calibrated and, for ensuring the correct operating condition of the equipment, some experiments with n-butane-air mixtures were performed in order to reproduce existing data reported in Deliverable Nr. 5. The summary and results of these experiments are reported in chapter 2.3 of this document. Table 1: Equipment data of the Auto Ignition Apparatus All Thermocouples Type K
Exposed junction ∅ = 330 µm Inner thermocouples, T4, T5 Response time = 50 ms
Outer thermocouples T1,T2,T3 Grounded junction, ∅ = 1.5 mm Voltage amplifier Voltage amplifier step response = 11.5 ms (87Hz)
Figure 1: Position of the thermocouples in the experimental flask
2.2 PROCEDURE DESCRIPTION The operating procedure is also described in Deliverable Nr. 5. The experiments reported in this document were performed following it in nearly all points such as the mixing time of 5 minutes or the test vessel vacuum below 0,3 bara before sample addition. The main difference has been that the volume injected has been just 5 times the volume of the flask instead of 10, due to the fact that using higher injected volumes introduced instability in the thermocouple signals.
2.3 INTERPRETATION OF TEMPERATURE-TIME HISTORIES The temperature-time peaks have been classified visually on their shape as Cool Flame, Slow Oxidation or Explosion. Explosions are usually accompanied by light flash and reporting noise. Slow oxidation is an exothermic process over a relatively long time span. Cool flame produces a temperature peak of several seconds wide with a height of some tens of degrees up to a hundred K or more. It can under circumstances repeat itself a few times: Multiple Cool Flame. It is however

Project SAFEKINEX - Del No. 33, Add. B Additional experiments on the self-ignition temperature and the ignition delay time p. 6 (37)
the result of the low temperature mechanism and has therefore a ceiling temperature of about 700 K.
2.4 SET UP VALIDATION WITH n-BUTANE EXPERIMENTS In order to be sure that the equipment is working properly, different experiments have been performed to reproduce the results obtained with mixtures of 9.5 % n-butane in air which had been presented in Deliverable Nr. 5. In table 2, a summary is presented of the experiments performed for the equipment validation (see the legend in pages 11, 12 of this report). Table 2: n-Butane experiments summary
EXP conc. Ti4 Ti5 dtphe IDT4ma IDT 4 IDT 4mean phenomena Vol-% °C °C s s s s
bu26 9.5 331 328 1.5 5.7 5 5.4 CF?L+SO bu30 9.5 331 327 1.3 5.3 4.6 5.0 CFL+SO bu31 9.5 297 293 2 22.8 22.1 22.5 CF+SO bu32 9.5 297 294 1.8 27.6 26.9 27.3 CF+SO
Legend: See Table 10. Specifically, from figure 5.3.9 of Deliverable Nr. 5, it is possible to extract the IDT found for the same mixture composition and nearly the same temperature. In fact, at 570 K (297 ºC), the IDT reported there is 23 s, while for 600 K (327 ºC) it is 6 s. The difference between the IDT values is acceptable (less than 10%, which is within the error margin), therefore it is concluded that the equipment reproduced results obtained in Deliverable Nr. 5.
Project SAFEKINEX - Del No. 33, Add. B Additional experiments on the self-ignition temperature and the ignition delay time p. 7 (37)
3 ETHENE EXPERIMENTS
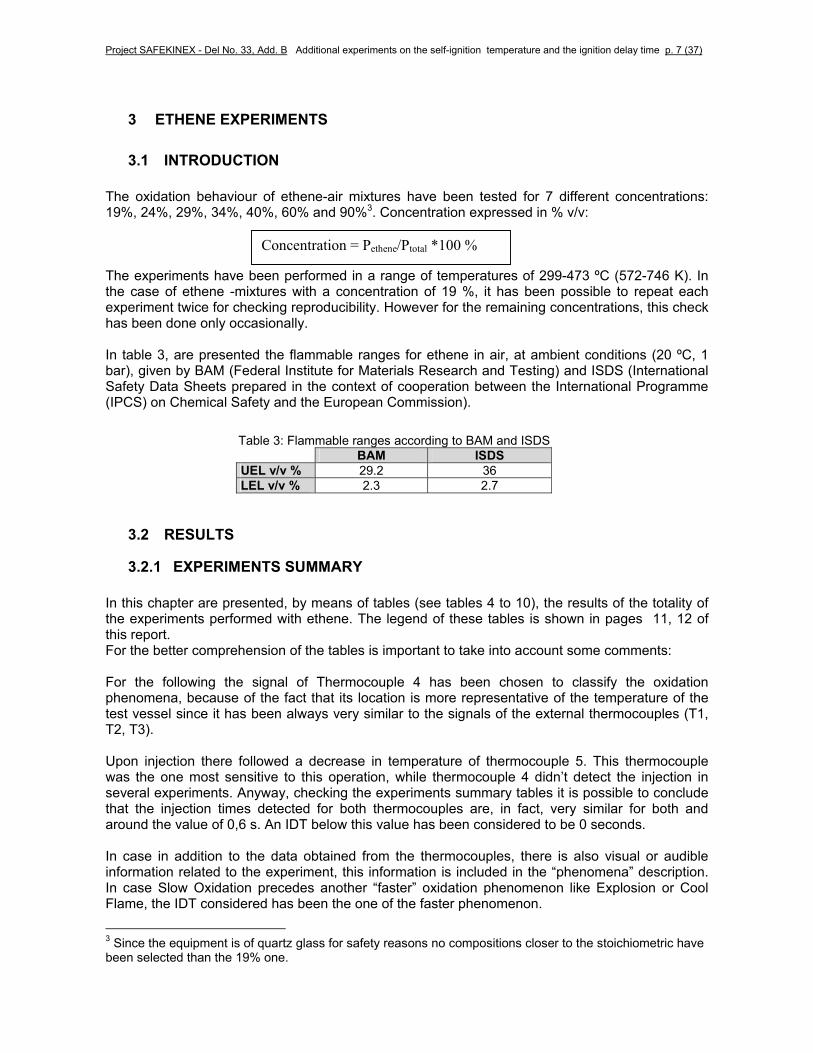
3.1 INTRODUCTION The oxidation behaviour of ethene-air mixtures have been tested for 7 different concentrations: 19%, 24%, 29%, 34%, 40%, 60% and 90%3. Concentration expressed in % v/v: The experiments have been performed in a range of temperatures of 299-473 ºC (572-746 K). In the case of ethene -mixtures with a concentration of 19 %, it has been possible to repeat each experiment twice for checking reproducibility. However for the remaining concentrations, this check has been done only occasionally. In table 3, are presented the flammable ranges for ethene in air, at ambient conditions (20 ºC, 1 bar), given by BAM (Federal Institute for Materials Research and Testing) and ISDS (International Safety Data Sheets prepared in the context of cooperation between the International Programme (IPCS) on Chemical Safety and the European Commission). Table 3: Flammable ranges according to BAM and ISDS
BAM ISDS UEL v/v % 29.2 36 LEL v/v % 2.3 2.7
3.2 RESULTS
3.2.1 EXPERIMENTS SUMMARY In this chapter are presented, by means of tables (see tables 4 to 10), the results of the totality of the experiments performed with ethene. The legend of these tables is shown in pages 11, 12 of this report. For the better comprehension of the tables is important to take into account some comments: For the following the signal of Thermocouple 4 has been chosen to classify the oxidation phenomena, because of the fact that its location is more representative of the temperature of the test vessel since it has been always very similar to the signals of the external thermocouples (T1, T2, T3). Upon injection there followed a decrease in temperature of thermocouple 5. This thermocouple was the one most sensitive to this operation, while thermocouple 4 didn’t detect the injection in several experiments. Anyway, checking the experiments summary tables it is possible to conclude that the injection times detected for both thermocouples are, in fact, very similar for both and around the value of 0,6 s. An IDT below this value has been considered to be 0 seconds. In case in addition to the data obtained from the thermocouples, there is also visual or audible information related to the experiment, this information is included in the “phenomena” description. In case Slow Oxidation precedes another “faster” oxidation phenomenon like Explosion or Cool Flame, the IDT considered has been the one of the faster phenomenon.
3 Since the equipment is of quartz glass for safety reasons no compositions closer to the stoichiometric have been selected than the 19% one.
Concentration = Pethene/Ptotal *100 %

Project SAFEKINEX - Del No. 33, Add. B Additional experiments on the self-ignition temperature and the ignition delay time p. 8 (37)
The IDT time has been calculated by means of a MATLAB programme according to the tangential method reported in Deliverable Nr 5, in its chapter 5.1.2. In the next pages are presented the summary tables of the ethene -air experiments.

Project SAFEKINEX - Del No. 33, Add. B Additional experiments on the self-ignition temperature and the ignition delay time p. 9 (37)
Table 4: Experiments summary, ethene-air 19%
EXP conc. T4* Ti4 Ti5 T4max T5max dT4ma dT5ma tiinj 4 tiinj 5 tfinj 4 tfinj 5 IDT 4 IDT 5 dt inj4 dtinj5 dtphe IDT4ma IDT 4IDT
4mean phenomena e56 19 299 280 302 282 3 2 NO e59 19 331 311 332 312 1 1 NO e62 19 360 339 363 342 3 3 21,4 22,3 0 0,0 SSSO e67 19 390 370 396 374 6 4 20,3 20,3 21,2 21 0 0 0,9 0,7 0 0 0,0 SO e4 19 409 390 412 391 3 1 20 20 21 20,5 0 0 1 0,5 204,5 0 0 0,0 SSSO e5 19 409 391 413 391 4 0 31,5 31,4 32 32 0 0 0,5 0,6 268 0 0 0,0 SSSO e6 19 423 428 404 5 94,6 94,5 95,2 95,1 0 0 0,6 0,6 204,9 0 0 0,0 SO e7 19 423 403 429 404 6 1 37,9 37,9 38,6 38,5 0 0 0,7 0,6 261,5 0 0 0,0 SO e8 19 424 404 430 405 6 1 56,3 56,2 57,1 56,9 0 0 0,8 0,7 243,1 0 0 0,0 SO e9 19 435 416 445 416 10 0 26,5 26,5 27,3 27,1 0 0 0,8 0,6 102,9 0 0 0,0 SO e10 19 434 415 441 415 7 0 65,3 65,1 66 65,8 0 0 0,7 0,7 24,2 0 0 0,0 SO e11 19 447 427 460 429 13 2 42,2 42,3 43,2 42,8 0 0 1 0,5 72,2 0 0 0,0 SO e12 19 447 427 460 428 13 1 45,7 45,7 46,3 46,3 0 0 0,6 0,6 23,7 0 0 0,0 SO e29 19 448 427 474 430 26 3 21,3 21,2 21,8 0 0 0,6 30,2 0 0 0,0 SO e28 19 449 429 469 434 20 5 24,2 24,1 24,7 24,7 0 0 0,5 0,6 85,3 0 0 0,0 SO e13 19 460 440 478 441 18 1 98,3 98,3 99,1 98,9 0 0 0,8 0,6 41,1 0 0 0,0 SO e14 19 460 440 481 441 21 1 60 59,9 60,5 0 0 0,6 27,5 0 0 0,0 SO e46 19 460 437 497 445 37 8 22,8 23,4 0 0 50 0,6 0 0 0,0 SO e15** 19 470 452 524 609 54 157 21,1 21,1 21,3 21,5 21,6 0,2 0,7 0,4 0,3 0,4 PR+HF,EXPL e16 19 471 450 537 458 66 8 20,1 20,1 20,7 0 0 0,6 45,3 0 0 0,0 SO e18 19 471 450 518 454 47 4 41,6 41,5 42,1 0 0 0,6 39,9 0 0 0,0 SO e17 19 472 451 517 456 45 5 58,9 58,9 59,6 0,7 42,4 0 0 0,0 SO e80* 19 528 473 450 727 500 199 50 47,8 48,5 53,9 0,7 2,2 6,1 5,4 5,8 SO+CF?+SO e81* 19 528 473 450 722 531 194 81 53 53,5 57,6 2,3 4,6 4,1 4,4 SO+CF?+SO e79* 19 565 475 453 740 665 175 212 37,3 37,9 50,6 53,4 0,6 0,7 13,3 12,7 13,0 PR+HF+soot,SO+EXPL e77* 19 540 475 453 663 687 123 234 22,7 22,7 23,6 39,3 39,6 0,9 0,8 16,6 15,7 16,2 PR+HF,SO+EXPL e78* 19 540 476 453 722 525 182 72 47,5 48,1 57,8 0,6 1,6 10,3 9,7 10,0 SO+CF?+SO e19* 19 528 478 460 628 584 100 124 31 30,8 31,4 48 48,2 0,6 0,7 17,2 16,6 16,9 PR,SO+EXPL e21* 19 520 478 458 668 710 148 252 20,7 20,4 21 39,7 39,8 0,6 0,9 19,3 18,7 19,0 PR+HF,SO+EXPL e20* 19 540 479 458 649 631 109 173 25,1 24,9 25,6 45,1 45,3 0,7 0,9 20,2 19,5 19,9 SO+CF?+EXPL 19 526 563 37 25,1 24,9 25,6 41 1,2 16,1 15,4 15,8 descript CF? e22* 19 518 480 459 669 773 151 314 48,4 48,2 48,8 63,1 63,2 0,6 0,8 14,9 14,3 14,6 PR+HF,SO+EXPL e24* 19 495 480 460 622 621 127 161 26,2 26,1 26,9 26,6 37,1 37,1 0,7 0,5 0,6 11 10,5 10,8 PR+HF,SO+EXPL+SO del 19 490 540 50 26,1 26,9 26,6 184 10 157,9 157,4 157,7 descrip SOimp e23* 19 525 481 459 645 667 120 208 45,5 45,5 46 61,7 61,8 0,5 0,7 16,2 15,7 16,0 PR+HF+soot,EXPL e25* 19 540 482 459 654 606 114 147 34,7 34,6 35,2 52,3 52,5 0,6 0,7 17,7 17,1 17,4 PR+HF,SO+EXPL e1* 19 494 482 460 586 600 92 140 164,9 165 166,1 165,5 174,7 174,7 1,2 0,5 0,6 9,7 9,2 9,4 PR+HF,SO+EXPL e26* 19 515 491 470 626 581 111 111 14,7 14,5 15 15 20,7 20,7 0,5 0,5 0,5 6,2 5,7 6,0 PR+HF,SO+EXPL?+SO del 19 500 560 60 14,7 14,5 15 15 135 9 120,5 120 120,3 descrip SOimp e27* 19 530 491 470 625 561 95 91 55,8 55,7 56,2 62,6 62,8 0,5 0,7 6,9 6,4 6,7 PR+HF,SO+EXPL+SO del 19 500 520 20 55,8 55,7 56,2 605 12 549,3 548,8 549,1 descrip SOimp e3* 19 515 492 470 618 592 103 122 29,8 29,8 30,6 30,4 35,4 35,5 0,8 0,6 0,6 5,6 5 5,3 PR+HF,SO+EXPL e2* 19 502 494 472 602 591 100 119 59,8 59,9 60,6 60,5 64,8 64,9 0,8 0,6 0,7 4,9 4,3 4,6 PR+HF,SO+EXPL

Project SAFEKINEX - Del No. 33, Add. B Additional experiments on the self-ignition temperature and the ignition delay time p. 10 (37)
Table 5: Experiments summary, ethene-air 24% EXP conc. T4* Ti4 Ti5 T4max T5max dT4ma dT5ma tiinj 4 tiinj 5 tfinj 4 tfinj 5 IDT 4 IDT 5 dt inj4 dtinj5 dtphe IDT4ma IDT 4 IDT 4mean phenomena
e32 24 447 426 486 432 39 6 45,1 45,2 45,8 45,8 0,6 0,6 0 0,3 SO e30* 24 483 448 428 517 439 34 11 24,5 24,6 25,3 25,2 50,4 0,8 0,6 2 25,8 25,2 25,5 SO(CF?)SO e31 24 448 427 487 432 39 5 21,1 21 21,6 21,6 21,7 0,5 0,6 38,3 0,7 0,1 0,4 SO e42* 24 521 460 437 566 478 45 41 20,8 21,5 33,2 0 0 0,7 3 12,4 11,7 12,1 SO(CF?)SO e39 24 461 439 514 473 53 34 22,8 22,8 23,4 23,4 23,6 24,1 0,6 0,6 47,4 0,8 0,2 0,5 SO e35* 24 515 470 450 608 502 93 52 22 22 22,6 22,6 33,3 33,3 0,6 0,6 0,7 11,3 10,7 11,0 PR+soot,SO+EXPL e36* 24 554 470 449 626 479 72 30 22,6 22,6 23,1 46,8 47 0,5 0,7 24,2 23,7 24,0 PR, SO+EXPL
Table 6: Experiments summary, ethene-air 29% EXP conc. T4* Ti4 Ti5 T4max T5max dT4ma dT5ma tiinj 4 tiinj 5 tfinj 4 tfinj 5 IDT 4 IDT 5 dt inj4 dtinj5 dtphe IDT4ma IDT 4 IDT 4mean phenomena e57 29 300 281 301 282 1 1 NO e60 29 330 310 333 311 3 1 NO e63 29 360 339 366 342 6 3 0,0 SSSO e68 29 390 369 406 375 16 6 27,2 27,2 28 27,8 28,7 28,5 0,8 0,6 121,3 1,5 0,9 1,2 SO e72 29 422 400 464 411 42 11 34,3 34,2 34,9 34,8 34,2 0,6 0,6 61,2 0 -0,6 -0,3 SO e33 29 447 426 502 435 55 9 23,6 23,5 24 24,1 24,2 0,4 0,6 32,8 0,7 0,1 0,4 SO e40* 29 560 459 437 609 591 49 154 22,3 22,6 47,1 0,3 0,7 24,8 24,5 24,7 SO+CF?+EXPL 29 525 565 40 22,3 22,6 35,5 0,3 3 13,2 12,9 13,1 descript CF? e41* 29 558 460 438 627 594 69 156 28,5 29,1 48,6 0,6 0,7 20,1 19,5 19,8 SO+CF?+EXPL? 29 487 525 38 28,5 29,1 32,3 7 3,8 3,2 3,5 descript CF? e47* 29 545 460 437 626 604 81 167 26,6 27,1 39,9 0,5 0,9 13,3 12,8 13,1 PR, SO+EXPL e37* 29 540 469 449 622 486 82 37 43,3 43,8 53,5 0,5 0,7 10,2 9,7 10,0 PR+HF,SO+EXPL
Table 7: Experiments summary, ethene-air 34% EXP conc. T4* Ti4 Ti5 T4max T5max dT4ma dT5ma tiinj 4 tiinj 5 tfinj 4 tfinj 5 IDT 4 IDT 5 dt inj4 dtinj5 dtphe IDT4ma IDT 4 IDT 4mean phenomena e34 34 447 427 530 439 83 12 21,3 21,4 21,9 21,9 22 0,6 0,5 21 0,6 0,1 0,4 SO e44* 34 568 459 437 631 605 63 168 21,5 22 29,1 29,6 0,5 0,8 7,6 7,1 7,4 PR+HF,SO+EXPL e48* 34 550 459 437 627 612 77 175 30,7 30,6 31,2 31,3 39,3 39,7 0,5 0,7 1 8,7 8 8,4 PR+HF,SO+EXPL e43* 34 550 460 437 626 600 76 163 37,6 38,1 45,3 0,5 1 7,7 7,2 7,5 PR, SO+EXP+SO e38* 34 524 470 448 611 684 87 236 22,5 23,1 27,5 27,6 0,6 0,8 5 4,4 4,7 PR+HF,SO+EXPL

Project SAFEKINEX - Del No. 33, Add. B Additional experiments on the self-ignition temperature and the ignition delay time p. 11 (37)
Table 8: Experiments summary, ethene-air 40% EXP conc. T4* Ti4 Ti5 T4max T5max dT4ma dT5ma tiinj 4 tiinj 5 tfinj 4 tfinj 5 IDT 4 IDT 5 dt inj4 dtinj5 dtphe IDT4ma IDT 4 IDT 4mean phenomena e58 40 300 280 300 282 0 2 NO e61 40 330 310 333 311 3 1 21,5 22,3 45 0,0 SSSO e64 40 360 339 371 343 11 4 21,1 21 21,8 21,7 21,7 0,7 0,7 71,3 0,7 0 0,4 SO e69 40 390 368 422 374 32 6 42,8 42,8 43,6 43,5 44,3 0,8 0,7 51,7 1,5 0,8 1,2 SO e73 40 422 400 509 420 87 20 41 40,9 41,5 41,5 42 0,5 0,6 29 1,1 0,5 0,8 SO e75* 40 560 448 426 657 592 97 166 18,3 18,1 18,8 18,7 28,1 25,4 0,5 0,6 1 10 9,4 9,7 SO+EXPL1+EXPL2 40 520 612 92 18,3 18,1 18,8 18,7 25,2 0,7 7,1 6,5 6,8 descripEXPL1 e49* 40 545 459 437 603 599 58 162 48,4 48,9 52,8 0,5 1 4,4 3,9 4,2 SO+EXPL+SO e82* 40 522 473 450 669 651 147 201 20,5 21 22,7 0,5 1,1 2,2 1,7 2,0 PR+HF,SO+EXPL
Table 9: Experiments summary, ethene-air 60% EXP conc. T4* Ti4 Ti5 T4max T5max dT4ma dT5ma tiinj 4 tiinj 5 tfinj 4 tfinj 5 IDT 4 IDT 5 dt inj4 dtinj5 dtphe IDT4ma IDT 4 IDT 4mean phenomena
e65 60 360 339 380 344 20 5 36,2 36,1 36,9 36,8 36,9 0,7 0,7 45,1 0,8 0,1 0,4 SO e70 60 390 368 441 377 51 9 21,1 21 21,8 21,7 23 0,7 0,7 25 2 1,3 1,7 SO e53* 60 490 460 438 563 529 73 91 29,8 29,9 30,5 30,5 31,9 31,9 0,7 0,6 0,8 2 1,4 1,7 SO+EXPL
Table 10: Experiments summary, ethene-air 90% EXP conc. T4* Ti4 Ti5 T4max T5max dT4ma dT5ma tiinj 4 tiinj 5 tfinj 4 tfinj 5 IDT 4 IDT 5 dt inj4 dtinj5 dtphe IDT4ma IDT 4 IDT 4mean phenomena
e66 90 360 339 381 347 21 8 27,2 27,1 28 27,8 29,3 28,7 0,8 0,7 15,7 2,2 1,5 1,9 SO e71 90 390 368 413 377 23 9 21,2 21,1 21,9 21,8 23,1 0,7 0,7 5,9 2 1,3 1,7 SO?CF? e74 90 421 398 459 422 38 24 28,1 28 28,7 28,6 29,5 29,4 0,6 0,6 2,8 1,5 0,9 1,2 CFL+SO e76 90 449 426 490 464 41 38 21,5 21,3 22,1 22 22,7 22,7 0,6 0,7 1,6 1,4 0,7 1,1 CFL+SO e83 90 473 451 522 511 49 60 20,5 20,6 21,2 21,2 21,5 0,7 0,6 1,3 0,9 0,3 0,6 CF?,EXPL?
LEGEND: EXP: Number identification of the experiment. conc: Concentration of the fuel mixture in % v/v. T4*: Temperature of thermocouple 4 at the end of Slow Oxidation before another faster oxidation phenomenon (ºC). Ti4: Initial temperature of thermocouple 4 (ºC). Ti5: Initial temperature of thermocouple 5 (ºC). T4max: Maximum temperature of thermocouple 4 (ºC). T5max: Maximum temperature of thermocouple 5 (ºC). dT4: Maximum Temperature variation of thermocouple 4 (ºC). dT5: Maximum Temperature variation of thermocouple 5 (ºC). tiinj4: Initial injection time extracted from thermocouple 4 (s) . tiinj5: Initial injection time extracted from thermocouple 5 (s).

Project SAFEKINEX - Del No. 33, Add. B Additional experiments on the self-ignition temperature and the ignition delay time p. 12 (37)
tfinj4: Final injection time extracted from thermocouple 4 (s). tfinj5: Final injection time extracted from thermocouple 5 (s). IDT4: Initial time of the occurrence of oxidation phenomenon (fictitious IDT from start of recording) extracted from thermocouple 4 (s). IDT5: Initial time of the occurrence of oxidation phenomenon (fictitious IDT from start of recording) extracted from thermocouple 5 (s). dtinj 4: Injection time variation extracted from thermocouple 4 (s). dtinj5: Injection time variation extracted from thermocouple 5 (s). dtphe: time required for the increase of temperature of an oxidation phenomenon (s). IDT4ma: Maximum Ignition Delay time (“real” IDT using tiinj) extracted from thermocouple 4 (s). IDT4: Minimum Ignition Delay time (“real” IDT using tfinj) extracted from thermocouple 4 (s). IDT4mean: Arithmetical average of IDT4ma and IDT4 (s). Phenomena: Description of the Oxidation Phenomena. PR: Pressure release audible. HF: Hot flame visible. Underlined: Experiments done with covering wool in the top part of the vessel. * In these experiments, Slow Oxidation occurs before a faster oxidation phenomenon (explosion or Cool Flame). ** In this experiment the wool covering was placed during two days before performing he experiments there is some visible or audible information, this is indicated
before the physical description of the phenomena. NO: No Oxidation phenomena. SSSO: Very Slow Oxidation. SO: Slow Oxidation. SOdel: Slow Oxidation delayed. EXPL: Explosion. CF: Cool Flame. CFL: Cool Flame Long duration (rather broad peak of moderate height). MCF: Multiple Cool Flame. MCFsmooth: Multiple Cool Flame smooth. Using the sign “?”,the lack of audible or visual evidence of the “fast” oxidation phenomena and its relative long developing time cause the doubt about the possibility that it could be a sign of Cool Flame.

Project SAFEKINEX - Del No. 33, Add. B Additional experiments on the self-ignition temperature and the ignition delay time p. 13 (37)
3.2.2 TEMPERATURE VERSUS TIME EXPERIMENTAL PROFILES In this section are presented examples of the different types of temperature versus time profiles obtained for the experiments summarised before. For simplifying the visual observation of the figures, they just show the signals of thermocouples 1, 4 and 5. In table 11 are related each type of profile with its experiment and number of figure. Table 11: Temperature-time ethene experiments profiles. DESCRIPTION TEMPERATURE-
TIME PROFILE EXPERIMENT FIGURE
SSSO e62 Fig2 SO e16 Fig3 PR+HF, SO+EXPL PR, SO+EXPL PR+HF+soot, SO+EXPL
e25
Fig4
PR+HF, SO+EXPL+SO e43 Fig5 PR+HF, SO+EXPL?+SOdelayed e26 Fig6 SO+EXPL1+EXPL2 e75 Fig7 SO+CF?+SO e78 Fig8 SO+CF?+EXPL e20 Fig9 SO(CF?)SO e30 Fig10 SO?,CF? e71 Fig11 CF?,EXPL? e74 Fig12 CF?,EXPL?+SO e76 Fig13
0 100 200 300 400 500 600325
330
335
340
345
350
355
360
365
time (s)
tem
pera
ture
(o C)
TC1TC4TC5
Figure 2: Temperature-time profile, Exp. e62, ethene-air 19%, T4i=360ºC, SSSO

Project SAFEKINEX - Del No. 33, Add. B Additional experiments on the self-ignition temperature and the ignition delay time p. 14 (37)
0 50 100 150 200 250 300 350420
440
460
480
500
520
540
time (s)
tem
pera
ture
(o C)
TC1TC4TC5
Figure 3: Temperature-time profile, Exp e16, ethene-air 19%, T4i=471ºC, SO
0 50 100 150 200 250 300 350 400400
450
500
550
600
650
700
time (s)
tem
pera
ture
(o C)
TC1TC4TC5
Figure 4: Temperature-time profile, Exp. e25, ethene-air 19%, T4i=482ºC, PR+HF, SO+EXPL
0 50 100 150 200 250 300 350 400400
450
500
550
600
650
time (s)
tem
pera
ture
(o C)
TC1TC4TC5
Figure 5: Temperature-time profile, Exp. e43, ethene-air 34%, T4i=460ºC, PR, SO+EXPL+SO

Project SAFEKINEX - Del No. 33, Add. B Additional experiments on the self-ignition temperature and the ignition delay time p. 15 (37)
0 100 200 300 400 500 600 700 800440
460
480
500
520
540
560
580
600
620
640
time (s)
tem
pera
ture
(o C)
TC1TC4TC5
Figure 6: Temperature-time profile, Exp. e26, ethene-air 19%, T4i=491ºC, PR+HF, SO+EXPL?+SO delayed
0 20 40 60 80 100 120 140 160 180 200400
450
500
550
600
650
700
time (s)
tem
pera
ture
(o C)
p
TC1TC4TC5
Figure 7: Temperature-time profile, Exp. e75, ethene-air 40%, T4i=448ºC, SO+EXPL1+EXPL2
0 50 100 150 200 250 300 350400
450
500
550
600
650
700
750
time (s)
tem
pera
ture
(o C)
p
TC1TC4TC5
Figure 8: Temperature-time profile, Exp. e78, ethene-air 19%, T4i=476ºC, SO+CF?+SO

Project SAFEKINEX - Del No. 33, Add. B Additional experiments on the self-ignition temperature and the ignition delay time p. 16 (37)
0 50 100 150 200 250 300 350 400400
450
500
550
600
650
time (s)
tem
pera
ture
(o C)
TC1TC4TC5
Figure 9: Temperature-time profile, Exp. e20, ethene-air 19%, T4i=479ºC, SO+CF?+SO
0 50 100 150 200 250 300 350 400400
420
440
460
480
500
520
time (s)
tem
pera
ture
(o C)
TC1TC4TC5
Figure 10: Temperature-time profile, Exp. e30, ethene-air 24%, T4i=448ºC, SO(CF?)SO
0 50 100 150 200 250 300330
340
350
360
370
380
390
400
410
420
time (s)
tem
pera
ture
(o C)
TC1TC4TC5
Figure 11: Temperature-time profile, Exp. e71, ethene-air 90%, T4i=390ºC, SO?,CF?

Project SAFEKINEX - Del No. 33, Add. B Additional experiments on the self-ignition temperature and the ignition delay time p. 17 (37)
0 50 100 150 200 250 300360
370
380
390
400
410
420
430
440
450
460
time (s)
tem
pera
ture
(o C)
TC1TC4TC5
Figure 12: Temperature-time profile, Exp. e74, ethene-air 90%, T4i=421ºC, CFL+SO.
0 50 100 150 200 250 300390
400
410
420
430
440
450
460
470
480
490
time (s)
tem
pera
ture
(o C)
TC1TC4TC5
Figure 13: Temperature-time profile, Exp. e76, ethene-air 90%, T4i=449ºC, CFL+SO.

Project SAFEKINEX - Del No. 33, Add. B Additional experiments on the self-ignition temperature and the ignition delay time p. 18 (37)
3.2.3 INTERPRETATION AND DISCUSSION OF RESULTS On the basis of the data compiled it has been possible to summarise the various ranges of dT4 and dtphe (the time duration to the maximum temperature of the phenomenon) related to each kind of phenomenon:
SSS0 : dT4max [3-6] ºC
SO : dT4max [5-83] ºC, dtphe [21-262] s
CF : dT4max [23-199], dtphe [1.1-5.9] s (dtphe average 2,8 s)
EXPL: dT4max [63-175] ºC, dtphe [0,5-1.1] s
For the case of explosion, these ranges have been extracted from the experiments in which there was an audible or visual evidence of explosion. Also it has to be realised that the temperature increase in case of explosion is so fast that the peak temperature must have been much higher than indicated. For the experiments for which there was no “direct” evidence but just the thermocouple signals, the criterion of the dtphe has been used. If dtphe is inside the range shown above, the phenomenon is classified as Explosion, if it is not, it is considered Cool Flame. For this reason, the experiments e49, e53 and e75 have been considered as explosions although there was no direct evidence, and the experiments: e20, e30, e40, e41, e42, e71, e74, e76, e78, e80, e81 and e83, which have dtphe larger than 1.1 (in fact the average value is 2,8), have been considered as possible Cool Flames (see profiles in chapter 3.2.2). As can be seen in the experiments summary table, in all ethene experiments except for the ones performed at 90% concentration of ethene, for all kinds of oxidation phenomena developed, the first step is always SO since the very beginning after injection (nearly 0 seconds). It has to be taken into account that the injection time is just to the value of 0,6 s, therefore all IDT under and even close over this value have been considered to be IDT = 0. The following figures show the IDT versus temperature for different ethene -air mixtures. For all the experiments in which in addition to SO also another, faster oxidation phenomenon happened, the IDT has always been considered as that of the faster one, (otherwise all values would have been 0). In figure 14, there appears to be a NTC-region between 746 K (473 ºC) and 755 K (482 ºC). For temperatures lower than these the phenomena observed were just SO with an IDT of nearly 0 s. Inside the NTC-region Explosions (EXPL) have been observed as well as what we consider to be Cool Flames (CF). For temperatures higher than 753 K (480 ºC), all the phenomena observed were explosions with audible or visual signal evidence or both types. It is important to remark that the reproducibility is acceptable in the pure SO and pure EXPL regions but not very good in the NTC-region, in which Cool Flame phenomena seem possible.

Project SAFEKINEX - Del No. 33, Add. B Additional experiments on the self-ignition temperature and the ignition delay time p. 19 (37)
IDT versus Temperatureethene-air 19%
0,0
5,0
10,0
15,0
20,0
620 640 660 680 700 720 740 760 780
Temperature (K)
IDT
(s)
19%
Figure 14: IDT versus temperature ethene-air 19% It is important to remark that the following figures present results of the experiments performed at higher concentrations. It has not been possible to repeat all the experiments twice for checking reproducibility.
IDT versus temperatureethene-air 24%
0,05,0
10,015,020,025,030,0
715 720 725 730 735 740 745
Temperature (K)
IDT
(s)
24%
Figure 15: IDT versus temperature ethene-air 24% In figure 15, where the IDT versus temperature for mixtures of 24% ethene in air is presented, the lack of reproducibility is evident. The points are very erratic. There are cases in which a kind of Cool Flame appears during the normal evolution of SO (profile called SO (CF?)SO, see the chapter 3.2.2). This fact may prove that the occurrence of these Cool Flames is highly sensitive to ambient conditions that can vary the balance between heat loss and heat production. From this graph it is not possible to deduce the range of a possible NTC-region.
SO
SO+CF?,EXPL?
SO+EXPL
SO SO
SO(CF)SO
SO(CF)SO SO+EXPL

Project SAFEKINEX - Del No. 33, Add. B Additional experiments on the self-ignition temperature and the ignition delay time p. 20 (37)
IDT versus temperatureethene-air 29%
0,02,04,06,08,0
10,012,014,0
620 640 660 680 700 720 740 760
Temperature (K)
IDT
(s)
29%
Figure 16: IDT versus temperature ethene-air 29% In Figure 16, with a composition still inside the explosive range, the same effect appears to happen as described at figure 15. In this case the erratic points are related also to possible occurrence of Cool Flames but with a different profile described as SO+CF?+EXP (see chapter 3.2.2). The NTC-region could be considered between 720 K and 733 K (447 -460 ºC.)
IDT versus temperature ethene-air 34%
0,0
2,0
4,0
6,0
8,0
10,0
715 720 725 730 735 740 745
Temperature (K)
IDT
(s)
34%
Figure 17: IDT versus temperature ethene-air 34% In Figure 17, is shown the IDT for an ethene -air 34% mixture. This concentration is outside the explosive range determined by BAM at 20 °C, but still inside the explosive range proposed by ISDS. As can be seen in table 5, all the phenomena observed at this concentration were visual or audible explosions. The NTC-region could be considered to lie between 720 K and 732 K (447-459 ºC).
SO SO+EXPL
SO
SO+CF?,EXPL?
SO+EXPL

Project SAFEKINEX - Del No. 33, Add. B Additional experiments on the self-ignition temperature and the ignition delay time p. 21 (37)
IDT versus temperature ethene-air 40%
0,0
2,0
4,0
6,0
8,0
600 620 640 660 680 700 720 740 760
Temperature (K)
IDT
(s)
40%
Figure 18: IDT versus temperature ethene-air 40% Figure 18 illustrates the IDT versus time of a mixture ethene -air 40%. This fuel concentration is outside both BAM and ISDS explosive ranges (at 20 °C, at higher temperature the range will be wider). Explosive phenomena were observed inside the NTC-region and at higher temperature. As it has been said before, from the study of the data it can be deduced that no Cool Flame occurred during these experiments but just explosions although not in all cases there is a “direct evidence” of that. The NTC-region could be considered to be between 695 K and 721 K (422-448 ºC).
IDT versus temperature ethene-air 90%
0,0
0,5
1,0
1,5
2,0
600 650 700 750 800
Temperature (K)
IDT
(s)
90%
Figure 19: IDT versus temperature ethene-air 90% Also in the case showed in figure 19, ethene-air 90 %, the mixture tested is clearly outside the flammable ranges. As NTC-region could be considered the range between 633 K and 663 K (360-390 ºC). Probably this range is larger in comparison with the rest of the series, due to the lack of intermediate experiments. Inside the NTC-region as well after it, several oxidation phenomena were found to be possible Cool Flames because of the long time duration of their increase of temperature (see temperature-time profiles in chapter 3.2.2). The peculiarities here are the fact that before the “fast” oxidation phenomena observed, they were not preceded by Slow Oxidation, and on the other hand the low values of IDT.
SO
SO+EXPL
SO
CF?,EXPL

Project SAFEKINEX - Del No. 33, Add. B Additional experiments on the self-ignition temperature and the ignition delay time p. 22 (37)
IDT versus temperature ethene-airethene-air at different concentrations %v/v
0,02,04,06,08,0
10,012,014,016,018,020,0
620 630 640 650 660 670 680 690 700 710 720 730 740 750 760 770 780
temperature (K)
IDT
(s)
19%29%34%40%90%19%, 1.3 bar
Figure 20: IDT versus temperature for various ethene-air concentrations In figure 20, a comparison between the IDT versus temperature behaviour of the various concentrations studied is presented. As can be seen, 24% and 60% are not included because of the lack of reproducibility of the first and the small number of experiments of the second. The graph shows the tendency to lower IDT-values and temperatures with the increase of ethene concentration. The point indicated as “19%, 1.3 bar” is an experiment performed by BAM and presented in Deliverable No. 5. The experiment shows the IDT of an 19% ethene -air mixture, in a 200 ml cylindrical steel vessel at 1,3 bar. It can be seen that the value obtained is consistent with the present data. BAM didn’t obtain explosion at 1 bar in the range of temperatures allowed in their equipment. Because using a smaller and different shaped vessel, the temperature required to observe fast oxidation phenomena increases. As a consequence, in order to obtain a lower Ignition Temperature, the ambient pressure had to be increased. This finding confirms earlier observations with n-butane. At temperatures below the NTC-range there is good agreement in IDT as a function of temperature, between the BAM and TUDelft vessels which differ in material (stainless steel versus quartz glass) but have the same volume (200 ml vs. 500 ml).
Temperature of first "fast" oxidation phenomenon (CF or EXP) versus concenration
640660680700720740760
0% 20% 40% 60% 80% 100%concentration (%volume)
Tem
pera
ture
(k)
Figure 21: Temperature of the first “fast” oxidation phenomenon (CF or EXP) versus concentration. Finally, in figure 21, a graph is presented where the temperature is shown in which the first “fast” oxidation phenomenon was observed for each concentration tested. As “fast” oxidation phenomena
UEL, BAM
UEL, ISDS

Project SAFEKINEX - Del No. 33, Add. B Additional experiments on the self-ignition temperature and the ignition delay time p. 23 (37)
are intended all those temperature-time profiles that have been classified as Cool Flames or Explosions. As can be seen, for ethene-air mixtures outside the flammable range fast oxidation phenomena were observed, even at lower temperatures. At 40% ethene audible explosion was detected (exp e82), and at 90 % although no visual or audible evidence, the temperature-time profiles clearly exhibited “fast” oxidation phenomena (Explosions or Cool Flames). It is important to note the fact that the explosive ranges presented in table 3 were at ambient conditions (20 ºC, 1 bar) and as it is well known, the UEL is specially affected by the ambient temperature in the way that an increase of temperature should produce an increase of the UEL value. On the other hand an explosive range is, by definition, the concentration in which exist a sustained flame propagation, therefore it may be possible that some of the phenomena detected for instance at an ethene concentration of 90 %, were not sustained flame propagations.

Project SAFEKINEX - Del No. 33, Add. B Additional experiments on the self-ignition temperature and the ignition delay time p. 24 (37)
4 METHANE EXPERIMENTS
4.1 INTRODUCTION The oxidation behaviour of methane-air mixtures have been tested for 4 different concentrations: 14%, 25%, 40%, and 90%. Concentration expressed in % v/v: The experiments have been performed in a range of temperatures of 472-658 ºC (745-931 K). In the case of methane-air mixtures with a concentration of 14%, it has been possible to repeat each experiment at least twice for checking reproducibility. However for the remaining concentrations, due to the lack of time, it has not been possible do that for all the experiments. In table 12, are presented the flammable ranges for methane in air, at ambient conditions (20 ºC, 1 bar), given by BAM (Federal Institute for Materials Research and Testing) and ISDS (International Safety Data Sheets prepared in the context of cooperation between the International Programme (IPCS) on Chemical Safety and the European Commission). Table 12: Flammable ranges according to BAM and ISDS
BAM ISDS UEL v/v % 16.8 15 LEL v/v % 4.6 5
4.2 RESULTS
4.2.1 EXPERIMENTS SUMMARY In this chapter are presented, by means of tables (see tables 13 to 16), the results of all of the experiments performed with methane-air mixtures. The legend of these tables is shown in pages 11, 12 of this report. For the better comprehension of the tables is important to take into account the comments reported on pages 7, 8 of this report.
Concentration = Pmethane/Ptotal *100
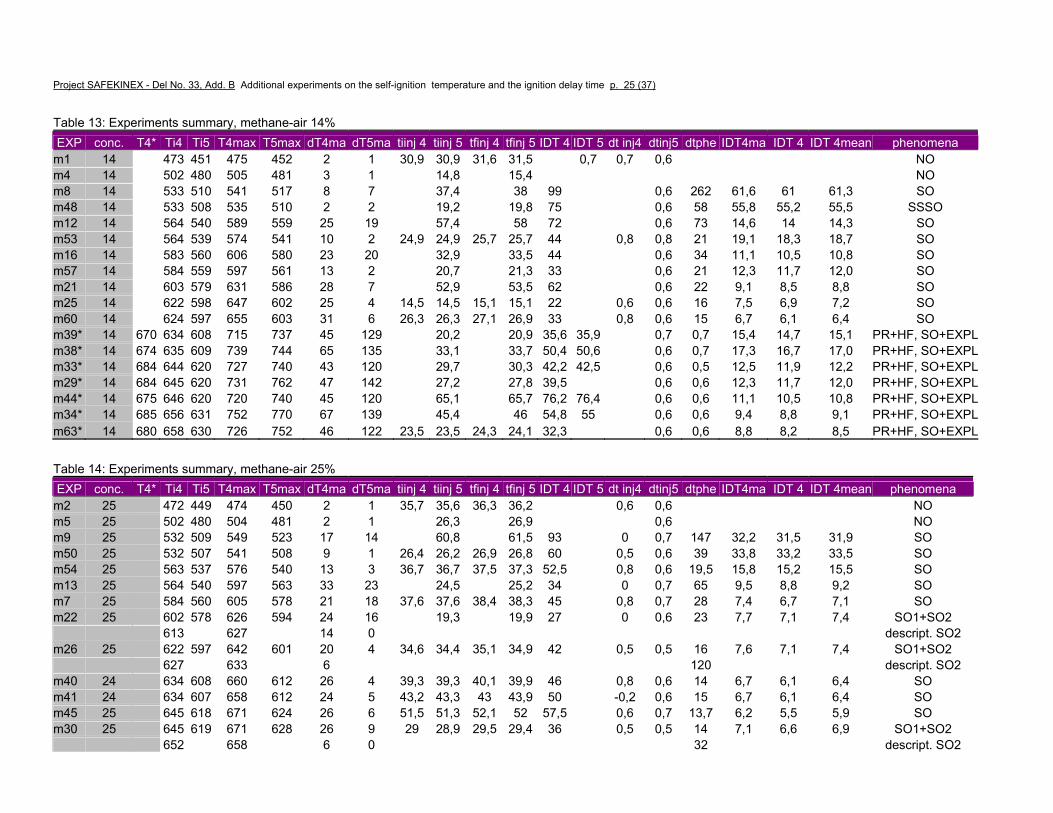
Project SAFEKINEX - Del No. 33, Add. B Additional experiments on the self-ignition temperature and the ignition delay time p. 25 (37) Table 13: Experiments summary, methane-air 14% EXP conc. T4* Ti4 Ti5 T4max T5max dT4ma dT5ma tiinj 4 tiinj 5 tfinj 4 tfinj 5 IDT 4 IDT 5 dt inj4 dtinj5 dtphe IDT4ma IDT 4 IDT 4mean phenomena
m1 14 473 451 475 452 2 1 30,9 30,9 31,6 31,5 0,7 0,7 0,6 NO m4 14 502 480 505 481 3 1 14,8 15,4 NO m8 14 533 510 541 517 8 7 37,4 38 99 0,6 262 61,6 61 61,3 SO m48 14 533 508 535 510 2 2 19,2 19,8 75 0,6 58 55,8 55,2 55,5 SSSO m12 14 564 540 589 559 25 19 57,4 58 72 0,6 73 14,6 14 14,3 SO m53 14 564 539 574 541 10 2 24,9 24,9 25,7 25,7 44 0,8 0,8 21 19,1 18,3 18,7 SO m16 14 583 560 606 580 23 20 32,9 33,5 44 0,6 34 11,1 10,5 10,8 SO m57 14 584 559 597 561 13 2 20,7 21,3 33 0,6 21 12,3 11,7 12,0 SO m21 14 603 579 631 586 28 7 52,9 53,5 62 0,6 22 9,1 8,5 8,8 SO m25 14 622 598 647 602 25 4 14,5 14,5 15,1 15,1 22 0,6 0,6 16 7,5 6,9 7,2 SO m60 14 624 597 655 603 31 6 26,3 26,3 27,1 26,9 33 0,8 0,6 15 6,7 6,1 6,4 SO m39* 14 670 634 608 715 737 45 129 20,2 20,9 35,6 35,9 0,7 0,7 15,4 14,7 15,1 PR+HF, SO+EXPLm38* 14 674 635 609 739 744 65 135 33,1 33,7 50,4 50,6 0,6 0,7 17,3 16,7 17,0 PR+HF, SO+EXPLm33* 14 684 644 620 727 740 43 120 29,7 30,3 42,2 42,5 0,6 0,5 12,5 11,9 12,2 PR+HF, SO+EXPLm29* 14 684 645 620 731 762 47 142 27,2 27,8 39,5 0,6 0,6 12,3 11,7 12,0 PR+HF, SO+EXPLm44* 14 675 646 620 720 740 45 120 65,1 65,7 76,2 76,4 0,6 0,6 11,1 10,5 10,8 PR+HF, SO+EXPLm34* 14 685 656 631 752 770 67 139 45,4 46 54,8 55 0,6 0,6 9,4 8,8 9,1 PR+HF, SO+EXPLm63* 14 680 658 630 726 752 46 122 23,5 23,5 24,3 24,1 32,3 0,6 0,6 8,8 8,2 8,5 PR+HF, SO+EXPL
Table 14: Experiments summary, methane-air 25% EXP conc. T4* Ti4 Ti5 T4max T5max dT4ma dT5ma tiinj 4 tiinj 5 tfinj 4 tfinj 5 IDT 4 IDT 5 dt inj4 dtinj5 dtphe IDT4ma IDT 4 IDT 4mean phenomena
m2 25 472 449 474 450 2 1 35,7 35,6 36,3 36,2 0,6 0,6 NO m5 25 502 480 504 481 2 1 26,3 26,9 0,6 NO m9 25 532 509 549 523 17 14 60,8 61,5 93 0 0,7 147 32,2 31,5 31,9 SO m50 25 532 507 541 508 9 1 26,4 26,2 26,9 26,8 60 0,5 0,6 39 33,8 33,2 33,5 SO m54 25 563 537 576 540 13 3 36,7 36,7 37,5 37,3 52,5 0,8 0,6 19,5 15,8 15,2 15,5 SO m13 25 564 540 597 563 33 23 24,5 25,2 34 0 0,7 65 9,5 8,8 9,2 SO m7 25 584 560 605 578 21 18 37,6 37,6 38,4 38,3 45 0,8 0,7 28 7,4 6,7 7,1 SO m22 25 602 578 626 594 24 16 19,3 19,9 27 0 0,6 23 7,7 7,1 7,4 SO1+SO2 613 627 14 0 descript. SO2 m26 25 622 597 642 601 20 4 34,6 34,4 35,1 34,9 42 0,5 0,5 16 7,6 7,1 7,4 SO1+SO2 627 633 6 120 descript. SO2 m40 24 634 608 660 612 26 4 39,3 39,3 40,1 39,9 46 0,8 0,6 14 6,7 6,1 6,4 SO m41 24 634 607 658 612 24 5 43,2 43,3 43 43,9 50 -0,2 0,6 15 6,7 6,1 6,4 SO m45 25 645 618 671 624 26 6 51,5 51,3 52,1 52 57,5 0,6 0,7 13,7 6,2 5,5 5,9 SO m30 25 645 619 671 628 26 9 29 28,9 29,5 29,4 36 0,5 0,5 14 7,1 6,6 6,9 SO1+SO2 652 658 6 0 32 descript. SO2

Project SAFEKINEX - Del No. 33, Add. B Additional experiments on the self-ignition temperature and the ignition delay time p. 26 (37)
m35 25 657 630 687 637 30 7 43,2 43,2 43,9 43,8 48,4 0,7 0,6 12,9 5,2 4,6 4,9 SO1+SO2 664 669 5 0 23 descript. SO2
Table 15: Experiments summary, methane-air 40% EXP conc. T4* Ti4 Ti5 T4max T5max dT4ma dT5ma tiinj 4 tiinj 5 tfinj 4 tfinj 5 IDT 4 IDT 5 dt inj4 dtinj5 dtphe IDT4ma IDT 4 IDT 4mean phenomena
m3 40 472 448 474 450 2 2 44,5 44,3 45,1 45 0,6 0,7 NO m7 40 502 479 507 482 5 3 20,5 20,3 21,1 21 0,6 0,7 SSSO m10 40 533 510 553 525 20 15 21,7 21,6 22,3 22,3 40 0,6 0,7 93 18,4 17,7 18,1 SO m51 40 533 509 540 511 7 2 19,3 19,3 20,1 19,9 45 0,8 0,6 30 25,7 25,1 25,4 SO m55 40 563 536 575 541 12 5 43,2 43 43,8 43,6 56 0,6 0,6 20 13 12,4 12,7 SO1+SO2 m14 40 564 540 596 561 32 21 44,4 44,3 45 44,9 55 0,6 0,6 51 10,7 10,1 10,4 SO1+SO2 592 600 8 0 0 0 78 0 0 descript. SO2 m59 40 583 556 603 563 20 7 33,2 33,2 34 33,8 44 0,8 0,6 30 10,8 10,2 10,5 SO1+SO2 m19 40 584 560 600 571 16 11 40,7 40,5 41,2 41,1 50 0,5 0,6 26 9,5 8,9 9,2 SO1+SO2 596 605 9 0 0 0 0 descript. SO2 m23 40 602 578 666 623 64 45 36,1 35,9 36,5 36,5 42 0,4 0,6 6,1 5,5 5,8 2stageSO m27 40 622 597 674 607 52 10 24,5 24,7 25,4 25,3 32 0,9 0,6 51 7,3 6,7 7,0 2stageSO m61 40 623 596 638 600 15 4 10 9,8 10,6 10,4 18 0,6 0,6 19,5 8,2 7,6 7,9 SO m42 40 634 608 652 615 18 7 31,8 31,7 32,4 32,3 38 0,6 0,6 24,5 6,3 5,7 6,0 SO1+SO2 m31 40 645 619 693 641 48 22 28,7 28,6 29,3 29,2 34 0,6 0,6 38 5,4 4,8 5,1 SO m46 40 645 617 665 625 20 8 10,5 10,3 11,1 11 16,2 0,6 0,7 21,8 5,9 5,2 5,6 SO m36 40 657 630 684 645 27 15 46,4 46,3 47,1 46,9 51,2 0,7 0,6 36,3 4,9 4,3 4,6 SO
Table 16: Experiments summary, methane-air 90% EXP conc. T4* Ti4 Ti5 T4max T5max dT4ma dT5ma tiinj 4 tiinj 5 tfinj 4 tfinj 5 IDT 4 IDT 5 dt inj4 dtinj5 dtphe IDT4ma IDT 4 IDT 4mean phenomena
m6 90 502 479 506 483 4 4 29,1 29 29,8 29,6 0,7 0,6 NO m11 90 532 509 539 514 7 5 36,1 36 36,7 36,6 SSSO m52 90 533 507 536 509 3 2 SSSO m15 90 575 563 539 579 545 4 6 30,1 30 30,7 30,6 388 0,6 0,6 24 358 357,4 357,7 SO +(SO1+SO2) 574 585 11 0 32 descript SO2 m56 90 563 536 571 540 8 4 35,7 35,6 36,3 36,2 52 0,6 0,6 173 16,4 15,8 16,1 SSSO m58 90 584 558 590 560 6 2 28,4 28,4 29,1 29 55 0,7 0,6 26,6 26 26,3 SSSO m20 90 592 584 560 616 567 24 7 31,3 31,3 32 31,9 158 0,7 0,6 3,5 126,7 126,1 126,4 MCF? m24 90 602 578 625 594 23 16 32,8 32,8 33,5 33,4 37,8 0,7 0,6 2,2 5 4,4 4,7 MCF? 619 641 22 0 0 m62 90 624 596 630 600 6 4 26,1 26,1 26,9 26,7 31 0,8 0,6 4,9 4,3 4,6 SSSO m28 90 623 597 642 606 19 9 27,4 27,3 28 27,9 32 0,6 0,6 2 4,7 4,1 4,4 MCF?

Project SAFEKINEX - Del No. 33, Add. B Additional experiments on the self-ignition temperature and the ignition delay time p. 27 (37)
636 653 17 0 1,6 0 0 m43 90 635 608 644 613 9 5 10,9 10,9 11,5 11,4 16,2 0,6 0,5 7,8 5,3 4,8 5,1 MCFs? m47 90 645 617 655 624 10 7 22,2 22,1 22,8 22,7 28 0,6 0,6 10 5,9 5,3 5,6 MCFs? m32 90 645 618 661 629 16 11 39,3 39,2 39,9 39,8 43,6 0,6 0,6 4,7 4,4 3,8 4,1 MCF? m37 90 657 629 670 637 13 8 21,9 21,9 22,5 22,5 27,5 0,6 0,6 5,5 5,6 5 5,3 MCF? m64 90 657 628 666 632 9 4 20,4 20,3 21 20,9 31 0,6 0,6 10,7 10,1 10,4 SO

Project SAFEKINEX - Del No. 33, Add. B Additional experiments on the self-ignition temperature and the ignition delay time p. 28 (37)
4.2.2 TEMPERATURE VERSUS TIME EXPERIMENTAL PROFILES In this section examples of the different types of temperature versus time profiles are presented for the experiments summarised earlier implying the visual observation of the figures, only the signals of thermocouples 1, 4 and 5 are shown. In table 17 each type of profile with its experiment and number of figure are correlated. Table 17: temperature-time methane experiments profiles.
DESCRIPTION TEMPERATURE-TIME PROFILE
EXPERIMENT FIGURE
SSSO m7 Fig 22 SO m10 Fig 23 SO1+SO2 m14 Fig 24 SO+(SO1+SO2) m15 Fig 25 2stageSO m23 Fig 26 PR+HF, SO+EXPL m39 Fig 27
MCF? m20 Fig 28 MCFsmooth m43 Fig 29
0 50 100 150 200 250 300 350 400 450 500450
460
470
480
490
500
510
time (s)
tem
pera
ture
(o C)
Exp m7, methane-air 40%, T4i=502, SSSO
TC1TC4TC5
Figure 22: Temperature-time profile, Exp. m7, methane-air 40%, T4i=502ºC, SSSO
0 50 100 150 200 250 300 350 400 450480
490
500
510
520
530
540
550
560
time (s)
tem
pera
ture
(o C)
Exp m10, methane-air 40%, T4i=533 ºC, SO
TC1TC4TC5
Figure 23: Temperature-time profile, Exp. m10, methane-air 40%, T4i=533ºC, SO

Project SAFEKINEX - Del No. 33, Add. B Additional experiments on the self-ignition temperature and the ignition delay time p. 29 (37)
0 50 100 150 200 250 300 350 400 450510
520
530
540
550
560
570
580
590
600
time (s)
tem
pera
ture
(o C)
TC1TC4TC5
Figure 24: Temperature-time profile, Exp. m14, methane-air 40%, T4i=564ºC, SO1+SO2
0 100 200 300 400 500 600500
510
520
530
540
550
560
570
580
590
time (s)
tem
pera
ture
(o C)
TC1TC4TC5
Figure 25: Temperature-time profile, Exp. m15, methane-air 90%, T4i=563ºC, SO+(SO1+SO2)
0 50 100 150 200 250 300 350540
560
580
600
620
640
660
680
time (s)
tem
pera
ture
(o C)
TC1TC4TC5
Figure 26: Temperature-time profile, Exp. m23, methane-air 40%, T4i=602ºC, 2 stage SO

Project SAFEKINEX - Del No. 33, Add. B Additional experiments on the self-ignition temperature and the ignition delay time p. 30 (37)
0 50 100 150 200 250 300580
600
620
640
660
680
700
720
740
time (s)
tem
pera
ture
(o C)
TC1TC4TC5
Figure 27: Temperature-time profile, Exp. m39, methane-air 14%, T4i=634ºC, PR+-HF, SO+EXPL
0 100 200 300 400 500 600530
540
550
560
570
580
590
600
610
620
time (s)
tem
pera
ture
(o C)
TC1TC4TC5
Figure 28: Temperature-time profile, Exp. m20, methane-air 90%, T4i=584ºC, MCF?
0 50 100 150 200 250 300 350570
580
590
600
610
620
630
640
650
time (s)
tem
pera
ture
(o C)
TC1TC4TC5
Figure 29: Temperature-time profile, Exp. m43, methane-air 90%, T4i=635ºC, MCF smooth

Project SAFEKINEX - Del No. 33, Add. B Additional experiments on the self-ignition temperature and the ignition delay time p. 31 (37)
4.2.3 INTERPRETATION AND DISCUSSION OF RESULTS As for the ethene-air experiments, it has been possible to derive the dT4 and the dtphe ranges related to each kind of phenomenon for the methane-air system: -SSSO: [2-8] º C.
-SO (all kinds of slow oxidation described in chapter 4.2.2): [6-64] ºC,
[14-262] s.
-MCF: [13-23] º C, [1,6-5,5] s, (dtphe average 3,2 s).
-EXPL: [43-67] ºC, [0,5-0,7] s.
These dtphe ranges are very similar to the ones obtained for ethene experiments. However the same cannot be said about dT4 for the “fast” oxidation phenomena (MCF? and Explosion) because for methane-air experiments the temperature increase has been clearly smaller than in case of ethene. The following figures show the IDT versus temperature for different methane-air mixtures. For all the experiments in which, in addition to SO, another faster oxidation phenomenon happened, the IDT has always been considered to be the faster one as in the ethene experiments. However, in the methane experiments, the Slow Oxidation that precedes the faster oxidation phenomena, doesn’t start since the very beginning, as in ethene experiments, but it has also an IDT. This IDT has not been shown in the experiments summary tables (tables 13 to 16) to avoid possible confusion but they are presented in table 18. Table 18: IDT of Slow Oxidation phenomenon before explosion
EXPERIMENT T4i (ºC) IDTslow oxidation (s) PHENOMENA m39 634 6,1 PR+HF, SO+EXPL m38 635 6,3 PR+HF, SO+EXPL m33 644 4,4 PR+HF, SO+EXPL m29 645 5,2 PR+HF, SO+EXPL m44 646 5,3 PR+HF, SO+EXPL m34 656 5,5 PR+HF, SO+EXPL m63 658 4,4 PR+HF, SO+EXPL
It would be necessary to perform new experiments at still higher temperatures to evaluate a probable decreasing tendency of IDT with the increase of temperature. In figure 30, the IDT versus temperature for 14% methane-air mixtures is presented. Being inside the Flammable range, the first oxidation phenomena is detected at 806 K (533 ºC) and it is clear SO. The first temperature in which an explosion is observed it is 907 K (634 ºC). The NTC-region spreads between 897-907 K (624-634 ºC). No Cool Flames have been detected for this mixture, just Slow Oxidations and Explosions. As can be seen the reproducibility of the experiments is good.

Project SAFEKINEX - Del No. 33, Add. B Additional experiments on the self-ignition temperature and the ignition delay time p. 32 (37)
IDT versus temperature methane-air 14%
0,010,020,030,040,050,060,070,0
780 830 880 930
Temperature (K)
IDT
(s)
14%
Figure 30: IDT versus temperature methane-air 14% In figure 31, shown below, the methane-air mixture is more fuel rich and outside the flammable range (at ambient temperature). In this case no fast oxidation phenomena (Cool Flame or Explosion) have been detected and the NTC-region is not distinguishable. Just three points have been reproduced by duplo experiments at 805, 907 and 918 K with acceptable results
IDT versus temperaturemethane-air 25%
0,05,0
10,015,020,025,030,035,040,0
780 830 880 930
Temperature (K)
IDT
(s)
25%
Figure 31: IDT versus temperature methane-air 25% In figure 32, the IDT-values versus temperature at 40% methane-air are illustrated. The results obtained are very similar to the ones at 25 %. Also in this case it is very difficult to talk about existence of a NTC-region, although the temperature range of 875-895 K (602-622 ºC) could be considered so. It has to be taken into account that there is no experiment at an intermediate temperature, therefore the NTC-region could be narrower.
PR+HF, SO+EXP
SO
SO SO1+SO2

Project SAFEKINEX - Del No. 33, Add. B Additional experiments on the self-ignition temperature and the ignition delay time p. 33 (37)
IDT versus temperaturemethane-air 40%
0,05,0
10,015,020,025,030,0
780 830 880 930 980
Temperature (K)
IDT
(s)
40%
Figure 32: IDT versus temperature methane-air 40% In figure 33, the results of the experiments performed with very rich methane-air mixtures (90 %) are shown. At this concentration some profiles look like Multiple Cool Flames or Multiple Cool Flame smooth (see figures 28, 29 in chapter 4.2.2), both types of profiles were not observed in ethene -air mixtures. In addition, it’s interesting to remark that, similar to the case of ethene -air mixtures, Cool Flames and Multiple Cool Flames profiles are difficult to reproduce. Specifically in figure 33, it can be seen that in a lot of cases for the same temperature one time a MCF-like phenomenon has been obtained and in another time Slow or Very Slow oxidation, although the IDTs in general were very similar4. Also in this case it is difficult to determine the existence of NTC-region. Very Slow Oxidation was observed for this concentration (see table 16) at temperatures lower than 836 K, although they are not presented in the graph because of the difficulty to determine the exact value of the IDT.
IDT versus temperaturemethane-air 90 %
0,020,040,060,080,0
100,0120,0140,0
820 840 860 880 900 920 940
Temperature (K)
IDT
(s)
90%
Figure 33: IDT versus temperature methane-air 90% In figure 34 is presented a comparative graph of IDT versus temperature for the different methane-air concentrations studied. An IDT decrease with an increase of temperature signifying the existence of an NTC-region is only clear for the 14% concentration is clear. The IDTs are very similar for all concentrations. Only at low temperature there seems to be difference. The IDT
4 In a later stage of drafting this report a rather more acceptable explanation was found for the MCF like pulsations. The very rich mixture being lighter than air (Mole weight CH4 is about half that of air), under the buoyancy force diffuses out of the vessel and gets replaced by air. The fresh air penetrating inwards reacts locally causing a temporary temperature rise and pushes out further methane etc.
SO SO1+SO2 2stageSO
SOSSSO
MCF, MCFsmooth

Project SAFEKINEX - Del No. 33, Add. B Additional experiments on the self-ignition temperature and the ignition delay time p. 34 (37)
becomes shorter the more concentrated the mixture. It is important to remark that, as has been shown in the previous figures, the majority of points is related to Slow Oxidation phenomena, except the explosions observed for 14% at 907 K and for what has been considered MCF, in the 90 % mixtures. Considering the high values of the IDT or rather the induction period in case of Slow Oxidation of methane just above 800 K, the curves are so shallow that the definition of Ignition Delay Time applying the tangential method does not provide a yard stick of much use. The point of time of maximum heat production or highest temperature (here called dtphe) may be of more interest for model validation.
IDT versus temperature for different methane-air concentrations %v/v
0,010,020,030,040,050,060,070,080,0
780 800 820 840 860 880 900 920 940
Temperature (K)
IDT
(s)
14%
25%
40%
90%
Figure 34: IDT versus temperature for different methane-air concentrations % v/v

Project SAFEKINEX - Del No. 33, Add. B Additional experiments on the self-ignition temperature and the ignition delay time p. 35 (37)
5 n-BUTANE-ETHENE-METHANE COMPARATIVE STUDY
In figure 35 is presented a comparative graph of IDTs versus temperature for n-butane, ethene and methane- Air mixtures at fuel rich concentrations: 9.5, 19% and 19% respectively. The n-butane data have been extracted from Deliverable Nr. 5.
IDT versus temperature for butane, ethene, methane at fuel rich concentrations
0
10
20
30
40
50
60
70
540 560 580 600 620 640 660 680 700 720 740 760 780 800 820 840 860 880 900 920 940 960
Temperature (K)
IDT
(s) butane 9,5 %
ethene 19%methane 14%
Figure 35: IDT versus temperature for different rich fuels mixtures n-butane-air (9.5%), ethene-air (19%) and methane-air (14%) The figure shows clearly that n-butane starts to react at lower temperatures than ethene and methane, in this order. The NTC-region seems to be narrower for ethene and methane than for n-butane. For the former ones it is maximum 10 ºC, while for n-butane it is 20 ºC. In addition it is important to note that, taking into account the phenomena description reported in Deliverable Nr. 5 (figure 5.3.9), n-butane, at this high concentration, is able to produce Cool Flames at temperatures around 570 K (297 ºC) approximately, while for ethene it only occurs at temperatures higher than 745 K (472 ºC), and for methane it simply doesn’t occur at this concentration, but only slow oxidation takes place. As mentioned in the Introduction IDT in this case is not an ignition time in true sense but an induction period.

Project SAFEKINEX - Del No. 33, Add. B Additional experiments on the self-ignition temperature and the ignition delay time p. 36 (37)
6 CONCLUSIONS
- According to the qualitative definition of Cool Flame used in this report based on the time duration of the increase of temperature (around 1 - 5 s for Cool flames and 0,6 - 0,8 s for explosions), in the case of ethene-air mixtures, possible Cool Flame phenomena, have been observed for 19%, 24%, 29% and 90% over a range of temperatures of 690- 750 K (420 - 480 ºC). In case of methane-air mixtures, just for a 90% concentration and in a range of 850 - 930 K (580 - 660 ºC) a pulsed MCF-like phenomena appeared.
- The difficulty of having to detect the existence of Cool Flame phenomena without the
possibility of visual evidence or by means of characterization of chemical species like peroxides during the evolution of the oxidation, prevents drawing firm conclusions. In possible follow-on experiments optical means shall have to be applied. Also model simulation will be used to get better understanding. In the case of methane an alternative explanation for the pulse like temperature increases could be derived based on replacement of methane by air in the semi-open vessel and reaction.
- Cool Flame-like phenomena in ethane and methane are, in general more difficult to
reproduce than Slow Oxidation and Explosion.
- For ethene-air mixtures, Explosion phenomena have been observed visually and audibly for concentrations of 19%, 24%, 29%, 34%, and 40% and just detected by thermocouples for concentrations of 60% and 90%.
- For methane-air mixtures, Explosion phenomena have been detected only for a
concentration of 14%.
- The NTC-region has been easily observed for all ethene-air mixture concentrations except for 24%. However, for methane-air mixtures only the concentration of 14% shows a clear NTC-region.
- The temperature range of the methane and ethene NTC-regions (fuel rich
concentration) seems to be narrower than the n-butane one. While for the first there is as a maximum of 10 ºC, for n-butane it is around 20 ºC.
- In case of Slow Oxidation the definition of ignition delay time or rather induction period
as the tangential to an up-going temperature-time curve does not produce a characteristic of much use. The point of time of maximum heat production or highest temperature (here called dtphe) may be of more interest for model validation.
- In general the data confirm previous observations and will be of help to support the
modelling effort in WP3.

Project SAFEKINEX - Del No. 33, Add. B Additional experiments on the self-ignition temperature and the ignition delay time p. 37 (37)
7 LITERATURE
− SAFEKINEX, Deliverable No 5, Report on experimentally determined self-ignition temperature and the ignition delay time, (www.safekinex.org).
− SAFEKINEX, Deliverable No 2, Report on experimental influences on the -determination of explosion indices, (www.safekinex.org).
− J.F. Griffiths, School of chemistry, University of Leeds, “Cool flames- a hot prospect”, internal communication, 2004.
− Pekalski, A. A., “Theoretical and experimental study on explosion safety of hydrocarbons at elevated conditions”, Ph.D. Thesis Technical University of Delft, Rhe Netherlands, November 2004.
− ASTM E 681-01, Standard Test Method for concentration limits of flammability of chemicals (vapors and gases).
− ASTM E 659-78 (re-approved 2000), Standard Test Method for Autoignition Temperature of Liquid Chemicals.
− Ten Holder, G. P. ”The influence of the overall heat transfer coefficient on combustion phenomena of n-butane-air mixtures”, Internal report, Explosion Group, Delft University of Technology, May 2003.
− M.S. Hsieh and D.T.A. Townend, J. Chem. Soc. (1939) 332. − The Temperature handbook Ω Omega, 21st century edition. − prEN 1839: Determination of explosion limits of gases and vapours, document for formal vote (version
9/2002). − M.S. Hsieh and D.T.A. Townend, J. Chem. Soc. (1939) 337. − Townend and Chamberlain, Proc. Roy. Soc, (1937) A, 158, 415. − A. G. White, J. Chem. Soc. (1927) 498.