report on healthy habits child version · report on healthy habits – child version: p. 2 overview...
TRANSCRIPT
Report on Healthy Habits – CHILD Version: p. 1
Report on Healthy Habits – CHILD Version
(Administered Spring 2010)
Prepared by: Lara L. Watkins and Jeffrey A. Anderson
Center for Adolescent and Family Studies

Report on Healthy Habits – CHILD Version: p. 2
Overview The data summarized in this document were supplied to the external evaluation team by
Providence Full Service Community Schools (PFSCS). The Healthy Habits Survey was
developed by the Providence YMCA in connection with PFSCS. The survey contains 24
questions that focus on two health related domains, physical activity and eating habits. The
evaluators worked with PFSCS personnel to design a scoring algorithm for this survey. While
the scoring system helps us better understand the responses to the survey and the questions
appear to have strong face validity, the reader is cautioned that, thus far, no formal psychometric
properties have been reported for this version of the Healthy Habits Survey. (The survey scoring
guide, which was developed as part of the analysis for this report and its complementary parent
version, is provided in the appendix.)
Surveys were administered to out-of-school time (OST) participants at three PFSCS OST
sites: Bailey, Lima/Fortes, and Woods/Young elementary schools in spring 2010. Lima/Fortes
and Woods/Young each receive OST participants from their two corresponding PFSCS
elementary schools. At the time of survey administration, Bailey had been a FSCS for two years,
while Lima and Fortes had been FSCS for one year. Woods and Young were slated to begin
formal PFSCS implementation in fall 2010. As part of the PFSCS evaluation, the Healthy Habits
Survey will be administered at enrollment in OST and after reaching 30 days of attendance in
OST to assess child reported healthy behavior and attitudes.
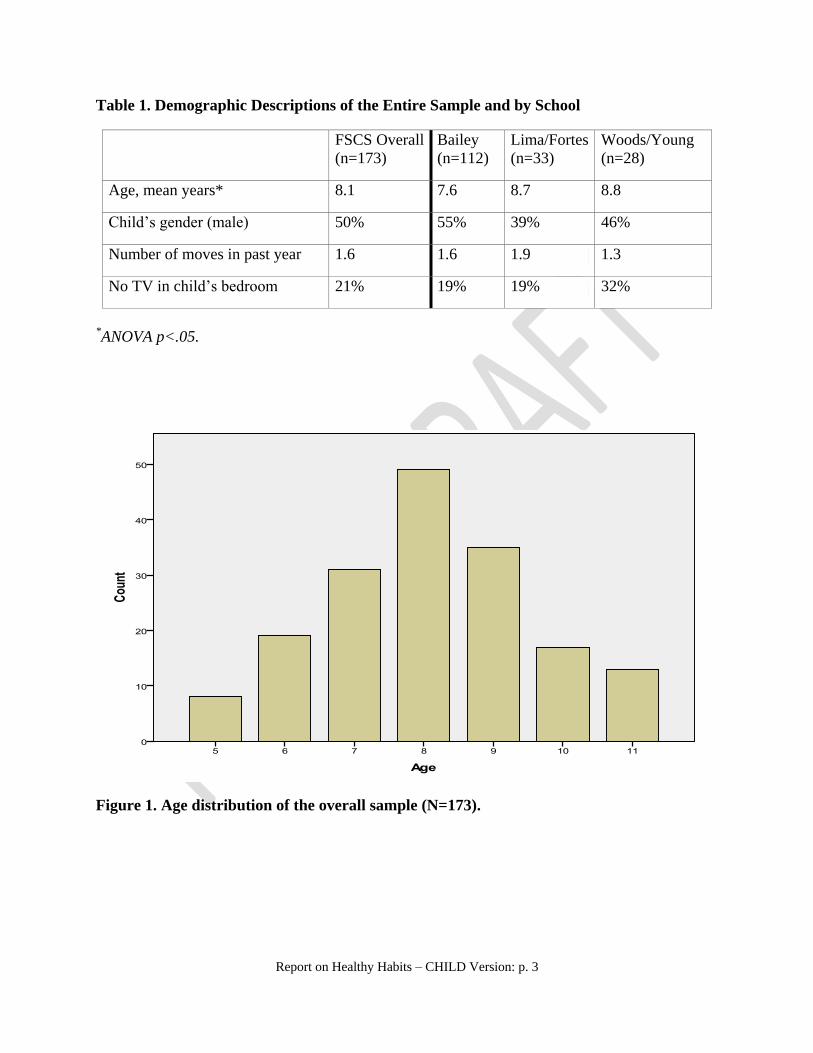
Findings Sample Description. In spring 2010, 173 students completed the survey, including 112
students from Bailey, 33 students from Lima/Fortes, and 28 students from Woods/Young.
Survey participants were between 5 and 11 years old and were in kindergarten through 6th
grades
(see Table 1 and Figures 1 & 2). The average student represented in the survey was 8.1 years old
(N=173) at the time of administration. Analysis of variance (ANOVA) indicated that there was a
statistically significant difference (p < .05) in the average age of respondents among the three
schools. Specifically, students who took the survey from Lima/Fortes and Woods/Young were
older than students from Bailey (see Figures 1 and 2 for more information about the age and
grade levels of the sample). For future administrations of the Healthy Habits survey – child
version, data analysis could be conducted by age or grade, particularly if there are specific
interventions that target different age or grade levels. This degree of specificity might better
target the outcomes of FSCS interventions.
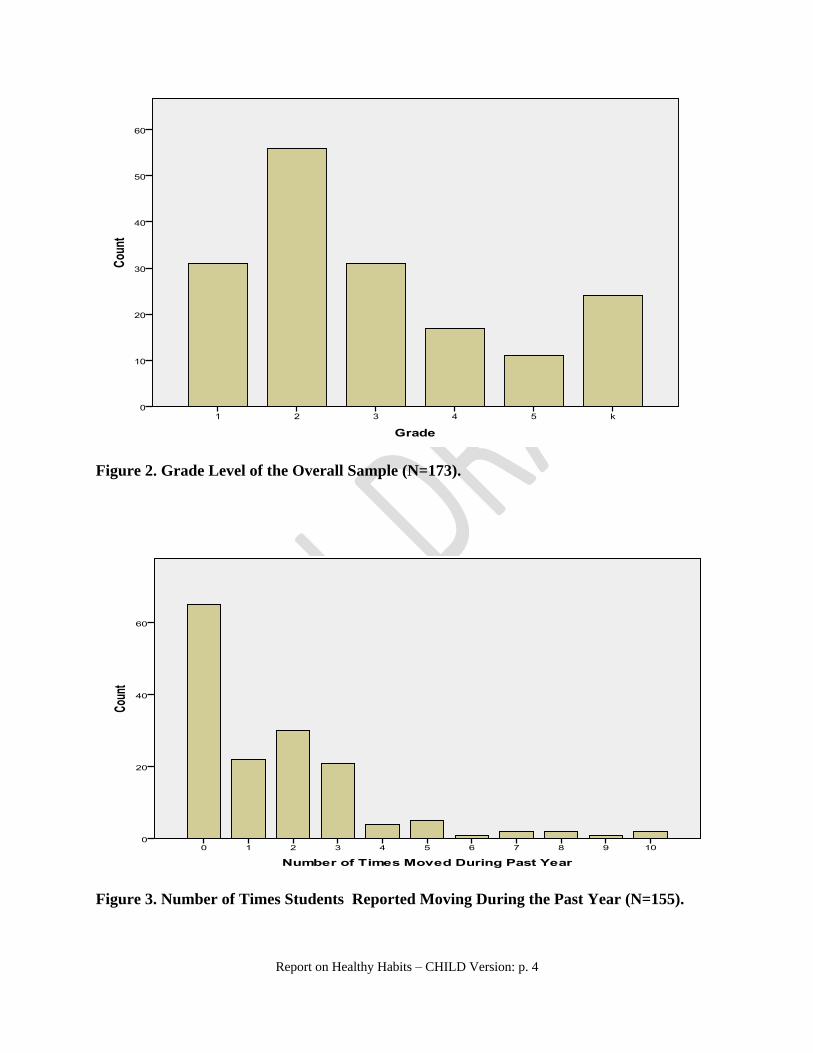
Although Bailey had more males completing the survey as compared to the other two
OST sites, the difference did not reach the threshold of statistical significance. Finally, the
average number of times students indicated that they had moved during the previous year was
1.6 (n=173). About 60% reported moving at least one time during the past year. A striking 42%
reported moving two or more times in the past year. There were some differences across
schools; however they were not statistically significant (see Table 1 and Figure 3).
Report on Healthy Habits – CHILD Version: p. 3
Table 1. Demographic Descriptions of the Entire Sample and by School
FSCS Overall
(n=173)
Bailey
(n=112)
Lima/Fortes
(n=33)
Woods/Young
(n=28)
Age, mean years* 8.1 7.6 8.7 8.8
Child’s gender (male) 50% 55% 39% 46%
Number of moves in past year
1.6 1.6 1.9 1.3
No TV in child’s bedroom 21% 19% 19% 32%
*ANOVA p<.05.
Figure 1. Age distribution of the overall sample (N=173).
Report on Healthy Habits – CHILD Version: p. 4
Figure 2. Grade Level of the Overall Sample (N=173).
Figure 3. Number of Times Students Reported Moving During the Past Year (N=155).

Report on Healthy Habits – CHILD Version: p. 5
Physical Activity Students overwhelming reported that they believe physical activity is important or
somewhat important (92%). About 60% of the sample reported that they participate in physical
activity at school “everyday" or “most days". On the other hand, 32% of the sample reported
that they participate in regular physical activity at school only on "some days", with about 8%
answering "very little" to this question (see Table 2).
Table 2. Participation in Regular Physical Activity at School
School Very Little Some Days Most Days Everyday
Overall Sample
(n=171) 7% 32% 19% 41%
Bailey
(n=110)
7% 32% 26% 35%
Lima/Fortes
(n=33)
3% 42% 6% 49%
Woods/Young
(n=27)
15% 19% 11% 56%
The response patterns differed somewhat when students were asked how often they
participated in regular physical activity in their neighborhood. Slightly less than half responded
"very little" or "some days" to this question; 15% responded “most days” and almost 39%
responded “everyday”. While sample sizes were relatively small, Woods/Young had
significantly more students reporting that they participate in physical activity “very little” in their
neighborhood as compared to Lima/Fortes (44% compared to 3%). In terms of students who
reported participating in physical activity “everyday”, Lima/Fortes had the highest percentage
(57%) followed by Bailey (38%), and then Woods/Young (24%). (see Table 3). When
respondents were asked if they participated in physical activity with parents or other adults, 42%
answered "no". Differences among the three schools were not significant.
When asked if appropriate safety equipment is worn during physical activities, only 29%
of students indicated "yes". More than half the sample of students reported that they do not use
safety equipment during physical activities, while 18% said they use safety equipment
"sometimes". Differences among the three schools were not significant.
Table 3. Participation in Regular Physical Activity in Your Neighborhood
School Very Little Some Days Most Days Everyday
Overall Sample
(n=171) 25% 20% 17% 39%
Bailey
(n=110) 27% 17% 18% 38%
Lima/Fortes
(n=33) 3% 27% 13% 57%
Woods/Young
(n=27) 44% 20% 12% 24%
Report on Healthy Habits – CHILD Version: p. 6
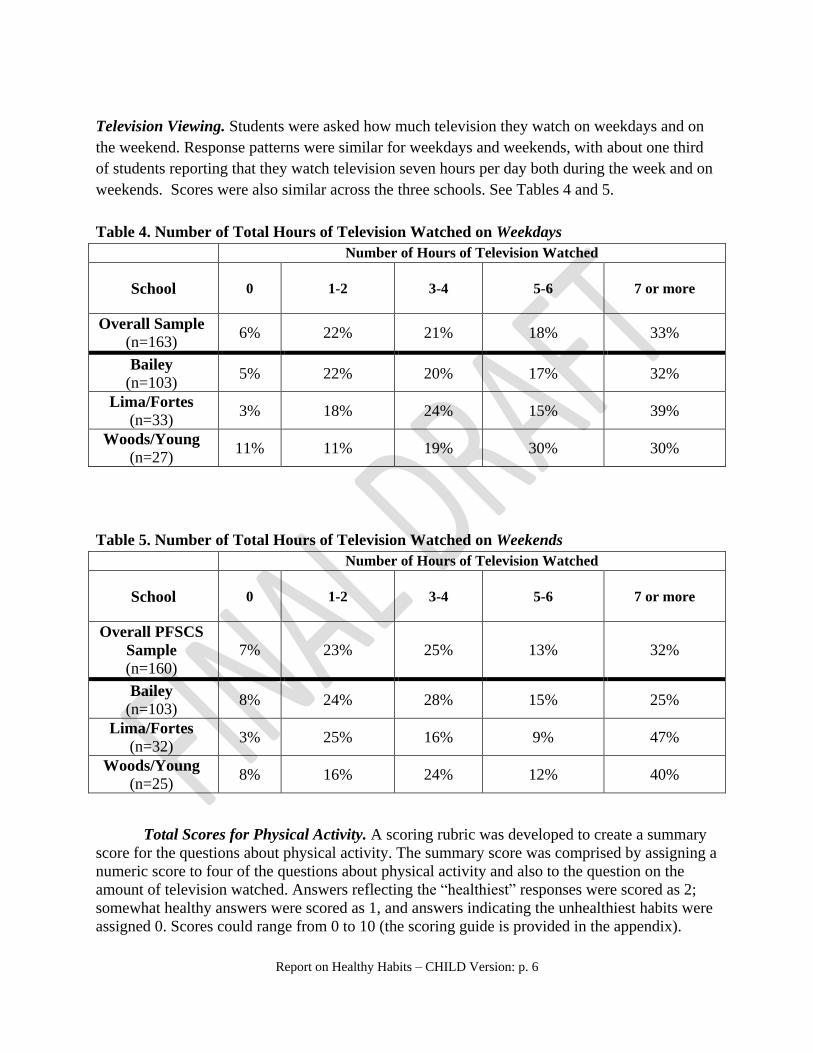
Television Viewing. Students were asked how much television they watch on weekdays and on
the weekend. Response patterns were similar for weekdays and weekends, with about one third
of students reporting that they watch television seven hours per day both during the week and on
weekends. Scores were also similar across the three schools. See Tables 4 and 5.
Table 4. Number of Total Hours of Television Watched on Weekdays
Number of Hours of Television Watched
School 0 1-2 3-4
5-6
7 or more
Overall Sample
(n=163) 6% 22% 21% 18% 33%
Bailey
(n=103) 5% 22% 20% 17% 32%
Lima/Fortes
(n=33) 3% 18% 24% 15% 39%
Woods/Young
(n=27) 11% 11% 19% 30% 30%
Table 5. Number of Total Hours of Television Watched on Weekends
Number of Hours of Television Watched
School 0 1-2 3-4
5-6
7 or more
Overall PFSCS
Sample
(n=160)
7% 23% 25% 13% 32%
Bailey
(n=103) 8% 24% 28% 15% 25%
Lima/Fortes
(n=32) 3% 25% 16% 9% 47%
Woods/Young
(n=25) 8% 16% 24% 12% 40%
Total Scores for Physical Activity. A scoring rubric was developed to create a summary
score for the questions about physical activity. The summary score was comprised by assigning a
numeric score to four of the questions about physical activity and also to the question on the
amount of television watched. Answers reflecting the “healthiest” responses were scored as 2;
somewhat healthy answers were scored as 1, and answers indicating the unhealthiest habits were
assigned 0. Scores could range from 0 to 10 (the scoring guide is provided in the appendix).
Report on Healthy Habits – CHILD Version: p. 7
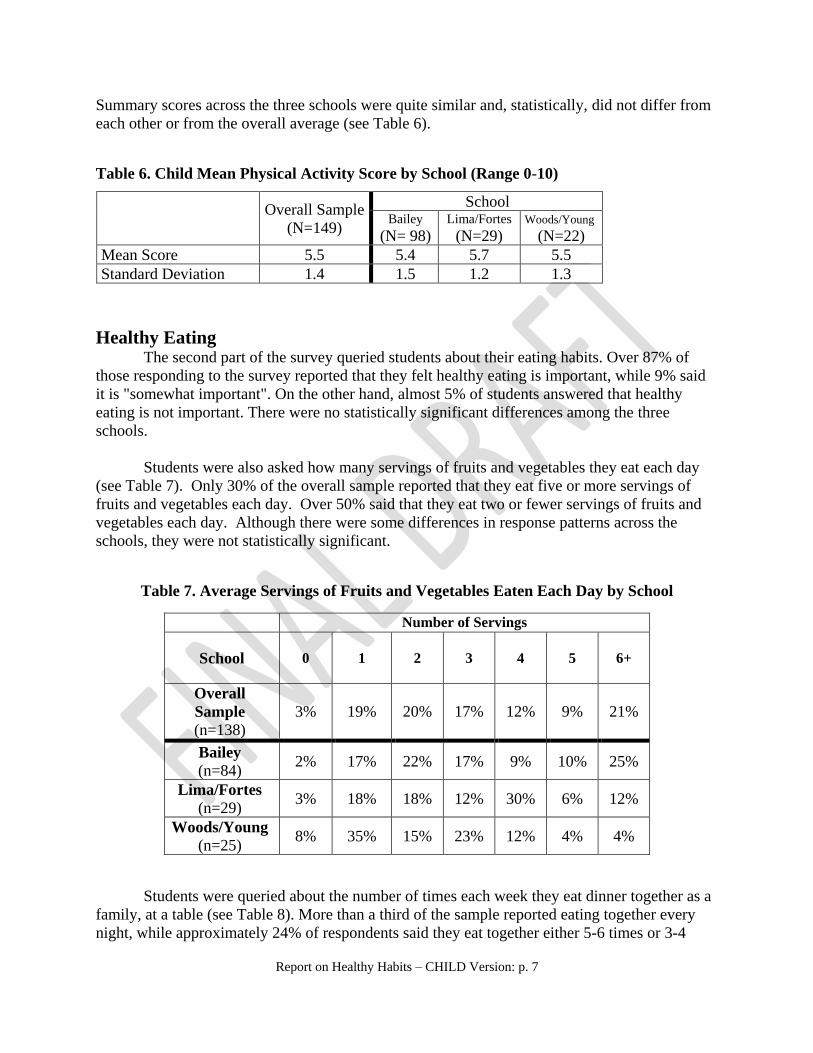
Summary scores across the three schools were quite similar and, statistically, did not differ from
each other or from the overall average (see Table 6).
Table 6. Child Mean Physical Activity Score by School (Range 0-10)
Overall Sample
(N=149)
School Bailey
(N= 98) Lima/Fortes
(N=29) Woods/Young
(N=22)
Mean Score 5.5 5.4 5.7 5.5
Standard Deviation 1.4 1.5 1.2 1.3
Healthy Eating The second part of the survey queried students about their eating habits. Over 87% of
those responding to the survey reported that they felt healthy eating is important, while 9% said
it is "somewhat important". On the other hand, almost 5% of students answered that healthy
eating is not important. There were no statistically significant differences among the three
schools.
Students were also asked how many servings of fruits and vegetables they eat each day
(see Table 7). Only 30% of the overall sample reported that they eat five or more servings of
fruits and vegetables each day. Over 50% said that they eat two or fewer servings of fruits and
vegetables each day. Although there were some differences in response patterns across the
schools, they were not statistically significant.
Table 7. Average Servings of Fruits and Vegetables Eaten Each Day by School
Number of Servings
School 0 1 2
3
4 5 6+
Overall
Sample
(n=138)
3% 19% 20% 17% 12% 9% 21%
Bailey
(n=84) 2% 17% 22% 17% 9% 10% 25%
Lima/Fortes
(n=29) 3% 18% 18% 12% 30% 6% 12%
Woods/Young
(n=25) 8% 35% 15% 23% 12% 4% 4%
Students were queried about the number of times each week they eat dinner together as a
family, at a table (see Table 8). More than a third of the sample reported eating together every
night, while approximately 24% of respondents said they eat together either 5-6 times or 3-4

Report on Healthy Habits – CHILD Version: p. 8
times a week. Slightly more than a quarter of the sample said that they eat together 1 or 2 times a
week, with 14% of students saying that they never eat together. Statistically, there were some
significant differences in the patterns among schools. Specifically, it appears that more students
at Lima/Fortes reported never eating together as a family when compared to students at Bailey.
Table 8. Average Number of Times Students Reported Eating Dinner as a Family Each
Week, By School
Number of times each week
School None 1-2 3-4 5-6 7
Overall Sample
(n=160) 14% 26% 11% 13% 37%
Bailey
(n=103) 10% 21% 14% 17% 39%
Lima/Fortes
(n=32) 16% 45% 10% 0% 29%
Woods/Young
(n=25) 28% 20% 0% 12% 40%
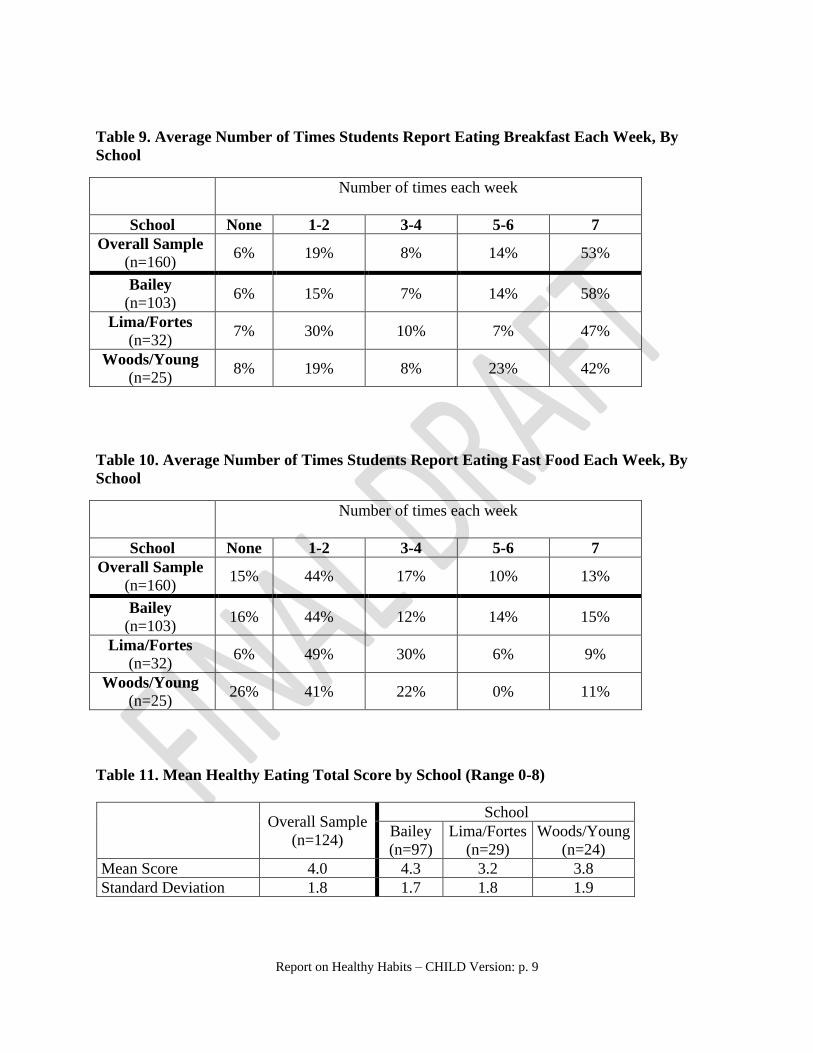
Students were queried about the number of times each week they eat breakfast (see Table
9). More than half of the sample reported eating breakfast every day, while approximately 22%
of respondents said either 5-6 times or 3-4 times a week. About 19% of students only eat
breakfast 1-2 times each week and 6% of the sample said they never eat breakfast. Again, some
differences across schools were noted; however, they were not statistically significant.
Finally, students were asked about the number of times they eat fast-food each week (see
Table 10). More than half of the sample, 59%, reported that they each fast food 0 to 2 times
weekly; 17% said 3 to 4 times a week, 10% said 5-6 times a week and 13% of the sample
reported eating fast food at least 7 times a week. Again, some differences across schools were
noted and it appears that significantly more students at Woods/Young reported never eating fast
food as compared to the respondents at Lima/Fortes.
Total Scores for Eating Habits. A scoring rubric was developed to create a summary
score for the questions about eating habits. Answers reflecting healthy responses were scored as
2; somewhat healthy answers were scored as 1, and answers indicating unhealthy habits were
assigned 0. Scores could range from 0 to 8 (the scoring guide is provided in the appendix).
Scores across the three schools showed some statistical differences. The mean total healthy
eating score was significantly higher for Bailey as compared to Lima/Fortes (see Table 11).
Report on Healthy Habits – CHILD Version: p. 9
Table 9. Average Number of Times Students Report Eating Breakfast Each Week, By
School
Number of times each week
School None 1-2 3-4 5-6 7
Overall Sample
(n=160) 6% 19% 8% 14% 53%
Bailey
(n=103) 6% 15% 7% 14% 58%
Lima/Fortes
(n=32) 7% 30% 10% 7% 47%
Woods/Young
(n=25) 8% 19% 8% 23% 42%
Table 10. Average Number of Times Students Report Eating Fast Food Each Week, By
School
Number of times each week
School None 1-2 3-4 5-6 7
Overall Sample
(n=160) 15% 44% 17% 10% 13%
Bailey
(n=103) 16% 44% 12% 14% 15%
Lima/Fortes
(n=32) 6% 49% 30% 6% 9%
Woods/Young
(n=25) 26% 41% 22% 0% 11%
Table 11. Mean Healthy Eating Total Score by School (Range 0-8)
Overall Sample
(n=124)
School
Bailey
(n=97)
Lima/Fortes
(n=29)
Woods/Young
(n=24)
Mean Score 4.0 4.3 3.2 3.8
Standard Deviation 1.8 1.7 1.8 1.9
Report on Healthy Habits – CHILD Version: p. 10
Data Recommendations
Survey Administration
Similar to the parent Healthy Habits survey report, we offer several recommendations
about the Child Habits Survey. Primarily, we suggest closely reviewing the survey to see if there
are unneeded questions. Now that the survey has been pilot tested and analyzed, it may be that
PFSCS personnel are not interested in all of the questions. We also suggest examining the
wording of the question about mobility. As with the parent survey, some of the sample was
missing a response for the mobility question and we speculate that that those at risk for high
mobility may be less likely to respond to this question. We also suggest removing the open-
ended questions, unless PFSCS personnel are making use of this information for programming
purposes. PFSCS should compare the original Healthy Habits survey – child version with the
revised Healthy Habits survey – adult version to see if similar changes should be implemented.
Moving forward, it is also important to keep track of the number of surveys that are
administered and the process of administration, in addition to the number of surveys that are
completed. This will allow us to determine more specific response rates and better characterize
survey respondents and the population to which findings might be generalized.
Survey Scoring
We have designed a total score for both sections of the child survey (physical activity and
eating habits). We thus ask if these scores are appropriate. As noted in the parent report, we want
to be able to triangulate data. Questions for future consideration by PFSCS administration and
the EAB include:
To what extent are the surveys psychometrically sound?
Do PFSCS personnel want additional scores to be created?
Can we link child surveys with parent surveys?
Also, would it be possible to objectively measure actual physical activity and
eating behavior? What are some potential measures?
To what extent do the Healthy Habit scores correlate with other indicators of
health and well-being?
Finally, as we pointed out in the parent survey, because there is no standardized scoring
mechanism and this is the first review of the Healthy Habits – child version, the survey needs to
be closely examined and calibrated to best match the specific programming goals and objectives.
Such efforts will help to ensure that the results are meaningful and that the survey is measuring
the behaviors and attitudes that the PFSCS seeks to impact. Additionally, future efforts need to
clearly describe and document the sampling population (i.e. all potential survey participants).
Also, as technological advances are made and datasets are better linked and integrated, it will be
helpful to link survey data to PFSCS services, supports, and activities. Then, we might be able
to examine participation in PFSCS components in connection with Healthy Habit scores and
other indicators of student and family well-being.

Report on Healthy Habits – CHILD Version: p. 11
Performance Measure
The following is the cited PFSCS Performance Measure: Within one year of
beginning services, 90% of children participating in after-school will increase their knowledge
and improve their attitudes around healthy eating habits as measured by the Healthy Habits
Survey. We anticipate being able to comment on this performance measure after the next
administration of the Healthy Habit survey – child version. This is contingent on being able to
link surveys administered to students prior to and after involvement in OST “interventions”.
Limitations
Again, as discussed in the parent report, this report has a number of limitations that need
to be considered when interpreting these results. First, while the findings of this work can be
used to inform the PFSCS initiative, it is suggested that this be done with caution because we
lack information about the extent to which results are representative of the larger populations of
OST participants and PFSCS students. Indeed, these findings from this survey may be limited to
describing the students who responded. Even though there were some differences among the
three OST programs that reached statistically significance, we encourage program administrators
not to compare the schools to each other. Instead, these findings should be considered solely as
preliminary and used to set program benchmarks. A second substantive limitation that should be
noted is that the survey itself is new and its reliability and validity are unknown.
Conclusions
Similar to the parent report, we were encouraged by the large percentage of respondents
who perceived physical activity and healthy eating to be important. Indeed, many of the findings
in this report were encouraging and indicate that the students who completed the survey perceive
themselves to be making healthy choices in a number of areas. Still, many of these findings can
offer a baseline or starting point. We encourage each school to consider using these findings to
develop short and longer term goals related to healthy habits.
The findings of this report also suggest several areas that could become the focus of
efforts to improve children's healthy habits. For example, parents may believe their children are
more active at school than the children perceive themselves to be, the indicators about physical
activity, both at school and a home, appear to need some attention. PFSCS may want to
reexamine its focus on physical activity, perhaps developing an indicator of 1-hour/day as a goal.
Moreover, this could be a combined school/home goal. Another finding of this survey that
PFSCS personnel may want to focus on is increasing the use of safety equipment, such as a
wearing a helmet when riding a bike. More than 1 out of every 2 children said that they do not
use such equipment or only use it sometimes. The high percentage of OST participants who
watch seven or more hours of TV, do not eat many fruits and vegetables, have few “family
meals”, and often do not eat breakfast also are areas for potential programming focus.
As always, further analyses are recommended prior to making substantive decisions based on
this information; a variety of additional analyses can be conducted using these data.
Report on Healthy Habits – CHILD Version: p. 12
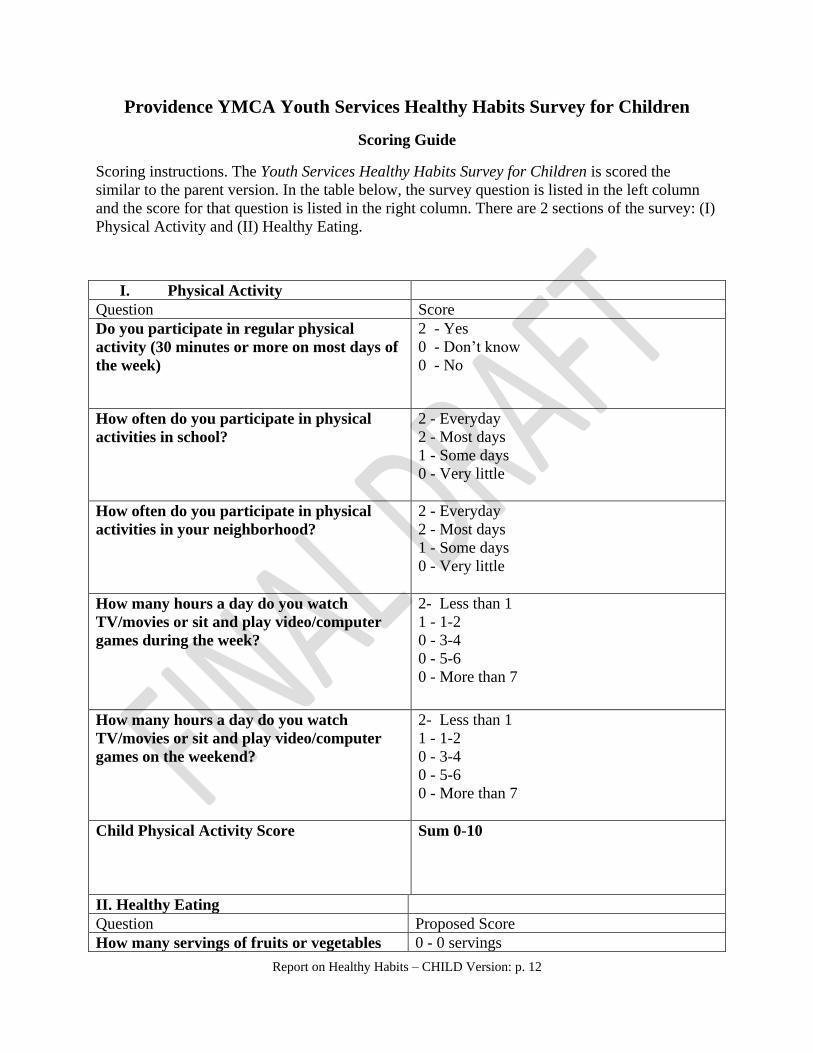
Providence YMCA Youth Services Healthy Habits Survey for Children
Scoring Guide
Scoring instructions. The Youth Services Healthy Habits Survey for Children is scored the
similar to the parent version. In the table below, the survey question is listed in the left column
and the score for that question is listed in the right column. There are 2 sections of the survey: (I)
Physical Activity and (II) Healthy Eating.
I. Physical Activity
Question Score
Do you participate in regular physical
activity (30 minutes or more on most days of
the week)
2 - Yes
0 - Don’t know
0 - No
How often do you participate in physical
activities in school?
2 - Everyday
2 - Most days
1 - Some days
0 - Very little
How often do you participate in physical
activities in your neighborhood?
2 - Everyday
2 - Most days
1 - Some days
0 - Very little
How many hours a day do you watch
TV/movies or sit and play video/computer
games during the week?
2- Less than 1
1 - 1-2
0 - 3-4
0 - 5-6
0 - More than 7
How many hours a day do you watch
TV/movies or sit and play video/computer
games on the weekend?
2- Less than 1
1 - 1-2
0 - 3-4
0 - 5-6
0 - More than 7
Child Physical Activity Score Sum 0-10
II. Healthy Eating
Question Proposed Score
How many servings of fruits or vegetables 0 - 0 servings
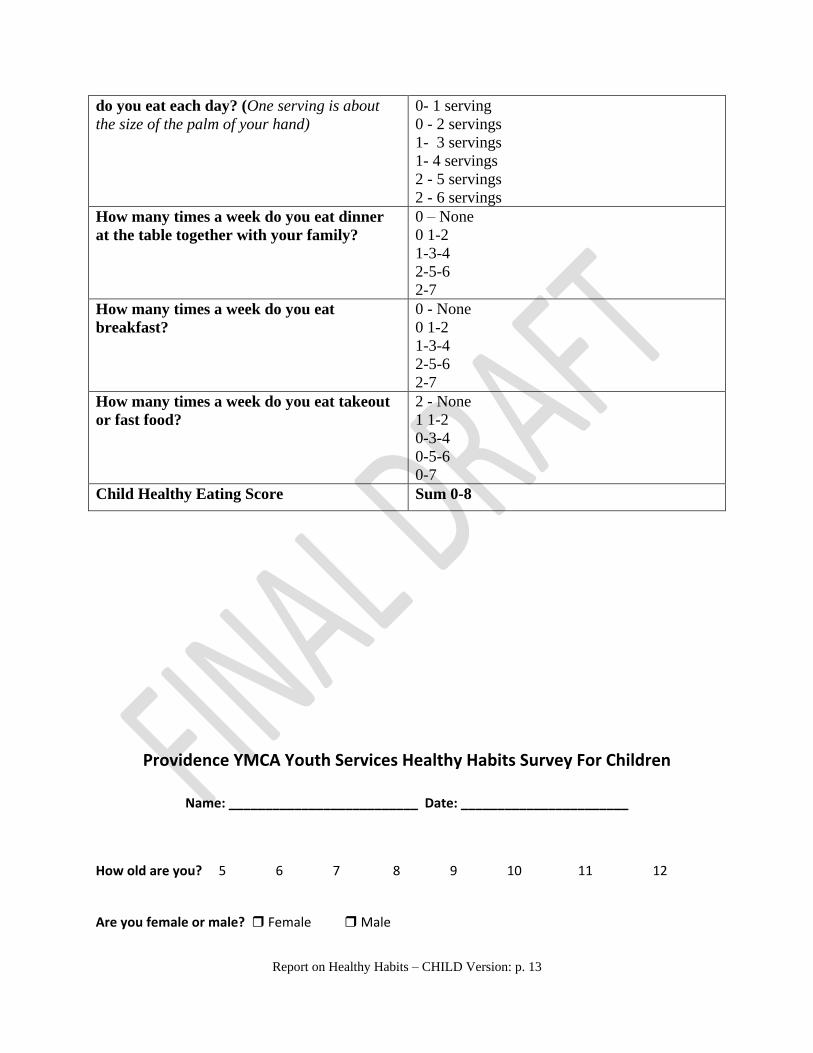
Report on Healthy Habits – CHILD Version: p. 13
do you eat each day? (One serving is about
the size of the palm of your hand)
0- 1 serving
0 - 2 servings
1- 3 servings
1- 4 servings
2 - 5 servings
2 - 6 servings
How many times a week do you eat dinner
at the table together with your family?
0 – None
0 1-2
1-3-4
2-5-6
2-7
How many times a week do you eat
breakfast?
0 - None
0 1-2
1-3-4
2-5-6
2-7
How many times a week do you eat takeout
or fast food?
2 - None
1 1-2
0-3-4
0-5-6
0-7
Child Healthy Eating Score Sum 0-8
Providence YMCA Youth Services Healthy Habits Survey For Children
Name: __________________________ Date: _______________________
How old are you? 5 6 7 8 9 10 11 12
Are you female or male? Female Male

Report on Healthy Habits – CHILD Version: p. 14
What grade are you in? K 1 2 3 4 5 6
During the past year, how many times have you moved (changed where you lived)
__________________
Do you think physical activity is important? Yes Somewhat No
Do you participate in regular physical activity (30 minutes or more on most days of the week)
Yes I Don’t Know No
If not, why?
_____________________________________________________________________________
Do you participate in physical activities in school? Yes No
If so, which
ones?_________________________________________________________________________
How often do you participate in physical activities in school?
Every Day Most Days (3 or more) Some days (1-2) Very little (<1)
Do you participate in physical activities in your neighborhood? Yes No
If so, which ones?
_________________________________________________________________________
How often do you participate in physical activities in your neighborhood?
Every Day Most Days (3 or more) Some days (1-2) Very little (<1)
Do your parents or other adults participate in physical activity with you? Yes No
If so, which ones?
__________________________________________________________________________
How often do your parents or other adults participate in physical activity with you?
Every Day Most Days (3 or more) Some days (1-2) Very little (<1)

Report on Healthy Habits – CHILD Version: p. 15
Do you use appropriate safety equipment (for example, helmet, wrist guards, elbow and knee pads)
when you participate in a physical activity? Yes Sometimes No
Do you always have something available to drink during and after physical activity?
Yes Sometimes No
Do you think healthy eating is important? Yes Somewhat No
How many servings of fruits or vegetables do you eat each day? (One serving is about the size of the palm of
your hand)
0 1 2 3 4 5 6 or more
How many times a week do you eat dinner at the table together with your family?
None 1 – 2 3-4 5-6 7
How many times a week do you eat breakfast?
None 1 – 2 3-4 5-6 7
How many times a week do you eat takeout or fast food?
None 1 – 2 3-4 5-6 7
How many hours a day do you watch TV/movies or sit and play video/computer games during the
week?
Less than 1 1 – 2 3-4 5-6 more than 7
How many hours a day do you watch TV/movies or sit and play video/computer games on the
weekend?
Less than 1 1 – 2 3-4 5-6 more than 7
Do you have a tv in the room where you sleep?
Yes Sometimes No
How many 8 ounce servings of the following do you drink a day?
____ 100% juice ____ Water ____ Fruit drink or sports drinks
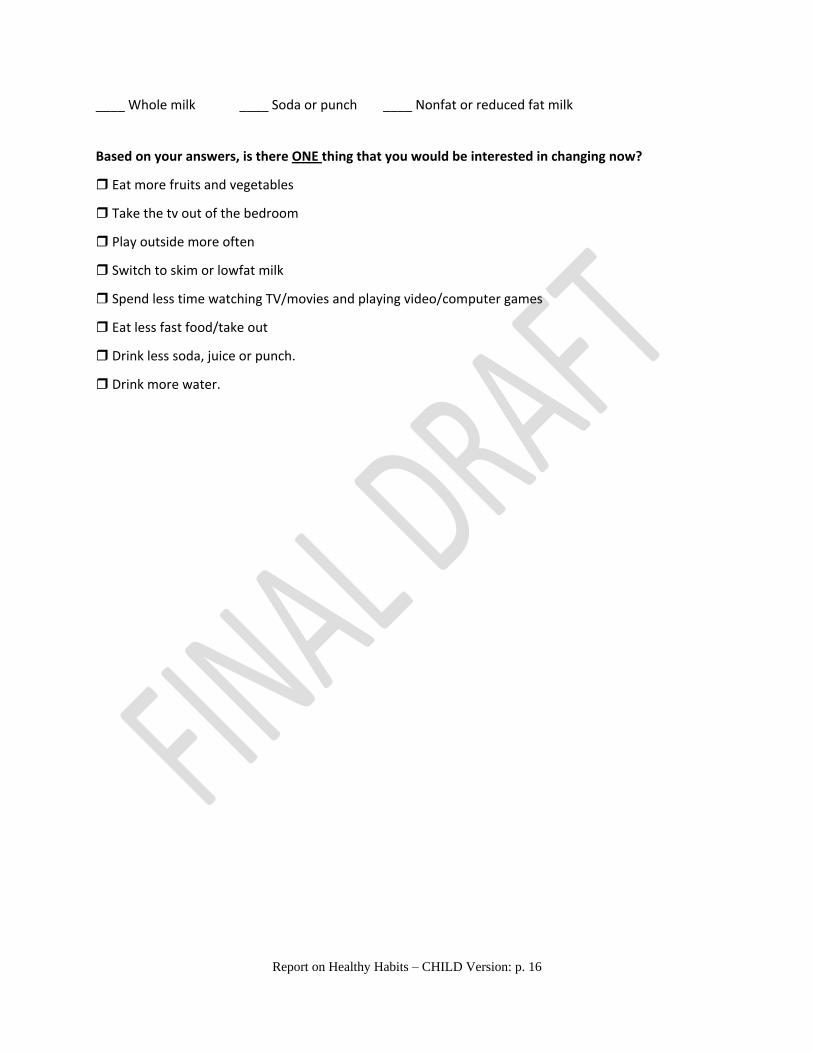
Report on Healthy Habits – CHILD Version: p. 16
____ Whole milk ____ Soda or punch ____ Nonfat or reduced fat milk
Based on your answers, is there ONE thing that you would be interested in changing now?
Eat more fruits and vegetables
Take the tv out of the bedroom
Play outside more often
Switch to skim or lowfat milk
Spend less time watching TV/movies and playing video/computer games
Eat less fast food/take out
Drink less soda, juice or punch.
Drink more water.