report on iip trends for fiscal year 13
TRANSCRIPT

P a g e | 1
INDEX OF INDUSTRIAL PRODUCTION
The Index of Industrial Production (IIP) is one of the important indicators of short term economic development and is used to measure the industrial growth in the economy in general and to identify the turning points in the economic development at an early stage in particular.
IIP describes the changes of the volume of goods produced in the industrial sector over time. It is an important indicator in its own right as well as being used in comparison to or conjunction with other short term indicators to assess the performance of an economy.
The IIP is intended to measure the change in the value added measured in volume terms over time and, therefore, should be free of any price effect. In India, physical quantity of output is used as a data variable where as volume extrapolation method is used to compile IIP.
IIP is considered to be one of the lead indicators for short-term economic analysis because of its strong relationship with economic fluctuations in the rest of economy. Most of services, like transport, storage, communication, real estate, insurance and banking are industry dependent and are considerably influenced by industrial performance. IIP is, therefore, also used as core ingredient in the compilation of annual and quarterly national accounts and forecasts of GDP.
IIP is a lead indicator of the economy due to its –
1) High frequency (monthly) makes it amenable to be used as a reference series in the compilation of cyclical indicators.
2) Fast availability (relative to GDP for example) 3) Detailed activity breakdown such as the coverage of manufacturing sub segments. 4) Usage for compiling quarterly Gross Domestic Product (GDP)
IIP is a zoomed in view of one of the 3 components of GDP –
1) It measures growth in the industrial sector. Index of industrial production (IIP) is one of
the essential short term indicators of the industrial activity in an economy.
2) Index of Industrial production conveys whether the industrial output of a country has
increased or decreased and to what extent with respect to a fixed base reference.
3) A shrinking IIP is unfavourable to the overall GDP of a country while a rising IIP suggests
that the industrial activity is expanding and capacity addition is taking place in the
economy.
Index numbers compress many facts into a few simple figures, and, in conjunction with other data, summarize past developments, facilitate forecasting of future trends and assist with evidence based policy decision and IIP is no exception. In micro-economic analysis, an index number of production shown with an industrial grouping enables comparisons to be made of changes in the output of different industries, as between themselves and in relation to such other data on different macro aggregates such as employment, wages and earnings. In macro-economics, the index serves to assess the significance, for the economy as a whole, of changes in the volume of industrial output in relation to corresponding changes in population, national income, foreign trade, prices and other aggregates. Production index has a particular importance in any analysis of economic changes since industrial production is one of the more dynamic and fluctuating elements in the economy. The importance increases further if we also consider the impact the fluctuations in the level of industrial activity has on the remainder of the economy. It is this strong relationship between changes in the levels of

P a g e | 2
industrial production and economic cycles that facilitates the use of the production indices as reference series in determining or forecasting the turning points in the business cycles.
IIP data is an important indicator to gauge the fiscal situation of both central and state governments. Growth of corporate tax, excise and income tax collection is directly proportional to movement of IIP. While the efficiency of tax administration has its role in improving tax collection, growth in tax collection to a large extent is dependent on IIP growth.
Although, in recent years, proportion of gold imports in total imports has increased, Indian import basket is still dominated by raw material and intermediate goods, which are used in the production process. IIP growth thus has impact on the growth of Custom duties.
IIP growth is also affected by the export performance of the economy. During good economic growth phase (2003-04 to 2008-09), Indian manufacturers not only catered to domestic demand but also to global demand leading to a stronger Indian exports and IIP growth.
Indian IIP data is released every month. Office of Economic Advisor, Ministry of Commerce and Industry released the first estimate of Index of Industrial Production officially with the base year 1937 covering 15 important industries. After many revisions, the base year currently stands at 2004-05. Over time, to present most current production basket and their contribution to industrial production, both product basket and their relative weights have been changed many times.
To arrive at the IIP estimate, data is accumulated and sourced from as many as 15 agencies like Central Statistical Organization, department of Industrial Policy and Promotion etc. As more data is made available and responses are received from the manufacturing and other units, the estimates are revised twice subsequently.
In computing the IIP, production data across 543 items that are grouped into 287 item groups is taken into consideration and appropriate weights are assigned to reflect a representative index. These are then broadly clubbed into 3 main categories - mining, electricity and manufacturing. Mining and electricity are seen as the enablers of manufacturing - and as such, are very important for growth in overall industrial activity - which in turn impacts overall GDP growth.
IIP can also be classified on a "use" based classification. A 'Use based classification' classifies items used in computing IIP into Basic Goods, Capital goods, Intermediate goods, and Consumer goods (further divided in Consumer durables and Consumer non- durables).
Present series of IIP: The present series of IIP with base year 2004-05 was released in June 2011
with a time lag of more than six years. While the data for mining sector is provided by the Indian Bureau of Mines (IBM), data for electricity is furnished by Central Electricity Authority (CEA) and data for manufacturing sector is provided by various source agencies from different central Departments and Ministries, the most prominent among them being Department of Industrial Policy and Promotion (DIPP), which provides data on as many as 268 item groups covering about 46% of the total weight.

P a g e | 3
SEASONAL ADJUSTMENT
Seasonality can be defined as a pattern of a time series, which repeats at regular intervals every year.
Seasonally adjusted data, providing more interpretable measures of changes occurring in a given period,
reflects real economic movements without the misleading seasonal changes.
Seasonal adjustment is a statistical technique which eliminates the influences of weather, festivals, the
opening and closing of schools and other recurring seasonal events from an economic time series. This
permits easier observation and analysis of cyclical, trend and other non-seasonal movements in the
data. By eliminating seasonal fluctuations, the series becomes smoother and it is easier to compare data
from month to month. Seasonally adjusted numbers have been revised to exclude yearly seasonal
components. Not seasonally adjusted numbers include these seasonal components.
When comparing non-seasonally adjusted data year-to-year, most of the recurring seasonal events
are accounted for in the comparison. The difference in the employment level would be due to events
which are specific to that year, such as weather, strikes or some other factors.
A time series from which the seasonal movements have been eliminated allows the comparison of data between two months or quarters for which the seasonal pattern is different. Also seasonal effects on non-adjusted or original data make it difficult to derive valid comparisons over time using these data, particularly for the most recent period.
When comparing data month-to-month, it is important to consider seasonal variations which may account for large parts of monthly fluctuations. Month-to-month not seasonally adjusted changes are an indicator of actual changes in labor force and employment and allow us to understand the size of seasonal variations. Using year-to-year changes would perhaps be more useful in understanding changes in the data that reflect events which are non-recurring. Looking at year-to-year changes allows us to interpret changes that occurred due to an increase or decrease in economic activities or other events that do not reoccur on a regular basis.
Thus the aim of seasonal adjustment is to remove
Seasonal fluctuations Calendar related effects
In order to
Aid interpretation Reveal the news of the series Facilitate comparison

P a g e | 4
Use based classification
BASIC GOODS
During Apr’12 to Mar’13, IIP of basic goods and IIP general exhibited opposite trend. This is due to the fact that basic goods comprise of electricity, mineral index etc. Electricity and mineral sector were affected by regulatory issues.
In May’12, there was a sudden increase in IIP (%YoY) from 1.9% to 4.4% while the same can be witnessed for seasonal growth but in the red area i.e. from -1.9% to 0.6%.
From May’12 to Jul’12, there was a noticeable dip in IIP (%YoY) from 4.4% to 1% followed by a significant increase from Jul’12 to Oct’12 i.e. from 1% to 4.3% while the seasonal growth rate varied from 0.6% in May’12 to 0.7% in Oct’12 with the same amount of rise and fall in the trends.
The IIP growth (%YoY) from Nov’12 to Mar’13 fluctuated between 1.1% in Nov’12 to 3.0% in Mar’13 whereas the seasonal growth lied above the negative territory with sudden increase and decrease in the trends and continues to rise from 0.1% in Feb’13 to 1.7% in Mar’13.
Hence a downward trend is seen in the case of IIP (%YoY) and an upward trend can be noticed in the case of seasonal average throughout the fiscal year.
The pace of growth of electricity, coal and steel (with a combined weight of 21% in the IIP Index) improved in January 2013 as compared to the previous month, the performance of cement, fertilizers, crude oil and natural gas (with a combined weight of 10.6% in the IIP Index) worsened as indicated by the Index of Core Industries. Data released by CSO indicates that ‘carbon steel’ and ‘CR sheets’ displayed a sharp expansion in y-o-y terms in January 2013 even as ‘stampings & forgings’ recorded a 24% contraction in the same month.
Basic goods recorded a sluggish 2.8% growth in April 2012-January 2013.
CAPITAL GOODS
A capital good is a durable good that is used in production of goods or services. Capital goods are acquired by a society by saving wealth which can be invested in the means of production. The capital goods have an increasing trend from Dec’12 to Mar’13 as it is an investment used for the production of other goods or commodities. A reason can also be that a company is expanding so it requires more and more capital goods, therefore has an increasing trend. This is a dominating factor than the one relating to reduction of labour which may or may not be true as it depends upon a company’s way of manufacturing. However, it slightly affects the overall growth as it can be seen that the overall growth rate is also increasing from Jan’13 to Mar’13.

P a g e | 5
It is clear from the graph that both seasonal average and % YoY have an increasing trend during the entire Fiscal year even though both are starting from the negative territory.
Monthly seasonal average attains a positive direction earlier than the IIP (% YoY).
The IIP growth (%YoY) starting from -21.5% in Apr’12 reaches -8.6% in May’12 and continues in the similar fashion rising upto -4.4% in Aug’12 however the seasonal growth rate is consistently increasing for the same period ranging from -5.9% in Apr’12 to 3.3% in Aug’12 with slight dips in-between.
Moving onto Oct’12 the seasonal growth didn’t witness any major rise and fall in the trends and fluctuating between 1.0% in Oct’12 and 10.2% in Mar’13 which shows a noticeable increase over the span of 6 months.
The IIP growth (%YoY) dipped from 7% in Oct’12 to -8.5% in Nov’12 followed by a constant increase from -1.1% in Dec’12 to 9.0% in Mar’13.
The de-growth of capital goods output worsened to 1.8% in January 2013 from a revised 0.6% in December 2012. Items such as ‘commercial vehicles’, ‘boilers’ and ‘grinding wheels’ with a combined weight of 3.21% in the IIP Index, displayed a sharp contraction in January 2013. However, items such as ‘aluminium conductors’ and ‘cable, rubber insulated’ displayed a substantial expansion in January 2013.
As compared to the 2.9% contraction in April 2011-January 2012, capital goods output has declined by a sharp 9.3% in the first 10 months of 2012-13, the only use-based category to record a de-growth in this period.
Although both yoy and seasonally adjusted growth of IIP capital goods is exhibiting increasing trend, the pace of increase is very slow. The slow trend of IIP capital goods growth suggests that the investment activities in the economy are still very sluggish.
INTERMEDIATE GOODS
Intermediate goods are goods used as inputs in the production of other goods, such as partly finished goods. Also, they are goods used in production of final goods. A firm may make and then use intermediate goods, or make and then sell, or buy then use them. In the production process, intermediate goods either become part of the final product, or are changed beyond recognition in the process. Therefore, on comparing the graphs for intermediate goods and general, we find that both have an almost same trend at each time point as intermediate goods is among the leading indicators responsible for the overall incline or decline.

P a g e | 6
Both the trend lines are starting from almost the same point in the negative territory but the growth rate of IIP (%YoY) experienced more fluctuations than seasonal growth rates.
The IIP growth (%YoY) has an upward trend till Oct’12 and after that a downward trend till Mar’13. In Apr’12 the IIP (%YoY) is -1.8% straightaway rising to 3.4% in May’12 then varying up to 2.7% in Aug’12. A high rise is experienced in Oct’12 reaching at 9.6% and then an enormous dip in IIP growth (%YoY) in Nov’12 i.e. -1.4%. A slight increase in the growth rate from -0.2% in Dec’12 to 3.5% in Jan’13 reaching to 2.4% in Mar’13.
On the other hand seasonal growth has an upward trend from Apr’12 to Jul’12 varying from -1.1% to 1.0% respectively. A slight decrease is seen from Aug’12 to Oct’12 and then a sudden dip to -1.6% in Nov’12. After that the trends lie in the positive territory reaching up to 2.1% in Mar’13.
The pace of growth of intermediate goods improved somewhat to 2.0% in January 2013 from a revised 0.7% in December 2012. This benefitted from the pickup in the pace of growth of refinery products to 10.5% in January 2013 from 4.9% in the previous month as indicated by the Index of Core Industries; refinery products have a weight of around 6% in the IIP Index, which accounts for nearly 38% of the weight of the intermediate goods category.
Intermediate goods expanded by 1.7% in the first 10 months of 2012-13, as compared to the 0.8% de-growth in April 2011-Janury 2012.
CONSUMER -GOODS
Any tangible commodity which is produced and subsequently consumed by the consumer, to satisfy its current wants or needs, is a consumer good or final good. Consumer goods are goods that are ultimately consumed rather than used in the production of another good.
Till Oct’12 the IIP growth (%YoY) has an upward trend and then a downward trend till Mar’13 while seasonal growth has an upward trend. Here a noticeable point is that in Jul’12 the IIP (%YoY) was 0.7% whereas the seasonal growth was -0.7%.
A drastic change was experienced when the IIP growth (%YoY) rose from 0.0% in Sep’12 to 13.8% in Oct’12 and then suddenly fell at -0.3% in Nov’12 and again it dipped to -3.6% in Dec’12 and moved in the positive direction thereafter. In Mar’13 the rate was 1.8%. Spike in consumer goods growth (yoy) in Oct’12 was due to festival demand.

P a g e | 7
Seasonal growth was in the negative territory for Aug’12 and Sep’12 and then rose to 1.6% in Oct’12. After following an upward trend till Dec’12 i.e. 4.1% the seasonal growth was constant for two consecutive months at 2.7%. In Mar’13 the rate was 1.3%.
For consumer goods (total), monthly seasonal averages (%) are declining after Dec’12 as Non-Durables have more weight (21.3) than durables (8.5). Therefore, durables are responsible for this downward trend. The IIP (%YoY) is 10.9% for Dec’12, therefore next year it is estimated to be less. But for Jan’13 in consumer durables monthly sa is -5.6% whereas it was -0.1% last year. Therefore, it has decreased.
DURABLES- It can be clearly seen that IIP growth (%YoY) has an increasing trend till Oct’12 and
decreasing trend thereafter while seasonal growth has an increasing trend.
From Apr’12 the IIP growth (%YoY) is consistently decreasing till Sep’12. From Aug’12 with 1.0% it entered the red area with -1.5% in Sep’12. The rate suddenly rose up to 16.7% in Oct’12 and with a substantial decrease it had reached -8.1% in Dec’12 and remained in the red area thereafter with -4.4% in Mar’13.
The seasonal growth constantly decreased from 2.1% in Apr’12 to -3.2% in Aug’12 and rose to 3.3% in Oct’12. The seasonal growth rate in Nov’12 was 2.2% and remained in the red area for three consecutive months. It had reached -1.2% in Feb’12 and then changed to 4.6% in Mar’13.
The pace of de-growth of consumer durables eased to 0.9% in January 2013 from 8.2% in December 2012, partly reflecting the base effect, with a contraction of 7.5% in January 2012 as compared to a 5.1% growth in December 2011.
Consumer durables expanded by 3.2% in April 2012-January 2013, somewhat slower than the 3.7% growth in the same months of 2011-12, with high inflation and moderating agricultural and non-agricultural growth dampening demand for some categories of consumer goods in 2012-13.

P a g e | 8
NON DURABLES- Monthly YoY has an increasing trend till Oct’12 but its Dec’12 for monthly seasonal
average.
The IIP growth (%YoY) had started from 2.3% in Apr’12 reaching slightly in the negative territory and then experienced sudden ups and downs till Nov’12. In Jul’12 the rate was -0.5% and in Aug’12 it was 6.0%. A drastic change was noticed in Oct’12 with a growth rate of 11.2% and then entered the negative territory (mainly due to festival demand). From Jan’13 till Mar’13 the rate fluctuated between 4.6% and 6.9%. As a whole the majority of the trends were in the positive territory.
The seasonal growth rates remained in the red area from Apr’12 with -5.8% to -2.5% in Sept’12 and then suddenly entered the positive territory with a rate of 0.1% in Oct’12. After that it experienced a drastic change and reached 10.9% in Dec’12 which was followed by a slight decrease to 9.4% in Jan’13 and again with a negative rate i.e. -0.9% in Mar’13.
Consumer non-durables underwent a 5.3% expansion in January 2013, following the de-growth of 1.6% and 0.4%, respectively, recorded in November and December 2012. This partly reflects an easing base effect as well as inventory restocking by producers, after the y-o-y dip in production in the last two months of 2012.
Growth of consumer non-durables eased to 2.3% in the first 10 months of 2012-13 from a moderate 6.6% in the same months of the previous fiscal, highlighting the impact of high food inflation and rising retail prices of fuels on disposable income and consumer spending.
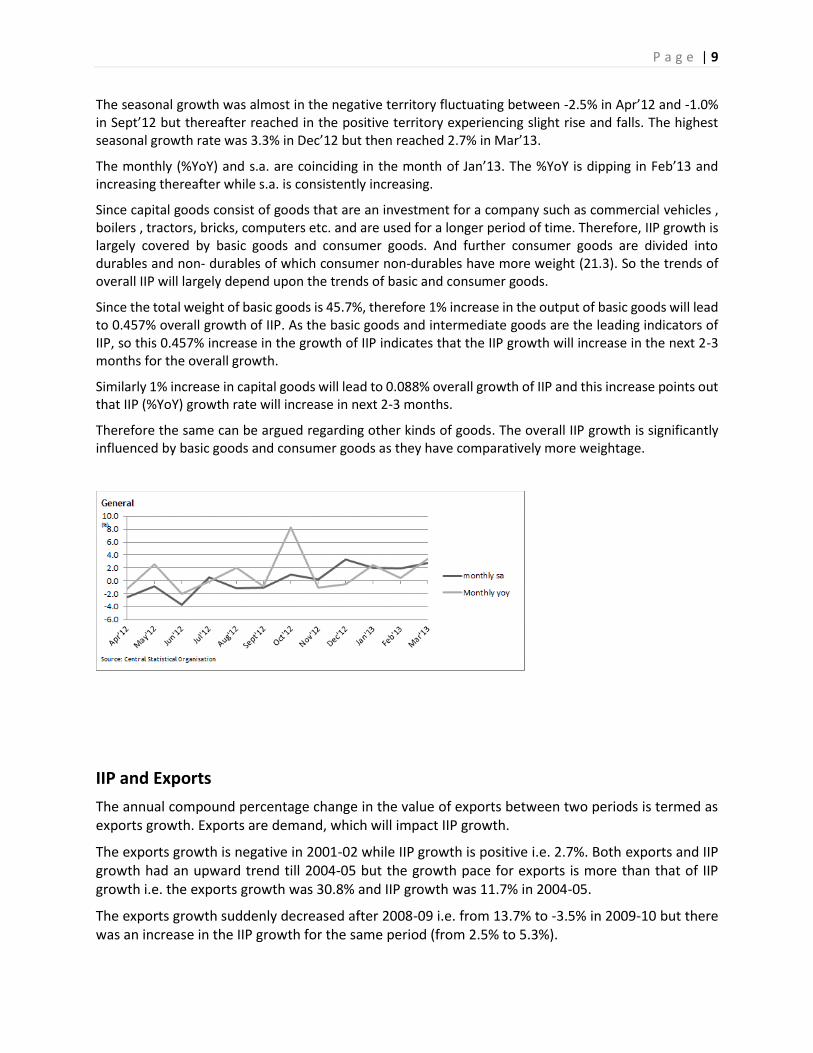
GENERAL
The overall IIP growth (%YoY) has an increasing trend till Oct’12 and then a declining trend. Monthly s.a. has an upward trend throughout. As this graph consists of overall trends i.e. it depends on all the above mentioned goods, therefore the IIP growth (%YoY) consists of sudden ups and downs. This high fluctuation might be due to the leading indicators.
A significant difference is noticed in IIP (%YoY) from -1.3% in Apr’12 to 2.5% in May’12 reaching to 8.3% in Oct’12 as the IIP growth rate (%YoY) is high for each type of goods in Oct’12. However after reaching -1.0% in Nov’12 the IIP growth (%YoY) reached 3.4% in Mar’13.
P a g e | 9
The seasonal growth was almost in the negative territory fluctuating between -2.5% in Apr’12 and -1.0% in Sept’12 but thereafter reached in the positive territory experiencing slight rise and falls. The highest seasonal growth rate was 3.3% in Dec’12 but then reached 2.7% in Mar’13.
The monthly (%YoY) and s.a. are coinciding in the month of Jan’13. The %YoY is dipping in Feb’13 and increasing thereafter while s.a. is consistently increasing.
Since capital goods consist of goods that are an investment for a company such as commercial vehicles , boilers , tractors, bricks, computers etc. and are used for a longer period of time. Therefore, IIP growth is largely covered by basic goods and consumer goods. And further consumer goods are divided into durables and non- durables of which consumer non-durables have more weight (21.3). So the trends of overall IIP will largely depend upon the trends of basic and consumer goods.
Since the total weight of basic goods is 45.7%, therefore 1% increase in the output of basic goods will lead to 0.457% overall growth of IIP. As the basic goods and intermediate goods are the leading indicators of IIP, so this 0.457% increase in the growth of IIP indicates that the IIP growth will increase in the next 2-3 months for the overall growth.
Similarly 1% increase in capital goods will lead to 0.088% overall growth of IIP and this increase points out that IIP (%YoY) growth rate will increase in next 2-3 months.
Therefore the same can be argued regarding other kinds of goods. The overall IIP growth is significantly influenced by basic goods and consumer goods as they have comparatively more weightage.
IIP and Exports
The annual compound percentage change in the value of exports between two periods is termed as exports growth. Exports are demand, which will impact IIP growth.
The exports growth is negative in 2001-02 while IIP growth is positive i.e. 2.7%. Both exports and IIP growth had an upward trend till 2004-05 but the growth pace for exports is more than that of IIP growth i.e. the exports growth was 30.8% and IIP growth was 11.7% in 2004-05.
The exports growth suddenly decreased after 2008-09 i.e. from 13.7% to -3.5% in 2009-10 but there was an increase in the IIP growth for the same period (from 2.5% to 5.3%).

P a g e | 10
For the year 2010-11, the difference between IIP growth and exports growth was the highest after which both had declining trends.
Overall, it can be viewed that both rates are increasing and decreasing at the same time inspite of too much difference.
The growth rate (%YoY) for exports came in at -1.6% in 2001-02 and then experienced a drastic change with 20.3% in 2002-03 but was almost the same for the 2003-04. It then had slight ups and downs reaching 28.9% in 2008-09.
A significant downward trend from 2007-08 to 2009-10 was mainly due to decline in growth of global demand which indicated that IIP growth was due to domestic demand. Domestic demand refers to the demand from within the country. This in turn suggests that there should be more policies for domestic dealing so as avoid decline in the domestic demand.
But then the growth had reached 40.5% in 2010-11 pointing an increase in the global demand. After 2010-11 there is a constant decrease till 2012-13 as once again there was an increase in the domestic demand.
In the whole span of 13 years, the growth (%YoY) was in the negative territory only for three years i.e in 2001-02, 2009-10 and 2012-13 and exports growth in all these years was negative.
Impact of IIP on Central Government Revenues
Service tax constitutes a smaller proportion of Indian government revenues and a large proportion of government revenue originates from industrial sector. While the efficiency of tax administration has its impact of government’s revenue collection performance, to a large extent government revenue collection depends on growth of industrial sector.
It can be seen that both revenue growth and IIP growth are following a same trend however both the rates have a significant difference but lie in the positive territory.

P a g e | 11
Both have an upward trend till 2003-04 but for the very next year i.e. 2004-05, the revenue growth rate is 6.6% while IIP growth rate is 11.7%. The IIP growth experienced a drastic change from 15.5% in 2007-08 to 2.5% in 2008-09 but the revenue growth is almost constant for the same period.
Between 2010-11 and 2011-12, both had a declining trend after which revenue growth is intended to increase whereas IIP growth to decrease.
The growth for central revenue remained in the positive territory throughout despite of high rise and falls.
The growth rate (%YoY) for central revenue entered at 11.3% in 2002-03 and then rose to 15.5% in 2003-04. It lowered for the next two consecutive years and then a sudden change bought the growth rate to 24.0% in 2008-09. This sudden change in the total revenue will lead to increase in the excise duty which is an inland tax on the sale, or production for sale, of specific goods or a tax on a good produced for sale, or sold, within a country or licenses for specific activities. Now increase in excise duty will in turn lead to an increment in custom duty which is a tax on the importation (usually) or exportation (unusually) of goods. This indicates that there was a substantial increase in the industrial performance due to which there will be a hike in the corporate tax which is imposed on net profits of a company. This would lead to a rise in the income tax of a particular individual or a firm.
From 2008-09 the revenue growth experienced an overall declining trend till 2012-13.
A slight rise was there from 2009-10 to 2010-11 i.e. from 15.9% to 16.9% which thereafter declined to 10.1% in 2011-12 and is likely to increase afterwards which suggests that there will be a hike in income tax in upcoming years.

P a g e | 12
APPENDIX
Monthly IIP growth
Exports (US$ Million)
Period
Month
Weight 45.70 8.80 15.70 29.80 8.50 21.30 100
Monthly monthly Monthly monthly Monthly monthly Monthly monthly Monthly monthly Monthly monthly Monthly monthly
yoy sa yoy sa yoy sa yoy sa yoy sa yoy sa yoy sa
Apr'11 7.1 -1.9 6.6 0.1 3.9 -1.3 3.2 -2.8 1.6 -2.1 4.6 -3.3 5.3 -1.8
May'11 7.5 1.6 6.2 1.3 0.1 -0.1 7.2 -3.5 5.1 -3.7 9.0 -3.4 6.2 -0.3
Jun'11 7.8 -3.4 38.7 -7.4 1.6 -2.5 3.1 -4.2 1.6 -4.6 4.3 -3.8 9.5 -4.1
Jul'11 10.0 0.9 -13.7 -1.9 -0.1 0.4 6.4 0.2 9.0 1.6 4.1 -0.9 3.7 0.2
Aug'11 5.8 -1.1 4.0 1.6 -1.0 -0.3 2.1 -2.2 5.5 -0.5 -0.7 -3.7 3.4 -1.0
Sep'11 5.3 -1.3 -6.5 -4.6 -1.4 -1.0 5.7 -0.2 8.9 3.1 2.7 -3.1 2.5 -1.4
Oct'11 1.2 -0.4 -26.5 -2.9 -8.4 -2.9 0.1 -2.6 -0.4 -1.9 0.5 -3.3 -4.9 -1.8
Nov'11 6.5 0.8 -4.7 -0.6 1.3 -0.3 12.8 3.4 10.4 2.3 15.0 4.5 6.1 1.3
Dec'11 5.5 3.8 -16.0 -3.0 -1.5 2.4 10.1 5.7 5.1 -1.2 13.8 12.0 2.7 3.3
Jan'12 1.9 2.1 -2.7 4.2 -2.5 3.0 2.5 6.0 -7.5 -0.1 10.6 10.9 1.0 3.8
Feb'12 7.6 1.1 10.5 0.6 1.0 0.9 -0.4 2.4 -6.2 0.0 4.4 4.2 4.2 1.4
Mar'12 1.1 1.4 -20.1 6.4 0.0 1.2 1.1 -0.5 1.2 3.3 1.0 -3.2 -2.8 1.4
Apr'12 1.9 -1.9 -21.5 -5.9 -1.8 -1.1 3.7 -2.4 5.4 2.1 2.3 -5.8 -1.3 -2.5
May'12 4.4 0.6 -8.6 -4.4 3.4 0.7 4.4 -2.0 9.7 1.4 -0.1 -4.8 2.5 -0.9
Jun'12 3.6 -2.6 -27.7 -10.4 0.9 -2.2 3.7 -3.3 9.1 -2.1 -0.5 -4.3 -2.0 -3.8
Jul'12 1.0 0.6 -5.8 3.9 0.1 1.0 0.7 -0.7 0.8 0.1 0.6 -1.5 -0.1 0.6
Aug'12 3.0 -1.5 -4.4 3.3 2.7 -0.5 3.6 -2.5 1.0 -3.2 6.0 -1.9 2.0 -1.1
Sept'12 2.7 -1.6 -13.3 1.9 1.7 -0.8 0.0 -1.5 -1.5 -0.4 1.4 -2.5 -0.8 -1.0
Oct'12 4.3 0.7 7.0 1.0 9.6 0.1 13.8 1.6 16.7 3.3 11.2 0.1 8.3 0.9
Nov'12 1.1 0.1 -8.5 -2.0 -1.4 -1.6 -0.3 2.0 1.1 2.2 -1.5 1.8 -1.0 0.2
Dec'12 2.2 3.6 -1.1 1.7 -0.2 1.7 -3.6 4.1 -8.1 -3.2 -0.5 10.9 -0.5 3.3
Jan'13 3.7 1.9 -2.5 1.3 3.5 1.1 2.5 2.7 -0.7 -5.6 4.6 9.4 2.5 2.0
Feb'13 -1.8 0.1 8.7 6.6 -1.0 1.0 0.4 2.7 -2.4 -1.2 2.5 5.4 0.5 1.9
Mar'13 3.0 1.7 9.0 10.2 2.4 2.1 1.8 1.3 -4.4 4.6 6.9 -0.9 3.4 2.7
General
goods goods goods Total Durables Non-durables Index
Basic Capital Intermediate Consumer goods
Year TOTAL EXPORTS YoY IIP Growth
2000-01 44560.3
2001-02 43826.7 -1.6 2.7
2002-03 52719.4 20.3 5.7
2003-04 63842.6 21.1 7.0
2004-05 83535.9 30.8 11.7
2005-06 103090.5 23.4 8.6
2006-07 126414.1 22.6 12.9
2007-08 162904.2 28.9 15.5
2008-09 185295 13.7 2.5
2009-10 178751.4 -3.5 5.3
2010-11 251136 40.5 8.2
2011-12 305963.9 21.8 2.9
2012-13 300570.6 -1.8 1.1

P a g e | 13
Central Government Revenue (Rs Billion)
YEAR REVENUE REVENUE YoY IIP
2000-01 3267.89
2001-02 3638.06 11.3 2.7
2002-03 4113.65 13.1 5.7
2003-04 4751.46 15.5 7.0
2004-05 5063.82 6.6 11.7
2005-06 5266.26 4.0 8.6
2006-07 5788.69 9.9 12.9
2007-08 7126.71 23.1 15.5
2008-09 8839.56 24.0 2.5
2009-10 10244.87 15.9 5.3
2010-11 11973.28 16.9 8.2
2011-12 13187.19 10.1 2.9
2012-13 14909.26 13.1 1.1