report on operations 2011 - banco desio
TRANSCRIPT

Report on Operations 2011

Report on Operations 2011
2
Corporate officesBoard of Directors
Chairman Agostino Gavazzi*
Deputy Chairman Stefano Lado*
Managing Director Nereo Dacci*
Directors Egidio Gavazzi*
Luigi Gavazzi
Paolo Gavazzi
Guido Pozzoli*
Luigi Guatri
Gerolamo Pellicanò
Pier Antonio Cutellé
Lorenzo Rigodanza
* M embers of Executives Committee
Board of Statutory Auditors
Chairman Eugenio Mascheroni
Statutory Auditors Rodolfo Anghileri
Marco Piazza
Alternate Auditors Giovanni Cucchiani
Clemente Domenici
Carlo Mascheroni
General Management
General Director Claudio Broggi
Vice General Director Marco Sala
Manager responsible for preparing the Company’s financial reports pursuant to article 154-
bis of Consolidated Law on Finance "TUF"
Nominated Official in charge of draw ing up Company Accounts Piercamillo Secchi

Report on Operations 2011
3
PREAMBLE
Following the merger of the subsidiaries Banco Desio Toscana S.p.A. and Banco Desio Veneto S.p.A. by
incorporation into the Bank, with legal effect from 1 October 2011, and in order to make the comparison between
the single items at 31 December 2011 and the data from the previous financial year more homogeneous, the
latter were aggregated with those from the merged companies, including the necessary intergroup eliminations,
as per the appropriate column “aggregate at 31.12.2010” of the Balance Sheet, as well as of the Income
Statement of the Financial Statements schedules (this aggregation has showed an increase in the 2010 Profit
equal to about Euro 0.1 million).
Therefore, the data and indexes reported in this Report on operations, in addition to the comments on the
breakdowns of the items and the changes that occurred, make reference, if applicable, to the Balance Sheet of
the Financial Statements layout, as well as to the reclassified Income Statement, as outlined in the appropriate
paragraph, which has in turn been prepared based on the Financial Statements layout.

Report on Operations 2011
4
1 - FINANCIAL HIGHLIGHTS AND RATIOS
BALANCE SHEET DATA
31.12.2011
aggregate at
in thousands of Euros 31.12.2010 Amount %
Total assets 7,391,542 7,309,380 82,162 1.1%
Financial assets 1,001,436 916,565 84,871 9.3%
Amounts due from banks 167,016 272,772 -105,756 -38.8%
Amounts due from customers 5,774,850 5,728,999 45,851 0.8%
Tangible assets 143,777 142,060 1,717 1.2%
Intangible assets 8,384 8,062 322 4.0%
Amounts due to banks 393,373 319,826 73,547 23.0%
Amounts due to customers 3,513,235 3,678,515 -165,280 -4.5%
Securities issued and financial liabilities
at fair value through profit or loss 2,543,123 2,338,667 204,456 8.7%
Shareholders’ equity (including net proft for the period) 745,679 747,644 -1,965 -0.3%
Total indirect deposits 9,943,316 10,565,284 -621,968 -5.9%
Change
INCOME STATEMENT DATA (1)
31.12.2011
aggregate at
Amount in thousands of Euros 31.12.2010 Amount %
Operating income 298,141 289,345 8,796 3.0%
of which net interest income 178,757 162,936 15,821 9.7%
Operating costs 197,961 196,888 1,073 0.5%
Operating margin 100,180 92,457 7,723 8.4%
Operating profit net of taxes 35,535 34,029 1,506 4.4%
Non-recurring profit after taxes 7,700 15,203 -7,503 -49.4%
Net profit/(loss) for the period 43,235 49,232 -5,997 -12.2%
(1) from reclassified Income Statement
Change

Report on Operations 2011
5
FINANCIAL RATIOS
31.12.2011
aggregate at
31.12.2010
Shareholders’ equity / Total assets 10.1% 10.2% -0.1%
Shareholders’ equity / Amounts due from customers 12.9% 13.1% -0.2%
Shareholders’ equity / Amounts due to customers 21.2% 20.3% 0.9%
Shareholders’ equity / Securities issued and financial liabilities
at fair value through profit or loss 29.3% 32.0% -2.7%
(Tier 1 and Core Tier 1) Equity ratio 17.0% 20.0% (2) -3.0%
(Tier 2) Solvency ratio 18.4% 22.3% (2) -3.9%
Financial assets / Total assets 13.5% 12.5% 1.0%
Amounts due from banks / Total assets 2.3% 3.7% -1.4%
Amounts due from customers / Total assets 78.1% 78.4% -0.3%
Amounts due from customers / Direct deposits from customers 95.4% 95.2% 0.2%
Amounts due to banks / Total assets 5.3% 4.4% 0.9%
Amounts due to customers / Total assets 47.5% 50.3% -2.8%
Securities issued and Financial liabilities
at fair value through profit or loss / Total assets 34.4% 32.0% 2.4%
Direct deposits from customers / Total assets 81.9% 82.3% -0.4%
Operating costs / Operating income (Cost/Income ratio) 66.4% 68.0% -1.6%
Net interest income / Operating income 60.0% 56.3% 3.7%
Operating margin / Operating income 33.6% 32.0% 1.6%
Operating profit net of taxes / Shareholders’ equity 4.8% 4.6% 0.2%
Net profit/(loss) for the period / Shareholders' equity (R.O.E.) 6.2% 7.0% -0.8%
(2) single data not aggregated
Amount
Change
STRUCTURE AND PRODUCTIVITY DATA
31.12.2011
aggregate at
31.12.2010 Amount %
Number of employees 1,608 1,583 25 1.6%
Number of bank branches 164 155 9 5.8%
in thousands of Euros
Amounts due from customers by employee (3) 3,619 3,636 -17 -0.5%
Direct deposits from ordinary customer by employee (3) 3,796 3,819 -23 -0.6%
Operating income by employee (3) 187 184 3 1.6%
(3) on the basis of the number of employees determined as arithmetic mean
Change

Report on Operations 2011
6
2 - THE BASELINE SCENARIO
2.1 - THE MACROECONOMIC FRAMEWORK
In 2011, the global economy suffered a further slowdown and the reduction in the rate of growth of GDP affected
both mature economies and emerging markets, with an associated variability in the growth rates of individual
countries. In a situation as volatile as this, many shadows remain hanging over the International Economy: the
slowdown in world trade, the fall in the price of raw materials, albeit at a moderate pace, and the weak expansion
of manufacturing activity in the USA and Asia, which moreover is in sharp decline in Europe.
Emerging Economies
At the end of 2011, the slowdown in economic activity in the BRIC countries became increasingly pronounced. In
the third quarter of 2011, GDP in China grew by 9.1% compared to average growth in 2010 of 10.4%. In India, the
slowdown was even more considerable (+6.7% against +10% of the previous year). In Brazil the slowdown
started to become increasingly marked; in the third quarter of 2011 GDP in Brazil grew by +2.1% on average
compared to +7.6% in 2010. On the other hand, Russia continued to record good growth rates; in the third quarter
GDP grew by an average of +4.8% against 4% in 2010. Consumer prices, after coming close to double figures,
started to slow down. Russia started to suffer from the EMU crisis as a result of the more well-established
presence of European banks in the region. The expansive measures of the Central Bank were aimed at avoiding
a liquidity crisis in a context of maintaining domestic demand.
United States
The US economy struggled to regain its pre-crisis growth rates. In the first two quarters of 2011, GDP growth data
were disappointing, whereas a rate of +2% was indicated in the final quarter, a trend that could continue into the
first months of 2012. The latest positive data released regarding the employment market and the property market
contributed to improving the climate of confidence in the strengthening of the economic cycle, although there are
still a number of grey areas; the main item of concern related to household spending which is rather low. In fact,
the weakness of the labour market weighs heavily on the trend of consumption; at the end of 2011 the rate of
unemployment in the USA was still very high, albeit falling in the last months of the year. Another element that
affected household spending was the level of borrowing; the ratio of loans to families to disposable income was
equal to 115%, lower than the peak of 130% in 2007 but still high when compared to the average of 70%
recorded in the last thirty years of the past century. Inflation remained broadly stable and fixed at 2%.
Japan
The situation in Japan highlighted a much deeper recession than previously reported as a result of the earthquake
in March. The third quarter saw a sharp rebound in the growth of investments in construction and exports. On the
other hand, growth in investments in machinery and equipment was negative whereas consumption rose slightly
due to the effect of the increase in real salaries. The main economic indicators showed a decline in service
activities and manufacturing at the end of 2011 in spite of the recovery in the summer.
Euro Zone
The difficulties faced by the European institutions in managing the crisis affected a growing number of countries.
Growth in the Euro Zone slowed; indeed after 3.1% in the first quarter, GDP increased at very moderate rates
(+0.7%, +0.6%). In the third quarter of 2011, GDP decreased compared to the second quarter, not only in a
number of peripheral countries of the European Union but also in Holland and Belgium. Germany still stood out
with reported growth of 1% in the second quarter and 2% in the third quarter. In France, after the standstill
recorded in the second quarter, GDP returned to growth in the third quarter with a variance of +1.5% being
recorded. The economic indicators for the last months of 2011 and the start of 2012 show an extremely weak
situation for the majority of countries, the only exception being Germany. At the end of the third quarter of 2011
Report on Operations 2011
7
industrial production in the Euro Zone recorded a decline of 1.8% on a monthly basis. The business confidence
index, which had been in decline since February, registered -7.3% in October. On the prices front, there was a
further increase in inflation. The situation on the labour market continued to be very negative; in October the rate
of unemployment hit 10.3%, up from the minimum level recorded in March 2008 (+7.3%). In a context in which the
great uncertainty regarding the cyclic upturn continued to be compounded by the necessity to recapitalise a large
number of banks, during 2011, the European Central Bank repeatedly provided support to the banking system
and tried to avoid a credit crunch for families and businesses using all the means at its disposal.
Italy
The performance of the Italian economy was disappointing; the trend of GDP declined by 0.5% on an annual
basis in the final part of the year. In October the industrial production index fell by another 2% with respect to the
previous month, a weakness that seems destined to last. Production expectations are at the lowest levels since
October, driven down mainly by a sharp reduction in orders. Exports were still below pre-crisis levels, having lost
24% and recovered only a half. In October, new manufacturing orders registered a decrease of 4.8% on an
annual basis. In the same month, retail sales registered a negative variance. In November the business
confidence index fell, from -9.7% to -11.3%. The mood of consumers fell sharply, from -29.2% to -34% between
November and December. The labour market too showed a rate of unemployment of around 8.6%, with much
higher peaks for the younger population; the depression of the employment market has led inevitably to a
considerable weakness in private consumption. In 2010, the increase in the prices index could largely be
attributed to the increase in oil prices, this tendency also intensified during 2011.
2.2 - THE CAPITAL MARKET AND THE BANKING SYSTEM IN ITALY
The change reported in the trends of the main economies in December 2011 recorded monthly performances less
than the growths recorded in 2010; this is also evident if we observe International stock markets: notwithstanding
the recovery in progress on a monthly basis, in fact, the annual changes were significantly negative. The Dow
Jones Euro Stoxx recorded a decrease of 12.5% on an annual basis, the Nikkei 225 of Tokyo 17.1%, while the
Standard & Poor’s 500 of New York substantially remained stable (+0.2%). The main European Stock Exchange
indexes also recorded, in December, monthly average changes showing a recovery but negative on an annual
basis: the Ftse Mib recorded a variation of 0.3% on a monthly basis (-26.1% y/y), the Dax30 +0.7% (-16.1% y/y),
the Cac40 +1.9% (-19.7% y/y) and the UK Ftse100 +1.5% (-6.8% y/y). In the wake of the trends in the stock
exchanges of the individual markets, in December 2011 the capitalization of the Euro Zone stock market also
showed a positive performance, on a cyclical basis (+0.5%) but negative on an annual basis (-18.1%). Within the
Euro Zone, capitalisation was equal to 9.9% of the total in Italy, 31.2% in France and 25.5% in Germany. With
specific reference to Italy, the overall capitalisation of the stock market came to Euro 133 billion (Euro 93 billion on
an annual basis) at the end of December. The impact of bank capitalization on the total came to 16.7% compared
to 29.8%, the value posted at the beginning of the financial crisis.
With reference to the banking system, at the end of 2011 the growth rate of domestic borrowing appeared to have
settled, while the trend in the borrowing on foreign markets showed a decrease. The tendential growth rate of
deposits in Euro of the Italian banks came to +1.5%. Specifically, deposits from customers recorded a tendential
negative growth rate of -2.1%, while the annual change in bonds was positive and equal to +7.8%; a decrease
was recorded by transactions with customers (-35.4%). The average return on bank deposits was stable,
consistently with the performance of market rates. The average rate of bank deposits from customers came to
1.11% in December 2011, down by 37 basis points compared to the same period of the previous period.
Loans to private individuals showed an increase at the end of 2011, recording a tendential growth of +4.1%; on
the basis of a breakdown by term, the medium/long-term segment showed a tendential growth change of +2.9%,
while the short-term segment showed an increase equal to 7.6%.

Report on Operations 2011
8
At the end of the year, a slight deceleration was recorded in the trend of loans to businesses: however, a growth
of 4.9% was recorded as a whole, a value which is again in line with the levels of April 2011. The weighted
average rate on total loans to families and non-financial companies was equal to 4.25%, while that of loans for the
purchase of properties was 3.83%.
In 2011, compared to 2010, the spread between the average rate on loans and the average rate on deposits
recorded a slight increase; in December 2011 it was higher by 1 basis point than recorded by the average of
December 2010. In the 2011 average the scissors were equal to 2.43%, up compared to the average value
recorded in 2010 (2.15%).
3 - LOCAL EXPANSION AND ISSUES OF CORPORATE INTEREST
3.1 - DEVELOPMENT OF THE DISTRIBUTION NETWORK
Even within the difficult macroeconomic scenario, the Bank firmly continued, also in 2011, to expand its
distribution network which, following the opening of nine branches, reached an overall number of 164 units at the
end of the financial year.
The branch network, increasingly widespread, continues to be marked by the central role given to the rapport and
relations with customers. The objective of the continuity in the expansion policy was aimed at putting roots down
in the territory with which the Bank is historically associated and in adjacent and complementary areas and taking
up other local opportunities. This policy led to specifically extend the presence of the Bank in Lombardy, Emilia,
Piedmont, Liguria, Tuscany and Veneto.
In the year that has closed, in particular the Bank opened four branches in Lombardy, in Milan near piazzale
Cadorna, Vimercate (Monza e della Brianza), Treviglio (Bergamo) and Brembate (Bergamo), three branches in
Emilia Romagna, in Bologna S. Viola (Bologna), Imola (Bologna) and Casalecchio di Reno (Bologna), one branch
in Piedmont in Leinì (Turin) and another branch in Tuscany in Sesto Fiorentino (Florence).
The chart below reports the breakdown of the local presence by regions, while the subsequent chart shows the
dimensional growth reached in the last few years, with growth rates corresponding to a Compound Annual Growth
Rate of 4.7% in the three year period 2009-2011.

Report on Operations 2011
9
Lombardy65.9%
Piedmont8.5%
Liguria3.7%
Emilia Romagna6.7%
Tuscany6.7%
Veneto8.5%
0
20
40
60
80
100
120
140
160
180
2008aggregate
2009aggregate
2010aggregate
2011
143150 155
164
Branches
3.2 - MAJOR CORPORATE EVENTS DURING THE FINANCIAL YEAR
Merger of the subsidiaries Banco Desio Toscana S.p.A. and Banco Desio Veneto S.p.A. by incorporation into the
Bank and transfer of stakes in the subsidiary Rovere Societé de Gestion SA
In view of a more correct streamlining of the banking network in relation to its vocation of retail bank, the Bank
implemented, in the year, the Plan of Merger by incorporation of the subsidiaries Banco Desio Toscana S.p.A.
and Banco Desio Veneto S.p.A., which led to the execution of the deed of merger with legal effect from 1 October
2011.
With reference to the shareholdings previously held by Banco Desio Toscana S.p.A. and Banco Desio Veneto
S.p.A. in the subsidiary Rovere Societé de Gestion SA, each for a share of 10%, and then transferred to the Bank
as a result of the merger, it should be pointed out that, at the same time, the same transferred these shares to the
subsidiary Brianfid-Lux SA, which increased its stake in the aforesaid company up to 70%.
Chart no. 2 - THE DISTRIBUTION NETWORK: GROWTH IN SIZE IN THE LAST FEW YEAR
Chart no. 1 - THE BANK DISTRIBUTION NETWORK: BREAKDOWN BY REGION

Report on Operations 2011
10
Approval of the 2012-2013 two-year Business Plan
On 22 December 2011, the Board of Directors of the Bank approved the 2012-2013 two-year Strategic Group
Plan in which, in a particularly difficult economic situation in which growth prospects and the performance of the
financial markets are dependent on a number of crisis indicators, it reaffirms its strategy of unwavering confidence
in the retail banking model, as a provider of a full range of services to its customers.
This Strategic Plan also incorporates the “Local Development Project” for the two-year period as notified to the
Bank of Italy; as part of an ever-targeted local development initiative, it is expected that the distribution network of
the Bank will number a total of 174 branches at the end of 2013, increased to 197 branches at Group level.
Capital strengthening of the subsidiaries Banco Desio Lazio S.p.A. and FIDES S.p.A.
As part of the strategic planning scheduled for the 2012-2013 two-year period, on 20 December 2011, the Bank
made a shareholders’ contribution to the capital of the subsidiary Banco Desio Lazio S.p.A., non-interest-bearing
and without expiry (non-refundable), amounting to €10 million. The consequent capital strengthening can be
connected for the most part to the forecast of operational development for the indirect subsidiary FIDES S.p.A.;
indeed, on the same date, Banco Desio Lazio S.p.A. in turn made a shareholders’ contribution to the capital of the
finance company, non-interest-bearing and without expiry (non-refundable), amounting to Euro 5 million. Both
transactions provide the opportunity to start the authorisation and deliberation process in order to reach the
respective capital increases of the companies.
Capital increase serving a Stock Grant Plan for the three-year period 2011-2013
On 27 October 2011, the Board of Directors of the Bank took, subject to the favourable opinion of the
Appointments and Remuneration Committee (to the extent pertaining thereto), some measures after the
resolutions of 21 July 2011, which were adopted for the purposes of bringing the Group’s Incentive System into
line with the “Provisions for banks and banking groups governing remuneration and incentive policies and
practices” (Disposizioni per le banche e i gruppi bancari in materia di politiche e prassi di remunerazione e
incentivazione) issued by the Bank of Italy on 30 March 2011.
Following the subsequent authorisation given by the Bank of Italy as to the amendments to the by-laws connected
to the 2011-2013 Stock Grant Plan, which forms an integral part of the new Incentive System, and at the request
of the Board of Directors, on 29 November 2011 the Ordinary Shareholders’ Meeting approved the review of the
Group’s Remuneration Policies in relation to the Incentive System in favour of the Management, as adopted for
the purposes of complying with the abovementioned Supervisory provisions, the Stock Grant Plan for the three-
year period 2011-2013 concerning the assignment, free of charge, of a maximum number of 1,000,000 ordinary
shares of the Company in favour of the Group’s Management (as identified in the application of the
abovementioned supervisory Provisions), as well as the establishment of appropriate reserve for accumulated
earnings, subject to the service of the capital increase, free of charge, reserved for the Group’s Management.
Accordingly, the Extraordinary Shareholders’ Meeting held on the same date approved the capital increase, free
of charge, pursuant to article 2349 of the Italian Civil Code, on a divisible basis, for a maximum nominal amount of
Euro 520,000 corresponding to a maximum number of 1,000,000 ordinary shares, with a par value of Euro 0.52
each, serving the Stock Grant Plan, to be issued by the Board of Directors in more than one tranche, within the
time limits and subject to the conditions envisaged in the Plan itself, through the use of an appropriate equity
reserve drawn from other free equity reserves made up of “undivided profits” and also approved the correlated
proposed amendments to Section 4 of the Bylaws.
Capital increase of the subsidiary Chiara Assicurazioni S.p.A. and increase to 66.66% of the stake held by the
Bank in the insurance company
On 27 April 2011 the subsidiary Chiara Assicurazioni S.p.A. implemented the capital increase of Euro 0.6 million,
serving the residual Shareholding plan, increasing it to Euro 9.4 million; at the same time, the Bank increased its

Report on Operations 2011
11
stake held in the Insurance Company up to 66.66%, considering that, as early as 15 February 2011, it had
reached 62.43% as a result of the purchase of 50,000 shares.
Payment by shareholders on account of capital of the associated company Chiara Vita S.p.A.
In view of the strengthening of the capital structure of the associated company Chiara Vita S.p.A., on 20 April
2011 the Bank made a shareholder payment on account of capital of Euro 2.7 million.
Acquisition of the stake in AcomeA SGR S.p.A.
On 25 July 2011 the Bank acquired 50,000 ordinary shares of AcomeA SGR S.p.A., within the capital increase of
the same, at a price of Euro 30.00 per share (including Euro 20.00 by way of share premium), for a counter-value
of Euro 1.5 million. As a result of this transaction, the bank holds a stake of 9.09% of the finance company.
Group remuneration policies
The Banco Desio Group has adopted the Bank of Italy and Consob regulations with respect to remuneration
policies. The objective of the Bank of Italy is to ensure, in the interest of all stakeholders, systems of remuneration
that are in line with the long-term corporate strategy and objectives, correlated to the company results, suitably
adjusted to take into account all risks, consistently with the levels of capital and liquidity necessary to deal with the
activities undertaken and in any case such as to avoid any incentives that may give rise to conflicts of interest and
excessive risk taking. For all details, reference is made to the Group Remuneration Policies prepared pursuant to
article 123-ter of the TUF, which are available on the Group’s website, together with this Report.
Opening of inspection procedures by the Bank of Italy
It should be pointed out that on 21 November 2011 an ordinary supervisory inspection was started at the Bank in
relation to the Banco Desio Group.
Tax assessment by the Finance Police
It should be pointed out that on 14 December 2011 a tax assessment was started at the Bank by the Finance
Police – Tax Police Unit of Milan Milano.
3.3 - OTHER TRANSACTIONS / MAJOR CORPORATE EVENTS RELATING TO SUBSIDIARIES
OR ASSOCIATES
Judicial investigations - Banco Desio Lazio S.p.A. and Credito Privato Commerciale S.A.
On 3 January 2012, the company received notification of a request for committal for trial submitted by the Public
Prosecutor’s Office of the Court of Rome, within the context of judicial proceedings concerning, among others, a
number of parties who at the time of the alleged events, which date back to 2009, were representatives of the
subsidiaries Banco Desio Lazio S.p.A. and Credito Privato Commerciale S.A., as well as third parties with respect
to the Companies themselves.
As the alleged events include offences that entail the administrative liability of legal persons, pursuant to
Legislative Decree 231/2001 Banco Desio Lazio S.p.A. is involved in the abovementioned proceedings, in relation
to the unlawful administrative act contested envisaged under articles 5 of Legislative Decree 231/2001 and 10,
paragraph 2, of Law 146/2006, for the cases provided for by articles 416 and 648-bis of the Italian Criminal Code
alleged against the then Chief Executive Officer of the Company itself, as a result of the administration
relationship existing at that time; Credito Privato Commerciale S.A. is involved in relation to the unlawful
administrative act contested envisaged under articles 5 and 25-octies of Legislative Decree 231/2001 and 10,
paragraph 2, of Law 146/2006, for the cases provided for by articles 416 and 648-bis of the Italian Criminal Code
alleged against the then General Manager of the Company itself, as a result of the management relationship
existing at that time.

Report on Operations 2011
12
In light of the above, the Boards of Directors of each of the two subsidiaries has approved, in order to be prudent,
the setting aside of a specific provision amounting to the average of the minimum and maximum penalties
envisaged. On the basis of the work performed and the checks conducted so far in relation to the conditions of a
plea bargain, the defence lawyer for the subsidiaries Banco Desio Lazio S.p.A. and Credito Privato Commerciale
S.A. has confirmed that any other risks have been ruled out; in particular, we highlight that the banks have taken
steps to adopt and implement an appropriate organisational model and before the next hearing they will also take
steps to implement the remaining conditions which are required in order to rule out the application of disqualifying
sanctions under article 17 of Legislative Decree 231/01.
Adjustment to the value of the equity investment of Brianfid-Lux S.A. in the subsidiary Credito Privato
Commerciale S.A.
As part of the procedure that has been launched to explore the market for the possible sale of the Swiss
subsidiary Credito Privato Commerciale S.A. by Brianfid-Lux S.A., the company has taken steps to align the value
of the stake to the value deriving from the contingent application of market benchmarks for transactions of that
nature.
4 -HUMAN RESOURCES
4.1 - MANAGEMENT AND BREAKDOWN OF THE RESOURCES
While respecting the individual characteristics of the companies, human resource management aims for a unitary
and synergetic approach, bolstering expectations and fostering professional growth as well as ensuring the
sharing of values within the Group. This approach, in line with the geographic expansion policy, accompanies the
dissemination of information and development in areas with which the Bank has historic associations and in inter-
regional offices in different catchment areas and economic sectors.
As at 31 December 2011, the subordinate staff increased to 1,608 employees, with a change of twenty-five
resources more than the previous year, corresponding to 1.6%.
The increase in the number of staff in the last three-year period 2009-2011 corresponded to an average
compound annual growth rate equal to 0.9%, lower than that registered in the distribution network, which was
equal to 4.7%, as evidenced by the numeric data represented in the chart below.
0
200
400
600
800
1.000
1.200
1.400
1.600
1.800
2008aggregate
2009aggregate
2010aggregate
2011
1,565 1,568 1,5831,608
Employees
Chart no. 3 - INCREASE IN THE GROUP STAFF NUMBERS IN THE LAST FEW YEARS

Report on Operations 2011
13
The table below shows the breakdown of staff by grade.
No. of employees 31.12.2011Percentage
breakdown
aggregate at
31.12.2010
Percentage
breakdown
Value %
Executives 28 1.7% 29 1.8% -1 -3.4%
3rd and 4th level managers 397 24.7% 379 23.9% 18 4.7%
1st and 2nd level managers 451 28.1% 441 27.9% 10 2.3%
Other personnel 732 45.5% 734 46.4% -2 -0.3%
Staff 1,608 100.0% 1,583 100.0% 25 1.6%
Change
The chart below reports the breakdown of staff employed at the end of the financial year by area, showing the
predominance of the share attributable to the distribution network, equal to 72.1%.
72.1%
27.9%
Distribution network General Management and Operational Support to the Group
The average age of employees at the end of the period was 43 years, while the percentage of female staff came
to 35%.
4.2 - TRAINING ACTIVITIES
With reference to training activities, which is a distinctly effective partner in growth processes and in developing
resources, in accordance with the directives and procedures envisaged at Group level, the financial year saw the
implementation of an overall number of 7,569 man/days, counting in-house courses, conferences, external
seminars and online training activities.
The provision of training in 2011 is broken down according to the types outlined below:
- “General”: offers courses targeted at all professional families and with the objective of developing cross-
sector skills;
- “Technical-professional”: includes courses aimed at developing the technical skills of staff who are starting
out in the performance of specific tasks or those interested in consolidating or further improving skills that
are relevant to the position held;
Table no. 1 - STAFF: BREAKDOWN BY GRADE
Chart no. 4 - BREAKDOWN OF THE STAFF IN EMPLOYMENT BY AREA OF REFERENCE

Report on Operations 2011
14
- “Inter-personal skills”: aims to develop behavioural skills and facilitate the spreading of the business
culture as well as the internalisation of the company values.
The chart below reports the percentage breakdown of the days of training meetings for the three types specified.
81.6%
9.6%
8.8%
Technical-professional General Interpersonal skills
Within the scope of “General” training activities, note the importance attached to the actions for compliance with
the regulations in force; specifically, attention was paid to the issues concerning “Money Laundering”, “Legislative
Decree 231/2001”, “Transparency” and “Safety at Work”.
Regarding the “Technical professional” training, the percentage breakdown of the meetings held based on the
classification of the issues dealt with by sectors concerned is represented in the following chart.
62.1%
11.7%
26.2%
Finance and insurance Administrative Commercial, Credit, International and other
The activity carried out, which particularly affects the “Loans” area, is composed of courses aimed at the further
growth of professionals with a significant commitment to the planning of specific activities for the support and
consolidation of skills, given the complexity and the changing needs of the market caused by the difficult and
fragile macroeconomic situation.
In the “Finance and Insurance” segment we note the delivery of the programme relating to “Risks in investment
services” which has been extended to the whole Private Clients department, with the objective of raising
awareness among Network staff with regard to behaviour that is always strictly aligned to operational standards.
In the Private Banker world, the training activity for the certification of on-the-job skills which was started in
Chart no. 6 - “TECHNICAL PROFESSIONAL” TRAINING IN THE YEAR 2011: BREAKDOWN BY SUBJECT
Chart no. 5 - “TECHNICAL PROFESSIONAL” TRAINING IN THE YEAR 2011: BREAKDOWN BY SUBJECT

Report on Operations 2011
15
previous years was completed. Furthermore, although it is cross-cutting compared to the specificity of individual
professionals, as well as having maintained the insurance update in accordance with the provisions of the ISVAP
Regulation, attention was given to the further development of specific skills for relevant profiles.
As regards the “Interpersonal Skills” initiatives we highlight the launch of a training programme to develop
“commercial” skills, which moreover is being intensified this year and which pursues the objectives of improving
interpersonal performance during the commercial offer phase as well as of increasing knowledge of clients, who
have always been a focus of great attention since they are the true assets of the Group.
In general, the organisation of the training provision has led, and will lead to an increasing extent, to the use of
channels that supplement the traditional classroom; in this regard we highlight the use of distance learning
modules (FAD), manuals to support working activity and periods of working alongside subject experts, such as for
example training on the job within the “Foreign” activities.
The focus placed by the Group on the growth and development of professional skills was recognised by the
Fondo Banche Assicurazioni (FBA) (Banks and Insurance Companies Fund) which in 2011 provided the Bank
with grants of around €0.5 million. The Fund’s recognition and support for training activity is the result of an
approach that is now well-established.
4.3 – LABOUR RELATIONS
In the context of trade union relations, which have always been characterised by a cordial and constructive
relationship in the manner established by the Bank, also at group level, it is noted that requests submitted by the
company trade unions for the complete renewal of the Supplementary Company Agreement were closely
examined during 2011. During this procedure it was confirmed that the 2nd
-level supplementary bargaining will
take place exclusively as regards the subjects expressly referred to by the National Collective Labour Agreement
(CCNL, Contratto Collettivo Nazionale di Lavoro) for the sector; the negotiations, for which we are still waiting for
the outline of the package put forward by the trade unions, will therefore take place within this context.
It should be pointed out that, on 19 January 2012, the A.B.I. (Associazione Bancaria Italiana, Italian bankers’
Association) and the Trade Unions for the sector signed the new “National collective labour agreement for middle
managers and for the staff of professional areas depending on credit, finance and instrumental companies”
(Contratto Collettivo nazionale di lavoro per i quadri direttivi e per il personale delle aree professionali dipendenti
dalle imprese creditizie, finanziarie e strumentali).
5 - CONTROL ACTIVITIES
5.1 - LEVELS OF CONTROL IN THE FUNCTION OF DIRECTION AND CO-ORDINATION
In the exercise of its function of direction and co-ordination, the Bank, in its capacity as the Parent Company,
effects three levels of control on subsidiaries in order to implement the specific “co-ordination model” selected,
taking account of the nature and size of the activities carried out by the individual companies together with their
specific location and identifying the competent functions of the Parent Company for the specific control
mechanisms.
The first level is of a strategic nature and is designed to maintain a constant check that the indications given by
the Parent Company are kept to. Implementation is achieved for the most part by the presence of its own
representatives on the Boards of Directors of each subsidiary company, normally in sufficient numbers to
represent a majority.
Report on Operations 2011
16
The second level is more concerned with management and relates to the activities of analysis, systemising and
evaluation of the periodical information flows from subsidiary companies in order to confirm the pursuit of strategic
goals in compliance with supervisory rules, the preparation of sufficient reports on performance and profitability,
the analysis of development, research/investment plans and strategic opportunities, forecast flows and all other
information necessary for the preparation of the Group Budget.
The third level can be described as being technical/operational in nature and in practice is conducted through the
supervision of internal control systems.
Additional information on direction and coordination activities is contained in paragraph 2.3 of the Annual Report
on Corporate Governance made available, pursuant to article 123-bis of the Consolidated Law on Finance, on the
Group’s website at the same time as this Report, to which reference is made.
5.2 - INTERNAL CONTROL SYSTEM
The internal control system is made up of the collection of standards of conduct, rules and organisational
procedures which, in observance of law instructions from the Supervisory Body and business strategies, make it
possible to manage all Group activities properly, involving the top Bodies and management and, in general, all
staff.
Detailed information on the internal control system, as well as on the Manager responsible for preparing the
Company’s financial reports, and then also on risk management systems and on systems of internal control over
the financial reporting process, is contained in paragraphs 1 and 7 of the Annual Report on Corporate
Governance made available, pursuant to article 123-bis of the Consolidated Law on Finance, on the Group’s
website at the same time as this Report, to which reference is made.
5.3 - RISK MEASUREMENT AND MANAGEMENT
With regard to the specific activities carried out by the Bank’ Risk Management Function, designed to ensure that
checks are maintained on the various risk types through the adoption of integrated processes, please refer to Part
E of the Notes to the Financial Statements “Information on Risks and the Related Hedging Policies”.
6 - MANAGEMENT PERFORMANCE
6.1 - SAVINGS DEPOSITS: ADMINISTERED CUSTOMER ASSETS
At the end of the financial year the total administered customer assets came to about Euro 16 billion, with an
increase of 0.7% in direct deposits and a decrease of 5.9% in indirect deposits, particularly affected by the
international economic and financial crisis that significantly affected stock prices, which entailed a decrease in the
value of deposits equal to 3.5%.
The table below reports the breakdown and balances of the items of the aggregate.

Report on Operations 2011
17
Amounts in thousands of Euro31.12.2011 Percentage
breakdown
aggregate at
31.12.2010Percentage
breakdown
Value %
Amounts due to customers 3,513,235 22.0% 3,678,515 22.2% -165,280 -4.5%
Securities issued and financial liabilities at fair
value through profit or loss 2,543,123 15.9% 2,338,667 14.1% 204,456 8.7%
Direct deposits 6,056,358 37.9% 6,017,182 36.3% 39,176 0.7%
Deposits from ordinary customers 6,927,123 43.3% 7,396,237 44.6% -469,114 -6.3%
Deposits from institutional customers 3,016,193 18.8% 3,169,047 19.1% -152,854 -4.8%
Indirect deposits 9,943,316 62.1% 10,565,284 63.7% -621,968 -5.9%
Total deposits from customers 15,999,674 100.0% 16,582,466 100.0% -582,792 -3.5%
Change
Direct deposits
At the end of 2011 the balance of direct deposits increased to about Euro 6.1 billion (+0.7%) as a result of the
increase in outstanding securities and financial liabilities at fair value (+8.7%), which was partially adjusted by the
decrease in amounts due to customers (-4.5%).
Amounts due to customers, which continue to represent the most significant item with 58% of the aggregate, can
be referred to the “sight” deposits, i.e. current accounts and savings deposits, for about Euro 3.3 billion, while a
residual part refers to time deposits, reverse repurchase agreements and other payables.
Securities issued and financial liabilities at fair value refer to bonds issued and placed by the Bank for Euro 2.2
billion (including about Euro 0.1 billion of subordinated securities) and to deposit certificates for Euro 0.4 billion.
Within the balance, financial liabilities reported on the basis of the fair value option amounted to Euro 0.1 billion
and related to bond loans hedged with financial derivative instruments.
It should be pointed out that, during 2011, the total nominal value of the bond loans issued and placed was
around Euro 0.8 billion, while that of the loans repaid upon expiry amounted to about Euro 0.6 billion.
Indirect deposits
In the twelve months indirect deposits reported decrease of about Euro 0.6 billion, equal to 5.9% of the previous
balance, coming to about Euro 9.9 billion.
Deposits from “ordinary” customers came to about Euro 6.9 billion, with an annual decrease of about Euro 0.5
billion, equal to 6.3%, which concerned both administered and managed assets, the latter showing an increase in
the “bank-insurance” assets.
Deposits from institutional customers reported a decrease of about Euro 0.1 billion compared to the balance of
the previous financial year, equal to 4.8%.
The table below gives the details of the items in question, showing the variations reported at the end of the twelve
months under analysis.
Table no. 2 - DEPOSITS FROM CUSTOMERS

Report on Operations 2011
18
Amounts in thousands of Euros31.12.2011 Percentage
breakdown
aggregate at
31.12.2010
Percentage
breakdown
Value %
Asset administration 3,870,257 38.9% 4,055,867 38.4% -185,610 -4.6%
Asset management 3,056,866 30.8% 3,340,370 31.6% -283,504 -8.5%
of which: Mut.Fund and Open-end Inv. 774,042 7.8% 1,103,750 10.4% -329,708 -29.9%
Portfolio management 267,892 2.7% 351,830 3.3% -83,938 -23.9%
Bank Insurance 2,014,932 20.3% 1,884,790 17.8% 130,142 6.9%
Deposits from ordinary customers 6,927,123 69.7% 7,396,237 70.0% -469,114 -6.3%
Deposits from institutional customers 3,016,193 30.3% 3,169,047 30.0% -152,854 -4.8%
Indirect deposits 9,943,316 100.0% 10,565,284 100.0% -621,968 -5.9%
Change
The charts below represent the percentage breakdown by segment of the indirect deposits from ordinary
customers as at 31 December 2011, as well as that of the components of the managed assets.
55.9%
44.1%
Asset administration Asset management
25.3%
8.8%
65.9%
Mut.Fund and Open-end Inv. Portfolio management Bank Insurance
Table no. 3 - INDIRECT DEPOSITS
Chart no. 8 - INDIRECT DEPOSITS FOR ASSET MANAGEMENT AT 31.12.2011: BREAKDOWN
Chart no. 7 - INDIRECT DEPOSITS FROM ORDINARY CUSTOMERS BY SECTOR AT 31.12.2011: BREAKDOWN

Report on Operations 2011
19
With reference to the components of the Mutual Funds and Open-end Inv. and Portfolio Management, the
diversification of the investments was the key theme for management, in order to be better able to seize all the
opportunities in the context of an extremely difficult economic situation and its main objective was to preserve
invested capital. The bond portfolios tried to balance, on the one hand, activities that are risk-free despite their
particularly low yield and, on the other hand, issues with potential to give interesting returns even if they are
characterised by an increased price volatility. The share component was characterised by an extremely prudent
approach; the investment favoured companies with strong financial statements, investing in large cap companies
with interesting dividends and operating in all the main global markets.
6.2 - CREDIT MANAGEMENT: LOANS TO CUSTOMERS
Loans to customers continued its growth trend, witnessing the particular commitment undertaken by the Group for
the actual support to families and small- and medium-sized companies in the difficult economic and financial
context. At 31 December 2011 the total amount of lending to customers increased up to about Euro 5.8 billion,
with an annual increase of about Euro 0.1 billion, equal to 0.8%; the graph below represents the development
trend of loans in the three-year period 2009-2011.
0
2
4
6
2008aggregate
2009aggregate
2010aggregate
2011
5.15.5
5.7 5.8
Euro/BN
The differences in the balances of the items making up lending, as shown in the table below, indicate in particular
the increase in the actuarial form of current accounts and, even if more limited, the increase in the medium- and
long-term forms and particularly mortgages.
Amounts in thousands of Euros
31.12.2011
Percentage
breakdown
aggregate
at
31.12.2010
Percentage
breakdow n
Value %
Households 1.859.912 32,2% 1.809.615 31,6% 50.298 2,8%
Non-financial companies, small businesses
and family businesses 3.603.224 62,4% 3.689.419 64,4% -86.195 -2,3%
Financial companies 274.269 4,8% 159.289 2,8% 114.979 72,2%
Private social institutions and others (1) 37.444 0,6% 70.675 1,2% -33.231 -47,0%
Amounts due from customers 5.774.850 100,0% 5.728.999 100,0% 45.851 0,8%
Change
Chart no. 9 - LOANS TO CUSTOMERS: THE TREND OVER THE LAST FEW YEARS
Table no. 4 - AMOUNTS DUE FROM CUSTOMERS

Report on Operations 2011
20
Amounts due to customers are also analysed in the table below, which evidences the changes in balances
registered in the period under review, based on the type of customer, while the following chart represents their
breakdown as at the end of 2011.
It is worth noting, in particular, the continuous predominance of loans to non-financial companies, small
businesses and family businesses, which, at the end of the period, represented a share of 62.4% of the total,
totalling Euro 3.6 billion and the increasing relevance of loans to households, with a positive change of 2.8%.
Amounts in thousands of Euros
31.12.2011
Percentage
breakdown
aggregate
at
31.12.2010
Percentage
breakdow n
Value %
Households 1,859,912 32.2% 1,809,615 31.6% 50,298 2.8%
Non-financial companies, small businesses
and family businesses 3,603,224 62.4% 3,689,419 64.4% -86,195 -2.3%
Financial companies 274,269 4.8% 159,289 2.8% 114,979 72.2%
Private social institutions and others (1) 37,444 0.6% 70,675 1.2% -33,231 -47.0%
Amounts due from customers 5,774,850 100.0% 5,728,999 100.0% 45,851 0.8%
(1) including financial and non financial companies in the rest of the world
Change
32.2%
62.4%
4.8%
0.6%
Households Non-financial companies, small businesses and family businesses Financial Companies Private social institutions and others
The chart below is an analysis of the breakdown of the loans referable to the category of non-financial companies,
small businesses and family businesses with reference to the relevant economic sector.
Table no. 5 - AMOUNTS DUE FROM CUSTOMERS: BREAKDOWN BY TYPE OF CUSTOMER
Chart no. 10 - AMOUNTS DUE FROM CUSTOMERS AS AT 31.12.2010: PERCENTAGE BREAKDOWN BY TYPE OF CUSTOMER

Report on Operations 2011
21
6,3%4,3%12,0%
20,0%
30,1%
27,3%
Metal products, excluding machinery and means of transport Textiles, leather, footwear products andclothing
Construction Commerce, salvage and repair services
Other sales services Other
The chart above highlights the considerable relevance of loans to companies belonging to the tertiary sector in
general, particularly as regards other sales services, commerce, salvage and repair services, as well as
construction. Jointly considered, these loans represent a share of 62%, corresponding to about Euro 2.2 billion, of
the category under analysis.
The credit quality reflects the guidelines based on the principles of prudence, diversification and targeted
development characterising the credit policies of the whole Banco Desio Group, constituting the essential element
in the credit provision strategy and it permits a degree of concentration on smaller figures.
As regards the distribution of gross loans, including endorsement loans, the percentage impact of uptakes by the
largest clients at the end of 2011 compared to the final figure at the end of the previous year, is reported in the
table below, reflecting the high and even greater degree of risk spreading.
Number of customers
31.12.2011 aggregate
at
31.12.2010
10 largest customers 2.0% 4.6%
20 largest customers 3.0% 5.8%
30 largest customers 3.9% 6.8%
50 largest customers 5.3% 8.6%
it should be pointed out that, according to the supervisory regulations in force, two positions were reported at the
end of 2010, which can be classified as “Significant Risks”, for a total nominal amount (which also includes the
guarantees given and any commitments) of about Euro 1.1 billion, which is set to zero in terms of total weighted
amount. Excluding any relations with the Group companies and the Treasury Ministry, no outstanding position is
reported.
Table no. 6 – AMOUNTS DUE FROM LARGEST CUSTOMERS: CONCENTRATION INDEX
Chart no. 11 - AMOUNTS DUE FROM NON-FINANCE COMPANIES, SMALL BUSINESSES AND OTHER FAMILY BUSINESS AS AT
31.12.2011: PERCENTAGE BREAKDOWN BY ECONOMIC SECTOR

Report on Operations 2011
22
At the end of the period the total amount of net impaired loans, represented by non-performing loans and problem
loans in addition to expired loans, that is persistent breach in relation to continuing failure to comply with credit
limits, as well as restructured exposures, amounted to Euro 224.2 million, net of value adjustments of Euro 102.3
million. Specifically, net non-performing loans amounted to Euro 117 million, net problem loans to Euro 94.7
million and expired loans to Euro 28.6 million and restructured exposures to Euro 4 million.
The table below summarises gross and net credit risk ratios: the amounts are still low, even though there was a
generalised increase compared with the previous year as a natural consequence of the economic crisis.
% Indexes for gross loans
31.12.2011 aggregate
at
31.12.2010
Gross impaired loans to customers 5.87% 4.77%
of which:
- gross non performing loans 3.22% 2.55%
- gross problem loans 2.08% 1.69%
- gross expired loans 0.50% 0.45%
- gross restructured loans 0.07% 0.08%
% Indexes for net loans
31.12.2011 aggregate
at
31.12.2010
Net impaired loans to customers 4.23% 3.24%
of which:
- net non performing loans 2.03% 1.48%
- net problem loans 1.64% 1.25%
- net expired loans 0.50% 0.44%
- net restructured loans 0.07% 0.07%
6.3 THE SECURITIES PORTFOLIO AND INTER-BANK POSITION
The securities portfolio
On 31 December 2011 the Bank’s total financial assets were equal to Euro 1 billion, compared to Euro 0.9 billion
which was the figure of the preceding year.
The chart below presents the percentage breakdown of the portfolio based on the types of securities, showing
that debt securities, mainly comprised of Government securities and of primary bank issuers, accounts for the
most significant portion.
Table no. 7 - AMOUNTS DUE FROM CUSTOMERS: RISK CREDIT INDICATORS

Report on Operations 2011
23
95.1%
0.7%
4.0%0.2%
Debt securities Equity securities UCITS units Derivative instruments
With reference to the issuers of securities, the aggregate Portfolio at the end of the financial year is comprised of
“Government securities” (over 58.4%), “Italian bank securities” (30.9%), and by “other issuers” for the remaining
share, as evidenced in the graph below.
70.5%
21.5%
8.0%
Governments Banks Others
The Portfolio’s choice of investment fell, therefore, to a very large extent, to the government securities of Italy and
the main Italian bank issuers, where there was particularly low volatility above all in the first half of 2011, when the
spread between Italian long-term and German ten-year treasury bonds ranked between 150 and 180 basis points.
From July the unprecedented and completely unexpected speculative attacks against Italy, which initially caused
the spread to rise to 300 and then reach 560 basis points for both two-year and ten-year bonds, led the Bank to
consolidate its defensive operational policy by keeping the duration below 2 years.
This prudent profile allowed the company to achieve an economic result that was in line with the budget and to
maintain the capital losses of the AFS Portfolio at sustainable levels, whereas a gradual reduction of the
corporates component was initiated, in favour of government securities, in order to improve the Basel III Liquidity
Coverage Rate (LCR).
Exposures held in sovereign debt
With reference to Consob communication n. DEM/11070007 of 05/08/2011 “Communication on information to be
provided in the financial reports as to the exposures held by listed companies in sovereign debt securities”
Chart no. 12 - FINANCIAL ASSETS AT 31.12.2011: PERCENTAGE BREAK-DOWN BY TYPE OF SECURITY
Chart no. 13 - FINANCIAL ASSETS AT 31.12.2011: PERCENTAGE BREAKDOWN BY TYPE OF ISSUER
Report on Operations 2011
24
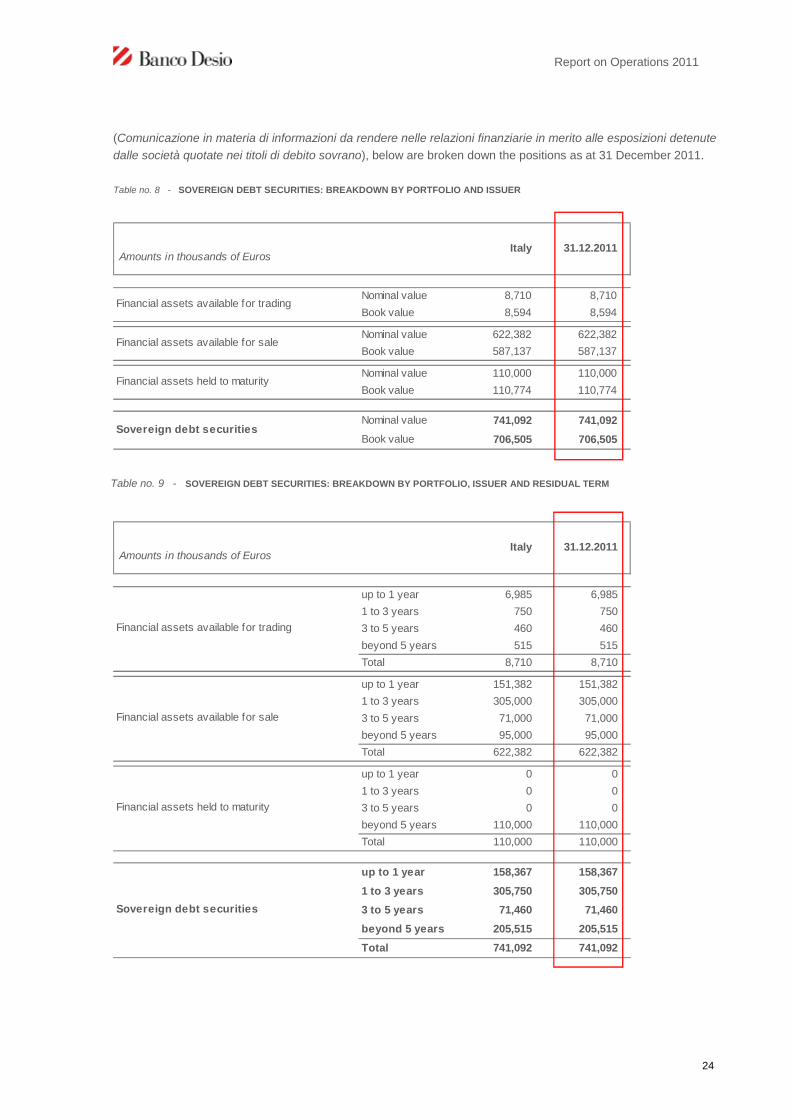
(Comunicazione in materia di informazioni da rendere nelle relazioni finanziarie in merito alle esposizioni detenute
dalle società quotate nei titoli di debito sovrano), below are broken down the positions as at 31 December 2011.
Amounts in thousands of EurosItaly 31.12.2011
Nominal value 8,710 8,710
Book value 8,594 8,594
Nominal value 622,382 622,382
Book value 587,137 587,137
Nominal value 110,000 110,000
Book value 110,774 110,774
Nominal value 741,092 741,092
Book value 706,505 706,505Sovereign debt securities
Financial assets available for trading
Financial assets available for sale
Financial assets held to maturity
Amounts in thousands of EurosItaly 31.12.2011
up to 1 year 6,985 6,985
1 to 3 years 750 750
3 to 5 years 460 460
beyond 5 years 515 515
Total 8,710 8,710
up to 1 year 151,382 151,382
1 to 3 years 305,000 305,000
3 to 5 years 71,000 71,000
beyond 5 years 95,000 95,000
Total 622,382 622,382
up to 1 year 0 0
1 to 3 years 0 0
3 to 5 years 0 0
beyond 5 years 110,000 110,000
Total 110,000 110,000
up to 1 year 158,367 158,367
1 to 3 years 305,750 305,750
3 to 5 years 71,460 71,460
beyond 5 years 205,515 205,515
Total 741,092 741,092
Financial assets available for trading
Financial assets available for sale
Financial assets held to maturity
Sovereign debt securities
Table no. 8 - SOVEREIGN DEBT SECURITIES: BREAKDOWN BY PORTFOLIO AND ISSUER
Table no. 9 - SOVEREIGN DEBT SECURITIES: BREAKDOWN BY PORTFOLIO, ISSUER AND RESIDUAL TERM

Report on Operations 2011
25
The interbank position
The net interbank position at the end of the financial year was debited for about Euro 0.2 billion compared to the
position again debited of about Euro 0.1 billion in the previous year.
With reference to the treasury activity, 2011 was characterised by a balanced situation in terms of liquidity,
without particular tensions and, therefore, recourse was made to the open market transactions of the ECB only on
an occasional basis.
In order to maintain a liquidity buffer, the Bank participated in the LTRO transaction (Long-Term Refinancing
Operation) of the ECB on 22 December 2011 for Euro 200 million, using its own securities.
6.4 - SHAREHOLDERS’ EQUITY AND ECONOMIC STABILITY
Shareholders’ equity as at 31 December 2011, including the net profits of the period, amounted to a total of Euro
745.7 million with respect to Euro 747.7 million of the figure recorded for 2010.
Shareholders’ equity calculated in accordance with the supervisory regulations in force was equal to Euro 724.7
million, with respect to Euro 787.9 million of the 2010 (at individual level of the Bank and not aggregated). The
figure is made up of Tier 1 capital of Euro 672.7 million (compared to Euro 706.9 million at the end of 2010) with
Tier 2 capital of Euro 68.2 million (compared to Euro 94.5 million at the end of 2010) for valuation reserves, and
subordinated liabilities. The total of the items to be deducted amounted to Euro 60.2 million (of which Euro 16.2
million is to be deducted from the sum of Tier 1 and Tier 2) and these refer to equity investments in financial and
insurance bodies.
The Tier 1 capital ratio, representing the ratio of primary capital to risk-weighted assets was equal to 17% and in
fact coincides with the Tier 1 Core. The Tier 2 solvency ratio, representing the ratio between regulatory capital
and risk-weighted assets, was equal to 18.4%, according to the supervisory regulations in force. On 31 December
2010 these ratios were equal to 20% and 22.3% respectively (at individual level of the Bank and not aggregated).

Report on Operations 2011
26
6.5 - RECLASSIFIED INCOME STATEMENT
A reclassified Income Statement has been prepared (as compared with the Layout in the Financial Statements) in
order to provide a view of the Bank’s affairs that is more consistent with operational performance, and this is the
basis on which the following comments are made.
The following is a summary of the criteria adopted in the preparation of this statement:
- two accounting item totals were stated, defined as “Operating income” and “Operating costs”, the
algebraic balance of which constitutes the “Operating margin”;
- “Net profit/(loss) for the period” was divided into “Profits/(losses) after taxes from continuing operations”
and “Non-recurring profits/(losses) after taxes”;
- “Operating income” also includes the balance of item 190, “Other operating income and expenses”, also
net of tax recoveries for stamp duty on customers’ statements of account and securities deposit
accounts and substitute tax on medium- and long-term financing, in addition to the amortisation of
leasehold improvements, respectively reclassified as a reduction of item 150 (b), “Other administrative
expenses” and as an increase of item 180, “Net adjustments to the value of /write-backs to intangible
assets” in the “Operating costs” total;
- dividends on equity investments in subsidiaries were reclassified from item 70 “Dividends and other
similar income” to the item “Dividends from equity investments in subsidiaries”, which follows “Operating
margin”;
- the balance of item 100 (a), “Profit/(loss) on disposal/purchase of receivables” in “Operating income” was
reclassified in special item “Profit/(loss) on disposal/purchase of receivables” after “Operating margin”;
- provisions for clawback actions in debt litigation were reclassified from item 190, “Net provisions for risks
and charges”, to item 130 (a), “Net impairment losses on loans”, both items following “Operating margin”;
- provisions for extraordinary transactions are reclassified from item 160, “Net provisions for risks and
charges”, to item “Provisions for risks and charges on extraordinary transactions";
- the tax effect on non-recurring Profits/(losses) is reclassified from item 260, “Taxes for the period on
income from continuing operations” to the item “Taxes for the period on income from non-recurring
operations".
The 2011 financial year ended with a net profit for the period of Euro 43.2 million, as shown in the table below,
which states the reclassified Income Statement in comparison with the income statement of the previous year.

Report on Operations 2011
27
Captions 31.12.2011
aggregate
at 31.12.2010
Amounts in thousands of Euros Value %
10+20 Net interest income 178,757 162,936 15,821 9.7%
70 Dividend and similar income 1,362 3,748 -2,386 -63.7%
40+50 Net fees and commissions 105,314 109,887 -4,573 -4.2%
80+90+100
+110
Net profits/(losses) on trading activities, hedging activities and
disposal/purchase of receivables, financial assets/liabilities and
financial assets/liabilities at fair value through profit or loss5,213 8,201 -2,988 -36.4%
190 Other operating income and expenses 7,496 4,573 2,923 63.9%
Operating income 298,141 289,345 8,796 3.0%
150 a Personnel expenses -134,404 -133,181 -1,223 0.9%
150 b Other administrative expenses -54,430 -54,933 503 -0.9%
170+180 Net adjustments to tangible/intangible assets -9,128 -8,774 -353 4.0%
Operating costs -197,961 -196,888 -1,073 0.5%
Operating margin 100,180 92,457 7,723 8.4%
Net profits/(losses) on disposal/purchase of receivables -552 57 -609 -1068.9%
130 a Net impairment losses on loans -35,854 -37,775 1,921 -5.1%
130 d Net impairment losses on other f inancial transactions -3 -120 117 -97.1%
160 Net provisions for risks and charges -1,210 584 -1,794 -307.2%
Dividends on equity investments in subsidiaries 2,825 3,460 -634 -18.3%
Profits/(losses) before taxes from continuing
operations 65,385 58,663 6,722 11.5%
260 Taxes for the period on income from continuing operations -29,850 -24,634 -5,216 21.2%
Profits/(losses) after taxes from continuing operations 35,535 34,029 1,506 4.4%
210 Profits (losses) on equity investments 0 493 -493 -100.0%
Provisions for risks and charges on extraordinary transactions 7,700 14,717 -7,017 -47.7%
Non-recurring Profit (Loss) before taxes 7,700 15,210 -7,510 -49.4%
Taxes for the period on income from non-recurring items 0 -7 7 -100.0%
Non-recurring Profit(Loss) after taxes 7,700 15,203 -7,503 -49.4%
290 Net profit/(loss) for the period 43,235 49,232 -5,997 -12.2%
Change
In order to make it easier to compare the reclassified Income Statement with the items as shown in the Financial
Statements layout, a reconciliation statement is given for each year, showing the figures corresponding to the
total in the layouts and the reclassification balances.
Table no. 10 - RECLASSIFIED INCOME STATEMENT

Report on Operations 2011
28
Captions
Financial
Statements
Reclassified
Statements
Amounts in thousands of Euros 31.12.2011Tax
recoveries
Dividends from
subsidiaries
Amortisation of
leasehold
improvements
Net profits/(losses) on
disposal/purchase of
receivables
Uses /
provisions
for risks
and
charges
Taxes on
income31.12.2011
10+20 Net interest income 178,757 178,757
70 Dividend and similar income 4,187 -2,825 1,362
40+50 Net fees and commissions 105,314 105,314
80+90+100+
110
Net profits/(losses) on trading activities, hedging
activities and disposal/purchase of receivables,
f inancial assets/liabilities and financial assets/liabilities
at fair value through prof it or loss 4,661 552 5,213
190 Other operating income and expenses 16,358 -11,468 2,606 7,496
Operating income 309,277 -11,468 -2,825 2,606 552 0 0 298,141
150 a Personnel expenses -134,404 -134,404
150 b Other administrative expenses -65,898 11,468 -54,430
170+180 Net adjustments to tangible/intangible assets -6,522 -2,606 -9,128
Operating costs -206,823 11,468 -2,606 0 0 -197,961
Operating margin 102,453 0 -2,825 0 552 0 0 100,180
Net profits/(losses) on disposal/purchase of receivables -552 -552
130 a Net impairment losses on loans -35,265 -589 -35,854
130 d Net impairment losses on other financial transactions -3 -3
160 Net provisions for risks and charges 5,900 -7,111 -1,210
Dividends on equity investments in subsidiaries 2,825 2,825
Profits/(losses) before taxes from continuing
operations 73,085 0 0 0 0 -7,700 0 65,385
260
Taxes for the period on income from continuing
operations -29,850 -29,850
Profits/(losses) after taxes from continuing
operations 43,235 0 0 0 0 -7,700 0 35,535
Provisions for risks and charges on extraordinary
transactions 7,700 7,700
Non-recurring profit (loss) before taxes 0 0 0 0 0 7,700 0 7,700
Taxes for the period on income from non-recurring
items 0
Non-recurring profit (loss) after taxes 0 0 0 0 0 7,700 0 7,700
290 Net profit/(loss) for the period 43,235 0 0 0 0 0 0 43,235
Reclassifications
Table no. 11 - RECONCILIATION BETWEEN FINANCIAL STATEMENTS AND RECLASSIFIED INCOME STATEMENT AS AT
31.12.2011
Report on Operations 2011
29
Captions
Financial
Statements
Reclassified
Statements
Amounts in thousands of Eurosaggregate at
31.12.2010
Tax
recoveries
Dividends from
subsidiaries
Amortisation of
leasehold
improvements
Net prof its/(losses)
on
disposal/purchase
of receivables
Uses /
provisions for
risks and
charges
Taxes on
income
aggregate at
31.12.2010
10+20 Net interest income 162,936 162,936
70 Dividend and similar income 7,208 -3,460 3,748
40+50 Net fees and commissions 109,887 109,887
80+90+100+
110
Net profits/(losses) on trading activities, hedging
activities and disposal/purchase of receivables,
financial assets/liabilities and financial assets/liabilities
at fair value through profit or loss 8,258 -57 8,201
190 Other operating income and expenses 12,883 -10,432 2,122 4,573
Operating income 301,172 -10,432 -3,460 2,122 -57 0 0 289,345
150 a Personnel expenses -133,181 -133,181
150 b Other administrative expenses -65,365 10,432 -54,933
170+180 Net adjustments to tangible/intangible assets -6,652 -2,122 -8,774
Operating costs -205,198 10,432 -2,122 0 0 -196,888
Operating margin 95,974 0 -3,460 0 -57 0 0 92,457
Net profits/(losses) on disposal/purchase of receivables 57 57
130 a Net impairment losses on loans -38,127 352 -37,775
130 d Net impairment losses on other financial transactions -120 -120
160 Net provisions for risks and charges 15,653 -15,069 584
Dividends on equity investments in subsidiaries 3,460 3,460
Profits/(losses) before taxes from continuing
operations 73,380 0 0 0 0 -14,717 0 58,663
260
Taxes for the period on income from continuing
operations -24,641 7 -24,634
Profits/(losses) after taxes from continuing
operations 48,739 0 0 0 0 -14,717 7 34,029
210 Prof its (losses) on equity investments 493 493
Provisions for risks and charges on extraordinary
transactions 14,717 14,717
Non-recurring profit (loss) before taxes 493 0 0 0 0 14,717 0 15,210
Taxes for the period on income from non-recurring
items -7 -7
Non-recurring profit (loss) after taxes 493 0 0 0 0 14,717 -7 15,203
290 Net profit/(loss) for the period 49,232 0 0 0 0 0 0 49,232
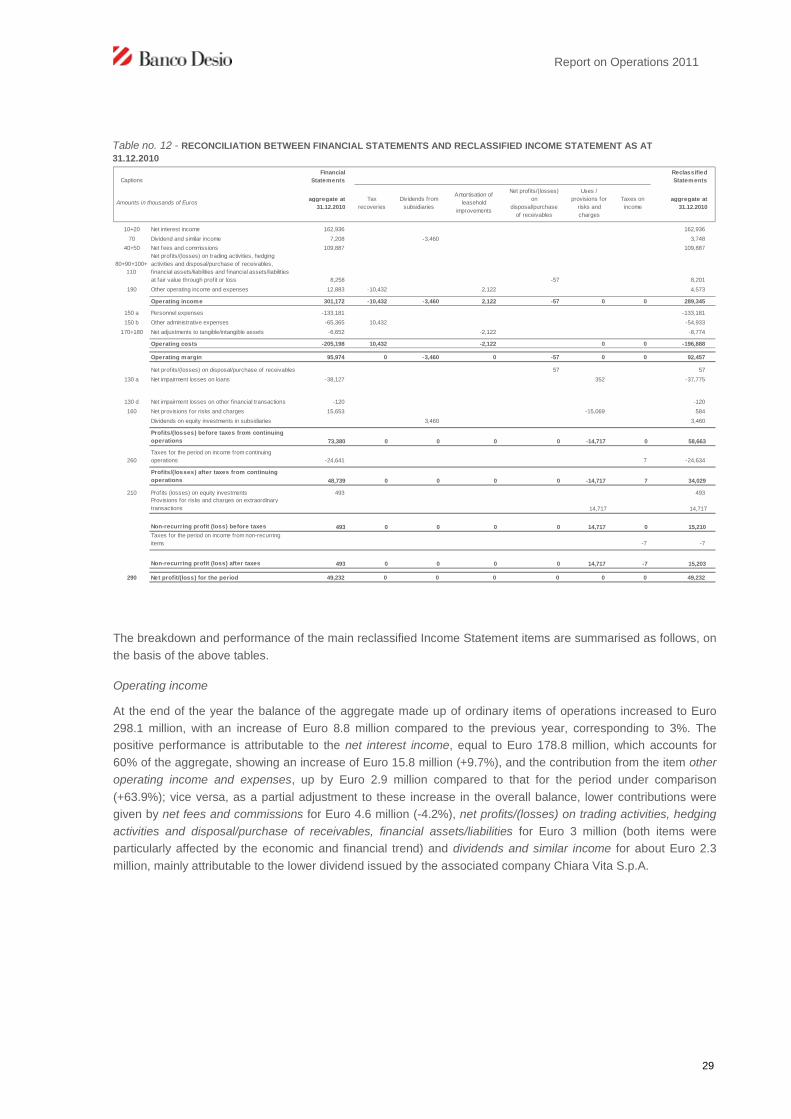
The breakdown and performance of the main reclassified Income Statement items are summarised as follows, on
the basis of the above tables.
Operating income
At the end of the year the balance of the aggregate made up of ordinary items of operations increased to Euro
298.1 million, with an increase of Euro 8.8 million compared to the previous year, corresponding to 3%. The
positive performance is attributable to the net interest income, equal to Euro 178.8 million, which accounts for
60% of the aggregate, showing an increase of Euro 15.8 million (+9.7%), and the contribution from the item other
operating income and expenses, up by Euro 2.9 million compared to that for the period under comparison
(+63.9%); vice versa, as a partial adjustment to these increase in the overall balance, lower contributions were
given by net fees and commissions for Euro 4.6 million (-4.2%), net profits/(losses) on trading activities, hedging
activities and disposal/purchase of receivables, financial assets/liabilities for Euro 3 million (both items were
particularly affected by the economic and financial trend) and dividends and similar income for about Euro 2.3
million, mainly attributable to the lower dividend issued by the associated company Chiara Vita S.p.A.
Table no. 12 - RECONCILIATION BETWEEN FINANCIAL STATEMENTS AND RECLASSIFIED INCOME STATEMENT AS AT
31.12.2010
Report on Operations 2011
30
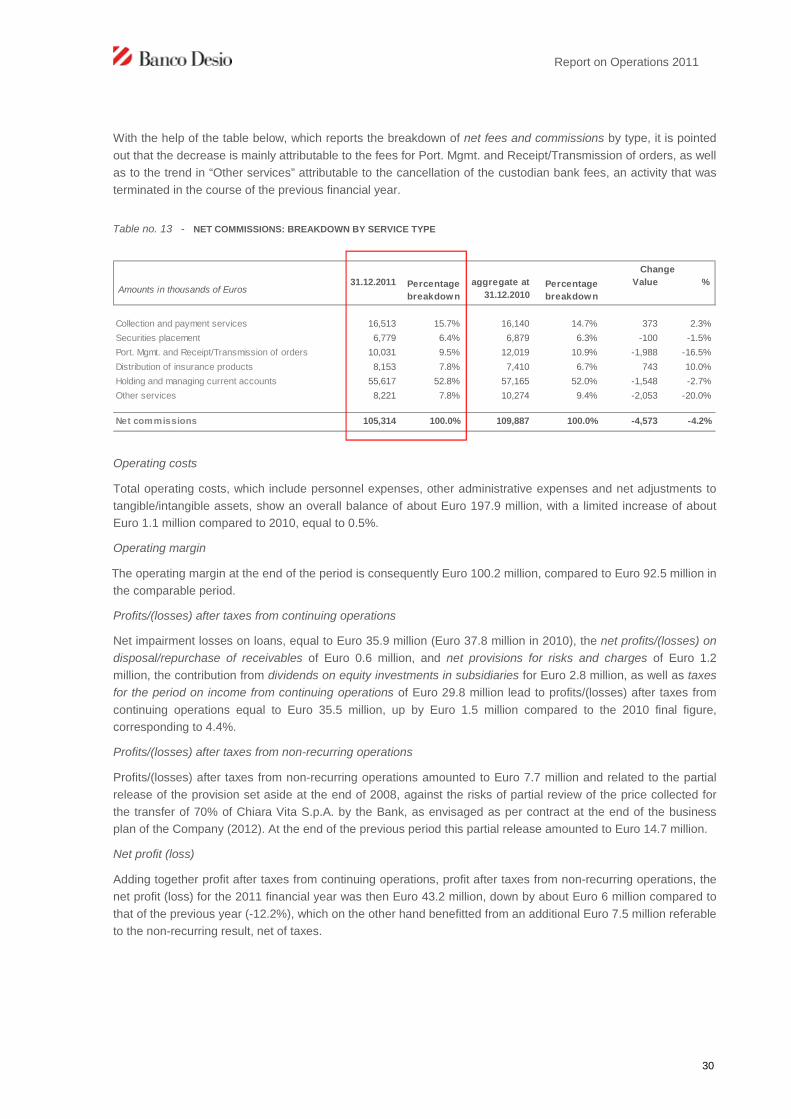
With the help of the table below, which reports the breakdown of net fees and commissions by type, it is pointed
out that the decrease is mainly attributable to the fees for Port. Mgmt. and Receipt/Transmission of orders, as well
as to the trend in “Other services” attributable to the cancellation of the custodian bank fees, an activity that was
terminated in the course of the previous financial year.
Amounts in thousands of Euros31.12.2011 Percentage
breakdown
aggregate at
31.12.2010Percentage
breakdown
Value %
Collection and payment services 16,513 15.7% 16,140 14.7% 373 2.3%
Securities placement 6,779 6.4% 6,879 6.3% -100 -1.5%
Port. Mgmt. and Receipt/Transmission of orders 10,031 9.5% 12,019 10.9% -1,988 -16.5%
Distribution of insurance products 8,153 7.8% 7,410 6.7% 743 10.0%
Holding and managing current accounts 55,617 52.8% 57,165 52.0% -1,548 -2.7%
Other services 8,221 7.8% 10,274 9.4% -2,053 -20.0%
Net commissions 105,314 100.0% 109,887 100.0% -4,573 -4.2%
Change
Operating costs
Total operating costs, which include personnel expenses, other administrative expenses and net adjustments to
tangible/intangible assets, show an overall balance of about Euro 197.9 million, with a limited increase of about
Euro 1.1 million compared to 2010, equal to 0.5%.
Operating margin
The operating margin at the end of the period is consequently Euro 100.2 million, compared to Euro 92.5 million in
the comparable period.
Profits/(losses) after taxes from continuing operations
Net impairment losses on loans, equal to Euro 35.9 million (Euro 37.8 million in 2010), the net profits/(losses) on
disposal/repurchase of receivables of Euro 0.6 million, and net provisions for risks and charges of Euro 1.2
million, the contribution from dividends on equity investments in subsidiaries for Euro 2.8 million, as well as taxes
for the period on income from continuing operations of Euro 29.8 million lead to profits/(losses) after taxes from
continuing operations equal to Euro 35.5 million, up by Euro 1.5 million compared to the 2010 final figure,
corresponding to 4.4%.
Profits/(losses) after taxes from non-recurring operations
Profits/(losses) after taxes from non-recurring operations amounted to Euro 7.7 million and related to the partial
release of the provision set aside at the end of 2008, against the risks of partial review of the price collected for
the transfer of 70% of Chiara Vita S.p.A. by the Bank, as envisaged as per contract at the end of the business
plan of the Company (2012). At the end of the previous period this partial release amounted to Euro 14.7 million.
Net profit (loss)
Adding together profit after taxes from continuing operations, profit after taxes from non-recurring operations, the
net profit (loss) for the 2011 financial year was then Euro 43.2 million, down by about Euro 6 million compared to
that of the previous year (-12.2%), which on the other hand benefitted from an additional Euro 7.5 million referable
to the non-recurring result, net of taxes.
Table no. 13 - NET COMMISSIONS: BREAKDOWN BY SERVICE TYPE

Report on Operations 2011
31
7 - SIGNIFICANT EVENTS AFTER THE REPORTING DATE
No significant events are reported which occurred after the reporting date.
8 - OTHER INFORMATION
8.1 - SHAREHOLDINGS HELD IN BANCO DESIO E DELLA BRIANZA S.P.A. BY DIRECTORS,
STATUTORY AUDITORS, THE GENERAL MANAGER AND DEPUTY GENERAL MANAGER
HOLDING OFFICE AT THE END OF THE PERIOD
Name and
surname
Office held in Banco Desio
e della Brianza S.p.A.
Ownership / Type
of ownership
Ordinary
shares at
31.12.2010
%
Savings
shares at
31.12.2010
%
Ordinary
shares
purchased
Savings
shares
purchased
Ordinary
shares sold
Savings
shares sold
Ordinary
shares at
31.12.2011
%
Savings
shares at
31.12.2011
%
Agostino Gavazzi Chairman Ow ned 78,244 0.067 0 0.000 0 0 0 0 78,244 0.067 0 0.000
Bare property 5,500 0.005 0 0.000 0 0 0 0 5,500 0.005 0 0.000
Registered to spouse 2,900 0.002 0 0.000 0 0 0 0 2,900 0.002 0 0.000
Stefano Lado Deputy Chairman Ow ned 270,656 0.231 0 0.000 10,000 16,000 0 0 280,656 0.240 16,000 0.121
Registered to spouse 6,500 0.006 0 0.000 0 0 0 0 6,500 0.006 0 0.000
Nereo Dacci Managing Director 0 0.000 0 0.000 0 0 0 0 0 0.000 0 0.000
Francesco Cesarini Director (until 28.04.2011) 0 0.000 0 0.000 0 0 0 0 0 0.000 0 0.000
Pier Antonio Cutellè Director 0 0.000 0 0.000 0 0 0 0 0 0.000 0 0.000
Egidio Gavazzi Director Ow ned 54,758 0.047 0 0.000 0 0 19,758 0 35,000 0.030 0 0.000
Luigi Gavazzi Director Ow ned 84,340 0.072 0 0.000 0 0 0 0 84,340 0.072 0 0.000
Bare property 5,500 0.005 0 0.000 0 0 0 0 5,500 0.005 0 0.000
Paolo Gavazzi Director Ow ned 798,453 0.682 15,004 0.114 0 0 0 0 798,453 0.682 15,004 0.114
Luigi Guatri Director 0 0.000 0 0.000 0 0 0 0 0 0.000 0 0.000
Gerolamo Pellicano' Director 0 0.000 0 0.000 0 0 0 0 0 0.000 0 0.000
Guido Pozzoli Director Ow ned 37,000 0.032 0 0.000 0 0 0 0 37,000 0.032 0 0.000
Registered to spouse 12,500 0.011 0 0.000 0 0 0 0 12,500 0.011 0 0.000
Usufruct 50,000 0.043 3,000 0.023 0 0 0 0 50,000 0.043 3,000 0.023
Lorenzo Rigodanza Director (from 28.04.2011) 0 0.000 0 0.000 0 0 0 0 0 0.000 0 0.000
Eugenio Mascheroni
Chairman of the Board of
Statutory Auditors 0 0.000 0 0.000 0 0 0 0 0 0.000 0 0.000
Rodolfo Anghileri Statutory Auditor 0 0.000 0 0.000 0 20,000 0 0 0 0.000 20,000 0.151
Marco Piazza Statutory Auditor 0 0.000 0 0.000 0 0 0 0 0 0.000 0 0.000
Claudio Broggi General Manager 0 0.000 0 0.000 0 0 0 0 0 0.000 0 0.000
Giovanni Cucchiani Alternate Stat. Aud. Ow ned 14,240 0.012 1,000 0.008 0 0 0 0 14,240 0.012 1,000 0.008
Registered to spouse 3,200 0.003 0 0.000 0 0 0 0 3,200 0.003 0 0.000
Clemente Domenici Alternate Stat. Aud. Ow ned 1,000 0.001 0 0.000 0 0 0 0 1,000 0.001 0 0.000
Carlo Mascheroni Alternate Stat. Aud. 0 0.000 0 0.000 0 0 0 0 0 0.000 0 0.000
Marco Sala Deputy General Manager 0 0.000 0 0.000 0 0 0 0 0 0.000 0 0.000
8.2 - SHAREHOLDINGS HELD IN SUBSIDIARIES BY DIRECTORS, STATUTORY AUDITORS, THE
GENERAL MANAGER AND DEPUTY GENERAL MANAGER HOLDING OFFICE AT THE END
OF THE PERIOD
At 31 December 2011 there was no record of any shareholdings in subsidiaries owned by directors, statutory
auditors, the General Manager and Deputy General Manager holding office at the end of the period, nor were any
such shareholdings involved in movements during the period.

Report on Operations 2011
32
8.3 - TREASURY SHARES
As at 31 December 2011, as well as at 31 December 2010, the Bank did not hold any treasury shares nor any
shares in the parent company Brianza Unione di Luigi Gavazzi & C. S.a.p.A. and no movements were registered
during the year.
8.4 - RELATIONS BETWEEN BANCO DI DESIO E DELLA BRIANZA S.P.A. AND ITS
CONTROLLING COMPANY, ITS SUBSIDIARIES AND COMPANIES SUBJECT TO
SIGNIFICANT INFLUENCE
With reference to the financial year end date, the following is a summary of the balance sheet and income
statement values underlying the relations between the Bank and the parent company, the subsidiary companies
and those subject to significant influence, divided by counterparty and by nature.
Amounts in thousands of EurosAssets Liabilities Guarantees /
Commitment
s
Revenues Charges
Controlling company
Brianza Unione di Luigi Gavazzi & C. S.a.p.A. 0 542 0 8 34
Subsidiaries
Banco Desio Lazio S.p.A. 13,863 113,598 12,469 3,744 1,493
Brianfid-Lux S.A. 26 20 0 105 0
Credito Privato Commerciale S.A. 4 23,449 0 265 1,351
Rovere Societé de Gestion S.A. 481 0 0 2,166 0
FIDES S.p.A. 187,657 653 0 5,169 6
Chiara Assicurazioni S.p.A. 357 1,485 2 2,918 214
Companies subject to significant influence
Chiara Vita S.p.A. 0 0 0 814 868
Istif id S.p.A. 13 1,057 0 5 177
Relations by company 202,401 140,804 12,471 15,194 4,143
Breakdown of relations by type
Finance 201,095 140,777 5,306 8,862 3,975
Business 574 27 7,165 5,146 10
Assets Rental / Management 11 0 0 441 0
Supply of services 695 0 0 640 158
Other 26 0 0 105 0
Relations by type 202,401 140,804 12,471 15,194 4,143
Table no. 14 RELATIONS BETWEEN CONTROLLING COMPANY, SUBSIDIARIES OR COMPANIES SUBJECT TO SIGNIFICANT
INFLUENCE AS OF 31.12.2011

Report on Operations 2011
33
It should be noted that the relations evidenced in this table were adjusted, whenever it has been possible to make
a comparison, by applying the average terms and rates indicated by the market.
Pursuant to article 37, paragraph 2 of the Consob Regulations on Markets (Resolution no. 16191 dated 29
October 2007), we specifically declare that Brianza Unione di Luigi Gavazzi & C. S.a.p.A., parent company of the
Bank, in accordance with the express provisions of its Articles of Associations, does not exercise any
management and coordination activity on the Bank, nor on any of its subsidiaries, whether on the basis of banking
laws or provisions of the Civil Code. For more details on the structure of the Group for the purposes of
management and coordination activities, reference should be made to paragraph 2.3 of the Annual Report on
Corporate Governance made available, pursuant to article 123-bis of the Consolidated Law on Finance, on the
Group’s website at the same time as this Report.
8.5 -RATING
On 29 November 2011, the international agency Fitch Ratings, as a result of the downgrading of the growth
prospects of the Italian economy and the complex economic and financial conditions in which the banks will
operate, changed the ratings assigned to the Bank as follows:
- long-term rating from “A” (with ‘stable’ outlook) to “A-” (with ‘negative’ outlook);
- short-term rating from “F1” to “F2”;
- viability rating from “a” to “a-”,
- senior debt notes rating from “A” to “A-”.
However, all the other ratings assigned previously were confirmed.
Fitch Ratings considers the Bank to be in a better position than medium-sized banks to manage the impact of the
economic decline, thanks to its prudent management of the credit risk and the solidity of its assets. Furthermore,
the bank is less exposed to market sentiments as it relies on direct deposits from clients for its funding and not on
the wholesale market. The bank’s rating also reflects its solid capitalisation. The negative outlook is solely linked
to the possibility of a further intensification of the financial crisis in the Eurozone and the potential impact that it
could have on the profitability margins of the banking system.
8.6 -CODE FOR THE PROTECTION OF PERSONAL DATA (Legislative Decree no. 196 of 30 June
2003)
The obligation to adopt the Security Policy Statement (Documento Programmatico della Sicurezza) was abolished
by Decree Law no. 5 of 9.02.2012 “Urgent measures for simplification and development”; however, the obligations
laid down with regard to minimum security measures remain fully applicable and the data controller must
therefore continue to fulfil all the relevant requirements on the subject.
In spite of the fact that the abovementioned decree allows specific relevant requirements to be postponed, and
pending further instructions from the Authority, we highlight that the annual update of the Security Policy
Statement was carried out nonetheless, in accordance with the provisions, in place at the time, of Article 34
paragraph g) of Legislative Decree no. 196 of 30 June 2003 – Code for the Protection of Personal Data. This
Document sets out a description of aspects laid down by the Code pursuant to Rule 19 of the Technical
Regulations – Annex B to the Code itself.
8.7 - LEGISLATIVE DECREE 231/2001
In the framework of measures taken as regards the issue of administrative liability, in 2004 the Bank’s Board of
Directors resolved to adopt an Organisational Model to prevent the commission of the offences contemplated in
Legislative Decree 231/2001.

Report on Operations 2011
34
In accordance with the Bankitalia Order concerning organisations and internal controls relating to money
laundering, on 1 September 2011 the Compliance Office established the Group’s Anti-Money Laundering
Function and the Compliance office was duly empowered for the delivery of the SOSs (Segnalazioni di Operazioni
Sospette, Reports on Suspect Transactions) on the part of the Bank and of the subsidiaries Banco Desio Lazio
S.p.A. and FIDES S.p.A.
For a summary description of the Model 231 adopted, reference should be made to paragraphs 1 and 7 of the
Annual Report on Corporate Governance made available, pursuant to article 123-bis of the Consolidated Law on
Finance, on the Group’s website at the same time as this Report
8.8 - TRANSACTIONS WITH RELATED PARTIES
For a more detailed description of the procedures governing transactions with Related Parties, we would refer to
paragraph 5 of the Annual Report on Corporate Governance, made available, pursuant to article 123-bis of the
Consolidated Law on Finance, on the website of the Group at the same time as this Report.
The transactions with related parties approved by the Board of Directors in 2011 are detailed in Part H of the
Notes to the Financial Statements.
8.9 - INFORMATION ON STOCK OPTION PLANS
The Plans in existence at the end of the financial period are those started during 2006, regarding shares of
subsidiary Chiara Assicurazioni S.p.A. (shares to be issued in the future against capital increases resolved as per
Article 2443 of the Civil Code) and the Plan started during 2008, regarding shares of indirect subsidiary FIDES
S.p.A. (these are already in Banco Desio Lazio S.p.A.’s possession). Part I of the Notes to the Group’s
consolidated financial statements should be referred to for information regarding these Plans.
8.10- THE ANNUAL REPORT ON THE ADOPTION OF THE CODE OF CONDUCT FOR LISTED
COMPANIES
The information on the adoption of the Code of Conduct for listed companies is reported in the Annual Report on
Corporate Governance required by article 123-bis of the Consolidated Law on Finance, made available on the
Group’s website at the same time as this Report, to which reference is made.
8.11 - RESEARCH AND DEVELOPMENT ACTIVITIES
Within its function as parent company, as described in paragraph 5.1 “Levels of control in the function of direction
and co-ordination” above, the Bank places itself in a development context aimed at supporting and coordinating
the companies belonging to the Group, as well as at the research into/ investment in operating solutions
specifically aimed at the continuous improvement of the Group’s relations with its own customers.
Of the activities carried out during 2011, we highlight that the internal activities were completed in connection to
the provisions of the Regulations regarding the treatment of loans to consumers. In this context, all the
safeguards provided for by the Regulations on Transparency with regard to transactions entered into with private
consumers were effectively regulated and put in place. In terms of Credit Risk Mitigation, monitoring activities are
periodically planned in order to continue to meet both the general and specific eligibility criteria laid down by the
Supervisory Measures.
Report on Operations 2011
35
9 -BUSINESS OUTLOOK AND MAIN RISKS AND UNCERTAINTIES
The rationalisation of the banking network in relation to the vocation of retail bank, the contribution from the
commercial development of integrated services for customers and the growth in size of distribution capabilities,
together with a particular attention to the provision of credit and a constant control of operating costs, are the main
elements for the substantial achievement of the financial and economic objectives for the year in progress, which
are set in advance by the two-year Strategic Plan. The hope, however obvious, is for a gradual improvement in
the macroeconomic context and, as a consequence, the possibility to operate in less critical market conditions
than the current ones and those of the recent past.
With reference to the main risks and uncertainties, it should be noted that this Report and, more generally, the
Financial Statements as at 31 December 2011 were drawn up on a going concern basis, due to there being no
reasons to consider anything otherwise to be likely in the foreseeable future. The equity and financial structure, as
well as the operating business performance, constitute absolute confirmations to this end.
The chapter about the relevant macroeconomic scenario contains a description of the performance of the global
economy and the financial markets from which the related risks can be inferred, whereas the controls on the
company’s operations of the various types of risk are shown in details in Part E of the Notes to the Financial
Statements – Information on Risks and the Related Hedging Policies”.
Moreover, explanatory notes about the levels of control in the management and coordination function, as well as
about internal controls, are reported in the elated paragraphs of this Report, making reference, for detailed
information, to the Annual report on Corporate Governance made available, pursuant to article 123-bis of the
Consolidated Law on Finance, on the Group’s website at the same time as this Report.

Report on Operations 2011
36
10 - PROPOSAL FOR THE APPROVAL OF THE FINANCIAL STATEMENTS AND THE
ALLOCATION OF NET PROFIT
Dear Shareholders,
We hereby submit for your approval the Financial Statements for the year ended on 31 December 2011, which
close with a net Profit of Euro 43,225,277.90, as shown in the Income Statement.
Pursuant to article 31 of the articles of association, the following allocation of the net profit is hereby proposed:
- 10% to be allocated to the legal reserve Euro 4,323,528.00
- 10% to be allocated to the statutory reserve Euro 4,323,528.00
- to shareholders:
Euro 0.10500 for each of the 117,000,000 ordinary shares Euro 12,285,000.00
Euro 0.12600 for each of the 13,202,000 savings shares Euro 1,663,452.00
- additional allocation to the statutory reserve Euro 20,639,769.90
Total Net Profit Euro 43,235,277.90
Desio, 20 March 2012 The Board of Directors

1
BANCO DI DESIO E DELLA BRIANZA S.p.A.
Registered office: Via Rovagnati,1 – 20832 Desio (MB)Fiscal Code no. 01181770155
Registered in the Monza and Brianza Register of CompaniesShare Capital: Euro 67,705,040.00 fully paid-upMember of the Interbank Deposit Protection Fund
(Fondo Interbancario di Tutela dei Depositi)and the National Guarantee Fund(Fondo Nazionale di Garanzia)
Registered in the Register of Banks (Albo delle Banche) under ABI code no. 3440/5Parent Company of the Banco di Desio e della Brianza Banking Group
Registered in the Register of Banking Groups (Albo dei Gruppi Bancari) under no. 3440/5
---------------------------------------
REPORT OF THE BOARD OF STATUTORY AUDITORS TO THE SHAREHOLDERS’
MEETING OF BANCO DI DESIO E DELLA BRIANZA S.P.A.
(ARTICLE 153 OF LEGISLATIVE DECREE NO. 58 OF 24 FEBRUARY 1998 AND
ARTICLE 2429, PARAGRAPH 3, OF THE ITALIAN CIVIL CODE)
FOR THE FINANCIAL YEAR ENDED 31/12/2011
Dear Shareholders,
In accordance with article 153 of Legislative Decree no. 58 of 24 February 1998 (hereinafter also
referred to as the “T.U.F.”, Testo Unico della Finanza, Consolidated Act on Finance) and article
2429 of the Italian Civil Code, we hereby submit to you the following Report in order to inform you
of the supervisory and control activity carried out during the 2011 financial year, which closed with
the Financial Statements at 31 December 2011 that are submitted to you together with the Report on
Operations and the information documents that adequately illustrate the performance of the Bank
and of its Subsidiaries, as well as the economic and financial data and the results achieved.
As regards the audit of the accounts and of the Financial Statements, it should be noted that the task
was carried out by PricewaterhouseCoopers S.p.A. (P.W.C.).

2
On 4 April 2012 the Independent Auditors issued their favourable opinion on the Financial
Statements at 31 December 2011, without making any remarks, objections or disclosures.
The Financial Statements relating to the financial year ended 31 December 2011 were prepared in
accordance with the International Financial Reporting Standards (IFRS) and the International
Accounting Standards (IAS), in compliance with the general principles for the preparation of
financial statements reported in the notes to the financial statements; specifically, the formats in the
financial statements and the notes to the financial statements were prepared and drawn up in
compliance with the compilation rules published by the Bank of Italy in its Circular Letter no. 262
of 22 December 2005, as updated.
The Report on Operations adequately comments on and illustrates the performance of the financial
year and provides indications on the outlook for operations. The Report itself complies, inter alia,
with the information requirements laid down in article 123-bis of the T.U.F. governing ownership
structures, with a relevant reference to the related available annual Report on Corporate
Governance, which was also approved by the Board of Directors on 20 March 2012.
We hereby confirm to you that during the financial year we carried out our supervisory activity in
accordance with the law.
In performing our supervisory and control activity, we had meetings with the Top Management, the
Internal control functions (Compliance, Risk Management, Manager responsible for preparing the
Company’s reports and Internal Audit), the Independent Auditors, the Managers responsible for
different services provided by the Company and the Internal Control Committee, the Committee for
Related-Party Transactions and the Appointment and Remuneration Committee, which allowed us
to gather, in the different sectors, any information about the organization, the internal control

3
system and the administrative and accounting system that was useful and necessary in order to
assess their suitability for corporate requirements, as well as their operational reliability.
We had meetings and carried out checks on general and specific issues which are subject to
supervision and control and checks at secondary offices.
We have been able to establish, by participating in all meetings of the Board of Directors and of the
Executive Committee, that the delegated bodies have reported to the Board of Directors and to the
Board of Statutory Auditors in relation to transactions carried out by virtue of the powers conferred,
the general performance of operations and the outlook for operations.
By participating in the meetings of the Board of Directors and of the Executive Committee and by
examining the minutes of the meetings themselves, we obtained adequate information on the
activity carried out and on the most significant transactions in economic, financial and equity terms
effected by the Company. As regards these transactions, we are able to affirm, also on the basis of
the information gathered, that they were performed in accordance with the law and the by-laws and
always in the interests of the Company, and that they did not appear to be manifestly imprudent or
reckless, to cause a conflict of interests, to be in conflict with the resolutions passed by the
Shareholders’ Meeting and by the Board or in any case to be such as to compromise the integrity of
the corporate assets.
Contact with the Manager responsible for preparing the Company’s reports allowed checks to be
carried out as to compliance with procedures for controlling the administrative and accounting
system, which was proven to be adequate and effective, as well as the pricing Policy for the
valuation of financial instruments.
The substantial and continuous connection with the Internal Audit Department, which we hereby
thank for the cooperation afforded to us, allowed us to follow any supervisory activity carried out

4
within the Group.
The meetings held with the Risk Management Office and the Compliance Office, allowed the Board
to receive a constant flow of information on the risk management system.
Having regard to the procedures by which the Board has carried out its institutional activity, it
hereby notifies and acknowledges that:
• it participated in 2 General Shareholders’ Meetings and 1 Special Shareholders’ Meeting for
holders of savings shares, 15 Board of Directors’ meetings and 4 Executive Committee
meetings, which were held during the financial year and that it received from the Directors
and the Top Management timely and suitable information on the activity carried out;
• it carried out 35 individual and collective checks at the registered office and 8 checks at
secondary offices to verify the adequate application of any operating and control systems;
• it participated, through the Chairman or a delegated Statutory Auditor, in the meetings of the
Internal Control Committee as well as in those of the Appointment and Remuneration
Committee and the Committee for Related Party Transactions;
• it gathered the knowledge necessary to carry out control activities, for the aspects under its
responsibility, over the degree of adequacy of the organisational structure of the Company,
also as regards connections with the Subsidiaries, through direct investigations, by gathering
information from the managers responsible for the Functions involved and through the
exchange of data and information with the Independent Auditors;
• it supervised the application of money laundering rules and compliance with the instructions
issued by the Bank of Italy and Consob (Italian Securities and Exchange Commission);
• it supervised the operation of the internal control and the administrative and accounting
systems in order to assess their suitability for the management requirements, as well as the

5
reliability of the latter in representing management events, through direct investigations on
corporate documents, the attainment of information from the managers responsible for the
respective Functions and the analysis of the results of the work carried out by the
Independent Auditors.
• it supervised the controls carried out by the Parent Company over the Subsidiaries, both
through the presence of members of the Board of Statutory Auditors of the Parent Company
on the Boards of Statutory Auditors of the investee companies, in compliance with Consob
notice DAC/RM/97001574 of 20 February 1997, as updated, and through collective
meetings between the Board of Statutory Auditors of the Parent Company and the various
Boards of Statutory Auditors of the Subsidiaries.
Therefore, the Board of Statutory Auditors can confirm the adequacy of:
the Governance System and of the correlated Internal Control System, the basic principles of
which are outlined in the aforesaid Annual Report on Corporate Governance pursuant to
article 123-bis of the T.U.F.;
the Internal Process of Capital Adequacy (Processo Interno di Adeguatezza Patrimoniale,
ICAAP), the preparation and updating of which are being checked in compliance with the
specific Supervision provisions;
the organisational and control checks in line with the provisions of law and the Supervision
regulations governing Money Laundering;
the control activities carried out by the responsible functions and, specifically, by the
Manager responsible for preparing the Company’s reports, the Compliance Department, the
Risk Management Department and the Internal Audit Department, also through a periodic
evaluation of institutional reports;

6
the procedures for managing complaints received from the Group’s Customers, also with
reference to those relating to investment services;
the activities carried out in relation to the Privacy Code (Law no. 193/2006), acknowledging
the Security Policy Statement (Documento Programmatico sulla Sicurezza) which was
brought to the attention of the Board of Directors.
In relation to Safety at Work, the Board acknowledges that a number of checks exist in relation
to the rules reviewed by Legislative Decree no. 81/2008.
In reporting to you, in more detail, the supervisory activity carried out, we are complying with the
Consob provisions under DEM/1025564 notice of 6 April 2001, as supplemented.
Specifically, the Board has examined the significant events that occurred during the financial year
and the main ones are described below:
- Merger of Banco Desio Toscana S.p.A. and Banco Desio Veneto S.p.A.
With effect from 1 October 2011 the Parent Company, which owned 100% of the Capital, merged
the subsidiaries Banco Desio Toscana SpA and Banco Desio Veneto SpA into it, as part of a plan to
simplify the organisation of the Group. The Board examined the various aspects (legal, IT and
administrative) of the merger transactions but made no remarks on them.
- Local development
During the 2011 financial year, nine new Branches were opened: (4 in Lombardy, 3 in Emilia
Romagna, 1 in Piedmont and 1 in Tuscany). Therefore, the distribution network of the Bank
included 164 Branches at 31 December 2011, taking into account the merger of the two subsidiary
banks operating in Tuscany and Veneto.
- Rovere SICAV

7
With reference to the equity investments previously held by Banco Desio Toscana S.p.A. and Banco
Desio Veneto S.p.A. in the subsidiary Rovere Société de Gestion SA, a stake of 10% each, and
which have therefore been transferred to the Bank as a result of the merger, it is noted that the Bank
immediately transferred these equity investments to the subsidiary Brianfid-Lux SA, which thus
increased its interest in the company to 70%.
- Administrative liability of legal persons pursuant to Legislative Decree no. 231/2001
In relation to the Public Prosecutor’s Office of Rome’s request for the committal to trial of the two
subsidiary companies Banco Desio Lazio S.p.A. and Credito Privato Commerciale S.p.A., as
described in detail in the Report on Operations, the Board of Statutory Auditors examined the
results of the in-depth analysis of all of the preliminary investigation documents and expressed its
opinions, also during the meetings of the Board, which adopted measures with regard to the issue.
In this context, the Board of Statutory Auditors carefully supervised the consolidation measures
adopted by Group companies in order to adopt Organisational Models pursuant to Legislative
Decree no. 231/2001 in compliance with the reference regulations and in line with best practice.
- Payment by shareholders on account of capital in favour of the subsidiary Banco Desio
Lazio S.p.A.
With a view to strengthening its capital structure, the Bank made a payment on account of capital to
the Subsidiary Banco Desio Lazio S.p.A. to the value of € 10,000,000.
Banco Desio Lazio S.p.A., in turn, made a payment on account of capital to Fides to the value of €
5,000,000.
With a view to strengthening the capital structure of the subsidiary Chiara Vita S.p.A., on 20 April
2011 the Bank made a shareholder payment on account of capital of Euro 2.7 million.

8
- Corporate Governance
During 2011 there were no particularly significant changes to report in the Corporate Governance
organisation of the Group. Any further information regarding this organisation is reported in the
aforementioned Annual Report on Corporate Governance.
- Capital increase to serve a Stock Grant plan for the 2011-2013 three-year period
On 29 November 2011 the Extraordinary Shareholders’ Meeting resolved a capital increase, free of
charge, pursuant to article 2349 of the Italian Civil Code, divisible into ‘tranches’, with a maximum
nominal amount of Euro 520,000 (corresponding to a maximum of 1,000,000 ordinary shares with a
nominal value of Euro 0.52 each) to serve the Stock Grant Plan for the Management of the Banco
Desio Group and to be issued by the Board of Directors in several ‘tranches’ according to the terms
and conditions envisaged by the Plan itself and using special profit reserves.
- Opening of inspections
The Bank of Italy launched an inspection in November 2011 (the conclusion of which is expected
soon) while the Milan Tax Police launched a tax inspection in December 2011.
To date, there is nothing to report whatsoever regarding this inspection as, apart from accessing and
gathering data, the investigation has not proceeded.
- Opinions issued by the Board of Statutory Auditors
The Board of Statutory Auditors has issued, when required, its opinion in reply to specific requests
received from the Supervisory Authorities, and submitted for the attention of the Boards.
In the Extraordinary Shareholders’ Meeting which, on 29 November 2011, resolved the
aforementioned share capital free of charge, to serve the abovementioned Stock Grant Plan, the

9
Board of Statutory Auditors also issued an opinion advising the setting up of a special profit reserve
for the limited purpose of serving capital increases.
- Selection of the Independent Auditors
The Board of Statutory Auditors has selected the Independent Auditors to be appointed by the
Shareholders’ Meeting. It has issued a separate justified proposal on this matter.
- Atypical and/or unusual, intragroup or related-party transactions
The Board of Statutory Auditors acknowledges that intragroup transactions and any other
transactions with related parties, in particular those defined by article 136 of the T.U.B. have been
always subject to specific analysis by the Board of Directors.
In compliance with Consob Regulation no. 17221/2010, the Bank has adopted and applied a
Procedure concerning transactions with related parties, which is aimed at ensuring transparency
and the material and procedural correctness of transactions with related parties carried out directly
or through subsidiaries pursuant to article 2391-bis of the Italian Civil Code; as regards procedures
for passing resolutions, this procedure is mainly characterised by the presence of a Committee for
Transactions with Related Parties.
This advisory body is composed of all 4 Independent Directors who hold office and is competent to
receive disclosures and/or issue opinions, which are also binding in some cases, on transactions
with related parties as outlined according to the quantitative and qualitative criteria laid down in the
Consob Regulation.
In addition to the operation of the Committee, the Internal Procedure also regulates a number of
cases of exemptions, either total or partial, in relation to a small amount or to an ordinary nature, as
10
well as in relation to the transaction counterparty (in the absence of any significant interests of any
other related party) being a member of the group.
The Board acknowledges that it has found that the operating procedures adopted in order to monitor
and identify any transaction of this kind are effective and consistent.
As for intragroup transactions, the Board has examined their lawfulness and reasonableness and is
able to certify that they are based on correct economic, financial and accounting principles.
The Report on Operations and the Notes to the Financial Statements provide adequate and
exhaustive information as to the transactions referred to above.
No atypical or unusual transactions were effected.
- Relationships with the Independent Auditors and any observations
We have had meetings and exchanges of information and knowledge relating to the supervisory and
control activities falling within the respective sphere of responsibility with the Independent
Auditors, which are responsible for auditing accounts and financial statements.
During these meetings, the Auditors declared that no irregularities or censurable facts which would
have been required to be reported to the Supervisory Bodies and Authorities emerged during the
checks carried out; they also reported on the correct drawing up of the financial statements
according to the rules which regulate the criteria for their preparation. As already said, the
Independent Auditors have issued their opinion which does not contain any remarks, objections or
disclosures.
- Notices pursuant to Article 2408 of the Italian Civil Code – Article 2409 of the Italian Civil
Code
No notice was received by the Board of Statutory Auditors pursuant to article 2408 of the Italian

11
Civil Code and no notices were given to the Court pursuant to article 2409 of the Italian Civil Code.
- Notices – petitions – complaints
For the sake of completeness of information, it should be noted that all complaints received by the
Company from customers (a total of 238, of which 30 related to investment services) during 2010
were duly examined by the Legal and Corporate Affairs Department which took steps to fulfil the
required formalities; 228 of these complaints (of which 10 related to investment services) were
rejected, while 10 (of which 0 related to investment services) were granted.
Furthermore, it should be noted that 9 requests for information were received from the Bank of Italy
against notices given by customers to the Supervisory Authority itself.
- Assignment of tasks to the Independent Auditors – Opinions required by law.
During 2011 the following “additional” tasks were entrusted to the Independent Auditors:
▪ an assignment concerning the issue of a certification on the relevant aggregates which are
decisive for the purposes of calculating the contribution to be paid out to the National
Guarantee Fund for total fees quantified at € 2,500.00, plus VAT;
▪ an assignment concerning the translation into English of the complete dossier of the 2010
Annual Accounts and Consolidated Financial Statements and of the 2011 quarterly and half-
year report for total fees quantified at € 28,900 plus VAT.
- Compliance with the Principles of correct administration, adequacy of the administrative
structure.
The Board of Statutory Auditors has acquired knowledge of and supervised the adequacy of the
administrative structure of the Company and its compliance with the principles of correct
administration.

12
The Board, as part of the checks carried out and its participation in the business of the Company,
with specific reference to meetings and checks with the Manager responsible for preparing the
Company’s financial/corporate reports, can attest that the administrative structure is suitable for
the business conducted by your Bank, and it can ensure that the material principles of correct
administration as laid down in the current legislation and related regulations are complied with.
The accounting and administrative system, which also uses outsourcing services for the IT
system, is reliable and adequate in order to correctly represent management events.
- Adequacy of the Internal Control System
During 2010 the Internal Control System was subject to further strengthening measures, both in the
application of the various supervision regulations and to provide the Group with a more efficient
control system.
The aforementioned “Annual Report on Corporate Governance” describes the Guidelines for the
Group’s Internal Control Systems, in accordance with the provisions laid down in the by-laws and
in the regulations.
All Group companies share – without prejudice to the operational peculiarities of each corporate
type – models for the measurement and management of risks defined by the Parent Company at
general level.
The assessment of the effectiveness of the internal control system is the responsibility of the
Internal Audit Department, within the functions attributed to it by virtue of the supervision and
corporate regulations, and its judgments are reported in detail to the company Bodies.
Within the respective purposes, and taking account of the provisions under Legislative Decree
39/2010 governing the auditing of accounts, the Board of Statutory Auditors and the Internal
Control System are responsible for assessing the efficacy and efficiency of any control services

13
adopted by virtue of the resolutions passed by the Board of Directors.
The Board of Statutory Auditors has maintained constant connection with and has received
adequate support in its tasks from the Internal Audit Department; also on the basis of the
examination of the reports produced by the aforesaid Department, the Board of Statutory Auditors
can affirm that the Company’s internal control functions are considered to be proportional and fair
with respect to the operations and related risks, as well as being carried out in a constant, adequate
and efficient manner.
- Instructions given to Subsidiaries (Article 114 of Legislative Decree no. 58/98)
Relations maintained by the Parent Company with its Subsidiaries have always been reported in the
meetings of the Boards of the Parent Company and the Board of Statutory Auditors has always
obtained exhaustive replies to its requests for more information. The direction, coordination and
control system implemented by the Bank in performing its functions of strategic leadership and
direction of the entire Group, also pursuant to article 61 of the T.U.B. and article 2497 of the Italian
Civil Code in consideration of the unitariness of the economic entity, is adequate and functional.
- Adequacy of the control systems applied to the foreign non-EU Subsidiary / Article 36 -
“Market Consob Regulation” in implementing the T.U.F.
The Board of Statutory Auditors acknowledges that, also on the basis of the auditing activities
carried out by the Independent Auditors , the Subsidiary C.P.C. – Credito Privato Commerciale
S.A., with registered office in Lugano (Switzerland), has an administrative and accounting system
suitable for allowing the Management and the Auditor of the controlling company to receive, in a
regular manner, the economic, equity and financial data necessary to prepare the consolidated
financial statements. The foregoing also mitigates the adequacy opinion that emerged from the

14
outcome of the checks carried out by the Manager responsible for preparing the Company’s report
and by the Internal Audit Department of Banco di Desio e della Brianza S.p.A..
- Privacy Code.
We acknowledge that the Directors, in compliance with the provisions under article 34, paragraph g,
of Legislative Decree no. 196/2003, reported, in the Report on Operations, on the annual update of
the Security Policy Statement within the time limits set out.
- Remuneration policies
The Board of Statutory Auditors has examined, without any observations, the Annual Report on the
Group’s Remuneration and Incentive Policies, which is now also drawn up pursuant to article 123-
ter of the T.U.F. [Testo Unico della Finanza, Consolidated Finance Act].
The Board of Statutory Auditors has checked the procedures which ensure that the remuneration
practices applied by the Bank comply with the regulatory framework, by also using the results of
the checks carried out, within the sphere of the respective responsibilities, by the Compliance and
Risk Management Functions and by the Internal Audit Department: in particular: the latter carried
out the annual check required by the Supervisory Measures issued by the Bank of Italy on the
subject.
- Self-Regulatory Code of Listed Companies.
The Board of Statutory Auditors points out that the Company has adopted the Self-Regulatory Code
of Listed Companies since 1999 (Board of Directors’ resolution of 26 November 1999), as amended
in 2002 (Board of Directors’ resolution of 12 November 2002) and 2006 (Board of Directors’
resolution of 22 February 2007).
Within the recommendations given by the Code, the Board, on 26 May 2011, carried out the

15
customary check that the Directors’ independence requirements had been correctly assessed by the
Board of Directors and has directly verified the existence of similar requirements on the part of each
of the Statutory Auditors; furthermore, in accordance with the abovementioned Bank of Italy’s
Order concerning Corporate Governance, the Board has acknowledged its own adequacy in terms of
powers, operation and composition, taking account of the size and complexity of, and the activity
carried out by, the Bank (also as Parent Company pursuant to article 61 of the T.U.B.).
- Final valuations of the supervisory activity and possible proposals pursuant to article 153 of
Legislative Decree 58/98
The Board of Statutory Auditors can reasonably assure that no significant events emerged during
the supervisory activity which would have had to be reported to the Supervisory Bodies or which
would have been such as to constitute a reason for remarks or proposals to the Shareholders’
Meeting.
Therefore, the Board can conclude that, through the activity carried out in the financial year, it was
able to assess:
- Compliance with the Law and the By-Laws
- The adequacy of the administrative and accounting structure
- The adequacy of the organisational and control structure
- The principles of correct administration
- The actual application of the corporate governance rules
- The adequacy of the instructions given to Subsidiaries
- The subsequent preparation of the Annual Accounts and of the Consolidated Financial
Statements in accordance with the international accounting standards IAS-IFRS and the

16
instructions given by the Bank of Italy (order no. 262 of 22 December 2005, as updated).
---------------------------------------------
Consolidated Financial Statements as at 31 December 2011
The Board of Statutory Auditors has also examined the Consolidated Financial Statements for the
2011 financial year which are submitted to you by the Directors and it is able to certify that they
were prepared in accordance with the law and that the Report on Operations includes a description
of the performance of the companies and a summary of the performance of the subsidiaries, as well
as of the Group’s structure.
In this regard, we can confirm that:
- We assessed the correct application of the accounting standards and policies. Specifically,
we assessed compliance with the principles of consolidation and the rules relating to the
formation of the scope of consolidation;
- The application of these criteria, no reasons for exception having emerged, has allowed the
consolidated equity, financial and economic position to be represented in a true and correct
manner and from a perspective of considering the situation in its totality;
- We determined that the organisational and procedural structure of the Parent Company is
adequate to manage information flows and consolidation operations;
- We assessed compliance with the requests submitted by Consob on the Financial Statements’
disclosures and on the performance of the different business segments.
The checks carried out by the Independent Auditors have determined that the values expressed in
the Financial Statements are proven by the accounting records of the Parent Company, by the
Financial Statements of the Subsidiaries and by the related information formally notified by the
latter.

17
The determination of the scope of consolidation, the choice of principles for the consolidation of
equity investments and the choice of procedures adopted for this purpose comply with the relevant
provisions of law.
The preparation of the Consolidated Financial Statements is therefore to be considered technically
correct and compliant with the specific regulations as a whole.
As is known, it is the responsibility of the governing body of the company to prepare the
Consolidated Financial Statements and the Independent Auditors have been appointed to give a
professional opinion, based on an audit. This opinion was issued on 4 April 2012 and does not
contain any observations, remarks or objections.
----------------------------------
Dear Shareholders,
We conclude our Report on the control activity carried out during 2011, as better highlighted by the
foregoing, and we hereby give a favourable opinion on the activity carried out by your Company, on
the organisation of the same, on the internal control system and on the compliance with the Law and
the Company’s By-Laws.
Accordingly, we hereby give a favourable opinion on the approval of the Financial Statements at 31
December 2011 which were submitted to you by the Board of Directors and on the proposed
distribution of dividends to the amount of €0.105 for each of 117,000,000 ordinary shares and
€0.126 for each of 13,202,000 savings shares, for a total dividend of €13,948,452.00, as well as on
the proposed allocation of the residual profit to the Legal Reserve for an amount of €4,323,528.00,
the Statutory Reserve for an amount of €4,323,528.00 and as an additional increase in the Statutory

18
Reserve for €20,639,769.90.
Desio, 4 April 2012
THE STATUTORY AUDITORS
Eugenio Mascheroni – Chairman
Marco Piazza
Rodolfo Anghileri
Financial Statements
37
Financial Statements

Financial Statements
38
PREAMBLE
Merger by incorporation of Banco Desio Toscana S.p.A. and Banco Desio Veneto S.p.A.
As already disclosed in the “Report on operations”, the merger of the two subsidiary banks Banco Desio ToscanaS.p.A. and Banco Desio Veneto S.p.A. by incorporation into the parent company Banco di Desio e della BrianzaS.p.A. became effective on 1 October 2011.The accounting and tax effects of the merger transaction started from 1 January 2011 and involved the merger ofthe two wholly-owned banks by incorporation into the Parent Company; as a consequence both the balance sheetand income statement balances were entered from that date.For the purpose of greater clarity and completeness of information in these financial statements the charts in thebalance sheet, income statement and notes to the financial statements also show the restated data from theprevious year adjusted to take account of this transaction. This data was restated using the process of line-by-lineconsolidation of the two banks affected by the abovementioned transaction into the controlling company.
The restated situation has not been audited.
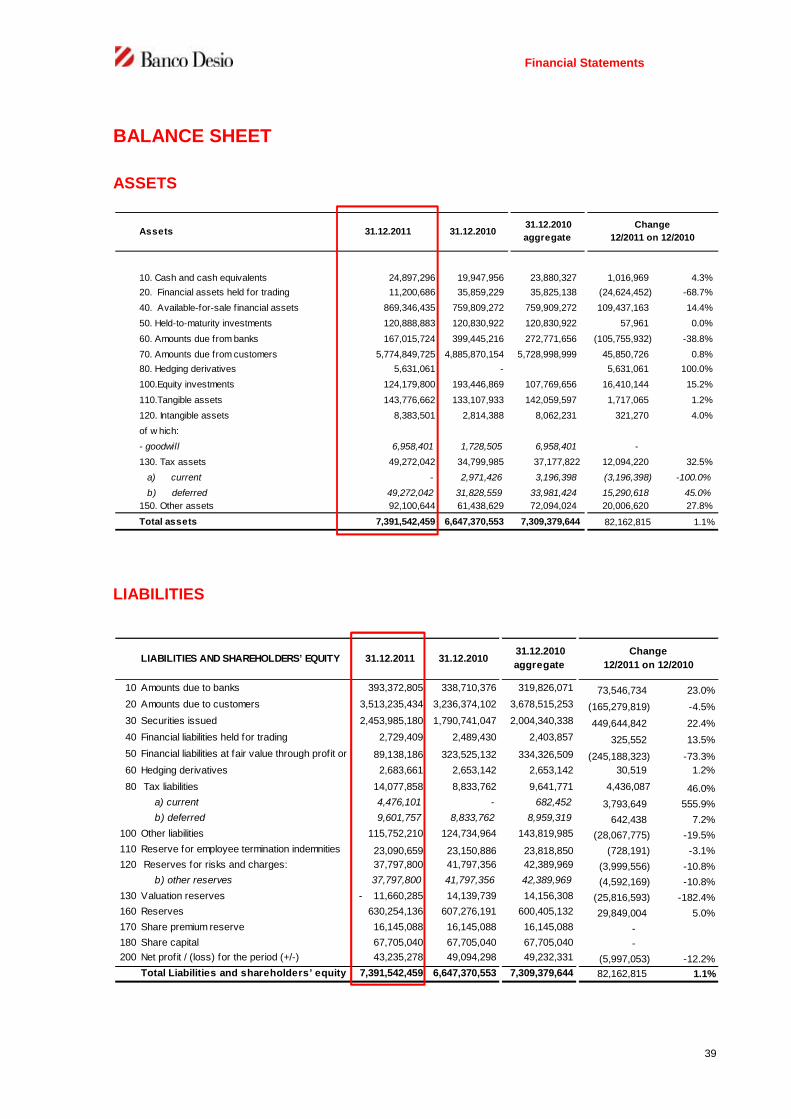
Financial Statements
39
BALANCE SHEET
ASSETS
LIABILITIES
Assets 31.12.2011 31.12.201031.12.2010
aggregate
10. Cash and cash equivalents 24,897,296 19,947,956 23,880,327 1,016,969 4.3%
20. Financial assets held for trading 11,200,686 35,859,229 35,825,138 (24,624,452) -68.7%
40. Available-for-sale financial assets 869,346,435 759,809,272 759,909,272 109,437,163 14.4%
50. Held-to-maturity investments 120,888,883 120,830,922 120,830,922 57,961 0.0%
60. Amounts due from banks 167,015,724 399,445,216 272,771,656 (105,755,932) -38.8%
70. Amounts due from customers 5,774,849,725 4,885,870,154 5,728,998,999 45,850,726 0.8%
80. Hedging derivatives 5,631,061 - 5,631,061 100.0%
100.Equity investments 124,179,800 193,446,869 107,769,656 16,410,144 15.2%
110.Tangible assets 143,776,662 133,107,933 142,059,597 1,717,065 1.2%
120. Intangible assets 8,383,501 2,814,388 8,062,231 321,270 4.0%
of w hich:
- goodwill 6,958,401 1,728,505 6,958,401 -
130. Tax assets 49,272,042 34,799,985 37,177,822 12,094,220 32.5%
a) current - 2,971,426 3,196,398 (3,196,398) -100.0%
b) deferred 49,272,042 31,828,559 33,981,424 15,290,618 45.0%
150. Other assets 92,100,644 61,438,629 72,094,024 20,006,620 27.8%
Total assets 7,391,542,459 6,647,370,553 7,309,379,644 82,162,815 1.1%
Change
12/2011 on 12/2010
LIABILITIES AND SHAREHOLDERS’ EQUITY 31.12.2011 31.12.201031.12.2010
aggregate
10 Amounts due to banks 393,372,805 338,710,376 319,826,071 73,546,734 23.0%
20 Amounts due to customers 3,513,235,434 3,236,374,102 3,678,515,253 (165,279,819) -4.5%
30 Securities issued 2,453,985,180 1,790,741,047 2,004,340,338 449,644,842 22.4%
40 Financial liabilities held for trading 2,729,409 2,489,430 2,403,857 325,552 13.5%
50 Financial liabilities at fair value through profit or
loss
89,138,186 323,525,132 334,326,509 (245,188,323) -73.3%
60 Hedging derivatives 2,683,661 2,653,142 2,653,142 30,519 1.2%
80 Tax liabilities 14,077,858 8,833,762 9,641,771 4,436,087 46.0%
a) current 4,476,101 - 682,452 3,793,649 555.9%
b) deferred 9,601,757 8,833,762 8,959,319 642,438 7.2%
100 Other liabilities 115,752,210 124,734,964 143,819,985 (28,067,775) -19.5%
110 Reserve for employee termination indemnities 23,090,659 23,150,886 23,818,850 (728,191) -3.1%
Reserves for risks and charges: 37,797,800 41,797,356 42,389,969 (3,999,556) -10.8%
b) other reserves 37,797,800 41,797,356 42,389,969 (4,592,169) -10.8%
130 Valuation reserves - 11,660,285 14,139,739 14,156,308 (25,816,593) -182.4%
160 Reserves 630,254,136 607,276,191 600,405,132 29,849,004 5.0%
170 Share premium reserve 16,145,088 16,145,088 16,145,088 -
180 Share capital 67,705,040 67,705,040 67,705,040 -
200 Net profit / (loss) for the period (+/-) 43,235,278 49,094,298 49,232,331 (5,997,053) -12.2%
Total Liabilities and shareholders’ equity 7,391,542,459 6,647,370,553 7,309,379,644 82,162,815 1.1%
120
Change
12/2011 on 12/2010

Financial Statements
40
INCOME STATEMENT
Item 31.12.2011 31.12.201031.12.2010
aggregate
10 Interest income and similar revenues 269,063,481 206,471,664 229,703,367 39,360,114 17.1%
20 Interest expense and similar charges (90,306,384) (60,876,599) (66,767,196) (23,539,188) 35.3%
30 Net interest income 178,757,097 145,595,065 162,936,171 15,820,926 9.7%
40 Fee and commission income 109,578,120 104,123,484 115,422,069 (5,843,949) 5.2%
50 Fee and commission expense (4,264,471) (6,295,096) (5,535,277) 1,270,806 -23.0%
60 Net fees and commissions 105,313,649 97,828,388 109,886,792 (4,573,143) -4.2%
70 Dividends and similar income 4,187,201 7,126,999 7,207,970 (3,020,769) -41.9%
80 Net prof its/(losses) on trading activities (1,232,094) 366,444 448,442 (1,680,536) -374.7%
90 Net prof its/(losses) on hedging activities (23,491) 1,596,539 1,596,539 (1,620,030) -101.5%
100 Profit/(loss) on disposal or repurchase of: 3,170,521 7,946,633 7,957,140 (4,786,619) -60.2%
a) loans and receivables (552,267) 55,175 56,735 (609,002) -1073.4%
b) available-for-sale financial assets 2,624,045 7,064,207 7,064,207 (4,440,162) -62.9%
d) financial liabilities 1,098,743 827,251 836,198 262,545 31.4%
110 Net gain/(loss) on financial assets and
liabilities at fair value through profit or loss 2,746,116 (1,881,018) (1,743,156) 4,489,272 -257.5%
120 (intermediation margin) 292,918,999 258,579,050 288,289,898 4,629,101 1.6%
130 Net impairment losses on/w ritebacks to: (35,268,225) (34,897,415) (38,247,969) 2,979,744 -7.8%
a) loans and receivables (35,264,769) (34,782,054) (38,127,676) 2,862,907 -7.5%
d) other financial assets (3,456) (115,361) (120,293) 116,837 -97.1%
140 Net income from banking activities 257,650,774 223,681,635 250,041,929 7,608,845 3.0%
150 Administrative expenses: (200,301,559) (174,625,358) (198,546,044) (1,755,515) 0.9%
a) personnel expenses (134,403,900) (117,696,028) (133,180,784) (1,223,116) 0.9%
b) other administrative expenses (65,897,659) (56,929,330) (65,365,260) (532,399) 0.8%
160 Net provisions for risks and charges 5,900,268 15,570,236 15,653,646 (9,753,378) -62.3%
170
Net adjustments to the value of tangible assets (5,937,619) (5,349,445) (6,221,173) 283,554 -4.6%
180 Net adjustments to the value of intangible
assets (584,312) (422,889) (430,554) (153,758) 35.7%
190 Other operating (expenses)/income 16,357,776 13,077,009 12,882,502 3,475,274 27.0%
200 Operating expenses (184,565,446) (151,750,447) (176,661,623) (7,903,823) 4.5%
210 Profits/(losses) on equity investments 493,232 493,232 (493,232) -100.0%
250
Profits/(losses) before taxes from
continuing operations 73,085,328 72,424,420 73,873,538.0 (788,210) -1.1%
260 Taxes for the period on income from
continuing operations(29,850,050) (23,330,122) (24,641,207) (5,208,843) 21.1%
270
Net profits (loss) after tax from
continuing operations 43,235,278 49,094,298 49,232,331 (5,997,053) -12.2%
290 Net profit/(loss) for the period 43,235,278 49,094,298 49,232,331 (5,997,053) -12.2%
Change
12/2011 on 12/2010

Financial Statements
41
STATEMENT OF COMPREHENSIVE INCOME
Items 31.12.2011 31.12.2010
10. Net Profit (Loss) for the period 43,235,279 49,094,298
Other income components, net of taxes
20. Available-for-sale financial assets (25,834,843) (12,242,894)
30. Tangible assets
40. Intangible assets
50. Hedging of foreign investments
60. Cash flow hedge
70. Exchange differences
80. Non-current assets being disposed of
90. Actuarial Gains (Losses) on defined benefit plans 34,820 195,555
100. Portion of valuation reserves of equity investments carried at
equity
110. Total other income components, net of taxes (25,800,023) (12,047,340)
120. Comprehensive income (Item 10+110) 17,435,256 37,046,958
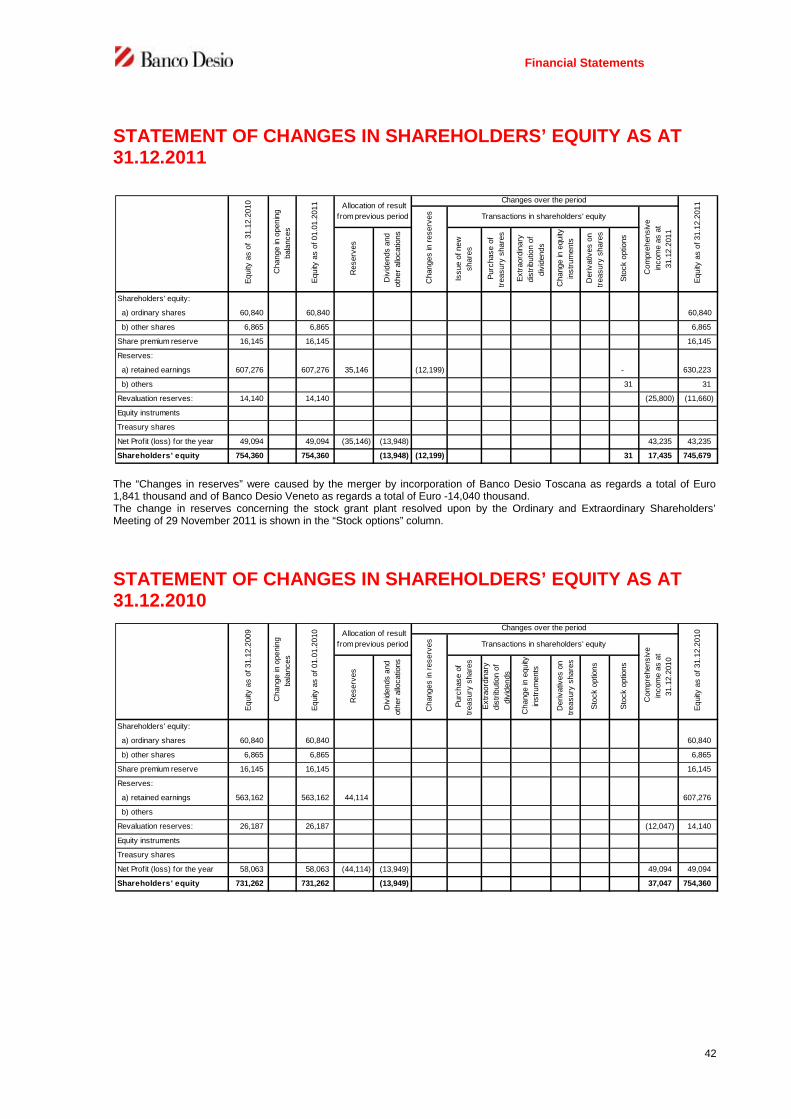
Financial Statements
42
STATEMENT OF CHANGES IN SHAREHOLDERS’ EQUITY AS AT31.12.2011
The “Changes in reserves” were caused by the merger by incorporation of Banco Desio Toscana as regards a total of Euro1,841 thousand and of Banco Desio Veneto as regards a total of Euro -14,040 thousand.The change in reserves concerning the stock grant plant resolved upon by the Ordinary and Extraordinary Shareholders’Meeting of 29 November 2011 is shown in the “Stock options” column.
STATEMENT OF CHANGES IN SHAREHOLDERS’ EQUITY AS AT31.12.2010
Shareholders' equity:
a) ordinary shares 60,840 - 60,840 60,840
b) other shares 6,865 6,865 6,865
Share premium reserve 16,145 16,145 16,145
Reserves:
a) retained earnings 607,276 607,276 35,146 (12,199) - 630,223
b) others 31 31
Revaluation reserves: 14,140 14,140 (25,800) (11,660)
Equity instruments
Treasury shares
Net Profit (loss) for the year 49,094 49,094 (35,146) (13,948) 43,235 43,235
Shareholders' equity 754,360 754,360 (13,948) (12,199) 31 17,435 745,679
Equity
as
of
31.1
2.2
010
Change
inopenin
g
bala
nces
Equity
as
of01.0
1.2
011 Allocation of result
from previous period
Equity
as
of31.1
2.2
011
Changes
inre
serv
es Transactions in shareholders' equity
Com
pre
hensiv
e
incom
eas
at
31.1
2.2
011
Reserv
es
Div
idends
and
oth
er
allo
catio
ns
Issue
ofnew
share
s
Purc
hase
of
treasury
share
s
Extr
aord
inary
dis
trib
utio
nof
div
idends
Change
inequity
instr
um
ents
Changes over the period
Derivativ
es
on
treasury
share
s
Sto
ck
optio
ns
Shareholders' equity:
a) ordinary shares 60,840 60,840 60,840
b) other shares 6,865 6,865 6,865
Share premium reserve 16,145 16,145 16,145
Reserves:
a) retained earnings 563,162 563,162 44,114 607,276
b) others
Revaluation reserves: 26,187 26,187 (12,047) 14,140
Equity instruments
Treasury shares
Net Profit (loss) for the year 58,063 58,063 (44,114) (13,949) 49,094 49,094
Shareholders' equity 731,262 731,262 (13,949) 37,047 754,360
Equity
as
of31.1
2.2
009
Change
inopenin
g
bala
nces
Equity
as
of01.0
1.2
010 Allocation of result
from previous period
Equity
as
of31.1
2.2
010
Changes
inre
serv
es Transactions in shareholders' equity
Com
pre
hensiv
e
incom
eas
at
31.1
2.2
010
Reserv
es
Div
idends
and
oth
er
allo
catio
ns
Purc
hase
of
treasury
share
s
Extr
aord
inary
dis
trib
utio
nof
div
idends
Change
inequity
instr
um
ents
Derivativ
es
on
treasury
share
s
Changes over the period
Sto
ck
optio
ns
Sto
ck
optio
ns

Financial Statements
43
CASH FLOW STATEMENT
31.12.2011 31.12.2010
1. Management activities 88,265,302 76,646,885
- interest income earned (+) 268,398,303 206,341,637
- interest expenses paid (-) (89,695,460) (60,588,235)
- dividends and similar revenues 1,361,732 -
- net commissions (+/-) 105,842,225 97,358,446
- personnel costs (-) (134,403,900) (117,696,028)
- other costs (-) (57,089,696) (46,634,867)
- other revenues (+) 23,702,147 21,196,053
- taxes and duties (-) (29,850,049) (23,330,121)
- costs/revenues relating to non current assets held for sale and discontinued operations,
net o f tax effect (+/-)- -
2. Liquid assets generated (absorbed) by decrease/increase in
financial assets(147,253,808) 336,715,050
- financial assets held for trading 23,086,621 34,648,838
- financial assets at fair value through profit or loss - -
- available-for-sale financial assets (150,034,747) (6,008,844)
- amounts due from customers (91,164,683) (242,341,609)
- amounts due from banks: at sight 118,281,597 72,898,928
- amounts due from banks: others (12,514,824) 448,278,571
- o ther assets (34,907,772) 29,239,166
3. Liquid assets generated (absorbed) by increase/decrease in
financial liabilities95,994,506 (259,377,091)
- amounts due to banks: at sight (48,420,809) (63,597,516)
- amounts due to banks: others 121,967,543 144,679,822
- amounts due to customers (165,279,819) (438,851,723)
- securities issued 442,484,353 318,099,441
- financial liabilities held for trading (2,921,061) (9,065,456)
- financial liabilities at fair value through pro fit o r loss (241,922,498) (220,552,846)
- o ther liabilities (9,913,202) 9,911,187
Net liquid assets generated (absorbed) by operations (A) 37,005,999 153,984,844
B. INVESTMENTS
1. Liquid assets generated by 2,909,623 8,388,191
- sale of investments - 1,244,400
- dividends received from investments 2,825,468 7,126,999
- sale/redemption of financial assets held to maturity - -
- sale of tangible assets 84,155 16,792
- sale of intangible assets - -
- sale of business divisions - -
2. Liquid assets absorbed by (25,050,201) (146,473,088)
- purchase of investments (16,405,780) (16,896,242)
- purchase of financial assets held to maturity 0 (120,831,709)
- purchase of tangible assets (7,738,840) (8,223,305)
- purchase of intangible assets (905,582) (521,832)
- purchase of business divisions - -
Net liquid assets generated (absorbed) by investments (B) (22,140,578) (138,084,897)
C. FUNDING ACTIVITIES
- issues/purchases of treasury shares - -
- issues/purchases of equity instruments - -
- distribution of dividends and other purposes (13,948,452) (13,948,452)
Net liquid assets generated (absorbed) by funding activities (C) (13,948,452) (13,948,452)
NET LIQUID ASSETS GENERATED (ABSORBED) DURING THE YEAR (A+B+C) 916,969 1,951,495
A. OPERATIONSAmount

Financial Statements
44
RECONCILIATION
N.B.: The item “Cash and cash equivalents at beginning of the year” corresponds to the total value and therefore includes thestarting stock balances of the merged banks.
Financial statements' items 2011 2010
Cash and cash equivalents at beginning of year 23,980,327 17,996,461
Total liquid assets generated (absorbed) during the year 916,969 1,951,495
Cash and cash equivalents: effect of exchange rate changes - -
Cash and cash equivalents at end of year 24,897,296 19,947,956

Notes to the financial statements
45
Notes to thefinancial statements______________________________

Notes to the financial statements
46
Part A - ACCOUNTING POLICIES
A. 1 – GENERAL
Section 1 – Declaration of conformity with international accounting standards
These financial statements were prepared in accordance with the provisions of law in force and the International
Accounting Standards IAS/IFRS, and is made up of the balance sheet, the income statement, the statement of
comprehensive income, the statement of changes in shareholders’ equity, the cash flow statement and the notes
to the financial statements; they are also accompanied by the notes on operations.
In application of Legislative Decree no. 38 of 28 February 2005, which incorporated EC Regulation no. 1606/2002
of 19 July 2002, the Bank’s financial statements were prepared in accordance with the International Financial
Reporting Standards (IFRS) and the International Accounting Standards (IAS), and related Interpretations, in
force at the date of reference of such financial statements.
Set out below are the accounting policies adopted in the preparation of the financial statements as of 31December 2011.
Section 2 – General accounting policies
The financial statements have been drawn up with clarity and represent a true and fair picture of the equity andfinancial situation and the economic results of the accounting period.
When noting the main management events emphasis has been given to the principle of economic substance overform.
The financial statements have been drawn up in compliance with the economic accruals basis using the criterionof historic cost, modified in relation to the valuation of financial assets held for trading, available for sale andvalued at fair value and of all existing derivative contracts which have been valued in accordance with the fairvalue principle.
The accounting value of liabilities recorded in the financial statements which have been hedged have beenadjusted to take account of the changes in fair value attributable to the hedged risk.
As provided for under IAS39, with regard to the valuation of financial instruments, the fair value option was alsoadopted, permitting the designation of financial assets and liabilities at their fair value with the related entries inthe income statement, when this produces more significant information, reduces complexity or leads to a morereliable valuation. The schedules under the financial statements and notes were prepared and drawn up inaccordance with the compilation rules issued by the Bank of Italy by the Circular Letter no. 262 of 22 December2005, as updated on 18 November 2009.
Amounts are expressed in Euro units, except for the notes to the financial statements which have been expressedin thousands of Euros.
Section 3 – Events subsequent to the reporting date
Reference is made to the Directors’ Report.
Section 4 – Other aspects
Use of estimates and assumptions when drawing up the financial statements
The drafting of the financial statements calls for the use of estimates and assumptions which may have asignificant effect on the values entered in the balance sheet and the income statement as well as on the notes tothe financial statements. The use of such estimates involves the use of available information and the adoption of

Notes to the financial statements
47
subjective valuations, also founded on past experience, for the purposes of the formulation of reasonableassumptions for the identification of management elements. By their nature the estimates and assumptions usedmay vary from accounting period to accounting period and it cannot therefore be excluded that in subsequentaccounting periods the values currently entered in the financial statements may change precisely because ofchanges in the subjective valuations utilised.
The main cases where the use of subjective valuations are called for are the following:
- the quantification of losses by reason of the reduction in the value of loans and receivables and, in general, offinancial assets;
- the calculation of the fair value of financial instruments to be used for the purposes of the notes to the financialstatements;
- the use of valuation techniques for the determination of the fair value of financial instruments not listed on activemarkets (Level 2 and 3);
- the quantification of the reserve for employee termination indemnities and the reserves for risks and charges;
- the estimates and assumptions made in relation to the ability to recover deferred tax assets.
The description of the accounting policies applied to the main aggregate headings in the financial statementsprovides more details and information on the subjective assumptions and valuations used in the drawing up of the
financial statements.
Auditing
These financial statements have been audited by the company PricewaterhouseCoopers SpA pursuant toLegislative Decree no. 39 of 27 January 2010 and in implementation of the resolution taken at the meeting of 30April 2003, which was extended on 28 April 2006 and again on 27 April 2007 for the 2009-2011 financial years.
A.2 - MAIN FINANCIAL STATEMENT ITEMS
The measurement criteria described below, used in the preparation of the financial statements as at 31 December
2011, are in compliance with the European Commission ratified International Accounting Standards (IAS/IFRS) in
force at the reporting date and have been applied on a going-concern basis.
For transactions involving the trading of standardized financial assets, namely contracts whereby delivery takesplace over a period of time laid down by regulations or by market conventions, the reference date is that ofsettlement.
Financial assets held for trading
Classification criteria
“Financial assets held for trading” (at fair value through profit or loss) comprise debt securities, equity securities,non-hedging derivative instruments with a positive value and the other assets that, based on their initialdesignation, are classified as financial instruments intended to be traded in the near term. Since classificationderives from the initial designation, subsequent transfers to other categories are not generally permitted for thiscategory of financial assets, except as permitted by IAS 39 in specific and exceptional circumstances.
Recognition criteria
Initial recognition is at fair value at the settlement date, which corresponds to the consideration paid withoutconsidering transaction costs, which are charged directly to the income statement.
Criteria for the measurement and recognition of income statement components
After initial recognition, subsequent measurement is at fair value, with recognition of the gain or loss in the incomestatement.
For shares, government bonds – both Italian and foreign – and derivatives which are traded on an active market,measurement is at the closing price at the date of measurement (Level 1 fair value).
Italian and foreign bonds traded on an active market are measured at the BID price (Level 1 fair value).
Shares and bonds which are not traded on an active market are measured at fair value by using valuation

Notes to the financial statements
48
techniques and considering objective elements that can be observed in the market (Level 2 fair value).
Derivative instruments which are not traded on active markets are measured by using valuation techniques (Level2 or 3 fair value).
Derecognition criteria
Assets held for trading are derecognised when they are sold or upon expiry of the assets.
Available-for-sale financial assets
Classification criteria
“Available-for-sale financial assets” comprise those financial assets – excluding derivatives – not classified asloans and receivables, held-to-maturity investments, financial assets held for trading or financial assets at fairvalue through profit or loss.
They include minority investments, bonds held for investment (not short-term) and mutual investment fund units.
“Available-for sale financial assets” may be transferred to the category “Held-to-maturity investments” only in thefollowing circumstances:
- a change in intention or ability,
-in the rare circumstances that a reliable measure of fair value is not available.
The transfer to the category “Loans and Receivables” is permitted only in particular circumstances.
Recognition criteria
Initial recognition is at fair value, including transaction costs directly attributable to the acquisition, at thesettlement date.
Measurement criteria
After initial recognition, subsequent measurement is at fair value for the price component, while the interestcomponent is calculated with reference to the Effective Rate of Return.
Fair value is determined using the criteria already set out for assets held for trading.
Unlisted financial assets whose fair value cannot be reliably measured are measured at cost.
For minority interests, measurement at fair value is made by using valuation techniques (Level 3). For UCITSunits, measurement occurs at the N.A.V. at the measurement date, or at the latest available date (Level 1).
At every balance sheet date, an assessment is made of any existing impairment that has a measurable impact onthe estimated future cash flows, considering possible financial difficulties of the issuer, or any other similarelement. As required by paragraph 61 of IAS 39, “significant” (exceeding 50%) or “extended” (beyond 24 months)decreases in value are considered as an objective evidence of impairment of equity securities.
The amount of the loss of value is represented by the difference between the asset’s accounting value and itsrecoverable value.
Criteria for the recognition of income statement components
Gains or losses are recorded at equity in the valuation reserve, net of tax effects, until derecognition of the asset,
while the component deriving from amortised cost is instead charged to the income statement.
At the time of expiry, sale or transfer to another category, or for impairment recognition, the amount accrued in the
valuation reserve is recognised in the income statement.When impairment losses which have been recognised in the income statement, are balanced as a result ofsubsequent revaluations, the value write-back, up to the amount of these losses, is recognised in the incomestatement for debt securities and in an equity reserve for equity securities.

Notes to the financial statements
49
Derecognition criteria
Available-for sale financial assets are derecognized when sold, upon expiry of the assets or upon transfer toanother category.
Held-to-maturity investments
Classification criteria
“Held-to-maturity investments” comprise non-derivative (including implicit) financial assets listed on an active
market (Level 1) with fixed or determinable contractual payments and fixed maturities for which there is the
positive intention and ability to hold them until maturity.
The constitution of the held-to-maturity investments category, and any subsequent movements, was made
against specific resolutions adopted by the corporate bodies, in accordance with the provisions of IAS 39.
Transfers are permitted limited to the category AFS in some cases only. The recording of financial assets in thiscategory is no longer permitted for the current year and for the two following years in the event that sales ortransfers are made for a not insignificant amount, except in the case of investments close to maturity and isolatedevents that are beyond the Bank’s control. If the conditions requiring that this category not be used exist, theremaining assets are reclassified as available-for-sale financial assets (tainting provision).
Recognition criteria
Initial recognition is at fair value, including transaction costs directly attributable to the acquisition, on thesettlement date.
Criteria for the measurement and recognition of income statement components
After initial recognition subsequent measurement is at amortised cost against profit and loss, by using the actual
interest rate method.
At every balance sheet date, an assessment is made of any existing impairment that has a measurable impact on
the estimated future cash flows. If such impairment exists, losses are recognised in the income statement.
Since they are securities listed on active markets, the fair value reported in the notes to the financial statements isequal to their counter values at market prices (Level 1).
Derecognition criteria
Held-to-maturity investments are derecognised when sold, upon expiry of the assets or upon transfer to anothercategory.
Loans and receivables
Classification criteria
“Loans and receivables” comprise non-derivative financial assets with fixed or determinable payments that are not
listed on an active market.
Normally, they include loans and advances to customers, amounts due from banks and debt securities not listed
on an active market that have characteristics similar to receivables, excluding assets held for trading and
available-for-sale assets.
They also include finance lease receivables.
Transfers from the categories of “Financial assets available for sale” and “Financial assets held for trading” are
permitted only in particular circumstances specified by IAS 39.

Notes to the financial statements
50
Recognition criteria
Loans and receivables are recorded on the trade date at fair value, including transaction costs and commissionsdirectly attributable, normally equal to the value paid out.
Measurement criteria
After initial recognition subsequent measurement is at amortised cost using the effective interest method.
The amortised cost is the amount at which the financial asset was measured at initial recognition minus principal
repayments, plus or minus the cumulative amortisation using the effective interest method of any difference
between the initial amount and the maturity amount, and minus any reduction for impairment or uncollectibility.
Loans and receivables are periodically subject to analysis, and are classified as “performing” and “nonperforming”
based on the state of impairment of the loan or receivable.
Non-performing loans include the different classes of impaired loans provided for under the regulations of Bank of
Italy: non-performing; problem, restructured exposures and expired loans.
Where objective evidence of impairment exists, loans pass from performing to non-performing.
The loans and receivables portfolio is subject to reassessment at least at the close of every set of annual or
interim financial statements, for the purpose of identifying and determining any objective evidence of impairment.
Measurement is achieved by considering both the specific solvency situation of customers and the local or
national economic conditions relative to the debtor’s sector of activity.
“Performing” loans and receivables are subject to collective assessment whereby they are subdivided into groups
with the same risk characteristics. Expected Loss is determined by applying the Probability of Default (PD)
produced by the Credit Rating System model and Loss Given Default (LGD) is determined from a historic
statistical analysis of the performance of non-performing and problem loans. The expected loss takes account of
the deterioration of the receivables at the reference date although the precise entity of such deterioration is not
yet known at the time of measurement, in order to move the valuation model from expected loss to latent loss.
Specific analyses are conducted for exposures of a significant amount.
All loans and receivables for which there exists objective evidence of impairment, measured by the difference
between the carrying value and the present value of expected future cash flows discounted applying the original
agreed effective interest rate, were classified in the “non-performing” category. The assessment is analytical and
takes into consideration the presumed possibility of recovery, expected recovery time and existing guarantees.
Receivables for default interest that have accrued on impaired assets are accounted for as to their actual
collection.
The value of loans to non-resident persons is written down on a general basis in relation to the difficulty in
servicing the debt by their countries of residence.
As regards “performing loans” beyond the short term, the fair value of the loans is calculated only for the purposes
of their inclusion in the notes to the financial statements. Non-performing loans previously valued analytically, and
the short term positions, are recognised at book value, which represents a reasonable estimate of their fair value.The fair value is determined through the development of future cash flows, applying a risk free discount rate, andtaking also into account the credit risk in term of PD and LGD, reported in the CRS model (Level 3).
Derecognition criteria
Loans and receivables that are transferred are only derecognised from the assets of the financial statements if thetransfer has entailed the material transfer of all of the risks and benefits connected to the actual loans andreceivables. However, if a substantial part of the risks and benefits relating to the transferred loans andreceivables has been retained, they continue to be recorded in the assets of the financial statements, eventhough legally the ownership of the loan or receivable has actually been transferred.In the event that it is not possible to ascertain whether the material transfer of the risks and benefits has takenplace, the loans and receivables are derecognised from the financial statements if no type of control over themhas been retained. On the other hand, if such control is retained, even partially, the loans and receivables areretained in the financial statements, to the extent of the residual involvement, which is measured by the exposure

Notes to the financial statements
51
of the transferred loans and receivables to changes in value and to variations in financial flows.Finally, the transferred loans and receivables are derecognised from the financial statements in the event that thecontractual rights to receive the related cash flows are retained, with the concurrent assumption of an obligation topay these cash flows, and only these, to other parties.
Criteria for the recognition of income statement components
Measurement at amortised cost generates a transfer of the transaction costs and additional revenues in the
income statement, over the life of the financial asset rather than being fully recognised in the income statement in
the period of initial recognition.
Default interest accrued is charged to the income statement only at the time of their actual collection.
Interest accruing over time as a result of the discounting-back of impaired loans is recognised in the income
statement under write-backs.
The adjustments arising from the analytical and collective assessments are recognized in profit and loss.
The original value of loans and receivables is reinstated if the reasons for the adjustment recorded cease to exist,
and the reversal is recognized in profit and loss.
Hedging transactions
Classification criteria
Hedging transactions have the objective of neutralizing certain potential risks of loss on financial assets or
liabilities through specific financial instruments, whose use is directed at lessening the effects of the hedged
financial instruments in the income statement.
The type of hedge used is the Fair Value Hedge: the objective is to hedge the risk of changes in the fair value ofthe hedged instrument.
Recognition criteria
Recognition of hedging transactions in the financial statements entails:
- involvement of external parties;
- -specific designation and identification of the hedging and hedged financial instruments used for thetransaction;
- definition of the risk management objective pursued, specifying the nature of the risk hedged;
- passing the test of effectiveness at the inception of the hedge relationship, and subsequently, with specificmeasurement methods and timing;
- preparation of complete formal documentation of the hedging relationship.
Criteria for the measurement and recognition of income statement components
The fair value of hedging financial instruments, which are not listed on an active market, is calculated by using
valuation models for the estimate and discounting back of future cash flows (Level 3).
The changes in the fair value of the hedging derivatives and hedged financial instruments (for the partsattributable to the hedged risk) are recorded separately in the income statement.This offsetting is recognised by recording, under item 90 “Net profits (losses) on hedging activities” in the incomestatement, the changes in value pertaining both to the item hedged (as regards the variations produced by theunderlying risk factor) and to the hedging instrument. Any difference is therefore its net economic effect.
A hedging transaction is considered effective when changes in the fair value (or in cash flows) of the hedging
financial instrument offset the changes of the hedged financial instrument within a range of 80%-125%, as set by
IAS 39.
Tests of effectiveness are performed at the close of each set of annual or interim financial statements, bothretrospectively, to measure actual results to date, and prospectively, to demonstrate the expected effectiveness infuture periods.

Notes to the financial statements
52
If the tests do not confirm the effectiveness of the hedge and taking account of internal policy, from that momentaccounting for hedging transactions, as set out above, is suspended, the derivative hedging contract isreclassified as an instrument held for trading and the hedged financial instrument reacquires the valuationcriterion that corresponds to its classification in the financial statements.
Derecognition criteria
Recognition of hedging transactions in the financial statements is discontinued when the effectiveness criteria are
no longer met, when the transactions are revoked, or when the hedging instrument or the hedged instrument
expires, is terminated or is sold.
If the hedged instrument is measured at amortised cost, the difference between the fair value, determined at thedate of discontinuance of the hedging relationship, and the amortised cost is recognised over its residual life.
Equity investments
Classification criteria
This item comprises investments in subsidiaries and associates, as defined by IAS 27 and 28. Other minorityinvestments are accounted for in accordance with IAS 39, and are classified as available-for-sale financial assetsand measured in accordance with the criteria for that class of financial asset.
Recognition criteria
Investments are entered at the settlement date. Initial recognition is at cost including any directly attributableadditional charges.
Measurement criteria
After initial recognition, investments in subsidiaries and associates are valued at cost.Any value adjustments due to impairment must be recognised in the income statement.
a) Criterion to estimate recoverable values (Impairment)For the criterion to estimate the recoverable value of the Equity Investment, reference is made to the so-called “fair value”:The impairment test is conducted by using the financial valuation method Discounted Cash Flow (DCF).
Time horizon for the determination of future cash flows: it is only that attributable to the last Business Plan orbudget approved by the Directors.
Cash flows1) Equity investments in banking companiesWith reference to this type of equity investments, the DCF method adopted is the so-called “Asset Side”,taking account of the fact that the financial margin is the most peculiar component of the income statementfor these entities. Furthermore, flows represented directly by the Net Results (NR) are assumed as future netCash Flows.2) Equity investments in other companiesWith reference to equity investments (if any) in non-banking companies, the DCF method adopted is alwaysthe so-called “Asset Side”, and, accordingly, the future net Cash Flows (CF) are determined on the basis ofthe prospective (unlevered) financial statements, or net of the financial margin.
Discount rate: reference is made to the so-called WACC (weighted average cost of capital) which, as isknown, expresses the cost of the financing sources of the business under consideration, weighing the debtratio and the equity ratio according to the degree of indebtedness.
Growth rate of the flows after the period covered by the business plan or budget: it is prudentially consideredto be:

Notes to the financial statements
53
- equal to zero, where the Subsidiary or Associate has already reached an income stability, or a ROE(return on equity, i.e. the ratio between Net Result and Equity) in line with the equity ratio; vice versa,
- equal to an annual growth rate such as to allow a ROE (return on equity) to be reached by the entity, inthe medium- to long-term, a in line with the equity ratio previously determined.
Terminal Value: it is determined by applying the formula which is associated to the traditional formula of“perpetual annuity” at the WACC rate, or by taking account of the Market Multiples (Stock Exchange), withreference to the P/E (Capitalisation value divided by the Net Profit) of a significant basket of listedcompanies.
The Fair Value of the Equity Investment, as determined on the date when observations are made, is thencompared to the value at which the specific Equity Investment is entered in the accounts, with the soleobjective of verifying impairment losses (if any).
b) Sensitivity analysisTo further support the test carried out, a stress test is then conducted which is based on the so-calledsensitivity analysis of the impairment test carried out.Given the nature of the object of the impairment test (equity investments), the sensitivity analysis is based oncarrying out again the impairment procedure while considering the same variables used in it, but withreference to a pessimistic version (worst case) of the Business Plan or Budget approved by the Board ofDirectors of the Company.This pessimistic version takes account of the impact of possible macro-changes in the market conditions asto:- rates (negative performance of the interest rate curve for the bank);- terms and conditions of sale of the products (introduction of possible regulatory changes which might
substantially amend such conditions);- credit risk (higher intensity of the phenomenon of the so-called credit litigation).
c) Control methodThe sensitivity analysis will be completed by an additional investigation to compare values, based on analternative method, only in the case when the findings of the stress test, after having been compared to thevalue of the specific equity investment entered in the accounts, should report a significant negative deviation(exceeding 10% of the value of the equity investment).
For equity investments in banks, this method is identified as the so-called “mixed” method, i.e. the most usedrelevant method within transactions concerning banking companies. The method in question estimates theBank’s value on the basis of:- adjusted equity, or of the equity, taking account of implicit revaluations/write-downs (if any) of assets
and/or liabilities; in applying the method, reference is made only to the book value of the equity;- Market value of Direct and Indirect Deposits on the basis of a reasonable panel of valuation rates;- value of the so-called “income goodwill” which arises from a 3-year (in the case of a negative value) or 5-
year (in the case of a positive value) discounting back of the difference between the Net Result and theCost of Capital given by the equity ratio multiplied by the sum of adjusted equity and the market value ofDirect and Indirect Deposits.
For equity investments in other (non-banking) companies, the control method is identified as the method ofthe so-called “multiples” that can be recorded in the market (Stock Exchange) or within recent transactionswhich have taken place for companies in the sector in which the company operates, for which an impairmentis made in relation to the equity investment or the economic segment next to it.
Criteria for the recognition of income components
Dividends are accounted for when the right to receive them matures. Profits/losses from disposals are determined
based on the difference between the investment’s book value, according to the weighted-average cost method
and the consideration paid for the transaction, net of any directly attributable additional charges.
Derecognition criteria
Investments are derecognised from the accounts when the contractual rights to the cash flows from financialassets expire or when they are transferred together with the substantial transfer of all related risks and rewards.

Notes to the financial statements
54
Tangible assets
Classification criteria
Tangible assets comprise buildings, land, plant, furniture and fittings and other office equipment. They are goods
that are instrumental to the supply of services.
Tangible assets whose cost can be reliably measured and from which it is probable that future economic benefitswill flow are recognised in the financial statements.
Recognition criteria
Tangible assets are initially recognised at the purchase price, including additional costs sustained for the
purchase and to put the asset into operation.
For the first-time adoption of IAS/IFRS, the exemption provided by IFRS 1, paragraph 16, was taken advantage of
by opting for the measurement of buildings at fair value, as a substitute for cost, as at 1 January 2004. The cost
model was adopted for the measurement of buildings subsequent to that date.
Extraordinary maintenance costs that increase the value of assets are allocated to the assets to which they refer.
Ordinary maintenance costs are recognized directly in the income statement. In application of IAS 17, finance
lease transactions are recognised in the financial statements in accordance with the finance method. Accordingly,
assets leased out under finance leases are recognised as receivables
Measurement criteria
Tangible assets are recognised in the financial statements at purchase cost, including additional costs sustained,
less any accumulated depreciation and any accumulated impairment losses.
Depreciation is calculated systematically, on a straight-line basis, using technical-economic rates that are
representative of the residual useful life of the assets. Land and works of art are exceptions - they are not subject
to depreciation given that their useful lives are unlimited, and in consideration of the fact that the related value is
not normally destined to reduce in relation to the passage of time. Extraordinary maintenance costs that increase
the value of assets are allocated to the assets to which they refer and depreciated in relation to the residual useful
life of the related assets.
Each year an assessment will be made of whether there are any indications of impairment. Should it bedetermined that the carrying amount of an asset is greater than the recoverable amount, the carrying amount isadjusted to the recoverable amount and the loss charged to the income statement.
Criteria for the recognition of income statement components
Depreciation and impairment (if any) are recognised in the income statement under net value adjustments totangible assets.
Derecognition criteria
Tangible assets are derecognised on disposal.
Intangible assets
Classification criteria
Intangible assets include goodwill, the indemnity costs for the abandonment of leasehold premises and the costs
Notes to the financial statements
55
for the purchase of applications software.
Restructuring costs related to leasehold properties are entered under other assets.
Recognition criteria
Goodwill represents the positive difference between the acquisition cost and the fair value of net assets acquired
in business combinations. It is recognised in the financial statements as an intangible asset when it is effectively
representative of the future economic benefits of the assets acquired.
Other intangible assets are recognised at cost only if they comply with the requirements that they beindependently identifiable and distinct from goodwill, that it is probable that future economic benefits will berealised, and that the cost itself can be measured reliably.
Measurement criteria
Intangible assets are recognised in the financial statements at purchase cost, including additional costs sustained,
less any accumulated amortisation and any accumulated impairment losses.
Amortisation is calculated systematically, on a straight-line basis, using technical-economic rates that are
representative of the residual useful life.
Goodwill is not amortized in view of its indefinite useful life, and the adequacy of the carrying amount is assessed
annually (impairment test). Should there be indications of impairment, goodwill is adjusted appropriately and the
loss charged to the income statement.
a) Definition of the CGU “cash generating unit”It is identified as the group of branches which are or have been purchased or contributed on the part of thepurchasing bank or the contributing bank.
b) Allocation of goodwillThe price settled by the purchasing bank by cash or equity gives rise to an asset defined as “goodwill” or a“negative reserve” which is entered under the assets (under “intangible asset” with an unlimited life) orliabilities (under “equity reserves”) of the financial statements of the purchasing or contributing bank at thetime of the purchase or contribution.
c) Criterion to estimate recoverable values (Impairment)For the criterion to estimate the recoverable value of the CGUs, reference is made to the so-called “value inuse” obtained by estimating the following factors:- future incoming and outgoing cash flows which will derive from the continuing use of the CGU and from
its “theoretical” future disposal;- an appropriate discount rate (WACC – Weighted Average Cost Of Capital) for future incoming and
outgoing flows cash flows;- the time horizon considered is only that attributable to the last business plan or budget approved by the
Directors.
Cash flows: the flows represented by EBITDA (earnings before interest, tax, depreciation and amortisation)are assumed as future Cash Flows of the CGU.
Discount rate: reference is made to the so-called WACC (weighted average cost of capital) which expressesthe cost of the financing sources of the business under consideration, weighing the debt ratio and the equityratio according to the degree of indebtedness,
Growth rate of the flows after the period covered by the business plan or budget: it is prudentially consideredto be equal to zero.
Terminal Value: it is determined by applying the formula which is associated to the traditional formula of“perpetual annuity” at the WACC rate.
Completion of the impairment testThe value in use of the CGU, as determined on the basis of the above procedure on the date whenobservations are made, is then compared to the value of the specific item entered in the accounts of thebank, with the sole objective of verifying impairment losses (if any).

Notes to the financial statements
56
d) Sensitivity analysisTo further support the test carried out, a stress test is then conducted which is based on the so-calledsensitivity analysis of the impairment test carried out.Given the nature of the object of the impairment test (groups of branches), the sensitivity analysis is based oncarrying out again the impairment procedure while considering the same variables used in it, but withreference to a pessimistic version (worst case) of the Business Plan or Budget approved by the Directors.
This pessimistic version takes account of the impact of possible macro-changes in the market conditions asto:- rates (negative performance of the interest rate curve for the bank);- terms and conditions of sale of the products (introduction of possible regulatory changes which might
substantially amend such conditions);- credit risk (higher intensity of the phenomenon of the so-called credit litigation).
e) Control methodThe sensitivity analysis will be completed by an additional investigation to compare values, based on analternative method, only in the case when the findings of the stress test, after having been compared to thevalue of the specific item entered in the accounts of the Bank, should report a significant negative deviation(exceeding 10% of the value of the item).For CGUs, this method is identified as that of the so-called “market multiples” which, in the present case, isreferred to the price per branch relating to the most recent market transactions concerning the purchase andsale of bank branches.
Indemnity costs for the abandonment of leasehold properties are amortised at rates determined in proportion tothe duration of the corresponding rental contract (including renewal).
Criteria for the recognition of income statement components
Amortisation and impairment losses (if any) are recognised in the income statement under net adjustments to the
value of intangible assets.
Value adjustments relating to costs for restructuring of leasehold properties are recognised in the incomestatement under other operating expenses.
Derecognition criteria
Intangible assets are derecognised from assets on disposal or when future economic benefits are no longerexpected.
Current and deferred taxes
Income taxes for the period are calculated by estimating the tax charges on an accruals basis. In addition to
current taxes, determined in relation to the tax regulations in force, deferred taxes are also recognised, originating
as a result of the temporary differences which emerge between the balance sheet amounts recorded for financial
reporting purposes and those for taxation purposes. Therefore, taxes represent the current and deferred tax
balances related to the taxable income for the period.
Deferred tax assets are recognised when their recovery is probable, that is when it is expected that sufficient
taxable income can be made available in the future to recover the asset. They are recognised as assets in the
balance sheet under item 130 “Tax assets”.
Conversely, deferred tax liabilities are recognised as liabilities in the balance sheet under item 80 “Tax liabilities”.
Likewise, current taxes that have not yet been paid are separately recognised under item 80 “Current tax
liabilities”. In the event of excess payments on account, the receivable to be recovered is recognized under item
130 “Current tax assets”. Tax assets and liabilities are recognised in equity if relating to transactions recognised
directly in equity.Finally, it should be noted that Banco Desio, together with other Italian companies in the Group, has adopted theGroup’s national tax consolidation mechanism.
Reserve for employee termination indemnities

Notes to the financial statements
57
Measurement criteria
The reserve for employee termination indemnities is measured in the financial statements employing actuarial
calculation techniques.
Measurement is entrusted to independent external actuaries, employing the accrued benefit method using the
Projected Unit Credit Method. The amount thus determined represents the present value, calculated using
demographic-financial assumptions, of the benefits due to the employee (settlement of Employee Termination
Indemnity (TFR)) for the service accrued to date, obtained by re-proportioning the total present value of the
obligation to the period of service already rendered at the date of measurement, taking into account the likelihood
of resignations and advance requests.
Criteria for the recognition of income statement components
The provisions to the Employee Termination Indemnity (TFR), resulting from the actuarial valuation, inaccordance with the provisions of IAS 19, are registered against the valuation reserves as regards the actuarialprofit (loss) element, and against the profit and loss account under provisions as regards other elements such asinterest accrued in time (time-discounting) and the adjustment of the figures as at 31 December 2006 in light ofthe reform introduced with the 2007 Financial Act.
Reserves for risks and charges - Other provisions
Classification criteria
Reserves for risks and charges include the provisions made against present obligations that are the result of past
events, and it is probable that the settlement of these obligations will require the employment of economic
resources that can be reliably estimated.
The provisions reflect the best estimate of the future cash flows required to settle the present obligations at thebalance sheet date.
Measurement criteria
In cases in which the effect of time is a relevant aspect, the amounts provided are subject to discounting taking
into account the estimate of the maturity of the obligation. The discount rate reflects current assessments of the
time value of money, taking into account risks specific to the liability.
The valuation of seniority bonuses paid to staff is the responsibility of independent external actuaries and followsthe same calculation logic already described for the provision for Employee Termination Indemnities.
Criteria for the recognition of income statement components
Provisions are generally recognized in the income statement. Exceptions are the amounts set aside for employee
seniority bonuses, recorded as balancing entries to valuation reserves.
The effects deriving from the elapsing of time for discounting of future cash flows are recognised in the incomestatement under provisions.
Liabilities and securities issued
Classification criteria
This item includes the various types of deposits received by the Bank: amounts due to banks, amounts due to

Notes to the financial statements
58
customers, certified bond securities held on deposit or issued by the Bank itself.
Recognition criteria
These financial liabilities are recognised upon receipt of the amounts deposited or upon issue of the debtsecurities. Recognition is at fair value, equal to the amount collected, or at the issue price, adjusted by any initialcosts or income directly attributable to the individual issue.
Criteria for the measurement and recognition of income statement components
After initial recognition, financial liabilities are measured at amortised cost using the effective interest method, with
the contra-entry to the income statement.
Financial liabilities without amortisation plans are measured at cost.
Financial liabilities subject to fair value hedges are subject to the same measurement criteria as the hedging
instrument, limited to the changes in fair value, from the time of designation of the hedge, recognized in the
income statement. The fair value of hedge financial instruments is calculated through valuation techniques by
using elements present in the market (Level 2).
In the case of discontinuance of the hedging relationship, the difference between the fair value determined as at
the date of discontinuance and the amortised cost is charged to the income statement, spreading it over the
residual life of the financial instrument.
Securities issued by the Bank are shown net of any repurchases.
Derecognition criteria
Liabilities and securities issued are derecognised from the financial statements upon maturity, settlement or sale.
For securities issued, the part subject to repurchase is, in essence, settled. The reinvestment of the Bank’ssecurities previously repurchased is considered as a new issue at the selling value.
Financial liabilities held for trading
Classification criteria
This item comprises derivative instruments that are held for trading with a negative fair value.
Recognition criteria
Liabilities held for trading are recognised at fair value.
Criteria for the measurement and recognition of income statement components
Financial liabilities held for trading are measured at fair value and the effects are recognised in the income
statement.
Derivative instruments traded on active markets are valued at the closing price on the day of valuation (Level 1).
For derivative instruments, not traded on active markets, the pricing is made by employing valuation techniques
(Level 3).
Derecognition criteria
Financial liabilities are derecognised upon sale, maturity or settlement.
Financial liabilities at fair value through profit or loss
Classification criteria

Notes to the financial statements
59
This item includes financial liabilities at fair value through profit or loss.
Specifically, the item refers especially to the application of the so-called fair value option for “naturally hedged”
financial liabilities. The purpose of the fair value option is to improve the balance of the profit and loss effects of
the measurement of financial assets and liabilities.
Liabilities at fair value may be recognised through profit or loss in the following cases:
- the elimination or the reduction of measurement inconsistencies;
- the measurement of instruments containing embedded derivatives;
- the measurement of groups of financial assets or liabilities on the basis of documented risk management or
investment strategy.Bond issues including an embedded derivative or that are financially hedged are classified under this category.
Recognition criteria
These are recognised at fair value, which corresponds to the consideration collected or the issue price, as
adjusted by initial income or charges (if any) directly attributable to the individual issue.
Criteria for the measurement and recognition of income statement components
These are measured at fair value through profit or loss.Fair value is determined through valuation techniques which use parameters that can be observed in activemarkets (level 2). The method is the discounted cash flow method by using a zero-coupon curve made up ofelements present in the market, and applying a credit spread calculated using the euro swaps curve and thecurve of the yields of the securities issued by European banks with a rating equal to that of the Bank (Level 2).For subordinate bonds, a specific adjustment factor is also considered.
Derecognition criteria
Financial liabilities at fair value are derecognised upon sale, maturity or settlement.
Repurchases of own issues substantially entail the extinction of the part subject to repurchase. The re-placement
of own securities that have previously been repurchased is considered as a new issue at sale value.
Transactions in foreign currency
Recognition criteria
Foreign currency transactions are recorded in the accounts on their date of settlement, converting them intoEuros at the exchange rate in force on the operation date.
Measurement criteria
At the end of the accounting period the headings in the financial statements in foreign currency have been valuedas follows:
- monetary: conversion at the exchange rate in force at the date of the closure;
- non-monetary, valued at cost: conversion at the exchange rate in force at the date of the transaction;- non-monetary valued at fair value: conversion at the exchange rate in force at the date of closure.
Criteria for the recognition of income statement components
For monetary elements the effect of the valuation is assigned to the income statement.
For non-monetary elements whose profits and losses are recognized in the income statement, even exchangerate differences will be recorded in the income statement. If profits and losses are recognized in equity, exchange

Notes to the financial statements
60
rate differences will be recognized in equity as well.
Other information
Revaluation reserves
This item comprises the revaluation reserves on financial assets available for sale, derivative contracts hedgingfinancial flows, the revaluation reserves constituted in application of special laws in previous years and thereserves from actuarial valuation of the reserve for employee termination indemnities according to IAS 19.Additionally, the effects deriving from the application of fair value, as deemed cost, to tangible assets upon thefirst-time adoption of IAS/IFRS are also included.
Costs and revenues recognition
Revenues are recognized when they are earned or, in any case, when it is probable that future benefits will bereceived and that these benefits can be quantified reliably. In particular:- interest payments are recognised on a pro rata basis according to the contractual rate of interest or the actual
rate in the case of the application of amortised cost. The item interest receivable (or interest payable) alsoincludes the differentials or the positive (or negative) margins accrued from the reference date of the financialstatements in relation to financial derivative contracts:
a) to hedge assets or liabilities that generate interest;b) classified in the Balance Sheet in the trading portfolio, but connected from an operational point of view to
financial assets and/or liabilities valued at fair value (fair value option);c) connected operationally to assets and liabilities classified in the trading portfolio and which provide for the
settlement of differentials or margins with several expiry dates;- default interest, which may be provided for contractually, is accounted for in the Income Statement only when
it is actually collected;- dividends are charged to the Income Statement when a resolution is taken for their distribution;- commission on income from services is recorded, on the basis of contractual agreements, in the period in
which the actual services are provided;- income deriving from the brokering of financial trading instruments, which is determined by the difference
between the transaction price and the fair value of the instrument, is charged to the Income Statement whenthe transaction is recorded if the fair value can be determined from parameters or recent transactions thatcan be observed on the same market in which the instrument is traded. If these values cannot be easilyobtained or if they show reduced liquidity, the financial instrument is recorded at an amount equal to thetransaction price, without the sales margin; the difference against the fair value is charged to the IncomeStatement for the duration of the transaction with a gradual reduction, in the valuation model, of the correctivefactor connected to the reduced liquidity of the instrument; profits/losses deriving from the trading of financialinstruments are charged to the Income Statement when the sale is completed, on the basis of the differencebetween the consideration paid or collected and their carrying value;
- income deriving from the sale of non-financial assets is recorded when the sale is completed, unless themajority of the risks and benefits connected to the asset have been retained.
Costs are charged to the Income Statement in the period in which the relative income is accounted for. If theassociation between costs and income is generic and indirect, costs are recorded over several periods usingrational procedures and on a systematic basis. Costs that cannot be linked to income are immediately charged tothe Income Statement.
Finance leases
Assets under finance leases are shown as receivables at an amount corresponding to the net leasing investment.
Financial income is then recognised on the basis of methods that reflect a constant periodical rate of return.
A.3 - INFORMATION ON FAIR VALUE
A.3.1 Transfers between portfolios
The amendments to IAS 39 and IFRS 7 “Reclassification of financial assets” which were approved by the IASB in2008, allow certain financial assets to be reclassified out of the “held for trading” and “available for sale” portfoliossubsequent to their initial entry.

Notes to the financial statements
61
In particular, the following can be reclassified:- those financial assets held for trading or available for sale that would have fulfilled the definition laid down by
international accounting standards for the loans portfolio (if these assets had not been classified as held fortrading or available for sale respectively when they were initially recorded) if the business has the intentionand capacity to hold them for the foreseeable future or until their expiry;
- “only in rare circumstances” those financial assets held for trading that at the time of their being recorded didnot fulfil the definition of loans.
Banco Desio Brianza has not reclassified any items between portfolios.
A.3.2 Fair value hierarchy
A.3.2.1 Accounting portfolios: breakdown by level of fair value
Assets/Liabilities at fair value Level 1 Level 2 Level 3 Level 1 Level 2 Level 3
1. Financial assets held for trading 8,783 19 2,399 16,684 1,763 17,412
2. Financial assets at fair value
3. Available-for-sale financial assets 630,639 232,080 6,627 507,926 246,754 5,129
4. Hedging derivatives 5,631
Total 639,422 232,099 14,657 524,610 248,517 22,541
1. Financial liabilities held for trading 16 16 2,697 65 8 2,416
2. Financial liabilities at fair value 89,138 323,525
3. Hedging derivatives 2,684 2,653
Total 16 89,154 5,381 65 323,533 5,069
31/12/2011 31/12/2010
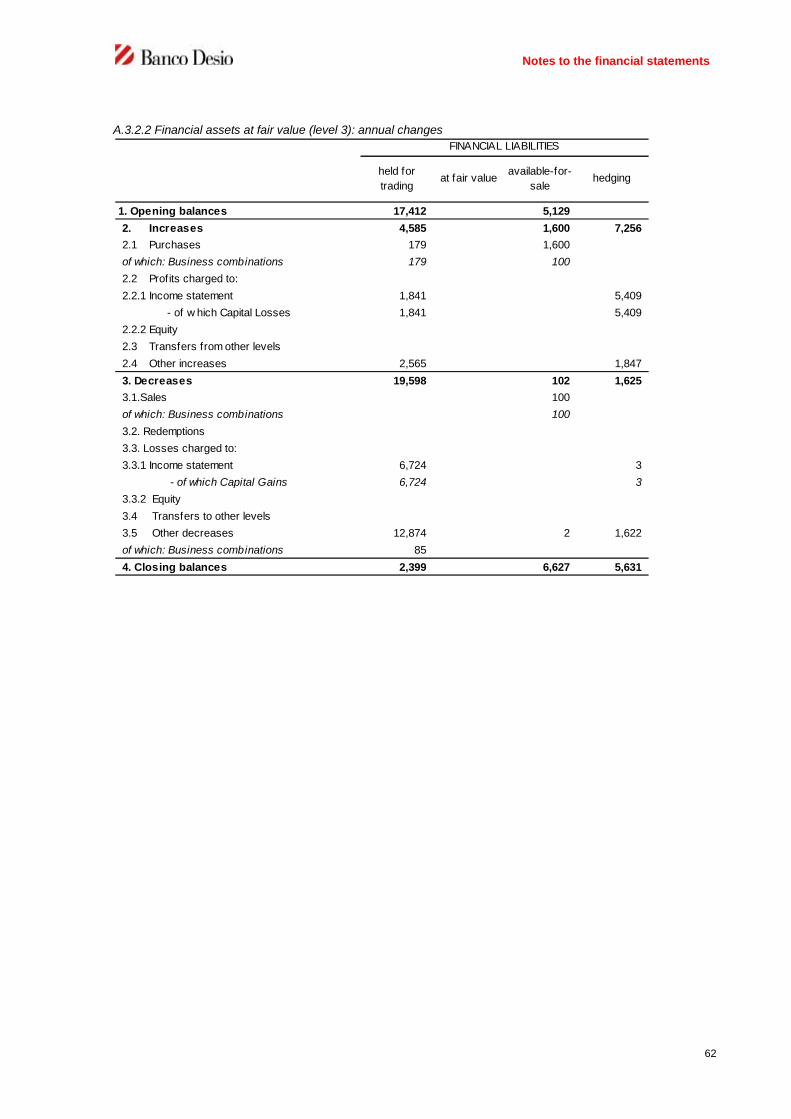
Notes to the financial statements
62
A.3.2.2 Financial assets at fair value (level 3): annual changes
held for
tradingat fair value
available-for-
salehedging
1. Opening balances 17,412 5,129
2. Increases 4,585 1,600 7,256
2.1 Purchases 179 1,600
of which: Business combinations 179 100
2.2 Profits charged to:
2.2.1 Income statement 1,841 5,409
- of w hich Capital Losses 1,841 5,409
2.2.2 Equity
2.3 Transfers from other levels
2.4 Other increases 2,565 1,847
3. Decreases 19,598 102 1,625
3.1.Sales 100
of which: Business combinations 100
3.2. Redemptions
3.3. Losses charged to:
3.3.1 Income statement 6,724 3
- of which Capital Gains 6,724 3
3.3.2 Equity
3.4 Transfers to other levels
3.5 Other decreases 12,874 2 1,622
of which: Business combinations 85
4. Closing balances 2,399 6,627 5,631
FINANCIAL LIABILITIES
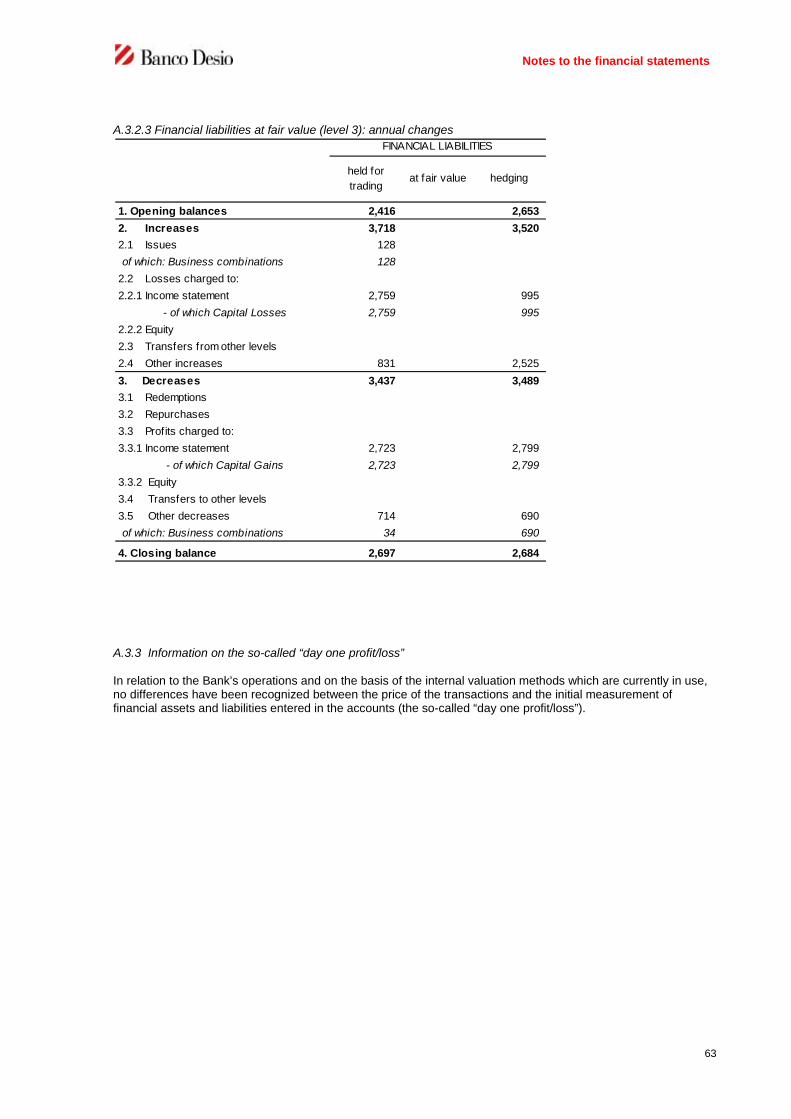
Notes to the financial statements
63
A.3.2.3 Financial liabilities at fair value (level 3): annual changes
A.3.3 Information on the so-called “day one profit/loss”
In relation to the Bank’s operations and on the basis of the internal valuation methods which are currently in use,no differences have been recognized between the price of the transactions and the initial measurement offinancial assets and liabilities entered in the accounts (the so-called “day one profit/loss”).
held for
tradingat fair value hedging
1. Opening balances 2,416 2,653
2. Increases 3,718 3,520
2.1 Issues 128
of which: Business combinations 128
2.2 Losses charged to:
2.2.1 Income statement 2,759 995
- of which Capital Losses 2,759 995
2.2.2 Equity
2.3 Transfers from other levels
2.4 Other increases 831 2,525
3. Decreases 3,437 3,489
3.1 Redemptions
3.2 Repurchases
3.3 Profits charged to:
3.3.1 Income statement 2,723 2,799
- of which Capital Gains 2,723 2,799
3.3.2 Equity
3.4 Transfers to other levels
3.5 Other decreases 714 690
of which: Business combinations 34 690
4. Closing balance 2,697 2,684
FINANCIAL LIABILITIES

Notes to the financial statements
64
Part B - INFORMATION ON THE BALANCE SHEET
ASSETS
SECTION 1 - CASH AND CASH EQUIVALENTS (caption 10)
1.1 Cash and cash equivalents : break-down
The counter-value of the component expressed in foreign currencies totals Euro 663 thousand (the aggregatedamount was Euro 704 thousand at the end of the previous period.
Total Total Total
31.12.2011 31.12.2010 31.12.2010
aggregate
a) Cash 24,897 19,948 23,880
b) Sight deposits at Central Banks - - -
Total 24,897 19,948 23,880

Notes to the financial statements
65
SECTION 2 - FINANCIAL ASSETS HELD FOR TRADING (caption 20)
2.1 Financial assets held for trading: break-down by type
This caption included securities held for trading together with the positive value of derivative contracts created fortrading purposes and those connected with the fair value option.
The counter-value of derivative instruments referring to banks of the Group amounts to Euro 1 thousand (Euro 3thousand at aggregated level last year).
L 1 L2 L 3 L 1 L 2 L 3 L 1 L 2 L3
A. Cash equivalents
1. Debt securities 8,594 16,274 1,748 16,274 1,748
1.1 Structured securities 145 145
1.2 Other debt securities 8,594 16,274 1,603 16,274 1,603
2. Equity securities 166 314 314
3. UCITS units
4. Financing
4.1 Repurchase
agreements assets
4.2 Other
Total (A) 8,760 - - 16,588 1,748 - 16,588 1,748 -
B. Derivative
1. Financial derivatives: 23 19 2,399 96 15 17,412 96 15 17,378
1.1 trading 23 19 830 96 15 1,469 96 15 1,435
1.2 connected with the
fair value option
1,569 15,943 15,943
1.3 other
2. Credit derivatives
2.1 trading
2.2 connected with the fair
value option
2.3 other
Total (B) 23 19 2,399 96 15 17,412 96 15 17,378
Total (A+B) 8,783 19 2,399 16,684 1,763 17,412 16,684 1,763 17,378
Total
31.12.2010 aggregateCaption/amount
Total Total
31.12.2011 31.12.2010

Notes to the financial statements
66
2.2 Financial assets held for trading: break-down by debtor/issuer
Total Total Total
31.12.2011 31.12.2010 31.12.2010
aggregate
A. CASH EQUIVALENTS
1. Debt securities 8,594 18,022 18,022
a) Governments and central banks 8,594 17,557 17,557
b) Other public entities
c) Banks - 465 465
d) Other issuers
2. Equity securities 166 314 314
a) Banks 166 314 314
b) Other issuers - - -
- insurance companies
- financial insitutions
- non-financial companies
- other
3. UCITS units
4. Financing - - -
a) Governments and central banks
b) Other public entities
c) Banks
d) Other entities
Total A 8,760 18,336 18,336
B. DERIVATIVE INSTRUMENTS
a) Banks - 16,916 16,844
- fair value 1,924 16,916 16,844
b) Customers - 607 645
- fair value 517 607 645
Total B 2,441 17,523 17,489
Total (A + B) 11,201 35,859 35,825
Caption /Amount

Notes to the financial statements
67
2.3 Cash financial assets held for trading: annual changes
Item “B.3 Other changes” includes profits from trading activities and from redemptions for a total of Euro 351thousand, of which Euro 253 thousand on debt securities and Euro 98 thousand on equity instruments, as well asinterest accrued, inclusive of the positive issue spreads, for an aggregate of Euro 78 thousand.
On the contrary, item “C.5 Other changes” includes losses from trading activities or from redemptions for a total ofEuro 241 thousand, of which Euro 88 thousand on debt securities and Euro 153 thousand on equity instruments;and the de-recognition of interest accrued at the end of the previous year amounting to Euro 37 thousand.
The results of the fair value changes of the trading portfolio, as reported under items “B.2 positive fair valuechanges” and “C.3 Negative fair value changes”, are recognised in the income statement under item 80 “Netprofits/(losses) on trading activities”, together with profits/losses from trading or redemptions.
SECTION 3 - FINANCIAL ASSETS MEASEURED AT FAIR VALUE (caption 30)
This item has a balance of nil in the periods of reference.
A. Opening balance 18,022 314 18,336
B. Increases 357,100 424,798 781,898
B.1 Purchases 173,466 212,227 385,693
B.2 Positive fair value changes 39 39
B.3 Other changes 331 98 429
C. Decreases 183,264 212,473 395,737
C.1 Sales 170,854 212,120 382,974
C.2 Redemptions 12,181 12,181
C.3 Negative fair value changes 104 200 304
C.4 Trasfers to other portfolios
C.5 Other changes 125 153 278
D. Closing balance 8,594 155 8,760
Debt
securities
Equity
securities
UCITS
unitsFinancing 2011
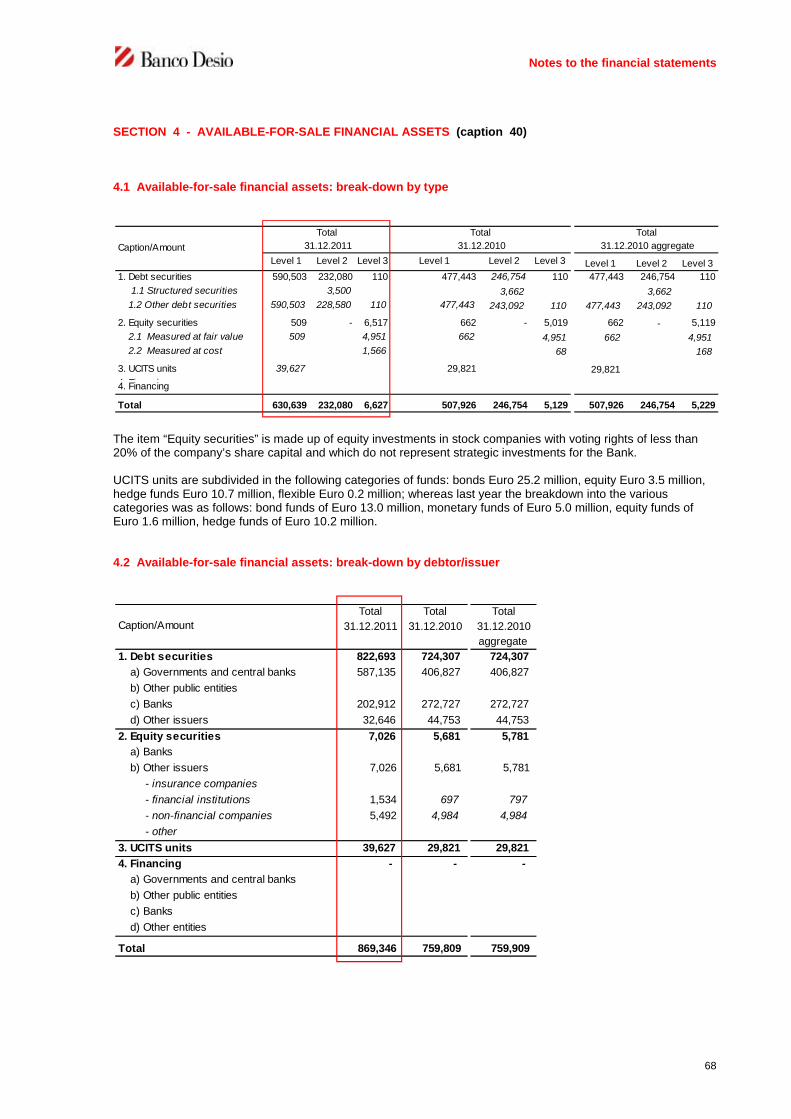
Notes to the financial statements
68
SECTION 4 - AVAILABLE-FOR-SALE FINANCIAL ASSETS (caption 40)
4.1 Available-for-sale financial assets: break-down by type
The item “Equity securities” is made up of equity investments in stock companies with voting rights of less than20% of the company’s share capital and which do not represent strategic investments for the Bank.
UCITS units are subdivided in the following categories of funds: bonds Euro 25.2 million, equity Euro 3.5 million,hedge funds Euro 10.7 million, flexible Euro 0.2 million; whereas last year the breakdown into the variouscategories was as follows: bond funds of Euro 13.0 million, monetary funds of Euro 5.0 million, equity funds ofEuro 1.6 million, hedge funds of Euro 10.2 million.
4.2 Available-for-sale financial assets: break-down by debtor/issuer
Level 1 Level 2 Level 3 Level 1 Level 2 Level 3 Level 1 Level 2 Level 3
1. Debt securities 590,503 232,080 110 477,443 246,754 110 477,443 246,754 110
1.1 Structured securities 3,500 3,662 3,662
1.2 Other debt securities 590,503 228,580 110 477,443 243,092 110 477,443 243,092 110
2. Equity securities 509 - 6,517 662 - 5,019 662 - 5,119
2.1 Measured at fair value 509 4,951 662 4,951 662 4,951
2.2 Measured at cost 1,566 68 168
3. UCITS units 39,627 29,821 29,821
4. Financing4. Financing
Total 630,639 232,080 6,627 507,926 246,754 5,129 507,926 246,754 5,229
Total
31.12.2010 aggregate31.12.2011 31.12.2010Caption/Amount
Total Total
Total Total Total
31.12.2011 31.12.2010 31.12.2010
aggregate
1. Debt securities 822,693 724,307 724,307
a) Governments and central banks 587,135 406,827 406,827
b) Other public entities
c) Banks 202,912 272,727 272,727
d) Other issuers 32,646 44,753 44,753
2. Equity securities 7,026 5,681 5,781
a) Banks
b) Other issuers 7,026 5,681 5,781
- insurance companies
- financial institutions 1,534 697 797
- non-financial companies 5,492 4,984 4,984
- other
3. UCITS units 39,627 29,821 29,821
4. Financing - - -
a) Governments and central banks
b) Other public entities
c) Banks
d) Other entities
Total 869,346 759,809 759,909
Caption/Amount

Notes to the financial statements
69
4.3 Available-for-sale financial assets: assets subject to specific hedging
4.4 Available-for-sale financial assets: annual changes
Items “B.2 Positive fair value changes” and “C.3 Negative fair value changes” represent capital gains/losses,inclusive of the relevant tax effect, recognised under Shareholders’ equity under item 130 “Valuation reserves”.
In relation to the section “Debt securities”, item “B.5 Other changes” includes:. interest accrued, including the positive issue spreads and the increase in the amortised cost, for an aggregate of
Euro 8.5 million, charged to the income statement under item 10 “Interest income on securities”;. income of Euro 1.4 million related to a valuation adjustment under hedge accounting, charged to the income
statement under item “90 Net profits (losses) on hedging activities”;. profits on trading activities for an aggregate of Euro 4.9 million, charged to the income statement under item 100
“Profit/(loss) on disposal or repurchase of financial assets available for sale”;On the other hand the item “C.6 Other changes” includes:
1. Financial assets subject to specific
hedging of fair value 14,245 -
a) interest rate risk 14,245
b) price risk
c) exchange risk
d) credit risk
e) other risk
2. Financial assets subject to specific
hedging of cash flows - -
a) interest rate risk
b) exchange risk
c) other
Total 14,245 -
Caption / Amount 31.12.2011 31.12.2010
A. Opening balance 724,307 5,681 29,821 - 759,809
B. Increases 654,631 1,634 17,080 - 673,345
B.1. Purchases 638,079 100 16,200 654,379
B.2. Positive fair value changes 100 100
B.3. Write-backs 1,718 786 2,504
- charged to statement of income
- charged to shareholders' equity
B.4. Transfer from other portfolios
B.5. Other increases 14,834 1,534 94 16,462
C. Decreases 556,243 290 7,275 - 563,808
C.1. Sales 407,894 100 6,678 414,672
C.2. Redemptions 102,309 102,309
C.3. Negative fair value changes 42,916 153 597 43,666
C.4. Impairment w rite-dow ns - - - -
- charged to statement of income
- charged to shareholders' equity
C.5. Transfers to other portfolios
C.6. Other decreases 3,124 37 - 3,161
D. Closing balance 822,695 7,025 39,626 - 869,346
2011Debt
securities
Equity
securities
UCITS
unitsFinancing
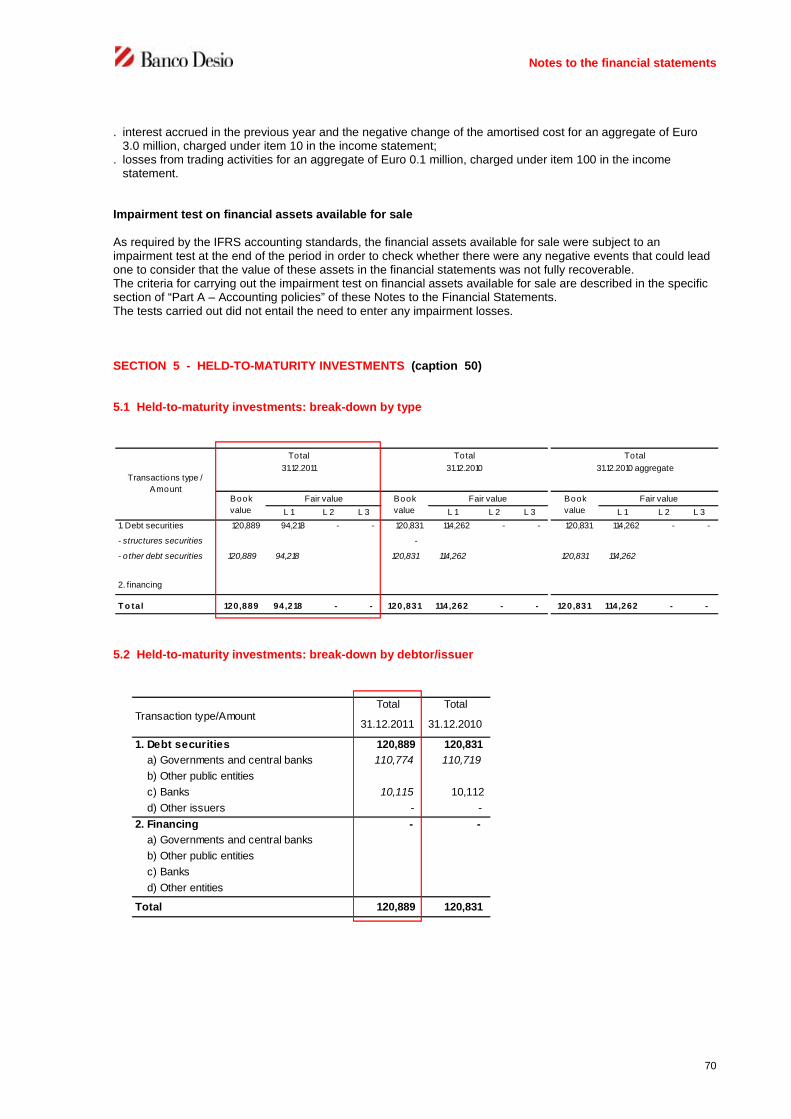
Notes to the financial statements
70
. interest accrued in the previous year and the negative change of the amortised cost for an aggregate of Euro3.0 million, charged under item 10 in the income statement;
. losses from trading activities for an aggregate of Euro 0.1 million, charged under item 100 in the incomestatement.
Impairment test on financial assets available for sale
As required by the IFRS accounting standards, the financial assets available for sale were subject to animpairment test at the end of the period in order to check whether there were any negative events that could leadone to consider that the value of these assets in the financial statements was not fully recoverable.The criteria for carrying out the impairment test on financial assets available for sale are described in the specificsection of “Part A – Accounting policies” of these Notes to the Financial Statements.The tests carried out did not entail the need to enter any impairment losses.
SECTION 5 - HELD-TO-MATURITY INVESTMENTS (caption 50)
5.1 Held-to-maturity investments: break-down by type
5.2 Held-to-maturity investments: break-down by debtor/issuer
L 1 L 2 L 3 L 1 L 2 L 3 L 1 L 2 L 3
1. Debt securities 120,889 94,218 - - 120,831 114,262 - - 120,831 114,262 - -
- structures securities -
- other debt securities 120,889 94,218 120,831 114,262 120,831 114,262
2. financing
T o tal 120,889 94,218 - - 120,831 114,262 - - 120,831 114,262 - -
Total
31.12.2010 aggregate
Book
value
Fair value
Transactions type /
Amount
Total
31.12.2011
Total
31.12.2010
Book
value
Book
value
Fair value Fair value
Total Total
31.12.2011 31.12.2010
1. Debt securities 120,889 120,831
a) Governments and central banks 110,774 110,719
b) Other public entities
c) Banks 10,115 10,112
d) Other issuers - -
2. Financing - -
a) Governments and central banks
b) Other public entities
c) Banks
d) Other entities
Total 120,889 120,831
Transaction type/Amount

Notes to the financial statements
71
5.3 Held-to-maturity investments: subject to specific hedging
At the balance sheet date there was a balance of nil for held-to-maturity investments subject to specific hedging.
5.4 Held-to-maturity financial assets: annual changes
Item B.4 “Other increases” is made up of Euro 1,567 thousand for accruals accrued at the end of the period andEuro 58 thousand for the portion of positive amortised cost accrued in the year, all of which was accounted for inthe income statement under item 10 “Interest income”.
On the contrary, item “C.5. Other decreases” is made up of Euro 1,565 thousand for accruals accumulated lastyear and Euro 2 thousand for the negative change in the amortised cost accrued in the period; the entry in theaccounts of the two elements entails a reduction in item 10 of the income statement.
Debt
securities
Financing2011
A. Opening balance 120,831 120,831
B. Increases 1,625 1,625
B.1 Purchases -
B.2 Write-backs
B.3 Transfer from other portfolios
B.4 Other increases 1,625 1,625
C. Decreases (1,567) (1,567)
C1. Sales
C2. Redemptions
C3. Value adjustments
C4. Transfers to other portfolios
C5. Other decreases (1,567) (1,567)
D. Closing balance 120,889 120,889

Notes to the financial statements
72
SECTION 6 - AMOUNTS DUE FROM BANKS (caption 60)
6.1 Amounts due from banks: break-down by type
The aggregate of credits expressed in foreign currencies amounts to Euro 59.8 million (Euro 44.6 million in theprevious year).
The intragroup relations outstanding at the end of the year come to 13.2 million (the aggregate amount was Euro47.5 million as at 31.12.2010), of which Euro 5.6 million for current accounts, Euro 7.5 million for other loans andEuro 0.1 million for restricted deposits.All accounts are regulated at arm’s length.
At the end of the year, the commitment to maintain the Compulsory reserve undertaken by Banco Desio for all theGroup banks amounted to Euro 86.1 million (Euro 24.5 million in the previous year)..
At the end of the year there were no impaired assets in amounts due from banks.
6.2 Amounts due from banks: assets subject to specific hedging
At the reference date there were no amounts due from banks subject to specific hedging.
6.3 Amounts due from banks: finance leases
Banco Desio has no amounts due from banks in connection with finance lease transactions.
Total Total Total
31.12.2011 31.12.2010 31.12.2010
aggregate
A. Amounts due from Central banks 29,371 69,384 69,384
1. Restricted deposits
2. Compulsory reserve 29,371 69,384 69,384
3. Repurchase agreements
4. Other
B. Amounts due from banks 137,645 330,061 203,388
deposits 31,328 135,211 68,404
2. Restricted deposits 73,281 75,692 70,490
3. Other financing 7,604 33,699 19,103
3.1 repurchase agreements
3.2 Finance leases
3.3 Other 7,604 33,699 19,103
4. Debt securities 25,432 85,459 45,391
4.1 Structured securities 25,432 25,358 25,358
4.2 Other debt securities - 60,101 20,033
Total (book value) 167,016 399,445 272,772
Total (fair value) 166,580 399,445 272,772
Transaction type/Amount

Notes to the financial statements
73
SECTION 7 - AMOUNTS DUE FROM CUSTOMERS (caption 70)
7.1 Amounts due from customers: break-down by type
The amounts due from customers shown relate to Euro 5,766.6 million of relations with resident clients and toEuro 8.2 million of relations with non-resident clients (Euro 4,861.9 million of relations with resident clients andEuro 24.0 million of relations with non-resident customers last year, respectively).
Currency exposures amount to a counter-value of Euro 27.2 million (Euro 6.0 million at the end of the previousyear).
Amounts due from Group Banco Desio companies amounted to Euro 187. 9 million (the aggregated amount wasEuro 109.5 million last year), of which Euro 187.5 million from the indirect subsidiary Fides S.p.a (the aggregatedamount was Euro 108.8 million as at 31.12.2010).
Section E of these Notes should be referred to for information regarding “Impaired assets” additional to thatprovided in the Report on Operations.
The fair value of credits reflects performing loans connected with medium and long term financing, the majorchanges of which refer to mortgages estimated at Euro 3,032.2 million, finance lease of Euro 620.4 million, creditcards, personal loans and loans on salary (“cessione del quinto”) for Euro 71.5 million.
The amount of item “8.e Other debt securities” represents the counter-value of capitalisation policies.
Performing Impaired Performing Impaired Performing Impaired
1. Current account 1,428,346 75,122 1,108,129 61,590 1,345,941 68,414
2. Repurchase agreements 3,583 1,522 1,522
3. Mortgage loans 2,776,999 138,598 2,283,316 88,148 2,739,597 93,089
4. Credit cards, personal loans and
loans on salary
66,941 3,875
87,393 3,292 87,662 3,292
5. Financial leases 576,355 21,272 598,102 17,944 598,102 17,944
6. Factoring 11,180 104 9,139 167 9,139 167
7. Other transactions 645,464 5,264 568,637 2,861 705,565 2,935
8. Debt securities 21,747 55,630 55,630
8.1 Structured secutities
8.2 Other debt securities 21,747 55,630 55,630
Total (book value) 5,530,615 244,235 4,711,868 174,002 5,543,158 185,841
Total (fair value) 5,834,472 244,235 4,954,916 174,002 5,826,007 185,841
Total
31.12.2011
Total
31.12.2010
aggregate
Total
31.12.2010Transactions type / Amount
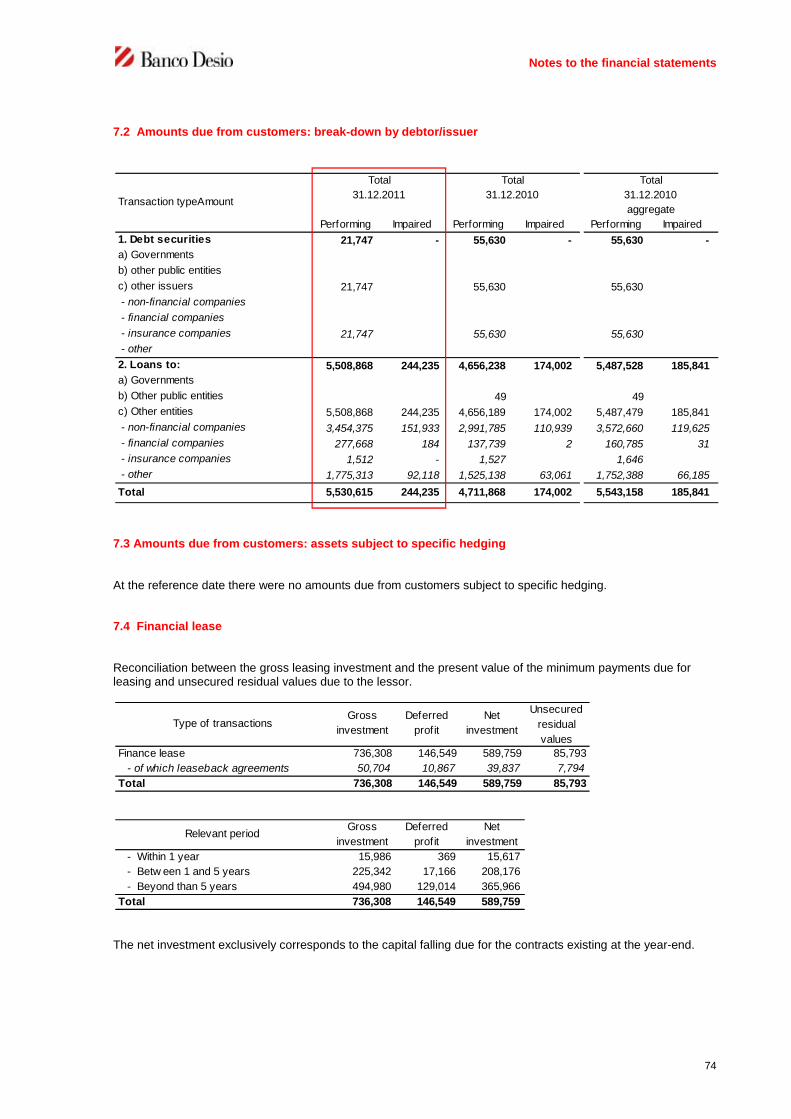
Notes to the financial statements
74
7.2 Amounts due from customers: break-down by debtor/issuer
7.3 Amounts due from customers: assets subject to specific hedging
At the reference date there were no amounts due from customers subject to specific hedging.
7.4 Financial lease
Reconciliation between the gross leasing investment and the present value of the minimum payments due forleasing and unsecured residual values due to the lessor.
The net investment exclusively corresponds to the capital falling due for the contracts existing at the year-end.
Performing Impaired Performing Impaired Performing Impaired
1. Debt securities 21,747 - 55,630 - 55,630 -
a) Governments
b) other public entities
c) other issuers 21,747 55,630 55,630
- non-financial companies
- financial companies
- insurance companies 21,747 55,630 55,630
- other
2. Loans to: 5,508,868 244,235 4,656,238 174,002 5,487,528 185,841
a) Governments
b) Other public entities 49 49
c) Other entities 5,508,868 244,235 4,656,189 174,002 5,487,479 185,841
- non-financial companies 3,454,375 151,933 2,991,785 110,939 3,572,660 119,625
- financial companies 277,668 184 137,739 2 160,785 31
- insurance companies 1,512 - 1,527 1,646
- other 1,775,313 92,118 1,525,138 63,061 1,752,388 66,185
Total 5,530,615 244,235 4,711,868 174,002 5,543,158 185,841
Total
31.12.2010
aggregateTransaction typeAmount
Total
31.12.2011
Total
31.12.2010
Finance lease 736,308 146,549 589,759 85,793
- of which leaseback agreements 50,704 10,867 39,837 7,794
Total 736,308 146,549 589,759 85,793
Type of transactionsGross
investment
Deferred
profit
Net
investment
Unsecured
residual
values
- Within 1 year 15,986 369 15,617
- Betw een 1 and 5 years 225,342 17,166 208,176
- Beyond than 5 years 494,980 129,014 365,966
Total 736,308 146,549 589,759
Relevant periodGross
investment
Deferred
profit
Net
investment

Notes to the financial statements
75
SECTION 8 - HEDGING DERIVATIVES (caption 80)
8.1 Hedging derivatives: breakdown by type of hedge and by level
KeyNV = Notional valueL1 = Level 1L2 = Level 2L3 = Level 3
8.2 Hedging derivatives: breakdown by portfolios hedged and by type of hedge
SECTION 9 - ADJUSTMENT TO VALUES OF FINANCIAL ASSETS SUBJECT TO SPECIFIC HEDGING(caption 90)
At the reference date there were no financial assets subject to specific hedging.
NV NV
L1 L2 L3 L1 L2 L3
A . F inancial d er ivat es 5,6 3 1 2 16 ,6 3 7
1) Fair value 5,631 216,637
2) Cash f low
3) Foreign investments
B . cred it d er ivat ives
1) Fair value
2) Cash f low
T ot al 5,6 3 1 2 16 ,6 3 7
31/12/2011 31/12/2010
Transactions/Hedging type
interest rate
riskexchange risk credit risk price risk other risk
1. Available-for-sale f inancial assets
2. Credits
3. Held-to-maturity financial assets
4. Port folio
5. Other t ransaction
Tot al asset s - - - - - - - - -
1. Financial liabilit ies 5,631
2. Port folio
Tot al l iab il it ies 5,6 3 1 - - - - - - - -
1. Expected set tlements
2. Financial assets and liabilit ies port folio
Fair V alue C ash f lows
Foreign
investments
Specif ic
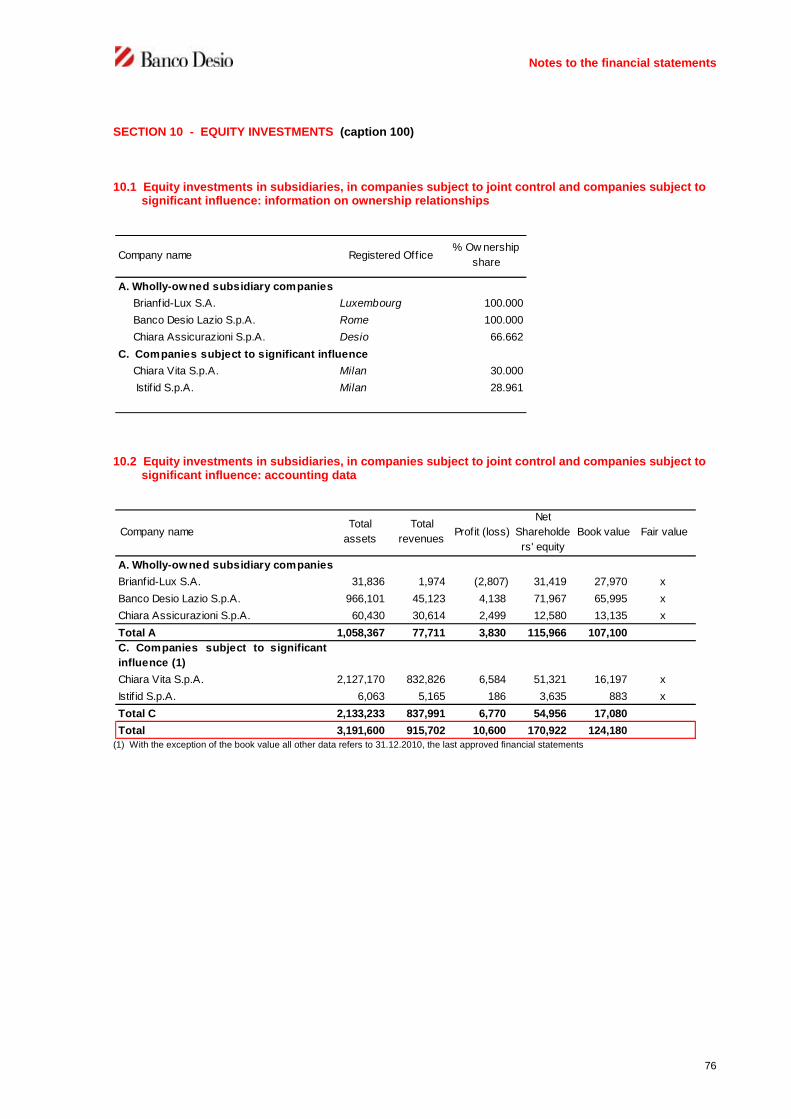
Notes to the financial statements
76
SECTION 10 - EQUITY INVESTMENTS (caption 100)
10.1 Equity investments in subsidiaries, in companies subject to joint control and companies subject tosignificant influence: information on ownership relationships
10.2 Equity investments in subsidiaries, in companies subject to joint control and companies subject tosignificant influence: accounting data
(1) With the exception of the book value all other data refers to 31.12.2010, the last approved financial statements
A. Wholly-owned subsidiary companies
Brianfid-Lux S.A. Luxembourg 100.000
Banco Desio Lazio S.p.A. Rome 100.000
Chiara Assicurazioni S.p.A. Desio 66.662
Chiara Vita S.p.A. Milan 30.000
Istif id S.p.A. Milan 28.961
Company name Registered Office% Ow nership
share
C. Companies subject to significant influence
Brianfid-Lux S.A. 31,836 1,974 (2,807) 31,419 27,970 x
Banco Desio Lazio S.p.A. 966,101 45,123 4,138 71,967 65,995 x
Chiara Assicurazioni S.p.A. 60,430 30,614 2,499 12,580 13,135 x
Total A 1,058,367 77,711 3,830 115,966 107,100
C. Companies subject to significant
influence (1)
Chiara Vita S.p.A. 2,127,170 832,826 6,584 51,321 16,197 x
Istif id S.p.A. 6,063 5,165 186 3,635 883 x
Total C 2,133,233 837,991 6,770 54,956 17,080
Total 3,191,600 915,702 10,600 170,922 124,180
A. Wholly-owned subsidiary companies
Net
Shareholde
rs' equity
Book value Fair valueCompany nameTotal
assets
Total
revenuesProfit (loss)
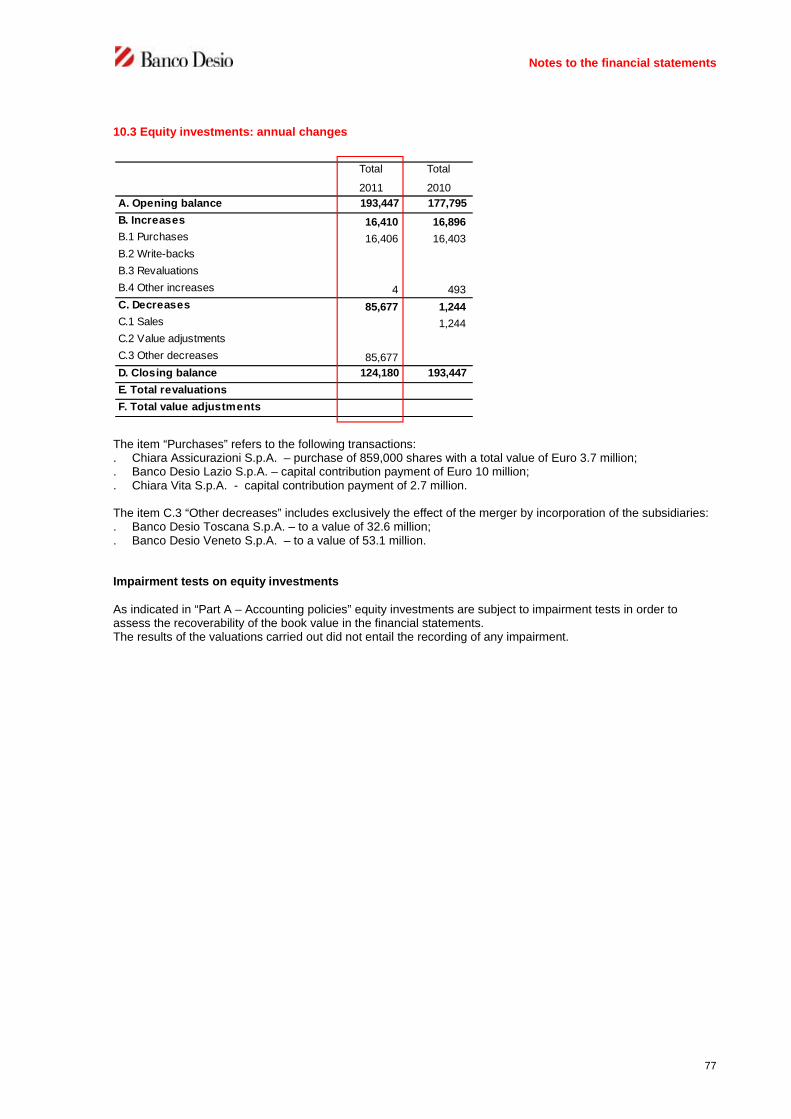
Notes to the financial statements
77
10.3 Equity investments: annual changes
The item “Purchases” refers to the following transactions:. Chiara Assicurazioni S.p.A. – purchase of 859,000 shares with a total value of Euro 3.7 million;. Banco Desio Lazio S.p.A. – capital contribution payment of Euro 10 million;. Chiara Vita S.p.A. - capital contribution payment of 2.7 million.
The item C.3 “Other decreases” includes exclusively the effect of the merger by incorporation of the subsidiaries:. Banco Desio Toscana S.p.A. – to a value of 32.6 million;. Banco Desio Veneto S.p.A. – to a value of 53.1 million.
Impairment tests on equity investments
As indicated in “Part A – Accounting policies” equity investments are subject to impairment tests in order toassess the recoverability of the book value in the financial statements.The results of the valuations carried out did not entail the recording of any impairment.
Total Total
2011 2010
A. Opening balance 193,447 177,795
B. Increases 16,410 16,896
B.1 Purchases 16,406 16,403
B.2 Write-backs
B.3 Revaluations
B.4 Other increases 4 493
C. Decreases 85,677 1,244
C.1 Sales 1,244
C.2 Value adjustments
C.3 Other decreases 85,677
D. Closing balance 124,180 193,447
E. Total revaluations
F. Total value adjustments

Notes to the financial statements
78
List of equity investments
(amounts in Euro units)
Equity investmentsNumber of
shares or
stakes
% ow nership
share
Nominal value Book value
Subsidiaries
BRIANFID-LUX S.A. 2,794,300 100.000 27,943,000 27,969,818
BANCO DESIO LAZIO S.p.A. 47,700,000 100.000 47,700,000 65,994,595
CHIARA ASSICURAZIONI S.p.A. 6,273,600 66.662 6,273,600 13,135,482
Total subsidiaries 81,916,600 107,099,895
Associated companies
ISTIFID S.p.A. (1) 419,937 28.961 419,937 883,370
CHIARA VITA S.p.A. 10,253,400 30.000 10,253,400 16,196,535
Total associated companies 10,673,337 17,079,905
Total equity investments 124,179,800
(1) of w hich 0.623% equal to no. 9,035 shares -bare property
(amounts in Euro units)
Equity investments
Number of
shares or
stakes
% ow nership
share
Nominal value Book value
Other (*)
Cedacri S.p.A. 643 5.100 643,000 4,951,100
First Capital S.p.A. 666,990 2.998 666,990 508,578
Be.Ve.Re.Co. S.r.l. 30,000 5.825 15,000 15,494
Carta Si 60,826 0.103 36,496 34,174
S.S.B. Società Servizi Bancari S.p.A. 51,491 0.030 6,694 3,640
Consorzio Bancario S.I.R. S.p.A. 882,939 0.057 883 274
S.W.I.F.T. - Bruxelles 10 0.011 1,250 5,572
Si.Te.Ba. 7,264 0.145 3,777 3,751
Sviluppo Brianza 1 0.698 2,462 2,613
AcomeA Sgr p.a. 50,000 9.091 500,000 1,500,000
7,025,196
(*) Equity investments recognised under item 40 "Financial assets available for sale"
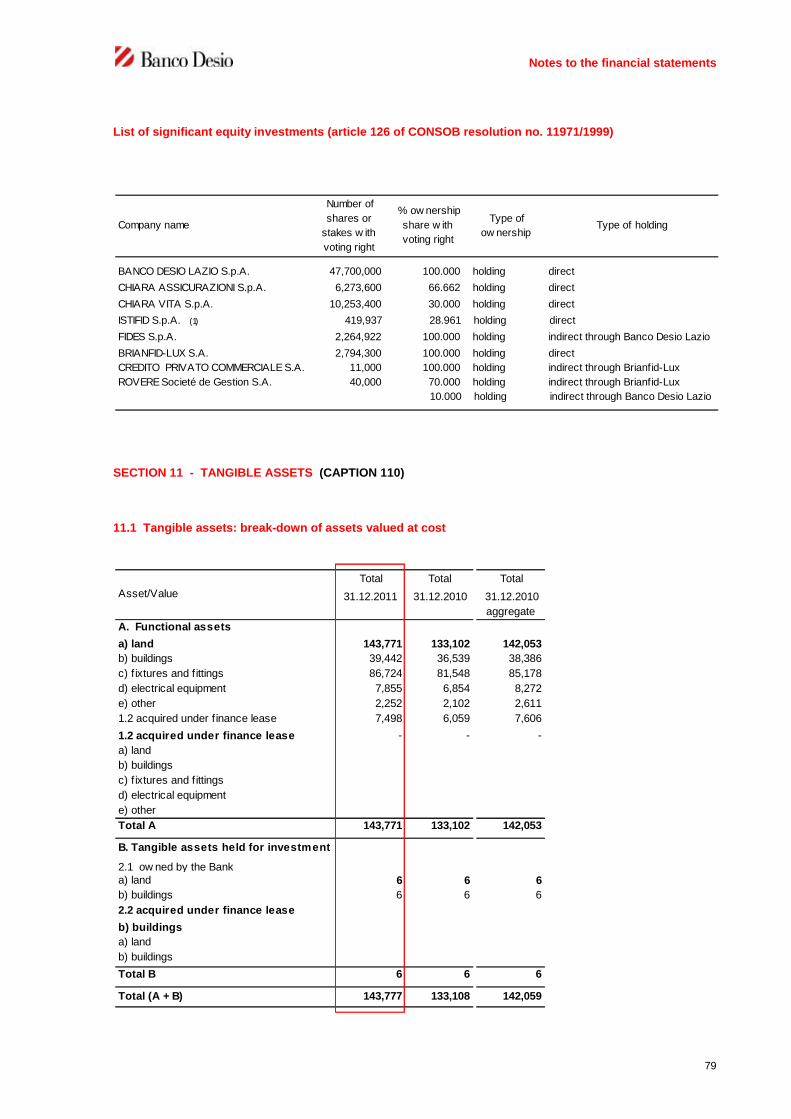
Notes to the financial statements
79
List of significant equity investments (article 126 of CONSOB resolution no. 11971/1999)
SECTION 11 - TANGIBLE ASSETS (CAPTION 110)
11.1 Tangible assets: break-down of assets valued at cost
Company name
Number of
shares or
stakes w ith
voting right
% ow nership
share w ith
voting right
Type of
ow nershipType of holding
BANCO DESIO LAZIO S.p.A. 47,700,000 100.000 holding direct
CHIARA ASSICURAZIONI S.p.A. 6,273,600 66.662 holding direct
CHIARA VITA S.p.A. 10,253,400 30.000 holding direct
ISTIFID S.p.A. (1) 419,937 28.961 holding direct
FIDES S.p.A. 2,264,922 100.000 holding indirect through Banco Desio Lazio
BRIANFID-LUX S.A. 2,794,300 100.000 holding direct
CREDITO PRIVATO COMMERCIALE S.A. 11,000 100.000 holding indirect through Brianfid-Lux
ROVERE Societé de Gestion S.A. 40,000 70.000 holding indirect through Brianfid-Lux
10.000 holding indirect through Banco Desio Lazio
Total Total Total
31.12.2011 31.12.2010 31.12.2010
aggregate
A. Functional assets
1.1 owned by the Banka) land 143,771 133,102 142,053
b) buildings 39,442 36,539 38,386
c) fixtures and fittings 86,724 81,548 85,178
d) electrical equipment 7,855 6,854 8,272
e) other 2,252 2,102 2,611
1.2 acquired under finance lease 7,498 6,059 7,606
1.2 acquired under finance lease - - -
a) land
b) buildings
c) fixtures and fittings
d) electrical equipment
e) other
Total A 143,771 133,102 142,053
B. Tangible assets held for investment
2.1 ow ned by the Banka) land 6 6 6
b) buildings 6 6 6
2.2 acquired under finance lease
a) landb) buildings
a) land
b) buildings
Total B 6 6 6
Total (A + B) 143,777 133,108 142,059
Asset/Value

Notes to the financial statements
80
The estimated useful life for the main categories of assets is defined as follows:-buildings: 50 years;-furniture for office use, fittings, systems and miscellaneous equipment;-office machines, armoured counters and security doors, alarm systems: 10 years; vehicles for business use: 8years;-terminals and PCs, motor vehicles for dual purpose: 4 years.
Within the individual categories, where required, some types of assets were identified to which different specifieduseful lives were assigned.
Depreciation is calculated on a straight line basis for all classes of tangible assets, with the exception of landwhich is not depreciated.
11.2 Tangible assets: break-down of assets at fair value or revalued
There were no tangible assets measured at fair value or revalued at the end of the period.

Notes to the financial statements
81
11.3 Tangible assets for business use: annual changes
Land and buildings have been valued based on the revalued amount as of 1 January 2004 upon first timeapplication of IASs. Once in operation, they have been valued at cost.Furniture, electronic systems and other tangible assets have been valued at cost.
The sale of tangible assets, of which item “C.1 Sales” represents the net carrying value of the assets disposed of,led to the recognition of profits on sales of Euro 48 thousand; and losses on sales of Euro 26 thousand.
11.4 Tangible assets held for investment: annual changes
During the year tangible assets held for investment recorded no changes.
Total
2011
A. Gross opening balance 36,539 91,728 27,051 17,510 32,902 205,730
A.1 Total net decreases in value 10,180 20,197 15,408 26,843 72,628
A.2 Net opening balance 36,539 81,548 6,854 2,102 6,059 133,102
B. Increases: 2,903 7,361 3,491 1,732 5,264 20,751
B.1 Purchases 2,903 5,116 3,417 1,672 4,473 17,581
of which: Business combinations 1,846 3,983 2,373 1,081 2,827 12,110
B.2 Capitalized improvement expenses 2,245 2,245
B.3 Write-backs
B.4 Positive fair value changes charged to:
a) shareholders' equity
b) statement of income
B.5 Positive exchange differences
B.6 Transfers from assets held for investment
B.7 Other increases 74 60 791 925
C. Decreases: - 2,185 2,490 1,582 3,825 10,082
C.1 Sales 351 1,031 637 2,126 4,145
of which: Business combinations 351 954
C.2 Amortization/depreciation 1,834 1,459 945 1,699 5,937
C.3 Value adjustments due to deterioration
charged to:
a) shareholders' equity
b) statement of income
C.4 Negative fair value changes charged to:
a) shareholders' equity
b) statement of income
C.5 Negative exchange differences
C.6 Transfers to:
a) tangible assets held for investment
b) assets being disposed of
C.7 Other decreases - - -
D. Net closing balance 39,442 86,724 7,855 2,252 7,498 143,771
D.1 Total net decreases in value 12,365 22,760 16,867 29,045 81,037
D.2 Gross closing balance 39,442 99,089 30,615 19,119 36,543 224,808
E. Valuation at cost
OtherLand BuildingsFixtures
and
Electronic
equipment

Notes to the financial statements
82
Statement of revaluations made on assets entered in the accounts (pursuant to Article 10 of Law No. 72 of19/3/1983
(amounts in Euro units)
T O T A L
Merger Voluntary
L. 576/75 L.72/83 L. 413/91 deficit revaluation
Properties
DESIO, via Rovagnati 937,369 6,844,273 7,781,642
CINISELLO P.zza Gramsci 1,173 1,173
CUSANO M.NO Via Matteotti 10,170 25,483 19,944 12,925 68,522
CANTU' Via Manzoni 22,884 185,972 1,321,713 1,530,569
CARUGATE Via XX Settembre 355 4,132 4,487
MILANO Via della Posta 189,958 51,645 241,603
NOVATE M.SE Via Matteotti 22,022 170,257 192,279
GIUSSANO Via dell'Addolorata 26,067 26,067
MEDA Via Indipendenza 51,616 51,616
MONZA Corso Milano 227,521 227,521
BOVISIO Via Garibaldi 26,357 26,357
PADERNO DUGNANO Via Casati 24,339 24,339
LEGNANO Corso Garibaldi 176,676 176,676
SOVICO Via G. da Sovico 62,703 62,703
T O T A L 10,170 985,736 7,858,976 1,491,970 68,702 10,415,554
Monetary revaluations Economic revaluations

Notes to the financial statements
83
PROPERTY OWNED BY THE BANK(excluding properties under financial lease)
Location Surface area for Net book
off ices (sqm) value
(thousands of euros)
ALBINO Viale Libertà 23/25 332 735
ARCORE Via Casati, 7 362 595
BAREGGIO Via Falcone, 14 200 297
BESANA BRIANZA Via Vittorio Emanuele, 1/3 625 876
BOLOGNA SANTA VIOLA Via Della Ferriera, 4 200 1,058
BOVISIO MASCIAGO Via Garibaldi, 8 382 452
BRESCIA Via Verdi, 1 530 1,894
BRESCIA 1° piano Via Verdi, 1 190 1,145
BRIOSCO Via Trieste, 14 430 441
BRUGHERIO Viale Lombardia, 216/218 425 1,361
BUSTO ARSIZIO Via Volta, 1 456 1,049
CADORAGO Via Mameli, 5 187 316
CANTU' Via Manzoni, 41 1,749 2,348
CARATE BRIANZA Via Azimonti, 2 773 1,042
CARUGATE Via XX Settembre, 8 574 656
CARUGO Via Cavour, 2 252 395
CASTELLANZA Corso Matteotti, 18 337 447
CESANO MADERNO Corso Roma, 15 692 923
CHIAVARI Piazza Matteotti 68 1,065
CINISELLO BALSAMO Via Frova, 1 729 967
CINISELLO BALSAMO Piazza Gramsci 26 16
COLOGNO MONZESE Via Cavallotti, 10 128 51
CUSANO MILANINO Viale Matteotti, 39 522 728
DESIO Piazza Conciliazione, 1 1,694 2,225
DESIO Via Rovagnati, 1 20,032 29,969
DESIO Via Volta 238 616
EMPOLI Via Masini, 58 448 1,744
GARBAGNATE Via Varese, 1 400 1,294
GIUSSANO Via Addolorata, 5 728 992
LECCO Via Volta 615 1,785
LEGNANO Corso Italia, 8 1,545 2,856
LISSONE Via San Carlo, 23 583 1,455
MEDA Via Indipendenza, 60 678 857
MILANO Via della Posta, 8 1,912 7,868
MILANO Via Foppa 223 829
MILANO Via Menotti 825 3,094
MILANO Via Moscova 668 5,476
MILANO Via Trau' 627 3,331
MILANO P.za De Angeli 385 2,326
MISINTO Piazza Mosca, 3 330 383
MODENA Via Saragozza, 130 720 4,517
MONZA Via Manzoni, 37 397 768
MONZA Corso Milano, 47 2,143 4,141
MONZA Via Rota, 66 330 586
MONZA P.za S. Paolo 496 3,940
NOVA MILANESE Piazza Marconi, 5 526 726

Notes to the financial statements
84
11.5 Commitments for purchase of tangible assets
There were no commitments for purchase of tangible assets at the financial statements date.
Location Surface area for Net book
off ices (sqm) value
(thousands of euros)
NOVATE MILANESE Via Matteotti, 7 462 691
ORIGGIO Largo Croce, 6 574 809
PADOVA Via Matteotti, 20 550 3,654
PALAZZOLO MILANESE Via Monte Sabotino, 1 605 629
PIACENZA Via Vittorio Veneto,67/a 486 1,525
REGGIO EMILIA Via Terrachini,1 ang. Via Risorgimento 713 2,812
RENATE Piazza don Zanzi, 2 429 691
RHO Via Martiri Libertà, 3 410 759
RUBIERA Via Emilia Ovest, 7 310 1,467
SARONNO Via Rimembranze, 42 530 784
SEGRATE Via Cassanese, 200 170 308
SEREGNO Via Trabattoni, 40 1,233 2,184
SESTO SAN GIOVANNI Piazza Oldrini 377 847
SEVESO Via Manzoni 382 1,158
SOVICO Via Frette, 10 673 1,140
TORINO Via Filadelf ia, 136 370 1,772
VAREDO Via Umberto I°, 123 501 557
VEDUGGIO Via Vittorio Veneto, 51 257 258
VERANO BRIANZA Via Preda, 17 322 415
VIGEVANO Via Decembrio, 21 480 2,074
VIMERCATE Via Milano 6 338 996
Sub total 56,884 126,165
P ro pert ies fo r investment purpo ses
MEDA car parking Via Indipendenza, 60 15 6
Sub total 15 6
Total 56,899 126,171

Notes to the financial statements
85
SECTION 12 - INTANGIBLE ASSETS (caption 120)
12.1 Intangible assets: break-down by type of asset
Goodwill and as a result assets with an indefinite useful life are represented by the amalgamation of the goodwillarising from the initial transaction for the transfer of branches to Banco Desio Toscana and from the deficitrelating to the merger of the subsidiary.Intangible assets with an indefinite useful life are subject to an impairment test at least once a year and inparticular in order to draw up the financial statements or in any case when certain circumstances arise that wouldimply a reduction in value.The valuation technique is based on the determination of the “value in use” of the CGU (cash-generating unit)which is made up directly of the entire “business unit” of the branch network of the former Banco Desio Toscanaand compared with the amount of goodwill as above equal to a total of Euro 5.3 million.The calculation of the “value in use” is obtained by estimating the following factors:a) future incoming and outgoing cash flows that derive from the continuous use of the CGU and from its
“hypothetical” final disposal;b) appropriate discount rate (WACC – Weighted Average Cost of Capital) applied to the incoming and outgoing
cash flows.
Other intangible assets have been amortized on a straight-line basis according to their useful life, that forindemnities for abandonment of premises is estimated to be equal to the lease term, being equal to 4 years forsoftware associated with machines and to 5 years for application software.
Definite
duration
Indefinite
duration
Definite
duration
Indefinite
duration
Definite
duration
Indefinite
duration
A.1 Goodw ill x 6,958 x 1,729 x 6,958
A.2 Other intangible assets: 1,426 1,086 1,104
A.2.1 Assets valued at cost: 1,426 1,086 1,104
a) Intangible assets generated
internally
b) Other assets 1,426 1,086 1,104
A.2.2 Assets at fair value through
profit or loss:
a) Intangible assets generated
internally
b) Other assets
Total 1,426 6,958 1,086 1,729 1,104 6,958
Total
31.12.2010
aggregate
Total
Caption/Value31.12.2011
Total
31.12.2010

Notes to the financial statements
86
12.2 Intangible assets: annual changes
Total
definite
duration
indefinite
duration
definite
duration
indefinite
duration
2011
A. Opening balance 3,458 - - 3,911 7,369
A.1 Total net decreases in value 1,729 2,825 4,554
A.2 Net opening balance 1,729 - - 1,086 - 2,815
B. Increases 5,229 - - 959 - 6,188
B.1 Purchases 5,229 959 6,188
of which: Business combinations 5,229 18 5,247
B.2 Increases in internal intangible assets
B.3 Write-backs
B.4 Increases in fair value charged to:
- shareholders' equity- shareholders' equity
- statement of income- statement of income
B.5 Positive exchange differences
B.6 Other increases
C. Decreases 0 0 0 619 0 619
C.1 Sales
C.2 Adjustments 584
- Amortization 584
- Write-dow ns
+ shareholders' equity
+ statement of income
C.3 Decreases in fair value charged to:
- shareholders' equity
- statement of income
C.4 Transfers to non-current assets held for
sale and discontinued operations
C.5 Negative exchange differences
C.6 Other decreases 35 35
D. Net Closing balance 6,958 - - 1,426 - 8,384
D.1 Total net adjustments 2,008 2,969 4,977
E. Gross closing balance 8,966 - - 4,395 - 13,361
F. Valuation at cost
Other intangible
assets: generated
internally
Other intangible
assets: others
Goodw
ill

Notes to the financial statements
87
SECTION 13 - TAX ASSETS AND LIABILITIES (caption 130 under assets and caption 80 under liabilities)
Tax assets and liabilities resulting from the application of “deferred taxation” are calculated by applying to thetemporary differences, generated in connection with the discrepancies between statutory and tax provisions, thetheoretical tax rates in force at the moment of their settlement.
13.1 Deferred tax assets: break-down
Tax assets and liabilities resulting from the application of “deferred taxation” are calculated by applying to thetemporary differences, generated in connection with the discrepancies between statutory and tax provisions, thetheoretical tax rates in force at the moment of their settlement.The assessment of the probabilities of recovering the deferred tax assets was carried out on the basis of theinformation available which was an estimate of forecast taxable incomes deduced from the 2012-2013 StrategicPlan. In these two financial years the recovery of the deferred tax assets should amount to around Euro 6.7million.
Total
31.12.2011 31.12.2010 31.12.2010
aggregate
a) against profit and loss
tax losses 185
w ritedow ns of loans to customers deductible on a
straight-line basis 24,707 24,707 21,859 22,613
provisions for risks from implicit loan losses 305 305
w rite-dow n of loans to customers outstanding as at
31.12.1994 9 9 10 10
goodw ill deductible for tax purposes 679
statutory depreciation of properties 1
statutory depreciation of tangible assets 161 161 119 151
provisions for guarantees and commitments/country
risk 244 244 299 322
provisions for personnel charges 2,796 2,796 1,919 2,054
provisions for legal disputes 1,504 1,504 1,630 1,648
provisions for revocatory actions 924 924 793 793
provision for sundry charges 87 87 91 91
tax provision for employee termination indemnities 294 294 251 251
entertainment expenses, w ithin the limit of one third
deductible in the follow ing four financial years 9 9
other general expenses deductible in the follow ing
accounting period 35 35 60 63
Total a) 31,066 - 31,066 27,040 29,175
b) against Equity
tax provision for employee termination indemnities 556 556 505 523
w ritedow n of securities classif ied AFS 14,643 2,997 17,640 4,283 4,283
w rite-dow n of equity investments 10 10 1 1
Total b) 15,199 3,007 18,206 4,789 4,807
Total 46,265 3,007 49,272 31,829 33,982
Temporary Differences ires irap

Notes to the financial statements
88
13.2 Deferred tax assets: break-down
13.3 Change in deferred tax assets (against profit and loss)
The item 3.3 “Other decreases” refers to the cancellation of deferred tax assets:. to the value of Euro 43 thousand due to the effect of recalculating the deferred tax assets at 31.12.2010,
determined while preparing the tax return, which related to entries concerning the write-down of loans andreceivables;
. to the value of Euro 679 thousand due to the effect of the reversal of the deferred tax assets recorded during thetransaction for the redemption of the tax value of the goodwill, carried out in the 2009 financial year by the
Total Total
31.12.2011 31.12.201031.12.2010
aggregate
a) against Profit and Loss
gains on disposal of tangible assets 19 19 42 42
tax amortization of properties 7,061 1,106 8,167 8,088 8,096
tax amortization of tangible assets 22 22 23 24
tax amortization of goodw ill 417 84 501 298 405
tax amortization on long-term charges
(softw are) 2 7 9 8 8
tax provision for employee termination indemnities - 9
Total a) 7,499 1,219 8,718 8,459 8,584
b) against Equity
revaluation of AFS securities 563 114 677 209 209
revaluation of equity investments 2 10 12 10 10
tax provision for employee termination indemnities 195 195 156 156
Total b) 760 124 884 375 375
Total 8,259 1,343 9,602 8,834 8,959
Temporary Differences ires irap
Total Total
31.12.2011 31.12.2010
1. Initial amount 27,040 24,186
2. Increases2.1 Deferred tax assets recognized 8,500 6,301
a) from previous years 6,366 6,237
b) due to adoption of different accounting
c) w rite-backs
d) other
2.2 New taxes or increases in fiscal rates 6,366 6,237
2.3 Other increases 2,134 64
of which: Business combinations 2,134
3. Decreases 4,474 3,447
3.1 Deferred tax assets cancelled during the 3,752 3,447
a) reallocation 3,752 3,447
b) w rite-dow ns due to
irrecoverability
c) different accounting standards
d) other
3.2 Decreases in fiscal rates
3.3 Other decreases 722
4. Final amount 31,066 27,040

Notes to the financial statements
89
merged company Banco Desio Veneto S.p.A, pursuant to article 15, paragraph 10, of Decree Law no.185/2008.
13.4 Change in deferred tax liabilities (against profit and loss)
13.5 Change in deferred tax assets (against equity)
Total Total
31.12.2011 31.12.2010
1. Initial amount 8,459 8,502
2. Increases 374 62
2.1 Deferred tax liabilities recognized during the year 86 62
a) from previous years
b) due to adoption of different accounting standards
c) other 86 62
2.2 New taxes or increases in fiscal rates 162
2.3 Other increases 126
of which: Business combinations 126
3. Decreases 115 105
3.1 Deferred tax liabilities cancelled during the year 115 105
a) reallocation 115 105
b) due to adoption of different accounting standards
c) other
3.2 Decreases in fiscal rates
3.3 Other decreases
4. Final amount 8,718 8,459
Total Total
31.12.2011 31.12.2010
1. Initial amount 4,789 2,006
2. Increases2. Increases 14,457 3,972
2.1 Deferred tax assets recognized during
the year14,359 3,972
a) from previous years
b) due to adoption of different
accounting standardsc) other 14,359 3,972
2.2 New taxes or increases in fiscal rates 79
2.3 Other increases 19
of which: Business combinations 19
3. Decreases 1,040 1,189
3.1 Deferred tax assets cancelled during the
year1,040 1,189
a) reallocation 1,040 1,189
b) w rite-dow ns due to irrecoverability
c) due to adoption of different
accounting standardsd) other
3.2 Decreases in fiscal rates
3.3 Other decreases
4. Final amount 18,206 4,789
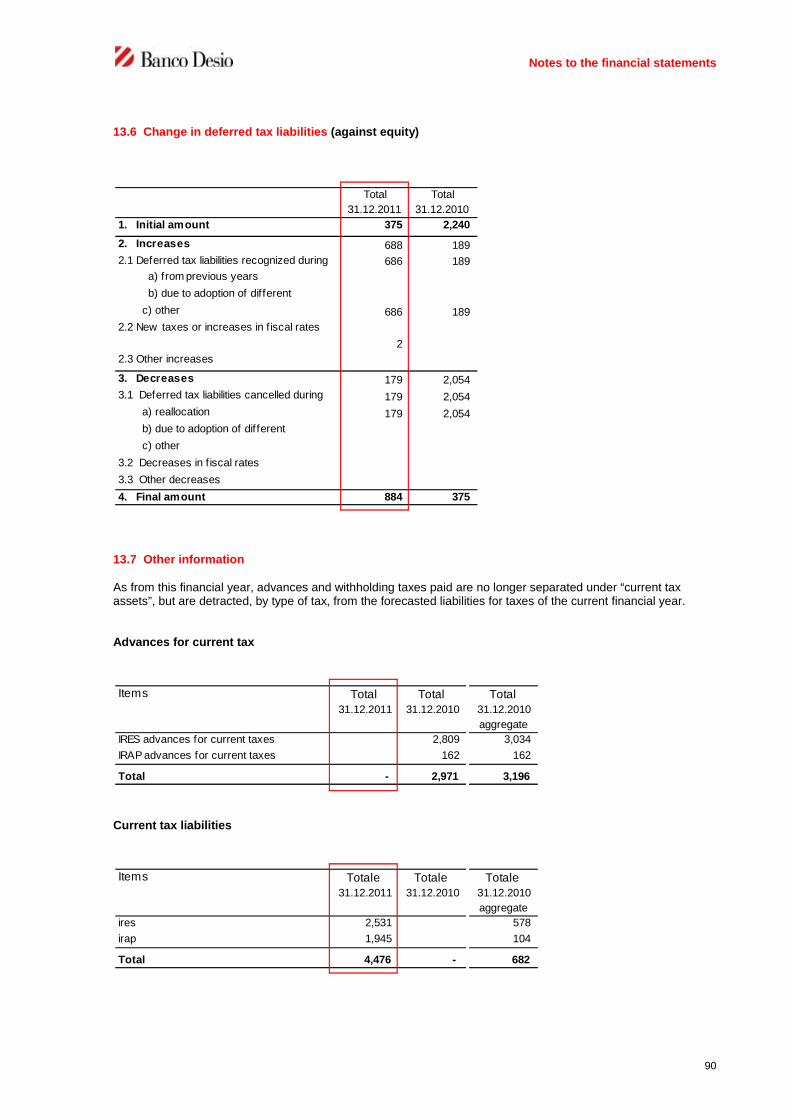
Notes to the financial statements
90
13.6 Change in deferred tax liabilities (against equity)
13.7 Other information
As from this financial year, advances and withholding taxes paid are no longer separated under “current taxassets”, but are detracted, by type of tax, from the forecasted liabilities for taxes of the current financial year.
Advances for current tax
Current tax liabilities
Total Total
31.12.2011 31.12.2010
1. Initial amount 375 2,240
2. Increases 688 189
2.1 Deferred tax liabilities recognized during 686 189
a) from previous years
b) due to adoption of different
accounting standardsc) other 686 189
2.2 New taxes or increases in fiscal rates
2
2.3 Other increases
3. Decreases 179 2,054
3.1 Deferred tax liabilities cancelled during
the year179 2,054
a) reallocation 179 2,054
b) due to adoption of different
accounting standardsc) other
3.2 Decreases in fiscal rates
3.3 Other decreases
4. Final amount 884 375
Total Total Total31.12.2011 31.12.2010 31.12.2010
aggregate
IRES advances for current taxes 2,809 3,034
IRAP advances for current taxes 162 162
Total - 2,971 3,196
Items
Totale Totale Totale31.12.2011 31.12.2010 31.12.2010
aggregate
ires 2,531 578
irap 1,945 104
Total 4,476 - 682
Items

Notes to the financial statements
91
Tax dispute
On 16 December 2011 the Regional Tax Office of Lombardy provided the Bank with notice of a tax assessmentrelating to the 2006 financial year and concerning the IRES, IRAP and VAT taxes.
The findings regarding the IRES and IRAP taxes mainly referred to adjustments highlighted in the tax audit reportdrawn up at the end of the tax audit carried out by the same Office in 2009. The irregularities found mostly refer tocosts deemed not connected or not relevant to the Bank’s business income.
The irregularity found in relation to VAT concerns the failure to tax the fees charged to Anima SGRpA for theservice relating to the appointment as depository bank. These fees, charged to the management company withthe application of a VAT exemption, ought to have been subject to VAT of 20% in the opinion of the Tax Authority.
As a result of the adjustments, the office imposed the penalties detailed below on the Bank:
In objection to the findings, the Bank submitted a tax settlement proposal.
In view of the findings, a provision for risks and charges of Euro 400 thousand was made to cover the presumedhigher taxes and sanctions payable in relation to the IRES and IRAP findings.No provision was made on the other hand as regards the VAT findings, which are considered completelygroundless.
Tax audits in progress
It should be noted that the Italian Finance Police initiated a tax audit on 14 December 2011 with reference todirect taxes for the years 2007, 2008, 2009, 2010 and 2011.
higher tax interest sanctions Total
Ires 496 71 645 1,212
Irap 70 10 80
Iva 981 147 1,913 3,041
Total 1,547 228 2,558 4,333

Notes to the financial statements
92
SECTION 15 - OTHER ASSETS (caption 150)
15.1 Other assets: break-down
The increase in the item “Tax credits – capital quota” mainly concerns the credit claimed for the reimbursement ofEuro 336 thousand as a result of the cancellation of the substitute tax applied in the transaction for theredemption of the tax value of the goodwill carried out in the 2009 tax year pursuant to article 15, paragraph 10, ofDecree Law no. 185/2008 by the merged company Banco Desio Veneto S.p.A. The amount is partiallycounterbalanced, to the value of Euro 679 thousand, by the cancellation of deferred tax credits, as already shownin table 13.3.
The changes in “Amounts due from tax authorities for paid advances” mainly involve:. the decrease of the withholdings on interest on deposits and current accounts of Euro 3,435 thousand, against
the use of the 2009 credit taken as a reduction in the amount of the taxes actually withheld in 2011;. the increase in the credit for the online payment of stamp duty of Euro 2,167 thousand, due to the increase in
the amount of stamp duty on account statements for securities introduced by Decree Law no. 98/2011.
The leasehold improvement expenses also include the costs incurred during the period which amount to Euro 2.9million, in relation to the consideration paid for the granting of leasehold rights on municipal land and theexpenses incurred for the construction of an underground car park, as well as adjustment of the surface area.The expenses referred to leaseholds improvements are subject to annual amortisation as regards the residualterm of the lease agreement.
The caption includes assets, almost exclusively for invoices to be settled by or issued to other companies in theGroup, for a total amount of Euro 1,314thousand (the aggregate amount last year was Euro 751 thousand lastyear).
Total Total Total
31.12.2011 31.12.2010 31.12.2010
aggregate
Tax credits
. Capital quota 414 41 41
Amounts due from tax authorities for paid advances 9,170 10,535 12,140
Taxes w ithheld - 13 15
Traded cheques to be settled 20,912 13,074 16,241
Guarantee deposits
Invoices issued to be collected 792 76 76
Accounts receivable for third-party securities and coupons to be collected49
Unprocessed transactions and amounts in
transit w ith bank branches 23,887 15,102 17,216
Currency spreads on portfolio transactions 48 - -
Investments in supplementary termination
indemnities for personnel 674 758 758
Leasehold improvements 20,496 14,191 18,275
Accrued income and prepaid expenses 1,440 421 483
Other items 14,219 7,228 6,849
Total 92,101 61,439 72,094
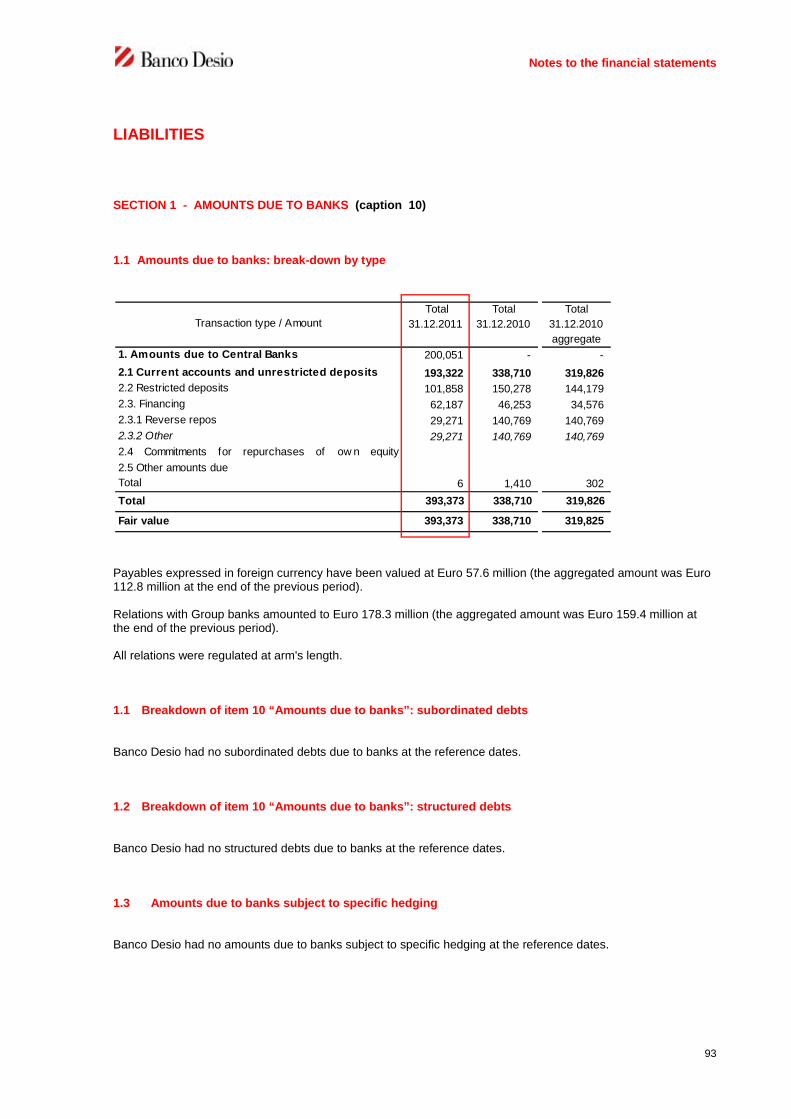
Notes to the financial statements
93
LIABILITIES
SECTION 1 - AMOUNTS DUE TO BANKS (caption 10)
1.1 Amounts due to banks: break-down by type
Payables expressed in foreign currency have been valued at Euro 57.6 million (the aggregated amount was Euro112.8 million at the end of the previous period).
Relations with Group banks amounted to Euro 178.3 million (the aggregated amount was Euro 159.4 million atthe end of the previous period).
All relations were regulated at arm's length.
1.1 Breakdown of item 10 “Amounts due to banks”: subordinated debts
Banco Desio had no subordinated debts due to banks at the reference dates.
1.2 Breakdown of item 10 “Amounts due to banks”: structured debts
Banco Desio had no structured debts due to banks at the reference dates.
1.3 Amounts due to banks subject to specific hedging
Banco Desio had no amounts due to banks subject to specific hedging at the reference dates.
Total Total Total
31.12.2011 31.12.2010 31.12.2010
aggregate
1. Amounts due to Central Banks 200,051 - -
2. Amounts due to banks2.1 Current accounts and unrestricted deposits 193,322 338,710 319,826
2.2 Restricted deposits 101,858 150,278 144,179
2.3. Financing 62,187 46,253 34,576
2.3.1 Reverse repos 29,271 140,769 140,769
2.3.2 Other 29,271 140,769 140,769
2.4 Commitments for repurchases of ow n equity
2.5 Other amounts due
Total 6 1,410 302
Total 393,373 338,710 319,826
Fair value 393,373 338,710 319,825
Transaction type / Amount

Notes to the financial statements
94
1.4 Amounts due for finance leases
Banco Desio had no finance lease contracts in place with banks at the reference dates.
SECTION 2 - AMOUNTS DUE TO CUSTOMERS (caption 20)
2.1 Amounts due to customers: break-down by type
Payables due to resident customers amounted to a total of Euro 3,506.7 million (the aggregated amount was Euro3,658.2 million at the end of last year), while the total amount of relations in foreign currency amounted to Euro6.5 million (the aggregated amount was Euro 11.6 million at the end of 2010).
All payables due to Group companies were serviced at market rates and totalled Euro 2.1 million (the aggregatedamount was Euro 3.5 million at the end of last year).
Item “Other amounts due” includes Euro 27.8 million of bank drafts and Euro 0.6 million of non-transferablecheques (with an aggregated amount of Euro 20.2 million for bank drafts and Euro1.2 million for non-transferablecheques respectively at the end of 2010).
2.2 Breakdown of item 20 “Amounts due to customers: subordinated debts
Banco Desio had no subordinated debts due to customers at the reference dates.
2.3 Breakdown of item 20 “Amounts due to customers: structured debts”
Banco Desio had no structured debts due to customers at the reference dates.
2.4 Amounts due to customers subject to specific hedging
Banco Desio had no amounts due to customers in connection with finance leases at the reference dates.
Total Total Total
31.12.2011 31.12.2010 31.12.2010
aggregate
1. Current accounts and unrestricted 3,347,036 3,162,128 3,589,211
2. Restricted deposits 102,439 66 66
3. Financing 35,374 52,751 67,809
3.1 Reverse repos 11,514 19,418 19,418
3.2 other 23,860 33,333 48,391
4. Commitments for repurchases of ow n
equity instruments
5. Other amounts due 28,386 21,429 21,429
Total 3,513,235 3,236,374 3,678,515
Fair value 3,513,235 3,236,374 3,678,515
Transaction type /Value

Notes to the financial statements
95
2.5 Amounts due for finance leases
Banco Desio had no amounts due to customers in connection with finance lease transactions at the referencedates.
SECTION 3 - SECURITIES ISSUED (caption 30)
3.1 Securities issued: break-down by type
The book value is determined according to the amortised cost method and therefore it includes the accrualsmatured.
The caption “A.2.2 Other Securities – Other” is made up of deposit certificates and the relative amounts accrued,Euro 367.2 million of which was issued on a short-term basis and Euro 8.5 million on a longer-term basis.
3.2 Break-down of caption 30 "securities issued": subordinated securities
During the year, the Bank issued a subordinated debenture loan named “Banco di Desio e della Brianza29/12/2011-29/12/2016 variable rate subordinated lower tier II” whose characteristics are summarised below:. total nominal value: Euro 13,000,000, divided into no.13,000 bonds with a nominal value of Euro 1,000
each;. issue price of bonds: equal to 100% of the nominal value, i.e. Euro 1,000.00,. duration: 5 years, expiry date 29/12/2016;
L 1 L 2 L 3 L 1 L 2 L 3 L 1 L 2 L 3
A. Securities
1. Bonds 2,078,301 1,987,021 1,534,011 1,517,261 1,725,856 1,707,892
1.1 structured 47,071 42,371 - - - -
1.2 other 2,031,230 1,944,650 1,534,011 1,517,261 1,725,856 1,707,892
2. other securities 375,684 375,684 256,730 256,730 278,484 278,484
2.1 structured
2.2 other 375,684 375,684 256,730 256,730 278,484 278,484
Total 2,453,985 2,362,705 1,790,741 1,773,991 2,004,340 1,986,376
Book valuefair value
Book valuefair value
Security type /
Amount
Total
31.12.2011
Book valuefair value
Total
31.12.2010
Total
31.12.2010 aggregate
Total Total Total
31.12.2011 31.12.2010 31.12.2010
aggregate
due 29.12.2011 12,991 12,991
due 01.06.2012 12,967 12,983 12,983
due 03.06.2013 12,811 13,003 13,003
due 04.05.2014 29,890 29,877 29,877
due 15.12.2014 29,982 29,879 29,879
due 01.12.2015 13,008 13,019 13,019
due 29.12.2016 13,002
Total 111,660 111,752 111,752
Bonds

Notes to the financial statements
96
. indexation ratio and record date: 3-month Euribor, taken on the fifth last working day prior to the start ofthe relevant coupon entitlement;
. spread: the indexation parameter will be increased by a spread equal to 200 basis points;
. coupon payment frequency: coupons will be paid on a quarterly basis on 29/03, 29/06, 29/09 and 29/12 ofeach year;
. redemption price and procedures: redemptions will be made at a percentage equal to 100% of the nominalvalue, in one single payment, on 29/12/2016; bonds will no longer bear interest on the date of redemption;
. early redemption: no early redemptions of bonds nor repayments by amortisation, are envisaged;
. subordination: the subordination clauses provide that in the event that the Bank is wound-up, the bondsshall be redeemed, on account of capital and residual interest, only after all other creditors, not equallysubordinated, have been paid off.
Subordinated debenture loans issued in previous years show characteristics similar to those of the loan issued inthe last accounting period.
3.3 "Securities issued": securities subject to specific hedging
Total Total Total
31.12.2011 31.12.2010 31.12.2010
aggregate
1. Debt securities subject to fair value 222,675 59,375 59,375
a) interest rate risk 222,675 59,375 59,375
b) exchange rate risk
c) other risks
2. Debt securities subject to cash flow - - -
a) interest rate risk
b) exchange rate risk
c) other risks
Total 222,675 59,375 59,375
Security type/ Value

Notes to the financial statements
97
SECTION 4 - FINANCIAL LIABILITIES HELD FOR TRADING (caption 40)
4.1 Financial liabilities held for trading: break-down by type
Legend
FV* = fair value calculated by excluding value variations due to the changed credit rating of the issuer with respectto the issue dateVN = nominal or notional value
Derivative instruments “connected with the fair value option” are related to the negative valuations of derivativesfully associated to financial liabilities designated at fair value and represented solely by bonds issued by the Bank.
“Financial derivatives for trading” include a total of Euro 161 thousand (the aggregated amount was Euro 382thousand at the end of last year) in transactions with Group companies.
4.2 Breakdown of item 40 “Financial liabilities held for trading”: subordinated debts
Banco Desio had no subordinated financial debts held for trading at the reference dates.
VN FV* VN FV* VN FV*
L1 L2 L3 L1 L2 L3 L1 L2 L3
A . Liabilit ies fo r cash
1. Amounts due to banks
2. Amounts due to customers
3. Debt securities
3.1Bonds
3.1.1Structured
3.1.2 Other bonds
3.2 Other securities
3.2.1Structured
3.2.2 Other
T o ta l A - - - - - - - - - - - -
B . D erivat ives instruments
1. Financial derivatives 16 16 792 65 8 1,947 65 7 1,863
1.1Trading 16 16 792 65 8 1,329 65 7 1,210
1.2 Connected with the fair
value option 618 653
1.3 Other
2. Credit derivatives - 1,905 469 469
2.1Trading 1,905 469 469
2.2 Connected with the fair
value option
2.3 Other
T o ta l B 16 16 2,697 65 8 2,416 65 7 2,332
T o ta l (A + B ) 16 16 2,697 65 8 2,416 65 7 2,332
Total
31.12.2010
FV
31.12.2011Transaction type / Values
Total
FV
Total
31.12.2010 aggregate
FV
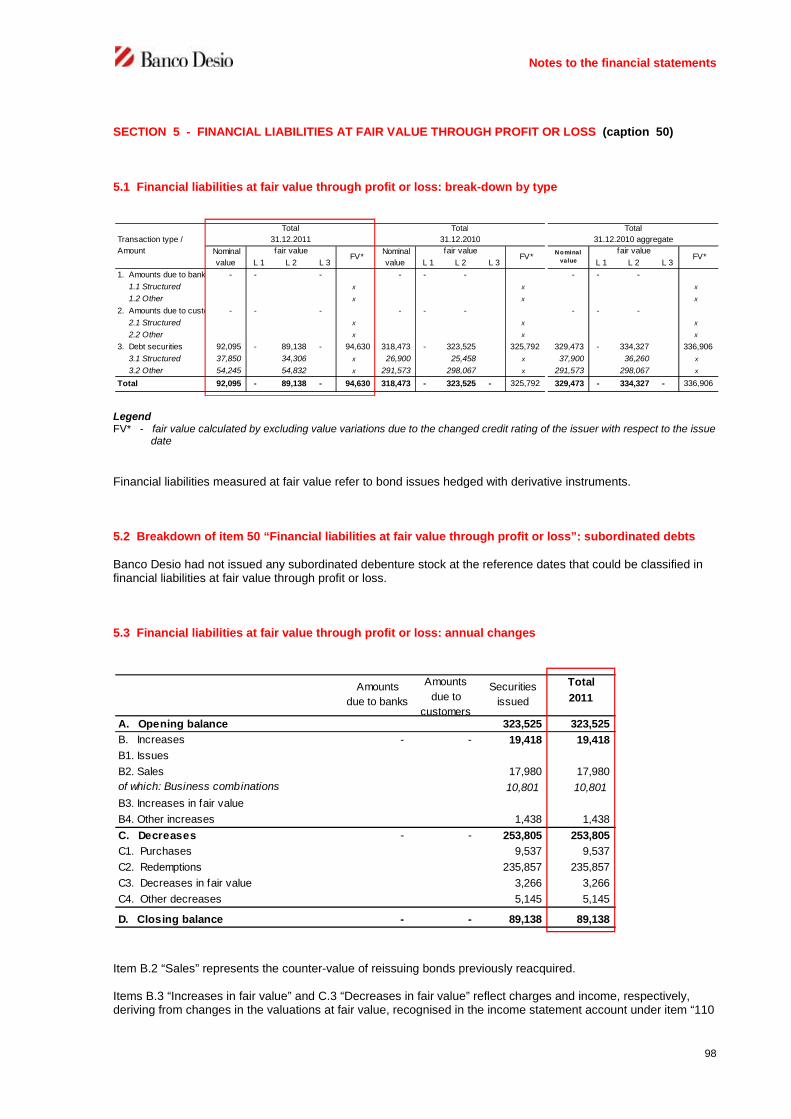
Notes to the financial statements
98
SECTION 5 - FINANCIAL LIABILITIES AT FAIR VALUE THROUGH PROFIT OR LOSS (caption 50)
5.1 Financial liabilities at fair value through profit or loss: break-down by type
LegendFV* - fair value calculated by excluding value variations due to the changed credit rating of the issuer with respect to the issue
date
Financial liabilities measured at fair value refer to bond issues hedged with derivative instruments.
5.2 Breakdown of item 50 “Financial liabilities at fair value through profit or loss”: subordinated debts
Banco Desio had not issued any subordinated debenture stock at the reference dates that could be classified infinancial liabilities at fair value through profit or loss.
5.3 Financial liabilities at fair value through profit or loss: annual changes
Item B.2 “Sales” represents the counter-value of reissuing bonds previously reacquired.
Items B.3 “Increases in fair value” and C.3 “Decreases in fair value” reflect charges and income, respectively,deriving from changes in the valuations at fair value, recognised in the income statement account under item “110
L 1 L 2 L 3 L 1 L 2 L 3 L 1 L 2 L 3
1. Amounts due to banks - - - - - - - - -
1.1 Structured x x x
1.2 Other x x x
2. Amounts due to customers - - - - - - - - -
2.1 Structured x x x
2.2 Other x x x
3. Debt securities 92,095 - 89,138 - 94,630 318,473 - 323,525 325,792 329,473 - 334,327 336,906
3.1 Structured 37,850 34,306 x 26,900 25,458 x 37,900 36,260 x
3.2 Other 54,245 54,832 x 291,573 298,067 x 291,573 298,067 x
Total 92,095 - 89,138 - 94,630 318,473 - 323,525 - 325,792 329,473 - 334,327 - 336,906
fair valueFV*
Transaction type /
Amount Nominal
value
fair value
Total
31.12.2011
Total
31.12.2010 aggregate
N ominal
value
fair valueFV*FV*
Total
31.12.2010
Nominal
value
Total
2011
A. Opening balance 323,525 323,525
B. Increases - - 19,418 19,418
B1. Issues
B2. Sales 17,980 17,980
of which: Business combinations 10,801 10,801
B3. Increases in fair value
B4. Other increases 1,438 1,438
C. Decreases - - 253,805 253,805
C1. Purchases 9,537 9,537
C2. Redemptions 235,857 235,857
C3. Decreases in fair value 3,266 3,266
C4. Other decreases 5,145 5,145
D. Closing balance - - 89,138 89,138
Amounts
due to banks
Amounts
due to
customers
Securities
issued

Notes to the financial statements
99
Net gain/(loss) on financial assets and liabilities at fair value through profit or loss”.
Item B.4 “Other increases” relates exclusively to the accruals accrued at the end of the year and to the positiveissue spreads.
Item C.4 “Other decreases” is made up of the de-recognition of interest accrued at the end of the previous year,for a total amount of Euro 2,418 thousand and profits on repurchase and redemption for Euro 2,727 thousand.
SECTION 6 - HEDGING DERIVATIVES (caption 60)
6.1 Hedging derivatives: breakdown by type of hedging and by hierarchical levels
6.2 Hedging derivatives: breakdown by hedged portfolios and by type of hedging
SECTION 7 - ADJUSTMENT TO VALUE OF FINANCIAL LIABILITIES SUBJECT TO GENERAL HEDGING(caption 70)
Banco Desio had no financial liabilities subject to general hedging at the reference dates.
SECTION 8 - TAX LIABILITIES (caption 80)
The composition and breakdown of tax liabilities are provided under Section 13 of Assets, together withinformation on deferred tax assets.
L 1 L 2 L 3 L 1 L 2 L 3 L 1 L 2 L 3
A. Financial derivates - - 2,684 15,000 - - 2,653 79,617 - - 2,653 79,617
1) Fair value 2,684 15,000 2,653 79,617 2,653 79,617
2) Cash flow s
3) Foreign investments
B. Credit derivatives - - - - - - - - - - - -
1) Fair value
2) Cash flow s
Total A - - 2,684 15,000 - - 2,653 79,617 - - 2,653 79,617
31.12.2010 aggregate
Fair valueNV
31.12.2011 31.12.2010
Fair value Fair valueNV NV
Interest
rate risk
Exchange
risk
Credit
riskPrice risk
Other
risks
1. Available-for-sale financial
assets
2,684
2. Credits
3. Held-to-maturity f inancial assets
4. Portfolio
5. Other transactions
Total assets 2,684 - - - - - - - -
1. Financial laibilities
2. Portfolio
Total liabilities - - - - - - - - -
1. Expected settlements
2.Financial assets and liabilities
portfolio
Foreign
investmentsSpecif ic Generic
Financial cash flow s
Transactions/Hedging type
Fair Value
Specif ic
Generic

Notes to the financial statements
100
SECTION 9 - LIABILITIES ASSOCIATED WITH ASSETS BEING DISPOSED OF (caption 98)
Banco Desio had no liabilities associated with assets for disposal at the reference dates.
SECTION 10 - OTHER LIABILITIES (caption 100)
10.1 Other liabilities: break-down
This item includes a total of Euro 109 thousand in liabilities towards companies of the Group (Euro 90 thousand atend of the previous period).
“Amounts due to personnel” related to the value assigned to untaken annual leaves and holidays at the end of theyear.
Accrued liabilities and deferred income which are reported in this section relates to positions which are notconnected to any specific items in the balance sheet.
Total Total Total
31.12.2011 31.12.2010
31.12.2010
aggegate
Due to tax authorities 74 656 883
Amounts due to tax authorities on account of third parties 14,825 12,827 14,408
Social security contributions to be reversed 4,649 3,989 4,555
Due to shareholders on account of dividends 15 14 14
Suppliers 12,511 10,360 11,223
Amounts available for customers 9,493 7,109 7,712
Interest and fees to be credited 202 440 448
Payments against disposals on bills 434 341 373
Advance payments on expiring loans 281 200 200
Unprocessed transactions and amounts in transit w ith
branches 9,165 10,041 11,226
Currency spreads on portfolio transactions 6,556 45,298 51,846
Amounts due to personnel 2,343 1,978 2,239
Other accounts payable 52,282 27,774 34,736
Provisions for guarantees and commitments 886 1,075 1,162
Accrued liabilities and deferred income 2,036 2,633 2,795
Total 115,752 124,735 143,820

Notes to the financial statements
101
SECTION 11 - PROVISIONS FOR EMPLOYEES TERMINATION INDEMNITIES (caption 110)
11.1 Provisions for employee termination indemnities: annual changes
The amount payable actually accrued at the end of the financial year is equal to Euro 26.2 million (the aggregatedamount was Euro 26.9 million at the end of last year).
11.2 Other information
Below are shown the actuarial assumptions utilized by an independent actuary to determine the liabilities at thereporting date:
Demographic assumptionsThe following assumptions were made:. as regards death probabilities, those determined by the General Accounting Office (Ragioneria Generale dello
Stato) and named RG48, as broken down by gender;. as regards the time of retirement, for the assets in general, the attainment of the first of the pension
requirements valid for the Compulsory General Insurance was assumed;. as regards the probabilities of leaving employment for reasons other than death, based on internal statistics,
an annual frequency of 2.5% was assumed;. as regards the probabilities of incapacity, those adopted in the INPS model for projections to 2010, broken
down by gender.
Economic-financial assumptionsTechnical valuations have been carried out based on the following assumptions:. annual technical discount rate 4.00%. annual rate of inflation 2.00%. overall annual rate of salary increase 3.00%. annual rate of increase of TFR 3.00%
As regards the discount rate, such parameter was determined taking in consideration the index IBoxx EurozoneCorporates AA 7-10.
2011 20102010
aggregate
A. Opening balance 23,151 24,350 24,976
B. Increases 1,885 1,167 1,264
B.1 Provisions during the year 1,217 1,167 1,264
B.2 Other increases 668
of which: Business combinations 668
C. Decreases 1,945 2,366 2,421
C.1 Amounts paid 1,764 2,202 2,249
C.2 Other decreases 181 164 172
D. Closing balance 23,091 23,151 23,819

Notes to the financial statements
102
SECTION 12 - PROVISIONS FOR RISKS AND CHARGES (caption 120)
12.1 Provisions for risks and charges: break-down
The item “legal disputes” includes the provisions for disputes in progress and the relative expenses; Euro 5,469thousand pertains to lawsuits and Euro 3,361 thousand to bankruptcy claw-back actions.
The item “personnel charges” includes the provisions related to company bonuses and seniority bonuses andadditional holidays.
The item “other” includes amounts set aside as follows:. Euro 15.4 million, (Euro 23.1 million at the end of the last year) created against the risk of partial review of the
price collected for the sale of 70% of Chiara Vita S.p.A. as envisaged as per contract at the end of the industrialplan of the Company (2012);
. Euro 0.4 million, to deal with the tax dispute;
. Euro 0.3 million, to deal with any charges for operating risks.
12.2 Provisions for risks and charges: annual changes
The item B.1 “Provisions during the year” includes:. a total of Euro 8.9 million for personnel charges;. Euro 1.4 million for lawsuits and claw-back actions;. Euro 0.4 million for tax dispute.
The caption “B.2 Changes due to the elapsing of time” includes interests from discounting-back activity accruedover the year in the provision for legal disputes.
The uses during the year (item C.1) refer to:
31.12.2011 31.12.2010 31.12.2010
aggregate
1. Company pension funds
2. Other provisions for risks and charges 37,798 41,797 42,390
2.1 legal disputes 8,830 8,812 8,879
2.2 personnel charges 12,868 8,521 9,047
2.3 other 16,100 24,464 24,464
Total 37,798 41,797 42,390
A. Opening balance 41,797 41,797
B. Increases 11,288 11,288
B.1 Provisions during the year 10,673 10,673
B.2 Changes due to the elapsing of time 22 22
B.3 Changes due to discount rate
adjustments
B.4 Other increases 593 593
of which: Business combinations 563 593
C. Decreases 15,287 15,287
C.1 Use during the year 15,287 15,287
C.2 Changes due to discount rate
adjustments
C.3 Other decreases
D. Closing balance 37,798 37,798
Pension
fundsOther funds 2011

Notes to the financial statements
103
. charges of Euro 1.5 million for lawsuits and bankruptcy claw-back actions;
. charges of Euro 6.1 million for personnel costs;
. a special fund set up for the review of the price for the transfer of Chiara Vita S.p.A. to the value of Euro 7.7million.
12.3 Defined benefit company pension funds
The item contains no balances.
12.4 Provisions for risks and charges - Other provisions
The breakdown of the item “Other funds” was already provided in section 12.1
SECTION 13 - REDEEMABLE SHARES (caption 140)
There were no balances in this item at the financial statements date.
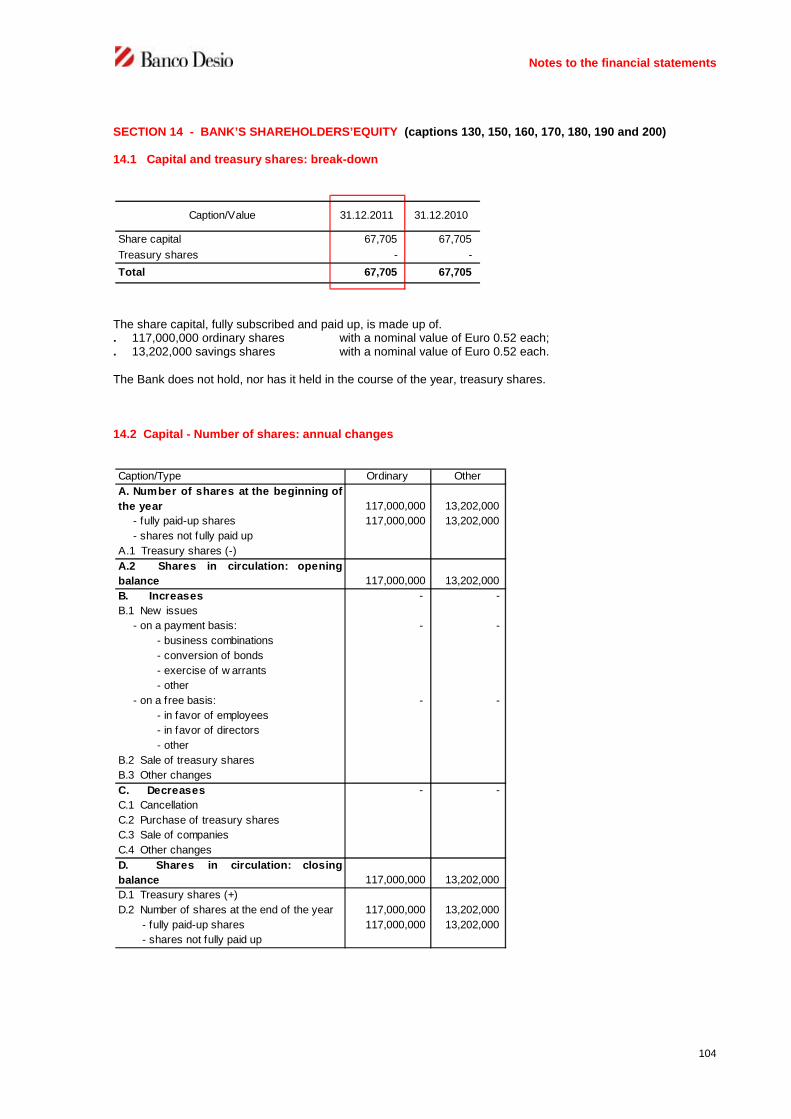
Notes to the financial statements
104
SECTION 14 - BANK’S SHAREHOLDERS’EQUITY (captions 130, 150, 160, 170, 180, 190 and 200)
14.1 Capital and treasury shares: break-down
The share capital, fully subscribed and paid up, is made up of.. 117,000,000 ordinary shares with a nominal value of Euro 0.52 each;. 13,202,000 savings shares with a nominal value of Euro 0.52 each.
The Bank does not hold, nor has it held in the course of the year, treasury shares.
14.2 Capital - Number of shares: annual changes
Share capital 67,705 67,705
Treasury shares - -
Total 67,705 67,705
Caption/Value 31.12.2011 31.12.2010
Caption/Type Ordinary Other
A. Number of shares at the beginning of
the year 117,000,000 13,202,000
- fully paid-up shares 117,000,000 13,202,000
- shares not fully paid up
A.1 Treasury shares (-)
A.2 Shares in circulation: opening
balance 117,000,000 13,202,000
B. Increases - -
B.1 New issues
- on a payment basis: - -
- business combinations
- conversion of bonds
- exercise of w arrants
- other
- on a free basis: - -
- in favor of employees
- in favor of directors
- other
B.2 Sale of treasury shares
B.3 Other changes
C. Decreases - -
C.1 Cancellation
C.2 Purchase of treasury shares
C.3 Sale of companies
C.4 Other changes
D. Shares in circulation: closing
balance 117,000,000 13,202,000
D.1 Treasury shares (+)
D.2 Number of shares at the end of the year 117,000,000 13,202,000
- fully paid-up shares 117,000,000 13,202,000
- shares not fully paid up

Notes to the financial statements
105
14.3 Capital: other information
There is no other information to report.
14.4 Profit reserves: other information
In compliance with the provisions of article 2427, paragraph 1, n: 7-bis) of the Italian Civil Code, please see belowa summary of the Net Equity items divided according to their origin and indicating the possibility for use and fordistribution, as well as their use in the three previous financial years.
14.5 Equity instruments: breakdown and annual changes
None.
14.6 Other information
There is no other information to report.
Uses in the last three financial years
Loss
coverage Other uses
Share Capital 67,705 - - - -
Share premiums 16,145 A,B,C (1) 16,145
Legal reserve 75,019 A, B (2)
Statutory reserves 435,301 A,B,C 435,301
Reserve for stock grant/option plans 551 A
Reserves from merger surpluses/deficits (6,203)
Valuation reserve :
. Available-for-sale financial assets (34,630) (3)
. actuarial valuation of tfr 74 (3)
. special revaluation law s 22,199 A,B (4)
. revaluation reserve L. 413/1991 697 A,B,C
Reserves for transition to IAS 123,356 (5)
Other 2,231 A,B,C 2,231
Total 702,445 453,677
Legenda: A = for capital increase B = for loss coverage C = for distribution to shareholders
(2) This may be used for capital increases only for the portion that exceeds one fifth of the share capital
(3) Unavailable reserve pursuant to article 6 of Legislative Decree no. 38/2005
(5) Reserves for adoption of IAS/IFRS comply w ith the provisions under article 7 of Legislative Decree 38/2005
(1) Share premium reserve, pursuant to article 2431 of the Italian Civil Code, is consdiered to be non-distributable for the
portion necessary to replenish, as per minimum legal requirements, the Legal Reserve (one fifth of the Share Capital)
(4) Reserve set up at the time of the first adoption of of IAS/IFRS, as a result of the measurement of tangible assets at
"presumed cost", as required by the "IAS decree"
31.12.2011Possible
uses
Available
share

Notes to the financial statements
106
OTHER INFORMATION
1. Guarantees granted and commitments
2. Assets lodged to guarantee own liabilities and commitments
1) Financial guarantees granted 13,207 9,967 14,530
a) Banks 8,241 8,031 9,015
b) Customers 4,966 1,936 5,515
2) Commercial guarantees granted 187,163 177,567 198,154
a) Banks 10,961 15,245 15,245
b) Customers 176,202 162,322 182,909
3) Irrevocable commitments to grant f inance 138,742 176,572 197,320
a) Banks 12,529 17,296 17,345
i) certain to be called on 12,529 17,296 17,345
ii) not certain to be called on -
b) Customers 126,213 159,276 179,975
i) certain to be called on 12,719 15,768 15,768
ii) not certain to be called on 113,494 143,508 164,207
4) Underlying commitments to credit
derivatives: hedging sales 25,000 25,000 25,000
5) Assets lodged to guarantee minority
interest 1,521 1,547 1,547
6) Other commitments - -
Total 365,633 390,653 436,551
Transactions 31.12.2011 31.12.201031.12.2010
aggregate
1. Financial assets held for trading 6,049 352 352
2. Financial assets at fair value
3. Available-for-sale financial assets 329,669 261,232 261,232
4. Held-to-maturity f inancial assets 10,115 43,451 43,451
5. Amounts due from banks 4,108 19,162
6. Amounts due from customers
7. Tangible assets
Portfolios31.12.2011 31.12.2010 31.12.2010
aggregate

Notes to the financial statements
107
4. Administration and dealing on behalf of third parties
Type of services Amount
1. Execution of orders on behalf of customers 87,658
a) purchase 41,714
1. settled 38,842
2. not settled 2,872
b) sale 45,944
1. settled 43,027
2. not settled 2,917
2. Portfolio management 845,013
a) individual 270,637
b) collective 574,376
3. Custody and administration of securities 10,532,915a) Third-party securities held on deposit in connection
w ith depositary bank's services (excluding portfolio
management) -
1. securities issued by the bank preparing the
accounts
2. other securities -
b) other third-party securities held on deposit
(excluding portfolio management): other 9,458,140
1. securities issued by the bank preparing the
accounts 2,361,102
2. other securities 7,097,038
c) third-party securities deposited w ith third parties 9,109,471
d) ow n securities deposited w ith third parties 1,074,775
4. Other transactions -

Notes to the consolidated financial statements
108
Part C - INFORMATION ON THE CONSOLIDATED INCOME STATEMENT
SECTION 1 - INTEREST (captions 10 and 20)
1.1 Interest income and similar revenues: breakdown
This item includes interest paid by Banks and other Companies of the Group with an aggregate of Euro 5.1 million(the total was Euro 2.6 million at the end of last year) of which Euro 0.2 million on amounts due from banks, Euro4.8 million on amounts due from customers and Euro 0.1 million on financial assets held for trading.
Interest on “amounts due from customers” is recognised net of any default interest accrued in the financial yearon impaired assets, since such interest is included in the balance sheet only after its collection. Interest of thisnature amounts to Euro 4.1 million overall.On the other hand a total of Euro 686 thousand (the total was Euro 704 thousand at the end of 2010) wasaccounted for in the item for interest collected during the year), of which Euro 591 thousand referred to previousfinancial years (the total was Euro 578 thousand last year).
1.2 Interest income and similar revenues: differentials on hedging transactions
Total Total Total
31.12.2011 31.12.2010 31.12.2010
aggregate
1. Financial assets held for trading 273 5,351 5,624 13,473 13,568
2. Available-for-sale financial assets 20,849 20,849 13,623 13,623
3. Held-to-maturity investments 4,683 4,683 1,732 1,732
4. Amounts due from banks 969 3,046 4,015 4,480 3,429
5. Amounts due from customers 1,395 230,898 232,293 172,919 197,105
profit or loss - - 142 142
7. Hedging derivatives 1,532 1,532 29 29
8. Other assets 67 67 74 77
Total 28,169 233,944 6,950 269,063 206,472 229,705
Debt
securitiesLoansCaption/Technical forms
Other
transactions
Caption/Value31.12.2011 31.12.2010 31.12.2010
aggregate
A. Positive differentials on hedging
transactions 5,416 761 761
B. Negative differentials on hedging
transactions (3,884) (732) (732)
C. Balance (A-B) 1,532 29 29

Notes to the consolidated financial statements
109
1.3 Interest income and similar revenues: other information
1.3.1 Interest income on foreign currency financial assets
1.3.2 Interest income on finance lease transactions
The total interest income recognised as revenues for the period and which are entered under “Amounts due fromcustomers - Loans”, amount to Euro 20.0 million; these include Euro 18.5 million related to indexed contracts, ofwhich Euro 0.9 million on leaseback contracts (in 2010 respectively Euro 12.7 million on indexed contracts, ofwhich Euro 0.9 million on leaseback contracts).
Financial profits pertaining to subsequent years amount to Euro 146.5 million, of which Euro 10.9 million onleaseback contracts (respectively Euro 150.8 million and Euro 13.6 million at the end of the last year).
1.4 Interest expense and similar charges: break-down
Debit interest paid to Group companies amounted to a total of Euro 2.6 million, of which Euro 2.4 million ofamounts due to banks and Euro 0.1 million of amounts due to customers and Euro 0.1 million on securities inissue (Euro 1.1 million last year).
1.5 Interest income and similar revenues: differentials on hedging transactions
Details are shown in item 1.2 above.
Technical forms 31.12.2011 31.12.2010 31.12.2010
aggregate
- Amounts due to banks 470 319 255
- Amounts due to customers 634 448 537
Total 1,104 767 792
Total Total Total
31.12.2011 31.12.2010 31.12.2010
aggregate
1. Amounts due to central banks (802) (802) (39) (39)
2. Amounts due to banks (4,146) (4,146) (1,202) (1,067)
3. Amounts due to customers (28,501) (28,501) (15,633) (18,047)
4. Securities issued (48,617) (48,617) (27,542) (30,868)
5. Financial liabilities held for trading -
6. Liabilities at fair value through profit or
loss - (8,218) (8,218) (16,445) (16,732)
7. Other liabilities (22) (22) (16) (16)
8. Hedging derivatives -
Total (33,449) (56,835) (22) (90,306) (60,877) (66,769)
Captions/Technical types Debts SecuritiesOther
transactions

Notes to the consolidated financial statements
110
1.6 Interest expense and similar charges: other information
1.6.1 Interest expense on foreign currency liabilities
1.6.2 Interest income on finance lease liabilities
No such operations in Banco Desio.
Captions/Technical forms 31.12.2011 31.12.2010 31.12.2010
aggregate
Amounts due to banks (311) (165) (153)
Amounts due to customers (33) (98) (106)
Securities issued - - -
Total (344) (263) (259)

Notes to the consolidated financial statements
111
SECTION 2 - NET FEE AND COMMISSION INCOME (caption 40 and 50)
2.1 Fee and commission income: break-down
Commission paid by Group Companies amounted to a total of Euro 5.0 million (total was Euro 3.2 million at theend of the last year).
Total Total Total
31.12.2011 31.12.201031.12.2010
aggregate
a) Guarantees given 1,914 1,728 1,996
b) Credit derivatives
c) Management, trading and consultancy
services: 28,576 29,970 33,170
1. trading of f inancial instruments - 25 25
2. currency trading 1,043 1,039 1,229
3. portfolio management 2,340 2,559 2,732
3.1. Individual 1,632 1,876 2,049
3.2. Collective 708 683 683
4. securities safekeeping and
administration 1,759 1,701 1,861
5. depositary bank 2,478 2,478
6. securities placement 6,779 6,085 6,879
7. order receipt and transmission 7,691 8,071 9,287
8. consultancy services
8.1 on investments
8.2 on financial structures
9. distribution of third party services 8,964 8,012 8,679
9.1. portfolio management 477 295 467
9.1.1. Individual 477 295 467
9.1.2. Collective
9.2. insurance products 8,153 6,962 7,410
9.3. other products 334 755 802
d) Collection and payment services 18,817 16,881 18,757
e) Servicing for securitization operations
f) Factoring transaction services 97 57 57
g) Tax collection services
h) multi-lateral trading systems management
i) holding and managing current accounts 55,617 51,659 57,165
j) other services 4,557 3,828 4,276
Total 109,578 104,123 115,421
Type of service / Amount
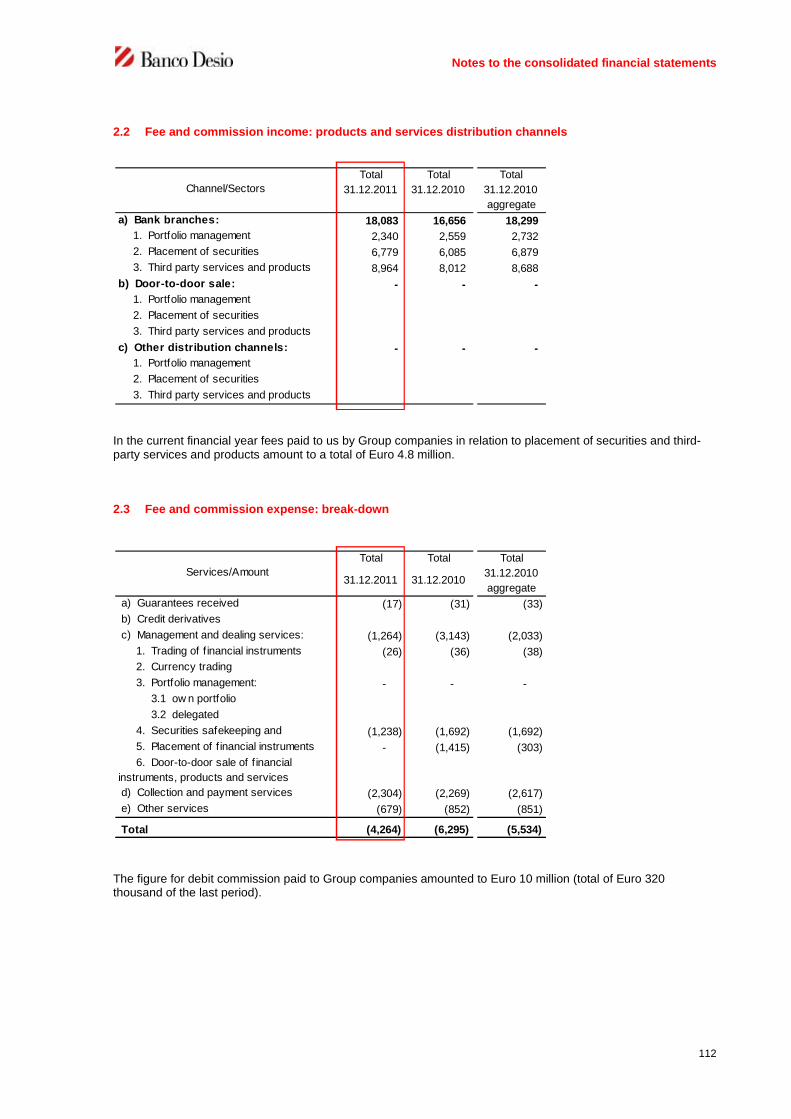
Notes to the consolidated financial statements
112
2.2 Fee and commission income: products and services distribution channels
In the current financial year fees paid to us by Group companies in relation to placement of securities and third-party services and products amount to a total of Euro 4.8 million.
2.3 Fee and commission expense: break-down
The figure for debit commission paid to Group companies amounted to Euro 10 million (total of Euro 320thousand of the last period).
Total Total Total
31.12.2011 31.12.2010 31.12.2010
aggregate
a) Bank branches: 18,083 16,656 18,299
1. Portfolio management 2,340 2,559 2,732
2. Placement of securities 6,779 6,085 6,879
3. Third party services and products 8,964 8,012 8,688
b) Door-to-door sale: - - -
1. Portfolio management
2. Placement of securities
3. Third party services and products
c) Other distribution channels: - - -
1. Portfolio management
2. Placement of securities
3. Third party services and products
Channel/Sectors
Total Total Total
31.12.2011 31.12.201031.12.2010
aggregate
a) Guarantees received (17) (31) (33)
b) Credit derivatives
c) Management and dealing services: (1,264) (3,143) (2,033)
1. Trading of f inancial instruments (26) (36) (38)
2. Currency trading
3. Portfolio management: - - -
3.1 ow n portfolio
3.2 delegated
4. Securities safekeeping and (1,238) (1,692) (1,692)
5. Placement of f inancial instruments - (1,415) (303)
6. Door-to-door sale of f inancial
instruments, products and services
d) Collection and payment services (2,304) (2,269) (2,617)
e) Other services (679) (852) (851)
Total (4,264) (6,295) (5,534)
Services/Amount

Notes to the consolidated financial statements
113
SECTION 3 -DIVIDENDS AND SIMILAR REVENUES (caption 70)
3.1 Dividends and similar revenues: break-down
The item “B. Financial assets available for sale” includes dividends of Euro 146 thousand collected by the mergedcompanies Banco Desio Toscana and Banco Desio Veneto in relation to the subsidiary Rovere S.A.
Dividends collected from equity investments, included under point D, relate to:Banco Desio Lazio euro 2,146 thousand (previously 2.862 thousand)Chiara Assicurazioni euro 533 thousandChiara Vita euro 1,333 thousand (previously 3.384 thousand)Brianfid euro 0 (previously 517 thousand)
Dividends
Income
from
UCITS
units
Dividends
Income
from
UCITS
units
Dividends
Income
from
UCITS
units
A. Financial assets held for trading 5
B. Available-for-sale financial assets 170 364 445
C. Financial assets at fair value through
profit or loss
D. Equity investments 4,012 x 6,763 x 6,763
Total 4,187 - 7,127 - 7,208 -
31.12.2010 aggregate
Caption / Revenues
31.12.2011 31.12.2010

Notes to the consolidated financial statements
114
SECTION 4 - PROFITS (LOSSES) ON TRADING (CAPTION 80)
4.1 Profit (losses) on trading: break-down
Profit (losses) on trading was affected by income earned in the operations carried out with Group companies for atotal of Euro 169 thousand (total of Euro 123 thousand at the end of 2010).
Net income Net income Net income
31.12.2011 31.12.2010 31.12.2010 aggregate
1. Financial assets held for trading 39 480 (304) (241) (26) (39) 61
1.1 Debt securities 39 253 (104) (88) 100 156 236
1.2 Equity securities 98 (200) (153) (255) (321) (321)
1.3 UCITS units
1.4 Loans
1.5 Other 129 129 126 146
2. Financial liabilities held for trading - - - - - - (10)
2.1 Debt securities (10)
2.2 Debts
2.3 Other
3. Other financial assets and liabilities:
foreign exchange differences
x x x x 440 1,245 1,305
4. Derivative instruments 284 1,237 (2,005) (1,184) (1,646) (840) (910)
4.1 Financial derivates:
- on debt securities and interest rates 219 1,237 (1,923) (1,184) (1,651) (894) (964)
- on equity securities and stock 65 - (82) - (17) 40 40
- on currencies and gold x x x x 22 14 14
- other
4.2 Credit derivatives
TOTAL 323 1,717 (2,309) (1,425) (1,232) 366 446
Transaction / Income component
Prof it
on
trading
Capital
losses
Losses
on trading
Capital
gain
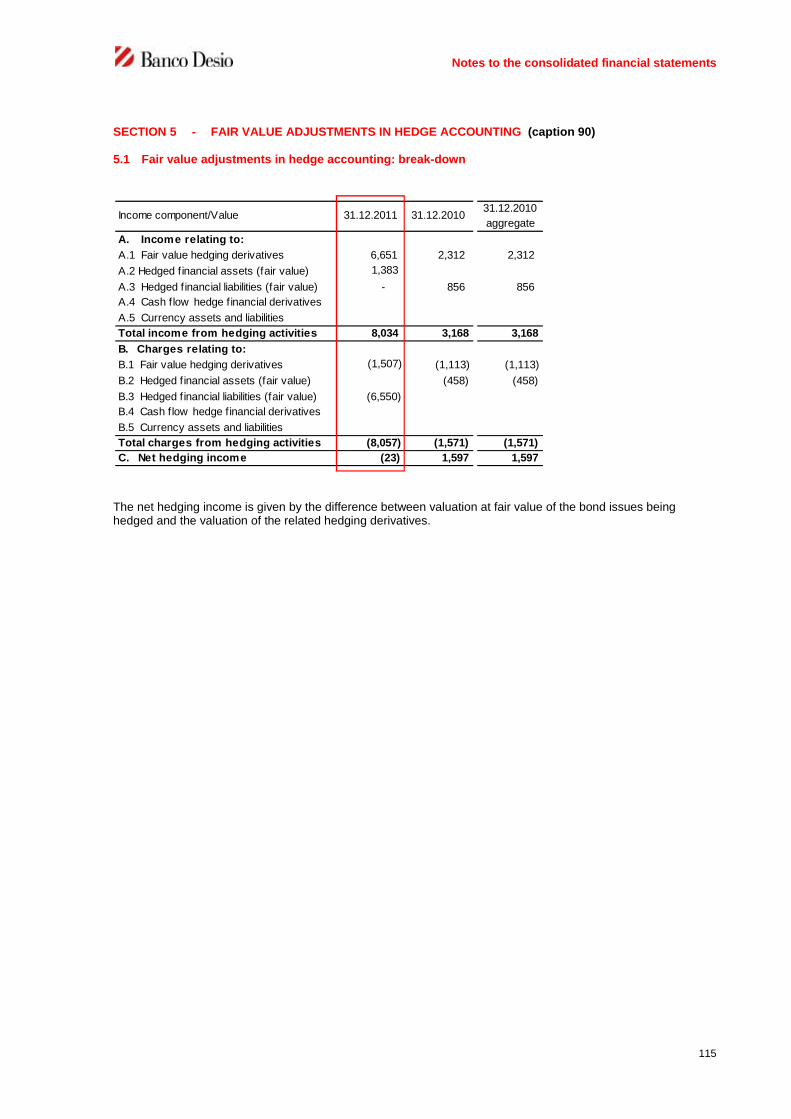
Notes to the consolidated financial statements
115
SECTION 5 - FAIR VALUE ADJUSTMENTS IN HEDGE ACCOUNTING (caption 90)
5.1 Fair value adjustments in hedge accounting: break-down
The net hedging income is given by the difference between valuation at fair value of the bond issues beinghedged and the valuation of the related hedging derivatives.
Income component/Value 31.12.2011 31.12.201031.12.2010
aggregate
A. Income relating to:
A.1 Fair value hedging derivatives 6,651 2,312 2,312
A.2 Hedged financial assets (fair value) 1,383
A.3 Hedged financial liabilities (fair value) - 856 856
A.4 Cash flow hedge financial derivatives
A.5 Currency assets and liabilities
Total income from hedging activities 8,034 3,168 3,168
B. Charges relating to:
B.1 Fair value hedging derivatives (1,507) (1,113) (1,113)
B.2 Hedged financial assets (fair value) (458) (458)
B.3 Hedged financial liabilities (fair value) (6,550)
B.4 Cash flow hedge financial derivatives
B.5 Currency assets and liabilities
Total charges from hedging activities (8,057) (1,571) (1,571)
C. Net hedging income (23) 1,597 1,597

Notes to the consolidated financial statements
116
SECTION 6 - PROFITS (LOSSES) ON DISPOSAL/REPURCHASE (caption 100)
6.1 Profits (losses) on disposal/repurchase: break-down
Profits/losses on Amounts due from customers result from the transfer of non-performing loans.
Profits/losses from disposal/repurchase of financial assets available for sale represent the effect in the incomestatement of the sales made in the financial year, including the release of the related valuation reserves beforetax effect. Profits referred to disposal of UCITS units also include the relevant tax credit.
As regards financial liabilities, the result reflects the profits/losses resulting from the purchase, sale or redemptionof bonds issued by the Bank.
Profits LossesNet
incomeProfits Losses
Net
incomeProfits Losses
Net
income
Financial assets
1. Amounts due from banks
2. Amounts due from customers 34 (586) (552) 55 55 57 57
3. Available-for-sale financial assets 5,383 (2,759) 2,624 11,058 (3,994) 7,064 11,058 (3,994) 7,064
3.1 Debt securities 4,998 (2,750) 2,248 9,882 (1,663) 8,219 9,882 (1,663) 8,219
3.2 Equity securities 200 (2) 198 100 (25) 75 100 (25) 75
3.3 UCITS units 185 (7) 178 1,076 (2,306) (1,230) 1,076 (2,306) (1,230)
3.4 Loans
4. Held-to-maturity investments
Total assets 5,417 (3,345) 2,072 11,113 (3,994) 7,119 11,115 (3,994) 7,121
Financial liabilities
1. Amounts due to banks
2. Amounts due to customers
3. Securities issued 1,114 (15) 1,099 931 (104) 827 960 (124) 836
Total liabilities 1,114 (15) 1,099 931 (104) 827 960 (124) 836
31.12.2010 aggregate31.12.2010
Caption/Income component
31.12.2011

Notes to the consolidated financial statements
117
SECTION 7 - PROFITS (LOSSES) ON FINANCIAL ASSETS AND LIABILITIES AT FAIR VALUETHROUGH PROFIT OR LOSS (caption 110)
7.1 Profits (losses) on financial assets and liabilities at fair value through profit or loss: break-down
Profits (losses) on financial assets and liabilities at fair value through profit or loss are given by the differencebetween valuation of the bonds issued, subject to “natural” hedging in compliance with the so-calledfair value option, and the corresponding financial derivatives.
SECTION 8 - NET LOSSES/RECOVERIES ON IMPAIRMENT (caption 130)
8.1 Net impairment losses on loans: break-down
“Impairment losses due to write-offs” entirely refer to the writing off of non-performing loans.
“Impairment losses - other” are generated by the analytical valuation of the likelihood of recovery of impairedloans and by the discounting of cash flows expected on the same classes of loans; specifically they refer:. to non-performing loans Euro 21.2 million (previously Euro 20.5 million);. to problem loans Euro 19,9 million (previously Euro 17.7 million);. restructured loans Euro 0,1 million (previously Euro 0.3 million);. to default loans Euro 1.1 million (previously Euro 0.9 million).
Net income Net income Net income
31.12.2011 31.12.2010 31.12.2010 aggregate
1. Financial assets - - - - - - -
1.1 Debt securities
1.2 Equity securities
1.3 UCITS units
1.4 Loans
2. Financial liabilities 3,266 2,727 - - 5,993 8,005 8,280
2.1 Debt securities 3,266 2,727 - - 5,993 8,005 8,280
2.2 Amounts due to banks
2.3 Amount due to customers
3. Other financial assets and liabilities:
foreign exchange differences- - -
4. Financial and credit derivatives 1,536 (4,783) (3,247) (9,886) (10,022)
Total 4,802 2,727 (4,783) - 2,746 (1,881) (1,742)
Transaction/ Income componentCapital
gain
Profits on
disposal
Capital
losses
Losses
on
disposal
Write-offs OtherDue to
interests
Other
recoveries
Due to
interests
Other
recoveries
A. Amounts due from
banks11 11 10 10
- loans 11 11 10 10.00
- debt securities
B. Amounts due from
customers(13,403) (42,374) 5,980 12,379 2,142 (35,276) (34,792) (38,137)
- loans (13,403) (42,374) 5,980 12,379 2,142 (35,276) (34,792) (38,137)
- debt securities -
C. Total (13,403) (42,374) - 5,980 12,379 - 2,153 (35,265) (34,782) (38,127)
Transaction/Income
component
Total
Specific
Impairment losses Recoveries
Portfo lio
Portfo lio 31.12.2011
Specific
Total
31.12.2010
aggregate31.12.2010
Total

Notes to the consolidated financial statements
118
Recoveries: – due to interest” result from the release of interest from the discounting of capital on non-performingor impaired loans.
As regards specific recoveries, “other recoveries” refer:. to transactions amortised in previous years Euro 2.3 million (previously 2.1 million);. to collections of previously devalued credits Euro 6.1 million (previously 6.1 million);. to recoveries from valuations Euro 4.0 million (previously 4.5 million).
8.2 Net impairment losses on financial assets available for sale: breakdown
There were no net impairment losses at the end of the period on financial assets available for sale.
8.3 Net impairment losses on held-to-maturity investments: breakdown
There were no net impairment losses at the end of the period on held-to-maturity investments.
8.4 Net impairment losses on other financial transactions: break-down
“Impairment losses and recoveries - specific: other” represent the valuation of the guarantees issued with regardto non-performing loans or problems loans.
Write-offs OtherDue to
interests
Other
recoveries
Due to
interests
Other
recoveries
A. Guarantees granted (279) (51) 75 252 (3) (115) (120)
B. Credit derivatives
C. Commitments to grant
f inance
D. Other transactions
E. Total (279) (51) 75 252 (3) (115) (120)
Transaction/Income
component
Impairment losses Recoveries Total
31.12.2010
aggregate
Total Total
Specific
Portfolio
Specific Portfo lio
31.12.2011 31.12.2010
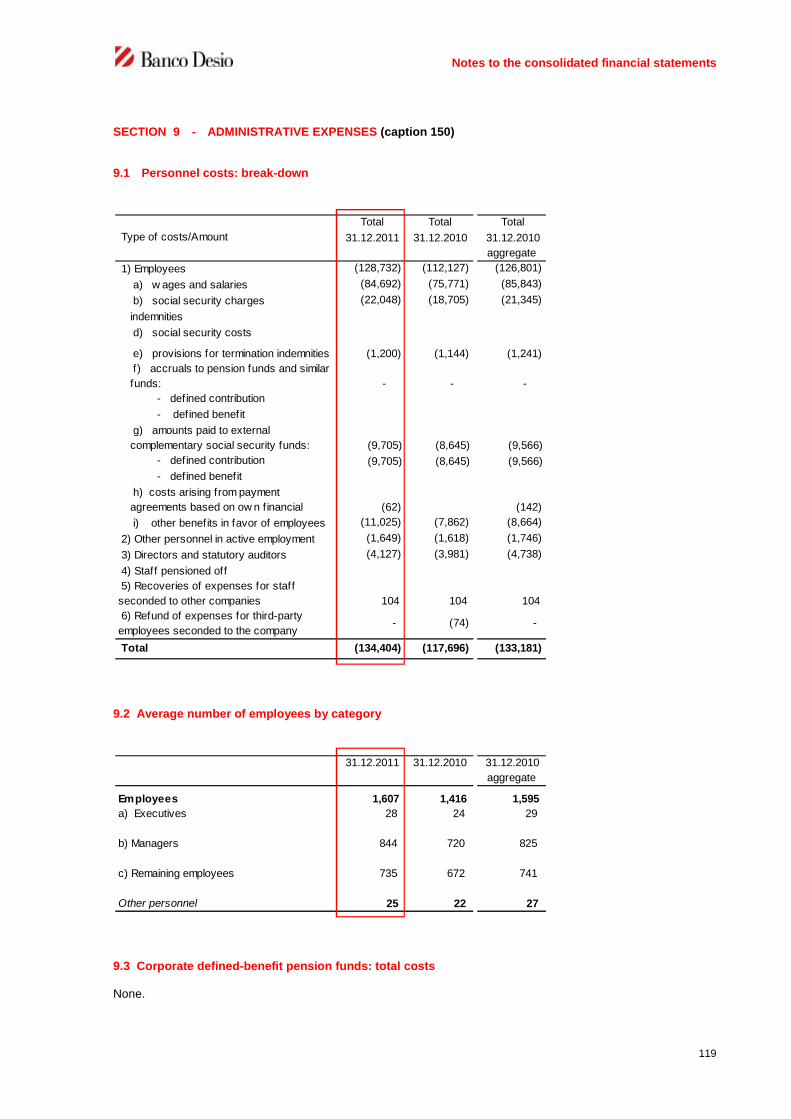
Notes to the consolidated financial statements
119
SECTION 9 - ADMINISTRATIVE EXPENSES (caption 150)
9.1 Personnel costs: break-down
9.2 Average number of employees by category
9.3 Corporate defined-benefit pension funds: total costs
None.
Total Total Total
31.12.2011 31.12.2010 31.12.2010
aggregate
1) Employees (128,732) (112,127) (126,801)
a) w ages and salaries (84,692) (75,771) (85,843)
b) social security charges (22,048) (18,705) (21,345)
indemnities
d) social security costs
e) provisions for termination indemnities (1,200) (1,144) (1,241)
f) accruals to pension funds and similar
funds: - - -
- defined contribution
- defined benefit
g) amounts paid to external
complementary social security funds: (9,705) (8,645) (9,566)
- defined contribution (9,705) (8,645) (9,566)
- defined benefit
h) costs arising from payment
agreements based on ow n financial (62) (142)
i) other benefits in favor of employees (11,025) (7,862) (8,664)
2) Other personnel in active employment (1,649) (1,618) (1,746)
3) Directors and statutory auditors (4,127) (3,981) (4,738)
4) Staff pensioned off
5) Recoveries of expenses for staff
seconded to other companies 104 104 104
6) Refund of expenses for third-party
employees seconded to the company- (74) -
Total (134,404) (117,696) (133,181)
Type of costs/Amount
31.12.2011 31.12.2010 31.12.2010
aggregate
Employees 1,607 1,416 1,595
a) Executives 28 24 29
b) Managers 844 720 825
c) Remaining employees 735 672 741
Other personnel 25 22 27

Notes to the consolidated financial statements
120
9.4 Other benefits in favour of employees
9.5 Other administrative costs: break-down
This item includes the fees paid to the firm PricewaterhouseCoopers S.p.A. which is responsible for auditing thefinancial statements for the following types of services rendered to the Bank.
31.12.2011 31.12.2010 31.12.2010
aggregate
provisions for sundry costs (7,956) (4,440) (4,830)
social security contribution (1,136) (904) (1,001)
training and education expenses (371) (525) (532)
leases on buildings dedicated to the use by employees(116) (56) (95)
other (1,446) (1,937) (2,080)
Total (11,025) (7,862) (8,664)
31.12.2011 31.12.2010 31.12.2010
aggregate
indirect taxes and duties
- stamp duties (10,063) (7,559) (8,412)
- other (3,286) (3,368) (3,881)
other costs
- information technology charges (8,067) (9,170) (10,418)
- property/equipment lease (9,893) (6,808) (9,110)
equipment (3,256) (3,157) (3,518)
- postal and telegraphic charges (2,107) (2,102) (2,350)
- telephone, data transmission charges (2,345) (1,880) (2,451)
- electric pow er, heating, w ater (3,109) (2,741) (3,061)
- cleaning services (1,086) (842) (1,018)
expenses (1,161) (950) (1,087)
- transport costs (696) (617) (731)
- surveillance and security (1,352) (1,113) (1,209)
- advertising (1,020) (1,261) (1,371)
- information and certif icates (933) (1,082) (1,305)
- insurance premiums (860) (770) (861)
- legal expenses (4,866) (4,490) (4,757)
- professional consulting expenses (2,891) (2,672) (3,035)
- contributions and donations (163) (127) (162)
- other expenses (8,744) (6,220) (6,628)
Total (65,898) (56,929) (65,365)
Type of services / Remuneration31.12.2011 31.12.2010
31.12.2010
aggregate
Audit 188 125 186
Certif ication services 6 3 7
Tax advisory services
Other services: agreed procedures 29 26 26

Notes to the consolidated financial statements
121
SECTION 10 - NET PROVISIONS FOR RISKS AND CHARGES (captions 160)
10.1 Net provisions for risks and charges: break-down
Adjustment to provisions relating to personnel charges is included under “Administrative expenses - Personnelcosts”.
SECTION 11 - NET ADJUSTMENTS TO/RECOVERIES ON TANGIBLE ASSETS (caption 170)
11.1 Net adjustments to/recoveries on tangible assets: break-down
Value adjustments exclusively refer to depreciation calculated on the basis of the useful life of assets.
The breakdown of the amortizations by type of asset is shown in the table 11.3 of the Assets.
Type of costs / Amount
31.12.2011 31.12.2010 31.12.2010
aggregate
charges for legal disputes (1,413) 1,072 1,072
sundry charges 7,313 14,498 14,581
Total 5,900 15,570 15,653
Net income Net income Net income
31.12.2011 31.12.201031.12.2010
aggregate
A. Tangible assets
A.1 ow ned by the Bank (5,938) - - (5,938) (5,349) (6,221)
- for business use (5,938) (5,938) (5,349) (6,221)
- for investment -
A.2 leased - - - - - -
- for business use -
- for investment -
Total (5,938) - - (5,938) (5,349) (6,221)
Asset / Income componentDepreciation
Impairment
lossesRecoveries

Notes to the consolidated financial statements
122
SECTION 12 - NET ADJUSTMENTS TO/RECOVERIES ON INTANGIBLE ASSETS (caption 180)
12.1 Net adjustments to/recoveries on intangible assets: break-down
Value adjustments exclusively refer to amortization calculated on the basis of the useful life of intangible assets.
SECTION 13 - OTHER OPERATING INCOME (caption 190)
13.1 Other operating expenses: break-down
This item accounts for other intragroup expenses of Euro 1 thousand (total was also Euro 1 thousand at the endof 2010).
13.2 Other operating income: break-down
This item accounts for other intergroup income of Euro 1,088 thousand (total of Euro 1,056 thousand at the end of2010).
Amortization
Impairment
losses RecoveriesNet income Net income Net income
31.12.2011 31.12.201031.12.2010
aggregate
A. Intangible assets -
A.1 ow ned by the Bank (584) - - (584) (423) (431)
- generated internally -
- other (584) (584) (423) (431)
A.2 leased -
Total (584) - - (584) (423) (431)
Asset / Income component
Type of costs / Amount
31.12.2011 31.12.2010 31.12.2010
aggregate
amortization of costs for leasehold
improvements (2,606) (1,798) (2,122)
losses on disposal of tangible assets (26) (15) (15)
charges on non-banking services (524) (1,734) (1,797)
Total (3,156) (3,547) (3,934)
Type of costs / Amount
31.12.2011 31.12.2010 31.12.2010
aggregate
recovery of taxes from third parties 11,468 9,202 10,433
recovery of expenses 1,807 1,299 1,471
rentals receivable 5 5 5
other recoveries of expenses 4,225 3,161 1,948
profits from disposal of tangible assets 48 2,957 2,960
others 1,961
Total 19,514 16,624 16,817

Notes to the consolidated financial statements
123
SECTION 14 - PROFITS (LOSSES) ON EQUITY INVESTMENTS (caption 210)
14.1 Profits (losses) on equity investments: break-down
SECTION 15 - NET PROFITS (LOSSES) FROM TANGIBLE AND INTANGIBLE ASSETS AT FAIR VALUE(caption 220)
Banco Desio has no tangible or intangible assets valued at fair value.
SECTION 16 - IMPAIRMENT OF GOODWILL (caption 230)
As noted in section 12 “Intangible assets” of the balance sheet assets, the performance of the impairment test didnot show any impairment of goodwill during the period.
SECTION 17 - PROFITS (LOSSES) ON DISPOSAL OF INVESTMENTS (caption 240)
There was no profit (loss) on disposal of investments during the period.
Total Total Total
31.12.2011 31.12.2010 31.12.2010
aggregate
A. Revenues - 493 493
1. Revaluations
2. Profits on disposal - 493 493
3. Write-backs
4. Other
B. Charges - - -
1. Write-dow ns
2. Impaiment losses
3. Losses on disposal
4. Other
Net result - 493 493
Income component / Values

Notes to the consolidated financial statements
124
SECTION 18 - TAXES ON INCOMEFROM CONTINUING OPERATIONS (caption 260)
18.1 Taxes on income from continuing operations: breakdown
Item 2 “Changes in current taxes of previous periods” recorded the following changes:. increase of Euro 336 thousand as a result of the reversal of the substitute tax applied during the transaction
for the tax redemption of goodwill, carried out in the 2009 financial year, pursuant to article 15, paragraph 10of Decree Law no. 185/2008 by the merged company Banco Desio Veneto S.p.A. The amount claimed inrefund was entered in the tax credits. The cancellation of the transaction also entailed the reversal ofdeferred tax assets amounting to Euro 679 thousand.The reversal of the transaction caused a total negative effect on the income statement equal to Euro 343thousand.
. reduction of Euro 25 thousand of current taxes allocated as at 31.12.2010.
18.2 Reconciliation of theoretical and effective tax charges in the financial statements
The effective tax charge, amounts to Euro 31,919 thousand is equal to the amount reported under item “1.Current taxes”, previous table 18.1.
Total Total Total
31.12.2011 31.12.2010 31.12.2010
aggregate
1. Current taxes (-) (31,919) (26,111) (27,374)
2. Changes in current taxes of previous
periods (+/-) 311 (115) (104)
3. Decrease in current taxes of the year (+)
4. Changes in deferred tax assets (+/-) 1,894 2,852 2,815
5. Changes in deferred tax liabilities (+/-) (136) 44 22
6. Taxes for the year (29,850) (23,330) (24,641)
Income component / Values
Profit before taxes 73,085 73,085
Non-deductible costs for IRAP purposes 200,909
Non-taxable revenues for IRAP purposes (33,502)
Sub-Total 73,085 240,492
Theoretical tax charge
27.5% Ires - 5.57% Irap (20,098) (13,395)
Temporary taxable differences over
subsequent years (261) (261)
Temporary deductible differences over
subsequent years 23,149
Reallocation of temporary differences from
previous financial years (13,506) 1,596
Differences not to be reversed in
subsequent years (8,080) (36,034)
Taxable income 74,387 205,793
Current taxes for the period
27.5% Ires - 5.57% Irap (20,456) (11,463)
IRES IRAP

Notes to the consolidated financial statements
125
SECTION 19 - GAINS (LOSSES) ON GROUPS OF ASSETS BEING DISPOSED OF, NET OF TAXES(caption 280)
There were no gains/losses on groups of assets/liabilities for disposal at the end of the period.
SECTION 20 - OTHER INFORMATION
There is no other information to report in this section.
SECTION 21 - EARNING PER SHARE
21.1 Average number of diluted ordinary shares
During the year no transaction on the share capital or no issue of financial instruments was carried out whichcould entail the issue of shares; therefore, the number of shares entitled to profits is equal to mo. 117,000,000ordinary shares and no. 13,202,000 savings shares
21.2 Other information
Earnings per share
(Amounts in Euros)
Ordinary shares Savings shares
Proposed allocation of dividends 12,285,000 1,663,452
Retained earnings 25,794,167 3,492,659
38,079,167 5,156,111 43,235,278
Average number of outstanding ordinary shares:
Categories:
Ordinary shares 117.000.000
Savings shares 13.202.000
Earnings per share - Basic : 0.325 0.391
Categories of sharesProfit for
the period

Nota integrativa
126
PART D - COMPREHENSIVE INCOME
ANALYTICAL STATEMENT OF COMPREHENSIVE INCOME
CaptionsGross
AmountIncome tax Net amount
10. Profit (Loss) for the period X X 43 235
Oher income components
20. Available-for-sale financial assets (38,668) 12,833 (25,835)
a) fair value changes (41,493) 13,680 (27,813)
b) reversal to the income statement 2,495 (817) 1,678
- value adjustments due to deterioration
- profits/losses on disposal 2,495 (817) 1,678
c) other changes 330 (30) 300
30. Tangible assets
40. Intangible assets
50. Foreign investment hedge:
a) fair value changes
b) reversal to the income statement
c) other changes
60. Cash flow hedge:
a)fair value changes
b) reversal to the income statement
c) other changes
70. Exchange differences:
a) fair value changes
b) reversal to the income statement
c) other changes
80. Non-current assets held for sale and discontinued operations
a) fair value changes
b) reversal to the income statement
c) other changes
90. Actuarial profits (losses) on defined benefit plans 42 (7) 35
100.Share of valuation reserve of equity investments carried at
equity:
a) fair value changes
b) reversal to the income statement
- value adjustments due to deterioration
- profits/losses on disposal
c) other changes
110. Total other income components (38,626) 12,826 (25,800)
120. Comprehensive income (10+110) X X 17,435

Notes to the financial statements
127
PART E – INFORMATION ON RISKS AND THE RELATED HEDGING POLICIES
SECTION 1 – CREDIT RISK
Qualitative information
1. General aspects
Banco di Desio e della Brianza’s lending activity has developed in line with the management policies laid down inthe Business Plan, directed at local economies and mainly carried on in the retail, small business and small-tomedium enterprises markets. Lending is directed at the corporate market to a lesser extent.
The activities directed at private and small business customers (artisans, producing families, professionals)include products substantially relating to: loans and deposits under any form; financial, banking and paymentservices; financial, insurance and asset management products; debit and credit cards.
The activities intended for medium-to-large enterprises and finance companies include products substantiallyrelating to: loans and deposits under any form; financial, banking and payment services; documentary credit;leasing and factoring.
Commercial policy is pursued through the peripheral branch network and in the geographical areas in which theBank has a traditional presence, the objectives being the constant consolidation of its position, and in its newmarkets, in order to acquire new market shares and to facilitate an increase in turnover.
In relation to policies of risk assumption, one of the main principles underlying the management and formulation ofstrategic decisions has historically been represented by the effective and precise monitoring of exposure quality.
As a consequence, all policies are aimed at maintaining the high level of receivable quality while also keepingbusiness objectives in mind.
For some specific products (targeted personal loans, leasing), activities are also conducted by means ofauthorised operators.
2. Policies for the management of credit risks
2.1 Organisational aspects
The factors that give rise to credit risk are related to the possibility of an unexpected variation in thecreditworthiness of a counter-party to which there is exposure generating a corresponding unexpected variation inthe market value of the debt. For this reason, a credit risk must be considered as arising not only as a result of thepossibility of a counter-party’s insolvency, but also as a result of a mere worsening of its creditworthiness.The Bank’s organisational structure ensures a satisfactory process to watch over and manage credit risk,adopting a policy of separating business and control functions. The Board of Directors is assigned, on anexclusive basis, inter alia, the tasks and powers related to the determination of the policies which affect thegeneral operation of the company. As regards internal controls, the Board of Directors approves the strategicdirection and risk management policies, as well as the organisational structure of the bank.The Board also ensures that the Managing Director, with the assistance of the General Manager, defines thestructure of internal controls and that control functions are autonomous within this structure, in which particularimportance is assumed by the system of delegated powers envisaged in the Articles of Association and specifiedin detail in Internal Regulations. This is a comprehensive system involving various bodies and functions, from theExecutive Committee to Middle Managers, which also grants specific powers with regard to disbursing andrecovering loans within operating powers.

Notes to the financial statements
128
The various functions are therefore given responsibility for the assessment and assumption of risks in compliancewith the lending autonomy ceilings under Internal Regulations and consistently with the organisational system ofthe sales network.In this context:
the Loans Department (for the ordinary credit and for medium-to-long term, para-banking and consumercredit) standardises the general principles and rules under internal regulations governing thedisbursement and monitoring of loans, in order to ensure that the risk activities undertaken meetprudential management criteria and are compatible with regulations on supervision;
the Risk and Litigation Performance Control Department monitors activities to forestall and minimise therisks deriving from the worsening of individual credit positions and the credit quality;
the Litigation Department handles cases that have been classified as problem and non-performing loans,with the aim of optimising the credit collection phase, if necessary through the efficient use of outsidecollaborators and legal counsels;
the Internal Audit department, assesses the efficiency and reliability of the entire internal control systemand checks, inter alia, that lending is carried out in accordance with the rules;
the duty of the Risk Management Office is to develop credit risk models and measurementmethodologies by drawing up periodic reports; the analyses produced mainly regard the evolution of thecredit risk attached to the overall credit portfolio and/or to individual fractions of the portfolio entailingother particular credit risks.
2.2 Management, measurement and control systems
The credit risk management, measurement and control systems develop in an organisational framework thatinvolves the entire credit process cycle, from the information-gathering stage to periodical review and the finalphase of revocation and recovery.During the information-gathering stage preliminary to granting credit, the Bank conducts investigations both withinand outside the potential borrower’s structure, and reaches the final decision to lend also considering theinformation regarding the economic entity as a whole, which is the result of direct acquaintance with the customerand the economic context in which it operates.The granting of personal or targeted loans is subject not only to the study of all the valuation factors obtained bymeans of the necessary documentation, but to a series of controls, including points awarded on the basis of asociological and behavioural scoring system.In the loan disbursement process, the Bank operates according to guidelines that spread risk over a large numberof customers operating in various economic sectors and market segments. Furthermore, the information gatheringactivities involved in the operational process that leads to disbursement, and periodical reviews, are carried onwith the aim of making a loan that is appropriate to each individual name on the basis of both the capacity torepay and the technical form of the credit facility itself and of collaterals. Creditworthiness is assessed with careincluding on the basis of the customer’s explanation of his or her financial requirements in the identification of themost appropriate technical form.The risk involved in lending is analysed and monitored by the Risk Performance Control Department, whichperforms its work supported by specific operating procedures. The purpose of a prompt monitoring system is todetect signs of risk deterioration at the earliest possible moment and to take effective corrective actions. For thispurpose, customers are separated into classes by analysis of the performance of the relationship and ofinformation from the automated Interbank Risk Service through a specific procedure, which separates customerswhose conduct in the course of the relationship is anomalous from those with whom the relationship proceedssmoothly.When the risk factor evidence contains signs of deterioration (mainly the conduct of the relationship, the trendemerging from the automated Interbank Risk Service, the worsening of the equity and/or financial position or theoccurrence of unfavourable events), the loan is classified as under control or in loans to reverse or problem loanswith the customer being asked to sign a repayment plan. These loans are handled on the basis of instructionsfrom the Risk Performance Control Department.The first watchdog for effective monitoring of the risks that are assumed, however, is the Branch structure, bymeans both of constant and continual dialogue with customers and recourse to available sources of information.The Bank adopts, for management purposes, in view of the Risk Management, an internal rating model (C.R.S.Credit Rating System) developed within the Parent Company, capable of classifying each counterparty in certainrisk classes with similar default probabilities. This system represents an analytical model for measuring the defaultrisk, which uses statistical inference methods based on the subjectivist theory (or on the conditioned probabilitytheory). This model allows a rating to be assigned based on the sources of information used and the segment ofthe borrower (retail/corporate); in particular, the segmentation criteria of the counterparties are set taking intoaccount the business sector, the legal status and the sales volumes (if applicable) of the counterparty. There areeight rating classes for performing counterparties (from AAA to CC), while there are three classes representingnon-performing loans (expired, problem and non-performing loans).The Bank follows the rules laid down in the new legislation regarding the standardised method for the calculationof regulatory capital requirements to meet credit risk.

Notes to the financial statements
129
2.3 Credit risk mitigation techniques
While developing the operational process leading to the disbursement of a loan, even if it is considered that thenecessary requirements have been met, whenever possible the Bank obtains additional real and/or personalsecurities in order to mitigate risk.Mortgages have proved to be the prevailing form of collateral, mainly in the technical form of mortgage loans (inparticular loans raised on residential properties). Pledges in financial instruments and/or cash are also to be foundto a lesser extent, although still at significant levels.A prudential spread is applied to collaterals that varies according to the degree of risk inherent in the assetspledged, which are monitored in order to verify current value as opposed to original value and to allow action tobe taken in the event of reductions in value. Spreads defined by Internal regulations are applied to the acquisitionof registered mortgages, differentiated according to the type of property, the duration of the financing and thecustomer’s business sector. Personal securities consist for the most part in performance bonds granted by bothnatural individuals and companies. The related evaluation is always effected on a valuation of the guarantor’sliable assets during the enquiry stage or prior to the renewal of the credit.The guarantees received by the Bank are drawn up on contractual forms, in line with the standards for the sectorand based on case law guidelines and approved by the competent corporate departments. The guaranteemanagement process, in compliance with the requirements in the new regulations, provides for monitoringactivities and specific checks with a view to the verification of eligibility.To date, the Bank has not used credit derivatives to hedge or transfer credit risks and has carried out no directsecuritisation transactions.
2.4 Impaired financial assets
The transfer to the non-performing loan category takes place when, in the light of the objective elements at thedisposal of the competent office, a customer becomes unable to meet its commitments and thus enters a state ofinsolvency, even one that has not been declared by a court.
Loans to customers are classified as problem loans in consideration of the extent of the risk that has arisen, of theobjective impossibility of reaching an amicable settlement, of failure to comply with the repayment plans that havebeen defined and the need to take timely legal action in order to safeguard the credit effectively.In any case problem loans include exposures with specific characteristics described by the supervisoryprovisions.
As to the classification under restructured loans, either cash or “off-balance sheet“, the Bank complies with thesupervisory provisions, analytically assessing the presence of the requirements prescribed by the regulations.
Positions which are overdue are kept under constant review by the Risk Control Area with the help of specificcomputerised procedures.
Value adjustments are made on the basis of measurement criteria and methods that are objective and prudent.In fact, loss forecasts represent the synthesis of more than one factor deriving from various assessments (bothinternal and external) of the capital that is available to the main debtor and any guarantors. Loss forecastmonitoring is constant and organic and in any event related to how individual positions develop.The time element in the discounting-back of impaired loans is determined based on specific valuations of eachsector of activity carried out on the basis of information relating to the various court districts.

Notes to the financial statements
130
Quantitative information
A. Credit quality
A.1 Performing and impaired loans: amounts, value adjustments, changes, break-down by type andgeographical area
A.1.1 Loans: break-down by portfolio and credit quality (book values)
A.1.2 Loans: break-down by portfolio and credit quality (gross and net values)
Portfo lio / Quality
Non
Performing
Loans
Problem
loans
Restructured
loans
Expired
loansOthes assets Total
1. Financial assets held for trading 11,035 11,035
2. Available-for-sale financial assets 110 822,583 822,693
3. Held-to-maturity investments 120,889 120,889
4. Amount due from banks 167,016 167,016
5. Amounts due from customers 116,967 94,748 3,921 28,600 5,530,614 5,774,850
6. Financial assets at fair value through
profit or loss
7. Financial assets under disposal
8. Hedging derivatives 5,631 5,631
T o tale 31/ 12/ 2011 117,077 94,748 3,921 28,600 6,657,768 6,902,114
T o tale 31/ 12/ 2010 81,024 66,165 3,130 23,802 5,991,877 6,165,998
Gross
exposure
Specific
adjustmentsNet exposure
Gross
exposure
Specific
adjustmentsNet exposure
1. Financial assets held for trading 11,035 11,035 11,035
2. Available-for-sale financial assets 110 110 822,583 822,583 822,693
3. Held-to-maturity investments 120,889 120,889 120,889
4. Amount due from banks 167,016 167,016 167,016
5. Amounts due from customers 346,786 (102,550) 244,236 5,557,188 (26,574) 5,530,614 5,774,850
6. Financial assets at fair value through
profit o r loss
7. Financial assets under disposal
8. Hedging derivatives 5,631 5,631 5,631
T o tal 31/ 12/ 2011 346,896 (102,550) 244,346 6,684,342 (26,574) 6,657,768 6,902,114
T o tal 31/ 12/ 2010 261,702 (87,581) 174,121 6,017,559 (25,682) 5,991,877 6,165,998
Portfo lio / Quality
Impaired assets Perfoming assets
Total
(net exposure)

Notes to the financial statements
131
Breakdown of performing exposures
The item “Amounts due from customers” includes net receivables arising from renegotiations with Collectiveagreements for Euro 25.3 million and Euro 341.0 million of expired loans in relation to which the breakdown isreported according to the maturity date of the same.
A.1.3 Cash and off-balance sheet loans to banks: gross and net values
A.1.4 Banking group – Cash and off-balance sheet loans to banks: change in impaired loans - gross
None at the reference date.
A.1.5 Banking group – Cash and off-balance sheet loans to banks: changes in overall impairments
None at the reference date.
. Amounts due from customers 5,557,189 (26,574) 5,530,615
of which . Expired loans 344,790 (3,792) 340,998
. Until 3 months 307,872 (3,197) 304,675
. Betw een 3 and 5 months 33,460 (496) 32,694
. Betw een 6 months and 1 year 3,386 (96) 3,290
. Beyond 1 year 72 (3) 69
Portfolio/quality
Performing loans
Gross exposure Portfolio adjustments Net exposure
Type of loan / AmountGross
exposure
Portfolio
adjustments
Net
exposure
Net exposure
A. Cash loans
a) Non-performing loans
b) Problem loans
c) Restructured loans
d) Expired loans
e) Other assets 380,043 380,043
Total A 380,043 380,043
B. Off-balance sheet loans
a) Impaired - -
b) Other 26,221 ( 45) 26,176
Total B 26,221 ( 45) 26,176
Total (A+B) 406,264 ( 45) 406,219

Notes to the financial statements
132
A.1.6 Cash and off-balance sheet loans to customers: gross and net values
A.1.7 Cash loans to customers: changes in impaired loans– gross
Type of loan / Amount
Gross
exposure
Portfolio
adjustments
Net
exposure
Net exposure
A. Cash loans
a) Non-performing loans 190,148 (73,071) - 117,077
b) Problem loans 122,675 (27,927) - 94,748
c) Restructured loans 4,361 (440) - 3,921
d) Expired loans 29,712 (1,112) - 28,600
e) Other assets 6,296,227 - (26,574) 6,269,653
Total A 6,643,123 (102,550) (26,574) 6,513,999
B. Off-balance sheet loans
a) Impaired 7,171 (95) - 7,076
b) Other 326,272 (746) 325,526
Total B 333,443 (95) (746) 332,602
Total (A+B) 6,976,566 (102,645) (27,320) 6,846,601
Type / Category
Non-
performing
loans
Problem
loans
Restructured
loans
Expired
loans
A. Opening gross exposure 142,346 91,064 3,512 24,771
of w hich: loans sold but not w ritten
off
B. Increases 99,708 149,905 2,350 99,632
b.1 from performing loans 7,503 88,404 267 91,372
of impaired loans 82,663 25,532 383 623
B.3 other increases 9,542 35,969 1,700 7,637
C. Decreases 51,906 118,294 1,501 94,691
c.1 to performing loans 12,084 40,148
C.2 w rite-offs 30,945
C.3 collections 20,739 30,144 1,501 21,598
C.4 arising from sales 34
impaired loans 188 76,066 32,945
C.6 other decreases
D. Closing gross exposure 190,148 122,675 4,361 29,712
of w hich: loans sold but not w ritten
off

Notes to the financial statements
133
A.1.8 Cash loans to customers: changes in total value adjustments
A.2 Break-down of exposures based on external ratings
A.2.1 Break-down of cash and off-balance sheet loans by classes of external ratings (book values)
In accordance with the compilation regulations laid down by the Bank of Italy, this table has not been filled in
because the amount of exposure with external ratings is modest.
A.2.2 Break-down of cash and off-balance sheet loans by classes of internal ratings
The Bank does not use internal rating models for the determination of capital requirements.As outlined in the section dedicated to qualitative information (paragraph 2.2), the Parent Company hasdeveloped, for management purposes, a rating model aimed at assessing retail clients (private consumers andmicro enterprises) and to Corporate clients (enterprises with a turnover of over Euro 1million).
The following table shows, as regards the performing loans belonging to the above mentioned segments, theweight of each rating class on the aggregate loans.
Loans as at 31.12.2011 Internal rating classes
from AAA to A from BBB to B from CCC to CC Total
Cash loans 35.9% 45.6% 18.5% 100%
Off-balance sheet loans 60.4% 32.6% 7.0% 100%
Type/Category
Non-
performing
loans
Problem
loans
Restructured
loans
Expired
loans
A. Total opening adjustments 61,322 24,908 382 969
of w hich: loans sold but not w ritten off
B. Increases 53,191 22,768 301 1,149
B.1 transfer from other categories of impaired loans 35,262 19,945 87 1,069
14,629 190 162 56
B.3 other increases 3,300 2,633 52 24
C. Decreases 41,442 19,749 243 1,006
C.1 w rite-backs due to valuation 5,816 3,459 159 594
C.2 w rite-backs due to collection 4,681 1,503 84 161
C.3 w rite-offs 30,945
C.4 transfer to other categories of impaired loans 14,787 251
C.5 other decreases
D. Total closing adjustments 73,071 27,927 440 1,112
of w hich: loans sold but not w ritten off

Notes to the financial statements
134
A.3 Breakdown of guaranteed loans by type of guarantee
A.3.2 Secured loans to banks
Property SecuritiesOther real
guaranteesCLN
Governments
and Central
banks
Other
public
entities
BanksOther
entities
Governments
and Central
banks
Other
public
entities
BanksOther
entities
1.1fully secured 3,816,331 5,947,893 457,336 98,484 2,361 3,269,048 9,775,122
- o f which impaired 185,515 342,919 9,299 1,916 394,873 749,007
1.2 partially secured 207,027 9,298 46,360 21,802 72,553 150,013
- o f which impaired 10,032 103 717 1,149 6,124 8,093
2.1fully secured 121,645 36,425 13,273 9,823 141,787 201,308
- o f which impaired 3,180 1,740 34 3,521 5,295
2.2 partially secured 32,177 8,670 2,606 7,216 18,492
- o f which impaired 65 39 10 49
2. Secured o ff -balance sheet
lo ans
Net amount of
loan
Real GuaranteesPersonal Guarantees
T o tal
Credit derivates Endorsements
Other derivates
1. Secured cash lo ans:
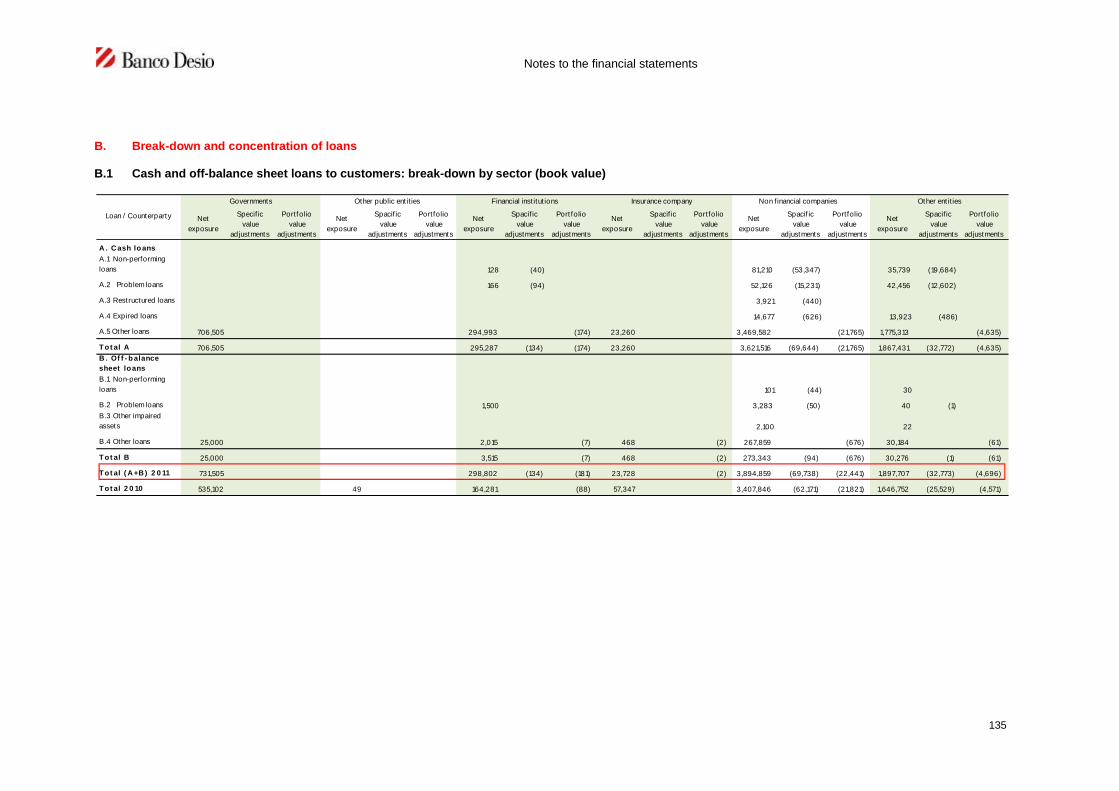
Notes to the financial statements
135
B. Break-down and concentration of loans
B.1 Cash and off-balance sheet loans to customers: break-down by sector (book value)
Net
exposure
Specif ic
value
adjustments
Portfolio
value
adjustments
Net
exposure
Spacif ic
value
adjustments
Portfolio
value
adjustments
Net
exposure
Spacif ic
value
adjustments
Port folio
value
adjustments
Net
exposure
Spacif ic
value
adjustments
Portfolio
value
adjustments
Net
exposure
Spacif ic
value
adjustments
Portfolio
value
adjustments
Net
exposure
Spacif ic
value
adjustments
Portfolio
value
adjustments
A . C ash lo ans
A.1 Non-performing
loans 128 (40) 81,210 (53,347) 35,739 (19,684)
A.2 Problem loans 166 (94) 52,126 (15,231) 42,456 (12,602)
A.3 Restructured loans 3,921 (440)
A.4 Expired loans 14,677 (626) 13,923 (486)
A.5 Other loans 706,505 294,993 (174) 23,260 3,469,582 (21,765) 1,775,313 (4,635)
T ot al A 706,505 295,287 (134) (174) 23,260 3,621,516 (69,644) (21,765) 1,867,431 (32,772) (4,635)
B . Of f - b alance
sheet loans
B.1 Non-performing
loans 101 (44) 30
B.2 Problem loans 1,500 3,283 (50) 40 (1)
B.3 Other impaired
assets 2,100 22
B.4 Other loans 25,000 2,015 (7) 468 (2) 267,859 (676) 30,184 (61)
T ot al B 25,000 3,515 (7) 468 (2) 273,343 (94) (676) 30,276 (1) (61)
T ot al ( A +B ) 2 0 11 731,505 298,802 (134) (181) 23,728 (2) 3,894,859 (69,738) (22,441) 1,897,707 (32,773) (4,696)
T ot al 2 0 10 535,102 49 164,281 (88) 57,347 3,407,846 (62,171) (21,821) 1,646,752 (25,529) (4,571)
Other ent it ies
Loan / Counterparty
Governments Other public entit ies Financial inst itut ions Insurance company Non financial companies

Notes to the financial statements
136
B.2 Cash and off-balance sheet loans to customers: break-down by geographical area (book value)
Net
exposure
Total value
adjustments
Net
exposure
Total value
adjustments
Net
exposure
Total value
adjustments
Net
exposure
Total value
adjustments
Net
exposure
Total value
adjustments
A . C ash lo ans
A.1 Non-performing loans 116,967 (73,071) 110
A.2 Problem loans 94,748 (27,927)
A.3 Restructured loans 3,921 (440)
A.4 Expired loans 28,600 (1,112)
A.5 Other loans 6,258,535 (26,466) 9,488 (108) 1,460 170
T OT A L A 6,502,771 (129,016) 9,488 (108) 1,570 170
B . Off -balance sheet lo ans
B.1 Non-performing loans 131 (44)
B.2 Problem loans 4,823 (51)
B.3 Other impaired assets 2,122
B.4 Other loans 325,370 (746) 156
T OT A L B 332,446 (841) 156
T OT A L (A +B ) 2011 6,835,217 (129,857) 9,644 (108) 1,570 170
T OT A L 2010 5,798,252 (114,086) 10,846 (94) 1,574 705
Rest o f the world
Loans / Geographical areas
Italy Other European Countries America Asia

Notes to the financial statements
137
B.3 Cash and off-balance sheet loans to banks: break-down by geographical area (book value)
Net
exposure
Total value
adjustments
Net
exposure
Total value
adjustments
Net
exposure
Total value
adjustments
Net
exposure
Total value
adjustments
Net
exposure
Total value
adjustments
A . C ash lo ans
A.1 Non-performing loans
A.2 Problem loans
A.3 Restructured loans
A.4 Expired loans
A.5 Other loans 342,568 36,773 507 87 108
T OT A L 342,568 36,773 507 87 108
B . Off -balance sheet
lo ans
B.1 Non-performing loans
B.2 Problem loans
B.3 Other impaired assets
B.4 Other loans 20,885 5,185 2 83 (36) 21 (9)
T OT A L 20,885 5,185 2 83 (36) 21 (9)
T OT A L 2011 363,453 41,958 509 170 (36) 129 (9)
T o ta l 2010 648,071 72,085 661 611 (38) 1,572 (120)
Rest o f the world
Loans / Geographical
areas
Italy Other European Countries America Asia

Notes to the financial statements
138
B.4 Large risks
With reference to the supervisory regulations in force, two positions were recognised for a total nominal amount,including guarantees and commitments issued, of Euro 1,108.6 million, and for a weighted total of nil.Below is the breakdown of the three positions:
nominal amounts weighted amounts
. relations with Group companies : 402.1 million 0
. Treasury Ministry: 706.5 million 0

Notes to the financial statements
139
C. Securitisation transactions and asset disposal
C.1 Securitization transactions
Quantitative information
C.1.1 Loans arising from securitization transactions divided by quality of the underlying assets
C.1.2 Banking group – Loans arising from the main “Bank” securitization transactions divided by type of securitized assets and by type of exposure
None.
Gross
exposureNet exposure
Gross
exposure
Net
exposure
Gross
exposure
Net
exposure
Gross
exposure
Net
exposure
Gross
exposure
Net
exposure
Gross
exposure
Net
exposure
Gross
exposure
Net
exposure
Gross
exposure
Net
exposure
Gross
exposure
Net
exposure
A . W it h own underlying asset s
a) impaired
b) other
B . W it h t hird p art y und erlying asset s
a) impaired
b) other 721 721
Senior M ezzanine JuniorUnderlying asset quality /
Loans
Cash loans Guarantees granted Credit lines
Senior M ezzanine Junior Senior M ezzanine Junior
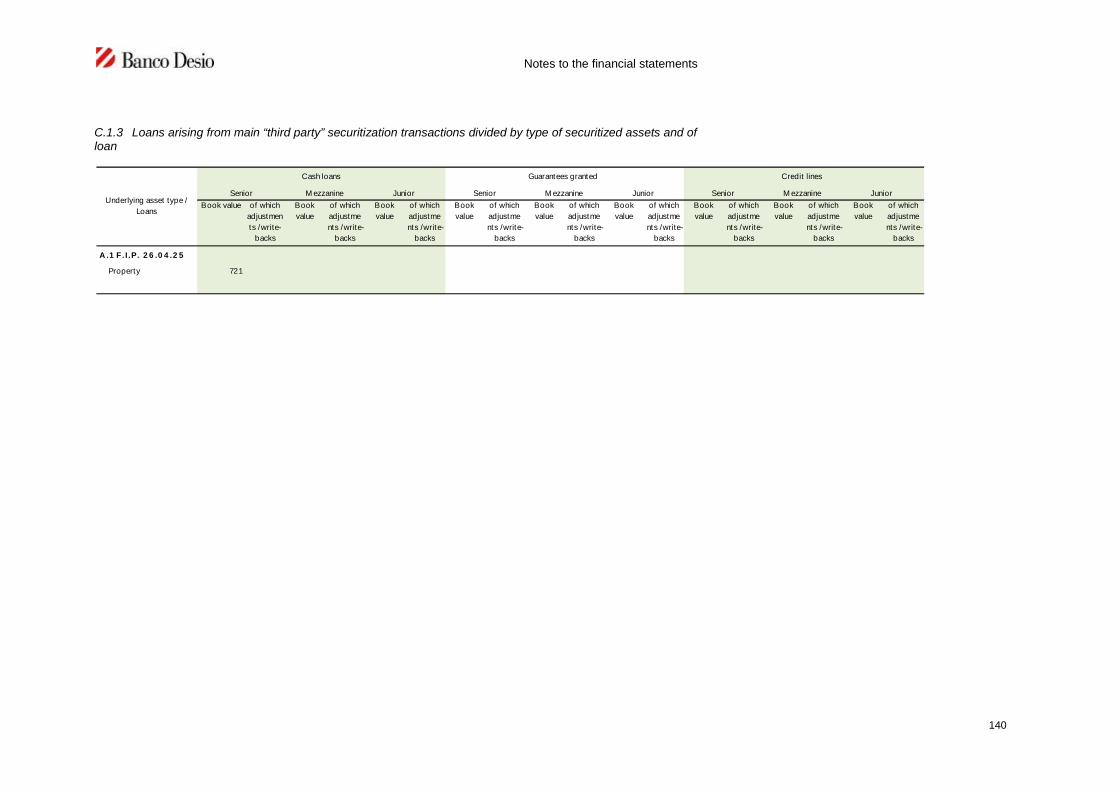
Notes to the financial statements
140
C.1.3 Loans arising from main “third party” securitization transactions divided by type of securitized assets and ofloan
Book value of which
adjustmen
ts /write-
backs
Book
value
of which
adjustme
nts /write-
backs
Book
value
of which
adjustme
nts /write-
backs
Book
value
of which
adjustme
nts /write-
backs
Book
value
of which
adjustme
nts /write-
backs
Book
value
of which
adjustme
nts /write-
backs
Book
value
of which
adjustme
nts /write-
backs
Book
value
of which
adjustme
nts /write-
backs
Book
value
of which
adjustme
nts /write-
backs
A .1 F .I .P. 2 6 .0 4 .2 5
Property 721
Senior M ezzanine Junior Senior M ezzanine JuniorUnderlying asset type /
Loans
Cash loans Guarantees granted Credit lines
Senior M ezzanine Junior

Notes to the financial statements
141
C.1.4 Exposures arising from securitizations broken down by portfolio and by type
Exposure / Portfolio
Financial
assets held
for trading
Financial
assets
valued at
fair value
Availabel-
for-sale
financial
assets
Held-to-
maturity
f inancial
assets
Loans due
from banks
31.12.2011 31.12.2010
1. Cash loans
- senior 721 721 1,307
- mezzanine
- junior
2. Off-balance sheet loans
- senior
- mezzanine
- junior

Notes to the financial statements
142
C.2 Asset disposals
C.2.1 Financial assets sold but not written off
Legend:A = Transferred financial assets fully recognised (book value)B = Transferred financial assets partially recognised (book value)C = Transferred financial assets partially recognised (full value)
Financial assets held for
t rading
Financial assets at fair
value through prof it and
loss
Availabile-for-sale financial
assets
Held-to-maturity f inancial
assetsLoans due from banks
Loans due from
customersT ot al
3 1.12 .2 0 11 3 1.12 .2 0 10
A . C ash asset s
1. Debt securit ies 6,049 35,059 4 1,10 8 16 0 ,9 76
2. Equity securit ies
3. U.C.I.T.S
4. Financing
B . D erivat ive
inst rument s
To t al 3 1/ 12 / 2 0 11 6 ,0 4 9 3 5,0 59 4 1,10 8 16 0 ,9 76
of which impaired
To t al 3 1/ 12 / 2 0 10 3 52 12 3 ,178 3 3 ,3 3 8 4 ,10 8 16 0 ,9 76
of which impaired

Notes to the financial statements
143
C.2.2 Financial liabilities against financial assets sold but not written off
Liabilit ies / Assets port folioFinancial assets
held for t rading
Financial assets
valued at fair
value
Availabile-for-
sale f inancial
assets
Held-to-
maturity
f inancial assets
Loans due from
banks
Loans due from
customersT ot al
1. D ue t o cust o mers
a) corresponding to fully
recorded assets 6,048 5,466 11,514
b) corresponding to part ially
recorded assets
2 . Due t o banks
a) corresponding to fully
recorded assets 29,271 2 9 ,2 71
b) corresponding to part ially
recorded assets
To t al 3 1/ 12 / 2 0 11 6 ,0 4 8 3 4 ,73 7 4 0 ,78 5
To t al 3 1/ 12 / 2 0 10 3 52 12 3 ,8 0 1 3 1,9 2 6 4 ,10 8 16 0 ,18 7
Notes to the financial statements
144
SECTION 2 –MARKET RISKS
2.1 Interest rate risk and price risk- regulatory trading portfolio
Qualitative information
A. General aspects
The unexpected variations in market rates, when there are differences in maturity dates and in the times at whichinterest rates on assets and liabilities are reviewed, give rise to a variation in net interest flow and thus in interestmargin.Furthermore, such unexpected fluctuations expose the bank to variations in the economic value of assets andliabilities.The Bank adopted a strategy aimed at consolidating a return in line with the budget, while ensuring a low riskprofile, through a low portfolio duration.
B. Interest rate risk and price risk management processes and measurement methods
The operational activity of the Finance Department is monitored by the internal control system both for operatinglimits (in terms of amount and composition by type of securities) and interest rate risk and price risk. Specifically,duration limits are laid down in order to limit interest rate risk. The Bank carries out both hedging and tradingtransactions and has established stop-loss limits on high-volatility financial instruments such as derivatives andequity. The Head Office is informed, on a daily basis, of operations and amounts in portfolios, as well as informingit in the event that operating limits have been reached.
Together with the abovementioned controls, the Bank has adopted the use of internal models, assigning themonitoring and the measurement of interest rate risk and price risk to the risk management unit, which operatescompletely independently with respect to operational offices.In order to quantify generic risks, the Bank has adopted a model based on the Value at Risk (VaR) concept, inorder to express, synthetically and in monetary terms, the maximum probable loss incurred by a static portfoliowith reference to a specific investment horizon and a specific level of confidence in normal market conditions.This method has the advantage of allowing the aggregation of the various risk positions taken in the accountsinvolving heterogeneous risk factors, and also provides a synthetic number that is easy for the organisational unitconcerned to use because it is expressed in monetary terms.This is a parametric model of a variance-covariance type for “linear” instruments with a delta-gamma typeestimate for options, and uses a 99% confidence interval over a 10-day time horizon, in line with therecommendations defined by the Basel Committee. This model covers the assets, in term of financial instruments,included both in managed and trading portfolios, as defined in the regulations regarding reports to the SupervisoryBoard and subject to the capital requirements for market risk.The model uses matrixes containing the standard deviations of each risk factor (interest rates, exchange ratesand prices) together with the relevant correlations. The determination of volatilities and correlations is based onthe modelling under a normal scenario of the daily logarithmic returns of the risk factors, though the exponentialweighting based on a decline factor in a period corresponding to 250 observations.The application used for the calculation of VaR is ALMpro, while the financial information necessary for thedetermination of VaR (volatility, correlations, term structure of interest rates, exchange rates, stock andbenchmark indices) is provided by the RiskSize product.To date, derivatives on currencies and interest rates and options on shares and indices entered into for tradingpurposes are excluded from this analysis; almost all the business, however, is conducted on a brokerage basis.The VaR of equity instruments is measured considering the link (beta coefficient) between the trend of the singleinstrument and that of its benchmark (stock or benchmark index for U.C.I.T.S units).Stress test activities are carried out using parallel shifts in the yield curve, assuming variations of +/- 100 basispoints only for interest rate sensitive holdings; the necessary research activities are being performed which willlead to the implementation of “backtesting” analysis.
Trading activity is subject to operating limits laid down by the Board of Directors and expressed for eachdelegation level in terms of VaR. The interest rate risk and price risk and compliance with the limits are monitoreddaily. A special reporting system is the instrument that has been chosen to give the organisational units involvedsufficient information. The contents and the frequency of the reports depend on the objectives assigned to eachparty in the process. The results of the monitoring are in any event given daily to the Finance Department

Notes to the financial statements
145
Manager and to the top Management. Given the market turbulence that characterised the 2011 financial year, theoverall V.a.R limits related to the “managed portfolio” were exceeded in the period of reference, although they stillfell within the delegated limits.
The internal model is not used in the calculation of the capital requirement on market risks.
Quantitative information
1. Regulatory trading portfolio: break-down by outstanding maturity (repricing date) for cash assets andliabilities and financial derivatives
Currency of denomination: Euro
Type/Residual maturity
On
demand
Up to 3
months
Between 3
and 6
months
Between 6
months
and 1year
Between 1
and 5 years
Between 5
and 10
years
Beyond 10
years
Unspecifie
d
maturity
1. C ash assets 5,920 10 1,502 1,085 13 7
1.1Debt securities 5,920 10 1,502 1,085 13 7
- with an option for early
redemption
- o ther 5,920 10 1,502 1,085 13 7
1.2 Other assets
2. C ash liabilit ies 5 5,493 549
2.1reverse repos 5 5,493 549
2.2 Other liabilities
3. F inancial derivates 181,503 13,984 11,934 28,233
3.1With underlying security 51,729 10,949 11,145 28,233
- Options
+Long positions
+Short positions
- Other derivates 51,729 10,949 11,145 28,233
+Long positions 38,648 9,137 1,307 2,176
+Short positions 13,081 1,812 9,838 26,057
3.2 With no underlying security 129,774 3,035 789
- Options
+Long positions
+Short positions
- Other derivates 129,774 3,035 789
+Long positions 65,454 1,518 395
+Short positions 64,320 1,517 394

Notes to the financial statements
146
Currency of denomination: US Dollar
Type/Residual maturity
On
demand
Up to 3
months
Between 3
and 6
months
Between 6
months
and 1year
Between 1
and 5 years
Between 5
and 10
years
Beyond 10
years
Unspecified
maturity
1. C ash assets
1.1Debt securities
- with an option for early
redemption
- o ther
1.2 Other assets
2. C ash liabilit ies
2.1reverse repos
2.2 Other liabilities
3. F inancial derivates 51,746 3,216 310
3.1With underlying security
- Options
+Long positions
+Short positions
- Other derivates
+Long positions
+Short positions
3.2 With no underlying security 51,746 3,216 310
- Options
+Long positions
+Short positions
- Other derivates 51,746 3,216 310
+Long positions 25,698 1,608 155
+Short positions 26,048 1,608 155

Notes to the financial statements
147
Currency of denomination:UK Pound Sterling
Type/Residual maturity
On
demand
Up to 3
months
Between 3
and 6
months
Between 6
months
and 1year
Between 1
and 5 years
Between 5
and 10
years
Beyond 10
years
Unspecified
maturity
1. C ash assets
1.1Debt securities
- with an option for early
redemption
- o ther
1.2 Other assets
2. C ash liabilit ies
2.1reverse repos
2.2 Other liabilities
3. F inancial derivates 6,114
3.1With underlying security
- Options
+Long positions
+Short positions
- Other derivates
+Long positions
+Short positions
3.2 With no underlying security 6,114
- Options
+Long positions
+Short positions
- Other derivates 6,114
+Long positions 3,023
+Short positions 3,091

Notes to the financial statements
148
Currency of denomination:Swiss Franc
Type/Residual maturity
On
demand
Up to 3
months
Between 3
and 6
months
Between 6
months
and 1year
Between 1
and 5 years
Between 5
and 10
years
Beyond 10
years
Unspecified
maturity
1. C ash assets
1.1Debt securities
- with an option for early
redemption
- o ther
1.2 Other assets
2. C ash liabilit ies
2.1reverse repos
2.2 Other liabilities
3. F inancial derivates 797 248
3.1With underlying security 256 248
- Options
+Long positions
+Short positions
- Other derivates 256 248
+Long positions 128 124
+Short positions 128 124
3.2 With no underlying security 541
- Options
+Long positions
+Short positions
- Other derivates 541
+Long positions 170
+Short positions 371

Notes to the financial statements
149
Currency of denomination:Canadian Dollar
Type/Residual maturity
On
demand
Up to 3
months
Between 3
and 6
months
Between 6
months
and 1year
Between 1
and 5 years
Between 5
and 10
years
Beyond 10
years
Unspecified
maturity
1. C ash assets
1.1Debt securities
- with an option for early
redemption
- o ther
1.2 Other assets
2. C ash liabilit ies
2.1reverse repos
2.2 Other liabilities
3. F inancial derivates 157
3.1With underlying security
- Options
+Long positions
+Short positions
- Other derivates
+Long positions
+Short positions
3.2 With no underlying security 157
- Options
+Long positions
+Short positions
- Other derivates 157
+Long positions 79
+Short positions 78
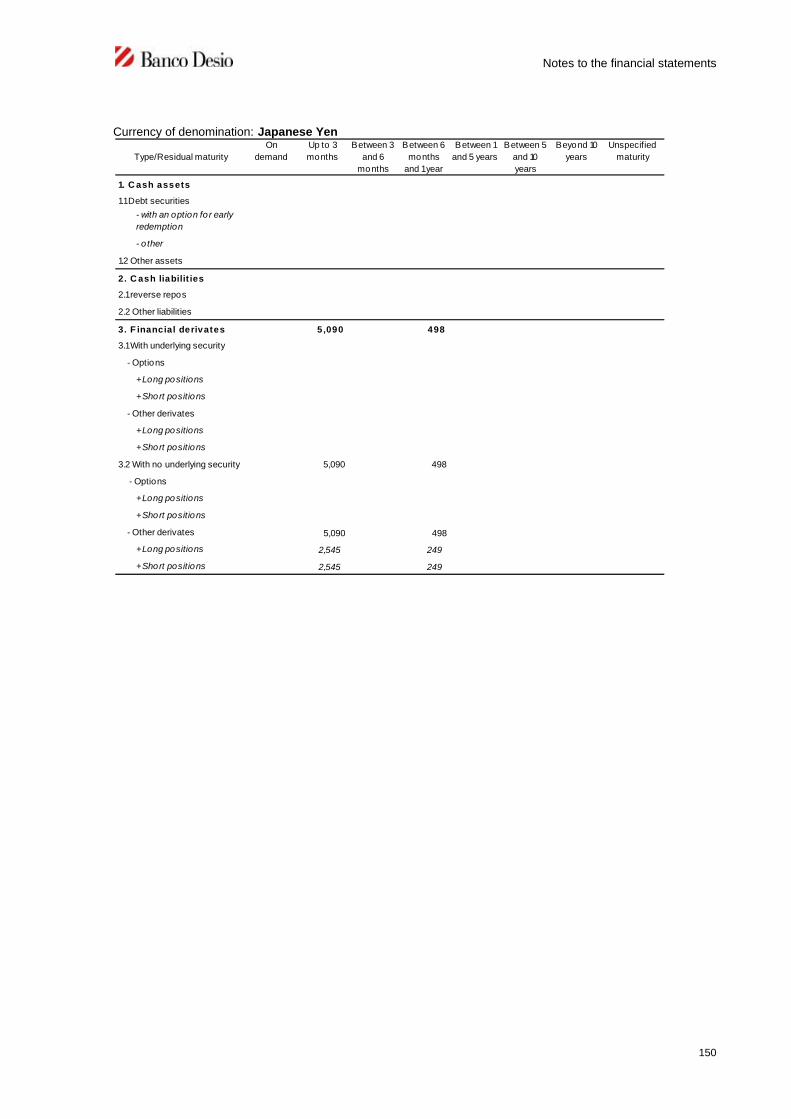
Notes to the financial statements
150
Currency of denomination: Japanese Yen
Type/Residual maturity
On
demand
Up to 3
months
Between 3
and 6
months
Between 6
months
and 1year
Between 1
and 5 years
Between 5
and 10
years
Beyond 10
years
Unspecified
maturity
1. C ash assets
1.1Debt securities
- with an option for early
redemption
- o ther
1.2 Other assets
2. C ash liabilit ies
2.1reverse repos
2.2 Other liabilities
3. F inancial derivates 5,090 498
3.1With underlying security
- Options
+Long positions
+Short positions
- Other derivates
+Long positions
+Short positions
3.2 With no underlying security 5,090 498
- Options
+Long positions
+Short positions
- Other derivates 5,090 498
+Long positions 2,545 249
+Short positions 2,545 249

Notes to the financial statements
151
Currency of denomination: Other currencies
Type/Residual maturity
On
demand
Up to 3
months
Between 3
and 6
months
Between 6
months
and 1year
Between 1
and 5 years
Between 5
and 10
years
Beyond 10
years
Unspecified
maturity
1. C ash assets
1.1Debt securities
- with an option for early
redemption
- o ther
1.2 Other assets
2. C ash liabilit ies
2.1reverse repos
2.2 Other liabilities
3. F inancial derivates 5,134
3.1With underlying security
- Options
+Long positions
+Short positions
- Other derivates
+Long positions
+Short positions
3.2 With no underlying security 5,134
- Options
+Long positions
+Short positions
- Other derivates 5,134
+Long positions 2,316
+Short positions 2,818

Notes to the financial statements
152
3. Regulatory trading portfolio - internal models and other methods for sensitivity analyses
Monitoring effected on the “regulatory trading portfolio” during the 2011 financial year showed a structure withlimited market risk. Given the policy implemented by the Group to underestimate price risks, the “regulatory tradingportfolio” is almost entirely exposed to the interest rate risk.
The VaR at 31 December 2011 is Euro 39 thousand, with a percentage of less than 0.53% of the trading portfolioand a duration of 0.75, evidence of the low-risk profile.
The scenario analyses carried out in terms of parallel shifts in the rate curve, assumed variations of +/- 100 basis
points only for the positions that are sensitive to interest rates. As at 31.12.2011, considering the positive variation
in rates and the economic data on an annual basis, there was a negative impact of Euro 48 thousand, equal to:
0.53 % of trading portfolio; 0.02 % of business margin; 0.14 % of net income for the period; 0.01 % of shareholders’ equity, net of the result for the period.
2.2 Interest rate risk and price risk – banking portfolio
Qualitative information
A. General aspects, management procedures and methods of measuring interest rate risk and pricerisk
It is the responsibility of the risk management unit, which is autonomous with respect to operating areas, tomeasure interest rate risk. The system of the bank’s commercial activities consisting of balance sheet asset andliability maturity transformation, the treasury operations and the respective hedging derivatives is monitored usingAsset and Liability Management (ALM) methods, through the ALMpro application. Risks are measured eachmonth adopting a static approach; the Simulation module is also active which allows the monitoring andmanagement of the interest rate risk adopting a dynamic approach.The static analysis which is currently implemented allows the impacts of variations in interest rate structure to bemeasured and expressed in terms both of the variation in the economic value of assets and the interest margin.Decision-making is aimed at minimising the volatility of the expected interest margin and of economic value,directing the bank’s strategy so that it takes up the opportunities the market offers as the interest rate structurevaries.The model covers the assets and liabilities exposed to interest rate risk, included both in the banking portfolio heldfor management purposes and in the financial statements. The results of the banking portfolio held for thepurposes of the financial statements are therefore presented, excluding the financial instruments in the regulatorytrading portfolio from this analysis.Interest margin variability, determined by positive and negative changes in rates over a 365-day time horizon, isestimated by gap analysis, with the help of a number of different approaches in order to increase the accuracy ofthe forecasts.The variations in the economic value of assets and liabilities are analysed applying Duration Gap and SensitivityAnalysis methods.The analyses are performed using parallel shifts in the yield curve and specific scenarios of market rate changes.
B. Fair Value hedge
The Bank’s primary objective is to manage the risks associated with its operations prudently and actively, namely
on the basis of a determinate risk profile that allows it to take up any opportunities deriving from risk factor
variations.
Notes to the financial statements
153
To date, the Bank only takes out Fair Value type hedges in order to protect the profit and loss account from the
risks deriving from unfavourable variations in Fair Value; the objective of the hedge is to set off Fair Value
variations in the hedged instrument against Fair Value variations in the hedging instrument. To date, hedged
instruments relate to both assets and liabilities, and of these only bond loans, while derivative instruments are
used as hedges, which are represented by unlisted securities - mainly Interest Rate Swaps and interest rate
options - used to hedge interest rate risks only.
The Bank has prepared a model that can handle hedge accounting in compliance with the relevant regulations
laid down in IAS accounting standards. The method the Bank uses to carry out the effectiveness test is the Dollar
Offset Method (hedge ratio) on a cumulative basis, namely the comparison between changes in Fair Value of the
hedging instrument and of the hedged instrument. All the hedges are specific.
The Bank, with the purpose of making the fair value of the entire financial instrument more reliable andrepresentative, applied the Fair Value Option to some types of bonds issued.
C. Cash flow hedge
No cash flow hedge transactions have been effected by the Bank.

Notes to the financial statements
154
Quantitative information
1. Banking portfolio: distribution by outstanding maturity (repricing date) of banking assets and liabilities.
Currency of denomination:Euro
Type/Residual maturity
On demand Up to 3
months
Between 3
and 6
months
Between 6
months
and 1year
Between 1
and 5 years
Between 5
and 10
years
Beyond 10
years
Unspecified
maturity
1. C ash assets
1.1Debt securities
- with an option for early
redemption 16,926 953 5,919 1,958 721
- other 4,779 47,856 24,967 202,802 461,491 200,642
1.2 Financing to banks 24,845 52,372 4,500 97
1.3 Financing to customers
- Current account 1,463,011 443 1,612 3,084 32,812 1,968
- other loans
- with an option for early
redemption 45,998 2,475,013 80,636 52,433 203,662 78,871 1,872
- other 426,959 688,379 51,373 30,882 99,799 8,342 491
2. C ash liabilit ies
2.1Due to customers
- Current account 3,270,295 43,434 42,189 16,521
- other debts
- with an option for early
redemption
- other 49,148 5,473 2,213 4,070 17,595
2.2 Due to banks
- Current account 23,886
- other 68,086 214,821 28,918
2.3 Debt securities
- with an option for early
redemption 150 29,657
- other 16,773 683,058 401,197 235,865 1,153,825 16,906
2.4 Other liabilities
- with an option for early
redemption
- other
3. F inancial derivates
3.1With underlying security
- Options
+Long positions
+Short positions
- Other derivates
+Long positions
+Short positions
3.2 With no underlying security
- Options
+Long positions 1,126 1,460 5,770 194,400 45,163 44,241
+Short positions 211,082 4,441 4,319 72,320
- Other derivatives
+Long positions 78,016 20,000 10,000 206,637 10,000
+Short positions 232,233 92,420

Notes to the financial statements
155
Currency of denomination:US Dollar
Type/Residual maturity
On demand Up to 3
months
Between 3
and 6
months
Between 6
months
and 1year
Between 1
and 5 years
Between 5
and 10
years
Beyond 10
years
Unspecified
maturity
1. C ash assets 214 65,989 2,148 34
1.1Debt securities
- with an option for early
redemption
- other
1.2 Financing to banks 157 51,492
1.3 Financing to customers 57 14,497 2,148 34
- Current account 5
- other loans
- with an option for early
redemption
- other 52 14,497 2,148 34
2. C ash liabilit ies 32,196 35,551
2.1Due to customers 22,180
- Current account 22,180
- other debts
- with an option for early
redemption
- other
2.2 Due to banks 10,016 35,551
- Current account 9,988
- other 28 35,551
2.3 Debt securities
- with an option for early
redemption
- other
2.4 Other liabilities
- with an option for early
redemption
- other
3. F inancial derivates
3.1With underlying security
- Options
+Long positions
+Short positions
- Other derivates
+Long positions
+Short positions
3.2 With no underlying security304
- Options
+Long positions
+Short positions
- Other derivatives 304
+Long positions 152
+Short positions 152

Notes to the financial statements
156
Currency of denomination:UK Pound Sterling
Type/Residual maturity
On demand Up to 3
months
Between 3
and 6
months
Between 6
months
and 1year
Between 1
and 5 years
Between 5
and 10
years
Beyond 10
years
Unspecified
maturity
1. C ash assets 1,226 1,847 12
1.1Debt securities
- with an option for early
redemption
- other
1.2 Financing to banks 693 1,712
1.3 Financing to customers 533 135 12
- Current account 533
- other loans
- with an option for early
redemption
- other 135 12
2. C ash liabilit ies 1,114 1,892
2.1Due to customers 1,067
- Current account 1,067
- other debts
- with an option for early
redemption
- other
2.2 Due to banks 47 1,892
- Current account 44
- other 3 1,892
2.3 Debt securities
- with an option for early
redemption
- other
2.4 Other liabilities
- with an option for early
redemption
- other
3. F inancial derivates
3.1With underlying security
- Options
+Long positions
+Short positions
- Other derivates
+Long positions
+Short positions
3.2 With no underlying security
- Options
+Long positions
+Short positions
- Other derivatives
+Long positions
+Short positions

Notes to the financial statements
157
Currency of denomination:Swiss Franc
Type/Residual maturity
On demand Up to 3
months
Between 3
and 6
months
Between 6
months
and 1year
Between 1
and 5 years
Between 5
and 10
years
Beyond 10
years
Unspecified
maturity
1. C ash assets 2,032 2,502
1.1Debt securities
- with an option for early
redemption
- other
1.2 Financing to banks 2,024 8
1.3 Financing to customers 8 2,494
- Current account
- other loans
- with an option for early
redemption
- other 8 2,494
2. C ash liabilit ies 1,709 2,550
2.1Due to customers 1,592
- Current account 1,592
- other debts
- with an option for early
redemption
- other
2.2 Due to banks 117 2,550
- Current account 116
- other 1 2,550
2.3 Debt securities
- with an option for early
redemption
- other
2.4 Other liabilities
- with an option for early
redemption
- other
3. F inancia l derivates
3.1With underlying security
- Options
+Long positions
+Short positions
- Other derivates
+Long positions
+Short positions
3.2 With no underlying security
- Options
+Long positions
+Short positions
- Other derivatives
+Long positions
+Short positions

Notes to the financial statements
158
Currency of denomination: Canadian Dollar
Type/Residual maturity
On demand Up to 3
months
Between 3
and 6
months
Between 6
months
and 1year
Between 1
and 5 years
Between 5
and 10
years
Beyond 10
years
Unspecified
maturity
1. C ash assets 530
1.1Debt securities
- with an option for early
redemption
- other
1.2 Financing to banks 530
1.3 Financing to customers
- Current account
- other loans
- with an option for early
redemption
- other
2. C ash liabilit ies 530
2.1Due to customers 530
- Current account 530
- other debts
- with an option for early
redemption
- other
2.2 Due to banks
- Current account
- other
2.3 Debt securities
- with an option for early
redemption
- other
2.4 Other liabilities
- with an option for early
redemption
- other
3. F inancia l derivates
3.1With underlying security
- Options
+Long positions
+Short positions
- Other derivates
+Long positions
+Short positions
3.2 With no underlying security
- Options
+Long positions
+Short positions
- Other derivatives
+Long positions
+Short positions

Notes to the financial statements
159
Currency of denomination: Japanese Yen
Type/Residual maturity
On demand Up to 3
months
Between 3
and 6
months
Between 6
months
and 1year
Between 1
and 5 years
Between 5
and 10
years
Beyond 10
years
Unspecified
maturity
1. C ash assets 81 7,283
1.1Debt securities
- with an option for early
redemption
- other
1.2 Financing to banks 71
1.3 Financing to customers 10 7,283
- Current account
- other loans
- with an option for early
redemption
- other 10 7,283
2. C ash liabilit ies 34 7,385
2.1Due to customers 24
- Current account 24
- other debts
- with an option for early
redemption
- other
2.2 Due to banks 10 7,385
- Current account 10
- other 7,385
2.3 Debt securities
- with an option for early
redemption
- other
2.4 Other liabilities
- with an option for early
redemption
- other
3. F inancia l derivates
3.1With underlying security
- Options
+Long positions
+Short positions
- Other derivates
+Long positions
+Short positions
3.2 With no underlying security14,770
- Options
+Long positions
+Short positions
- Other derivatives 14,770
+Long positions 7,385
+Short positions 7,385

Notes to the financial statements
160
Currency of denomination: Other currencies
Type/Residual maturity
On demand Up to 3
months
Between 3
and 6
months
Between 6
months
and 1year
Between 1
and 5 years
Between 5
and 10
years
Beyond 10
years
Unspecified
maturity
1. C ash assets 3,084
1.1Debt securities
- with an option for early
redemption
- other
1.2 Financing to banks 3,084
1.3 Financing to customers
- Current account
- other loans
- with an option for early
redemption
- other
2. C ash liabilit ies 2 ,573
2.1Due to customers 2,479
- Current account 2,479
- other debts
- with an option for early
redemption
- other
2.2 Due to banks 94
- Current account 94
- other
2.3 Debt securities
- with an option for early
redemption
- other
2.4 Other liabilities
- with an option for early
redemption
- other
3. F inancia l derivates
3.1With underlying security
- Options
+Long positions
+Short positions
- Other derivates
+Long positions
+Short positions
3.2 With no underlying security
- Options
+Long positions
+Short positions
- Other derivatives
+Long positions
+Short positions
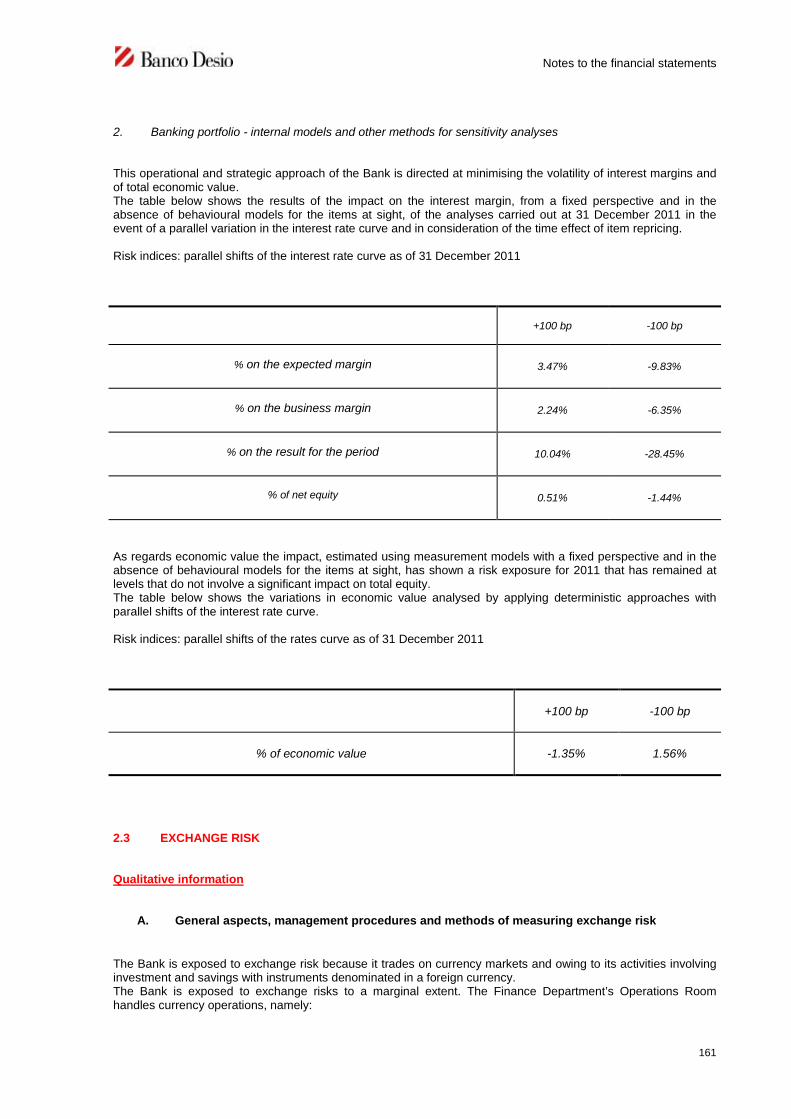
Notes to the financial statements
161
2. Banking portfolio - internal models and other methods for sensitivity analyses
This operational and strategic approach of the Bank is directed at minimising the volatility of interest margins andof total economic value.The table below shows the results of the impact on the interest margin, from a fixed perspective and in theabsence of behavioural models for the items at sight, of the analyses carried out at 31 December 2011 in theevent of a parallel variation in the interest rate curve and in consideration of the time effect of item repricing.
Risk indices: parallel shifts of the interest rate curve as of 31 December 2011
+100 bp -100 bp
% on the expected margin 3.47% -9.83%
% on the business margin 2.24% -6.35%
% on the result for the period 10.04% -28.45%
% of net equity 0.51% -1.44%
As regards economic value the impact, estimated using measurement models with a fixed perspective and in theabsence of behavioural models for the items at sight, has shown a risk exposure for 2011 that has remained atlevels that do not involve a significant impact on total equity.The table below shows the variations in economic value analysed by applying deterministic approaches withparallel shifts of the interest rate curve.
Risk indices: parallel shifts of the rates curve as of 31 December 2011
+100 bp -100 bp
% of economic value -1.35% 1.56%
2.3 EXCHANGE RISK
Qualitative information
A. General aspects, management procedures and methods of measuring exchange risk
The Bank is exposed to exchange risk because it trades on currency markets and owing to its activities involvinginvestment and savings with instruments denominated in a foreign currency.The Bank is exposed to exchange risks to a marginal extent. The Finance Department’s Operations Roomhandles currency operations, namely:

Notes to the financial statements
162
transactions on the domestic and foreign currency, exchange rate and currency deposits markets; trading spot and forward contracts on its own behalf and for customers; forward and deposit transactions in foreign currencies with resident and non-resident counter-parties.
The exchange risk is governed by means of intra-day and end-of-day operating limits, both for currency areas andfor concentrations on each individual currency. There are also daily and annual stop-loss operating limits.
B. Exchange rate hedge
The Bank’s primary objective is to manage the exchange risk prudently, while always taking the possibility ofprofiting from market opportunities into consideration. Transactions involving exchange risks, therefore, aremanaged by means of appropriate hedging strategies.
Quantitative information
1: Break-down of assets, liabilities and derivatives by currency of denomination
US DollarPound
Sterling
Japanese
Yen
Canadian
DollarSw iss Franc
Other
currencies
A. Financial assets 68,385 3,083 7,365 530 4,534 3,083
A.1 Debt securities
A.2 Equity securities
A.3 Financing to banks 51,649 2,405 71 530 2,032 3,083
A.4 Financing to customers 16,736 678 7,294 2,502
A.5 Other financial assets
B. Other assets 237 199 25 28 125 47
C. Financial assets 67,748 3,005 7,419 530 4,259 2,573
C.1 Due to banks 45,568 1,938 7,395 2,667 94
C.2 Due to customers 22,180 1,067 24 530 1,592 2,479
C.3 Debt securities
C.4 Other financial liabilities
D. Other liabilities 176 81
E. Financial derivatives 351 68 (1) 201 501
- Options
+ long positions
+ short positions
- Other 351 68 (1) 201 501
+ long positions 27,460 3,023 2,794 79 170 2,316
+ short positions 27,811 3,091 2,794 78 371 2,817
Total assets 96,082 6,305 10,184 637 4,829 5,446
Total liabilities 95,735 6,096 10,213 608 4,711 5,390
Imbalance 347 209 (29) 29 118 56
Captions
Currency

Notes to the financial statements
163
2. Internal models and other methods for sensitivity analysis
The exchange risk profile assumed by the Bank is not significant, in light of the currency exposure of the balancesheet items and the relevant hedging transactions implemented through derivative financial instruments.
2.4 DERIVATIVE INSTRUMENTS
A. Financial derivatives
A.1 Regulatory trading portfolio: period-end and average notional values
Underlying assets / Type of derivativesOver the
counter
Central
counterparties
Over the
counter
Central
counterparties
1. Debt securities and interest rates 32,000 90,000
a) Options 1,000 35,000
b) Sw ap 31,000 55,000
c) Forw ard
d) Futures
e) Other
2. Equity securities and stock indexes 39 6,263
a) Options 39
b) Sw ap
c) Forw ard 6,263
d) Futures
e) Other
3. Currencies and gold 63,669 82,684
a) Options
b) Sw ap
b) Forw ard 63,669 82,684
c) Futures
e) Other
4. Commodities
5. Other underlying items
Total 95,669 39 172,684 6,263
Average values 37,604 39 89,882 42
Total 31.12.2011 Total 31.12.2010

Notes to the financial statements
164
A.2 Banking portfolio: period-end and average notional values
A.2.1 Hedging instruments
Underlying assets / Type of derivativesOver the
counter
Central
counterparties
Over the
counter
Central
counterparties
1. Debt securities and interest rates 231,637 79,617
a) Options
b) Sw ap 231,637 79,617
c) Forw ard
d) Futures
e) Other
2. Equity securities and stock indexes
a) Options
b) Sw ap
c) Forw ard
d) Futures
e) Other
3. Currencies and gold
a) Options
b) Sw ap
b) Forw ard
c) Futures
e) Other
4. Commodities
5. Other underlying items
Total 231,637 79,617
Average values 208,299 23,562
Total 31.12.2011 Total 31.12.2010

Notes to the financial statements
165
A.2.2 Other derivatives
Underlying assets / Type of derivativesOver the
counter
Central
counterparties
Over the
counter
Central
counterparties
1. Debt securities and interest rates 158,816 372,682
a) Options 65,800 48,800
b) Sw ap 93,016 323,882
c) Forw ard
d) Futures
e) Other
2. Equity securities and stock indexes
a) Options
b) Sw ap
c) Forw ard
d) Futures
e) Other
3. Currencies and gold
a) Options
b) Sw ap
b) Forw ard
c) Futures
e) Other
4. Commodities
5. Other underlying items
Total 158,816 372,682
Average values 158,816 368,534
Total 31.12.2011 Total 31.12.2010

Notes to the financial statements
166
A.3 Financial derivatives: gross positive fair value – breakdown by products
Over the
counter
Central
counterparties
Over the
counter
Central
counterparties
A. Regulatory trading portfolio: 831 14 1,508 57
a) Options 14 39
b) Interest rate sw ap 189 685
c) Cross currency sw ap
d) Equity sw ap
e) Forw ard 642 784 57
f) Futures
g) Other
B. Banking portfolio - hedging instruments 5,631
a) Options
b) Interest rate sw ap 5,631
c) Cross currency sw ap
d) Equity sw ap
e) Forw ard
f) Futures
g) Other
C. Banking portfolio - other derivatives 1,569 15,943
a) Options
b) Interest rate sw ap 1,569 15,943
c) Cross currency sw ap
d) Equity sw ap
e) Forw ard
f) Futures
g) Other
Total 8,031 14 17,451 57
Portfolio/Type of derivatives
Positive fair value
Total 31.12.2011 Total 31.12.2010

Notes to the financial statements
167
A.4 Financial derivatives: gross negative fair value – breakdown by products
Over the
counter
Central
counterparties
Over the
counter
Central
counterparties
A. Regulatory trading portfolio 791 1,329 65
a) Options
b) Interest rate sw ap 159 532
c) Cross currency sw ap
d) Equity sw ap
e) Forw ard 632 797 65
f) Futures
g) Other
B. Banking portfolio - hedging instruments 2,684 2,653
a) Options
b) Interest rate sw ap 2,684 2,653
c) Cross currency sw ap
d) Equity sw ap
e) Forw ard
f) Futures
g) Other
C. Banking portfolio - other derivates 618
a) Options
b) Interest rate sw ap 618
c) Cross currency sw ap
d) Equity sw ap
e) Forw ard
f) Futures
g) Other
Total 3,475 4,600 65
Portfolio/Type of derivates
Negative Fair value
Total 31.12.2011 Total 31.12.2010

Notes to the financial statements
168
A.5 OTC financial derivatives – regulatory trading portfolio: notional values, gross positive and negative fairvalues by counterparties - contracts which do not fall within offset agreements
Contracts which do not fall
within offset agreements
Governments
and Central
banks
Other public
entities
Banks Financial
institutions
Insurance
companies
Non-financial
companies
Other entities
1) D ebt securit ies and
interest rates
- notional value 21,000 10,000 1,000
- positive fair value 30 156 3
- negative fair value 159
- future exposure
2)Equity securit ies and
sto ck indexes
- notional value
- positive fair value
- negative fair value
- future exposure
3)Exchange rate and go ld
- notional value 31,866 24,381 4,504 2,918
- positive fair value 304 263 18 57
- negative fair value 334 2 207 90
- future exposure 319 244 45 29
4)Other values
- notional value
- positive fair value
- negative fair value
- future exposure

Notes to the financial statements
169
A.7 OTC financial derivatives – banking portfolio: notional values, gross positive and negative fair values bycounterparties - contracts which do not fall within offset agreements
Contracts which do not fall
within offset agreements
Governments
and Central
banks
Other public
entitiesBanks
Financial
institutions
Insurance
companies
Non-financial
companiesOther entities
1) Deb t securit ies and
int erest rat es
- not ional value 328,733
- posit ive fair value 6,620
- negat ive fair value
- future exposure 1,318
2 ) Equit y securit ies and
st ock indexes
- not ional value
- posit ive fair value
- negat ive fair value
- future exposure
3 ) Exchange rat e and g old
- not ional value
- posit ive fair value
- negat ive fair value
- future exposure
4 ) Ot her values
- not ional value
- posit ive fair value
- negat ive fair value
- future exposure

Notes to the financial statements
170
A.8 OTC financial derivatives – banking portfolio: notional values, gross positive and negative fair values bycounterparties - contracts which fall within offset agreements
A.9 Residual maturity of over-the-counter financial derivatives: notional values
Contracts which fall within
o ffset agreements
Governments
and central
banks
Public
entities
Banks Financial
institutions
Insurance
companies
Non-
financial
companies
Other entities
1) D ebt securit ies and
interest rates
- notional value 61,720
- positive fair value 579
- negative fair value 2,684
2)Equity securit ies and
sto ck indexes
- notional value
- positive fair value
- negative fair value
3)Exchange rate and go ld
- notional value
- positive fair value
- negative fair value
4)Other values
- notional value
- positive fair value
- negative fair value
Underlying instruments / Residual maturityUp to 1 year Betw een 1
and 5 years
Beyond 5
years
Total
A. Regulatory trading portfolio 95,669 95,669
A.1 Financial derivatives on debt securities
and interest rates 32,000 32,000
A.2 Financial derivatives on equity securities
and stock indexes
A.3 Financial derivatives on exchange rates
and gold 63,669 63,669
A.4 Financial derivatives on other instruments
B. Banking portofolio 108,016 236,637 45,800 390,453
B.1 Financial derivatives on debt securities
and interest rates 108,016 236,637 45,800 390,453
B.2 Financial derivatives on equity securities
and stock indexes
B.3 Financial derivatives on exchange rates
and gold
B.4 Financial derivatives on other instruments
Total 31/12/2011 203,685 236,637 45,800 486,122
Total 31/12/2010 385,450 132,116 107,417 624,983

Notes to the financial statements
171
B. Credit derivatives
B.1 Credit derivatives: period-end and average nominal values
B.3 OTC credit derivatives: gross negative fair value – breakdown by products
on a
single
subject
on more
than one
subject
(basket)
on a
single
subject
on more
than one
subject
(basket)
1. Hedging purchases
a) Credit default products
b) Credit spread products
c) Total rate of return sw ap
d) Other
TOTAL 31/12/2011
AVERAGE VALUES
TOTAL 31/12/2010
2. Hedging sales
a) Credit default products 25,000
b) Credit spread products
c) Total rate of return sw ap
d) Other
TOTAL 31/12/2011 25,000
AVERAGE VALUES 25 000
TOTAL 31/12/2010 25,000
Categories of transactions
Regulatory trading
portfolio
Banking portfolio
A. Regulatory trading portfolio
a) Credit default products 1,906 469
b) Credit spread products 1,906
c) Total rate of return sw ap
d) Other 469
B. Banking portfolio
a) Credit default products
b) Credit spread products
c) Total rate of return sw ap
d) Other
Total 1,906 469
Portfolio / Type of derivatives
Negative Fair value
Total
31/12/2011
Total
31/12/2010

Notes to the financial statements
172
B.4 OTC credit derivatives: gross positive and negative fair values by counterparties - contracts which donot fall within offset agreements
B.6 Residual maturity of credit derivatives: notional values
Contracts which do not fall within
offset agreements
Governments
and Central
banks
Other public
entities
Banks Financial
institutions
Insurance
companies
Non-
financial
institutions
Other
entities
Regulatory trading
1) Hedging purchase- notional value- positive fair value- negative fair value- future exposure
2) Hedging sales (25 469)- notional value 25,000- positive fair value- negative fair value 1,906- future exposure 2,000
Banking portfolio1) Hedging purchase
- notional value- positive fair value- negative fair value
2) Hedging sales- notional value- positive fair value- negative fair value
Underlying instruments / Residual maturityUp to 1
year
Between 1 and
5 years
Beyond 5
yearsTotal
A. Regulatory trading portfolio 25,000 25,000
A.1 Derivatives on loans with "qualified" "reference obligation"
A.2 Derivatives on loans with "non-qualified" "reference obligation" 25,000 25,000
B. Banking portfolio
A.1 Derivatives on loans with "qualified" "reference obligation"
A.2 Derivatives on loans with "non-qualified" "reference obligation"
Total 31/12/2011 25,000 25,000
Total 31/12/2010 25,000 25,000

Notes to the financial statements
173
SECTION 3 - LIQUIDITY RISK
Qualitative information
A. General aspects, management procedures and methods of measuring liquidity risk
Liquidity risk is managed through the Finance Department with the aim of meeting liquidity requirements, whileavoiding position of having excessive and/or insufficient liquidity, entailing the need to invest and/or raise funds atrates that are less favourable than normal market rates. The activity of monitoring and periodical reporting onliquidity risks is the responsibility of the Risk Management Department, both for structural and operationalliquidity, which are carried out on a monthly basis and on a daily basis, respectively.Treasury activities consist in procurement and allocation of liquidity available through the interbank market, openmarket transactions, repos and derivatives.The relevant scope of application of daily reports on operational liquidity refers to those items with a high volatilitylevel and a strong impact on the monetary basis. Monitoring and compliance with operating limits are carried outthrough the acquisition of information from collection and payment transactions, from the management of servicesaccounts and from the trading of the financial instruments in the owned portfolios.The counterbalancing capacity model allows reports to be integrated with all those free assets which can bepromptly used both because they can be allocated for the refinancing at the ECB and because they can beconverted into cash. Together with the application of the haircuts determined by the ECB for the securities thatcan be allocated, adequate discount factors are also prepared (which are broken down by type of security, rating,currency) for all securities which cannot be allocated, but which are in any case considered to be negotiable asappropriately positioned in time buckets.An additional support to the management of liquidity risks derives from monitoring the structural liquidity with themain objective of maintaining an adequate dynamic relationship between medium/long-term assets and liabilities.Operations are measured using the Asset and Liability Management (ALM) method with the ALMpro application,which processes all the transaction cash flows and allows the bank’s liquidity requirements as generated byimbalance between incoming and outgoing flows to be assessed and managed during the various periods inquestion.Overall structural liquidity is analysed monthly using the Gap Liquidity Analysis technique, which shows up thecapital flow maturity gaps over a present period of time.
Special care is taken with the funding policy, coordinated by the Finance Department, which arranges for funds tobe raised by means of normal retail bond issues and Euromarket issues.In 2011 the Bank estimated the impact of the new indicators introduced by the quantitative rules – calculation ofthe LCR (Liquidity Coverage ratio) and of the NDFR (Net Stable Funding Ratio) – in order to prepare theappropriate checks also in consideration of the adjustments necessary for adopting the new rules issued by theBank of Italy governing prudential supervision.

Notes to the financial statements
174
Quantitative information
1. Break-down by contractual residual maturity of financial assets and liabilities
Currency of denomination:Euro
Caption / Time interval
On demand Between 1
and 7 days
Between 7
and 15 days
Between 15
days and 1
month
Between 1
and 3
months
Between 3
and 6
months
Between 6
months and
1year
Between 1and
5 years
Beyond 5
years
Unspecified
maturity
C ash assets 1,489,660 60,592 24,352 248 ,684 433 ,091 206,969 505,320 2,069,984 1,857,885 31,364
A.1Government securities 31,630 10 123,503 366,837 202,823
A.2 Other debt securities 2,959 4,450 84,559 149,941 42,905 1,993
A.3 UCITS units 39,438
A.4 Financing 1,450,222 60,592 24,352 245,725 397,011 206,959 29,758 1,553,206 1,612,157 29,371
- banks 24,845 15,000 5,000 7,500 97 29,371
- customers 1,425,377 45,592 19,352 245,725 397,011 206,959 297,258 1,545,706 1,612,060
C ash liabilit ies 3,412,062 50,620 24,933 77 ,426 417,770 385,181 277,337 1,621,733 50,331
B.1Deposits and current
accounts 3,411,016 669 4,318 23,540 29,693 42,205 16,524 21
- Banks 91,613 14,769
- Customers 3,319,403 669 4,318 23,540 29,693 42,205 16,254 21
B.2 Debt securities 612 41,951 20,415 52,487 386,726 340,230 227,828 1,404,117 50,331
B.3 Other liabilities 434 8,000 200 1,399 1,351 2,746 32,985 217,595
"Off -balance" sheet
t ransactio ns189 ,371 60,560 366 51,866 7,474 17,986 16,813 129,777 107,721 9,136
C.1Financial derivatives with
underlying asset exchange 60,560 366 51,497 7,080 13,983 11,795 28,371
- long positions 43,787 183 25,753 3,378 10,654 1,563 2,314
- short positions 16,773 183 25,744 3,702 3,329 10,232 26,057
C.2 Financial derivatives without
underlying asset exchange 348 97 324 237 1,167
- long positions 189 97 313 237 990
- short positions 159 11 177
C.3 Deposits and financing to be
received
- long positions
- short positions
C.4 Irrevocable commitments to
grant finance 188,305 1,233 2,479 101,406 107,721 9,136
- long positions 233 1,233 2,479 76,406 107,721 4,568
- short positions 188,072 25,000 4,568
C.5 Financial guarantees granted 718 272 70 2,533 1,372
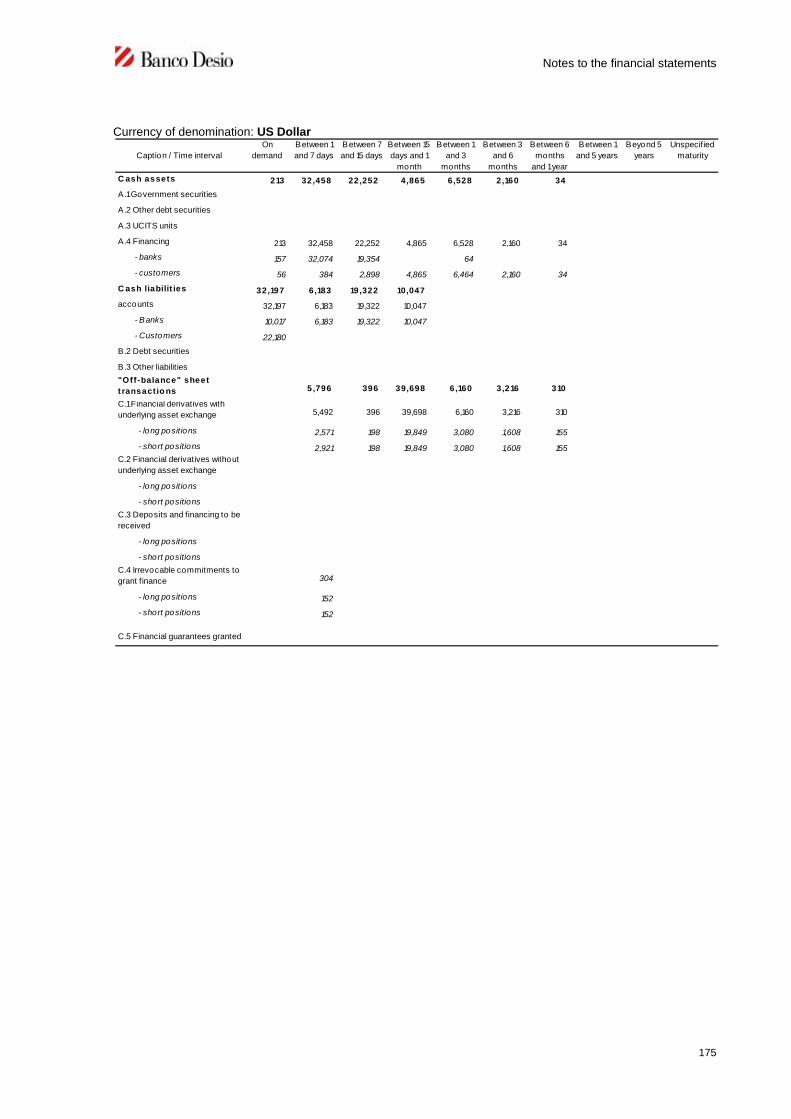
Notes to the financial statements
175
Currency of denomination: US Dollar
Caption / Time interval
On
demand
Between 1
and 7 days
Between 7
and 15 days
Between 15
days and 1
month
Between 1
and 3
months
Between 3
and 6
months
Between 6
months
and 1year
Between 1
and 5 years
Beyond 5
years
Unspecified
maturity
C ash assets 213 32,458 22,252 4,865 6,528 2,160 34
A.1Government securities
A.2 Other debt securities
A.3 UCITS units
A.4 Financing 213 32,458 22,252 4,865 6,528 2,160 34
- banks 157 32,074 19,354 64
- customers 56 384 2,898 4,865 6,464 2,160 34
C ash liabilit ies 32,197 6,183 19,322 10,047
accounts 32,197 6,183 19,322 10,047
- Banks 10,017 6,183 19,322 10,047
- Customers 22,180
B.2 Debt securities
B.3 Other liabilities
"Off-balance" sheet
t ransactio ns 5,796 396 39,698 6,160 3,216 310
C.1Financial derivatives with
underlying asset exchange 5,492 396 39,698 6,160 3,216 310
- long positions 2,571 198 19,849 3,080 1,608 155
- short positions 2,921 198 19,849 3,080 1,608 155
C.2 Financial derivatives without
underlying asset exchange
- long positions
- short positions
C.3 Deposits and financing to be
received
- long positions
- short positions
C.4 Irrevocable commitments to
grant finance 304
- long positions 152
- short positions 152
C.5 Financial guarantees granted

Notes to the financial statements
176
Currency of denomination: UK Pound Sterling
Caption / Time interval
On
demand
Between 1
and 7 days
Between 7
and 15 days
Between 15
days and 1
month
Between 1
and 3
months
Between 3
and 6
months
Between 6
months
and 1year
Between 1
and 5 years
Beyond 5
years
Unspecified
maturity
C ash assets 1,226 6 61 1,780 12
A.1Government securities
A.2 Other debt securities
A.3 UCITS units
A.4 Financing 1,226 6 61 1,780 12
- banks 693 1,712
- customers 533 6 61 68 12
C ash liabilit ies 1,114 180 1,712
B.1Deposits and current
accounts 1,114 180 1,712
- Banks 47 180 1,712
- Customers 1,067
B.2 Debt securities
B.3 Other liabilities
"Off -balance" sheet
transact io ns 1,350 4,764
with underlying asset
exchange 1,350 4,764
- long positions 641 2,382
- short positions 709 2,382
without underlying asset
exchange
- long positions
- short positions
C.3 Deposits and financing
to be received
- long positions
- short positions
commitments to grant
finance
- long positions
- short positions
C.5 Financial guarantees
granted

Notes to the financial statements
177
Currency of denomination: Swiss Franc
Caption / Time interval
On
demand
Between 1
and 7 days
Between 7
and 15 days
Between 15
days and 1
month
Between 1
and 3
months
Between 3
and 6
months
Between 6
months
and 1year
Between 1
and 5 years
Beyond 5
years
Unspecified
maturity
C ash assets 2,032 394 641 1,482
A.1Government securities
A.2 Other debt securities
A.3 UCITS units
A .4 Financing 2,032 394 641 1,482
- banks 2,024 8
- customers 8 394 641 1,474
C ash liabilit ies 1,709 2,550
B.1Deposits and current
accounts 1,709 2,550
- Banks 117 2,550
- Customers 1,592
B.2 Debt securities
B.3 Other liabilities
"Off -balance" sheet
transact io ns 741 160 152 248
C.1Financial derivatives with
underlying asset exchange 485 160 152 248
- long positions 142 80 76 124
- short positions 343 80 76 124
C.2 Financial derivatives without
underlying asset exchange
- long positions
- short positions
C.3 Deposits and financing to be
received
- long positions
- short positions
C.4 Irrevocable commitments to
grant finance 256
- long positions 128
- short positions 128
C.5 Financial guarantees granted

Notes to the financial statements
178
Currency of denomination: Canadian Dollar
Caption / Time intervalOn
demand
Between 1
and 7 days
Between 7
and 15 days
Between 15
days and 1
month
Between 1
and 3
months
Between 3
and 6
months
Between 6
months
and 1year
Between 1
and 5 years
Beyond 5
years
Unspecified
maturity
C ash assets 530
A.1Government securities
A.2 Other debt securities
A.3 UCITS units
A.4 Financing 530
- banks 530
- customers
C ash liabilit ies 530
B.1Deposits and current
accounts 530
- Banks
- Customers 530
B.2 Debt securities
B.3 Other liabilities
"Off -balance" sheet
transact io ns157
C.1Financial derivatives with
underlying asset exchange157
- long positions 79
- short positions 78
C.2 Financial derivatives without
underlying asset exchange
- long positions
- short positions
C.3 Deposits and financing to be
received
- long positions
- short positions
C.4 Irrevocable commitments to
grant finance
- long positions
- short positions
C.5 Financial guarantees granted
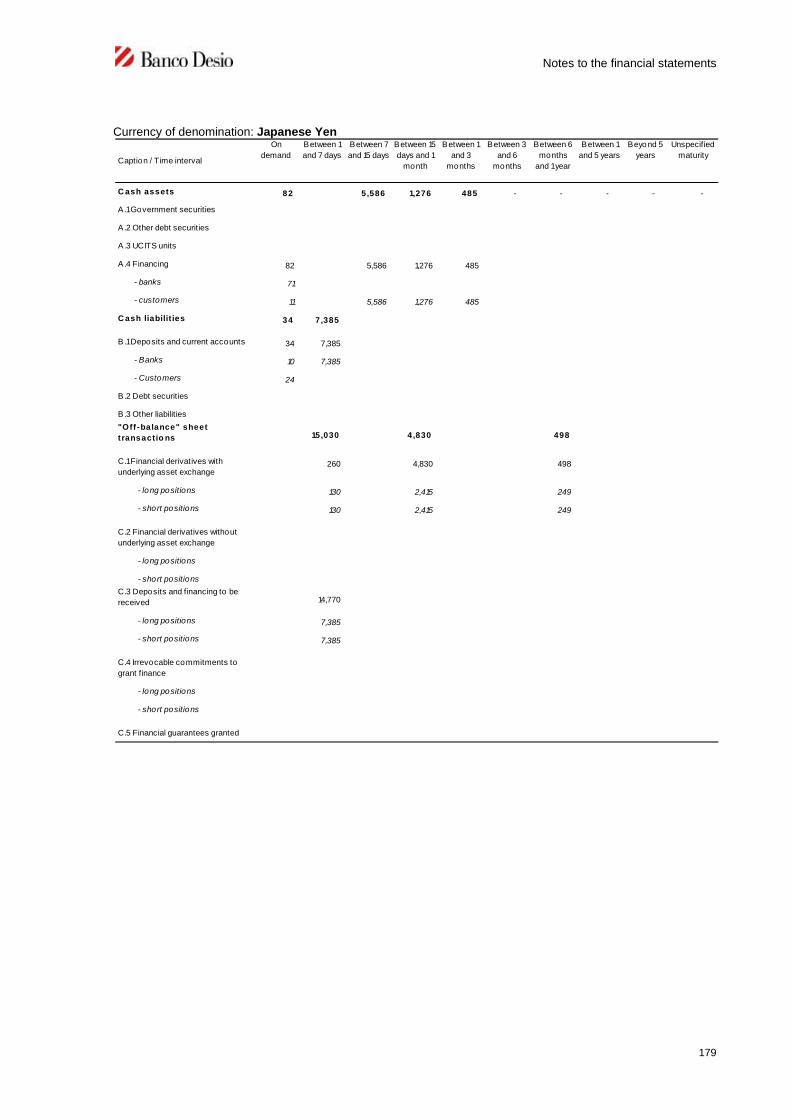
Notes to the financial statements
179
Currency of denomination: Japanese Yen
Caption / Time interval
On
demand
Between 1
and 7 days
Between 7
and 15 days
Between 15
days and 1
month
Between 1
and 3
months
Between 3
and 6
months
Between 6
months
and 1year
Between 1
and 5 years
Beyond 5
years
Unspecified
maturity
C ash assets 82 5,586 1,276 485 - - - - -
A.1Government securities
A.2 Other debt securities
A.3 UCITS units
A.4 Financing 82 5,586 1,276 485
- banks 71
- customers 11 5,586 1,276 485
C ash liabilit ies 34 7,385
B.1Deposits and current accounts 34 7,385
- Banks 10 7,385
- Customers 24
B.2 Debt securities
B.3 Other liabilities
"Off -balance" sheet
t ransactio ns 15,030 4,830 498
C.1Financial derivatives with
underlying asset exchange260 4,830 498
- long positions 130 2,415 249
- short positions 130 2,415 249
C.2 Financial derivatives without
underlying asset exchange
- long positions
- short positions
C.3 Deposits and financing to be
received 14,770
- long positions 7,385
- short positions 7,385
C.4 Irrevocable commitments to
grant finance
- long positions
- short positions
C.5 Financial guarantees granted

Notes to the financial statements
180
Currency of denomination: Other currencies
Caption / Time interval
On
demand
Between 1
and 7 days
Between 7
and 15 days
Between 15
days and 1
month
Between 1
and 3
months
Between 3
and 6
months
Between 6
months
and 1year
Between 1
and 5 years
Beyond 5
years
Unspecified
maturity
C ash assets 3,084
A.1Government securities
A.2 Other debt securities
A.3 UCITS units
A.4 Financing 3,084
- banks 3,084
- customers -
C ash liabilit ies 2,573
B.1Deposits and current
accounts 2,573
- Banks 94
- Customers 2,479
B.2 Debt securities
B.3 Other liabilities
"Off -balance" sheet
transactio ns 1,788 2,684 662
C.1Financial derivatives with
underlying asset exchange 1,788 2,684 662
- long positions 643 1,342 331
- short positions 1,145 1,342 331
C.2 Financial derivatives without
underlying asset exchange
- long positions
- short positions
C.3 Deposits and financing to be
received
- long positions
- short positions
C.4 Irrevocable commitments to
grant finance
- long positions
- short positions
C.5 Financial guarantees granted

Notes to the financial statements
181
SECTION 4 - OPERATING RISK
Qualitative information
A. General aspects, management procedures and methods of measuring operating risk
By Operational Risk is meant the risk of suffering losses deriving from the inadequacies or malfunctioning ofprocedures, human resources and internal systems or by exogenous events. Losses deriving from fraud, humanerror, interruption of operations, system unavailability, breach of contract and natural catastrophes all come withinthis category. Operational risk includes legal risk but does not include those relating to strategy or reputation(Bank of Italy – circular no. 263 of 27 December 2006). This type includes, inter alia, losses arising from frauds,human errors, discontinuance of operations, unavailability of the systems, contract defaults and natural disasters.Banco Desio Brianza uses the definition of operational risk given by the Parent Company within the relevantmethodological framework which adopts the definition given by the Bank of Italy in its circular letter no. 263 of27/12/2006.In Banco Desio there is an appropriate procedure for the structured gathering of adverse events which mightgenerate operating losses. A reporting system for detrimental events recorded in the Corporate Operating LossesDatabase (DBPOA) was implemented that has the capacity to provide top management at set intervals with allthe information (overall and detailed) available regarding such events: the number of events, the amounts ofgross losses and of losses net of any recoveries by business line concerned.The Bank is, as a Banking Group, a member of the Italian Banking Association DIPO.For the monitoring of risks for the commission of offences pursuant to Legislative Decree no. 231/2001“Regulations dealing with the administrative liability of legal persons, companies and associations without legalpersonality”, the Bank adopted an organisational prevention model. The supervision of the effectiveimplementation of the above mentioned models was assigned, in line with the provisions of law and with thedirections of the industry associations, to specific bodies.The organisational model under review is updated also following the changes that have occurred in the regulatoryframework of reference.
An Operational Continuity Plan has been drawn up in relation to the management of risks having an impact on theBank’s operational continuity. Measures were carried out aimed at the identification and mapping of processesconsidered vital for the purposes of the business, the preparation of the documentary structure supporting Bankoperations (operational procedures for the management of emergencies and restoration) and the preparation ofthe Disaster Recovery site to be used in the event of emergency, an alternative site with respect to that to beused for production.
The various corporate functions guard against legal risk by using standard contractual forms that are in any eventfirst evaluated by the responsible corporate boards. This said, it is to be noted that most actions brought againstthe Bank at the end of the financial year consist in disputes regarding financial instruments trading.
The lawsuits pending for Banco Desio Brianza have a value of Euro 69,583 thousand. These risks areappropriately assessed and hedged by prudential allocations to provisions of Euro 9,183 thousand. The mostimportant lawsuits make up 96.43% of the whole, mostly attributable to objections relating to the default on thepart of bond issuers and objections relating to compounding and bankruptcy claw-back actions.
Quantitative information
The number of adverse events detected, and recognized in the accounts, by Banco Desio Brianza in 2011 totalled795 events. The result of the process for the gathering of adverse events is summarised in the table below(expressed in thousands of Euros):

Notes to the financial statements
182
Gross operating loss amounts to Euro 4,144 thousand, in relation to which prudential provisions of Euro 3,179.2thousand were set aside during the year. The gross losses paid out were recovered for Euro 237 thousand, thusreporting a net loss of Euro 3,907 thousand.
Type of eventNo. of
Events
% of
Events
Gross
loss
% on
totalNet loss
% on
totalRecoveries
% on
total
INTERNAL FRAUD Losses generated by fraud,
misappropriation, violation of laws, rules and
regulations or corporate directives (except for
discrimination events) involving at least one internal
member of the bank
6 0.75% 2,053.36 49.55% 2,041.20 52.25% 12.16 0.59%
EXTERNAL FRAUD Losses generated by fraud,
misappropriation, violation of laws, rules and
regulations or corporate directives (except for
discrimination events) carried out by third parties
251 31.57% 465.54 11.24% 248.01 6.35% 217.54 46.73%
EMPLOYMENT CONTRACT AND WORKPLACE SAFETY
Losses generated by breaches of the employment laws
and contracts, health and workplace safety laws, and by
any indemnities for accidents or discrimination.
3 0.38% 68.44 1.65% 68.44 1.75% 0.00 0.00%
RELATIONAL ACTIVITIES RELATED TO CLIENTS,
PRODUCTS AND CHANNELS Losses generated by the
inability (unintentional or due to negligence) to fulfil
the professional commitments assumed vis-à-vis the
customers (including the fiduciary requirements and
the requirements for an adequate information on
investments).
19 2.39% 265.11 6.40% 265.11 6.79% 0.00 0.00%
DAMAGES TO ASSETS This category includes natural
events or those events which might be connected to
any actions carried out by external persons which cause
damages to the tangible assets of the bank.
1 0.13% 1.93 0.05% 1.93 0.05% 0.00 0.00%
BUSINESS INTERRUPTION AND SYSTEMS MALFUNCTIONS
Losses generated by any blocks of the information
systems or of line connections.
4 0.50% 8.22 0.20% 1.07 0.03% 7.15 87.00%
EXECUTION OF DIRECTIONS, SUPPLY OF PRODUCTS AND
MANAGEMENT OF THE PROCESSES
511 64.28% 1,281.07 30.93% 1,281.07 32.79% 0.00 0.00%
TOTAL 795 100.00% 4,144 100.00% 3,907 100.00% 237 5.72%

Notes to the financial statements
183
Part F – INFORMATION ON EQUITY
Section 1 – The Bank’s shareholders’ equity
A. Qualitative information
The Board of Directors has always paid most attention to the shareholders’ equity of the bank, aware both of itsfunction in guaranteeing the trust of outside financers that can be called upon to absorb any losses and of itsimportance both purely for operations and for corporate growth.In fact a substantial level of capitalisation enables corporate growth to be conducted with the necessary margins ofautonomy, preserving the bank’s stability.The concept of accounting capital used by the Bank is given by the algebraic sum of the following liability items inthe Balance Sheet: Share capital, Valuation reserves, Reserves, Share premiums and Profit for the Period.The policy of the Board of Directors is, therefore, to give a substantial degree of priority to shareholders’ equity inorder to make the best possible use of it in the growth of the bank, and to optimise returns for the shareholders,keeping to a prudent risk profile. As far as this is concerned, it should be remembered that the main component ofthe compulsory minimum capital requirements relates to the credit risk against a loan portfolio spread on its coremarket which is made up of local enterprises and families.
B. Quantitative information
B.1 The Bank’s shareholders’ equity: breakdown
31.12.2011 31.12.2010
1. Shareholders' equity 67,705 67,705
2. Share premium reserve 16,145 16,145
3. Reserves 630,254 607,276
- retained earnings
a) legal 75,019 70,109
b) statutory 435,821 405,585
c) treasury shares
d) other 23,571 23,571
e) advances on dividends
- other 95,843 108,011
4. Equity instruments
5. Treasury shares
6. Revaluation reserves
- Available-for-sale financial assets (34 630) (8 795)
- tangible assets
- intangible assets
- foreign investment hedge
- exchange rate differences
- non-current assets held for sale and discontinued operations
- actuarial profits (losses) relating to
defined benefit plans 74 39
- shares of valuation reserves relating to - -
investee companies carried at equity 22,896 22,896
- special revaluation law s 43,235 49,094
Total 745,679 754,360

Notes to the financial statements
184
B.2 Valuation reserves of financial assets available for sale: breakdown
B.3 Valuation reserves of financial assets available for sale: annual changes
Section 2 – Regulatory capital and ratios
2.1 Regulatory capital
A. Qualitative information
The Board of Directors also pays great attention to the notion of equity used for supervision purposes. The
determination of the regulatory capital is certainly important owing to the importance of this aggregate in
connection with the controls that the competent authorities carry out in order to ascertain the stability of banks. The
relevant regulations, in fact, state that “….the most important control tools are based on this, such as the solvency
Assets / Amounts
Positive
reserve
Negative
reserve
Positive
reserve
Negative
reserve
1. Debt securities 738 (39,221) 268 (10,217)
2. Equity securities 158 (168) 159 (23)
3. UCITS Units 631 (408) 170 (16)
4. Financing
Total 1,527 (39,797) 597 (10,256)
31.12.201031.12.2011
Debt
securities
Equity
securitiesUCITS units Loans
1. Opening balance (9,085) 136 154
2. Increases 3,073 531
2.1 Fair value increases 738 523
2.2 Reversal of negative reserves to the
income statement 1,839 5
- from deterioration
- from disposal 1,839 5
2.3 Other increases 496 3
3. Decreases 28,831 146 462
3.1 Fair value decreases 28,531 145 400
3.2 Adjustments from deterioration
3.3 Reversal of positive reserves to the
income statement: from disposal104 61
3.4 Other decreases 196 1 1
4. Closing balance 34,843 10 (223)

Notes to the financial statements
185
coefficient, the requirements to meet market risks, the rules regarding risk concentration and maturity
transformation; transactions in various sectors also depend on equity size”. In compliance with European
Directives, the regulations specify the method for the calculation of regulatory capital. This is made up of the sum
of Tier 1 capital - which is allowed into the calculation without any limitation- and the Tier 2 capital, which is allowed
within the maximum limit of Tier 1 capital. The following are deducted from this sum: equity investments, hybrid
equity instruments and subordinated assets, held in other banks and finance companies.
As of 31 December 2011, the bank’s regulatory capital is made up as follows:
Description Amount
Primary capital 672,664
Supplementary capital 68,193
Deductions 16,197
Regulatory capital 724,660
1. Tier 1 capital
Share capital, share premiums, reserves, undistributable earnings for the period and innovative capitalinstruments are the most significant elements of the capital. From these positive elements, any negative elementsare deducted, mainly represented by intangible assets, the residual portion of goodwill and any deductionsresulting from the application of prudential filters.Tier 1 capital accounts for about 93 % of the Regulatory Capital.
2. Tier 2 capital
Valuation reserves, innovative capital instruments not included in the Tier 1 capital, hybrid equity instruments,subordinated liabilities and net gains on equity investments represent the key positive elements of Tier 2 capital.To these positive elements, the deductions provided for by the prudential filters are applied.
Tier 2 capital accounts for about 9% of the Regulatory Capital. The elements to be deducted account for about2%.
3. Tier 3 capital
This is composed of the portion of Tier 2 subordinated liabilities not included in Tier 2 since exceeding 50% of Tier1 capital gross of the elements to be deducted, and by Tier 3 subordinated liabilities. This aggregate may only beused for the purpose of fulfilling the capital requirements on market risks for a maximum amount equal to 71.4% ofsuch risks.

Notes to the financial statements
186
B. Quantitative information
2.2 Capital adequacy
A. Qualitative information
The Prudential Supervision provisions provide for banks to retain a minimum amount of the Total RegulatoryCapital equal to 8% of the risk-weighted assets as a whole (credit and counterpart, market, operational risk). Thisrequirement is reduced by 25% for institutes belonging to Banking Groups that respect the limit of 8% atconsolidated level. The rules for determining the overall capital requirement and the capital structure of the Bankprovide the following ratios at 31 December 2011:
- Tier 1 capital / risk-weighted assets(1)
17.04 %- Regulatory capital / risk-weighted assets
(1)18.36 %
The Board of Directors periodically reviews and approves the aggregates comprising the regulatory capital, inorder to verify both their consistency with the risk profile assumed as well as their compliance with thedevelopment plans of the bank.
(1) Risk-weighted assets are determined as the product of the total prudential requirements and the reciprocal of the obligatory minimum coefficient for credit risks.
A. Tier 1 capital before the application of prudential filters 735,007 723,458
B. Prudential f ilters for Tier 1 capital: (40,334) (11,352)
B1 - positive IAS/IFRS prudential f ilters (+) - -
B2 - negative IAS/IFRS prudential f ilters (-) 40,334 11,352
C. Tier 1 gross of deductions (A+B) 694,673 712,106
D. Deductions from Tier 1 capital 22,009 5,156
E. Total primary capital (TIER1) (C-D) 672,664 706,950
F. Tier 2 capital before the application of prudential filters 90,308 99,786
G. Prudential f ilters for Tier 2 capital: (106) (145)
G1- positive IAS/IFRS prudential f ilters (+) - -
G2- negative IAS/IFRS prudential f ilters(-) 106 145
H. Tier 2 gross of deductions (F+G) 90,202 99,641
I. Deductions from Tier 2 capital 22,009 5,156
L. Total supplementary capital (TIER2) (H-J) 68,193 94,485
M. Deductions from Tier 1 and Tier 2 capital 16,197 13,497
N. Regulatory capital (E + L - M) 724,660 787,939
O. Tier 3 capital - -
P. Regulatory Capital including TIER3 (N + O) 724,660 787,939
31.12.2011 31.12.2010

Notes to the financial statements
187
B. Quantitative information
Prudential ratios
31.12.2011 31.12.2010 31.12.2011 31.12.2010
A. RISK ASSETS
A.1 CREDIT AND CO UNTERPARTY RISK 7,500,175 6,968,560 4,752,936 4,212,881
1. STANDARD METHODOLOGY 7,499,454 6,967,253 4,752,576 4,212,619
2. METHODOLOGY BASED ON INTERNAL RATINGS
2.1 Base
2.2 Advanced
3. SECURITISATIONS
721 1,307 360 261
B. REGULATORY CAPITAL REQUIREMENTS
B.1 CREDIT AND CO UNTERPARTY RISKS 380,235 337,030
B.2 MARKET RISK 137 242
1. STANDARD METHODOLOGY 137 242
2. INTERNAL MODELS
3. CONCENTRATION RISK
B.3 O PERATIO NAL RISK 40,652 39,196
1. BASE METHODOLOGY 40,652 39,196
2. STANDARD METHODOLOGY
3. ADVANCED METHODOLOGY
B.4 O THER CAPITAL REQ UIREMENTS
B.5 O THER CALCULATIO N ELEMENTS (105,256) (94,117)
B.6 TOTAL CAPITAL REQUIREMENTS 315,768 282,351
C. RISK ASSETS AND REGULATO RY RATIOS
C.1 Risk-weighted assets 3,947,100 3,529,389
C.2 Tier 1 capital / Risk-weighted assets (T ier 1 capital ratio) 17.04% 20.03%
C.3 Regulatory capital including TIER 3 / Risk-weighted assets (Total
capital ratio) 18.36% 22.33%
Category/ValueUnweighted amounts
Weighted
amounts/requirements
Notes to the financial statements
188
PART H - TRANSACTIONS WITH RELATED PARTIES
1 - Information in remunaration paid to directors and managers
For information regarding the remuneration paid to the Directors and Managers with strategic responsibilitiesplease refer to the “Report on Group Remuneration Policies” drawn up pursuant to Article 123-ter of the T.U.F.[Testo Unico della Finanza, Consolidated Act on Finance].For information about the stock option plans reference is also made to Part I of these notes.
2 - INFORMATION ON TRANSACTIONS WITH RELATED PARTIES
The Internal Procedure adopted pursuant to Consob Regulation no. 17221/2010 for transactions with relatedparties (including those made with Representatives pursuant to article 136 of the Consolidated Banking Act) isoutlined in the Annual Report on Corporate Governance. The Procedure itself is published, in compliance withthe abovementioned Regulation, on the website www.bancodesio.it – section “Banco Desio / CorporateGovernance / Transactions with Related Parties”.Considering that, pursuant to article 5 of the Regulation itself and of article 154-ter of the Consolidated Act onFinance referred to by the same, information is to be provided on:a) the individual “most significant” transactions entered into in the reporting period, these being the transactions
which exceed, also on a cumulative basis, the thresholds envisaged in Annex 3 to the abovementionedRegulation
1;
b) any other individual transactions (if any) with related parties, as defined pursuant to article 2427, paragraph 2,of the Italian Civil Code, entered in the relevant period, which have significantly affected the financial positionor results of Banco Desio;
c) any change in or development of transactions with related parties described in the last annual report whichhave had a significant effect on the financial position or results of Banco Desio in the reporting period.
it is noted that in 2011 no transactions were entered into which were such as to present the characteristicsreferred to in letters a), b) and c) without prejudice to the merger of the full subsidiaries Banco Desio ToscanaSpA and Banco Desio Veneto SpA into the Parent company – effective from 1 October 2011 – which, as reportedin the specific disclosures, was approved by the Board of Directors after a binding favourable opinion expressedby the Committee for Transactions with Related Parties.
Relations with external related parties are generally settled on market conditions and, where the market is not asatisfactory reference, (as in the instance of the Agreements for outsourcing services provided by the ParentCompany to subsidiaries), on advantageous ad correct conditions, that are valued in compliance with theProcedures above, in any case taking account of the company’s interest in performing the transactions.
In this context, as of 31 December 2011, no transaction presents particular risks other than those that areassessed in the context of ordinary banking activities, and no transaction is either atypical or unusual.The following paragraphs summarise the relations by counterparty category (Parent Company, Subsidiaries,Associates, Representatives), highlighting in particular current account and security account balances at the endof the period and, finally, any supplier relations of a different type.
In this context, also note – according to a single management approach of potential conflicts of interest – thosetransactions which are effected pursuant to article 136 of the Consolidated Banking Law and which, in any case,do not fall within the scope of transactions with related parties pursuant to Consob Regulation no. 17221/2010 or,in short, of article 2391-bis of the Italian Civil Code by virtue of which this Regulation has been issued (mainly withreference to the following subjects: Representatives of subsidiaries of “Banco Desio”; their close relatives;companies with which the representatives of the Group hold offices of director/statutory auditor in the absence ofrelationships of control/association).
1 As regards the significance ratio of the countervalue of transactions with related parties, the Internal Procedure makesreference to a significance threshold equal to Euro 37.5 million (corresponding to 5% of the consolidated regulatory capital asrecognized at the date of adoption of the Procedure itself)

Notes to the financial statements
189
I - Parent Company
At the end of the year, the amounts due (to customers) to the Parent Company Brianza Unione di Luigi Gavazzi &C. SApA by Banco Desio totalled Euro 179.5 million, of which Euro 178.9 million related to security portfolios. Thecompany has no debt exposure.
During the year, there were no other transactions with this company (the company also falls within the scope ofArticle 136 of the Consolidated Banking Act (T.U.B.) by virtue of the positions held in it by some Representatives,as per paragraph IV below).
II - Subsidiaries
The table below summarises significant transactions with the subsidiary companies (excluding the mergedcompanies Banco Desio Toscana SpA and Banco Desio Veneto SpA) approved by the Board of Directors duringthe year and in the board meetings prior to the approval of the financial statements at 31 December 2011, withinthe abovementioned Procedure:
Type of TransactionAmounts/economic
conditions(Euro)
Counterparty
Placement of Chiara VitaBankassurance products
Special considerationBanco Desio Lazio SpA
Financing current account –renewal
50,000,000 Banco Desio Lazio SpA
Credit line for commercialbanking transactions
5,000,000 Banco Desio Lazio SpA
Credit line for ordinary currentaccount overdraft
Increasefrom 170,000,000 to 220,000,000
Fides SpA
Group integrated treasury2012 Resolution
Review of conditions
Banco Desio Lazio SpAFides SpA
Chiara Assicurazioni SpABrianfid_LUX Sa
Credito Privato Commerciale SaRovere SdG SA
Review of the MasterAgreement for the supply oftechnical-administrativeservices
Total annual fee in favour of theParent Company
628,000
Banco Desio Lazio SpAFides SpA
Renewal of contract for supplyof IT services
Annual fee in favour of theParent Company
25,000
Chiara Assicurazioni SpA
The amount of assets/liabilities, as well as guarantees/commitments and revenues/charges, resulting fromrelations with the aforesaid companies, is shown in paragraph 8.4 of the Report of Operations (Table no. 13)under the item “Subsidiaries”.

Notes to the financial statements
190
III – Associated companies
At the end of the year there were two associated companies: Chiara Vita SpA, in which an interest of 30% is retained within the framework of the agreements with the
Helvetia Group entered into 2008;
Istifid S.p.A., in which the interest of approx. 29% (relative majority) is retained, which was reachedduring 2009
Within the framework of the agreements entered into with the Helvetia Group, the following agreements are still inplace with Chiara Vita Spa: i) a five-year contract for the distribution of products in the life insurance branch; ii) acorrelated agreement for banking services.At the close of the period, the amounts due (to customers) to Chiara Vita SpA by Banco Desio amounted to a totalof Euro 158.5 million, of which Euro 40.7 million related to security portfolios; the company has no debt exposure.
The contractual relations maintained with Istifid SpA by Banco Desio consist essentially in the supply of companyservices (shareholders registers, assistance at meetings, consultancy regarding corporate compliance etc) whichare charged at the usual costs for such services. With reference to the transactions for closing the “Banco DesioVeneto” and “Chiara Assicurazioni” stock option plans described in Part 1 of these notes, it is noted that theassociate company was appointed to carry out, as for similar transactions carried out in previous periods, a seriesof activities of a fiduciary nature, with a resulting outlay by Banco Desio equal to Euro 0.1 million.As regards the banking services provided by Banco Desio to Istifid SpA, the amounts due (to customers) at theclose of the period amounted to a total of Euro 48.8 million, of which Euro 23.5 million related to securityportfolios; the company has no debt exposure.It is clarified that these amounts payable and receivable also refer to relations maintained by Istifid SpA as part offiduciary mandates granted by third parties.
The amount of assets/liabilities, as well as revenues/charges, resulting from relations with the aforesaidcompanies is shown in paragraph 8.4 of the Report of Operations under the item “Companies subject tosignificant influence”.
IV - Transactions with Representatives and subjects referable thereto
Pursuant to Article 136 of the Consolidated Law on Banking (T.U.B.), it is to be noted that most of the these wereordinary transactions whereby credit was paid out to Representatives of the Group and/or companies referablethereto, with regard to which the Representatives (i.e. directors, statutory auditors and managers with strategicresponsibilities within the Bank and the companies under control) concerned stated that they had interests ofvarious kinds by virtue of stakes held of a controlling/associate nature, appointments and/or other relationships ofa financial or personal nature with these companies. These relations did not affect the application of the normalcriteria for appraising creditworthiness.The total amount of the facilities granted in the 34 positions existing as at 31 December 2011 is equal to aboutEuro 30.8 million and the relative uses totalled about Euro 22.6million. The figures above do not includeoutstanding transactions with the associate and investee companies mentioned in point III above (officially treatedpursuant to Article 136 of the Consolidated Banking Act, due to the positions held in such companies by someRepresentatives of the Bank).
As regards deposit relations held by Banco directly with the Representatives, as well as with parties connected tothese it is also worth noting that the debit as at 31 December 2011 amounted to about Euro 57.2 million inamounts due to customers (inclusive of about Euro 40.8 million in security accounts).
It should be noted that the position of those who are Representatives of only the subsidiaries of Banco Desio,entails a scope of activity which is limited to the respective companies, such as to exclude their classification asManagers with strategic responsibilities of Banco Desio pursuant to IAS 24 and/or Consob Regulation no.17221/2010.
The abovementioned calculations exclude the transactions and balances referring to the parent company and theassociate companies as per paragraphs II and III above (even though they fall within the scope of article 136 ofthe TUB [Testo Unico Bancario, Consolidated Banking Act] as a result of the roles held there by a number ofRepresentatives of the Bank).
The table below shows the breakdown relating to the aforesaid credit line and collection relationships asdescribed in this paragraph:

Notes to the financial statements
191
(balances at 31.12.2011 in Euro/million)
Subjects “art. 136 ofConsolidated bankingAct” which fall withinthe scope of relatedparties “article 2391-bis of the Italian Civil
Code”(e.g.: Representativesof “Banco Desio” or of
“Brianza Unione”;their close relatives;
related companies in acontrol/association
relationship)
(A)
Subjects “art. 136 ofConsolidated bankingAct” which do not fall
within the scope ofrelated parties “article2391-bis of the Italian
Civil Code”(e.g.: Representatives ofsubsidiaries of “Banco
Desio”; their closerelatives; companies in
which theRepresentatives of theGroup hold offices of
director/statutory auditorwhere there is no
relationship ofcontrol/association)
(B)
TOTAL(A+B)
Credit line transactions:
Amount granted5.8 25 30.8
Amount used 4.6 18 22.6
Borrowing transactions:
Current account and savingsdeposit amount
(a)
7.4 9.02 16.4
Amount of securities accounts(b)
37.6 3.2 40.8
Total(a+b)
45 12.2 57.2
* * *
In compliance with CONSOB Resolution no. 15519 of 27 July 2006 1, it is noted that the total percentage value ofthe above balances in terms of the Group’s equity, financial and economic situation remains substantiallynegligible.
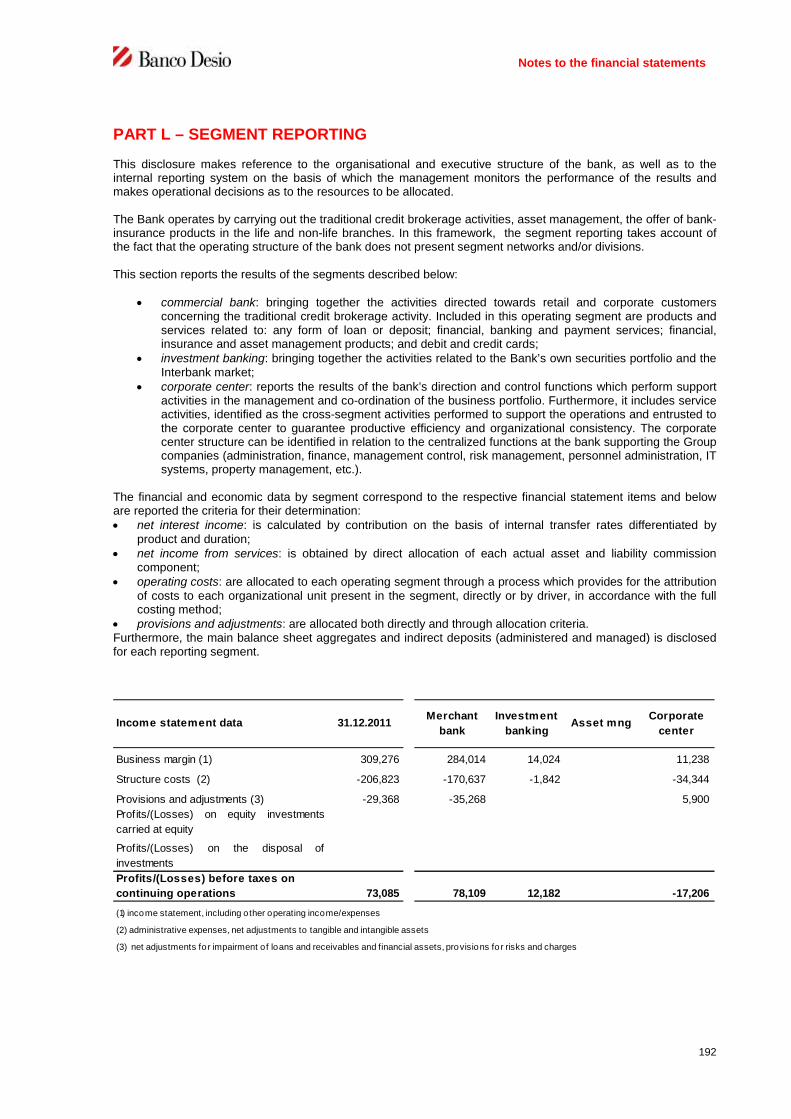
Notes to the financial statements
192
PART L – SEGMENT REPORTING
This disclosure makes reference to the organisational and executive structure of the bank, as well as to theinternal reporting system on the basis of which the management monitors the performance of the results andmakes operational decisions as to the resources to be allocated.
The Bank operates by carrying out the traditional credit brokerage activities, asset management, the offer of bank-insurance products in the life and non-life branches. In this framework, the segment reporting takes account ofthe fact that the operating structure of the bank does not present segment networks and/or divisions.
This section reports the results of the segments described below:
commercial bank: bringing together the activities directed towards retail and corporate customersconcerning the traditional credit brokerage activity. Included in this operating segment are products andservices related to: any form of loan or deposit; financial, banking and payment services; financial,insurance and asset management products; and debit and credit cards;
investment banking: bringing together the activities related to the Bank’s own securities portfolio and theInterbank market;
corporate center: reports the results of the bank’s direction and control functions which perform supportactivities in the management and co-ordination of the business portfolio. Furthermore, it includes serviceactivities, identified as the cross-segment activities performed to support the operations and entrusted tothe corporate center to guarantee productive efficiency and organizational consistency. The corporatecenter structure can be identified in relation to the centralized functions at the bank supporting the Groupcompanies (administration, finance, management control, risk management, personnel administration, ITsystems, property management, etc.).
The financial and economic data by segment correspond to the respective financial statement items and beloware reported the criteria for their determination: net interest income: is calculated by contribution on the basis of internal transfer rates differentiated by
product and duration; net income from services: is obtained by direct allocation of each actual asset and liability commission
component; operating costs: are allocated to each operating segment through a process which provides for the attribution
of costs to each organizational unit present in the segment, directly or by driver, in accordance with the fullcosting method;
provisions and adjustments: are allocated both directly and through allocation criteria.Furthermore, the main balance sheet aggregates and indirect deposits (administered and managed) is disclosedfor each reporting segment.
Income statement data 31.12.2011Merchant
bank
Investment
bankingAsset mng
Corporate
center
Business margin (1) 309,276 284,014 14,024 11,238
Structure costs (2) -206,823 -170,637 -1,842 -34,344
Provisions and adjustments (3) -29,368 -35,268 5,900
Profits/(Losses) on equity investments
carried at equity
Profits/(Losses) on the disposal of
investments
Profits/(Losses) before taxes on
continuing operations 73,085 78,109 12,182 -17,206
(1) income statement, including other operating income/expenses
(2) administrative expenses, net adjustments to tangible and intangible assets
(3) net adjustments fo r impairment of loans and receivables and financial assets, provisions for risks and charges

Notes to the financial statements
193
Balance sheet data 31.12.2011Merchant
bank
Investment
bankingAsset mng
Corporate
center
Financial assets 1,001,436 1,001,436
Equity investments 124,180 124,180
Amounts due from banks 167,016 167,016
Amounts due from customers 5,774,849 5,774,849
Amounts due to banks 393,373 393,373
Amounts due to customers 3,513,235 3,513,235
Securities issued and Financial liabilities at
fair value 2,543,123 2,543,123
INDIRECT DEPOSITS: ADMINISTERED
AND MANAGED 9,943,316 9,943,316
Income statement data 31.12.2010Merchant
bank
Investment
bankingAsset mng
Corporate
center
Business margin (1) 301,172 266,288 17,059 17,825
Structure costs (2) -205,198 -168,453 -1,860 -34,885
Provisions and adjustments (3) -22,594 -38,243 -5 15,654
Profits/(Losses) on equity investments
carried at equity 493 493Profits/(Losses) on the disposal of
investments
Profits/(Losses) before taxes on
continuing operations 73,873 59,592 15,194 -913
(1) income statement, including other operating income/expenses
(2) administrative expenses, net adjustments to tangible and intangible assets
(3) net adjustments fo r impairment of loans and receivables and financial assets, provisions for risks and charges
Balance sheet data 31.12.2010Merchant
bank
Investment
bankingAsset mng
Corporate
center
Financial assets 916,466 916,466
Equity investments 107,870 107,870
Amounts due from banks 272,770 272,770
Amounts due from customers 5,728,999 5,728,999
Amounts due to banks 319,825 319,825
Amounts due to customers 3,678,515 3,678,515
Securities issued and Financial liabilities at
fair value 2,338,666 2,318,633 20,033
INDIRECT DEPOSITS: ADMINISTERED
AND MANAGED 10,565,285 10,565,285

CERTIFICATION OF THE FINANCIAL STATEMENTS
PURSUANT TO ART. 154-BIS OF LEGISLATIVE DECREE 58/1998
1. The undersigned Nereo Dacci, Managing Director, and Piercamillo Secchi, Manager responsible forpreparing the Company financial reports, of Banco di Desio e della Brianza S.p.A., taking intoaccount the provisions of Article 154-bis, paragraphs 3 and 4, of Legislative Decree 58 of 24February 1998, do hereby certify to:
- the adequacy in relation to the Company’s features and- the actual application
of the administrative and accounting procedures employed to draw up the financial statements forthe 2011 financial year.
2. Evaluation of the adequacy of the administrative and accounting procedures employed to draw upthe financial statements as at 31 December 2011 was based on methods defined by Banco di Desioe della Brianza S.p.A. consistently with the Internal Control Integrated Framework model, issued bythe Committee of Sponsoring Organization of the Treadway Commission, which is an internationallyaccepted reference framework.
3. The undersigned also certify that:
3.1 The Financial Statements:
a. were prepared according to the applicable international accounting standardsrecognised in the European Union as per Regulation (EC) 1606/2002 of the EuropeanParliament and Council of 19 July 2002; the applicable provisions under the Italian CivilCode, Legislative decree no. 38 of 28 February 2005 and the administrative provisionsissued by the Bank of Italy;b. correspond to the results of the books and accounts;c. give a true and fair representation of the equity, economic and financial position ofthe issuer.
3.2 The Report on Operations includes a reliable analysis of the performance and result ofoperations, as well as of the position of the issuer, together with the description of the main risksand uncertainties to which they are exposed.
Desio, 20 March 2012.
Managing Director Manager responsible for preparingthe Company’s financial reports
Nereo Dacci Piercamillo Secchi

PricewaterhouseCoopers SpA
Sede legale e amministrativa: MilanoReg. Imp. Milano 12979880155 Iscritta al n. 43 dell’Albo ConsobBologna Zola Predosa 40069 Via Tevere 18 Tel. 0516186211Viale Gramsci 15 Tel. 0552482811 –– Padova 35138 Via Vicenza 4 Tel. 049873481Tel. 0521242848 – Roma 00154 Largo Fochetti 29 Tel. 06570251Via Grazioli 73 Tel. 0461237004 - TrevisoUdine 33100 Via Poscolle 43 Tel. 043225789
www.pwc.com/it
AUDITORS’ REPORT IN ACCORDANCE WITH ARTICLESDECREE N. 39 DATED 27 JANUARY 2010
To the shareholders ofBanco di Desio e della Brianza SpA
1 We have audited the financial statements of Banco di Desio e della BrDecember 2011, which comprise the balance sheet, income statement, statement ofcomprehensive income, statement of changes in shareholder’s equity, cash flow statementrelated notes. The directors ofpreparation of theseReporting Standards as adopted by the Europto implement article 9 of Legislative Decree No. 38/2005. Our responsibility is to express anopinion on these financial statements based on our audit.
2 We conducted our audit in accordance with the auditing standards and criteria recoby CONSOB. Those standards and criteria require that we plan and perform the audit toobtain the necessary assurance about whether the financial statements are free of materialmisstatement and, taken as a whole, are presented fairly. An audit incltest basis, evidence supporting the amounts and disclosures in the financial statements. Anaudit also includes assessing the accounting principles used and significant estimates made bythe directors. We believe that our audit provide
For the opinion on thecomparative purposes, referenc
3 In our opinion, the financial staDecember 2011 comply with thethe European UnionLegislative Decree No. 38/20and fair view of the financial position, results of operations, changes in equity and cash flowsof Banco di Desio e della Brianza SpA for the period then ended.
4 The directors of Banco diReport on Operations and of the Report on the Corporate Governance and ShareholdingStructure, published in the Banco DesioBrianza SpA’s website, inresponsibility is to express an opinion on the consistency of the Report on Operations and onthe information required by art. 123letters c), d), f), l), m) and paragraph 2, letter b) disclosed in the Report on the CorporateGovernance and Shareholding Structure with the financial statements, as required by law. Forthis purpose, we have performed the procedures required under Aud
PricewaterhouseCoopers SpA
20149 Via Monte Rosa 91 Tel. 0277851 Fax 027785240 Cap. Soc. 3.754.400,00 Euro i.v., C.F. e P.IVA eReg. Imp. Milano 12979880155 Iscritta al n. 43 dell’Albo Consob - Altri Uffici: Bari 70124 Via Don Luigi Guanella 17 Tel. 0805640211
Zola Predosa 40069 Via Tevere 18 Tel. 0516186211 – Brescia 25123 Via Borgo Pietro Wuhrer 23 Tel. 0303697501– Genova 16121 Piazza Dante 7 Tel. 01029041 – Napoli 80121 Piazza dei Martiri
35138 Via Vicenza 4 Tel. 049873481 – Palermo 90141 Via Marchese Ugo 60 Tel. 09134973700154 Largo Fochetti 29 Tel. 06570251 – Torino 10129 Corso Montevecchio 37
Treviso 31100 Viale Felissent 90 Tel. 0422696911 – Trieste 34125 Via Cesare Battisti 18 Tel. 040348078133100 Via Poscolle 43 Tel. 043225789 – Verona 37122 Corso Porta Nuova 125 Tel.0458002561
AUDITORS’ REPORT IN ACCORDANCE WITH ARTICLES 14 AND 16 OF LEGISLATIVEDECREE N. 39 DATED 27 JANUARY 2010
Banco di Desio e della Brianza SpA
We have audited the financial statements of Banco di Desio e della Br, which comprise the balance sheet, income statement, statement of
comprehensive income, statement of changes in shareholder’s equity, cash flow statementThe directors of Banco di Desio e della Brianza SpA are responsible for the
preparation of these financial statements in compliance with the International FinancialReporting Standards as adopted by the European Union, as well as with thto implement article 9 of Legislative Decree No. 38/2005. Our responsibility is to express anopinion on these financial statements based on our audit.
We conducted our audit in accordance with the auditing standards and criteria recoby CONSOB. Those standards and criteria require that we plan and perform the audit toobtain the necessary assurance about whether the financial statements are free of materialmisstatement and, taken as a whole, are presented fairly. An audit incltest basis, evidence supporting the amounts and disclosures in the financial statements. Anaudit also includes assessing the accounting principles used and significant estimates made bythe directors. We believe that our audit provides a reasonable basis for our audit opinion.
For the opinion on the financial statements of the prior period, which are presented forcomparative purposes, reference is made to our report dated 6 April, 2011
In our opinion, the financial statements of Banco di Desio e della Brcomply with the International Financial Reporting Standards as adopted by
ean Union, as well as with the regulations issued to implement article 9 ofLegislative Decree No. 38/2005; accordingly, they have been drawn up clearly and give a trueand fair view of the financial position, results of operations, changes in equity and cash flowsof Banco di Desio e della Brianza SpA for the period then ended.
Banco di Desio e della Brianza SpA are responsible for the preparation of theReport on Operations and of the Report on the Corporate Governance and ShareholdingStructure, published in the Banco Desio – Governance section of Banco di Desio e della
bsite, in accordance with the applicable laws and regulations. Ourresponsibility is to express an opinion on the consistency of the Report on Operations and onthe information required by art. 123-bis of Italian Legislative Decree n° 58/1998, paragraph 1,letters c), d), f), l), m) and paragraph 2, letter b) disclosed in the Report on the CorporateGovernance and Shareholding Structure with the financial statements, as required by law. Forthis purpose, we have performed the procedures required under Aud
20149 Via Monte Rosa 91 Tel. 0277851 Fax 027785240 Cap. Soc. 3.754.400,00 Euro i.v., C.F. e P.IVA e70124 Via Don Luigi Guanella 17 Tel. 0805640211 –
25123 Via Borgo Pietro Wuhrer 23 Tel. 0303697501 – Firenze 5012180121 Piazza dei Martiri 58 Tel. 08136181
90141 Via Marchese Ugo 60 Tel. 091349737 – Parma 43100 Viale Tanara 20/A10129 Corso Montevecchio 37 Tel. 011556771 – Trento 38122
34125 Via Cesare Battisti 18 Tel. 0403480781 -
14 AND 16 OF LEGISLATIVE
We have audited the financial statements of Banco di Desio e della Brianza SpA as of 31, which comprise the balance sheet, income statement, statement of
comprehensive income, statement of changes in shareholder’s equity, cash flow statement andare responsible for the
International Financialean Union, as well as with the regulations issued
to implement article 9 of Legislative Decree No. 38/2005. Our responsibility is to express an
We conducted our audit in accordance with the auditing standards and criteria recommendedby CONSOB. Those standards and criteria require that we plan and perform the audit toobtain the necessary assurance about whether the financial statements are free of materialmisstatement and, taken as a whole, are presented fairly. An audit includes examining, on atest basis, evidence supporting the amounts and disclosures in the financial statements. Anaudit also includes assessing the accounting principles used and significant estimates made by
s a reasonable basis for our audit opinion.
financial statements of the prior period, which are presented fore is made to our report dated 6 April, 2011.
tements of Banco di Desio e della Brianza SpA as of 31International Financial Reporting Standards as adopted by
, as well as with the regulations issued to implement article 9 ofaccordingly, they have been drawn up clearly and give a true
and fair view of the financial position, results of operations, changes in equity and cash flows
SpA are responsible for the preparation of theReport on Operations and of the Report on the Corporate Governance and Shareholding
Governance section of Banco di Desio e dellaaccordance with the applicable laws and regulations. Our
responsibility is to express an opinion on the consistency of the Report on Operations and onbis of Italian Legislative Decree n° 58/1998, paragraph 1,
letters c), d), f), l), m) and paragraph 2, letter b) disclosed in the Report on the CorporateGovernance and Shareholding Structure with the financial statements, as required by law. Forthis purpose, we have performed the procedures required under Auditing Standard n. 001

issued by the Italian Accounting Profession (CNDCEC) and recommended by CONSOB. In ouropinion, the Report on Operations and the information required by art. 123Legislative Decree n° 58/1998, paragraph 1, letters c), ddisclosed in the Report of the Corporate Governance Shareholding Structure, are consistentwith the financial statements of
Milan, 4 April 2012
PricewaterhouseCoopers SpA
Signed byLia Lucilla Turri(Partner)
This report has been translated into the English language from the original which was issued inItalian, solely for the convenience of international readers.
issued by the Italian Accounting Profession (CNDCEC) and recommended by CONSOB. In ouropinion, the Report on Operations and the information required by art. 123Legislative Decree n° 58/1998, paragraph 1, letters c), d), f), l), m) and paragraph 2, letter b)disclosed in the Report of the Corporate Governance Shareholding Structure, are consistentwith the financial statements of Banco di Desio e della Brianza SpA as of December 31, 2011
erhouseCoopers SpA
This report has been translated into the English language from the original which was issued inItalian, solely for the convenience of international readers.
2 of 2
issued by the Italian Accounting Profession (CNDCEC) and recommended by CONSOB. In ouropinion, the Report on Operations and the information required by art. 123-bis of Italian
), f), l), m) and paragraph 2, letter b)disclosed in the Report of the Corporate Governance Shareholding Structure, are consistent
SpA as of December 31, 2011.
This report has been translated into the English language from the original which was issued in
Consolidated Report on Operations 2011

Consolidated report on operations 2011
2
Corporate offices(Banco di Desio e della Brianza S.p.A.)
Board of Directors
Chairman Agostino Gavazzi*
Deputy Chairman Stefano Lado*
Managing Director Nereo Dacci*
Directors Egidio Gavazzi*
Luigi Gavazzi
Paolo Gavazzi
Guido Pozzoli*
Luigi Guatri
Gerolamo Pellicanò
Pier Antonio Cutellé
Lorenzo Rigodanza
* M embers of Executive Committee
Board of Statutory Auditors
Chairman Eugenio Mascheroni
Statutory Auditors Rodolfo Anghileri
Marco Piazza
Alternate Auditors Giovanni Cucchiani
Clemente Domenici
Carlo Mascheroni
General Management
General Director Claudio Broggi
Vice General Director Marco Sala
Manager responsible for preparing the Company’s financial reports pursuant to
article 154-bis of Consolidated Law on Finance "TUF"
Nominated Official in charge of draw ing up Company Accounts Piercamillo Secchi
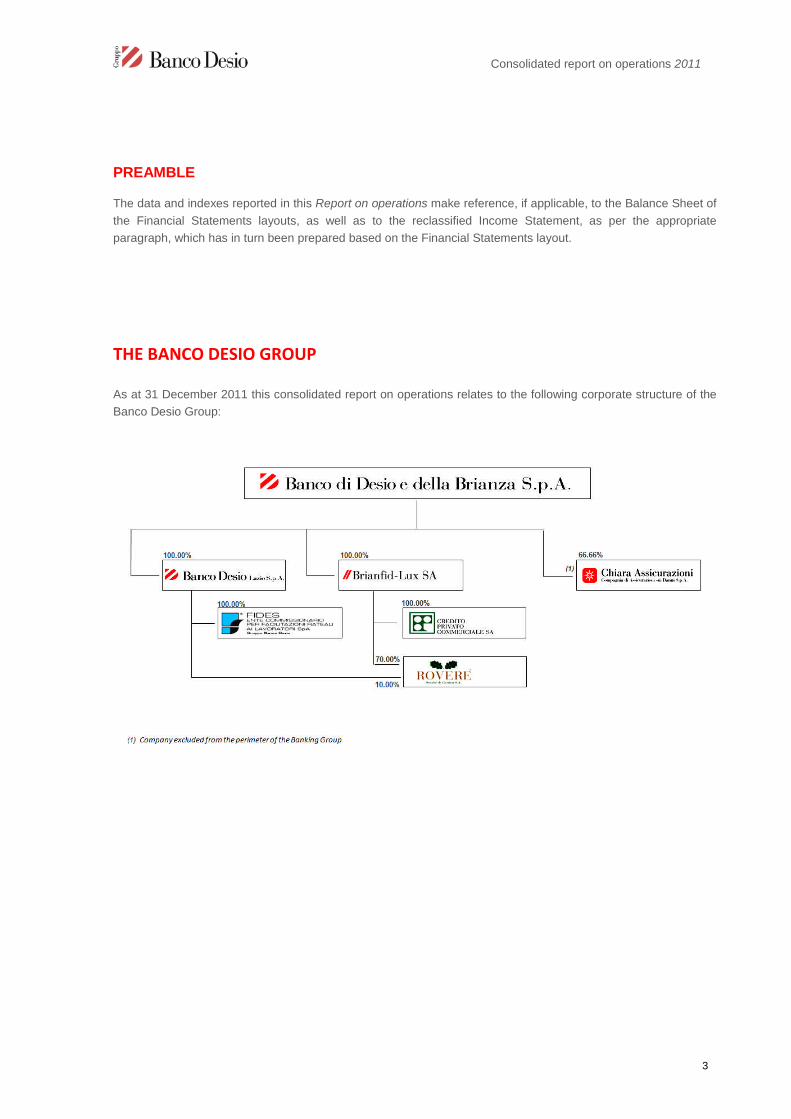
Consolidated report on operations 2011
3
PREAMBLE
The data and indexes reported in this Report on operations make reference, if applicable, to the Balance Sheet of
the Financial Statements layouts, as well as to the reclassified Income Statement, as per the appropriate
paragraph, which has in turn been prepared based on the Financial Statements layout.
THE BANCO DESIO GROUP
As at 31 December 2011 this consolidated report on operations relates to the following corporate structure of the
Banco Desio Group:

Consolidated report on operations 2011
4
1 - FINANCIAL HIGHLIGHTS AND RATIOS
BALANCE SHEET DATA
31.12.2011 31.12.2010
in thousand of Euros Amount %
Total assets 8,359,795 8,163,010 196,785 2.4%
Financial assets 1,066,594 999,053 67,541 6.8%
Amounts due from banks 288,525 302,852 -14,327 -4.7%
Amounts due from customers 6,580,450 6,476,720 103,730 1.6%
Tangible assests 154,481 150,821 3,660 2.4%
Intangible assets 46,496 47,592 -1,096 -2.3%
Amounts due to banks 267,998 171,918 96,080 55.9%
Amounts due to customers 4,347,706 4,459,599 -111,893 -2.5%
Securities issued and financial liabilities at fair value through profit or loss 2,696,584 2,448,734 247,850 10.1%
Shareholders'equity (including net prof it for the period) (1) 770,926 783,022 -12,096 -1.5%
Indirect deposits 10,821,717 11,605,011 -783,294 -6.7%
Change
INCOME STATEMENT DATA (2)
31.12.2011 31.12.2010
in thousands of Euros Amount %
Operating income 356,597 340,992 15,605 4.6%
of which Net Interest income 205,556 184,314 21,242 11.5%
Operating costs 236,657 233,248 3,409 1.5%
Operating margin 119,940 107,744 12,196 11.3%
Operating prof it net of taxes 41,189 38,221 2,968 7.8%
Non-recurring prof it after taxes 4,702 15,239 -10,537 -69.1%
Net profit/(loss) for the period (1) 44,942 52,611 -7,669 -14.6%
(1) pertaining to the Parent Company ;(2) from reclassified Income Statement
Change

Consolidated report on operations 2011
5
FINANCIAL RATIOS
31.12.2011 31.12.2010
Shareholders’ equity / Total assets 9.2% 9.6% -0.4%
Shareholders’ equity / Amounts due from customers 11.7% 12.1% -0.4%
Shareholders’ equity / Amounts due to customers 17.7% 17.6% 0.1%
Shareholders’ equity / Securities issued and financial liabilities valued at fair value 28.6% 32.0% -3.4%0.0%
(Tier 1 and Core Tier 1) Equity ratio 10.7% 11.0% -0.3%
(Tier 2) Solvency ratio 11.8% 12.4% -0.6%0.0%
Financial assets / Total assets 12.8% 12.2% 0.6%
Amounts due from banks / Total assets 3.5% 3.7% -0.2%
Amounts due from customers / Total assets 78.7% 79.3% -0.6%
Amounts due from customers / Direct deposits from customers 93.4% 93.8% -0.4%0.0%
Amounts due to banks / Total assets 3.2% 2.1% 1.1%
Amounts due to customers / Total assets 52.0% 54.6% -2.6%
Securities issued and financial liabilities valued at fair value/ Total assets 32.3% 30.0% 2.3%
Direct deposits from customers / Total assets 84.3% 84.6% -0.3%0.0%
Operating costs / Operating income (Cost/Income ratio) 66.4% 68.4% -2.0%
Net interest income / Operating income 57.6% 54.1% 3.5%
Operating margin / Operating income 33.6% 31.6% 2.0%
Operating profit net of taxes / Shareholders’ equity 5.7% 5.2% 0.5%
Net profit/(loss) for the period / Shareholders' equity (R.O.E.) 6.2% 7,2% -1.0%
Amount
Change
STRUCTURE AND PRODUCTIVITY DATA
31.12.2011 31.12.2010
Amount %
Number of employees 1,875 1,846 29 1.6%
Number of bank branches 185 175 10 5.7%
in thousands of Euros
Amounts due from customers by employee (3) 3,537 3,545 -8 -0.2%
Direct deposits from ordinary customer by employee (3) 3,786 3,781 5 0.1%
Operating income by employee (3) 192 187 5 2.7%
(3) on the basis of the number of employees determined as arithmetic mean
Change
Consolidated report on operations 2011
6
2 - THE BASELINE SCENARIO
2.1 - THE MACROECONOMIC FRAMEWORK
In 2011, the global economy suffered a further slowdown and the reduction in the rate of growth of GDP affected
both mature economies and emerging markets, with an associated variability in the growth rates of individual
countries. In a situation as volatile as this, many shadows remain hanging over the International Economy: the
slowdown in world trade, the fall in the price of raw materials, albeit at a moderate pace, and the weak expansion
of manufacturing activity in the USA and Asia, which moreover is in sharp decline in Europe.
Emerging Economies
At the end of 2011, the slowdown in economic activity in the BRIC countries became increasingly pronounced. In
the third quarter of 2011, GDP in China grew by 9.1% compared to average growth in 2010 of 10.4%. In India, the
slowdown was even more considerable (+6.7% against +10% of the previous year). In Brazil the slowdown
started to become increasingly marked; in the third quarter of 2011 GDP in Brazil grew by +2.1% on average
compared to +7.6% in 2010. On the other hand, Russia continued to record good growth rates; in the third quarter
GDP grew by an average of +4.8% against 4% in 2010. Consumer prices, after coming close to double figures,
started to slow down. Russia started to suffer from the EMU crisis as a result of the more well-established
presence of European banks in the region. The expansive measures of the Central Bank were aimed at avoiding
a liquidity crisis in a context of maintaining domestic demand.
United States
The US economy struggled to regain its pre-crisis growth rates. In the first two quarters of 2011, GDP growth data
were disappointing, whereas a rate of +2% was indicated in the final quarter, a trend that could continue into the
first months of 2012. The latest positive data released regarding the employment market and the property market
contributed to improving the climate of confidence in the strengthening of the economic cycle, although there are
still a number of grey areas; the main item of concern related to household spending which is rather low. In fact,
the weakness of the labour market weighs heavily on the trend of consumption; at the end of 2011 the rate of
unemployment in the USA was still very high, albeit falling in the last months of the year. Another element that
affected household spending was the level of borrowing; the ratio of loans to families to disposable income was
equal to 115%, lower than the peak of 130% in 2007 but still high when compared to the average of 70%
recorded in the last thirty years of the past century. Inflation remained broadly stable and fixed at 2%.
Japan
The situation in Japan highlighted a much deeper recession than previously reported as a result of the earthquake
in March. The third quarter saw a sharp rebound in the growth of investments in construction and exports. On the
other hand, growth in investments in machinery and equipment was negative whereas consumption rose slightly
due to the effect of the increase in real salaries. The main economic indicators showed a decline in service
activities and manufacturing at the end of 2011 in spite of the recovery in the summer.
Euro Zone
The difficulties faced by the European institutions in managing the crisis affected a growing number of countries.
Growth in the Euro Zone slowed; indeed after 3.1% in the first quarter, GDP increased at very moderate rates
(+0.7%, +0.6%). In the third quarter of 2011, GDP decreased compared to the second quarter, not only in a
number of peripheral countries of the European Union but also in Holland and Belgium. Germany still stood out
with reported growth of 1% in the second quarter and 2% in the third quarter. In France, after the standstill
recorded in the second quarter, GDP returned to growth in the third quarter with a variance of +1.5% being

Consolidated report on operations 2011
7
recorded. The economic indicators for the last months of 2011 and the start of 2012 show an extremely weak
situation for the majority of countries, the only exception being Germany. At the end of the third quarter of 2011
industrial production in the Euro Zone recorded a decline of 1.8% on a monthly basis. The business confidence
index, which had been in decline since February, registered -7.3% in October. On the prices front, there was a
further increase in inflation. The situation on the labour market continued to be very negative; in October the rate
of unemployment hit 10.3%, up from the minimum level recorded in March 2008 (+7.3%). In a context in which the
great uncertainty regarding the cyclic upturn continued to be compounded by the necessity to recapitalise a large
number of banks, during 2011, the European Central Bank repeatedly provided support to the banking system
and tried to avoid a credit crunch for families and businesses using all the means at its disposal.
Italy
The performance of the Italian economy was disappointing; the trend of GDP declined by 0.5% on an annual
basis in the final part of the year. In October the industrial production index fell by another 2% with respect to the
previous month, a weakness that seems destined to last. Production expectations are at the lowest levels since
October, driven down mainly by a sharp reduction in orders. Exports were still below pre-crisis levels, having lost
24% and recovered only a half. In October, new manufacturing orders registered a decrease of 4.8% on an
annual basis. In the same month, retail sales registered a negative variance. In November the business
confidence index fell, from -9.7% to -11.3%. The mood of consumers fell sharply, from -29.2% to -34% between
November and December. The labour market too showed a rate of unemployment of around 8.6%, with much
higher peaks for the younger population; the depression of the employment market has led inevitably to a
considerable weakness in private consumption. In 2010, the increase in the prices index could largely be
attributed to the increase in oil prices, this tendency also intensified during 2011.
2.2 - THE CAPITAL MARKET AND THE BANKING SYSTEM IN ITALY
The change reported in the trends of the main economies in December 2011 recorded monthly performances less
than the growths recorded in 2010; this is also evident if we observe International stock markets: notwithstanding
the recovery in progress on a monthly basis, in fact, the annual changes were significantly negative. The Dow
Jones Euro Stoxx recorded a decrease of 12.5% on an annual basis, the Nikkei 225 of Tokyo 17.1%, while the
Standard & Poor’s 500 of New York substantially remained stable (+0.2%). The main European Stock Exchange
indexes also recorded, in December, monthly average changes showing a recovery but negative on an annual
basis: the Ftse Mib recorded a variation of 0.3% on a monthly basis (-26.1% y/y), the Dax30 +0.7% (-16.1% y/y),
the Cac40 +1.9% (-19.7% y/y) and the UK Ftse100 +1.5% (-6.8% y/y). In the wake of the trends in the stock
exchanges of the individual markets, in December 2011 the capitalization of the Euro Zone stock market also
showed a positive performance, on a cyclical basis (+0.5%) but negative on an annual basis (-18.1%). Within the
Euro Zone, capitalisation was equal to 9.9% of the total in Italy, 31.2% in France and 25.5% in Germany. With
specific reference to Italy, the overall capitalisation of the stock market came to Euro 133 billion (Euro 93 billion on
an annual basis) at the end of December. The impact of bank capitalization on the total came to 16.7% compared
to 29.8%, the value posted at the beginning of the financial crisis.
With reference to the banking system, at the end of 2011 the growth rate of domestic borrowing appeared to have
settled at the end of 2011, while the trend in the borrowing on foreign markets showed a decrease. The tendential
growth rate of deposits in Euro of the Italian banks came to +1.5%. Specifically, deposits from customers
recorded a tendential negative growth rate of -2.1%, while the annual change in bonds was positive and equal to
+7.8%; a decrease was recorded by transactions with customers (-35.4%). The average return on bank deposits
was stable, consistently with the performance of market rates. The average rate of bank deposits from customers
came to 1.11% in December 2011, down by 37 basis points compared to the same period of the previous period.

Consolidated report on operations 2011
8
Loans to private individuals showed an increase at the end of 2011, recording a tendential growth of +4.1%; on
the basis of a breakdown by term, the medium/long-term segment showed a tendential growth change of +2.9%,
while the short-term segment showed an increase equal to 7.6%.
At the end of the year, a slight deceleration was recorded in the trend of loans to businesses: however, a growth
of 4.9% was recorded as a whole, a value which is again in line with the levels of April 2011. The weighted
average rate on total loans to families and non-financial companies was equal to 4.25%, while that of loans for the
purchase of properties was 3.83%.
In 2011, compared to 2010, the spread between the average rate on loans and the average rate on deposits
recorded a slight increase; in December 2011 it was higher by 1 basis point than recorded by the average of
December 2010. In the 2011 average the scissors were equal to 2.43%, up compared to the average value
recorded in 2010 (2.15%).
3 - LOCAL EXPANSION AND ISSUES OF CORPORATE INTEREST
3.1 - DEVELOPMENT OF THE DISTRIBUTION NETWORK
Even within the difficult macroeconomic scenario, the Group firmly continued, also in 2011, to expand its
distribution network which, following the opening of ten branches, reached an overall number of 185 units at the
end of the financial year.
The branch network, increasingly widespread, continues to be marked by the central role given to the rapport and
relations with customers. The objective of the continuity in the expansion policy was to put roots down in the
territory with which the Group is historically associated and in adjacent and complementary areas and to take up
other local opportunities. Over time this policy has led the Group to extend its presence in Lombardy, Emilia,
Piedmont, Liguria, Tuscany, Veneto and Lazio.
The breakdown of the branch network by Group company with the change in the year is shown in the table below,
while the chart that follows it also gives the percentage distribution by region as at the end of the year.

Consolidated report on operations 2011
9
No. of branches 31.12.2011Percentage
breakdown31.12.2010
Percentage
breakdownValue %
Banco di Desio e della Brianza S.p.A. 164 88,6% 155 88,6% 9 5,8%
Banco Desio Lazio S.p.A. 21 11,4% 20 11,4% 1 5,0%
Group distribution network 185 100,0% 175 100,0% 10 5,7%
Change
Banco di Desio e dellaBrianza S.p.A.
88.6%
Banco Desio LazioS.p.A.11.4%
PiedmontEmilia Romagna
58.4%
7.6%5.9%
Lombardy
Liguria 3.2%
Veneto
Tuscany 5.9%
7.6%
In the year that has closed, the Parent Company opened four branches in Lombardy, in Milan near piazzale
Cadorna, Vimercate (Monza e della Brianza), Treviglio (Bergamo) and Brembate (Bergamo), three branches in
Emilia Romagna, in Bologna S. Viola (Bologna), Imola (Bologna) and Casalecchio di Reno (Bologna), one branch
in Piedmont in Leinì (Turin) and another branch in Tuscany in Sesto Fiorentino (Florence).
The distribution structure of the subsidiary Banco Desio Lazio S.p.A., with the opening of the branch in Albano
Laziale (Rome) in October, numbered a total of twenty-one branches, with a presence particularly concentrated in
the capital and the surrounding areas.
The chart below shows the dimensional growth of the Group in the last few years, corresponding to a
development rate equal to the Compound Annual Growth Rate of 4.7% in the three year period 2009-2011.
Chart no. 1- THE GROUP DISTRIBUTION NETWORK: PERCENTAGE BREAKDOWN BY BANK AND BY REGION 2011
Table no. 1 - THE GROUP DISTRIBUTION NETWORK: BREAKDOWN BY BANK

Consolidated report on operations 2011
10
0
50
100
150
200
2008 2009 2010 2011
161169
175185
Branches
3.2 - MAJOR CORPORATE EVENTS DURING THE FINANCIAL YEAR
Merger of the subsidiaries Banco Desio Toscana S.p.A. and Banco Desio Veneto S.p.A. by incorporation into the
Parent Company and transfer of stakes in the subsidiary Rovere Societé de Gestion SA
In view of a more correct streamlining of the banking network in relation to its vocation of retail bank, the Parent
Company implemented, in the year, the Plan of Merger by incorporation of the subsidiaries Banco Desio Toscana
S.p.A. and Banco Desio Veneto S.p.A., which led to the execution of the deed of merger with legal effect from 1
October 2011.
With reference to the shareholdings previously held by Banco Desio Toscana S.p.A. and Banco Desio Veneto
S.p.A. in the subsidiary Rovere Societé de Gestion SA, each for a share of 10%, and then transferred to the
Parent Company as a result of the merger, it should be pointed out that, at the same time, the same transferred
these shares to the subsidiary Brianfid-Lux SA, which increased its stake in the aforesaid company up to 70%.
Approval of the 2012-2013 two-year Business Plan
On 22 December 2011, the Board of Directors of the Parent Company approved the 2012-2013 two-year
Strategic Group Plan in which, in a particularly difficult economic situation in which growth prospects and the
performance of the financial markets are dependent on a number of crisis indicators, it reaffirms its strategy of
unwavering confidence in the retail banking model, as a provider of a full range of services to its customers.
This Strategic Plan also incorporates the “Local Development Project” for the two-year period as notified to the
Bank of Italy; as part of an ever-targeted local development initiative, it is expected that the distribution network
will number a total of 197 branches at the end of 2013.
Capital strengthening of the subsidiaries Banco Desio Lazio S.p.A. and FIDES S.p.A.
As part of the strategic planning scheduled for the 2012-2013 two-year period, on 20 December 2011, the Parent
Company made a shareholders’ contribution to the capital of the subsidiary Banco Desio Lazio S.p.A., non-
interest-bearing and without expiry (non-refundable), amounting to €10 million. The consequent capital
strengthening can be connected for the most part to the forecast of operational development for the indirect
Chart no. 2 - THE GROUP DISTRIBUTION NETWORK: GROWTH IN SIZE IN THE LAST FEW YEARS
Consolidated report on operations 2011
11
subsidiary FIDES S.p.A.; indeed, on the same date, Banco Desio Lazio S.p.A. in turn made a shareholders’
contribution to the capital of the finance company, non-interest-bearing and without expiry (non-refundable),
amounting to €5 million. Both transactions provide the opportunity to start the authorisation and deliberation
process in order to reach the respective capital increases of the companies.
Capital increase serving a Stock Grant Plan for the three-year period 2011-2013
On 27 October 2011, the Board of Directors of the Parent Company took, subject to the favourable opinion of the
Appointments and Remuneration Committee (to the extent pertaining thereto), some measures after the
resolutions of 21 July 2011, which were adopted for the purposes of bringing the Group’s Incentive System into
line with the “Provisions for banks and banking groups governing remuneration and incentive policies and
practices” (Disposizioni per le banche e i gruppi bancari in materia di politiche e prassi di remunerazione e
incentivazione) issued by the Bank of Italy on 30 March 2011.
Following the subsequent authorisation given by the Bank of Italy as to the amendments to the by-laws connected
to the 2011-2013 Stock Grant Plan, which forms an integral part of the new Incentive System, and at the request
of the Board of Directors, on 29 November 2011 the Ordinary Shareholders’ Meeting approved the review of the
Group’s Remuneration Policies in relation to the Incentive System in favour of the Management, as adopted for
the purposes of complying with the abovementioned Supervisory provisions, the Stock Grant Plan for the three-
year period 2011-2013 concerning the assignment, free of charge, of a maximum number of 1,000,000 ordinary
shares of the Company in favour of the Group’s Management (as identified in the application of the
abovementioned supervisory Provisions), as well as the establishment of appropriate reserve for accumulated
earnings, subject to the service of the capital increase, free of charge, reserved for the Group’s Management.
Accordingly, the Extraordinary Shareholders’ Meeting held on the same date approved the capital increase, free
of charge, pursuant to article 2349 of the Italian Civil Code, on a divisible basis, for a maximum nominal amount of
Euro 520,000 corresponding to a maximum number of 1,000,000 ordinary shares, with a par value of Euro 0.52
each, serving the Stock Grant Plan, to be issued by the Board of Directors in more than one tranche, within the
time limits and subject to the conditions envisaged in the Plan itself, through the use of an appropriate equity
reserve drawn from other free equity reserves made up of “undivided profits” and also approved the correlated
proposed amendments to Section 4 of the Bylaws.
Capital increase of the subsidiary Chiara Assicurazioni S.p.A. and increase to 66.66% of the stake held by the
Parent Company in the insurance company
On 27 April 2011 the subsidiary Chiara Assicurazioni S.p.A. implemented the capital increase of Euro 0.6 million,
serving the residual Shareholding plan, increasing it to Euro 9.4 million; at the same time, the Parent Company
increased its stake held in the Insurance Company up to 66.66%, considering that, as early as 15 February 2011,
it had reached 62.43% as a result of the purchase of 50,000 shares.
Payment by shareholders on account of capital of the associated company Chiara Vita S.p.A.
In view of the strengthening of the capital structure of the associated company Chiara Vita S.p.A., on 20 April
2011 the Parent Company made a shareholder payment on account of capital of Euro 2.7 million.
Acquisition of the stake in AcomeA SGR S.p.A.
On 25 July 2011 the Parent Company acquired 50,000 ordinary shares of AcomeA SGR S.p.A., within the capital
increase of the same, at a price of Euro 30.00 per share (including Euro 20.00 by way of share premium), for a
counter-value of Euro 1.5 million. As a result of this transaction, the stake held in the finance company is equal to
9.09%.
Group remuneration policies

Consolidated report on operations 2011
12
The Banco Desio Group has adopted the Bank of Italy and Consob regulations with respect to remuneration
policies. The objective of the Bank of Italy is to ensure, in the interest of all stakeholders, systems of remuneration
that are in line with the long-term corporate strategy and objectives, correlated to the company results, suitably
adjusted to take into account all risks, consistently with the levels of capital and liquidity necessary to deal with the
activities undertaken and in any case such as to avoid any incentives that may give rise to conflicts of interest and
excessive risk taking. For all details, reference is made to the Group Remuneration Policies prepared pursuant to
article 123-ter of the TUF, which are available on the Group’s website , together with this Report.
Opening of inspection procedures by the Bank of Italy
It should be pointed out that on 21 November 2011 an ordinary supervisory inspection was started at the Parent
Company in relation to the Banco Desio Group.
Tax assessment by the Finance Police
It should be pointed out that on 14 December 2011 a tax assessment was started at the Parent Company by the
Finance Police – Tax Police Unit of Milan Milano.
3.3 - OTHER TRANSACTIONS / MAJOR CORPORATE EVENTS RELATING TO SUBSIDIARIESOR ASSOCIATES
Judicial investigations - Banco Desio Lazio S.p.A. and Credito Privato Commerciale S.A.
On 3 January 2012, the company received notification of a request for committal for trial submitted by the Public
Prosecutor’s Office of the Court of Rome, within the context of judicial proceedings concerning, among others, a
number of parties who at the time of the alleged events, which date back to 2009, were representatives of the
subsidiaries Banco Desio Lazio S.p.A. and Credito Privato Commerciale S.A., as well as third parties with respect
to the Companies themselves. As the alleged events include offences that entail the administrative liability of legal
persons, pursuant to Legislative Decree 231/2001 Banco Desio Lazio S.p.A. is involved in the abovementioned
proceedings, in relation to the unlawful administrative act contested envisaged under articles 5 of Legislative
Decree 231/2001 and 10, paragraph 2, of Law 146/2006, for the cases provided for by articles 416 and 648-bis of
the Italian Criminal Code alleged against the then Chief Executive Officer of the Company itself, as a result of the
administration relationship existing at that time; Credito Privato Commerciale S.A. is involved in relation to the
unlawful administrative act contested envisaged under articles 5 and 25-octies of Legislative Decree 231/2001
and 10, paragraph 2, of Law 146/2006, for the cases provided for by articles 416 and 648-bis of the Italian
Criminal Code alleged against the then General Manager of the Company itself, as a result of the management
relationship existing at that time.
In light of the above, the Boards of Directors of each of the two subsidiaries has approved, in order to be prudent,
the setting aside of a specific provision amounting to the average of the minimum and maximum penalties
envisaged. On the basis of the work performed and the checks conducted so far in relation to the conditions of a
plea bargain, the defence lawyer for the subsidiaries Banco Desio Lazio S.p.A. and Credito Privato Commerciale
S.A. has confirmed that any other risks have been ruled out; in particular, we highlight that the banks have taken
steps to adopt and implement an appropriate organisational model and before the next hearing they will also take
steps to implement the remaining conditions which are required in order to rule out the application of disqualifying
sanctions under article 17 of Legislative Decree 231/01.
Adjustment to the value of the equity investment of Brianfid-Lux S.A. in the subsidiary Credito Privato
Commerciale S.A. As part of the procedure that has been launched to explore the market for the possible sale of
the Swiss subsidiary Credito Privato Commerciale S.A. by Brianfid-Lux S.A., the company has taken steps to
align the value of the stake to the value deriving from the contingent application of market benchmarks for
transactions of that nature.

Consolidated report on operations 2011
13
4 - HUMAN RESOURCES
4.1 - MANAGEMENT AND BREAKDOWN OF THE RESOURCES
While respecting the individual characteristics of the companies, human resource management aims for a unitary
and synergetic approach, bolstering expectations and fostering professional growth as well as ensuring the
sharing of values within the Group. This approach, in line with the geographic expansion policy, accompanies the
dissemination of information and development in areas with which the Bank has historic associations and in inter-
regional offices in different catchment areas and economic sectors.
As at 31 December 2011, the Group counted 1,875 employees, with an increase of 29, corresponding to 1.6%,
compared to the final figure of the previous year.
The increase in the number of staff in the last three-year period 2009-2011 corresponded to an average
compound annual growth rate equal to 1.9%, lower than that registered in the distribution network, which was
equal to 4.7%, as evidenced by the numeric data represented in the chart below.
0
500
1.000
1.500
2.000
2008 2009 2010 2011
1,7741,808
1,8461,875
Employees
The table below shows the breakdown of staff by grade and the variation on the previous year.
No. of employees 31.12.2011Percentage
breakdown31.12.2010
Percentage
breakdownValue %
Executives 38 2.0% 42 2.3% -4 -9.5%
3rd and 4th level managers 444 23.7% 420 22.8% 24 5.7%
1st and 2nd level managers 500 26.7% 490 26.5% 10 2.0%
Other personnel 893 47.6% 894 48.4% -1 -0.1%
Group staff 1,875 100.0% 1,846 100.0% 29 1.6%
Change
Table no. 2 - GROUP STAFF: BREAKDOWN BY GRADE
Chart no. 3 - INCREASE IN THE GROUP STAFF NUMBERS IN THE LAST FEW YEARS

Consolidated report on operations 2011
14
4.2 – TRAINING ACTIVITIES
With reference to training activities, which is a distinctly effective partner in growth processes and in developing
resources, in accordance with the directives and procedures envisaged at Group level, the financial year saw the
implementation of an overall number of 8,120 man/days of training meetings, counting in-house courses,
conferences, external seminars and online training activities.
The provision of training in 2011 is broken down according to the types outlined below:
- “General”: offers courses targeted at all professional families and with the objective of developing cross-
sector skills;
- “Technical-professional”: includes courses aimed at developing the technical skills of staff who are starting
out in the performance of specific tasks or those interested in consolidating or further improving skills that
are relevant to the position held;
- “Inter-personal skills”: aims to develop behavioural skills and facilitate the spreading of the business
culture as well as the internalisation of the company values.
The chart below reports the percentage breakdown of the days of training meetings for the three types specified.
82.2%
9.6%
8.2%
Technical-professional General Inter-personal skills
Within the scope of “General” training activities, note the importance attached to the actions for compliance with
the regulations in force; specifically, attention was paid to the issues concerning “Money Laundering”, “Legislative
Decree 231/2001”, “Transparency” and “Safety at Work”.
Regarding the “Technical professional” training, the percentage breakdown of the meetings held based on the
classification of the issues dealt with by sectors concerned is represented in the following chart.
Chart no. 4 - “TECHNICAL PROFESSIONAL” TRAINING IN THE YEAR 2010: BREAKDOWN BY SUBJECT

Consolidated report on operations 2011
15
61.7%
13.6%
24.7%
Finance and Insurance Administrative Commercial, credit, International and Other
The activity carried out, which particularly affects the “Loans” area, is composed of courses aimed at the further
growth of professionals with a significant commitment to the planning of specific activities for the support and
consolidation of skills, given the complexity and the changing needs of the market caused by the difficult and
fragile macroeconomic situation.
In the “Finance and Insurance” segment we note the delivery of the programme relating to “Risks in investment
services” which has been extended to the whole Private Clients department, with the objective of raising
awareness among Network staff with regard to behaviour that is always strictly aligned to operational standards.
In the Private Banker world, the training activity for the certification of on-the-job skills which was started in
previous years was completed. Furthermore, although it is cross-cutting compared to the specificity of individual
professionals, as well as having maintained the insurance update in accordance with the provisions of the ISVAP
Regulation, attention was given to the further development of specific skills for relevant profiles.
As regards the “Interpersonal Skills” initiatives we highlight the launch of a training programme to develop
“commercial” skills, which moreover is being intensified this year and which pursues the objectives of improving
interpersonal performance during the commercial offer phase as well as of increasing knowledge of clients, who
have always been a focus of great attention since they are the true assets of the Group.
In general, the organisation of the training provision has led, and will lead to an increasing extent, to the use of
channels that supplement the traditional classroom; in this regard we highlight the use of distance learning
modules (FAD), manuals to support working activity and periods of working alongside subject experts, such as for
example training on the job within the “Foreign” activities.
The focus placed by the Group on the growth and development of professional skills was recognised by the
Fondo Banche Assicurazioni (FBA) (Banks and Insurance Companies Fund) which in 2011 provided the Parent
Company with grants of around €0.5 million. The Fund’s recognition and support for training activity is the result of
an approach that is now well-established.
4.3 – LABOUR RELATIONS
In the context of trade union relations, which have always been characterised by a cordial and constructive
relationship in the manner established by the Parent Company, it is noted that requests submitted by the
company trade unions for the complete renewal of the Supplementary Company Agreement were closely
examined during 2011. During this procedure it was confirmed that the 2nd
-level supplementary bargaining will
take place exclusively as regards the subjects expressly referred to by the National Collective Labour Agreement
(CCNL, Contratto Collettivo Nazionale di Lavoro) for the sector; the negotiations, for which we are still waiting for
the outline of the package put forward by the trade unions, will therefore take place within this context.
Chart no. 5 - “TECHNICAL PROFESSIONAL” TRAINING IN THE YEAR 2011: BREAKDOWN BY SUBJECT

Consolidated report on operations 2011
16
It should be pointed out that, on 19 January 2012, the A.B.I. (Associazione Bancaria Italiana, Italian bankers’
Association) and the Trade Unions for the sector signed the new “National collective labour agreement for middle
managers and for the staff of professional areas depending on credit, finance and instrumental companies”
(Contratto Collettivo nazionale di lavoro per i quadri direttivi e per il personale delle aree professionali dipendenti
dalle imprese creditizie, finanziarie e strumentali).
5 - CONTROL ACTIVITIES
5.1 - LEVELS OF CONTROL IN THE FUNCTION OF DIRECTION AND CO-ORDINATION
In the exercise of its function of direction and co-ordination, the Parent Company Banco di Desio e della Brianza
S.p.A., effects three levels of control on subsidiaries in order to implement the specific “co-ordination model”
selected, taking account of the nature and size of the activities carried out by the individual companies together
with their specific location and identifying within its structure the competent functions for the specific control
mechanisms.
The first level is of a strategic nature and is designed to maintain a constant check that the indications given by
the Parent Company are kept to. Implementation is achieved for the most part by the presence of its own
representatives on the Boards of Directors of each subsidiary company, normally in sufficient numbers to
represent a majority.
The second level is more concerned with management and relates to the activities of analysis, systemising and
evaluation of the periodical information flows from subsidiary companies in order to confirm the pursuit of strategic
goals in compliance with supervisory rules, the preparation of sufficient reports on performance and profitability,
the analysis of development/research/investment plans and of strategic opportunities, forecast flows and all other
information necessary for the preparation of the Group Budget.
The third level can be described as being technical/operational in nature and in practice is conducted through the
supervision of internal control systems.
Additional information on direction and coordination activities is contained in paragraph 2.3 of the Annual Report
on Corporate Governance made available, pursuant to article 123-bis of the Consolidated Law on Finance, on the
Group’s website at the same time as this Report, to which reference is made.
5.2 - INTERNAL CONTROL SYSTEM
The internal control system is made up of the collection of standards of conduct, rules and organisational
procedures which, in observance of law instructions from the Supervisory Body and business strategies, make it
possible to manage all Group activities properly, involving the top Bodies and management and, in general, all
staff.
Company’s financial reports, and then also on risk management systems and on systems of internal control over
the financial reporting process, is contained in paragraphs 1 and 7 of the Annual Report on Corporate
Governance made available, pursuant to article 123-bis of the Consolidated Law on Finance, on the Group’s
website at the same time as this Report, to which reference is made.

Consolidated report on operations 2011
17
5.3 - RISK MEASUREMENT AND MANAGEMENT
With regard to the specific activities carried out by the Parent Company’s Risk Management function designed to
ensure that checks are maintained on the various risk types through the adoption of integrated processes, please
refer to Part E of the Notes to the Financial Statements Information on Risks and the Related Hedging Policies.
6 - MANAGEMENT PERFORMANCE
6.1 - SAVINGS DEPOSITS: ADMINISTERED CUSTOMER ASSETS
At the end of the financial year the total administered customer assets came to about Euro 17.9 billion, with an
increase of 2% in direct deposits and a decrease of 6.7% in indirect deposits, particularly affected by the
international economic and financial crisis that significantly affected stock prices, which entailed a decrease in the
value of deposits equal to 3.5%.
The breakdown and balances of the items of the aggregate are shown in the table below.
Amounts in thousands of Euro 31.12.2011Percentage
breakdown31.12.2010
Percentage
breakdownValue %
Amounts due to customers 4,347,706 24.3% 4,459,599 24.1% -111,893 -2.5%
Securities issued and financial liabilities
at fair value through profit or loss 2,696,584 15.1% 2,448,734 13.2% 247,850 10.1%
Direct deposits 7,044,290 39.4% 6,908,333 37.3% 135,957 2.0%
Deposits from ordinary customers 7,717,007 43.2% 8,365,300 45.2% -648,293 -7.7%
Deposits from institutional customers 3,104,710 17.4% 3,239,711 17.5% -135,001 -4.2%
Indirect deposits 10,821,717 60.6% 11,605,011 62.7% -783,294 -6.7%
Total deposits from customers 17,866,007 100.0% 18,513,344 100.0% -647,337 -3.5%
Change
Direct deposits
At the end of 2011 the balance of direct deposits exceeded Euro 7 billion (+2%) as a result of the increase in
outstanding securities and financial liabilities at fair value (+10.1%), which was partially adjusted by the decrease
in amounts due to customers (-2.5%).
Amounts due to customers, which continue to represent the most significant item with 61.7% of the aggregate,
can be referred to about Euro 4.2 billion to the “sight” deposits, i.e. current accounts and savings deposits, while a
residual part refers to time deposits, reverse repurchase agreements and other payables.
Table no. 3 - DEPOSITS FROM CUSTOMERS

Consolidated report on operations 2011
18
Securities issued and financial liabilities at fair value refer to bonds issued and placed by the Group for about
Euro 2.3 billion (including Euro 0.1 billion of subordinated debt) and to deposit certificates for about Euro 0.4
billion. Within the balance, financial liabilities reported on the basis of the fair value option amounted to about
Euro 0.1 billion and related to bond loans hedged with financial derivative instruments.
It should be pointed out that, during 2011, the total nominal value of the bond loans issued and placed was
around Euro 0.8 billion, while that of the loans repaid upon expiry amounted to about Euro 0.7 billion.
Indirect deposits
In the twelve months indirect deposits reported a decrease of about Euro 0.8 billion, equal to 6.7% of the previous
balance, totalling about Euro 10.8 billion.
Deposits from “ordinary” customers came to about Euro 7.7 billion, with an annual decrease of about Euro 0.6
billion, equal to 7.7%, which concerned both administered and managed assets, the latter showing an increase in
the “bank-insurance” assets.
Deposits from institutional customers reported a decrease of about Euro 0.1 billion compared to the balance of
the previous financial year, equal to 4.2%.
The table below gives the details of the items in question, showing the variations reported at the end of the twelve
months under analysis.
Amounts in thousands of Euros 31.12.2011Percentage
breakdown31.12.2010
Percentage
breakdownValue %
Asset administration 4,335,692 40.1% 4,568,258 39.4% -232,566 -5.1%
Asset management 3,381,315 31.2% 3,797,042 32.7% -415,727 -10.9%
of which: Mut.Fund and Open-end Inv. 815,585 7.5% 1,187,076 10.2% -371,491 -31.3%
Portfolio management 459,571 4.2% 631,235 5.4% -171,664 -27.2%
Bank Insurance 2,106,159 19.5% 1,978,731 17.1% 127,428 6.4%
Deposits from ordinary customers 7,717,007 71.3% 8,365,300 72.1% -648,293 -7.7%
Deposits from institutional customers 3,104,710 28.7% 3,239,711 27.9% -135,001 -4.2%
Indirect deposits 10,821,717 100.0% 11,605,011 100.0% -783,294 -6.7%
Change
The charts below represent the breakdown by segment of the indirect deposits from ordinary customers as at 31
December 2011, as well as that of the components of the managed assets.
Table no. 4 - INDIRECT DEPOSITS

Consolidated report on operations 2011
19
56.2%
43.8%
Asset administration Asset management
24.1%
13.6%
62.3%
Mtu.Fund and Open-end Inv. Portfolio management Bank insurance
With reference to the components of the Mutual Funds and Open-end Inv. and Portfolio Management, the
diversification of the investments was the key theme for management, in order to be better able to seize all the
opportunities in the context of an extremely difficult economic situation and its main objective was to preserve
invested capital. The bond portfolios tried to balance, on the one hand, activities that are risk-free despite their
particularly low yield and, on the other hand, issues with potential to give interesting returns even if they are
characterised by an increased price volatility. The share component was characterised by an extremely prudent
approach; the investment favoured companies with strong financial statements, investing in large cap companies
with interesting dividends and operating in all the main global markets.
6.2 - CREDIT MANAGEMENT: LOANS TO CUSTOMERS
Loans to customers continued its growth trend, witnessing the particular commitment undertaken by the Group for
the actual support to families and small- and medium-sized companies in the difficult economic and financial
context. At 31 December 2011 the total amount of lending to customers increased up to about Euro 6.6 billion,
with an annual increase of Euro 0.1 billion, equal to 1.6%; the graph below represents the development trend of
loans in the three-year period 2009-2011.
Chart no. 6 - INDIRECT DEPOSITS FOR ASSET MANAGEMENT AT 31.12.2011: BREAKDOWN
Chart no. 5 - INDIRECT DEPOSITS FROM ORDINARY CUSTOMERS BY SECTOR AT 31.12.2011:

Consolidated report on operations 2011
20
108103
9181
0
2
4
6
8
2008 2009 2010 2011
5.76.2
6.5 6.6
Euro/MLD
3,2
The differences in the balances of the items making up lending, as shown in the table below, show in particular
the increase in the medium- and long-term actuarial form, which is mainly made up of mortgages.
Amounts in thousands of Euros 31.12.2011Percentage
breakdow n31.12.2010
Percentage
breakdownValue %
Current accounts 1,536,661 23.4% 1,508,312 23.3% 28,349 1.9%
Mortgages and other medium/long
term loans 4,285,266 65.1% 4,121,587 63.6% 163,679 4.0%
Other 758,523 11.5% 846,821 13.1% -88,298 -10.4%
Amounts due from customers 6,580,450 100.0% 6,476,720 100.0% 103,730 1.6%
Change
The credit quality reflects the guidelines based on the principles of prudence, diversification and targeted
development characterising the credit policies of the whole Banco Desio Group, constituting the essential element
in the credit provision strategy and it permits a degree of concentration on smaller figures.
As regards the distribution of gross loans, including endorsement loans, the percentage impact of uptakes by the
largest clients at the end of 2011 compared to the final figure at the end of the previous year, is reported in the
table below, reflecting the high and even greater degree of risk spreading.
Chart no. 7 - LOANS TO CUSTOMERS: THE TREND OVER THE LAST FEW YEARS
Table no. 5 - AMOUNTS DUE FROM CUSTOMERS

Consolidated report on operations 2011
21
Number of customersi (1) 31.12.2011 31.12.2010
10 largest customers 2.2% 3.6%
20 largest customers 3.3% 4.7%
30 largest customers 4.2% 5.5%
50 largest customers 5.6% 7.0%
(1) On the basis of the data of the Parent Company and of the subsidiary Banco Desio Lazio S.p.A.
It should be noted that, according to the supervisory regulations in force, at the end of 2011 only one position was
recorded which can be classified as “Significant Risks”, for a total nominal amount (which also includes the
guarantees given and any commitments) of about Euro 0.7 billion, which has no corresponding total weighted
amount; on the other hand, as the position relates to relations with the Treasury Ministry, no outstanding position
is actually reported against customers at Group level.
At the end of the period the total amount of net impaired loans, represented by non-performing loans and problem
loans in addition to expired loans, that is persistent breach in relation to continuing failure to comply with credit
limits, as well as restructured exposures, amounted to Euro 268.1 million, net of value adjustments of Euro 109.7
million. Specifically, net non-performing loans amounted to Euro 124.7 million, net problem loans to Euro 104.6
million and expired loans to Euro 34.9 million and restructured exposures to Euro 3.9 million.
The table below summarises gross and net credit risk ratios: the amounts are still low, even though there was a
generalised increase compared with the previous year as a natural consequence of the economic crisis.
Table no. 6 – AMOUNTS DUE FROM LARGEST CUSTOMERS: CONCENTRATION INDEX

Consolidated report on operations 2011
22
% Indexes for gross loans 31.12.2011 31.12.2010
Gross impaired loans to customers 5.62% 4.59%
of which:
- gross non performing loans 3.01% 2.37%
- gross problem loans 2.01% 1.65%
- gross expired loans 0.54% 0.50%
- gross restructured loans 0.06% 0.07%
% Indexes for net loans 31.12.2011 31.12.2010
Net impaired loans to customers 4.07% 3.15%
of which:
- net non performing loans 1.89% 1.38%
- net problem loans 1.59% 1.22%
- net expired loans 0.53% 0.49%
- net restructured loans 0.06% 0.06%
6.3 THE SECURITIES PORTFOLIO AND INTER-BANK POSITION
The securities portfolio
On 31 December 2011 the Group’s total financial assets were equal to about Euro 1.1 billion, compared to Euro
1.1 billion which was the figure of the preceding year.
The chart below presents the percentage breakdown of the portfolio based on the types of securities, showing
that debt securities, mainly comprised of Government securities and of primary bank issuers, accounts for the
most significant portion.
Table no. 7 - AMOUNTS DUE FROM CUSTOMERS: RISK CREDIT INDICATORS
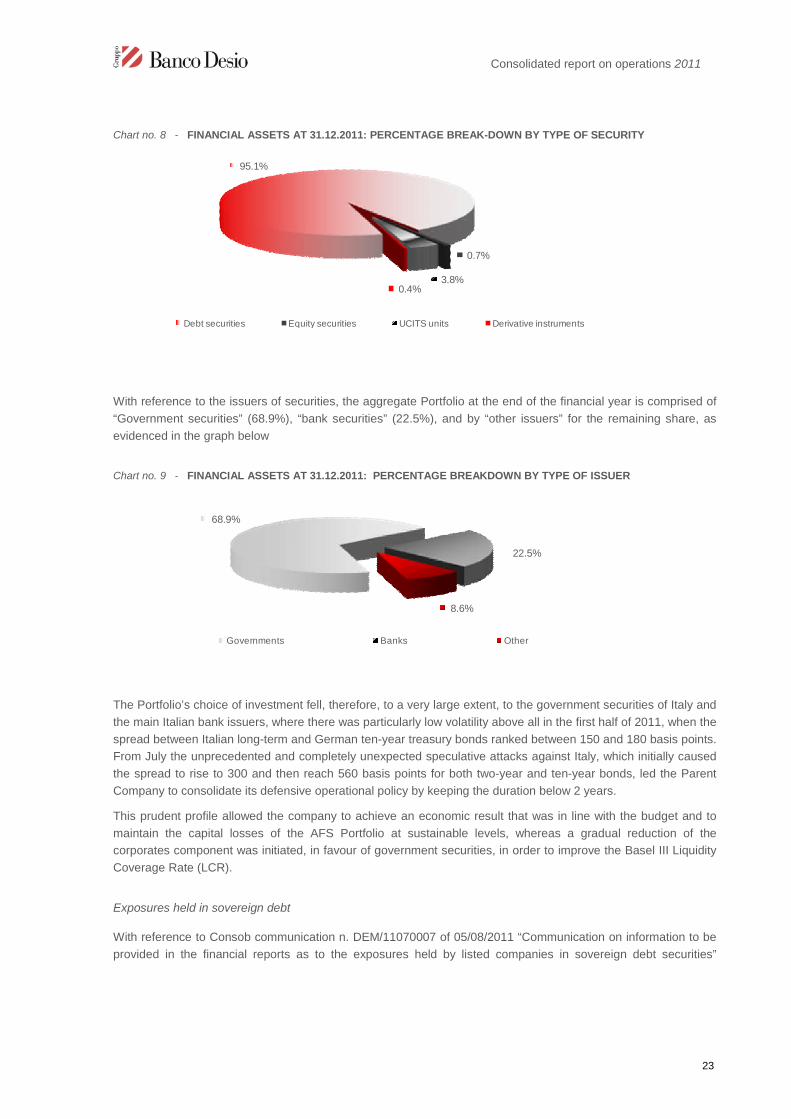
Consolidated report on operations 2011
23
95.1%
0.7%
3.8%0.4%
Debt securities Equity securities UCITS units Derivative instruments
With reference to the issuers of securities, the aggregate Portfolio at the end of the financial year is comprised of
“Government securities” (68.9%), “bank securities” (22.5%), and by “other issuers” for the remaining share, as
evidenced in the graph below
68.9%
22.5%
8.6%
Governments Banks Other
The Portfolio’s choice of investment fell, therefore, to a very large extent, to the government securities of Italy and
the main Italian bank issuers, where there was particularly low volatility above all in the first half of 2011, when the
spread between Italian long-term and German ten-year treasury bonds ranked between 150 and 180 basis points.
From July the unprecedented and completely unexpected speculative attacks against Italy, which initially caused
the spread to rise to 300 and then reach 560 basis points for both two-year and ten-year bonds, led the Parent
Company to consolidate its defensive operational policy by keeping the duration below 2 years.
This prudent profile allowed the company to achieve an economic result that was in line with the budget and to
maintain the capital losses of the AFS Portfolio at sustainable levels, whereas a gradual reduction of the
corporates component was initiated, in favour of government securities, in order to improve the Basel III Liquidity
Coverage Rate (LCR).
Exposures held in sovereign debt
With reference to Consob communication n. DEM/11070007 of 05/08/2011 “Communication on information to be
provided in the financial reports as to the exposures held by listed companies in sovereign debt securities”
Chart no. 8 - FINANCIAL ASSETS AT 31.12.2011: PERCENTAGE BREAK-DOWN BY TYPE OF SECURITY
Chart no. 9 - FINANCIAL ASSETS AT 31.12.2011: PERCENTAGE BREAKDOWN BY TYPE OF ISSUER

Consolidated report on operations 2011
24
(Comunicazione in materia di informazioni da rendere nelle relazioni finanziarie in merito alle esposizioni detenute
dalle società quotate nei titoli di debito sovrano), below are broken down the positions as at 31 December 2011.
Amounts in thousands of EurosItaly 31.12.2011
Nominal value 8,710 8,710
Book value 8,594 8,594
Nominal value 652,172 652,172
Book value 614,460 614,460
Nominal value 110,000 110,000
Book value 110,774 110,774
Nominal value 770,882 770,882
Book value 733,828 733,828
Financial assets available for trading
Financial assets available for sale
Financial assets held to maturity
Sovereign debt securities
Amounts in thousands of EurosItaly 31.12.2011
up to 1 year 6,985 6,985
1 to 3 years 750 750
3 to 5 years 460 460
beyond 5 years 515 515
Total 8,710 8,710
up to 1 year 153,182 153,182
1 to 3 years 318,660 318,660
3 to 5 years 75,720 75,720
beyond 5 years 104,610 104,610
Totale 652,172 652,172
up to 1 year 0 0
1 to 3 years 0 0
3 to 5 years 0 0
beyond 5 years 110,000 110,000
Total 110,000 110,000
up to 1 year 160,167 160,167
1 to 3 years 319,410 319,410
3 to 5 years 76,180 76,180
beyond 5 years 215,125 215,125
Total 770,882 770,882
Financial assets available for trading
Financial assets available for sale
Financial assets held to maturity
Sovereign debt securities
Table no. 8 - SOVEREIGN DEBT SECURITIES: BREAKDOWN BY PORTFOLIO AND ISSUER
Table no. 9 - SOVEREIGN DEBT SECURITIES: BREAKDOWN BY PORTFOLIO, ISSUER AND RESIDUAL TERM

Consolidated report on operations 2011
25
The interbank position
The net interbank position at the end of the financial year was positive and almost balanced (Euro 20 million),
compared to the positive position of about Euro 0.1 billion in the previous year.
With reference to the treasury activity, 2011 was characterised by a balanced situation in terms of liquidity,
without particular tensions and, therefore, recourse was made to the open market transactions of the ECB only on
an occasional basis.
In order to maintain a liquidity buffer, the Parent Company participated in the LTRO transaction (Long-Term
Refinancing Operation) of the ECB on 22 December 2011 for Euro 200 million, using its own securities.
6.4 - SHAREHOLDERS’ EQUITY AND ECONOMIC STABILITY
Shareholders’ equity as at 31 December 2011, including the net profits of the period, amounted to a total of Euro
770.9 million, with respect to Euro 783 million of the figure recorded for 2010.
Shareholders’ equity calculated in accordance with the supervisory regulations in force was equal to Euro 728.9
million with respect to Euro 772.6 million at the end of the previous year. The figure is made up of Tier 1 capital of
Euro 663.7 million (compared to Euro 686.5 million at the end of 2010) with Tier 2 capital of Euro 75.6 million
(compared to Euro 99.6 million at the end of 2010) for valuation reserves, and subordinated liabilities. The total of
the items to be deducted amounted to Euro 49.3 million (of which about Euro 10.4 million is to be deducted from
the sum of Tier 1 and Tier 2) and these refer to equity investments in financial and insurance bodies.
The Tier 1 capital ratio, representing the ratio of primary capital to risk-weighted assets was equal to 10.7% and in
fact coincides with the Tier 1 Core. The Tier 2 solvency ratio, representing the ratio between regulatory capital
and risk-weighted assets, was 11.8% according to the supervisory regulations in force. On 31 December 2010
these ratios were 11% and 12.4% respectively.

Consolidated report on operations 2011
26
6.5 - RECLASSIFIED INCOME STATEMENT
A reclassified Income Statement has been prepared (as compared with the layout in the Financial Statements) in
order to provide a view of the Bank’s affairs that is more consistent with operational performance, and this is the
basis on which the following comments are made.
The following is a summary of the criteria adopted in the preparation of this statement:
- two accounting item totals were stated, defined as “Operating income” and “Operating costs”, the
algebraic balance of which constitutes the “Operating margin”;
- “Net profit/(loss) for the period” was divided into “Profits/(losses) after taxes from continuing operations”
and “Non-recurring profits/(losses) after taxes”;
- Net income from insurance activities includes the following income from Chiara Assicurazioni S.p.A.: net
interest income (items 10 and 20), net insurance premiums (item 150), profits/(losses) on
disposal/repurchase of financial assets available for sale (item 100), Other operating income and
expenses (item 220) and the balance of other income/charges from insurance activities management
(item 160);
- “Operating income” also includes the balance of item 220, “Other operating income and expenses”, also
net of tax recoveries for stamp duty on customers’ statements of account and securities deposit
accounts and substitute tax on medium- and long-term financing, in addition to the amortisation of
leasehold improvements, respectively reclassified as a reduction of item 180 (b), “Other administrative
expenses” and as an increase of item 210, “Net adjustments to the value of /write-backs to intangible
assets” in the “Operating costs” total;
- shares of profits in the period relating to equity investments in associates were reclassified from item 240
“Profits/(losses) on equity investments” to the item “Profits on equity investments in associates;
- the balance of item 100 (a), “Profit/(loss) on disposal/purchase of receivables” in “Operating income” was
reclassified in special item “Profit/(loss) on disposal/purchase of receivables” after “Operating margin”;
- provisions for clawback actions in debt litigation were reclassified from item 190, “Net provisions for risks
and charges”, to item 130 (a), “Net impairment losses on loans”, both items following “Operating margin”;
- provisions for extraordinary transactions are reclassified from item 190, “Net provisions for risks and
charges”, to item “Provisions for risks and charges on extraordinary transactions";
- the tax effect on non-recurring Profits/(losses) is reclassified from item 290, “Taxes for the period on
income from continuing operations” to the item “Taxes for the period on income from non-recurring
operations”.
The 2011 financial year ended with Parent Bank net profit (loss) of Euro 44.9 million, as shown in the table below,
which states the reclassified Income Statement in comparison with the income statement of the previous year.

Consolidated report on operations 2011
27
Captions
Amounts in thousands of Euros 31.12.2011 31.12.2010 Value %
10+20 Net interest income 205,556 184,314 21,242 11.5%
70 Dividend and similar income 48 370 -322 -87.0%
Profits (losses) on equity investments in associates 2,763 3,380 -617 -18.3%
40+50 Net fees and commissions 120,142 127,606 -7,464 -5.8%
80+90+100+
110
Net prof its/(losses) on trading activities, hedging activities and
disposal/repurchase and financial assets/liabilities at fair value through
profit or loss 7,049 9,611 -2,562 -26.7%
150+160 Net income from insurance activities 12,539 10,373 2,166 20.9%
220 Other operating income and expenses 8,500 5,338 3,162 59.2%
Operating income 356,597 340,992 15,605 4.6%
180 a Personnel expenses -157,073 -154,975 -2,098 1.4%
180 b Other administrative expenses -67,944 -67,545 -399 0.6%
200+210 Net adjustments to tangible/intangible assets -11,640 -10,728 -912 8.5%
Operating costs -236,657 -233,248 -3,409 1.5%
Operating margin 119,940 107,744 12,196 11.3%
Net prof its/(losses) on disposal/repurchase of receivables -556 60 -616 -1026.7%
130 a Net impairment losses on loans -38,959 -40,306 1,347 -3.3%
130 d Net impairment losses on other f inancial transactions -87 -102 15 -14.7%
190 Net provisions for risks and charges -3,056 570 -3,626 -636.1%
Profits/(losses) before taxes from continuing operations 77,282 67,966 9,316 13.7%
290 Taxes for the period on income from continuing operations -36,093 -29,745 -6,348 21.3%
Profits/(losses) after taxes from continuing operations 41,189 38,221 2,968 7.8%
240+270+
260
Profits (losses) on equity investments and on disposal of investments
value adjustments to goodw ill -2,998 529 -3,527 -666.7%
Provisions for risks and charges on extraordinary transactions 7,700 14,717 -7,017 -47.7%
Non-recurring profit/(loss) before taxes 4,702 15,246 -10,544 -69.2%
Taxes for the period on income from non-recurring items 0 -7 7 -100.0%
Non-recurring profit/(loss) after taxes 4,702 15,239 -10,537 -69.1%
320 Net profit/(loss) for the period 45,891 53,460 -7,569 -14.2%
330 (Prof it)/loss for the period attributable to minority interests -949 -849 -100 11.8%
340 Parent Bank net profit (loss) 44,942 52,611 -7,669 -14.6%
Change
In order to make it easier to compare the reclassified Income Statement with the items as shown in the Financial
Statements layout, a reconciliation statement is given for each year, showing the figures corresponding to the
total in the layouts and the reclassification balances.
Table no. 10 - RECLASSIFIED INCOME STATEMENT

Consolidated report on operations 2011
28
Captions
Financial
Statements
Reclassified
Statements
Amounts in thousands of Euros 31.12.2011
Net income
from
insurance
activities
Tax
recoveries
Prof its on
equity
investments in
associates
Amortisation
of leasehold
improvements
Net profits/(losses) on
disposal/repurchase of
receivables
Uses /
provisions for
risks and
charges
Taxes on
income31.12.2011
10+20 Net interest income 206,867 -1,311 205,556
70 Dividend and similar income 48 48
Prof its (losses) on equity investments in associates 2,763 2,763
40+50 Net fees and commissions 120,142 120,142
80+90+100+
110
Net prof its/(losses) on trading activities, hedging activities and
disposal/repurchase and financial assets/liabilities at fair value through
prof it or loss 6,460 33 556 7,049
150+160 Net income from insurance activities 11,296 1,243 12,539
220 Other operating income and expenses 17,956 35 -12,679 3,188 8,500
Operating income 362,769 0 -12,679 2,763 3,188 556 0 0 356,597
180 a Personnel expenses -157,073 -157,073
180 b Other administrative expenses -80,623 12,679 -67,944
200+210 Net adjustments to tangible/intangible assets -8,452 -3,188 -11,640
Operating costs -246,148 0 12,679 0 -3,188 0 0 0 -236,657
Operating margin 116,621 0 0 2,763 0 556 0 0 119,940
Net prof its/(losses) on disposal/repurchase of receivables -556 -556
130 a Net impairment losses on loans -38,370 -589 -38,959
130 d Net impairment losses on other f inancial transactions -87 -87
190 Net provisions for risks and charges 4,055 -7,111 -3,056
Profits/(losses) before taxes from continuing operations 82,219 0 0 2,763 0 0 -7,700 0 77,282
290 Taxes for the period on income from continuing operations -36,093 0 -36,093
Profits/(losses) after taxes from continuing operations 46,126 0 0 2,763 0 0 -7,700 0 41,189
240+270+
260Prof its (losses) on equity investments and on disposal of investments
/value adjustments to goodw ill -235 -2,763 -2,998
Provisions for risks and charges on extraordinary transactions 7,700 7,700
Non-recurring profit(loss) before taxes -235 0 0 -2,763 0 0 7,700 0 4,702
Taxes for the period on income from non-recurring items 0 0
Non-recurring profit(loss) after taxes -235 0 0 -2,763 0 0 7,700 0 4,702
320 Net profit/(loss) for the period 45,891 0 0 0 0 0 0 0 45,891
330 (Profit)/loss for the period attributable to minority interests -949 -949
340 Parent Bank net profit (loss) 44,942 0 0 0 0 0 0 0 44,942
Reclassifications
Table no. 11 - RECONCILIATION BETWEEN FINANCIAL STATEMENTS AND RECLASSIFIED INCOME
STATEMENT AS AT 31.12.2011
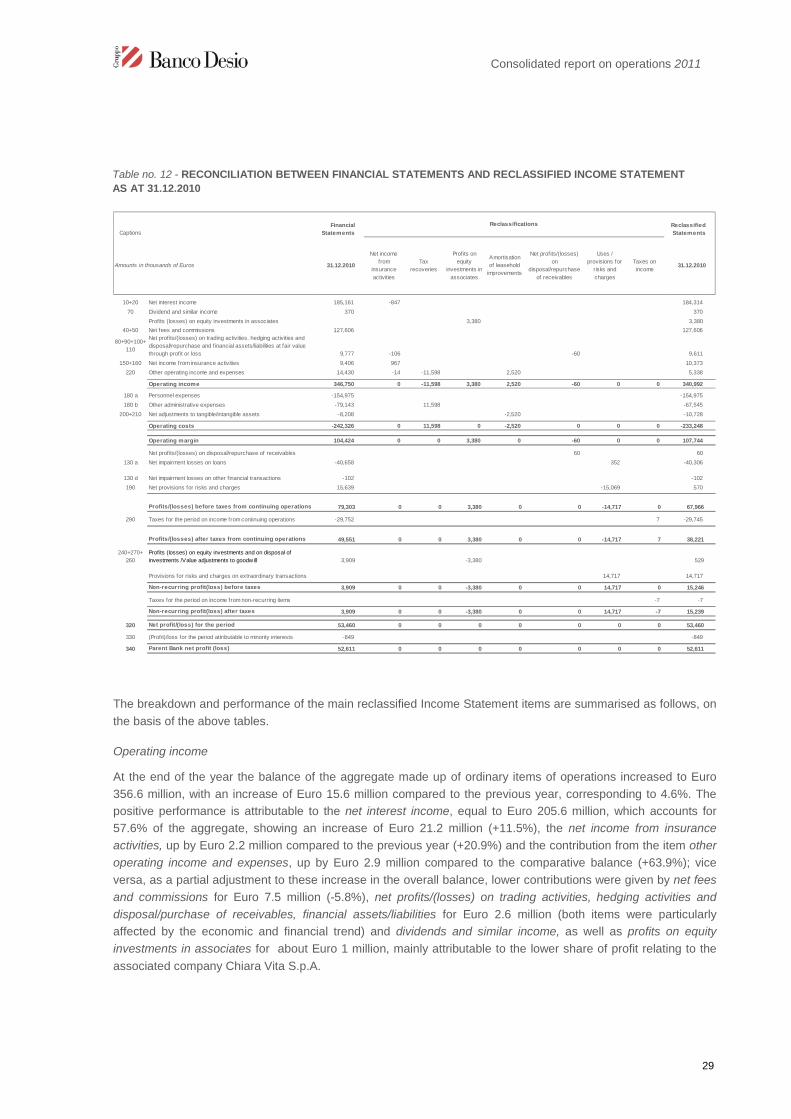
Consolidated report on operations 2011
29
Captions
Financial
Statements
Reclassified
Statements
Amounts in thousands of Euros 31.12.2010
Net income
from
insurance
activities
Tax
recoveries
Profits on
equity
investments in
associates
Amortisation
of leasehold
improvements
Net profits/(losses)
on
disposal/repurchase
of receivables
Uses /
provisions for
risks and
charges
Taxes on
income31.12.2010
10+20 Net interest income 185,161 -847 184,314
70 Dividend and similar income 370 370
Profits (losses) on equity investments in associates 3,380 3,380
40+50 Net fees and commissions 127,606 127,606
80+90+100+
110
Net profits/(losses) on trading activities, hedging activities and
disposal/repurchase and financial assets/liabilities at fair value
through profit or loss 9,777 -106 -60 9,611
150+160 Net income from insurance activities 9,406 967 10,373
220 Other operating income and expenses 14,430 -14 -11,598 2,520 5,338
Operating income 346,750 0 -11,598 3,380 2,520 -60 0 0 340,992
180 a Personnel expenses -154,975 -154,975
180 b Other administrative expenses -79,143 11,598 -67,545
200+210 Net adjustments to tangible/intangible assets -8,208 -2,520 -10,728
Operating costs -242,326 0 11,598 0 -2,520 0 0 0 -233,248
Operating margin 104,424 0 0 3,380 0 -60 0 0 107,744
Net profits/(losses) on disposal/repurchase of receivables 60 60
130 a Net impairment losses on loans -40,658 352 -40,306
130 d Net impairment losses on other financial transactions -102 -102
190 Net provisions for risks and charges 15,639 -15,069 570
Profits/(losses) before taxes from continuing operations 79,303 0 0 3,380 0 0 -14,717 0 67,966
290 Taxes for the period on income from continuing operations -29,752 7 -29,745
Profits/(losses) after taxes from continuing operations 49,551 0 0 3,380 0 0 -14,717 7 38,221
240+270+
260
Profits (losses) on equity investments and on disposal of
investments /Value adjustments to goodw ill 3,909 -3,380 529
Provisions for risks and charges on extraordinary transactions 14,717 14,717
Non-recurring profit(loss) before taxes 3,909 0 0 -3,380 0 0 14,717 0 15,246
Taxes for the period on income from non-recurring items -7 -7
Non-recurring profit(loss) after taxes 3,909 0 0 -3,380 0 0 14,717 -7 15,239
320 Net profit/(loss) for the period 53,460 0 0 0 0 0 0 0 53,460
330 (Profit)/loss for the period attributable to minority interests -849 -849
340 Parent Bank net profit (loss) 52,611 0 0 0 0 0 0 0 52,611
Reclassifications
The breakdown and performance of the main reclassified Income Statement items are summarised as follows, on
the basis of the above tables.
Operating income
At the end of the year the balance of the aggregate made up of ordinary items of operations increased to Euro
356.6 million, with an increase of Euro 15.6 million compared to the previous year, corresponding to 4.6%. The
positive performance is attributable to the net interest income, equal to Euro 205.6 million, which accounts for
57.6% of the aggregate, showing an increase of Euro 21.2 million (+11.5%), the net income from insurance
activities, up by Euro 2.2 million compared to the previous year (+20.9%) and the contribution from the item other
operating income and expenses, up by Euro 2.9 million compared to the comparative balance (+63.9%); vice
versa, as a partial adjustment to these increase in the overall balance, lower contributions were given by net fees
and commissions for Euro 7.5 million (-5.8%), net profits/(losses) on trading activities, hedging activities and
disposal/purchase of receivables, financial assets/liabilities for Euro 2.6 million (both items were particularly
affected by the economic and financial trend) and dividends and similar income, as well as profits on equity
investments in associates for about Euro 1 million, mainly attributable to the lower share of profit relating to the
associated company Chiara Vita S.p.A.
Table no. 12 - RECONCILIATION BETWEEN FINANCIAL STATEMENTS AND RECLASSIFIED INCOME STATEMENT
AS AT 31.12.2010
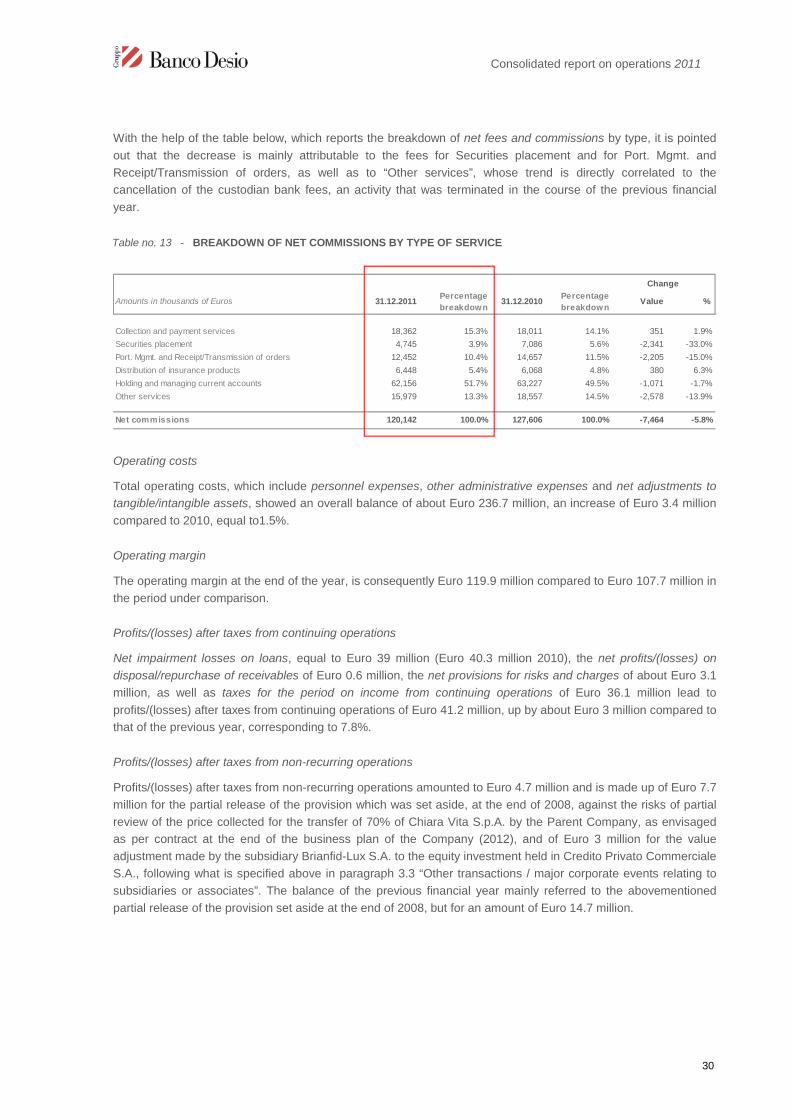
Consolidated report on operations 2011
30
With the help of the table below, which reports the breakdown of net fees and commissions by type, it is pointed
out that the decrease is mainly attributable to the fees for Securities placement and for Port. Mgmt. and
Receipt/Transmission of orders, as well as to “Other services”, whose trend is directly correlated to the
cancellation of the custodian bank fees, an activity that was terminated in the course of the previous financial
year.
Amounts in thousands of Euros 31.12.2011Percentage
breakdown31.12.2010
Percentage
breakdownValue %
Collection and payment services 18,362 15.3% 18,011 14.1% 351 1.9%
Securities placement 4,745 3.9% 7,086 5.6% -2,341 -33.0%
Port. Mgmt. and Receipt/Transmission of orders 12,452 10.4% 14,657 11.5% -2,205 -15.0%
Distribution of insurance products 6,448 5.4% 6,068 4.8% 380 6.3%
Holding and managing current accounts 62,156 51.7% 63,227 49.5% -1,071 -1.7%
Other services 15,979 13.3% 18,557 14.5% -2,578 -13.9%
Net commissions 120,142 100.0% 127,606 100.0% -7,464 -5.8%
Change
Operating costs
Total operating costs, which include personnel expenses, other administrative expenses and net adjustments to
tangible/intangible assets, showed an overall balance of about Euro 236.7 million, an increase of Euro 3.4 million
compared to 2010, equal to1.5%.
Operating margin
The operating margin at the end of the year, is consequently Euro 119.9 million compared to Euro 107.7 million in
the period under comparison.
Profits/(losses) after taxes from continuing operations
Net impairment losses on loans, equal to Euro 39 million (Euro 40.3 million 2010), the net profits/(losses) on
disposal/repurchase of receivables of Euro 0.6 million, the net provisions for risks and charges of about Euro 3.1
million, as well as taxes for the period on income from continuing operations of Euro 36.1 million lead to
profits/(losses) after taxes from continuing operations of Euro 41.2 million, up by about Euro 3 million compared to
that of the previous year, corresponding to 7.8%.
Profits/(losses) after taxes from non-recurring operations
Profits/(losses) after taxes from non-recurring operations amounted to Euro 4.7 million and is made up of Euro 7.7
million for the partial release of the provision which was set aside, at the end of 2008, against the risks of partial
review of the price collected for the transfer of 70% of Chiara Vita S.p.A. by the Parent Company, as envisaged
as per contract at the end of the business plan of the Company (2012), and of Euro 3 million for the value
adjustment made by the subsidiary Brianfid-Lux S.A. to the equity investment held in Credito Privato Commerciale
S.A., following what is specified above in paragraph 3.3 “Other transactions / major corporate events relating to
subsidiaries or associates”. The balance of the previous financial year mainly referred to the abovementioned
partial release of the provision set aside at the end of 2008, but for an amount of Euro 14.7 million.)
Table no. 13 - BREAKDOWN OF NET COMMISSIONS BY TYPE OF SERVICE
Consolidated report on operations 2011
31
Parent Bank net profit (loss)
Adding together profit after taxes from continuing operations, profit after taxes from non-recurring operations and
minority interests, the Parent Bank net profit (loss) for the 2011 financial year was Euro 44.9 million, down by
about Euro 7.7 million compared to that of the previous year (-14.6%), which also benefitted from an additional
Euro 10.5 million referable to the non-recurring result, net of taxes.
7 -SIGNIFICANT EVENTS AFTER THE REPORTING DATE
No significant events are reported which occurred after the reporting date.
8 - OTHER INFORMATION
8.1 - TREASURY SHARES
As at 31 December 2011, as in the previous year, the Parent Company Banco di Desio e della Brianza S.p.A did
not hold any treasury shares nor any shares in the parent company Brianza Unione di Luigi Gavazzi & C. S.a.p.A.
and no movements were registered during the year.
8.2 - IL RATING
On 20 November 2011, the international agency Fitch Ratings, as a result of the downgrading of the growth
prospects of the Italian economy and the complex economic and financial conditions in which the banks will
operate, changed the ratings assigned to the Parent Company as follows:
- long-term rating from “A” (with ‘stable’ outlook) to “A-” (with ‘negative’ outlook);
- short-term rating from “F1” to “F2”;
- viability rating from “a” to “a-”,
- senior debt notes rating from “A” to “A-”.
However, all the other ratings assigned previously were confirmed.
Fitch Ratings considers the Parent Company to be in a better position than medium-sized banks to manage the
impact of the economic decline, thanks to its prudent management of the credit risk and the solidity of its assets.
Furthermore, the bank is less exposed to market sentiments as it relies on direct deposits from clients for its
funding and not on the wholesale market. The bank’s rating also reflects its solid capitalisation. The negative
outlook is solely linked to the possibility of a further intensification of the financial crisis in the Eurozone and the
potential impact that it could have on the profitability margins of the banking system.

Consolidated report on operations 2011
32
8.3 - CODE FOR THE PROTECTION OF PERSONAL DATA (Legislative Decree no. 196 of 30
June 2003)
The obligation to adopt the Security Policy Statement (Documento Programmatico della Sicurezza) was abolished
by Decree Law no. 5 of 9.02.2012 “Urgent measures for simplification and development”; however, the obligations
laid down with regard to minimum security measures remain fully applicable and the data controller must
therefore continue to fulfil all the relevant requirements on the subject.
In spite of the fact that the abovementioned decree allows specific relevant requirements to be postponed, and
pending further instructions from the Authority, we highlight that the annual update of the Security Policy
Statement was carried out nonetheless, in accordance with the provisions, in place at the time, of Article 34
paragraph g) of Legislative Decree no. 196 of 30 June 2003 – Code for the Protection of Personal Data.
This Document sets out a description of aspects laid down by the Code pursuant to Rule 19 of the Technical
Regulations – Annex B to the Code itself.
8.4 - Legislative Decree 231/2001
In the framework of measures taken as regards the issue of administrative liability, in 2004 the Parent Company’s
Board of Directors resolved to adopt an Organisational Model to prevent the commission of the offences
contemplated in Legislative Decree 231/2001.
In accordance with the Bankitalia Order concerning organisations and internal controls relating to money
laundering, on 1 September 2011 the Compliance Office established the Group’s Anti-Money Laundering
Function and the Compliance office was duly empowered for the delivery of the SOS (Segnalazioni di Operazioni
Sospette, Reports on Suspect Transactions) on the part of the Parent Company and of the subsidiaries Banco
Desio Lazio S.p.A. and FIDES S.p.A.
For a summary description of the Model 231 adopted, reference should be made to paragraphs 1 and 7 of the
Annual Report on Corporate Governance made available, pursuant to article 123-bis of the Consolidated Law on
Finance, on the Group’s website at the same time as this Report.
8.5 - TRANSACTIONS WITH RELATED PARTIES
For a more detailed description of the procedures governing the transactions with Related Parties, we would refer
to paragraph 5 of the Annual Report on Corporate Governance, made available, pursuant to article 123-bis of the
Consolidated Law on Finance, on the website of the Group at the same time as this Report.
The breakdown of transactions with Related Parties approved by the Board of Directors in 2011 is reported in Part
H of the Notes to the Financial Statements.
8.6 - INFORMATION ON STOCK OPTION PLANS
The Plans in existence at the end of the financial period include that started during 2006, regarding shares of the
subsidiary Chiara Assicurazioni S.p.A. (shares to be issued in the future against capital increases resolved as per
Consolidated report on operations 2011
33
Article 2443 of the Civil Code) and the Plan started during 2008, regarding shares of indirect subsidiary FIDES
S.p.A. (these are already in Banco Desio Lazio S.p.A.’s possession). Part I of the Notes to these Group’s
consolidated financial statements should be referred to for information regarding these Plans.
8.7- THE ANNUAL REPORT ON THE ADOPTION OF THE CODE OF CONDUCT FOR LISTED
COMPANIES
The information on the adoption of the Code of Conduct for listed companies is reported in the Annual Report on
Corporate Governance required by article 123-bis of the Consolidated Law on Finance, made available on the
Group’s website at the same time as this Report, to which reference is made.
8.8 – RESEARCH AND DEVELOPMENT ACTIVITIES
Within its function as parent company, as described in paragraph 5.1 “Levels of control in the function of direction
and co-ordination” above, Banco di Desio e della Brianza S.p.A. places itself in a development context aimed at
supporting and coordinating the companies belonging to the Group, as well as at the research into/ investment in
operating solutions specifically aimed at the continuous improvement of the Group’s relations with its own
customers.
Of the activities carried out during 2011, we highlight that the internal activities were completed in connection to
the provisions of the Regulations regarding the treatment of loans to consumers. In this context, all the
safeguards provided for by the Regulations on Transparency with regard to transactions entered into with private
consumers were effectively regulated and put in place. In terms of Credit Risk Mitigation, monitoring activities are
periodically planned in order to continue to meet both the general and specific eligibility criteria laid down by the
Supervisory Measures.
9 - BUSINESS OUTLOOK AND MAIN RISKS AND UNCERTAINTIES
The rationalisation of the banking network in relation to the vocation of retail Group, the contribution from the
commercial development of integrated services for customers and the growth in size of distribution capabilities,
together with a particular attention to the provision of credit and a constant control of operating costs, are the main
elements for the substantial achievement of the financial and economic objectives for the year in progress, which
are set in advance by the two-year Strategic Plan. The hope, however obvious, is for a gradual improvement in
the macroeconomic context and, as a consequence, the possibility to operate in less critical market conditions
than the current ones and those of the recent past.
With reference to the main risks and uncertainties, it should be noted that this Report and, more generally, the
Financial Statements as at 31 December 2011 were drawn up on a going concern basis, due to there being no
reasons to consider anything otherwise to be likely in the foreseeable future. The equity and financial structure, as
well as the operating performance of the Group, constitute absolute confirmations to this end.
The chapter about the relevant macroeconomic scenario contains a description of the performance of the global
economy and the financial markets from which the related risks can be inferred, whereas the controls on the

Consolidated report on operations 2011
34
company’s operations of the various types of risk are shown in details in Part E of the Notes to the Financial
Statements – Information on Risks and the Related Hedging Policies”.
Moreover, explanatory notes about the levels of control in the management and coordination function, as well as
about internal controls, are reported in the elated paragraphs of this Report, making reference, for detailed
information, to the Annual report on Corporate Governance made available, pursuant to article 123-bis of the
Consolidated Law on Finance, on the Group’s website at the same time as this Report.

Consolidated Financial Statements
35
CONSOLIDATED FINANCIAL STATEMENTS
(amounts in Euro/ 1.000)

Consolidated Financial Statements
36
CONSOLIDATED BALANCE SHEET
ASSETS
absolute %
10. Cash and cash equivalents 31,983 28,615 3,368 11.8%
20. Financial assets held for trading 17,585 40,759 (23,174) -56.9%
40. Available-for-sale financial assets 924,383 833,814 90,569 10.9%
50. Held-to-maturity investments 124,626 124,480 146 0.1%
60. Amounts due from banks 288,525 302,852 (14,327) -4.7%
70. Amounts due from customers 6,580,450 6,476,720 103,730 1.6%
80. Hedging derivatives 5,631 5,631 100.0%
100.Equity investments 13,838 16,720 (2,882) -17.2%
110. Technical reserves arising from reinsurance 6,931 6,363
120. Tangible assets 154,481 150,821 3,660 2.4%
130. Intangible assets 46,496 47,592 (1,096) -2.3%
- goodw ill 41,345 44,345 (3,000) -6.8%
140. Tax assets 56,134 42,822 13,312 31.1%
a) current 3,897 7,289 (3,392) -46.5%
b) deferred 52,237 35,533 16,704 47.0%
160. Other assets 108,732 91,452 17,280 18.9%
Total assets 8,359,795 8,163,010 196,785 2.4%
ASSETS 31/12/2011 31/12/2010change
LIABILITIES
absolute %
10. Amounts due to banks 267,998 171,918 96,080 55.9%
20. Amounts due to customers 4,347,706 4,459,599 (111,893) -2.5%
30. Securities issued 2,607,446 2,114,408 493,038 23.3%
40. Financial liabilities held for trading 4,342 6,657 (2,315) -34.8%
50. Financial liabilities at fair value through profit or loss 89,138 334,326 (245,188) -73.3%
60. Hedging derivatives 2,684 2,653 31 1.2%
80. Tax liabilities 17,358 12,664 4,694 37.1%
a) current 6,854 2,763 4,091 148.1%
b) deferred 10,504 9,901 603 6.1%
100. Other liabilities 143,516 174,893 (31,377) -17.9%
110. Reserve for employee termination indemnities 23,720 24,378 (658) -2.7%
120. Reserves for risks and charges: 41,982 43,517 (1,535) -3.5%
a) pensions and similar commitments 185 186 (1) -0.5%
b) other reserves 41,797 43,331 (1,534) -3.5%
130. Technical reserves 38,539 29,980
140. Valuation reserves (14,576) 17,536 (32,112) -183.1%
170. Reserves 656,710 629,025 27,685 4.4%
180. Share premium reserve 16,145 16,145 0.0%
190. Share capital 67,705 67,705 0.0%
210. Minority interests (+/-) 4,440 4,995 (555) -11.1%
220. Net profit / (loss) for the period 44,942 52,611 (7,669) -14.6%
Total Liabilities and shareholders’ equity 8,359,795 8,163,010 196,785 2.4%
LIABILITIES AND SHAREHOLDERS’ EQUITY 31/12/2011 31/12/2010change

Consolidated Financial Statements
37
CONSOLIDATED INCOME STATEMENT
absolute %
10. Interest income and similar revenues 307,311 258,056 49,255 19.1%
20. Interest expense and similar charges (100,444) (72,895) (27,549) 37.8%
30. Net interest income 206,867 185,161 21,706 11.7%
40. Fee and commission income 139,563 145,269 (5,706) -3.9%
50. Fee and commission expense (19,421) (17,663) (1,758) 10.0%
60. Net fees and commissions 120,142 127,606 (7,464) -5.8%
70. Dividends and similar income 48 370 (322) -87.0%
80. Net profits/(losses) on trading activities 425 1,817 (1,392) -76.6%
90. Net profits/(losses) on hedging activities (23) 1,597 (1,620) -101.4%
100. Profit/(loss) on disposal or repurchase of: 3,312 8,114 (4,802) -59.2%
a) loans and receivables (556) 60 (616) -1026.7%
b) available-for-sale financial assets 2,591 7,198 (4,607) -64.0%
d) financial liabilities 1,277 856 421 49.2%
110. Net gain/(loss) on financial assets and liabilities at
fair value through profit or loss2,746 (1,751)
4,497 -256.8%
120. Net interest and other banking income
(intermediation margin)333,517 322,914
10,603 3.3%
130. Net impairment losses on/w ritebacks to: (38,457) (40,760) 2,303 -5.7%
a) loans and receivables (38,370) (40,658) 2,288 -5.6%
d) other financial assets (87) (102) 15 -14.7%
140. Net income from banking activities 295,060 282,154 12,906 4.6%
150. Net insurance premiums 29,106 24,674 4,432 18.0%
160. Balance of other income/charges arising on
insurance management activities(17,810) (15,268)
(2,542) 16.6%
170. Net income from banking and insurance
activities 306,356 291,560 14,796 5.1%
180. Administrative expenses: (237,696) (234,118) (3,578) 1.5%
a) personnel expenses (157,073) (154,975) (2,098) 1.4%
b) other administrative expenses (80,623) (79,143) (1,480) 1.9%
190. Net provisions for risks and charges 4,055 15,639 (11,584) -74.1%
200. Net adjustments to the value of tangible assets (6,852) (7,088) 236 -3.3%
210. Net adjustments to the value of intangible assets (1,600) (1,120) (480) 42.9%
220. Other operating (expenses)/income 17,956 14,430 3,526 24.4%
230. Operating expenses (224,137) (212,257) (11,880) 5.6%
240. Profits/(losses) on equity investments 2,763 3,909 (1,146) -29.3%
260. Value adjustments to goodw ill (3,000) (3,000) -100.0%
270. Profits/(losses) on the disposal of investments 2 2 100.0%
280. Profits/(losses) before taxes from continuing
operations 81,984 83,212 (1,228) -1.5%
290. Taxes for the period on income from continuing
operations (36,093) (29,752) (6,341) 21.3%
300. Net profits (loss) after tax from continuing
operations 45,891 53,460 (7,569) -14.2%
320. Net profit/(loss) for the period 45,891 53,460 (7,569) -14.2%
330. Profit (loss) for the period attributable to
minority interests(949) (849)
(100) 11.8%
340. Parent Bank net profit (loss) 44,942 52,611 (7,669) -14.6%
Caption 31/12/2011 31/12/2010Change

Consolidated Financial Statements
38
CONSOLIDATED STATEMENT OF COMPREHENSIVE INCOME
Captions 31.12.2011 31.12.2010
10. Profit (Loss) for the period 45,891 53,460
Other income components, net of taxes
20. Available-for-sale financial assets (28,611) (13,163)
30. Tangible assets
40. Intangible assets
50. Foreign investment hedge:
60. Cash flow hedge:
70. Exchange differences: 485 3,603
80. Non-current assets held for sale and discontinued operations
90. Actuarial profits (losses) on defined benefit plans 10 236
100. Share of valuation reserve of equity investments carried at equity (4,748) (2,361)
110. Total other income components, net of taxes (32,864) (11,685)
120. Comprehensive income (10+110) 13,027 41,775
130. Consolidated comprehensive income attributable to minority interests (197) (615)
140. Consolidated comprehensive income attributable to the
parent company12,830 41,160

Consolidated Financial Statements
39
CONSOLIDATED STATEMENT OF CHANGES IN SHAREHOLDERS’ EQUITY ASAT 31.12.2011
Shareholders'equity:
a) ordinay shares 64,278 64,278 (201) 60,840 3,237
b) other shares 6,865 6,865 6,865
Share premium reserve 16,303 16,303 52 16,145 210
Reserves: -
a) retained earnings 620,461 620,461 39,070 (11,170) 647,418 943
b) others 9,261 9,261 31 9,292
Valuation reserves 17,389 17,389 (32,864) (14,576) (899)
Equity instruments
Treasury shares
Net Profit (loss) for the year 53,460 53,460 (39,070) (14,390) 45,891 44,942 949
Group Shareholders'equity 783,022 783,022 (13,949) (11,008) 31 12,830 770,926
Shareholders' equity 4,995 4,995 (441) (162) (201) 52 197 4,440
Eq
uity
as
of1
.01
.201
1
Allocation of result
from previous period
Changes over the period
Ch
an
ge
ine
qu
ity
ins
tru
me
nts
Deri
va
tives
on
tre
as
ury
sha
res
Sto
ck
optio
ns
Gro
up
sha
reh
old
ers
'eq
uity
al3
1.1
2.2
01
1
Min
ority
inte
res
tsas
of
31
.12
.201
1
Ch
an
ge
sin
res
erv
es Transactions in shareholders' equity
Com
pre
he
ns
ive
inco
me
FY
31
.12
.201
1
Res
erv
es
Div
ide
nd
sa
nd
oth
er
allo
ca
tion
s
Issu
eof
ne
w
sh
are
s
Purc
ha
se
of
tre
as
ury
sha
res
Ex
tra
ord
inary
dis
trib
utio
nof
div
iden
ds
Eq
uity
as
of
31
.12.2
01
0
Cha
ng
ein
op
en
ing
bala
nc
es
CONSOLIDATED STATEMENT OF CHANGES IN SHAREHOLDERS’ EQUITY ASAT 31.12.2010
Shareholders'equity:
a) ordinay shares 63,702 63,702 576 60,840 3,438
b) other shares 6,865 6,865 6,865
Share premium reserve 16,392 16,392 (89) 16,145 158
Reserves:
a) retained earnings 582,485 582,485 39,733 (1,757) 619,764 697
b) others 9,119 9,119 142 9,261
Valuation reserves 29,074 29,074 (11,685) 17,536 (147)
Equity instruments
Treasury shares
Net Profit (loss) for the year 53,682 53,682 (39,733) (13,949) 53,460 52,611 849
Group Shareholders'equity 757,372 757,372 (13,949) (1,703) 142 41,160 783,022
Shareholders' equity 3,947 3,947 (54) 487 - 615 4,995
Eq
uity
as
of1
.01.2
01
0
Allocation of result
from previous period
Changes over the period
Ch
an
ge
ineq
uity
instr
um
en
ts
Deri
vativ
es
on
trea
su
rys
hare
s
Sto
ck
op
tion
s
Gro
up
Sha
reh
old
ers
'eq
uity
al3
1.1
2.2
010
Min
ority
inte
rests
as
of
31
.12.2
01
0
Ch
an
ge
sin
res
erv
es Transactions in shareholders' equity
Com
pre
hen
siv
ein
co
me
FY
31.1
2.2
010
Re
se
rve
s
Div
ide
nd
san
doth
er
allo
catio
ns
Iss
ue
ofn
ew
sh
are
s
Purc
has
eo
f
trea
su
rys
hare
s
Extr
aord
ina
ry
dis
trib
utio
no
f
div
idend
s
Eq
uity
as
of3
1.1
2.2
009
Cha
ng
ein
op
en
ing
ba
lanc
es

Consolidated Financial Statements
40
CONSOLIDATED CASH FLOW STATEMENT
31.12.2011 31.12.2010
1. M anagement act iv it ies 97,875 95,447
- interest income earned (+) 306,634 257,894
- interest expenses paid (-) (99,754) (72,485)
- dividends and similar revenues (+) 48 370
- net commissions (+/-) 120,770 127,003
- personnel costs (-) (157,073) (154,975)
- net premiums collected (+) 29,106 24,674
- o ther insurance income/charges (+/-) (17,810) (15,268)
- o ther costs (-) (75,554) (73,743)
- o ther revenues (+) 27,601 31,729
- taxes and duties (-) (36,093) (29,752)
- costs/revenues relating to non current assets held for sale and discontinued operations, net of tax effect (+/-) - -
2. Liquid assets generated (abso rbed) by decrease/ increase in financia l assets (281,665) 240,041
- financial assets held for trading 21,463 34,248
- financial assets at fair value through pro fit o r loss - -
- available-fo r-sale financial assets (130,411) 45,963
- amounts due from customers (152,019) (360,426)
- amounts due from banks: at sight (28,206) 37,699
- amounts due from banks: others 42,544 452,442
- o ther assets (35,036) 30,115
3. Liquid assets generated (abso rbed) by increase/ decrease in financia l liabilit ies 214,969 (184,964)
- amounts due to banks: at sight (2,104) (344)
- amounts due to banks: others 98,184 135,604
- amounts due to customers (111,893) (408,677)
- securities issued 489,064 311,686
- financial liabilities held for trading (5,562) (5,927)
- financial liabilities at fair value through profit or loss (245,188) (222,826)
- o ther liabilities (7,532) 5,520
N et liquid assets generated (abso rbed) by o peratio ns (A ) 31,179 150,524
B . IN VEST M EN T S
1. Liquid assets generated by 111 43
- sale o f investments - -
- dividends received from investments - -
- sale/redemption of financial assets held to maturity - -
- sale o f tangible assets 111 43
- sale o f intangible assets - -
- sale o f business divisions - -
2. Liquid assets abso rbed by (13,973) (134,469)
- purchase of investments (2,700) -
- purchase of financial assets held to maturity (146) (121,392)
- purchase of tangible assets (10,623) (9,742)
- purchase of intangible assets (504) (3,335)
- purchase of business divisions - -
N et liquid assets generated (abso rbed) by investments (B ) (13,862) (134,426)
C . F UN D IN G A C T IVIT IES
- issues/purchases of treasury shares - -
- issues/purchases of equity instruments - -
- distribution of dividends and other purposes (13,949) (13,798)
N et liquid assets generated (abso rbed) by funding act ivit ies (C ) (13,949) (13,798)
N ET LIQUID A SSET S GEN ER A T ED (A B SOR B ED ) D UR IN G T H E YEA R (A +B +C ) 3,368 2,300
A . OP ER A T ION SImpo rt

Consolidated Financial Statements
41
RECONCILIATION
F inancia l statements items 2011 2010
Cash and cash equivalents at beginning of year 28,615 26,315
Total liquid assets generated (absorbed) during the year 3,368 2,300
Cash and cash equivalents: effect o f exchange rate changes
Cash and cash equivalents at end of year 31,983 28,615

Notes to the Consolidated Financial Statements
42
NOTES TO THE CONSOLIDATEDFINANCIAL STATEMENTS

Notes to the Consolidated Financial Statements
43
Part A - ACCOUNTING POLICIES
A. 1 – GENERAL
Section 1 – Declaration of conformity with international accounting standards
These consolidated financial statements of the Banco Desio Group were prepared in accordance with the
provisions of law in force and the International Accounting Standards IAS/IFRS, and are made up of the balance
sheet, the income statement, the statement of comprehensive income, the statement of changes in shareholders’
equity, the cash flow statement and the notes to the financial statements; they are also accompanied by the report
on operations.
In application of Legislative Decree no. 38 of 28 February 2005, which incorporated EC Regulation no. 1606/2002
of 19 July 2002, the consolidated financial statements of the Banco Desio Group were prepared in accordance
with the International Financial Reporting Standards (IFRS) and the International Accounting Standards (IAS),
and related Interpretations, in force at the date of reference of such financial statements.
Set out below are the accounting policies adopted in the preparation of the consolidated financial statements as of
31 December 2011.
Section 2 – General accounting policies
The consolidated financial statements have been drawn up with clarity and represent a true and fair picture of the
equity and financial situation and the economic results of the accounting period.
When noting the main management events emphasis has been given to the principle of economic substance over
form.
The consolidated financial statements have been drawn up in compliance with the economic accruals basis using
the criterion of historic cost, modified in relation to the valuation of financial assets held for trading, available for
sale and valued at fair value and of all existing derivative contracts which have been valued in accordance with
the fair value principle.
The accounting value of liabilities recorded in the financial statements which have been hedged have been
adjusted to take account of the changes in fair value attributable to the hedged risk.
As provided for under IAS39, with regard to the valuation of financial instruments the Group adopted the fair value
option, permitting the designation of financial assets and liabilities at their fair value with the related entries in the
income statement, when this produces more significant information, reduces complexity or leads to a more
reliable valuation.
The schedules under the financial statements and notes were prepared and drawn up in accordance with the
compilation rules issued by the Bank of Italy by the Circular Letter no. 262 of 22 December 2005, as updated on
18 November 2009.
Amounts are expressed in thousands of Euro.

Notes to the Consolidated Financial Statements
44
Section 3 – Scope and methods of consolidation
1. Investments in wholly-owned subsidiary companies and companies subject to joint control(consolidated proportionately)
Investing company % share
A. Companies
A.1 Wholly-owned subsidiary companies
Banco Desio Lazio S.p.A. Rome 1 Banco Desio 100.000 100.000
Brianfid-Lux S.A. Luxembourg 1 Banco Desio 100.000 100.000
Chiara Assicurazioni S.p.A. Desio 1 Banco Desio 66.662 66.662
Credito Privato Commerciale S.A. Lugano 1 Brianfid-Lux 100.000 100.000
Rovere S.A. Luxembourg 1 Brianfid-Lux 70.000 70.000
1 Banco Desio Lazio 10.000 10.000
Fides S.p.A. Rome 1 Banco Desio Lazio 100.000 100.000
Company nameRegistered
office
Type of
ow nership
Ow nership relationship %
Ow nership
share w ith
voting rights
Legend:(1) Type of relationship: 1 = majority of voting rights at the ordinary shareholders meeting
During the period the stake in Chiara Assicurazioni S.p.A. increased from 61.86% last year to 66.662%.
As regards Rovere S.A., note a different breakdown of the shareholdings, while the overall shareholding remainedunchanged at Group level.
It should be remembered that with legal effect from 1.10.2011 the subsidiaries Banco Desio Toscana S.p.A. andBanco Desio Veneto S.p.A. were merged into Banco Desio Brianza S.p.A.
Equity investments in companies subject to significant influence - Chiara Vita S.p.A. (shareholding 30%) and
Istifid (shareholding 28.961%) are consolidated on an equity basis.Compared to the previous period, no change was reported in the shareholdings.
2. Other information
The consolidation criteria are regulated as follows:- subsidiaries on an exclusive basis: the assets, liabilities, shareholders’ equity, “off-balance-sheet
transactions”, costs and income are integrated into the relevant items of the consolidated financial statements,using the line-by-line method as required under IAS 27.Any positive difference arising from the comparison between the book value of each equity investment and therelevant residual portion of the shareholders’ equity of the subsidiary company after allocation to the specificitems is recognised as goodwill and is subject to the impairment test procedure;
- associates: equity investments in associated companies are consolidated using the equity method as requiredby IAS 28.
Section 4 – Events subsequent to the reporting date
Reference is made to the consolidated financial Report.
Section 5 – Other aspects
Use of estimates and assumptions when drawing up the consolidated financial statements.
The drafting of the consolidated financial statements calls for the use of estimates and assumptions which mayhave a significant effect on the values entered in the balance sheet and the income statement as well as on the

Notes to the Consolidated Financial Statements
45
notes to the financial statements.
The use of such estimates involves the use of available information and the adoption of subjective valuations,also founded on past experience, for the purposes of the formulation of reasonable assumptions for theidentification of management elements. By their nature the estimates and assumptions used may vary fromaccounting period to accounting period and it cannot therefore be excluded that in subsequent accounting periodsthe values currently recognised may change precisely because of changes in the subjective valuations utilised.
The main cases where the use of subjective estimations and valuations are called for are the following:
- the quantification of losses by reason of the reduction in the value of loans and receivables and, in general, offinancial assets;
- the calculation of the fair value of financial instruments to be used for the purposes of disclosures;
- the use of valuation models for the identification of the fair value of financial instruments not listed on activemarkets (Level 2 and 3);
- the quantification of staff reserves and the reserves for risks and charges;
- the estimates and assumptions made in relation to the ability to recover deferred tax assets.
The description of the accounting policies applied to the main aggregate headings in the financial statementsprovides more details and information on the subjective assumptions and valuations used in the drawing up of theconsolidated financial statements.
Option for national tax consolidation regime
Banco di Desio e della Brianza and the Italian companies of the Group have adopted the so-called “national taxconsolidation” regime regulated by articles 117-129 of the TUIR [Testo Unico delle imposte sui redditi,Consolidated Act on Income Tax], introduced into the tax legislation by Legislative Decree no. 344/2003. Thisregulation provides for an optional regime, by virtue of which the total income or loss of each subsidiary companyparticipating in the tax consolidation regime – together with withholding tax incurred, tax allowances and taxcredits – are transferred to the controlling company, for which a single taxable income, or a single loss that can becarried forward, is then determined and, consequently, a single tax debit/credit.
Auditing
These financial statements have been audited by the company PricewaterhouseCoopers SpA in implementationof the resolution taken at the meeting of 30 April 2003, which was extended on 28 April 2006 and again on 27April 2007 for the 2009-2011 financial years.
A.2 MAIN FINANCIAL STATEMENT ITEMS
The measurement criteria described below, used in the preparation of the consolidated financial statements as at31 December 2011, are in compliance with the European Commission ratified International Accounting Standards(IAS/IFRS) and in force at the reporting date and have been applied on a going concern basis.For transactions involving the trading of standardized financial assets, namely contracts whereby delivery takesplace in a period of time laid down by regulations or by market conventions, the reference date is that ofsettlement.
Financial assets held for trading
Classification criteria
“Financial assets held for trading” (at fair value through profit or loss) comprise debt securities, equity securities,non-hedging derivative instruments with a positive value and the other assets that, based on their initialdesignation, are classified as financial instruments intended to be traded in the near term. Since classificationderives from the initial designation, subsequent transfers to other categories are not generally permitted for thiscategory of financial assets, except as permitted by IAS 39 in specific and exceptional circumstances.

Notes to the Consolidated Financial Statements
46
Recognition criteria
Initial recognition is at fair value at the settlement date, which corresponds to the consideration paid withoutconsidering transaction costs, which are charged directly to the income statement.
Criteria for the measurement and recognition of income statement components
After initial recognition, subsequent measurement is at fair value, with recognition of the gain or loss in the incomestatement.
For shares, government bonds – both Italian and foreign – and derivatives which are traded on an active market,measurement is at the closing price at the date of measurement (Level 1 fair value).
Italian and foreign bonds traded on an active market are measured at the BID price (Level 1 fair value).
Shares and bonds which are not traded on an active market are measured at fair value by using valuationtechniques and considering objective elements that can be observed in the market (Level 2 fair value).
Derivative instruments which are not traded on active markets are measured by using valuation techniques (Level2 or 3 fair value).
Derecognition criteria
Assets held for trading are derecognised when they are sold or upon expiry of the assets.
Available-for-sale financial assets
Classification criteria
“Available-for-sale financial assets” comprise those financial assets – excluding derivatives – not classified asloans and receivables, held-to-maturity investments, financial assets held for trading or financial assets at fairvalue through profit or loss.
They include minority investments, bonds held for investment (not short-term) and mutual investment fund units.
“Available-for sale financial assets” may be transferred to the category “Held-to-maturity investments” only in thefollowing circumstances:
- a change in intention or ability to hold,
- in the rare circumstances that a reliable measure of fair value is not available.
The transfer to the category “Loans and Receivables” is permitted only in particular circumstances.
Recognition criteria
Initial recognition is at fair value, including transaction costs directly attributable to the acquisition, at thesettlement date.
Measurement criteria
After initial recognition, subsequent measurement is at fair value for the price component, while the interestcomponent is calculated with reference to the Effective Rate of Return.
Fair value is determined using the criteria already set out for assets held for trading.
Unlisted financial assets whose fair value cannot be reliably measured are measured at cost.
For minority interests, measurement at fair value is made by using valuation techniques (Level 3). For UCITSunits, measurement occurs at the N.A.V. at the measurement date, or at the latest available date (Level 1).
At every balance sheet date, an assessment is made of any existing impairment that has a measurable impact onthe estimated future cash flows, considering possible financial difficulties of the issuer, or any other similarelement. As required by paragraph 61 of IAS 39, “significant” (exceeding 50%) or “extended” (beyond 24 months)decreases in value are considered as objective evidence of impairment of equity securities.
The amount of the loss of value is represented by the difference between the asset’s accounting value and its

Notes to the Consolidated Financial Statements
47
recoverable value.
Criteria for the recognition of income statement components
Gains or losses are recorded at equity in the valuation reserve, net of tax effects, until derecognition of the asset,while the component deriving from amortised cost is instead charged to the income statement.
At the time of expiry, sale or transfer to another category, or for impairment recognition, the amount accrued tothe valuation reserve is recognised in the income statement.
When impairment losses which have been recognised in the income statement, are balanced as a result ofsubsequent revaluations, the value write-back, up to the amount of these losses, is recognised in the incomestatement for debt securities and in an equity reserve for equity securities.
Derecognition criteria
Available-for sale financial assets are derecognized when sold, upon expiry of the assets or upon transfer toanother category.
Held-to-maturity investments
Classification criteria
“Held-to-maturity investments” comprise non-derivative (including implicit) financial assets listed on an activemarket (Level 1), with fixed or determinable contractual payments and fixed maturities for which there is thepositive intention and ability to hold them until maturity.
The constitution of the held-to-maturity investments category, and any subsequent movements, was madeagainst specific resolutions adopted by the corporate bodies, in accordance with the provisions of IAS 39.
Transfers are permitted limited to the category AFS in some cases only. The recording of financial assets in thiscategory is no longer permitted for the current year and for the two following years in the event that sales ortransfers are made for a not insignificant amount, except in the case of investments close to maturity and isolatedevents that are beyond the Bank’s control. If the conditions requiring that this category not be used exist, theremaining assets are reclassified as available-for-sale financial assets (tainting provision).
Recognition criteria
Initial recognition is at fair value, including transaction costs directly attributable to the acquisition, on thesettlement date.
Criteria for the measurement and recognition of income statement components
After initial recognition, subsequent measurement is at amortised cost against profit and loss, by using the actualinterest rate method.
At every balance sheet date, an assessment is made of any evident impairment that has a measurable impact onthe estimated future cash flows. If such impairment exists, losses are recognized in profit and loss.
Since they are securities listed on active markets, the fair value reported in the notes to the financial statements isequal to their counter values at market prices (Level 1).
Derecognition criteria
Held-to-maturity investments are derecognised when sold, upon expiry of the assets or upon transfer to another
category.

Notes to the Consolidated Financial Statements
48
Loans and receivables
Classification criteria
“Loans and receivables” comprise non-derivative financial assets with fixed or determinable payments that are not
listed on an active market.
Normally, they include loans and advances to customers, amounts due from banks and debt securities not listed
on an active market which have characteristics similar to receivables, excluding assets held for trading and
available-for-sale assets.
They also include finance lease receivables.
Transfers from the categories of “Financial assets available for sale” and “Financial assets held for trading” arepermitted only in particular circumstances specified by IAS 39.
Recognition criteria
Loans and receivables are recorded on the trade date at fair value, including transaction costs and commissions
directly attributable to the acquisition, normally equal to the value paid out.
Measurement Criteria
After initial recognition, subsequent measurement is at amortised cost using the effective interest method.
The amortised cost is the amount at which the financial asset was measured at initial recognition minus principal
repayments, plus or minus the cumulative amortisation, as determined using the effective interest method of any
difference between the initial amount and the maturity amount, and minus any reduction following impairment or
uncollectibility.
Loans and receivables are periodically subject to analysis, and are classified as “performing” and “nonperforming”
based on the state of impairment of the loan or receivable.
Non-performing loans include the different classes of impaired loans provided for under the regulations of Bank of
Italy: non-performing; problem, restructured exposures and expired loans.
Where objective evidence of impairment exists, loans pass from performing to non-performing.
The loans and receivables portfolio is subject to reassessment at least at the close of every set of annual or
interim financial statements, for the purpose of identifying and determining any objective impairment. This is
carried out considering both the specific solvency situation of debtors and the local or national economic
conditions relative to the debtor’s sector of activity.
“Performing” loans and receivables are subject to collective assessment whereby they are subdivided into groups
with the same risk characteristics. Expected Loss is determined by applying the Probability of Default (PD)
produced by the Credit Rating System model and Loss Given Default (LGD) is determined from a historic-
statistical analysis of the performance of non-performing and problem loans. The expected loss takes account of
the deterioration of the receivables at the reference date although the precise entity of such deterioration is not
yet known at the time of measurement, in order to move the valuation model from expected loss to latent loss.
Specific analyses are conducted for exposures of a significant amount.
This method was adopted to advance a convergence with the valuation criteria provided by the Basel Agreement
on capital requirements (Basel 2).
All loans and receivables for which there exists objective evidence of impairment, measured by the difference
between the carrying value and the present value of expected future cash flows discounted applying the original
agreed effective interest rate, were classified in the “non-performing” category. The assessment is analytical and
takes into consideration the presumed possibility of recovery, expected recovery time and existing guarantees.
Receivables for default interest accrued on impaired assets are reported in the accounts only at the time of their

Notes to the Consolidated Financial Statements
49
actual collection.
The value of loans to non-resident persons is written down on a general basis in relation to the difficulty in
servicing the debt by their countries of residence.
As regards “performing loans” beyond the short term, the fair value of the loans is calculated only for the purposes
of their inclusion in the notes to the financial statements. Non-performing loans previously valued analytically, and
the short term positions, are recognised at book value, which represents a reasonable estimate of their fair value.
The fair value is determined through the contractual development of future cash flows, applying a risk freediscount rate, and taking also into account the credit risk in term of PD and LGD, reported in the CRS model (level3).
Derecognition criteria
Loans and receivables that are assigned are only derecognised from the assets of the financial statements if theassignment has entailed the material transfer of all of the risks and awards connected to the actual loans andreceivables. However, if a substantial part of the risks and awards relating to the assigned loans and receivableshas been retained, they continue to be recorded in the assets of the financial statements, even though legally theownership of the loan or receivable has actually been transferred.
In the event that it is not possible to ascertain whether the material transfer of the risks and awards has takenplace, the loans and receivables are derecognised from the financial statements if no type of control over themhas been retained. On the other hand, if such control is retained, even partially, the loans and receivables areretained in the financial statements, to the extent of the residual involvement, which is measured by the exposureto changes in value of the assigned loans and receivables and to variations in cash flows of the same.
Finally, the assigned loans and receivables are derecognised from the financial statements in the event that thecontractual rights to receive the related cash flows are retained, with the concurrent assumption of an obligation topay these cash flows, and only these, to other parties.
Criteria for the recognition of income statement components
Measurement at amortised cost generates a transfer of the transaction costs and additional revenues in theincome statement, over the life of the financial asset rather than being fully recognised in the income statement inthe period of initial recognition.
Accrued default interest is charged to the income statement only at the time of their actual collection.
Interest accruing over time as a result of the discounting-back of impaired loans is recognised in the incomestatement under write-backs.
The adjustments arising from the analytical and collective assessments are recognized in profit and loss.
The original value of loans and receivables is reinstated if the reasons for the adjustment recorded cease to exist,and the reversal is recognized in profit and loss.
Hedging transactions
Classification criteria
Hedging transactions have the objective of neutralizing certain potential risks of loss on financial assets or
liabilities through specific financial instruments, whose use is directed at lessening the effects of the hedged
financial instruments on the income statement.
The type of hedge used is the Fair Value Hedge: the objective is to hedge the risk of changes in the fair value ofthe hedged instrument.

Notes to the Consolidated Financial Statements
50
Recognition criteria
Recognition of hedging transactions in the financial statements entails:
- involvement of external parties;
- specific designation and identification of the hedging and hedged financial instruments used for thetransaction;
- definition of the risk management objective pursued, specifying the nature of the risk hedged;
- passing the test of effectiveness at the inception of the hedge relationship, and subsequently, with specificmeasurement methods and timing;
- preparation of complete formal documentation of the hedging relationship.
Criteria for the measurement and recognition of income statement components
The fair value of hedging financial instruments, which are not listed on active markets, is calculated by using
valuation models for the estimate and discounting back of future cash flows (Level 3).
The changes in the fair value of the hedging derivatives and hedged financial instruments (for the partsattributable to the hedged risk) are recorded separately against profit and loss.This offsetting is recognised by reporting, under item 90 “Net profits (losses) on hedging activities” in the incomestatement, the changes in value pertaining both to the item hedged (as regards the variations produced by theunderlying risk factor) and to the hedging instrument. Any difference, which represents the partial ineffectivenessof the hedge, is therefore its net economic effect.
A hedging transaction is considered effective when changes in the fair value (or in cash flows) of the hedgingfinancial instrument offset the changes of the hedged financial instrument within a range of 80%-125%, as set byIAS 39.
Tests of effectiveness are performed at the close of each set of annual or interim financial statements, both
retrospectively, to measure actual results to date, and prospectively, to demonstrate the expected effectiveness in
future periods.
If the tests do not confirm the effectiveness of the hedge and taking account of internal policy, from that momentaccounting for hedging transactions, as set out above, is suspended, the derivative hedging contract isreclassified as an instrument held for trading and the hedged financial instrument reacquires the valuationcriterion that corresponds to its classification in the financial statements.
Derecognition criteria
Recognition of hedging transactions in the financial statements is discontinued when the effectiveness criteria are
no longer met, when the transactions are revoked, or when the hedging instrument or the hedged instrument
expires, is terminated or is sold.
If the hedged instrument is measured at amortised cost, the difference between the fair value, determined at thedate of discontinuance of the hedging relationship, and the amortised cost is recognised over its residual life.
Equity investments
Classification criteria
This item comprises investments in associates, as defined by IAS 28. Other investments are accounted for inaccordance with IAS 39, and are classified as available-for-sale financial assets and measured in accordancewith the measurement criteria for that class of financial asset.
Recognition criteria

Notes to the Consolidated Financial Statements
51
Investments are initially entered at cost including any directly attributable additional charges.
Measurement criteria
The equity method is applied in measuring after first recognition: according to this method, the initial carrying
amount is adjusted to recognise the Parent Company’s portion in the associate’s balance sheet. If there are
indications of impairment after the value of the investment has been adjusted in accordance with the equity
method, its recoverable value is estimated in the light of the present value of the future cash flows that it may
generate, including the cost of its final disposal.If recoverable value is lower than carrying amount, the difference is recognised in profit and loss.
Criteria for the recognition of income statement components
Item 240, profit/loss on equity investments, includes the associates’ portion of the result for the year.
Derecognition criteria
Investments are derecognised when the contractual rights to the cash flows from the assets expire or when theyare transferred together with the substantial transfer of all the related risks and rewards.
Tangible assets
Classification criteria
Tangible assets comprise buildings, land, plant, furniture and fittings and other office equipment. They are goodsthat are instrumental to the supply of services.
Tangible assets whose cost can be reliably measured and from which it is probable that future economic benefitswill flow are recognised in the financial statements.
Recognition criteria
Tangible assets are initially recognised at the purchase price, including additional costs sustained for thepurchase and to put the asset into operation.
For the first-time adoption of IAS/IFRS, the exemption provided by IFRS 1, paragraph 16, was taken advantage ofby opting for the measurement of buildings at fair value, as a substitute for cost, as at 1 January 2004. The costmodel was adopted for the measurement of buildings subsequent to that date.
Extraordinary maintenance costs that increase the value of assets are allocated to the assets to which they refer.
Ordinary maintenance costs are recognized directly in the income statement.
In application of IAS 17, finance lease transactions are recognised in the financial statements in accordance withthe finance method. Accordingly, assets leased out under finance leases are recognised as receivables.
Measurement criteria
Tangible assets are recognised in the financial statements at purchase cost, including additional costs sustained,
less any accumulated depreciation and any accumulated impairment losses.
Depreciation is calculated systematically, on a straight-line basis, using technical-economic rates that are
representative of the residual useful life of the assets. Land and works of art are exceptions - they are not subject
to depreciation given that their useful lives are unlimited, and in consideration of the fact that the related value is
Notes to the Consolidated Financial Statements
52
not normally destined to reduce in relation to the passage of time. Extraordinary maintenance costs that increase
the value of assets are depreciated in relation to the residual useful life of the related assets.
Each year an assessment will be made of whether there are any indications of impairment. Should it bedetermined that the carrying amount of an asset is greater than the recoverable amount, the carrying amount isadjusted to the recoverable amount and the loss charged to the income statement.
Criteria for the recognition of income statement components
Depreciation and impairment (if any) are recognised in the income statement under net value adjustments totangible assets.
Derecognition criteria
Tangible assets are derecognised on disposal.
Intangible assets
Classification criteria
Intangible assets include goodwill, the indemnity costs for the abandonment of leasehold premises and the costs
for the purchase of applications software.
Restructuring costs related to leasehold properties are entered under other assets.
Recognition criteria
Goodwill represents the positive difference between the acquisition cost and the fair value of net assets acquired
in business combinations. It is recognised in the financial statements as an intangible asset when it is effectively
representative of the future economic benefits of the assets acquired.
Other intangible assets are recognised at cost only if they comply with the requirements that they beindependently identifiable and distinct from goodwill, that it is probable that future economic benefits will berealised, and that the cost itself can be measured reliably.
Measurement criteria
Intangible assets are recognised in the financial statements at purchase cost, including additional costs sustained,less any accumulated amortisation and any accumulated impairment losses.
Amortisation is calculated systematically, on a straight-line basis, using technical-economic rates that arerepresentative of the residual useful life.
Goodwill is not amortized in view of its indefinite useful life, and the adequacy of the carrying amount is assessedannually (impairment test). Should there be indications of impairment, goodwill is adjusted appropriately and theloss charged to the income statement.
a) Definition of the CGU “cash generating unit”It is identified as the group of branches which are or have been purchased or contributed on the part of thepurchasing bank or the contributing bank.
b) Allocation of goodwillThe price settled by the purchasing bank by cash or equity gives rise to an asset defined as “goodwill” or a“negative reserve” which is entered under the assets (under “intangible asset” with an unlimited life) or liabilities(under “equity reserves”) of the financial statements of the purchasing or contributing bank at the time of thepurchase or contribution.
c) Criterion to estimate recoverable values (Impairment)For the criterion to estimate the recoverable value of the CGUs, reference is made to the so-called “value in use”obtained by estimating the following factors;
Notes to the Consolidated Financial Statements
53
- future incoming and outgoing cash flows which will derive from the continuing use of the CGU and fromits “theoretical” future disposal;- an appropriate discount rate (WACC – Weighted Average Cost Of Capital) for future incoming andoutgoing flows cash flows;- the time horizon considered is only that attributable to the last business plan or budget approved by theDirectors.
Cash flows: the flows represented by EBITDA (earnings before interest, tax, depreciation and amortisation) areassumed as future Cash Flows of the CGU.
Discount rate: reference is made to the so-called WACC (weighted average cost of capital) which expresses thecost of the financing sources of the business under consideration, weighing the debt ratio and the equity ratioaccording to the degree of indebtedness.
Growth rate of the flows after the period covered by the business plan or budget:: it is prudentially considered tobe equal to zero.
Terminal Value: it is determined by applying the formula which is associated to the traditional formula of“perpetual annuity” at the WACC rate.
Completion of the impairment testThe value in use of the CGU, as determined on the basis of the above procedure on the date when observationsare made, is then compared to the value of the specific item entered in the accounts of the bank, with the soleobjective of verifying impairment losses (if any).
d) Sensitivity analysisTo further support the test carried out, a stress test is then conducted which is based on the so-called sensitivityanalysis of the impairment test carried out.Given the nature of the object of the impairment test (groups of branches), the sensitivity analysis is based oncarrying out again the impairment procedure while considering the same variables used in it, but with reference toa pessimistic version (worst case) of the Business Plan or Budget approved by the Directors.
This pessimistic version takes account of the impact of possible macro-changes in the market conditions as to:- rates (negative performance of the interest rate curve for the bank);- terms and conditions of sale of the products (introduction of possible regulatory changes which mightsubstantially amend such conditions);- credit risk (higher intensity of the phenomenon of the so-called credit litigation).
e) Control methodThe sensitivity analysis will be completed by an additional investigation to compare values, based on analternative method, only in the case when the findings of the stress test, after having been compared to the valueof the specific item entered in the accounts of the Bank, should report a significant negative deviation (exceeding10% of the value of the item).
For CGUs, this method is identified as that of the so-called “market multiples” which, in the present case, isreferred to the price per branch relating to the most recent market transactions concerning the purchase and saleof bank branches.
Indemnity costs for the abandonment of leasehold properties are amortised at rates determined in proportion tothe duration of the corresponding rental contract (including renewal).
Criteria for the recognition of income statement components
Amortisation and impairment losses (if any) are recognised in the income statement under net adjustments to thevalue of intangible assets.
Value adjustments relating to costs for restructuring of leasehold properties are recognised in the incomestatement under other operating expenses.
Derecognition criteria
Intangible assets are derecognised from assets on disposal or when future economic benefits are no longerexpected.

Notes to the Consolidated Financial Statements
54
Current and deferred taxes
Income taxes for the period are calculated by estimating the tax charges on an accruals basis. In addition to
current taxes, determined in relation to the tax regulations in force, deferred taxes are also recognised, originating
as a result of the temporary differences which emerge between the balance sheet amounts recorded for financial
reporting purposes and those for taxation purposes. Therefore, taxes represent the current and deferred tax
balances related to the taxable income for the period.
Tax assets and liabilities include the fiscal positions of every single company within the Group. Deferred tax
assets are recognised when their recovery is probable, that is when it is expected that sufficient taxable income
can be made available in the future to recover the asset. They are recognised as assets in the balance sheet
under item 140 “Deferred tax assets”.
Conversely, deferred tax liabilities are recognised as liabilities in the balance sheet under item 80 “Deferred tax
liabilities”.
Current taxes that have not yet been paid are separately recognised under item “Current tax liabilities” in the
Balance Sheet. In the event of excess payments on account for current taxes, the receivable to be recovered is
recognized under item “Current tax assets” in the Balance Sheet.
Tax assets and liabilities are recognised in equity if connected to transactions recognised directly in equity.
Reserves for risks and chargesReserve for employee termination indemnities
Measurement criteria
The reserve for employee termination indemnities is measured in the financial statements employing actuarial
calculation techniques.
Measurement is entrusted to independent external actuaries, employing the accrued benefit method using theProjected Unit Credit Method. The amount thus determined represents the present value, calculated usingdemographic-financial assumptions, of the benefits due to the employee (settlement of Employee TerminationIndemnity (TFR)) for the service accrued to date, obtained by re-proportioning the total present value of theobligation to the period of service already rendered at the date of measurement, taking into account the likelihoodof resignations and advance requests.
Criteria for the recognition of income statement components
The provisions to the Employee Termination Indemnity (TFR), resulting from the actuarial valuation, inaccordance with the provisions of IAS 19, are registered against the valuation reserves as regards the actuarialgain (loss) element, and against the profit and loss account under provisions as regards other elements such asinterest accrued in time (time-discounting) and the adjustment to the figures as at 31 December 2006 in light ofthe reform introduced with the 2007 Financial Act.
Other provisions
Classification criteria
Reserves for risks and charges include the provisions made against present obligations that are the result of past
events, and it is probable that the settlement of these obligations will require the employment of economic
resources that can be reliably estimated.
The provisions reflect the best estimate of the future cash flows required to settle the present obligations at thebalance sheet date.

Notes to the Consolidated Financial Statements
55
Measurement criteria
In cases in which the effect of time is a relevant aspect, the amounts provided are subject to discounting takinginto account the estimate of the maturity of the obligation. The discount rate reflects current assessments of thetime value of money, taking into account risks specific to the liability.
The valuation of seniority bonuses paid to staff is the responsibility of independent external actuaries and followsthe same calculation logic already described for the provision for Employee Termination Indemnities.
Criteria for the recognition of income statement components
Provisions are generally recognized in the income statement. Exceptions are the amounts set aside for employee
seniority bonuses, recorded as balancing entries to valuation reserves.
The effects deriving from the elapsing of time for discounting of future cash flows are recognised in the incomestatement under provisions.
Liabilities and securities issued
Classification criteria
This item includes the various types of deposits received by the Bank: amounts due to banks, amounts due tocustomers, certified bond securities held on deposit or issued by the Group itself.
Recognition criteria
These financial liabilities are recognised upon receipt of the amounts deposited or upon issue of the debtsecurities. Recognition is at fair value, equal to the amount collected, or at the issue price, adjusted by any initialcosts or income directly attributable to the individual issue.
Criteria for the measurement and recognition of income statement components
After initial recognition, financial liabilities are measured at amortised cost using the effective interest method, withthe contra-entry to the income statement.
Financial liabilities without amortisation plans are measured at cost.
Financial liabilities subject to fair value hedges are subject to the same measurement criteria as the hedginginstrument, limited to the changes in fair value, from the time of designation of the hedge, recognized in profit andloss. The fair value of hedged financial instruments is calculated through valuation techniques by using elementspresent in the market (Level 2).
In the case of discontinuance of the hedging relationship, the difference between the fair value determined as atthe date of discontinuance and the amortised cost is charged to the income statement, spreading it over theresidual life of the financial instrument.
Securities issued by the Group are shown net of any repurchases.
Derecognition criteria
Liabilities and securities issued are derecognised from the financial statements upon maturity, settlement or sale.
For securities issued, the part subject to repurchase is, in essence, settled. The reinvestment of the Group’ssecurities previously repurchased is considered as a new issue at the selling value.

Notes to the Consolidated Financial Statements
56
Financial liabilities held for trading
Classification criteria
This item comprises derivative instruments that are held for trading with negative fair values.
Recognition criteria
Liabilities held for trading are recognised at fair value.
Criteria for the measurement and recognition of income statement components
Financial liabilities held for trading are measured at fair value and the effects are recognised in the incomestatement.Derivative instruments traded on active markets are valued at the closing price on the day of valuation (level 1).Derivative instruments, not traded on active markets, the pricing is made by employing valuation techniques(Level 3).
Derecognition criteria
Financial liabilities are derecognised upon sale, maturity or settlement.
Financial liabilities at fair value through profit or loss
Classification criteria
This item includes financial liabilities at fair value through profit or loss.
Specifically, the item refers to the application of the so-called fair value option for “naturally hedged” financial
liabilities, aimed at improving the balance of the profit and loss effects of the measurement of financial assets and
liabilities.
Liabilities at fair value may be recognised through profit or loss in the following cases:- the elimination or the reduction of measurement inconsistencies- the measurement of instruments containing embedded derivatives- the measurement of groups of financial assets or liabilities on the basis of documented risk management or
investment strategy.Bond issues including an embedded derivative or that are financially hedged have been classified under thiscategory.
Recognition criteria
These are recognised at fair value, which corresponds to the consideration collected or the issue price, asadjusted by initial income or charges (if any) directly attributable to the individual issue.
Criteria for the measurement and recognition of income statement components
These are measured at fair value through profit or loss.Fair value is determined through valuation techniques which use parameters that can be observed in activemarkets (level 2). The method is the discounted cash flow method by using a zero-coupon curve made up ofelements present in the market, and applying a credit spread calculated using the euro swaps curve and the

Notes to the Consolidated Financial Statements
57
curve of the yields of the securities issued by European banks with a rating equal to that of the Bank (Level 2).For subordinate bonds, a specific adjustment factor is also considered.
Derecognition criteria
Financial liabilities at fair value are derecognised upon sale, maturity or settlement.
Repurchases of own issues substantially entail the extinction of the part subject to repurchase. The re-placementof own securities that have previously been repurchased is considered as a new issue at sale value.
Transactions in foreign currency
Recognition criteria
Foreign currency transactions are recorded in the accounts on their date of settlement, converting them intoEuros at the exchange rate in force on the operation date.
Measurement criteria
At the end of the accounting period the headings in the financial statements in foreign currency have been valued
as follows:
- monetary: conversion at the exchange rate in force at the date of the closure;- non-monetary, valued at cost: conversion at the exchange rate in force at the date of the transaction;- non-monetary valued at fair value: conversion at the exchange rate in force at the date of closure.
Criteria for the recognition of income statement components
For monetary elements the effect of the valuation carried out is recognized in profit and loss.
For non-monetary elements whose profits and losses are recognized in the income statement, even exchangerate differences will be recorded in the income statement. If profits and losses are recognized in equity, exchangerate differences will be recognized in equity.
Insurance assets and liabilities
The insurance assets and liabilities entered in the Group’s consolidated financial statements arise solely from the
consolidation of Chiara Assicurazioni S.p.A. on a line-by-line basis, and represent the contracts that are classified
as insurance contracts as prescribed by IFRS 4, as well as the investment contracts classified as DPF
(Discretionary Participation Feature).
The technical reserves are the contractual obligations under the insurance contracts that have been entered into.
They are recognised on the basis of the taking out and continuation of the policies and are sufficient to allow the
prudentially estimated commitments to be met as far as can reasonably be foreseen.
They comprise:Assets:
- actuarial reserves arising from reinsurance: they are the portion of the technical liabilities that are sold
under reinsurance agreements. They are measured on the basis of the same parameters as those used
Notes to the Consolidated Financial Statements
58
to make provision for the risks assumed by the Company (the so-called “direct labour”).
Liabilities:- actuarial reserves: they are calculated on the basis of suitable actuarial mortality assumptions that are able
to discount possible subsequent unfavourable discrepancies, include contractual revaluations and are inany event not lower than the surrender value;
- reserves for sums to pay: they represent the amount necessary to pay out, during the subsequent sixmonths, on the surrenders and claims already notified in the first half-year;
- technical reserves with the risk assumed by the insured: they are proportionate to the value of the units ofthe internal funds to which the performance of some products are partially linked, such as theSupplementary Pension Fund (FIP);
- other technical reserves: these are made up of reserves for future operating expenses, as estimatedpursuant to Article 25, paragraph 8, of Legislative Decree No. 174/1995.
Other information
Revaluation reserves
This item comprises the revaluation reserves on financial assets available for sale, derivative contracts hedgingfinancial flows, the revaluation reserves constituted in application of special laws in previous years and thereserves from actuarial valuation of the reserve for employee termination indemnities according to IAS 19.Additionally, the effects deriving from the application of fair value, as deemed cost, to tangible assets upon thefirst-time adoption of IAS/IFRS are also included.
Costs and revenues recognition
Revenues are recognized in the financial statements when they are earned or, in any case, when it is probablethat future benefits will be received and that these benefits can be quantified reliably. In particular:- interest payments are recognised on a pro rata basis according to the contractual rate of interest or the actual
rate in the case of the application of amortised cost. The item interest receivable (or interest payable) alsoincludes the differentials or the positive (or negative) margins accrued from the reporting date of the financialstatements in relation to financial derivative contracts:a) to hedge assets or liabilities that generate interest;b) classified in the Balance Sheet in the trading portfolio, but connected from an operational point of view to
financial assets and/or liabilities measured at fair value (fair value option);c) connected operationally to assets and liabilities classified in the trading portfolio and which provide for the
settlement of differentials or margins with several expiry dates;- default interest, which may be provided for contractually, is accounted for in the Income Statement only when
it is actually collected;- dividends are charged to the Income Statement when a resolution is taken for their distribution;- commissions on revenues from services are recognised, on the basis of contractual agreements, in the period
in which the actual services are provided;- income deriving from the brokering of financial trading instruments, which is determined by the difference
between the transaction price and the fair value of the instrument, is charged to the Income Statement whenthe transaction is recognised if the fair value can be determined from parameters or recent transactions thatcan be observed on the same market in which the instrument is traded. If these values cannot be easilyobtained or if they show reduced liquidity, the financial instrument is recognised at an amount equal to thetransaction price, without the sales margin; the difference against the fair value is charged to the IncomeStatement for the duration of the transaction with a gradual reduction, in the valuation model, of the correctivefactor connected to the reduced liquidity of the instrument;
- profits/losses deriving from the trading of financial instruments are charged to the Income Statement when thesale is completed, on the basis of the difference between the consideration paid or collected and their carryingvalue;
- income deriving from the sale of non-financial assets is recognised when the sale is completed, unless themajority of the risks and awards connected to the asset have been retained.
Costs are charged to the Income Statement in the period in which the relative income is accounted for.If the association between costs and income is generic and indirect, costs are recognised over several periodsusing rational procedures and on a systematic basis.Costs that cannot be linked to income are immediately charged to the Income Statement.

Notes to the Consolidated Financial Statements
59
Finance leases
Assets under finance leases are shown as receivables at an amount corresponding to the net leasing investment.
Financial income is then recognised on the basis of methods that reflect a constant periodical rate of return.
Share-based payments
Share-based payments to Group employees can be:- cash-settled, and then accounted for in the income statement on the basis of the quota that has matured at
the period-end, also considering the probability that the cost will arise on the date on which the options areexercised;
- equity-settled, and then valued with the Black and Scholes model and recorded in the Income Statementon the basis of the accrued amount at the end of the accounting period and recorded in a specific reserveunder equity.
A.3 - INFORMATION ON FAIR VALUE
A.3.1 Transfers between portfolios
The amendments to IAS 39 and IFRS 7 “Reclassification of financial assets” which were approved by the IASB in2008, allow certain financial assets to be reclassified out of the “held for trading” and “available for sale” portfoliossubsequent to their initial recognition.In particular, the following can be reclassified:- those financial assets held for trading or available for sale that would have fulfilled the definition laid down by
international accounting standards for the loans portfolio (if these assets had not been classified as held fortrading or available for sale respectively when they were initially recognised) if the business has the intentionand capacity to hold them for the foreseeable future or until their expiry;
- “only in rare circumstances” those financial assets held for trading that at the time of their being recognised didnot fulfil the definition of loans.
No Group company has reclassified any items between portfolios.
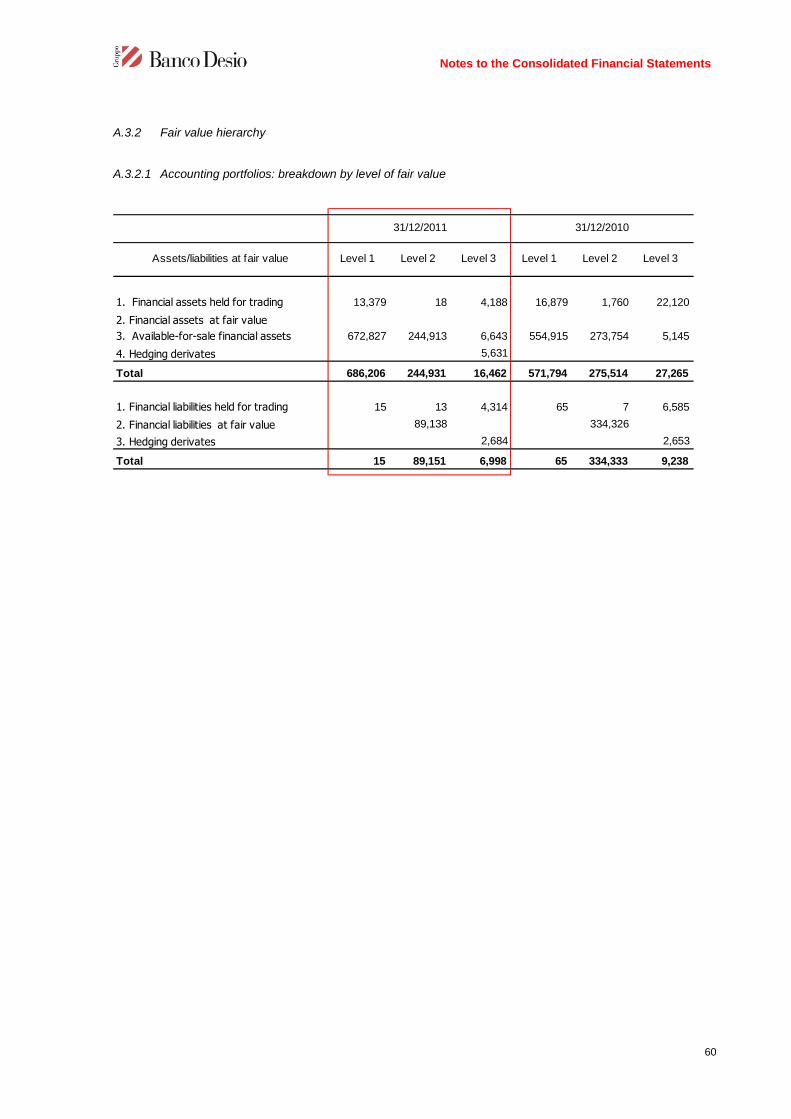
Notes to the Consolidated Financial Statements
60
A.3.2 Fair value hierarchy
A.3.2.1 Accounting portfolios: breakdown by level of fair value
Assets/liabilities at fair value Level 1 Level 2 Level 3 Level 1 Level 2 Level 3
1. Financial assets held for trading 13,379 18 4,188 16,879 1,760 22,120
2. Financial assets at fair value
3. Available-for-sale financial assets 672,827 244,913 6,643 554,915 273,754 5,145
4. Hedging derivates 5,631
Total 686,206 244,931 16,462 571,794 275,514 27,265
1. Financial liabilities held for trading 15 13 4,314 65 7 6,585
2. Financial liabilities at fair value 89,138 334,326
3. Hedging derivates 2,684 2,653
Total 15 89,151 6,998 65 334,333 9,238
31/12/2011 31/12/2010

Notes to the Consolidated Financial Statements
61
A.3.2.2 Financial assets at fair value (level 3): annual changes
held for
tradingat fair value
available for
salehedging
1. Opening balance 22,120 5,145
2.1. Purchases 4,406 1,500 7,256
2.2 Profits charged to: 179 1,500
2.2.1 Income statement
- of w hich Capital Gains 1,841 5,409
2.2.2 Equity 1,841 5,409
2.3 Transfers from other levels
2.4 Other increases
2.4. Other increases 2,565 1,847
3. Decreases 22,338 2 1,625
3.1 Sales
3.2 Redemptions
3.3 Losses charged to:
3.3.1 Income statement 6,630 3
- of w hich Capital Losses 6,630 3
3.3.2 Equity
3.4 Transfers to other levels
3.5 Other decreases 15,708 2 1,622
4. Closing balance 4,188 6,543 5,631
Financial assets
A.3.2.3 Financial assets at fair value (level 3): annual changes
held for
tradingat fair value hedging
1. Opening balance 6,585 2,653
2. Increases 3,591 3,519
2.1 Issues 128
2.2 Losses charged to:
2.2.1 Income statement 2,759 995
- of w hich Capital Losses 2,759 995
2.2.2 Equity
2.3 Transfers from other levels
2.4 Other increases 832 2,524
3. Decreases 5,862 3,488
3.1 Redemptions
3.2 Repurchases
3.3 Profits charged to:
3.3.1 Income statement 2,405 2,798
- of w hich Capital Gains 2,405 2,799
3.3.2 Equity
3.4 Transfers to other levels
3.5 Other decreases 3,457 690
4. Closing balance 4,314 2,684
Financial liabilities

Notes to the Consolidated Financial Statements
62
A.3.3 Information on the so-called “day one profit/loss”
In relation to the Group’s operations and on the basis of the internal valuation methods which are currently in use,no differences have been recognized between the price of the transactions and the initial measurement offinancial assets and liabilities entered in the accounts (the so-called “day one profit/loss”).

Part B - INFORMATION ON THE CONSOLIDATED BALANCE SHEET
ASSETS
SECTION 1 - CASH AND CASH EQUIVALENTS
1.1 Cash and cash equivalents: breakdown
SECTION 2 - FINANCIAL ASSETS HELD FOR TRADING
2.1 Financial assets held for trading: breakdown by type
a) Cash
b) Sight deposits at Central Banks
Total
A. Cash equivalents
1. Debt securities 13,190
1.1 Structured securities
1.2 Other debt securities 13,190
2. Equity securities 166
3. UCITS units
4. Financing
4.1 Repurchase agreements
assets
4.2 Other
Total (A) 13,356
B. Derivative instruments:
1. Financial derivatives: 23
1.1 trading 23
1.2 connected with the fair
value option
1.3 other
2. Credit derivatives
2.1 trading
2.2 connected with the fair
value option
2.3 other
Total (B) 23
Total (A+B) 13,379
Caption/amount
Notes to the consolidated financial
INFORMATION ON THE CONSOLIDATED BALANCE SHEET
CASH AND CASH EQUIVALENTS (caption 10)
Cash and cash equivalents: breakdown
FINANCIAL ASSETS HELD FOR TRADING (caption 20)
held for trading: breakdown by type
31.12.2011 31.12.2010
29,228 27,732
2,755 892
31,893 28,615
L 1 L2 L 3 L 1 L 2 L 3
13,190 16,469 1,748
145
13,190 16,469 1,603
166 314
13,356 - - 16,783 1,748 -
23 18 4,188 96 12 22,120
23 18 2,619 96 12 6,093
1,569 16,027
23 18 4,188 96 12 22,120
13,379 18 4,188 16,879 1,760 22,120
31.12.2011 31.12.2010
Notes to the consolidated financial statements
63
INFORMATION ON THE CONSOLIDATED BALANCE SHEET

2.2 Financial assets held for trading: breakdown by debtor/issuer
A. CASH EQUIVALENTS
1. Debt securities
a) Governments and central banks
b) Other public entities
c) Banks
d) Other issuers
2. Equity securities
a) Banks
b) Other issuers
- insurance companies
- financial insitutions
- non-financial companies
- other
3. UCITS units
4. Financing
a) Governments and central banks
b) Other public entities
c) Banks
d) Other entities
Total A
B. DERIVATIVE INSTRUMENTS
a) Banks
- fair value
b) Customers
- fair value
Total B
Total (A + B)
Caption /Amount
Notes to the consolidated financial
Financial assets held for trading: breakdown by debtor/issuer
13,190 18,217
a) Governments and central banks 8,594 17,557
3,734
862 660
166 314
166 314
a) Governments and central banks
13,356 18,531
1,924 19,876
2,275 2,352
4,229 22,228
17,585 40,759
31.12.2011 31.12.2010
Notes to the consolidated financial statements
64

2.3 Cash financial assets held for trading: annual changes
SECTION 3 - FINANCIAL ASSETS AT FAIR VALUE THROUGH PROFIT OR LOSS
This item has a balance of nil in the periods of reference
SECTION 4 - AVAILABLE-FOR
4.1 Available-for-sale financial assets: breakdown by type
The component attributable to the insurance company, which is represented almost exclusively by Level 1securities, amounts to a total of Euroinstruments of Euro 612 thousandin 2010).
A. Opening balance
B. Increases
B.1 Purchases
B.2 Positive fair value changes
B.3 Other changes
C. Decreases
C.1 Sales
C.2 Redemptions
C.3 Negative fair value changes
C.4 Trasfers to other portfolios
C.5 Other changes
D. Closing balance
1. Debt securities
1.1 Structured securities
1.2 Other debt securities
2. Equity securities
2.1 Measured at fair value
2.2 Measured at cost
3. UCITS units
4. Financing4. Financing
Total
Caption/Amount
Notes to the consolidated financial
Cash financial assets held for trading: annual changes
FINANCIAL ASSETS AT FAIR VALUE THROUGH PROFIT OR LOSS
has a balance of nil in the periods of reference.
FOR-SALE FINANCIAL ASSETS (caption 40)
sale financial assets: breakdown by type
The component attributable to the insurance company, which is represented almost exclusively by Level 1securities, amounts to a total of Euro 34,994 thousand, of which debt securities of Euro 33,
thousand and UCITS units of Euro 1,037 thousand (compared to Euro
18,217 314
223,676 212,325
223,178 212,227
77
371 98
228,653 212,473
216,234 212,120
12,181
104 200
125 153
13,190 169
Debt
securities
Equity
securities
UCITS
units
Level 1 Level 2 Level 3 Level 1 Level 2
630,841 244,913 110 523,666 273,754
561 3,500 899 3,662
630,280 241,413 110 522,767 270,092
1,121 6,533 662
1,121 4,952 662
1,581
40,865 30,587
672,827 244,913 6,643 554,915 273,754
31.12.2011 31.12.2010
Notes to the consolidated financial statements
65
FINANCIAL ASSETS AT FAIR VALUE THROUGH PROFIT OR LOSS (caption 30)
The component attributable to the insurance company, which is represented almost exclusively by Level 1-Euro 33,345 thousand, equity
thousand (compared to Euro 27,758 thousand
18,531
435,951
435,405
77
469
441,126
428,363
12,181
304
278
13,356
UCITS
unitsFinancing Total
Level 2 Level 3
273,754 110
3,662
270,092 110
5,035
4,952
8383
273,754 5,145
31.12.2010
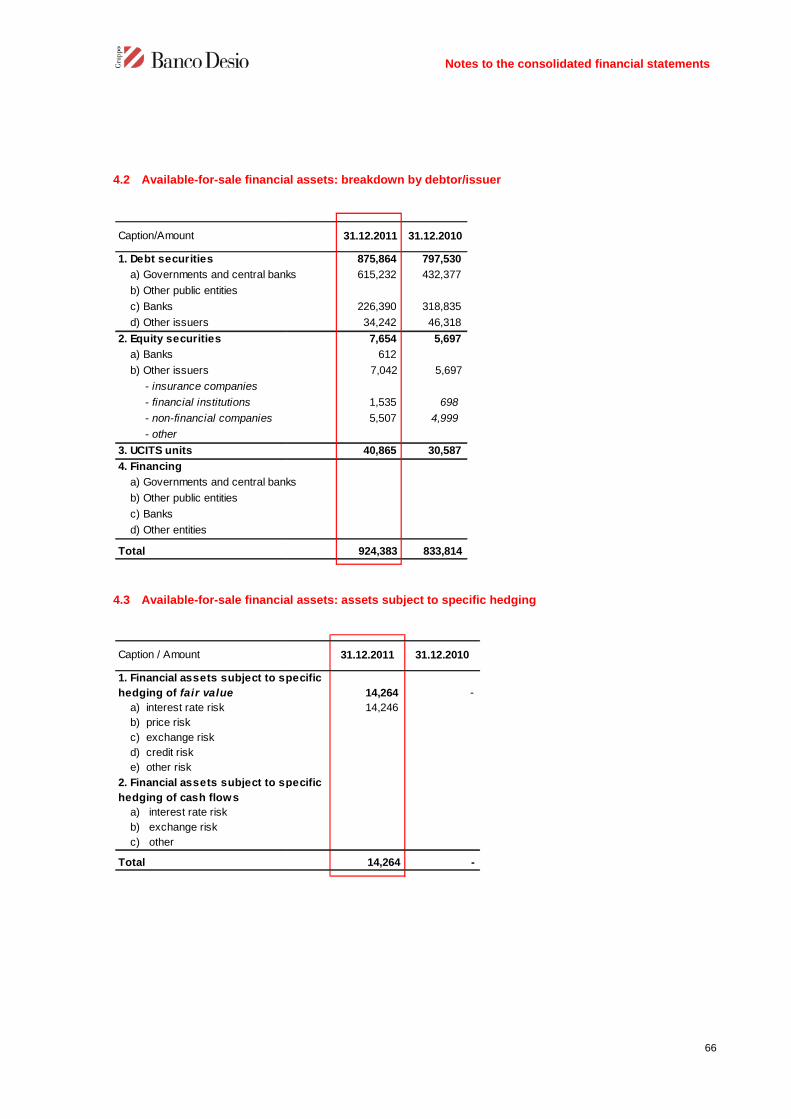
4.2 Available-for-sale financial assets: breakdown by debtor/issuer
4.3 Available-for-sale financial
1. Debt securities
a) Governments and central banks
b) Other public entities
c) Banks
d) Other issuers
2. Equity securities
a) Banks
b) Other issuers
- insurance companies
- financial institutions
- non-financial companies
- other
3. UCITS units
4. Financing
a) Governments and central banks
b) Other public entities
c) Banks
d) Other entities
Total
Caption/Amount
1. Financial assets subject to specific
hedging of fair value
a) interest rate risk
b) price risk
c) exchange risk
d) credit risk
e) other risk
2. Financial assets subject to specific
hedging of cash flows
a) interest rate risk
b) exchange risk
c) other
Total
Caption / Amount
Notes to the consolidated financial
sale financial assets: breakdown by debtor/issuer
sale financial assets: assets subject to specific hedging
875,864 797,530
a) Governments and central banks 615,232 432,377
226,390 318,835
34,242 46,318
7,654 5,697
612
7,042 5,697
1,535 698
5,507 4,999
40,865 30,587
a) Governments and central banks
924,383 833,814
31.12.2011 31.12.2010
1. Financial assets subject to specific
14,264 -
14,246
2. Financial assets subject to specific
14,264 -
31.12.2011 31.12.2010
Notes to the consolidated financial statements
66
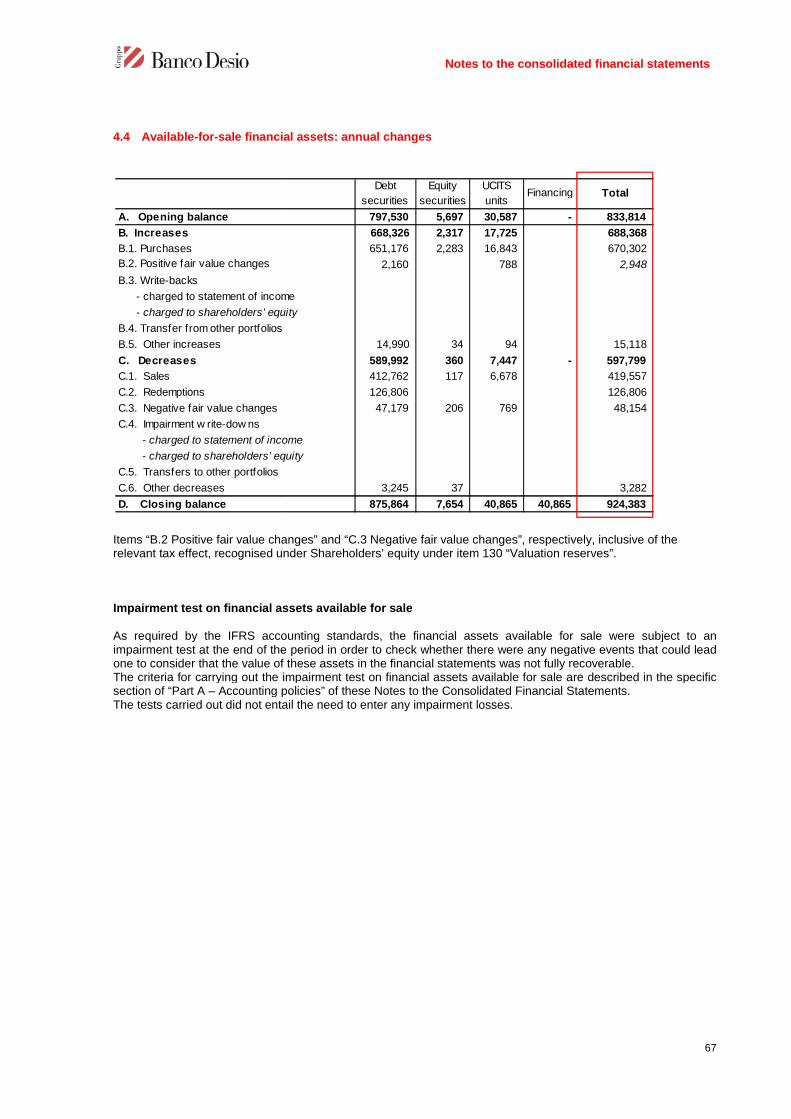
4.4 Available-for-sale financial assets: annual changes
Items “B.2 Positive fair value changes” and “C.3 Negative fair value changes”, respectively, inclusive of therelevant tax effect, recognised under Shareholders’ equity under item 130 “Valuation reser
Impairment test on financial assets available for sale
As required by the IFRS accounting standards, the financial assets available for sale were subject to animpairment test at the end of the period in order to check whether there were anyone to consider that the value of these assets in the financial statements was not fully recoverableThe criteria for carrying out the impairment test on financial assets available for sale are described in the specificsection of “Part A – Accounting policiesThe tests carried out did not entail the need to
A. Opening balance
B. Increases
B.1. Purchases
B.2. Positive fair value changes
B.3. Write-backs
- charged to statement of income
- charged to shareholders' equity
B.4. Transfer from other portfolios
B.5. Other increases
C. Decreases
C.1. Sales
C.2. Redemptions
C.3. Negative fair value changes
C.4. Impairment w rite-dow ns
- charged to statement of income
- charged to shareholders' equity
C.5. Transfers to other portfolios
C.6. Other decreases
D. Closing balance
Notes to the consolidated financial
sale financial assets: annual changes
Items “B.2 Positive fair value changes” and “C.3 Negative fair value changes”, respectively, inclusive of therelevant tax effect, recognised under Shareholders’ equity under item 130 “Valuation reser
Impairment test on financial assets available for sale
As required by the IFRS accounting standards, the financial assets available for sale were subject to animpairment test at the end of the period in order to check whether there were any negative events that could leadone to consider that the value of these assets in the financial statements was not fully recoverableThe criteria for carrying out the impairment test on financial assets available for sale are described in the specific
Accounting policies” of these Notes to the Consolidated Financial StatementsThe tests carried out did not entail the need to enter any impairment losses.
797,530 5,697 30,587 -
668,326 2,317 17,725
651,176 2,283 16,843
2,160 788
- charged to statement of income
- charged to shareholders' equity
14,990 34 94
589,992 360 7,447 -
412,762 117 6,678
126,806
47,179 206 769
- charged to statement of income
- charged to shareholders' equity
3,245 37
875,864 7,654 40,865 40,865
Debt
securities
Equity
securities
UCITS
unitsFinancing
Notes to the consolidated financial statements
67
Items “B.2 Positive fair value changes” and “C.3 Negative fair value changes”, respectively, inclusive of therelevant tax effect, recognised under Shareholders’ equity under item 130 “Valuation reserves”.
As required by the IFRS accounting standards, the financial assets available for sale were subject to annegative events that could lead
one to consider that the value of these assets in the financial statements was not fully recoverable.The criteria for carrying out the impairment test on financial assets available for sale are described in the specific
of these Notes to the Consolidated Financial Statements.
- 833,814
688,368
670,302
2,948
15,118
- 597,799
419,557
126,806
48,154
3,282
40,865 924,383
TotalFinancing

SECTION 5 - HELD-TO-MATURITY INVESTMENTS
5.1 Held-to-maturity investments: breakdown by type
5.2 Held-to-maturity investments: breakdown by debtor/issuer
5.3 Held-to-maturity investments: subject to specific hedging
At the balance sheet date there was a balance of nil for
1. Debt securities 124,626 90,389
- structured securities
- o ther debt securities 124,626 90,389
2. Financing
Transactions type /
Amount
31.12.2011
Book
value
1. Debt securities
a) Governments and central banks
b) Other public entities
c) Banks
d) Other issuers
2. Financing
a) Governments and central banks
b) Other public entities
c) Banks
d) Other entities
Total
Total fair value
Transaction type/Amount
Notes to the consolidated financial
MATURITY INVESTMENTS (caption 50)
maturity investments: breakdown by type
maturity investments: breakdown by debtor/issuer
maturity investments: subject to specific hedging
At the balance sheet date there was a balance of nil for held-to-maturity investments subject to specific hedging
L 1 L 2 L 3 L 1 L 2 L 3
90,389 9,715 124,480 118,052
90,389 9,715 124,480 118,052
31.12.2011 31.12.2010
Book
value
Fair value Fair value
124,626 124,480
a) Governments and central banks 110,774 110,719
10,115 10,112
3,737 3,649
- -
a) Governments and central banks
124,626 124,480
100,104 118,052
#REF! #REF!
31.12.201031.12.2011
Notes to the consolidated financial statements
68
maturity investments subject to specific hedging.

5.4 Held-to-maturity investments: annual changes
SECTION 6 - AMOUNTS DUE FROM BANKS
6.1 Amounts due from banks: breakdown by type
Amounts due from banks claimed bythousand, all of which refer to current account
A. Opening balance
B. Increases
B.1 Purchases
B.2 Write-backs
B.3 Transfer from other portfolios
B.4 Other increases
C. Decreases
C1. Sales
C2. Redemptions
C3. Value adjustments
C4. Transfers to other portfolios
C5. Other decreases
D. Closing balance
A. Amounts due from Central banks
1. Restricted deposits
2. Compulsory reserve
3. Repurchase agreements
4. Other
B. Amounts due from banks
deposits
2. Restricted deposits
3. Other financing
3.1 repurchase agreements
3.2 Finance leases
3.3 Other
4. Debt securities
4.1 Structured securities
4.2 Other debt securities
Total (book value)
Total (fair value)
Transaction type/Amount
Notes to the consolidated financial
maturity investments: annual changes
AMOUNTS DUE FROM BANKS (caption 60)
Amounts due from banks: breakdown by type
banks claimed by the insurance company, net of intra-group accounts, amount to Eurocurrent accounts and unrestricted deposits (Euro 4,566 thousand last year
Debt
securities
FinancingTotal
124,480 - 124,480
1,729 1,729
1,729 1,729
(1,583) (1,583)
(1,583) (1,583)
124,626 - 124,626
A. Amounts due from Central banks 29,371 69,384
29,371 69,384
259,154 233,468
158,889 130,673
74,729 77,207
104 232
104 232
25,432 25,358
25,432 25,358
288,525 302,852
288,089 302,852
31.12.2011 31.12.2010
Notes to the consolidated financial statements
69
group accounts, amount to Euro 6,150thousand last year).

6.2 Amounts due from banks
At the reference date there were no amounts due from banks subject to specific hedging
6.3 Amounts due from banks: finance leases
At the reference date there were no amounts due from banks in connection with finance lease transactions
SECTION 7 - AMOUNTS DUE FROM CUSTOMERS
7.1 Amounts due from customers: breakdown by type
The year-end balance of performing loans includes receivables pertaining to the insurance businessEuro 20 thousand (unchanged compared to the
As regards “Impaired assets”, for further information to that already provided in the Report on Operations, refer to“Section E” of these Notes to the Consolidated Financial Statements
1. Current account
2. Repurchase agreements
3. Mortgage loans
4. Credit cards, personal loans and
loans on salary
5. Financial leases
6. Factoring
7. Other transactions
8. Debt securities
8.1 Structured secutities
8.2 Other debt securities
Total (book value)
Total (fair value)
Transactions type / Amount
Notes to the consolidated financial
Amounts due from banks: assets subject to specific hedging
reference date there were no amounts due from banks subject to specific hedging
Amounts due from banks: finance leases
there were no amounts due from banks in connection with finance lease transactions
AMOUNTS DUE FROM CUSTOMERS (caption 70)
Amounts due from customers: breakdown by type
of performing loans includes receivables pertaining to the insurance businessunchanged compared to the previous period).
”, for further information to that already provided in the Report on Operations, refer to“Section E” of these Notes to the Consolidated Financial Statements.
Performing Impaired Performing Impaired
1,451,585 85,076 1,433,110 75,202
3,583 1,522
3,229,191 148,056 3,170,555 99,874
4. Credit cards, personal loans and 302,172 8,220
230,076 5,036
576,355 21,272 598,102 17,944
11,180 104 9,139 167
716,538 5,317 777,245 3,118
21,747 55,630
21,747 55,630
6,312,351 268,099 6,275,379 201,341
6,615,008 268,099 6,596,889 201,341
31.12.2011 31.12.2010
Notes to the consolidated financial statements
70
reference date there were no amounts due from banks subject to specific hedging.
there were no amounts due from banks in connection with finance lease transactions.
of performing loans includes receivables pertaining to the insurance business of a total of
”, for further information to that already provided in the Report on Operations, refer to
Impaired
75,202
99,874
5,036
17,944
167
3,118
201,341
201,341

7.2 Amounts due from customers: breakdown by
7.3 Amounts due from customers
At the reference date there were no amounts due from customers subject to specific hedging.
7.4 Finance lease
Reconciliation between the gross leasing investmentleasing and unsecured residual values due to
1. Debt securities
a) Governments
b) other public entities
c) other issuers
- non-financial companies
- financial companies
- insurance companies
- other
2. Loans to:
a) Governments
b) Other public entities
c) Other entities
- non-financial companies
- financial companies
- insurance companies
- other
Total
Transaction type/Amount
Finance lease
- of which leaseback agreements
Total
Type of transactions
- Within 1 year
- Betw een 1 and 5 years
- Beyond than 5 years
Total
Relevant period
Notes to the consolidated financial
Amounts due from customers: breakdown by debtor/issuer
Amounts due from customers: assets subject to specific hedging
At the reference date there were no amounts due from customers subject to specific hedging.
Reconciliation between the gross leasing investment and the present value of the minimum payments due forleasing and unsecured residual values due to the lessor.
Performing Impaired Performing Impaired
21,747 55,630
21,747 55,630
21,747 55,630
6,290,604 268,099 6,219,749 201,341
49
6,290,604 268,099 6,219,700 201,341
3,958,774 164,488 4,058,788 127,925
101,884 209 62,165 102
2,624 1,877
2,227,322 103,402 2,096,870 73,314
6,312,351 268,099 6,275,379 201,341
31.12.2011 31.12.2010
736,308 146,549 589,759 85,793
- of which leaseback agreements 50,704 10,867 39,837 7,794
736,308 146,549 589,759 85,793
Gross
investment
Deferred
profit
Net
investment
Unsecured
residual
values
15,986 369 15,617
225,342 17,166 208,176
494,980 129,014 365,966
736,308 146,549 589,759
Gross
investment
Deferred
profit
Net
investment
Notes to the consolidated financial statements
71
At the reference date there were no amounts due from customers subject to specific hedging.
and the present value of the minimum payments due for
Impaired
201,341
201,341
127,925
102
73,314
201,341
85,793
7,794
85,793
Unsecured
residual
values

SECTION 8 - HEDGING DERIVATIVES
8.1 Hedging derivatives: breakdown by type of hedging and by level
KeyNV = Notional value
8.2 Hedging derivatives: breakdown by hedged portfolios and type of hedging
SECTION 9 - ADJUSTMENT(caption 90)
At the reference date there were
L1
A . F inancial der ivat ives
1) Fair value
2) Cash f low
3) Foreign investments
B . C redit d erivat ives
1) Fair value
2) Cash f low
T o t al
Transactions/Hedging type
interest rate
risk
1. Available-for-sale f inancial assets
2. Credits
3. Held-to-maturity f inancial assets
4. Port folio
5. Other t ransaction
Tot al asset s
1. Financial liabilit ies
2. Port folio
Tot al l iab il it ies
1. Expected set t lements
2. Financial assets and liabilit ies port folio
Notes to the consolidated financial
HEDGING DERIVATIVES (caption 80)
Hedging derivatives: breakdown by type of hedging and by level
Hedging derivatives: breakdown by hedged portfolios and type of hedging
DJUSTMENT TO VALUES OF FINANCIAL ASSETS SUBJECT TO SPECIFIC HEDGING
At the reference date there were no financial assets subject to specific hedging.
L2 L3 L1 L2
5,631 216,637
5,631 216,637
5,631 216,637
3 1/ 12 / 2 0 11 3 1/ 12 / 2 0 10NV
interest rate
riskexchange risk credit risk price risk other risk
5,631
5,6 3 1
Fair V alue
Specif ic
Notes to the consolidated financial statements
72
VALUES OF FINANCIAL ASSETS SUBJECT TO SPECIFIC HEDGING
L2 L3
3 1/ 12 / 2 0 10NV
C ash f lows
Foreign
investments
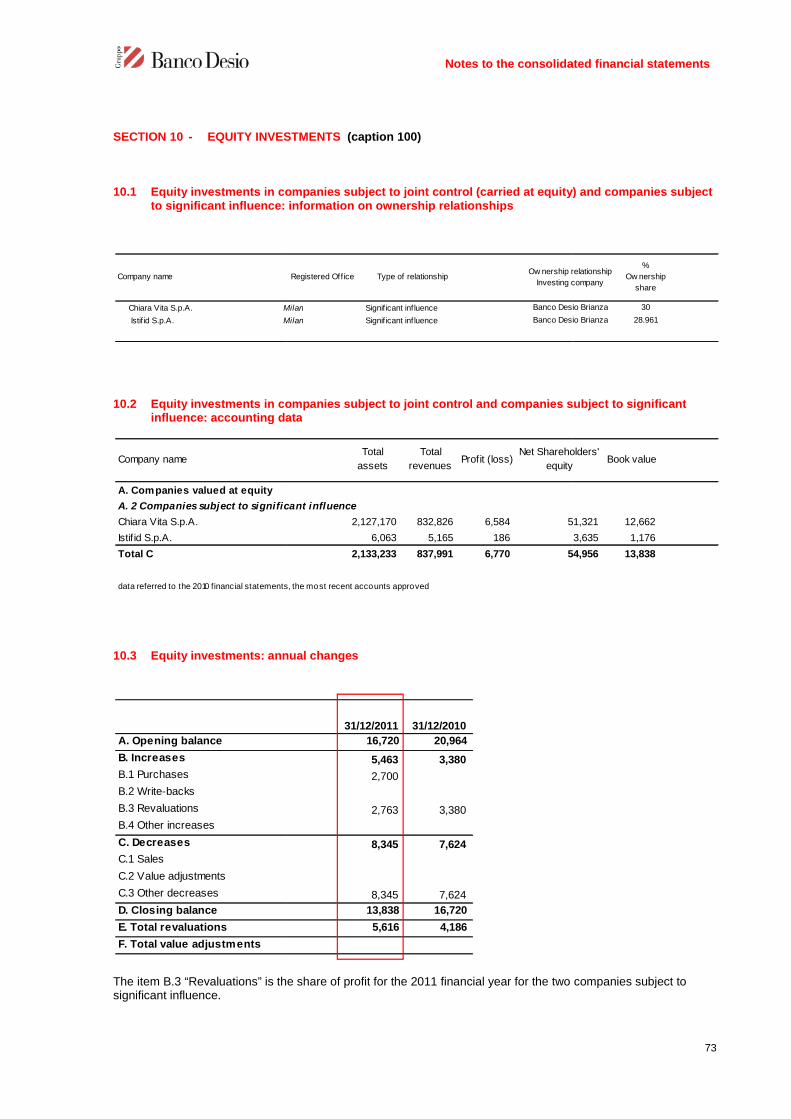
SECTION 10 - EQUITY INVESTMENTS
10.1 Equity investments in companies subject to joint control (carried at equity) and companies subjectto significant influence: information on ownership relationships
10.2 Equity investments in companies subject to joint control and companies subject to significantinfluence: accounting data
10.3 Equity investments: annual changes
The item B.3 “Revaluations” is the share of profit for the 2011 financial year for the two companies subject tosignificant influence.
Chiara Vita S.p.A. Milan
Istif id S.p.A. Milan
Company name
Chiara Vita S.p.A.
Istif id S.p.A.
Total C
data referred to the 2010 financial statements, the most recent accounts approved
A. 2 Companies subject to significant influence
A. Companies valued at equity
Company name
A. Opening balance
B. Increases
B.1 Purchases
B.2 Write-backs
B.3 Revaluations
B.4 Other increases
C. Decreases
C.1 Sales
C.2 Value adjustments
C.3 Other decreases
D. Closing balance
E. Total revaluations
F. Total value adjustments
Notes to the consolidated financial
EQUITY INVESTMENTS (caption 100)
Equity investments in companies subject to joint control (carried at equity) and companies subjectto significant influence: information on ownership relationships
Equity investments in companies subject to joint control and companies subject to significantinfluence: accounting data
Equity investments: annual changes
is the share of profit for the 2011 financial year for the two companies subject to
Milan Signif icant inf luence Banco Desio Brianza
Milan Signif icant inf luence Banco Desio Brianza
Ow nership relationship
Investing companyRegistered Off ice Type of relationship
2,127,170 832,826 6,584 51,321
6,063 5,165 186 3,635
2,133,233 837,991 6,770 54,956
data referred to the 2010 financial statements, the most recent accounts approved
A. 2 Companies subject to significant influence
Net Shareholders'
equity
Total
assets
Total
revenuesProfit (loss)
31/12/2011 31/12/2010
16,720 20,964
5,463 3,380
2,700
2,763 3,380
8,345 7,624
8,345 7,624
13,838 16,720
5,616 4,186
Notes to the consolidated financial statements
73
Equity investments in companies subject to joint control (carried at equity) and companies subject
Equity investments in companies subject to joint control and companies subject to significant
is the share of profit for the 2011 financial year for the two companies subject to
Banco Desio Brianza 30
Banco Desio Brianza 28.961
Ow nership relationship
Investing company
%
Ow nership
share
51,321 12,662
3,635 1,176
54,956 13,838
Net Shareholders'
equityBook value

SECTION 11 - TECHNICAL INSURANCE RESERVES CARRIED BY REINSURERS
11.1 Technical insurance reserves carried by reinsurers: breakdown
11.2 Change in caption 110 “Technical insurance reserves carried by reinsurers”
The item Non-Life branch shows a total increase of Euro 568 thousand (Euro 834 thousand last year)
*
A. Non-Life branch
A.1 premiums reserves
A.2 claims reserves
A.3 other reserves
B. Life branch
B.1 mathematical reserves
B.2 reserves for amounts to be disbursed
B.3 other reserves
C. Technical reserves for investment risks to be
borne by the insured
C.1 reserves for contracts w ith disbursements
connected w ith investment funds and market indices
C.2 reserves from pension fund management
D. Total technical insurance reserves carried by
reinsurers
Notes to the consolidated financial
TECHNICAL INSURANCE RESERVES CARRIED BY REINSURERS
Technical insurance reserves carried by reinsurers: breakdown
Change in caption 110 “Technical insurance reserves carried by reinsurers”
Life branch shows a total increase of Euro 568 thousand (Euro 834 thousand last year)
B.2 reserves for amounts to be disbursed
C. Technical reserves for investment risks to be
C.1 reserves for contracts w ith disbursements
connected w ith investment funds and market indices
C.2 reserves from pension fund management
D. Total technical insurance reserves carried by
Notes to the consolidated financial statements
74
TECHNICAL INSURANCE RESERVES CARRIED BY REINSURERS (caption110)
Change in caption 110 “Technical insurance reserves carried by reinsurers”
Life branch shows a total increase of Euro 568 thousand (Euro 834 thousand last year).
31.12.2011 31.12.2010
6,931 6,363
5,684 5,227
1,247 1,136
6,931 6,363

SECTION 12 - TANGIBLE ASSETS
12.1 Tangible assets: breakdown of assets valued at cost
The insurance component amounts to Euro 225thousand (Euro 264 thousand last year)
12.2 Tangible assets: breakdown of tangible assets at fair value or revalued
At the reference date there were
A. Functional assets
1.1 owned by the Bank1.1 owned by the Bank
a) land
b) buildings
c) f ixtures and fittings
d) electrical equipment
e) other
1.2 acquired under finance lease
a) land
b) buildings
c) f ixtures and fittings
d) electrical equipment
e) other
Total A
B. Tangible assets held for investment
2.1 owned by the Banka) land
b) buildings
2.2 acquired under finance lease
a) landa) land
b) buildings
Total B
Total (A + B)
Asset/Value
Notes to the consolidated financial
TANGIBLE ASSETS (caption 120)
assets: breakdown of assets valued at cost
The insurance component amounts to Euro 225thousand (Euro 264 thousand last year)
breakdown of tangible assets at fair value or revalued
ce date there were no tangible assets measured at fair value or revalued.
31.12.2011 31.12.2010
154,475 150,815
42,778 40,756
91,002 88,213
9,034 9,570
2,678 3,128
8,983 9,148
1.2 acquired under finance lease
154,475 150,815
B. Tangible assets held for investment
6 6
6 6
2.2 acquired under finance lease
6 6
154,481 150,821
Notes to the consolidated financial statements
75
The insurance component amounts to Euro 225thousand (Euro 264 thousand last year).
.

12.3 Tangible assets for business use: annual changes
A. Gross opening balance
A.1 Total net decreases in value
A.2 Net opening balance
B. Increases:
B.1 Purchases
B.2 Capitalized improvement expenses
B.3 Write-backs
a:
a) shareholders' equity
b) statement of income
B.5 Positive exchange differences
B.6 Transfers from assets held for investment
B.7 Other increases
C. Decreases:
C.1 Sales
C.2 Amortization/depreciation
C.3 Value adjustments due
charged to:
a) shareholders' equity
b) statement of income
charged to:
a) shareholders' equity
b) statement of income
C.5 Negative exchange differences
C.6 Transfers to:
a) tangible assets held for investment
b) assets being disposed of
C.7 Other decreases
D. Net closing balance
D.1 Total net decreases in value
D.2 Gross closing balance
E. Valuation at cost
Notes to the consolidated financial
Tangible assets for business use: annual changes
40,756 99,447 32,076 19,601
Total net decreases in value 11,234 22,506 16,473
40,756 88,213 9,570 3,128
2,022 5,096 2,255 1,328
1,990 2,621 2,151 1,257
Capitalized improvement expenses 2,407
Positive exchange differences 32 68 8
Transfers from assets held for investment
96 71
- 2,307 2,791 1,778
351 1,066 649
1,956 1,725 1,129
to deterioration
Negative exchange differences
a) tangible assets held for investment
b) assets being disposed of
42,778 91,002 9,034 2,678
13,435 24,193 17,609
42,778 104,437 33,227 20,287
Land BuildingsFixtures
and
Electronic
equipment
Notes to the consolidated financial statements
76
Total
19,601 38,345 230,225
16,473 29,197 79,410
3,128 9,148 150,815
1,328 4,064 14,765
1,257 3,236 11,255
2,407
5 113
-
71 823 990
1,778 4,229 11,105
649 2,185 4,251
1,129 2,044 6,854
2,678 8,983 154,475
17,609 30,571 85,808
20,287 39,554 240,283
OtherElectronic
equipment

12.4 Tangible assets held for investment: annual changes
No changes were recorded during the period in tangible assets held for
12.5 Tangible assets: commitments
At the reference date there were no commitments
SECTION 13 - INTANGIBLE ASSETS
13.1 Intangible assets: breakdown by
Tests were performed on the goodwill recorded in the financial statements to check the recoverability of the valueTo this end we note, as already reported in the Report on Operations, that the subsidiaryLuxembourg has written down, by a total of Euro 3 million, the value of the stake in
The insurance component, which only refers to intangibthousand last year).
A.1 Goodwill
A.2 Other intangible assets:
A.2.1 Assets valued at cost:
a) Intangible assets generated
internally
b) Other assets
A.2.2 Assets at fair value through
profit or loss:
a) Intangible assets generated
internally
b) Other assets
Total
Caption/Value
Notes to the consolidated financial
Tangible assets held for investment: annual changes
No changes were recorded during the period in tangible assets held for investment.
assets: commitments for purchase of tangible assets
At the reference date there were no commitments for purchase of tangible assets.
INTANGIBLE ASSETS (caption 130)
Intangible assets: breakdown by type of assets
Tests were performed on the goodwill recorded in the financial statements to check the recoverability of the valueTo this end we note, as already reported in the Report on Operations, that the subsidiary
has written down, by a total of Euro 3 million, the value of the stake in C.P.C. s.a.
The insurance component, which only refers to intangible assets, amounts to Euro 2,206 thousand (Euro 1,201
Definite
duration
Indefinite
duration
Definite
duration
Indefinite
duration
41,345 44,345
5,151 3,247
5,151 3,247
a) Intangible assets generated
5,151 3,247
through
a) Intangible assets generated
5,151 41,345 3,247 44,345
31.12.2011 31.12.2010
Notes to the consolidated financial statements
77
Tests were performed on the goodwill recorded in the financial statements to check the recoverability of the value.To this end we note, as already reported in the Report on Operations, that the subsidiary Brianfid S.A. –
C.P.C. s.a. – Lugano.
le assets, amounts to Euro 2,206 thousand (Euro 1,201
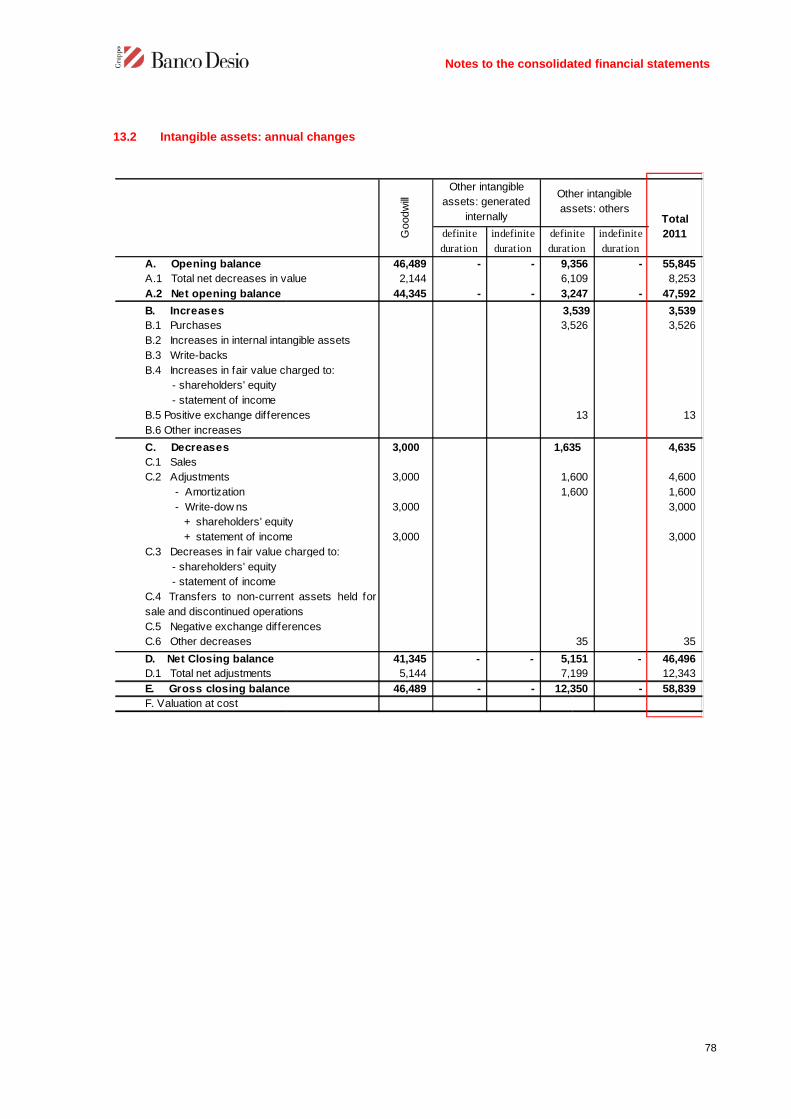
13.2 Intangible assets: annual changes
A. Opening balance
A.1 Total net decreases in value
A.2 Net opening balance
B. Increases
B.1 Purchases
B.2 Increases in internal intangible assets
B.3 Write-backs
B.4 Increases in fair value charged to:
- shareholders' equity- shareholders' equity
- statement of income- statement of income
B.5 Positive exchange differences
B.6 Other increases
C. Decreases
C.1 Sales
C.2 Adjustments
- Amortization
- Write-dow ns
+ shareholders' equity
+ statement of income
C.3 Decreases in fair value charged to:
- shareholders' equity
- statement of income
C.4 Transfers to non-current
sale and discontinued operations
C.5 Negative exchange differences
C.6 Other decreases
D. Net Closing balance
D.1 Total net adjustments
E. Gross closing balance
F. Valuation at cost
Notes to the consolidated financial
assets: annual changes
definite
duration
indefinite
duration
definite
duration
46,489 - - 9,356
A.1 Total net decreases in value 2,144 6,109
44,345 - - 3,247
3,539
3,526
B.2 Increases in internal intangible assets
B.4 Increases in fair value charged to:
B.5 Positive exchange differences
3,000 1,635
3,000 1,600
1,600
3,000
+ shareholders' equity
+ statement of income 3,000
C.3 Decreases in fair value charged to:
non-current assets held for
sale and discontinued operations
C.5 Negative exchange differences
41,345 - - 5,151
5,144 7,199
E. Gross closing balance 46,489 - - 12,350
Other intangible
assets: generated
internally
Other intangible
assets: others
Goodw
ill
Notes to the consolidated financial statements
78
Total
definite
duration
indefinite
duration
2011
9,356 - 55,845
6,109 8,253
3,247 - 47,592
3,539 3,539
3,526 3,526
13 13
1,635 4,635
1,600 4,600
1,600 1,600
3,000
3,000
35 35
5,151 - 46,496
7,199 12,343
12,350 - 58,839
Other intangible
assets: others

SECTION 14 - TAX ASSETS AND LIABILITIESliabilities)
14.1 Deferred tax assets: breakdown
Deferred tax assets relating to the insurance company amount to Euro 1,496thousand accounted for with a contra
a) against profit and loss
tax losses
goodw ill deductible for tax purposes
w ritedow ns of loans to customers deductible on a
straight-line basis
provisions for risks from implicit loan losses
w rite-dow n of loans to customers outstanding as at
31.12.1994
statutory depreciation of properties
statutory depreciation of tangible assets
provisions for guarantees and commitments/country
risk
provisions for personnel charges
provisions for legal disputes
provisions for revocatory actions
provision for sundry charges
tax provision for employee termination indemnities
entertainment expenses, w ithin the limit of one third
deductible in the follow ing four financial years
other general expenses deductible in the follow ing
accounting period
other
Total a)
b) against Equity
tax provision for employee termination indemnities
w ritedow n of securities classif ied AFS
w rite-dow n of equity investments
Total b)
Total
Temporary Differences
Notes to the consolidated financial
TAX ASSETS AND LIABILITIES (caption 140 under assets and caption 80 under
Deferred tax assets: breakdown
the insurance company amount to Euro 1,496 thousand,accounted for with a contra-entry in equity (a total of Euro 391 thousand last year
Total
31.12.2011
goodw ill deductible for tax purposes
w ritedow ns of loans to customers deductible on a
25,295 25,295
provisions for risks from implicit loan losses 305 305
w rite-dow n of loans to customers outstanding as at
9 9
statutory depreciation of properties
statutory depreciation of tangible assets 189 189
provisions for guarantees and commitments/country
364 364
2,928 2,928
1,581 1,581
924 924
137 137
tax provision for employee termination indemnities 304 304
entertainment expenses, w ithin the limit of one third
deductible in the follow ing four financial years
other general expenses deductible in the follow ing
35 35
13 13
32,084 - 32,084
tax provision for employee termination indemnities 564 564
w ritedow n of securities classif ied AFS 16,206 3,373 19,579
10 10
16,770 3,383 20,153
48,854 3,383 52,237
ires irap
Notes to the consolidated financial statements
79
under assets and caption 80 under
, of which Euro 1,495Euro 391 thousand last year).
Total
31.12.2011 31.12.2010
185
679
25,295 23,149
305 305
9 10
1
189 175
364 426
2,928 2,276
1,581 1,671
924 793
137 118
304 260
10
35 63
13 16
32,084 30,137
564 528
19,579 4,867
10 1
20,153 5,396
52,237 35,533

14.2 Deferred tax liabilities: breakdown
Deferred tax liabilities relating to the insurance company amount to Eurothousand is set-off in the Income Statement and Euro 205 thousand inlast year).
14.3 Change in deferred tax assets
a) against Profit and Loss
gains on disposal of tangible assets
tax amortization of properties
tax amortization of tangible assets
tax amortization of goodw ill
tax amortization on long-term charges (softw are)
tax provision ex art. 106, c. 3
tax provision for employee termination indemnities
other
Total a)
b) against Equity
revaluation of AFS securities
revaluation of equity investments
tax provision for employee termination indemnities
Total b)
Total
Temporary Differences
1. Initial amount
2. Increases
2.1 Deferred tax assets recognized during the year
a) from previous years
b) due to adoption of different accounting
c) value adjustments
d) other
2.2 New taxes or increases in fiscal rates
2.3 Other increases
3. Decreases
3.1 Deferred tax assets cancelled during the year
a) reallocation
b) due to adoption of different accounting
c) other
3.2 Decreases in fiscal rates
3.3 Other decreases
4. Final amount
Notes to the consolidated financial
Deferred tax liabilities: breakdown
Deferred tax liabilities relating to the insurance company amount to Euro 247 thousand, of which Eurooff in the Income Statement and Euro 205 thousand in Equity (a total of Euro 247 thousand also
Change in deferred tax assets (against profit and loss)
Total
31.12.2011
gains on disposal of tangible assets 20 20
7,062 1,106 8,168
1 24 25
672 136 808
tax amortization on long-term charges (softw are) 2 7 9
340 340
tax provision for employee termination indemnities 28 28
12 2 14
8,137 1,275 9,411
738 145 883
2 9 11
tax provision for employee termination indemnities 199 199
939 154 1,093
9,076 1,429 10,504
ires irap
1
31/12/2011 31/12/2010
30,137 27,336
6,742 6,898
2.1 Deferred tax assets recognized during the year 6,742 6,837
b) due to adoption of different accounting
6,742 6,657
2.2 New taxes or increases in fiscal rates
61
4,795 4,097
3.1 Deferred tax assets cancelled during the year 4,073 4,033
4,073 4,033
b) due to adoption of different accounting
722 64
32,084 30,137
Notes to the consolidated financial statements
80
thousand, of which Euro 42quity (a total of Euro 247 thousand also
Total
31.12.2011 31.12.2010
20 42
8,168 8,097
25 26
808 654
9 8
340 438
28 37
14 14
9,316
883 415
11 10
199 160
585
9,901

14.4 Change in deferred tax liabilities
14.5 Change in deferred tax asset
1. Initial amount
2. Increases2.1 Increases
2.1 Deferred tax assets recognized during the year
a) from previous years
b) due to adoption of different accounting
c) other
2.2 New taxes or increases in fiscal rates
2.3 Other increases
3. Decreases
3.1 Deferred tax assets cancelled during the year
a) reallocation
b) due to adoption of different accounting
standards
c) other
3.2 Decreases in fiscal rates
3.3 Other decreases
4. Final amount
1. Initial amount
2. Increases2. Increases
2.1 Deferred tax liabilities recognized during
the yeara) from previous years
b) due to adoption of different accounting
standardsc) other
2.2 New taxes or increases in fiscal
rates2.3 Other increases
3. Decreases
3.1 Deferred tax liabilities cancelled during
the yeara) reallocation
b) w rite-dow ns due to irrecoverability
c) due to adoption of different accounting
standardsd) other
3.2 Decreases in fiscal rates
3.3 Other decreases
4. Final amount
Notes to the consolidated financial
Change in deferred tax liabilities (against profit and loss)
deferred tax assets (against equity)
31.12.2011 31.12.2010
9,316 9,310
308 144
2.1 Deferred tax assets recognized during the year 141 144
b) due to adoption of different accounting 3
141 141
2.2 New taxes or increases in fiscal rates 167
213 138
3.1 Deferred tax assets cancelled during the year 213 138
213 138
b) due to adoption of different accounting
9,411 9,316
31.12.2011 31.12.2010
5,396 2,177
15,804 4,449
2.1 Deferred tax liabilities recognized during 15,721 4,446
b) due to adoption of different accounting
15,721 4,446
2.2 New taxes or increases in fiscal 83
3
1,047 1,230
3.1 Deferred tax liabilities cancelled during 1,047 1,230
1,047 1,230
b) w rite-dow ns due to irrecoverability
c) due to adoption of different accounting
20,153 5,396
Notes to the consolidated financial statements
81

14.6 Change in deferred tax liabilities
SECTION 15 - NON-CURRENT ASSETS AND DISCONTINUED OPERATIONS ANDLIABILITIES (caption 150
There were none at the reference date
1. Initial amount
2. Increases2. Increases
2.1 Deferred tax assets recognized during
the yeara) from previous years
b) due to adoption of different
accounting standardsc) other
2.2 New taxes or increases in fiscal rates
2.3 Other increases
3. Decreases
3.1 Deferred tax assets cancelled during the
year a) reallocation
b) due to adoption of different
accounting standardsc) other
3.2 Decreases in fiscal rates
3.3 Other decreases
4. Final amount
Notes to the consolidated financial
Change in deferred tax liabilities (against equity)
CURRENT ASSETS AND DISCONTINUED OPERATIONS ANDcaption 150 under assets and caption 90 under liabilities)
There were none at the reference date.
31.12.2011 31.12.2010
585 2,453
687 195
2.1 Deferred tax assets recognized during 685 193
b) due to adoption of different 4
685 189
2.2 New taxes or increases in fiscal rates 2
2
179 2,063
3.1 Deferred tax assets cancelled during the 179 2,063
179 2,062
b) due to adoption of different
1
1,093 585
Notes to the consolidated financial statements
82
CURRENT ASSETS AND DISCONTINUED OPERATIONS AND ASSOCIATED
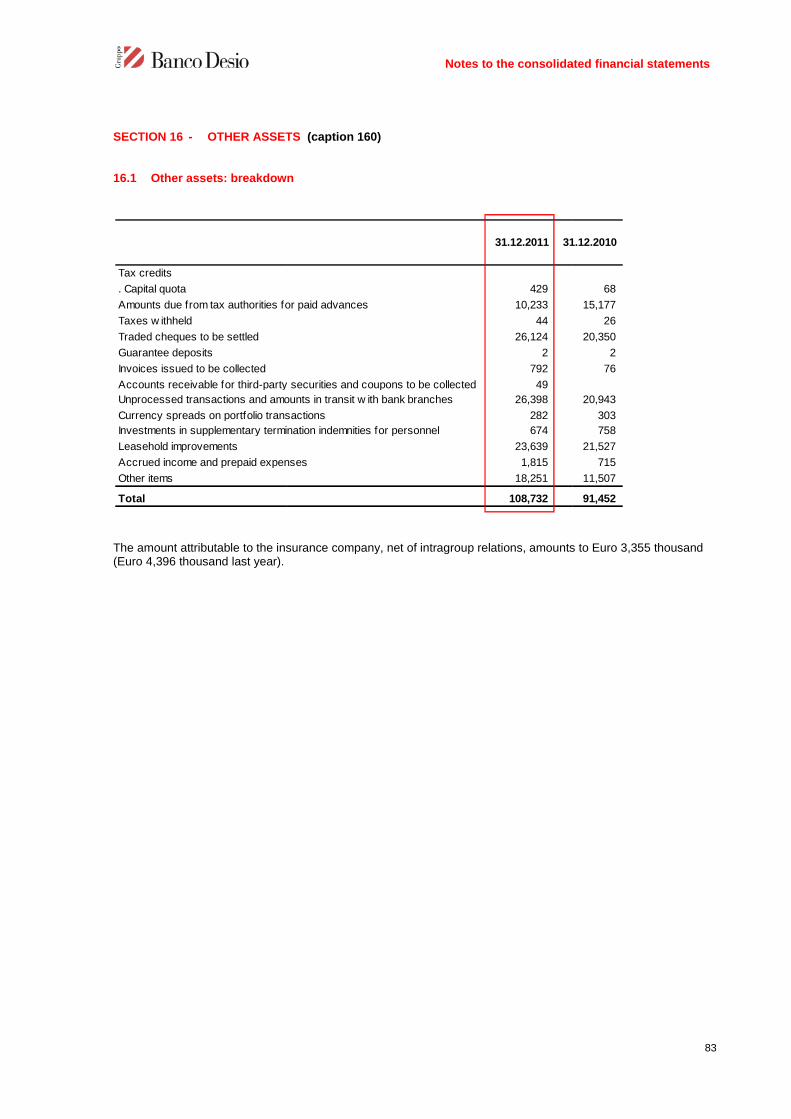
SECTION 16 - OTHER ASSETS
16.1 Other assets: breakdown
The amount attributable to the insurance company,(Euro 4,396 thousand last year).
Tax credits
. Capital quota
Amounts due from tax authorities for paid advances
Taxes w ithheld
Traded cheques to be settled
Guarantee deposits
Invoices issued to be collected
Accounts receivable for third-party securities and coupons to be collected
Unprocessed transactions and amounts in transit w ith bank branches
Currency spreads on portfolio transactions
Investments in supplementary termination indemnities for personnel
Leasehold improvements
Accrued income and prepaid expenses
Other items
Total
Notes to the consolidated financial
OTHER ASSETS (caption 160)
Other assets: breakdown
The amount attributable to the insurance company, net of intragroup relations, amounts to Euro 3,
31.12.2011 31.12.2010
429
Amounts due from tax authorities for paid advances 10,233
44
26,124
2
792
Accounts receivable for third-party securities and coupons to be collected 49
Unprocessed transactions and amounts in transit w ith bank branches 26,398
Currency spreads on portfolio transactions 282
Investments in supplementary termination indemnities for personnel 674
23,639
Accrued income and prepaid expenses 1,815
18,251
108,732
Notes to the consolidated financial statements
83
net of intragroup relations, amounts to Euro 3,355 thousand
31.12.2010
68
15,177
26
20,350
2
76
20,943
303
758
21,527
715
11,507
91,452

LIABILITIES
SECTION 1 - AMOUNTS DUE TO BANKS
1.1 Amounts due to banks: breakdown by type
1.2 Breakdown of caption 10 “
There were no subordinated debts due to banks at the reference date
1.3 Breakdown of caption 10 “Amounts due to banks
There were no structured debts due to banks at the reference date
1.4 Amounts due to banks subject to specific hedging
There were no amounts due to banks subject to specific hedging at the reference date
1.5 Amounts due for finance leases
There were no finance lease contracts in place
Transaction type / Amount
1. Amounts due to Central Banks
2. Amounts due to banks
2.1 Current accounts and unrestricted deposits
2.2 Restricted deposits
2.3. Financing
2.3.1 Reverse repos
2.3.2 Other
2.4 Commitments for repurchases of ow n equity instruments
2.5 Other amounts due
Total
Fair value
Notes to the consolidated financial statements
AMOUNTS DUE TO BANKS (caption 10)
Amounts due to banks: breakdown by type
10 “Amounts due to banks”: subordinated debts
no subordinated debts due to banks at the reference date.
10 “Amounts due to banks”: structured debts
There were no structured debts due to banks at the reference date.
Amounts due to banks subject to specific hedging
no amounts due to banks subject to specific hedging at the reference date.
Amounts due for finance leases
There were no finance lease contracts in place with banks at the reference date.
Transaction type / Amount 31.12.2011 31.12.2010
1. Amounts due to Central Banks 200,051
67,947 171,918
2.1 Current accounts and unrestricted deposits 11,227 13,331
26,349 16,602
29,271 140,769
29,271 140,769
2.4 Commitments for repurchases of ow n equity instruments
1,100 1,216
267,998 171,918
267,998 171,918
Notes to the consolidated financial statements
84
.

SECTION 2 - AMOUNTS DUE TO CUSTOMERS
2.1 Amounts due to customers: breakdown by type
2.2 Breakdown of caption 20 “Amounts due to customers
There were no subordinated debts due to customers at the reference date
2.3 Breakdown of caption 20 “Amounts due to customers:
There were no structured debts due to customers at the reference date
2.4 Amounts due to customers subject to specific hedging
There were no amounts due to customers in connection with finance leases
Transaction type/Amount
1. Current accounts and unrestricted
deposits
2. Restricted deposits
3. Financing
3.1 Reverse repos
3.2 other
5. Other amounts due
Total
Fair value
Notes to the consolidated financial statements
AMOUNTS DUE TO CUSTOMERS (caption 20)
Amounts due to customers: breakdown by type
20 “Amounts due to customers: subordinated debts
There were no subordinated debts due to customers at the reference date.
20 “Amounts due to customers: structured debts”
There were no structured debts due to customers at the reference date.
Amounts due to customers subject to specific hedging
There were no amounts due to customers in connection with finance leases at the reference date
31.12.2011 31.12.2010
1. Current accounts and unrestricted
4,147,184 4,367,104
135,685 1,721
35,374 68,009
11,514 19,618
23,860 48,391
29,463 22,765
4,347,706 4,459,599
4,347,706 4,459,599
Notes to the consolidated financial statements
85
subordinated debts
at the reference date.
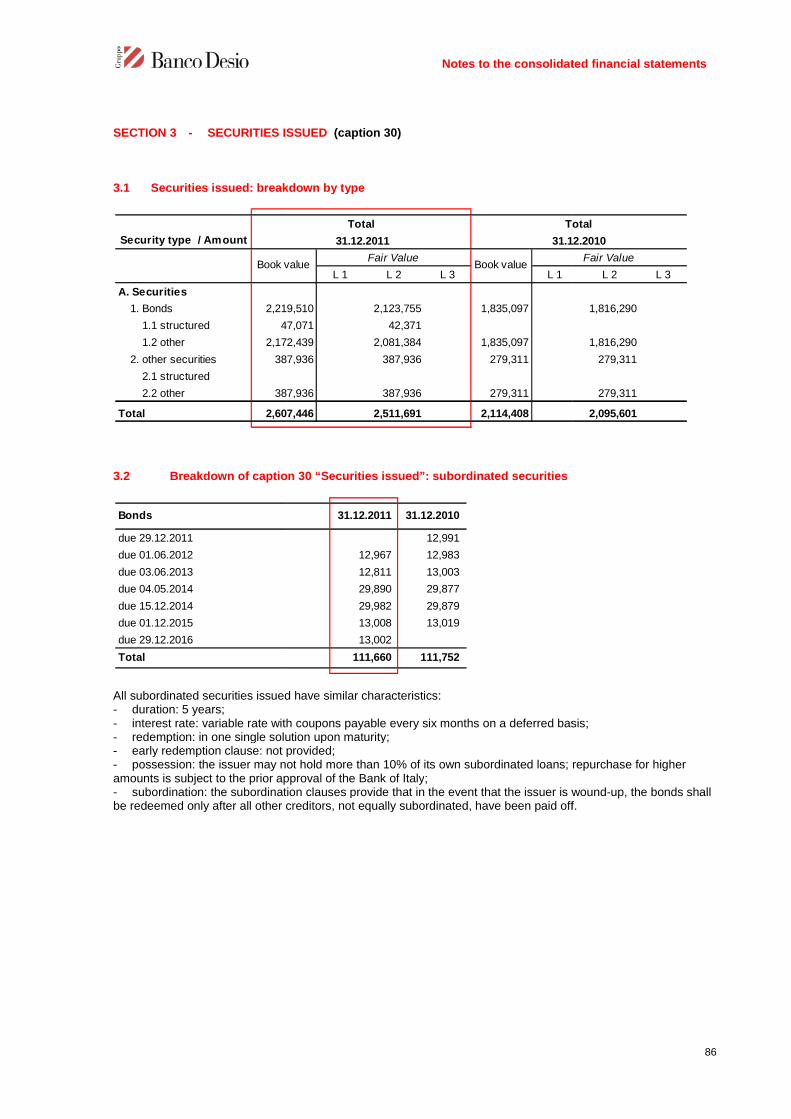
SECTION 3 - SECURITIES ISSUED
3.1 Securities issued: breakdown by type
3.2 Breakdown of caption 30 “Securities issued”: subordinated securities
All subordinated securities issued have similar characteristics- duration: 5 years;- interest rate: variable rate with coupons payable every six months on a deferred basis- redemption: in one single solution upon maturity- early redemption clause: not provided- possession: the issuer may not hold more than 10% of its own subordinaamounts is subject to the prior approval of the Bank of Italy- subordination: the subordination clauses provide that in the event that the issuer is woundbe redeemed only after all other creditors,
Security type / Amount
A. Securities
1. Bonds 2,219,510
1.1 structured 47,071
1.2 other 2,172,439
2. other securities 387,936
2.1 structured
2.2 other 387,936
Total 2,607,446
Book value
Bonds
due 29.12.2011
due 01.06.2012
due 03.06.2013
due 04.05.2014
due 15.12.2014
due 01.12.2015
due 29.12.2016
Total
Notes to the consolidated financial statements
SECURITIES ISSUED (caption 30)
Securities issued: breakdown by type
Breakdown of caption 30 “Securities issued”: subordinated securities
All subordinated securities issued have similar characteristics:
interest rate: variable rate with coupons payable every six months on a deferred basisredemption: in one single solution upon maturity;early redemption clause: not provided;possession: the issuer may not hold more than 10% of its own subordinated loans; repurchase for higher
amounts is subject to the prior approval of the Bank of Italy;subordination: the subordination clauses provide that in the event that the issuer is wound
be redeemed only after all other creditors, not equally subordinated, have been paid off
L 1 L 2 L 3 L 1
2,219,510 2,123,755 1,835,097
47,071 42,371
2,172,439 2,081,384 1,835,097
387,936 387,936 279,311
387,936 387,936 279,311
2,607,446 2,511,691 2,114,408
Book valueFair Value
Book value
Total Total
31.12.2011 31.12.2010
31.12.2011 31.12.2010
12,991
12,967 12,983
12,811 13,003
29,890 29,877
29,982 29,879
13,008 13,019
13,002
111,660 111,752
Notes to the consolidated financial statements
86
interest rate: variable rate with coupons payable every six months on a deferred basis;
ted loans; repurchase for higher
subordination: the subordination clauses provide that in the event that the issuer is wound-up, the bonds shallnot equally subordinated, have been paid off.
L 2 L 3
1,816,290
1,816,290
279,311
279,311
2,095,601
Fair Value
Total
31.12.2010

3.3 Breakdown of caption 30 “Securities issued”: securities subject to specific hedging
SECTION 4 - FINANCIAL LIABILITIES HELD FOR TRADING
4.1 Financial liabilities held for trading:
LegendNV = nominal or notional valueFV* = fair value calculated excluding variations due to the changed rating of the issuer with respect to the issue date
1. Debt securities subject to fair
value hedging
a) interest rate risk
b) exchange rate risk
c) other risks
2. Debt securities subject to cash
flow hedging
a) interest rate risk
b) exchange rate risk
c) other risks
A . Liabilit ies fo r cash
1. Amounts due to banks
2. Amounts due to customers
3. Debt securities
3.1Bonds
3.1.1Structured
3.1.2 Other bonds
3.2 Other securities
3.2.1Structured
3.2.2 Other
T o ta l A
B . D erivat ives instruments
1. Financial derivatives
1.1Trading
1.2 Connected with the fair value
option
1.3 Other
2. Credit derivatives
2.1Trading
2.2 Connected with the fair value
option
2.3 Other
T o ta l B
T o ta l (A +B )
NominalTransaction type / Values
Notes to the consolidated financial statements
Breakdown of caption 30 “Securities issued”: securities subject to specific hedging
FINANCIAL LIABILITIES HELD FOR TRADING (caption 40)
Financial liabilities held for trading: breakdown by type
nominal or notional valuefair value calculated excluding variations due to the changed rating of the issuer with respect to the issue date
31.12.2011 31.12.2010
1. Debt securities subject to fair
222,675 59,375
222,675 59,375
2. Debt securities subject to cash
FV*
Level 1 Level 2 Level 3 Level 1 Level 2
15 13 2,409 65
15 13 2,409 65
1,905
1,905
15 13 4,314 65
15 13 4,314 65
Nominal
value
Fair valueFV
Fair value
31.12.2011 31.12.2010
Notes to the consolidated financial statements
87
Breakdown of caption 30 “Securities issued”: securities subject to specific hedging
fair value calculated excluding variations due to the changed rating of the issuer with respect to the issue date
FV*
Level 2 Level 3
7 6,116
7 5,464
652
469
469
7 6,585
7 6,585
Fair value
31.12.2010
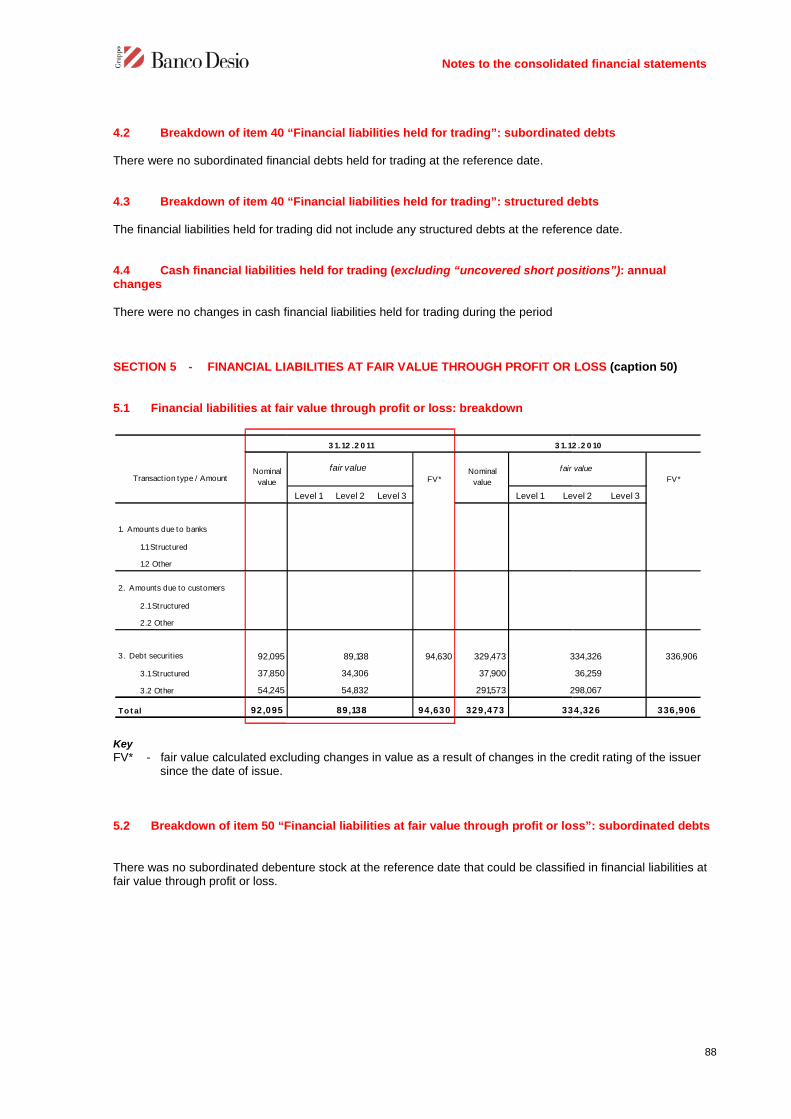
4.2 Breakdown of item 40 “
There were no subordinated financial debts held for trading at the reference date
4.3 Breakdown of item 40 “Financial liabilities held for trading”: structured debts
The financial liabilities held for trading did not include any
4.4 Cash financial liabilitieschanges
There were no changes in cash financial liabilities
SECTION 5 - FINANCIAL LIABILITIES AT FAIR VALUE THROUGH PROFIT OR LOSS
5.1 Financial liabilities at fair value through profit or loss: breakdown
Key
FV* - fair value calculated excluding changes in value as a result of changes in the creditsince the date of issue.
5.2 Breakdown of item 50 “Financial liabilities at
There was no subordinated debenture stock at the reference date that could be classified infair value through profit or loss.
Transact ion type / Amount
1. Amounts due to banks
1.1Structured
1.2 Other
2. Amounts due to customers
2.1Structured
2.2 Other
3. Debt securit ies 92,095
3.1Structured 37,850
3.2 Other 54,245
To t al 92,095
Nominal
value
Notes to the consolidated financial statements
40 “Financial liabilities held for trading”: subordinated debts
There were no subordinated financial debts held for trading at the reference date.
Breakdown of item 40 “Financial liabilities held for trading”: structured debts
The financial liabilities held for trading did not include any structured debts at the reference date
inancial liabilities held for trading (excluding “uncovered short positions
financial liabilities held for trading during the period
FINANCIAL LIABILITIES AT FAIR VALUE THROUGH PROFIT OR LOSS
Financial liabilities at fair value through profit or loss: breakdown
ulated excluding changes in value as a result of changes in the credit
Breakdown of item 50 “Financial liabilities at fair value through profit or loss
There was no subordinated debenture stock at the reference date that could be classified in
FV*
Level 1 Level 2 Level 3 Level 1 Level 2
89,138 94,630 329,473 334,326
34,306 37,900
54,832 291,573 298,067
89,138 94,630 329,473 334,326
3 1.12 .2 0 11 3 1.12 .2 0 10
fair value Nominal
value
fair value
Notes to the consolidated financial statements
88
subordinated debts
Breakdown of item 40 “Financial liabilities held for trading”: structured debts
structured debts at the reference date.
uncovered short positions”): annual
FINANCIAL LIABILITIES AT FAIR VALUE THROUGH PROFIT OR LOSS (caption 50)
ulated excluding changes in value as a result of changes in the credit rating of the issuer
through profit or loss”: subordinated debts
There was no subordinated debenture stock at the reference date that could be classified in financial liabilities at
FV*
Level 2 Level 3
334,326 336,906
36,259
298,067
334,326 336,906
3 1.12 .2 0 10
fair value

5.3 Financial liabilities at fair value through profit or loss: annual changes
The item B2 “Sales” is the equivalent value for reissuing debentures previously repurchased
The items B3 “Increases in fair valuerespectively, deriving from the changes in valuations of fair value accounted for in the income statement
SECTION 6 - HEDGING DERIVATIVES
6.1 Hedging derivatives: breakdown by type of hedging and by level
A. Opening balance
B. Increases
B1. Issues
B2. Sales
B3. Increases in fair value
B4. Other increases
C. Decreases
C1. Purchases
C2. Redemptions
C3. Decreases in fair value
C4. Other decreases
D. Closing balance
L1
A . F inancia l derivates
1) Fair value
2) Cash flows
3) Foreign investments
B . C redit derivat ives
1) Fair value
2) Cash flows
T o ta l
Notes to the consolidated financial statements
Financial liabilities at fair value through profit or loss: annual changes
is the equivalent value for reissuing debentures previously repurchased
Increases in fair value” and C3 “Decreases in fair value” represent the charges and the proceeds,respectively, deriving from the changes in valuations of fair value accounted for in the income statement
HEDGING DERIVATIVES (caption 60)
Hedging derivatives: breakdown by type of hedging and by level
Amounts
due to banks
Amounts
due to
customers
Securities
issuedTotal
334,326 334,326
8,616 8,616
7,178 7,178
1,438 1,438
253,804 253,804
9,537 9,537
235,856 235,856
3,266 3,266
5,145 5,145
89,138 89,138
L1 L2 L3 L1 L2 L3
2,684 15,000 2,653
2,684 15,000 2,653
2,684 15,000 2,653
fair value fair value
31.12.2011
NV
31.12.2010
Notes to the consolidated financial statements
89
is the equivalent value for reissuing debentures previously repurchased.
represent the charges and the proceeds,respectively, deriving from the changes in valuations of fair value accounted for in the income statement.
2,653 79,617
2,653 79,617
2,653 79,617
NV
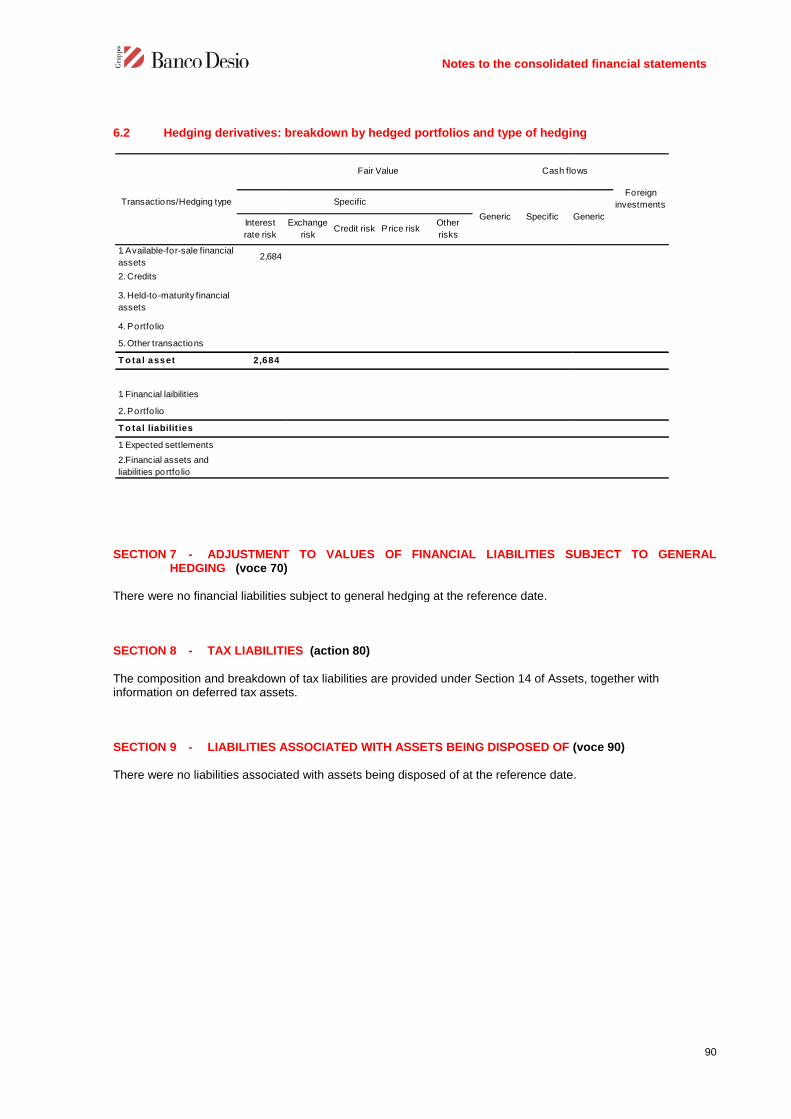
6.2 Hedging derivatives: breakdown by hedged portfolios and type of hedging
SECTION 7 - ADJUSTMENTHEDGING (voce 70)
There were no financial liabilities subject to general hedging at the reference date
SECTION 8 - TAX LIABILITIES
The composition and breakdown of tax liabilities areinformation on deferred tax assets
SECTION 9 - LIABILITIES ASSOCIATED WITH ASSETS
There were no liabilities associated with assets
Transactions/Hedging type
Interest
rate risk
1. Available-for-sale financial
assets2,684
2. Credits
3. Held-to-maturity financial
assets
4. Portfo lio
5. Other transactions
T o tal asset 2,684
1. Financial laibilities
2. Portfo lio
T o tal liabilit ies
1. Expected settlements
2.Financial assets and
liabilities portfo lio
Notes to the consolidated financial statements
Hedging derivatives: breakdown by hedged portfolios and type of hedging
JUSTMENT TO VALUES OF FINANCIAL LIABILITIES SUBJECT TO GENERAL0)
There were no financial liabilities subject to general hedging at the reference date.
TAX LIABILITIES (action 80)
The composition and breakdown of tax liabilities are provided under Section 14 of Assets, together withinformation on deferred tax assets.
LIABILITIES ASSOCIATED WITH ASSETS BEING DISPOSED OF
There were no liabilities associated with assets being disposed of at the reference date
Specific
Exchange
riskCredit risk Price risk
Other
risks
Fair Value Cash flows
Generic Specific
Notes to the consolidated financial statements
90
Hedging derivatives: breakdown by hedged portfolios and type of hedging
OF FINANCIAL LIABILITIES SUBJECT TO GENERAL
provided under Section 14 of Assets, together with
BEING DISPOSED OF (voce 90)
at the reference date.
Cash flows
Foreign
investments
Generic

SECTION 10 - OTHER LIABILITIES
10.1 Other liabilities: breakdown
The component attributable to the insurance company, net of intergroup relations, amounts to Eurothousand (Euro 5,819 thousand last year).
SECTION 11 - PROVISIONS FOR EMPLOYEE TERMINATION INDEMNITIES
11.1 Provisions for employee termination indemnities: annual changes
The year-end balance includes the amounts pertaining to the insurance company equal to Euro(Euro 89 thousand last year).
Description
Due to tax authorities
Amounts due to tax authorities on account of third parties
Social security contributions to be reversed
Due to shareholders on account of dividends
Suppliers
Amounts available for customers
Interest and fees to be credited
Payments against disposals on bills
Advance payments on expiring loans
Unprocessed transactions and amounts in transit w ith
branches
Currency spreads on portfolio transactions
Amounts due to personnel
Other accounts payable
Provisions for guarantees and commitments
Accrued liabilities and deferred income
Total
A. Opening balance
B. Increases
B.1 Provisions during the year
B.2 Other increases
C. Decreases
C.1 Amounts paid
C.2 Other decreases
D. Closing balance
Notes to the consolidated financial statements
OTHER LIABILITIES (CAPTION 100)
Other liabilities: breakdown
The component attributable to the insurance company, net of intergroup relations, amounts to Eurothousand last year).
PROVISIONS FOR EMPLOYEE TERMINATION INDEMNITIES (caption
Provisions for employee termination indemnities: annual changes
end balance includes the amounts pertaining to the insurance company equal to Euro
31.12.2011 31.12.2010
1,736 1,778
Amounts due to tax authorities on account of third parties 18,576 17,115
Social security contributions to be reversed 5,116 5,147
Due to shareholders on account of dividends 15 14
14,636 13,200
10,353 8,722
206 460
Payments against disposals on bills 756 468
Advance payments on expiring loans 281 413
Unprocessed transactions and amounts in transit w ith
11,337 13,213
Currency spreads on portfolio transactions 6,934 55,928
2,948 3,280
66,890 40,285
Provisions for guarantees and commitments 1,325 1,544
Accrued liabilities and deferred income 2,407 3,204
143,516 174,893
31.12.2011 31.12.2010
24,378 25,696
1,319 1,352
B.1 Provisions during the year 1,312 1,343
7 9
1,977 2,670
1,786 2,498
191 172
23,720 24,378
Notes to the consolidated financial statements
91
The component attributable to the insurance company, net of intergroup relations, amounts to Euro 7,255
(caption 110)
end balance includes the amounts pertaining to the insurance company equal to Euro 135 thousand
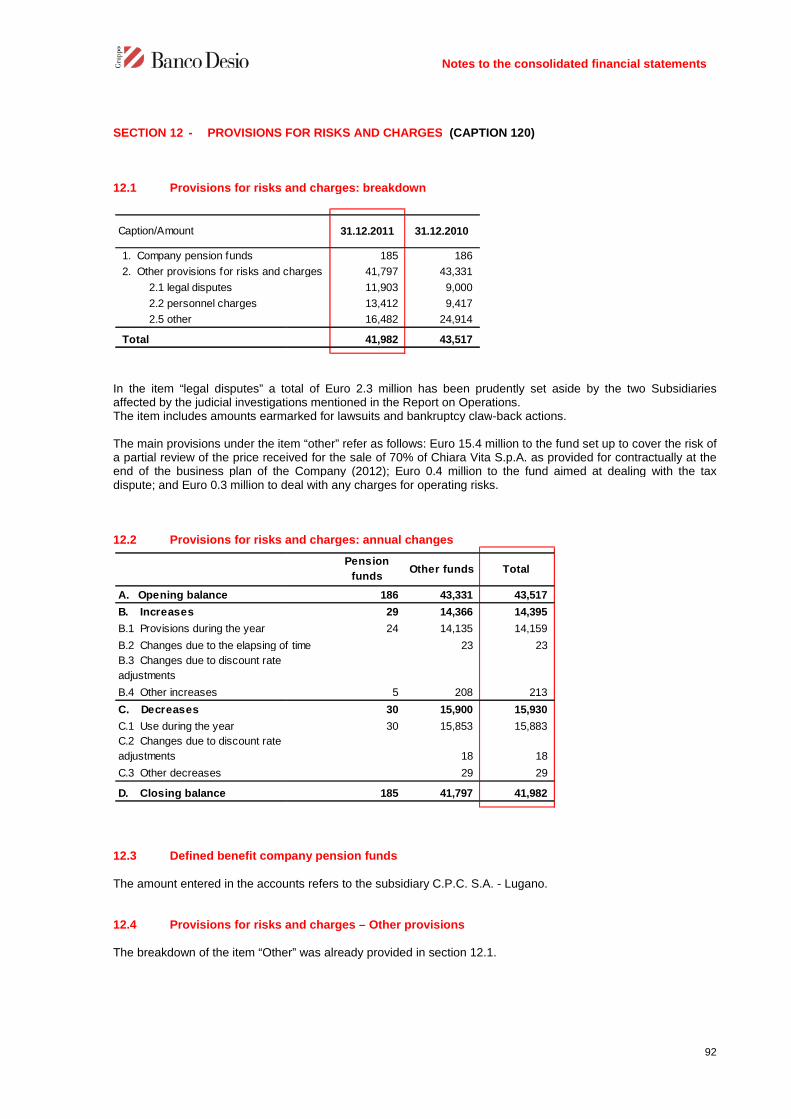
SECTION 12 - PROVISIONS FOR RISKS AND CHARGES
12.1 Provisions for risks and charges: breakdown
In the item “legal disputes” a total of Euro 2.3 millionaffected by the judicial investigations mentioned in the Report on Operations.The item includes amounts earmarked for lawsuits and bankruptcy claw
The main provisions under the item “other” refer as follows: Euro 15.4 million to the fund set upa partial review of the price received for the sale of 70end of the business plan of the Company (2012); Euro 0.4 million to the fund aimed at dealing with the taxdispute; and Euro 0.3 million to deal with a
12.2 Provisions for risks and charges: annual changes
12.3 Defined benefit company pension funds
The amount entered in the accounts refers to the subsidiary C.P.C. S.A.
12.4 Provisions for risks and charges
The breakdown of the item “Other
Caption/Amount
1. Company pension funds
2. Other provisions for risks and charges
2.1 legal disputes
2.2 personnel charges
2.5 other
Total
A. Opening balance
B. Increases
B.1 Provisions during the year
B.2 Changes due to the elapsing of time
B.3 Changes due to discount rate
adjustments
B.4 Other increases
C. Decreases
C.1 Use during the year
C.2 Changes due to discount rate
adjustments
C.3 Other decreases
D. Closing balance
Notes to the consolidated financial statements
PROVISIONS FOR RISKS AND CHARGES (CAPTION 120)
Provisions for risks and charges: breakdown
a total of Euro 2.3 million has been prudently set aside by the two Subsidiariesaffected by the judicial investigations mentioned in the Report on Operations.The item includes amounts earmarked for lawsuits and bankruptcy claw-back actions.
The main provisions under the item “other” refer as follows: Euro 15.4 million to the fund set upof the price received for the sale of 70% of Chiara Vita S.p.A. as provided for
end of the business plan of the Company (2012); Euro 0.4 million to the fund aimed at dealing with the taxEuro 0.3 million to deal with any charges for operating risks.
Provisions for risks and charges: annual changes
Defined benefit company pension funds
The amount entered in the accounts refers to the subsidiary C.P.C. S.A. - Lugano.
Provisions for risks and charges – Other provisions
Other” was already provided in section 12.1.
31.12.2011 31.12.2010
185 186
2. Other provisions for risks and charges 41,797 43,331
11,903 9,000
13,412 9,417
16,482 24,914
41,982 43,517
Pension
fundsOther funds Total
186 43,331 43,517
29 14,366 14,395
24 14,135 14,159
B.2 Changes due to the elapsing of time 23 23
5 208 213
30 15,900 15,930
30 15,853 15,883
18 18
29 29
185 41,797 41,982
Notes to the consolidated financial statements
92
been prudently set aside by the two Subsidiaries
The main provisions under the item “other” refer as follows: Euro 15.4 million to the fund set up to cover the risk ofprovided for contractually at the
end of the business plan of the Company (2012); Euro 0.4 million to the fund aimed at dealing with the tax

SECTION 13 - TECHNICAL RESERVES
13.1 Technical reserves: breakdown
13.2 Technical reserves: annual changes
SECTION 14 - REDEEMABLE SHARES
There were no redeemable shares at the reference date
A. Non-Life branch
A.1 premiums reserves
A.2 claims reserves
A.3 other reserves
B. Life branch
B.1 mathematical reserves
B.2 reserves for amounts to be disbursed
B.3 other reserves
C. Technical reserves for
investment risks to be borne by
the insurers
C.1 reserves for contracts w ith
disbursements connected w ith
investment funds and market indices
C.2 reserves from pension fund
management
D. Total technical insurance
reserves
A. Opening balance
B. Increases
B.1 Provisions during the year
B.2 Other increases
C. Decreases
C.1 Use in the period
C.2 Other decreases
D. Closing balance
Notes to the consolidated financial statements
TECHNICAL RESERVES (caption 130)
Technical reserves: breakdown
Technical reserves: annual changes
REDEEMABLE SHARES (caption 150)
There were no redeemable shares at the reference date.
Direct work Indirect work 31.12.2011
38,539 38,539
30,153 30,153
7,910
476
B.2 reserves for amounts to be disbursed
investment risks to be borne by
C.1 reserves for contracts w ith
investment funds and market indices
C.2 reserves from pension fund
38,539 38,539
Direct work Indirect work Total 2011
29,980
8,559
B.1 Provisions during the year 8,559
38,539
Notes to the consolidated financial statements
93
31.12.2011 31.12.2010
38,539 29,980
30,153 23,565
7,910 6,040
476 375
38,539 29,980
Total 2011
29,980
8,559
8,559
38,539

SECTION 15 - GROUP’S SHAREHOLDERS’
15.1 “Share capital” and “Treasury shares”: breakdown
The share capital of the Parent Company Banco Desio, fully subscribed and paid up, is made up of. no. 117,000,000 ordinary shares, with a nominal value of Euro 0.52 each. no. 13,202,000 savings shares, with a nominal value of Euro 0.52
No Group company holds or has been in possession of its own shares at any time during the accounting period
15.2 Capital – Number of Parent Company shares: annual changes
A. Share capital
B. Treasury shares
Total
Caption/Type
A. Number of shares at the beginning of the year
- fully paid-up shares
- shares not fully paid up
A.1 Treasury shares (-)
A.2 Shares in circulation: opening balance
B. Increases
B.1 New issues
- on a payment basis:
- business combinations
- conversion of bonds
- exercise of w arrants
- other
- on a free basis:
- in favor of employees
- in favor of directors
- other
B.2 Sale of treasury shares
B.3 Other changes
C. Decreases
C.1 Cancellation
C.2 Purchase of treasury shares
C.3 Sale of companies
C.4 Other changes
D. Shares in circulation: closing balance
D.1 Treasury shares (+)
D.2 Number of shares at the end of the year
- fully paid-up shares
- shares not fully paid up
Notes to the consolidated financial statements
GROUP’S SHAREHOLDERS’ EQUITY (captions 140, 160, 170, 180, 190, 200 and
“Share capital” and “Treasury shares”: breakdown
The share capital of the Parent Company Banco Desio, fully subscribed and paid up, is made up of117,000,000 ordinary shares, with a nominal value of Euro 0.52 each;
no. 13,202,000 savings shares, with a nominal value of Euro 0.52.
No Group company holds or has been in possession of its own shares at any time during the accounting period
Number of Parent Company shares: annual changes
31.12.2011 31.12.2010
67,705 67,705
67,705 67,705
Ordinary Other
A. Number of shares at the beginning of the year 117,000,000 13,202,000
117,000,000 13,202,000
A.2 Shares in circulation: opening balance 117,000,000 13,202,000
- business combinations
- conversion of bonds
- exercise of w arrants
- in favor of employees
D. Shares in circulation: closing balance 117,000,000 13,202,000
D.2 Number of shares at the end of the year 117,000,000 13,202,000
117,000,000 13,202,000
- shares not fully paid up
Notes to the consolidated financial statements
94
(captions 140, 160, 170, 180, 190, 200 and 220)
The share capital of the Parent Company Banco Desio, fully subscribed and paid up, is made up of:
No Group company holds or has been in possession of its own shares at any time during the accounting period
Other
13,202,000
13,202,000
13,202,000
13,202,000
13,202,000
13,202,000

15.3 Capital: other information
There is no other information to report at the reference date
15.4 Revenue reserves: other information
SECTION 16 - MINORITY INTERESTS
16.1 Shareholders’ equity attributable to minority interests: breakdown
Caption
Legal reserve
Statutory reserves
Profits (losses) carried forw ard
First Time Adoption (F.T.A.) reserves
Other reserves
Total
Captions/Amount
1. Shareholders' equity
2. Share premium reserve
3. Reserves
4. Treasury shares
5. Revaluation reserves
6. Equity instruments
7. Profit (loss) for the period attributable to
minority interests
Total
Notes to the consolidated financial statements
other information
There is no other information to report at the reference date.
Revenue reserves: other information
MINORITY INTERESTS (caption 210)
Shareholders’ equity attributable to minority interests: breakdown
31.12.2011 31.12.2010
75,019 70,109
435,821 405,585
23,571 23,571
First Time Adoption (F.T.A.) reserves 99,785 99,785
22,514 29,975
656,710 629,025
Banking
Group
Insurance
company31.12.2011 31.12.2010
100 3,137 3,237 3,438
210 210 158
30 913 943 697
(899) (899) (147)
7. Profit (loss) for the period attributable to
116 833 949 849
246 4,194 4,440 4,995
Notes to the consolidated financial statements
95
31.12.2010
3,438
158
697
(147)
849
4,995

OTHER INFORMATION
Guarantees granted and commitments
Assets lodged to guarantee own liabilities and commitments
Transactions
1) Financial guarantees granted
a) Banks
b) Customers
2) Commercial guarantees granted
a) Banks
b) Customers
3) Irrevocable commitments to grant f inance
a) Banks
i) certain to be called on
ii) not certain to be called on
b) Customers
i) certain to be called on
ii) not certain to be called on
4) Underlying commitments to credit
derivatives: hedging sales
5) Assets lodged to guarantee minority
interest6) Other commitments
Total
Portfolios
1. Financial assets held for trading
2. Financial assets at fair value through
profit or loss
3. Available-for-sale financial assets
4. Held-to-maturity f inancial assets
5. Amounts due from banks
6. Amounts due from customers
7. Tangible assets
Notes to the consolidated financial statements
Guarantees granted and commitments
Assets lodged to guarantee own liabilities and commitments
31.12.2011 31.12.2010
45,000 64,069
33,934 50,061
11,066 14,008
2) Commercial guarantees granted 209,890 213,836
3,840 3,464
206,050 210,372
3) Irrevocable commitments to grant f inance 159,215 206,700
7,818 3,959
i) certain to be called on 7,224 3,959
ii) not certain to be called on 594 -
151,397 202,741
i) certain to be called on 12,719 15,768
ii) not certain to be called on 138,678 186,973
4) Underlying commitments to credit25,000 25,000
5) Assets lodged to guarantee minority 1,521 1,547
440,626 511,152
31.12.2011 31.12.2010
6,049 352
2. Financial assets at fair value through
3. Available-for-sale financial assets 329,669 261,432
4. Held-to-maturity f inancial assets 10,115 43,451
19,162
Notes to the consolidated financial statements
96

5 Administration and dealing on behalf of third parties
Type of services
1. Execution of orders on behalf of customers
a) purchase
1. settled
2. not settled
b) sale
1. settled
2. not settled
2. Portfolio management
a) individual
b) collective
3. Custody and administration of securities
a) Third-party securities held on deposit in connection
w ith depositary bank's services (excluding portfolio
management)
1. securities issued by the bank preparing the accounts
2. other securities
b) other third-party securities held on deposit
(excluding portfolio management): other
1. securities issued by the bank preparing the accounts
2. other securities
c) third-party securities deposited w ith third parties
d) ow n securities deposited w ith third parties
4. Other transactions
Notes to the consolidated financial statements
dealing on behalf of third parties
Amount
1. Execution of orders on behalf of customers 817,544
404,925
402,053
2,872
412,619
409,702
2,917
1,037,971
463,595
574,376
3. Custody and administration of securities 10,565,995
a) Third-party securities held on deposit in connection
w ith depositary bank's services (excluding portfolio
1. securities issued by the bank preparing the accounts
b) other third-party securities held on deposit
(excluding portfolio management): other 9,458,140
1. securities issued by the bank preparing the accounts2,495,037
6,963,103
c) third-party securities deposited w ith third parties 9,195,611
d) ow n securities deposited w ith third parties 1,107,855
-
Notes to the consolidated financial statements
97

Part C - INFORMATION ON THE CONSOLIDATED INCOME STATEMENT
SECTION 1 - INTEREST (caption
Interest income and similar revenues: breakdown
Interest income pertaining to the insurance company, net of the intergroup component, amounts1,247 thousand (Euro 847 thousand last year)
1.2 Interest income and similar revenues: differentials on hedging transactions
1.3 Interest income and similar revenues: other information
1.3.1 Interest income on foreign currency
Interest income on currency financial assets accounted for under “Interest income and similar revenues” as at theyear-end amounts to Euro 1.2 millionthousand on amounts due from customer
1.3.2 Interest income on finance lease transactions
The total interest income recognised as revenues for the period and which are entered under “Amounts due fromcustomers - loans”, amount to Euroindexed contracts, of which Euro 0.9 million relating to leaseback agreements (ininterest on indexed contracts, of which
1. Financial assets held for trading
2. Available-for-sale financial assets
3. Held-to-maturity investments
4. Amounts due from banks
5. Amounts due from customers
6. Financial assets at fair value through
profit or loss7. Hedging derivatives
8. Other assets
Total
Caption/Technical forms
Caption
A. Positive differentials on hedging
transactions
B. Negative differentials on hedging
transactions
C. Balance (A-B)
Notes to the consolidated financial statements
INFORMATION ON THE CONSOLIDATED INCOME STATEMENT
(caption 10 and 20)
Interest income and similar revenues: breakdown
Interest income pertaining to the insurance company, net of the intergroup component, amountsthousand last year)
Interest income and similar revenues: differentials on hedging transactions
Interest income and similar revenues: other information
Interest income on foreign currency financial assets
Interest income on currency financial assets accounted for under “Interest income and similar revenues” as at themillion, of which Euro 558 thousand on amounts due from banks
due from customers (a total of Euro 0.7 million in the previous financial year
Interest income on finance lease transactions
The total interest income recognised as revenues for the period and which are entered under “Amounts due fromloans”, amount to Euro 20.0 million (Euro 17.3 million last year); of which Euro
Euro 0.9 million relating to leaseback agreements (in 2010interest on indexed contracts, of which Euro 0.9 million relating to leaseback agreements
1. Financial assets held for trading226 5,351 5,577
2. Available-for-sale financial assets22,543 22,543
4,789 4,789
902 2,999 107 4,008
1,396 267,399 268,795
6. Financial assets at fair value through
1,532 1,532
67
29,856 270,398 7,057 307,311
Debt
securitiesLoans
Other
transaction
s
31.12.2011
31.12.2011 31.12.2010
A. Positive differentials on hedging
5,416 761
B. Negative differentials on hedging
(3,884) (732)
1,532 29
Notes to the consolidated financial statements
98
INFORMATION ON THE CONSOLIDATED INCOME STATEMENT
Interest income pertaining to the insurance company, net of the intergroup component, amounts to a total of Euro
Interest income and similar revenues: differentials on hedging transactions
Interest income on currency financial assets accounted for under “Interest income and similar revenues” as at theamounts due from banks and Euro 638
a total of Euro 0.7 million in the previous financial year).
The total interest income recognised as revenues for the period and which are entered under “Amounts due fromof which Euro 18.5 million relate to
0 Euro 12.7 million ofmillion relating to leaseback agreements, respectively).
5,577 13,566
22,543 15,119
4,789 1,826
4,008 3,264
268,795 224,033
142
1,532 29
67 77
307,311 258,056
31.12.201031.12.2011

Financial profits pertaining to subsequent years amount to Euroto leaseback agreements (Euro 150respectively).
1.4 Interest expense and similar charges: breakdown
1.5 Interest expense and similar charges: differentials on hedging transactions
In this financial year differentials on hedging transactions showed a positive balance and therefore they werereported in the table “1.2 Interest income and similar revenues: differentials on hedging
1.6 Interest expense and similar charges: other information
At year-end, interest expense on currency liabilities accounted for under “Interest expense and similar charges”amounted to Euro 189 thousandon amounts due to customers (a total of
Captions/Technical types
1. Amounts due to central banks
2. Amounts due to banks
3. Amounts due to customers
4. Securities issued
5. Financial liabilities held for trading
loss
7. Other liabilities
8. Hedging derivatives
Total
Notes to the consolidated financial statements
Financial profits pertaining to subsequent years amount to Euro 146.6 million, of which Euro150.8 million, of which Euro 13.6 million on leaseback agreements last year
Interest expense and similar charges: breakdown
similar charges: differentials on hedging transactions
In this financial year differentials on hedging transactions showed a positive balance and therefore they were1.2 Interest income and similar revenues: differentials on hedging
Interest expense and similar charges: other information
end, interest expense on currency liabilities accounted for under “Interest expense and similar charges”thousand, of which Euro 76 thousand on amounts due to banks and Euro
a total of Euro 255 thousand last year).
Captions/Technical types Debts SecuritiesOther
transaction
s
31.12.2011
(802)
(1,830) (1,830)
(37,761) (37,761)
(51,809) (51,809)
5. Financial liabilities held for trading
(8,218) (8,218)
(24)
(40,393) (60,027) (24) (100,444)
Notes to the consolidated financial statements
99
of which Euro 10.9 million relatingon leaseback agreements last year,
similar charges: differentials on hedging transactions
In this financial year differentials on hedging transactions showed a positive balance and therefore they were1.2 Interest income and similar revenues: differentials on hedging transactions”.
end, interest expense on currency liabilities accounted for under “Interest expense and similar charges”banks and Euro 113 thousand
31.12.2011 31.12.2010
(802) (39)
(1,830) (463)
(37,761) (22,507)
(51,809) (33,091)
(8,218) (16,779)
(24) (16)
(100,444) (72,895)

SECTION 2 - NET FEE AND COMMISSION INCOME
2.1 Fee and commission income: breakdown
Compared to the data released last yearsame amount being reclassified to item
Type of service / Amount
a) Guarantees given
b) Credit derivatives
c) Management, trading and consultancy
services:
1. trading of f inancial instruments
2. currency trading
3. portfolio management
3.1. Individual
3.2. Collective
4. securities safekeeping and
administration
5. depositary bank
6. securities placement
7. order receipt and transmission
8. consultancy services
8.1 on investments
8.2 on financial structures
9. distribution of third party services
9.1. portfolio management
9.1.1. Individual
9.1.2. Collective
9.2. insurance products
9.3. other products
d) Collection and payment services
e) Servicing for securitization operations
f) Factoring transaction services
g) Tax collection services
h) multi-lateral trading systems
management
i) holding and managing current accounts
j) other services
Total
Notes to the consolidated financial statements
NET FEE AND COMMISSION INCOME (caption 40 and 50)
Fee and commission income: breakdown
released last year, item “9.3 Other products” has fallen by Euro 8same amount being reclassified to item “j) Other services”.
31.12.2011 31.12.2010
2,217 2,315
c) Management, trading and consultancy
31,568 38,821
1. trading of f inancial instruments 3,441 3,550
1,123 1,327
4,473 5,060
3,765 4,377
708 683
2,858 3,164
2,478
4,745 7,086
7,979 9,597
9. distribution of third party services 6,949 6,559
484 481
484 481
6,448 6,068
17 10
d) Collection and payment services 20,933 20,863
e) Servicing for securitization operations
97 57
i) holding and managing current accounts 62,156 63,227
22,592 19,986
139,563 145,269
Notes to the consolidated financial statements
100
8,868 thousand due to the

2.2 Fee and commission expense: breakdown
Compared to the data released last year itemservices” was cleared, with the balanceservices”.
The element pertaining to the insurance company is limited to just Euro 0.8
SECTION 3 - DIVIDENDS AND SIMILAR REVENUES
3.1 Dividends and similar revenues: breakdown
The element pertaining to the insurance company
Services/Amount
a) Guarantees received
b) Credit derivatives
c) Management and dealing services:
1. Trading of f inancial instruments
2. Currency trading
3. Portfolio management:
3.1 ow n portfolio
3.2 delegated
4. Securities safekeeping and administration
5. Placement of f inancial instruments
6. Door-to-door sale of f inancial
instruments, products and services
d) Collection and payment services
e) Other services
Total
A. Financial assets held for trading
B. Available-for-sale financial assets
C. Financial assets at fair value through
profit or loss
D. Equity investments
Total
Caption/Revenues
Notes to the consolidated financial statements
Fee and commission expense: breakdown
released last year item “c) 6. Door-to-door sale of financial instruments, products andwith the balance – equal to Euro 8,532 thousand – being reclassified to item
The element pertaining to the insurance company is limited to just Euro 0.8 thousand.
DIVIDENDS AND SIMILAR REVENUES (caption 70)
Dividends and similar revenues: breakdown
The element pertaining to the insurance company amounts to Euro 19 thousand (Euro
31.12.2011 31.12.2010
(18) (37)
c) Management and dealing services: (2,259) (2,218)
1. Trading of f inancial instruments (926) (448)
4. Securities safekeeping and administration (1,333) (1,770)
5. Placement of f inancial instruments
6. Door-to-door sale of f inancial
instruments, products and services
d) Collection and payment services (2,571) (2,852)
(14,573) (12,556)
(19,421) (17,663)
DividendsIncome from
UCITS unitsDividends
Income from
UCITS units
A. Financial assets held for trading 5
B. Available-for-sale financial assets 43 364
C. Financial assets at fair value through
48 364
31.12.2011 31.12.2010
Notes to the consolidated financial statements
101
financial instruments, products andbeing reclassified to item “e) other
Euro 6 thousand last year).
Income from
UCITS units
6
6
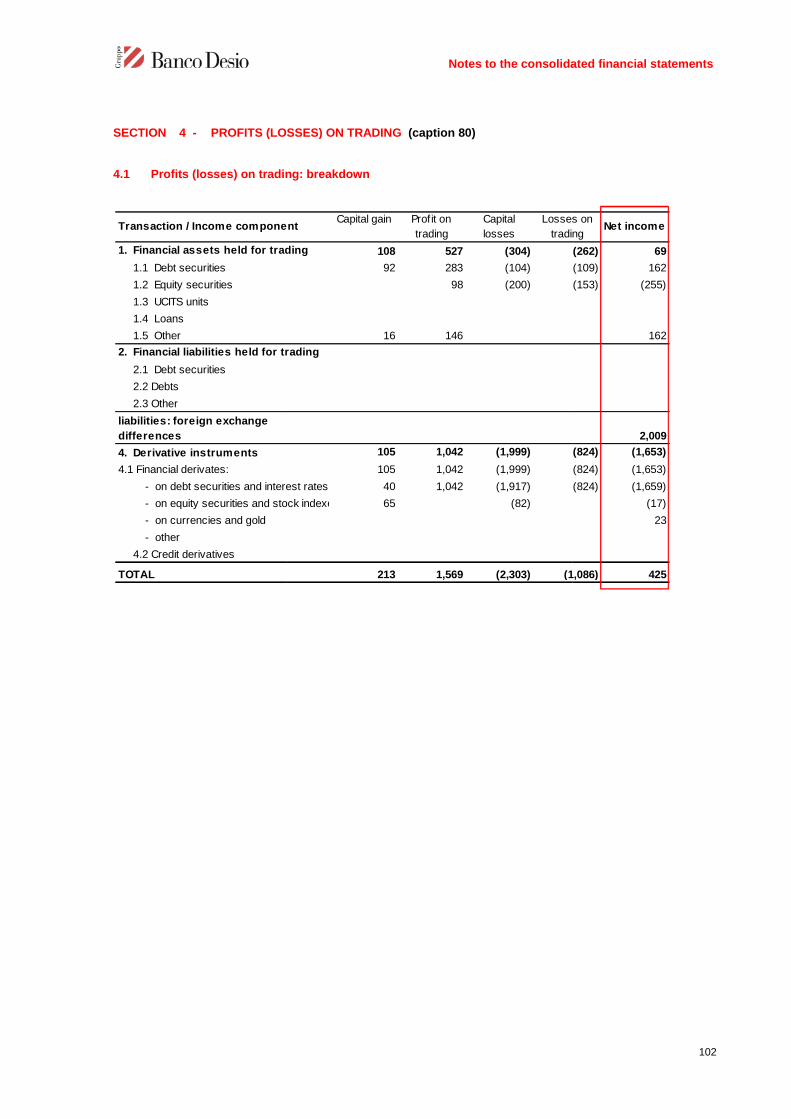
SECTION 4 - PROFITS (LOSSES) ON TRADING
4.1 Profits (losses) on trading: breakdown
Transaction / Income component
1. Financial assets held for trading
1.1 Debt securities
1.2 Equity securities
1.3 UCITS units
1.4 Loans
1.5 Other
2. Financial liabilities held for trading
2.1 Debt securities
2.2 Debts
2.3 Other
liabilities: foreign exchange
differences
4. Derivative instruments
4.1 Financial derivates:
- on debt securities and interest rates
- on equity securities and stock indexes
- on currencies and gold
- other
4.2 Credit derivatives
TOTAL
Notes to the consolidated financial statements
(LOSSES) ON TRADING (caption 80)
Profits (losses) on trading: breakdown
Transaction / Income componentCapital gain Profit on
trading
Capital
losses
Losses on
trading
1. Financial assets held for trading 108 527 (304)
92 283 (104)
98 (200)
16 146
2. Financial liabilities held for trading
105 1,042 (1,999)
105 1,042 (1,999)
- on debt securities and interest rates 40 1,042 (1,917)
- on equity securities and stock indexes 65 (82)
213 1,569 (2,303) (1,086)
Notes to the consolidated financial statements
102
Losses on
tradingNet income
(262) 69
(109) 162
(153) (255)
162
2,009
(824) (1,653)
(824) (1,653)
(824) (1,659)
(17)
23
(1,086) 425

SECTION 5 - FAIR VALUE ADJUSTMENTS IN HEDGE ACCOUNTING
5.1 Fair value adjustments in hedge accounting: breakdown
Income component/Amount
A. Income relating to:
A.1 Fair value hedging derivatives
A.2 Hedged financial assets (fair value)
A.3 Hedged financial liabilities (fair value)
A.4 Cash flow hedge financial derivatives
A.5 Currency assets and liabilities
Total income from hedging activities
(A)
B. Charges relating to:
B.1 Fair value hedging derivatives
B.2 Hedged financial assets (fair value)
B.3 Hedged financial liabilities (fair value)
B.4 Cash flow hedge financial derivatives
B.5 Currency assets and liabilities
Total charges from hedging activities
(B)
C. Net hedging income (A – B)
Notes to the consolidated financial statements
FAIR VALUE ADJUSTMENTS IN HEDGE ACCOUNTING (caption
Fair value adjustments in hedge accounting: breakdown
31.12.2011 31.12.2010
6,651 2,312
A.2 Hedged financial assets (fair value) 1,383
A.3 Hedged financial liabilities (fair value) 856
A.4 Cash flow hedge financial derivatives
Total income from hedging activities
8,034 3,168
(1,507) (1,113)
B.2 Hedged financial assets (fair value) (458)
B.3 Hedged financial liabilities (fair value) (6,550)
B.4 Cash flow hedge financial derivatives
Total charges from hedging activities
(8,057) (1,571)
(23) 1,597
Notes to the consolidated financial statements
103
caption 90)

SECTION 6 - PROFITS (LOSSES) ON DISPOSAL/REPURCHASE
6.1 Profits (losses) on disposals/repurchase: breakdown
Profits/losses from assignments of receivables arise from the transfer of non
Profits/losses from disposal/repurchase ofthe year on the income statement, including the release of the related valuation reserves, gross of tax effect.Profits related to the transfer of UCITS units also include tax credit
For financial liabilities, the result is given by profits/losses for the purchase and sale or repayment of debentureloans issued by the Bank.
The income component pertaining to the insurance company, which relates to operations on availablefinancial assets, recorded a negative result of Euro 33 thousandthousand).
Financial assets
1. Amounts due from banks
2. Amounts due from customers
3. Available-for-sale financial assets
3.1 Debt securities
3.2 Equity securities
3.3 UCITS units
3.4 Loans
4. Held-to-maturity investments
Total assets
Financial liabilities
1. Amounts due to banks
2. Amounts due to customers
3. Securities issued
Total liabilities
Caption/Income component
Notes to the consolidated financial statements
(LOSSES) ON DISPOSAL/REPURCHASE (caption 100)
Profits (losses) on disposals/repurchase: breakdown
Profits/losses from assignments of receivables arise from the transfer of non-performing loans.
Profits/losses from disposal/repurchase of available-for-sale financial assets represent the impact of the sales forthe year on the income statement, including the release of the related valuation reserves, gross of tax effect.Profits related to the transfer of UCITS units also include tax credits.
For financial liabilities, the result is given by profits/losses for the purchase and sale or repayment of debenture
The income component pertaining to the insurance company, which relates to operations on availablerecorded a negative result of Euro 33 thousand (against a positive result last year of
Profits Losses Net income Profits
38 (594) (556) 60
3. Available-for-sale financial assets 5,431 (2,840) 2,591 11,249
5,046 (2,798) 2,248 10,073
200 (35) 165 100
185 (7) 178 1,076
5,469 (3,434) 2,035 11,309
1,292 (15) 1,277 1,018
1,292 (15) 1,277 1,018
31.12.2011
Notes to the consolidated financial statements
104
100)
performing loans.
sale financial assets represent the impact of the sales forthe year on the income statement, including the release of the related valuation reserves, gross of tax effect.
For financial liabilities, the result is given by profits/losses for the purchase and sale or repayment of debenture
The income component pertaining to the insurance company, which relates to operations on available-for-saleagainst a positive result last year of Euro 106
Losses Net income
60
(4,051) 7,198
(1,720) 8,353
(25) 75
(2,306) (1,230)
(4,051) 7,258
(162) 856
(162) 856
31.12.2010

SECTION 7 - PROFITS (LOSSES) ON FINANCIAL ASSETS AND LIABILITIES AT FAIR VALUETHROUGH PROFIT OR LOSS
7.1 Profits (losses) on financial assets and liabilities at fair value through profit or loss: breakdown
Section 8 - NET LOSSES/RECOVERIES ON IMPAIRMENT
8.1 Net impairment losses on loans: breakdown
8.2 Net impairment losses on
There were no net impairment losses at the reference date on financial assets available for sale
Transaction/ Income component
1. Financial assets
1.1 Debt securities
1.2 Equity securities
1.3 UCITS units
1.4 Loans
2. Financial liabilities
2.1 Debt securities
2.2 Amounts due to banks
2.3 Amount due to customers
3. Financial assets and liabilities:
foreign exchange differences
4. Financial and credit derivates
TOTAL
Write-o ffs
A. Amounts due from banks
- loans
- debt securities
B. Amounts due from customers(13,751)
- loans (13,751)
- debt securities
C . T o tal (13,751)
Impairment losses
SpecificTransaction/Income
component
Notes to the consolidated financial statements
PROFITS (LOSSES) ON FINANCIAL ASSETS AND LIABILITIES AT FAIR VALUETHROUGH PROFIT OR LOSS (caption 110)
Profits (losses) on financial assets and liabilities at fair value through profit or loss: breakdown
NET LOSSES/RECOVERIES ON IMPAIRMENT (caption 130)
Net impairment losses on loans: breakdown
on financial assets available for sale: breakdown
There were no net impairment losses at the reference date on financial assets available for sale
Capital gainProfits on
disposal
Capital
losses
Losses on
disposal
3,266 2,727
3,266 2,727
3. Financial assets and liabilities:
4. Financial and credit derivates 1,536 (4,783)
4,802 2,727 (4,783)
Other
Due to
interest
s
Other
recoveries
Due to
interest
s
Other
recoveries
11
11
(45,621) (732) 6,305 13,276 2,142
(45,621) (732) 6,305 13,276 2,142
(45,621) (732) 6 ,305 13,276 2,153 (38,370)
Impairment losses Recoveries
T o tal
31.12.2011SpecificPortfo li
o
Specific Portfo lio
Notes to the consolidated financial statements
105
PROFITS (LOSSES) ON FINANCIAL ASSETS AND LIABILITIES AT FAIR VALUE
Profits (losses) on financial assets and liabilities at fair value through profit or loss: breakdown
There were no net impairment losses at the reference date on financial assets available for sale.
Net
income
5,993
5,993
(3,247)
2,746
11 10
11 10
(38,381) (40,668)
(38,381) (40,668)
(38,370) (40,658)
T o tal
31.12.2011
T o tal
31.12.2010

8.3 Net impairment losses on held
There were no net impairment losses at the reference date on held
8.4 Net impairment losses on other financial transactions: breakdown
SECTION 9 - NET INSURANCE PREMIUMS
9.1 Net insurance premiums: breakdown
Write-offs
A. Guarantees granted (305)
B. Credit derivatives
C. Commitments to grant
finance
D. Other transactions
T o tal (305)
SpecificTransaction / Income
component
Impairment losses
Net insurance premiums
A. Life branch
A.1 Gross premiums accounted for (+)
A.2 Premiums assigned for reinsurance (-)
A.3 Total
B. Non-life branch
B.1 Gross premiums accounted for (+)
B.2 Premiums assigned for reinsurance (-)
B.3 Changes in the gross amount of premium
reserve (+/-)
B.4 Changes in premium reserves reassured w ith
third parties (-/+)
B.5 Total
C. Total net insurance premiums
Notes to the consolidated financial statements
Net impairment losses on held-to-maturity investments: breakdown
losses at the reference date on held-to-maturity investments
Net impairment losses on other financial transactions: breakdown
NET INSURANCE PREMIUMS (caption 150)
Net insurance premiums: breakdown
OtherDue to
interestsOther recoveries
Due to
interestsOther recoveries
(236) (9) 101
(236) (9) 101
Specific
Portfo lio
Specific Portfo lio
Impairment losses Recoveries
Direct
work
Indirect
work31.12.2011
A.1 Gross premiums accounted for (+)
A.2 Premiums assigned for reinsurance (-)
B.1 Gross premiums accounted for (+) 32,201 32,201
B.2 Premiums assigned for reinsurance (-) (3,095) (3,095)
B.3 Changes in the gross amount of premium
B.4 Changes in premium reserves reassured w ith
29,106 29,106
C. Total net insurance premiums 29,106 29,106
Notes to the consolidated financial statements
106
maturity investments.
Other recoveries
362 (87) (102)
362 (87) (102)
T o tal
31.12.2010
T o tal
31.12.2011
31.12.2010
32,201 27,234
(3,095) (2,560)
29,106 24,674
29,106 24,674
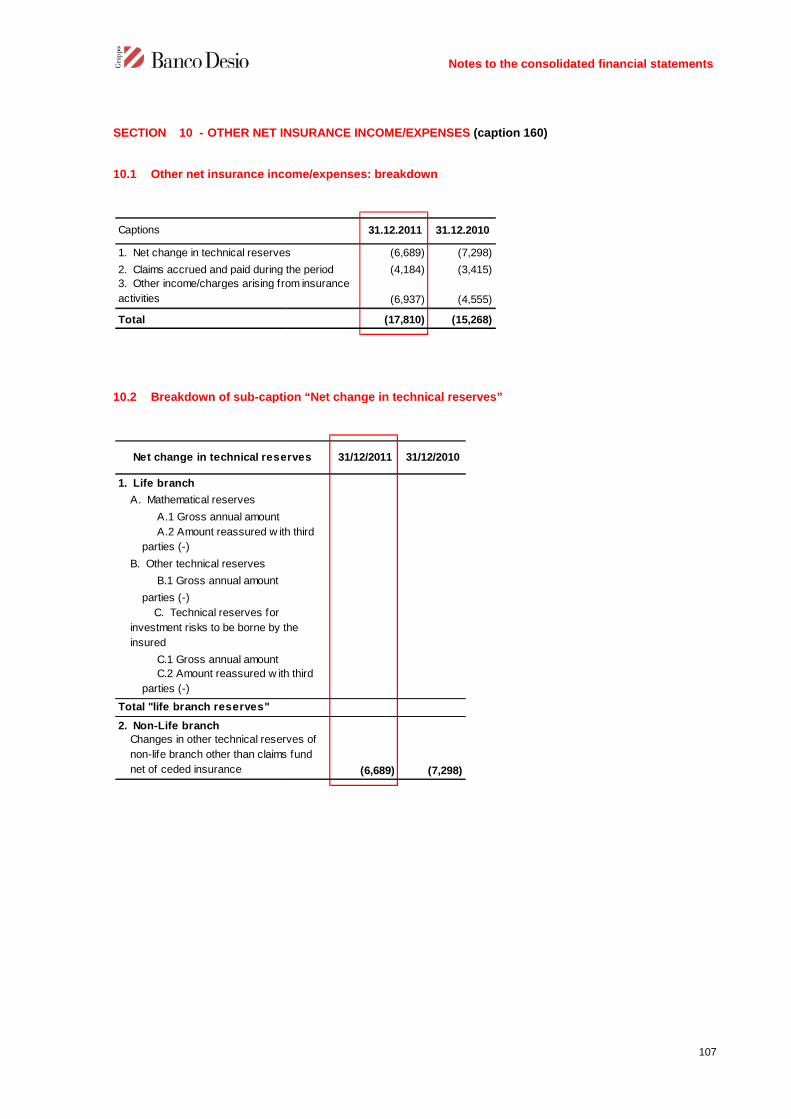
SECTION 10 - OTHER NET INSURANCE INCOME/EXPENSES
10.1 Other net insurance income/expenses: breakdown
10.2 Breakdown of sub-caption “Net change in technical reserves”
Captions
1. Net change in technical reserves
2. Claims accrued and paid during the period
3. Other income/charges arising from insurance
activities
Total
Net change in technical reserves
1. Life branch
A. Mathematical reserves
A.1 Gross annual amount
A.2 Amount reassured w ith third
parties (-)
B. Other technical reserves
B.1 Gross annual amount
parties (-)
C. Technical reserves for
investment risks to be borne by the
insured
C.1 Gross annual amount
C.2 Amount reassured w ith third
parties (-)
Total "life branch reserves"
2. Non-Life branchChanges in other technical reserves of
non-life branch other than claims fund
net of ceded insurance
Notes to the consolidated financial statements
OTHER NET INSURANCE INCOME/EXPENSES (caption 160)
Other net insurance income/expenses: breakdown
caption “Net change in technical reserves”
31.12.2011 31.12.2010
1. Net change in technical reserves (6,689) (7,298)
2. Claims accrued and paid during the period (4,184) (3,415)
3. Other income/charges arising from insurance
(6,937) (4,555)
(17,810) (15,268)
Net change in technical reserves 31/12/2011 31/12/2010
A.2 Amount reassured w ith third
investment risks to be borne by the
C.2 Amount reassured w ith third
Changes in other technical reserves of
non-life branch other than claims fund
(6,689) (7,298)
Notes to the consolidated financial statements
107

10.3 Breakdown of sub-caption “Claims accrued and paid during the
10.4 Breakdown of sub-caption “Other net insurance income/expense”
10.4.2 Non-Life Branch
Charges associated to claims
Life branch: charges associated to
claims, net of reinsurance ceded
A. Amounts paid
A.1 Gross annual amount
third parties
B. Changes in funds for amounts to be
disbursed
B.1 Gross annual amount
B.2 (-) Amount reassured w ith
third parties
Total life branch claims
Non-Life branch: charges associated to
claims, net of recoveries and
reinsurance ceded
C. Amounts paid:
C.1 Gross annual amount
third parties
D. Changes in recoveries, net of amounts
reassured w ith third parties
E. Changes in claims fund
E.1 Gross annual amount
third parties
Total non-life branch claims
Total
NON-LIFE BRANCH
Income
-Other technical income, net of recoveries
and reinsurance
- Change in commissions and other
acquisition costs to be amortised
- Commissions and share of gains received
from reinsurers
Charges
- Other technical charges, net of
recoveries and reinsurance
- Acquisition fees
- Other acquisition costs
- Collection fees
Total non-life branch
Notes to the consolidated financial statements
caption “Claims accrued and paid during the year”
caption “Other net insurance income/expense”
Charges associated to claims 31.12.2011 31.12.2010
Life branch: charges associated to
claims, net of reinsurance ceded
A.1 Gross annual amount
B. Changes in funds for amounts to be
B.1 Gross annual amount
B.2 (-) Amount reassured w ith
Non-Life branch: charges associated to
(2,425) (1,467)
C.1 Gross annual amount (3,336) (1,830)
911 363
D. Changes in recoveries, net of amounts
(1,759) (1,948)
E.1 Gross annual amount (1,870) (2,172)
111 224
(4,184) (3,415)
(4,184) (3,415)
31.12.2011 31.12.2010
2,610 1,979
-Other technical income, net of recoveries
410 145
- Change in commissions and other
- Commissions and share of gains received
2,200 1,834
(9,547) (6,534)
(1,089) (178)
(8,373) (6,275)
(85) (81)
(6,937) (4,555)
Notes to the consolidated financial statements
108

SECTION 11 - ADMINISTRATIVE COSTS
11.1 Personnel costs: breakdown
The insurance component amounts to Euro 3,
11.2 Average number of employees by category: banking group
The average number of employees in the insurance company10 Managers (11 last year) and 10 remaining staff.
Type of costs/Amount
1) Employees
a) w ages and salaries
b) social security charges
c) provision for employee termination
indemnities
d) social security costs
e) provisions for termination indemnities
f) accruals to pension funds and similar
funds:
- defined contribution
- defined benefit
g) amounts paid to external
complementary social security funds:
- defined contribution
- defined benefit
h) costs arising from payment agreements
based on ow n financial instruments
i) other benefits in favor of employees
2) Other personnel in active employment
3) Directors and statutory auditors
4) Staff pensioned off
5) Recoveries of expenses for staff
seconded to other companies
6) Refund of expenses for third-party
employees seconded to the company
Total
Employees
a) Executives
b) Managers
c) Remaining employees
Other personnel
Notes to the consolidated financial statements
ADMINISTRATIVE COSTS (caption 180)
Personnel costs: breakdown
The insurance component amounts to Euro 3,296 thousand (Euro 3,045 thousand last year)
Average number of employees by category: banking group
The average number of employees in the insurance company was 38 (39 last year), of which 210 Managers (11 last year) and 10 remaining staff. Other staff comprises 4 units of staff (1 last year
31.12.2011 31.12.2010
(148,450) (145,035)
(98,934) (98,902)
(25,196) (24,146)
c) provision for employee termination
(26) (25)
e) provisions for termination indemnities (1,280) (1,322)
f) accruals to pension funds and similar
complementary social security funds: (10,942) (10,746)
(10,942) (10,746)
h) costs arising from payment agreements
based on ow n financial instruments(159) (268)
i) other benefits in favor of employees (11,913) (9,626)
2) Other personnel in active employment (2,787) (3,034)
3) Directors and statutory auditors (5,836) (6,906)
5) Recoveries of expenses for staff
6) Refund of expenses for third-party
employees seconded to the company
(157,073) (154,975)
31.12.2011 31.12.2010
1,834 1,746
35 37
932 897
867 812
39 39
Notes to the consolidated financial statements
109
thousand last year).
of which 2 Senior Managers,staff comprises 4 units of staff (1 last year).

11.3 Corporate defined-benefit pension funds
None at the reference date.
11.4 Other employee benefits
The element pertaining to the insurance company amounts to Euro
11.5 Other administrative costs: breakdown
provisions for sundry costs
social security contribution
training and education expenses
leases on buildings dedicated to the use by employees
other
Total
indirect taxes and duties
- stamp duties
- other
other costs
- information technology charges
- property/equipment lease
- maintenance of property/furniture and
equipment
- postal and telegraphic charges
- telephone, data transmission charges
- electric pow er, heating, w ater
- cleaning services
- printing, stationery and consumables
expenses
- transport costs
- surveillance and security
- advertising
- information and certif icates
- insurance premiums
- legal expenses
- professional consulting expenses
- contributions and donations
- other expenses
Total
Notes to the consolidated financial statements
benefit pension funds: total costs
Other employee benefits
The element pertaining to the insurance company amounts to Euro 58 thousand (Euro
Other administrative costs: breakdown
31.12.2011 31.12.2010
(8,409) (5,151)
(1,260) (1,108)
(408) (589)
leases on buildings dedicated to the use by employees(191) (149)
(1,645) (2,629)
(11,913) (9,626)
31.12.2011 31.12.2010
(11,154) (9,353)
(3,687) (4,363)
(10,056) (12,034)
(13,219) (12,532)
- maintenance of property/furniture and
(3,614) (3,876)
(2,353) (2,566)
- telephone, data transmission charges (2,946) (3,027)
(3,391) (3,430)
(1,342) (1,268)
- printing, stationery and consumables
(1,411) (1,424)
(905) (909)
(1,950) (1,790)
(1,421) (1,686)
(1,680) (2,027)
(1,120) (929)
(5,490) (5,296)
- professional consulting expenses (4,331) (3,953)
(179) (221)
(10,374) (8,459)
(80,623) (79,143)
Notes to the consolidated financial statements
110
Euro 52 thousand last year).
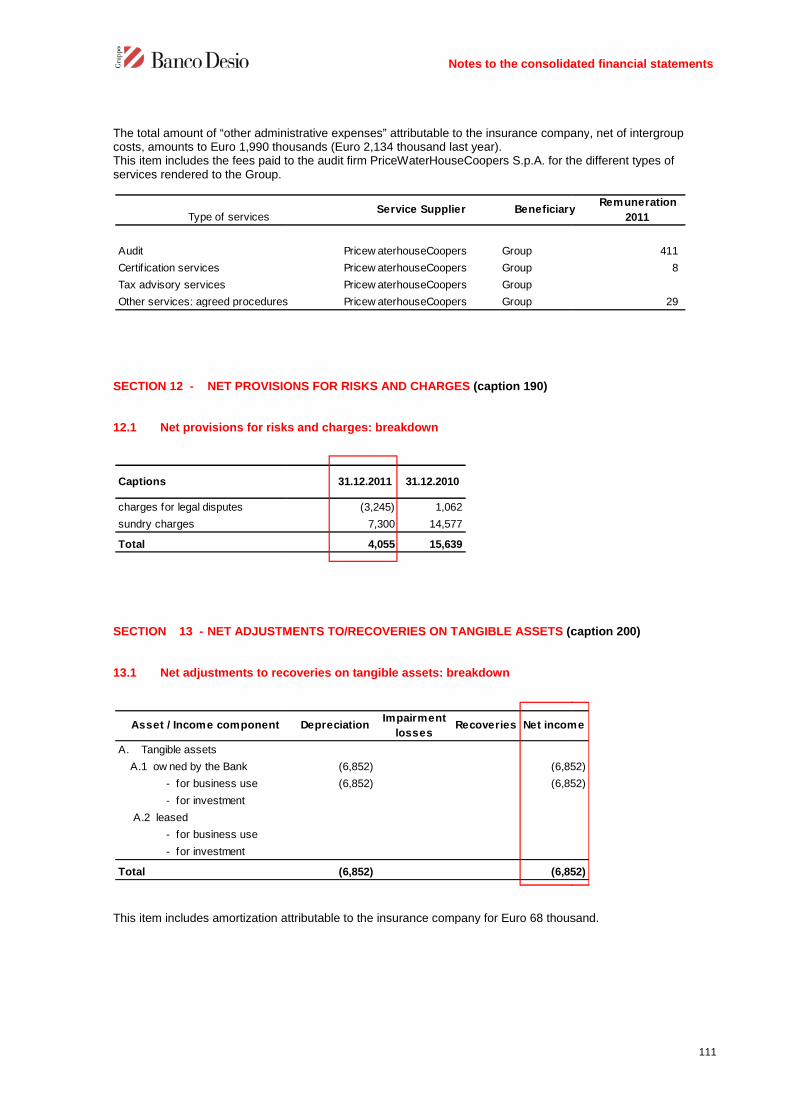
The total amount of “other administrative expenses” attributable to the insurance companycosts, amounts to Euro 1,990 thousandsThis item includes the fees paid to the audit firm PriceWaterHouseCoopers S.p.A. for the different types ofservices rendered to the Group.
SECTION 12 - NET PROVISIONS FOR RISKS AND CHARGES
12.1 Net provisions for risks and
SECTION 13 - NET ADJUSTMENTS TO/RECOVERIES ON TANGIBLE ASSETS
13.1 Net adjustments to recoveries on tangible assets: breakdown
This item includes amortization attributable to the insurance company for Euro 6
Type of services
Audit
Certif ication services
Tax advisory services
Other services: agreed procedures
Captions
charges for legal disputes
sundry charges
Total
Asset / Income component
A. Tangible assets
A.1 ow ned by the Bank
- for business use
- for investment
A.2 leased
- for business use
- for investment
Total
Notes to the consolidated financial statements
The total amount of “other administrative expenses” attributable to the insurance companythousands (Euro 2,134 thousand last year).
This item includes the fees paid to the audit firm PriceWaterHouseCoopers S.p.A. for the different types of
NET PROVISIONS FOR RISKS AND CHARGES (caption 190)
Net provisions for risks and charges: breakdown
NET ADJUSTMENTS TO/RECOVERIES ON TANGIBLE ASSETS (caption
recoveries on tangible assets: breakdown
This item includes amortization attributable to the insurance company for Euro 68 thousand.
Service Supplier Beneficiary
Pricew aterhouseCoopers Group
Pricew aterhouseCoopers Group
Pricew aterhouseCoopers Group
Other services: agreed procedures Pricew aterhouseCoopers Group
31.12.2011 31.12.2010
(3,245) 1,062
7,300 14,577
4,055 15,639
DepreciationImpairment
lossesRecoveries Net income
(6,852) (6,852)
(6,852) (6,852)
(6,852) (6,852)
Notes to the consolidated financial statements
111
The total amount of “other administrative expenses” attributable to the insurance company, net of intergroup
This item includes the fees paid to the audit firm PriceWaterHouseCoopers S.p.A. for the different types of
caption 200)
thousand.
BeneficiaryRemuneration
2011
411
8
29
Net income
(6,852)
(6,852)
(6,852)
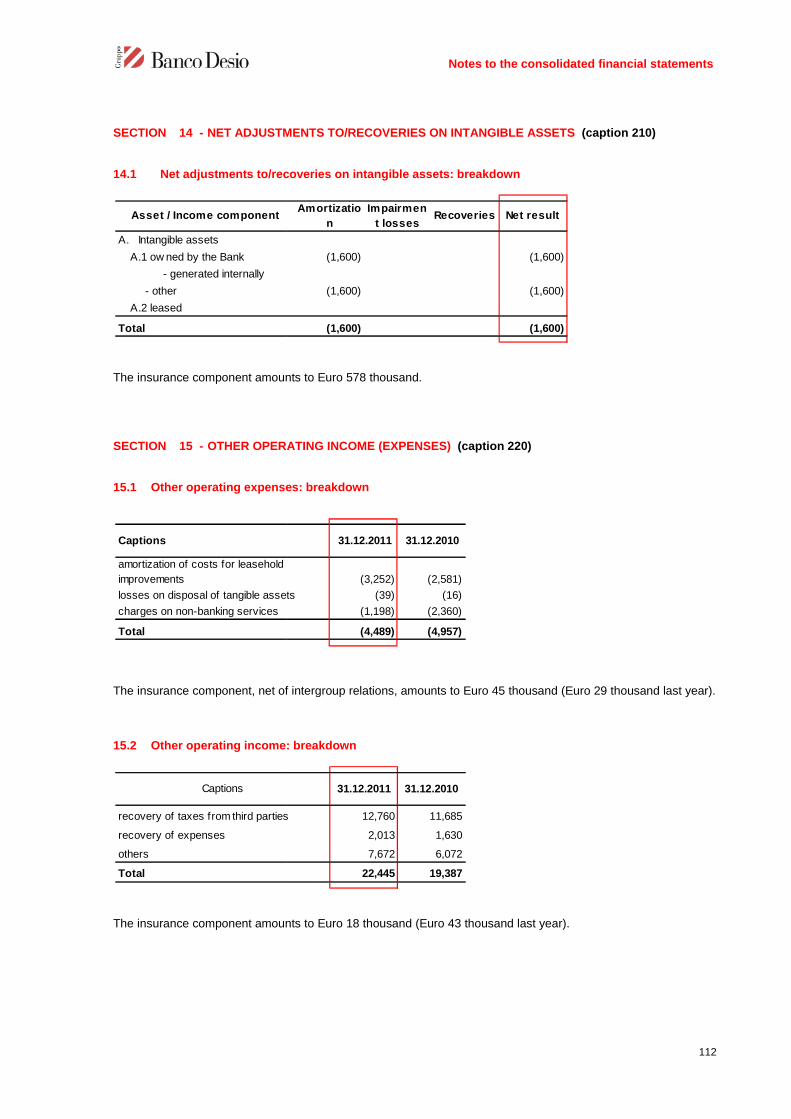
SECTION 14 - NET ADJUSTMENTS TO/RECOVERIES ON INTANGIBLE ASSETS
14.1 Net adjustments to/recoveries on intangible assets: breakdown
The insurance component amounts to Euro
SECTION 15 - OTHER OPERATING INCOME (EXPENSES)
15.1 Other operating expenses: breakdown
The insurance component, net of intergroup relations, amounts to Euro
15.2 Other operating income: breakdown
The insurance component amounts to Euro
Asset / Income component
A. Intangible assets
A.1 ow ned by the Bank
- generated internally
- other
A.2 leased
Total
Captions
amortization of costs for leasehold
improvements
losses on disposal of tangible assets
charges on non-banking services
Total
Captions
recovery of taxes from third parties
recovery of expenses
others
Total
Notes to the consolidated financial statements
NET ADJUSTMENTS TO/RECOVERIES ON INTANGIBLE ASSETS
Net adjustments to/recoveries on intangible assets: breakdown
The insurance component amounts to Euro 578 thousand.
OPERATING INCOME (EXPENSES) (caption 220)
Other operating expenses: breakdown
The insurance component, net of intergroup relations, amounts to Euro 45 thousand (Euro 2
Other operating income: breakdown
The insurance component amounts to Euro 18 thousand (Euro 43 thousand last year).
Amortizatio
n
Impairmen
t lossesRecoveries Net result
(1,600) (1,600)
(1,600) (1,600)
(1,600) (1,600)
31.12.2011 31.12.2010
amortization of costs for leasehold
(3,252) (2,581)
losses on disposal of tangible assets (39) (16)
(1,198) (2,360)
(4,489) (4,957)
31.12.2011 31.12.2010
recovery of taxes from third parties 12,760 11,685
2,013 1,630
7,672 6,072
22,445 19,387
Notes to the consolidated financial statements
112
NET ADJUSTMENTS TO/RECOVERIES ON INTANGIBLE ASSETS (caption 210)
Euro 29 thousand last year).

SECTION 16 - PROFITS (LOSSES) ON EQUITY INVESTMENTS
16.1 Profits (losses) on equity investments: breakdown
SECTION 17 - NET PROFITS (LOSSES) FROM(caption 250)
There were no tangible or intangible assets
SECTION 18 - IMPAIRMENT OF GOODWILL
18.1 Impairment of goodwill: breakdown
The results of the recoverability tests on goodwill recorded in the financial statements led to impairment losses ofEuro 3.0 million being recorded for the subsidiary
Income component / Values
Companies subject to significant
influence
A. Revenues
1. Revaluations
2. Profits on disposal
3. Write-backs
4. Other
B. Charges
1. Write-dow ns
2. Impaiment losses
3. Losses on disposal
4. Other
Net result
Notes to the consolidated financial statements
PROFITS (LOSSES) ON EQUITY INVESTMENTS (caption 240)
Profits (losses) on equity investments: breakdown
NET PROFITS (LOSSES) FROM TANGIBLE AND INTANGIBLE ASSETS
There were no tangible or intangible assets measured at fair value at the reference date
IMPAIRMENT OF GOODWILL (caption 260)
Impairment of goodwill: breakdown
results of the recoverability tests on goodwill recorded in the financial statements led to impairment losses ofEuro 3.0 million being recorded for the subsidiary C.P.C. S.A. – Lugano.
31.12.2011 31.12.2010
Companies subject to significant
2,763 3,909
2,763 3,380
529
2,763 3,909
Notes to the consolidated financial statements
113
TANGIBLE AND INTANGIBLE ASSETS AT FAIR VALUE
at fair value at the reference date.
results of the recoverability tests on goodwill recorded in the financial statements led to impairment losses of

SECTION 19 - PROFITS (LOSSES) ON DISPOSAL OF INVESTMENTS
19.1 Profits (losses) on disposals of investments: breakdown
SECTION 20 - TAXES ON INCOME FROM CONTINUING OPERATIONS: BREAKDOWN
20.1 Taxes on income from continuing operations: breakdown
The component attributable to the insurance company amounts to Euro 1,last year).
Income component/Sectors
A. Real estate assets
- Profits on disposal
- Losses on disposal
B. Other assets
- Profits on disposal
- Losses on disposal
Net result
Income component / Values
1. Current taxes (-)
2. Changes in current taxes of previous
periods (+/-)
3. Decrease in current taxes of the year
(+)
4. Changes in deferred tax assets (+/-)
5. Changes in deferred tax liabilities (+/-)
6. Taxes for the year
Notes to the consolidated financial statements
PROFITS (LOSSES) ON DISPOSAL OF INVESTMENTS (caption
Profits (losses) on disposals of investments: breakdown
TAXES ON INCOME FROM CONTINUING OPERATIONS: BREAKDOWN
Taxes on income from continuing operations: breakdown
attributable to the insurance company amounts to Euro 1,682 thousand (Euro
31.12.2011 31.12.2010
2
2
2
31.12.2011 31.12.2010
(38,241) (32,362)
2. Changes in current taxes of previous
296 (10)
3. Decrease in current taxes of the year
4. Changes in deferred tax assets (+/-) 1,947 2,622
5. Changes in deferred tax liabilities (+/-) (95) (2)
(36,093) (29,752)
Notes to the consolidated financial statements
114
270)
TAXES ON INCOME FROM CONTINUING OPERATIONS: BREAKDOWN (caption 290)
thousand (Euro 1,033 thousand
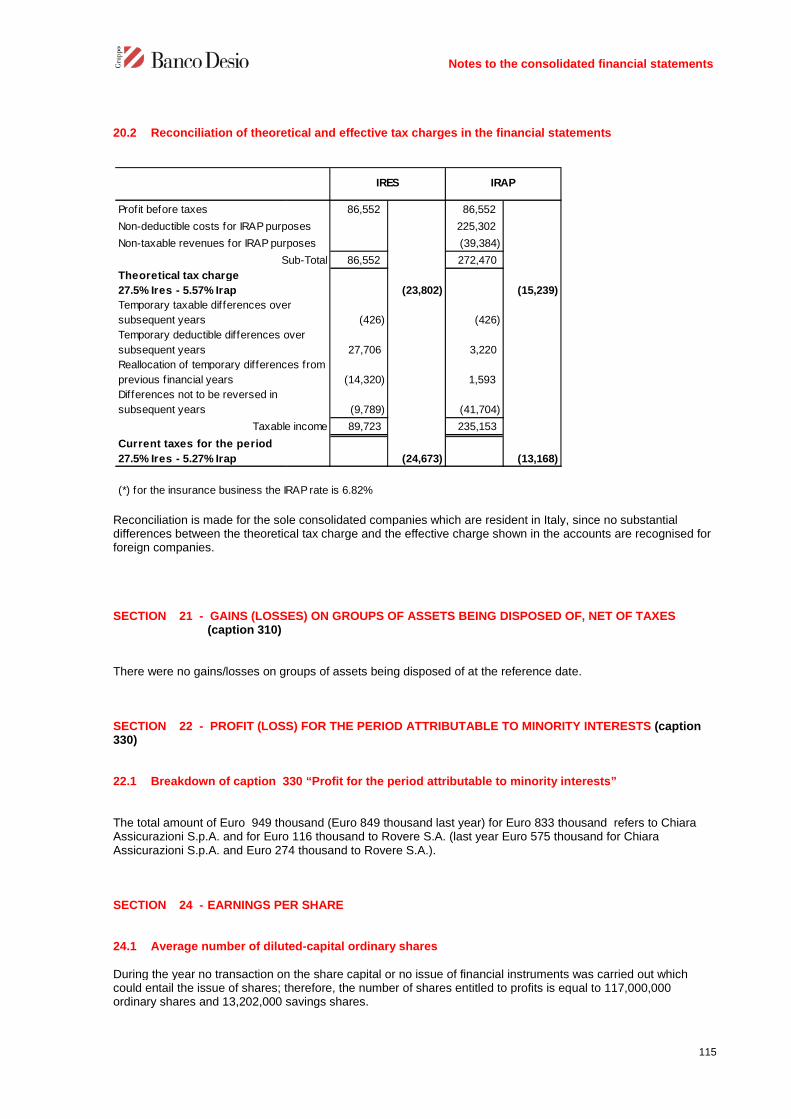
20.2 Reconciliation of theoretical and effective tax charges in the financial statements
Reconciliation is made for the sole consolidateddifferences between the theoretical tax charge and the effective charge shown in the accounts are recognised forforeign companies.
SECTION 21 - GAINS (LOSSES) ON GROUPS OF ASSETS(caption 310)
There were no gains/losses on groups of assets
SECTION 22 - PROFIT (LOSS) FOR THE PERIOD ATTRIBUTABLE TO MINORITY INTERESTS330)
22.1 Breakdown of caption 330 “Profit for the period attributable to minority interests”
The total amount of Euro 949 thousand (EuroAssicurazioni S.p.A. and for EuroAssicurazioni S.p.A. and Euro 274
SECTION 24 - EARNINGS PER SHARE
24.1 Average number of diluted
During the year no transaction on thecould entail the issue of shares; therefore, the number of shares entitled to profits is equal to 117,000,000ordinary shares and 13,202,000 savings shares
Profit before taxes
Non-deductible costs for IRAP purposes
Non-taxable revenues for IRAP purposes
Sub-Total
Theoretical tax charge
27.5% Ires - 5.57% Irap
Temporary taxable differences over
subsequent years
Temporary deductible differences over
subsequent years
Reallocation of temporary differences from
previous financial years
Differences not to be reversed in
subsequent years
Taxable income
Current taxes for the period
27.5% Ires - 5.27% Irap
(*) for the insurance business the IRAP rate is 6.82%
Notes to the consolidated financial statements
Reconciliation of theoretical and effective tax charges in the financial statements
Reconciliation is made for the sole consolidated companies which are resident in Italy, since no substantialdifferences between the theoretical tax charge and the effective charge shown in the accounts are recognised for
GAINS (LOSSES) ON GROUPS OF ASSETS BEING DISPOSED OF,
There were no gains/losses on groups of assets being disposed of at the reference date
PROFIT (LOSS) FOR THE PERIOD ATTRIBUTABLE TO MINORITY INTERESTS
caption 330 “Profit for the period attributable to minority interests”
thousand (Euro 849 thousand last year) for Euro 833 thousand refers to ChiaraAssicurazioni S.p.A. and for Euro 116 thousand to Rovere S.A. (last year Euro 575 thousand for Chiara
274 thousand to Rovere S.A.).
PER SHARE
Average number of diluted-capital ordinary shares
During the year no transaction on the share capital or no issue of financial instruments was carried out whichcould entail the issue of shares; therefore, the number of shares entitled to profits is equal to 117,000,000ordinary shares and 13,202,000 savings shares.
86,552 86,552
Non-deductible costs for IRAP purposes 225,302
Non-taxable revenues for IRAP purposes (39,384)
Sub-Total 86,552 272,470
Theoretical tax charge
(23,802) (15,239)
Temporary taxable differences over
(426) (426)
Temporary deductible differences over
27,706 3,220
Reallocation of temporary differences from
(14,320) 1,593
(9,789) (41,704)
Taxable income 89,723 235,153
Current taxes for the period
(24,673) (13,168)
(*) for the insurance business the IRAP rate is 6.82%
IRES IRAP
Notes to the consolidated financial statements
115
Reconciliation of theoretical and effective tax charges in the financial statements
companies which are resident in Italy, since no substantialdifferences between the theoretical tax charge and the effective charge shown in the accounts are recognised for
BEING DISPOSED OF, NET OF TAXES
at the reference date.
PROFIT (LOSS) FOR THE PERIOD ATTRIBUTABLE TO MINORITY INTERESTS (caption
caption 330 “Profit for the period attributable to minority interests”
thousand refers to Chiarathousand for Chiara
share capital or no issue of financial instruments was carried out whichcould entail the issue of shares; therefore, the number of shares entitled to profits is equal to 117,000,000
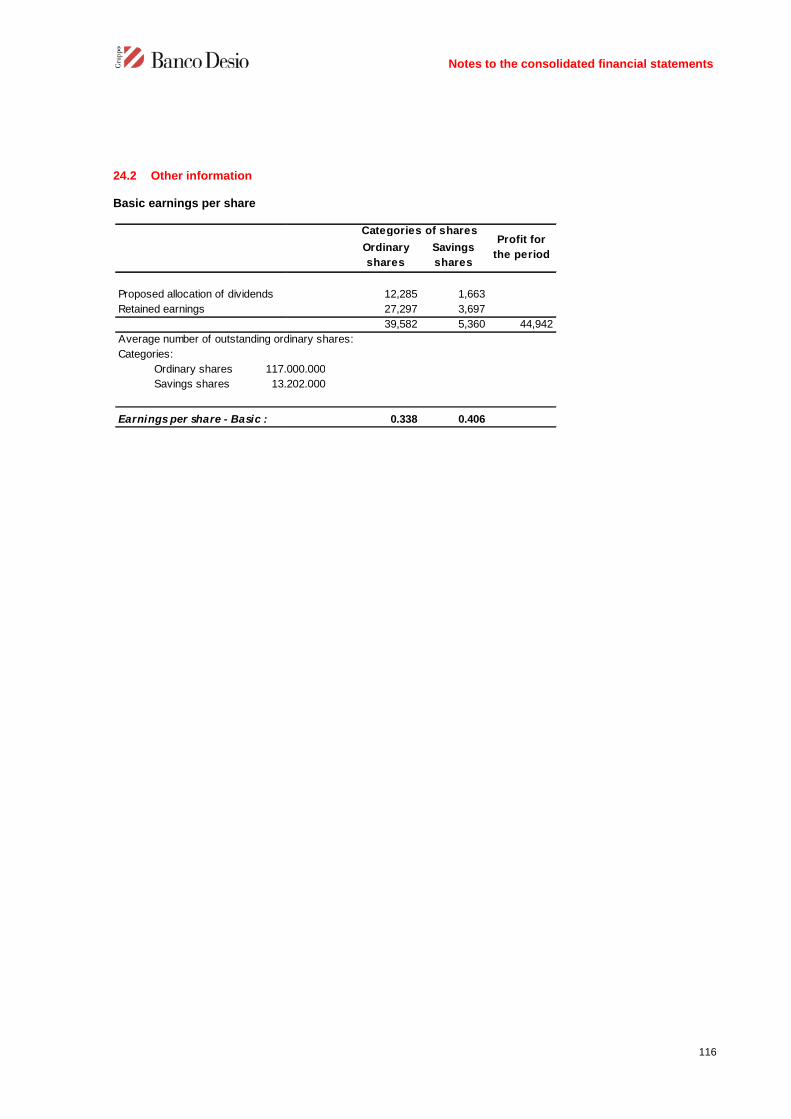
24.2 Other information
Basic earnings per share
Proposed allocation of dividends
Retained earnings
Average number of outstanding ordinary shares:
Categories:
Ordinary shares 117.000.000
Savings shares 13.202.000
Earnings per share - Basic :
Notes to the consolidated financial statements
Ordinary
shares
Savings
shares
12,285 1,663
27,297 3,697
39,582 5,360 44,942
Average number of outstanding ordinary shares:
Ordinary shares 117.000.000
Savings shares 13.202.000
0.338 0.406
Categories of sharesProfit for
the period
Notes to the consolidated financial statements
116

PART D - CONSOLIDATED COMPREHENSIVE INCOME
Statement of consolidated comprehensive income
Captions
10. Profit (Loss) for the period
Oher income components
20. Available-for-sale financial assets
a) fair value changes
b) reversal to the income statement
- value adjustments due to deterioration
- profits/losses on disposal
c) other changes
30. Tangible assets
40. Intangible assets
50. Foreign investment hedge:
a) fair value changes
b) reversal to the income statement
c) other changes
60. Cash flow hedge:
a)fair value changes
b) reversal to the income statement
c) other changes
70. Exchange differences:
a) fair value changes
b) reversal to the income statement
c) other changes
80. operations
a) fair value changes
b) reversal to the income statement
c) other changes
90. Actuarial profits (losses) on defined benefit plans
100.Share of valuation reserve of equity investments
carried at equity:
a) fair value changes
b) reversal to the income statement
- value adjustments due to deterioration
- profits/losses on disposal
c) other changes
110. Total other income components
120. Comprehensive income (10+110)
130.
Consolidated comprehensive income attributable to
minority interests
140.Consolidated comprehensive income attributable
to the parent company
Notes to the consolidated
CONSOLIDATED COMPREHENSIVE INCOME
Statement of consolidated comprehensive income
CaptionsGross
amountIncome tax
Profit (Loss) for the period X X
Oher income components
Available-for-sale financial assets (42 780) 14 169
a) fair value changes (45 652) 15 030
b) reversal to the income statement 2 542 ( 835)
- value adjustments due to deterioration
- profits/losses on disposal 2 542 ( 835)
330 ( 26)
Foreign investment hedge:
a) fair value changes
b) reversal to the income statement
a)fair value changes
b) reversal to the income statement
485
a) fair value changes
b) reversal to the income statement
485
a) fair value changes
b) reversal to the income statement
Actuarial profits (losses) on defined benefit plans 13 ( 3)
Share of valuation reserve of equity investments
(4 748)
a) fair value changes (4 748)
b) reversal to the income statement
- value adjustments due to deterioration
- profits/losses on disposal
Total other income components (47 030) 14 166
Comprehensive income (10+110) X XConsolidated comprehensive income attributable to
X X
Consolidated comprehensive income attributableX X
onsolidated financial statements
117
Income tax Net amount
45 891
14 169 (28 611)
15 030 (30 622)
( 835) 1 707
( 835) 1 707
( 26) 304
485
485
( 3) 10
(4 748)
(4 748)
14 166 (32 864)
13 027
( 197)
12 830

PART E – INFORMATION ON RISKS AND THE RELATED HEDGING POLICIES
SECTION 1 – THE BANKING GROUP RISK
1.1 Credit risk
Qualitative information
1. 1. General aspects
The Group’s lending activity has developed in line with the management policies laiddirected at local economies and mainly carried on in the retail, small business and smallmarkets. Lending is directed at the corporate market to a lesser extent.The activities directed at private and smallinclude products substantially relating to: loans and deposits under any form; financial, banking and paymentservices; financial, insurance and asset management products; debit and credit cThe activities intended for mediumrelating to: loans and deposits under any form; financial, banking and payment services; documentary credit;leasing and factoring.Commercial policy is pursued through the peripheral branch network and in the geographical areas in which theGroup has a traditional presence, the objectives being the constant consolidation of its position, and in its newmarkets, in order to acquire new market sFor some specific products (targeted personal loans, leasing), activities are also conducted by means ofauthorised operators.
2. Policies for the management of credit risks
2.1 Organisational aspects
The factors that give rise to credit risk are related to the possibility of an unexpected variation in thecreditworthiness of a counter-party to which there is exposure generating a corresponding unexpected variation inthe market value of the debt. For this reason, a credit risk must be considered as arising not only as a result of thepossibility of a counter-party’s insolvency, but also as a result of a mere worsening of its creditworthiness.The Group’s organisational structure ensures a satisadopting a policy of separating business and control functions.The Board of Directors of the Parent Company is assigned, on an exclusive basis, the tasks and powers relatedto the determination of the policies which affect the general operation of the company and of the Groupregards internal controls, the Board of Directors approves the strategic direction and risk management policies, aswell as the organisational structure ofIn the exercise of its responsibilities concerning direction and coordination, the Board of Directors of Banco Desioe della Brianza S.p.A., in its capacity as Parent Company, establishes any concrete procedures to implement thecontrol levels envisaged, taking account of the nature and size of the business conducted by the subsidiary.
2.2 Management, measurement and control systems
The credit risk management, measurement and control systems develop in an organisational framework thatinvolves the entire credit process cycle, from the informationphase of revocation and recovery.The organisational structure and the risk management, measurement and control systems of the Italian banks inthe Group are the same as those of the Parent Company, in which the outsourcing functions for subsidiaries areconcentrated.The Banco Desio Group adopts, for management purposes in view of the Risk Management, an internal ratingmodel (C.R.S. Credit Rating System), developed witcertain risk classes with similar default probabilities. This system represents an analytical model for measuring the
Notes to the consolidated
INFORMATION ON RISKS AND THE RELATED HEDGING POLICIES
THE BANKING GROUP RISK
Qualitative information
The Group’s lending activity has developed in line with the management policies laid down in the Business Plan,directed at local economies and mainly carried on in the retail, small business and smallmarkets. Lending is directed at the corporate market to a lesser extent.The activities directed at private and small business customers (artisans, producing families, professionals)include products substantially relating to: loans and deposits under any form; financial, banking and paymentservices; financial, insurance and asset management products; debit and credit cards.The activities intended for medium-to-large enterprises and finance companies include products substantiallyrelating to: loans and deposits under any form; financial, banking and payment services; documentary credit;
l policy is pursued through the peripheral branch network and in the geographical areas in which theGroup has a traditional presence, the objectives being the constant consolidation of its position, and in its newmarkets, in order to acquire new market shares and to facilitate an increase in turnover.For some specific products (targeted personal loans, leasing), activities are also conducted by means of
Policies for the management of credit risks
The factors that give rise to credit risk are related to the possibility of an unexpected variation in theparty to which there is exposure generating a corresponding unexpected variation in
bt. For this reason, a credit risk must be considered as arising not only as a result of theparty’s insolvency, but also as a result of a mere worsening of its creditworthiness.
The Group’s organisational structure ensures a satisfactory process to watch over and manage credit risk,adopting a policy of separating business and control functions.
Parent Company is assigned, on an exclusive basis, the tasks and powers relatedpolicies which affect the general operation of the company and of the Group
regards internal controls, the Board of Directors approves the strategic direction and risk management policies, aswell as the organisational structure of the bank.
rcise of its responsibilities concerning direction and coordination, the Board of Directors of Banco Desioe della Brianza S.p.A., in its capacity as Parent Company, establishes any concrete procedures to implement the
account of the nature and size of the business conducted by the subsidiary.
Management, measurement and control systems
The credit risk management, measurement and control systems develop in an organisational framework thatprocess cycle, from the information-gathering stage to periodical review and the final
phase of revocation and recovery.The organisational structure and the risk management, measurement and control systems of the Italian banks in
s those of the Parent Company, in which the outsourcing functions for subsidiaries are
The Banco Desio Group adopts, for management purposes in view of the Risk Management, an internal ratingmodel (C.R.S. Credit Rating System), developed within the Group, capable of classifying each counterparty incertain risk classes with similar default probabilities. This system represents an analytical model for measuring the
Notes to the consolidated financial statements
118
INFORMATION ON RISKS AND THE RELATED HEDGING POLICIES
down in the Business Plan,directed at local economies and mainly carried on in the retail, small business and small-to-medium enterprises
business customers (artisans, producing families, professionals)include products substantially relating to: loans and deposits under any form; financial, banking and payment
large enterprises and finance companies include products substantiallyrelating to: loans and deposits under any form; financial, banking and payment services; documentary credit;
l policy is pursued through the peripheral branch network and in the geographical areas in which theGroup has a traditional presence, the objectives being the constant consolidation of its position, and in its new
hares and to facilitate an increase in turnover.For some specific products (targeted personal loans, leasing), activities are also conducted by means of
The factors that give rise to credit risk are related to the possibility of an unexpected variation in theparty to which there is exposure generating a corresponding unexpected variation in
bt. For this reason, a credit risk must be considered as arising not only as a result of theparty’s insolvency, but also as a result of a mere worsening of its creditworthiness.
factory process to watch over and manage credit risk,
Parent Company is assigned, on an exclusive basis, the tasks and powers relatedpolicies which affect the general operation of the company and of the Group. As
regards internal controls, the Board of Directors approves the strategic direction and risk management policies, as
rcise of its responsibilities concerning direction and coordination, the Board of Directors of Banco Desioe della Brianza S.p.A., in its capacity as Parent Company, establishes any concrete procedures to implement the
account of the nature and size of the business conducted by the subsidiary.
The credit risk management, measurement and control systems develop in an organisational framework thatgathering stage to periodical review and the final
The organisational structure and the risk management, measurement and control systems of the Italian banks ins those of the Parent Company, in which the outsourcing functions for subsidiaries are
The Banco Desio Group adopts, for management purposes in view of the Risk Management, an internal ratinghin the Group, capable of classifying each counterparty in
certain risk classes with similar default probabilities. This system represents an analytical model for measuring the

default risk, which uses statistical inference methods based on the subjectivisprobability theory). The application of this model allows a rating to be assigned based on the sources ofinformation used and the segment of the borrower (retail/corporate); in particular, the segmentation criteria of thecounterparties are set taking into account the business sector, the legal status and the sales volumes (ifapplicable) of the counterparty. There are eight rating classes for performing counterparties (from AAA to CC),while there are three classes represenThe Group followed the rules laid down in the legislation regarding the standardised method for the calculation ofregulatory capital requirements to meet credit risk
2.3 Credit risk mitigation techniques
While developing the operational process leading to the disbursement of a loan, even if it is considered that thenecessary requirements have been met, whenever possible the Group obtains additional real and/or personalsecurities in order to mitigate risk.Mortgages have proved to be the prevailing form of collateral, mainly in the technical form of mortgage loans (inparticular loans raised on residential properties). Pledges in financial instruments and/or cash are also to be founto a lesser extent, although still at significant levels.The guarantees received by the Groupand based on case law guidelines and approved by the competent corporatemanagement process, in compliance with the requirements in the new regulations, provides for monitoringactivities and specific internal monitoring with a view to the verification of eligibility.To date, the Group has not used csecuritisation transactions.
2.4 Impaired financial assets
The transfer to the non-performing loan category takes place when, in the light of the objective elements at thedisposal of the competent office, a customer becomes unable to meet its commitments and thus enters a state ofinsolvency, even one that has not been declared by a court.
Loans to customers are classified as problem loans in consideration of the extent oobjective impossibility of reaching an amicable settlement, of failure to comply with the repayment plans that havebeen defined and the need to take timely legal action in order to safeguard the credit effectively. In anproblem loans include exposures with specific characteristics described by the supervisory provisions.
As to the classification under restructured loans, either cash or “offsupervisory provisions, analytically assessing the presence of the requirements prescribed by the regulations
Positions which are overdue are kept under constant review bycomputerised procedures.
Value adjustments are made on theIn fact, loss forecasts represent the synthesis of more than one factor deriving from various assessments (bothinternal and external) of the capital that is available to the mainmonitoring is constant and organic and in any event related to how individual positions develop. The time elementin the discounting-back of impaired loans is determined based on specific valuations of each sector ocarried out on the basis of the information relating to the various court districts
Notes to the consolidated
default risk, which uses statistical inference methods based on the subjectivist theory (or on the conditionedprobability theory). The application of this model allows a rating to be assigned based on the sources ofinformation used and the segment of the borrower (retail/corporate); in particular, the segmentation criteria of theounterparties are set taking into account the business sector, the legal status and the sales volumes (if
applicable) of the counterparty. There are eight rating classes for performing counterparties (from AAA to CC),while there are three classes representing non-performing loans (expired, problem and nonThe Group followed the rules laid down in the legislation regarding the standardised method for the calculation ofregulatory capital requirements to meet credit risk.
mitigation techniques
While developing the operational process leading to the disbursement of a loan, even if it is considered that thenecessary requirements have been met, whenever possible the Group obtains additional real and/or personal
n order to mitigate risk.Mortgages have proved to be the prevailing form of collateral, mainly in the technical form of mortgage loans (inparticular loans raised on residential properties). Pledges in financial instruments and/or cash are also to be founto a lesser extent, although still at significant levels.The guarantees received by the Group are drawn up on contractual forms, in line with the standards for the sectorand based on case law guidelines and approved by the competent corporate departmentsmanagement process, in compliance with the requirements in the new regulations, provides for monitoringactivities and specific internal monitoring with a view to the verification of eligibility.To date, the Group has not used credit derivatives to hedge or transfer credit risks and has carried out no direct
Impaired financial assets
performing loan category takes place when, in the light of the objective elements at thedisposal of the competent office, a customer becomes unable to meet its commitments and thus enters a state ofinsolvency, even one that has not been declared by a court.
Loans to customers are classified as problem loans in consideration of the extent of the risk that has arisen, of theobjective impossibility of reaching an amicable settlement, of failure to comply with the repayment plans that havebeen defined and the need to take timely legal action in order to safeguard the credit effectively. In anproblem loans include exposures with specific characteristics described by the supervisory provisions.
As to the classification under restructured loans, either cash or “off-balance sheet“, the Group complies with theically assessing the presence of the requirements prescribed by the regulations
are kept under constant review by the functions responsible
Value adjustments are made on the basis of measurement criteria and methods that are objective and prudent.In fact, loss forecasts represent the synthesis of more than one factor deriving from various assessments (bothinternal and external) of the capital that is available to the main debtor and any guarantors. Loss forecastmonitoring is constant and organic and in any event related to how individual positions develop. The time element
back of impaired loans is determined based on specific valuations of each sector ocarried out on the basis of the information relating to the various court districts.
Notes to the consolidated financial statements
119
t theory (or on the conditionedprobability theory). The application of this model allows a rating to be assigned based on the sources ofinformation used and the segment of the borrower (retail/corporate); in particular, the segmentation criteria of theounterparties are set taking into account the business sector, the legal status and the sales volumes (if
applicable) of the counterparty. There are eight rating classes for performing counterparties (from AAA to CC),performing loans (expired, problem and non-performing loans).
The Group followed the rules laid down in the legislation regarding the standardised method for the calculation of
While developing the operational process leading to the disbursement of a loan, even if it is considered that thenecessary requirements have been met, whenever possible the Group obtains additional real and/or personal
Mortgages have proved to be the prevailing form of collateral, mainly in the technical form of mortgage loans (inparticular loans raised on residential properties). Pledges in financial instruments and/or cash are also to be found
are drawn up on contractual forms, in line with the standards for the sectordepartments. The guarantee
management process, in compliance with the requirements in the new regulations, provides for monitoring
redit derivatives to hedge or transfer credit risks and has carried out no direct
performing loan category takes place when, in the light of the objective elements at thedisposal of the competent office, a customer becomes unable to meet its commitments and thus enters a state of
f the risk that has arisen, of theobjective impossibility of reaching an amicable settlement, of failure to comply with the repayment plans that havebeen defined and the need to take timely legal action in order to safeguard the credit effectively. In any caseproblem loans include exposures with specific characteristics described by the supervisory provisions.
balance sheet“, the Group complies with theically assessing the presence of the requirements prescribed by the regulations.
responsible with the help of specific
basis of measurement criteria and methods that are objective and prudent.In fact, loss forecasts represent the synthesis of more than one factor deriving from various assessments (both
debtor and any guarantors. Loss forecastmonitoring is constant and organic and in any event related to how individual positions develop. The time element
back of impaired loans is determined based on specific valuations of each sector of activity

Quantitative information
A. Credit quality
A.1 Performing and impaired loans: amounts, value adjustments, changes, breakgeographical area
A.1.1 Loans: break-down by portfolio and credit quality (book values)
1. Financial assets held for trading
2. Available-for-sale financial assets
3. Held-to-maturity investments
4. Amount due from banks
5. Amounts due from customers
6. Financial assets at fair value through
profit o r loss
7. Financial assets under disposal
8. Hedging derivatives
Total 31/12/2011
Total 31/12/2010
Portfo lio / Quality
Notes to the consolidated
Performing and impaired loans: amounts, value adjustments, changes, break
down by portfolio and credit quality (book values)
Non-
performing
loans
Problem
loans
Restructured
loans
Expired
loansOther assets Impaired
17,419
110 842,409
124,626
282,375
124,676 104,553 3,921 34,948 6,312,332
5,631
124,786 104,553 3,921 34,948 7,584,792
89,538 78,907 4,119 31,759 7,506,719
Banking Group
Notes to the consolidated financial statements
120
Performing and impaired loans: amounts, value adjustments, changes, break-down by type and
Impaired Others
17,419
33,345 875,864
124,626
6,150 288,525
20 6,580,450
5,631
39,515 7,892,515
31,779 7,742,821
Other companies
T o tal

A.1.2 Loans: break-down by portfolio and credit quality (gross and net values)
Breakdown of performing assets
The item “Amounts due from customers” includes net receivables arising from renegotiations within Collectiveagreements for Euro 28.5 million and Euro 404.by maturity date is reported.
A. Group Bank
1. Financial assets held for trading
2. Available-for-sale f inancial assets
3. Held-to-maturity investments
4. Amount due from banks
5. Amounts due from customers
6. Financial assets at fair value through prof it
or loss
7. Financial assets under disposal
8. Hedging derivatives
Total A
B. Other companies included in the
consolidation
1. Financial assets held for trading
2. Available-for-sale f inancial assets
3. Held-to-maturity investments
4. Amount due from banks
5. Amounts due from customers
6. Financial assets at fair value through prof it
or loss
7. Financial assets under disposal
8. Hedging derivatives
Totale B
Total 31/12/2011
Total 31/12/2010
Portfolio / Quality
. Amounts due from customers
of which . Expired loans
. Until 3 months
. Betw een 3 and 5 months
. Betw een 6 months and 1 year
. Beyond 1 year
Portfolio/quality
Notes to the consolidated
down by portfolio and credit quality (gross and net values)
Breakdown of performing assets
The item “Amounts due from customers” includes net receivables arising from renegotiations within Collectivemillion and Euro 404.9 million for expired loans, for which the breakdown of the same
Gross
exposure
Spacif ic
adjustments
Net
exposure
Gross
exposure
Portfolio
adjustments
17,419
110 110 842,409
124,626
282,375
377,779 (109,681) 268,098 6,343,221 (30,889)
6. Financial assets at fair value through prof it
5,631
377,889 (109,681) 268,208 7,615,681 (30,889)
33,345
6,150
20
6. Financial assets at fair value through prof it
Totale B 39,515
377,889 (109,681) 268,208 7,655,196 (30,889)
303,559 (99,236) 204,323 7,570,190 (32,486)
Impaired assets Performing assets
. Amounts due from customers 6,343,221 (30,889) 6,312,332
409,509 (4,616) 404,893
364,640 (3,899) 360,741
. Betw een 3 and 5 months 40,956 (605) 40,351
. Betw een 6 months and 1 year 3,509 (97) 3,412
404 (15) 389
Performing loans
Gross
exposure
Portfolio
adjustmentsNet exposure
Notes to the consolidated financial statements
121
The item “Amounts due from customers” includes net receivables arising from renegotiations within Collectivefor expired loans, for which the breakdown of the same
Portfolio
adjustments
Net
exposure
17,419 17,419
842,409 842,519
124,626 124,626
282,375 282,375
(30,889) 6,312,332 6,580,430
5,631 5,631
(30,889) 7,584,792 7,853,000
33,345 33,345
6,150 6,150
20 20
39,515 39,515
(30,889) 7,624,307 7,892,515
(32,486) 7,537,704 7,742,027
Total
(net
exposure)
Performing assets

A.1.3 Banking group - Cash and off
A.1.4 Banking group – Cash and off
None at the reference date.
A.1.5 Banking group – Cash and off
None at the reference date.
A.1.6 Banking group - Cash and off
Type/Amount
A . C ash lo ans
b) Non-perfo rming loans
c) Restructured loans
d) Expired loans
e) Other assets
Total A
A . C ash lo ans
a) P ro blem lo ans
c) Restructured loans
d) Expired loans
T o ta l B
T o ta l (A +B )
Type/Amount
A. Cash loans
a) Problem loans
b) Non-performing loans
c) Restructured loans
d) Expired loans
e) Other assets
Total A
B. Off-balance sheet loans
a) Impaired assets
b) Other
Total B
Total (A+B)
Notes to the consolidated
Cash and off-balance sheet loans to banks: gross and net values
ash and off-balance sheet loans to banks: change in impaired
and off-balance sheet loans to banks: changes in overall impairments
Cash and off-balance sheet loans to customers: gross and net values
Gross
exposure
Specific value
adjustments
Portfo lio value
adjustmentsNet exposure
509,097 509,097
509,097 509,097
20,914 (45) 20,869
20,914 (45) 20,869
530,011 (45) 529,966
Gross exposure Specif ic value
adjustments
Portfolio value
adjustments
202,459 (77,673)
134,936 (30,383)
4,361 (440)
36,133 (1,185)
7,097,063 (30,889)
7,474,952 (109,681) (30,889)
10,067 (368)
411,208 (913)
421,275 (368) (913)
7,896,227 (110,049) (31,802)
Notes to the consolidated financial statements
122
balance sheet loans to banks: gross and net values
change in impaired loans - gross
in overall impairments
balance sheet loans to customers: gross and net values
Net exposure
509,097
509,097
20,869
20,869
529,966
Portfolio value
adjustments
Net exposure
124,786
104,553
3,921
34,948
(30,889) 7,066,174
(30,889) 7,334,382
9,699
(913) 410,295
(913) 419,994
(31,802) 7,754,376

A.1.7 Banking group – Cash loans to customers:
A.1.8 Banking group – Cash loans to customers: changes in total value adjustments
Type / Category
A. Opening gross exposure
of w hich: loans sold but not
w ritten off
B. Increases
b.1 from performing loans
B.2 transfer from other categories
of impaired loans
B.3 other increases
C. Decreases
c.1 to performing loans
C.2 w rite-offs
C.3 collections
C.4 arising from sales
C.5 transfer to other categories of
impaired loans
C.6 other decreases
D. Closing gross exposure
of w hich: loans sold but not
w ritten off
Type/Category
A. Total opening adjustments
of w hich: loans sold but not
w ritten off
B. Increases
B.1 adjustments
B.2 transfer from other categories
of impaired loans
B.3 other increases
C. Decreases
C.1 w rite-backs due to valuation
C.2 w rite-backs due to collection
C.3 w rite-offs
C.4 transfer to other categories of
impaired loans
C.5 other decreases
D. Total closing adjustments
of w hich: loans sold but not
w ritten off
Notes to the consolidated
Cash loans to customers: changes in impaired loans – gross
Cash loans to customers: changes in total value adjustments
Non-
performing
loans
Problem
loans
Restructured
loans
Expired
loans
156,940 109,126 4,553 32,904
99,503 154,285 1,309 118,215
8,237 96,029 267 110,556
B.2 transfer from other categories
88,052 28,227 383 930
3,214 30,029 659 6,729
53,984 128,475 1,501 114,986
13,695 54,723
32,297 14 1
21,461 33,006 1,501 24,619
38
C.5 transfer to other categories of
188 81,760 35,643
202,459 134,936 4,361 36,133
Non-
performing
loans
Problem
loansRestructured
loans
Expired
loans
A. Total opening adjustments 67,402 30,228 434 1,172
- - - -
53,640 21,553 249 1,226
37,449 21,322 87 1,139
B.2 transfer from other categories15,778 230 162 86
413 1 - 1
43,369 21,398 243 1,213
6,093 3,803 159 697
4,979 1,617 84 223
32,297 14 - 1
C.4 transfer to other categories of
- 15,964 - 292
- - - -
77,673 30,383 440 1,185
- - - -
Notes to the consolidated financial statements
123

A.2 Break-down of exposures based on external ratings
A.2.1 Break-down of cash and off
In accordance with the compilation regulations laid down by the Bank of Italy, this table has not been filled inbecause the amount of exposure with external ratings is modest
A.2.2 Break-down of cash and off
The Group does not use internal rating models for the determination of capital requirements.As outlined in the section dedicated to qualitative information (paragraph 2.2), the Parent Company hasdeveloped, for management purposes, a rating model aimed at assessing retail clients (private consumers andmicro enterprises) and Corporate clients (enterprises with a turnover of over Euro 1million).The following table shows, as regards the performing loans belongiweight of each rating class on the aggregate
Cash loans
Off-balance sheet loans
Loans at 31.12.2011
Notes to the consolidated
down of exposures based on external ratings
down of cash and off-balance sheet loans by classes of external ratings (book values)
In accordance with the compilation regulations laid down by the Bank of Italy, this table has not been filled inbecause the amount of exposure with external ratings is modest.
down of cash and off-balance sheet loans by classes of internal ratings
The Group does not use internal rating models for the determination of capital requirements.As outlined in the section dedicated to qualitative information (paragraph 2.2), the Parent Company has
r management purposes, a rating model aimed at assessing retail clients (private consumers andmicro enterprises) and Corporate clients (enterprises with a turnover of over Euro 1million).The following table shows, as regards the performing loans belonging to the above mentioned segments, theweight of each rating class on the aggregate.
35.90%
61.90%
45.10%
30.40%
from AAA to A from BBB to B from CCC to CC
Internal rating classes
Notes to the consolidated financial statements
124
external ratings (book values)
In accordance with the compilation regulations laid down by the Bank of Italy, this table has not been filled in
The Group does not use internal rating models for the determination of capital requirements.As outlined in the section dedicated to qualitative information (paragraph 2.2), the Parent Company has
r management purposes, a rating model aimed at assessing retail clients (private consumers andmicro enterprises) and Corporate clients (enterprises with a turnover of over Euro 1million).
ng to the above mentioned segments, the
19.00%
7.70%
100%
100%
from CCC to CC Total

A.3 Breakdown of guaranteed loans by type of guarantee
A.3.1 Banking group – Secured loans to banks
None at the reference date.
A.3.2 Banking group – Secured loans to customers
Property Securities
1.1fully secured 4,465,121 7,017,964 482,937
- of which impaired 202,635 376,787 9,343
1.2 partially secured 220,288 9,298 49,014
- of which impaired 10,582 103 717
2.1fully secured 160,049 48,005 14,965
- of which impaired 3,258 1,750
2.2 partially secured 34,927 10,133
- of which impaired 65 39
2. Secured o ff -balance sheet
lo ans :
Net amount o f
loan
Real Guarantees
1. Secured cash lo ans:
Notes to the consolidated financial statements
Breakdown of guaranteed loans by type of guarantee
loans to customers
Securities Other real
guarantees
CLN Governme
nts and
Central
banks
Other
public
entities
Banks Other
entities
Governme
nts and
Central
banks
Other
public
entities
482,937 119,977
2,591
49,014 23,344
1,149
14,965 13,091
134
10,133 3,015
Real GuaranteesPersonal Guarantees
Credit derivates Endorsements
Other derivates
125
Banks Other
entities
2,791 3,979,888 11,603,557
431,834 820,555
76,747 158,403
6,795 8,764
192,986 269,047
3,681 5,565
7,237 20,385
10 49
T o ta l
Endorsements

B. Break-down and concentration of loans
B.1 Banking group – Cash and off-balance sheet loans to customers: break
Net exposure
Specif ic
value
adjust ments
Port f olio
value
adjust ment s
Net exposure
Spacif ic
value
adjust ments
Port f olio
value
adjust ment s
A . Ca sh l oa ns
A.1 Non-perf orming loans
A.2 Problem loans
A.3 Rest ruct ured loans
A.4 Expired loans
A.5 Ot her loans 713,498 3,734
Tot a l A 713,498 3,734
B . Of f - ba l a nc e
she e t l oa ns
B.1 Non-perf orming loans
B.2 Problem loans
B.3 Ot her impaired asset s
B.4 Ot her loans 25,000
Tot a l B 25,000
Tot a l ( A +B ) 2 0 11 738,498 3,734
Tot a l 2 0 10 583,722 (1) (59) 87,406 (112) (124)
Loan / Counterparty
Government s Other public ent it ies
Notes to the consolidated financial statements
balance sheet loans to customers: break-down by sector (book value)
Net exposure
Specif ic
value
adjust ment s
Port f olio
value
adjust ment s
Net exposure
Spacif ic
value
adjust ment s
Port f olio
value
adjustment s
Net exposure
Specif ic
value
adjust ment s
Port f olio
value
adjustment s
Net exposure
128 (40) 86,202 (56,388)
191 (110) 57,330 (16,794)
3,921 (440)
17,034 (673)
119,189 (249) 24,711 (85) 3,973,982 (24,909)
119,508 (150) (249) 24,711 (85) 4,138,469 (74,295) (24,909)
114 (58)
1,500 3,339 (50)
2,100
6,642 (8) 873 (2) 319,190 (805)
8,142 (8) 873 (2) 324,743 (108) (805)
127,650 (150) (257) 25,584 (87) 4,463,212 (74,403) (25,714)
95,691 (73) (235) 58,638 (21) 4,599,546 (70,853) (27,500)
Financial inst it ut ions Insurance company Non f inancial companies
126
Net exposure
Spacif ic
value
adjust ment s
Port folio
value
adjustment s
38,456 (21,245)
47,032 (13,479)
17,914 (512)
2,231,060 (5,646)
2,334,462 (35,236) (5,646)
453 (85)
1,229 (174)
964 (1)
58,590 (98)
61,236 (260) (98)
2,395,698 (35,496) (5,744)
2,095,017 (28,316) (5,557)
Other ent it ies

B.2 Banking group - Cash and off-balance sheet loans to customers: break
Net exposure Total value
adjustments
A . C ash lo ans
A.1 Non-performing loans 124,676 (77,673)
A.2 Problem loans 104,553 (30,383)
A.3 Restructured loans 3,921 (440)
A.4 Expired loans 34,948 (1,185)
A.5 Other loans 7,039,341 (30,634)
T o tal A 7,307,439 (140,315)
B . Off-balance sheet lo ans
B.1 Non-performing loans 567 (143)
B.2 Problem loans 6,068 (224)
B.3 Other impaired assets 3,064 (1)
B.4 Other loans 403,608 (913)
T OT A L B 413,307 (1,281)
T OT A L (A +B ) 2011 7,720,746 (141,596)
T OT A L 2010 7,487,149 (132,603)
Loans / Geographical areas
Italy
Notes to the consolidated financial statements
balance sheet loans to customers: break-down by geographical area (book value)
Net exposure Total value
adjustments
Net exposure Total value
adjustments
Net exposure Total value
adjustments
Net exposure
110
24,448 (237) 1,669 (5) 715 (13)
24,448 (237) 1,779 (5) 715 (13)
5,853 684
5,853 684
30,301 (237) 2,463 (5) 715 (13)
26,049 (218) 6 ,103 (30) 719
Rest of the worldOther European Countries America Asia
127
Net exposure Total value
adjustments
1
1
150
150
151
Rest of the world

B.3 Banking group - Cash and off-balance sheet loans to banks: break
Net
exposure
Total value
adjustments
A . C ash lo ans
A.1 Non-performing loans
A.2 Problem loans
A.3 Restructured loans
A.4 Expired loans
A.5 Other loans 348,908
T OT A L 348,908
B . Off -balance sheet lo ans
B.1 Non-performing loans
B.2 Problem loans
B.3 Other impaired assets
B.4 Other loans 14,684
T OT A L 14,684
T OT A L 2011 363,592
T o ta l 2010 547,105 (256)
Loans / Geographical areas
Italy
Notes to the consolidated financial statements
balance sheet loans to banks: break-down by geographical area (book value)
Total value
adjustments
Net
exposure
Total value
adjustments
Net
exposure
Total value
adjustments
Net
exposure
Total value
adjustments
Net
exposure
Total value
adjustments
159,397 597 87 108
159,397 597 87 108
6,079 2 83 (36) 21
6,079 2 83 (36) 21
165,476 599 170 (36) 129
(256) 142,702 969 611 (38) 1,572
Rest o f the worldOther European
CountriesAmerica Asia
128
Total value
adjustments
(9)
(9)
(9)
(120)
Rest o f the world

B.4 Large risks
With reference to the supervisory regulationswith a total nominal amount of Euro 713.
Notes to the consolidated
With reference to the supervisory regulations 1 position was recorded, referring to the Ministry of the Treasurya total nominal amount of Euro 713.5 million, and a weighted value of nil.
Notes to the consolidated financial statements
129
1 position was recorded, referring to the Ministry of the Treasury,

C. SECURITIZATION TRANSACTIONS AND ASSET DISPOSAL
C.1 Securitization transactions
Quantitative information
C.1.1 Banking group - Loans arising from securitization transactions divided by quality of the underlying assets
C.1.2 Banking group – Loans arising from the main “Bank”
None at the reference date.
C.1.3 Banking group - Loans arising from main “third party” securitization
Gross
exposure
Net
exposure
Gross
exposure
Net
exposure
Gross
exposure
A . W it h o wn und er lying asset s
a) impaired
b) other
B . W it h t hird par t y und er lying asset s
a) impaired
b) other 721 721
M ezzanineUnderlying asset quality /
Loans
Cash loans
Senior
Gross
exposure
Net
exposure
Gross
exposure
Net
exposure
Gross
exposure
A .1 F .I .P. 2 6 .0 4 .2 5
Property 721
Underlying asset type /
Loans
Cash loans
Senior M ezzanine
Notes to the consolidated financial statements
SECURITIZATION TRANSACTIONS AND ASSET DISPOSAL
Loans arising from securitization transactions divided by quality of the underlying assets
“Bank” securitization transactions divided by type of securitized assets and by type of exposure
Loans arising from main “third party” securitization transactions divided by type of securitized assets and of loan
Gross
exposure
Net
exposure
Gross
exposure
Net
exposure
Gross
exposure
Net
exposure
Gross
exposure
Net
exposure
Gross
exposure
Net
exposure
Junior Senior M ezzanine Junior Senior
Guarantees granted
Gross
exposure
Net
exposure
Gross
exposure
Net
exposure
Gross
exposure
Net
exposure
Gross
exposure
Net
exposure
Gross
exposure
Net
exposure
Guarantees granted
Junior Senior M ezzanine Junior Senior
130
assets and by type of exposure
transactions divided by type of securitized assets and of loan
Net
exposure
Gross
exposure
Net
exposure
Gross
exposure
Net
exposure
M ezzanine Junior
Credit lines
Net
exposure
Gross
exposure
Net
exposure
Gross
exposure
Net
exposure
Junior
Credit lines
M ezzanine
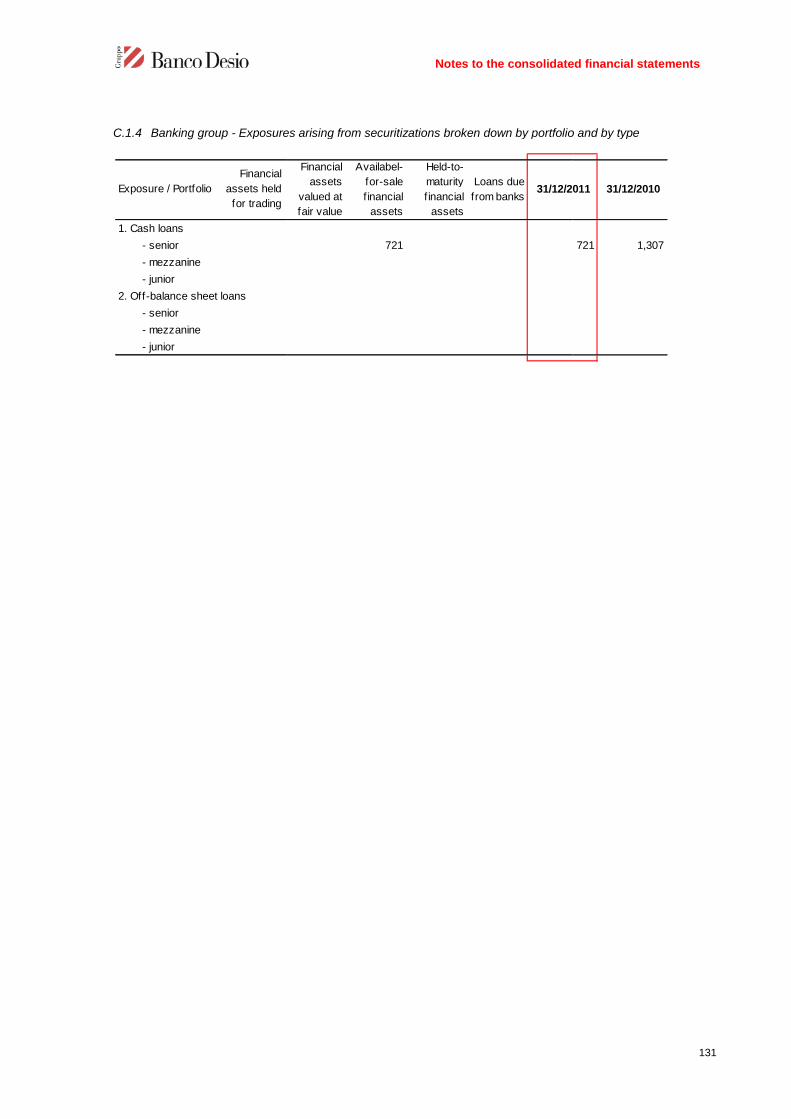
C.1.4 Banking group - Exposures arising from securitizations broken down by portfolio and by type
Exposure / Portfolio
Financial
assets held
for trading
1. Cash loans
- senior
- mezzanine
- junior
2. Off-balance sheet loans
- senior
- mezzanine
- junior
Notes to the consolidated
Exposures arising from securitizations broken down by portfolio and by type
Financial
assets
valued at
fair value
Availabel-
for-sale
financial
assets
Held-to-
maturity
f inancial
assets
Loans due
from banks31/12/2011
721
Notes to the consolidated financial statements
131
Exposures arising from securitizations broken down by portfolio and by type
31/12/2011 31/12/2010
721 1,307

C.2 Asset disposals
C.2.1 Banking group - Financial assets sold but not written off
Key:A = Transferred financial assets which are fully recognised (book value)B = Transferred financial assets which are partially recognised (book value)C = Transferred financial assets which are partially recognised (full value)
Financial assets held for t radingFinancial assets at fair value
through prof it and loss
A B C A B C
A . C ash asset s
1. Debt securit ies 6,049
2. Equity securit ies
3. U.C.I.T.S
4. Financing
B . D erivat ive
inst rument s
To t al 3 1/ 12 / 2 0 11 6 ,0 4 9
of which impaired
To t al 3 1/ 12 / 2 0 10 3 52
of which impaired
Notes to the consolidated financial statements
Financial assets sold but not written off
Transferred financial assets which are fully recognised (book value)Transferred financial assets which are partially recognised (book value)
which are partially recognised (full value)
Financial assets at fair value Availabile-for-sale financial
assets
Held-to-maturity f inancial
assetsLoans due from banks Loans due from customers
A B C A B C A B C A B
35,059
3 5,0 59
12 3 ,3 78 3 3 ,3 3 8
132
Loans due from customers T ot al
C 3 1/ 12 / 2 0 11 3 1/ 12 / 2 0 10
4 1,10 8 157,0 6 8
4 1,10 8 157,0 6 8
157,0 6 8

C.2.2 Banking group - Financial liabilities against financial assets sold but not written off
D. Banking Group - Credit risk measurement models
1.2 Banking group - market
1.2.1 Interest rate risk and price risk
Qualitative information
A. General aspects
The unexpected variations in market rates, when there are differences in maturity dates and in the times at whichinterest rates on assets and liabilities are reviewed, give rise to a variation in net interest flow and thus in interestmargin. Furthermore, such unexpected fluctuations expose the bank to variations in the economic value of assetsand liabilities.The information contained in this section refers solely to the Italian banks of the Group, given the irrelevance ofthe assets held by the other companies.The Group adopted, in the financial year just ended, a strategy aimed at consolidating a return in line with thebudget, while ensuring a low risk profile through a low portfolio duration
B. Interest rate risk and price risk management processes and measurement methods
In exercising its responsibilities of direction and coordination, the Board of Directors of Banco
S.p.A., in its capacity as Parent Company, has issued specific rules for controls at the various levels of all the
banking Group companies.
The operational activity of the Parent Company’s Finance
the internal control system monitors both operating limits (in terms of amount and composition by type of
securities) and interest rate risk and price risk. Specifically, duration limits are laid down in order to limit interest
rate risk. On a daily basis, the Head Office is informed with operations and amounts in portfolios, as well as when
operating limits have been reached.
Liabilit ies / Assets portfolioFinancial assets
held for t rading
1. D ue t o cust o mers
a) corresponding to fully
recorded assets 6,048
b) corresponding to partially
recorded assets
2 . Due t o banks
a) corresponding to fully
recorded assets
b) corresponding to partially
recorded assets
3 . Securit ies issued
a) corresponding to fully
recorded assets
b) corresponding to partially
recorded assets
To t al 3 1/ 12 / 2 0 11 6 ,0 4 8
To t al 3 1/ 12 / 2 0 10 3 52
Notes to the consolidated
Financial liabilities against financial assets sold but not written off
Credit risk measurement models
market risks
Interest rate risk and price risk – Regulatory trading portfolio
The unexpected variations in market rates, when there are differences in maturity dates and in the times at whichon assets and liabilities are reviewed, give rise to a variation in net interest flow and thus in interest
margin. Furthermore, such unexpected fluctuations expose the bank to variations in the economic value of assets
contained in this section refers solely to the Italian banks of the Group, given the irrelevance ofthe assets held by the other companies.The Group adopted, in the financial year just ended, a strategy aimed at consolidating a return in line with the
get, while ensuring a low risk profile through a low portfolio duration.
Interest rate risk and price risk management processes and measurement methods
In exercising its responsibilities of direction and coordination, the Board of Directors of Banco
S.p.A., in its capacity as Parent Company, has issued specific rules for controls at the various levels of all the
The operational activity of the Parent Company’s Finance Department is only directed at the G
the internal control system monitors both operating limits (in terms of amount and composition by type of
securities) and interest rate risk and price risk. Specifically, duration limits are laid down in order to limit interest
isk. On a daily basis, the Head Office is informed with operations and amounts in portfolios, as well as when
operating limits have been reached.
Financial assets
held for t rading
Financial assets
valued at fair
value
Availabile-for-
sale f inancial
assets
Held-to-
maturity
f inancial assets
Loans due from
banks
Loans due from
customers
6,048
29,271
6 ,0 4 8 3 4 ,73 7
3 52 12 4 ,0 0 1 3 1,9 2 6 4 ,10 8
Notes to the consolidated financial statements
133
Financial liabilities against financial assets sold but not written off
The unexpected variations in market rates, when there are differences in maturity dates and in the times at whichon assets and liabilities are reviewed, give rise to a variation in net interest flow and thus in interest
margin. Furthermore, such unexpected fluctuations expose the bank to variations in the economic value of assets
contained in this section refers solely to the Italian banks of the Group, given the irrelevance of
The Group adopted, in the financial year just ended, a strategy aimed at consolidating a return in line with the
Interest rate risk and price risk management processes and measurement methods
In exercising its responsibilities of direction and coordination, the Board of Directors of Banco Desio e della Brianza
S.p.A., in its capacity as Parent Company, has issued specific rules for controls at the various levels of all the
is only directed at the Group’s Italian banks:
the internal control system monitors both operating limits (in terms of amount and composition by type of
securities) and interest rate risk and price risk. Specifically, duration limits are laid down in order to limit interest
isk. On a daily basis, the Head Office is informed with operations and amounts in portfolios, as well as when
Loans due from
customersT ot al
5,466 11,514
29,271 2 9 ,2 71
3 4 ,73 7 4 0 ,78 5
16 0 ,3 8 7

Together with the abovementioned controls, the Group has adopted the use of internal models, assigning the
monitoring and the measurement of interest rate risk and price risk to the risk management unit of the Parent
Company, which operates completely independently with respect to both operational offices and subsidiaries.
This activity only involves the Group’s
In order to quantify generic risks, the Group has adopted a model based on the Value at Risk (VaR) concept, in
order to express, synthetically and in monetary terms, the maximum
reference to a specific investment horizon and a specific level of confidence in normal market conditions. This
method has the advantage of allowing the aggregation of the various risk positions taken in th
heterogeneous risk factors, and also provides a synthetic number that is easy for the organisational unit concerned
to use because it is expressed in monetary terms.
This is a parametric model of a variance
for options, and uses a 99% confidence interval over a 10
defined by the Basel Committee. This model covers the assets, in term of financial instruments, incl
managed and trading portfolios, as defined in the regulations regarding reports to the Supervisory Board and
subject to the capital requirements for market risk.
The model uses matrixes containing the standard deviations of each risk factor (i
prices) together with the relevant correlations. The determination of volatilities and correlations is based on the
modelling under a normal scenario of the daily logarithmic returns of the risk factors, though the exponen
weighting based on a decline factor in a period corresponding to 250 observations. The application used for the
calculation of VaR is ALMpro, while the financial information necessary for the determination of VaR (volatility,
correlations, term structure of interest rates, exchange rates, stock and benchmark indices) is provided by the
RiskSize product.
To date, derivatives on currencies and interest rates and options on shares and indices entered into for trading
purposes are excluded from this analys
The VaR of equity instruments is measured considering the link (beta coefficient) between the trend of the single
instrument and that of its benchmark (stock or benchmark index for U.
Stress test activities are carried out using parallel shifts in the yield curve, assuming variations of +/
points only for interest rate sensitive holdings; the necessary research activities are being performed which will
lead to the implementation of “backtesting” analysis”.
Trading activity is subject to operating limits laid down by the Board of Directors of the Parent Company and
expressed for each delegation level in terms of VaR. Considering the composition of the portfolio
operating limits are laid down for subsidiaries. A special reporting system is the instrument that has been chosen to
give the organisational units involved sufficient information
on the objectives assigned to each party in the process.
financial year, the overall V.a.R limits relat
although they still fell within the
requirement on market risks.
Notes to the consolidated
Together with the abovementioned controls, the Group has adopted the use of internal models, assigning the
nitoring and the measurement of interest rate risk and price risk to the risk management unit of the Parent
Company, which operates completely independently with respect to both operational offices and subsidiaries.
This activity only involves the Group’s Italian banks, which account for nearly all the regulatory trading portfolio.
In order to quantify generic risks, the Group has adopted a model based on the Value at Risk (VaR) concept, in
order to express, synthetically and in monetary terms, the maximum probable loss incurred by a static portfolio with
reference to a specific investment horizon and a specific level of confidence in normal market conditions. This
method has the advantage of allowing the aggregation of the various risk positions taken in th
heterogeneous risk factors, and also provides a synthetic number that is easy for the organisational unit concerned
to use because it is expressed in monetary terms.
This is a parametric model of a variance-covariance type for “linear” instruments with a delta
for options, and uses a 99% confidence interval over a 10-day time horizon, in line with the recommendations
defined by the Basel Committee. This model covers the assets, in term of financial instruments, incl
managed and trading portfolios, as defined in the regulations regarding reports to the Supervisory Board and
subject to the capital requirements for market risk.
The model uses matrixes containing the standard deviations of each risk factor (interest rates, exchange rates and
prices) together with the relevant correlations. The determination of volatilities and correlations is based on the
modelling under a normal scenario of the daily logarithmic returns of the risk factors, though the exponen
weighting based on a decline factor in a period corresponding to 250 observations. The application used for the
calculation of VaR is ALMpro, while the financial information necessary for the determination of VaR (volatility,
ure of interest rates, exchange rates, stock and benchmark indices) is provided by the
To date, derivatives on currencies and interest rates and options on shares and indices entered into for trading
purposes are excluded from this analysis; almost all the business, however, is conducted on a brokerage basis.
The VaR of equity instruments is measured considering the link (beta coefficient) between the trend of the single
instrument and that of its benchmark (stock or benchmark index for U.C.I.T.S units).
Stress test activities are carried out using parallel shifts in the yield curve, assuming variations of +/
points only for interest rate sensitive holdings; the necessary research activities are being performed which will
the implementation of “backtesting” analysis”.
Trading activity is subject to operating limits laid down by the Board of Directors of the Parent Company and
expressed for each delegation level in terms of VaR. Considering the composition of the portfolio
operating limits are laid down for subsidiaries. A special reporting system is the instrument that has been chosen to
give the organisational units involved sufficient information. The contents and the frequency of the reports depend
ives assigned to each party in the process. Given the market turbulence that characterised the 2011
the overall V.a.R limits relating to the “managed portfolio” were exceeded in the period of reference
although they still fell within the delegated limits. The internal model is not used in the calculation of the capital
Notes to the consolidated financial statements
134
Together with the abovementioned controls, the Group has adopted the use of internal models, assigning the
nitoring and the measurement of interest rate risk and price risk to the risk management unit of the Parent
Company, which operates completely independently with respect to both operational offices and subsidiaries.
Italian banks, which account for nearly all the regulatory trading portfolio.
In order to quantify generic risks, the Group has adopted a model based on the Value at Risk (VaR) concept, in
probable loss incurred by a static portfolio with
reference to a specific investment horizon and a specific level of confidence in normal market conditions. This
method has the advantage of allowing the aggregation of the various risk positions taken in the accounts involving
heterogeneous risk factors, and also provides a synthetic number that is easy for the organisational unit concerned
” instruments with a delta-gamma type estimate
day time horizon, in line with the recommendations
defined by the Basel Committee. This model covers the assets, in term of financial instruments, included both in
managed and trading portfolios, as defined in the regulations regarding reports to the Supervisory Board and
nterest rates, exchange rates and
prices) together with the relevant correlations. The determination of volatilities and correlations is based on the
modelling under a normal scenario of the daily logarithmic returns of the risk factors, though the exponential
weighting based on a decline factor in a period corresponding to 250 observations. The application used for the
calculation of VaR is ALMpro, while the financial information necessary for the determination of VaR (volatility,
ure of interest rates, exchange rates, stock and benchmark indices) is provided by the
To date, derivatives on currencies and interest rates and options on shares and indices entered into for trading
is; almost all the business, however, is conducted on a brokerage basis.
The VaR of equity instruments is measured considering the link (beta coefficient) between the trend of the single
Stress test activities are carried out using parallel shifts in the yield curve, assuming variations of +/- 100 basis
points only for interest rate sensitive holdings; the necessary research activities are being performed which will
Trading activity is subject to operating limits laid down by the Board of Directors of the Parent Company and
expressed for each delegation level in terms of VaR. Considering the composition of the portfolio, no VaR
operating limits are laid down for subsidiaries. A special reporting system is the instrument that has been chosen to
The contents and the frequency of the reports depend
Given the market turbulence that characterised the 2011
exceeded in the period of reference,
The internal model is not used in the calculation of the capital

Quantitative information
1. Regulatory trading portfolio: breakliabilities and financial derivatives
Currency of denomination:Euro
Type/Residual maturityOn
demand
1. C ash assets 3,734
1.1Debt securities 3,734
- with an option for early
redemption
- o ther 3,734
1.2 Other assets
2. C ash liabilit ies 5
2.1reverse repos 5
2.2 Other liabilities
3. F inancia l derivates
3.1With underlying security
- Options
+Long positions
+Short positions
- Other derivates
+Long positions
+Short positions
3.2 With no underlying security
- Options
+Long positions
+Short positions
- Other derivates
+Long positions
+Short positions
Notes to the consolidated
Regulatory trading portfolio: break-down by outstanding maturity (repricing date) for cash assets andliabilities and financial derivatives
demand
Up to 3
months
Between 3
and 6
months
Between 6
months
and 1year
Between 1
and 5 years
Between 5
and 10
years
Beyond 10
years
3,734 5,920 10 1,502 1,085 13
3,734 5,920 10 1,502 1,085 13
3,734 5,920 10 1,502 1,085 13
5 5,493 549
5 5,493 549
154,410 10,328 10,689 26,126
44,684 7,293 9,900 26,126
44,684 7,293 9,900 26,126
36,908 7,215 62 69
7,776 78 9,838 26,057
109,726 3,035 789
109,726 3,035 789
55,406 1,518 395
54,320 1,517 394
Notes to the consolidated financial statements
135
down by outstanding maturity (repricing date) for cash assets and
Beyond 10
years
Unspecified
maturity
7
7
7
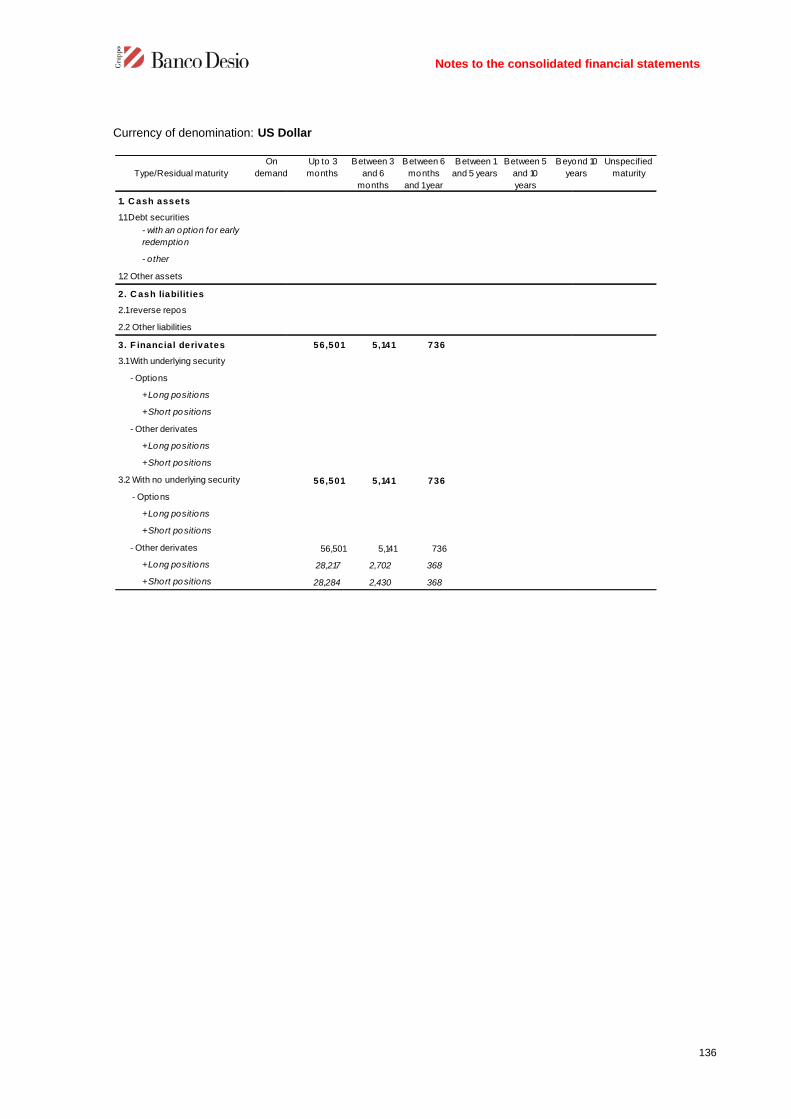
Currency of denomination: US Dollar
Type/Residual maturity
On
demand
1. C ash assets
1.1Debt securities
- with an option for early
redemption
- other
1.2 Other assets
2. C ash liabilit ies
2.1reverse repos
2.2 Other liabilities
3. F inancial derivates
3.1With underlying security
- Options
+Long positions
+Short positions
- Other derivates
+Long positions
+Short positions
3.2 With no underlying security
- Options
+Long positions
+Short positions
- Other derivates
+Long positions
+Short positions
Notes to the consolidated
US Dollar
demand
Up to 3
months
Between 3
and 6
months
Between 6
months
and 1year
Between 1
and 5 years
Between 5
and 10
years
Beyond 10
years
56,501 5,141 736
56,501 5,141 736
56,501 5,141 736
28,217 2,702 368
28,284 2,430 368
Notes to the consolidated financial statements
136
Beyond 10
years
Unspecified
maturity

Currency of denomination:UK Pound Sterling
Type/Residual maturity
On
demand
1. C ash assets
1.1Debt securities
- with an option for early
redemption
- o ther
1.2 Other assets
2. C ash liabilit ies
2.1reverse repos
2.2 Other liabilities
3. F inancia l derivates
3.1With underlying security
- Options
+Long positions
+Short positions
- Other derivates
+Long positions
+Short positions
3.2 With no underlying security
- Options
+Long positions
+Short positions
- Other derivates
+Long positions
+Short positions
Notes to the consolidated
UK Pound Sterling
demand
Up to 3
months
Between 3
and 6
months
Between 6
months
and 1year
Between 1
and 5 years
Between 5
and 10
years
Beyond 10
years
6,686 1,324
6,686 1,324
6,686 1,324
3,441 662
3,245 662
Notes to the consolidated financial statements
137
Beyond 10
years
Unspecified
maturity

Currency of d: Swiss Franc
Type/Residual maturity
On
demand
1. C ash assets
1.1Debt securities
- with an option for early
redemption
- other
1.2 Other assets
2. C ash liabilit ies
2.1reverse repos
2.2 Other liabilities
3. F inancial derivates
3.1With underlying security
- Options
+Long positions
+Short positions
- Other derivates
+Long positions
+Short positions
3.2 With no underlying security
- Options
+Long positions
+Short positions
- Other derivates
+Long positions
+Short positions
Notes to the consolidated
demand
Up to 3
months
Between 3
and 6
months
Between 6
months
and 1year
Between 1
and 5 years
Between 5
and 10
years
Beyond 10
years
522
522
522
175
347
Notes to the consolidated financial statements
138
Beyond 10
years
Unspecified
maturity

Currency of denomination:Canadian Dollar
Type/Residual maturity
On
demand
1. C ash assets
1.1Debt securities
- with an option for early
redemption
- other
1.2 Other assets
2. C ash liabilit ies
2.1reverse repos
2.2 Other liabilities
3. F inancial derivates
3.1With underlying security
- Options
+Long positions
+Short positions
- Other derivates
+Long positions
+Short positions
3.2 With no underlying security
- Options
+Long positions
+Short positions
- Other derivates
+Long positions
+Short positions
Notes to the consolidated
Canadian Dollar
demand
Up to 3
months
Between 3
and 6
months
Between 6
months
and 1year
Between 1
and 5 years
Between 5
and 10
years
Beyond 10
years
23
23
23
11
12
Notes to the consolidated financial statements
139
Beyond 10
years
Unspecified
maturity

Currency of denomination:Japanese
Type/Residual maturity
On
demand
1. C ash assets
1.1Debt securities
- with an option for early
redemption
- o ther
1.2 Other assets
2. C ash liabilit ies
2.1reverse repos
2.2 Other liabilities
3. F inancia l derivates
3.1With underlying security
- Options
+Long positions
+Short positions
- Other derivates
+Long positions
+Short positions
3.2 With no underlying security
- Options
+Long positions
+Short positions
- Other derivates
+Long positions
+Short positions
Notes to the consolidated
Japanese Yen
demand
Up to 3
months
Between 3
and 6
months
Between 6
months
and 1year
Between 1
and 5 years
Between 5
and 10
years
Beyond 10
years
7,181 644
7,181 644
7,161 644
3,590 322
3,591 322
Notes to the consolidated financial statements
140
Beyond 10
years
Unspecified
maturity

Currency of denomination:Other currencies
Type/Residual maturity
On
demand
1. C ash assets
1.1Debt securities
- with an option for early
redemption
- other
1.2 Other assets
2. C ash liabilit ies
2.1reverse repos
2.2 Other liabilities
3. F inancial derivates
3.1With underlying security
- Options
+Long positions
+Short positions
- Other derivates
+Long positions
+Short positions
3.2 With no underlying security
- Options
+Long positions
+Short positions
- Other derivates
+Long positions
+Short positions
Notes to the consolidated
Other currencies
demand
Up to 3
months
Between 3
and 6
months
Between 6
months
and 1year
Between 1
and 5 years
Between 5
and 10
years
Beyond 10
years
5,134
5,134
5,134
2,316
2,818
Notes to the consolidated financial statements
141
Beyond 10
years
Unspecified
maturity

2. Regulatory trading portfolio: breakdown by exposures in equity securities and stock indexes for the mainCountries of the listing market
3. Regulatory trading portfolio
Monitoring of the Parent Company’s portfolio and the Italian banks during the 2011 financial year showed a
structure with limited market risks
“regulatory trading portfolio” is almost entirely exposed to the interest rate risk. The Parent Company takes on
almost the whole interest rate and price risk, the Italian subsidi
VaR at 31 December 2011 is Euro 39 thousand with a percentage of less than 0.53% of the trading portfolio and a
duration of 0.75, evidence of the low
The scenario analyses carried out in
points only for the positions that are sensitive to interest rates, as at 31.12.2011, show
variation in rates - a negative impact of Euro 48 thousand
0.53 % of trading portfolio 0.01 % of business margin 0.12 % of net income for the period 0.01 % of shareholders’ equity, net of the result for the period
1.2.2 Interest rate risk and price risk
Qualitative information
A. General aspects, management procedures and methods of measuring interest rate risk and pricerisk
It is the responsibility of the Parent Company’ risk management unit to measure interest rate risk. This activity isonly directed at the Group’s Italian banks, which account for almost the entire banking portfolio. The system of the
A. Equity securities
- long positions
- short positions
B. Unsettled purchases and sales on
equity securities
- long positions
- short positions
C. Other derivatives on equity securities
- long positions
- short positions
D. Derivates on stock indexes
- long positions
- short positions
Type of transactions/Listing index
Notes to the consolidated
Regulatory trading portfolio: breakdown by exposures in equity securities and stock indexes for the mainCountries of the listing market
Regulatory trading portfolio - internal models and other methods for sensitivity analyses
Monitoring of the Parent Company’s portfolio and the Italian banks during the 2011 financial year showed a
limited market risks. Given the policy implemented by the Group to underestimate price risks, the
“regulatory trading portfolio” is almost entirely exposed to the interest rate risk. The Parent Company takes on
almost the whole interest rate and price risk, the Italian subsidiaries making a completely negligible contribution
VaR at 31 December 2011 is Euro 39 thousand with a percentage of less than 0.53% of the trading portfolio and a
duration of 0.75, evidence of the low-risk profile.
The scenario analyses carried out in terms of parallel shifts in the rate curve, assumed variations of +/
points only for the positions that are sensitive to interest rates, as at 31.12.2011, show
a negative impact of Euro 48 thousand, equal to:
of trading portfolio;of business margin;of net income for the period;of shareholders’ equity, net of the result for the period.
Interest rate risk and price risk – banking portfolio
General aspects, management procedures and methods of measuring interest rate risk and price
It is the responsibility of the Parent Company’ risk management unit to measure interest rate risk. This activity isonly directed at the Group’s Italian banks, which account for almost the entire banking portfolio. The system of the
Italy United StatesOther countries
166
B. Unsettled purchases and sales on
5
C. Other derivatives on equity securities
Type of transactions/Listing index
Listed
Unlisted
Notes to the consolidated financial statements
142
Regulatory trading portfolio: breakdown by exposures in equity securities and stock indexes for the main
internal models and other methods for sensitivity analyses
Monitoring of the Parent Company’s portfolio and the Italian banks during the 2011 financial year showed a
Given the policy implemented by the Group to underestimate price risks, the
“regulatory trading portfolio” is almost entirely exposed to the interest rate risk. The Parent Company takes on
aries making a completely negligible contribution.
VaR at 31 December 2011 is Euro 39 thousand with a percentage of less than 0.53% of the trading portfolio and a
terms of parallel shifts in the rate curve, assumed variations of +/- 100 basis
points only for the positions that are sensitive to interest rates, as at 31.12.2011, show - considering the positive
General aspects, management procedures and methods of measuring interest rate risk and price
It is the responsibility of the Parent Company’ risk management unit to measure interest rate risk. This activity isonly directed at the Group’s Italian banks, which account for almost the entire banking portfolio. The system of the
Unlisted

Group’s commercial activities consisting of balance sheet asset and liability maturity transformation, the securitiesportfolio, the treasury operations and the respective hedging derivatives is monitored using Asset and LiabilityManagement (ALM) methods, through the ALMpro apapproach; the Simulation module is also activerisk adopting a dynamic approachThe static analysis which is currently implementedmeasured and expressed in terms both of the variation of assets and the interest margin. The model covers theassets and liabilities exposed to interest rate risk, included both in the bankipurposes and in the financial statements. The results of the banking portfolio held for the purposes of the financialstatements are therefore presented, excluding the financial instruments in the regulatory trading portfolanalysis.Interest margin variability, determined by positive and negative changes in rates over a 365estimated by Gap Analysis, with the help of a number of different approaches in order to increase the accuracy ofthe forecasts.The variations in the economic value of assets and liabilities are analysed applying Duration Gap and SensitivityAnalysis methods.The analyses are performed using parallel shifts in the yield curve and specific scenarios of market rate changes.In the banking portfolio the assets subject to price risks are represented exclusively by equity investments andmutual fund units. The latter represent a marginal share and are measured through VaR techniques described inparagraph 2.1.
B. Fair Value hedge
The Group’s primary objective is to manage the risks associated with its operations prudently and actively. The
Group only takes out Fair Value type hedges for the Group’s Italian banks, in order to protect the profit and loss
account from the risks deriving from unfavourable variations in Fair Value; the objective of the hedge is to set off
Fair Value variations in the hedged instrument against Fair Value variations in the hedging instrument.
To date, hedged instruments refer to both assets and li
instruments are used as hedges, which are represented by unlisted securities
interest rate options - used to hedge interest rate risks only.
The Parent Company has prepared a model which is able to manage hedge accounting consistently with the
relevant regulations laid down in the IAS accounting standards. The method used by the Parent Company to
conduct effectiveness tests is the “Dollar Offset Method”
specific hedges.
The Group, with the purpose of making the fair value of the entire financial instrument more reliable andrepresentative, applied the Fair Value Option to some types of bonds issued
C. Cash flow hedge
No cash flow hedge transactions have been effected by the Group
Notes to the consolidated
ivities consisting of balance sheet asset and liability maturity transformation, the securitiesportfolio, the treasury operations and the respective hedging derivatives is monitored using Asset and LiabilityManagement (ALM) methods, through the ALMpro application. Risks are measured each month adopting a static
the Simulation module is also active which allows the monitoring and management of the interest raterisk adopting a dynamic approach.The static analysis which is currently implemented allows the impacts of variations in interest rate structure to bemeasured and expressed in terms both of the variation of assets and the interest margin. The model covers theassets and liabilities exposed to interest rate risk, included both in the banking portfolio held for managementpurposes and in the financial statements. The results of the banking portfolio held for the purposes of the financialstatements are therefore presented, excluding the financial instruments in the regulatory trading portfol
Interest margin variability, determined by positive and negative changes in rates over a 365estimated by Gap Analysis, with the help of a number of different approaches in order to increase the accuracy of
The variations in the economic value of assets and liabilities are analysed applying Duration Gap and Sensitivity
The analyses are performed using parallel shifts in the yield curve and specific scenarios of market rate changes.In the banking portfolio the assets subject to price risks are represented exclusively by equity investments andmutual fund units. The latter represent a marginal share and are measured through VaR techniques described in
The Group’s primary objective is to manage the risks associated with its operations prudently and actively. The
Group only takes out Fair Value type hedges for the Group’s Italian banks, in order to protect the profit and loss
s deriving from unfavourable variations in Fair Value; the objective of the hedge is to set off
Fair Value variations in the hedged instrument against Fair Value variations in the hedging instrument.
To date, hedged instruments refer to both assets and liabilities; the latter being bond loans only, while derivative
instruments are used as hedges, which are represented by unlisted securities - mainly Interest Rate Swaps and
used to hedge interest rate risks only.
as prepared a model which is able to manage hedge accounting consistently with the
relevant regulations laid down in the IAS accounting standards. The method used by the Parent Company to
conduct effectiveness tests is the “Dollar Offset Method” (hedge ratio) on a cumulative basis. All hedges are
The Group, with the purpose of making the fair value of the entire financial instrument more reliable andrepresentative, applied the Fair Value Option to some types of bonds issued.
No cash flow hedge transactions have been effected by the Group.
Notes to the consolidated financial statements
143
ivities consisting of balance sheet asset and liability maturity transformation, the securitiesportfolio, the treasury operations and the respective hedging derivatives is monitored using Asset and Liability
Risks are measured each month adopting a staticwhich allows the monitoring and management of the interest rate
allows the impacts of variations in interest rate structure to bemeasured and expressed in terms both of the variation of assets and the interest margin. The model covers the
ng portfolio held for managementpurposes and in the financial statements. The results of the banking portfolio held for the purposes of the financialstatements are therefore presented, excluding the financial instruments in the regulatory trading portfolio from this
Interest margin variability, determined by positive and negative changes in rates over a 365-day time horizon, isestimated by Gap Analysis, with the help of a number of different approaches in order to increase the accuracy of
The variations in the economic value of assets and liabilities are analysed applying Duration Gap and Sensitivity
The analyses are performed using parallel shifts in the yield curve and specific scenarios of market rate changes.In the banking portfolio the assets subject to price risks are represented exclusively by equity investments andmutual fund units. The latter represent a marginal share and are measured through VaR techniques described in
The Group’s primary objective is to manage the risks associated with its operations prudently and actively. The
Group only takes out Fair Value type hedges for the Group’s Italian banks, in order to protect the profit and loss
s deriving from unfavourable variations in Fair Value; the objective of the hedge is to set off
Fair Value variations in the hedged instrument against Fair Value variations in the hedging instrument.
abilities; the latter being bond loans only, while derivative
mainly Interest Rate Swaps and
as prepared a model which is able to manage hedge accounting consistently with the
relevant regulations laid down in the IAS accounting standards. The method used by the Parent Company to
io) on a cumulative basis. All hedges are
The Group, with the purpose of making the fair value of the entire financial instrument more reliable and

Quantitative information
1. Banking portfolio: distribution by outstanding maturity (repricing date) of financial assets and liabilities
Currency of denomination:Euro
Type/Residual maturity
On
demand
1. C ash assets
1.1Debt securities
- with an option for early
redemption
- o ther 4,789
1.2 Financing to banks 70,562
1.3 Financing to customers
- Current account 1,491,651
- o ther loans
- with an option for early
redemption 49,084
- o ther 490,951
2. C ash liabilit ies
2.1Due to customers
- Current account 3,973,476
- o ther debts
- with an option for early
redemption
- o ther 53,072
2.2 Due to banks
- Current account 11,203
- o ther 1,478
2.3 Debt securities
- with an option for early
redemption 150
- o ther 17,865
2.4 Other liabilities
- with an option for early
redemption
- o ther
3. F inancia l derivates
3.1With underlying security
- Options
+Long positions
+Short positions
- Other derivates
+Long positions
+Short positions
3.2 With no underlying security
- Options
+Long positions
+Short positions
- Other derivates
+Long positions
+Short positions
Notes to the consolidated
Banking portfolio: distribution by outstanding maturity (repricing date) of financial assets and liabilities
demand
Up to 3
months
Between 3
and 6
months
Between 6
months
and 1year
Between 1and
5 years
Between 5
and 10
years
19,266 953 5,919 1,958
4,789 47,856 25,937 212,323 468,476 200,642
70,562 49,372 1,553
1,491,651 443 1,624 3,303 35,665 2,083
49,084 2,873,717 95,176 59,197 224,831 90,024
490,951 700,869 59,741 45,866 217,773 99,929
3,973,476 71,725 44,751 17,076
53,072 5,473 2,213 4,070 17,595
11,203
1,478 200,052 28,918
150 29,657
17,865 716,144 442,665 249,410 1,218,095 16,906
548,080 119,067 20,633 486,714 60,905
1,264 1,605 6,314 207,757 50,695
236,567 5,042 4,319 72,320
78,016 20,000 10,000 206,637 10,000
232,233 92,420
Notes to the consolidated financial statements
144
Banking portfolio: distribution by outstanding maturity (repricing date) of financial assets and liabilities
Between 5 Beyond 10
years
Unspecified
maturity
721
-
97
2,247
523 4,345
50,611
50,611

Currency of denomination:US Dollar
Type/Residual maturity
On
demand
1. C ash assets 214
1.1Debt securities
- with an option for early
redemption
- o ther
1.2 Financing to banks 157
1.3 Financing to customers 57
- Current account
- o ther loans
- with an option for early
redemption
- o ther 52
2. C ash liabilit ies 32,196
2.1Due to customers 22,180
- Current account 22,180
- o ther debts
- with an option for early
redemption
- o ther
2.2 Due to banks 10,016
- Current account 9,988
- o ther 28
2.3 Debt securities
- with an option for early
redemption
- o ther
2.4 Other liabilities
- with an option for early
redemption
- o ther
3. F inancia l derivates
3.1With underlying security
- Options
+Long positions
+Short positions
- Other derivates
+Long positions
+Short positions
3.2 With no underlying security
- Options
+Long positions
+Short positions
- Other derivates
+Long positions
+Short positions
Notes to the consolidated
US Dollar
demand
Up to 3
months
Between 3
and 6
months
Between 6
months
and 1year
Between 1and
5 years
Between 5
and 10
years
214 65,989 2,148 34
157 51,492
57 14,497 2,148 34
5
52 14,497 2,148 34
32,196 35,551
22,180
22,180
10,016 35,551
9,988
28 35,551
304
304
304
152
152
Notes to the consolidated financial statements
145
Between 5 Beyond 10
years
Unspecified
maturity

Currency of denomination:UK Pound Sterling
Type/Residual maturity
On
demand
1. C ash assets 1,226
1.1Debt securities
- with an option for early
redemption
- o ther
1.2 Financing to banks 693
1.3 Financing to customers 533
- Current account 533
- o ther loans
- with an option for early
redemption
- o ther
2. C ash liabilit ies 1,114
2.1Due to customers 1,067
- Current account 1,067
- o ther debts
- with an option for early
redemption
- o ther
2.2 Due to banks 47
- Current account 44
- o ther
2.3 Debt securities
- with an option for early
redemption
- o ther
2.4 Other liabilities
- with an option for early
redemption
- o ther
3. F inancia l derivates
3.1With underlying security
- Options
+Long positions
+Short positions
- Other derivates
+Long positions
+Short positions
3.2 With no underlying security
- Options
+Long positions
+Short positions
- Other derivates
+Long positions
+Short positions
Notes to the consolidated
UK Pound Sterling
demand
Up to 3
months
Between 3
and 6
months
Between 6
months
and 1year
Between 1and
5 years
Between 5
and 10
years
1,226 1,847 12
693 1,712
533 135 12
533
135 12
1,114 1,892
1,067
1,067
47 1,892
44
3 1,892
Notes to the consolidated financial statements
146
Between 5 Beyond 10
years
Unspecified
maturity
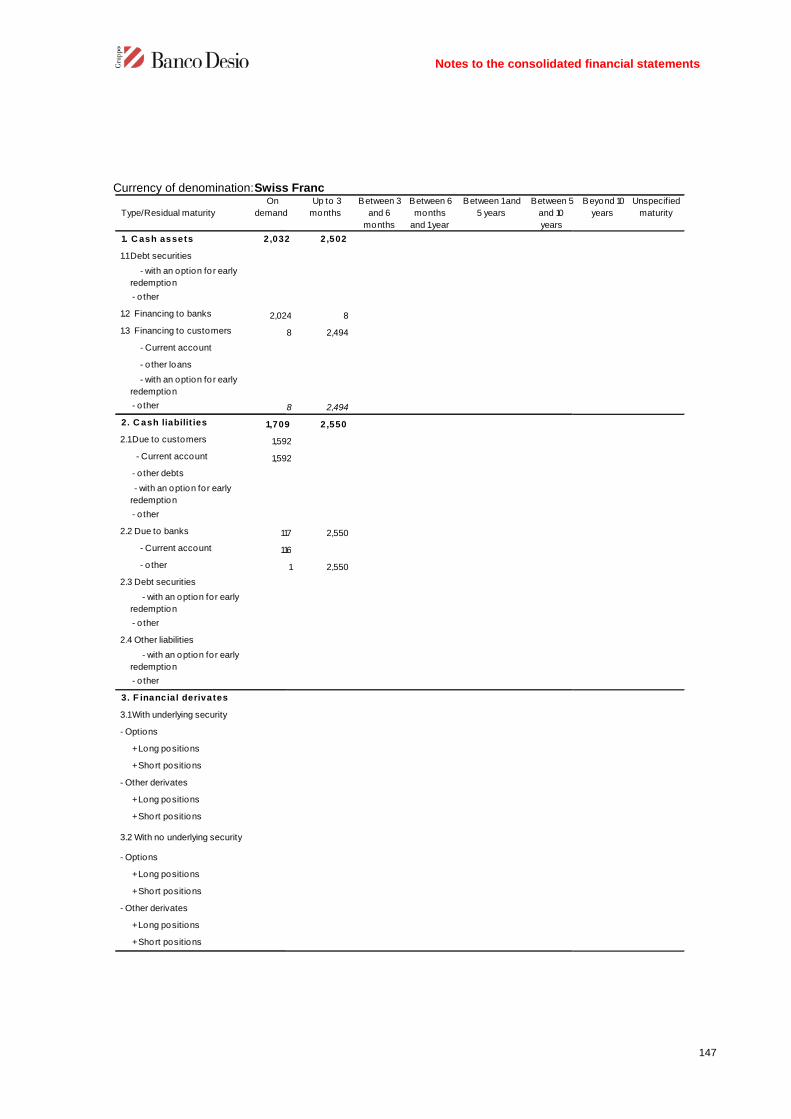
Currency of denomination:Swiss Franc
Type/Residual maturity
On
demand
1. C ash assets 2,032
1.1Debt securities
- with an option for early
redemption
- o ther
1.2 Financing to banks 2,024
1.3 Financing to customers
- Current account
- o ther loans
- with an option for early
redemption
- o ther
2. C ash liabilit ies 1,709
2.1Due to customers 1,592
- Current account 1,592
- o ther debts
- with an option for early
redemption
- o ther
2.2 Due to banks 117
- Current account 116
- o ther
2.3 Debt securities
- with an option for early
redemption
- o ther
2.4 Other liabilities
- with an option for early
redemption
- o ther
3. F inancia l derivates
3.1With underlying security
- Options
+Long positions
+Short positions
- Other derivates
+Long positions
+Short positions
3.2 With no underlying security
- Options
+Long positions
+Short positions
- Other derivates
+Long positions
+Short positions
Notes to the consolidated
Swiss Franc
demand
Up to 3
months
Between 3
and 6
months
Between 6
months
and 1year
Between 1and
5 years
Between 5
and 10
years
2,032 2,502
2,024 8
8 2,494
8 2,494
1,709 2,550
1,592
1,592
117 2,550
116
1 2,550
Notes to the consolidated financial statements
147
Between 5 Beyond 10
years
Unspecified
maturity

Currency of denomination:Canadian Dollar
Type/Residual maturity
On
demand
1. C ash assets 530
1.1Debt securities
- with an option for early
redemption
- o ther
1.2 Financing to banks 530
1.3 Financing to customers
- Current account
- o ther loans
- with an option for early
redemption
- o ther
2. C ash liabilit ies 530
2.1Due to customers 530
- Current account 530
- o ther debts
- with an option for early
redemption
- o ther
2.2 Due to banks
- Current account
- o ther
2.3 Debt securities
- with an option for early
redemption
- o ther
2.4 Other liabilities
- with an option for early
redemption
- o ther
3. F inancia l derivates
3.1With underlying security
- Options
+Long positions
+Short positions
- Other derivates
+Long positions
+Short positions
3.2 With no underlying security
- Options
+Long positions
+Short positions
- Other derivates
+Long positions
+Short positions
Notes to the consolidated
Canadian Dollar
demand
Up to 3
months
Between 3
and 6
months
Between 6
months
and 1year
Between 1and
5 years
Between 5
and 10
years
530
530
530
530
530
Notes to the consolidated financial statements
148
Between 5 Beyond 10
years
Unspecified
maturity

Currency of denomination:Japanese
Type/Residual maturity
On
demand
1. C ash assets 81
1.1Debt securities
- with an option for early
redemption
- o ther
1.2 Financing to banks 71
1.3 Financing to customers 13
- Current account
- o ther loans
- with an option for early
redemption
- o ther 10
2. C ash liabilit ies 34
2.1Due to customers 24
- Current account 24
- o ther debts
- with an option for early
redemption
- o ther
2.2 Due to banks 10
- Current account 10
- o ther
2.3 Debt securities
- with an option for early
redemption
- o ther
2.4 Other liabilities
- with an option for early
redemption
- o ther
3. F inancia l derivates
3.1With underlying security
- Options
+Long positions
+Short positions
- Other derivates
+Long positions
+Short positions
3.2 With no underlying security
- Options
+Long positions
+Short positions
- Other derivates
+Long positions
+Short positions
Notes to the consolidated
Japanese Yen
demand
Up to 3
months
Between 3
and 6
months
Between 6
months
and 1year
Between 1and
5 years
Between 5
and 10
years
81 7,283
71
13 7,283
10 7,283
34 7,385
24
24
10 7,385
10
7,385
14,770
14,770
14,770
7,385
7,385
Notes to the consolidated financial statements
149
Between 5 Beyond 10
years
Unspecified
maturity
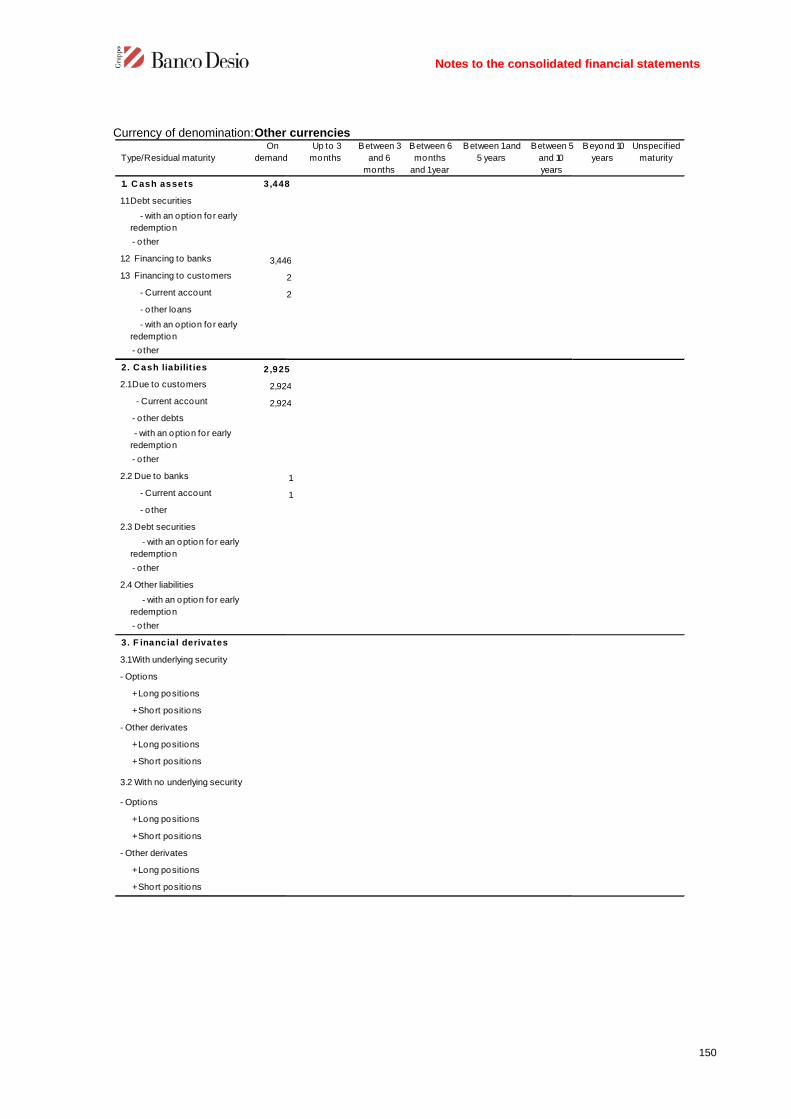
Currency of denomination:Other currencies
Type/Residual maturity
On
demand
1. C ash assets 3,448
1.1Debt securities
- with an option for early
redemption
- o ther
1.2 Financing to banks 3,446
1.3 Financing to customers
- Current account
- o ther loans
- with an option for early
redemption
- o ther
2. C ash liabilit ies 2,925
2.1Due to customers 2,924
- Current account 2,924
- o ther debts
- with an option for early
redemption
- o ther
2.2 Due to banks
- Current account
- o ther
2.3 Debt securities
- with an option for early
redemption
- o ther
2.4 Other liabilities
- with an option for early
redemption
- o ther
3. F inancia l derivates
3.1With underlying security
- Options
+Long positions
+Short positions
- Other derivates
+Long positions
+Short positions
3.2 With no underlying security
- Options
+Long positions
+Short positions
- Other derivates
+Long positions
+Short positions
Notes to the consolidated
Other currencies
demand
Up to 3
months
Between 3
and 6
months
Between 6
months
and 1year
Between 1and
5 years
Between 5
and 10
years
3,448
3,446
2
2
2,925
2,924
2,924
1
1
Notes to the consolidated financial statements
150
Between 5 Beyond 10
years
Unspecified
maturity

2. Banking portfolio - internal models and other methods for sensitivity analyses
This operational and strategic approach of the Group is directed at minimising the volatility of interest margins andof total economic value.The table below shows the results of the impact on the interest marginabsence of behavioural modelsevent of a parallel variation in the interest rate curve and considering the time effect of repricing of the items
Risk indices as at 31 December 2011 (economic margins of the operational management as per the reclassifiedincome statement): parallel shifts of the interest rate curve.
% on the expected margin
% on the business margin
% on the result for the period
% of net equity
As regards economic value the impact, estimated using measurement modabsence of behavioural models for the itemslevels that do not involve significant shifts in the interest rateThe table below shows the variations in economic value analysed by applying deterministic approaches withparallel shifts of the interest rate curve
Risk indices: parallel shifts of the rates curve as of 31 December
% of economic value
1.2.3 Exchange risk
Qualitative information
A. General aspects, management procedures and methods of measuring exchange risk
The Group is exposed to exchange risk because it trades on currency markets andinvestment and savings with instruments denominated in a foreign currency.The Group is exposed to exchange risks to a marginal extent. As regards the Italian banks only, currencytransactions are handled by the Operation
Notes to the consolidated
internal models and other methods for sensitivity analyses
This operational and strategic approach of the Group is directed at minimising the volatility of interest margins and
the results of the impact on the interest margin, from a fixed perspectiveabsence of behavioural models for the items at sight, of the analyses carried out at 31 December 2011
parallel variation in the interest rate curve and considering the time effect of repricing of the items
Risk indices as at 31 December 2011 (economic margins of the operational management as per the reclassifiedfts of the interest rate curve.
+100 bp
on the expected margin 3,23%
on the business margin 2,03%
% on the result for the period 8,77%
of net equity 0,49%
impact, estimated using measurement models with a fixed perspective and in theabsence of behavioural models for the items at sight, has shown a risk exposure for 2011 that has remained at
significant shifts in the interest rate curve.The table below shows the variations in economic value analysed by applying deterministic approaches withparallel shifts of the interest rate curve.
Risk indices: parallel shifts of the rates curve as of 31 December 31.12.2011
+100 bp
of economic value -0,78%
General aspects, management procedures and methods of measuring exchange risk
The Group is exposed to exchange risk because it trades on currency markets and owing to its activities involvinginvestment and savings with instruments denominated in a foreign currency.The Group is exposed to exchange risks to a marginal extent. As regards the Italian banks only, currencytransactions are handled by the Operations Room of the Parent Company’s Finance Department.
Notes to the consolidated financial statements
151
This operational and strategic approach of the Group is directed at minimising the volatility of interest margins and
from a fixed perspective and in the, of the analyses carried out at 31 December 2011 in the
parallel variation in the interest rate curve and considering the time effect of repricing of the items.
Risk indices as at 31 December 2011 (economic margins of the operational management as per the reclassified
+100 bp -100 bp
-9,53%
-6,00%
-25,90%
-1,46%
els with a fixed perspective and in the, has shown a risk exposure for 2011 that has remained at
The table below shows the variations in economic value analysed by applying deterministic approaches with
+100 bp -100 bp
0,78% 0,95%
General aspects, management procedures and methods of measuring exchange risk
owing to its activities involving
The Group is exposed to exchange risks to a marginal extent. As regards the Italian banks only, currencys Room of the Parent Company’s Finance Department.

The exchange risk is governed by means of intrafor concentrations on each individual currency. There are also daily and annual stop
B. Exchange rate hedge
The Group’s primary objective is to manage the exchange risk prudently, while always taking the possibility ofprofiting from market opportunities into consideration. Transactions involving exchange risks,managed by means of appropriate hedging strategies
Quantitative information
1: Break-down of assets, liabilities and derivatives by currency of denomination
2. Internal models and other methods for sensitivity analysis
The exchange risk profile assumed by the Group is not significant, in light of the currency exposure of the balance
sheet items and the relevant hedging transactions implemented through derivative financial instruments
US Dollar
A. Financial assets
A.1 Debt securities
A.2 Equity securities
A.3 Financing to banks
A.4 Financing to customers
A.5 Other financial assets
B. Other assets
C. Financial assets
C.1 Due to banks
C.2 Due to customers
C.3 Debt securities
C.4 Other financial liabilities
D. Other liabilities
E. Financial derivatives
- Options
+ long positions
+ short positions
- Other
+ long positions
+ short positions
Total assets
Total liabilities
Imbalance
Captions
Notes to the consolidated
The exchange risk is governed by means of intra-day and end-of-day operating limits, both for currency areas andfor concentrations on each individual currency. There are also daily and annual stop-loss op
The Group’s primary objective is to manage the exchange risk prudently, while always taking the possibility ofprofiting from market opportunities into consideration. Transactions involving exchange risks,managed by means of appropriate hedging strategies.
down of assets, liabilities and derivatives by currency of denomination
Internal models and other methods for sensitivity analysis
exchange risk profile assumed by the Group is not significant, in light of the currency exposure of the balance
sheet items and the relevant hedging transactions implemented through derivative financial instruments
US DollarPound
Sterling
Japanese
Yen
Canadian
DollarSw iss Franc
68,384 3,083 7,365 530 4,534
51,552 2,405 71 530 2,024
16,832 678 7,294 2,510
259 252 26 30
67,716 3,003 7,419 530 4,259
16,426 213 7,395 2,602
51,290 2,790 24 530 1,657
( 4)
196
303 69 ( 1)
303 69 ( 1)
27,460 3,022 2,794 79
27,763 3,091 2,794 78
96,103 6,357 10,185 639 4,841
95,671 6,094 10,213 608 4,711
432 263 ( 28) 31
Currency
Notes to the consolidated financial statements
152
day operating limits, both for currency areas andloss operating limits.
The Group’s primary objective is to manage the exchange risk prudently, while always taking the possibility ofprofiting from market opportunities into consideration. Transactions involving exchange risks, therefore, are
exchange risk profile assumed by the Group is not significant, in light of the currency exposure of the balance
sheet items and the relevant hedging transactions implemented through derivative financial instruments.
Sw iss FrancOther
currencies
4,534 3,083
2,024 3,083
2,510
137 51
4,259 2,573
2,602 94
1,657 2,479
81
201 501
201 501
170 2,316
371 2,817
4,841 5,450
4,711 5,390
130 60

1.2.4 Derivative instruments
A. Financial derivatives
A.1 Regulatory trading portfolio: average and period
Underlying assets / Type of derivatives
1. Debt securities and interest rates
a) Options
b) Sw ap
c) Forw ard
d) Futures
e) Other
2. Equity securities and stock indexes
a) Options
b) Sw ap
c) Forw ard
d) Futures
e) Other
3. Currencies and gold
a) Options
b) Sw ap
b) Forw ard
c) Futures
e) Other
4. Commodities
5. Other underlying items
Total
Average values
Notes to the consolidated
Regulatory trading portfolio: average and period-end notional values
Underlying assets / Type of derivativesOver the
counter
Central
counterpar
ties
Over the
counter
Central
counterpar
ties
1. Debt securities and interest rates 22,000 24,000
1,000 1,000
21,000 23,000
2. Equity securities and stock indexes 5,745 39 44,967 6,263
5,745 39 44,967
6,263
238,887 619,881
63,669 82,682
175,218 537,199
266,632 39 688,848 6,263
49,846 39 98,233
31.12.2011 31.12.2010
Notes to the consolidated financial statements
153
Central
counterpar
ties
6,263
6,263
6,263
42

A.2 Banking portfolio: average and period
A.2.1 Hedging instruments
Underlying assets / Type of derivatives
1. Debt securities and interest rates
a) Options
b) Sw ap
c) Forw ard
d) Futures
e) Other
2. Equity securities and stock indexes
a) Options
b) Sw ap
c) Forw ard
d) Futures
e) Other
3. Currencies and gold
a) Options
b) Sw ap
b) Forw ard
c) Futures
e) Other
4. Commodities
5. Other underlying items
Total
Average values
Notes to the consolidated
Banking portfolio: average and period-end notional values
Underlying assets / Type of derivativesOver the
counter
Central
counterpar
ties
Over the
counter
Central
counterpar
ties31/12/2011 31/12/2010
1. Debt securities and interest rates 231,637 79,617
231,637 79,617
2. Equity securities and stock indexes
231,637 79,617
208,299 23,562
31.12.2011 31.12.2010
Notes to the consolidated financial statements
154
Central
counterpar
ties

A.2.2 Other derivatives
Underlying assets / Type of derivatives
1. Debt securities and interest rates
a) Options
b) Sw ap
c) Forw ard
d) Futures
e) Other
2. Equity securities and stock indexes
a) Options
b) Sw ap
c) Forw ard
d) Futures
e) Other
3. Currencies and gold
a) Options
b) Sw ap
b) Forw ard
c) Futures
e) Other
4. Commodities
5. Other underlying items
Total
Average values
Notes to the consolidated
Underlying assets / Type of derivativesOver the
counter
Central
counterpar
ties
Over the
counter
Central
counterpar
ties
1. Debt securities and interest rates 158,816 400,682
65,800 65,800
93,016 334,882
2. Equity securities and stock indexes
158,816 400,682
158,816 393,399
31.12.2011 31.12.2010
Notes to the consolidated financial statements
155
Central
counterpar
ties
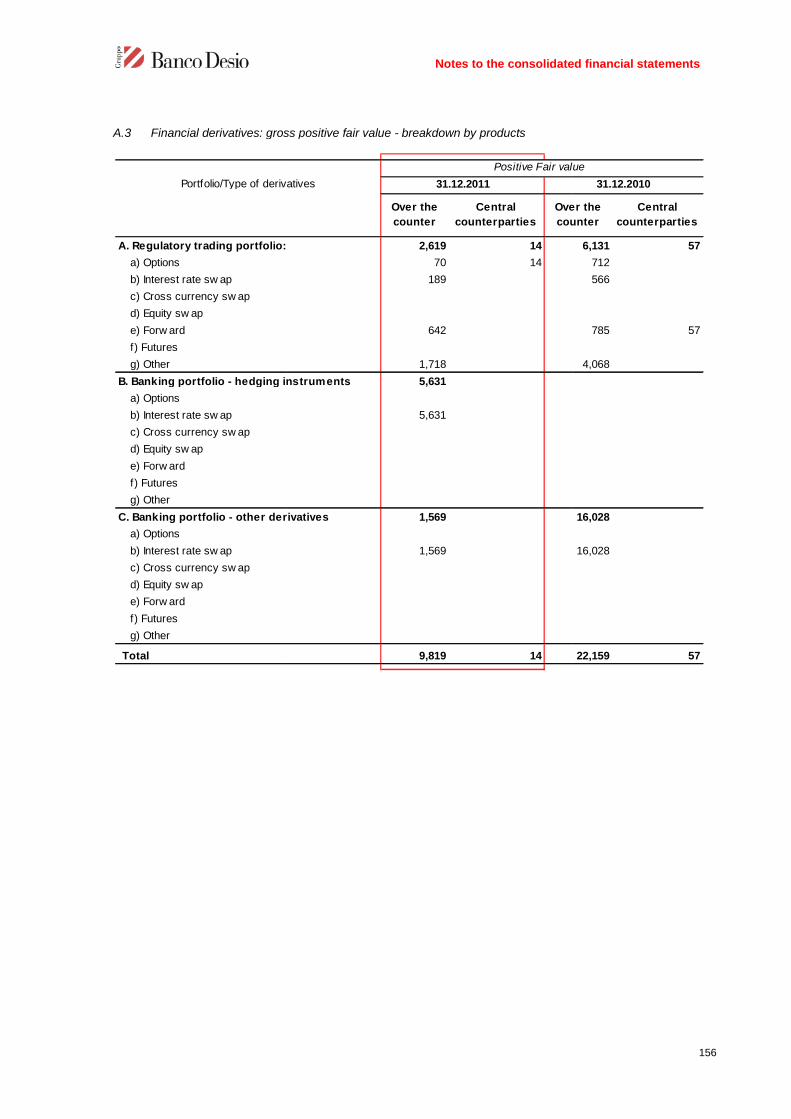
A.3 Financial derivatives: gross positive fair value
Portfolio/Type of derivatives
A. Regulatory trading portfolio:
a) Options
b) Interest rate sw ap
c) Cross currency sw ap
d) Equity sw ap
e) Forw ard
f) Futures
g) Other
B. Banking portfolio - hedging instruments
a) Options
b) Interest rate sw ap
c) Cross currency sw ap
d) Equity sw ap
e) Forw ard
f) Futures
g) Other
C. Banking portfolio - other derivatives
a) Options
b) Interest rate sw ap
c) Cross currency sw ap
d) Equity sw ap
e) Forw ard
f) Futures
g) Other
Total
Notes to the consolidated
derivatives: gross positive fair value - breakdown by products
Portfolio/Type of derivatives
Over the
counter
Central
counterparties
Over the
counter
2,619 14
70 14
189
642
1,718
B. Banking portfolio - hedging instruments 5,631
5,631
C. Banking portfolio - other derivatives 1,569
1,569
9,819 14
Positive Fair value
31.12.2011
Notes to the consolidated financial statements
156
Over the
counter
Central
counterparties
6,131 57
712
566
785 57
4,068
16,028
16,028
22,159 57
Positive Fair value
31.12.2010

A.4 Financial derivatives: gross negative fair value
Portfolio/Type of derivatives
A. Regulatory trading portfolio
a) Options
b) Interest rate sw ap
c) Cross currency sw ap
d) Equity sw ap
e) Forw ard
f) Futures
g) Other
B. Banking portfolio - hedging instruments
a) Options
b) Interest rate sw ap
c) Cross currency sw ap
d) Equity sw ap
e) Forw ard
f) Futures
g) Other
C. Banking portfolio - other derivatives
a) Options
b) Interest rate sw ap
c) Cross currency sw ap
d) Equity sw ap
e) Forw ard
f) Futures
g) Other
Total
Notes to the consolidated
Financial derivatives: gross negative fair value - breakdown by products
Over the
counter
Central
counterparties
Over the
counter counterparties
2,408 5,493
70 673
3 31
632 826
1,703 3,963
B. Banking portfolio - hedging instruments 2,684 2,653
2,684 2,653
C. Banking portfolio - other derivatives 652
652
5,092 8,798
Fair value negativo
31.12.2011 31.12.2010
Notes to the consolidated financial statements
157
Central
counterparties
65
65
65
31.12.2010

A.5 OTC financial derivativesvalues by counterparties -
A.6 OTC financial derivativesvalues for counterparties
None at the reference date.
Contracts which do not fall
within offset agreements
Governmen
ts and
Central
banks
1) D ebt securities and
interest rates
- notional value
- positive fair value
- negative fair value
- future exposure
2)Equity securit ies and
sto ck indexes
- notional value
- positive fair value
- negative fair value
- future exposure
3)Exchange rate and go ld
- notional value
- positive fair value
- negative fair value
- future exposure
4)Other values
- notional value
- positive fair value
- negative fair value
- future exposure
Notes to the consolidated
OTC financial derivatives – regulatory trading portfolio: notional values, gross positive and negative fair- contracts which do not fall within offset agreements
OTC financial derivatives – regulatory trading portfolio: notional values, gross positive and negative fairvalues for counterparties - contracts which do not fall within offset agreements
GovernmenOther public
entitiesBanks
Financial
institutions
Insurance
companies
Non-
financial
companies
11,000 10,000 1,000
30 156 3
3
31,866 24,381 4,504
304 263 18
334 2 207
319 244 45
Notes to the consolidated financial statements
158
regulatory trading portfolio: notional values, gross positive and negative fair
portfolio: notional values, gross positive and negative fair
Other
entities
2,918
57
90
29

A.7 OTC financial derivativescounterparties- contracts which do not fall within offset agreements
Contracts w hich do not fall w ithin
offset agreements
Governments
1) Debt securities and
interest rates
- notional value
- positive fair value
- negative fair value
- future exposure
2)Equity securities and stock
indexes
- notional value
- positive fair value
- negative fair value
- future exposure
3)Exchange rate and gold
- notional value
- positive fair value
- negative fair value
- future exposure
4)Other values
- notional value
- positive fair value
- negative fair value
- future exposure
Notes to the consolidated
OTC financial derivatives – banking portfolio: notional values, gross positive and negative fair valueswhich do not fall within offset agreements
Governments
and Central
banks
Other
public
entities
BanksFinancial
institutions
Insurance
companies
328,733
6,620
1,318
Notes to the consolidated financial statements
159
banking portfolio: notional values, gross positive and negative fair values for
Insurance
companies
Non-financial
companies
Other
entities

A.8 OTC financial derivativescounterparties - contracts which fall within offset agreements
A.9 Residual maturity of OTC financial derivatives: notional values
Contracts w hich fall w ithin
offset agreements
Governments
1) Debt securities and
interest rates
- notional value
- positive fair value
- negative fair value
2)Equity securities and
stock indexes
- notional value
- positive fair value
- negative fair value
3)Exchange rate and gold
- notional value
- positive fair value
- negative fair value
4)Other values
- notional value
- positive fair value
- negative fair value
Underlying instruments / Residual maturity
A. Regulatory trading portfolio
A.1 Financial derivatives on debt securities and interest rates
A.2 Financial derivatives on equity securities and stock
indexes
A.3 Financial derivatives on exchange rates and gold
A.4 Financial derivatives on other instruments
B. Banking portofolio
B.1 Financial derivatives on debt securities and interest rates
B.2 Financial derivatives on equity securities and stock
indexes
B.3 Financial derivatives on exchange rates and gold
B.4 Financial derivatives on other instruments
Total 31/12/2011
Total 31/12/2010
Notes to the consolidated
OTC financial derivatives - Banking portfolio: notional values, gross positive and negative faircontracts which fall within offset agreements
Residual maturity of OTC financial derivatives: notional values
Governments
and central
banks
Public
entitiesBanks
Financial
institutionsInsurance
companie
61,720
579
2,684
Underlying instruments / Residual maturityUp to 1
year
Betw een 1
and 5
years
Beyond 5
years
85,669
A.1 Financial derivatives on debt securities and interest rates 22,000
A.2 Financial derivatives on equity securities and stock
A.3 Financial derivatives on exchange rates and gold 63,669
A.4 Financial derivatives on other instruments
108,016 236,637 45,800
B.1 Financial derivatives on debt securities and interest rates 108,016 236,637 45,800
B.2 Financial derivatives on equity securities and stock
B.3 Financial derivatives on exchange rates and gold
B.4 Financial derivatives on other instruments
193,685 236,637 45,800
(375,998) (107,116) (105,417)
Notes to the consolidated financial statements
160
Banking portfolio: notional values, gross positive and negative fair values for
Insurance
companie
Non-
financial
companie
Other
entities
Beyond 5
yearsTotal
85,669
22,000
63,669
45,800 390,453
45,800 390,453
45,800 476,122
(105,417) (588,531)

B. Credit derivatives
B.1 Credit derivatives: period
B.2 OTC credit derivatives: gross negative fair value
None at the reference date.
Categories of transactions
1. Hedging purchases
a) Credit default products
b) Credit spread products
c) Total rate of return sw ap
d) Other
TOTAL 31.12.2011
AVERAGE VALUES
TOTAL 31.12.2010
2. Hedging sales
a) Credit default products
b) Credit spread products
c) Total rate of return sw ap
d) Other
TOTAL 31.12.2011
AVERAGE VALUES
TOTAL 31.12.2010
Notes to the consolidated
Credit derivatives: period-end and average nominal values
OTC credit derivatives: gross negative fair value – breakdown by products
Categories of transactionson a single
subject
on more than
one subject
(basket)
on a single
subject
on more than
one subject
(basket)
25,000
25,000
25,000
25,000
Regulatory trading portfolio Banking portfolio
Notes to the consolidated financial statements
161
on more than
one subject
(basket)
Banking portfolio
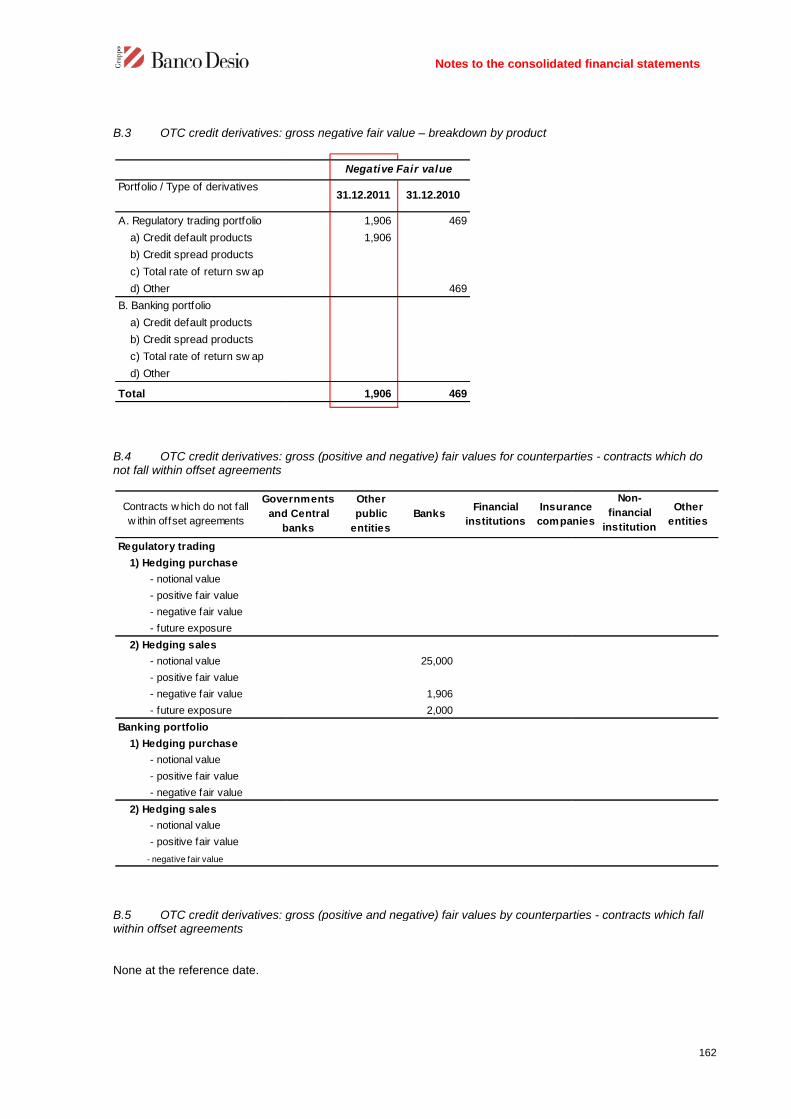
B.3 OTC credit derivatives: gross negative fa
B.4 OTC credit derivatives: gross (positive and negative) fairnot fall within offset agreements
B.5 OTC credit derivatives: gross (positive and negatwithin offset agreements
None at the reference date.
Portfolio / Type of derivatives
A. Regulatory trading portfolio
a) Credit default products
b) Credit spread products
c) Total rate of return sw ap
d) Other
B. Banking portfolio
a) Credit default products
b) Credit spread products
c) Total rate of return sw ap
d) Other
Total
Contracts w hich do not fall
w ithin offset agreements
Governments
and Central
banks
Regulatory trading
1) Hedging purchase
- notional value
- positive fair value
- negative fair value
- future exposure
2) Hedging sales
- notional value
- positive fair value
- negative fair value
- future exposure
Banking portfolio
1) Hedging purchase
- notional value
- positive fair value
- negative fair value
2) Hedging sales
- notional value
- positive fair value
- negative fair value
Notes to the consolidated
OTC credit derivatives: gross negative fair value – breakdown by product
OTC credit derivatives: gross (positive and negative) fair values for counterpart
gross (positive and negative) fair values by counterparties
31.12.2011 31.12.2010
1,906 469
1,906
469
1,906 469
Negative Fair value
Governments
and Central
banks
Other
public
entities
BanksFinancial
institutions
Insurance
companies
(24 906)
25,000
1,906
2,000
Notes to the consolidated financial statements
162
counterparties - contracts which do
values by counterparties - contracts which fall
Insurance
companies
Non-
financial
institution
s
Other
entities
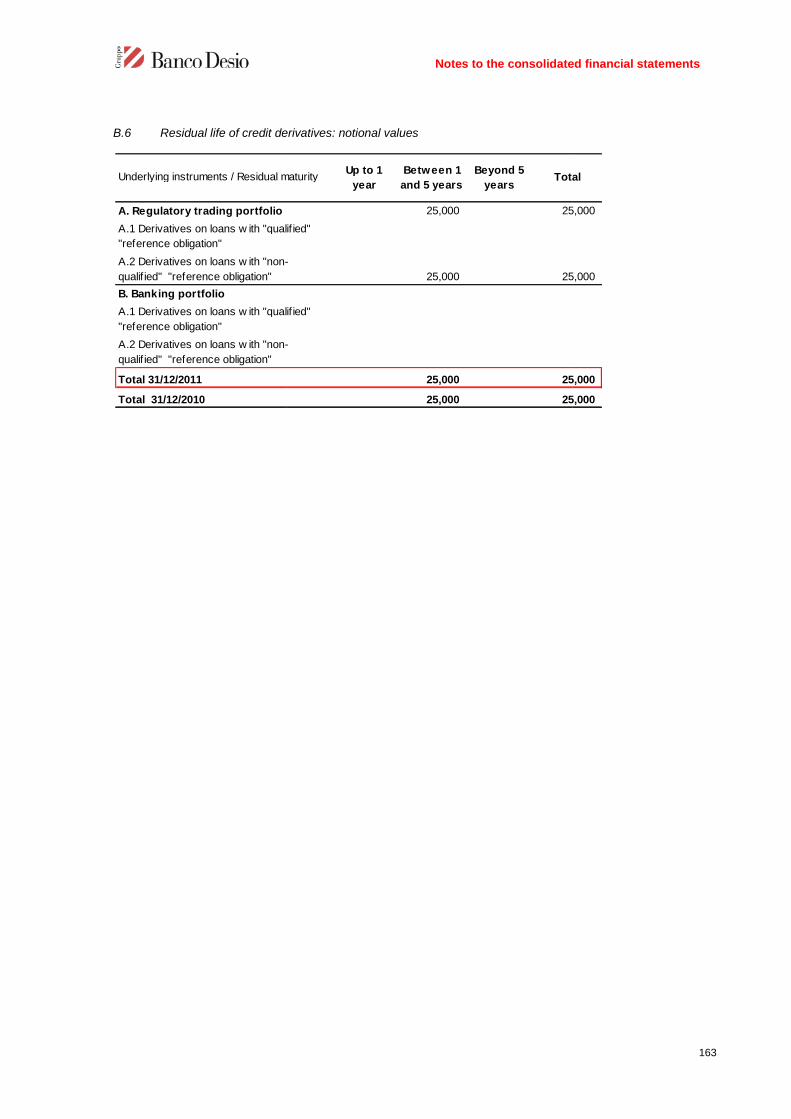
B.6 Residual life of credit derivatives: notional values
Underlying instruments / Residual maturity
A. Regulatory trading portfolio
A.1 Derivatives on loans w ith "qualif ied"
"reference obligation"
A.2 Derivatives on loans w ith "non-
qualif ied" "reference obligation"
B. Banking portfolio
A.1 Derivatives on loans w ith "qualif ied"
"reference obligation"
A.2 Derivatives on loans w ith "non-
qualif ied" "reference obligation"
Total 31/12/2011
Total 31/12/2010
Notes to the consolidated
Residual life of credit derivatives: notional values
Underlying instruments / Residual maturityUp to 1
year
Between 1
and 5 years
Beyond 5
yearsTotal
25,000 25,000
A.1 Derivatives on loans w ith "qualif ied"
A.2 Derivatives on loans w ith "non-
25,000 25,000
A.1 Derivatives on loans w ith "qualif ied"
A.2 Derivatives on loans w ith "non-
25,000 25,000
25,000 25,000
Notes to the consolidated financial statements
163
Total
25,000
25,000
25,000
25,000
1.3 Banking group – liquidity risk
Qualitative information
A. General aspects, management procedures and methods of measuring liquidity risks
It is the responsibility of the Parent Company to manage the liquidity risk through the Finance Department with theaim of verifying the Group’s capacity to meet liquidity requirements, whiland/or insufficient liquidity, entailing the need to invest and/or raise funds at rates that are less favourable thannormal market rates. The Group’s governance model is based on the centralised management of liquidParent Company for the Italian Commercial Banks, for which the Parent Company is also responsible for thefunding management.
With reference to the Italian Commercial Banks, the activity of monitoring and periodical reporting on liquidity risksis the responsibility of the Risk Management Department of the Parent Company, both for structural andoperational liquidity, which are carried out on a monthly basis and on a daily basis, respectively. The Treasuryactivity consists of procuring and allotransactions, repo transactions and derivativesThe relevant scope of application of daily reports on operational liquidity refers to those items with a high volatilitylevel and a strong impact on the monetary basis. Monitoring and compliance with operating limits are carried outthrough the acquisition of information from collection and payment transactions, from the management of servicesaccounts and from the trading of the financial insThe counterbalancing capacity model allows reports to be integrated with all those free assets which can bepromptly used both because they can be allocated for the refinancing at the ECB and because they can beconverted into cash. Together with the application of the haircuts determined by the ECB for the securities thatcan be allocated, adequate discount factors are also prepared (which are broken down by type of security, rating,currency) for all securities which cannappropriately positioned in time bucketsAn additional support to the management of liquidity risks derives from monitoring the structural liquidity with themain objective of maintaining an adequate dynamic relationship between medium/longOperations are measured using the Asset and Liability Management (ALM) method with the ALMpro application,which processes all the transaction cash flows and allowsimbalance between incoming and outgoing flows to be assessed and managed during the various periods inquestion.Overall structural liquidity is analysed monthly using the Gap Liquidity Analysis technique,capital flow maturity gaps over aSpecial care is taken with the funding policy, coordinated by the Parent Company’s Finance Department, which
arranges for funds to be raised by means of normal retail bondIn 2011 the Group estimated the impact of the new indicators introduced by the quantitative rulesthe LCR (Liquidity Coverage ratio) and of the NDFR (Net Stable Funding Ratio)appropriate checks also in consideration of the adjustments necessary for adopting the new rules issued by theBank of Italy governing prudential supervision
Notes to the consolidated
liquidity risk
management procedures and methods of measuring liquidity risks
It is the responsibility of the Parent Company to manage the liquidity risk through the Finance Department with theaim of verifying the Group’s capacity to meet liquidity requirements, while avoiding position of having excessiveand/or insufficient liquidity, entailing the need to invest and/or raise funds at rates that are less favourable thannormal market rates. The Group’s governance model is based on the centralised management of liquidParent Company for the Italian Commercial Banks, for which the Parent Company is also responsible for the
With reference to the Italian Commercial Banks, the activity of monitoring and periodical reporting on liquidity risksis the responsibility of the Risk Management Department of the Parent Company, both for structural andoperational liquidity, which are carried out on a monthly basis and on a daily basis, respectively. The Treasuryactivity consists of procuring and allocating available funds through the interbank market
repo transactions and derivatives.The relevant scope of application of daily reports on operational liquidity refers to those items with a high volatility
mpact on the monetary basis. Monitoring and compliance with operating limits are carried outthrough the acquisition of information from collection and payment transactions, from the management of servicesaccounts and from the trading of the financial instruments in the owned portfolios.The counterbalancing capacity model allows reports to be integrated with all those free assets which can bepromptly used both because they can be allocated for the refinancing at the ECB and because they can be
into cash. Together with the application of the haircuts determined by the ECB for the securities thatcan be allocated, adequate discount factors are also prepared (which are broken down by type of security, rating,currency) for all securities which cannot be allocated, but which are in any case considered to be negotiable asappropriately positioned in time buckets.An additional support to the management of liquidity risks derives from monitoring the structural liquidity with the
ntaining an adequate dynamic relationship between medium/long-Operations are measured using the Asset and Liability Management (ALM) method with the ALMpro application,which processes all the transaction cash flows and allows the bank’s liquidity requirements as generated byimbalance between incoming and outgoing flows to be assessed and managed during the various periods in
Overall structural liquidity is analysed monthly using the Gap Liquidity Analysis technique,capital flow maturity gaps over a present period of time.Special care is taken with the funding policy, coordinated by the Parent Company’s Finance Department, which
arranges for funds to be raised by means of normal retail bond issues and Euromarket issuesthe Group estimated the impact of the new indicators introduced by the quantitative rules
the LCR (Liquidity Coverage ratio) and of the NDFR (Net Stable Funding Ratio)iate checks also in consideration of the adjustments necessary for adopting the new rules issued by the
Bank of Italy governing prudential supervision.
Notes to the consolidated financial statements
164
management procedures and methods of measuring liquidity risks
It is the responsibility of the Parent Company to manage the liquidity risk through the Finance Department with thee avoiding position of having excessive
and/or insufficient liquidity, entailing the need to invest and/or raise funds at rates that are less favourable thannormal market rates. The Group’s governance model is based on the centralised management of liquidity at theParent Company for the Italian Commercial Banks, for which the Parent Company is also responsible for the
With reference to the Italian Commercial Banks, the activity of monitoring and periodical reporting on liquidity risksis the responsibility of the Risk Management Department of the Parent Company, both for structural andoperational liquidity, which are carried out on a monthly basis and on a daily basis, respectively. The Treasury
cating available funds through the interbank market, open market
The relevant scope of application of daily reports on operational liquidity refers to those items with a high volatilitympact on the monetary basis. Monitoring and compliance with operating limits are carried out
through the acquisition of information from collection and payment transactions, from the management of services
The counterbalancing capacity model allows reports to be integrated with all those free assets which can bepromptly used both because they can be allocated for the refinancing at the ECB and because they can be
into cash. Together with the application of the haircuts determined by the ECB for the securities thatcan be allocated, adequate discount factors are also prepared (which are broken down by type of security, rating,
ot be allocated, but which are in any case considered to be negotiable as
An additional support to the management of liquidity risks derives from monitoring the structural liquidity with the-term assets and liabilities.
Operations are measured using the Asset and Liability Management (ALM) method with the ALMpro application,the bank’s liquidity requirements as generated by
imbalance between incoming and outgoing flows to be assessed and managed during the various periods in
Overall structural liquidity is analysed monthly using the Gap Liquidity Analysis technique, which shows up the
Special care is taken with the funding policy, coordinated by the Parent Company’s Finance Department, whichissues and Euromarket issues.
the Group estimated the impact of the new indicators introduced by the quantitative rules – calculation ofthe LCR (Liquidity Coverage ratio) and of the NDFR (Net Stable Funding Ratio) – in order to prepare the
iate checks also in consideration of the adjustments necessary for adopting the new rules issued by the

Quantitative information
1. Break-down by contractual residual maturity of financial assets and
Currency of denomination:Euro
Caption / Time interval On demandBetween 1
and 7 days
C ash assets 1,542,387
A.1Government securities
A.2 Other debt securities 3,734
A.3 UCITS units 39,639
A.4 Financing 1,499,014
- banks 73,487
- customers 1,425,527
C ash liabilit ies 4,038,798
B.1Deposits and current
accounts 4,036,658
- Banks 11,227
- Customers 4,025,431
B.2 Debt securities 612
B.3 Other liabilities 1,528
"Off -balance" sheet
t ransact io ns 135,360
C.1Financial derivatives with
underlying asset exchange0
- long positions 0
- short positions 0
C.2 Financial derivatives
without underlying asset
exchange 192
- long positions 189
- short positions 3
C.3 Deposits and financing to
be received
- long positions
- short positions
C.4 Irrevocable commitments
to grant finance134,880
- long positions 795
- short positions 134,085
C.5 Financial guarantees
granted 288
Notes to the consolidated
down by contractual residual maturity of financial assets and liabilities
Between 1
and 7 days
Between 7
and 15 days
Between 15
days and 1
month
Between 1
and 3
months
Between 3
and 6
months
Between 6
months and
1year
Between 1and
63,233 24,553 282,893 480,440 236,367 557,276
31,630 10 123,503
2,959 4,450 970 94,280
63,233 24,553 279,934 444,360 235,387 339,493
15,000 5,000 1,553
48,233 19,553 279,934 444,360 233,834 339,493
54,898 27,426 81,271 449,434 424,941 293,768
1,947 6,811 24,885 38,099 44,767 17,079
1,947 6,811 24,885 38,099 44,767 17,079
44,951 20,415 54,987 409,984 377,428 243,704
8,000 200 1,399 1,351 2,746 32,985
68,257 366 51,883 8,459 14,707 14,323
53,473 366 51,497 7,073 10,327 10,689
42,006 183 25,753 3,371 8,732 457
11,467 183 25,744 3,702 1,595 10,232
97 324 237 1,167
97 313 237 990
11 177
14,784 634 1,377 4,200
7,392 634 1,377 4,200
7,392
289 428 2,766 ( 1733)
Notes to the consolidated financial statements
165
Between 1and
5 years
Beyond 5
years
Unspecified
maturity
2,400,970 2,177 ,184 35,709
373,822 202,823
152,727 42,905 1,993
1,874,421 1,931,456 33,716
97 29,371
1,874,421 1,931,359 4,345
1,690,273 52,331
21
21
1,472,657 52,331
217,595
126,640 32,030 2,930
26,125
68
26,057
109,309 44,504 5,734
84,309 44,504 2,867
25,000 2,867
( 8 794) ( 12 474) ( 2 804)

Currency of denomination:US Dollar
Caption / Time interval On demandBetween 1
and 7 days
C ash assets 213
A.1Government securities
A.2 Other debt securities
A.3 UCITS units
A.4 Financing 213
- banks 157
- customers 56
C ash liabilit ies 32,197
B.1Deposits and current
accounts 32,197
- Banks 10,017
- Customers 22,180
B.2 Debt securities
B.3 Other liabilities
"Off -balance" sheet
t ransact io ns
C.1Financial derivatives with
underlying asset exchange
- long positions
- short positions
C.2 Financial derivatives
without underlying asset
exchange
- long positions
- short positions
C.3 Deposits and financing to
be received
- long positions
- short positions
C.4 Irrevocable commitments
to grant finance
- long positions
- short positions
C.5 Financial guarantees
granted
Notes to the consolidated
US Dollar
Between 1
and 7 days
Between 7
and 15 days
Between 15
days and 1
month
Between 1
and 3
months
Between 3
and 6
months
Between 6
months and
1year
Between 1and
32,458 22 ,252 4,865 6,528 2,160 34
32,458 22,252 4,865 6,528 2,160 34
32,074 19,354 64
384 2,898 4,865 6,464 2,160 34
6 ,183 19 ,322 10 ,047
6,183 19,322 10,047
6,183 19,322 10,047
5,796 396 39,698 6,160 3,216 310
5,492 396 39,698 6,160 3,216 310
2,571 198 19,849 3,080 1,608 155
2,921 198 19,849 3,080 1,608 155
304
152
152
Notes to the consolidated financial statements
166
Between 1and
5 years
Beyond 5
years
Unspecified
maturity

Currency of denomination:UK Pound Sterling
Caption / Time interval On demandBetween 1
and 7 days
C ash assets 1,226
A.1Government securities
A.2 Other debt securities
A.3 UCITS units
A.4 Financing 1,226
- banks 693
- customers 533
C ash liabilit ies 1,114
B.1Deposits and current
accounts 1,114
- Banks 1,114
- Customers 1,067
B.2 Debt securities
B.3 Other liabilities
"Off -balance" sheet
transact io ns
C.1Financial derivatives with
underlying asset exchange
- long positions
- short positions
C.2 Financial derivatives
without underlying asset
exchange
- long positions
- short positions
C.3 Deposits and financing to
be received
- long positions
- short positions
C.4 Irrevocable commitments
to grant finance
- long positions
- short positions
C.5 Financial guarantees
granted
Notes to the consolidated
UK Pound Sterling
Between 1
and 7 days
Between 7
and 15 days
Between 15
days and 1
month
Between 1
and 3
months
Between 3
and 6
months
Between 6
months and
1year
Between 1and
6 61 1,780 12
6 61 1,780 12
1,712
6 61 68 12
180 1,712
180 1,712
180 1,712
1,350 4,764
1,350 4,764
641 2,382
709 2,382
Notes to the consolidated financial statements
167
Between 1and
5 years
Beyond 5
years
Unspecifie
d
maturity

Currency of denomination:Swiss Franc
Caption / Time interval On demandBetween 1
and 7 days
C ash assets 2,032
A.1Government securities
A.2 Other debt securities
A.3 UCITS units
A.4 Financing 2,032
- banks 2,024
- customers 8
C ash liabilit ies 1,709
B.1Deposits and current
accounts 1,709
- Banks 117
- Customers 1,592
B.2 Debt securities
B.3 Other liabilities
"Off -balance" sheet
transact io ns
C.1Financial derivatives with
underlying asset exchange
- long positions
- short positions
C.2 Financial derivatives
without underlying asset
exchange
- long positions
- short positions
C.3 Deposits and financing to
be received
- long positions
- short positions
C.4 Irrevocable commitments
to grant finance
- long positions
- short positions
C.5 Financial guarantees
granted
Notes to the consolidated
Swiss Franc
Between 1
and 7 days
Between 7
and 15 days
Between 15
days and 1
month
Between 1
and 3
months
Between 3
and 6
months
Between 6
months and
1year
Between 1and
394 641 1,482
394 641 1,482
8
394 641 1,474
2,550
2,550
2,550
741 160 152
485 160 152
142 80 76
343 80 76
256
128
128
Notes to the consolidated financial statements
168
Between 1and
5 years
Beyond 5
years
Unspecifie
d
maturity
248
248
124
124

Currency denomination: Canadian Dollar
Caption / Time interval On demandBetween 1
and 7 days
C ash assets 535
A.1Government securities
A.2 Other debt securities
A.3 UCITS units
A.4 Financing 535
- banks 535
- customers
C ash liabilit ies 534
B.1Deposits and current
accounts 534
- Banks
- Customers 534
B.2 Debt securities
B.3 Other liabilities
"Off -balance" sheet
transact io ns
C.1Financial derivatives with
underlying asset exchange
- long positions
- short positions
C.2 Financial derivatives
without underlying asset
exchange
- long positions
- short positions
C.3 Deposits and financing to
be received
- long positions
- short positions
C.4 Irrevocable commitments
to grant finance
- long positions
- short positions
C.5 Financial guarantees
granted
Notes to the consolidated
Canadian Dollar
Between 1
and 7 days
Between 7
and 15 days
Between 15
days and 1
month
Between 1
and 3
months
Between 3
and 6
months
Between 6
months and
1year
Between 1and
157
157
79
78
Notes to the consolidated financial statements
169
Between 1and
5 years
Beyond 5
years
Unspecifie
d
maturity

Currency of denomination: Japanese
Caption / Time interval On demandBetween 1
and 7 days
C ash assets 82
A.1Government securities
A.2 Other debt securities
A.3 UCITS units
A.4 Financing 82
- banks 71
- customers 11
C ash liabilit ies 34
B.1Deposits and current
accounts 34
- Banks 10
- Customers 24
B.2 Debt securities
B.3 Other liabilities
"Off -balance" sheet
transact io ns
C.1Financial derivatives with
underlying asset exchange
- long positions
- short positions
C.2 Financial derivatives
without underlying asset
exchange
- long positions
- short positions
C.3 Deposits and financing to
be received
- long positions
- short positions
C.4 Irrevocable commitments
to grant finance
- long positions
- short positions
C.5 Financial guarantees
granted
Notes to the consolidated
Japanese Yen
Between 1
and 7 days
Between 7
and 15 days
Between 15
days and 1
month
Between 1
and 3
months
Between 3
and 6
months
Between 6
months and
1year
Between 1and
5,586 1,276 485
5,586 1,276 485
5,586 1,276 485
7,385
7,385
7,385
15,030 4,830 498
260 4,830 498
130 2,415 249
130 2,415 249
14,770
7,385
7,385
Notes to the consolidated financial statements
170
Between 1and
5 years
Beyond 5
years
Unspecifie
d
maturity

Currency of denomination:Other currencies
Caption / Time interval On demandBetween 1
and 7 days
C ash assets 3,448
A.1Government securities
A.2 Other debt securities
A.3 UCITS units
A.4 Financing 3,448
- banks 3,446
- customers 2
C ash liabilit ies 2,925
B.1Deposits and current
accounts 2,925
- Banks 1
- Customers 2,924
B.2 Debt securities
B.3 Other liabilities
"Off -balance" sheet
transact io ns
C.1Financial derivatives with
underlying asset exchange
- long positions
- short positions
C.2 Financial derivatives
without underlying asset
exchange
- long positions
- short positions
C.3 Deposits and financing to
be received
- long positions
- short positions
C.4 Irrevocable commitments
to grant finance
- long positions
- short positions
C.5 Financial guarantees
granted
Notes to the consolidated
Other currencies
Between 1
and 7 days
Between 7
and 15 days
Between 15
days and 1
month
Between 1
and 3
months
Between 3
and 6
months
Between 6
months and
1year
Between 1and
1,788 2,684 662
1,788 2,684 662
643 1,342 331
1,145 1,342 331
Notes to the consolidated financial statements
171
Between 1and
5 years
Beyond 5
years
Unspecifie
d
maturity

1.4 Banking Group – Operational risks
Qualitative information
A. General aspects, management procedures and methods of measuring operational risk
By Operational Risk is meant the risk of suffering losses deriving from the inadequacies or malfunctioning ofprocedures, human resources and internal systems or by exogenous eventserror, interruption of operations, system unavailability, breach of contract and naturthis category. Operational risk includes legal risk but does not include those relating to strategy orThe Banco Desio Group uses the definition of operational risk given by the Parent Company within the relevantmethodological framework which adopts the definition given by the Bank of Italy in its circular no. 263 of 27December 2006.At Group level, a process is carried out to identify, classify and collect detrimental events
In relation to the management of risks having an impact on the Group’s operational continuity, consistently with itsgovernance model and in line with banking group supervision regulations, it was decided to adopt a businesscontinuity management plan centmaster agreements, the Parent Companyoperations, assistance and consultancy
The various corporate functions of the Groupin any event first evaluated by the responsible corporate boards. This said, it is to be noted that most actionsbrought against the Group at the end of the financial ydisputes concerning the trading service of financial instruments
Overall, the lawsuits pending with regard to the Italian banks of the Group have a value of Euro 76,614 million.These risks are appropriately monitored and hedged by prudential provisions of Euro 9.important lawsuits, almost exclusively brought against the Parent Companyamount 96.84%.
Quantitative information
The number of adverse events detected by the Group in 2011 totalled 841 events. The result of the process forthe gathering of adverse events is summarised in the table below (monetary values are reported in thousands ofEuros):
Notes to the consolidated
Operational risks
aspects, management procedures and methods of measuring operational risk
By Operational Risk is meant the risk of suffering losses deriving from the inadequacies or malfunctioning ofprocedures, human resources and internal systems or by exogenous events. Losses deriving from fraud, humanerror, interruption of operations, system unavailability, breach of contract and natural catastrophes all come withinthis category. Operational risk includes legal risk but does not include those relating to strategy orThe Banco Desio Group uses the definition of operational risk given by the Parent Company within the relevantmethodological framework which adopts the definition given by the Bank of Italy in its circular no. 263 of 27
level, a process is carried out to identify, classify and collect detrimental events
In relation to the management of risks having an impact on the Group’s operational continuity, consistently with itsgovernance model and in line with banking group supervision regulations, it was decided to adopt a businesscontinuity management plan centralised in the Parent Company, also considering that, on the basis of specificmaster agreements, the Parent Company provides the Italian banking subsidiaries withoperations, assistance and consultancy.
of the Group guard against legal risk by using standard contractual forms that arein any event first evaluated by the responsible corporate boards. This said, it is to be noted that most actionsbrought against the Group at the end of the financial year consisted in claw-back actions in bankruptcy, and otherdisputes concerning the trading service of financial instruments.
Overall, the lawsuits pending with regard to the Italian banks of the Group have a value of Euro 76,614 million.appropriately monitored and hedged by prudential provisions of Euro 9.
important lawsuits, almost exclusively brought against the Parent Company, account for about 96.96% of the total
number of adverse events detected by the Group in 2011 totalled 841 events. The result of the process forthe gathering of adverse events is summarised in the table below (monetary values are reported in thousands of
Notes to the consolidated financial statements
172
aspects, management procedures and methods of measuring operational risk
By Operational Risk is meant the risk of suffering losses deriving from the inadequacies or malfunctioning of. Losses deriving from fraud, human
al catastrophes all come withinthis category. Operational risk includes legal risk but does not include those relating to strategy or reputation.The Banco Desio Group uses the definition of operational risk given by the Parent Company within the relevantmethodological framework which adopts the definition given by the Bank of Italy in its circular no. 263 of 27
level, a process is carried out to identify, classify and collect detrimental events.
In relation to the management of risks having an impact on the Group’s operational continuity, consistently with itsgovernance model and in line with banking group supervision regulations, it was decided to adopt a business
ralised in the Parent Company, also considering that, on the basis of specificItalian banking subsidiaries with outsourced services for
legal risk by using standard contractual forms that arein any event first evaluated by the responsible corporate boards. This said, it is to be noted that most actions
back actions in bankruptcy, and other
Overall, the lawsuits pending with regard to the Italian banks of the Group have a value of Euro 76,614 million.appropriately monitored and hedged by prudential provisions of Euro 9.313 million. The most
account for about 96.96% of the total
number of adverse events detected by the Group in 2011 totalled 841 events. The result of the process forthe gathering of adverse events is summarised in the table below (monetary values are reported in thousands of

The value of the gross operating loss, equal to Euro 5,092 thousand; in relation to it, prudential provisions wereset aside for Euro 4,085 thousand during the year. The expensed gross losses were recovered for Euro 250thousand, thus recording a net loss equal t
SECTION 2 – INSURANCE COMPANIES’ RISKS
2.1 Insurance risks
Qualitative information
Insurance risks are analysed in relation to the activity carried out by the insurance company Chiara Assicurazioni,
a subsidiary owned by the Parent Company which is active in the non
In compliance with Regulation 20 of 26 March 2008 issued by ISVAPacceptable level the risks to which it is exposed, consistently with the assets available,an appropriate risk management system, proportionate to the sizeconducts, which should allow it to identify, measure and monitor the most significant risksThe main risks subject to qualitative and quantitative analysis by the Company are as follows
underwriting risk: the risk deriving from the execution of insurance contracts attached to the eventscovered, to the procedures followed for the rating andclaims trend than that estimated
reserves risk: the risk attached to having calculated claims reserves that are notcommitments to insured and damaged parties
Type of event
INTERNAL FRAUD Losses generated by fraud,
misappropriation, violation of laws, rules and
regulations or corporate directives (except for
discrimination events) involving at least one internal
member of the bank
EXTERNAL FRAUD Losses generated by fraud,
misappropriation, violation of laws, rules and
regulations or corporate directives (except for
discrimination events) carried out by third parties
EMPLOYMENT CONTRACT AND WORKPLACE SAFETY
Losses generated by breaches of the employment laws
and contracts, health and workplace safety laws, and by
any indemnities for accidents or discrimination.
RELATIONAL ACTIVITIES RELATED TO CLIENTS,
PRODUCTS AND CHANNELS Losses generated by the
inability (unintentional or due to negligence) to fulfil
the professional commitments assumed vis-à-vis the
customers (including the fiduciary requirements and
the requirements for an adequate information on
investments).
DAMAGES TO ASSETS This category includes natural
events or those events which might be connected to
any actions carried out by external persons which cause
damages to the tangible assets of the bank.
BUSINESS INTERRUPTION AND SYSTEMS MALFUNCTIONS
Losses generated by any blocks of the information
systems or of line connections.
EXECUTION OF DIRECTIONS, SUPPLY OF PRODUCTS AND
MANAGEMENT OF THE PROCESSES
TOTAL
Notes to the consolidated
ue of the gross operating loss, equal to Euro 5,092 thousand; in relation to it, prudential provisions wereset aside for Euro 4,085 thousand during the year. The expensed gross losses were recovered for Euro 250thousand, thus recording a net loss equal to Euro 4,842 thousand.
INSURANCE COMPANIES’ RISKS
Insurance risks are analysed in relation to the activity carried out by the insurance company Chiara Assicurazioni,
Parent Company which is active in the non-life branch.
Regulation 20 of 26 March 2008 issued by ISVAP and for the purpose of maintaining at anacceptable level the risks to which it is exposed, consistently with the assets available,an appropriate risk management system, proportionate to the size, nature and complexity of the business that
to identify, measure and monitor the most significant risksqualitative and quantitative analysis by the Company are as follows
: the risk deriving from the execution of insurance contracts attached to the eventsto the procedures followed for the rating and selection of risks and to
claims trend than that estimated;
the risk attached to having calculated claims reserves that are notcommitments to insured and damaged parties;
No. of
Events
% of
EventsGross loss
% on
totalNet loss
INTERNAL FRAUD Losses generated by fraud,
misappropriation, violation of laws, rules and
regulations or corporate directives (except for
discrimination events) involving at least one internal
6 0.71% 2,053 40.32% 2,041.20
EXTERNAL FRAUD Losses generated by fraud,
misappropriation, violation of laws, rules and
regulations or corporate directives (except for
discrimination events) carried out by third parties 282 33.53% 514 10.08% 282.48
EMPLOYMENT CONTRACT AND WORKPLACE SAFETY
Losses generated by breaches of the employment laws
and contracts, health and workplace safety laws, and by
any indemnities for accidents or discrimination. 3 0.36% 68 1.34% 68.44
RELATIONAL ACTIVITIES RELATED TO CLIENTS,
PRODUCTS AND CHANNELS Losses generated by the
inability (unintentional or due to negligence) to fulfil
the professional commitments assumed vis-à-vis the
customers (including the fiduciary requirements and
the requirements for an adequate information on
21 2.50% 1,141 22.41% 1,141.21
DAMAGES TO ASSETS This category includes natural
events or those events which might be connected to
any actions carried out by external persons which cause
damages to the tangible assets of the bank.1 0.12% 2 0.04% 1.93
BUSINESS INTERRUPTION AND SYSTEMS MALFUNCTIONS
Losses generated by any blocks of the information
4 0.48% 8 0.16% 1.07
EXECUTION OF DIRECTIONS, SUPPLY OF PRODUCTS AND
524 62.31% 1,306 25.64% 1,305.65
841 100.00% 5,092 100.00% 4,842
Notes to the consolidated financial statements
173
ue of the gross operating loss, equal to Euro 5,092 thousand; in relation to it, prudential provisions wereset aside for Euro 4,085 thousand during the year. The expensed gross losses were recovered for Euro 250
Insurance risks are analysed in relation to the activity carried out by the insurance company Chiara Assicurazioni,
and for the purpose of maintaining at anthe Company has obtained
nature and complexity of the business that itto identify, measure and monitor the most significant risks.
qualitative and quantitative analysis by the Company are as follows:
: the risk deriving from the execution of insurance contracts attached to the eventsand to a more unfavourable
the risk attached to having calculated claims reserves that are not sufficient to meet
% on
totalRecoveries
% on
total
42.16% 12.16 0.59%
5.83% 231.11 45.00%
1.41% 0.00 0.00%
23.57% 0.00 0.00%
0.04% 0.00 0.00%
0.02% 7.15 87.00%
26.97% 0.00 0.00%
100.00% 250 4.92%

The procedures for registering risks and the relativereports:
- mapping of operating risks carried out on an annual basis- reporting using the main- valuation of the capital requirement according to the- valuation of the effects on the
The procedures for identifying and assessing the risks are carried out on a continuous basis, to take accountboth the changes that have occurred to the nature andonset of new risks or the change in existing risksParticular attention is paid to the evaluation of risks arising from the offer of new promarkets. In this case, there is a direct involvement of the Risk Management function of the Company which, onthe basis of the technical characteristics of the product, assesses the potential capital absorption for the Companyresulting from the possible issue of the new productOnce a year, the Company, with reference to the closing of the accounts, carries out a prospective quantitativeanalysis using a stress tests, namely the evaluation of the Solvency Capital Requirement, wequal to the maximum probable loss with a probability level equal to 99.5% and with a time horizon of one yearThe risk management process is therefore divided into the following phases, which are closely connected to eachother:
- definition of the propensity to risk- identification, valuation and measurement of risks- control and reporting;- implementation of remedial measures (if any)
The Board of Directors defines and approves the Company’s propensity to risk, this being the risk level which canbe supported over a certain period of time, which allows to achieve economic and financial objectives
Underwriting risk
Operating limits relating to premiumsdown in insurance contracts.Premium practices are thus applied in full accordance with the reinsurance guidelines, through a range ofproducts complying, in terms of risksthe different types of products.As to reinsurance, the transfer of risks is aimed at maintaining a constant equilibrium of the technical results of theportfolio with respect to all the dynamics which potentially could jeopardise the expected profit.In view of the protection of corporate assets and control of venture capital, the plan for transfer to reinsurers helpsto increase the Company’s underwriting capacity, thus offering protterms of both frequency and impactThe corporate mission, as defined in the initial phases of the Company’s operations, focuses on athat provides for the marketing of nonoffer.The distribution of the Company’s products takes place predominantly at bank countersdistribution via insurance agents, multilevel networks, brokers or other atypical diThe distribution network performs exclusively the function of placing standardised insurance products, withinsurance contracts being issued by brokers using an online issuing platform which does not allow any type ofpersonalisation of the tariffs fixed by the Company, in order to maintain a level of risk in keeping with thepredefined underwriting limits.These safeguards as a whole are aimed at containing risks in compliance with the approved strategy and with theobjective of maximising the risk/yield profile of the CompanyThe Company places insurance products through the offer of two product lines• line of products “integrated” with banking services• line of “individual” products”.As at 31 December 2011 total premiums were equaprevious year.The analysis of the premiums shows a significant impact of the policies integrated with banking services whichaccount for about 63.33% of the total premiumsTherefore, the type of contract term accounts for 50.1% of long49.9% of annual policies based on tacit renewal
Notes to the consolidated
for registering risks and the relative quantitative results are suitably documented in the following
mapping of operating risks carried out on an annual basis;using the main Key Risk Indicators on a quarterly basis;
valuation of the capital requirement according to the Solvency II regime;ation of the effects on the Company’s state of solvency following a stress test
The procedures for identifying and assessing the risks are carried out on a continuous basis, to take accountboth the changes that have occurred to the nature and size of the business and to the market context, andonset of new risks or the change in existing risks.Particular attention is paid to the evaluation of risks arising from the offer of new products or from entering newmarkets. In this case, there is a direct involvement of the Risk Management function of the Company which, onthe basis of the technical characteristics of the product, assesses the potential capital absorption for the Company
sulting from the possible issue of the new product.Once a year, the Company, with reference to the closing of the accounts, carries out a prospective quantitativeanalysis using a stress tests, namely the evaluation of the Solvency Capital Requirement, wequal to the maximum probable loss with a probability level equal to 99.5% and with a time horizon of one yearThe risk management process is therefore divided into the following phases, which are closely connected to each
definition of the propensity to risk of the Company;identification, valuation and measurement of risks;
implementation of remedial measures (if any)in the event of exposure which exceeds the risk thresholdsrs defines and approves the Company’s propensity to risk, this being the risk level which can
be supported over a certain period of time, which allows to achieve economic and financial objectives
Operating limits relating to premiums are fully applied consistently with the contractual term and conditions laid
Premium practices are thus applied in full accordance with the reinsurance guidelines, through a range ofproducts complying, in terms of risks assumed and guarantees excluded, with the reinsurance limits assigned to
As to reinsurance, the transfer of risks is aimed at maintaining a constant equilibrium of the technical results of thethe dynamics which potentially could jeopardise the expected profit.
In view of the protection of corporate assets and control of venture capital, the plan for transfer to reinsurers helpsto increase the Company’s underwriting capacity, thus offering protection against anomalous trends in claims, interms of both frequency and impact.The corporate mission, as defined in the initial phases of the Company’s operations, focuses on athat provides for the marketing of non-life insurance policies at the bank branches through a highly standardised
The distribution of the Company’s products takes place predominantly at bank countersdistribution via insurance agents, multilevel networks, brokers or other atypical distributorsThe distribution network performs exclusively the function of placing standardised insurance products, withinsurance contracts being issued by brokers using an online issuing platform which does not allow any type of
tariffs fixed by the Company, in order to maintain a level of risk in keeping with the
These safeguards as a whole are aimed at containing risks in compliance with the approved strategy and with thehe risk/yield profile of the Company.
The Company places insurance products through the offer of two product lines:line of products “integrated” with banking services;
As at 31 December 2011 total premiums were equal to Euro 32,379 thousand, up by 18.4% compared to the
The analysis of the premiums shows a significant impact of the policies integrated with banking services whichaccount for about 63.33% of the total premiums.
ntract term accounts for 50.1% of long-term policies with an advance single premium and49.9% of annual policies based on tacit renewal.
Notes to the consolidated financial statements
174
are suitably documented in the following
of solvency following a stress test.
The procedures for identifying and assessing the risks are carried out on a continuous basis, to take account ofsize of the business and to the market context, and of the
ducts or from entering newmarkets. In this case, there is a direct involvement of the Risk Management function of the Company which, onthe basis of the technical characteristics of the product, assesses the potential capital absorption for the Company
Once a year, the Company, with reference to the closing of the accounts, carries out a prospective quantitativeanalysis using a stress tests, namely the evaluation of the Solvency Capital Requirement, which by definition, isequal to the maximum probable loss with a probability level equal to 99.5% and with a time horizon of one year.The risk management process is therefore divided into the following phases, which are closely connected to each
n the event of exposure which exceeds the risk thresholds.rs defines and approves the Company’s propensity to risk, this being the risk level which can
be supported over a certain period of time, which allows to achieve economic and financial objectives.
are fully applied consistently with the contractual term and conditions laid
Premium practices are thus applied in full accordance with the reinsurance guidelines, through a range ofassumed and guarantees excluded, with the reinsurance limits assigned to
As to reinsurance, the transfer of risks is aimed at maintaining a constant equilibrium of the technical results of thethe dynamics which potentially could jeopardise the expected profit.
In view of the protection of corporate assets and control of venture capital, the plan for transfer to reinsurers helpsection against anomalous trends in claims, in
The corporate mission, as defined in the initial phases of the Company’s operations, focuses on a business modeles at the bank branches through a highly standardised
The distribution of the Company’s products takes place predominantly at bank counters – with the exception ofstributors.
The distribution network performs exclusively the function of placing standardised insurance products, withinsurance contracts being issued by brokers using an online issuing platform which does not allow any type of
tariffs fixed by the Company, in order to maintain a level of risk in keeping with the
These safeguards as a whole are aimed at containing risks in compliance with the approved strategy and with the
l to Euro 32,379 thousand, up by 18.4% compared to the
The analysis of the premiums shows a significant impact of the policies integrated with banking services which
term policies with an advance single premium and

Reserves risks
To monitor reserve risks, which are associated with the possible quantification of inadequatewith respect to the commitments undertaken to insured and damaged parties, formalised procedures are in placewhich are applied by the relevant functions and are characterised by the following control elements
adequate segregation of dresponsible for assessment and the persons who carry out administrative checks
procedures to support the correct determination of technical reserves, includingo an organisational process which provides for a constant update of the assumptions underlying
the assessment of the technical reserves in the nono an organisational process which provides for the automatic allocation of cla
filing of any claimso on-going control procedures which show variances in claims reserves to be subjected to
additional checks
During the 2011 financial year the Company carried out the Stress Tests required by the Supervisorypursuant to article 20, paragraph 5, of ISVAPCompany calculated the Solvency Capital Requirement (SCR) according to the standard formula in the fifthquantitative impact study (QIS5)minimum capital requirements are fully covered by the Company’s own reservessufficient to meet the capital requirements (soRatio) amounted to 184%.
2.2 Financial risks
Quantitative information
The asset allocation guidelines and the investment operating limits of the assets are approved by the Board of
Directors. The monitoring of financial risks is the responsibility of the Investment Committee which is responsible
for the operational asset management through investment and disinvestment decisions relating to transferable
securities and through the management of the liquidity deriv
As at 31 December 2011 equity investments amounted to Euro 35,
year). Below is reported the breakdown in thousands of Euro
Assets
Cash
Shares
Bonds
UCITS
Total
Notes to the consolidated
To monitor reserve risks, which are associated with the possible quantification of inadequatewith respect to the commitments undertaken to insured and damaged parties, formalised procedures are in placewhich are applied by the relevant functions and are characterised by the following control elements
adequate segregation of duties and responsibilities in the reserve quantification process for the staffresponsible for assessment and the persons who carry out administrative checksprocedures to support the correct determination of technical reserves, including
organisational process which provides for a constant update of the assumptions underlyingthe assessment of the technical reserves in the non-life branch before their assessmentan organisational process which provides for the automatic allocation of clafiling of any claims;
going control procedures which show variances in claims reserves to be subjected toadditional checks.
During the 2011 financial year the Company carried out the Stress Tests required by the Supervisorypursuant to article 20, paragraph 5, of ISVAP Regulation no. 20/2008, with a valuation date of 31.12.2010. TheCompany calculated the Solvency Capital Requirement (SCR) according to the standard formula in the fifth
5). The study has demonstrated that also from a Solvency IIminimum capital requirements are fully covered by the Company’s own reserves.sufficient to meet the capital requirements (so-called SCR) and that the coverage degree (so
The asset allocation guidelines and the investment operating limits of the assets are approved by the Board of
financial risks is the responsibility of the Investment Committee which is responsible
for the operational asset management through investment and disinvestment decisions relating to transferable
securities and through the management of the liquidity deriving from operating and financial cash flow
equity investments amounted to Euro 35,998 thousand (+30%
year). Below is reported the breakdown in thousands of Euro:
Book value
7,615
0,613
34,355
1,029
43,613
Notes to the consolidated financial statements
175
To monitor reserve risks, which are associated with the possible quantification of inadequate technical reserveswith respect to the commitments undertaken to insured and damaged parties, formalised procedures are in placewhich are applied by the relevant functions and are characterised by the following control elements:
uties and responsibilities in the reserve quantification process for the staffresponsible for assessment and the persons who carry out administrative checks;procedures to support the correct determination of technical reserves, including:
organisational process which provides for a constant update of the assumptions underlyinglife branch before their assessment;
an organisational process which provides for the automatic allocation of claims reserves upon
going control procedures which show variances in claims reserves to be subjected to
During the 2011 financial year the Company carried out the Stress Tests required by the Supervisory AuthorityRegulation no. 20/2008, with a valuation date of 31.12.2010. The
Company calculated the Solvency Capital Requirement (SCR) according to the standard formula in the fifthSolvency II perspective the. The available capital was
coverage degree (so-called Solvency
The asset allocation guidelines and the investment operating limits of the assets are approved by the Board of
financial risks is the responsibility of the Investment Committee which is responsible
for the operational asset management through investment and disinvestment decisions relating to transferable
ing from operating and financial cash flow.
(+30% compared to the previous
Portfolio
weighting
17.46%
1.41%
78.77%
2.36%
100%

The assets in the portfolio at 31
the working capital of the Company
The investments in bonds at the valuation date amounted to
78.77% of the securities portfolio
DISCLOSURE TO THE PUBLIC
Information for which publication is subject to the rules laid down by Section IV, Chapter 1 of the Bank of Italy
circular no. 263/06 “New regulations for the prudential supervision of banks
parent company by the deadline set out for the publication of the financial statements
Assets
Government bonds
Corporate bonds
TOTAL
Notes to the consolidated
31 December 2011 were classified as Available for Sale,
Company.
The investments in bonds at the valuation date amounted to € 34,335 thousand and they represent around
of the securities portfolio. The breakdown is shown below, in thousands of euro
DISCLOSURE TO THE PUBLIC
publication is subject to the rules laid down by Section IV, Chapter 1 of the Bank of Italy
regulations for the prudential supervision of banks” is published on the internet site of the
parent company by the deadline set out for the publication of the financial statements.
Book value Portfolio weighting
22,017
12,338
34,355
Notes to the consolidated financial statements
176
, and therefore they fall into
thousand and they represent around
The breakdown is shown below, in thousands of euro:
publication is subject to the rules laid down by Section IV, Chapter 1 of the Bank of Italy
is published on the internet site of the
Portfolio weighting
50.48%
28.29%
78.77%
Notes to the consolidated financial statements
177
Part F – INFORMATION ON CONSOLIDATED EQUITY
SECTION 1 - CONSOLIDATED SHAREHOLDERS’EQUITY
A Qualitative information
The Banco Desio Group has always paid most attention to shareholders’ equity, aware both of its function inguaranteeing the trust of outside financers that can be called upon to absorb any losses and of its importance bothpurely for operations and for corporate growth. In fact a substantial level of capitalisation enables corporate growthto be conducted with the necessary margins of autonomy, preserving the Group’s stability.The concept of accounting capital used by the Group is given by the algebraic sum of the following liability items inthe Balance Sheet: Share capital, Valuation reserves, Reserves, Share premiums and Profit for the Period.The policy of the Banco Desio Parent Company is, therefore, to give a substantial degree of priority toshareholders’ equity in order to make the best possible use of it in business growth.

Notes to the consolidated financial statements
178
B Quantitative information
B.1 Consolidated equity: breakdown by type of business
Captions/values Banking GroupInsurance
companies
Other
companies
Eliminations and
adjustments from
consolidation
Total
of w hich
"attributable to
minority
interests"
1. Shareholders' equity 67,805 3,137 70,942 3,237
2. Share premium reserve 16,145 210 16,355 210
3. Reserves 656,187 913 553 657,653 943
- retained earnings 0
a) legal 75,021 913 75,934 915
b) statutory 435,849 435,849 28
c) treasury shares
d) other 145,317 553 145,870
e) advances on dividends
- other
4. Equity instruments
5. Treasury shares
6. Revaluation reserves (14 576) ( 899) (15 475) ( 899)
- Available-for-sale financial assets (37 370) ( 900) (38 270) ( 900)
- tangible assets
- intangible assets
- foreign investment hedge
- exchange rate differences
- non-current assets held for sale and discontinued operations 4,841 4,841
- actuarial prof its (losses) relating to
defined benefit plans 71 1 72 1
- shares of valuation reserves relating to (5 014) (5 014)
investee companies carried at equity 22 896 22 896
- special revaluation law s 45,058 833 45,891 949
Total 770,619 4,194 - 553 775,366 4,484

Notes to the consolidated financial statements
179
B.2 Valuation reserves of financial assets available for sale: breakdown
Assets / Amounts
Positive
reserve
Negative
reserve
Positive
reserve
Negative
reserve
Positive
reserve
Negative
reserve
Positive
reserve
Negative
reserve
Positive
reserve
Negative
reserve
1. Debt securities 738 (36 520) (2 701) 738 (39 221)
2. Equity securities 158 ( 168) 158 ( 168)
3. UCITS Units 631 ( 408) 631 ( 408)
4. Financing
Total 31/12/2011 1,527 (37 096) (2 701) 1,527 (39 797)
Total 31/12/2010 597 (9 869) ( 387) 597 (10 256)
Banking Group Insurance companies Other companies
Eliminations and
adjustments from
consolidation
31.12.2011
B.3 Valuation reserves of financial assets available for sale: annual changes
Debt
securities
Equity
securitiesUCITS units Loans
1. Opening balance (9 949) 136 154
2. Increases 3,106 531
2.1 Fair value increases 738 523
2.2 Reversal of negative reserves to the
income statement 1,868 5
- from deterioration
- from disposal 1,868 5
2.3 Other increases 500 3
3. Decreases 31,640 146 462
3.1 Fair value decreases 31,340 145 400
3.2 Adjustments from deterioration
3.3 Reversal of positive reserves to the
income statement: from disposal104 61
3.4 Other decreases 196 1 1
4. Closing balance 38,483 10 ( 223)
SECTION 2 - BANKING REGULATORY CAPITAL AND RATIOS
2.1 Scope of application of the regulations
According to the prudential regulations (Bank of Italy’s Circular Letters no. 263 and no. 155), the scope of
consolidation includes the companies which present the following characteristics:
- banking, financial and functional companies directly or indirectly owned by the Parent Company and to
which the method of consolidation on a line-by-line basis is applied;
- businesses, other than banking, financial and functional companies, directly or indirectly owned by the
Parent Company on an exclusive or joint basis or subject to significant influence; such companies are
consolidated on an equity basis.
Banking and financial companies valued at equity and qualified companies, which are directly or indirectly ownedby the Parent Company to an extent exceeding 10%, are deducted from the regulatory capital for 50% from Tier 1capital and for the remaining 50% from the Tier 2 capital; the difference as at the date of first-time application ofequity between the book value of the equity investment and the correspondent portion of equity of the company isentered as a total reduction in Tier 1 capital; equity investments in insurance companies acquired before 20 July2006 are deducted from the Tier 1 capital and from the Tier 2 capital.The book value of the companies other than banking and financial companies and of the banking companiesowned to an extent equal to or less than 10% is included in weighted risk assets.

Notes to the consolidated financial statements
180
The prudential scope of consolidation differs from the scope of consolidation of the annual accounts reportedaccording to the international accounting standards (IAS/IFRS); in the second case, in fact, the subsidiarycompanies or the companies subject to joint control are consolidated on a line-by-line or proportional basis, even ifthey are other than banking, financial and functional companies.
Within the Banking Group, there are no restrictions or impediments to the transfer of financial resources betweencompanies in the banking group.
2.2 Banking regulatory capital
A. Qualitative information
The Banco Desio Group pays great attention to the notion of equity used for supervision purposes. Thedetermination of the regulatory capital is certainly important owing to the importance of this aggregate inconnection with the controls that the competent authorities carry out in order to ascertain the stability of bankingGroups. The relevant regulations, in fact, state that “….the most important control tools are based on this, such asthe solvency coefficient, the requirements to meet market risks, the rules regarding risk concentration andmaturity transformation; transactions in various sectors also depend on equity size”.
As of 31 December 2011 the consolidated regulatory capital of the Banco Desio Group is made up as follows:
Description AmountPrimary capital 663,679Supplementary capital 75,582Deductions 10,344Regulatory capital 728,917
1. Tier 1 capital
Share capital, share premiums, reserves, undistributable earnings for the period and innovative equityinstruments are the most significant elements of the capital. From these positive elements, any negative elementsis deducted, mainly represented by intangible assets, the residual portion of goodwill and any deductions resultingfrom the application of prudential filters.Tier 1 capital accounts for about 89% of the Regulatory Capital.
2. Tier 2 capital
Valuation reserves, innovative equity instruments not included in the Tier 1 capital, hybrid equity instruments,subordinated liabilities and net gains on equity investments, represent the key positive elements of Tier 2 capital.To these positive elements, the deductions provided for by the prudential filters are applied.Tier 2 capital accounts for about 12% of the Regulatory Capital. The elements to be deducted account for about1%.
3. Tier 3 capital
This is made up of the portion of Tier 2 subordinated liabilities that cannot be calculated in Tier 2 because theyexceed 50% of the core capital before deductions and by Tier 3 subordinated liabilities. This total can be used onlyto cover the capital requirements for the market risks up to a maximum amount of 71.4% of the same.
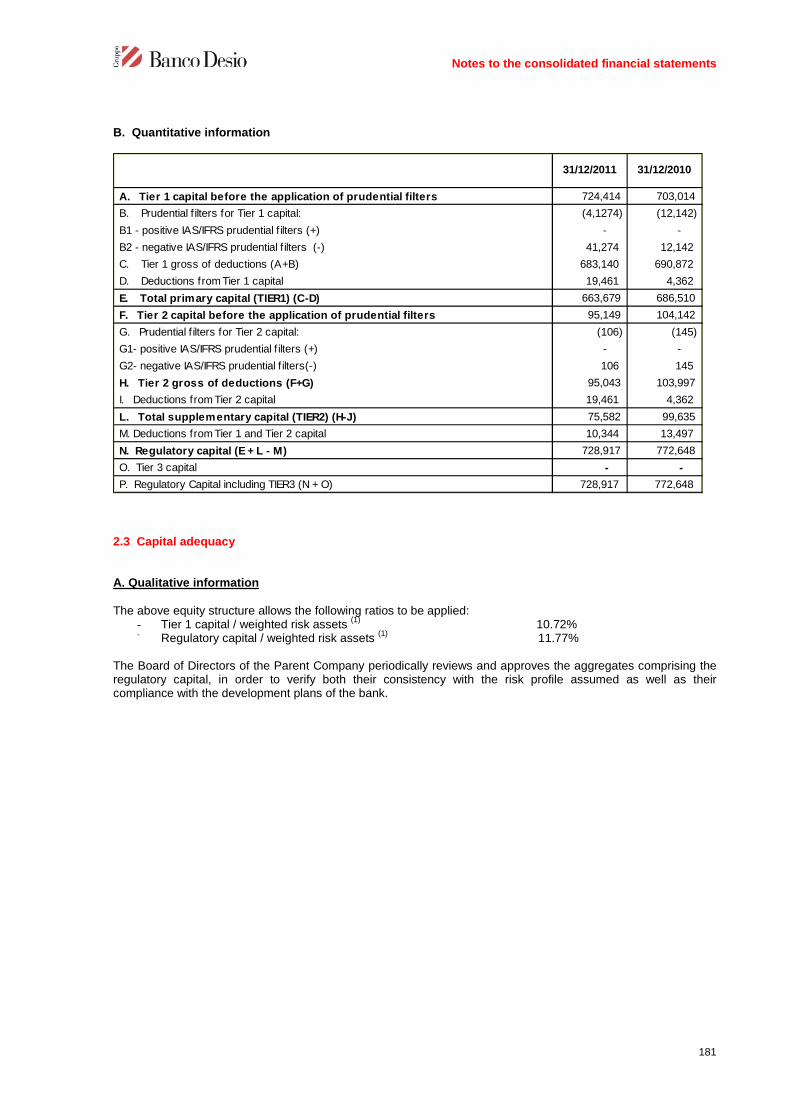
Notes to the consolidated financial statements
181
B. Quantitative information
A. Tier 1 capital before the application of prudential filters 724,414 703,014
B. Prudential f ilters for Tier 1 capital: (4,1274) (12,142)
B1 - positive IAS/IFRS prudential f ilters (+) - -
B2 - negative IAS/IFRS prudential f ilters (-) 41,274 12,142
C. Tier 1 gross of deductions (A+B) 683,140 690,872
D. Deductions from Tier 1 capital 19,461 4,362
E. Total primary capital (TIER1) (C-D) 663,679 686,510
F. Tier 2 capital before the application of prudential filters 95,149 104,142
G. Prudential f ilters for Tier 2 capital: (106) (145)
G1- positive IAS/IFRS prudential f ilters (+) - -
G2- negative IAS/IFRS prudential f ilters(-) 106 145
H. Tier 2 gross of deductions (F+G) 95,043 103,997
I. Deductions from Tier 2 capital 19,461 4,362
L. Total supplementary capital (TIER2) (H-J) 75,582 99,635
M. Deductions from Tier 1 and Tier 2 capital 10,344 13,497
N. Regulatory capital (E + L - M) 728,917 772,648
O. Tier 3 capital - -
P. Regulatory Capital including TIER3 (N + O) 728,917 772,648
31/12/2011 31/12/2010
2.3 Capital adequacy
A. Qualitative information
The above equity structure allows the following ratios to be applied:- Tier 1 capital / weighted risk assets
(1)10.72%
- Regulatory capital / weighted risk assets(1)
11.77%
The Board of Directors of the Parent Company periodically reviews and approves the aggregates comprising theregulatory capital, in order to verify both their consistency with the risk profile assumed as well as theircompliance with the development plans of the bank.
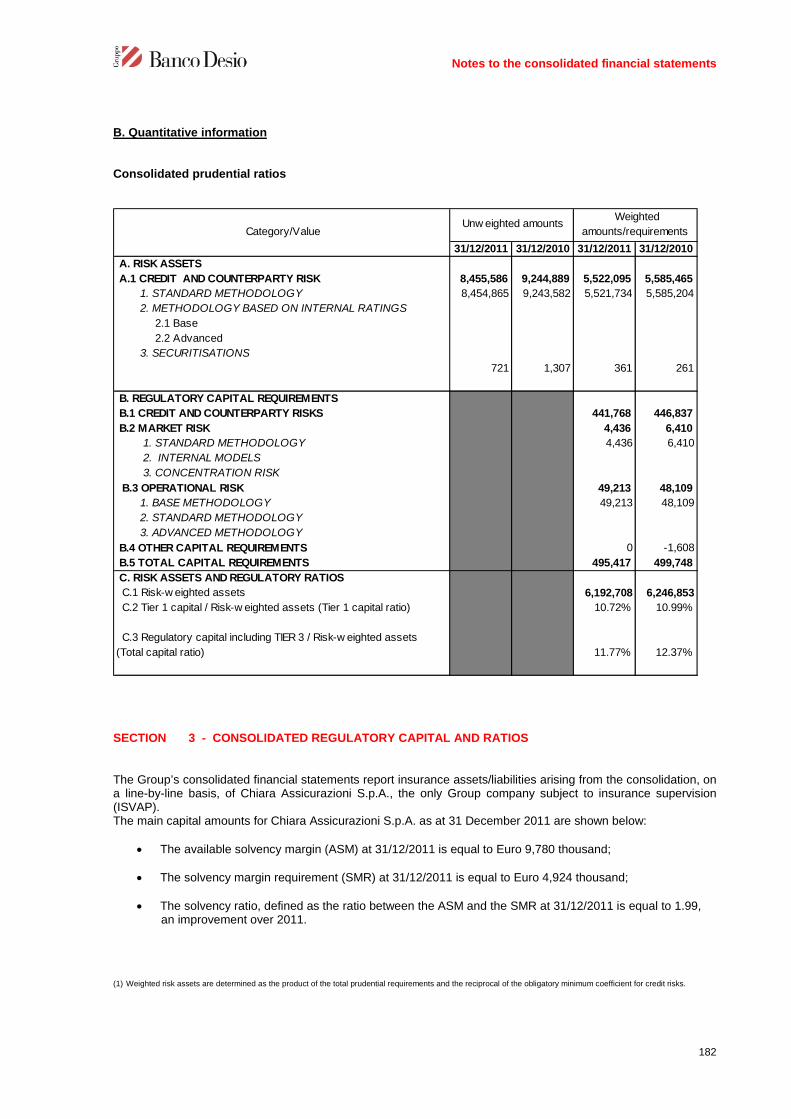
Notes to the consolidated financial statements
182
B. Quantitative information
Consolidated prudential ratios
31/12/2011 31/12/2010 31/12/2011 31/12/2010
A. RISK ASSETS
A.1 CREDIT AND COUNTERPARTY RISK 8,455,586 9,244,889 5,522,095 5,585,465
1. STANDARD METHODOLOGY 8,454,865 9,243,582 5,521,734 5,585,204
2. METHODOLOGY BASED ON INTERNAL RATINGS
2.1 Base
2.2 Advanced
3. SECURITISATIONS
721 1,307 361 261
B. REGULATORY CAPITAL REQUIREMENTS
B.1 CREDIT AND COUNTERPARTY RISKS 441,768 446,837
B.2 MARKET RISK 4,436 6,410
1. STANDARD METHODOLOGY 4,436 6,410
2. INTERNAL MODELS
3. CONCENTRATION RISK
B.3 OPERATIONAL RISK 49,213 48,109
1. BASE METHODOLOGY 49,213 48,109
2. STANDARD METHODOLOGY
3. ADVANCED METHODOLOGY
B.4 OTHER CAPITAL REQUIREMENTS 0 -1,608
B.5 TOTAL CAPITAL REQUIREMENTS 495,417 499,748
C. RISK ASSETS AND REGULATORY RATIOS
C.1 Risk-w eighted assets 6,192,708 6,246,853
C.2 Tier 1 capital / Risk-w eighted assets (Tier 1 capital ratio) 10.72% 10.99%
C.3 Regulatory capital including TIER 3 / Risk-w eighted assets
(Total capital ratio) 11.77% 12.37%
Category/ValueUnw eighted amounts
Weighted
amounts/requirements
SECTION 3 - CONSOLIDATED REGULATORY CAPITAL AND RATIOS
The Group’s consolidated financial statements report insurance assets/liabilities arising from the consolidation, ona line-by-line basis, of Chiara Assicurazioni S.p.A., the only Group company subject to insurance supervision(ISVAP).The main capital amounts for Chiara Assicurazioni S.p.A. as at 31 December 2011 are shown below:
The available solvency margin (ASM) at 31/12/2011 is equal to Euro 9,780 thousand;
The solvency margin requirement (SMR) at 31/12/2011 is equal to Euro 4,924 thousand;
The solvency ratio, defined as the ratio between the ASM and the SMR at 31/12/2011 is equal to 1.99,an improvement over 2011.
(1) Weighted risk assets are determined as the product of the total prudential requirements and the reciprocal of the obligatory minimum coefficient for credit risks.

Notes to the consolidated financial statements
183
Part H - TRANSACTIONS WITH RELATED PARTIES
For information regarding the remuneration paid to the members of management and control boards andmanagers with strategic responsibilities please refer to the “Report on Group Remuneration Policies” drawn uppursuant to Article 123-ter of the T.U.F. [Testo Unico della Finanza, Consolidated Act on Finance].For information about the stock option plans reference is also made to “Part I” of these notes.
Information on transactions with related parties
The Internal Procedure adopted pursuant to Consob Regulation no. 17221/2010 for transactions with relatedparties (including those made with Representatives pursuant to article 136 of the Consolidated Banking Act) isdescribed in the Annual Report on Corporate Governance.The procedure itself is published, in compliance with the abovementioned Regulation, on the websitewww.bancodesio.it – section “Banco Desio / Corporate Governance / Transactions with Related Parties”.Considering that, pursuant to article 5 of the Regulation itself and article 154-ter of the Consolidated Act onFinance referred to by the same, periodical information is to be provided regarding:a) the individual “most significant” transactions entered into in the reporting period, these being the transactions
which exceeds, also on a cumulative basis, the thresholds envisaged in Annex 3 to the abovementionedRegulation
1;
b) any other individual transactions (if any) with related parties, as defined pursuant to article 2427, paragraph 2,of the Italian Civil Code, entered in the relevant period, which have significantly affected the Group’s financialposition or results;
c) any change in or development of transactions with related parties described in the last annual report whichhave had a significant effect on the Group’s financial position or results in the reporting period;
it is noted that in 2011 no transactions were entered into which were such as to present the characteristicsreferred to in letters a), b) and c) without prejudice to the merger of the full subsidiaries Banco Desio ToscanaSpA and Banco Desio Veneto SpA into the Parent company – effective from 1 October 2011 – which, as reportedin the specific disclosures, was approved by the Board of Directors after a binding favourable opinion expressedby the Committee for Transactions with Related Parties.
Relations with external related parties are generally settled at market conditions and, where the market is not asatisfactory reference (as in the instance of the Agreements for outsourcing services provided to subsidiaries bythe Parent Company), at advantageous and correct conditions, that are valued in compliance with the Proceduresabove, in any case taking account of the company’s interest in performing the transactions.In this context, as of 31 December 2011, no transaction presents particular risks other than those that areassessed in the context of ordinary banking activities, and no transaction is either atypical or unusual.The following paragraphs summarise the existing relations by categories of related parties (Parent Company,Associates, Representatives and parties connected to these), highlighting in particular the current accounts andsecurity accounts at the close of the financial year and, finally, any supplier relations of a different type.
In this context, also note – according to a single management approach of potential conflicts of interest – thosetransactions which are effected pursuant to article 136 of the Consolidated Banking Law and which, in any case,do not fall within the scope of transactions with related parties pursuant to Consob Regulation no. 17221/2010 or,in short, of article 2391-bis of the Italian Civil Code by virtue of which this Regulation has been issued (mainly withreference to the following subjects: Representatives of subsidiaries of “Banco Desio”; their close relatives;companies with which the representatives of the Group hold offices of director/statutory auditor where there is norelationship of control/association).
I - Parent Company
At the end of the year, the amounts due (to customers) to the Parent Company Brianza Unione di Luigi Gavazzi &C. SApA by Banco Desio totalled Euro 179.5 million, of which Euro 178.9 million related to security portfolios. Thecompany has no debt exposure.
1 As regards the significance ratio of the countervalue of transactions with related parties, the Internal Procedure makesreference to a significance threshold equal to Euro 37.5 million (corresponding to 5% of the consolidated regulatory capital asrecognized at the date of adoption of the Procedure itself)

Notes to the consolidated financial statements
184
During the year, there were no other transactions with this company (the company also falls within the scope ofArticle 136 of the Consolidated Banking Act (T.U.B.) by virtue of the positions held in it by some Representatives,as per paragraph III below).
II – Associated companies
At the end of the year there were two associated companies:
- Chiara Vita SpA, in which an interest of 30% is retained within the framework of the agreements with theHelvetia Group entered into in 2008;
- Istifid S.p.A., in which the interest of approx. 29% (relative majority) is retained, which was reached during2009
Within the framework of the agreements with the Helvetia Group, the following agreements are still in place withChiara Vita Spa: i) a five-year contract for the distribution of products in the life insurance branch; ii) a correlatedagreement for banking services.At the close of the period, the amounts due (to customers) to Chiara Vita SpA by Banco Desio amounted to a totalof Euro 158.5 million, of which Euro 40.7 million related to security portfolios; the company has no debt exposure.
The contractual relations maintained by Banco Desio with Istifid SpA consist essentially in the supply of companyservices (shareholders registers, assistance at meetings, consultancy regarding corporate compliance etc.) whichare charged at the usual costs for such services. With reference to the transactions for closing the “Banco DesioVeneto” and “Chiara Assicurazioni” stock option plans described in Part 1 of these notes, it is noted that theassociate company was appointed to carry out, as for similar transactions carried out in previous periods, a seriesof activities of a fiduciary nature, with a resulting outlay by Banco Desio equal to Euro 0.1 million.As regards the banking services provided by Banco Desio to Istifid SpA, the amounts due (to customers) at theclose of the period amounted to a total of Euro 48.8 million, of which Euro 23.5 million related to securityportfolios; the company has no debt exposure.It is clarified that these amounts payable and receivable also refer to relations maintained by Istifid SpA as part offiduciary mandates granted by third parties.
The amount of assets/liabilities, as well as revenues/charges, resulting from relations of Banco Desio with theaforesaid companies is shown in paragraph 8.4 of the individual company Report of Operations under the item“Companies subject to significant influence”.
III - Transactions with Representatives and subjects referable thereto
As regards the transactions subject to credit limits approved in 2010 pursuant to Article 136 of the ConsolidatedLaw on Banking (T.U.B.), it is to be noted that most of these were ordinary transactions whereby credit was paidout to Representatives of the Group and/or companies referable thereto, with regard to which the Representatives(by such is meant the directors, auditors and managers with strategic responsibilities in the Bank and in thecompanies with a control relationship) concerned stated that they had interests of various kinds by virtue of stakesheld of a controlling/associate nature, appointments and/or other relationships of a financial or personal naturewith these companies. These relations did not affect the application of the normal criteria for appraisingcreditworthiness. The total amount of the facilities granted by the Group’s Banks in the 38 positions existing as at31 December 2011 is equal to about Euro 31.5 million. The relative uses totalled about Euro 23.2 million inamounts due from customers.The figures above do not include approved transactions with the associate companies mentioned in point II above(officially resolved pursuant to Article 136 of the Consolidated Banking Act, due to the positions held in suchcompanies by some Representatives of the Bank).It should be noted that the position of those working as Representatives of only the Banco Desio’s subsidiariesare confined to their respective companies, thus excluding their classification as “Managers with strategicresponsibilities within the Group” pursuant to IAS24 and/or Consob Regulation no. 17221/2010.
As regards deposit relations held by the Banks of the Group directly with the Representatives, as well as withparties connected to these, it is also worth noting that the balances as at 31 December 2011 amount to aboutEuro 64.9 million in amounts due to customers (inclusive of about Euro 44.8 million, in securities accounts).
The table below reports the breakdown of the aforesaid credit line and borrowing relationships as described in thisparagraph:

Notes to the consolidated financial statements
185
(balances at 31.12.2011 Euro/million)
Subjects “art. 136 ofConsolidated banking Act”which fall within the scopeof related parties “article
2391-bis of the Italian CivilCode”
(e.g.: Representatives of“Banco Desio” or of
“Brianza Unione”; theirclose relatives; related
companies in acontrol/connection
relationship)
(A)
Subjects “art. 136 ofConsolidated banking Act”which do not fall within the
scope of related parties“article 2391-bis of the Italian
Civil Code”(e.g.: Representatives ofsubsidiaries of “Banco
Desio”; their close relatives;companies in which theRepresentatives of theGroup hold offices of
director/statutory auditorwhere there is no
relationship ofcontrol/connection
(B)
TOTAL(A+B)
Credit line transactions:
Amount granted 5.8 25.7 31.5
Amount used 4.6 18.6 23.2
Borrowing transactions:
Current account and savingsdeposit amount
(a)
7.4 12.7 20.1
Amount of securities accounts(b)
37.6 7.2 44.8
Total (a+b) 45 19.9 64.9
* * *In compliance with CONSOB Resolution no. 15519 of 27 July 2006 it is noted that the total percentage value ofthe above balances in terms of the Group’s equity, financial and economic situation remains substantiallynegligible.

Notes to the consolidated financial statements
186
PART I – PAYMENT AGREEMENTS BASED ON THE GROUP’S EQUITYINSTRUMENTS
Stock Grant Plan for shares of the Parent Company
With reference to the Stock Grant Plan for the 2011-2012-2013 three-year period, which concerns the allocation,free of charge, of ordinary shares of the company to the Management of the Banco Desio Group, approved by theGeneral Shareholders’ Meeting of 29 November 2011, reference is made to the “Report on Group remunerationpolicies” drawn up pursuant to Article 123-ter of the T.U.F. [Testo Unico della Finanza, Consolidated Act onFinance].
Stock Option Plan for shares of the merged company Banco Desio Veneto SpA
The “Banco Desio Veneto” Plan, which drew to its conclusion during the period, was already outlined in detail inthe financial statements of 2006 (the year when the plan was activated) and then appropriately updated in thesubsequent financial statements and in the six-monthly financial reports.
In support of the subscription options exercised by the beneficiaries by virtue of the provisions of the Plan Rules,the share capital of Banco Desio Veneto SpA was increased on 27 April 2011, in a single “tranche” – for a feewith the exception of the option right of shareholders pursuant to articles 2441 and 2443 of the Italian Civil Code –by a total nominal amount of Euro 5,614,474 (through the issue of 5,614,474 ordinary shares, with a nominalvalue of Euro 1.00 each). The exercise of the options took place at a weighted average price of Euro 1.09 pershare and therefore with a total value of Euro 6.1 million.
The shares issued were subscribed, upon the mandate of the beneficiaries, by the appointed trustee, who on thesame date of 27 April 2011 transferred, upon the instructions of the beneficiaries, all of the subscribed shares toBanco di Desio e della Brianza SpA at a price of Euro 2.08 per share and therefore with a total value of Euro 11.7million. This price was determined by the Board of Directors of Banco di Desio e della Brianza on 24 February2011 on the basis of a special report drawn up as is the custom by a financial expert and based on the accountingdata at 31 December 2010.
As a result of the above-mentioned transactions, Banco di Desio e della Brianza SpA’s stake in Banco DesioVeneto SpA therefore remained 100% until the merger effective from 1 October 2011.
Stock option plan for shares of subsidiary Chiara Assicurazioni SpA
The “Chiara Assicurazioni” Plan, which also came to an end during the period was already outlined in details inthe financial statements of 2006 (the year when the plan was activated) and then appropriately updated in thesubsequent Financial Statements and in the six-monthly financial reports.

Notes to the consolidated financial statements
187
In support of the subscription options exercised by the beneficiaries by virtue of the provisions of the Plan Rules,the share capital of Chiara Assicurazioni SpA was increased on 27 April 2011, in a third and final “tranche” – for afee with the exception of the option right of shareholders pursuant to articles 2441 and 2443 of the Italian CivilCode – by a total nominal amount of Euro 658,000 (through the issue of 658,000 ordinary shares, with a nominalvalue of Euro 1.00 each). The exercise of the options took place at a price of Euro 1.33 per share and thereforewith a total value of Euro 0.9 million.
The shares issued were subscribed, upon the mandate of the beneficiaries, by the appointed trustee, who on thesame date of 27 April 2011 transferred, upon the instructions of the beneficiaries, all of the shares in question(including 151,000 shares subscribed in the first two “tranches” and retained in the portfolio) to Banco di Desio edella Brianza SpA at a price of Euro 4.42 per share and therefore with a total value of Euro 3.6 million. This pricewas determined by the Board of Directors of Banco di Desio e della Brianza on 24 February 2011 on the basis ofa special report drawn up as is the custom by a actuarial expert and based on the accounting data at 31December 2010.
As a result of the above-mentioned transactions, Banco di Desio e della Brianza SpA’s stake in ChiaraAssicurazioni SpA is therefore 66.66%.
Stock option plan for shares of subsidiary Fides SpA held by Banco Desio Lazio SpA
The “Fides” Plan was already outlined in detail in the 2008 financial statements (the year that the Plan wasactivated) and then appropriately updated in the subsequent financial statements and in the six-monthly financialreports. In summary, this Plan refers to a maximum number of shares equal to 20% of the share capital of thesubsidiary, which is a finance company operating in particular, as known, in the sector of salary-secured loans.This maximum portion remains substantially unchanged after the capital increases carried out by the subsidiaryduring the 2009 and 2010 financial years, as a consequence of additional allocations granted to the beneficiariesto such an extent as to offset the resulting share dilution incurred by them, as laid down by the Plan Rules. Thebase of beneficiaries is made up of a number of representatives and employees of the company and of the Groupthat are directly and/or indirectly involved in the process of developing the business of the company.
As a result of the changes already outlined in detail in the last financial statements, there were a total of 401,509options remaining at 31 December 2011. The final deadline for the exercise of the abovementioned options(previously 1 – 31 October 2011) was extended by the Board of Directors of Banco Desio Lazio to 31 October2012, by means of a resolution taken on 17 October 2011.
The strike price of Euro 7.64 per share takes account of the normal value of Euro 7.55 initially set by anappropriate expert’s report, as well as of the subsequent appropriations of additional charges which increased thecarrying amount of the Fides shares with the holder Banco Desio Lazio SpA.
The Black & Scholes method was used to value options; the basic assumptions made for valuation are similar tothose for the other plans described above. The unit value of each option is included in a range between aminimum of Euro 0.15356 and a maximum of Euro 1.03901 The value of the existing options is Euro 304,752.
The cost accruing, in 2011, for the aforesaid no. 401,509 options, calculated by distributing the total cost over theterm of the options - is Euro 89,209.

Notes to the consolidated financial statements
188
PART L – SEGMENT REPORTING
This disclosure makes reference to the organisational and executive structure of the Group, as well as to theinternal reporting system on the basis of which the management monitors the performance of the results andmakes operational decisions as to the resources to be allocated.
The Group operates by carrying out the traditional credit brokerage activities, asset management, the offer ofbank-insurance products in the life and non-life branches. In this framework, segment reporting takes account ofthe fact that the operating structure of the commercial banks does not present segment networks and/or divisions.This section reports the results of the Group’s segments described below:
commercial bank: bringing together the activities directed towards retail and corporate customers concerningthe traditional credit brokerage activity. Included in this operating segment are products and services relatedto: any form of loan or deposit; financial, insurance and asset management products; and debit and creditcards.
investment banking: bringing together the activities related to the Bank’s own securities portfolio and theInterbank market;
asset management: includes the activities carried out by the subsidiary companies Brianfid Sa, BancaCredito Privato Commerciale Sa e Rovere SA;
corporate center: reports the results of the Group’s direction and control functions which perform supportactivities in the management and co-ordination of the business portfolio. Furthermore, it includes serviceactivities, identified as the cross-segment activities performed to support the operations and entrusted to thecorporate centre to guarantee productive efficiency and organizational consistency. The corporate centrestructure can be identified in the centralized functions at the Parent Company supporting the Groupcompanies (administration, finance, management control, risk management, personnel administration, ITsystems, property management, etc.). Furthermore, intra-group adjustments are allocated to the corporatecentre, except where the intra-group netting are between companies within the same segment.
The financial and economic data by segment correspond to the respective financial statement items and beloware reported the criteria for their determination:
net interest income: is calculated by contribution on the basis of internal transfer rates differentiated byproduct and duration;
net income from services: is obtained by direct allocation of each actual asset and liability commissioncomponent;
operating costs: are allocated to each operating segment through a process which provides for the attributionof costs to each organizational unit present in the segment, directly or by driver, in accordance with the fullcosting method;
provisions and adjustments: are allocated both directly and through allocation criteria.
Furthermore, the main balance sheet aggregates and indirect deposits (administered and managed) is disclosedfor each reporting segment.The data by segment is shown before intra-group balances, except where the intra-group balances are betweencompanies within the same operating segment.

Notes to the consolidated financial statements
189
Income statement data 31.12.2011Merchant
bank
Investment
bankingAsset mng
Corporate
center
Business margin (1) 362,769 326,863 15,916 11,864 8,126
Structure costs (2) -246,148 -200,069 -1,846 -9,165 -35,068
Provisions and adjustments (3) -37,402 -38,468 -766 1,832
Profits/(Losses) on equity investments
carried at equity 2,763 2,763
Profits/(Losses) on the disposal of
investments 2 2
Profits/(Losses) before taxes on
continuing operations 81,984 88,326 14,070 1,935 -22,347
(1) including other operating expenses/expenses
(2) administrative expenses, net adjustments to tangible and intangible assets
(3) net adjustments for impairment of loans and receivables and financial assets, provisions for risks and charges
Balance sheet data 31.12.2011Merchant
bank
Investment
bankingAsset mng
Corporate
center
Financial assets 1,066,594 34,994 1,021,489 10,323 -212
Amounts due from banks 288,525 168,134 145,288 -24,898
Amounts due from customers 6,580,450 6,573,677 6,773
Amounts due to banks 267,998 291,446 -23,448
Amounts due to customers 4,347,706 4,210,068 137,658 -20
Securities issued and financial liabilities at
fair value through profit or loss 2,696,584 2,696,584
INDIRECT DEPOSITS: ADMINISTERED
AND MANAGED 10,821,717 9,908,851 912,866
Income statement data 31.12.2010Merchant
bank
Investment
bankingAsset mng
Corporate
center
Business margin (1) 346,750 303,513 19,194 13,705 10,338
Structure costs (2) -242,326 -196,179 -1,863 -9,257 -35,027
Provisions and adjustments (3) -25,121 -40,756 -5 15,640
Profits/(Losses) on equity investments
carried at equity 3,909 3,909Profits/(Losses) on the disposal of
investments
Profits/(Losses) before taxes on
continuing operations 83,212 66,578 17,326 4,448 -5,140
(1) including other operating expenses/expenses
(2) administrative expenses, net adjustments to tangible and intangible assets
(3) net adjustments for impairment of loans and receivables and financial assets, provisions for risks and charges

Notes to the consolidated financial statements
190
Balance sheet data 31.12.2010Merchant
bank
Investment
bankingAsset mng
Corporate
center
Financial assets 999,053 27,758 963,039 8,787 -531
Amounts due from banks 302,852 238,386 139,481 -75,015
Amounts due from customers 6,476,720 6,469,570 7,150
Amounts due to banks 171,918 253,332 -81,414
Amounts due to customers 4,459,599 4,331,719 127,900 -20
Securities issued and financial liabilities at
fair value through profit or loss 2,448,734 2,448,734
INDIRECT DEPOSITS: ADMINISTERED
AND MANAGED 11,605,011 10,411,111 1,193,900

CERTIFICATION OF THE CONSOLIDATED FINANCIAL STATEMENTS
PURSUANT TO ART. 154-BIS OF LEGISLATIVE DECREE 58/1998
1. The undersigned Nereo Dacci, Managing Director, and Piercamillo Secchi, Manager responsible forpreparing the Company financial reports, of Banco di Desio e della Brianza S.p.A., taking intoaccount the provisions of Article 154-bis, paragraphs 3 and 4, of Legislative Decree 58 of 24February 1998, do hereby certify to:
- the adequacy in relation to the Company’s features and- the actual application
of the administrative and accounting procedures employed to draw up the consolidated financialstatements for the 2011 financial year.
2. Evaluation of the adequacy of the administrative and accounting procedures employed to draw upthe consolidated financial statements as at 31 December 2011 was based on methods defined byBanco di Desio e della Brianza S.p.A. consistently with the Internal Control Integrated Frameworkmodel, issued by the Committee of Sponsoring Organization of the Treadway Commission, which isan internationally accepted reference framework.
3. The undersigned also certify that:
3.1 The Consolidated Financial Statements:
a. were prepared according to the applicable international accounting standardsrecognised in the European Union as per Regulation (EC) 1606/2002 of theEuropean Parliament and Council of 19 July 2002;b. correspond to the results of the books and accounts;c. give a true and fair representation of the equity, economic and financial position ofthe issuer and the whole of the companies included in the scope of consolidation.
3.2 The Report on Operations includes a reliable analysis of the performance and result ofoperations, as well as of the position of the issuer and the whole of the companies includedin the scope of consolidation, together with the description of the main risks anduncertainties to which they are exposed.
Desio, 20 March 2012
Managing Director Manager responsible for preparingthe Company’s financial reports
Nereo Dacci Piercamillo Secchi

PricewaterhouseCoopers SpA
Sede legale e amministrativa: MilanoReg. Imp. Milano 12979880155 Iscritta al n. 43 dell’Albo ConsobBologna Zola Predosa 40069 Via Tevere 18 Tel. 0516186211Viale Gramsci 15 Tel. 0552482811 –– Padova 35138 Via Vicenza 4 Tel. 049873481Tel. 0521242848 – Roma 00154 Largo Fochetti 29 Tel. 06570251Via Grazioli 73 Tel. 0461237004 - TrevisoUdine 33100 Via Poscolle 43 Tel. 043225789
www.pwc.com/it
AUDITORS’ REPORT IN ACCORDANCE WITH ARTICLESDECREE N. 39 DATED 27 JANUARY 2010
To the shareholders ofBanco di Desio e della Brianza SpA
1 We have audited the consolidated financial statements of Banco di Desio e della Brianza SpAand its subsidiaries (Banco di Desio e della Briancomprise the balance sheet, income statement, statement of comprehensive iof changes in shareholders’ equity, cash flow statement and related notes.Banco di Desio e della Brianza SpAstatements in compliance with thethe European Union, as well as with the regulations issued to implement article 9 ofLegislative Decree No. 38/2005. Our responsibility is to express an opinion on theseconsolidated financial statements based on our audi
2 We conducted our audit in accordance with the auditing standards and criteria recommendedby CONSOB. Those standards and criteria require that we plan and perform the audit toobtain the necessary assurance about whether the consolidated financial statmaterial misstatement and, taken as a whole, are presented fairly. An audit includesexamining, on a test basis, evidence supporting the amounts and disclosures in theconsolidated financial statements. An audit also includes assessing tused and significant estimates made by the directors. We believe that our audit provides areasonable basis for our audit opinion.
For the opinion on the consolidated financial statements of the prior period, which arepresented for comparative purposes, referenc
3 In our opinion, the consolidated financial statements of Banco di Desio e della Brof 31 December 2011by the European Union, as well as with the regulations issued to implement article 9 ofLegislative Decree No. 38/2005; accordingly, they have been drawn up clearly and give a trueand fair view of the financial position, results of operations, chof Banco di Desio e della Brianza Group for the period then ended.
4 The directors of Banco di Desio e della BrianzaReport on Operations and of the Report on the Corporate Governance and ShareholdingStructure, published in the Banco DesioBrianza SpA’s website, in accordance witresponsibility is to express an opinion on the consistency of the report on Operations and onthe information required by art. 123
PricewaterhouseCoopers SpA
20149 Via Monte Rosa 91 Tel. 0277851 Fax 027785240 Cap. Soc. 3.754.400,00 Euro i.v., C.F. e P.IVA eReg. Imp. Milano 12979880155 Iscritta al n. 43 dell’Albo Consob - Altri Uffici: Bari 70124 Via Don Luigi Guanella 17 Tel. 0805640211
Zola Predosa 40069 Via Tevere 18 Tel. 0516186211 – Brescia 25123 Via Borgo Pietro Wuhrer 23 Tel. 0303697501– Genova 16121 Piazza Dante 7 Tel. 01029041 – Napoli 80121 Piazza dei Martiri
35138 Via Vicenza 4 Tel. 049873481 – Palermo 90141 Via Marchese Ugo 60 Tel. 09134973700154 Largo Fochetti 29 Tel. 06570251 – Torino 10129 Corso Montevecchio 37
Treviso 31100 Viale Felissent 90 Tel. 0422696911 – Trieste 34125 Via Cesare Battisti 18 Tel. 040348078133100 Via Poscolle 43 Tel. 043225789 – Verona 37122 Corso Porta Nuova 125 Tel.0458002561
AUDITORS’ REPORT IN ACCORDANCE WITH ARTICLES 14 AND 16 OF LEGISLATIVEDECREE N. 39 DATED 27 JANUARY 2010
Banco di Desio e della Brianza SpA
We have audited the consolidated financial statements of Banco di Desio e della Brianza SpAand its subsidiaries (Banco di Desio e della Brianza Group) as of 31 December 2011comprise the balance sheet, income statement, statement of comprehensive iof changes in shareholders’ equity, cash flow statement and related notes.
co di Desio e della Brianza SpA are responsible for the preparation of thesestatements in compliance with the International Financial Reporting Standards as adopted by
ean Union, as well as with the regulations issued to implement article 9 ofLegislative Decree No. 38/2005. Our responsibility is to express an opinion on theseconsolidated financial statements based on our audit.
We conducted our audit in accordance with the auditing standards and criteria recommendedby CONSOB. Those standards and criteria require that we plan and perform the audit toobtain the necessary assurance about whether the consolidated financial statmaterial misstatement and, taken as a whole, are presented fairly. An audit includesexamining, on a test basis, evidence supporting the amounts and disclosures in theconsolidated financial statements. An audit also includes assessing tused and significant estimates made by the directors. We believe that our audit provides areasonable basis for our audit opinion.
For the opinion on the consolidated financial statements of the prior period, which areor comparative purposes, reference is made to our report dated 6 April, 2011
In our opinion, the consolidated financial statements of Banco di Desio e della Brof 31 December 2011 comply with the International Financial Reporting Standards as
ean Union, as well as with the regulations issued to implement article 9 ofLegislative Decree No. 38/2005; accordingly, they have been drawn up clearly and give a trueand fair view of the financial position, results of operations, changes in equity and cash flowsof Banco di Desio e della Brianza Group for the period then ended.
Banco di Desio e della Brianza SpA are responsible for the preparation of theReport on Operations and of the Report on the Corporate Governance and ShareholdingStructure, published in the Banco Desio – Governance section of Banco di Desio e dellaBrianza SpA’s website, in accordance with the applicable laws and regulations. Ourresponsibility is to express an opinion on the consistency of the report on Operations and onthe information required by art. 123-bis of Italian Legislative Decree n° 58/1998, paragraph 1,
20149 Via Monte Rosa 91 Tel. 0277851 Fax 027785240 Cap. Soc. 3.754.400,00 Euro i.v., C.F. e P.IVA e70124 Via Don Luigi Guanella 17 Tel. 0805640211 –
25123 Via Borgo Pietro Wuhrer 23 Tel. 0303697501 – Firenze 5012180121 Piazza dei Martiri 58 Tel. 08136181
90141 Via Marchese Ugo 60 Tel. 091349737 – Parma 43100 Viale Tanara 20/A10129 Corso Montevecchio 37 Tel. 011556771 – Trento 38122
34125 Via Cesare Battisti 18 Tel. 0403480781 -
14 AND 16 OF LEGISLATIVE
We have audited the consolidated financial statements of Banco di Desio e della Brianza SpAza Group) as of 31 December 2011, which
comprise the balance sheet, income statement, statement of comprehensive income, statementof changes in shareholders’ equity, cash flow statement and related notes. The directors of
are responsible for the preparation of these financialReporting Standards as adopted by
ean Union, as well as with the regulations issued to implement article 9 ofLegislative Decree No. 38/2005. Our responsibility is to express an opinion on these
We conducted our audit in accordance with the auditing standards and criteria recommendedby CONSOB. Those standards and criteria require that we plan and perform the audit toobtain the necessary assurance about whether the consolidated financial statements are free ofmaterial misstatement and, taken as a whole, are presented fairly. An audit includesexamining, on a test basis, evidence supporting the amounts and disclosures in theconsolidated financial statements. An audit also includes assessing the accounting principlesused and significant estimates made by the directors. We believe that our audit provides a
For the opinion on the consolidated financial statements of the prior period, which aree is made to our report dated 6 April, 2011.
In our opinion, the consolidated financial statements of Banco di Desio e della Brianza SpA asInternational Financial Reporting Standards as adopted
ean Union, as well as with the regulations issued to implement article 9 ofLegislative Decree No. 38/2005; accordingly, they have been drawn up clearly and give a true
anges in equity and cash flows
are responsible for the preparation of theReport on Operations and of the Report on the Corporate Governance and Shareholding
Governance section of Banco di Desio e dellah the applicable laws and regulations. Our
responsibility is to express an opinion on the consistency of the report on Operations and onbis of Italian Legislative Decree n° 58/1998, paragraph 1,

letters c), d), f), l),Governance and Shareholding Structure with the financial statements, as required by law. Forthis purpose, we have performed the procedures required under Auditing Standard n. 001issued by the Italian Accounting Profession (CNDCEC) and recommended by CONSOB. In ouropinion, the Report on Operations and the information required by art. 123Legislative Decree n° 58/1998, paragraph 1, letters c), d), f), l), m) and paragradisclosed in the Report on the Corporate Governance ShareholdingStructure are consistent with the consolidated financial statements of Bancodi Desio e della Brianza SpA as of 31 December 2011
Milan, 4 April 2012
PricewaterhouseCoopers SpA
Signed byLia Lucilla Turri(Partner)
This report has been translated into the English language from the original which was issued in
Italian, solely for the convenience of international readers.
m) and paragraph 2, letter b) disclosed in the Report on the CorporateGovernance and Shareholding Structure with the financial statements, as required by law. Forthis purpose, we have performed the procedures required under Auditing Standard n. 001
ued by the Italian Accounting Profession (CNDCEC) and recommended by CONSOB. In ouropinion, the Report on Operations and the information required by art. 123Legislative Decree n° 58/1998, paragraph 1, letters c), d), f), l), m) and paragradisclosed in the Report on the Corporate Governance ShareholdingStructure are consistent with the consolidated financial statements of Banco
ianza SpA as of 31 December 2011.
PricewaterhouseCoopers SpA
This report has been translated into the English language from the original which was issued in
Italian, solely for the convenience of international readers.
2 of 2
m) and paragraph 2, letter b) disclosed in the Report on the CorporateGovernance and Shareholding Structure with the financial statements, as required by law. Forthis purpose, we have performed the procedures required under Auditing Standard n. 001
ued by the Italian Accounting Profession (CNDCEC) and recommended by CONSOB. In ouropinion, the Report on Operations and the information required by art. 123-bis of ItalianLegislative Decree n° 58/1998, paragraph 1, letters c), d), f), l), m) and paragraph 2, letter b)disclosed in the Report on the Corporate Governance ShareholdingStructure are consistent with the consolidated financial statements of Banco
This report has been translated into the English language from the original which was issued in