report on resistance tests of a flat plateseashellantifoulant.com/files/report-on-resistanc… ·...
TRANSCRIPT

REPORT ON RESISTANCE TESTS OF A FLAT PLATE
A flat laminated aluminum alloy plate, having the size shown in figure 1, on which a U.S. new
patented Anti Fouling coating was applied, has been tested in the towing tank of the University of
Trieste (Italy).
1. Introduction
On request of MarineEcoCoating Inc., Marina del Rey, CA., U.S.A. through his Mediterranean
licensee EcoCoatingMed srl, Castelrotto, Italy, a series of towing tests have been made, by using a
vertical flat plate on which a new A.F. coating was applied. The plate transportation to the
University and the mounting of the plate on the towing carriage of the University tank was made by
a technical staff composed by an university technician and one or two technicians of the Shipyard
“Cantiere Alto Adriatico”.
The plate (figure 2) has been placed in a vertical position, supported on two suspension points by
two movable carriages, which could move along two guide lines. By so doing, the flat plate could
move along the guide lines and could be connected to a load cell, to measure its resistance during
the tests. A series of centering screws allowed to place the plate in the central position, between the
guide lines so as to be run parallel to the advancing direction. Small water disturbances can indeed
create instabilities to the plate advance during the motion and, for this reason, the plate itself was
constrained to remain vertical to the water surface during the runs at different speeds. The
constraints, which bind the flat plate to the centre plane of the towing tank, do not prevent from
Figure 1 : Geometry of the flat plate tested in the towing tank (data in millimeters). The submerged
part is rectangular 2500 x 384 mm – Thickness of the bare plate after the coating with the A.F.
Seashell : 4 mm.
measuring the resistance during the tests. The vertical position of the flat plate is assured by two
extreme projections which are useful to bind the plate and to prevent side motions. It was decided to
limit also the maximum carriage speed to 5 m/s to reduce risk of unstable motions (fluttering).
The main characteristics of the flat plate are shown on TABLE A.

TABLE A : Main characteristics of the tested plate (also identified as “reference plate”).
Flat plate material : Aluminum Alloy (smooth laminated)
Plate length : 2.5 m; Submerged part: 384 mm Plate thickness : 1/10 in = 2.54 mm
Initial Wetted surface : 1.92 m2 The extreme sides of the flat plate have been rounded.
Some images of the flat plate in preparation and placed into the water are shown in figures 2 and 3.
Figure 2 : The coated plate prepared for preliminary tests. It should be noted that the submerged
part is still rectangular.
Figure 3 : The flat plate during the tests.

To assure an adequate plate stiffness, two longitudinal aluminum L sections have been placed on
the plate (see figures 2 and 3), outside of the water. External chains supporters were used to better
distribute the plate weight on the longitudinal guides, so as to have a perfect horizontal sliding way.
The towing of the plate is made by a load cell, having an extra charge up to 500 N and a linear
registration field up to 100 N. For safety reasons two mechanical stops have been placed on the
guide ends. The original plate shown in figure 1, was then tested in the towing tank, to determine
the maximum towing speed; no drag measurements were taken during these preliminary tests. A
maximum speed of 5 m/s before reaching instability was measured, so that the plate was slightly
modified truncating the lower fore end and rounding the fore and aft ends (see figure 4).
Figure 4 : Extreme truncation of the plate end after the cut.
Then the towing tank tests were resumed and no instability inconvenience was noticed up to a speed
of 5.5 m/s. Anyhow it was then decided not to exceed the velocity of 5 m/s during the drag tests.
2. Bench mark tests
The bare smooth-laminated aluminum rectangular plate (also called “reference plate” - see figure
1) was previously tested firstly to set a bench mark for comparing with the same plate after SeaShell
coating and, secondly for comparing the experimental results with Computational Fluid Dynamics
(CFD) calculations. The CFD program used for this comparison was the program STAR – CCM+
(CD- ADAPCO) in its version 7.06. The consistency of measured data and CFD results is shown in
figure 5.
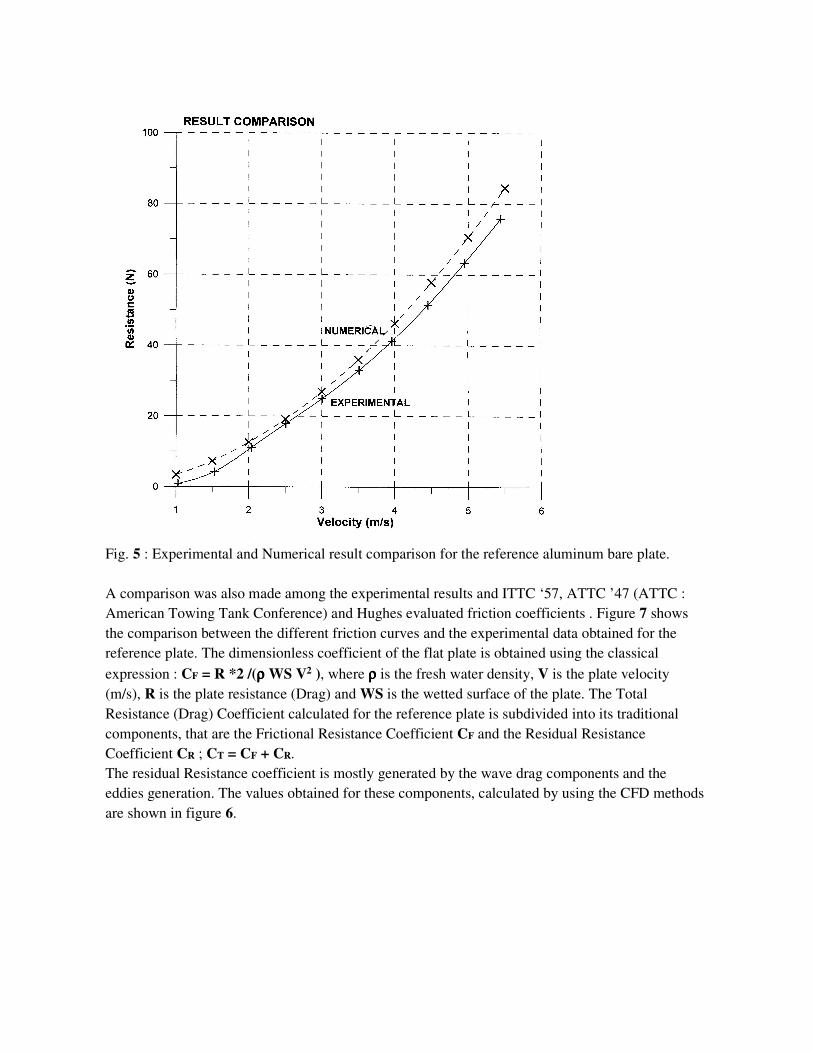
Fig. 5 : Experimental and Numerical result comparison for the reference aluminum bare plate.
A comparison was also made among the experimental results and ITTC ‘57, ATTC ’47 (ATTC :
American Towing Tank Conference) and Hughes evaluated friction coefficients . Figure 7 shows
the comparison between the different friction curves and the experimental data obtained for the
reference plate. The dimensionless coefficient of the flat plate is obtained using the classical
expression : CF = R *2 /(ρρρρ WS V2 ), where ρρρρ is the fresh water density, V is the plate velocity
(m/s), R is the plate resistance (Drag) and WS is the wetted surface of the plate. The Total
Resistance (Drag) Coefficient calculated for the reference plate is subdivided into its traditional
components, that are the Frictional Resistance Coefficient CF and the Residual Resistance
Coefficient CR ; CT = CF + CR.
The residual Resistance coefficient is mostly generated by the wave drag components and the
eddies generation. The values obtained for these components, calculated by using the CFD methods
are shown in figure 6.

Figure 6 : Resistance Coefficients obtained from the CFD calculation for the original plate.
In figure 7 a comparison between the friction resistance (Drag) coefficients obtained or calculated
for the flat plate is shown.
It is possible to see that the friction lines obtained from the experiments and classical theories agree
very well.
Both ATTC'47 and ITTC'47 friction lines include a small form factor and for this reason they are
higher that the Hughes friction curve.
The work done set the stage to resort to this mixed experimental-theoretical method to analyze the
towing test results and make the necessary corrections to the measured data to take into account the
difference of plate thickness and shape.

Figure 7 : Friction resistance(Drag) comparison between the experimental results and the classical
friction curves.
Smaller values can be noticed at low Reynolds Number, where some transition phenomena can
arise; transition generates laminar flows and reduces the friction coefficients. In general the
Reynolds Numbers are quite almost higher than 1*10 6, and this number signifies that we are
operating in turbulent regime.
3. The tests with the SeaShell coated plate
The lines of the plate are shown in figure 8. The depth during the tests was set to 380 mm and the
plate wetted surface was equal to
1.82 m2. A picture of the tests is
shown in figure 9.
The maximum speed of the
carriage was set to 5 m/s. The
Drag was measured by a load cell,
placed at the top of the plate.
Figure 8 : Test shape of the SeaShell coated plate.
(dimensions in millimeters)

Figure 9 : The SeaShell
coated plate assembled on the
carriage and ready to be
tested.
As made for the reference flat bare, a numerical CFD simulation of the Drag tests was made for this
configuration, and the Drag data were compared with the experimental ones. The results obtained
are shown in figure 10.
As it can be seen, the
experimental data are smaller
than the numerical ones,
although they are getting closer
as the speed increases. By
comparing the numerical
components of the total drag, it
is possible to notice that the
residual components are slightly
higher than the values obtained
with the reference plate. This
phenomenon is caused by the
increased thickness of this plate
(4 millimeters now, 2.54
millimeters for the reference
plate) only partially
compensated by the “bow
effect” due to the modification
Figure 10 : Experimental and Numerical results obtained during the tests and by numerical
computation.
of the submerged part of the plate (from rectangular to trapezoidal) ; by increasing the testing speed
the thickness the thickness effect tend to prevail.

The CR values of the new
plate are slightly higher
than the ones shown on figure
6.
Due to the change in plate
thickness and plate geometry
it was not possible to directly
determine and compare the
friction coefficient of the bare
laminated smooth aluminum
used testing the reference
plate (see paragraph 2) and
the friction coefficient of the
SeaShell coated plate used in
the last performed tests (see
above). As a consequence, as
said at the end of paragraph 2,
the following corrective
procedure was adopted :
Figure 11 : Resistance (Drag) coefficients obtained from the CFD investigation in the SeaShell
coated plate.
The total resistance coefficient measured on the coated plate (figure 10) and subtracted the residual
resistance coefficient, derived from CFD calculation (figure 11). Then we compared the friction
resistance (drag) curve with
the classical friction curves
evaluated for the smooth
laminated aluminum plate.
The results are shown in
figure 12.
Figure 12 : Friction
Resistance Coefficients
comparison between the
tested results and the
classical friction lines.
In figures 13 and 14 two
images showing the
numerical (CFD)
reproduction of the reference
plate and of the coated plate
tested at a speed of 5 m/s are
reported.

Figure 13 : The reference plate Figure 14 : The coated plate
4. Final considerations
The final results show that an appreciable friction resistance reduction has been obtained testing a
SeaShell coated plate at low Reynolds numbers.
From figure 12 it is possible to presume that at higher speeds the plate frictional resistance is
approaching to the friction resistance curve of the smoothed laminated aluminum plate. For this
reason it is strongly recommended to extend the investigation up to a Reynolds number equal to
1.6*107, whereas the Reynolds Number typical of full scale ships are in order of 109.
Trieste, 18th April 2014
Igor Zotti
Prof. Igor Zotti
University of Trieste – Department DIA
Via Alfonso Valerio, 10
34127 Trieste – ITALY