report on rfi survey of charlottesville ntc laboratories on rfi survey of... · report on rfi...
TRANSCRIPT
Report on RFI Survey of Charlottesville NTC Laboratories December 16 & 17 2004
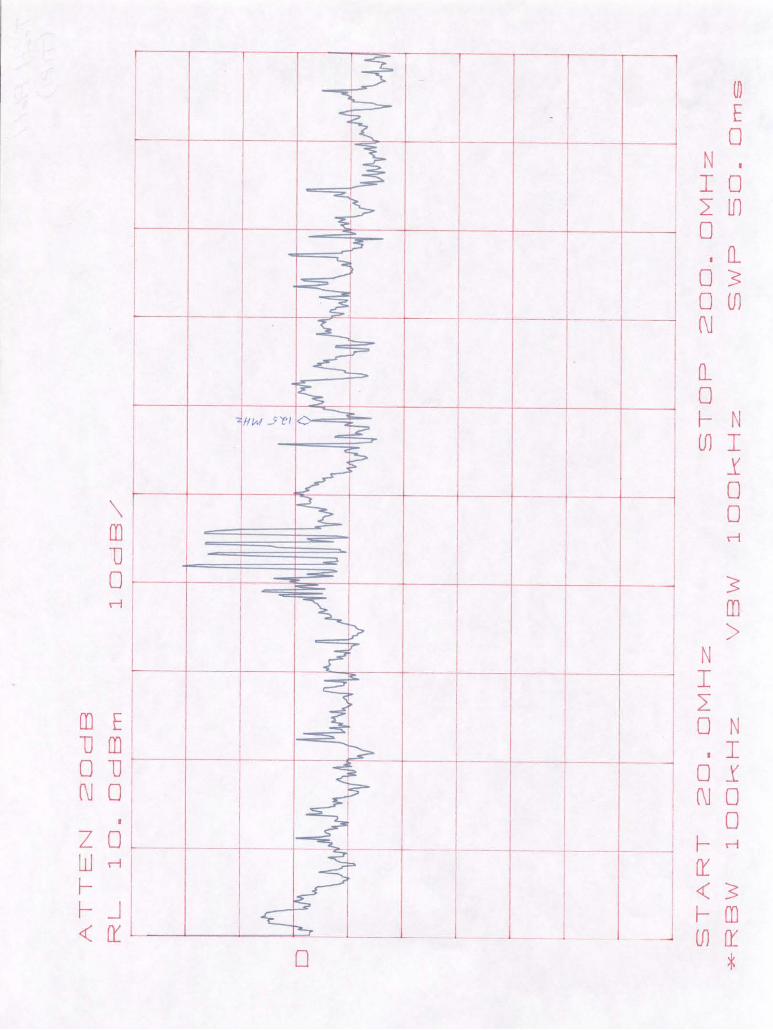
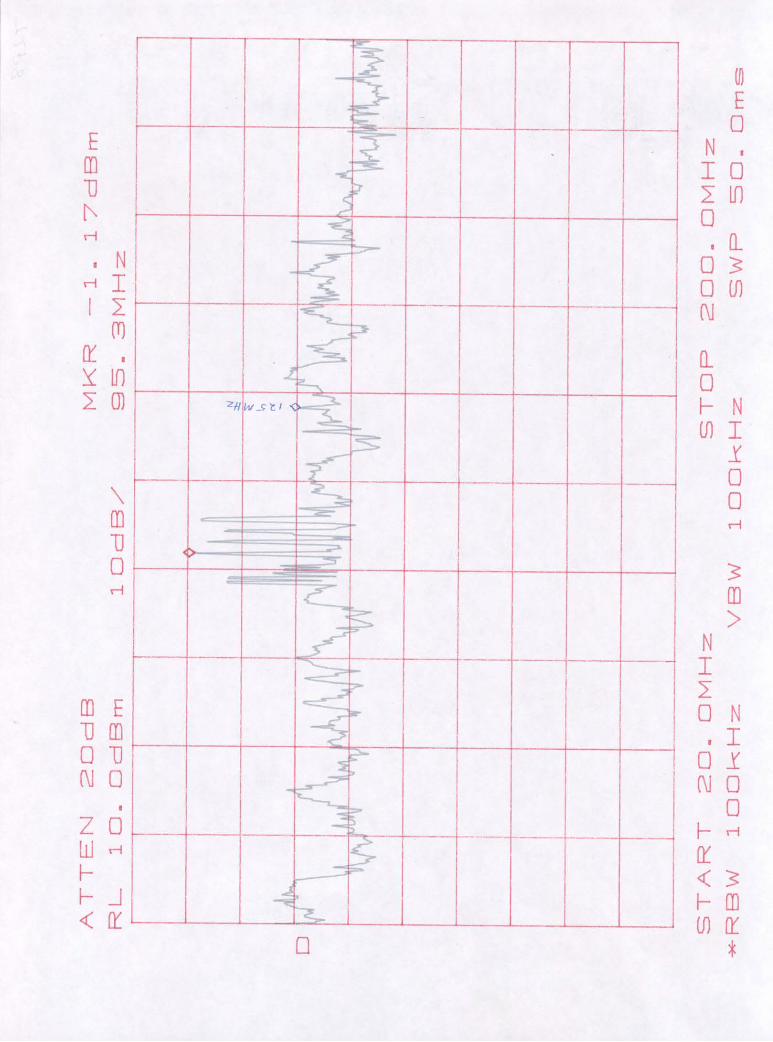
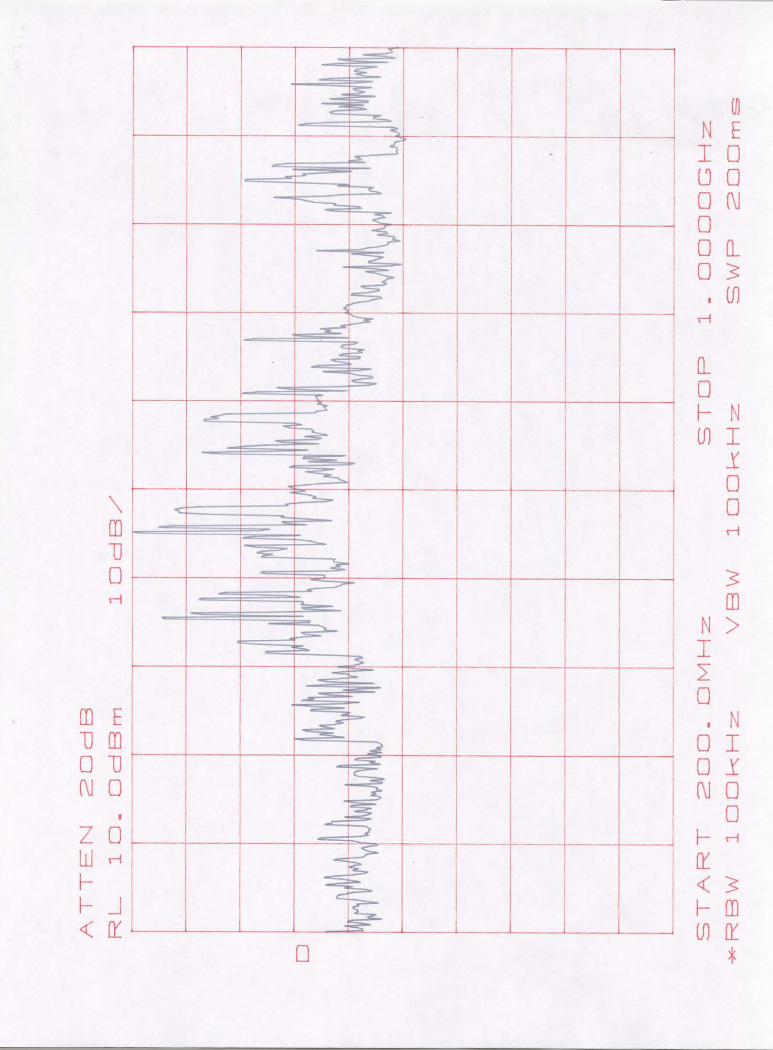
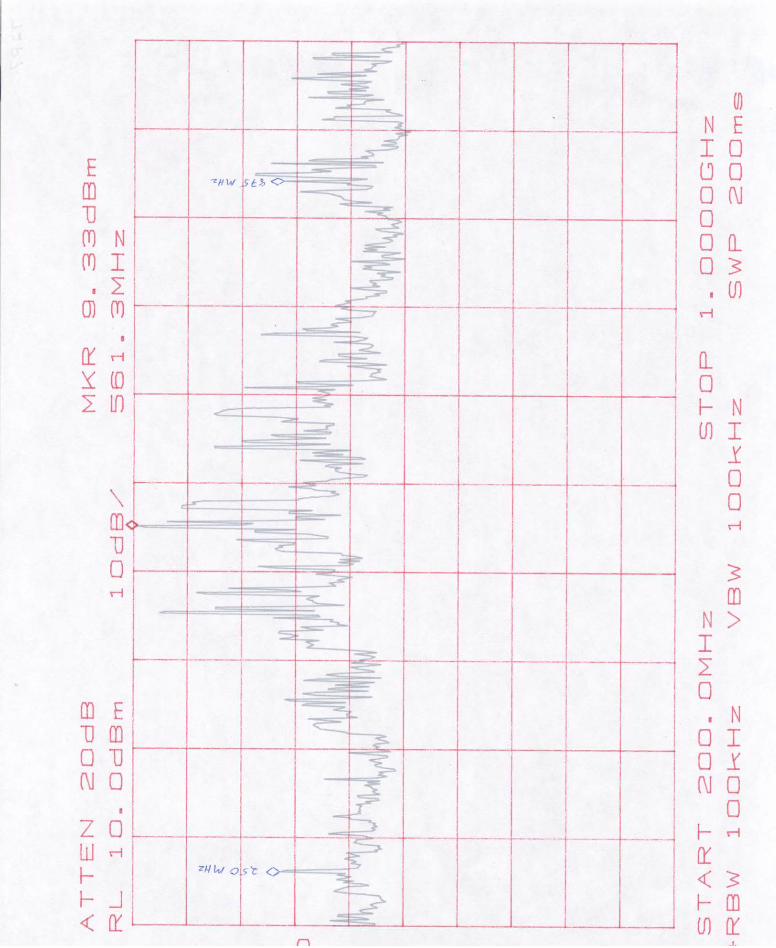
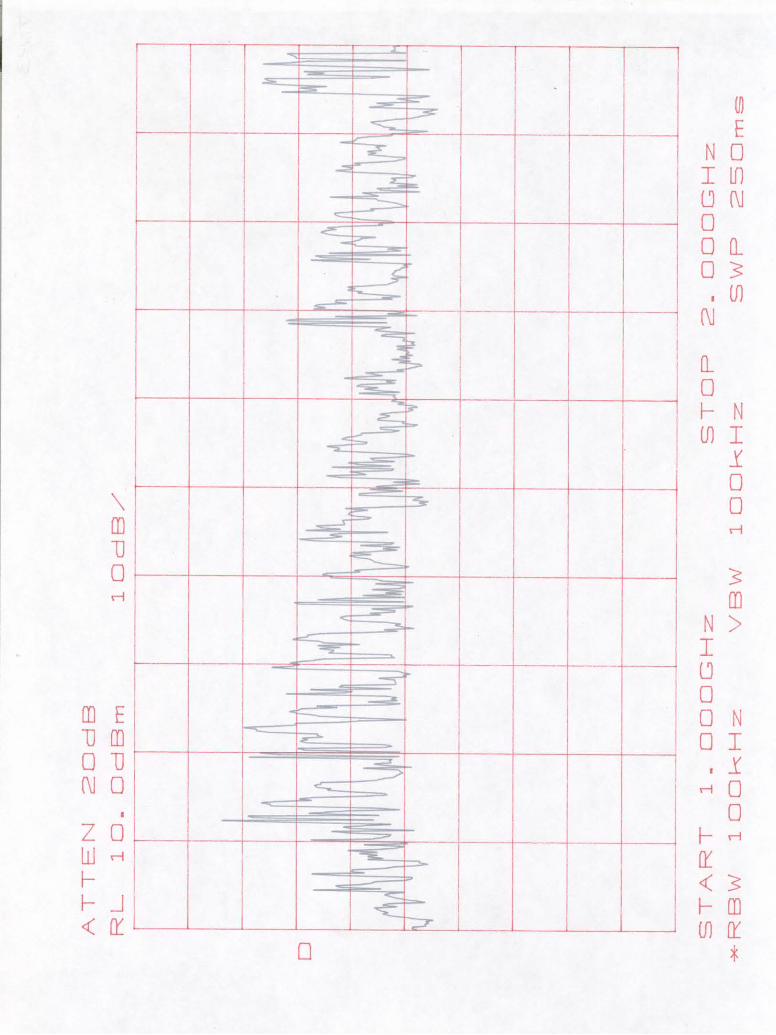
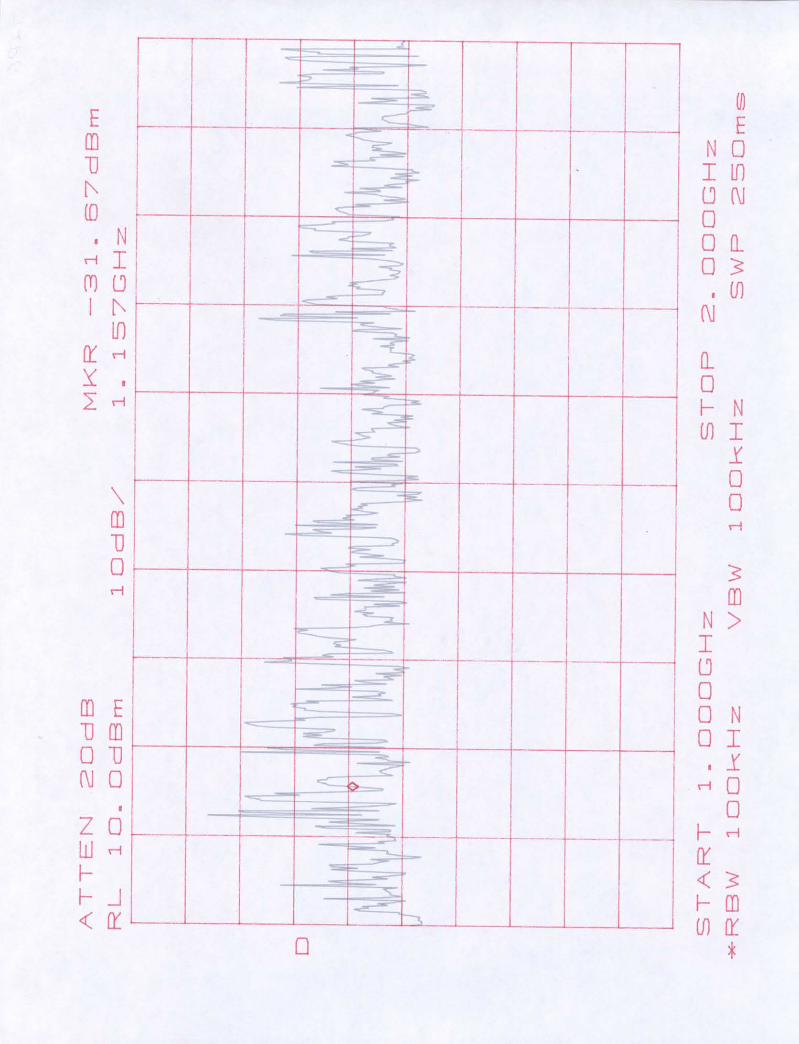
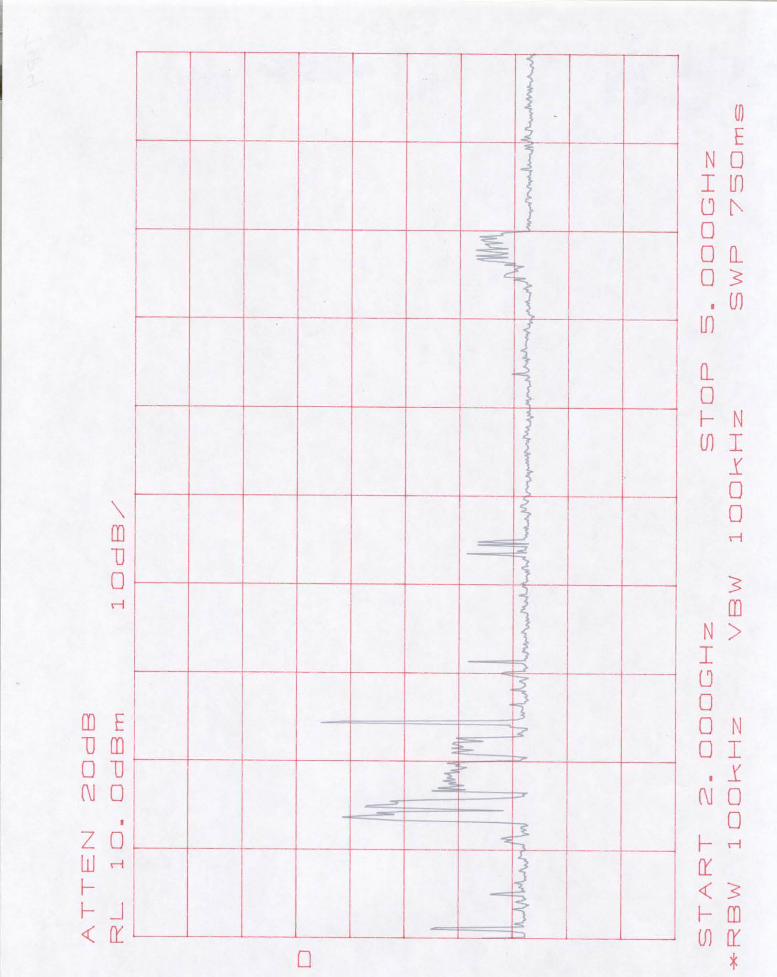
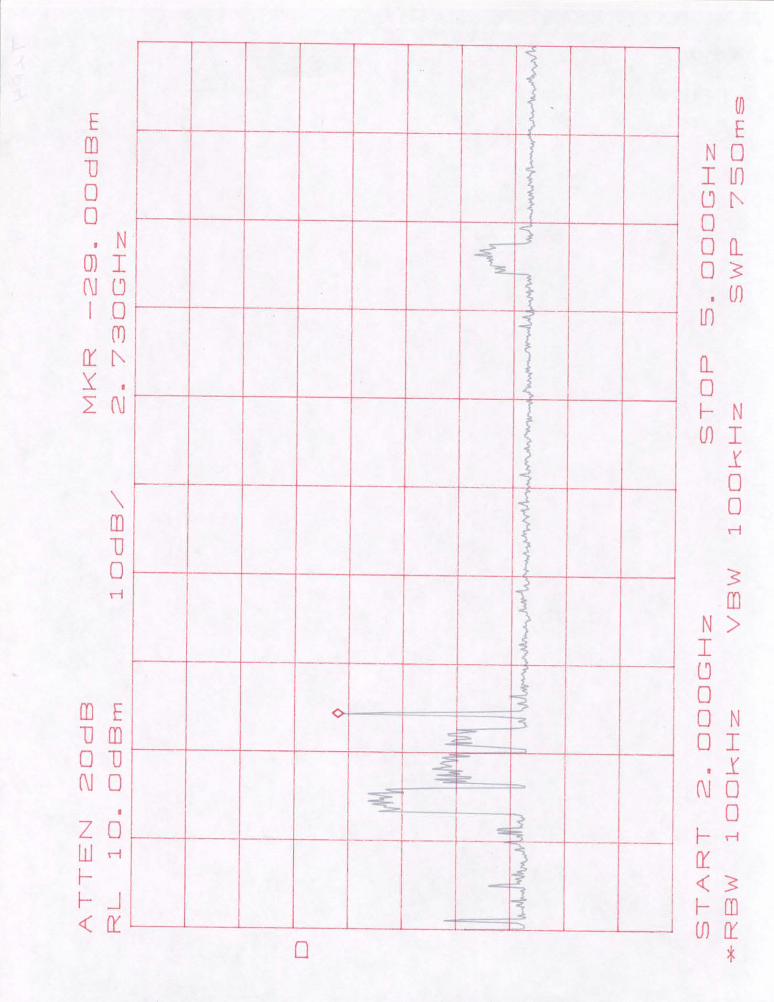
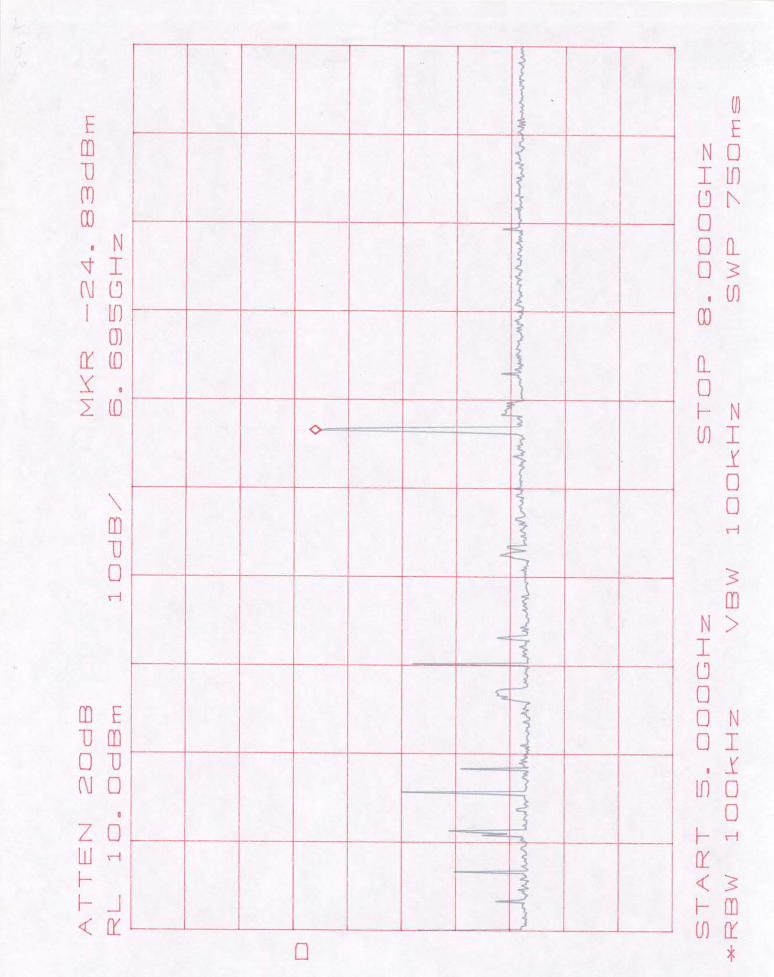
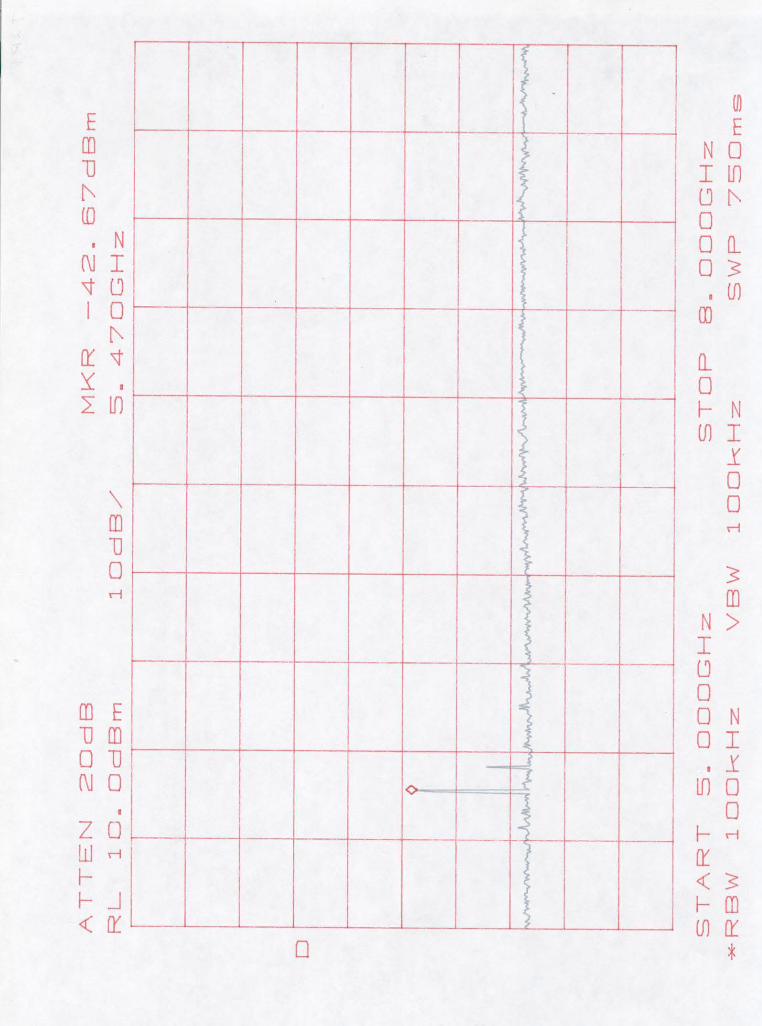
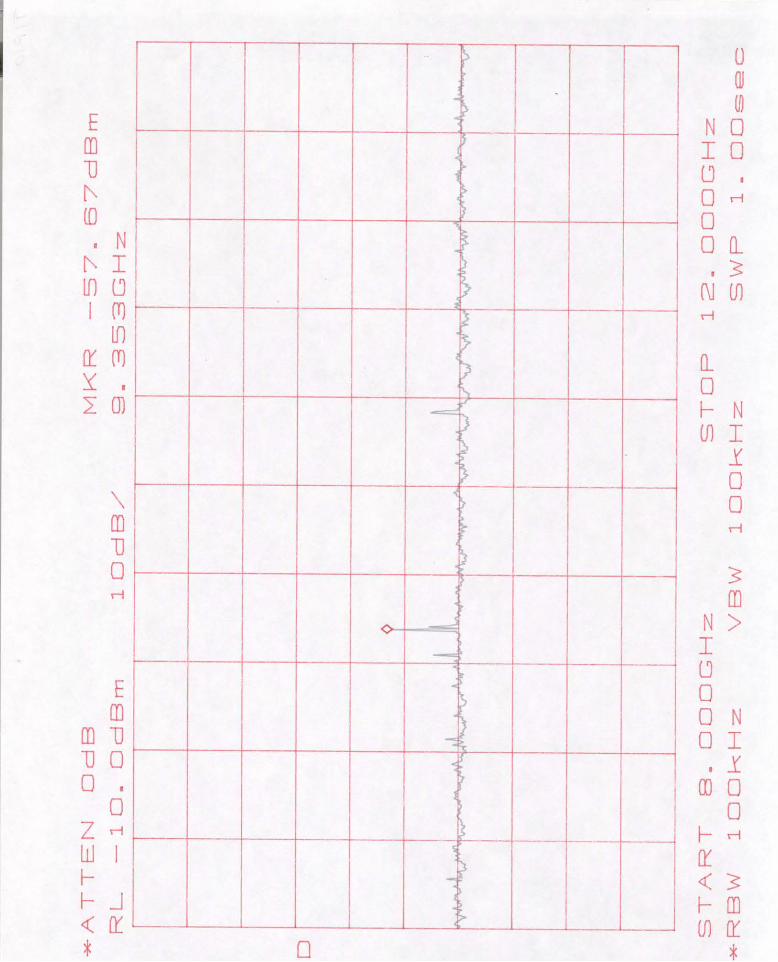
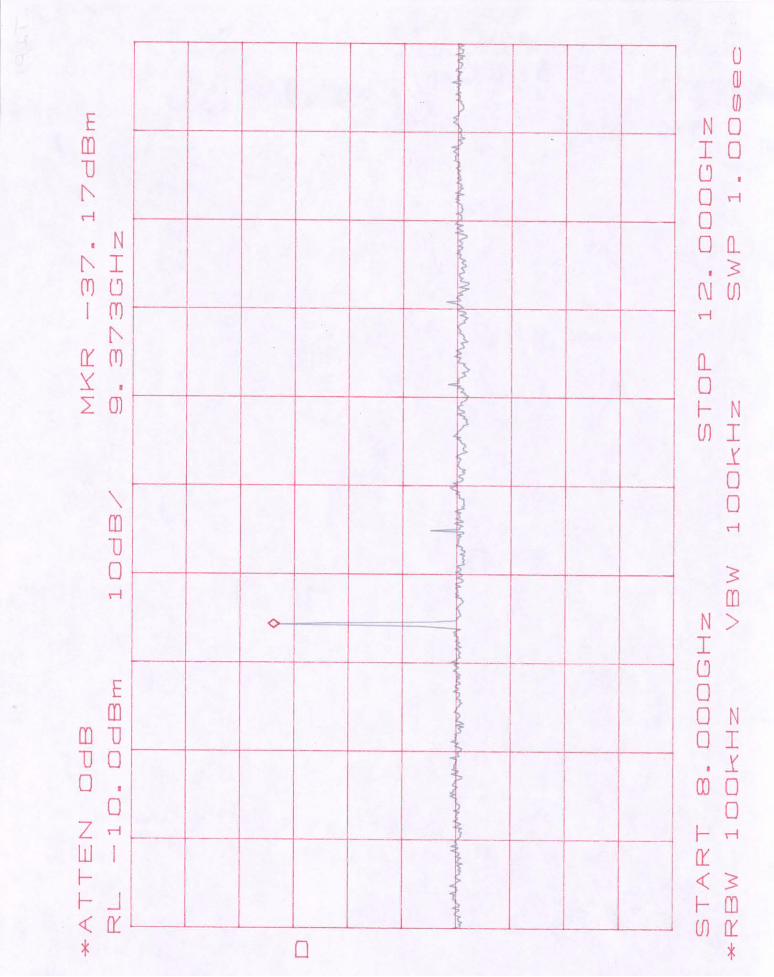
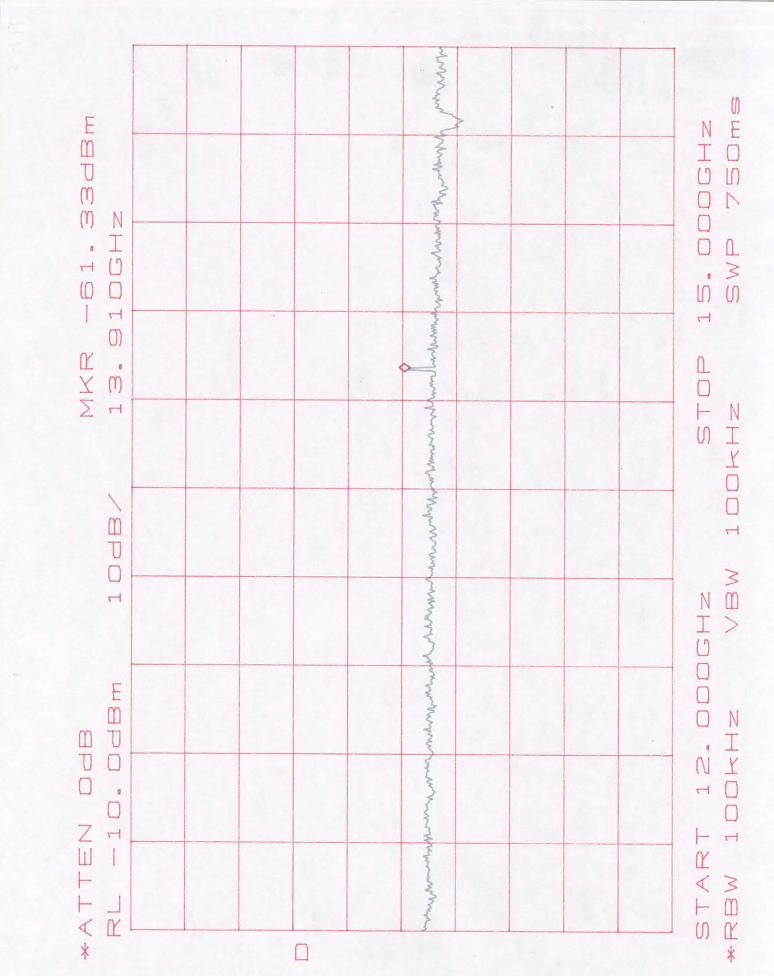
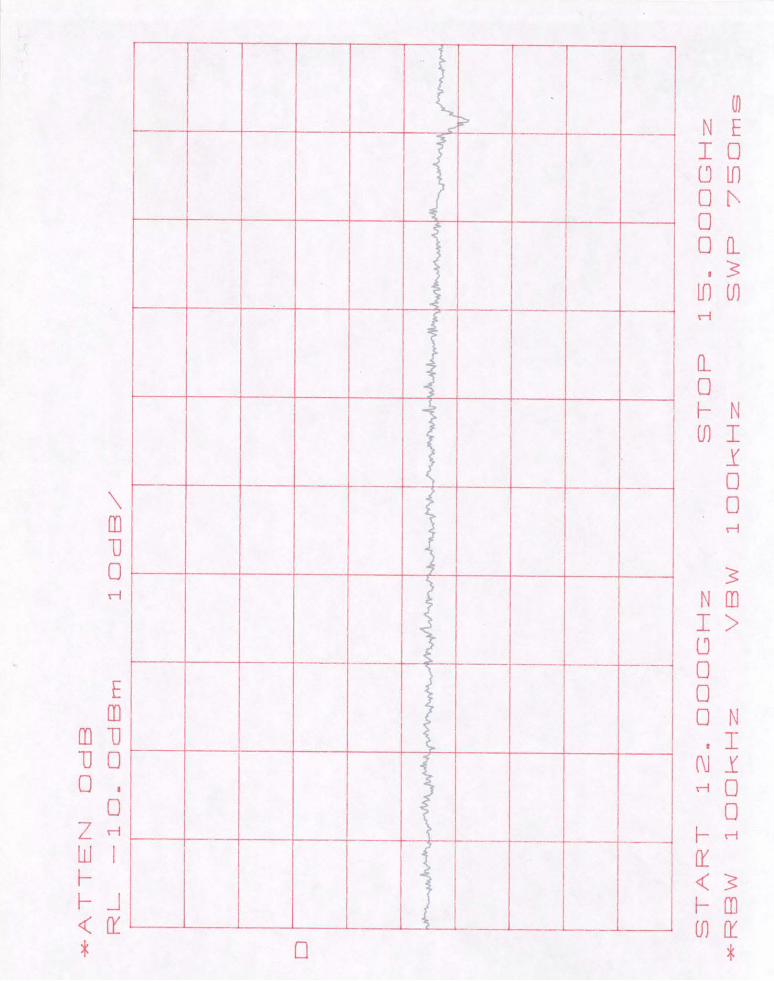
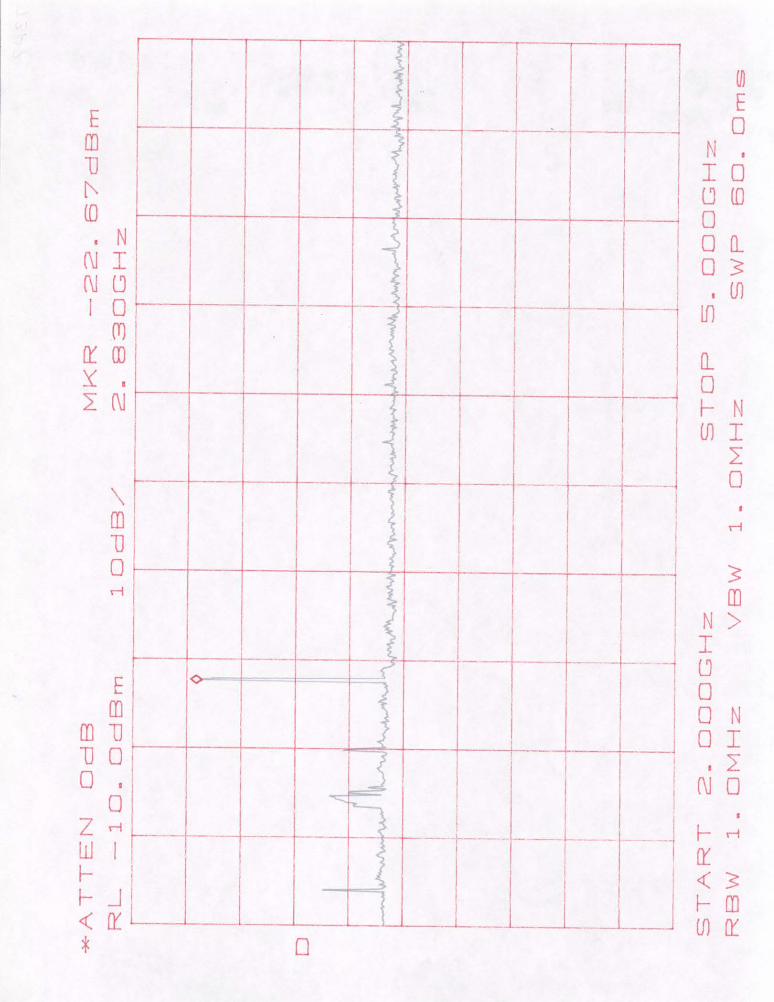
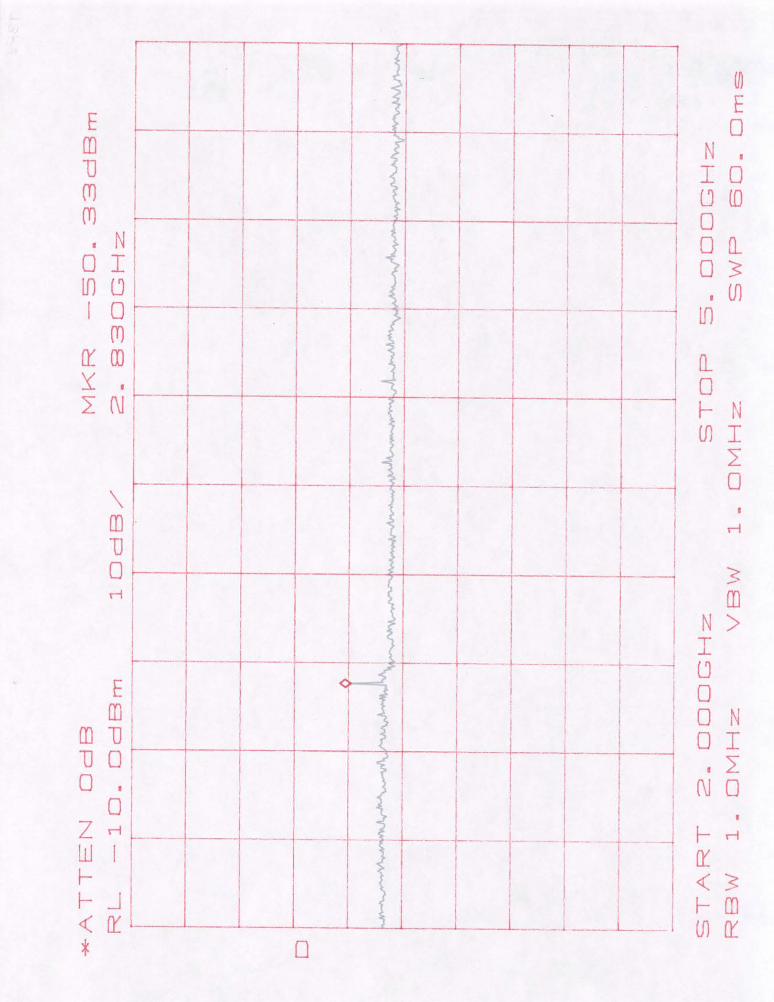
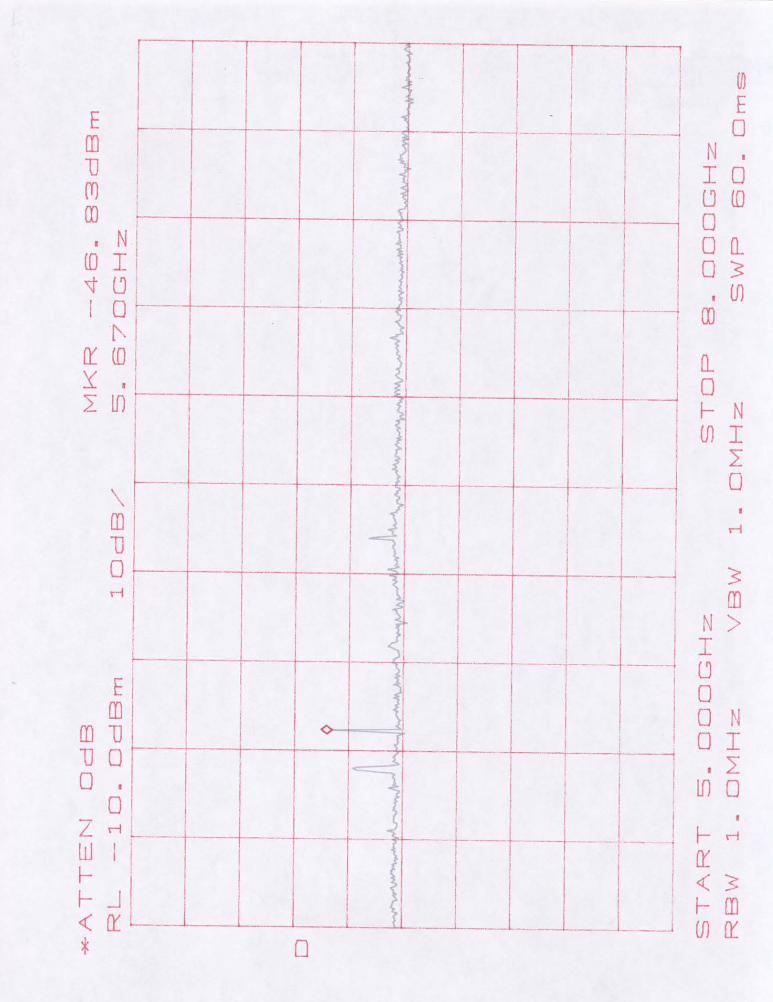
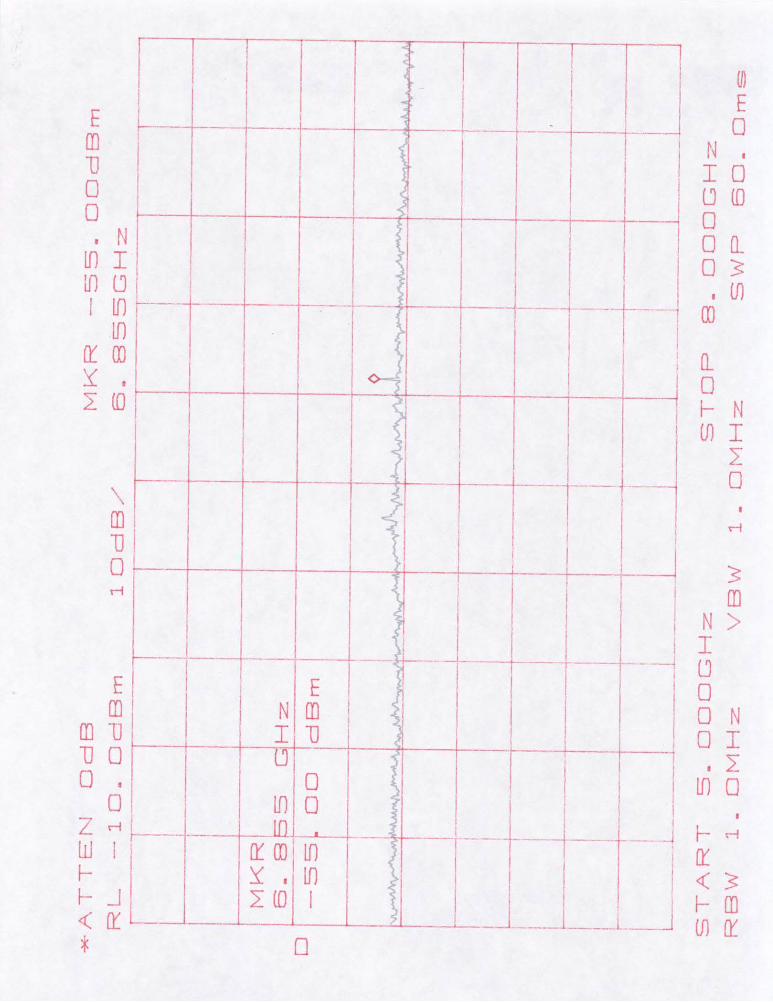
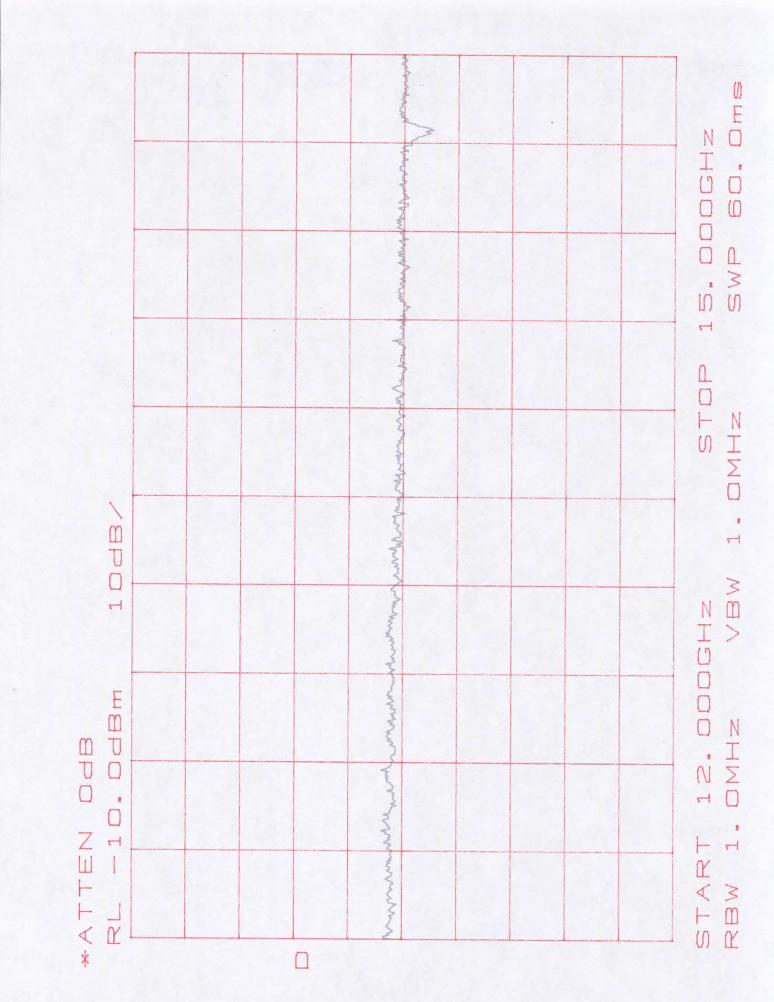
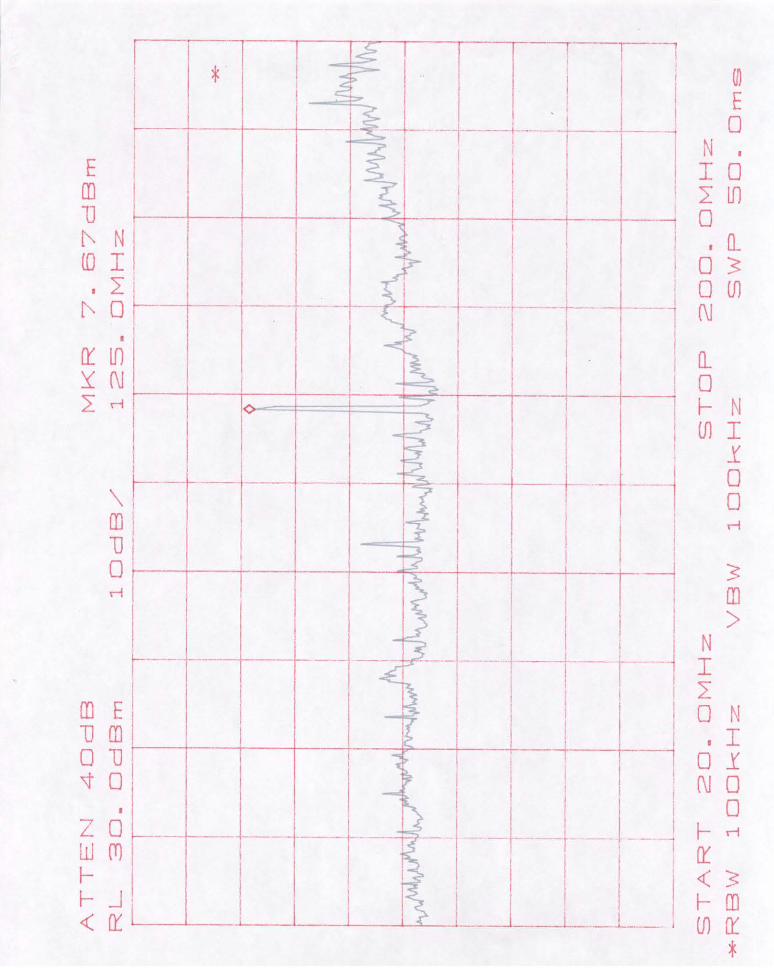
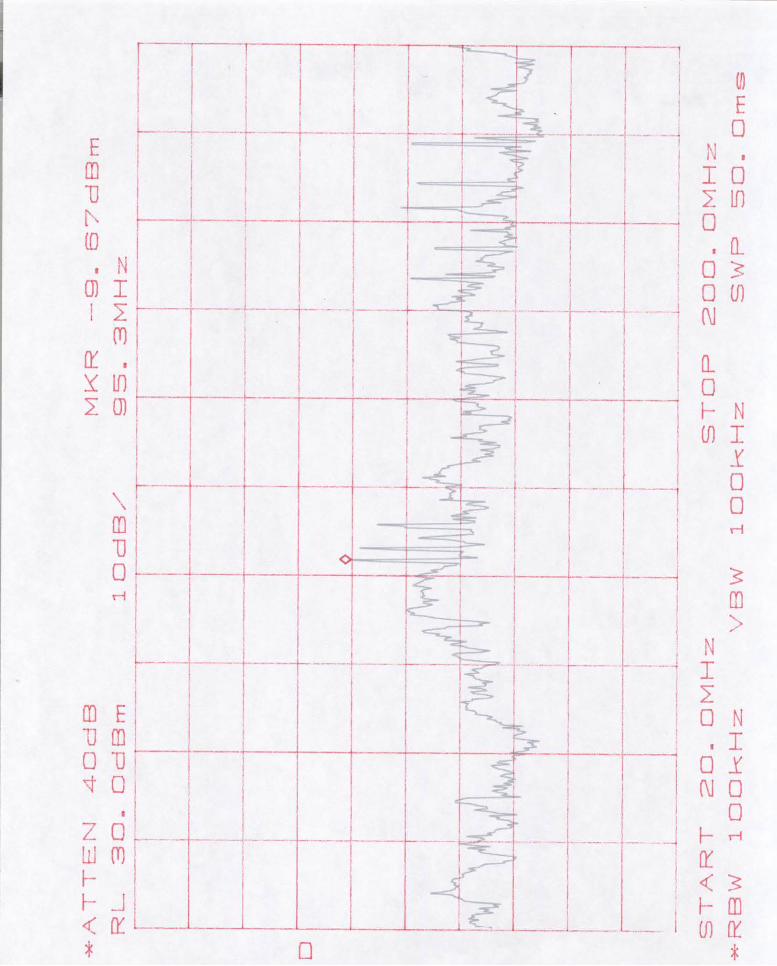
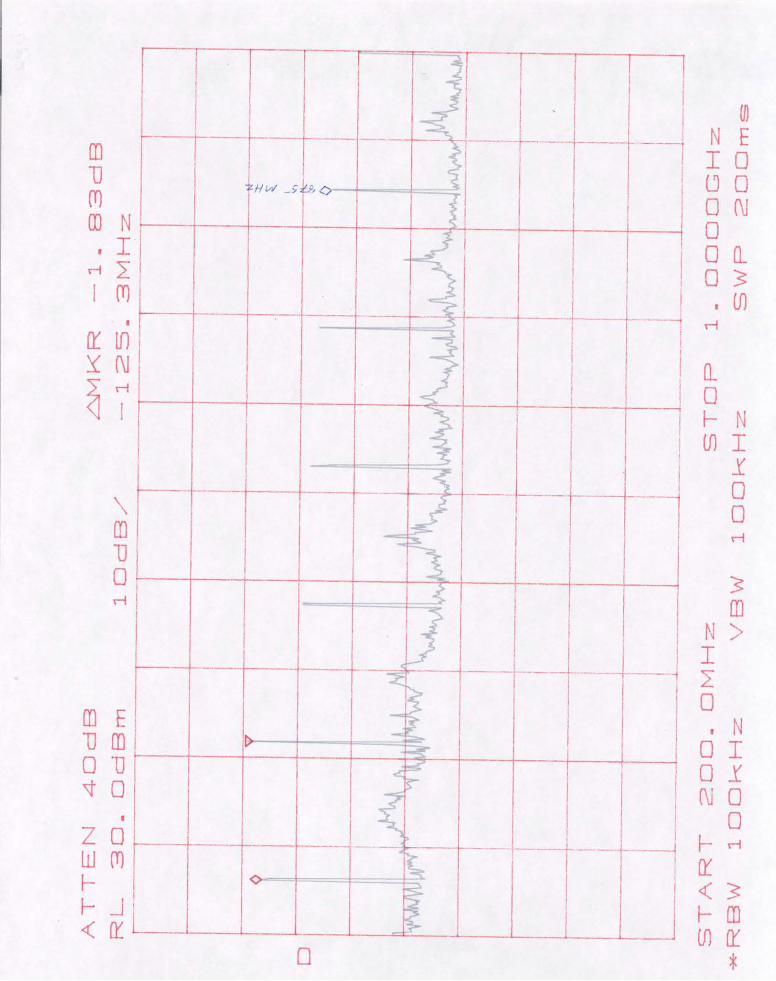
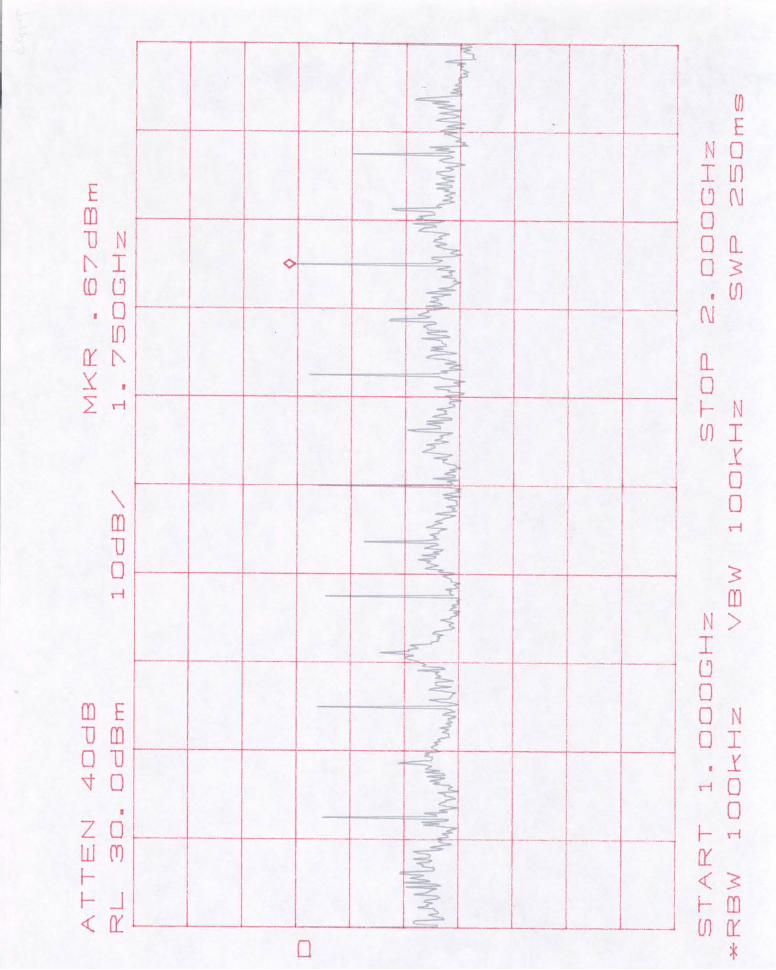
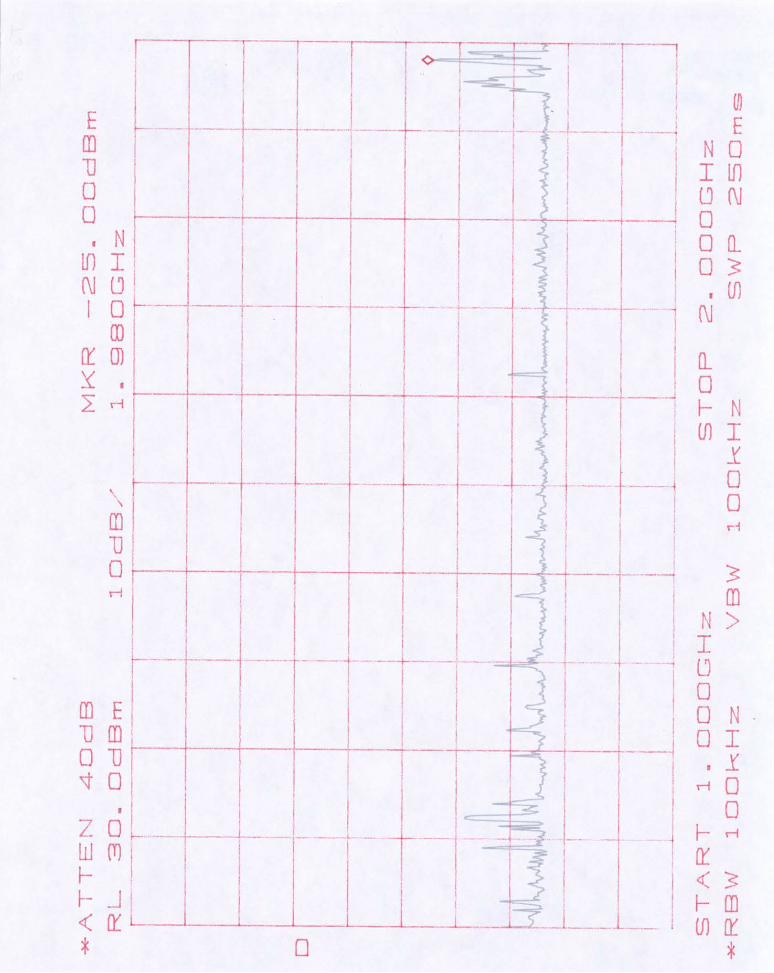
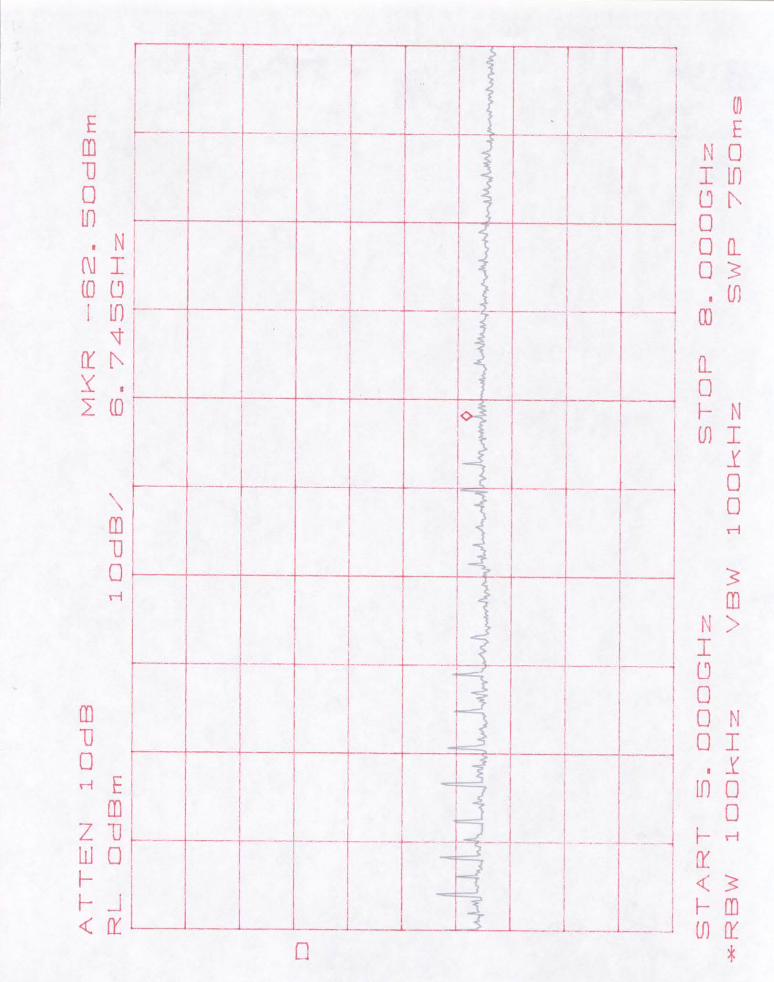
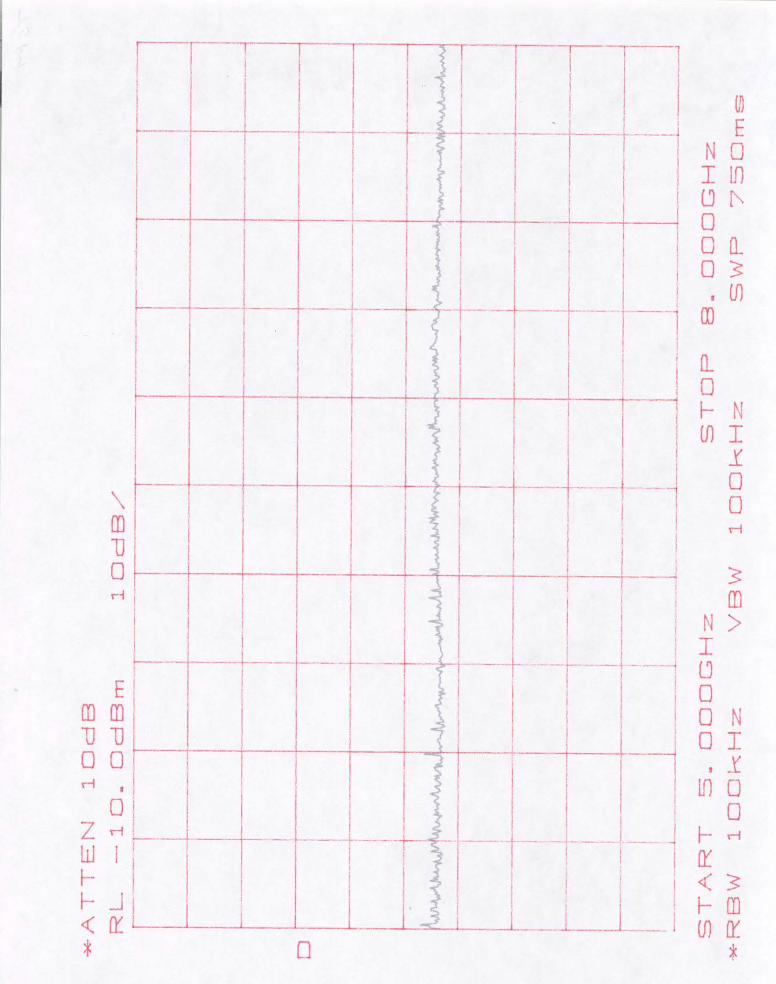
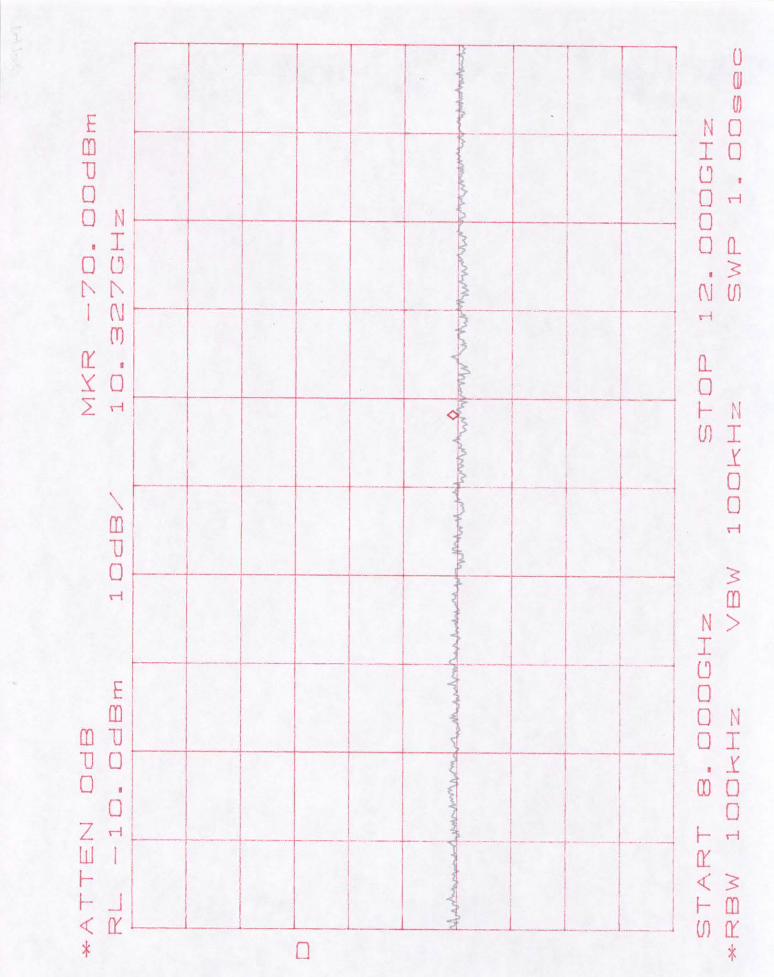
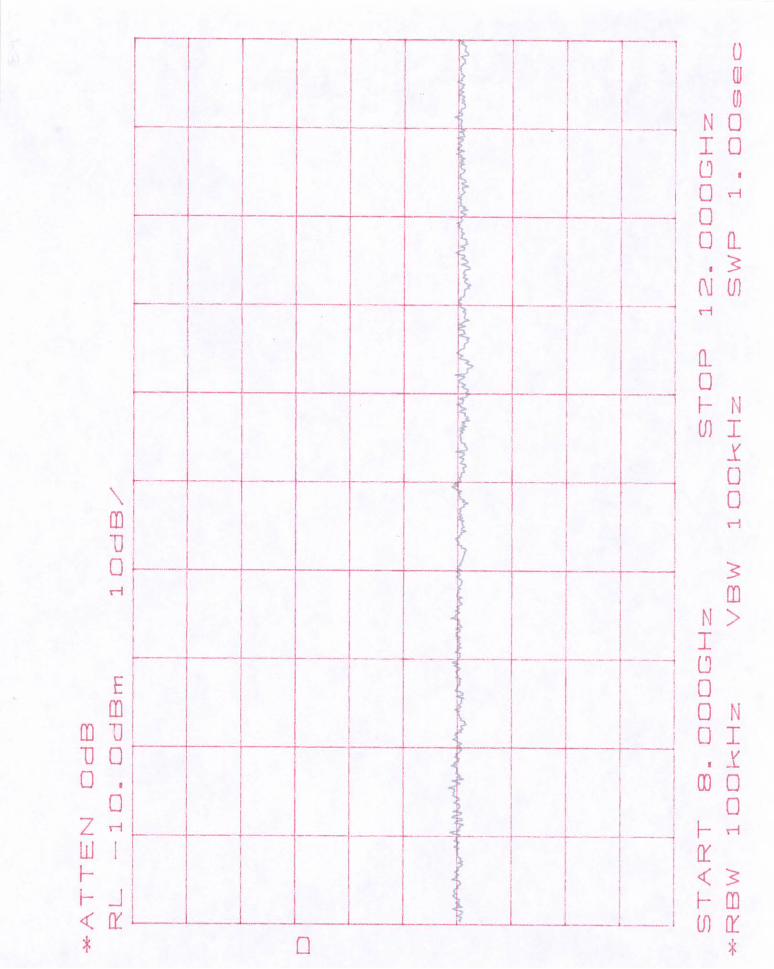
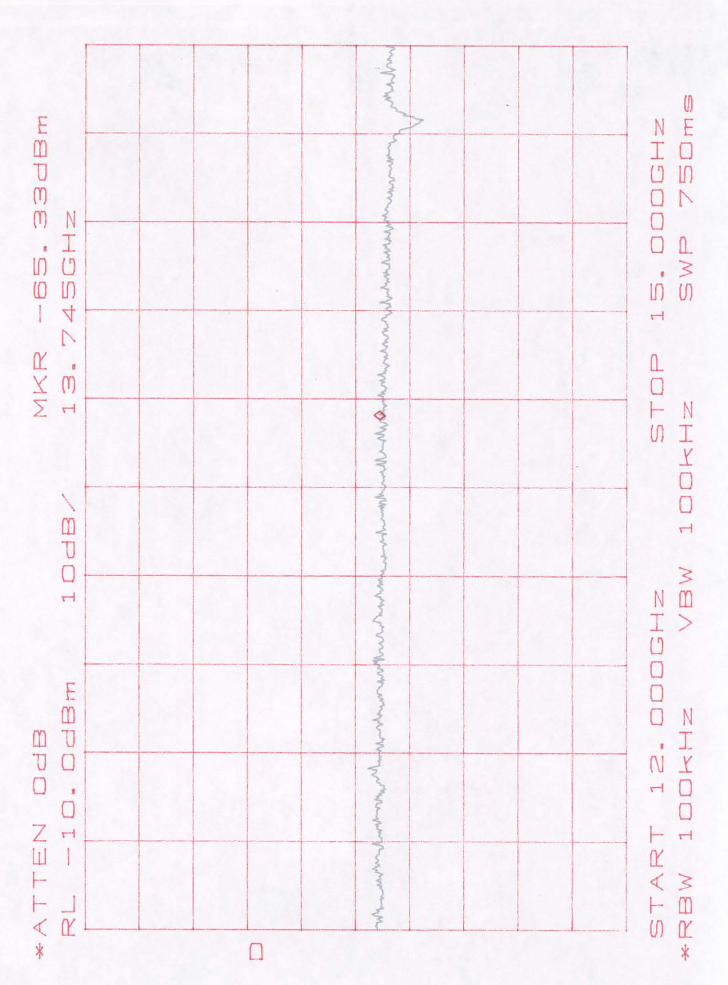
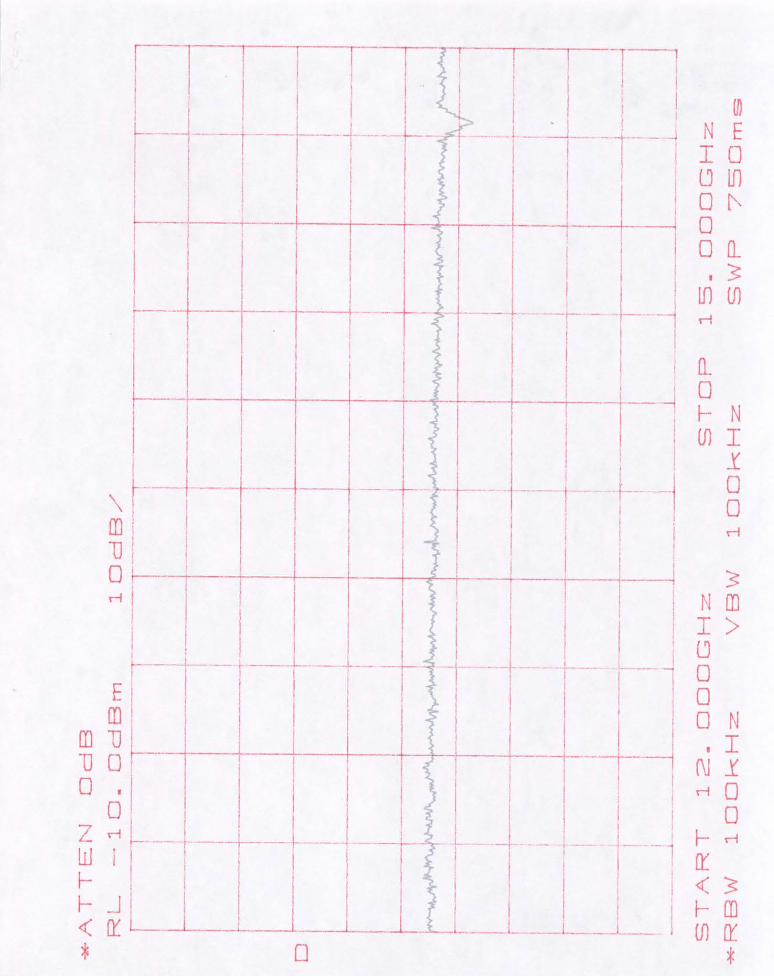
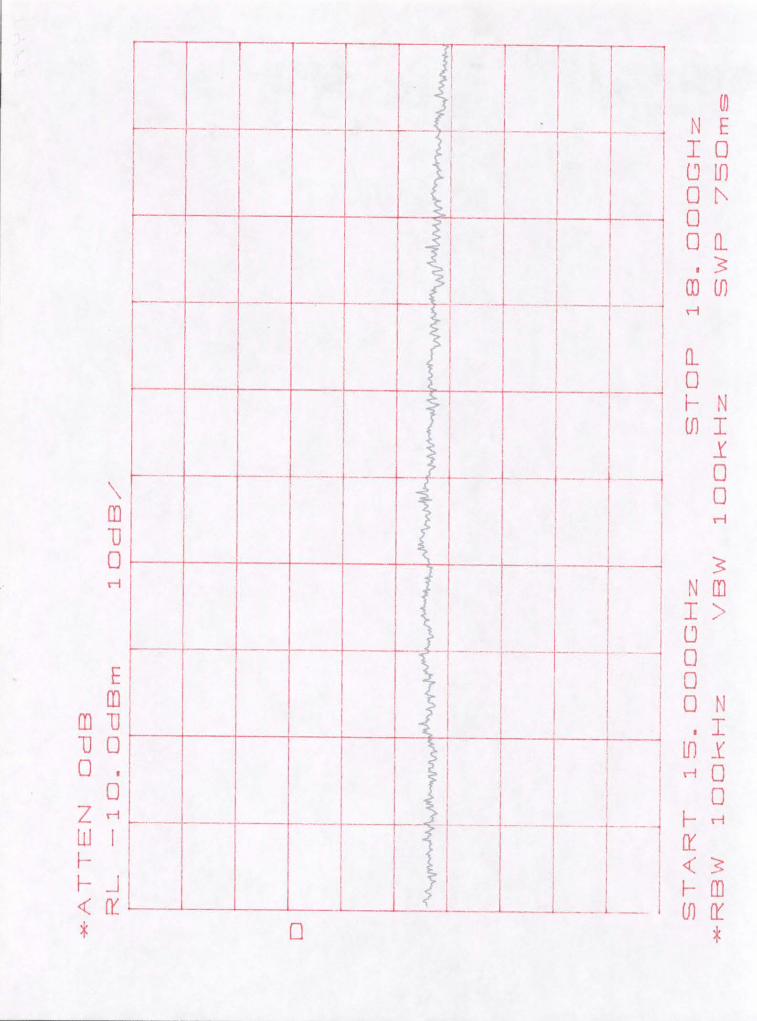
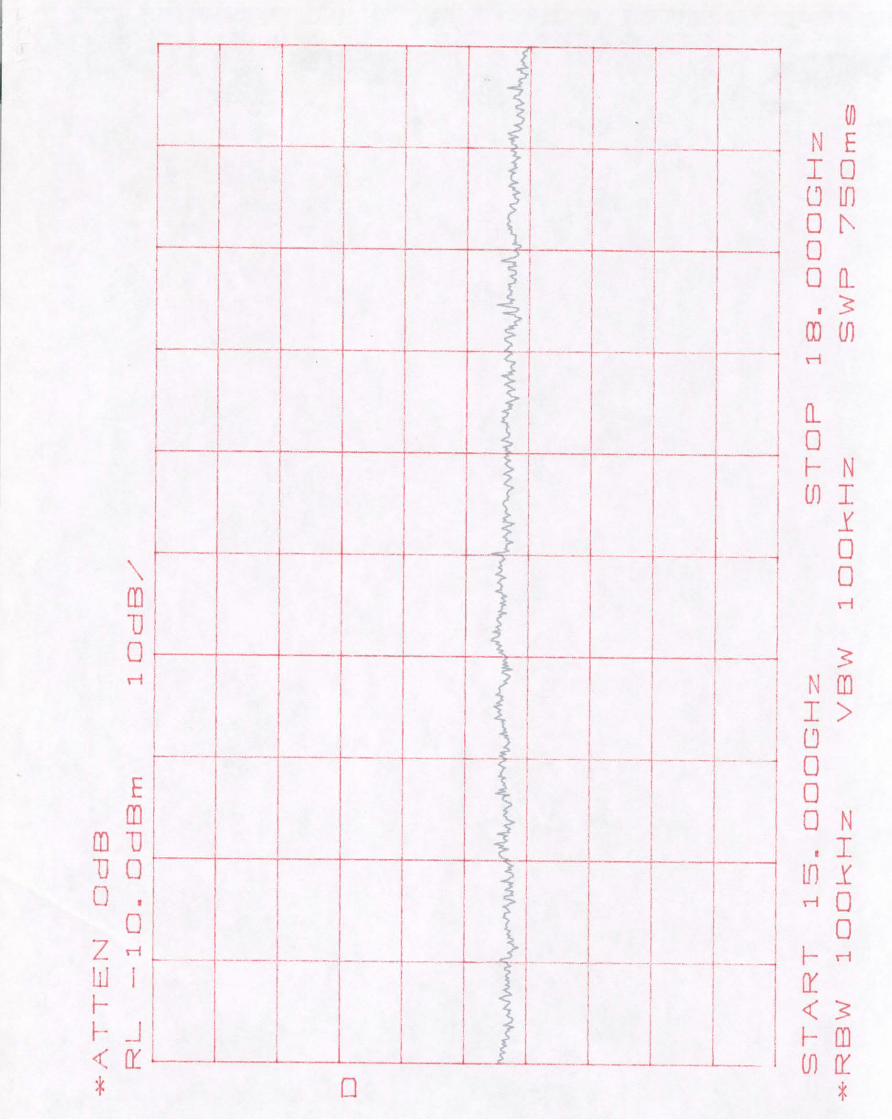
C. Beaudet, G. Watts On December 16 and 17, 2004, we visited the New Technology Center of the NRAO in Charlottesville, VA to conduct an RFI survey at three locations in the labs. A central concern is whether RFI produced by the ALMA correlator will interfere with SIS mixer testing and other sensitive receiver measurements being made in the labs. At the time of this survey, only ¼ of the card slots in 1 quadrant of the correlator rack was populated; the intent is to perform the survey again when the correlator is completely installed. The survey at each location is comprised of sweeps that collectively span 20 MHz to 18 GHz. Antennas were fixed at a specified azimuth and elevation angle and in a selected polarity at each survey location. To achieve equal dwell time per bandwidth, the spectrum analyzer adjusts the sweep time according to span. Since our amplifiers and antennas cover different spans, test time was adjusted to keep the number of sweeps the same for any given span. All plots are peak hold representations of the interference encountered during the test. A measurement worksheet, plots for each location, and a comprehensive equipment list can be found in the appendices. The first survey location was on the 3rd floor of building 4, in lab 302 B where sideband response testing of SIS mixers was being conducted. The ALMA correlator is located roughly 25m due North and 9m below this location in the classroom building. Antennas were positioned with the main lobes pointing due North and a vertical tilt of roughly -20˚ (where applicable), roughly at rooftop air ducts from the correlator’s AC unit. In the first set of measurements, the correlator was powered off, and the wireless LAN was operating. In the second set of measurements, the correlator was powered on in a test mode, and the wireless LAN was off. The difference between the two sets of measurements is minimal. It is possible to pick out the 125 MHz correlator clock and two of its harmonics (250 MHz and 875 MHz) that appear in the second set of measurements and were absent in the first. However, these signals are not the dominant features of the plots, showing up 20 to 25 dB lower than the strongest signals measured in this range. Additionally, the broadband noise from the correlator which underlies it’s 125 MHz harmonics fell below the general noise level already present in the lab; this level was not was not obviously increased by powering on the correlator. It is unclear why only the 1st and 6th harmonics showed up; the later survey at 4m distance from the correlator shows a typical “comb” of harmonics that eventually falls below the noise floor of the measurement system around 6.7 GHz. We suspect random reflective surfaces are responsible for the seemingly arbitrary appearance of selected harmonics. Reflection and absorption attenuated the signal seen at 125 MHz by 13 dB beyond what one would expect from line-of-sight free space loss. We suspect that reflection off the roofing material of the B building (the building housing the correlator) was responsible for much of this loss. We can only guess that ambient interference (cell phone, perhaps?) or additive moding is responsible for the fact that the signal at 875 MHz measured 4 dB higher than free space loss predicts. Three channels of WIFI around 2.4 GHz, occupying almost 100 MHz of BW each, are evident in both plots, although in the second survey, when the in-house WIFI was supposed to be powered down, the lowest channel was absent until the scan was about halfway finished; perhaps the purpose of shutting down the system was not communicated to all concerned parties? Anyway, it was possible to pick up WIFI from at least two other access points than the one that was temporarily powered down for the purposes of our test. A very strong, relatively narrow band signal which appeared on both plots at 2.730 GHz may have been Instructional Television Fixed Service (ITFS) or Multipoint Distribution Service (MDS) a.k.a. “wireless cable TV”, although a search of the FCC database does not reveal any licensing at that frequency in the Charlottesville area. At the high end of this test range one can see the sideband source for the SIS mixer test operating between 4.270 and 4.405 GHz. We were set up very close to the SIS test rack, although that noise must been relatively attenuated as it was positioned (intentionally) out of the main beam of the horn antenna. During the first measurements, which were taken during working hours, there was a surprising amount of intermittent noise in the 5 – 8 GHz span. The only signals that persisted and were present after 4:30 PM, when the second set of measurements were taken, appeared at 5.470 GHz and may have been radiolocation out of the Charlottesville Airport, roughly 10 Km away to the North East. Everything above that was intermittent, including a very strong spike which showed up at 9.373 GHz during the second measurement set. This also falls in a radionavigation band and may have been coming from the airport. The highest frequency at which anything at all was seen was a small spike at 13.91 GHz, possibly earth to satellite radiolocation.
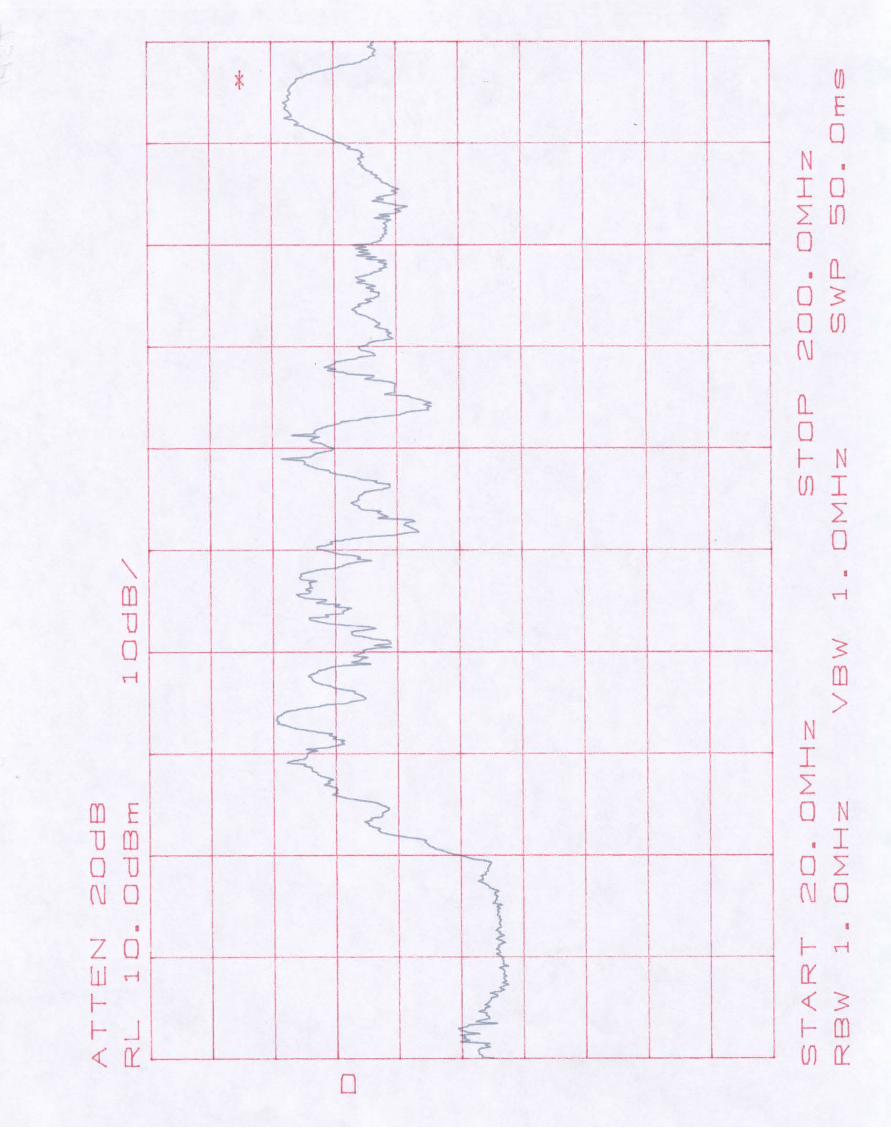
The second survey location was inside the 12’x 8’x 8’ shielded chamber on the first floor of building 4. The intent of this survey was to provide information about the shielding effectiveness of that chamber. The antenna was polarized vertically (to line up with the door aperture) about 1m inside the door, and a scan was taken with the door open, and with the door closed. A few limitations of this method must be noted: 1) Signal moding inside a reflective chamber ensures that the level read at the antenna is going to be different when the door is open vs. when the door is closed, even if the signal source were inside the chamber. 2) Since the ambient signals are constantly changing, we can’t be sure that attenuation is caused by the chamber or a change in the signal. 3) The direction of the source relative to a breach in the chamber factors into the attenuation. Keeping these items in mind, all we can say if we see signals with the door shut is that the chamber is leaky at that frequency and probably for some bandwidth around that frequency. Still, in contrasting the before/after plots, it is tempting to say that we appear to be getting about 20dB of attenuation across the range of test. At the very least, it is obvious that the chamber is providing some attenuation more than 10dB, less than 40dB, and certainly its effectiveness varies with frequency. To improve the shielding effectiveness and usefulness of the enclosure, we make the following recommendations:
1) Fix the holes. I noticed at least 4 holes (3) about 3/16” diameter and one about ¾” diameter. Remove the paint around them with a dremel tool and then provide a conductive seal with copper tape.
2) It is unclear whether the “hat and flat” panel junctions are actually making conductive contact with the panels. In some areas (like where there is a gap) it clearly is not. These panel connectors may be able to be loosened without disassembling the chamber, I don’t know, but in any case it is necessary to clean paint, oxidation, etc. from them where they contact the panels. Additionally, copper wool should be stuffed into any crevice big enough for it to fit, especially the corner junctions which have large gaps. If you’re very serious about improving the chamber, I recommend a complete disassembly, cleaning, and reassembly.
3) The spring fingers around the door appear to be very old and worn, and some of them are missing. I would replace all of them. Also, the addition of a latching mechanism that holds the door tightly closed is recommended.
4) I noticed that some test equipment was running inside the chamber. I powered it off during our test, and used the bulkhead connection on the rear wall of the chamber to connect to our test equipment outside the enclosure. (The only active device in there was the linear power supply for the preamplifier which has been tested and shown to be quiet.) In a small, reflective chamber the test equipment should be isolated from the receiver under test as much as possible, running coaxial cables through a bulkhead connector and filtering other cable connections to the outside world wherever possible.
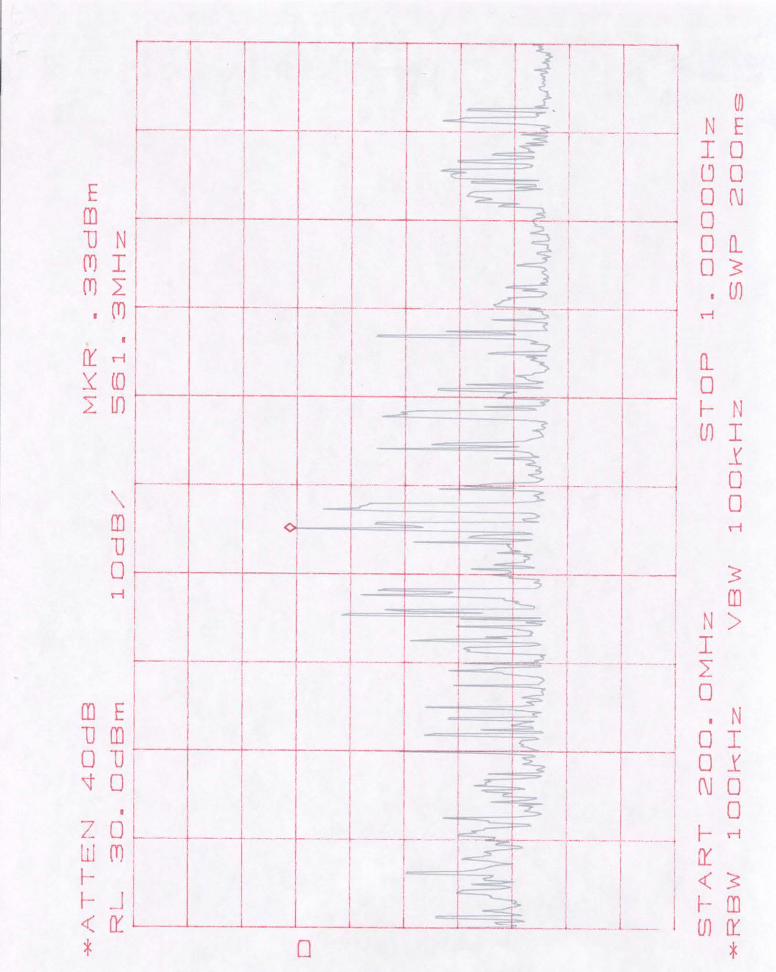
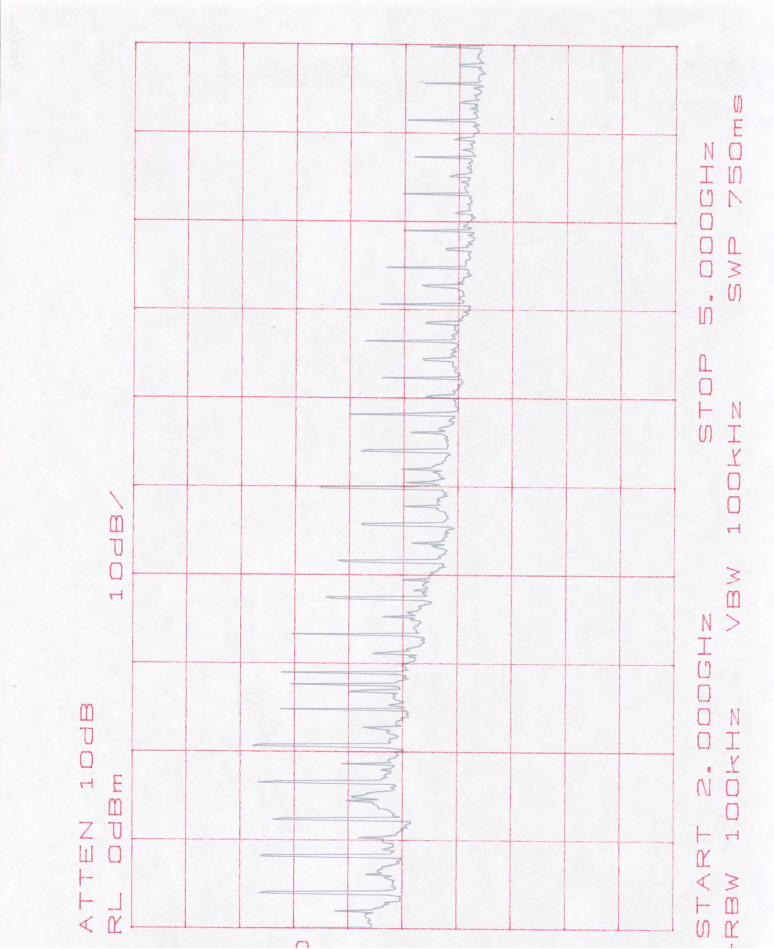
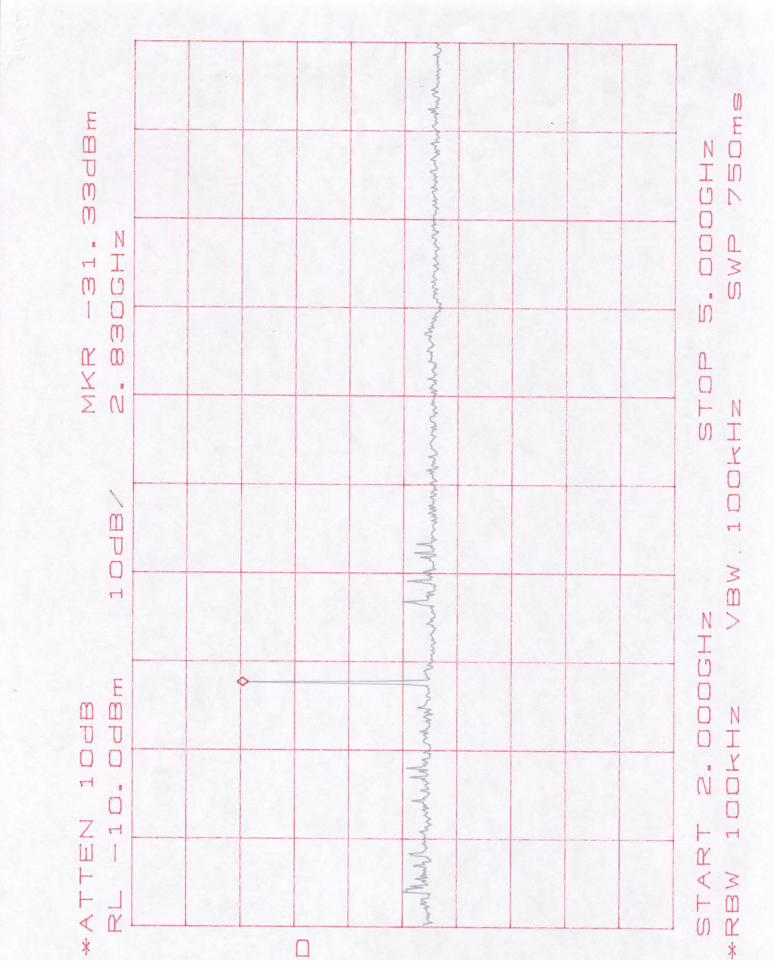
If a restoration effort demands a more quantitative assessment of the chamber, we could conduct shielded effectiveness (SE) testing with methods adapted from the IEEE 299 standard. This method of SE testing has proven helpful in assessing the condition of the large shielded areas in the Jansky lab and in the Education and Visitor Center here at Green Bank. The third survey location was in the B building at a 4m distance from the correlator rack, with about 1/16 of the cards installed and running a “L501 test” continually during test. The purpose of this survey is to profile the RFI generated by the correlator. One feature of the resultant profile is the harmonics of the correlator’s 125 MHz clock which extend to 6.75 GHz before fading below the noise floor of the measurement system. In addition to these harmonics, we note a roughly 20 dB shift in the noise floor from the start of our measurements at 20 MHz all the way up to 3.2 GHz, where it starts to roll off, dropping into the noise at about 7 GHz. One of the biggest broadband noise sources I have ever seen, but not too surprising, given that I was set up 4m away from a device dissipating 8725W. Should the dissipated power be linearly proportional to the number of cards installed, and should the radiated power be similarly proportional to dissipated power, I would expect to see our measurements increase by 12 dB when we return to measure the fully installed correlator, and higher harmonics would be expected to emerge from the noise. From the 4m data, we can make some predictions about the field strength at 25m from the correlator, using our “RFI analysis” spreadsheet. Bear in mind that these predictions do not account for absorption and reflection losses from the buildings, foliage, etc.
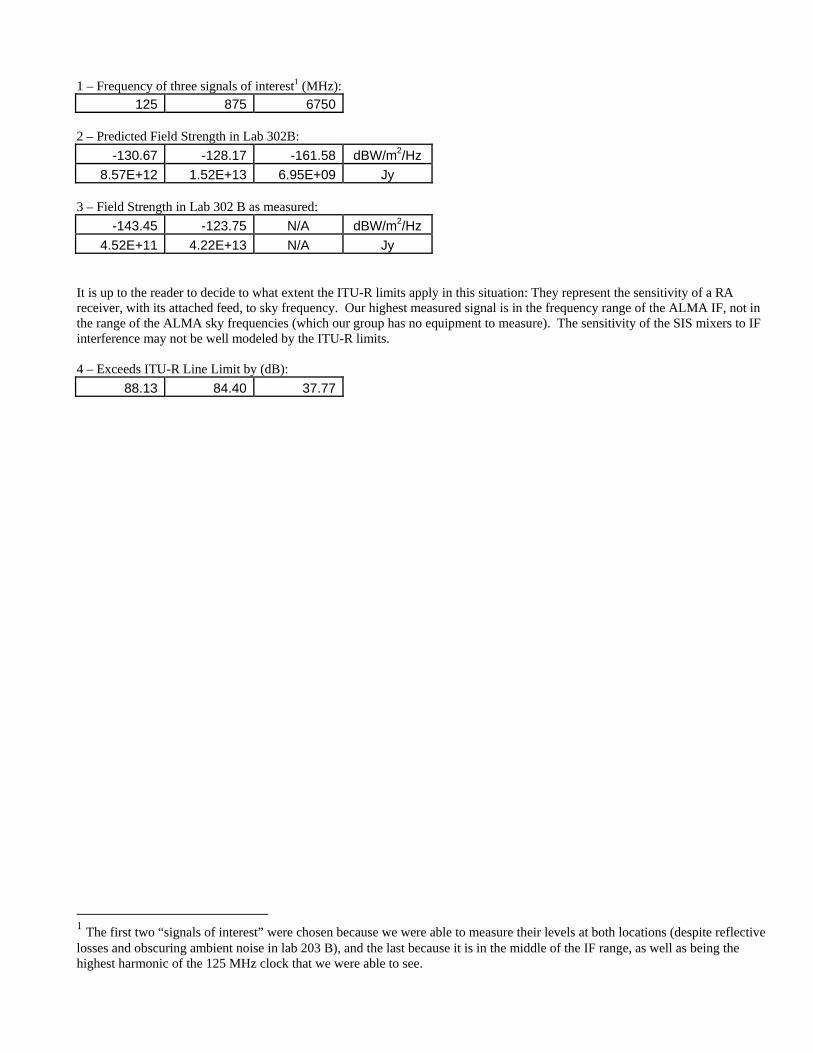
1 – Frequency of three signals of interest1 (MHz):
125 875 6750 2 – Predicted Field Strength in Lab 302B:
-130.67 -128.17 -161.58 dBW/m2/Hz 8.57E+12 1.52E+13 6.95E+09 Jy
3 – Field Strength in Lab 302 B as measured:
-143.45 -123.75 N/A dBW/m2/Hz 4.52E+11 4.22E+13 N/A Jy
It is up to the reader to decide to what extent the ITU-R limits apply in this situation: They represent the sensitivity of a RA receiver, with its attached feed, to sky frequency. Our highest measured signal is in the frequency range of the ALMA IF, not in the range of the ALMA sky frequencies (which our group has no equipment to measure). The sensitivity of the SIS mixers to IF interference may not be well modeled by the ITU-R limits. 4 – Exceeds ITU-R Line Limit by (dB):
88.13 84.40 37.77
1 The first two “signals of interest” were chosen because we were able to measure their levels at both locations (despite reflective losses and obscuring ambient noise in lab 203 B), and the last because it is in the middle of the IF range, as well as being the highest harmonic of the 125 MHz clock that we were able to see.
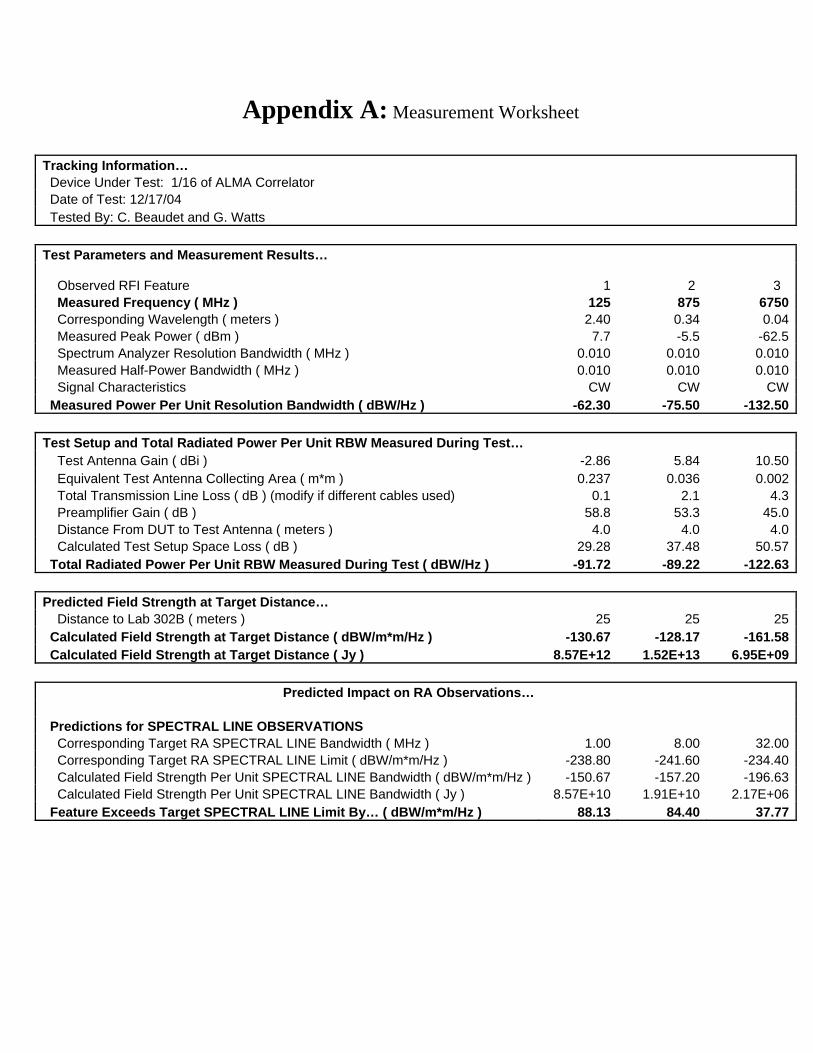
Appendix A: Measurement Worksheet Tracking Information… Device Under Test: 1/16 of ALMA Correlator Date of Test: 12/17/04 Tested By: C. Beaudet and G. Watts Test Parameters and Measurement Results…
Observed RFI Feature
1 2 3 Measured Frequency ( MHz ) 125 875 6750 Corresponding Wavelength ( meters ) 2.40 0.34 0.04 Measured Peak Power ( dBm ) 7.7 -5.5 -62.5 Spectrum Analyzer Resolution Bandwidth ( MHz ) 0.010 0.010 0.010 Measured Half-Power Bandwidth ( MHz ) 0.010 0.010 0.010 Signal Characteristics CW CW CW Measured Power Per Unit Resolution Bandwidth ( dBW/Hz ) -62.30 -75.50 -132.50 Test Setup and Total Radiated Power Per Unit RBW Measured During Test… Test Antenna Gain ( dBi ) -2.86 5.84 10.50 Equivalent Test Antenna Collecting Area ( m*m ) 0.237 0.036 0.002 Total Transmission Line Loss ( dB ) (modify if different cables used) 0.1 2.1 4.3 Preamplifier Gain ( dB ) 58.8 53.3 45.0 Distance From DUT to Test Antenna ( meters ) 4.0 4.0 4.0 Calculated Test Setup Space Loss ( dB ) 29.28 37.48 50.57 Total Radiated Power Per Unit RBW Measured During Test ( dBW/Hz ) -91.72 -89.22 -122.63 Predicted Field Strength at Target Distance… Distance to Lab 302B ( meters ) 25 25 25 Calculated Field Strength at Target Distance ( dBW/m*m/Hz ) -130.67 -128.17 -161.58 Calculated Field Strength at Target Distance ( Jy ) 8.57E+12 1.52E+13 6.95E+09 Predicted Impact on RA Observations… Predictions for SPECTRAL LINE OBSERVATIONS Corresponding Target RA SPECTRAL LINE Bandwidth ( MHz ) 1.00 8.00 32.00 Corresponding Target RA SPECTRAL LINE Limit ( dBW/m*m/Hz ) -238.80 -241.60 -234.40 Calculated Field Strength Per Unit SPECTRAL LINE Bandwidth ( dBW/m*m/Hz ) -150.67 -157.20 -196.63 Calculated Field Strength Per Unit SPECTRAL LINE Bandwidth ( Jy ) 8.57E+10 1.91E+10 2.17E+06 Feature Exceeds Target SPECTRAL LINE Limit By… ( dBW/m*m/Hz ) 88.13 84.40 37.77
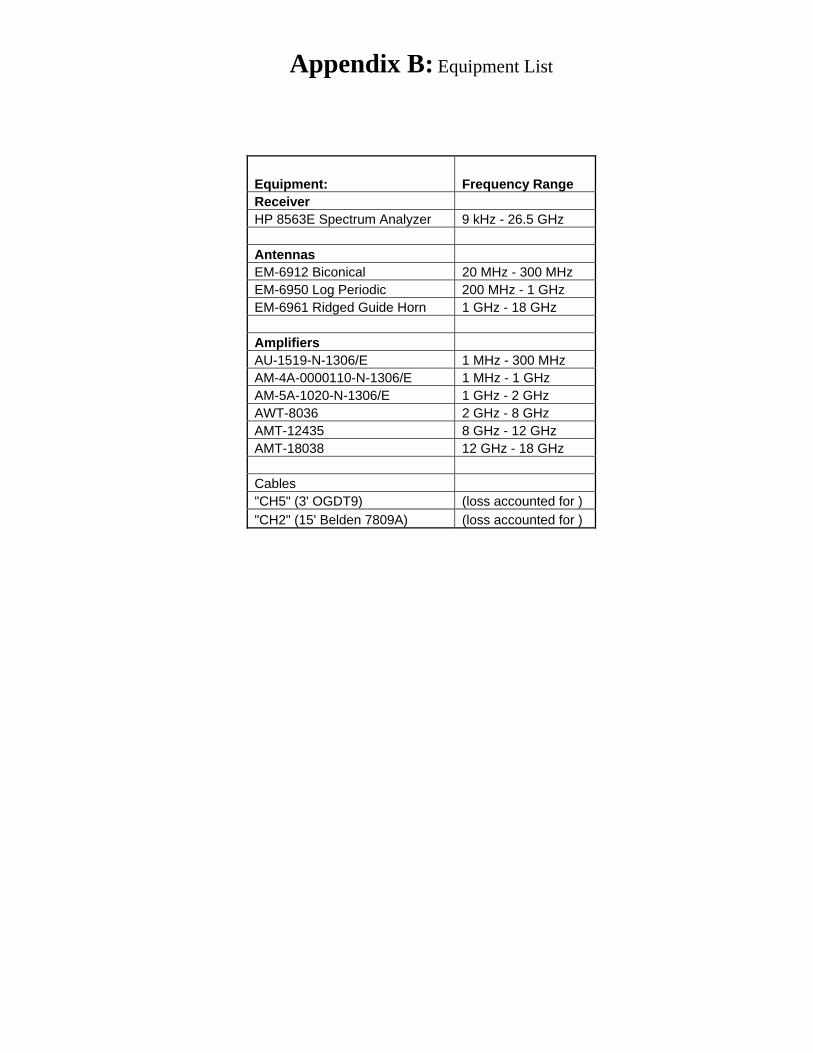
Appendix B: Equipment List
Equipment: Frequency Range Receiver HP 8563E Spectrum Analyzer 9 kHz - 26.5 GHz Antennas EM-6912 Biconical 20 MHz - 300 MHz EM-6950 Log Periodic 200 MHz - 1 GHz EM-6961 Ridged Guide Horn 1 GHz - 18 GHz Amplifiers AU-1519-N-1306/E 1 MHz - 300 MHz AM-4A-0000110-N-1306/E 1 MHz - 1 GHz AM-5A-1020-N-1306/E 1 GHz - 2 GHz AWT-8036 2 GHz - 8 GHz AMT-12435 8 GHz - 12 GHz AMT-18038 12 GHz - 18 GHz Cables "CH5" (3' OGDT9) (loss accounted for ) "CH2" (15' Belden 7809A) (loss accounted for )
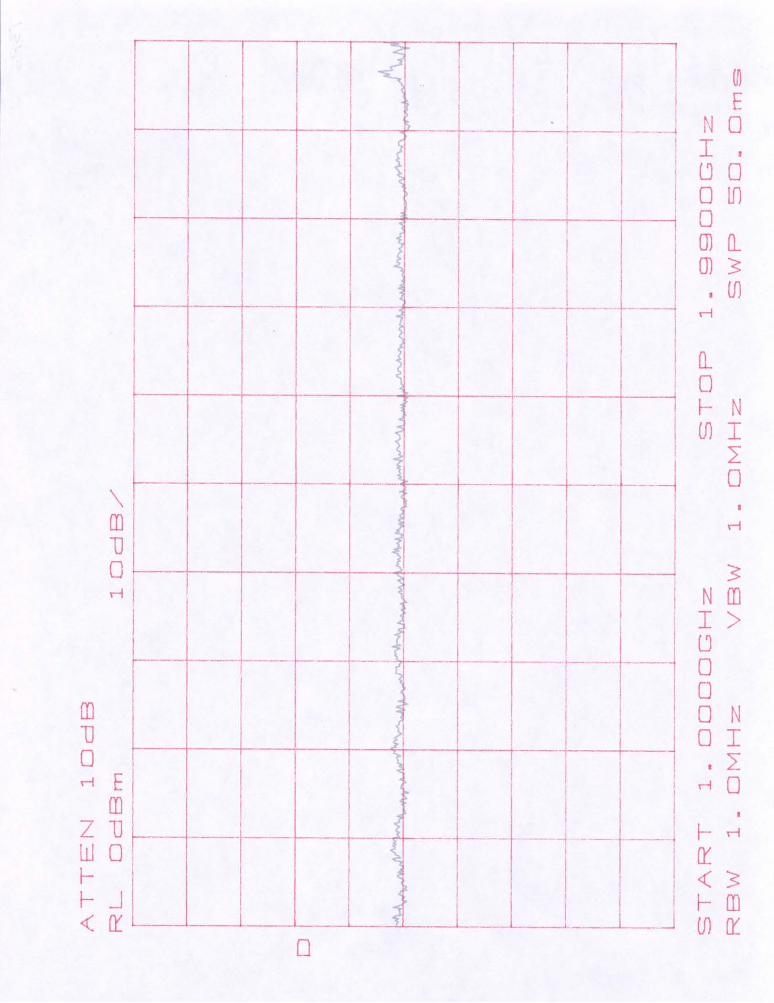
Appendix C: Survey Plots Location 1: Lab 302 B Plots are presented in pairs covering the same frequency range. The first of each pair was taken with the site WIFI ON, and the 1/16 Correlator OFF. The second plot in each pair was taken with the site WIFI OFF2, and the 1/16 Correlator ON.
2 The NRAO WIFI was turned back on in the middle of the sweep that covered its range, so the plot does not reflect its OFF state.
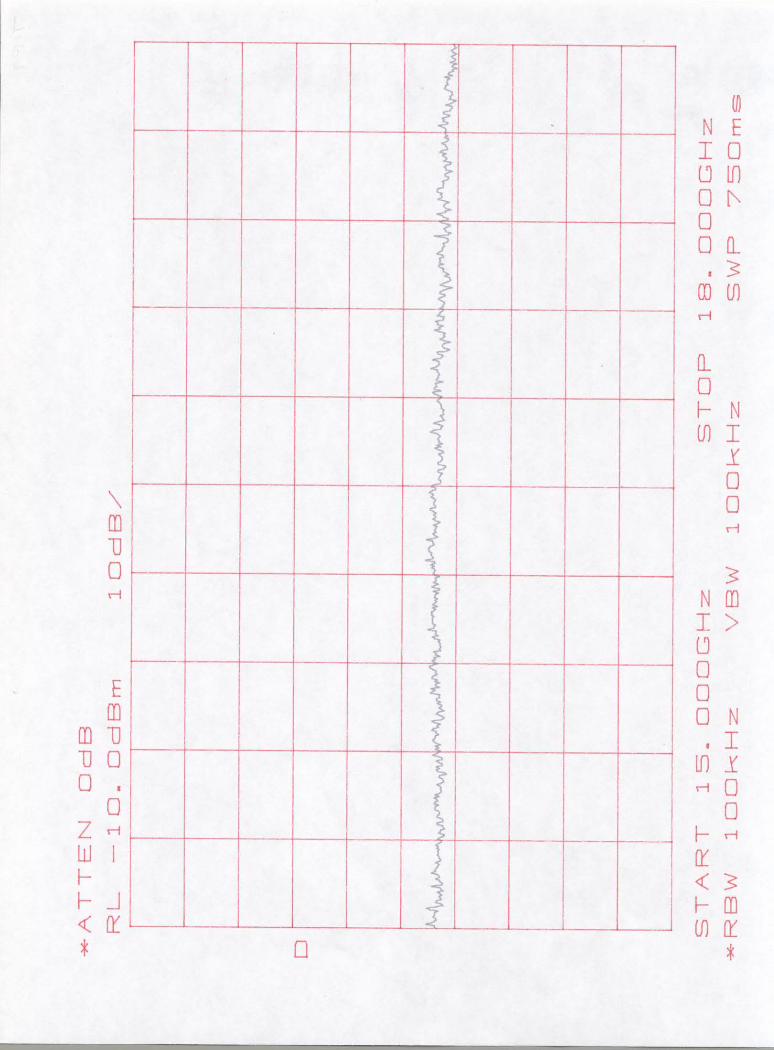
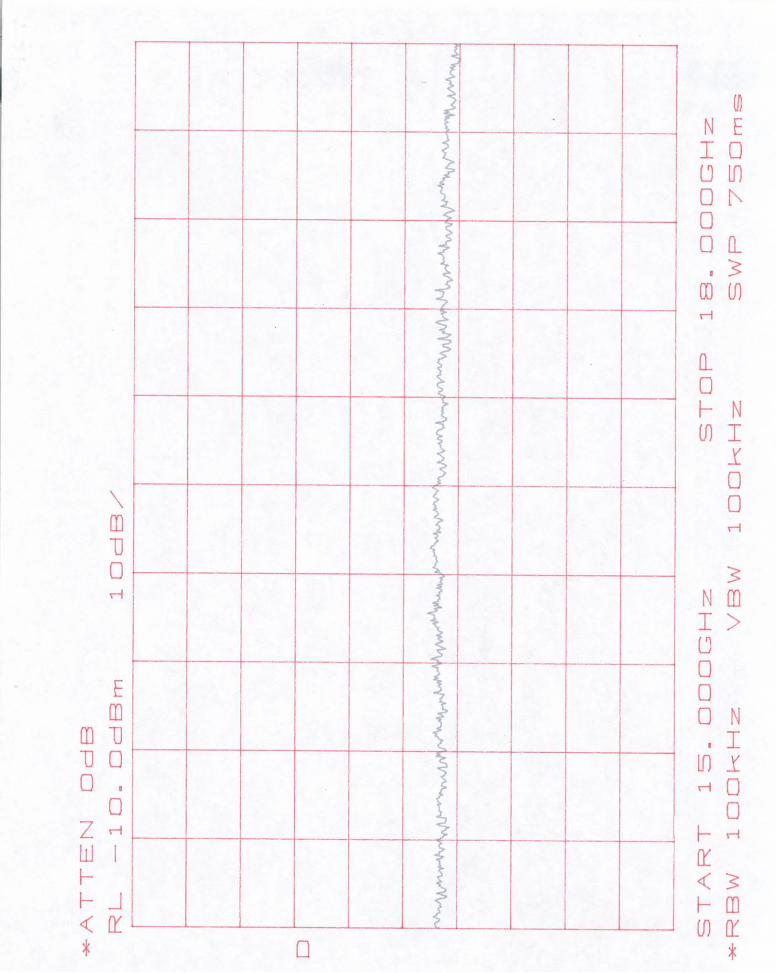
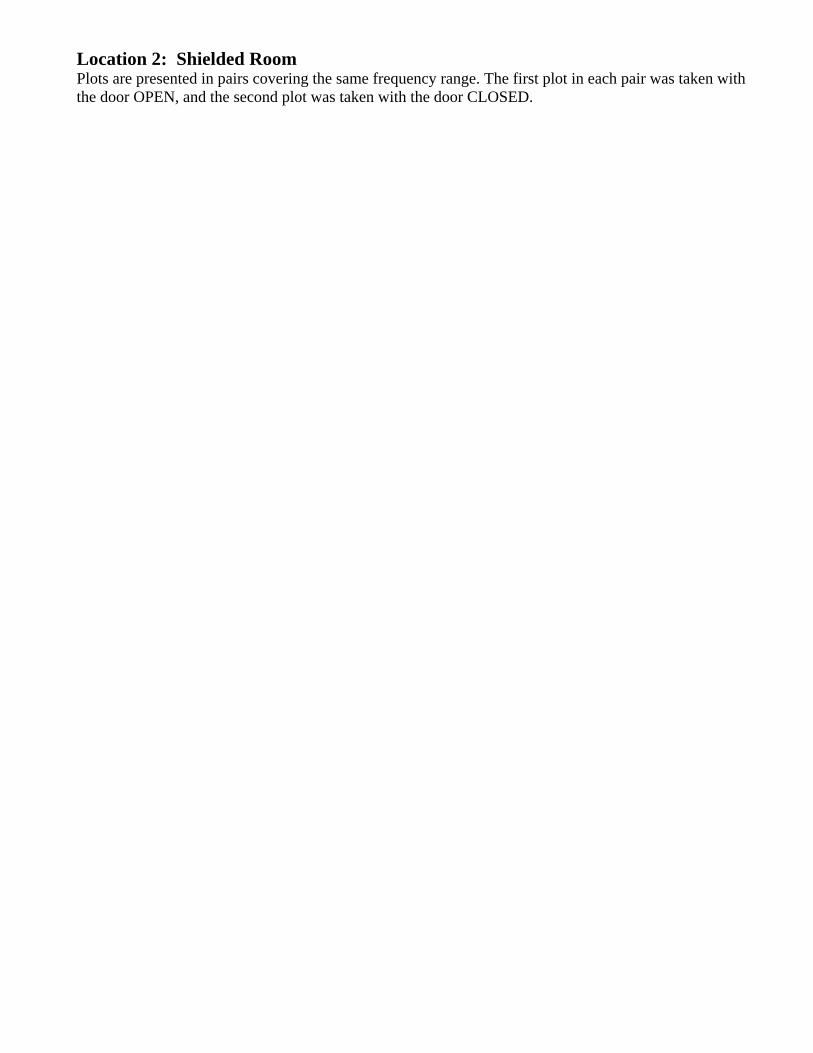
Location 2: Shielded Room Plots are presented in pairs covering the same frequency range. The first plot in each pair was taken with the door OPEN, and the second plot was taken with the door CLOSED.
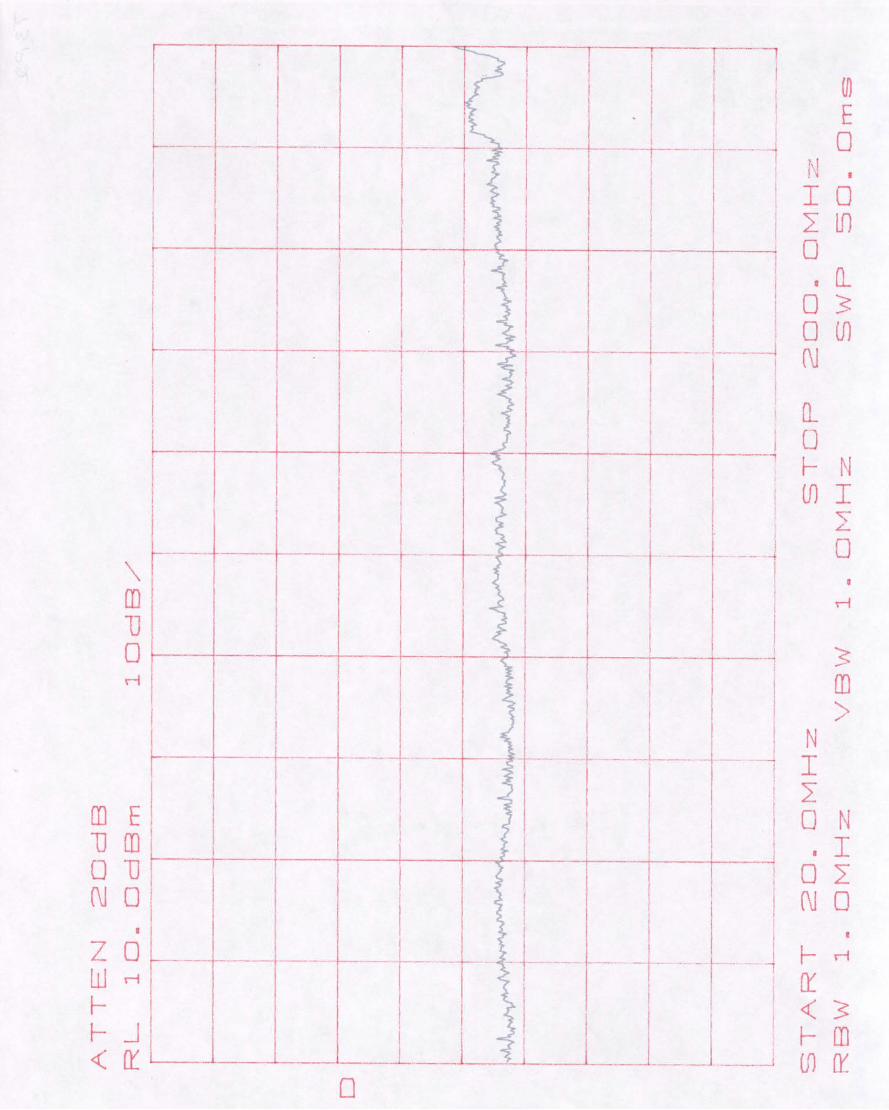
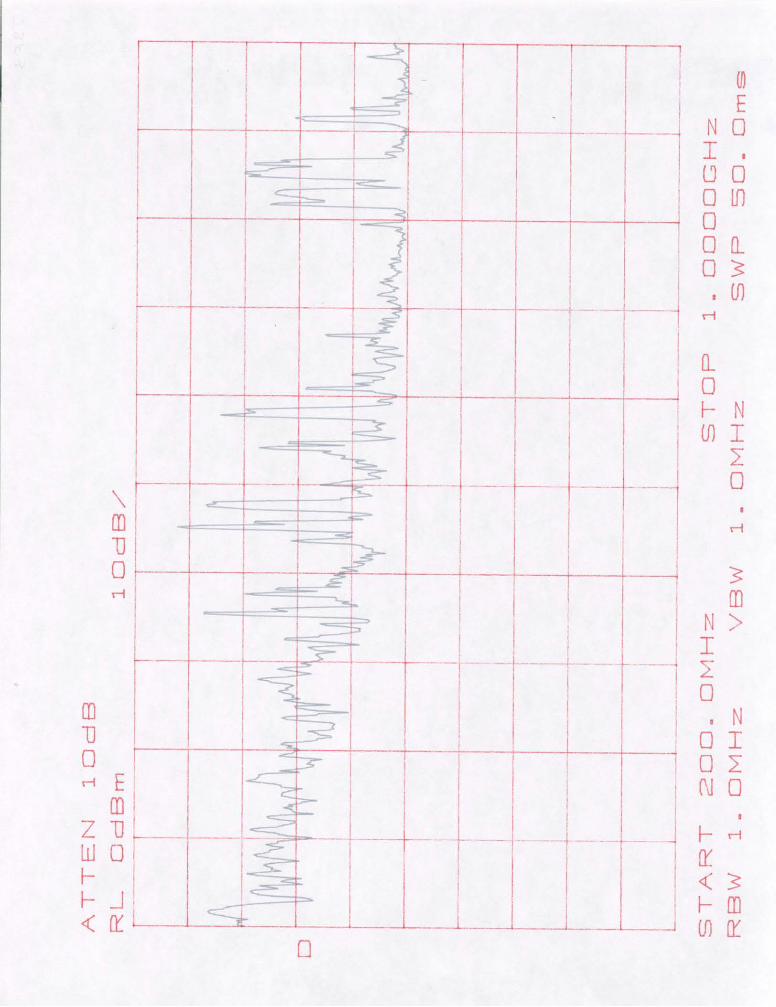
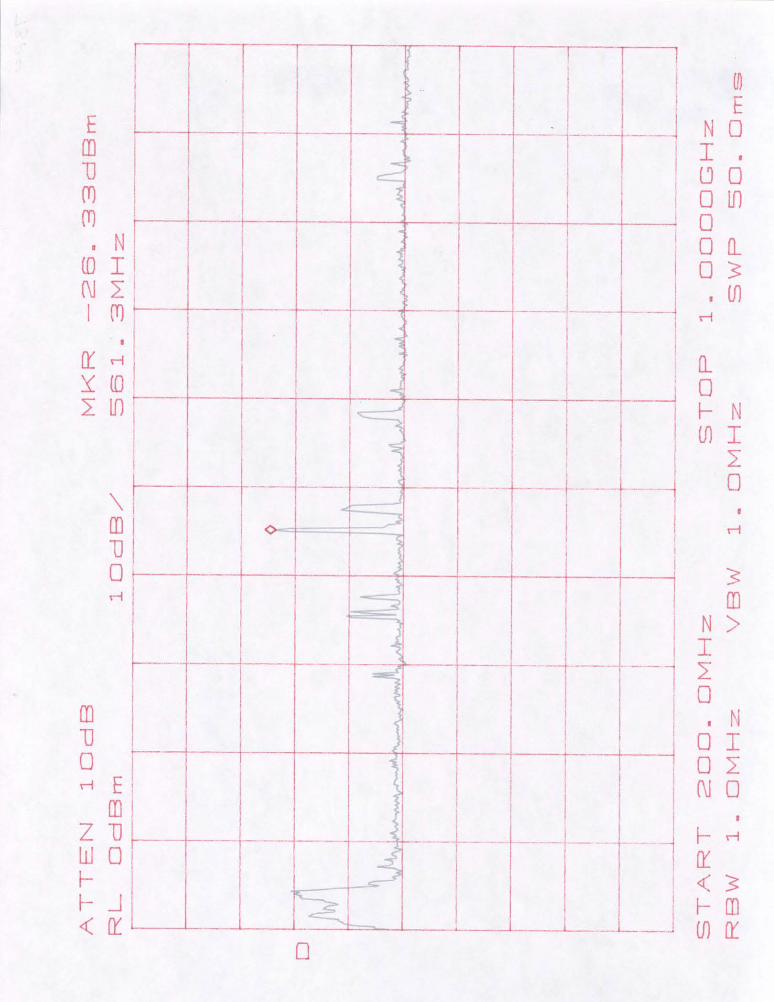
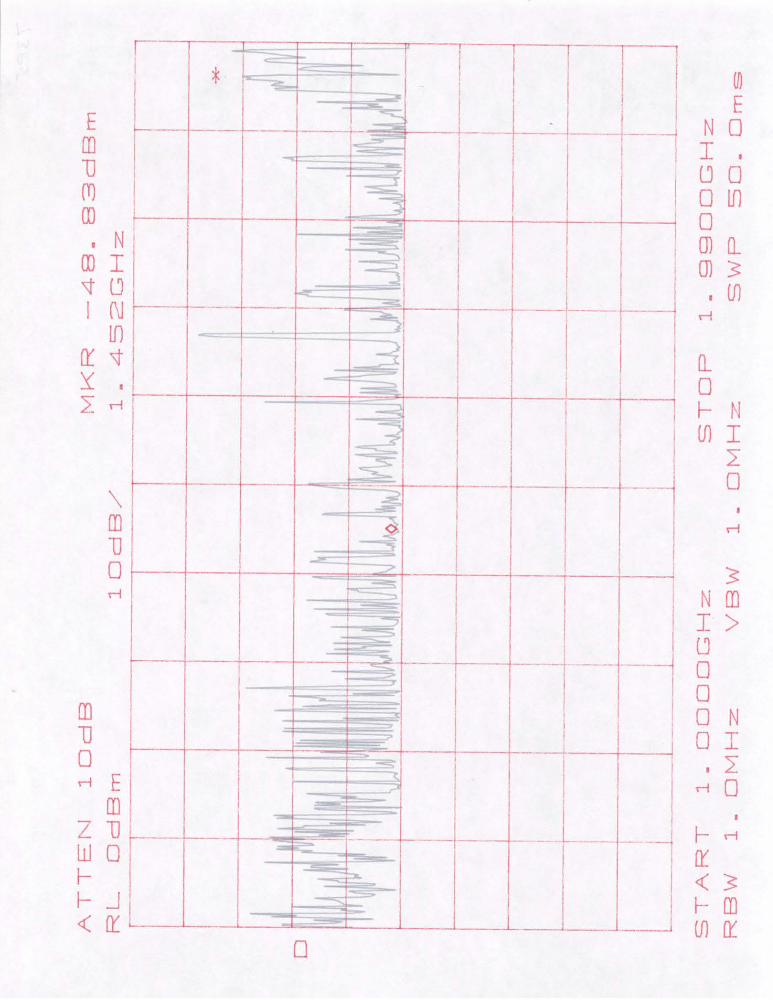
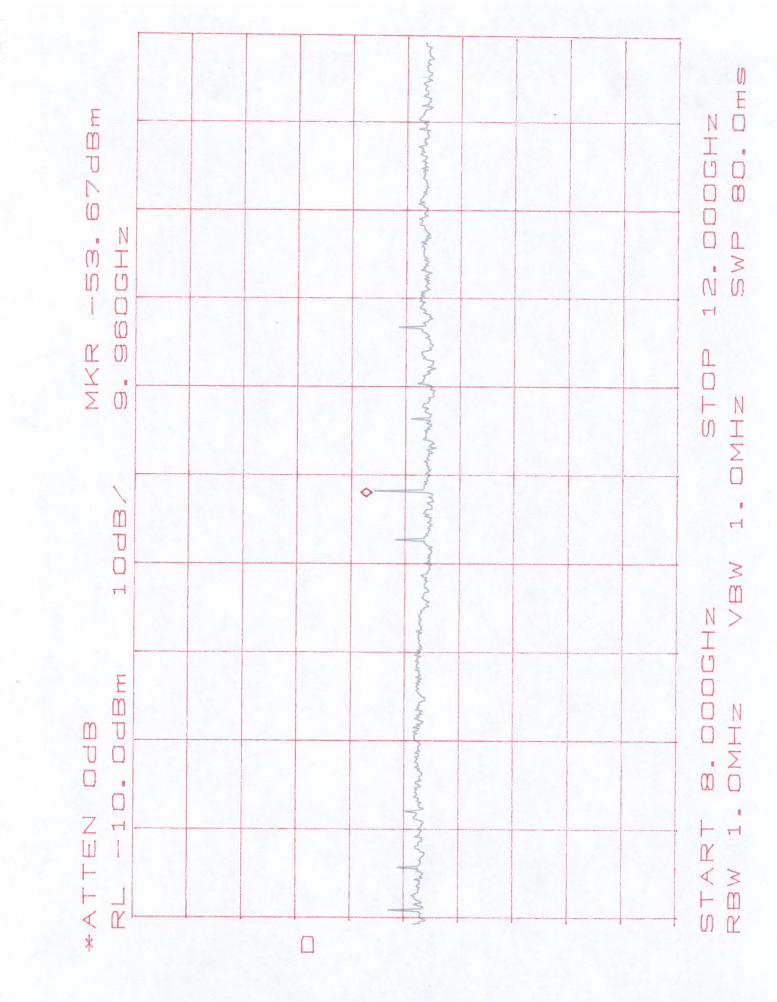
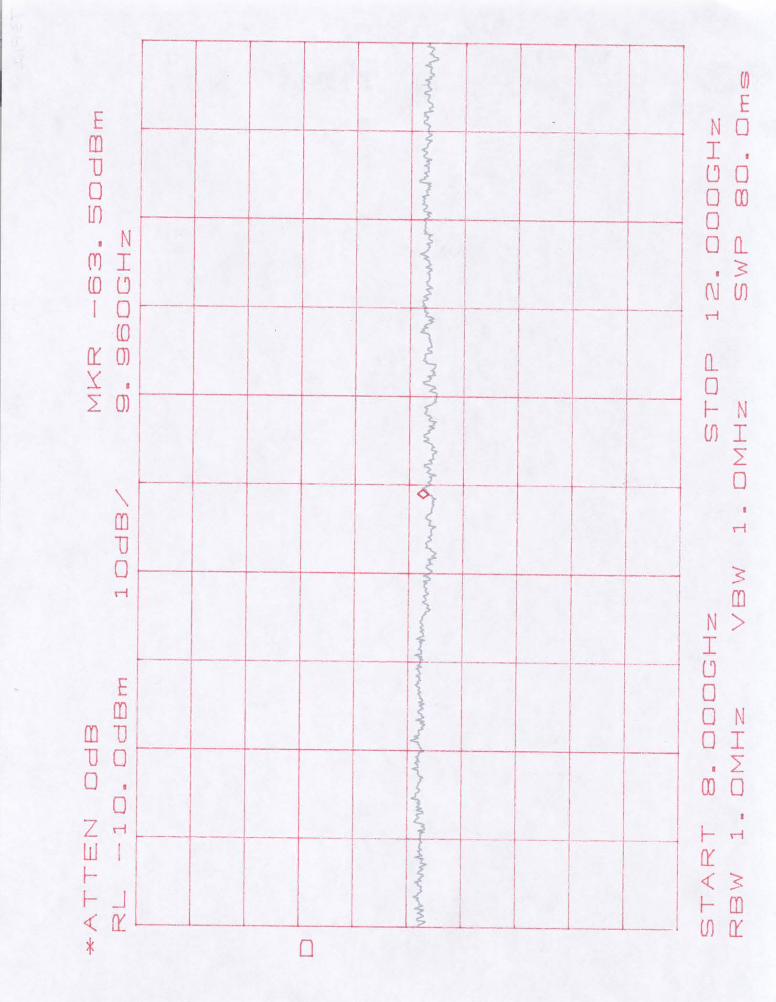
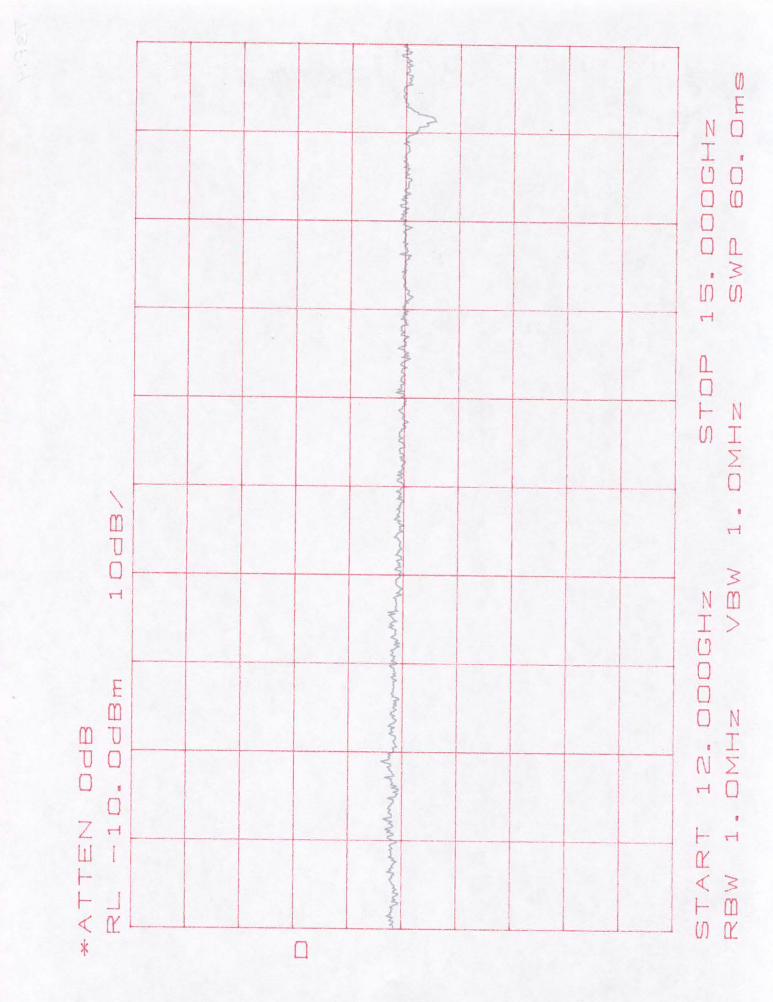
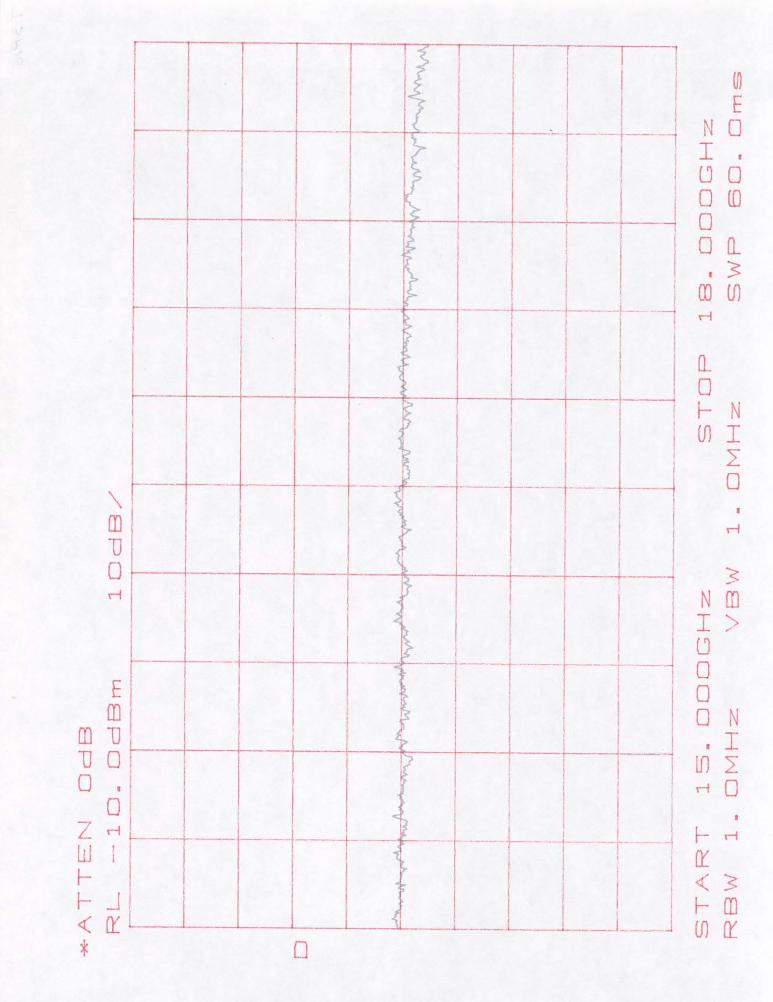
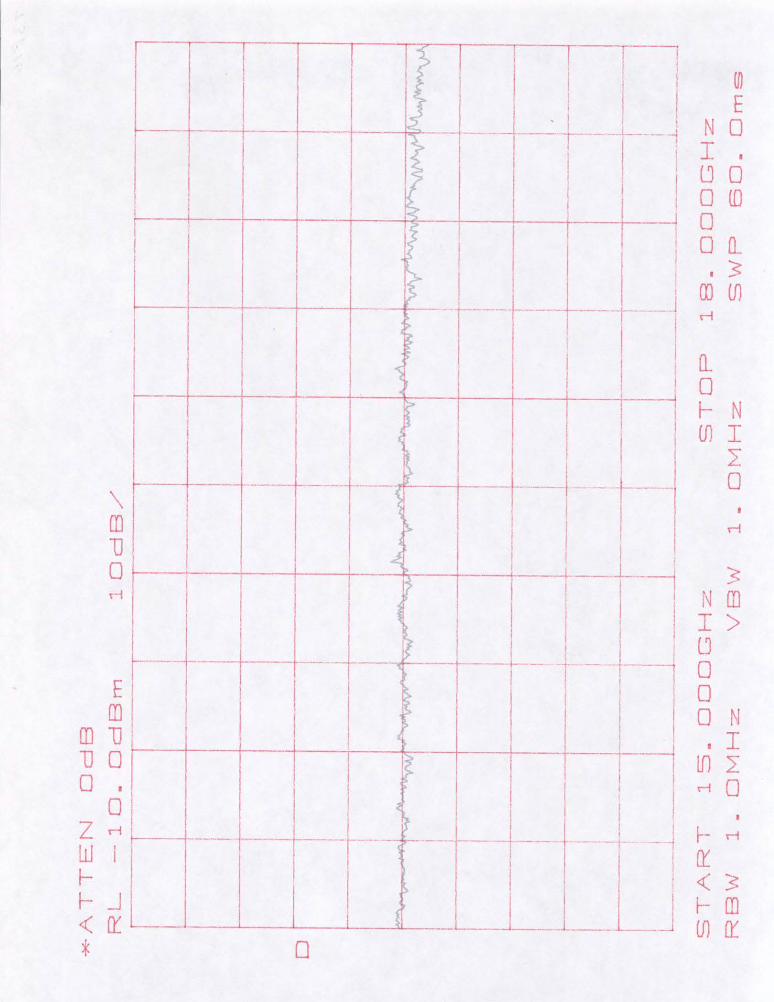
Location 3: 4m from the 1/16 ALMA Correlator Plots are presented in pairs covering the same frequency range. The first plot in each pair was taken with the 1/16 ALMA Correlator ON, and the second plot was taken with the 1/16 ALMA Correlator OFF.
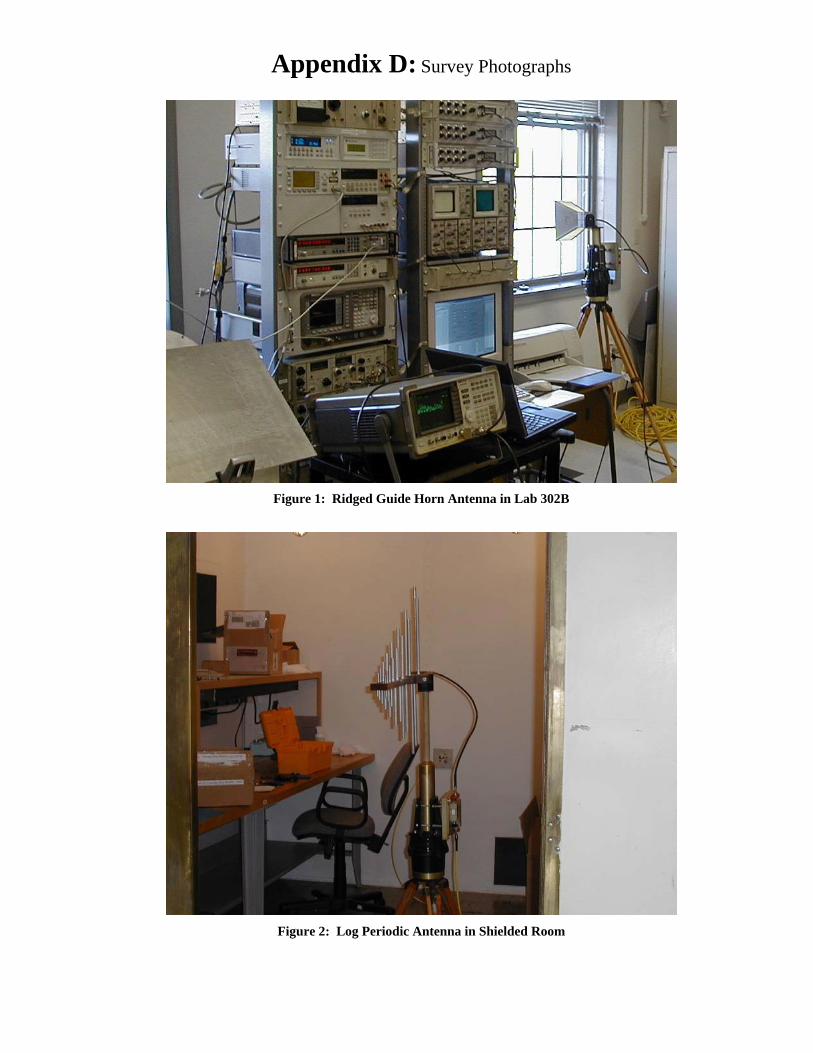
Appendix D: Survey Photographs
Figure 1: Ridged Guide Horn Antenna in Lab 302B
Figure 2: Log Periodic Antenna in Shielded Room
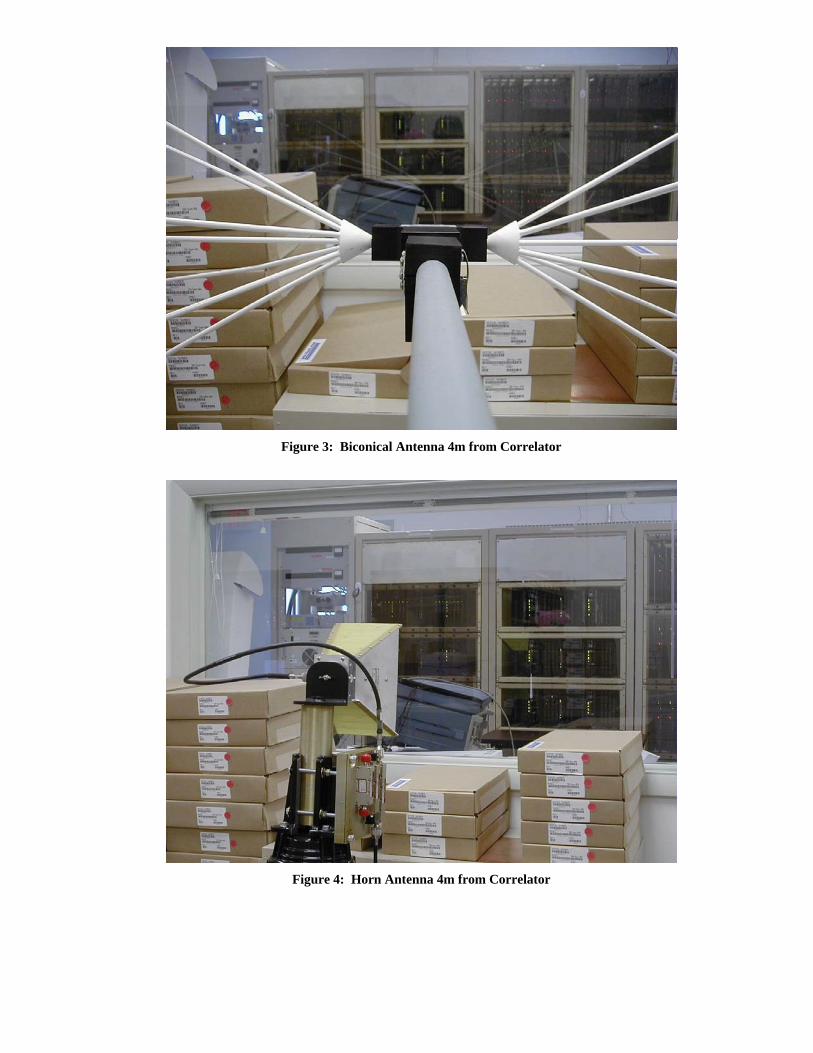
Figure 3: Biconical Antenna 4m from Correlator
Figure 4: Horn Antenna 4m from Correlator