report on sdgs related activitiesggim.un.org › meetings › 2020 › wg-gi-mexico-city ›...
TRANSCRIPT

Report on SDGs Related Activities
Presented by: Chu Ishida, JAXA
WGGIMexico City, MexicoMarch9-11, 2020
@GEOSEC2025www.earthobservations.org1

1. Follow-up Survey on EO data use for SDGs by GEO Member
countries
2. Demonstration in computation of selected SDG Indicators using
existing global/national datasets and tools (QGIS, Trends.Earth)
2
Contents

1. Follow-up Survey on EO data use for SDG Indicators by GEO Member countries
• GEO survey on EO data use for SDGs by Member countries
made in 2019 found 25 existing EO data use cases and 21
planned uses.
• A simple template to share country use cases were sent to the
survey respondents who kindly indicated willing to share them.
• So far received inputs from New Zealand, Germany, Canada
and Colombia. Other interested countries are requested to
provide inputs.
• Collected information will be shared through GEO SDG toolkit for
SDGs.
Status of EO data use
EO data used
Data access, process, analysis
Work flow
LL, gaps, issues, action
Report ”Responses to
the Questionnaire on
Uses of Earth
Observation Data for
SDG analysis and
reporting by GEO
Member Countries,
February 2019”
Template to follow-up
GEO survey on EO data
use for SDG Indicators

4
Overview of the Use of EO for SDG Indicator Reporting (2019 Survey)
Colombia
SDG Indicator
2.3.1
2.4.1
SDG 3 3.9.1
6.3.2
6.4.2
6.6.1
9.1.1
11.1.1
11.2.1 Austria
11.3.1 UK
11.3.2 Ukraine
11.5 Canada
11.6.2 South Africa
11.7.1 Armenia
13.1.1 Germany
13.1.2 US
13.1.3 New Zealand
SDG 14 14.1.1 Nigeria
15.1.1 Senegal
15.1.2 Madagascar
15.3.1 Mongolia
15.4.1 Viernam
15.4.2
SDG 13
SDG 15
Countries using EO for Indicator Countries planning to use EO for Indicator
SDG 11
SDG 2
Existing and planned
country use cases of
EO data for SDG
Indicator
Left
25 cases of existing
country use cases of
EO data for SDG
Indicators
Right
21 cases of planned
country use cases
Follow-up info
received

2. SDG Indicator Computation Using Existing Global Datasets and Tools
ObjectivesCompute selected SDG Indicators on experimental-basis using existing global datasets and tools (QGIS, Trends.Earth) to identify usable datasets and develop a workflow for assessing applicability of datasets and tools and identify any gaps.
Target SDG Indicators :
The following indicators were computed. Results of 6.6.1, 9.1.1 and 15.4.2 are reported here.6.6.1 Spatial extent of water-related ecosystems*
9.1.1 Rural population within 2km distance from all-season roads*
11.3.1 Land consumption per population growth*
11.7.1 Share of built-up area of cities that is open space for public uses
15.1.1 Forest areas as a proportion of total land area
15.3.1 Proportion of degraded land per total land*
15.4.2 Mountain Green Cover Index
* WGGI Task Stream 2 indicators
5

6
SDG 6.6.1 Change in Extent of Water-related Ecosystems over Time
- Mangroves -
The Global Mangrove Watch – a consistent global dataset
(partially) filling the mangrove information gap.
The GMW dataset
• The Global Mangrove Watch* dataset shows the global extent of
mangroves for 7 annual epochs in the period 1996 – 2016.
• 2010 baseline map generated from ALOS PALSAR and Landsat imagery
• Other 6 epochs generated from JERS-1, ALOS and ALOS-2 SAR mosaics
• Consistent methodology applied globally
Constraints and limitations
• 25 m pixel spacing a limitation in small or fragmented mangroves
• SAR mosaic generation time lag
• 2010 baseline artefacts due to cloud cover and
GMW input source: L-band SAR global mosaics @ 25 m
1996 (JERS-1), 2007-2010 (ALOS PALSAR) , 2015-2016 ALOS-2 PALSAR-)
GMW input source: Optical global mosaic @ 30 m
~2010 (Lansdat 5 & Landsat 7)* The Global Mangrove Watch (GMW) is an international initiative led by JAXA, Aberystwyth University
(U.K.) and soloEO (Japan) in collaboration with NGOs (WI, IWMI, TNC, WCMC, WRI), NASA GSFC and
academic institutions. GMW contributes to GEO-Wetlands

SDG 6.6.1 Change in Extent of Water-related Ecosystems over Time
― Mangroves
The GMW dataset was designated 2019 by UNEP (SDG6.6.1 co-custodian) as official mangrove dataset for country reporting on Indicator 6.6.1.
GMW data to be released on UNEP SDG www (www.sdg661.app) late March 2020 . The site provides free and open access tools for calculation SDG6.6.1 components at national or sub-national basis.
Mangrove area estimated bystandard QGIS tools – Bangadesh
1996 4120.0 km2(red)2010 4121.3 km2(green)
7
Bangladesh
Effects of L7 scaneline
error in GMW baselineGMW data can also be downloaded directly and areas calculated by common GIS software.

Global Mangrove Watch www:
www.globalmangrovewatch.org
www.eorc.jaxa.jp/ALOS/en/kyoto/mangrovewatch.htm
Data access:
UNEP-WCMC: data.unep-wcmc.org/datasets/45 (.shp)
UNEP SDG6.6.1 www: www.sdg661.app
JAXA EORC www: 2020/Q2 (GeoTiff)
Online viewing:
Global Forest Watch www (select “Mangrove forest” layer under “Land Cover” tab)
https://www.globalforestwatch.org/
For technical details see:Bunting P., Rosenqvist A., Lucas R., Rebelo L-M., Hilarides L., Thomas N., Hardy A., Itoh T., Shimada M. and Finlayson C.M. (2018). The Global Mangrove Watch
– a New 2010 Global Baseline of Mangrove Extent. Remote Sensing 10(10): 1669. doi: 10.3390/rs1010669
•
8
SDG 6.6.1 Change in Extent of Water-related Ecosystems over Time
― Mangroves
GMW on GFW www

9
SDG 6.6.1 Change in Extent of Water-related Ecosystems over Time
― Mangroves
Next steps2020/Q2: Revision of GMW v2.0 to include known missing areas
2021: Add mangrove biomass (AGB) derived from SRTM height (collaboration w. NASA GSFC)
2021: Generation of 2017, 2018 & 2019 GMW maps
2021+: Integration of wider range of EO datasets (L-band SAR, C-band SAR, optical data
@10m) to improve classification accuracy
GMW estimates for the world’s Top-10 mangrove countries

SDG 9.1.1 Rural Population within 2km Distance from All-season Roads
10
Data:Population: WorldPoP, 100m grid Japan (2015) https://www.worldpop.org/project/categories?id=3
Roads: GRIP (Global Roads Inventory Project) data(2018)
https://datacatalog.worldbank.org/dataset/grip-global-roads-inventory-project-2018
Rural/urban areas: Global Rural-Urban Mapping Project (GRUMP), v1(2014)
https://sedac.ciesin.columbia.edu/data/collection/grump-v1
Workflow:Download population,
roads, urban/rural area
data and clip them to
Japan area
Overlay population data with
rural area data and estimate
population in rural areaEstimate ratio of rural population within
2km buffer against total rural population
Overlay with rural area data,
estimate rural population
within 2km buffer
Set 2km buffer from roads.
Overlay with population data,
estimate population within
buffer

SDG 9.1.1 Rural Population within 2km Distance from All-season Roads
WorldPoP population grid data (100m resolution)
GRIP road data
11
Population Density
(per ha)
National population 134,853,493 2.41
Rural area population-A 10,963,884 0.29
Within 2km from roads
(national)
134,821,984 2.87
ditto(rural area)-B 10,488,073 0.35
B/A 95.6%
2km buffer from roads
GRUMP urban area (1km)

15.4.2 Mountain Vegetation Cover Index
Mountain area Mountain Green Coverage
Computation using Global Map 72.2% 96.71%
Computation using ALOS data 45.9% 91.2%
Analysis by FAO 44.9% 97%
標高300m以上の土地利用分類図
12
Land use dataElevation data Mountain green coverage
• GSI/Global Map data (1km, land use, elevation and administrative boundary) and
ALOS land use map (250m, 2014-2016) and AW3D(300m) were used.
• Mountain area was delineated considering elevation and slope *
*300m elevation range within 700 m radius for
300-1500 m elevation was not considered.
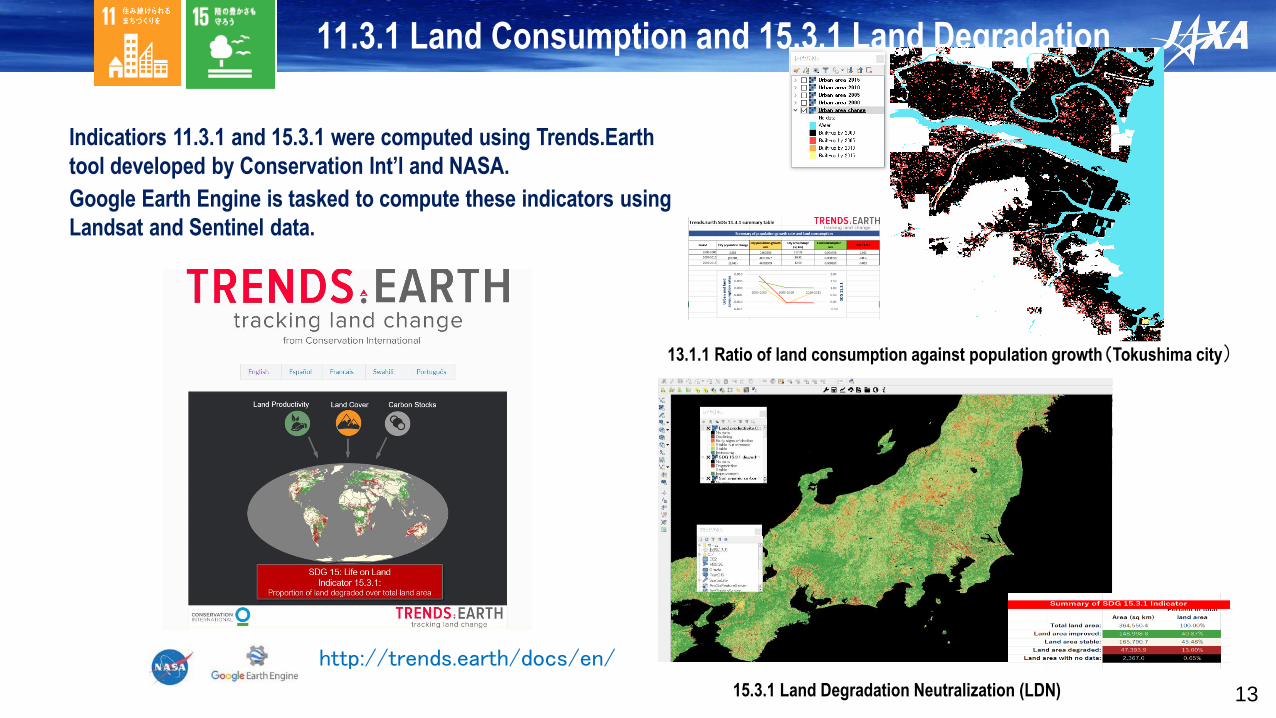
11.3.1 Land Consumption and 15.3.1 Land Degradation
13
Indicatiors 11.3.1 and 15.3.1 were computed using Trends.Earth
tool developed by Conservation Int’l and NASA.
Google Earth Engine is tasked to compute these indicators using
Landsat and Sentinel data.
http://trends.earth/docs/en/
13.1.1 Ratio of land consumption against population growth(Tokushima city)
15.3.1 Land Degradation Neutralization (LDN)
Summary
• SDG Indicators were computed on experimental basis using
global/national datasets and tools (QGIS and Trends.Earth).
• Once datasets are selected and a workflow is established, it is rather
straight forward to compute the Indicators using existing datasets and
tools.
• Datasets need to be selected to fit for the purpose.
• Satellite data is large and complex. It is often challenging to preprocess
data before analysis. But, it provides great means to make a time-series
change analysis at different scales in a consistent manner.
• It needs further analysis and consultation with NSOs and line ministries to
assess applicability of datasets and tools for SDG Indicator reporting.
14