report on the 2nd quarter and 1st half of 2013 - precisionir
TRANSCRIPT

Future Inside 2013RepoR t on the 2nd QuaR teR and 1s t half

Future Inside
Which way is the automotive industry heading? What technology will be driving our cars in the future? These questions concern us all in a society characterized by almost unrestricted mobility. The answers will bring about fundamental changes in terms of resource management and infrastructure.
ElringKlinger is one of just a handful of suppliers around the globe that develop and produce technologically sophisticated components for all drive systems – for conven-tional combustion engines optimized by downsizing as well as for hybrid and electric vehicles using either battery-powered electric engines or fuel cells.
As a development partner and original equipment manufacturer with a global pres-ence, we supply almost all of the world’s vehicle and engine manufacturers. To round off our portfolio, ElringKlinger Kunststofftechnik also supplies products made of high-performance PTFE plastics to manufacturers outside the automotive industry. We harness our innovative strengths to achieve the company’s goals of sustainable mo-bility and profitable growth. These efforts are supported by our committed workforce of over 6,400 people at 42 ElringKlinger Group locations worldwide.
e lR ing k ling e R
Contents
G ro u p In t e r Im m a n aG e m e n t r e p o r t
Macroeconomic Conditions and Business Environment 02
Sales and Earnings Performance 04
Financial Position and Cash Flows 15
Opportunities and Risks 19
Outlook 20
Events after the Reporting Period 26
e lr In G K lIn G e r a nd
t he C a pI ta l m a r K e t s 2 7
Co n s o lIdat e d In t e r Im
F In a n C I a l s tat e m e n t s
Group Income Statement 30
Group Statement of Comprehensive Income 31
Group Statement of Financial Position 32
Group Statement of Changes in Equity 34
Group Statement of Cash Flows 36
Group Sales by Region 37
Segment Reporting 38
n o t e s to t he In t e r Im
F In a n C I a l s tat e m e n t s 4 0
r e s p o n sIb Il I t y s tat e m e n t 4 8

Macroeconomic Conditions and Business Environment
large economies continue to drift apart
Economic performance in the various regions around the globe remained divergent during the
second quarter of 2013. While the sovereign debt crisis in Europe continued to exert pressure on
domestic economies, conditions in the United States and Asia were much more favorable.
The economies of Europe’s peripheral member states appear to have gradually reached the trough
of recession, whereas the region’s core markets have seen more pronounced economic risks. Of the
core member states only Germany managed to achieve any forward momentum during the second
quarter of 2013: its gross domestic product (GDP) rose by 0.2% compared to the same quarter a year
ago. By contrast, the eurozone as a whole recorded a decline in GDP by 0.8%.
The United States, meanwhile, are slowly but surely emerging from the crisis. The overall number
of unsold homes was scaled back to more normal levels and the country’s unemployment rate
decreased on a quarter-to-quarter basis. Against this backdrop, the US economy recorded an increase
in GDP of 1.8% in the period from April to June 2013. Brazil, by contrast, felt the effects of sluggish
investment spending – among other factors – and achieved growth of just 2.4% in the second quarter.
China saw its economy advance at a less dynamic pace, with economic growth standing at 7.4% in
the second quarter. Economic output in India rose by 4.8% during the same period, while Indonesia
recorded growth of 5.8%.
In Japan, the weaker yen provided fresh impetus for exports, thus helping to further cement economic
recovery in the second quarter of 2013. The country’s GDP increased by 1.0%.
Global automobile markets develop along divergent lines
There continued to be wide disparity between the various car markets around the globe during the
second quarter of 2013. Whereas Western Europe had to contend with all-time lows, the world’s two
single largest markets, China and the United States, recorded growth. This helped to compensate for
the anemic state of the Western European market. In the second quarter of 2013, global production
of passenger cars and light commercial vehicles rose by 3.5% compared to the same period a year ago.
Western european car market continues to bring up the rear
The protracted recession in Europe resulted in a further decline in car sales over the course of the
first half of 2013. At 6.1 (6.5) million units, new car registrations fell by another 6.6% year on year in
the period from January to June 2013. The UK market proved to be surprisingly buoyant. Recording
a 10.0% increase, it was the only one among the five largest European markets to generate growth.
In the second quarter of 2013, however, the rate of decline slowed down significantly compared
to the first quarter, at minus 3.5% as opposed to minus 9.8%. Car production in the second quarter
also remained lower than in the same quarter a year ago.
02

Germany has been unable to isolate itself completely from the crisis-ridden markets, despite the fact
that strong overseas demand from Asia and the United States continues to provide sufficient support
for domestic production. New car registrations declined by 8.1% to 1.5 (1.6) million units in the first
six months of 2013. At the same time, vehicle exports fell to 2.1 (2.2) million units, as a result of
which German car production contracted by 3.4% to 2.7 (2.8) million units.
The repercussions of the sovereign debt crisis also became increasingly apparent in Eastern Europe,
where new registrations stood at 374,363 (403,497), i.e. down on the previous year’s figure. The
Russian automobile market also developed unfavorably. In the first half of 2013 it recorded a 5.8%
downturn in the number of cars and light commercial vehicles sold, taking the figure to 1.3 (1.4) mil-
lion units.
positive performance in the us continues
Supported by favorable financing conditions and low energy costs, the US car market remained on
track for growth. In the first half of 2013, the total number of cars and light trucks sold in the US stood
at 7.8 (7.3) million units, which was up 7.5% on the same period a year ago.
Brazil saw vehicle sales rise in the months of April and May 2013. Against this backdrop, the number
of cars and light trucks sold increased by a solid 4.8% to 1.7 (1.6) million units in the period from
January to June 2013.
asia remains growth driver
China again generated dynamic double-digit growth in the first six months of 2013. The number
of new cars sold reached 7.7 (6.4) million in total, 20.6% more than in the same period a year ago.
Thus, China retains its ranking as the world’s biggest car market ahead of the United States.
India, by contrast, failed to generate forward momentum. Against the background of high financing
costs, the number of new vehicles sold fell to 1.3 (1.5) million units. At 2.3 (2.5) million vehicles,
Japan also saw a decline in the number of cars registered. Having said that, the previous year’s com-
parative figure was relatively high.
no visible turnaround for the european commercial vehicle markets
Business within the truck market is directly connected to economic performance, which explains the
pressure exerted on this segment of the automotive industry in Europe. ElringKlinger generates
around 13% of its original equipment revenue from truck components and would benefit accordingly
from an upturn in commercial vehicle demand.
However, there are still no signs of an immediate turnaround in Europe. Although the contraction
in truck sales was less pronounced during the year to date, the market for mid-sized and heavy
trucks still remained at minus 12.7% in the first half of 2013, taking the figure to 250,340 (235,274)
in total. None of the five biggest markets in Europe produced growth in the period under review.
Also Germany recorded a decline of 13.3%.
I n t e r I m m a n ag e m e n t r e p o r t
03

In the United States, sales of Class 8 trucks edged up slightly in the second quarter of 2013. Despite
this, the decline in truck sales recorded for the first half of 2013 still stood at 13.5%, taking the figure
to 85,892 (99,246) units.
Truck sales in China totaled around 350,000 units in the first half of 2013.
Sales and Earnings Performance
revenue grows despite extreme weakness of european car markets
In spite of the difficult market situation in Europe, the ElringKlinger Group managed to grow at a
faster rate in percentage terms than the global vehicle markets over the first six months of 2013.
Thanks to structural growth in a large number of its product groups and the introduction of many
new products, the Group was able to boost revenue by 3.6% to EUR 590.1 (569.8) million despite
extremely weak demand for cars in Western Europe. The pace of revenue growth picked up even
further in the second quarter, with a year-on-year rise of 6.0% for the period, taking the total figure
to EUR 303.3 (286.0) million.
The forward momentum generated by ElringKlinger with components such as turbocharger and
exhaust gaskets as well as heat shields was again underpinned by the trend towards lighter, more
fuel-efficient and encapsulated engines. The number of parts such as these required in modern
vehicles has increased. ElringKlinger has also been benefiting from a steady increase in demand for
control plates used in automatic transmissions and for lightweight plastic housing modules.
G r o u p s a l e s 1 s t h a l F
in EUR million
750
500
250
0
2012 2013
569.8 590.1
04

In the second quarter, exchange rate movements had a negative effect on revenue, equivalent to
EUR 4.6 million. If exchange rates had remained unchanged, the Group’s organic growth would have
amounted to 7.2%.
The full acquisition of the former joint venture ElringKlinger Korea Co., Ltd., Changwon, South
Korea, effective from February 1, 2013, contributed EUR 2.3 million to revenue and EUR 0.1 million
to earnings before taxes in the first half of 2013.
performance of acquired companies – turnaround at hug
At EUR 29.2 (15.4) million, first-half sales were up at the exhaust technology specialist Hug Group,
which was acquired by ElringKlinger in 2011. Revenue for the second quarter alone more than
doubled to reach EUR 18.2 (8.4) million.
The gradual improvement in earnings performance at the Hug Group was largely due to restructuring
measures and the deployment of state-of-the-art production technology. It also acquired a large num-
ber of new projects. While the first half of the previous financial year had produced a loss of EUR 2.9
million before taxes, the company achieved a tangible improvement in earnings over the course of
2013.
Despite the negative impact of a purchase price allocation totaling EUR 0.5 (-0.5) million, at EUR 1.0
(-2.0) million, Hug’s pre-tax result in the first quarter was nevertheless well within positive territory.
The second quarter brought a further improvement in earnings before taxes to EUR 3.8 (-0.9) million.
This figure included the negative impact of a purchase price allocation equivalent to EUR 0.2 (-0.5) mil-
lion. In line with targets, the Hug Group was thus able to match and even slightly exceed ElringKlinger’s
aggregate Group profit margin for the first time.
The company’s retrofit business in the United States has become a key pillar of its operations. In
2012, Hug’s combined catalyst-diesel particulate filter systems were approved by the CARB (California
Air Resources Board) for use in buses and heavy trucks with a vehicle weight of over 6.34 metric
tons. This provided a considerable boost to its sales in the first half of 2013. Hug now has share of
around 35% of the core market in California. Additionally, its nauticleanTM exhaust purification systems
are showing great promise in the shipping industry. Hug also received several attractive new orders
for exhaust purification systems for use in gas- and light-oil-fired power stations. The company is also
working on prototypes for OEM applications.
Based in Thale in the German federal state of Saxony-Anhalt, ThaWa GmbH, a Hug supplier acquired
in 2012, has been merged into ElringKlinger AG and integrated into the parent company as a pro-
duction site. The new production facility in Thale for precision welding, diesel particulate filter canning
and the manufacture of housings used in complete exhaust gas purification systems was completed
in the second quarter of 2013. The process of migrating elements of production as well as logistics
from Hug’s sites in Switzerland was also finalized. Production has now commenced and is helping to
reduce costs and exchange-rate risks in the Exhaust Gas Technology division.
I n t e r I m m a n ag e m e n t r e p o r t
05

restructuring of former Freudenberg site in France
With new car registrations down a further 11.2% in the first half of 2013, the ongoing slump in
France’s vehicle market has also had an impact on capacity utilization at ElringKlinger Meillor SAS,
France, a former Freudenberg Group company. At EUR 26.3 (27.0) million in total, revenue of
all former Freudenberg entities for the first half of 2013 was down on the previous year.
Whereas earnings at the two former Freudenberg sites in Gelting, Germany, and Settimo Torinese,
Italy, were well within positive territory, earnings before taxes at ElringKlinger Meillor SAS remained
negative in the first half of the year. ElringKlinger has implemented restructuring measures at the
French site and is downsizing the local workforce in order to adapt its capacity levels to persistently
low demand within the market. In this context, other liabilities of EUR 1.8 million were recognized
in the first quarter. These had a non-recurring impact on earnings.
Parallel efforts are being made to improve earnings through further process automation and the
introduction of small-scale production in the Aftermarket business.
All together, with first-quarter sales at EUR 13.4 (13.7) million, the three former Freudenberg sites
posted earnings before taxes of minus EUR 1.5 (0.2) million, which includes the above-mentioned
restructuring costs. Second-quarter revenue stood at EUR 12.9 (13.3) million, with improved pre-tax
earnings of EUR 0.3 (0.3) million.
hummel-Formen Group adds to expertise in lightweight design
Die and tool maker Hummel-Formen generated sales of EUR 4.0 (4.7) million in the first six months
of 2013. Out of this total, EUR 2.1 (3.6) million were attributable to the second quarter.
Earnings before taxes for this period stood at minus EUR 0.3 (-0.4) million. This figure includes the
negative impact of a EUR 0.1 (-0.2) million purchase price allocation. Pre-tax earnings showed an
improvement in the second quarter, moving just into positive territory compared to the figure of minus
EUR 0.3 million for the same period in 2012.
It should be noted that a large proportion of the operating output of Hummel-Formen, a specialist
in the design and development of tools used in the production of lightweight plastic components, is
now supplied to the ElringKlinger Group’s Plastic Housing Modules/Elastomer Technology division.
Shielding technology tools that were previously bought in from external suppliers are now developed
and made by Hummel.
Hummel’s development teams are working on a number of lightweight construction projects with
a view to using new, highly resistant plastic/fiber-reinforced composite structures to replace vehicle
components currently made of metal. Additionally, Hummel-Formen has now begun to offer its
services to external customers and to develop innovative metal-polymer composite products.
06

All together, the Hug Group, the Hummel-Formen Group and the former Freudenberg companies
generated sales of EUR 59.5 (47.1) million in the first six months of 2013. Of this total, an amount of
EUR 33.2 (25.3) million was attributable to the second quarter. The same companies reported
earnings before taxes for the first half of EUR 3.3 (-2.8) million, with the second quarter accounting
for EUR 4.3 (-0.9) million of the total.
rapid growth in asia – sales in europe well above market as a whole
The marked downturn in German car production during the first half of 2013 also had an impact
on ElringKlinger’s sales performance in the period under review. Although domestic revenue fell
slightly in the first quarter, a general improvement in business performance in the second quarter
allowed ElringKlinger to achieve modest overall growth of 3.4% for the first half. A relatively high
proportion of ElringKlinger’s sales comes from German car makers and suppliers that have benefit -
ed from strong demand for their products in Asia and North America. Revenue generated from sales
within the German market rose accordingly to EUR 178.7 (172.9) million. At 30.3% (30.3%), Germa-
ny’s contribution to the Group’s total sales revenue was unchanged on the previous year.
While the continued slump in Western European automobile markets also acted as a drag on sales
growth at ElringKlinger, new product launches and a modest improvement in demand on the custom-
er side in the second quarter helped ElringKlinger to achieve a small increase in sales even in its
“Rest of Europe” (excluding Germany) region. Here, with revenue up 0.5% at EUR 183.1 (182.1) mil-
lion, the company outperformed the wider market by a significant margin.
The region again accounted for the biggest share of the Group’s total sales in the first half of 2013.
However, it should be noted that a large proportion of the engines manufactured in Europe (particu-
larly Germany) for which ElringKlinger supplies parts are destined for export markets in North
America and Asia.
G r o u p s a l e s by r eG I o n 1 s t h a l F 2 0 13 (prior year) in %
I n t e r I m m a n ag e m e n t r e p o r t
07
n a F ta 16.8 (17.9)
G E R M a n y 30.3 (30.3)
R E S t O F EU R O P E 31.1 (32.0)
S O U t h a M E R I C a a n d
R E S t O F w O R l d 5.7 (5.8)
a S I a a n d aU S t R a l I a 16.1 (14.0)

Compared to the strong sales performance recorded over the same period of 2012, revenue from
North America was down 2.5% at EUR 99.4 (102.0) million. Growth at ElringKlinger’s US subsidiar-
ies contrasted with declining sales in Canada on account of the product mix.
In South America, customer demand in the second quarter of 2013 was higher after a sluggish first
quarter. As a result, total revenue for this region over the first six months was up 2.1% at EUR 33.8
(33.1) million.
ElringKlinger maintained a pattern of dynamic growth in Asia. Sales in this region rose by 19.2% in
the first six months of 2013. At EUR 95.1 (79.8) million, revenue from the Asian market was almost
on a par with that generated in North America.
Growth in Asia was driven primarily by the Group’s Chinese subsidiaries, but also by an increase
in revenue at ElringKlinger Marusan Corporation, Japan. In response to the significant level of in-
coming orders, the ElringKlinger Group is currently expanding its manufacturing capacity at the
Chinese site in Suzhou, where a local development center is now being set up. As early as 2012, the
ElringKlinger Group established its own manufacturing operations in the burgeoning ASEAN region
via its Japanese joint venture ElringKlinger Marusan Corporation in Indonesia. In the first quarter
of 2013, the company strengthened its position in South Korea through its complete takeover of the
Korean joint venture.
Asia accounted for 16.1% of total Group revenue, up again from 14.0% in the same period a year
ago. Taking exports to the Asian markets into account, the share of Original Equipment sales attrib-
utable to Asia is now around 24%.
Overall, at 69.7% (69.7%), the Group’s foreign sales again made a substantial contribution to total
Group revenue in the first half of 2013.
original equipment records growth in revenue and earnings
Growth generated within the ElringKlinger Group during the period under review was driven
by Original Equipment, the strongest segment with regard to sales. Supported in particular by new
product launches and a strong position established in the growth markets of Asia, the Group man-
aged to expand sales revenue for the first half of 2013 by 4.4% compared to the same period a year
ago, which had already been very solid. Revenue growth gathered pace in the second quarter,
reaching 7.0%. Sales revenue generated within this segment stood at EUR 478.2 (458.0) million in
the first half of the year.
Earnings before taxes for the segment rose at a slightly faster rate than sales, up 6.5% to EUR 49.3
(46.3) million.
aftermarket business remains unchanged year on year
Revenue generated from sales within the Aftermarket segment was on a par with the figure posted
for the same period a year ago. The segment recorded sales revenue of EUR 59.1 (59.1) million in the
first six months of 2013.
08

A sluggish economic performance and high unemployment throughout the Southern and Western
European countries exerted downward pressure on the market. Against the backdrop of these dif-
ficulties, vehicle owners have been postponing repairs for as long as possible.
Revenue growth achieved in the Eastern European markets, in South Eastern Europe and in the
Middle East was sufficient when it came to offsetting the effects of economic malaise in Western
Europe and the visible downturn also seen in domestic sales compared to the previous year.
In acquiring the metallic flat gaskets unit from the Freudenberg Group in 2011, ElringKlinger has
added to its portfolio of cylinder-head and specialty gaskets for the French and Italian market. The
broader product range will allow the Aftermarket segment to unlock further sales potential in the
aforementioned markets. ElringKlinger is in the process of introducing small-batch production with-
in this area at the site operated by ElringKlinger Meillor SAS, Nantiat, France. Additional sales ex-
penses were allocated for the purpose of driving market expansion forward in France and the United
States.
Earnings before taxes fell by 12.7% to EUR 11.7 (13.4) million in the first half of 2013.
stagnation in engineered plastics segment
Supplying a wide range of industries, ElringKlinger’s Engineered Plastics segment, which develops and
produces components made of the high-performance plastic PTFE, generated sales of EUR 46.6 (47.4)
million in the first half of 2013.
The slight year-on-year dip in revenue was attributable primarily to a contraction in business in
Italy, Spain and France as a result of the economic situation in these markets. Demand within the
mechanical engineering industry proved to be particularly weak. Meanwhile, products destined for
the automotive sector felt the more noticeable effects of subdued demand within the Western Europe-
an car manufacturing industry.
I n t e r I m m a n ag e m e n t r e p o r t
09
G r o u p s a l e s by s eG m e n t 1 s t h a l F 2 0 13 (prior year) in %
a F t E R M a R k E t 9.9 (10.3)
S E R v I C E S 0.7 (0.6)
E n G In E E R E d P l a S t I C S 8.0 (8.4)
O R I G In a l E q U IP M E n t 81.0 (80.3)
In d U S t R I a l Pa R k S 0.4 (0.4)

Having been targeted to a large extent at Central Europe, business is now gradually being put on
an international footing. Following the installation of the first production line at the site in Suzhou,
China, a sales team was put together in the United States. The process of setting up the new sales
office as well as the essential preparations for market expansion in North America were associated
with up-front expenses in the first half of the year, which led to a concomitant rise in costs.
The staff profit-sharing bonus agreed for the employees of ElringKlinger Kunststofftechnik GmbH
in respect of the financial year 2012 was recognized in other liabilities in the first quarter of 2013 and
resulted in additional staff costs of EUR 0.8 million.
In total, earnings before taxes generated by the Engineered Plastics segment in the first half of 2013
fell by 16.5% year on year to EUR 7.1 (8.5) million. Cost streamlining helped to improve earnings
before taxes in the second quarter of 2013, compared to both the preceding quarter and the second
quarter of 2012, taking the figure to EUR 4.0 (3.5) million.
downturn in earnings from Industrial parks
Rental income from the Idstein industrial park and Technik-Park Heliport Kft. in Kecskemét-Kádafalva,
Hungary, amounted to EUR 2.1 (2.1) million.
Earnings before taxes declined to EUR 0.1 (0.3) million, particularly due to expenses associated with
renovation work at the Idstein industrial park.
strong demand for engineering services in the field of exhaust technology
There was considerable demand for ElringKlinger’s engineering services in the field of SCR (Selec-
tive Catalytic Reduction) technology aimed at nitrogen oxide reduction as well as for services such as
particle counting for diesel particulate filters. This made a significant contribution to revenue growth
in the Services segment, which rose to EUR 4.1 (3.3) million.
The introduction of the Euro 6 standard for passenger cars and EURO VI for trucks has generated sig-
nificant interest among customers for test stand resources and instrumentation-based analysis servic-
es. Given the more stringent emission standards adopted around the globe, demand for ElringKlinger
services and test stand facilities looks set to remain strong well into the future.
Owing to the high level of capacity utilization within the Services segment, coupled with the process
optimization measures implemented by the company, earnings before taxes rose at a faster rate than
revenue, up 37.5% to EUR 1.1 (0.8) million.
proportion of staff employed abroad exceeds 54%
ElringKlinger recruited additional personnel over the period in response to sales growth and a rise
in production volume. As of June 30, 2013, the headcount stood at 6,434 (6,231), a year-on-year rise
of 203 (3.3%). Most of this increase came in the second quarter, when 121 new employees joined the
Group, primarily on the manufacturing side.
10

The complete takeover of ElringKlinger’s joint venture in Korea effective from February 1, 2013,
added 37 to the total headcount.
If the additional staff gained from this acquisition are excluded, the increase in personnel comes to
2.7%, which is below the rate of organic growth in sales (4.3%).
As of June 30, 2013, the headcount at the Group’s German sites was 2,954 (2,890), equivalent to
45.9% (46.4%) of the total figure. Compared to the previous financial year, this was an increase of
64 employees or 2.2%. ElringKlinger AG, the parent company, had 2,090 (2,043) staff at the end of
the period. Here, additional personnel were recruited in the second quarter of 2013 among others to
prepare for new product launches in the truck segment over the second half of the year.
Outside Germany, the Group’s headcount as of June 30, 2013, was up 139, or 4.2%, on the previous
year. This was mainly attributable to the expansion of capacity in China, the United States, Brazil and
Turkey. Thus, the headcount outside Germany came in at 3,480 (3,341), equivalent to 54.1% (53.6%)
of the Group total.
Gross profit margin up on preceding quarter
The Group can report a robust set of earnings for the first half-year of 2013. Its operating profit
margin for the second quarter was up by 200 basis points (2.0 percentage points) compared to the
preceding quarter.
For the first six months as a whole, the Group’s gross profit margin stood at 28.2% (29.3%). Over the
first three months in particular, this figure was held down by much lower gross margins at the for-
mer Freudenberg companies and the Hummel-Formen Group acquired by the company. The weaker
performance of the Engineered Plastics segment also mainly affected the first quarter.
The second three months brought quarter-on-quarter improvements both from the acquisitions and
the Engineered Plastics segment, allowing ElringKlinger to boost its gross profit margin compared
to the first quarter by 1.5 percentage points to 28.9% (29.1%).
Purchase prices for most of the input materials used by ElringKlinger, especially alloy surcharges
for high-grade steel, remained largely stable over the first half and in some cases actually fell by a
small margin compared to the same period in 2012. By contrast, material prices for polymer granules
remained relatively high. In order to counteract rising procurement costs, ElringKlinger agrees sup-
ply contracts that are as long term as possible. It also optimizes its product designs on a continual basis
and takes advantage of new and less expensive sources.
Another factor that exerted downward pressure on the gross profit margin in the first half of 2013
was the collective pay agreement, which increased salaries for employees in Germany by 4.3% with
effect from May 1, 2012. This produced a substantial year-on-year rise in staff costs, most of which
were attributable to the cost of sales figure. A profit-sharing bonus of EUR 1,300 (1,150) per employee
I n t e r I m m a n ag e m e n t r e p o r t
11

was paid in respect of the previous year to employees at ElringKlinger AG, ElringKlinger Kunstst-
offtechnik GmbH and Elring Klinger Motortechnik GmbH. This generated additional expenses of
EUR 3.7 (3.3) million in the first quarter of 2013.
Overall, the cost of sales rose by 5.2% to EUR 423.7 (402.9) million in the first six months of 2013,
i.e. at a faster rate compared to the increase in sales revenue (3.6%). In the second quarter, the
cost of sales rose by 6.2% to EUR 215.6 (203.0) million, roughly in line with growth in revenue over
the same period.
high research and development ratio provides guarantee of future growth
ElringKlinger spent a total of EUR 30.4 (30.4) million on research and development (R&D) in the
first half of 2013. The amount attributable to the second quarter was EUR 14.5 (15.4) million. The
R&D ratio for the first half of 2013 therefore remained above the 5% threshold at 5.2% (5.3%).
In the first six months of 2013, ElringKlinger AG received government grants totaling EUR 2.2 (1.2)
million for ongoing research and development projects, predominantly in the field of fuel cell tech-
nology. However, the company also incurred expenses at a comparable level for development work
and prototyping.
In the Group’s core business, development teams worked on numerous product variants and new
designs ranging from exhaust gaskets and lightweight plastic modules for the truck segment through
to thermal and acoustic shielding components.
The main focus in the E-Mobility division was on further development projects in the field of cell con-
tact systems for lithium-ion batteries with cylindrical and prismatic cell structures. In this context,
the company has begun to establish a second product line in the area of cell housings. With regard to
fuel cells, the company is pushing ahead with the development and optimization of a fuel cell stack
that can be used to provide on-board electricity for commercial vehicles and combined domestic heat
and power. However, the revenue generated in these promising areas does not yet cover the high
up-front costs.
A total of EUR 3.0 (2.8) million of research and development costs was capitalized in the first six
months of 2013, while the figure for systematic depreciation/amortization stood at EUR 2.7 (2.6) mil-
lion. The bottom-line impact was therefore minimal.
In the period from January to June 2013, selling expenses were scaled back by 1.3% to EUR 39.0
(39.5) million. By contrast, general and administrative expenses rose at a more pronounced rate than
sales, up 6.9% to EUR 24.8 (23.2) million. This rise was mainly due to higher staff costs.
The figure of EUR 5.2 (4.8) million relating to other operating income contains a non-recurring
item of EUR 1.4 million. This amount is linked to the successive takeover of the Korean joint venture
ElringKlinger Korea Co., Ltd. and was accounted for in the first quarter of 2013.
12

ebIt rises to eur 39.3 million in Q2 despite foreign exchange losses
Totaling EUR 111.8 (115.4) million in the first half of 2013, earnings before interest, taxes, depreciation
and amortization (EBITDA) were slightly lower than in the same period a year ago. At EUR 57.5
(58.3) million, the second quarter of 2013 contributed a disproportionately large amount to EBITDA
for the first six months of 2013.
Depreciation/amortization fell by EUR 3.1 million in the first half of 2013, taking the figure to EUR
36.7 (39.8) million. In the second quarter, depreciation/amortization amounted to EUR 18.2 (20.0)
million. Within this context, the purchase price allocations for the Hug Group as well as the Hummel-
Formen Group produced a negative effect of EUR 0.6 million in the first quarter and EUR 0.2 million
in the second quarter.
The Group’s operating result for the first six months of 2013 was slightly weaker than in same period
a year ago. Business relating to truck components has still been sluggish to date. Additionally, the
second quarter saw more pronounced start-up costs within the E-Mobility division relating to serial
production projects that are scheduled for ramp-up towards the end of 2013. At the same time, the
Aftermarket segment put in a weaker performance compared to the same period a year ago. Against
this backdrop, the operating result totaled EUR 74.5 (76.5) million in the first half, which was slightly
down on the previous year’s figure. Having contracted by 14.6% in the first quarter, operating result
rose significantly in the second quarter of 2013. In fact, the Group saw its operating result improve
by 9.9% – faster than revenue in percentage terms – to EUR 41.2 (37.5) million. In this context, the
swing in earnings at Hug Engineering AG made a major contribution to the operating margin, which
rose to 13.6% (13.1%) in the second quarter of 2013.
Earnings before interest and taxes (EBIT) – in contrast to the operating result, this indicator includes
foreign exchange gains and losses – totaled EUR 75.1 (75.6) million in the first six months of 2013.
Whereas EBIT had benefited from foreign exchange gains of EUR 2.5 million in the first quarter, it
was impacted by foreign exchange losses of EUR 1.9 million in the second quarter. Nevertheless,
compared to the preceding quarter, EBIT expanded by EUR 3.5 million to EUR 39.3 (38.3) million in
the second quarter of 2013.
G r o u p e b I t 1 s t h a l F
in EUR million
75.6
90
60
30
0
2012 2013
75.1
I n t e r I m m a n ag e m e n t r e p o r t
13

The Group’s EBIT margin in the first half of 2013 stood at 12.7% (13.3%). In the second quarter, the
EBIT margin rose by 0.5 percentage points quarter on quarter to 13.0% (13.4%). Adjusted for the
dilutive effects attributable to the acquisitions of the former Freudenberg companies and the Hummel-
Formen Group, the EBIT margin for the ElringKlinger Group as a whole reached 13.4% in the second
quarter – despite substantial start-up costs in the E-Mobility division.
net finance costs down due to foreign exchange effects
In the first half of 2013, net finance costs fell by EUR 2.1 million year on year to EUR 5.2 (7.3) million,
primarily as a result of positive foreign exchange effects in the first quarter. In the second quarter,
foreign currency losses resulted in a significant rise in net finance costs compared to the preceding
quarter. Having stood at EUR 0.3 (5.0) million in the first quarter, net finance costs totaled EUR 4.9
(2.3) million in the second quarter.
In 2008, ElringKlinger had originally financed the acquisition of the Swiss SEVEX Group in Swiss
francs. The exchange-rate-induced change in liabilities associated with this loan resulted in positive
currency effects of EUR 1.1 million in total in the first six months of 2013 and EUR 0.7 million in
the second quarter. The loan was fully extinguished in the second quarter of 2013.
In total, foreign exchange gains amounted to EUR 6.3 million in the first half of the year. In paral-
lel, foreign exchange losses totaled EUR 5.7 million, which resulted in a foreign exchange net effect
of EUR 0.6 (-0.9) million.
As regards net interest expenses, ElringKlinger benefited from the decline in interest rates across
the majority of maturities. Therefore, net interest expenses fell to EUR 5.8 (6.3) million in the first
half of 2013.
As a result, earnings before taxes returned to the high level seen in the same period a year ago. They
stood at EUR 69.3 (69.3) million at the end of the first half of 2013. In the second quarter of 2013 the
Group saw its earnings before taxes increase by 2.8% to EUR 36.3 (35.3) million.
Increase in net income attributable to shareholders of elringKlinger aG
In the first six months of 2013, the Group’s tax expenses fell by EUR 2.6 million to EUR 16.1 (18.7) mil-
lion. In the second quarter, income taxes totaled EUR 7.7 (9.3) million. The income tax rate stood at
23.2% (27.0%) in the first half of 2013, which was considerably lower than in the same period a year
ago. The unusually low income tax rate was attributable partly to loss carryforwards of the French
entity ElringKlinger Meillor SAS.
As a result, net income increased at a more pronounced rate of 5.1% to EUR 53.2 (50.6) million in
the first half of 2013. Growth was driven primarily by the more substantial earnings contributions in
the second quarter. During this period, net income rose by 10.0% to EUR 28.6 (26.0) million.
Due to the marked improvement in the earnings contribution of the Swiss Hug Group, net income
attributable to non-controlling interests increased to EUR 3.3 (1.1) million in the first six months of
2013. Of this total, an amount of EUR 2.5 (0.7) million was attributable to the second quarter.
14

Net income attributable to shareholders of ElringKlinger AG stood at EUR 50.0 (49.5) million. In the
second quarter, net income attributable to the shareholders of ElringKlinger AG was up 3.6% year
on year, taking the figure to EUR 26.2 (25.3) million, despite much higher net income attributable to
non-controlling interests (Hug). ElringKlinger increased its ownership interest in Hug Engineering
AG by 25.0% to 93.7% effective from August 1, 2013. Correspondingly, net income attributable to
non-controlling interests will be lower in future.
The number of ElringKlinger shares outstanding remained unchanged year on year at 63,359,990.
Basic and diluted earnings per share amounted to EUR 0.79 (0.78) in the first six months. In the sec-
ond quarter earnings per share rose to EUR 0.41 (0.40).
Financial Position and Cash Flows
The ElringKlinger Group remained solid with regard to its financial position and cash flows, record-
ing an equity ratio of 48.8% and positive operating cash flow of EUR 55.0 million as of June 30, 2013.
total assets expand to eur 1,343.3 million
Total assets held by the ElringKlinger Group rose to EUR 1,343.3 (1,260.8) million as of June 30,
2013. This was attributable primarily to the growth-induced increase in property, plant and equip-
ment as well as trade receivables, particularly at the end of the first quarter of 2013. Compared to
March 31, 2013 (EUR 1,334.3 million), total assets remained largely unchanged.
p r o F I t at t r I b u ta b l e t o s h a r e h o l d e r s o F
e l r I n G K l I n G e r aG 1 s t h a l F
in EUR million
50.049.5
90
60
30
0
2012 2013
I n t e r I m m a n ag e m e n t r e p o r t
15

As a result of investments in new manufacturing systems and buildings, total property, plant and
equipment rose to EUR 580.0 (548.8) million as of June 30, 2013. Compared to December 31, 2012,
the increase was EUR 15.0 million; the figure expanded by EUR 4.0 million compared to March
31, 2013.
In total, non-current assets amounted to EUR 770.7 (723.4) million as of June 30, 2013.
Working capital virtually unchanged
Compared to March 31, 2013, the Group managed to scale back its trade receivables slightly, by EUR
2.0 million, to EUR 222.3 (204.6) million – despite higher sales revenue. At the end of the first quarter
of 2013, receivables had been EUR 38.4 million higher than the figure recorded on December 31, 2012.
As of June 30, 2013, inventories amounted to EUR 236.7 (231.7) million, i.e. only slightly above the
level recorded on December 31, 2012 (EUR 229.6 million). Taking into consideration the increase in
tool stocks accounted for in inventories, up EUR 8.6 million, the level of capital tied up in total inven-
tories would have been lower.
The share of inventories in total assets was 17.6% (18.4%) as of June 30, 2013.
equity ratio remains high
Revenue reserves increased to EUR 446.5 (389.6) million as of June 30, 2013, due to higher alloca-
tions from net income. By contrast, other reserves fell by EUR 11.9 million compared to March 31,
2013, thus standing at minus EUR 6.1 (24.8) million. This was due to foreign exchange translation
differences, which are recognized directly in other reserves and therefore have no influence on
profit or loss.
At EUR 655.8 (625.4) million, equity accounted for by the ElringKlinger Group thus grew at a slower
rate compared to total equity and liabilities. The equity ratio stood at 48.8% (49.6%) and was there-
fore slightly lower than the figure posted on March 31, 2013 (50.1%). Having said that, it was still
well above the minimum rate of 40% that has been defined for the Group as a whole.
Increase in net debt
Bank borrowings were expanded as of June 30, 2013, for the purpose of financing the company’s
growth. Current and non-current financial liabilities stood at EUR 356.5 (342.7) million. The increase
compared to December 31, 2012, was EUR 41.8 million in total. Compared to March 31, 2013, the
figure was up by EUR 27.0 million. In this context, the focus was on signing long-term contracts: non-
current financial liabilities rose to EUR 163.9 (117.6) million as of June 30, 2013, whereas current
financial liabilities fell to EUR 192.6 (225.1) million.
Compared to the figure posted at the end of 2012, the Group’s net debt (current and non-current
financial liabilities less cash) rose by EUR 33.4 million to EUR 293.8 million. Net debt will be gradu-
ally scaled back over the course of the second half of the year.
16

Trade payables increased to EUR 71.4 (52.7) million as of June 30, 2013. Compared to December 31,
2012, the figure rose by EUR 13.3 million, primarily due to revenue growth in Asia and invoicing in
respect of construction work at the new plant in Thale and the logistics facility to be operated at
the site of ElringKlinger Logistic Service GmbH, Rottenburg/Neckar. Compared to March 31, 2013,
the figure was up by EUR 5.2 million or 7.9%. Here, the significant increase in revenue generated by
the Hug Group was one of the key contributors.
Other liabilities amounted to EUR 66.1 (75.8) million as of June 30, 2013, thus returning to the level
recorded at December 31, 2012. At the end of the first quarter of 2013, other liabilities had risen to
EUR 78.3 million, mainly as a result of the staff profit-sharing bonus of EUR 3.7 million and Manage-
ment Board bonuses. These items were paid out in the second quarter of 2013. Additionally, the
final payment of EUR 1.0 million in connection with a warranty incident was made during the second
quarter (Notes, page 47).
As of June 30, 2013, liabilities accounted for 51.2% (50.4%) of total equity and liabilities.
operating cash flow improves to eur 55 million
Although earnings before taxes for the first half of 2013 remained unchanged year on year at EUR
69.3 (69.3) million and depreciation/amortization was slightly lower at EUR 36.7 (39.8) million, the
ElringKlinger Group managed to lift its operating cash flow by EUR 26.6 million to EUR 55.0 (28.4)
million. This was attributable primarily to the expansion of trade payables. At EUR 36.5 (22.5) million,
the second quarter contributed a disproportionately large amount to operating cash flow for the
first six months. In the second quarter, the Group managed to scale back the level of capital tied up
in trade receivables, despite growth in sales revenue.
n e t C a s h F r o m o p e r at I n G aC t I v I t I e s 1 s t h a l F
in EUR million
60
40
20
0
2012 2013
55.0
28.4
I n t e r I m m a n ag e m e n t r e p o r t
17

The increase in inventories and trade receivables as well as other assets not attributable to investing
or financing activities exerted downward pressure on operating cash flow during the first half of
2013. These items were expanded by EUR 41.7 (32.7) million over the course of this period. In the
second quarter of 2013, by contrast, they were scaled back by EUR 1.2 million, primarily as a result
of lower trade receivables.
The marked improvement in cash flow from operating activities was attributable mainly to the in-
crease by EUR 13.9 (-29.6) million in trade payables and other liabilities not attributable to investing
or financing activities during the first six months of 2013. In the second quarter, however, they re-
ceded again by EUR 5.7 (-13.8) million, which was mainly due to the direction taken by other liabilities.
Owing to the payout of the staff profit-sharing bonus of EUR 3.7 million and the final payment of
EUR 1.0 million in connection with a warranty incident (Notes, page 47), other liabilities fell sharply.
Provisions fell by a net amount of EUR 2.6 million in the first six months of 2013 and by EUR 1.5 mil-
lion in the second quarter. In the first half of 2012, by contrast, provisions had been increased by
EUR 0.8 million in total.
At EUR 18.2 (22.0) million, income tax payments were considerably lower than in the same period
a year ago. In the first half of 2012, ElringKlinger AG had made a payment of tax arrears in respect of
the financial year 2011. For this reason, income tax payments had reached an above-average level.
Cash flow from investing activities at normal level
In the first half of 2013, ElringKlinger invested EUR 54.2 (45.4) million in property, plant and equip-
ment as well as investment property and intangible assets. A total of EUR 29.0 (24.5) million of the
cash outflow relating to investments was attributable to the second quarter. The investment ratio (pay-
ments for investments in relation to sales revenue) stood at 9.2% (8.0%) in the first half of 2013
and at 9.6% (8.6%) in the second quarter, i.e. within the long-term range of 8 to 10% targeted by the
company.
The majority of investments was attributable to the international subsidiaries, particularly those
based in Asia and North America. The focus was on machinery and equipment for newly launched
serial production projects.
At ElringKlinger AG, capital expenditure was directed primarily at an extension built at the new
plant in Thale, which has now commenced operations.
ElringKlinger AG paid EUR 3.2 million for the acquisition of the remaining 50% interest in the for-
mer South Korean joint venture ElringKlinger Korea Co., Ltd. Payment of the purchase consideration
was completed back in the first quarter of 2013.
18

Net cash used in investing activities thus amounted to EUR 57.1 (45.3) million in total in the first half
of 2013 and EUR 29.1 (24.4) million in the second quarter of 2013.
Owing to the significant improvement in operating cash flow, ElringKlinger recorded positive
operating free cash flow (cash flow from operating activities less cash flow from investing activities,
adjusted for payments in respect of acquisitions) of EUR 1.1 (-15.6) million in the first half of 2013.
This corresponds to a year-on-year increase of EUR 16.7 million. In the second quarter of 2013, oper-
ating free cash flow totaled EUR 7.5 (-1.9) million.
reduction in cash flow from financing activities
In the second quarter of 2013, the company executed its dividend payout to the shareholders of
ElringKlinger AG. The dividend payment to shareholders and non-controlling interests totaled
EUR 29.7 (37.9) million in the reporting period. In the previous year, the total dividend payout had
been higher due to an extra dividend granted in connection with the sale of the Ludwigsburg
in dustrial park.
In the first six months of 2013, the ElringKlinger Group took on financial liabilities of EUR 94.9 (73.7)
million, EUR 75.6 (60.7) million of which in the second quarter, in particular for the interim financing
of the company’s dividend payout. In parallel, it scaled back loans by EUR 53.0 (21.0) million. In net
terms, therefore, financial liabilities rose by EUR 41.9 (52.7) million. Net cash from financing activi-
ties totaled EUR 11.8 (14.4) million in the first half of 2013.
Cash held by the ElringKlinger Group amounted to EUR 62.7 (63.5) million at the end of the first half
of 2013.
Opportunities and Risks
As regards the assessment of opportunities and risks for the ElringKlinger Group, there were no
significant changes to the details discussed in the 2012 Annual Report of the ElringKlinger Group
(Page 107 et seqq.).
There are currently no identifiable risks that might jeopardize the future existence of the Group
as a going concern, either in isolation or in conjunction with other risk factors.
The report on opportunities and risks can be accessed on the website of ElringKlinger at
www.elringklinger.de/ar2012/report-on-opportunities-and-risks.
I n t e r I m m a n ag e m e n t r e p o r t
19
Outlook
Outlook – Market and Sector
Weaker growth prospects for global economy
The outlook for the world economy has deteriorated slightly over the course of the year to date.
Encouragingly, the economic recovery in the US and state-led demand stimuli in China are proving
effective. When it comes to the eurozone, however, there is evidence to suggest that the route out
of recession will be longer than previously anticipated. At the same time, some of the emerging coun-
tries are having to contend with weaker growth rates. In July, the International Monetary Fund
(IMF) therefore revised downward its outlook for 2013 as a whole, suggesting that the world economy
would see growth of just 3.1% rather than the rate of 3.3% originally projected. The IMF’s growth
outlook for 2014 stands at 3.8%.
In the eurozone, the agenda continues to be dominated by the sovereign debt crisis. The fundamental
problems underlying the monetary union have remained largely unresolved. The eurozone has been
slow to emerge from the recession and confidence levels throughout the region have increasingly been
tinged with skepticism in recent months. The IMF forecasts moderate growth in economic output
in the eurozone for the remainder of the year. However, 2013 as a whole will see a further decline in
the gross domestic product (GDP) of 0.6%.
Germany remains an anchor of stability for Europe. Climbing to 105.9 points in June, the ifo Business
Climate Index shows signs of improvement. Regardless of the more pronounced uncertainties within
the eurozone, the IMF has projected GDP growth of 0.3% for Germany in 2013 as a whole.
The US economy remains on track for growth despite the government’s budget restraint. Private
demand in the United States has retained its stability, while a blossoming realty market and the Fed’s
easy monetary policy have been underpinning the economy. The IMF has projected GDP growth of
1.7% for the United States in 2013. The IMF’s outlook for Brazil, meanwhile, stands at 2.5%.
Although the double-digit growth rates achieved by China in recent years appear to be a thing of
the past in 2013, the local economy is nevertheless likely to stabilize at a high level. The Chinese
economy is expected to expand by 7.8%, which more or less corresponds to the corridor targeted by
the central government. GDP in India is projected to grow by 5.6%. According to IMF data, the
burgeoning ASEAN region will also expand by 5.6%.
The expansive route chosen by the Japanese central bank has produced accelerated growth in re-
cent months. Benefiting from a visibly weaker yen, the country’s exports in particular have surged.
Japan’s GDP is expected to increase by 2.0% in 2013.
Global automotive markets continue to paint a mixed picture
The international vehicle markets will remain bifurcated during the remainder of the year. While the
expansive emerging markets as well as North America provide a positive impetus, Western Europe
is only gradually beginning to find its footing again, having plunged to a 25-year low in terms of new
vehicle registrations.
20
As regards the performance of the automotive market in 2013 as a whole, the ElringKlinger Group
has retained its forecast of anything from relative stagnation to moderate growth. In this context,
the Group is of the opinion that the severe weakness in vehicle demand in Western Europe can be
compensated for by car market growth in Asia and North America.
The automobile markets in Western Europe are likely to be in a better state in the second half of 2013
than in the first two quarters of the year. Having said that, the volume of passenger cars sold is ex-
pected to contract by a further 5% in 2013 as a whole. Car production figures for the year as a whole
are also likely to decline.
The Verband der Automobilindustrie (VDA), Germany’s association of the automobile industry,
anticipates that new car registrations will fall short of the figure recorded in the previous year. After
3.1 million new car registrations in 2012, it has projected a figure of between 2.9 and 3.0 million
units for the current year. As foreign trade within the recession-hit eurozone is down significantly,
German car exports are also likely to see a downturn, despite strong demand from Asia and the
United States; in total, they are expected to fall by around 2% compared to the previous year. On this
basis, domestic car production will fail to reach the level of 2012 (5.4 million vehicles) and is likely
to total 5.2 million units.
The buoyant performance of the US vehicle market looks set to continue over the remainder of the
year. In June, the seasonally adjusted annualized rate of new-vehicle sales within the passenger car
and light truck segment reached 16.0 million – the highest level since December 2007. Sales volumes
for 2013 as a whole are expected to rise by between 6 and 7%. Production figures are projected to
increase by a similarly high rate.
In Brazil, meanwhile, the relatively cautious outlook presented at the beginning of the year has im-
proved recently. Forecasts for the annual period as a whole range from stagnation to a slight increase
in vehicle sales.
China remains the driving force behind growth within the automotive industry. On the back of a strong
first half, there is every chance that vehicle sales will grow by more than 10% in 2013 as a whole.
Production levels are expected to rise at a similar percentage rate. Given the very low vehicle density,
China as well as the booming ASEAN-10 states will remain highly attractive growth markets for
the automotive industry in the years to come.
Both India and Japan are expected to see a downturn in demand for new cars in 2013. Whereas India
is likely to see a percentage downturn in the middle of the single-digit range, Japan is expected
to be hit by a double-figure decline in percentage terms. In this context, it should be noted that the
Japanese market had been dominated by the catch-up effects of recovery in 2012 as it gained ground
following the natural disaster in 2011.
Commercial vehicle business slow to achieve turnaround
Given the current economic situation in Western Europe, in particular, the future direction of the
commercial vehicle market remains difficult to predict. Based on incoming orders, however, there is
evidence to suggest that business within this area may pick up over the course of the second half
I n t e r I m m a n ag e m e n t r e p o r t
21

of 2013. In Europe, the introduction of the EURO VI standard at the beginning of 2014 could prompt
advance purchases.
Order intake for Class 8 trucks in the United States has also seen steady improvement recently.
It remains to be seen to what extent the declines recorded in the first half of 2013 can be offset by an
upturn in demand. The US market for heavy trucks is likely to shrink by 8% in 2013.
Asia and Latin America are expected to see an improvement in commercial vehicle demand for the
year as a whole.
Outlook – Company
Further growth in order intake
Following on from an increase in the volume of new orders in the first quarter to EUR 333.9 (269.4)
million, order intake in the second quarter of 2013 stood at EUR 374.1 (337.1) million, up 11.0% on
the same period in 2012.
At the end of the first half-year, the ElringKlinger Group had a solid pipeline of orders to support
its planned sales growth of between 5% and 7% for the year as a whole. As of June 30, 2013, the
value of order backlog stood at EUR 573.8 (485.1) million, up 18.3% on the equivalent figure for
the previous year.
Improved earnings performance by acquired companies – successful turnaround at hug
Overall, the marked dilutive effects on the Group’s profit margins attributable to the consolidation
of companies acquired in 2011 and 2012 will be less pronounced in 2013. In fiscal 2012, these acqui-
sitions had still contributed negative aggregate earnings before taxes.
Hug Engineering AG is expected to deliver a significant turnaround in earnings over the 2013 finan-
cial year as a whole.
After a strong first half in 2013, ElringKlinger now anticipates a substantial rise in the exhaust
specialist’s year-end EBIT to over EUR 7.0 (-3.0) million. It should be noted that Hug’s business model
is partly based on project work, and its performance therefore tends to fluctuate more widely during
the year than is the case for series production in the automotive field. Despite the ongoing purchase
price allocation of around EUR 1.5 million, the Hug Group’s EBIT margin should be on a par with
the Group by as early as 2013.
The US retrofit market continues to thrive as a result of the CARB legislation and is generating a high
level of demand for mobiclean RTM diesel particulate filters. Additionally, further projects to equip
vessels on inland waterways with complete nauticleanTM exhaust gas purification systems are currently
in progress and will contribute to the Group’s sales figures over the rest of the year. There is also
22

exciting potential with exhaust purification technology at natural gas power stations. This market is
set to expand due to the widespread availability of inexpensive natural gas in North America. Hug is
also working on a series of prototypes and model systems for applications in the truck category
and for construction machinery.
Production has now started at the newly expanded Thale facility in the German state of Saxony-
Anhalt. This site is designed to act as an extended workbench for Hug Engineering AG, while also
limiting the negative impact of the strong Swiss franc on Hug’s operating margin. The cutting-
edge technology used in Thale to manufacture housings and can systems will also help to scale
back production costs.
optimized cost structures at former Freudenberg site in France
The main focus with the regard to the former Freudenberg Group companies lies on improving their
financial performance.
Cost-reduction measures implemented at the ElringKlinger Meillor SAS site in Nantiat/Chamborêt,
France, in the first half of 2013 will begin to have an impact in the second half of the year. Given the
continued weakness of the French car market, however, the earnings situation at ElringKlinger
Meillor SAS in 2013 is only expected to show a gradual and moderate improvement. The restructuring
expenses incurred as a result of measures to streamline the workforce were charged to profit and
loss and included in other liabilities already in the first quarter. Capacity utilization will be improved
following the setting up of a special manufacturing line for small production lots in the Aftermarket
segment. The new product portfolio for French vehicles will make a growing contribution to the After-
market segment’s sales figures.
On balance, for fiscal 2013 as a whole, earnings before taxes at the former Freudenberg companies
are expected to be at a comparable level as in the previous year.
Continued focus on cost management
In keeping with its streamlining efforts, ElringKlinger is committed to optimizing the Group’s pro-
duction processes. Thanks to the increased use of process automation, advanced tooling technology
and intelligent production methods, the Group has seen a continuous reduction in costs. The aim
remains to improve efficiency by at least 3% per annum. Over the remainder of the year, the main
focus of these streamlining programs will be directed at subsidiaries and investees.
Prices for some of the key commodities and materials of relevance to ElringKlinger’s operations,
particularly alloy surcharges for high-grade steel, have remained unchanged or have even fallen
slightly in the financial year to date. By contrast, revenue generated by the company from discard -
ed cut-outs has declined. Overall, based on the supply agreements concluded to date and on current
spot market prices, ElringKlinger anticipates that the overall price situation will largely remain
stable in the second half of 2013, although this may vary according to the type of material required.
Depending on future developments in the global economy and the corresponding demand for
I n t e r I m m a n ag e m e n t r e p o r t
23

commodities, it is not possible to completely rule out price increases for some of the materials used
by the company. For example, the company is likely to be faced with a gradual rise in the price of
polymer granules, for which demand is on the increase.
As a result of the collective wage agreement in the metal and electrical engineering industry, salaries
and wages at almost all German sites operated by the ElringKlinger Group rose by 3.4% effective
from July 1, 2013. The Group employs around 46% of its workforce at sites in Germany. In view of
the competitive climate at an international level and sustained downward pressure on prices, wage
rises will have to be offset by streamlining measures and cost savings.
Against the backdrop of anticipated revenue growth in 2013, the Group plans to recruit additional
personnel. However, any expansion of the workforce will be less pronounced relative to revenue
growth. It should be noted that ElringKlinger has a clearly defined goal of keeping any percentage
increase in staff costs below the growth rate for sales revenue. Due to the high level of wages in
Germany, in future the emphasis will be on expanding the company’s workforce primarily at more
cost-effective sites abroad.
Further process optimization measures and the increasing centralization of administrative activities
at parent company level will help to limit the impact of general and administrative expenses, which
rose by an above-average margin in 2012 and the first half of 2013. The aim is therefore to keep the
percentage increase in general and administrative expenses below the level of growth in sales.
Increase in revenue and earnings for current financial year
Based on the economic projections outlined above, the company confirms its forecast for the annual
period as a whole. The ElringKlinger Group plans to increase sales revenue by 5 to 7% in 2013 in
terms of organic growth. Should global car production only stagnate in 2013, revenue growth is more
likely to be positioned at the lower end of this range.
The operating margin attributable to the ElringKlinger Group will be diluted in 2013 as a result of
the as yet below-average aggregated profit margins of the acquired entities and the associated pur-
chase price allocations. However, thanks to the measures outlined earlier, the level of dilution will be
less pronounced in 2013.
In addition, substantial up-front costs are being incurred in the E-Mobility division, which will see
the launch of several projects in the second half of this year.
ElringKlinger anticipates that earnings before interest and taxes (EBIT), adjusted for one-time
effects, will expand at a faster percentage rate relative to sales revenue. For the financial year 2013
as a whole, the adjusted figure for EBIT is expected to lie in the range of EUR 150 to 155 million
(EUR 136.0 million in 2012).
24

Investment ratio to be scaled back to normal level
Recent years have been dominated by significant investments in new production plants as well as
the funding of large-scale projects. As a result, the investment ratio at Group level, i.e. investments
as a proportion of Group sales, temporarily rose to levels of up to 17%. In 2013 and 2014, cash
outflows for investments in property, plant and equipment will be scaled back to the normal level
pursued in the long term. On the basis of the current project and order situation, the Group antici-
pates that the investment ratio will probably range between 8 and 10%. As a general rule, newly
acquired large-scale projects or the introduction of entirely new products may necessitate an in-
crease in the capital expenditure budget.
After a figure of EUR 103.1 million in 2012, the ElringKlinger Group has earmarked investments
of around EUR 100 million in 2013 as a whole for property, plant and equipment and for investment
property. Cash outflows for these investments are directed primarily at new production buildings,
machinery and operating systems required for scheduled production ramp-ups as well as at stream-
lining projects.
Over the coming years, growth within the automobile industry will be driven primarily by the markets
in Asia. Accordingly, the Group’s investment strategy for 2013 and thereafter will concentrate on
further expansion in this region. ElringKlinger has begun work on a new factory at its Gumi site in
South Korea with the capability to manufacture the full range of product groups. Around EUR 10
million has been earmarked for investment in buildings and production equipment. This will help
ElringKlinger to expand its business relationship with Korean vehicle manufacturers and prime it -
self on the production side for growth in the years ahead. The new plant in Indonesia is to be equipped
with additional production machinery. A new development center is being set up at the Group’s site
in Suzhou, China, along with a series of additional production lines.
In 2013, around EUR 6 million in total are invested in the new production building at the site in
Thale, Germany. Operating as an “extended workbench” for the Group’s exhaust specialist Hug
Engineering AG, the plant is ready for the production of larger series. A key factor contributing to
automation and helping to reduce costs in the area of exhaust technology is the state-of-the-art
machinery used for precision welding as well as for particulate filter canning and for the manufac-
ture of housings used in complete exhaust gas purification systems.
A further EUR 8 million are invested in the construction of a new logistics center at the Group’s
Rottenburg/Neckar site in Germany. When it is completed, this facility will assemble spare part sets
for the Aftermarket business as part of a highly automated system.
Based on its current financial performance, financial position and cash flows, the ElringKlinger
Group believes it is favorably positioned to achieve its short- and long-term corporate targets.
I n t e r I m m a n ag e m e n t r e p o r t
25

Events after the Reporting Period
Effective from August 1, 2013, ElringKlinger AG acquired an additional 24.99% of the interests in
exhaust gas purification specialist Hug Engineering AG from the former owner family and one other
partner in the company. ElringKlinger thus holds 93.67% of the interests in the Swiss subsidiary,
the majority acquisition of which took place in May 2011.
In 2012, the Hug Group generated revenue of EUR 36.6 million and a loss before taxes of EUR 3.5
million. The earnings situation improved significantly in the first half of 2013, with revenue increa-
sing to EUR 29.2 million and earnings before taxes totaling EUR 4.8 million. The purchase price
payable for the additional ownership interest is around CHF 5.7 million (EUR 4.6 million).
It is the declared aim of ElringKlinger AG to acquire the non-controlling interests within the Group
to the largest extent possible. The latest transaction has helped to strengthen the company‘s position
in the rapidly growing area of exhaust gas purification technology, the objective being to introduce
technical innovations to the market even faster, open up new fields of application and move into pre-
viously untapped regions.
Committed to gradually scaling back non-controlling interests, effective from August 1, 2013,
ElringKlinger AG also acquired the remaining 10% interest in Elring Parts Ltd., United Kingdom.
Thus, ElringKlinger became the sole owner of the aforementioned company, which operates in
the aftermarket sector. The purchase consideration for the remaining 10% interest is approx. GBP
0.6 million (EUR 0.7 million).
Beyond this, no other significant events requiring disclosure occurred after the reporting period.
Dettingen / Erms, August 9, 2013
The Management Board
Dr. Stefan Wolf Theo Becker Karl Schmauder
26

ElringKlinger and the Capital Markets
stock rally dampened by announcement of reduced us bond buying
Over the course of the second quarter of 2013 stock markets were fueled to a large extent by the
expansive monetary policy adopted by central banks around the globe. The European Central Bank,
for instance, lowered its benchmark interest rate by 25 basis points to 0.50%. At the beginning of
the second quarter, robust economic data in the US and more stable economic indicators in the euro-
zone also helped to underpin the upward trend taken by international stock markets. The Dow Jones
Index reached a new high of 15,409 points. In May 2013, Germany’s blue chip index, DAX, climbed
to its all-time high of 8,530 points.
However, the stock market rally came to an abrupt end at the beginning of June following an unex-
pected announcement by the Fed that it may scale back its US bond-purchase program. The DAX
relinquished much of its gains and closed the second quarter of 2013 at 7,959 points. Over the entire
first half, however, the index still managed to record growth of 4.6%. The MDAX put in a much
stronger performance. By the end of June it was up by a solid 15.0% on the figure recorded at the
beginning of the year.
elringKlinger share price up 9% in Q2
Following the announcement of 2012 annual results that fell slightly short of expectations,
ElringKlinger’s stock performance was influenced to a large extent by profit-taking towards the end
of the first quarter of 2013. Against this backdrop, the company’s share price fell to EUR 22.46
at the beginning of April, its lowest level in the year to date.
e l r I n G K l I n G e r ’s s h a r e p r I C e p e r F o r m a n C e ( X e t r a ) s I n C e Ja n . 1 , 2 0 13
compared to MdaX and daX
El ring klin ger MdaX daX
120
110
100
90
Ja n F e b m a r a p r m ay J u n J u l
2013
E l r i n g K l i n g E r a n d t h E C a p i ta l M a r K E t s
27

Trading in what was generally considered a favorable environment, ElringKlinger managed to fully
offset its market losses incurred over the first three months of 2013, following the announcement
in May of positive quarterly results. Over the course of the second quarter ElringKlinger’s share price
rose by 8.5%. The stock thus outperformed both the DAX (+ 2.1%) and the MDAX (+ 2.9%) by a con-
siderable margin. As of June 30, 2013, ElringKlinger’s share price stood at EUR 25.64, up 0.6% on
the figure recorded at the beginning of the year. Thus, the company’s market capitalization moved
beyond the threshold of EUR 1.6 billion.
At the beginning of July, the stock freed itself from a temporary dip and subsequently managed to
breach the resistance line of EUR 28.00 towards the end of July. On July 24, 2013, the company’s
shares recorded a new annual high of EUR 28.75.
trading volume remains low
The average trading volume of ElringKlinger shares remained relatively low over the course of the first
half of 2013. This coincided with a significant decline in trading volumes across the stock markets in
general. Additionally, a large proportion of the freefloat shares are held by investment companies with
a long-term approach. Against this backdrop, the average volume of shares traded per day fell to
96,600 (167,200) units. The average daily trading value was EUR 2.5 (3.6) million. Having said that,
ElringKlinger shares can still be considered highly tradable, particularly in relation to the size of
the company.
ongoing dialog with the capital markets
During the second quarter of 2013, ElringKlinger maintained its close dialog with both institutional
investors and financial analysts as well as private investors. The company organized a number of
one-on-one and group meetings at various conferences and roadshows, including venues in Baden-
Baden, Munich, Geneva, Zurich, London, Edinburgh and Warsaw.
In April 2013, ElringKlinger took part in the 2nd Investor Forum of the Stuttgart Stock Exchange as
a member of the interest group of Baden-Württemberg Small Caps (BWSC: www.bwsc.de). The asset
managers and family offices attending the event were able to find out first-hand about the product
portfolio and strategy of ElringKlinger AG, in addition to discussing specific questions with company
representatives in person.
In autumn, private investors will again have the opportunity to engage in a direct dialog with
Dr. Stefan Wolf (“Chat with the CEO”). In October, ElringKlinger will be hosting another 30-minute
online chat during which those taking part can put their questions directly to the com pany’s Chief
Executive Officer. The chat can be accessed via the company website (www.elringklinger.de/de/
chat-mit-dem-ceo). Those unable to take part in the live-chat can submit their questions beforehand
via an online form. These questions will then be answered during the chat.
28
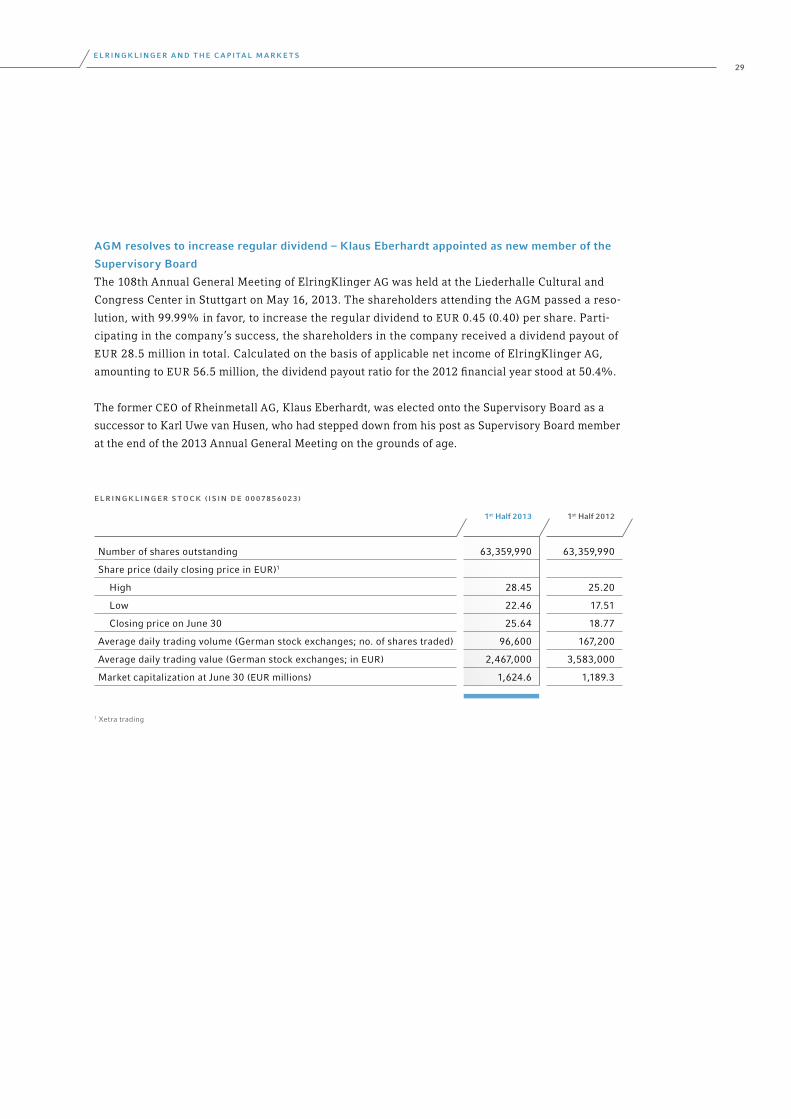
aGm resolves to increase regular dividend – Klaus eberhardt appointed as new member of the
supervisory board
The 108th Annual General Meeting of ElringKlinger AG was held at the Liederhalle Cultural and
Congress Center in Stuttgart on May 16, 2013. The shareholders attending the AGM passed a reso-
lution, with 99.99% in favor, to increase the regular dividend to EUR 0.45 (0.40) per share. Parti-
cipating in the company’s success, the shareholders in the company received a dividend payout of
EUR 28.5 million in total. Calculated on the basis of applicable net income of ElringKlinger AG,
amounting to EUR 56.5 million, the dividend payout ratio for the 2012 financial year stood at 50.4%.
The former CEO of Rheinmetall AG, Klaus Eberhardt, was elected onto the Supervisory Board as a
successor to Karl Uwe van Husen, who had stepped down from his post as Supervisory Board member
at the end of the 2013 Annual General Meeting on the grounds of age.
e l r I n G K l I n G e r s t o C K ( I s I n d e 0 0 0 7 8 5 6 0 2 3 )
1st half 2013 1st half 2012
number of shares outstanding 63,359,990 63,359,990
Share price (daily closing price in EUR)1
high 28.45 25.20
low 22.46 17.51
Closing price on June 30 25.64 18.77
average daily trading volume (German stock exchanges; no. of shares traded) 96,600 167,200
average daily trading value (German stock exchanges; in EUR) 2,467,000 3,583,000
Market capitalization at June 30 (EUR millions) 1,624.6 1,189.3
1 Xetra trading
E l r i n g K l i n g E r a n d t h E C a p i ta l M a r K E t s
29
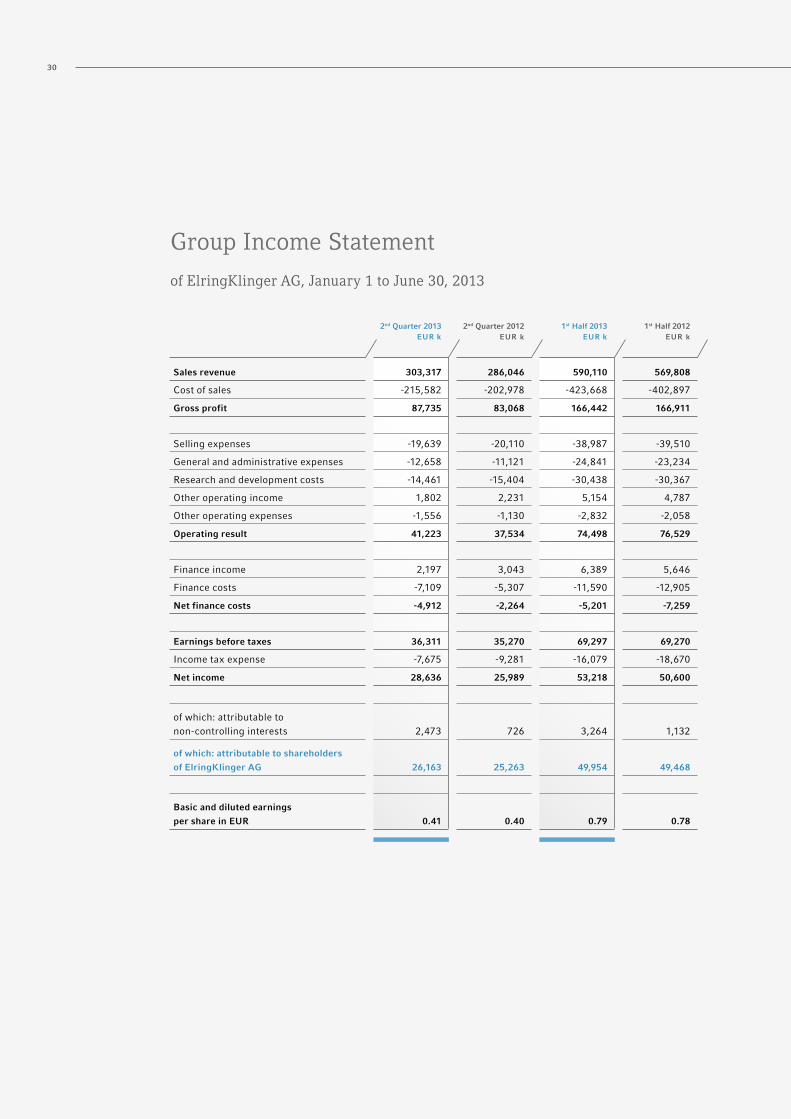
Group Income Statement
of ElringKlinger AG, January 1 to June 30, 2013
30
2nd Quarter 2013eur k
2nd Quarter 2012eur k
1st half 2013eur k
1st half 2012eur k
sales revenue 303,317 286,046 590,110 569,808
Cost of sales -215,582 -202,978 -423,668 -402,897
Gross profit 87,735 83,068 166,442 166,911
Selling expenses -19,639 -20,110 -38,987 -39,510
General and administrative expenses -12,658 -11,121 -24,841 -23,234
Research and development costs -14,461 -15,404 -30,438 -30,367
Other operating income 1,802 2,231 5,154 4,787
Other operating expenses -1,556 -1,130 -2,832 -2,058
operating result 41,223 37,534 74,498 76,529
Finance income 2,197 3,043 6,389 5,646
Finance costs -7,109 -5,307 -11,590 -12,905
net finance costs -4,912 -2,264 -5,201 -7,259
earnings before taxes 36,311 35,270 69,297 69,270
Income tax expense -7,675 -9,281 -16,079 -18,670
net income 28,636 25,989 53,218 50,600
of which: attributable to non-controlling interests 2,473 726 3,264 1,132
of which: attributable to shareholders
of elringKlinger aG 26,163 25,263 49,954 49,468
basic and diluted earnings
per share in eur 0.41 0.40 0.79 0.78

I n t e r I m F I n a n c I a l S tat e m e n t S
31
Group Statement of Comprehensive Income
of ElringKlinger AG, January 1 to June 30, 2013
2nd Quarter 2013eur k
2nd Quarter 2012eur k
1st half 2013eur k
1st half 2012eur k
net income 28,636 25,989 53,218 50,600
actuarial losses from pension commitments, net after taxes 0 0 0 0
Gains and losses that cannot be
reclassified to profit or loss
in subsequent periods 0 0 0 0
Currency translation difference -12,081 5,863 -8,051 2,970
Gains and losses that can be
reclassified to profit or loss
in subsequent periods -12,081 5,863 -8,051 2,970
other comprehensive income after taxes -12,081 5,863 -8,051 2,970
total comprehensive income 16,555 31,852 45,167 53,570
of which: attributable to non-controlling interests 2,280 1,122 4,170 1,826
of which: attributable to shareholders
of elringKlinger aG 14,275 30,730 40,997 51,744

32
Group Statement of Financial Position
of ElringKlinger AG, as at June 30, 2013
June 30, 2013eur k
dec. 31, 2012eur k
June 30, 2012eur k
assets
Intangible assets 138,822 135,989 133,619
Property, plant and equipment 580,012 565,000 548,831
Investment property 13,068 13,329 13,653
Financial assets 2,082 1,637 1,623
non-current income tax assets 2,824 2,830 3,609
Other non-current assets 2,619 2,737 1,185
deferred tax assets 31,298 29,552 20,875
non-current assets 770,725 751,074 723,395
Inventories 236,699 229,586 231,659
trade receivables 222,335 185,850 204,564
Current income tax assets 3,019 2,208 1,781
Other current assets 47,813 45,351 35,869
Cash 62,693 54,273 63,532
Current assets 572,559 517,268 537,405
non-current assets held for sale and discontinued operations 0 249 0
1,343,284 1,268,591 1,260,800

I n t e r I m F I n a n c I a l S tat e m e n t S
33
June 30, 2013eur k
dec. 31, 2012eur k
June 30, 2012eur k
lIabIlItIes and eQuIty
Share capital 63,360 63,360 63,360
Capital reserves 118,238 118,238 118,238
Revenue reserves 446,546 424,631 389,566
Other reserves -6,135 3,048 24,774
equity attributable to the shareholders of elringKlinger aG 622,009 609,277 595,938
non-controlling interest in equity 33,750 30,978 29,490
equity 655,759 640,255 625,428
Provisions for pensions 102,182 101,559 80,073
non-current provisions 10,481 11,121 7,835
non-current financial liabilities 163,868 130,993 117,578
deferred tax liabilities 46,442 46,781 45,555
Other non-current liabilities 5,092 10,149 15,151
non-current liabilities 328,065 300,603 266,192
Current provisions 17,491 18,409 16,457
trade payables 71,433 58,065 52,658
Current financial liabilities 192,620 183,716 225,149
tax payable 16,872 11,513 14,276
Other current liabilities 61,044 56,030 60,640
Current liabilities 359,460 327,733 369,180
1,343,284 1,268,591 1,260,800

Group Statement of Changes in Equity
of ElringKlinger AG, January 1 to June 30, 2013
shareCapitaleur k
Capital reserves
eur k
revenuereserves
eur k
actuarial gains and losses
from pensioncommit ments,
net*eur k
equity impactof controlling
interestseur k
Currency translation
differences*eur k
equity attributable
to the shareholders of
el ring Klin ger aGeur k
non-controlling interests in equity
eur k
Groupequityeur k
balance as of dec. 31, 2011 / balance as of Jan. 1, 2012 63,360 118,238 376,847 -8,287 -1,484 31,979 580,653 29,458 610,111
dividend distribution -36,749 -36,749 -1,175 -37,924
Purchase of shares from controlling interests 290 290 -619 -329
total comprehensive income 49,468 2,276 51,744 1,826 53,570
net income 49,468 49,468 1,132 50,600 Other comprehensive income 2,276 2,276 694 2,970
balance as of June 30, 2012 63,360 118,238 389,566 -8,287 -1,194 34,255 595,938 29,490 625,428
balance as of dec. 31, 2012 / balance as of Jan. 1, 2013 * 63,360 118,238 424,631 -23,866* -833 27,748* 609,277 30,978 640,255
dividend distribution -28,512 -28,512 -1,138 -29,650
Change in scope of consolidated financial statements 473 22 495 81 576
Purchase of shares from controlling interests -248 -248 -341 -589
total comprehensive income 49,954 -8,957 40,997 4,170 45,167
net income 49,954 49,954 3,264 53,218 Other comprehensive income -8,957 -8,957 906 -8,051
balance as of June 30, 2013 63,360 118,238 446,546 -23,844 -1,081 18,791 622,009 33,750 655,759
* a different presentation was selected for Other reserves. Figures as of dec. 31, 2012 have been adjusted.
34

shareCapitaleur k
Capital reserves
eur k
revenuereserves
eur k
actuarial gains and losses
from pensioncommit ments,
net*eur k
equity impactof controlling
interestseur k
Currency translation
differences*eur k
equity attributable
to the shareholders of
el ring Klin ger aGeur k
non-controlling interests in equity
eur k
Groupequityeur k
balance as of dec. 31, 2011 / balance as of Jan. 1, 2012 63,360 118,238 376,847 -8,287 -1,484 31,979 580,653 29,458 610,111
dividend distribution -36,749 -36,749 -1,175 -37,924
Purchase of shares from controlling interests 290 290 -619 -329
total comprehensive income 49,468 2,276 51,744 1,826 53,570
net income 49,468 49,468 1,132 50,600 Other comprehensive income 2,276 2,276 694 2,970
balance as of June 30, 2012 63,360 118,238 389,566 -8,287 -1,194 34,255 595,938 29,490 625,428
balance as of dec. 31, 2012 / balance as of Jan. 1, 2013 * 63,360 118,238 424,631 -23,866* -833 27,748* 609,277 30,978 640,255
dividend distribution -28,512 -28,512 -1,138 -29,650
Change in scope of consolidated financial statements 473 22 495 81 576
Purchase of shares from controlling interests -248 -248 -341 -589
total comprehensive income 49,954 -8,957 40,997 4,170 45,167
net income 49,954 49,954 3,264 53,218 Other comprehensive income -8,957 -8,957 906 -8,051
balance as of June 30, 2013 63,360 118,238 446,546 -23,844 -1,081 18,791 622,009 33,750 655,759
other reserves
I n t e r I m F I n a n c I a l S tat e m e n t S
35

2nd Quarter 2013eur k
2nd Quarter 2012eur k
1st half 2013eur k
1st half 2012eur k
Earnings before taxes 36,311 35,270 69,297 69,270
depreciation/amortization (less write-ups) of non-current assets 18,208 20,026 36,670 39,788
net interest 2,976 3,030 5,784 6,292
Change in provisions -1,514 614 -2,595 805
Gains/losses on disposal of non-current assets -71 279 -1,530 134
Change in inventories, trade receivables and other assets not resulting from financing and investing activities 1,192 -4,991 -41,688 -32,740
Change in trade payables and other liabilities not resulting from financing and investing activities -5,723 -13,808 13,910 -29,600
Income taxes paid -10,191 -16,402 -18,210 -21,968
Interest paid -2,625 -2,627 -4,023 -4,638
Interest received 60 57 115 100
Other non-cash expenses/income -2,095 1,070 -2,756 944
net cash from operating activities 36,528 22,518 54,974 28,387
Proceeds from disposals of property, plant and equipment, intangible assets and investment property 296 97 635 184
Proceeds from disposals of financial assets 0 0 215 1,181
Payments for investments in intangible assets -1,718 -1,761 -4,088 -3,220
Payments for investments in property, plant and equipment and investment property -27,301 -22,718 -50,112 -42,140
Payments for investments in financial assets -343 0 -565 -8
Payments for the acquisition of subsidiaries, less cash 0 0 -3,151 -1,315
net cash from investing activities -29,066 -24,382 -57,066 -45,318
Proceeds from non-controlling interests for the purchase of shares 98 0 98 0
Payments to non-controlling interests for the purchase of shares 0 -329 -589 -329
dividends paid to shareholders and minorities -29,650 -37,784 -29,650 -37,924
Proceeds from the addition of financial liabilities* 75,621 60,766* 94,944 73,654*
Payments for the repayment of financial liabilities* -47,500 -19,815* -53,038 -21,029*
net cash from financing activities -1,431 2,838 11,765 14,372
Changes in cash 6,031 974 9,673 -2,559
Effects of currency exchange rates on cash -1,409 2,507 -1,253 938
Cash at beginning of period 58,071 60,051 54,273 65,153
Cash at end of period 62,693 63,532 62,693 63,532
* a different presentation was selected for net cash from financing activities. Prior-year figures have been adjusted for comparability.
36
Group Statement of Cash Flows
of ElringKlinger AG, January 1 to June 30, 2013

Group Sales by Region
2nd Quarter 2013eur k
2nd Quarter 2012eur k
1st half 2013eur k
1st half 2012eur k
Germany 90,794 84,734 178,673 172,875
Rest of Europe 94,187 88,380 183,147 182,102
naFta 50,369 53,005 99,399 101,953
asia and australia 50,497 43,109 95,120 79,814
South america and other 17,470 16,818 33,771 33,064
Group 303,317 286,046 590,110 569,808
I n t e r I m F I n a n c I a l S tat e m e n t S
37

Segment Reporting
of ElringKlinger AG, April 1 to June 30, 2013
segment original equipment aftermarket engineered plastics
2013 eur k
2012 eur k
2013 eur k
2012 eur k
2013 eur k
2012 eur k
sales revenue 248,429 232,217 28,960 29,045 22,898 22,144
Intersegment revenue 3,780 5,074 0 0 87 28
segment revenue1 252,209 237,291 28,960 29,045 22,985 22,172
ebIt2 28,939 27,142 5,928 7,217 4,084 3,487
Interest income 56 43 3 3 99 106
Interest expense -2,685 -2,745 -279 -319 -159 -83
earnings before taxes 26,310 24,440 5,652 6,901 4,024 3,510
depreciation and amortization -16,654 -18,608 -347 -298 -942 -752
Capital expenditures3 26,610 22,196 363 674 1,821 1,002
segment original equipment aftermarket engineered plastics
2013 eur k
2012 eur k
2013 eur k
2012 eur k
2013 eur k
2012 eur k
sales revenue 478,153 457,984 59,095 59,108 46,641 47,361
Intersegment revenue 8,841 11,306 0 0 319 241
segment revenue1 486,994 469,290 59,095 59,108 46,960 47,602
ebIt2 54,325 51,908 12,327 14,077 7,185 8,421
Interest income 110 78 6 7 185 210
Interest expense -5,128 -5,686 -621 -661 -319 -165
earnings before taxes 49,307 46,300 11,712 13,423 7,051 8,466
depreciation and amortization -33,624 -37,003 -691 -572 -1,827 -1,500
Capital expenditures3 47,558 41,329 708 1,130 2,962 2,058
January 1 to June 30, 2013
1 a different presentation was selected for segment revenue2 Earnings before interest and taxes3 Investments in intangible assets and property, plant and equipment and investment property
38

segment original equipment aftermarket engineered plastics
2013 eur k
2012 eur k
2013 eur k
2012 eur k
2013 eur k
2012 eur k
sales revenue 248,429 232,217 28,960 29,045 22,898 22,144
Intersegment revenue 3,780 5,074 0 0 87 28
segment revenue1 252,209 237,291 28,960 29,045 22,985 22,172
ebIt2 28,939 27,142 5,928 7,217 4,084 3,487
Interest income 56 43 3 3 99 106
Interest expense -2,685 -2,745 -279 -319 -159 -83
earnings before taxes 26,310 24,440 5,652 6,901 4,024 3,510
depreciation and amortization -16,654 -18,608 -347 -298 -942 -752
Capital expenditures3 26,610 22,196 363 674 1,821 1,002
segment original equipment aftermarket engineered plastics
2013 eur k
2012 eur k
2013 eur k
2012 eur k
2013 eur k
2012 eur k
sales revenue 478,153 457,984 59,095 59,108 46,641 47,361
Intersegment revenue 8,841 11,306 0 0 319 241
segment revenue1 486,994 469,290 59,095 59,108 46,960 47,602
ebIt2 54,325 51,908 12,327 14,077 7,185 8,421
Interest income 110 78 6 7 185 210
Interest expense -5,128 -5,686 -621 -661 -319 -165
earnings before taxes 49,307 46,300 11,712 13,423 7,051 8,466
depreciation and amortization -33,624 -37,003 -691 -572 -1,827 -1,500
Capital expenditures3 47,558 41,329 708 1,130 2,962 2,058
Industrial parks services Consolidation and other Group
2013 eur k
2012 eur k
2013 eur k
2012 eur k
2013 eur k
2012 eur k
2013 eur k
2012 eur k
1,080 1,052 1,951 1,588 303,317 286,046
2 64 1,013 1,038 -4,883 -6,204 0 0
1,082 1,116 2,964 2,626 -4,883 -6,204 303,317 286,046
-92 108 428 346 39,287 38,300
2 0 5 4 -108 -102 57 54
-18 -35 0 -4 108 102 -3,033 -3,084
-108 73 433 346 36,311 35,270
-12 -102 -253 -266 -18,208 -20,026
8 105 266 502 29,068 24,479
Industrial parks services Consolidation and other Group
2013 eur k
2012 eur k
2013 eur k
2012 eur k
2013 eur k
2012 eur k
2013 eur k
2012 eur k
2,121 2,083 4,099 3,272 590,110 569,808
75 328 2,056 2,114 -11,290 -13,989 0 0
2,196 2,411 6,155 5,386 -11,290 -13,989 590,110 569,808
168 338 1,076 818 75,081 75,562
3 1 9 7 -198 -203 115 100
-29 -75 0 -8 198 203 -5,899 -6,392
142 264 1,085 817 69,297 69,270
-21 -200 -507 -513 -36,670 -39,788
39 129 2,934 714 54,201 45,360
I n t e r I m F I n a n c I a l S tat e m e n t S
39

Notes to the First Half of 2013
ElringKlinger AG is an exchange-listed stock corporation headquartered in Germany.
The accompanying condensed consolidated interim financial statements of ElringKlinger AG and
its subsidiaries as of June 30, 2013, have been prepared on the basis of IAS 34 (Interim Financial
Reporting). The interim financial statements conform with the International Financial Reporting
Standards (IFRS), including the Interpretations issued by the IFRS Interpretations Committee, as
adopted by the European Union.
As the consolidated interim financial statements are presented in a condensed format, the finan-
cial statements as of June 30, 2013, do not include all information and disclosures required under
IFRS for annual consolidated financial statements.
The consolidated interim financial statements have not been audited. They were authorized for
issue based on a resolution passed by the Management Board on August 9, 2013.
basis of reporting
The following new or amended Standards and Interpretations issued by the IASB were to be
applied to the consolidated interim financial statements for the first time:
IFRS 7 – Disclosures – Offsetting Financial Assets and Financial Liabilities
The amendment to IFRS 7 necessitates additional disclosures in the notes with regard to the off-
setting of financial instruments. To the best of our knowledge at present, the amended version of
IFRS 7 will have no significant effects on the presentation of the Group’s financial position, financial
performance and cash flows.
IFRS 13 – Fair Value Measurement
The requirements for the measurement of fair value, which had previously been dispersed across
several International Financial Reporting Standards, were brought together in a single Standard
and replaced by consistent regulations. IFRS 13 is to be applied prospectively for annual periods be-
ginning on or after 1 January 2013. To the best of our knowledge at present, first-time application
will not give rise to any material changes to the measurement of assets and liabilities. The changes
will apply in particular to the notes to the consolidated financial statements. All information pertain-
ing to the market values of financial instruments as well as the categorization of financial instruments,
which previously only had to be disclosed in the notes relating to the financial statements for the
annual period as a whole, must now also be disclosed as part of interim financial reporting.
IAS 19 – Employee Benefits
Owing to an amendment to the definition of “termination benefits”, top-up amounts relating to
partial retirement obligations may no longer be classified as “termination benefits” but rather as other
long-term employee benefits. In future, therefore, associated expenses may not be recognized im-
mediately in full but rather pro rata temporis. As a result of the associated changes to the recognition
of part-time retirement obligations, provisions for part-time retirement obligations within the
ElringKlinger Group would have decreased from EUR 4,119k to EUR 3,342k as of December 31, 2012,
and earnings before taxes would have increased by EUR 777k.
40

Beyond this, the accounting policies applied to the consolidated interim financial statements
for the first half of 2013 correspond to those used in the consolidated financial statements for
the financial year ended December 31, 2012. For a detailed description of the basis of preparation and
accounting policies, please refer to the notes to the consolidated financial statements of the 2012
Annual Report published by ElringKlinger AG.
The cost-of-sales (also referred to as function-of-expense) method has been applied when prepar-
ing the Group income statement. The presentation currency of the ElringKlinger Group is the euro.
scope of consolidated financial statements
Alongside the interim financial statements of ElringKlinger AG, the interim financial statements
as of June 30, 2013, include the interim financial statements of seven domestic and 26 foreign enti-
ties in which ElringKlinger AG holds more than 50% of the interests, either directly or indirectly.
Effective from May 10, 2013, HURO Invest S.R.L., Timisoara, Romania, was merged into HURO
Supermold S.R.L., Timisoara, Romania.
On April 29, 2013, KOCHWERK Catering GmbH, with its registered office in Dettingen/Erms,
Germany, was established. ElringKlinger AG holds 100% of the interests in this entity.
ElringKlinger Engineered Plastics North America, Inc., USA, a subsidiary of ElringKlinger
Kunststofftechnik GmbH, Germany, was established on April 8, 2013.
The joint-venture enterprise ElringKlinger Marusan Corporation, Tokyo, Japan, together with
its subsidiaries, has been included in the interim report on the basis of proportionate consolida-
tion, in accordance with IAS 31. In the case of proportionate consolidation, all assets and liabilities
as well as expenses and income of the joint ventures are included in the consolidated financial
statements at the proportionate interest held (50%). On April 19, 2013, an additional subsidiary of
ElringKlinger Marusan Corporation, by the name of ElringKlinger (Thailand) Co. Ltd., Thailand,
was established.
acquisition of non-controlling interests
Effective from January 1, 2013, ElringKlinger AG acquired the former non-controlling interests
of 49% relating to the subsidiary ElringKlinger South Africa (Pty) Ltd., with its registered office in
Johannesburg, South Africa. The purchase price amounted to EUR 589k and was recognized directly
in equity. Since the conclusion of this transaction, ElringKlinger AG has held 100% of the ownership
interests.
Interests acquired in stages
Effective from February 1, 2013, ElringKlinger AG acquired the interests of 50% relating to
ElringKlinger Korea Co., Ltd., Changwon, South Korea.
Since the conclusion of this transaction, ElringKlinger AG has held 100% of the ownership inter-
ests. The purchase price amounted to EUR 4,266k. The costs related to the transaction, amounting
to EUR 102k to date, were recognized as general and administrative expenses.
The assets and liabilities of the acquired interests were measured at their fair value as of the date
of acquisition.
Based on preliminary calculations, the business combination resulted in goodwill amounting to
EUR 4,915k. It has been allocated to the Original Equipment segment.
Goodwill is not tax deductible.
N o t e s t o t h e I N t e r I m F I N a N c I a l s tat e m e N t s
41

Due to the consolidation of the entity, Group revenue increased by EUR 2,297k and earnings be-
fore taxes by EUR 67k as of June 30, 2013.
Had the acquisition become effective as early as January 1, 2013, estimates conducted by
management suggest that consolidated revenue would have totaled EUR 2,765k and consolidated
earnings before taxes would have amounted to EUR 87k.
The preliminary allocation of the purchase price to assets and liabilities is presented in the
table below:
eur k
IFrs carrying amount at date
of purchasepurchase
price allocation
Fair value at date of purchase
Intangible assets - 82 82
Property, plant and equipment 2,164 - 2,164
Financial assets 212 - 212
deferred tax assets 289 - 289
Inventories 2,155 - 2,155
trade receivables 2,033 - 2,033
Other current assets 1,278 - 1,278
Cash and cash equivalents 2,231 - 2,231
total assets 10,362 82 10,444
Provisions 164 - 164
deferred tax liabilities - 16 16
Current trade payables 6,255 - 6,255
Current provisions 68 - 68
tax liabilities 11 - 11
Other current liabilities 293 - 293
total liabilities 6,791 16 6,807
net assets 3,571 66 3,637
eur k
February 1,
2013
Purchase price of interests 50 % 4,266
Fair value of previously held interests 50 % 4,266
Retained profits brought forward January 2013 50 % 20
measurement basis for goodwill 8,552
Goodwill 4,915
42

The fair value adjustments in respect of intangible assets relate to the profit margins contained
within the existing order backlog at the date of acquisition as well as the thus resulting tax effects in
connection with deferrals.
The interests in ElringKlinger Korea Co., Ltd., which were recognized on a proportionate basis at
the date of acquisition, were remeasured on acquiring the remaining interests at their fair value of
EUR 4,266k. Goodwill arising on the aforementioned acquisition was paid primarily in respect of the
positive earnings prospects as well as the anticipated synergies.
The transition to full consolidation resulted in non-cash accounting income of EUR 1,413k, which
was recognized as other operating income.
No contingent liabilities were identified during the acquisition procedure. No impairments were
recognized in respect of trade receivables.
The fair values presented for the respective assets and liabilities are provisional. A definitive
valuation of the assets and liabilities has yet to be made.
exchange rates
Exchange rates developed as follows:
Currency abbr.Closing rate
June 30, 2013Closing rate
dec. 31, 2012average rate
Jan.–June 2013 average rate
Jan.– dec. 2012
US-dollar (USa) USd 1.30800 1.31940 1.31070 1.29284
Pound (United kingdom) GBP 0.85720 0.81610 0.85346 0.81163
Swiss Franc (Switzerland) ChF 1.23380 1.20720 1.22880 1.20428
Canadian dollar (Canada) Cad 1.37140 1.31370 1.34033 1.29058
Real (Brazil) BRl 2.88990 2.70360 2.68775 2.53343
Mexican Peso (Mexico) MXn 17.04130 17.18450 16.58970 16.94385
RMB (China) Cny 8.02800 8.22070 8.10422 8.14721
wOn (South korea) kRw 1,494.24000 1,406.23000 1,454.39000 1,447.12500
Rand (South africa) ZaR 13.07040 11.17270 12.29535 10.57579
yen (Japan) JPy 129.39000 113.61000 125.41167 103.49667
Forint (hungary) hUF 294.85000 292.30000 297.26167 288.18167
turkish lira (turkey) tRy 2.52100 2.35510 2.39757 2.31404
leu (Romania) ROn 4.46030 4.44450 4.38890 4.45736
Indian Rupie (India) InR 77.72100 72.56000 72.42767 69.00309
Indonesian Rupiah IdR 12,980.41000 12,713.97000 12,786.59000 12,123.76333
N o t e s t o t h e I N t e r I m F I N a N c I a l s tat e m e N t s
43

disclosures relating to financial instruments
This section provides a comprehensive overview of the significance of financial instruments and
offers additional information on line items of the statement of financial position containing financial
instruments.
The following table shows the carrying amounts (CA) and fair values (FV) of financial assets:
The fair value of cash as well as loans and receivables corresponds to the carrying amount.
This is mainly attributable to the short maturity of such instruments. ElringKlinger measures the
fair value of held-to-maturity investments at the market rate observed in an active market. Available-
for-sale assets are marked to market values. Financial assets include time deposits amounting to
EUR 524k.
trade receivables / Cash derivativesother financial
instruments total
Ca eur k
Fv eur k
Ca eur k
Fv eur k
Ca eur k
Fv eur k
Ca eur k
as of June 30, 2013
Cash 62,693 62,693 0 0 0 0 62,693
loans and receivables 222,335 222,335 0 0 4,709 4,709 227,044
held to maturity 0 0 0 0 1,993 2,015 1,993
held for trading 0 0 0 0 0 0 0
available for sale 0 0 0 0 28 28 28
total 285,028 285,028 0 0 6,730 6,752 291,758
as of dec. 31, 2012
Cash 54,273 54,273 0 0 0 0 54,273
loans and receivables 185,850 185,850 0 0 4,621 4,621 190,471
held to maturity 0 0 0 0 1,386 1,423 1,386
held for trading 0 0 25 25 0 0 25
available for sale 0 0 0 0 508 508 508
total 240,123 240,123 25 25 6,515 6,552 246,663
44

The following table shows the carrying amounts (CA) and fair values (FV) of financial liabilities:
* these are derivatives that do not qualify for hedge accounting.
The fair value of trade payables and other current financial liabilities corresponds to the carrying
amount. ElringKlinger determines the market value of non-current fixed-interest liabilities to banks,
finance lease liabilities and derivatives by discounting expected future cash flows with the current
prevailing interest rates for similar financial liabilities with comparable residual terms and the com-
pany-specific interest rate.
trade payablesliabilities from finance leases
other financial liabilities total
Ca eur k
Fv eur k
Ca eur k
Fv eur k
Ca eur k
Fv eur k
Ca eur k
as of June 30, 2013
trade payables 71,433 71,433 0 0 0 0 71,433
Financial liabilities 0 0 396 396 356,092 361,951 356,488
Financial liabilities measured
at acquisition cost 71,433 71,433 396 396 356,092 361,951 427,921
held for trading* 0 0 0 0 428 428 428
Financial liabilities measured at
fair value through profit or loss 0 0 0 0 428 428 428
as of dec. 31, 2012
trade payables 58,065 58,065 0 0 0 0 58,065
Financial liabilities 0 0 567 567 314,142 320,287 314,709
Financial liabilities measured at
acquisition cost 58,065 58,065 567 567 314,142 320,287 372,774
held for trading* 0 0 0 0 227 227 227
Financial liabilities measured at
fair value through profit or loss 0 0 0 0 227 227 227
N o t e s t o t h e I N t e r I m F I N a N c I a l s tat e m e N t s
45

Financial assets and liabilities measured at fair value are classified into the following three-level
fair value hierarchy:
* these are derivatives that do not qualify for hedge accounting.
The levels of the fair value hierarchy are defined as follows:
• Level 1: Measurement based on quoted prices
• Level 2: Measurement based on inputs for the asset or liability that are observable in active markets
either directly or indirectly
• Level 3: Measurement based on inputs for assets and liabilities not representing observable market
data
Contingencies and related-party disclosures
The contingencies and related-party relationships disclosed in the consolidated financial state-
ments for 2012 were not subject to significant changes in the first half of 2013.
Government grants
As a result of government grants received in respect of development projects, other operating
income rose by EUR 2,193k in the first half of 2013, of which a total of EUR 742k was attributable to
the first quarter of 2013.
dividend payment
In the second quarter of 2013, ElringKlinger AG distributed a total dividend of EUR 28,512k
(EUR 0.45 per entitled share) to shareholders from its unappropriated retained earnings of 2012.
The dividend payout took place on May 17, 2013.
level 1 eur k
level 2eur k
level 3 eur k
Financial assets
available for sale 28 0 0
held for trading* 0 0 0
total 28 0 0
Financial liabilities
available for sale 0 0 0
held for trading * 0 428 0
total 0 428 0
46

other information
In connection with a warranty incident, ElringKlinger AG and the customers concerned concluded
a settlement agreement in 2011 for the payment of an amount totaling EUR 24.4 million. The war-
ranty case relates to gaskets supplied at the beginning of 2008. A partial amount of EUR 17.4 million
was paid in 2011. Another part payment of EUR 5.0 million was made in the first quarter of 2012,
while a further payment of EUR 1.0 million was made in the second quarter of 2012. The remaining
payment of EUR 1.0 million was made in the second quarter of 2013. In parallel, ElringKlinger AG
has a claim against its primary insurer and excess carrier for the same amount, of which EUR 10.0
million was already settled in 2011. Settlement of the remaining amount claimed has not yet occurred.
Therefore, ElringKlinger has filed suit. The proceedings have yet to be concluded. ElringKlinger con-
tinues to anticipate that this claim will be settled in full.
events after the reporting period
Effective from August 1, 2013, ElringKlinger AG acquired 10% of the interests in Elring Parts
Ltd., based in Gateshead, United Kingdom, and thus holds 100% of the interests in this entity.
Effective from August 1, 2013, ElringKlinger AG acquired 24.99% of the interests in exhaust
gas purification specialist Hug Engineering AG. ElringKlinger thus holds 93.67% of the interests
in the Swiss subsidiary, the majority acquisition of which took place in May 2011.
N o t e s t o t h e I N t e r I m F I N a N c I a l s tat e m e N t s
47

disclaimer – Forward-looking statements and Forecasts
this report contains forward-looking statements. these statements are based on expectations, market evaluations and forecasts
by the Management Board and on information currently available to them. In particular, the forward-looking statements shall not
be interpreted as a guarantee that the future events and results to which they refer will actually materialize. whilst the Manage-
ment Board is confident that the statements as well as the opinions and expectations on which they are based are realistic, the
aforementioned statements rely on assumptions that may conceivably prove to be incorrect. Future results and circumstances
depend on a multitude of factors, risks and imponderables that can alter the expectations and judgments that have been expressed.
these factors include, for example, changes to the general economic and business situation, variations of exchange rates and
interest rates, poor acceptance of new products and services, and changes to business strategy.
this report was published on august 9, 2013, and is available in German and English. Only the German version shall be legally binding.
this Report has been produced in a carbon neutral
manner. the CO2 emissions caused by its pro-
duction were compensated for by certified climate
protection projects.
Print compensatedId-No. 1330792
www.bvdm-online.de
Responsibility Statement
To the best of our knowledge, and in accordance with the applicable reporting principles for interim
financial reporting, the interim consolidated financial statements give a true and fair view of the as-
sets, liabilities, financial position and profit or loss of the Group, and the interim management report of
the Group includes a fair review of the development and performance of the business and the posi-
tion of the Group, together with a description of the principal opportunities and risks associated with
the expected development of the Group for the remaining months of the financial year.
Dettingen / Erms, August 9, 2013
The Management Board
Dr. Stefan Wolf Theo Becker Karl Schmauder
48

If you would like to receive our interim reports by e-mail please send your details to:
[email protected] or give us a call at Phone + 49 (0) 71 23 / 724-137
Further information is available at www.elringklinger.com
Financial Calendar
noVeMBeR 6 , 2013
Interim Report on the 3rd Quarter and First
Nine months of 2013
MaRch 28 , 2014
Annual Press Conference, Stuttgart
Analysts’ Meeting, Frankfurt/Main
MaY 16 , 2014
109th Annual General Shareholders’ Meeting,
Stuttgart
Calendar Trade Fairs 2013
sep teMBeR 12 – 2 2 , 2013
65th IAA International Motor Show,
Frankfurt / Main
sep teMBeR 30 – oc toBeR 2 , 2013
BATTERY + STORAGE
International trade fair for battery and energy
storage technologies, Stuttgart
oc toBeR 7 – 9, 2013
22nd Aachen Colloquium Automobile and
Engine Technology, Aachen
oc toBeR 16 – 20 , 2013
Equip Auto, Paris
deceMBeR 3 – 4 , 2013
12th International CTI Symposium and Exhibition
Innovative Automotive Transmissions, Hybrid &
Electric Drives, Berlin
deceMBeR 3 – 6 , 2013
EuroMold, World Fair for Moldmaking and
Tooling, Design and Application Development,
Frankfurt / Main

elringklinger agMax-Eyth-Straße 2
D-72581 Dettingen / Erms
(Germany)