report on the capacity, demand, and reserves in the … · ercot to provide balancing energy by...
TRANSCRIPT

ERCOT2705 West Lake DriveTaylor, Texas 76574
REPORT ON THE CAPACITY, DEMAND, AND RESERVES IN THE ERCOT REGION
Transmission Services
June 2006
STP000005 May 9, 2011
Nuclear Regulatory CommissionExhibit # - STP000005-00-BD01Docket # - 05200012| 05200013Identified: 08/18/2011
Admitted: Withdrawn: Rejected: Stricken: 08/18/2011
CDR Report - Contents April 2006
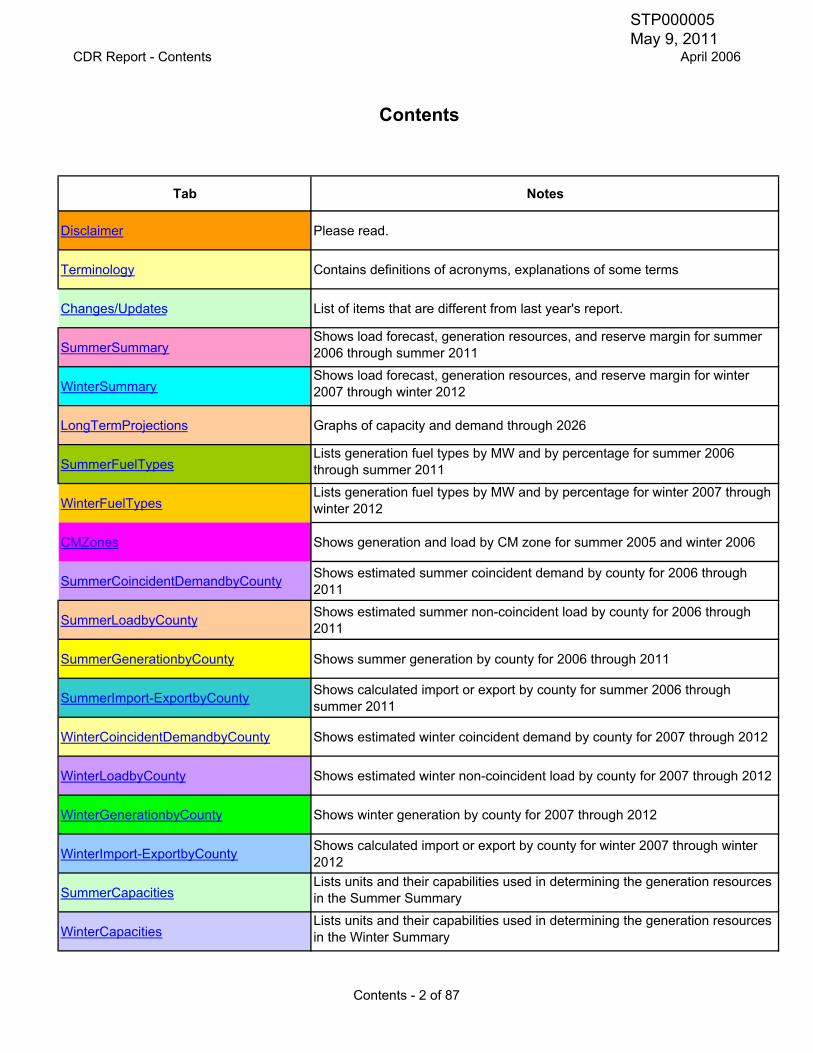
Tab Notes
Disclaimer Please read.
Terminology Contains definitions of acronyms, explanations of some terms
Changes/Updates List of items that are different from last year's report.
SummerSummaryShows load forecast, generation resources, and reserve margin for summer 2006 through summer 2011
WinterSummaryShows load forecast, generation resources, and reserve margin for winter 2007 through winter 2012
LongTermProjections Graphs of capacity and demand through 2026
SummerFuelTypesLists generation fuel types by MW and by percentage for summer 2006 through summer 2011
WinterFuelTypesLists generation fuel types by MW and by percentage for winter 2007 through winter 2012
CMZones Shows generation and load by CM zone for summer 2005 and winter 2006
SummerCoincidentDemandbyCounty Shows estimated summer coincident demand by county for 2006 through 2011
SummerLoadbyCounty Shows estimated summer non-coincident load by county for 2006 through 2011
SummerGenerationbyCounty Shows summer generation by county for 2006 through 2011
SummerImport-ExportbyCounty Shows calculated import or export by county for summer 2006 through summer 2011
WinterCoincidentDemandbyCounty Shows estimated winter coincident demand by county for 2007 through 2012
WinterLoadbyCounty Shows estimated winter non-coincident load by county for 2007 through 2012
WinterGenerationbyCounty Shows winter generation by county for 2007 through 2012
WinterImport-ExportbyCounty Shows calculated import or export by county for winter 2007 through winter 2012
SummerCapacitiesLists units and their capabilities used in determining the generation resources in the Summer Summary
WinterCapacitiesLists units and their capabilities used in determining the generation resources in the Winter Summary
Contents
Contents - 2 of 87
STP000005 May 9, 2011

CDR Report - Disclaimer June 2006
Disclaimer
CDR WORKING PAPER
FOR PLANNING PURPOSES ONLY
This ERCOT Working Paper has been prepared for specific ERCOT and market participant purposes and has been developed from data provided by ERCOT market participants. The data may contain errors or become obsolete and thereby affect the conclusions and opinions of the Working Paper. ERCOT MAKES NO WARRANTY, EXPRESS OR IMPLIED, INCLUDING ANY WARRANTY OF MERCHANTABILITY OR FITNESS FOR ANY PARTICULAR PURPOSE, AND DISCLAIMS ANY AND ALL LIABILITY WITH RESPECT TO THE ACCURACY OF SAME OR THE FITNESS OR APPROPRIATENESS OF SAME FOR ANY PARTICULAR USE. THIS ERCOT WORKING PAPER IS SUPPLIED WITH ALL FAULTS. The specific suitability for any use of the Working Paper and its accuracy should be confirmed by each ERCOT market participant that contributed data for this Working Paper.
This Working Paper is based on data submitted by ERCOT market participants as part of their Annual Load Data Request (ALDR) and their generation asset registration and on data in the EIA-411. As such, this data is updated on an ongoing basis, which means that this report can be rendered obsolete without notice.
Disclaimer - 3 of 87
STP000005 May 9, 2011
CDR Report - Terminology June 2006
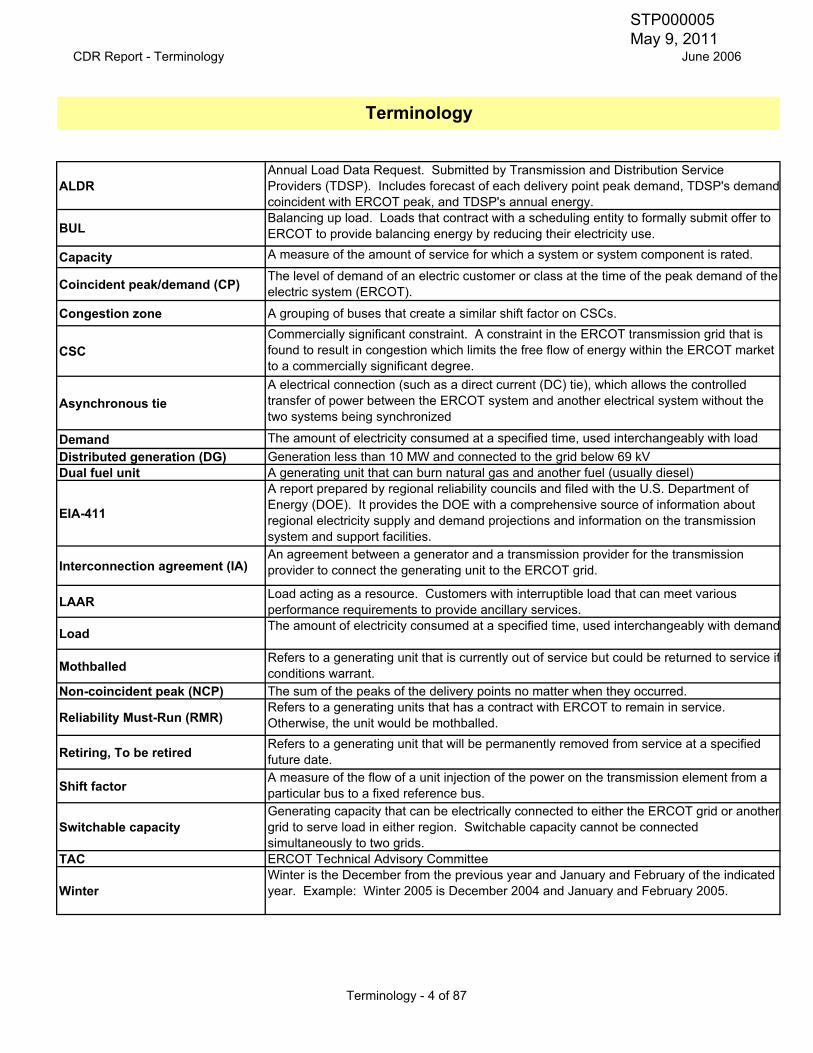
ALDRAnnual Load Data Request. Submitted by Transmission and Distribution Service Providers (TDSP). Includes forecast of each delivery point peak demand, TDSP's demandcoincident with ERCOT peak, and TDSP's annual energy.
BULBalancing up load. Loads that contract with a scheduling entity to formally submit offer to ERCOT to provide balancing energy by reducing their electricity use.
Capacity A measure of the amount of service for which a system or system component is rated.
Coincident peak/demand (CP) The level of demand of an electric customer or class at the time of the peak demand of the electric system (ERCOT).
Congestion zone A grouping of buses that create a similar shift factor on CSCs.
CSCCommercially significant constraint. A constraint in the ERCOT transmission grid that is found to result in congestion which limits the free flow of energy within the ERCOT market to a commercially significant degree.
Asynchronous tieA electrical connection (such as a direct current (DC) tie), which allows the controlled transfer of power between the ERCOT system and another electrical system without the two systems being synchronized
Demand The amount of electricity consumed at a specified time, used interchangeably with loadDistributed generation (DG) Generation less than 10 MW and connected to the grid below 69 kVDual fuel unit A generating unit that can burn natural gas and another fuel (usually diesel)
EIA-411
A report prepared by regional reliability councils and filed with the U.S. Department of Energy (DOE). It provides the DOE with a comprehensive source of information about regional electricity supply and demand projections and information on the transmission system and support facilities.
Interconnection agreement (IA)An agreement between a generator and a transmission provider for the transmission provider to connect the generating unit to the ERCOT grid.
LAAR Load acting as a resource. Customers with interruptible load that can meet various performance requirements to provide ancillary services.
Load The amount of electricity consumed at a specified time, used interchangeably with demand
MothballedRefers to a generating unit that is currently out of service but could be returned to service ifconditions warrant.
Non-coincident peak (NCP) The sum of the peaks of the delivery points no matter when they occurred.
Reliability Must-Run (RMR)Refers to a generating units that has a contract with ERCOT to remain in service.Otherwise, the unit would be mothballed.
Retiring, To be retiredRefers to a generating unit that will be permanently removed from service at a specified future date.
Shift factorA measure of the flow of a unit injection of the power on the transmission element from a particular bus to a fixed reference bus.
Switchable capacityGenerating capacity that can be electrically connected to either the ERCOT grid or anothergrid to serve load in either region. Switchable capacity cannot be connected simultaneously to two grids.
TAC ERCOT Technical Advisory Committee
WinterWinter is the December from the previous year and January and February of the indicated year. Example: Winter 2005 is December 2004 and January and February 2005.
Terminology
Terminology - 4 of 87
STP000005 May 9, 2011

CDR Report - Changes/Updates June 2006
Changes/Updates from Last Year
1. The latest net dependable capabilities for the units were used. Many of the units were tested in the summer of 2005. If the net dependable capability was not available, the capability from the unit's asset generation registration was used.
2. Capabilities used for the private-use networks were provided by the generating companies in accordance with PRR 593.
2. A new wind analysis was performed. The methodology mandated by the ERCOT Technical Advisory Committee in May 2005 was followed. Wind data from 2002 through 2005 were used in the new analysis. The result is that the percentage of wind used in the reserve margin calcuation is 2.6% instead of the 2.9% used last year.
3. RMR units were reviewed and the latest information used in this report.
4. Planned units with signed interconnection agreements are included in this year's report.Also, units that retired in the last year and those units have been removed from this report.
5. Mothballed units were reviewed and the latest information was used. Probabilities that the units would return to service, provided by the generating companies, were used in the calculations6. Although the peak demand forecast was again developed using econometric techniques that consider long-term growth trends, weather patterns and calendar variables, the forecast in this report is higher than in last year's report. The 2006 forecast was developed by weather zones and aggregated by summing across all zones. The forecast in 2005 was based on ERCOT system load data directly. The recent performance of the economy in Texas shows that it is in a recovery period and has improved since the beginning of 2005. The long-term economic outlook for Texas shows an expanding economy for the next ten years with a short slowdown period in 2007. The weather zone models incorporate employment into the forecasting process a major indicator of economic health in reflecting the pattern of economic7. In last year's report two planned units, for a total of 1950 MW in years 2008 through 2011, were included that should not have been included. These units have been removed from this report.
Changes/Updates - 5 of 87
STP000005 May 9, 2011

CD
R R
epor
t - S
umm
er S
umm
ary
June
200
6
Load
For
ecas
t:20
0620
0720
0820
0920
1020
11A
sk a
bout
this
Tota
l Sum
mer
Pea
k D
eman
d, M
W
61,6
5663
,222
64,3
1865
,950
67,5
4869
,034
less
LAA
Rs
Serv
ing
as R
espo
nsiv
e R
eser
ve, M
W
1,11
21,
112
1,11
21,
112
1,11
21,
112
less
LAA
Rs
Serv
ing
as N
on-S
pinn
ing
Res
erve
, MW
00
00
00
less
BU
Ls, M
W
00
00
00
Firm
Loa
d Fo
reca
st, M
W60
,544
62,1
1063
,206
64,8
3866
,436
67,9
22
Res
ourc
es:
2006
2007
2008
2009
2010
2011
Inst
alle
d C
apac
ity, M
W
58,5
7358
,573
58,5
7358
,573
58,5
7358
,573
Cap
acity
from
Priv
ate
Net
wor
ks, M
W6,
419
6,57
56,
279
6,27
96,
279
6,27
9W
ind
Gen
erat
ion,
MW
2,38
32,
383
2,38
32,
383
2,38
32,
383
RM
R U
nits
und
er C
ontra
ct, M
W26
717
017
017
00
0O
pera
tiona
l Gen
erat
ion,
MW
67,6
4267
,701
67,4
0567
,405
67,2
3567
,235
Asyn
chro
nous
Tie
s, M
W85
61,
106
1,10
61,
106
1,10
61,
106
Switc
habl
e U
nits
, MW
2,81
02,
810
2,81
02,
810
2,81
02,
810
Mot
hbal
led
Uni
ts, M
W8,
833
8,93
08,
930
8,93
09,
100
9,10
0Pl
anne
d U
nits
(not
win
d) w
ith S
igne
d IA
, MW
055
055
055
01,
300
1,30
0Pl
anne
d W
ind
Uni
ts w
ith S
igne
d IA
, MW
01,
085
1,57
61,
576
1,57
61,
576
Tota
l Res
ourc
es, M
W80
,141
82,1
8282
,377
82,3
7783
,127
83,1
27
less
97.
4% E
xist
ing
Win
d G
ener
atio
n, M
W2,
321
2,32
12,
321
2,32
12,
321
2,32
1le
ss 5
0% o
f Asy
nchr
onou
s Ti
es, M
W42
855
355
355
355
355
3le
ss S
witc
habl
e U
nits
Una
vaila
ble
to E
RC
OT,
MW
165
00
00
0le
ss M
othb
alle
d U
nits
Una
vaila
ble,
MW
6,72
96,
933
7,14
07,
144
7,31
77,
280
less
97.
4% P
lann
ed W
ind
Gen
erat
ion,
MW
01,
057
1,53
51,
535
1,53
51,
535
less
Ret
iring
Uni
ts, M
W0
039
345
145
145
1R
esou
rces
, MW
70,4
9871
,319
70,4
3570
,374
70,9
5070
,987
Res
erve
Mar
gin
16.4
%14
.8%
11.4
%8.
5%6.
8%4.
5%(R
esou
rces
- Fi
rm L
oad
Fore
cast
)/Firm
Loa
d Fo
reca
st
"Hig
h" R
eser
ve M
argi
n (a
ll M
othb
alle
d U
nits
retu
rn)
16.4
%26
.0%
22.7
%19
.6%
17.8
%15
.2%
"Low
" Res
erve
Mar
gin
(no
Mot
hbal
led
Uni
ts re
turn
)16
.4%
11.6
%8.
6%5.
8%4.
1%1.
8%
16.5
%15
.0%
11.6
%19
.7%
24.5
%23
.5%
* A
ir P
erm
it ei
ther
requ
este
d or
issu
ed, b
ut n
o IA
sig
ned
2006
Rep
ort o
n th
e C
apac
ity, D
eman
d, a
nd R
eser
ves
in th
e ER
CO
T R
egio
n
Sum
mer
Sum
mar
ySu
mm
er S
umm
ary
2006
Rep
ort o
n th
e C
apac
ity, D
eman
d, a
nd R
eser
ves
in
the
ERC
OT
Reg
ion
Res
erve
Mar
gin
w/ P
ublic
ly A
nnou
nced
The
rmal
U
nits
(net
)*
50,0
00
55,0
00
60,0
00
65,0
00
70,0
00
75,0
00
80,0
00
85,0
00
90,0
00
2006
2007
2008
2009
2010
2011
MW
Sum
mer
Loa
ds a
nd R
esou
rces
Firm
Loa
d Fo
reca
stR
esou
rces
All
Mot
hbal
led
Ret
urn
No
Mot
hbal
led
Ret
urn
Publ
icy
Ann
ounc
ed U
nits
Sum
mer
Sum
mar
y - 6
of 2
STP000005 May 9, 2011
CDR Report - Winter Summary June 2006
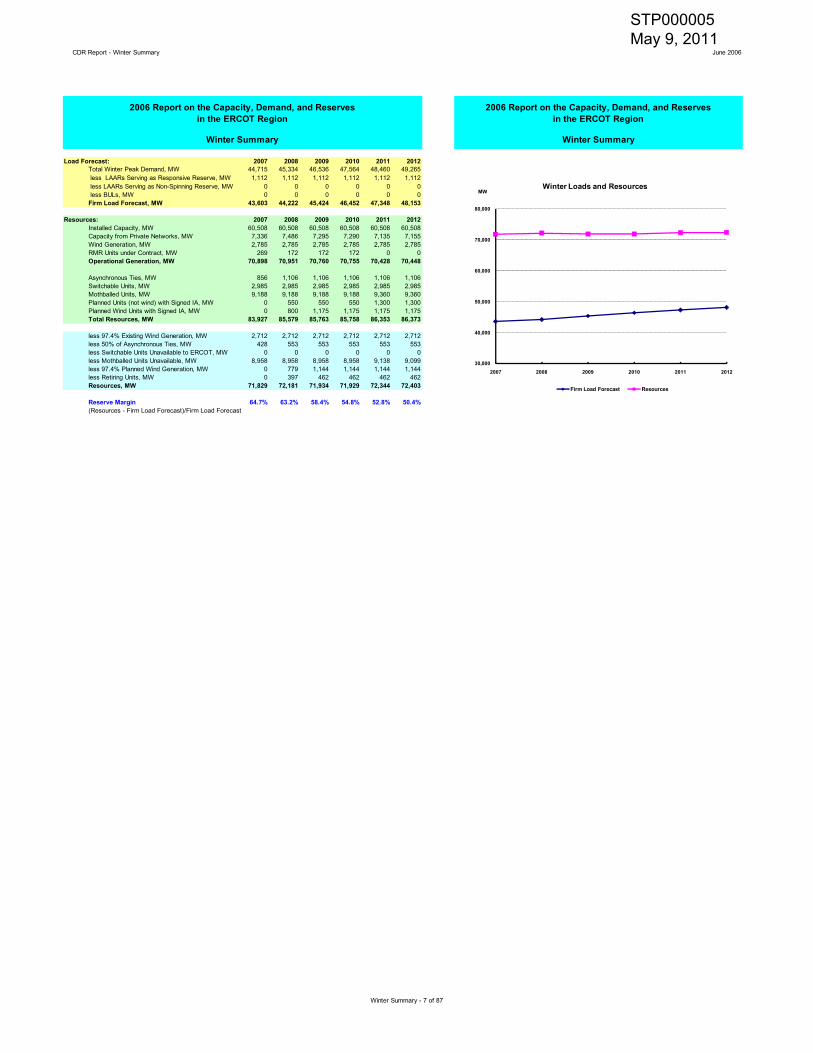
Load Forecast: 2007 2008 2009 2010 2011 2012Total Winter Peak Demand, MW 44,715 45,334 46,536 47,564 48,460 49,265 less LAARs Serving as Responsive Reserve, MW 1,112 1,112 1,112 1,112 1,112 1,112 less LAARs Serving as Non-Spinning Reserve, MW 0 0 0 0 0 0 less BULs, MW 0 0 0 0 0 0Firm Load Forecast, MW 43,603 44,222 45,424 46,452 47,348 48,153
Resources: 2007 2008 2009 2010 2011 2012Installed Capacity, MW 60,508 60,508 60,508 60,508 60,508 60,508Capacity from Private Networks, MW 7,336 7,486 7,295 7,290 7,135 7,155Wind Generation, MW 2,785 2,785 2,785 2,785 2,785 2,785RMR Units under Contract, MW 269 172 172 172 0 0Operational Generation, MW 70,898 70,951 70,760 70,755 70,428 70,448
Asynchronous Ties, MW 856 1,106 1,106 1,106 1,106 1,106Switchable Units, MW 2,985 2,985 2,985 2,985 2,985 2,985Mothballed Units, MW 9,188 9,188 9,188 9,188 9,360 9,360Planned Units (not wind) with Signed IA, MW 0 550 550 550 1,300 1,300Planned Wind Units with Signed IA, MW 0 800 1,175 1,175 1,175 1,175Total Resources, MW 83,927 85,579 85,763 85,758 86,353 86,373
less 97.4% Existing Wind Generation, MW 2,712 2,712 2,712 2,712 2,712 2,712less 50% of Asynchronous Ties, MW 428 553 553 553 553 553less Switchable Units Unavailable to ERCOT, MW 0 0 0 0 0 0less Mothballed Units Unavailable, MW 8,958 8,958 8,958 8,958 9,138 9,099less 97.4% Planned Wind Generation, MW 0 779 1,144 1,144 1,144 1,144less Retiring Units, MW 0 397 462 462 462 462Resources, MW 71,829 72,181 71,934 71,929 72,344 72,403
Reserve Margin 64.7% 63.2% 58.4% 54.8% 52.8% 50.4%(Resources - Firm Load Forecast)/Firm Load Forecast
2006 Report on the Capacity, Demand, and Reserves in the ERCOT Region
Winter Summary
2006 Report on the Capacity, Demand, and Reserves in the ERCOT Region
Winter Summary
30,000
40,000
50,000
60,000
70,000
80,000
2007 2008 2009 2010 2011 2012
MWWinter Loads and Resources
Firm Load Forecast Resources
Winter Summary - 7 of 87
STP000005 May 9, 2011

CDR Report - Long-Term Projections June 2006
Long-Term Projections
77,663
86,644
96,837
108,230
69,034
77,017
86,077
96,204
73,31769,909
61,637
49,520
61,637
49,520
40,208
34,481
40,208
34,481
27,48225,210
20,000
30,000
40,000
50,000
60,000
70,000
80,000
90,000
100,000
110,000
120,000
2011 2016 2021 2026
MW
ERCOT GENERATION CAPACITY AND DEMAND PROJECTIONS
Total Requirement (Peak + 12.5% Reserve Margin)
Peak demand
Capacity less units 50 years old or older
Capacity less units 40 years old or older
Capacity less units 30 years old or older
4,346
16,735
35,199
58,709
16,026
37,124
56,628
73,748
37,455
52,163
69,354
83,019
0
10,000
20,000
30,000
40,000
50,000
60,000
70,000
80,000
90,000
2011 2016 2021 2026
MW
POSSIBLE ERCOT GENERATION CAPACITY NEEDED
Capacity needed less units 30 years old or older
Capacity needed less units 40 years old or older
Capacity needed less units 50 years old or older
Long-Term Projections - 1 of 1
STP000005 May 9, 2011

CDR Report - Summer Fuel Types June 2006
Fuel Type 2006 2007 2008 2009 2010 2011
Natural Gas 55,496 56,204 55,515 55,457 55,457 55,457Coal 15,729 15,729 15,729 15,729 16,479 16,479Nuclear 4,887 4,887 4,887 4,887 4,887 4,887Wind 62 89 102 102 102 102Water 552 552 552 552 552 552Other 200 200 200 200 200 200Diesel 38 38 38 38 38 38Total 76,964 77,699 77,023 76,965 77,715 77,715
Fuel Type 2006 2007 2008 2009 2010 2011
Natural Gas 72.1% 72.3% 72.1% 72.1% 71.4% 71.4%Coal 20.4% 20.2% 20.4% 20.4% 21.2% 21.2%Nuclear 6.3% 6.3% 6.3% 6.3% 6.3% 6.3%Wind 0.1% 0.1% 0.1% 0.1% 0.1% 0.1%Water 0.7% 0.7% 0.7% 0.7% 0.7% 0.7%Other 0.3% 0.3% 0.3% 0.3% 0.3% 0.3%Diesel 0.0% 0.0% 0.0% 0.0% 0.0% 0.0%
Summer Fuel Types - ERCOT
In MW
Fuel type is based on the primary fuel. The total capactities of the mothballed units are included. Capacities of the wind units are included at 2.6%. The amounts available for the grid according to information from the owners of the private network (self-serve) units and the distributed generation units that have registered with ERCOT are included. Asynchronous ties are not included.
In Percentages
72.1%0.1%
20.4%
0.7%0.3%
6.3%
0.0%
Summer 2006 Fuel Types - ERCOT
Natural Gas Wind Coal Water Other Nuclear Diesel
Summer Fuel Types - 9 of 87
STP000005 May 9, 2011

CDR Report - Summer Fuel Types June 2006
Fuel Type 2006 2007 2008 2009 2010 2011
Natural Gas 14,565 14,721 14,435 14,435 14,435 14,435Coal 2,466 2,466 2,466 2,466 2,466 2,466Nuclear 0 0 0 0 0 0Wind 0 0 0 0 0 0Water 0 0 0 0 0 0Other 165 165 165 165 165 165Diesel 0 0 0 0 0 0Total 17,196 17,352 17,066 17,066 17,066 17,066
Fuel Type 2006 2007 2008 2009 2010 2011
Natural Gas 84.7% 84.8% 84.6% 84.6% 84.6% 84.6%Coal 14.3% 14.2% 14.4% 14.4% 14.4% 14.4%Nuclear 0.0% 0.0% 0.0% 0.0% 0.0% 0.0%Wind 0.0% 0.0% 0.0% 0.0% 0.0% 0.0%Water 0.0% 0.0% 0.0% 0.0% 0.0% 0.0%Other 1.0% 1.0% 1.0% 1.0% 1.0% 1.0%Diesel 0.0% 0.0% 0.0% 0.0% 0.0% 0.0%
Summer Fuel Types - Houston Zone
Fuel type is based on the primary fuel. The total capactities of the mothballed units are included. Capacities of the wind units are included at 2.6%. The amounts available for the grid according to information from the owners of the private network (self-serve) units and the distributed generation units that have registered with ERCOT are included. Asynchronous ties are not included.
In MW
In Percentages
84.7%
0.0% 14.3%
0.0%
1.0%0.0%
0.0%
Summer 2006 Fuel Types - Houston Zone
Natural Gas Wind Coal Water Other Nuclear Diesel
Summer Fuel Types - 10 of 87
STP000005 May 9, 2011

CDR Report - Summer Fuel Types June 2006
Fuel Type 2006 2007 2008 2009 2010 2011
Natural Gas 18,384 18,384 18,384 18,384 18,384 18,384Coal 6,132 6,132 6,132 6,132 6,132 6,132Nuclear 2,327 2,327 2,327 2,327 2,327 2,327Wind 0 0 0 0 0 0Water 33 33 33 33 33 33Other 11 11 11 11 11 11Diesel 24 24 24 24 24 24Total 26,911 26,911 26,911 26,911 26,911 26,911
Fuel Type 2006 2007 2008 2009 2010 2011
Natural Gas 68.3% 68.3% 68.3% 68.3% 68.3% 68.3%Coal 22.8% 22.8% 22.8% 22.8% 22.8% 22.8%Nuclear 8.6% 8.6% 8.6% 8.6% 8.6% 8.6%Wind 0.0% 0.0% 0.0% 0.0% 0.0% 0.0%Water 0.1% 0.1% 0.1% 0.1% 0.1% 0.1%Other 0.0% 0.0% 0.0% 0.0% 0.0% 0.0%Diesel 0.1% 0.1% 0.1% 0.1% 0.1% 0.1%
Summer Fuel Types - North Zone
Fuel type is based on the primary fuel. The total capactities of the mothballed units are included. Capacities of the wind units are included at 2.6%. The amounts available for the grid according to information from the owners of the private network (self-serve) units and the distributed generation units that have registered with ERCOT are included. Asynchronous ties are not included.
In MW
In Percentages
68.3%0
22.8%
0.1% 0.0%8.6%
0.1%
Summer 2006 Fuel Types - North Zone
Natural Gas Wind Coal Water Other Nuclear Diesel
Summer Fuel Types - 11 of 87
STP000005 May 9, 2011

CDR Report - Summer Fuel Types June 2006
Fuel Type 2006 2007 2008 2009 2010 2011
Natural Gas 3,648 3,648 3,648 3,648 3,648 3,648Coal 1,919 1,919 1,919 1,919 1,919 1,919Nuclear 0 0 0 0 0 0Wind 0 0 0 0 0 0Water 80 80 80 80 80 80Other 0 0 0 0 0 0Diesel 0 0 0 0 0 0Total 5,647 5,647 5,647 5,647 5,647 5,647
Fuel Type 2006 2007 2008 2009 2010 2011
Natural Gas 64.6% 64.6% 64.6% 64.6% 64.6% 64.6%Coal 34.0% 34.0% 34.0% 34.0% 34.0% 34.0%Nuclear 0.0% 0.0% 0.0% 0.0% 0.0% 0.0%Wind 0.0% 0.0% 0.0% 0.0% 0.0% 0.0%Water 1.4% 1.4% 1.4% 1.4% 1.4% 1.4%Other 0.0% 0.0% 0.0% 0.0% 0.0% 0.0%Diesel 0.0% 0.0% 0.0% 0.0% 0.0% 0.0%
Summer Fuel Types - Northeast Zone
Fuel type is based on the primary fuel. The total capactities of the mothballed units are included. Capacities of the wind units are included at 2.6%. The amounts available for the grid according to information from the owners of the private network (self-serve) units and the distributed generation units that have registered with ERCOT are included. Asynchronous ties are not included.
In MW
In Percentages
64.6%
0
34.0%
1.4%
0.0%
0.0%0.0%
Summer 2006 Fuel Types - Northeast Zone
Natural Gas Wind Coal Water Other Nuclear Diesel
Summer Fuel Types - 12 of 87
STP000005 May 9, 2011

CDR Report - Summer Fuel Types June 2006
Fuel Type 2006 2007 2008 2009 2010 2011
Natural Gas 14,782 15,057 14,654 14,596 14,596 14,596Coal 4,618 4,618 4,618 4,618 5,368 5,368Nuclear 2,560 2,560 2,560 2,560 2,560 2,560Wind 0 0 0 0 0 0Water 415 415 415 415 415 415Other 25 25 25 25 25 25Diesel 14 14 14 14 14 14Total 22,414 22,689 22,286 22,228 22,978 22,978
Fuel Type 2006 2007 2008 2009 2010 2011
Natural Gas 65.9% 66.4% 65.8% 65.7% 63.5% 63.5%Coal 20.6% 20.4% 20.7% 20.8% 23.4% 23.4%Nuclear 11.4% 11.3% 11.5% 11.5% 11.1% 11.1%Wind 0.0% 0.0% 0.0% 0.0% 0.0% 0.0%Water 1.9% 1.8% 1.9% 1.9% 1.8% 1.8%Other 0.1% 0.1% 0.1% 0.1% 0.1% 0.1%Diesel 0.1% 0.1% 0.1% 0.1% 0.1% 0.1%
Summer Fuel Types - South Zone
Fuel type is based on the primary fuel. The total capactities of the mothballed units are included. Capacities of the wind units are included at 2.6%. The amounts available for the grid according to information from the owners of the private network (self-serve) units and the distributed generation units that have registered with ERCOT are included. Asynchronous ties are not included.
In MW
In Percentages
65.9%
0
20.6%
1.9%
0.1%11.4%
0.1%
Summer 2006 Fuel Types - South Zone
Natural Gas Wind Coal Water Other Nuclear Diesel
Summer Fuel Types - 13 of 87
STP000005 May 9, 2011

CDR Report - Summer Fuel Types June 2006
Fuel Type 2006 2007 2008 2009 2010 2011
Natural Gas 4,117 4,394 4,394 4,394 4,394 4,394Coal 594 594 594 594 594 594Nuclear 0 0 0 0 0 0Wind 62 89 102 102 102 102Water 24 24 24 24 24 24Other 0 0 0 0 0 0Diesel 0 0 0 0 0 0Total 4,797 5,101 5,114 5,114 5,114 5,114
Fuel Type 2006 2007 2008 2009 2010 2011
Natural Gas 85.8% 86.1% 85.9% 85.9% 85.9% 85.9%Coal 12.4% 11.6% 11.6% 11.6% 11.6% 11.6%Nuclear 0.0% 0.0% 0.0% 0.0% 0.0% 0.0%Wind 1.3% 1.7% 2.0% 2.0% 2.0% 2.0%Water 0.5% 0.5% 0.5% 0.5% 0.5% 0.5%Other 0.0% 0.0% 0.0% 0.0% 0.0% 0.0%Diesel 0.0% 0.0% 0.0% 0.0% 0.0% 0.0%
Summer Fuel Types - West Zone
Fuel type is based on the primary fuel. The total capactities of the mothballed units are included. Capacities of the wind units are included at 2.6%. The amounts available for the grid according to information from the owners of the private network (self-serve) units and the distributed generation units that have registered with ERCOT are included. Asynchronous ties are not included.
In MW
In Percentages
85.8%
012.4%
0.5%0.0%
0.0%
0.0%
Summer 2006 Fuel Types - West Zone
Natural Gas Wind Coal Water Other Nuclear Diesel
Summer Fuel Types - 14 of 87
STP000005 May 9, 2011

CDR Report - Winter Fuel Types June 2006
Fuel Type 2007 2008 2009 2010 2011 2012
Natural Gas 58,644 58,952 58,694 58,689 58,534 58,554Coal 15,842 15,842 15,842 15,842 16,592 16,592Nuclear 4,918 4,918 4,918 4,918 4,918 4,918Wind 73 92 102 102 102 102Water 545 545 545 545 545 545Other 203 203 203 203 203 203Diesel 38 38 38 38 38 38Total 80,263 80,590 80,342 80,337 80,932 80,952
Fuel Type 2007 2008 2009 2010 2011 2012
Natural Gas 73.1% 73.2% 73.1% 73.1% 72.3% 72.3%Coal 19.7% 19.7% 19.7% 19.7% 20.5% 20.5%Nuclear 6.1% 6.1% 6.1% 6.1% 6.1% 6.1%Wind 0.1% 0.1% 0.1% 0.1% 0.1% 0.1%Water 0.7% 0.7% 0.7% 0.7% 0.7% 0.7%Other 0.3% 0.3% 0.3% 0.3% 0.3% 0.3%Diesel 0.0% 0.0% 0.0% 0.0% 0.0% 0.0%
Winter Fuel Types - ERCOT
In MW
In Percentages
Fuel type is based on the primary fuel. The total capactities of the mothballed units are included. Capacities of the wind units are included at 2.6%. The amounts available for the grid according to information from the owners of the private network (self-serve) units and the distributed generation units that have registered with ERCOT are included. Asynchronous ties are not included.
73.1%0.1%
19.7%
0.7%0.3%
6.1%
0.0%
Winter 2007 Fuel Types - ERCOT
Natural Gas Wind Coal Water Other Nuclear Diesel
Winter Fuel Types - 15 of 87
STP000005 May 9, 2011
CDR Report - Winter Fuel Types June 2006
Fuel Type 2007 2008 2009 2010 2011 2012
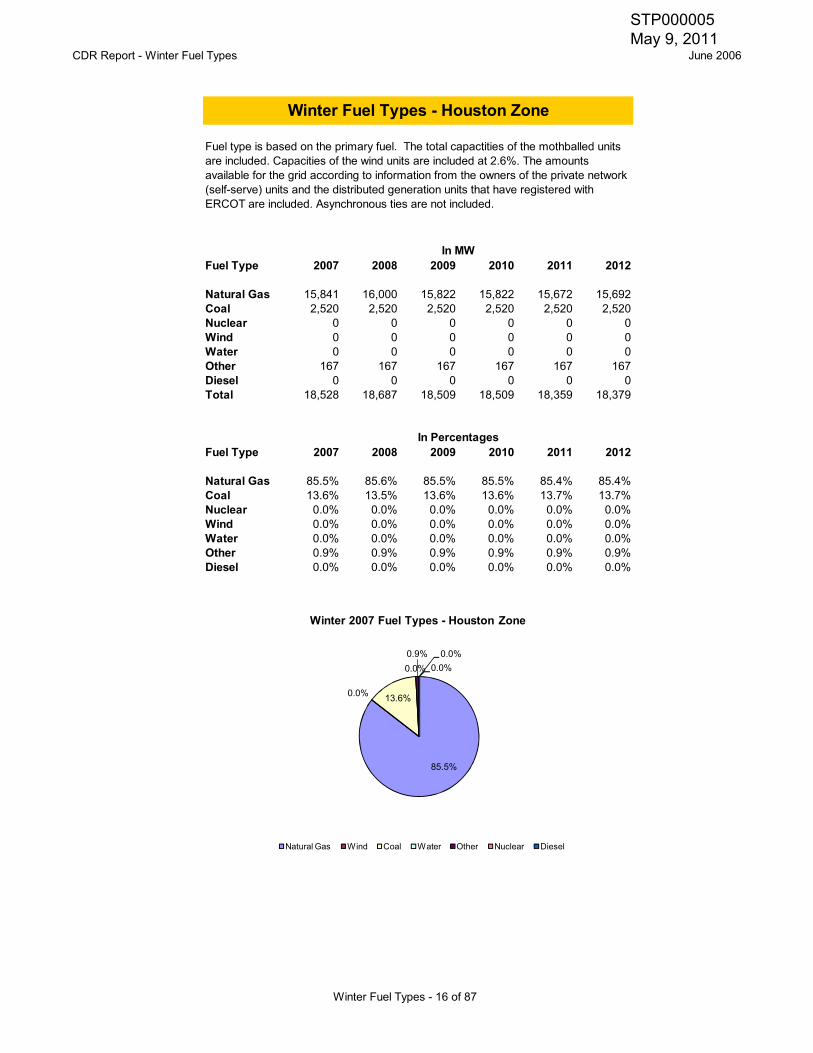
Natural Gas 15,841 16,000 15,822 15,822 15,672 15,692Coal 2,520 2,520 2,520 2,520 2,520 2,520Nuclear 0 0 0 0 0 0Wind 0 0 0 0 0 0Water 0 0 0 0 0 0Other 167 167 167 167 167 167Diesel 0 0 0 0 0 0Total 18,528 18,687 18,509 18,509 18,359 18,379
Fuel Type 2007 2008 2009 2010 2011 2012
Natural Gas 85.5% 85.6% 85.5% 85.5% 85.4% 85.4%Coal 13.6% 13.5% 13.6% 13.6% 13.7% 13.7%Nuclear 0.0% 0.0% 0.0% 0.0% 0.0% 0.0%Wind 0.0% 0.0% 0.0% 0.0% 0.0% 0.0%Water 0.0% 0.0% 0.0% 0.0% 0.0% 0.0%Other 0.9% 0.9% 0.9% 0.9% 0.9% 0.9%Diesel 0.0% 0.0% 0.0% 0.0% 0.0% 0.0%
Winter Fuel Types - Houston Zone
Fuel type is based on the primary fuel. The total capactities of the mothballed units are included. Capacities of the wind units are included at 2.6%. The amounts available for the grid according to information from the owners of the private network (self-serve) units and the distributed generation units that have registered with ERCOT are included. Asynchronous ties are not included.
In MW
In Percentages
85.5%
0.0% 13.6%
0.0%0.9% 0.0%
0.0%
Winter 2007 Fuel Types - Houston Zone
Natural Gas Wind Coal Water Other Nuclear Diesel
Winter Fuel Types - 16 of 87
STP000005 May 9, 2011

CDR Report - Winter Fuel Types June 2006
Fuel Type 2007 2008 2009 2010 2011 2012
Natural Gas 19,212 19,212 19,212 19,212 19,212 19,212Coal 6,147 6,147 6,147 6,147 6,147 6,147Nuclear 2,352 2,352 2,352 2,352 2,352 2,352Wind 0 0 0 0 0 0Water 33 33 33 33 33 33Other 12 12 12 12 12 12Diesel 24 24 24 24 24 24Total 27,780 27,780 27,780 27,780 27,780 27,780
Fuel Type 2007 2008 2009 2010 2011 2012
Natural Gas 69.2% 69.2% 69.2% 69.2% 69.2% 69.2%Coal 22.1% 22.1% 22.1% 22.1% 22.1% 22.1%Nuclear 8.5% 8.5% 8.5% 8.5% 8.5% 8.5%Wind 0.0% 0.0% 0.0% 0.0% 0.0% 0.0%Water 0.1% 0.1% 0.1% 0.1% 0.1% 0.1%Other 0.0% 0.0% 0.0% 0.0% 0.0% 0.0%Diesel 0.1% 0.1% 0.1% 0.1% 0.1% 0.1%
Winter Fuel Types - North Zone
Fuel type is based on the primary fuel. The total capactities of the mothballed units are included. Capacities of the wind units are included at 2.6%. The amounts available for the grid according to information from the owners of the private network (self-serve) units and the distributed generation units that have registered with ERCOT are included. Asynchronous ties are not included.
In MW
In Percentages
69.2%0.0%
22.1%
0.1%0.0%
8.5%
0.1%
Winter 2007 Fuel Types - North Zone
Natural Gas Wind Coal Water Other Nuclear Diesel
Winter Fuel Types - 17 of 87
STP000005 May 9, 2011

CDR Report - Winter Fuel Types June 2006
Fuel Type 2007 2008 2009 2010 2011 2012
Natural Gas 3,789 3,789 3,789 3,789 3,789 3,789Coal 1,933 1,933 1,933 1,933 1,933 1,933Nuclear 0 0 0 0 0 0Wind 0 0 0 0 0 0Water 80 80 80 80 80 80Other 0 0 0 0 0 0Diesel 0 0 0 0 0 0Total 5,802 5,802 5,802 5,802 5,802 5,802
Fuel Type 2007 2008 2009 2010 2011 2012
Natural Gas 65.3% 65.3% 65.3% 65.3% 65.3% 65.3%Coal 33.3% 33.3% 33.3% 33.3% 33.3% 33.3%Nuclear 0.0% 0.0% 0.0% 0.0% 0.0% 0.0%Wind 0.0% 0.0% 0.0% 0.0% 0.0% 0.0%Water 1.4% 1.4% 1.4% 1.4% 1.4% 1.4%Other 0.0% 0.0% 0.0% 0.0% 0.0% 0.0%Diesel 0.0% 0.0% 0.0% 0.0% 0.0% 0.0%
Winter Fuel Types - Northeast Zone
Fuel type is based on the primary fuel. The total capactities of the mothballed units are included. Capacities of the wind units are included at 2.6%. The amounts available for the grid according to information from the owners of the private network (self-serve) units and the distributed generation units that have registered with ERCOT are included. Asynchronous ties are not included.
In MW
In Percentages
65.3%
0.0%
33.3%
1.4%
0.0% 0.0%
0.0%
Winter 2007 Fuel Types - Northeast Zone
Natural Gas Wind Coal Water Other Nuclear Diesel
Winter Fuel Types - 18 of 87
STP000005 May 9, 2011

CDR Report - Winter Fuel Types June 2006
Fuel Type 2007 2008 2009 2010 2011 2012
Natural Gas 15,498 15,371 15,291 15,286 15,281 15,281Coal 4,611 4,611 4,611 4,611 5,361 5,361Nuclear 2,566 2,566 2,566 2,566 2,566 2,566Wind 0 0 0 0 0 0Water 408 408 408 408 408 408Other 25 25 25 25 25 25Diesel 14 14 14 14 14 14Total 23,122 22,995 22,915 22,910 23,655 23,655
Fuel Type 2007 2008 2009 2010 2011 2012
Natural Gas 67.0% 66.8% 66.7% 66.7% 64.6% 64.6%Coal 19.9% 20.1% 20.1% 20.1% 22.7% 22.7%Nuclear 11.1% 11.2% 11.2% 11.2% 10.8% 10.8%Wind 0.0% 0.0% 0.0% 0.0% 0.0% 0.0%Water 1.8% 1.8% 1.8% 1.8% 1.7% 1.7%Other 0.1% 0.1% 0.1% 0.1% 0.1% 0.1%Diesel 0.1% 0.1% 0.1% 0.1% 0.1% 0.1%
Winter Fuel Types - South Zone
Fuel type is based on the primary fuel. The total capactities of the mothballed units are included. Capacities of the wind units are included at 2.6%. The amounts available for the grid according to information from the owners of the private network (self-serve) units and the distributed generation units that have registered with ERCOT are included. Asynchronous ties are not included.
In MW
In Percentages
67.0%0.0%
19.9%
1.8%0.1%
11.1%
0.1%
Winter 2007 Fuel Types - South Zone
Natural Gas Wind Coal Water Other Nuclear Diesel
Winter Fuel Types - 19 of 87
STP000005 May 9, 2011

CDR Report - Winter Fuel Types June 2006
Fuel Type 2007 2008 2009 2010 2011 2012
Natural Gas 4,303 4,580 4,580 4,580 4,580 4,580Coal 631 631 631 631 631 631Nuclear 0 0 0 0 0 0Wind 73 92 102 102 102 102Water 24 24 24 24 24 24Other 0 0 0 0 0 0Diesel 0 0 0 0 0 0Total 5,031 5,327 5,337 5,337 5,337 5,337
Fuel Type 2007 2008 2009 2010 2011 2012
Natural Gas 85.5% 86.0% 85.8% 85.8% 85.8% 85.8%Coal 12.5% 11.8% 11.8% 11.8% 11.8% 11.8%Nuclear 0.0% 0.0% 0.0% 0.0% 0.0% 0.0%Wind 1.5% 1.7% 1.9% 1.9% 1.9% 1.9%Water 0.5% 0.5% 0.4% 0.4% 0.4% 0.4%Other 0.0% 0.0% 0.0% 0.0% 0.0% 0.0%Diesel 0.0% 0.0% 0.0% 0.0% 0.0% 0.0%
Winter Fuel Types - West Zone
Fuel type is based on the primary fuel. The total capactities of the mothballed units are included. Capacities of the wind units are included at 2.6%. The amounts available for the grid according to information from the owners of the private network (self-serve) units and the distributed generation units that have registered with ERCOT are included. Asynchronous ties are not included.
In MW
In Percentages
85.5%
1.5% 12.5%
0.5%0.0%
0.0%
0.0%
Winter 2007 Fuel Types - West Zone
Natural Gas Wind Coal Water Other Nuclear Diesel
Winter Fuel Types - 20 of 87
STP000005 May 9, 2011

CDR Report - Congestion Zone Information June 2006
Zone 2005 Resources, MW
2005 Actual Coincident
Demand, MW
2006 Resources, MW
2006 Forecasted Non-coincident Demand, MW
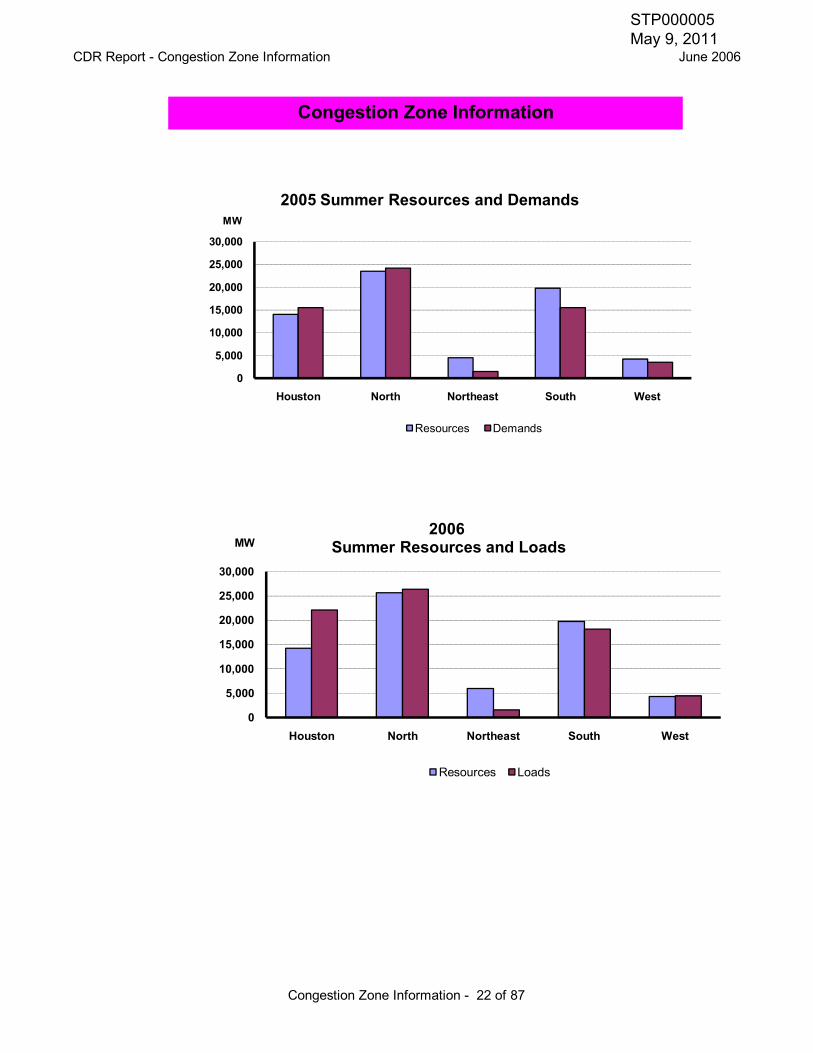
Houston 14,063 15,507 14,258 22,099
North 23,519 24,195 25,667 26,382
Northeast 4,537 1,493 5,947 1,589
South 19,769 15,540 19,768 18,152
West 4,213 3,535 4,324 4,442
Total 66,101 60,270 69,964 72,664
ERCOT System Peak 60,475
Zone 2006 Resources, MW
2006 Actual Coincident
Demand, MW
2007 Resources, MW
2007 Forecasted Non-coincident Demand, MW
Houston 13,487 11,557 15,534 17,506
North 21,161 19,434 25,636 22,414
Northeast 4,824 1,229 5,372 1,406
South 18,678 12,720 20,415 14,580
West 3,318 3,195 4,545 3,769
Total 61,468 48,135 71,502 59,675
ERCOT System Peak 44,532
Summer
Winter
Congestion Zone Information
Forecasted load is the non-coincident peaks from the Annual Load Data Requests (ALDR). Forecasted ERCOT system peaks are shown for comparison. Neither forecast includes self-serve load.
The capacities for mothballed units are not included in the resources. Capacities of wind generation are at 2.6%; asynchronous ties are shown at 50% of their capacities; and switchable units that are available to ERCOT are included. The values include the amount available for the grid according information from the owners of the private network (self-serve) units and the distributed generation units that have registered with ERCOT.
Congestion Zone Information - 21 of 87
STP000005 May 9, 2011
CDR Report - Congestion Zone Information June 2006
Congestion Zone Information
0
5,000
10,000
15,000
20,000
25,000
30,000
Houston North Northeast South West
MW
2005 Summer Resources and Demands
Resources Demands
0
5,000
10,000
15,000
20,000
25,000
30,000
Houston North Northeast South West
MW2006
Summer Resources and Loads
Resources Loads
Congestion Zone Information - 22 of 87
STP000005 May 9, 2011

CDR Report - Congestion Zone Information June 2006
Congestion Zone Information
0
5,000
10,000
15,000
20,000
25,000
Houston North Northeast South West
MW2006 Winter Resources and Demands
Resources Demands
0
5,000
10,000
15,000
20,000
25,000
30,000
Houston North Northeast South West
MW2007
Winter Resources and Loads
Resources Loads
Congestion Zone Information - 23 of 87
STP000005 May 9, 2011

CDR Report - Summer Coincident Demand by County June 2006
County 2006 2007 2008 2009 2010 2011
ANDERSON 153.1 155.3 156.6 159.3 161.9 164.3ANDREWS 149.5 150.7 150.9 152.3 153.5 154.2ANGELINA 320.2 323.5 324.6 328.3 331.3 333.7ARANSAS 62.9 64.3 65.3 66.8 68.2 69.4ARCHER 26.7 27.3 27.7 28.4 29.0 29.5ATASCOSA 71.8 73.6 74.9 76.8 78.5 80.0AUSTIN 89.5 91.0 91.9 93.6 95.2 96.5BANDERA 54.1 57.0 55.6 58.5 61.5 64.4BASTROP 187.5 191.7 200.6 202.7 212.9 222.8BAYLOR 16.2 16.2 16.2 16.2 16.3 16.3BEE 61.9 62.7 63.0 63.8 64.5 65.1BELL 768.3 793.1 810.1 822.9 844.9 865.4BEXAR 4230.0 4308.9 4377.4 4517.2 4734.1 4908.7BLANCO 28.1 29.1 30.0 31.1 32.2 33.3BORDEN 1.7 1.7 1.7 1.7 1.8 1.8BOSQUE 88.6 89.7 89.9 90.9 91.6 92.2BRAZORIA 1322.8 1342.8 1352.5 1373.1 1389.8 1404.6BRAZOS 443.9 455.9 465.0 478.3 490.2 476.6BREWSTER 23.7 24.0 24.1 24.3 24.6 24.7BROOKS 19.9 20.2 20.3 20.6 20.8 21.1BROWN 112.9 114.3 115.1 116.7 121.6 122.8BURLESON 27.8 28.7 29.4 30.3 31.2 34.4BURNET 123.5 128.4 132.6 138.1 143.5 148.6CALDWELL 97.9 101.1 103.6 107.1 110.4 113.6CALHOUN 265.8 268.5 272.4 278.0 282.7 286.7CALLAHAN 32.4 32.8 32.9 33.3 33.6 33.9CAMERON 709.9 744.0 780.6 821.0 861.6 896.6CHAMBERS 224.0 226.6 227.2 229.8 231.8 233.5CHEROKEE 94.9 96.0 96.4 97.6 98.5 99.3CHILDRESS 16.6 16.9 17.0 17.3 17.5 17.7CLAY 29.5 30.1 30.7 31.4 32.0 32.6COKE 15.6 15.8 15.9 16.2 16.4 16.5COLEMAN 35.2 35.6 35.7 36.2 36.4 36.6COLLIN 2134.3 2228.4 2296.2 2385.4 2468.0 2561.8COLORADO 83.2 85.0 86.3 88.3 90.1 91.8COMAL 323.5 354.1 365.8 381.1 396.2 410.6COMANCHE 48.1 49.4 50.2 51.5 52.7 53.9CONCHO 11.3 11.4 11.5 11.7 11.9 12.0COOKE 116.6 119.5 121.6 124.8 127.7 130.4CORYELL 118.5 123.1 123.6 138.4 141.8 145.0COTTLE 4.5 4.6 4.6 4.7 4.8 4.9
Summer Coincident Demand by County
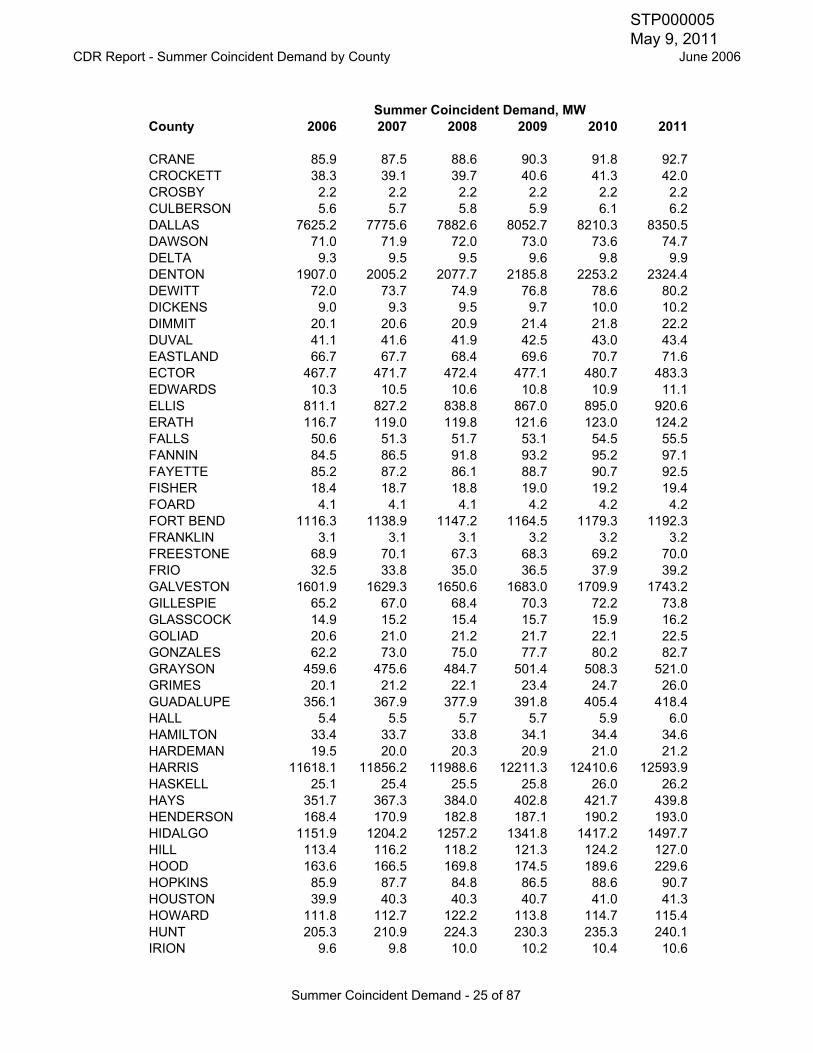
The demands shown were estimated by using the forecasted non-coincident loads from the 2006 ALDRs to determine a proportion of the total for each county for each year and then applying those proportions to the forecasted ERCOT peak demand.
Summer Coincident Demand, MW
Summer Coincident Demand - 24 of 87
STP000005 May 9, 2011
CDR Report - Summer Coincident Demand by County June 2006
County 2006 2007 2008 2009 2010 2011Summer Coincident Demand, MW
CRANE 85.9 87.5 88.6 90.3 91.8 92.7CROCKETT 38.3 39.1 39.7 40.6 41.3 42.0CROSBY 2.2 2.2 2.2 2.2 2.2 2.2CULBERSON 5.6 5.7 5.8 5.9 6.1 6.2DALLAS 7625.2 7775.6 7882.6 8052.7 8210.3 8350.5DAWSON 71.0 71.9 72.0 73.0 73.6 74.7DELTA 9.3 9.5 9.5 9.6 9.8 9.9DENTON 1907.0 2005.2 2077.7 2185.8 2253.2 2324.4DEWITT 72.0 73.7 74.9 76.8 78.6 80.2DICKENS 9.0 9.3 9.5 9.7 10.0 10.2DIMMIT 20.1 20.6 20.9 21.4 21.8 22.2DUVAL 41.1 41.6 41.9 42.5 43.0 43.4EASTLAND 66.7 67.7 68.4 69.6 70.7 71.6ECTOR 467.7 471.7 472.4 477.1 480.7 483.3EDWARDS 10.3 10.5 10.6 10.8 10.9 11.1ELLIS 811.1 827.2 838.8 867.0 895.0 920.6ERATH 116.7 119.0 119.8 121.6 123.0 124.2FALLS 50.6 51.3 51.7 53.1 54.5 55.5FANNIN 84.5 86.5 91.8 93.2 95.2 97.1FAYETTE 85.2 87.2 86.1 88.7 90.7 92.5FISHER 18.4 18.7 18.8 19.0 19.2 19.4FOARD 4.1 4.1 4.1 4.2 4.2 4.2FORT BEND 1116.3 1138.9 1147.2 1164.5 1179.3 1192.3FRANKLIN 3.1 3.1 3.1 3.2 3.2 3.2FREESTONE 68.9 70.1 67.3 68.3 69.2 70.0FRIO 32.5 33.8 35.0 36.5 37.9 39.2GALVESTON 1601.9 1629.3 1650.6 1683.0 1709.9 1743.2GILLESPIE 65.2 67.0 68.4 70.3 72.2 73.8GLASSCOCK 14.9 15.2 15.4 15.7 15.9 16.2GOLIAD 20.6 21.0 21.2 21.7 22.1 22.5GONZALES 62.2 73.0 75.0 77.7 80.2 82.7GRAYSON 459.6 475.6 484.7 501.4 508.3 521.0GRIMES 20.1 21.2 22.1 23.4 24.7 26.0GUADALUPE 356.1 367.9 377.9 391.8 405.4 418.4HALL 5.4 5.5 5.7 5.7 5.9 6.0HAMILTON 33.4 33.7 33.8 34.1 34.4 34.6HARDEMAN 19.5 20.0 20.3 20.9 21.0 21.2HARRIS 11618.1 11856.2 11988.6 12211.3 12410.6 12593.9HASKELL 25.1 25.4 25.5 25.8 26.0 26.2HAYS 351.7 367.3 384.0 402.8 421.7 439.8HENDERSON 168.4 170.9 182.8 187.1 190.2 193.0HIDALGO 1151.9 1204.2 1257.2 1341.8 1417.2 1497.7HILL 113.4 116.2 118.2 121.3 124.2 127.0HOOD 163.6 166.5 169.8 174.5 189.6 229.6HOPKINS 85.9 87.7 84.8 86.5 88.6 90.7HOUSTON 39.9 40.3 40.3 40.7 41.0 41.3HOWARD 111.8 112.7 122.2 113.8 114.7 115.4HUNT 205.3 210.9 224.3 230.3 235.3 240.1IRION 9.6 9.8 10.0 10.2 10.4 10.6
Summer Coincident Demand - 25 of 87
STP000005 May 9, 2011

CDR Report - Summer Coincident Demand by County June 2006
County 2006 2007 2008 2009 2010 2011Summer Coincident Demand, MW
JACK 25.0 25.6 26.0 26.5 27.1 27.6JACKSON 37.4 37.9 38.2 38.8 39.4 39.8JEFF DAVIS 4.6 4.8 4.9 5.1 5.2 5.4JIM HOGG 3.9 4.0 4.1 4.2 4.3 4.4JIM WELLS 87.5 89.4 90.8 92.9 94.7 96.3JOHNSON 353.8 371.4 384.2 399.6 416.7 433.0JONES 39.5 39.9 40.0 40.4 40.7 40.9KARNES 26.5 26.8 26.9 27.2 27.5 27.8KAUFMAN 325.0 362.2 355.5 372.8 384.8 397.3KENDALL 75.5 80.1 84.3 87.3 92.5 97.5KENEDY 1.1 1.1 1.1 1.2 1.2 1.2KENT 47.6 47.7 47.6 47.8 47.9 48.0KERR 128.0 131.3 133.8 137.5 141.6 145.4KIMBLE 19.1 19.4 19.7 20.1 20.4 20.8KING 7.2 7.2 7.1 7.1 7.1 7.1KINNEY 7.6 7.7 7.8 7.9 8.0 8.1KLEBERG 105.0 106.4 107.0 108.5 109.7 110.6KNOX 21.9 22.3 22.6 23.1 23.5 23.9LA SALLE 13.7 14.2 14.7 15.3 15.8 16.4LAMAR 169.3 172.0 173.7 176.3 179.2 182.0LAMPASAS 48.4 50.6 52.4 54.7 57.0 59.2LAVACA 38.7 39.7 40.5 41.6 42.7 43.8LEE 35.7 36.5 37.1 38.0 38.8 39.5LEON 157.7 159.9 161.0 163.6 165.9 167.9LIMESTONE 64.5 65.9 66.9 68.6 70.2 71.8LIVE OAK 79.5 81.2 82.3 84.0 85.6 87.0LLANO 71.6 73.8 75.5 77.8 80.0 82.1LOVING 4.9 4.9 4.9 5.0 5.0 5.0MADISON 7.6 7.8 7.9 8.1 8.3 8.5MARTIN 27.6 27.9 28.0 28.4 28.7 29.0MASON 11.0 11.1 11.1 11.2 11.3 11.4MATAGORDA 152.0 154.8 157.0 159.9 162.2 164.3MAVERICK 86.0 89.6 93.1 97.5 101.7 105.2MCCULLOCH 42.8 43.7 44.3 45.2 46.1 46.9MCLENNAN 708.6 729.8 743.4 761.6 777.6 792.7MCMULLEN 5.6 5.8 5.8 6.0 6.1 6.2MEDINA 178.0 184.4 203.7 211.5 219.4 226.9MENARD 4.1 4.1 4.2 4.2 4.3 4.3MIDLAND 322.4 325.4 326.3 329.7 332.4 334.4MILAM 73.3 75.3 76.4 78.1 79.7 81.3MILLS 8.8 9.0 9.1 9.2 9.4 9.5MITCHELL 18.0 18.2 18.2 18.4 18.6 18.7MONTAGUE 65.5 67.2 68.3 70.1 71.8 73.4MONTGOMERY 242.4 259.2 269.1 281.7 294.2 306.6MOTLEY 4.1 4.3 4.4 4.6 4.8 4.9NACOGDOCHES 162.8 166.4 167.1 169.3 171.0 172.5NAVARRO 201.4 217.9 227.7 233.1 238.3 243.2NOLAN 55.4 55.9 56.0 56.6 56.9 57.3NUECES 1041.7 1060.5 1072.4 1092.5 1109.0 1123.5
Summer Coincident Demand - 26 of 87
STP000005 May 9, 2011

CDR Report - Summer Coincident Demand by County June 2006
County 2006 2007 2008 2009 2010 2011Summer Coincident Demand, MW
PALO PINTO 83.2 85.5 88.8 90.9 92.8 94.5PARKER 297.6 303.5 311.4 317.2 326.9 327.7PECOS 105.9 108.5 110.3 113.0 115.5 117.8PRESIDIO 11.8 12.3 12.6 13.0 13.4 13.8RAINS 22.8 23.2 23.4 23.8 24.5 25.2REAGAN 13.0 13.3 13.5 13.8 14.0 14.3REAL 12.4 12.8 13.2 13.8 14.3 14.7RED RIVER 38.5 39.1 37.0 38.0 38.7 39.4REEVES 65.4 66.3 66.7 67.7 68.6 69.3REFUGIO 25.7 26.0 26.1 26.5 26.8 27.0ROBERTSON 20.9 21.6 22.4 23.3 24.3 25.3ROCKWALL 247.6 261.1 273.2 288.1 304.3 309.6RUNNELS 34.2 34.7 34.9 35.5 35.9 36.3RUSK 18.0 18.1 18.0 18.1 18.2 18.3SAN PATRICIO 209.7 213.3 215.5 219.4 222.7 225.5SAN SABA 12.2 12.5 12.6 12.9 13.1 13.3SCHLEICHER 9.7 9.7 9.7 9.7 9.8 9.8SCURRY 238.4 240.0 240.0 242.0 243.4 244.4SHACKELFORD 23.6 24.0 24.2 24.6 25.0 25.3SMITH 619.3 627.4 630.9 639.6 646.8 652.8SOMERVELL 50.9 52.3 53.2 54.5 54.8 56.0STARR 92.8 96.4 100.1 104.7 109.3 113.5STEPHENS 60.8 62.2 63.1 64.6 65.9 66.9STERLING 9.9 10.0 10.0 10.2 10.3 10.4STONEWALL 7.6 7.8 8.0 8.3 8.6 8.8SUTTON 13.7 13.9 14.1 14.3 14.5 14.7TARRANT 4909.9 5050.3 5172.1 5316.6 5460.1 5602.8TAYLOR 364.5 367.3 367.1 370.1 372.3 373.8TERRELL 4.2 4.3 4.3 4.3 4.4 4.4THROCKMORTON 8.6 8.7 8.8 8.9 9.1 9.2TOM GREEN 280.0 283.5 284.3 287.6 289.9 291.7TRAVIS 2624.9 2672.1 2664.6 2679.0 2694.6 2710.6UPTON 26.1 27.0 27.8 28.8 29.7 30.5UVALDE 56.8 58.7 60.5 62.8 65.0 66.7VAL VERDE 91.0 93.9 96.9 100.7 104.2 107.0VAN ZANDT 88.8 90.1 90.8 92.3 94.2 96.1VICTORIA 341.5 349.8 355.7 364.3 371.7 378.2WALLER 208.2 215.2 220.4 227.6 234.5 241.1WARD 60.1 60.6 60.6 61.2 61.7 62.0WASHINGTON 109.4 108.2 109.6 111.9 114.0 115.9WEBB 429.3 443.5 454.6 469.5 483.3 496.2WHARTON 122.0 123.3 123.7 125.2 126.5 127.4WICHITA 430.9 434.2 435.1 439.3 442.4 444.8WILBARGER 47.8 48.4 48.8 49.5 50.1 50.7WILLACY 39.5 41.0 42.5 44.3 46.2 47.9WILLIAMSON 864.2 897.2 933.3 978.9 1028.6 1073.6WILSON 84.4 86.9 88.9 91.6 94.2 96.6WINKLER 69.4 70.1 70.4 71.2 71.9 72.5WISE 238.8 246.8 265.6 274.7 284.0 293.5
Summer Coincident Demand - 27 of 87
STP000005 May 9, 2011

CDR Report - Summer Coincident Demand by County June 2006
County 2006 2007 2008 2009 2010 2011Summer Coincident Demand, MW
YOUNG 69.1 70.8 71.9 73.7 75.3 76.8ZAPATA 26.8 27.7 28.4 29.4 30.3 31.2ZAVALA 22.1 22.8 23.5 24.3 25.2 25.8
Summer Coincident Demand - 28 of 87
STP000005 May 9, 2011

CDR Report - Summer Load by County June 2006
County 2006 2007 2008 2009 2010 2011
ANDERSON 177.1 179.6 182.2 184.9 188.0 191.2ANDREWS 173.0 174.3 175.6 176.9 178.2 179.5ANGELINA 370.6 374.1 377.6 381.2 384.7 388.3ARANSAS 72.8 74.4 76.0 77.6 79.2 80.8ARCHER 30.9 31.6 32.3 33.0 33.6 34.3ATASCOSA 83.1 85.1 87.1 89.2 91.2 93.1AUSTIN 103.5 105.2 106.9 108.7 110.5 112.3BANDERA 62.7 65.9 64.6 68.0 71.4 74.9BASTROP 217.0 221.6 233.4 235.3 247.3 259.3BAYLOR 18.7 18.7 18.8 18.8 18.9 18.9BEE 71.7 72.5 73.3 74.1 74.9 75.8BELL 889.1 917.1 942.5 955.4 981.3 1007.1BEXAR 4895.0 4982.7 5093.1 5244.5 5498.0 5712.3BLANCO 32.6 33.6 34.8 36.1 37.4 38.8BORDEN 2.0 2.0 2.0 2.0 2.0 2.1BOSQUE 102.6 103.7 104.6 105.5 106.4 107.3BRAZORIA 1530.7 1552.8 1573.6 1594.2 1614.1 1634.5BRAZOS 513.7 527.2 541.0 555.3 569.4 554.7BREWSTER 27.5 27.7 28.0 28.3 28.5 28.8BROOKS 23.0 23.3 23.6 23.9 24.2 24.5BROWN 130.6 132.2 133.9 135.5 141.2 142.9BURLESON 32.2 33.2 34.2 35.2 36.2 40.0BURNET 142.9 148.5 154.3 160.3 166.6 172.9CALDWELL 113.3 116.9 120.5 124.4 128.3 132.1CALHOUN 307.6 310.5 316.9 322.8 328.4 333.7CALLAHAN 37.4 37.9 38.2 38.6 39.1 39.5CAMERON 821.4 860.3 908.2 953.2 1000.7 1043.4CHAMBERS 259.2 262.0 264.3 266.7 269.2 271.8CHEROKEE 109.9 111.0 112.1 113.3 114.4 115.6CHILDRESS 19.2 19.5 19.8 20.1 20.3 20.6CLAY 34.1 34.9 35.7 36.4 37.1 37.9COKE 18.1 18.3 18.5 18.8 19.0 19.2COLEMAN 40.7 41.2 41.6 42.0 42.3 42.6COLLIN 2469.8 2576.9 2671.6 2769.5 2866.3 2981.3COLORADO 96.3 98.3 100.4 102.5 104.7 106.9COMAL 374.3 409.5 425.6 442.5 460.1 477.8COMANCHE 55.6 57.1 58.4 59.8 61.2 62.7CONCHO 13.0 13.2 13.4 13.6 13.8 14.0COOKE 135.0 138.2 141.5 144.9 148.3 151.7CORYELL 137.1 142.4 143.8 160.7 164.6 168.7
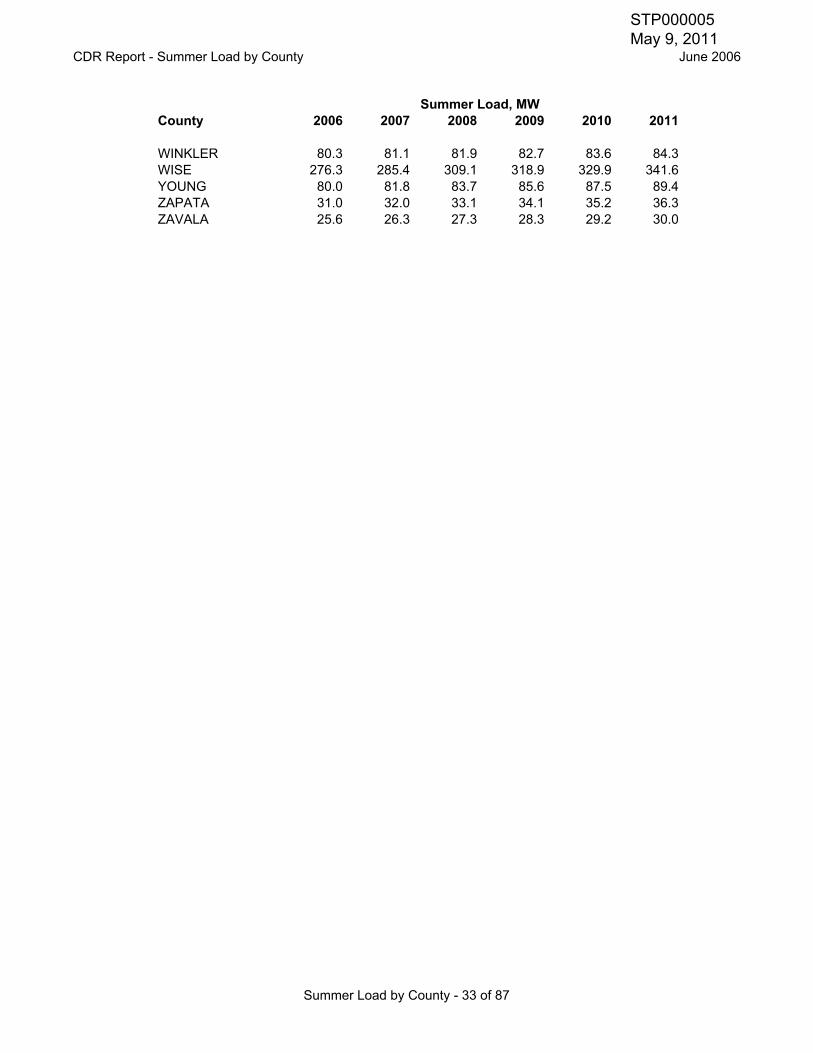
Summer Load by County
Summer Load, MW
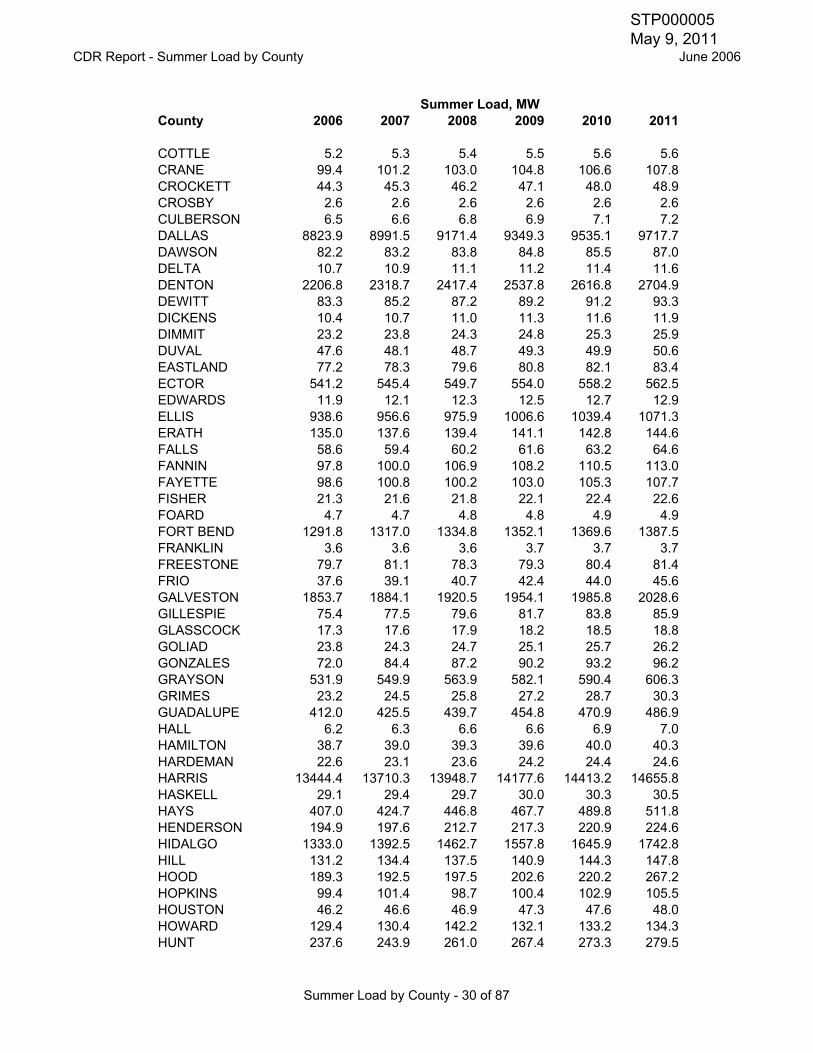
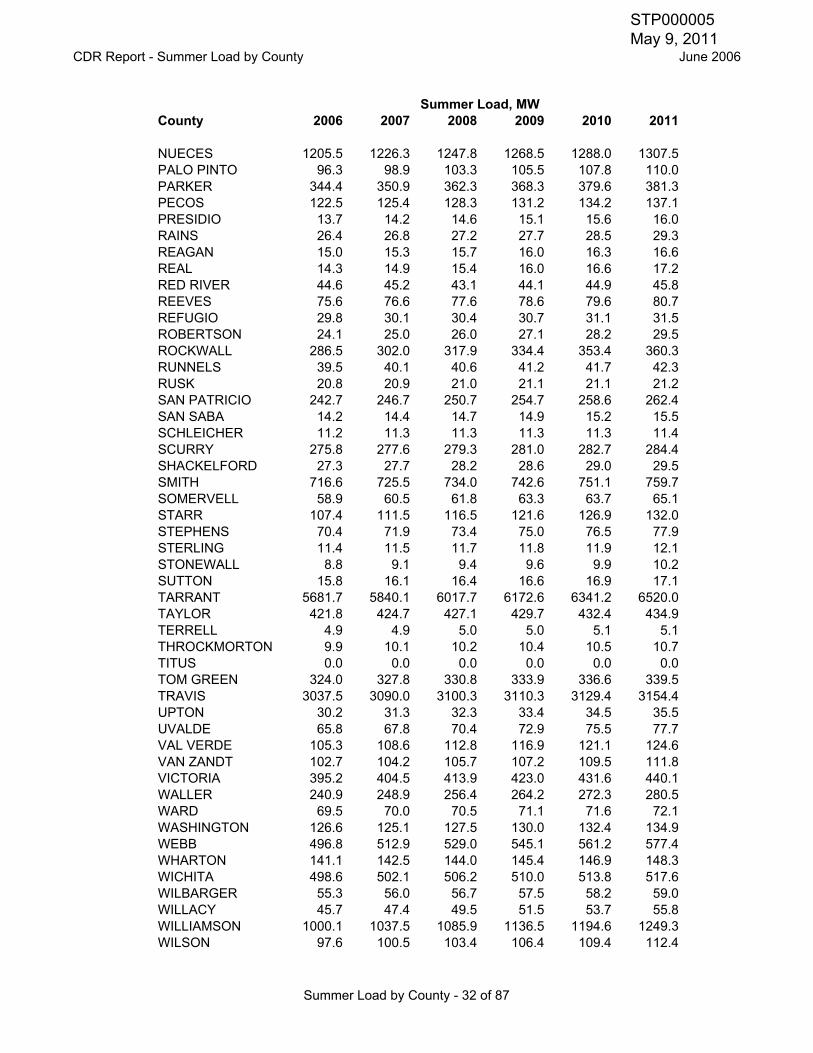
The loads shown are the non-coincident loads of the individual delivery points from the 2006 ALDRs and do not include self-serve loads. The values shown here are used in the summer import/export calculations.
Summer Load by County - 29 of 87
STP000005 May 9, 2011
CDR Report - Summer Load by County June 2006
County 2006 2007 2008 2009 2010 2011Summer Load, MW
COTTLE 5.2 5.3 5.4 5.5 5.6 5.6CRANE 99.4 101.2 103.0 104.8 106.6 107.8CROCKETT 44.3 45.3 46.2 47.1 48.0 48.9CROSBY 2.6 2.6 2.6 2.6 2.6 2.6CULBERSON 6.5 6.6 6.8 6.9 7.1 7.2DALLAS 8823.9 8991.5 9171.4 9349.3 9535.1 9717.7DAWSON 82.2 83.2 83.8 84.8 85.5 87.0DELTA 10.7 10.9 11.1 11.2 11.4 11.6DENTON 2206.8 2318.7 2417.4 2537.8 2616.8 2704.9DEWITT 83.3 85.2 87.2 89.2 91.2 93.3DICKENS 10.4 10.7 11.0 11.3 11.6 11.9DIMMIT 23.2 23.8 24.3 24.8 25.3 25.9DUVAL 47.6 48.1 48.7 49.3 49.9 50.6EASTLAND 77.2 78.3 79.6 80.8 82.1 83.4ECTOR 541.2 545.4 549.7 554.0 558.2 562.5EDWARDS 11.9 12.1 12.3 12.5 12.7 12.9ELLIS 938.6 956.6 975.9 1006.6 1039.4 1071.3ERATH 135.0 137.6 139.4 141.1 142.8 144.6FALLS 58.6 59.4 60.2 61.6 63.2 64.6FANNIN 97.8 100.0 106.9 108.2 110.5 113.0FAYETTE 98.6 100.8 100.2 103.0 105.3 107.7FISHER 21.3 21.6 21.8 22.1 22.4 22.6FOARD 4.7 4.7 4.8 4.8 4.9 4.9FORT BEND 1291.8 1317.0 1334.8 1352.1 1369.6 1387.5FRANKLIN 3.6 3.6 3.6 3.7 3.7 3.7FREESTONE 79.7 81.1 78.3 79.3 80.4 81.4FRIO 37.6 39.1 40.7 42.4 44.0 45.6GALVESTON 1853.7 1884.1 1920.5 1954.1 1985.8 2028.6GILLESPIE 75.4 77.5 79.6 81.7 83.8 85.9GLASSCOCK 17.3 17.6 17.9 18.2 18.5 18.8GOLIAD 23.8 24.3 24.7 25.1 25.7 26.2GONZALES 72.0 84.4 87.2 90.2 93.2 96.2GRAYSON 531.9 549.9 563.9 582.1 590.4 606.3GRIMES 23.2 24.5 25.8 27.2 28.7 30.3GUADALUPE 412.0 425.5 439.7 454.8 470.9 486.9HALL 6.2 6.3 6.6 6.6 6.9 7.0HAMILTON 38.7 39.0 39.3 39.6 40.0 40.3HARDEMAN 22.6 23.1 23.6 24.2 24.4 24.6HARRIS 13444.4 13710.3 13948.7 14177.6 14413.2 14655.8HASKELL 29.1 29.4 29.7 30.0 30.3 30.5HAYS 407.0 424.7 446.8 467.7 489.8 511.8HENDERSON 194.9 197.6 212.7 217.3 220.9 224.6HIDALGO 1333.0 1392.5 1462.7 1557.8 1645.9 1742.8HILL 131.2 134.4 137.5 140.9 144.3 147.8HOOD 189.3 192.5 197.5 202.6 220.2 267.2HOPKINS 99.4 101.4 98.7 100.4 102.9 105.5HOUSTON 46.2 46.6 46.9 47.3 47.6 48.0HOWARD 129.4 130.4 142.2 132.1 133.2 134.3HUNT 237.6 243.9 261.0 267.4 273.3 279.5
Summer Load by County - 30 of 87
STP000005 May 9, 2011

CDR Report - Summer Load by County June 2006
County 2006 2007 2008 2009 2010 2011Summer Load, MW
IRION 11.2 11.4 11.6 11.9 12.1 12.3JACK 29.0 29.6 30.2 30.8 31.4 32.1JACKSON 43.3 43.9 44.5 45.1 45.7 46.3JEFF DAVIS 5.3 5.5 5.7 5.9 6.1 6.3JIM HOGG 4.6 4.7 4.8 4.9 5.0 5.1JIM WELLS 101.2 103.4 105.6 107.8 110.0 112.1JOHNSON 409.4 429.4 447.0 463.9 484.0 503.9JONES 45.8 46.2 46.5 46.9 47.3 47.7KARNES 30.7 31.0 31.3 31.5 31.9 32.3KAUFMAN 376.1 418.8 413.6 432.8 446.9 462.4KENDALL 87.4 92.6 98.0 101.4 107.4 113.5KENEDY 1.2 1.2 1.2 1.3 1.3 1.3KENT 55.0 55.2 55.4 55.5 55.7 55.8KERR 148.1 151.9 155.7 159.6 164.4 169.2KIMBLE 22.1 22.5 22.9 23.3 23.7 24.2KING 8.3 8.3 8.3 8.3 8.3 8.3KINNEY 8.8 8.9 9.0 9.2 9.3 9.4KLEBERG 121.5 123.0 124.5 125.9 127.4 128.8KNOX 25.3 25.8 26.3 26.8 27.3 27.8LA SALLE 15.8 16.5 17.1 17.8 18.4 19.0LAMAR 195.9 198.9 202.1 204.7 208.2 211.8LAMPASAS 56.1 58.5 60.9 63.5 66.2 68.9LAVACA 44.7 45.9 47.1 48.3 49.6 50.9LEE 41.3 42.2 43.2 44.1 45.0 46.0LEON 182.5 184.9 187.4 189.9 192.6 195.4LIMESTONE 74.6 76.2 77.9 79.7 81.6 83.6LIVE OAK 92.0 93.9 95.8 97.5 99.4 101.2LLANO 82.9 85.3 87.8 90.3 92.9 95.5LOVING 5.6 5.7 5.7 5.8 5.8 5.8MADISON 8.8 9.0 9.2 9.5 9.7 9.9MARTIN 31.9 32.3 32.6 33.0 33.3 33.7MASON 12.7 12.8 12.9 13.0 13.2 13.3MATAGORDA 175.9 179.0 182.7 185.6 188.4 191.2MAVERICK 99.6 103.6 108.4 113.2 118.1 122.4MCCULLOCH 49.6 50.5 51.5 52.5 53.5 54.6MCLENNAN 820.0 844.0 865.0 884.2 903.0 922.5MCMULLEN 6.5 6.7 6.8 6.9 7.1 7.3MEDINA 206.0 213.2 237.0 245.6 254.8 264.1MENARD 4.7 4.8 4.8 4.9 5.0 5.0MIDLAND 373.1 376.3 379.6 382.8 386.0 389.2MILAM 84.8 87.1 88.9 90.7 92.6 94.6MILLS 10.2 10.4 10.5 10.7 10.9 11.0MITCHELL 20.8 21.0 21.2 21.4 21.6 21.8MONTAGUE 75.8 77.7 79.5 81.4 83.4 85.4MONTGOMERY 280.5 299.7 313.1 327.1 341.6 356.8MOTLEY 4.7 4.9 5.2 5.3 5.6 5.7NACOGDOCHES 188.4 192.4 194.5 196.5 198.6 200.7NAVARRO 233.0 252.0 264.9 270.6 276.7 283.0NOLAN 64.1 64.7 65.2 65.7 66.1 66.7
Summer Load by County - 31 of 87
STP000005 May 9, 2011
CDR Report - Summer Load by County June 2006
County 2006 2007 2008 2009 2010 2011Summer Load, MW
NUECES 1205.5 1226.3 1247.8 1268.5 1288.0 1307.5PALO PINTO 96.3 98.9 103.3 105.5 107.8 110.0PARKER 344.4 350.9 362.3 368.3 379.6 381.3PECOS 122.5 125.4 128.3 131.2 134.2 137.1PRESIDIO 13.7 14.2 14.6 15.1 15.6 16.0RAINS 26.4 26.8 27.2 27.7 28.5 29.3REAGAN 15.0 15.3 15.7 16.0 16.3 16.6REAL 14.3 14.9 15.4 16.0 16.6 17.2RED RIVER 44.6 45.2 43.1 44.1 44.9 45.8REEVES 75.6 76.6 77.6 78.6 79.6 80.7REFUGIO 29.8 30.1 30.4 30.7 31.1 31.5ROBERTSON 24.1 25.0 26.0 27.1 28.2 29.5ROCKWALL 286.5 302.0 317.9 334.4 353.4 360.3RUNNELS 39.5 40.1 40.6 41.2 41.7 42.3RUSK 20.8 20.9 21.0 21.1 21.1 21.2SAN PATRICIO 242.7 246.7 250.7 254.7 258.6 262.4SAN SABA 14.2 14.4 14.7 14.9 15.2 15.5SCHLEICHER 11.2 11.3 11.3 11.3 11.3 11.4SCURRY 275.8 277.6 279.3 281.0 282.7 284.4SHACKELFORD 27.3 27.7 28.2 28.6 29.0 29.5SMITH 716.6 725.5 734.0 742.6 751.1 759.7SOMERVELL 58.9 60.5 61.8 63.3 63.7 65.1STARR 107.4 111.5 116.5 121.6 126.9 132.0STEPHENS 70.4 71.9 73.4 75.0 76.5 77.9STERLING 11.4 11.5 11.7 11.8 11.9 12.1STONEWALL 8.8 9.1 9.4 9.6 9.9 10.2SUTTON 15.8 16.1 16.4 16.6 16.9 17.1TARRANT 5681.7 5840.1 6017.7 6172.6 6341.2 6520.0TAYLOR 421.8 424.7 427.1 429.7 432.4 434.9TERRELL 4.9 4.9 5.0 5.0 5.1 5.1THROCKMORTON 9.9 10.1 10.2 10.4 10.5 10.7TITUS 0.0 0.0 0.0 0.0 0.0 0.0TOM GREEN 324.0 327.8 330.8 333.9 336.6 339.5TRAVIS 3037.5 3090.0 3100.3 3110.3 3129.4 3154.4UPTON 30.2 31.3 32.3 33.4 34.5 35.5UVALDE 65.8 67.8 70.4 72.9 75.5 77.7VAL VERDE 105.3 108.6 112.8 116.9 121.1 124.6VAN ZANDT 102.7 104.2 105.7 107.2 109.5 111.8VICTORIA 395.2 404.5 413.9 423.0 431.6 440.1WALLER 240.9 248.9 256.4 264.2 272.3 280.5WARD 69.5 70.0 70.5 71.1 71.6 72.1WASHINGTON 126.6 125.1 127.5 130.0 132.4 134.9WEBB 496.8 512.9 529.0 545.1 561.2 577.4WHARTON 141.1 142.5 144.0 145.4 146.9 148.3WICHITA 498.6 502.1 506.2 510.0 513.8 517.6WILBARGER 55.3 56.0 56.7 57.5 58.2 59.0WILLACY 45.7 47.4 49.5 51.5 53.7 55.8WILLIAMSON 1000.1 1037.5 1085.9 1136.5 1194.6 1249.3WILSON 97.6 100.5 103.4 106.4 109.4 112.4
Summer Load by County - 32 of 87
STP000005 May 9, 2011
CDR Report - Summer Load by County June 2006
County 2006 2007 2008 2009 2010 2011Summer Load, MW
WINKLER 80.3 81.1 81.9 82.7 83.6 84.3WISE 276.3 285.4 309.1 318.9 329.9 341.6YOUNG 80.0 81.8 83.7 85.6 87.5 89.4ZAPATA 31.0 32.0 33.1 34.1 35.2 36.3ZAVALA 25.6 26.3 27.3 28.3 29.2 30.0
Summer Load by County - 33 of 87
STP000005 May 9, 2011

CDR Report - Summer Generation by County June 2006
County 2006 2007 2008 2009 2010 2011
ANDERSON 0.0 0.0 0.0 0.0 0.0 0.0ANDREWS 0.0 0.0 0.0 0.0 0.0 0.0ANGELINA 0.0 0.0 0.0 0.0 0.0 0.0ARANSAS 0.0 0.0 0.0 0.0 0.0 0.0ARCHER 0.0 0.0 0.0 0.0 0.0 0.0ATASCOSA 396.0 396.0 396.0 396.0 396.0 396.0AUSTIN 0.0 0.0 0.0 0.0 0.0 0.0BANDERA 0.0 0.0 0.0 0.0 0.0 0.0BASTROP 1111.0 1111.0 1111.0 1111.0 1111.0 1111.0BAYLOR 0.0 0.0 0.0 0.0 0.0 0.0BEE 0.0 0.0 0.0 0.0 0.0 0.0BELL 0.0 0.0 0.0 0.0 0.0 0.0BEXAR 4322.6 4322.6 4322.6 4264.6 5014.6 5014.6BLANCO 0.0 0.0 0.0 0.0 0.0 0.0BORDEN 2.2 2.2 2.2 2.2 2.2 2.2BOSQUE 556.0 556.0 556.0 556.0 556.0 556.0BRAZORIA 610.0 610.0 325.0 325.0 325.0 325.0BRAZOS 288.0 288.0 288.0 288.0 288.0 288.0BREWSTER 0.0 0.0 0.0 0.0 0.0 0.0BROOKS 0.0 0.0 0.0 0.0 0.0 0.0BROWN 0.0 0.0 0.0 0.0 0.0 0.0BURLESON 0.0 0.0 0.0 0.0 0.0 0.0BURNET 95.0 95.0 95.0 95.0 95.0 95.0CALDWELL 0.0 0.0 0.0 0.0 0.0 0.0CALHOUN 459.0 459.0 459.0 459.0 459.0 459.0CALLAHAN 0.0 0.0 0.0 0.0 0.0 0.0CAMERON 360.0 435.0 435.0 435.0 435.0 435.0CHAMBERS 2829.9 2829.9 2829.9 2829.9 2829.9 2829.9CHEROKEE 693.0 693.0 693.0 693.0 693.0 693.0CHILDRESS 0.0 0.0 0.0 0.0 0.0 0.0CLAY 0.0 0.0 0.0 0.0 0.0 0.0COKE 0.0 0.0 0.0 0.0 0.0 0.0COLEMAN 0.0 0.0 0.0 0.0 0.0 0.0COLLIN 545.0 545.0 545.0 545.0 545.0 545.0COLORADO 0.0 0.0 0.0 0.0 0.0 0.0COMAL 6.0 6.0 6.0 6.0 6.0 6.0COMANCHE 0.0 0.0 0.0 0.0 0.0 0.0CONCHO 0.0 0.0 0.0 0.0 0.0 0.0COOKE 0.0 0.0 0.0 0.0 0.0 0.0
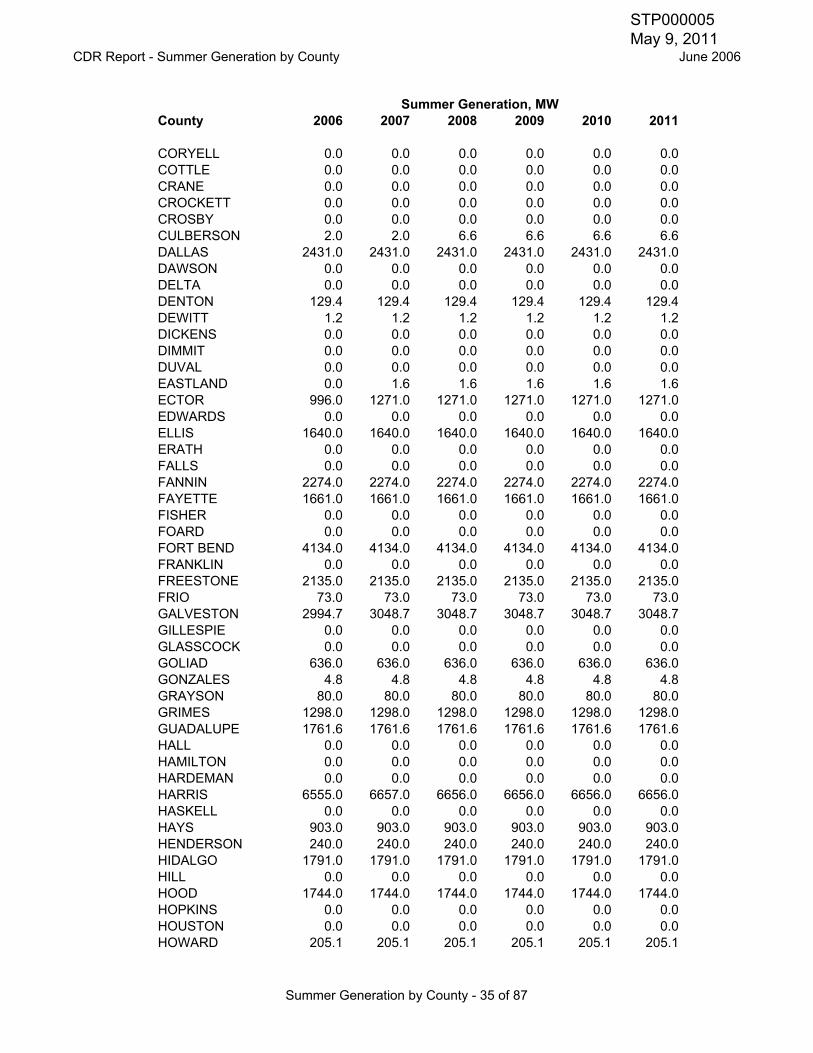
Summer Generation by County
These values are used in the summer import/export calculations for each county. Capacities for mothballed units are included as the total capacity of the unit. Capacities for the wind units are at 2.6%. Asynchronous ties are shown at 50%. These values include the amount available for the grid according information from the owners of the private network units and the distributed generation units that have registered with ERCOT.
Summer Generation, MW
Summer Generation by County - 34 of 87
STP000005 May 9, 2011
CDR Report - Summer Generation by County June 2006
County 2006 2007 2008 2009 2010 2011Summer Generation, MW
CORYELL 0.0 0.0 0.0 0.0 0.0 0.0COTTLE 0.0 0.0 0.0 0.0 0.0 0.0CRANE 0.0 0.0 0.0 0.0 0.0 0.0CROCKETT 0.0 0.0 0.0 0.0 0.0 0.0CROSBY 0.0 0.0 0.0 0.0 0.0 0.0CULBERSON 2.0 2.0 6.6 6.6 6.6 6.6DALLAS 2431.0 2431.0 2431.0 2431.0 2431.0 2431.0DAWSON 0.0 0.0 0.0 0.0 0.0 0.0DELTA 0.0 0.0 0.0 0.0 0.0 0.0DENTON 129.4 129.4 129.4 129.4 129.4 129.4DEWITT 1.2 1.2 1.2 1.2 1.2 1.2DICKENS 0.0 0.0 0.0 0.0 0.0 0.0DIMMIT 0.0 0.0 0.0 0.0 0.0 0.0DUVAL 0.0 0.0 0.0 0.0 0.0 0.0EASTLAND 0.0 1.6 1.6 1.6 1.6 1.6ECTOR 996.0 1271.0 1271.0 1271.0 1271.0 1271.0EDWARDS 0.0 0.0 0.0 0.0 0.0 0.0ELLIS 1640.0 1640.0 1640.0 1640.0 1640.0 1640.0ERATH 0.0 0.0 0.0 0.0 0.0 0.0FALLS 0.0 0.0 0.0 0.0 0.0 0.0FANNIN 2274.0 2274.0 2274.0 2274.0 2274.0 2274.0FAYETTE 1661.0 1661.0 1661.0 1661.0 1661.0 1661.0FISHER 0.0 0.0 0.0 0.0 0.0 0.0FOARD 0.0 0.0 0.0 0.0 0.0 0.0FORT BEND 4134.0 4134.0 4134.0 4134.0 4134.0 4134.0FRANKLIN 0.0 0.0 0.0 0.0 0.0 0.0FREESTONE 2135.0 2135.0 2135.0 2135.0 2135.0 2135.0FRIO 73.0 73.0 73.0 73.0 73.0 73.0GALVESTON 2994.7 3048.7 3048.7 3048.7 3048.7 3048.7GILLESPIE 0.0 0.0 0.0 0.0 0.0 0.0GLASSCOCK 0.0 0.0 0.0 0.0 0.0 0.0GOLIAD 636.0 636.0 636.0 636.0 636.0 636.0GONZALES 4.8 4.8 4.8 4.8 4.8 4.8GRAYSON 80.0 80.0 80.0 80.0 80.0 80.0GRIMES 1298.0 1298.0 1298.0 1298.0 1298.0 1298.0GUADALUPE 1761.6 1761.6 1761.6 1761.6 1761.6 1761.6HALL 0.0 0.0 0.0 0.0 0.0 0.0HAMILTON 0.0 0.0 0.0 0.0 0.0 0.0HARDEMAN 0.0 0.0 0.0 0.0 0.0 0.0HARRIS 6555.0 6657.0 6656.0 6656.0 6656.0 6656.0HASKELL 0.0 0.0 0.0 0.0 0.0 0.0HAYS 903.0 903.0 903.0 903.0 903.0 903.0HENDERSON 240.0 240.0 240.0 240.0 240.0 240.0HIDALGO 1791.0 1791.0 1791.0 1791.0 1791.0 1791.0HILL 0.0 0.0 0.0 0.0 0.0 0.0HOOD 1744.0 1744.0 1744.0 1744.0 1744.0 1744.0HOPKINS 0.0 0.0 0.0 0.0 0.0 0.0HOUSTON 0.0 0.0 0.0 0.0 0.0 0.0HOWARD 205.1 205.1 205.1 205.1 205.1 205.1
Summer Generation by County - 35 of 87
STP000005 May 9, 2011

CDR Report - Summer Generation by County June 2006
County 2006 2007 2008 2009 2010 2011Summer Generation, MW
HUNT 87.0 87.0 87.0 87.0 87.0 87.0IRION 0.0 0.0 0.0 0.0 0.0 0.0JACK 620.0 620.0 620.0 620.0 620.0 620.0JACKSON 0.0 0.0 0.0 0.0 0.0 0.0JEFF DAVIS 0.0 0.0 0.0 0.0 0.0 0.0JIM HOGG 0.0 0.0 0.0 0.0 0.0 0.0JIM WELLS 0.0 0.0 0.0 0.0 0.0 0.0JOHNSON 258.0 258.0 258.0 258.0 258.0 258.0JONES 0.0 0.0 0.0 0.0 0.0 0.0KARNES 0.0 0.0 0.0 0.0 0.0 0.0KAUFMAN 1770.0 1770.0 1770.0 1770.0 1770.0 1770.0KENDALL 0.0 0.0 0.0 0.0 0.0 0.0KENEDY 0.0 0.0 0.0 0.0 0.0 0.0KENT 0.0 0.0 0.0 0.0 0.0 0.0KERR 0.0 0.0 0.0 0.0 0.0 0.0KIMBLE 0.0 0.0 0.0 0.0 0.0 0.0KING 0.0 0.0 0.0 0.0 0.0 0.0KINNEY 0.0 0.0 0.0 0.0 0.0 0.0KLEBERG 0.0 0.0 0.0 0.0 0.0 0.0KNOX 0.0 0.0 0.0 0.0 0.0 0.0LA SALLE 0.0 0.0 0.0 0.0 0.0 0.0LAMAR 1236.0 1236.0 1236.0 1236.0 1236.0 1236.0LAMPASAS 0.0 0.0 0.0 0.0 0.0 0.0LAVACA 0.0 0.0 0.0 0.0 0.0 0.0LEE 0.0 0.0 0.0 0.0 0.0 0.0LEON 0.0 0.0 0.0 0.0 0.0 0.0LIMESTONE 1761.0 1761.0 1761.0 1761.0 1761.0 1761.0LIVE OAK 0.0 0.0 0.0 0.0 0.0 0.0LLANO 484.0 484.0 484.0 484.0 484.0 484.0LOVING 0.0 0.0 0.0 0.0 0.0 0.0MADISON 0.0 0.0 0.0 0.0 0.0 0.0MARTIN 0.0 0.0 0.0 0.0 0.0 0.0MASON 0.0 0.0 0.0 0.0 0.0 0.0MATAGORDA 2560.0 2560.0 2560.0 2560.0 2560.0 2560.0MAVERICK 24.0 24.0 24.0 24.0 24.0 24.0MCCULLOCH 0.0 0.0 0.0 0.0 0.0 0.0MCLENNAN 1674.0 1674.0 1674.0 1674.0 1674.0 1674.0MCMULLEN 0.0 0.0 0.0 0.0 0.0 0.0MEDINA 0.0 0.0 0.0 0.0 0.0 0.0MENARD 0.0 0.0 0.0 0.0 0.0 0.0MIDLAND 0.0 0.0 0.0 0.0 0.0 0.0MILAM 545.0 545.0 545.0 545.0 545.0 545.0MILLS 0.0 0.0 0.0 0.0 0.0 0.0MITCHELL 989.0 989.0 989.0 989.0 989.0 989.0MONTAGUE 0.0 0.0 0.0 0.0 0.0 0.0MONTGOMERY 0.0 0.0 0.0 0.0 0.0 0.0MOTLEY 0.0 0.0 0.0 0.0 0.0 0.0NACOGDOCHES 0.0 0.0 0.0 0.0 0.0 0.0NAVARRO 0.0 0.0 0.0 0.0 0.0 0.0
Summer Generation by County - 36 of 87
STP000005 May 9, 2011

CDR Report - Summer Generation by County June 2006
County 2006 2007 2008 2009 2010 2011Summer Generation, MW
NOLAN 237.8 239.4 239.4 239.4 239.4 239.4NUECES 1911.0 1911.0 1901.0 1901.0 1901.0 1901.0PALO PINTO 635.0 635.0 635.0 635.0 635.0 635.0PARKER 79.4 79.4 79.4 79.4 79.4 79.4PECOS 10.5 10.5 10.5 10.5 10.5 10.5PRESIDIO 0.0 0.0 0.0 0.0 0.0 0.0RAINS 0.0 0.0 0.0 0.0 0.0 0.0REAGAN 0.0 0.0 0.0 0.0 0.0 0.0REAL 0.0 0.0 0.0 0.0 0.0 0.0RED RIVER 0.0 0.0 0.0 0.0 0.0 0.0REEVES 0.0 0.0 0.0 0.0 0.0 0.0REFUGIO 0.0 0.0 0.0 0.0 0.0 0.0ROBERTSON 306.0 306.0 306.0 306.0 306.0 306.0ROCKWALL 0.0 0.0 0.0 0.0 0.0 0.0RUNNELS 0.0 0.0 0.0 0.0 0.0 0.0RUSK 3231.0 3231.0 3231.0 3231.0 3231.0 3231.0SAN PATRICIO 400.0 400.0 400.0 400.0 400.0 400.0SAN SABA 0.0 0.0 0.0 0.0 0.0 0.0SCHLEICHER 0.0 0.0 0.0 0.0 0.0 0.0SCURRY 4.2 7.6 7.6 7.6 7.6 7.6SHACKELFORD 0.0 5.2 10.4 10.4 10.4 10.4SMITH 0.0 0.0 0.0 0.0 0.0 0.0SOMERVELL 2327.0 2327.0 2327.0 2327.0 2327.0 2327.0STARR 34.0 34.0 34.0 34.0 34.0 34.0STEPHENS 0.0 0.0 0.0 0.0 0.0 0.0STERLING 0.0 5.6 5.6 5.6 5.6 5.6STONEWALL 0.0 0.0 0.0 0.0 0.0 0.0SUTTON 0.0 0.0 0.0 0.0 0.0 0.0TARRANT 1958.5 1958.5 1958.5 1958.5 1958.5 1958.5TAYLOR 22.2 33.1 36.1 36.1 36.1 36.1TERRELL 0.0 0.0 0.0 0.0 0.0 0.0THROCKMORTON 0.0 0.0 0.0 0.0 0.0 0.0TITUS 2219.0 2219.0 2219.0 2219.0 2219.0 2219.0TOM GREEN 0.0 0.0 0.0 0.0 0.0 0.0TRAVIS 1958.0 1958.0 1565.0 1565.0 1565.0 1565.0UPTON 9.2 9.2 9.2 9.2 9.2 9.2UVALDE 0.0 0.0 0.0 0.0 0.0 0.0VAL VERDE 70.0 70.0 70.0 70.0 70.0 70.0VAN ZANDT 0.0 0.0 0.0 0.0 0.0 0.0VICTORIA 240.6 240.6 240.6 240.6 240.6 240.6WALLER 0.0 0.0 0.0 0.0 0.0 0.0WARD 995.0 995.0 995.0 995.0 995.0 995.0WASHINGTON 0.0 0.0 0.0 0.0 0.0 0.0WEBB 170.0 220.0 220.0 220.0 220.0 220.0WHARTON 72.0 347.0 347.0 347.0 347.0 347.0WICHITA 75.4 75.4 75.4 75.4 75.4 75.4WILBARGER 704.0 704.0 704.0 704.0 704.0 704.0WILLACY 0.0 0.0 0.0 0.0 0.0 0.0WILLIAMSON 0.0 0.0 0.0 0.0 0.0 0.0
Summer Generation by County - 37 of 87
STP000005 May 9, 2011

CDR Report - Summer Generation by County June 2006
County 2006 2007 2008 2009 2010 2011Summer Generation, MW
WILSON 0.0 0.0 0.0 0.0 0.0 0.0WINKLER 0.0 0.0 0.0 0.0 0.0 0.0WISE 665.0 665.0 665.0 665.0 665.0 665.0YOUNG 631.0 631.0 631.0 631.0 631.0 631.0ZAPATA 0.0 0.0 0.0 0.0 0.0 0.0ZAVALA 0.0 0.0 0.0 0.0 0.0 0.0
Summer Generation by County - 38 of 87
STP000005 May 9, 2011

CDR Report - Summer Import/Export by County June 2006
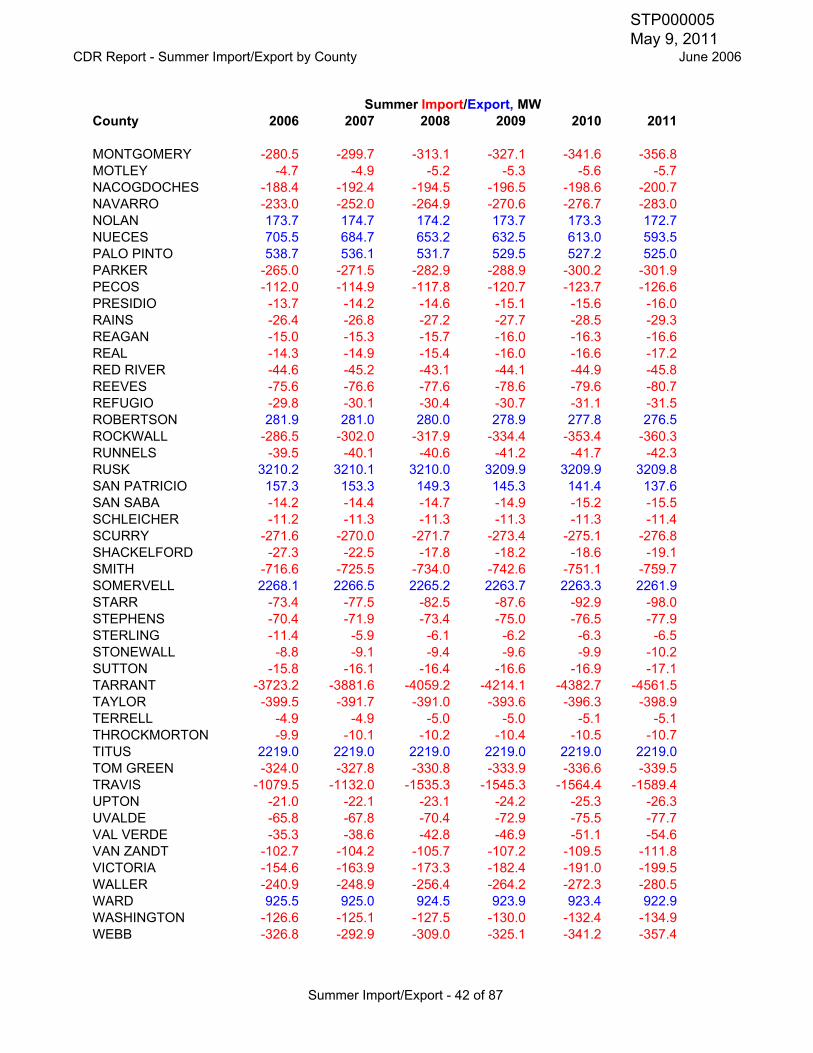
Import: The county has less generation than load and must import generation.Export: The county has more generation than load and is able to export generation.
County 2006 2007 2008 2009 2010 2011
ANDERSON -177.1 -179.6 -182.2 -184.9 -188.0 -191.2ANDREWS -173.0 -174.3 -175.6 -176.9 -178.2 -179.5ANGELINA -370.6 -374.1 -377.6 -381.2 -384.7 -388.3ARANSAS -72.8 -74.4 -76.0 -77.6 -79.2 -80.8ARCHER -30.9 -31.6 -32.3 -33.0 -33.6 -34.3ATASCOSA 312.9 310.9 308.9 306.8 304.8 302.9AUSTIN -103.5 -105.2 -106.9 -108.7 -110.5 -112.3BANDERA -62.7 -65.9 -64.6 -68.0 -71.4 -74.9BASTROP 894.0 889.4 877.6 875.7 863.7 851.7BAYLOR -18.7 -18.7 -18.8 -18.8 -18.9 -18.9BEE -71.7 -72.5 -73.3 -74.1 -74.9 -75.8BELL -889.1 -917.1 -942.5 -955.4 -981.3 -1007.1BEXAR -572.4 -660.1 -770.5 -979.9 -483.4 -697.7BLANCO -32.6 -33.6 -34.8 -36.1 -37.4 -38.8BORDEN 0.2 0.2 0.2 0.2 0.2 0.1BOSQUE 453.4 452.3 451.4 450.5 449.6 448.7BRAZORIA -920.7 -942.8 -1248.6 -1269.2 -1289.1 -1309.5BRAZOS -225.7 -239.2 -253.0 -267.3 -281.4 -266.7BREWSTER -27.5 -27.7 -28.0 -28.3 -28.5 -28.8BROOKS -23.0 -23.3 -23.6 -23.9 -24.2 -24.5BROWN -130.6 -132.2 -133.9 -135.5 -141.2 -142.9BURLESON -32.2 -33.2 -34.2 -35.2 -36.2 -40.0BURNET -47.9 -53.5 -59.3 -65.3 -71.6 -77.9CALDWELL -113.3 -116.9 -120.5 -124.4 -128.3 -132.1CALHOUN 151.4 148.5 142.1 136.2 130.6 125.3CALLAHAN -37.4 -37.9 -38.2 -38.6 -39.1 -39.5CAMERON -461.4 -425.3 -473.2 -518.2 -565.7 -608.4CHAMBERS 2570.7 2567.9 2565.6 2563.2 2560.7 2558.1CHEROKEE 583.1 582.0 580.9 579.7 578.6 577.4CHILDRESS -19.2 -19.5 -19.8 -20.1 -20.3 -20.6CLAY -34.1 -34.9 -35.7 -36.4 -37.1 -37.9COKE -18.1 -18.3 -18.5 -18.8 -19.0 -19.2COLEMAN -40.7 -41.2 -41.6 -42.0 -42.3 -42.6COLLIN -1924.8 -2031.9 -2126.6 -2224.5 -2321.3 -2436.3COLORADO -96.3 -98.3 -100.4 -102.5 -104.7 -106.9COMAL -368.3 -403.5 -419.6 -436.5 -454.1 -471.8COMANCHE -55.6 -57.1 -58.4 -59.8 -61.2 -62.7
Summer Import/Export by County
This data is presented for example only. It is a calculation of the generation in the county less the non-coincident load in the county. The true values will depend on actual load levels and actual generation dispatch.
Summer Import/Export, MW
Summer Import/Export - 39 of 87
STP000005 May 9, 2011

CDR Report - Summer Import/Export by County June 2006
County 2006 2007 2008 2009 2010 2011Summer Import/Export, MW
CONCHO -13.0 -13.2 -13.4 -13.6 -13.8 -14.0COOKE -135.0 -138.2 -141.5 -144.9 -148.3 -151.7CORYELL -137.1 -142.4 -143.8 -160.7 -164.6 -168.7COTTLE -5.2 -5.3 -5.4 -5.5 -5.6 -5.6CRANE -99.4 -101.2 -103.0 -104.8 -106.6 -107.8CROCKETT -44.3 -45.3 -46.2 -47.1 -48.0 -48.9CROSBY -2.6 -2.6 -2.6 -2.6 -2.6 -2.6CULBERSON -4.5 -4.6 -0.2 -0.3 -0.5 -0.6DALLAS -6392.9 -6560.5 -6740.4 -6918.3 -7104.1 -7286.7DAWSON -82.2 -83.2 -83.8 -84.8 -85.5 -87.0DELTA -10.7 -10.9 -11.1 -11.2 -11.4 -11.6DENTON -2077.4 -2189.3 -2288.0 -2408.4 -2487.4 -2575.5DEWITT -82.1 -84.0 -86.0 -88.0 -90.0 -92.1DICKENS -10.4 -10.7 -11.0 -11.3 -11.6 -11.9DIMMIT -23.2 -23.8 -24.3 -24.8 -25.3 -25.9DUVAL -47.6 -48.1 -48.7 -49.3 -49.9 -50.6EASTLAND -77.2 -76.7 -78.0 -79.2 -80.5 -81.8ECTOR 454.8 725.6 721.3 717.0 712.8 708.5EDWARDS -11.9 -12.1 -12.3 -12.5 -12.7 -12.9ELLIS 701.4 683.4 664.1 633.4 600.6 568.7ERATH -135.0 -137.6 -139.4 -141.1 -142.8 -144.6FALLS -58.6 -59.4 -60.2 -61.6 -63.2 -64.6FANNIN 2176.2 2174.0 2167.1 2165.8 2163.5 2161.0FAYETTE 1562.4 1560.2 1560.8 1558.0 1555.7 1553.3FISHER -21.3 -21.6 -21.8 -22.1 -22.4 -22.6FOARD -4.7 -4.7 -4.8 -4.8 -4.9 -4.9FORT BEND 2842.2 2817.0 2799.2 2781.9 2764.4 2746.5FRANKLIN -3.6 -3.6 -3.6 -3.7 -3.7 -3.7FREESTONE 2055.3 2053.9 2056.7 2055.7 2054.6 2053.6FRIO 35.4 33.9 32.3 30.6 29.0 27.4GALVESTON 1141.0 1164.6 1128.2 1094.6 1062.9 1020.1GILLESPIE -75.4 -77.5 -79.6 -81.7 -83.8 -85.9GLASSCOCK -17.3 -17.6 -17.9 -18.2 -18.5 -18.8GOLIAD 612.2 611.7 611.3 610.9 610.3 609.8GONZALES -67.2 -79.6 -82.4 -85.4 -88.4 -91.4GRAYSON -451.9 -469.9 -483.9 -502.1 -510.4 -526.3GRIMES 1274.8 1273.5 1272.2 1270.8 1269.3 1267.7GUADALUPE 1349.6 1336.1 1321.9 1306.8 1290.7 1274.7HALL -6.2 -6.3 -6.6 -6.6 -6.9 -7.0HAMILTON -38.7 -39.0 -39.3 -39.6 -40.0 -40.3HARDEMAN -22.6 -23.1 -23.6 -24.2 -24.4 -24.6HARRIS -6889.4 -7053.3 -7292.7 -7521.6 -7757.2 -7999.8HASKELL -29.1 -29.4 -29.7 -30.0 -30.3 -30.5HAYS 496.0 478.3 456.2 435.3 413.2 391.2HENDERSON 45.1 42.4 27.3 22.7 19.1 15.4HIDALGO 458.0 398.5 328.3 233.2 145.1 48.2HILL -131.2 -134.4 -137.5 -140.9 -144.3 -147.8HOOD 1554.7 1551.5 1546.5 1541.4 1523.8 1476.8
Summer Import/Export - 40 of 87
STP000005 May 9, 2011

CDR Report - Summer Import/Export by County June 2006
County 2006 2007 2008 2009 2010 2011Summer Import/Export, MW
HOPKINS -99.4 -101.4 -98.7 -100.4 -102.9 -105.5HOUSTON -46.2 -46.6 -46.9 -47.3 -47.6 -48.0HOWARD 75.7 74.7 62.9 73.0 71.9 70.8HUNT -150.6 -156.9 -174.0 -180.4 -186.3 -192.5IRION -11.2 -11.4 -11.6 -11.9 -12.1 -12.3JACK 591.0 590.4 589.8 589.2 588.6 587.9JACKSON -43.3 -43.9 -44.5 -45.1 -45.7 -46.3JEFF DAVIS -5.3 -5.5 -5.7 -5.9 -6.1 -6.3JIM HOGG -4.6 -4.7 -4.8 -4.9 -5.0 -5.1JIM WELLS -101.2 -103.4 -105.6 -107.8 -110.0 -112.1JOHNSON -151.4 -171.4 -189.0 -205.9 -226.0 -245.9JONES -45.8 -46.2 -46.5 -46.9 -47.3 -47.7KARNES -30.7 -31.0 -31.3 -31.5 -31.9 -32.3KAUFMAN 1393.9 1351.2 1356.4 1337.2 1323.1 1307.6KENDALL -87.4 -92.6 -98.0 -101.4 -107.4 -113.5KENEDY -1.2 -1.2 -1.2 -1.3 -1.3 -1.3KENT -55.0 -55.2 -55.4 -55.5 -55.7 -55.8KERR -148.1 -151.9 -155.7 -159.6 -164.4 -169.2KIMBLE -22.1 -22.5 -22.9 -23.3 -23.7 -24.2KING -8.3 -8.3 -8.3 -8.3 -8.3 -8.3KINNEY -8.8 -8.9 -9.0 -9.2 -9.3 -9.4KLEBERG -121.5 -123.0 -124.5 -125.9 -127.4 -128.8KNOX -25.3 -25.8 -26.3 -26.8 -27.3 -27.8LA SALLE -15.8 -16.5 -17.1 -17.8 -18.4 -19.0LAMAR 1040.1 1037.1 1033.9 1031.3 1027.8 1024.2LAMPASAS -56.1 -58.5 -60.9 -63.5 -66.2 -68.9LAVACA -44.7 -45.9 -47.1 -48.3 -49.6 -50.9LEE -41.3 -42.2 -43.2 -44.1 -45.0 -46.0LEON -182.5 -184.9 -187.4 -189.9 -192.6 -195.4LIMESTONE 1686.4 1684.8 1683.1 1681.3 1679.4 1677.4LIVE OAK -92.0 -93.9 -95.8 -97.5 -99.4 -101.2LLANO 401.1 398.7 396.2 393.7 391.1 388.5LOVING -5.6 -5.7 -5.7 -5.8 -5.8 -5.8MADISON -8.8 -9.0 -9.2 -9.5 -9.7 -9.9MARTIN -31.9 -32.3 -32.6 -33.0 -33.3 -33.7MASON -12.7 -12.8 -12.9 -13.0 -13.2 -13.3MATAGORDA 2384.1 2381.0 2377.3 2374.4 2371.6 2368.8MAVERICK -75.6 -79.6 -84.4 -89.2 -94.1 -98.4MCCULLOCH -49.6 -50.5 -51.5 -52.5 -53.5 -54.6MCLENNAN 854.0 830.0 809.0 789.8 771.0 751.5MCMULLEN -6.5 -6.7 -6.8 -6.9 -7.1 -7.3MEDINA -206.0 -213.2 -237.0 -245.6 -254.8 -264.1MENARD -4.7 -4.8 -4.8 -4.9 -5.0 -5.0MIDLAND -373.1 -376.3 -379.6 -382.8 -386.0 -389.2MILAM 460.2 457.9 456.1 454.3 452.4 450.4MILLS -10.2 -10.4 -10.5 -10.7 -10.9 -11.0MITCHELL 968.2 968.0 967.8 967.6 967.4 967.2MONTAGUE -75.8 -77.7 -79.5 -81.4 -83.4 -85.4
Summer Import/Export - 41 of 87
STP000005 May 9, 2011
CDR Report - Summer Import/Export by County June 2006
County 2006 2007 2008 2009 2010 2011Summer Import/Export, MW
MONTGOMERY -280.5 -299.7 -313.1 -327.1 -341.6 -356.8MOTLEY -4.7 -4.9 -5.2 -5.3 -5.6 -5.7NACOGDOCHES -188.4 -192.4 -194.5 -196.5 -198.6 -200.7NAVARRO -233.0 -252.0 -264.9 -270.6 -276.7 -283.0NOLAN 173.7 174.7 174.2 173.7 173.3 172.7NUECES 705.5 684.7 653.2 632.5 613.0 593.5PALO PINTO 538.7 536.1 531.7 529.5 527.2 525.0PARKER -265.0 -271.5 -282.9 -288.9 -300.2 -301.9PECOS -112.0 -114.9 -117.8 -120.7 -123.7 -126.6PRESIDIO -13.7 -14.2 -14.6 -15.1 -15.6 -16.0RAINS -26.4 -26.8 -27.2 -27.7 -28.5 -29.3REAGAN -15.0 -15.3 -15.7 -16.0 -16.3 -16.6REAL -14.3 -14.9 -15.4 -16.0 -16.6 -17.2RED RIVER -44.6 -45.2 -43.1 -44.1 -44.9 -45.8REEVES -75.6 -76.6 -77.6 -78.6 -79.6 -80.7REFUGIO -29.8 -30.1 -30.4 -30.7 -31.1 -31.5ROBERTSON 281.9 281.0 280.0 278.9 277.8 276.5ROCKWALL -286.5 -302.0 -317.9 -334.4 -353.4 -360.3RUNNELS -39.5 -40.1 -40.6 -41.2 -41.7 -42.3RUSK 3210.2 3210.1 3210.0 3209.9 3209.9 3209.8SAN PATRICIO 157.3 153.3 149.3 145.3 141.4 137.6SAN SABA -14.2 -14.4 -14.7 -14.9 -15.2 -15.5SCHLEICHER -11.2 -11.3 -11.3 -11.3 -11.3 -11.4SCURRY -271.6 -270.0 -271.7 -273.4 -275.1 -276.8SHACKELFORD -27.3 -22.5 -17.8 -18.2 -18.6 -19.1SMITH -716.6 -725.5 -734.0 -742.6 -751.1 -759.7SOMERVELL 2268.1 2266.5 2265.2 2263.7 2263.3 2261.9STARR -73.4 -77.5 -82.5 -87.6 -92.9 -98.0STEPHENS -70.4 -71.9 -73.4 -75.0 -76.5 -77.9STERLING -11.4 -5.9 -6.1 -6.2 -6.3 -6.5STONEWALL -8.8 -9.1 -9.4 -9.6 -9.9 -10.2SUTTON -15.8 -16.1 -16.4 -16.6 -16.9 -17.1TARRANT -3723.2 -3881.6 -4059.2 -4214.1 -4382.7 -4561.5TAYLOR -399.5 -391.7 -391.0 -393.6 -396.3 -398.9TERRELL -4.9 -4.9 -5.0 -5.0 -5.1 -5.1THROCKMORTON -9.9 -10.1 -10.2 -10.4 -10.5 -10.7TITUS 2219.0 2219.0 2219.0 2219.0 2219.0 2219.0TOM GREEN -324.0 -327.8 -330.8 -333.9 -336.6 -339.5TRAVIS -1079.5 -1132.0 -1535.3 -1545.3 -1564.4 -1589.4UPTON -21.0 -22.1 -23.1 -24.2 -25.3 -26.3UVALDE -65.8 -67.8 -70.4 -72.9 -75.5 -77.7VAL VERDE -35.3 -38.6 -42.8 -46.9 -51.1 -54.6VAN ZANDT -102.7 -104.2 -105.7 -107.2 -109.5 -111.8VICTORIA -154.6 -163.9 -173.3 -182.4 -191.0 -199.5WALLER -240.9 -248.9 -256.4 -264.2 -272.3 -280.5WARD 925.5 925.0 924.5 923.9 923.4 922.9WASHINGTON -126.6 -125.1 -127.5 -130.0 -132.4 -134.9WEBB -326.8 -292.9 -309.0 -325.1 -341.2 -357.4
Summer Import/Export - 42 of 87
STP000005 May 9, 2011

CDR Report - Summer Import/Export by County June 2006
County 2006 2007 2008 2009 2010 2011Summer Import/Export, MW
WHARTON -69.1 204.5 203.0 201.6 200.1 198.7WICHITA -423.2 -426.7 -430.8 -434.6 -438.4 -442.2WILBARGER 648.7 648.0 647.3 646.5 645.8 645.0WILLACY -45.7 -47.4 -49.5 -51.5 -53.7 -55.8WILLIAMSON -1000.1 -1037.5 -1085.9 -1136.5 -1194.6 -1249.3WILSON -97.6 -100.5 -103.4 -106.4 -109.4 -112.4WINKLER -80.3 -81.1 -81.9 -82.7 -83.6 -84.3WISE 388.7 379.6 355.9 346.1 335.1 323.4YOUNG 551.0 549.2 547.3 545.4 543.5 541.6ZAPATA -31.0 -32.0 -33.1 -34.1 -35.2 -36.3ZAVALA -25.6 -26.3 -27.3 -28.3 -29.2 -30.0
Summer Import/Export - 43 of 87
STP000005 May 9, 2011
CDR Report - Winter Coincident Demand by County June 2006
County 2007 2008 2009 2010 2011 2012
ANDERSON 123.3 123.6 125.4 128.0 129.8 132.6ANDREWS 130.3 128.7 129.5 130.0 130.4 130.0ANGELINA 256.7 247.6 257.5 259.7 261.3 261.6ARANSAS 48.0 48.2 49.3 50.2 51.1 51.7ARCHER 22.9 23.0 24.3 24.9 25.3 25.6ATASCOSA 59.9 60.2 61.7 63.0 64.3 65.1AUSTIN 66.3 66.5 68.0 69.4 70.7 71.6BANDERA 60.1 62.0 65.1 63.8 66.7 69.5BASTROP 163.1 170.5 172.0 180.3 178.8 185.7BAYLOR 12.6 12.4 12.5 12.5 12.4 12.3BEE 49.1 48.7 49.2 49.7 50.1 50.2BELL 684.0 700.6 718.7 725.7 742.1 747.0BEXAR 2491.0 2728.3 2774.4 2830.6 2892.3 2993.3BLANCO 33.8 34.4 35.5 36.7 37.9 38.9BORDEN 1.8 1.8 1.8 1.8 1.8 1.9BOSQUE 70.6 69.8 70.3 70.8 71.1 71.0BRAZORIA 990.2 985.7 995.9 1003.5 1008.8 1008.5BRAZOS 266.2 268.2 275.4 282.2 288.6 293.6BREWSTER 18.0 17.9 18.1 18.2 18.4 18.4BROOKS 13.1 13.1 13.3 13.4 13.6 13.6BROWN 88.5 88.2 89.5 90.7 91.7 95.4BURLESON 24.8 25.0 25.8 26.5 27.1 27.6BURNET 114.6 116.6 121.0 125.2 129.4 133.0CALDWELL 85.3 86.3 88.9 91.3 93.8 95.7CALHOUN 206.4 204.2 208.5 212.0 214.8 216.4CALLAHAN 31.8 31.7 31.9 32.2 32.5 32.5CAMERON 529.3 548.7 586.5 612.2 641.0 663.4CHAMBERS 176.9 177.5 179.2 180.1 180.7 180.4CHEROKEE 86.9 82.3 82.8 83.6 83.8 84.1CHILDRESS 10.6 10.5 10.7 10.9 11.0 11.1CLAY 24.1 24.3 24.9 25.5 26.0 26.4COKE 12.4 12.4 12.5 12.7 12.8 12.9COLEMAN 25.8 25.6 25.8 26.0 26.0 26.0COLLIN 1416.9 1438.0 1498.5 1545.6 1598.6 1639.7COLORADO 61.9 62.0 63.3 64.5 65.7 66.5COMAL 296.0 302.2 331.2 344.7 358.2 370.7COMANCHE 34.8 34.2 34.9 35.6 36.2 36.8CONCHO 10.5 10.5 10.7 10.9 11.0 11.1COOKE 103.1 104.3 107.3 110.2 112.9 114.9CORYELL 95.7 96.3 100.3 112.1 114.7 115.1COTTLE 3.8 3.9 4.0 4.1 4.2 4.3
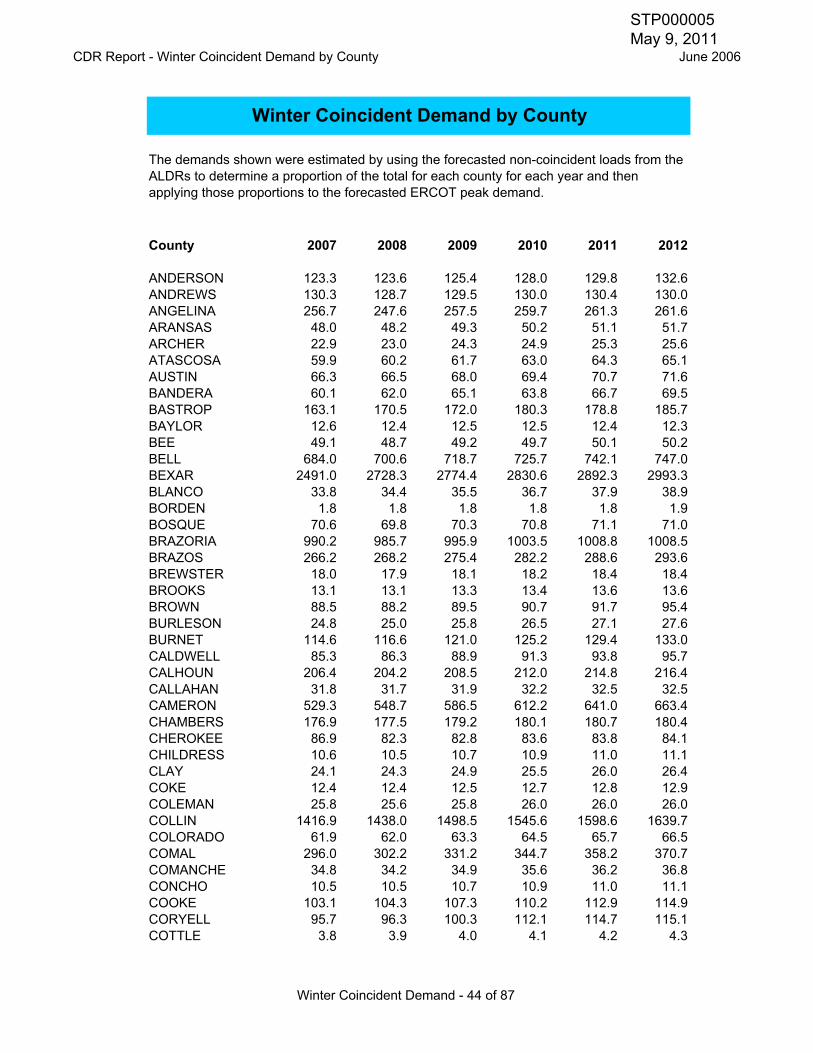
Winter Coincident Demand by County
The demands shown were estimated by using the forecasted non-coincident loads from the ALDRs to determine a proportion of the total for each county for each year and then applying those proportions to the forecasted ERCOT peak demand.
Winter Coincident Demand - 44 of 87
STP000005 May 9, 2011

CDR Report - Winter Coincident Demand by County June 2006
County 2007 2008 2009 2010 2011 2012
CRANE 72.1 72.2 73.6 74.8 75.9 76.6CROCKETT 28.8 28.9 29.6 30.1 30.6 31.0CROSBY 1.7 1.6 1.6 1.6 1.6 1.6CULBERSON 4.9 4.8 4.9 5.0 5.0 5.1DALLAS 5517.8 5539.0 5656.4 5752.6 5854.5 5921.2DAWSON 47.5 47.1 47.5 47.9 48.2 48.3DELTA 7.7 7.8 8.0 8.1 8.3 8.5DENTON 1350.6 1398.1 1477.4 1540.5 1624.5 1665.6DEWITT 56.6 57.0 58.5 60.0 61.3 62.4DICKENS 6.5 6.6 6.8 7.1 7.3 7.4DIMMIT 13.8 13.9 14.2 14.5 14.7 14.9DUVAL 32.6 32.4 32.8 33.1 33.4 33.6EASTLAND 51.3 51.0 51.9 52.5 53.1 53.4ECTOR 374.7 372.1 374.7 376.6 377.8 377.0EDWARDS 8.4 8.4 8.5 8.6 8.7 8.8ELLIS 708.4 691.2 706.4 721.0 743.4 761.8ERATH 89.0 90.2 91.3 92.4 93.2 93.6FALLS 37.9 38.7 39.3 39.8 40.8 41.3FANNIN 73.2 75.2 77.7 77.6 80.0 82.4FAYETTE 68.7 68.9 70.3 69.5 71.0 71.9FISHER 18.3 18.2 18.4 18.6 18.8 18.8FOARD 2.1 2.0 2.1 2.1 2.1 2.1FORT BEND 686.8 721.4 735.2 743.6 750.2 753.1FRANKLIN 2.5 2.5 2.5 2.5 2.5 2.5FREESTONE 53.8 55.8 56.6 54.0 54.4 54.7FRIO 20.9 21.4 22.3 23.1 24.0 24.7GALVESTON 1038.2 1036.4 1047.5 1056.8 1062.1 1062.0GILLESPIE 55.9 56.7 58.5 60.2 61.9 63.1GLASSCOCK 14.4 14.3 14.4 14.6 14.7 14.7GOLIAD 17.5 17.5 17.9 18.2 18.6 18.8GONZALES 50.7 59.3 61.3 63.3 65.2 66.8GRAYSON 406.8 411.4 426.1 441.0 454.5 464.1GRIMES 17.1 17.6 18.5 19.4 20.4 21.3GUADALUPE 315.3 319.3 330.0 340.7 351.4 360.8HALL 2.8 2.9 3.0 3.1 3.2 3.3HAMILTON 22.0 21.8 22.0 22.1 22.2 22.2HARDEMAN 15.0 14.8 14.9 15.0 15.1 15.0HARRIS 7716.6 7787.3 7934.6 8054.4 8149.0 8204.6HASKELL 12.7 12.8 13.1 13.4 13.7 13.9HAYS 328.2 335.0 351.0 367.9 383.6 397.9HENDERSON 166.3 167.1 170.2 155.9 157.8 159.1HIDALGO 889.8 907.1 949.3 1003.3 1043.1 1091.9HILL 88.6 89.5 92.0 94.3 97.7 99.6HOOD 157.9 159.4 159.6 163.6 167.5 170.2HOPKINS 65.5 65.6 66.8 73.3 75.7 78.1HOUSTON 32.5 32.2 32.2 32.4 32.3 32.3HOWARD 89.8 88.8 89.4 97.6 90.0 89.9HUNT 165.9 168.1 159.3 166.4 170.4 174.1IRION 8.8 8.8 8.9 9.1 9.2 9.3
Winter Coincident Demand - 45 of 87
STP000005 May 9, 2011

CDR Report - Winter Coincident Demand by County June 2006
County 2007 2008 2009 2010 2011 2012
JACK 19.8 19.9 20.4 20.8 21.2 21.5JACKSON 27.6 27.5 27.9 28.2 28.6 28.7JEFF DAVIS 5.5 5.6 5.7 5.9 6.0 6.1JIM HOGG 3.0 3.1 3.1 3.2 3.3 3.3JIM WELLS 71.8 72.1 73.6 75.1 76.3 77.1JOHNSON 307.9 322.0 334.5 347.3 359.3 371.0JONES 34.1 34.7 35.9 37.1 38.2 39.1KARNES 19.6 20.1 20.2 20.4 20.6 20.6KAUFMAN 295.9 343.7 369.5 401.1 422.8 443.8KENDALL 94.1 84.1 89.3 94.5 96.6 101.5KENEDY 1.0 1.0 1.0 1.0 1.0 1.0KENT 43.5 42.8 42.9 42.9 42.9 42.6KERR 129.7 130.8 134.3 137.7 140.8 143.2KIMBLE 18.8 18.8 19.2 19.6 19.9 20.1KING 6.3 6.1 6.1 6.1 6.1 6.0KINNEY 7.0 6.9 7.0 7.1 7.2 7.2KLEBERG 79.8 79.4 80.4 81.2 81.9 82.1KNOX 10.9 11.0 11.2 11.4 11.7 11.8LA SALLE 139.6 139.7 142.3 144.2 129.5 135.1LAMAR 52.5 47.7 49.9 52.0 54.1 56.0LAMPASAS 11.0 11.2 11.7 12.1 12.5 12.9LAVACA 30.1 30.3 31.0 31.8 32.5 33.1LEE 26.3 26.5 27.1 27.7 28.3 28.7LEON 137.8 137.0 138.6 140.2 141.5 142.2LIMESTONE 51.2 51.7 53.0 54.2 55.4 56.4LIVE OAK 63.2 63.2 64.5 65.6 66.6 67.2LLANO 71.3 72.4 74.8 77.2 79.4 81.2LOVING 4.7 4.6 4.6 4.7 4.7 4.7MADISON 22.3 22.6 23.2 23.9 24.5 25.0MARTIN 562.5 566.1 580.3 592.2 602.6 611.6MASON 5.0 5.0 5.1 5.2 5.3 5.3MATAGORDA 6.8 6.8 6.9 7.0 7.2 7.3MAVERICK 21.8 21.7 22.0 22.3 22.5 22.6MCCULLOCH 10.0 10.1 10.4 10.7 10.9 11.1MCLENNAN 119.8 120.5 123.5 124.8 126.3 127.1MCMULLEN 67.9 69.7 73.1 76.0 79.7 81.3MEDINA 122.2 123.7 128.1 139.6 144.1 148.3MENARD 3.9 3.9 3.9 4.0 4.0 4.0MIDLAND 229.1 226.8 228.8 230.4 231.5 231.4MILAM 60.3 61.9 63.8 65.3 66.6 67.7MILLS 6.4 6.4 6.5 6.6 6.7 6.7MITCHELL 15.6 15.5 15.6 15.7 15.7 15.7MONTAGUE 48.9 49.1 50.4 51.6 52.8 53.7MONTGOMERY 146.9 155.6 166.3 173.4 180.4 186.7MOTLEY 3.5 3.6 3.8 3.9 4.1 4.2NACOGDOCHES 133.9 131.7 131.1 132.5 133.6 134.0NAVARRO 164.6 166.8 181.6 182.5 186.2 189.1NOLAN 52.2 51.8 52.0 52.3 52.4 52.4NUECES 821.5 821.5 837.0 850.3 860.9 869.2
Winter Coincident Demand - 46 of 87
STP000005 May 9, 2011
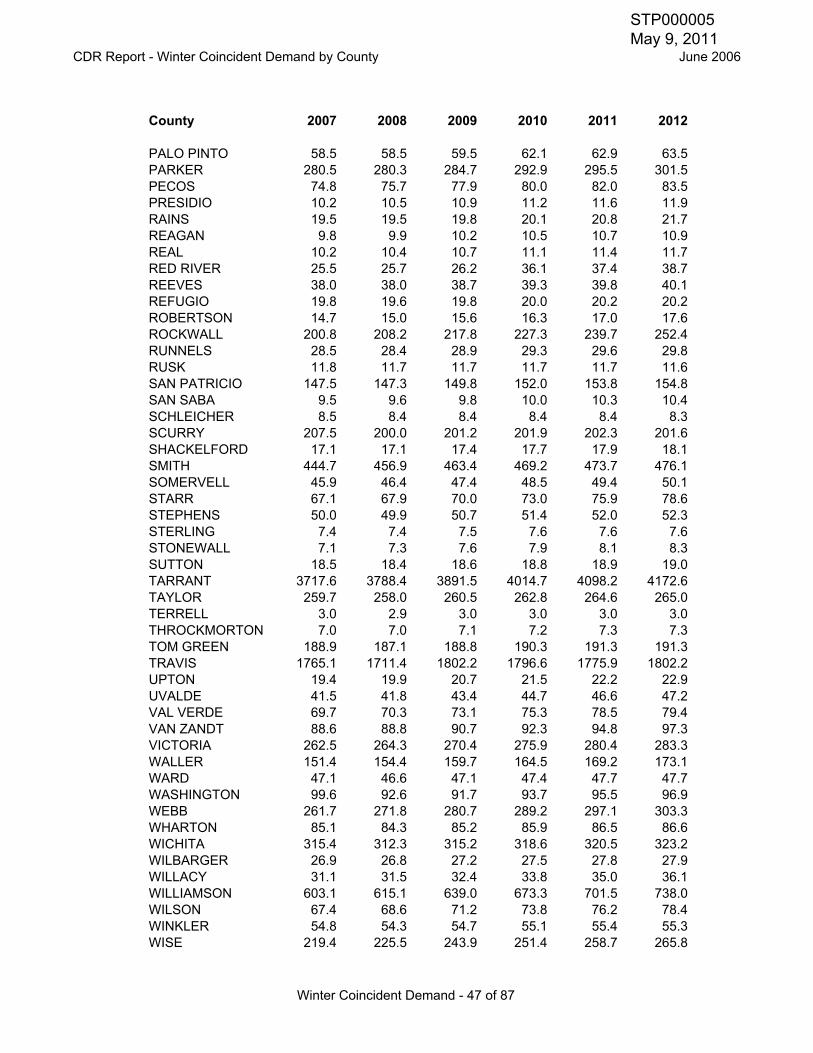
CDR Report - Winter Coincident Demand by County June 2006
County 2007 2008 2009 2010 2011 2012
PALO PINTO 58.5 58.5 59.5 62.1 62.9 63.5PARKER 280.5 280.3 284.7 292.9 295.5 301.5PECOS 74.8 75.7 77.9 80.0 82.0 83.5PRESIDIO 10.2 10.5 10.9 11.2 11.6 11.9RAINS 19.5 19.5 19.8 20.1 20.8 21.7REAGAN 9.8 9.9 10.2 10.5 10.7 10.9REAL 10.2 10.4 10.7 11.1 11.4 11.7RED RIVER 25.5 25.7 26.2 36.1 37.4 38.7REEVES 38.0 38.0 38.7 39.3 39.8 40.1REFUGIO 19.8 19.6 19.8 20.0 20.2 20.2ROBERTSON 14.7 15.0 15.6 16.3 17.0 17.6ROCKWALL 200.8 208.2 217.8 227.3 239.7 252.4RUNNELS 28.5 28.4 28.9 29.3 29.6 29.8RUSK 11.8 11.7 11.7 11.7 11.7 11.6SAN PATRICIO 147.5 147.3 149.8 152.0 153.8 154.8SAN SABA 9.5 9.6 9.8 10.0 10.3 10.4SCHLEICHER 8.5 8.4 8.4 8.4 8.4 8.3SCURRY 207.5 200.0 201.2 201.9 202.3 201.6SHACKELFORD 17.1 17.1 17.4 17.7 17.9 18.1SMITH 444.7 456.9 463.4 469.2 473.7 476.1SOMERVELL 45.9 46.4 47.4 48.5 49.4 50.1STARR 67.1 67.9 70.0 73.0 75.9 78.6STEPHENS 50.0 49.9 50.7 51.4 52.0 52.3STERLING 7.4 7.4 7.5 7.6 7.6 7.6STONEWALL 7.1 7.3 7.6 7.9 8.1 8.3SUTTON 18.5 18.4 18.6 18.8 18.9 19.0TARRANT 3717.6 3788.4 3891.5 4014.7 4098.2 4172.6TAYLOR 259.7 258.0 260.5 262.8 264.6 265.0TERRELL 3.0 2.9 3.0 3.0 3.0 3.0THROCKMORTON 7.0 7.0 7.1 7.2 7.3 7.3TOM GREEN 188.9 187.1 188.8 190.3 191.3 191.3TRAVIS 1765.1 1711.4 1802.2 1796.6 1775.9 1802.2UPTON 19.4 19.9 20.7 21.5 22.2 22.9UVALDE 41.5 41.8 43.4 44.7 46.6 47.2VAL VERDE 69.7 70.3 73.1 75.3 78.5 79.4VAN ZANDT 88.6 88.8 90.7 92.3 94.8 97.3VICTORIA 262.5 264.3 270.4 275.9 280.4 283.3WALLER 151.4 154.4 159.7 164.5 169.2 173.1WARD 47.1 46.6 47.1 47.4 47.7 47.7WASHINGTON 99.6 92.6 91.7 93.7 95.5 96.9WEBB 261.7 271.8 280.7 289.2 297.1 303.3WHARTON 85.1 84.3 85.2 85.9 86.5 86.6WICHITA 315.4 312.3 315.2 318.6 320.5 323.2WILBARGER 26.9 26.8 27.2 27.5 27.8 27.9WILLACY 31.1 31.5 32.4 33.8 35.0 36.1WILLIAMSON 603.1 615.1 639.0 673.3 701.5 738.0WILSON 67.4 68.6 71.2 73.8 76.2 78.4WINKLER 54.8 54.3 54.7 55.1 55.4 55.3WISE 219.4 225.5 243.9 251.4 258.7 265.8
Winter Coincident Demand - 47 of 87
STP000005 May 9, 2011

CDR Report - Winter Coincident Demand by County June 2006
County 2007 2008 2009 2010 2011 2012
YOUNG 53.3 53.5 54.7 55.8 56.8 57.5ZAPATA 19.2 19.5 20.2 20.8 21.4 21.9ZAVALA 18.6 18.8 19.4 20.0 20.8 21.1
Winter Coincident Demand - 48 of 87
STP000005 May 9, 2011

CDR Report - Winter Load by County June 2006
County 2007 2008 2009 2010 2011 2012
ANDERSON 154.9 158.3 160.6 164.2 167.2 172.4ANDREWS 163.8 164.8 165.9 166.9 168.0 169.1ANGELINA 322.7 317.2 329.9 333.3 336.8 340.2ARANSAS 60.3 61.7 63.1 64.5 65.9 67.2ARCHER 28.8 29.5 31.2 31.9 32.6 33.4ATASCOSA 75.2 77.1 79.0 80.9 82.8 84.6AUSTIN 83.4 85.2 87.1 89.0 91.1 93.1BANDERA 75.5 79.4 83.4 81.8 86.0 90.4BASTROP 205.0 218.4 220.4 231.4 230.4 241.4BAYLOR 15.9 15.9 16.0 16.0 16.0 16.0BEE 61.7 62.4 63.1 63.8 64.5 65.3BELL 859.6 897.3 920.7 931.4 956.3 971.4BEXAR 3130.8 3494.2 3554.0 3633.2 3727.1 3892.2BLANCO 42.4 44.0 45.4 47.1 48.8 50.6BORDEN 2.3 2.3 2.3 2.3 2.4 2.4BOSQUE 88.7 89.3 90.1 90.9 91.6 92.4BRAZORIA 1244.5 1262.4 1275.7 1288.0 1299.9 1311.4BRAZOS 334.6 343.5 352.7 362.2 371.9 381.8BREWSTER 22.6 22.9 23.2 23.4 23.7 23.9BROOKS 16.5 16.7 17.0 17.2 17.5 17.7BROWN 111.3 112.9 114.6 116.4 118.2 124.0BURLESON 31.1 32.1 33.0 34.0 34.9 35.8BURNET 144.0 149.4 155.0 160.7 166.7 173.0CALDWELL 107.2 110.5 113.9 117.1 120.8 124.4CALHOUN 259.4 261.6 267.0 272.1 276.8 281.4CALLAHAN 40.0 40.6 40.9 41.4 41.8 42.3CAMERON 665.2 702.7 751.3 785.8 826.0 862.6CHAMBERS 222.4 227.4 229.5 231.2 232.9 234.6CHEROKEE 109.2 105.5 106.1 107.4 108.0 109.3CHILDRESS 13.3 13.5 13.7 13.9 14.2 14.4CLAY 30.3 31.2 31.9 32.7 33.5 34.4COKE 15.6 15.8 16.1 16.3 16.5 16.7COLEMAN 32.4 32.8 33.0 33.3 33.6 33.8COLLIN 1780.9 1841.7 1919.5 1983.8 2060.0 2132.1COLORADO 77.8 79.4 81.1 82.8 84.6 86.4COMAL 372.1 387.1 424.2 442.4 461.6 482.0COMANCHE 43.7 43.8 44.8 45.7 46.7 47.8CONCHO 13.2 13.5 13.7 14.0 14.2 14.4COOKE 129.6 133.6 137.5 141.4 145.5 149.5CORYELL 120.3 123.4 128.5 143.9 147.7 149.7COTTLE 4.8 5.0 5.1 5.3 5.5 5.6
Winter Load by County
The loads shown are the non-coincident loads of the individual delivery points from the 2005 ALDRs and do not include self-serve load. The values shown here are used in the winter import/export calculations.
Winter Load, MW
Winter Load by County - 49 of 87
STP000005 May 9, 2011
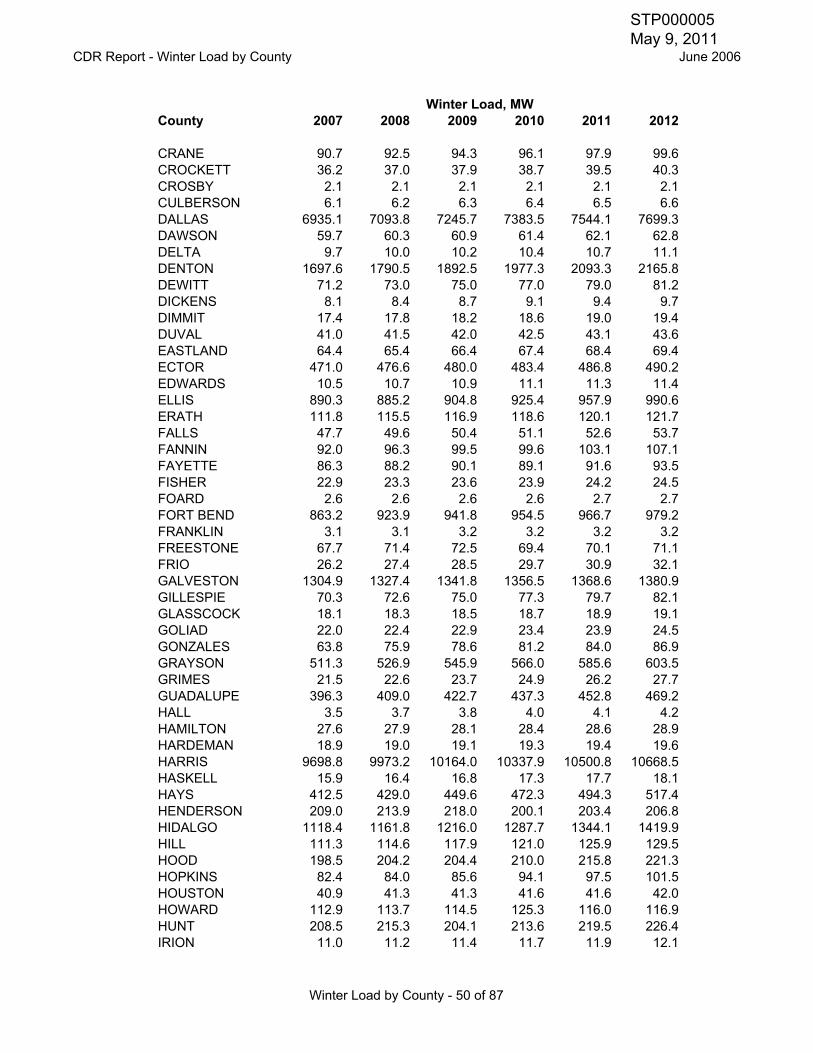
CDR Report - Winter Load by County June 2006
County 2007 2008 2009 2010 2011 2012Winter Load, MW
CRANE 90.7 92.5 94.3 96.1 97.9 99.6CROCKETT 36.2 37.0 37.9 38.7 39.5 40.3CROSBY 2.1 2.1 2.1 2.1 2.1 2.1CULBERSON 6.1 6.2 6.3 6.4 6.5 6.6DALLAS 6935.1 7093.8 7245.7 7383.5 7544.1 7699.3DAWSON 59.7 60.3 60.9 61.4 62.1 62.8DELTA 9.7 10.0 10.2 10.4 10.7 11.1DENTON 1697.6 1790.5 1892.5 1977.3 2093.3 2165.8DEWITT 71.2 73.0 75.0 77.0 79.0 81.2DICKENS 8.1 8.4 8.7 9.1 9.4 9.7DIMMIT 17.4 17.8 18.2 18.6 19.0 19.4DUVAL 41.0 41.5 42.0 42.5 43.1 43.6EASTLAND 64.4 65.4 66.4 67.4 68.4 69.4ECTOR 471.0 476.6 480.0 483.4 486.8 490.2EDWARDS 10.5 10.7 10.9 11.1 11.3 11.4ELLIS 890.3 885.2 904.8 925.4 957.9 990.6ERATH 111.8 115.5 116.9 118.6 120.1 121.7FALLS 47.7 49.6 50.4 51.1 52.6 53.7FANNIN 92.0 96.3 99.5 99.6 103.1 107.1FAYETTE 86.3 88.2 90.1 89.1 91.6 93.5FISHER 22.9 23.3 23.6 23.9 24.2 24.5FOARD 2.6 2.6 2.6 2.6 2.7 2.7FORT BEND 863.2 923.9 941.8 954.5 966.7 979.2FRANKLIN 3.1 3.1 3.2 3.2 3.2 3.2FREESTONE 67.7 71.4 72.5 69.4 70.1 71.1FRIO 26.2 27.4 28.5 29.7 30.9 32.1GALVESTON 1304.9 1327.4 1341.8 1356.5 1368.6 1380.9GILLESPIE 70.3 72.6 75.0 77.3 79.7 82.1GLASSCOCK 18.1 18.3 18.5 18.7 18.9 19.1GOLIAD 22.0 22.4 22.9 23.4 23.9 24.5GONZALES 63.8 75.9 78.6 81.2 84.0 86.9GRAYSON 511.3 526.9 545.9 566.0 585.6 603.5GRIMES 21.5 22.6 23.7 24.9 26.2 27.7GUADALUPE 396.3 409.0 422.7 437.3 452.8 469.2HALL 3.5 3.7 3.8 4.0 4.1 4.2HAMILTON 27.6 27.9 28.1 28.4 28.6 28.9HARDEMAN 18.9 19.0 19.1 19.3 19.4 19.6HARRIS 9698.8 9973.2 10164.0 10337.9 10500.8 10668.5HASKELL 15.9 16.4 16.8 17.3 17.7 18.1HAYS 412.5 429.0 449.6 472.3 494.3 517.4HENDERSON 209.0 213.9 218.0 200.1 203.4 206.8HIDALGO 1118.4 1161.8 1216.0 1287.7 1344.1 1419.9HILL 111.3 114.6 117.9 121.0 125.9 129.5HOOD 198.5 204.2 204.4 210.0 215.8 221.3HOPKINS 82.4 84.0 85.6 94.1 97.5 101.5HOUSTON 40.9 41.3 41.3 41.6 41.6 42.0HOWARD 112.9 113.7 114.5 125.3 116.0 116.9HUNT 208.5 215.3 204.1 213.6 219.5 226.4IRION 11.0 11.2 11.4 11.7 11.9 12.1
Winter Load by County - 50 of 87
STP000005 May 9, 2011
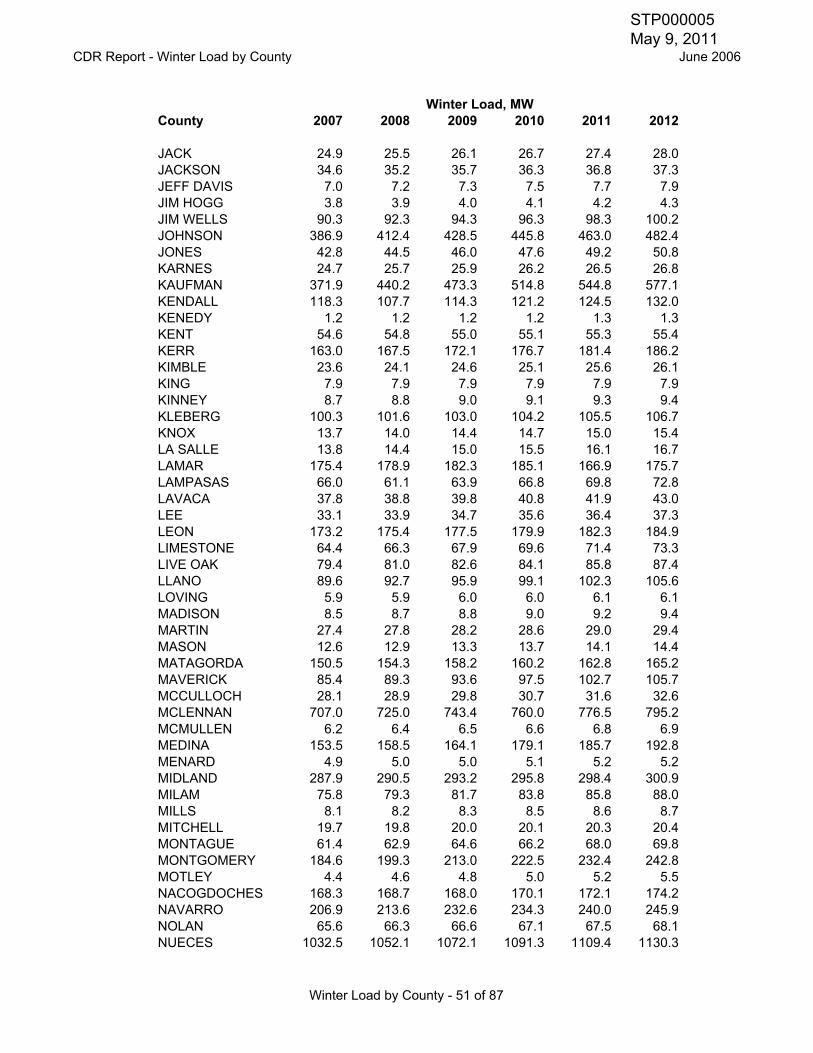
CDR Report - Winter Load by County June 2006
County 2007 2008 2009 2010 2011 2012Winter Load, MW
JACK 24.9 25.5 26.1 26.7 27.4 28.0JACKSON 34.6 35.2 35.7 36.3 36.8 37.3JEFF DAVIS 7.0 7.2 7.3 7.5 7.7 7.9JIM HOGG 3.8 3.9 4.0 4.1 4.2 4.3JIM WELLS 90.3 92.3 94.3 96.3 98.3 100.2JOHNSON 386.9 412.4 428.5 445.8 463.0 482.4JONES 42.8 44.5 46.0 47.6 49.2 50.8KARNES 24.7 25.7 25.9 26.2 26.5 26.8KAUFMAN 371.9 440.2 473.3 514.8 544.8 577.1KENDALL 118.3 107.7 114.3 121.2 124.5 132.0KENEDY 1.2 1.2 1.2 1.2 1.3 1.3KENT 54.6 54.8 55.0 55.1 55.3 55.4KERR 163.0 167.5 172.1 176.7 181.4 186.2KIMBLE 23.6 24.1 24.6 25.1 25.6 26.1KING 7.9 7.9 7.9 7.9 7.9 7.9KINNEY 8.7 8.8 9.0 9.1 9.3 9.4KLEBERG 100.3 101.6 103.0 104.2 105.5 106.7KNOX 13.7 14.0 14.4 14.7 15.0 15.4LA SALLE 13.8 14.4 15.0 15.5 16.1 16.7LAMAR 175.4 178.9 182.3 185.1 166.9 175.7LAMPASAS 66.0 61.1 63.9 66.8 69.8 72.8LAVACA 37.8 38.8 39.8 40.8 41.9 43.0LEE 33.1 33.9 34.7 35.6 36.4 37.3LEON 173.2 175.4 177.5 179.9 182.3 184.9LIMESTONE 64.4 66.3 67.9 69.6 71.4 73.3LIVE OAK 79.4 81.0 82.6 84.1 85.8 87.4LLANO 89.6 92.7 95.9 99.1 102.3 105.6LOVING 5.9 5.9 6.0 6.0 6.1 6.1MADISON 8.5 8.7 8.8 9.0 9.2 9.4MARTIN 27.4 27.8 28.2 28.6 29.0 29.4MASON 12.6 12.9 13.3 13.7 14.1 14.4MATAGORDA 150.5 154.3 158.2 160.2 162.8 165.2MAVERICK 85.4 89.3 93.6 97.5 102.7 105.7MCCULLOCH 28.1 28.9 29.8 30.7 31.6 32.6MCLENNAN 707.0 725.0 743.4 760.0 776.5 795.2MCMULLEN 6.2 6.4 6.5 6.6 6.8 6.9MEDINA 153.5 158.5 164.1 179.1 185.7 192.8MENARD 4.9 5.0 5.0 5.1 5.2 5.2MIDLAND 287.9 290.5 293.2 295.8 298.4 300.9MILAM 75.8 79.3 81.7 83.8 85.8 88.0MILLS 8.1 8.2 8.3 8.5 8.6 8.7MITCHELL 19.7 19.8 20.0 20.1 20.3 20.4MONTAGUE 61.4 62.9 64.6 66.2 68.0 69.8MONTGOMERY 184.6 199.3 213.0 222.5 232.4 242.8MOTLEY 4.4 4.6 4.8 5.0 5.2 5.5NACOGDOCHES 168.3 168.7 168.0 170.1 172.1 174.2NAVARRO 206.9 213.6 232.6 234.3 240.0 245.9NOLAN 65.6 66.3 66.6 67.1 67.5 68.1NUECES 1032.5 1052.1 1072.1 1091.3 1109.4 1130.3
Winter Load by County - 51 of 87
STP000005 May 9, 2011

CDR Report - Winter Load by County June 2006
County 2007 2008 2009 2010 2011 2012Winter Load, MW
PALO PINTO 73.5 74.9 76.2 79.7 81.1 82.5PARKER 352.6 359.0 364.6 375.9 380.8 392.0PECOS 94.1 97.0 99.8 102.7 105.6 108.5PRESIDIO 12.9 13.4 13.9 14.4 14.9 15.5RAINS 24.5 24.9 25.3 25.8 26.9 28.2REAGAN 12.3 12.7 13.1 13.5 13.8 14.2REAL 12.9 13.3 13.8 14.2 14.7 15.2RED RIVER 32.1 33.0 33.6 46.4 48.1 50.3REEVES 47.8 48.7 49.5 50.4 51.2 52.1REFUGIO 24.9 25.2 25.4 25.7 26.0 26.3ROBERTSON 18.5 19.2 20.0 20.9 21.9 22.9ROCKWALL 252.4 266.6 279.0 291.7 308.9 328.2RUNNELS 35.8 36.4 37.0 37.6 38.2 38.8RUSK 14.9 14.9 14.9 15.0 15.0 15.1SAN PATRICIO 185.4 188.6 191.9 195.0 198.2 201.3SAN SABA 11.9 12.3 12.6 12.9 13.2 13.6SCHLEICHER 10.7 10.7 10.7 10.7 10.8 10.8SCURRY 260.8 256.2 257.8 259.2 260.7 262.1SHACKELFORD 21.4 21.9 22.3 22.7 23.1 23.5SMITH 558.9 585.2 593.6 602.3 610.4 619.0SOMERVELL 57.6 59.4 60.8 62.2 63.6 65.1STARR 84.3 86.9 89.6 93.7 97.8 102.2STEPHENS 62.9 63.9 64.9 66.0 67.0 68.0STERLING 9.4 9.5 9.6 9.7 9.8 9.9STONEWALL 8.9 9.3 9.7 10.1 10.5 10.8SUTTON 23.2 23.5 23.8 24.1 24.4 24.7TARRANT 4672.5 4851.9 4984.9 5152.9 5280.9 5425.6TAYLOR 326.5 330.4 333.7 337.3 341.0 344.6TERRELL 3.7 3.8 3.8 3.8 3.9 3.9THROCKMORTON 8.8 8.9 9.1 9.2 9.4 9.5TITUS 0.0 0.0 0.0 0.0 0.0 0.0TOM GREEN 237.4 239.6 241.9 244.2 246.5 248.8TRAVIS 2218.4 2191.8 2308.6 2306.0 2288.5 2343.4UPTON 24.4 25.4 26.5 27.6 28.7 29.7UVALDE 52.1 53.5 55.5 57.3 60.1 61.4VAL VERDE 87.6 90.0 93.6 96.7 101.1 103.3VAN ZANDT 111.3 113.8 116.2 118.5 122.2 126.5VICTORIA 329.9 338.5 346.4 354.1 361.3 368.4WALLER 190.3 197.7 204.6 211.1 218.0 225.0WARD 59.2 59.7 60.3 60.9 61.4 62.0WASHINGTON 125.1 118.6 117.5 120.3 123.1 125.9WEBB 328.9 348.1 359.6 371.2 382.8 394.4WHARTON 106.9 108.0 109.2 110.3 111.5 112.6WICHITA 396.4 400.0 403.7 408.9 413.0 420.3WILBARGER 33.8 34.3 34.8 35.3 35.8 36.3WILLACY 39.1 40.3 41.5 43.4 45.1 47.0WILLIAMSON 758.0 787.8 818.5 864.2 903.9 959.6WILSON 84.8 87.9 91.2 94.7 98.2 101.9WINKLER 68.9 69.5 70.1 70.7 71.3 72.0
Winter Load by County - 52 of 87
STP000005 May 9, 2011

CDR Report - Winter Load by County June 2006
County 2007 2008 2009 2010 2011 2012Winter Load, MW
WISE 275.7 288.8 312.4 322.7 333.3 345.6YOUNG 67.0 68.5 70.0 71.6 73.2 74.8ZAPATA 24.2 25.0 25.9 26.7 27.6 28.5ZAVALA 23.4 24.0 24.9 25.7 26.8 27.4
Winter Load by County - 53 of 87
STP000005 May 9, 2011

CDR Report - Winter Generation by County June 2006
County 2007 2008 2009 2010 2011 2012
ANDERSON 0.0 0.0 0.0 0.0 0.0 0.0ANDREWS 0.0 0.0 0.0 0.0 0.0 0.0ANGELINA 0.0 0.0 0.0 0.0 0.0 0.0ARANSAS 0.0 0.0 0.0 0.0 0.0 0.0ARCHER 0.0 0.0 0.0 0.0 0.0 0.0ATASCOSA 397.0 397.0 397.0 397.0 397.0 397.0AUSTIN 0.0 0.0 0.0 0.0 0.0 0.0BANDERA 0.0 0.0 0.0 0.0 0.0 0.0BASTROP 1099.0 1099.0 1099.0 1099.0 1099.0 1099.0BAYLOR 0.0 0.0 0.0 0.0 0.0 0.0BEE 0.0 0.0 0.0 0.0 0.0 0.0BELL 0.0 0.0 0.0 0.0 0.0 0.0BEXAR 4395.6 4395.6 4330.6 4330.6 5080.6 5080.6BLANCO 0.0 0.0 0.0 0.0 0.0 0.0BORDEN 2.2 2.2 2.2 2.2 2.2 2.2BOSQUE 579.0 579.0 579.0 579.0 579.0 579.0BRAZORIA 813.0 813.0 655.0 655.0 505.0 505.0BRAZOS 286.0 286.0 286.0 286.0 286.0 286.0BREWSTER 0.0 0.0 0.0 0.0 0.0 0.0BROOKS 0.0 0.0 0.0 0.0 0.0 0.0BROWN 0.0 0.0 0.0 0.0 0.0 0.0BURLESON 0.0 0.0 0.0 0.0 0.0 0.0BURNET 95.0 95.0 95.0 95.0 95.0 95.0CALDWELL 0.0 0.0 0.0 0.0 0.0 0.0CALHOUN 477.0 477.0 477.0 477.0 477.0 477.0CALLAHAN 0.0 0.0 0.0 0.0 0.0 0.0CAMERON 370.0 445.0 445.0 445.0 445.0 445.0CHAMBERS 2895.9 2895.9 2895.9 2895.9 2895.9 2895.9CHEROKEE 707.0 707.0 707.0 707.0 707.0 707.0CHILDRESS 0.0 0.0 0.0 0.0 0.0 0.0CLAY 0.0 0.0 0.0 0.0 0.0 0.0COKE 0.0 0.0 0.0 0.0 0.0 0.0COLEMAN 0.0 0.0 0.0 0.0 0.0 0.0COLLIN 569.0 569.0 569.0 569.0 569.0 569.0COLORADO 0.0 0.0 0.0 0.0 0.0 0.0COMAL 6.0 6.0 6.0 6.0 6.0 6.0COMANCHE 0.0 0.0 0.0 0.0 0.0 0.0CONCHO 0.0 0.0 0.0 0.0 0.0 0.0COOKE 0.0 0.0 0.0 0.0 0.0 0.0CORYELL 0.0 0.0 0.0 0.0 0.0 0.0COTTLE 0.0 0.0 0.0 0.0 0.0 0.0CRANE 0.0 0.0 0.0 0.0 0.0 0.0
Winter Generation by County
These values are used in the summer import/export calculations for each county. Capacities for mothballed units are included as the total capacity of the unit. Capacities for the wind units are at 2.6%. Asynchronous ties are shown at 50%. These values include the amount available for the grid according information from the owners of the private network units and the distributed generation units that have registered with ERCOT.
Winter Generation, MW
Winter Generation by County - 54 of 87
STP000005 May 9, 2011

CDR Report - Winter Generation by County June 2006
County 2007 2008 2009 2010 2011 2012Winter Generation, MW
CROCKETT 0.0 0.0 0.0 0.0 0.0 0.0CROSBY 0.0 0.0 0.0 0.0 0.0 0.0CULBERSON 2.0 2.0 6.6 6.6 6.6 6.6DALLAS 2566.0 2566.0 2566.0 2566.0 2566.0 2566.0DAWSON 0.0 0.0 0.0 0.0 0.0 0.0DELTA 0.0 0.0 0.0 0.0 0.0 0.0DENTON 132.4 132.4 132.4 132.4 132.4 132.4DEWITT 1.2 1.2 1.2 1.2 1.2 1.2DICKENS 0.0 0.0 0.0 0.0 0.0 0.0DIMMIT 0.0 0.0 0.0 0.0 0.0 0.0DUVAL 0.0 0.0 0.0 0.0 0.0 0.0EASTLAND 0.0 1.6 1.6 1.6 1.6 1.6ECTOR 1082.0 1357.0 1357.0 1357.0 1357.0 1357.0EDWARDS 0.0 0.0 0.0 0.0 0.0 0.0ELLIS 1763.0 1763.0 1763.0 1763.0 1763.0 1763.0ERATH 0.0 0.0 0.0 0.0 0.0 0.0FALLS 0.0 0.0 0.0 0.0 0.0 0.0FANNIN 2293.0 2293.0 2293.0 2293.0 2293.0 2293.0FAYETTE 1669.0 1669.0 1669.0 1669.0 1669.0 1669.0FISHER 0.0 0.0 0.0 0.0 0.0 0.0FOARD 0.0 0.0 0.0 0.0 0.0 0.0FORT BEND 4274.0 4274.0 4274.0 4274.0 4274.0 4274.0FRANKLIN 0.0 0.0 0.0 0.0 0.0 0.0FREESTONE 2263.0 2263.0 2263.0 2263.0 2263.0 2263.0FRIO 74.0 74.0 74.0 74.0 74.0 74.0GALVESTON 3143.7 3213.7 3213.7 3213.7 3213.7 3213.7GILLESPIE 0.0 0.0 0.0 0.0 0.0 0.0GLASSCOCK 0.0 0.0 0.0 0.0 0.0 0.0GOLIAD 634.0 634.0 634.0 634.0 634.0 634.0GONZALES 4.8 4.8 4.8 4.8 4.8 4.8GRAYSON 80.0 80.0 80.0 80.0 80.0 80.0GRIMES 1353.0 1353.0 1353.0 1353.0 1353.0 1353.0GUADALUPE 1891.6 1891.6 1891.6 1891.6 1891.6 1891.6HALL 0.0 0.0 0.0 0.0 0.0 0.0HAMILTON 0.0 0.0 0.0 0.0 0.0 0.0HARDEMAN 0.0 0.0 0.0 0.0 0.0 0.0HARRIS 7321.0 7410.0 7390.0 7390.0 7390.0 7410.0HASKELL 0.0 0.0 0.0 0.0 0.0 0.0HAYS 972.0 972.0 972.0 972.0 972.0 972.0HENDERSON 241.0 241.0 241.0 241.0 241.0 241.0HIDALGO 1913.0 1913.0 1913.0 1913.0 1913.0 1913.0HILL 0.0 0.0 0.0 0.0 0.0 0.0HOOD 1838.0 1838.0 1838.0 1838.0 1838.0 1838.0HOPKINS 0.0 0.0 0.0 0.0 0.0 0.0HOUSTON 0.0 0.0 0.0 0.0 0.0 0.0HOWARD 212.1 212.1 212.1 212.1 212.1 212.1HUNT 88.1 88.1 88.1 88.1 88.1 88.1IRION 0.0 0.0 0.0 0.0 0.0 0.0JACK 630.0 630.0 630.0 630.0 630.0 630.0JACKSON 0.0 0.0 0.0 0.0 0.0 0.0JEFF DAVIS 0.0 0.0 0.0 0.0 0.0 0.0JIM HOGG 0.0 0.0 0.0 0.0 0.0 0.0
Winter Generation by County - 55 of 87
STP000005 May 9, 2011

CDR Report - Winter Generation by County June 2006
County 2007 2008 2009 2010 2011 2012Winter Generation, MW
JIM WELLS 0.0 0.0 0.0 0.0 0.0 0.0JOHNSON 270.0 270.0 270.0 270.0 270.0 270.0JONES 0.0 0.0 0.0 0.0 0.0 0.0KARNES 0.0 0.0 0.0 0.0 0.0 0.0KAUFMAN 1782.0 1782.0 1782.0 1782.0 1782.0 1782.0KENDALL 0.0 0.0 0.0 0.0 0.0 0.0KENEDY 0.0 0.0 0.0 0.0 0.0 0.0KENT 0.0 0.0 0.0 0.0 0.0 0.0KERR 0.0 0.0 0.0 0.0 0.0 0.0KIMBLE 0.0 0.0 0.0 0.0 0.0 0.0KING 0.0 0.0 0.0 0.0 0.0 0.0KINNEY 0.0 0.0 0.0 0.0 0.0 0.0KLEBERG 0.0 0.0 0.0 0.0 0.0 0.0KNOX 0.0 0.0 0.0 0.0 0.0 0.0LA SALLE 0.0 0.0 0.0 0.0 0.0 0.0LAMAR 1347.0 1347.0 1347.0 1347.0 1347.0 1347.0LAMPASAS 0.0 0.0 0.0 0.0 0.0 0.0LAVACA 0.0 0.0 0.0 0.0 0.0 0.0LEE 0.0 0.0 0.0 0.0 0.0 0.0LEON 0.0 0.0 0.0 0.0 0.0 0.0LIMESTONE 1770.0 1770.0 1770.0 1770.0 1770.0 1770.0LIVE OAK 0.0 0.0 0.0 0.0 0.0 0.0LLANO 491.0 491.0 491.0 491.0 491.0 491.0LOVING 0.0 0.0 0.0 0.0 0.0 0.0MADISON 0.0 0.0 0.0 0.0 0.0 0.0MARTIN 0.0 0.0 0.0 0.0 0.0 0.0MASON 0.0 0.0 0.0 0.0 0.0 0.0MATAGORDA 2566.0 2566.0 2566.0 2566.0 2566.0 2566.0MAVERICK 24.0 24.0 24.0 24.0 24.0 24.0MCCULLOCH 0.0 0.0 0.0 0.0 0.0 0.0MCLENNAN 1712.0 1712.0 1712.0 1712.0 1712.0 1712.0MCMULLEN 0.0 0.0 0.0 0.0 0.0 0.0MEDINA 0.0 0.0 0.0 0.0 0.0 0.0MENARD 0.0 0.0 0.0 0.0 0.0 0.0MIDLAND 0.0 0.0 0.0 0.0 0.0 0.0MILAM 545.0 545.0 545.0 545.0 545.0 545.0MILLS 0.0 0.0 0.0 0.0 0.0 0.0MITCHELL 1099.0 1099.0 1099.0 1099.0 1099.0 1099.0MONTAGUE 0.0 0.0 0.0 0.0 0.0 0.0MONTGOMERY 0.0 0.0 0.0 0.0 0.0 0.0MOTLEY 0.0 0.0 0.0 0.0 0.0 0.0NACOGDOCHES 0.0 0.0 0.0 0.0 0.0 0.0NAVARRO 0.0 0.0 0.0 0.0 0.0 0.0
Winter Generation by County - 56 of 87
STP000005 May 9, 2011

CDR Report - Winter Generation by County June 2006
County 2007 2008 2009 2010 2011 2012Winter Generation, MW
NOLAN 265.8 267.4 267.4 267.4 267.4 267.4NUECES 1941.0 1941.0 1931.0 1931.0 1931.0 1931.0PALO PINTO 634.0 634.0 634.0 634.0 634.0 634.0PARKER 80.4 80.4 80.4 80.4 80.4 80.4PECOS 10.6 10.6 10.6 10.6 10.6 10.6PRESIDIO 0.0 0.0 0.0 0.0 0.0 0.0RAINS 0.0 0.0 0.0 0.0 0.0 0.0REAGAN 0.0 0.0 0.0 0.0 0.0 0.0REAL 0.0 0.0 0.0 0.0 0.0 0.0RED RIVER 0.0 0.0 0.0 0.0 0.0 0.0REEVES 0.0 0.0 0.0 0.0 0.0 0.0REFUGIO 0.0 0.0 0.0 0.0 0.0 0.0ROBERTSON 307.0 307.0 307.0 307.0 307.0 307.0ROCKWALL 0.0 0.0 0.0 0.0 0.0 0.0RUNNELS 0.0 0.0 0.0 0.0 0.0 0.0RUSK 3342.0 3342.0 3342.0 3342.0 3342.0 3342.0SAN PATRICIO 420.0 420.0 420.0 420.0 420.0 420.0SAN SABA 0.0 0.0 0.0 0.0 0.0 0.0SCHLEICHER 0.0 0.0 0.0 0.0 0.0 0.0SCURRY 4.2 7.6 7.6 7.6 7.6 7.6SHACKELFORD 0.0 5.2 10.4 10.4 10.4 10.4SMITH 0.0 0.0 0.0 0.0 0.0 0.0SOMERVELL 2352.0 2352.0 2352.0 2352.0 2352.0 2352.0STARR 34.5 34.5 34.5 34.5 34.5 34.5STEPHENS 0.0 0.0 0.0 0.0 0.0 0.0STERLING 5.6 5.6 5.6 5.6 5.6 5.6STONEWALL 0.0 0.0 0.0 0.0 0.0 0.0SUTTON 0.0 0.0 0.0 0.0 0.0 0.0TARRANT 1980.5 1980.5 1980.5 1980.5 1980.5 1980.5TAYLOR 27.0 36.1 36.1 36.1 36.1 36.1TERRELL 0.0 0.0 0.0 0.0 0.0 0.0THROCKMORTON 0.0 0.0 0.0 0.0 0.0 0.0TITUS 2233.0 2233.0 2233.0 2233.0 2233.0 2233.0TOM GREEN 0.0 0.0 0.0 0.0 0.0 0.0TRAVIS 2053.0 1656.0 1656.0 1656.0 1656.0 1656.0UPTON 9.2 9.2 9.2 9.2 9.2 9.2UVALDE 0.0 0.0 0.0 0.0 0.0 0.0VAL VERDE 68.0 68.0 68.0 68.0 68.0 68.0VAN ZANDT 0.0 0.0 0.0 0.0 0.0 0.0VICTORIA 268.6 263.6 258.6 253.6 248.6 248.6WALLER 0.0 0.0 0.0 0.0 0.0 0.0WARD 981.0 981.0 981.0 981.0 981.0 981.0WASHINGTON 0.0 0.0 0.0 0.0 0.0 0.0WEBB 172.0 222.0 222.0 222.0 222.0 222.0WHARTON 80.0 355.0 355.0 355.0 355.0 355.0WICHITA 77.4 77.4 77.4 77.4 77.4 77.4WILBARGER 741.0 741.0 741.0 741.0 741.0 741.0WILLACY 0.0 0.0 0.0 0.0 0.0 0.0WILLIAMSON 0.0 0.0 0.0 0.0 0.0 0.0WILSON 0.0 0.0 0.0 0.0 0.0 0.0WINKLER 0.0 0.0 0.0 0.0 0.0 0.0WISE 706.0 706.0 706.0 706.0 706.0 706.0
Winter Generation by County - 57 of 87
STP000005 May 9, 2011

CDR Report - Winter Generation by County June 2006
County 2007 2008 2009 2010 2011 2012Winter Generation, MW
YOUNG 598.0 598.0 598.0 598.0 598.0 598.0ZAPATA 0.0 0.0 0.0 0.0 0.0 0.0ZAVALA 0.0 0.0 0.0 0.0 0.0 0.0
Winter Generation by County - 58 of 87
STP000005 May 9, 2011

CDR Report - Winter Import/Export by County June 2006
Import: The county has less generation than load and must import generation.Export: The county has more generation than load and is able to export generation.
County 2007 2008 2009 2010 2011 2012
ANDERSON -154.9 -158.3 -160.6 -164.2 -167.2 -172.4ANDREWS -163.8 -164.8 -165.9 -166.9 -168.0 -169.1ANGELINA -322.7 -317.2 -329.9 -333.3 -336.8 -340.2ARANSAS -60.3 -61.7 -63.1 -64.5 -65.9 -67.2ARCHER -28.8 -29.5 -31.2 -31.9 -32.6 -33.4ATASCOSA 321.8 319.9 318.0 316.1 314.2 312.4AUSTIN -83.4 -85.2 -87.1 -89.0 -91.1 -93.1BANDERA -75.5 -79.4 -83.4 -81.8 -86.0 -90.4BASTROP 894.0 880.6 878.6 867.6 868.6 857.6BAYLOR -15.9 -15.9 -16.0 -16.0 -16.0 -16.0BEE -61.7 -62.4 -63.1 -63.8 -64.5 -65.3BELL -859.6 -897.3 -920.7 -931.4 -956.3 -971.4BEXAR 1264.8 901.4 776.6 697.4 1353.5 1188.4BLANCO -42.4 -44.0 -45.4 -47.1 -48.8 -50.6BORDEN -0.1 -0.1 -0.1 -0.1 -0.2 -0.2BOSQUE 490.3 489.7 488.9 488.1 487.4 486.6BRAZORIA -431.5 -449.4 -620.7 -633.0 -794.9 -806.4BRAZOS -48.6 -57.5 -66.7 -76.2 -85.9 -95.8BREWSTER -22.6 -22.9 -23.2 -23.4 -23.7 -23.9BROOKS -16.5 -16.7 -17.0 -17.2 -17.5 -17.7BROWN -111.3 -112.9 -114.6 -116.4 -118.2 -124.0BURLESON -31.1 -32.1 -33.0 -34.0 -34.9 -35.8BURNET -49.0 -54.4 -60.0 -65.7 -71.7 -78.0CALDWELL -107.2 -110.5 -113.9 -117.1 -120.8 -124.4CALHOUN 217.6 215.4 210.0 204.9 200.2 195.6CALLAHAN -40.0 -40.6 -40.9 -41.4 -41.8 -42.3CAMERON -295.2 -257.7 -306.3 -340.8 -381.0 -417.6CHAMBERS 2673.5 2668.5 2666.4 2664.7 2663.0 2661.3CHEROKEE 597.8 601.5 600.9 599.6 599.0 597.7CHILDRESS -13.3 -13.5 -13.7 -13.9 -14.2 -14.4CLAY -30.3 -31.2 -31.9 -32.7 -33.5 -34.4COKE -15.6 -15.8 -16.1 -16.3 -16.5 -16.7COLEMAN -32.4 -32.8 -33.0 -33.3 -33.6 -33.8COLLIN -1211.9 -1272.7 -1350.5 -1414.8 -1491.0 -1563.1COLORADO -77.8 -79.4 -81.1 -82.8 -84.6 -86.4COMAL -366.1 -381.1 -418.2 -436.4 -455.6 -476.0COMANCHE -43.7 -43.8 -44.8 -45.7 -46.7 -47.8
Winter Import/Export, MW
This data is presented for example only. It is a calculation of the generation in the county less the non-coincident load in the county. The true values will depend on actual load levels and actual generation dispatch.
Winter Import/Export by County
Winter Import/Export - 59 of 87
STP000005 May 9, 2011

CDR Report - Winter Import/Export by County June 2006
County 2007 2008 2009 2010 2011 2012Winter Import/Export, MW
CONCHO -13.2 -13.5 -13.7 -14.0 -14.2 -14.4COOKE -129.6 -133.6 -137.5 -141.4 -145.5 -149.5CORYELL -120.3 -123.4 -128.5 -143.9 -147.7 -149.7COTTLE -4.8 -5.0 -5.1 -5.3 -5.5 -5.6CRANE -90.7 -92.5 -94.3 -96.1 -97.9 -99.6CROCKETT -36.2 -37.0 -37.9 -38.7 -39.5 -40.3CROSBY -2.1 -2.1 -2.1 -2.1 -2.1 -2.1CULBERSON -4.1 -4.2 0.3 0.2 0.1 0.0DALLAS -4369.1 -4527.8 -4679.7 -4817.5 -4978.1 -5133.3DAWSON -59.7 -60.3 -60.9 -61.4 -62.1 -62.8DELTA -9.7 -10.0 -10.2 -10.4 -10.7 -11.1DENTON -1565.2 -1658.1 -1760.1 -1844.9 -1960.9 -2033.4DEWITT -70.0 -71.8 -73.8 -75.8 -77.8 -80.0DICKENS -8.1 -8.4 -8.7 -9.1 -9.4 -9.7DIMMIT -17.4 -17.8 -18.2 -18.6 -19.0 -19.4DUVAL -41.0 -41.5 -42.0 -42.5 -43.1 -43.6EASTLAND -64.4 -63.8 -64.8 -65.8 -66.8 -67.8ECTOR 611.0 880.4 877.0 873.6 870.2 866.8EDWARDS -10.5 -10.7 -10.9 -11.1 -11.3 -11.4ELLIS 872.7 877.8 858.2 837.6 805.1 772.4ERATH -111.8 -115.5 -116.9 -118.6 -120.1 -121.7FALLS -47.7 -49.6 -50.4 -51.1 -52.6 -53.7FANNIN 2201.0 2196.7 2193.5 2193.4 2189.9 2185.9FAYETTE 1582.7 1580.8 1578.9 1579.9 1577.4 1575.5FISHER -22.9 -23.3 -23.6 -23.9 -24.2 -24.5FOARD -2.6 -2.6 -2.6 -2.6 -2.7 -2.7FORT BEND 3410.8 3350.1 3332.2 3319.5 3307.3 3294.8FRANKLIN -3.1 -3.1 -3.2 -3.2 -3.2 -3.2FREESTONE 2195.3 2191.6 2190.5 2193.6 2192.9 2191.9FRIO 47.8 46.6 45.5 44.3 43.1 41.9GALVESTON 1838.8 1886.3 1871.9 1857.2 1845.1 1832.8GILLESPIE -70.3 -72.6 -75.0 -77.3 -79.7 -82.1GLASSCOCK -18.1 -18.3 -18.5 -18.7 -18.9 -19.1GOLIAD 612.0 611.6 611.1 610.6 610.1 609.5GONZALES -59.0 -71.1 -73.8 -76.4 -79.2 -82.1GRAYSON -431.3 -446.9 -465.9 -486.0 -505.6 -523.5GRIMES 1331.5 1330.4 1329.3 1328.1 1326.8 1325.3GUADALUPE 1495.3 1482.6 1468.9 1454.3 1438.8 1422.4HALL -3.5 -3.7 -3.8 -4.0 -4.1 -4.2HAMILTON -27.6 -27.9 -28.1 -28.4 -28.6 -28.9HARDEMAN -18.9 -19.0 -19.1 -19.3 -19.4 -19.6HARRIS -2377.8 -2563.2 -2774.0 -2947.9 -3110.8 -3258.5HASKELL -15.9 -16.4 -16.8 -17.3 -17.7 -18.1HAYS 559.5 543.0 522.4 499.7 477.7 454.6HENDERSON 32.0 27.1 23.0 40.9 37.6 34.2HIDALGO 794.6 751.2 697.0 625.3 568.9 493.1HILL -111.3 -114.6 -117.9 -121.0 -125.9 -129.5HOOD 1639.5 1633.8 1633.6 1628.0 1622.2 1616.7
Winter Import/Export - 60 of 87
STP000005 May 9, 2011

CDR Report - Winter Import/Export by County June 2006
County 2007 2008 2009 2010 2011 2012Winter Import/Export, MW
HOPKINS -82.4 -84.0 -85.6 -94.1 -97.5 -101.5HOUSTON -40.9 -41.3 -41.3 -41.6 -41.6 -42.0HOWARD 99.2 98.4 97.6 86.8 96.1 95.2HUNT -120.4 -127.2 -116.0 -125.5 -131.4 -138.3IRION -11.0 -11.2 -11.4 -11.7 -11.9 -12.1JACK 605.1 604.5 603.9 603.3 602.6 602.0JACKSON -34.6 -35.2 -35.7 -36.3 -36.8 -37.3JEFF DAVIS -7.0 -7.2 -7.3 -7.5 -7.7 -7.9JIM HOGG -3.8 -3.9 -4.0 -4.1 -4.2 -4.3JIM WELLS -90.3 -92.3 -94.3 -96.3 -98.3 -100.2JOHNSON -116.9 -142.4 -158.5 -175.8 -193.0 -212.4JONES -42.8 -44.5 -46.0 -47.6 -49.2 -50.8KARNES -24.7 -25.7 -25.9 -26.2 -26.5 -26.8KAUFMAN 1410.1 1341.8 1308.7 1267.2 1237.2 1204.9KENDALL -118.3 -107.7 -114.3 -121.2 -124.5 -132.0KENEDY -1.2 -1.2 -1.2 -1.2 -1.3 -1.3KENT -54.6 -54.8 -55.0 -55.1 -55.3 -55.4KERR -163.0 -167.5 -172.1 -176.7 -181.4 -186.2KIMBLE -23.6 -24.1 -24.6 -25.1 -25.6 -26.1KING -7.9 -7.9 -7.9 -7.9 -7.9 -7.9KINNEY -8.7 -8.8 -9.0 -9.1 -9.3 -9.4KLEBERG -100.3 -101.6 -103.0 -104.2 -105.5 -106.7KNOX -13.7 -14.0 -14.4 -14.7 -15.0 -15.4LA SALLE -13.8 -14.4 -15.0 -15.5 -16.1 -16.7LAMAR 1171.6 1168.1 1164.7 1161.9 1180.1 1171.3LAMPASAS -66.0 -61.1 -63.9 -66.8 -69.8 -72.8LAVACA -37.8 -38.8 -39.8 -40.8 -41.9 -43.0LEE -33.1 -33.9 -34.7 -35.6 -36.4 -37.3LEON -173.2 -175.4 -177.5 -179.9 -182.3 -184.9LIMESTONE 1705.6 1703.7 1702.1 1700.4 1698.6 1696.7LIVE OAK -79.4 -81.0 -82.6 -84.1 -85.8 -87.4LLANO 401.4 398.3 395.1 391.9 388.7 385.4LOVING -5.9 -5.9 -6.0 -6.0 -6.1 -6.1MADISON -8.5 -8.7 -8.8 -9.0 -9.2 -9.4MARTIN -27.4 -27.8 -28.2 -28.6 -29.0 -29.4MASON -12.6 -12.9 -13.3 -13.7 -14.1 -14.4MATAGORDA 2415.5 2411.7 2407.8 2405.8 2403.2 2400.8MAVERICK -61.4 -65.3 -69.6 -73.5 -78.7 -81.7MCCULLOCH -28.1 -28.9 -29.8 -30.7 -31.6 -32.6MCLENNAN 1005.0 987.0 968.6 952.0 935.5 916.8MCMULLEN -6.2 -6.4 -6.5 -6.6 -6.8 -6.9MEDINA -153.5 -158.5 -164.1 -179.1 -185.7 -192.8MENARD -4.9 -5.0 -5.0 -5.1 -5.2 -5.2MIDLAND -287.9 -290.5 -293.2 -295.8 -298.4 -300.9MILAM 469.2 465.7 463.3 461.2 459.2 457.0MILLS -8.1 -8.2 -8.3 -8.5 -8.6 -8.7MITCHELL 1079.4 1079.2 1079.1 1078.9 1078.8 1078.6MONTAGUE -61.4 -62.9 -64.6 -66.2 -68.0 -69.8
Winter Import/Export - 61 of 87
STP000005 May 9, 2011

CDR Report - Winter Import/Export by County June 2006
County 2007 2008 2009 2010 2011 2012Winter Import/Export, MW
MONTGOMERY -184.6 -199.3 -213.0 -222.5 -232.4 -242.8MOTLEY -4.4 -4.6 -4.8 -5.0 -5.2 -5.5NACOGDOCHES -168.3 -168.7 -168.0 -170.1 -172.1 -174.2NAVARRO -206.9 -213.6 -232.6 -234.3 -240.0 -245.9NOLAN 200.2 201.1 200.8 200.3 199.9 199.3NUECES 908.5 888.9 858.9 839.7 821.6 800.7PALO PINTO 560.5 559.1 557.8 554.3 552.9 551.5PARKER -272.2 -278.6 -284.2 -295.5 -300.4 -311.6PECOS -83.5 -86.4 -89.2 -92.1 -95.0 -97.9PRESIDIO -12.9 -13.4 -13.9 -14.4 -14.9 -15.5RAINS -24.5 -24.9 -25.3 -25.8 -26.9 -28.2REAGAN -12.3 -12.7 -13.1 -13.5 -13.8 -14.2REAL -12.9 -13.3 -13.8 -14.2 -14.7 -15.2RED RIVER -32.1 -33.0 -33.6 -46.4 -48.1 -50.3REEVES -47.8 -48.7 -49.5 -50.4 -51.2 -52.1REFUGIO -24.9 -25.2 -25.4 -25.7 -26.0 -26.3ROBERTSON 288.5 287.8 287.0 286.1 285.1 284.1ROCKWALL -252.4 -266.6 -279.0 -291.7 -308.9 -328.2RUNNELS -35.8 -36.4 -37.0 -37.6 -38.2 -38.8RUSK 3327.1 3327.1 3327.1 3327.0 3327.0 3326.9SAN PATRICIO 234.6 231.4 228.1 225.0 221.8 218.7SAN SABA -11.9 -12.3 -12.6 -12.9 -13.2 -13.6SCHLEICHER -10.7 -10.7 -10.7 -10.7 -10.8 -10.8SCURRY -256.6 -248.6 -250.2 -251.6 -253.1 -254.5SHACKELFORD -21.4 -16.7 -11.9 -12.3 -12.7 -13.1SMITH -558.9 -585.2 -593.6 -602.3 -610.4 -619.0SOMERVELL 2294.4 2292.6 2291.2 2289.8 2288.4 2286.9STARR -49.8 -52.4 -55.1 -59.2 -63.3 -67.7STEPHENS -62.9 -63.9 -64.9 -66.0 -67.0 -68.0STERLING -3.8 -3.9 -4.0 -4.1 -4.2 -4.3STONEWALL -8.9 -9.3 -9.7 -10.1 -10.5 -10.8SUTTON -23.2 -23.5 -23.8 -24.1 -24.4 -24.7TARRANT -2692.0 -2871.4 -3004.4 -3172.4 -3300.4 -3445.1TAYLOR -299.5 -294.3 -297.6 -301.2 -304.9 -308.5TERRELL -3.7 -3.8 -3.8 -3.8 -3.9 -3.9THROCKMORTON -8.8 -8.9 -9.1 -9.2 -9.4 -9.5TITUS 2233.0 2233.0 2233.0 2233.0 2233.0 2233.0TOM GREEN -237.4 -239.6 -241.9 -244.2 -246.5 -248.8TRAVIS -165.4 -535.8 -652.6 -650.0 -632.5 -687.4UPTON -15.2 -16.2 -17.3 -18.4 -19.5 -20.5UVALDE -52.1 -53.5 -55.5 -57.3 -60.1 -61.4VAL VERDE -19.6 -22.0 -25.6 -28.7 -33.1 -35.3VAN ZANDT -111.3 -113.8 -116.2 -118.5 -122.2 -126.5VICTORIA -61.3 -74.9 -87.8 -100.5 -112.7 -119.8WALLER -190.3 -197.7 -204.6 -211.1 -218.0 -225.0WARD 921.8 921.3 920.7 920.1 919.6 919.0WASHINGTON -125.1 -118.6 -117.5 -120.3 -123.1 -125.9WEBB -156.9 -126.1 -137.6 -149.2 -160.8 -172.4
Winter Import/Export - 62 of 87
STP000005 May 9, 2011

CDR Report - Winter Import/Export by County June 2006
County 2007 2008 2009 2010 2011 2012Winter Import/Export, MW
WHARTON -26.9 247.0 245.8 244.7 243.5 242.4WICHITA -319.0 -322.6 -326.3 -331.5 -335.6 -342.9WILBARGER 707.2 706.7 706.2 705.7 705.2 704.7WILLACY -39.1 -40.3 -41.5 -43.4 -45.1 -47.0WILLIAMSON -758.0 -787.8 -818.5 -864.2 -903.9 -959.6WILSON -84.8 -87.9 -91.2 -94.7 -98.2 -101.9WINKLER -68.9 -69.5 -70.1 -70.7 -71.3 -72.0WISE 430.3 417.2 393.6 383.3 372.7 360.4YOUNG 531.0 529.5 528.0 526.4 524.8 523.2ZAPATA -24.2 -25.0 -25.9 -26.7 -27.6 -28.5ZAVALA -23.4 -24.0 -24.9 -25.7 -26.8 -27.4
Winter Import/Export - 63 of 87
STP000005 May 9, 2011
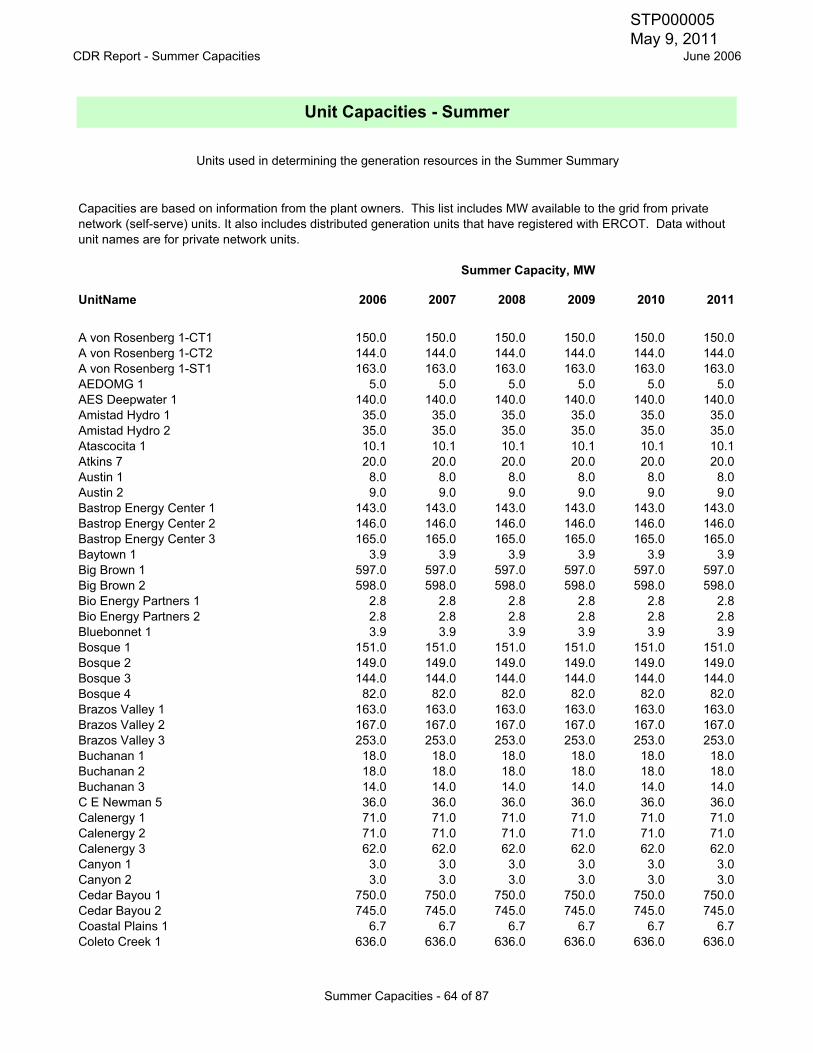
CDR Report - Summer Capacities June 2006
UnitName 2006 2007 2008 2009 2010 2011
A von Rosenberg 1-CT1 150.0 150.0 150.0 150.0 150.0 150.0A von Rosenberg 1-CT2 144.0 144.0 144.0 144.0 144.0 144.0A von Rosenberg 1-ST1 163.0 163.0 163.0 163.0 163.0 163.0AEDOMG 1 5.0 5.0 5.0 5.0 5.0 5.0AES Deepwater 1 140.0 140.0 140.0 140.0 140.0 140.0Amistad Hydro 1 35.0 35.0 35.0 35.0 35.0 35.0Amistad Hydro 2 35.0 35.0 35.0 35.0 35.0 35.0Atascocita 1 10.1 10.1 10.1 10.1 10.1 10.1Atkins 7 20.0 20.0 20.0 20.0 20.0 20.0Austin 1 8.0 8.0 8.0 8.0 8.0 8.0Austin 2 9.0 9.0 9.0 9.0 9.0 9.0Bastrop Energy Center 1 143.0 143.0 143.0 143.0 143.0 143.0Bastrop Energy Center 2 146.0 146.0 146.0 146.0 146.0 146.0Bastrop Energy Center 3 165.0 165.0 165.0 165.0 165.0 165.0Baytown 1 3.9 3.9 3.9 3.9 3.9 3.9Big Brown 1 597.0 597.0 597.0 597.0 597.0 597.0Big Brown 2 598.0 598.0 598.0 598.0 598.0 598.0Bio Energy Partners 1 2.8 2.8 2.8 2.8 2.8 2.8Bio Energy Partners 2 2.8 2.8 2.8 2.8 2.8 2.8Bluebonnet 1 3.9 3.9 3.9 3.9 3.9 3.9Bosque 1 151.0 151.0 151.0 151.0 151.0 151.0Bosque 2 149.0 149.0 149.0 149.0 149.0 149.0Bosque 3 144.0 144.0 144.0 144.0 144.0 144.0Bosque 4 82.0 82.0 82.0 82.0 82.0 82.0Brazos Valley 1 163.0 163.0 163.0 163.0 163.0 163.0Brazos Valley 2 167.0 167.0 167.0 167.0 167.0 167.0Brazos Valley 3 253.0 253.0 253.0 253.0 253.0 253.0Buchanan 1 18.0 18.0 18.0 18.0 18.0 18.0Buchanan 2 18.0 18.0 18.0 18.0 18.0 18.0Buchanan 3 14.0 14.0 14.0 14.0 14.0 14.0C E Newman 5 36.0 36.0 36.0 36.0 36.0 36.0Calenergy 1 71.0 71.0 71.0 71.0 71.0 71.0Calenergy 2 71.0 71.0 71.0 71.0 71.0 71.0Calenergy 3 62.0 62.0 62.0 62.0 62.0 62.0Canyon 1 3.0 3.0 3.0 3.0 3.0 3.0Canyon 2 3.0 3.0 3.0 3.0 3.0 3.0Cedar Bayou 1 750.0 750.0 750.0 750.0 750.0 750.0Cedar Bayou 2 745.0 745.0 745.0 745.0 745.0 745.0Coastal Plains 1 6.7 6.7 6.7 6.7 6.7 6.7Coleto Creek 1 636.0 636.0 636.0 636.0 636.0 636.0
Unit Capacities - Summer
Units used in determining the generation resources in the Summer Summary
Capacities are based on information from the plant owners. This list includes MW available to the grid from private network (self-serve) units. It also includes distributed generation units that have registered with ERCOT. Data without unit names are for private network units.
Summer Capacity, MW
Summer Capacities - 64 of 87
STP000005 May 9, 2011

CDR Report - Summer Capacities June 2006
UnitName 2006 2007 2008 2009 2010 2011
Summer Capacity, MW
Comanche Peak 1 1,161.0 1,161.0 1,161.0 1,161.0 1,161.0 1,161.0Comanche Peak 2 1,166.0 1,166.0 1,166.0 1,166.0 1,166.0 1,166.0Covel Gardens LG Power Station 1 1.6 1.6 1.6 1.6 1.6 1.6Covel Gardens LG Power Station 2 1.6 1.6 1.6 1.6 1.6 1.6Covel Gardens LG Power Station 3 1.6 1.6 1.6 1.6 1.6 1.6Covel Gardens LG Power Station 4 1.6 1.6 1.6 1.6 1.6 1.6Covel Gardens LG Power Station 5 1.6 1.6 1.6 1.6 1.6 1.6Covel Gardens LG Power Station 6 1.6 1.6 1.6 1.6 1.6 1.6Dansby 1 111.0 111.0 111.0 111.0 111.0 111.0Dansby 2 48.0 48.0 48.0 48.0 48.0 48.0Decker Creek 1 327.0 327.0 327.0 327.0 327.0 327.0Decker Creek 2 422.0 422.0 422.0 422.0 422.0 422.0Decker Creek G1 47.0 47.0 47.0 47.0 47.0 47.0Decker Creek G2 49.0 49.0 49.0 49.0 49.0 49.0Decker Creek G3 48.0 48.0 48.0 48.0 48.0 48.0Decker Creek G4 44.0 44.0 44.0 44.0 44.0 44.0DeCordova 1 779.0 779.0 779.0 779.0 779.0 779.0DeCordova A 68.0 68.0 68.0 68.0 68.0 68.0DeCordova B 70.0 70.0 70.0 70.0 70.0 70.0DeCordova C 68.0 68.0 68.0 68.0 68.0 68.0DeCordova D 68.0 68.0 68.0 68.0 68.0 68.0Denison Dam 1 40.0 40.0 40.0 40.0 40.0 40.0Denison Dam 2 40.0 40.0 40.0 40.0 40.0 40.0Dunlop (Schumansville) 1 3.6 3.6 3.6 3.6 3.6 3.6Eagle Pass 1 2.0 2.0 2.0 2.0 2.0 2.0Eagle Pass 2 2.0 2.0 2.0 2.0 2.0 2.0Eagle Pass 3 2.0 2.0 2.0 2.0 2.0 2.0Ennis Power Station 1 203.0 203.0 203.0 203.0 203.0 203.0Ennis Power Station 2 115.0 115.0 115.0 115.0 115.0 115.0ExTex La Porte Power Sta.1 42.0 42.0 42.0 42.0 42.0 42.0ExTex La Porte Power Sta.2 42.0 42.0 42.0 42.0 42.0 42.0ExTex La Porte Power Sta.3 41.0 41.0 41.0 41.0 41.0 41.0ExTex La Porte Power Sta.4 41.0 41.0 41.0 41.0 41.0 41.0Falcon Hydro 1 11.5 11.5 11.5 11.5 11.5 11.5Falcon Hydro 2 11.5 11.5 11.5 11.5 11.5 11.5Falcon Hydro 3 11.0 11.0 11.0 11.0 11.0 11.0Fayette Power Project 1 608.0 608.0 608.0 608.0 608.0 608.0Fayette Power Project 2 608.0 608.0 608.0 608.0 608.0 608.0Fayette Power Project 3 445.0 445.0 445.0 445.0 445.0 445.0FPLE Forney CT1 162.0 162.0 162.0 162.0 162.0 162.0FPLE Forney CT2 164.0 164.0 164.0 164.0 164.0 164.0FPLE Forney CT3 165.0 165.0 165.0 165.0 165.0 165.0FPLE Forney CT4 160.0 160.0 160.0 160.0 160.0 160.0FPLE Forney CT5 158.0 158.0 158.0 158.0 158.0 158.0FPLE Forney CT6 156.0 156.0 156.0 156.0 156.0 156.0FPLE Forney STG1 404.0 404.0 404.0 404.0 404.0 404.0FPLE Forney STG2 401.0 401.0 401.0 401.0 401.0 401.0Freestone Energy Center 1 143.0 143.0 143.0 143.0 143.0 143.0Freestone Energy Center 2 152.0 152.0 152.0 152.0 152.0 152.0Freestone Energy Center 3 174.0 174.0 174.0 174.0 174.0 174.0Freestone Energy Center 4 144.0 144.0 144.0 144.0 144.0 144.0
Summer Capacities - 65 of 87
STP000005 May 9, 2011

CDR Report - Summer Capacities June 2006
UnitName 2006 2007 2008 2009 2010 2011
Summer Capacity, MW
Freestone Energy Center 5 155.0 155.0 155.0 155.0 155.0 155.0Freestone Energy Center 6 172.0 172.0 172.0 172.0 172.0 172.0Frontera 1 145.0 145.0 145.0 145.0 145.0 145.0Frontera 2 144.0 144.0 144.0 144.0 144.0 144.0Frontera 3 168.0 168.0 168.0 168.0 168.0 168.0FW Regional LFG Generation Facility 1 1.5 1.5 1.5 1.5 1.5 1.5GBRA H 4 2.4 2.4 2.4 2.4 2.4 2.4GBRA H 5 2.4 2.4 2.4 2.4 2.4 2.4GBRA TP 4 2.4 2.4 2.4 2.4 2.4 2.4Gibbons Creek 1 465.0 465.0 465.0 465.0 465.0 465.0Graham 1 241.0 241.0 241.0 241.0 241.0 241.0Graham 2 390.0 390.0 390.0 390.0 390.0 390.0Granite Shoals 1 29.0 29.0 29.0 29.0 29.0 29.0Granite Shoals 2 30.0 30.0 30.0 30.0 30.0 30.0Greens Bayou 5 396.0 396.0 396.0 396.0 396.0 396.0Greens Bayou 73 48.0 48.0 48.0 48.0 48.0 48.0Greens Bayou 74 47.0 47.0 47.0 47.0 47.0 47.0Greens Bayou 81 46.0 46.0 46.0 46.0 46.0 46.0Greens Bayou 82 57.0 57.0 57.0 57.0 57.0 57.0Greens Bayou 83 58.0 58.0 58.0 58.0 58.0 58.0Greens Bayou 84 55.0 55.0 55.0 55.0 55.0 55.0Guadalupe Power Partners 1 152.0 152.0 152.0 152.0 152.0 152.0Guadalupe Power Partners 2 153.0 153.0 153.0 153.0 153.0 153.0Guadalupe Power Partners 3 156.0 156.0 156.0 156.0 156.0 156.0Guadalupe Power Partners 4 151.0 151.0 151.0 151.0 151.0 151.0Guadalupe Power Partners 5 194.0 194.0 194.0 194.0 194.0 194.0Guadalupe Power Partners 6 201.0 201.0 201.0 201.0 201.0 201.0Handley 3 392.0 392.0 392.0 392.0 392.0 392.0Handley 4 435.0 435.0 435.0 435.0 435.0 435.0Handley 5 436.0 436.0 436.0 436.0 436.0 436.0Hays Energy Facility 1 225.0 225.0 225.0 225.0 225.0 225.0Hays Energy Facility 2 223.0 223.0 223.0 223.0 223.0 223.0Hays Energy Facility 3 226.0 226.0 226.0 226.0 226.0 226.0Hays Energy Facility 4 229.0 229.0 229.0 229.0 229.0 229.0Hidalgo 1 150.0 150.0 150.0 150.0 150.0 150.0Hidalgo 2 148.0 148.0 148.0 148.0 148.0 148.0Hidalgo 3 168.0 168.0 168.0 168.0 168.0 168.0Holly Street 3 196.0 196.0 196.0 196.0 196.0 196.0Holly Street 4 197.0 197.0 197.0 197.0 197.0 197.0Inks 1 14.0 14.0 14.0 14.0 14.0 14.0J K Spruce 1 564.0 564.0 564.0 564.0 564.0 564.0J T Deely 1 403.0 403.0 403.0 403.0 403.0 403.0J T Deely 2 413.0 413.0 413.0 413.0 413.0 413.0Jack County Generation Facility 1 160.0 160.0 160.0 160.0 160.0 160.0Jack County Generation Facility 2 160.0 160.0 160.0 160.0 160.0 160.0Jack County Generation Facility 3 300.0 300.0 300.0 300.0 300.0 300.0Johnson County Generation Facility 1 158.0 158.0 158.0 158.0 158.0 158.0Johnson County Generation Facility 2 100.0 100.0 100.0 100.0 100.0 100.0Lake Creek 1 81.0 81.0 81.0 81.0 81.0 81.0Lake Creek 2 232.0 232.0 232.0 232.0 232.0 232.0Lake Creek D1 2.0 2.0 2.0 2.0 2.0 2.0
Summer Capacities - 66 of 87
STP000005 May 9, 2011
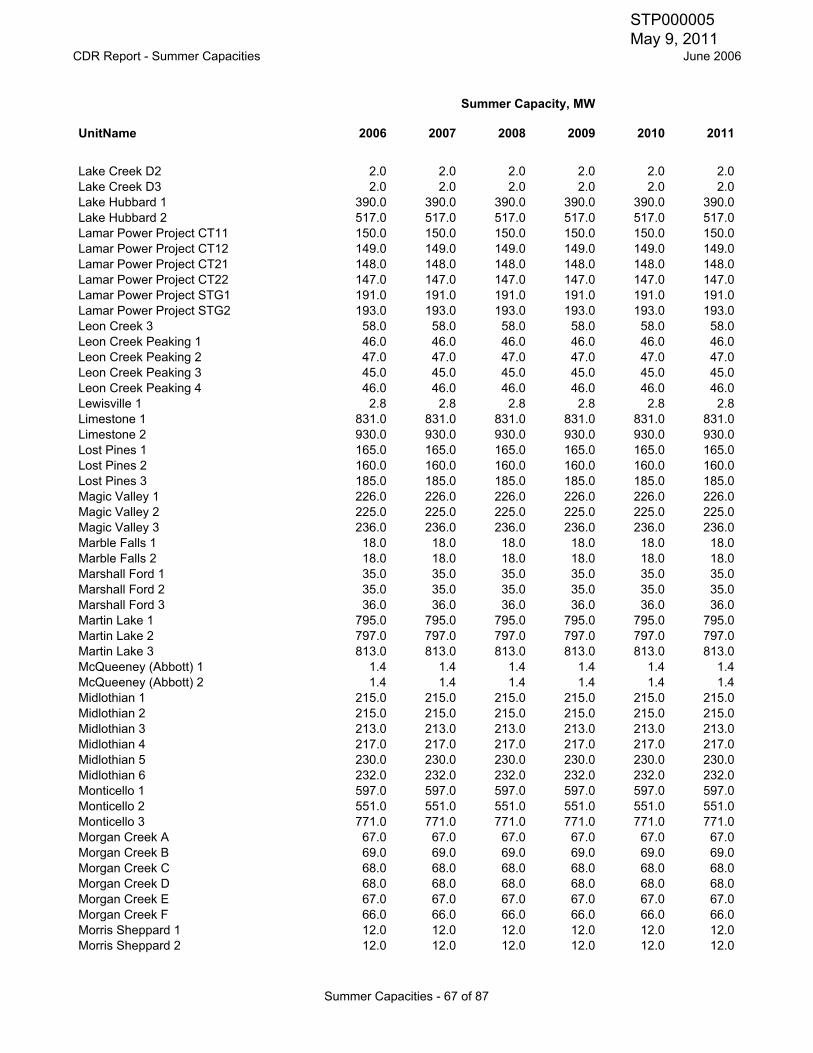
CDR Report - Summer Capacities June 2006
UnitName 2006 2007 2008 2009 2010 2011
Summer Capacity, MW
Lake Creek D2 2.0 2.0 2.0 2.0 2.0 2.0Lake Creek D3 2.0 2.0 2.0 2.0 2.0 2.0Lake Hubbard 1 390.0 390.0 390.0 390.0 390.0 390.0Lake Hubbard 2 517.0 517.0 517.0 517.0 517.0 517.0Lamar Power Project CT11 150.0 150.0 150.0 150.0 150.0 150.0Lamar Power Project CT12 149.0 149.0 149.0 149.0 149.0 149.0Lamar Power Project CT21 148.0 148.0 148.0 148.0 148.0 148.0Lamar Power Project CT22 147.0 147.0 147.0 147.0 147.0 147.0Lamar Power Project STG1 191.0 191.0 191.0 191.0 191.0 191.0Lamar Power Project STG2 193.0 193.0 193.0 193.0 193.0 193.0Leon Creek 3 58.0 58.0 58.0 58.0 58.0 58.0Leon Creek Peaking 1 46.0 46.0 46.0 46.0 46.0 46.0Leon Creek Peaking 2 47.0 47.0 47.0 47.0 47.0 47.0Leon Creek Peaking 3 45.0 45.0 45.0 45.0 45.0 45.0Leon Creek Peaking 4 46.0 46.0 46.0 46.0 46.0 46.0Lewisville 1 2.8 2.8 2.8 2.8 2.8 2.8Limestone 1 831.0 831.0 831.0 831.0 831.0 831.0Limestone 2 930.0 930.0 930.0 930.0 930.0 930.0Lost Pines 1 165.0 165.0 165.0 165.0 165.0 165.0Lost Pines 2 160.0 160.0 160.0 160.0 160.0 160.0Lost Pines 3 185.0 185.0 185.0 185.0 185.0 185.0Magic Valley 1 226.0 226.0 226.0 226.0 226.0 226.0Magic Valley 2 225.0 225.0 225.0 225.0 225.0 225.0Magic Valley 3 236.0 236.0 236.0 236.0 236.0 236.0Marble Falls 1 18.0 18.0 18.0 18.0 18.0 18.0Marble Falls 2 18.0 18.0 18.0 18.0 18.0 18.0Marshall Ford 1 35.0 35.0 35.0 35.0 35.0 35.0Marshall Ford 2 35.0 35.0 35.0 35.0 35.0 35.0Marshall Ford 3 36.0 36.0 36.0 36.0 36.0 36.0Martin Lake 1 795.0 795.0 795.0 795.0 795.0 795.0Martin Lake 2 797.0 797.0 797.0 797.0 797.0 797.0Martin Lake 3 813.0 813.0 813.0 813.0 813.0 813.0McQueeney (Abbott) 1 1.4 1.4 1.4 1.4 1.4 1.4McQueeney (Abbott) 2 1.4 1.4 1.4 1.4 1.4 1.4Midlothian 1 215.0 215.0 215.0 215.0 215.0 215.0Midlothian 2 215.0 215.0 215.0 215.0 215.0 215.0Midlothian 3 213.0 213.0 213.0 213.0 213.0 213.0Midlothian 4 217.0 217.0 217.0 217.0 217.0 217.0Midlothian 5 230.0 230.0 230.0 230.0 230.0 230.0Midlothian 6 232.0 232.0 232.0 232.0 232.0 232.0Monticello 1 597.0 597.0 597.0 597.0 597.0 597.0Monticello 2 551.0 551.0 551.0 551.0 551.0 551.0Monticello 3 771.0 771.0 771.0 771.0 771.0 771.0Morgan Creek A 67.0 67.0 67.0 67.0 67.0 67.0Morgan Creek B 69.0 69.0 69.0 69.0 69.0 69.0Morgan Creek C 68.0 68.0 68.0 68.0 68.0 68.0Morgan Creek D 68.0 68.0 68.0 68.0 68.0 68.0Morgan Creek E 67.0 67.0 67.0 67.0 67.0 67.0Morgan Creek F 66.0 66.0 66.0 66.0 66.0 66.0Morris Sheppard 1 12.0 12.0 12.0 12.0 12.0 12.0Morris Sheppard 2 12.0 12.0 12.0 12.0 12.0 12.0
Summer Capacities - 67 of 87
STP000005 May 9, 2011

CDR Report - Summer Capacities June 2006
UnitName 2006 2007 2008 2009 2010 2011
Summer Capacity, MW
Mountain Creek 2 23.0 23.0 23.0 23.0 23.0 23.0Mountain Creek 6 122.0 122.0 122.0 122.0 122.0 122.0Mountain Creek 7 95.0 95.0 95.0 95.0 95.0 95.0Mountain Creek 8 568.0 568.0 568.0 568.0 568.0 568.0Nelson Gardens Landfill Power Station 1 1.8 1.8 1.8 1.8 1.8 1.8Nelson Gardens Landfill Power Station 2 1.8 1.8 1.8 1.8 1.8 1.8Nolte 1 1.2 1.2 1.2 1.2 1.2 1.2Nolte 2 1.2 1.2 1.2 1.2 1.2 1.2North Texas 1 18.0 18.0 18.0 18.0 18.0 18.0North Texas 2 18.0 18.0 18.0 18.0 18.0 18.0North Texas 3 38.0 38.0 38.0 38.0 38.0 38.0O W Sommers 1 426.0 426.0 426.0 426.0 426.0 426.0O W Sommers 2 415.0 415.0 415.0 415.0 415.0 415.0O W Sommers 3 2.5 2.5 2.5 2.5 2.5 2.5O W Sommers 4 2.5 2.5 2.5 2.5 2.5 2.5O W Sommers 5 2.5 2.5 2.5 2.5 2.5 2.5O W Sommers 6 2.5 2.5 2.5 2.5 2.5 2.5Odessa-Ector C11 144.0 144.0 144.0 144.0 144.0 144.0Odessa-Ector C12 141.0 141.0 141.0 141.0 141.0 141.0Odessa-Ector C21 138.0 138.0 138.0 138.0 138.0 138.0Odessa-Ector C22 149.0 149.0 149.0 149.0 149.0 149.0Odessa-Ector ST1 214.0 214.0 214.0 214.0 214.0 214.0Odessa-Ector ST2 210.0 210.0 210.0 210.0 210.0 210.0Oklaunion 1 594.0 594.0 594.0 594.0 594.0 594.0Pearsall 1 24.0 24.0 24.0 24.0 24.0 24.0Pearsall 2 25.0 25.0 25.0 25.0 25.0 25.0Pearsall 3 24.0 24.0 24.0 24.0 24.0 24.0Permian Basin 5 117.0 117.0 117.0 117.0 117.0 117.0Permian Basin 6 523.0 523.0 523.0 523.0 523.0 523.0Permian Basin A 69.0 69.0 69.0 69.0 69.0 69.0Permian Basin B 69.0 69.0 69.0 69.0 69.0 69.0Permian Basin C 73.0 73.0 73.0 73.0 73.0 73.0Permian Basin D 73.0 73.0 73.0 73.0 73.0 73.0Permian Basin E 71.0 71.0 71.0 71.0 71.0 71.0Powerlane Plant 1 19.0 19.0 19.0 19.0 19.0 19.0Powerlane Plant 2 26.0 26.0 26.0 26.0 26.0 26.0Powerlane Plant 3 42.0 42.0 42.0 42.0 42.0 42.0R W Miller 1 75.0 75.0 75.0 75.0 75.0 75.0R W Miller 2 120.0 120.0 120.0 120.0 120.0 120.0R W Miller 3 208.0 208.0 208.0 208.0 208.0 208.0R W Miller 4 104.0 104.0 104.0 104.0 104.0 104.0R W Miller 5 104.0 104.0 104.0 104.0 104.0 104.0Ray Olinger 1 77.0 77.0 77.0 77.0 77.0 77.0Ray Olinger 2 112.0 112.0 112.0 112.0 112.0 112.0Ray Olinger 3 141.0 141.0 141.0 141.0 141.0 141.0Ray Olinger 4 77.0 77.0 77.0 77.0 77.0 77.0Rayburn 1 11.0 11.0 11.0 11.0 11.0 11.0Rayburn 2 11.0 11.0 11.0 11.0 11.0 11.0Rayburn 3 25.0 25.0 25.0 25.0 25.0 25.0Rayburn 4 2.0 2.0 2.0 2.0 2.0 2.0Rayburn 5 2.0 2.0 2.0 2.0 2.0 2.0
Summer Capacities - 68 of 87
STP000005 May 9, 2011

CDR Report - Summer Capacities June 2006
UnitName 2006 2007 2008 2009 2010 2011
Summer Capacity, MW
Rayburn 7 49.0 49.0 49.0 49.0 49.0 49.0Rayburn 8 49.0 49.0 49.0 49.0 49.0 49.0Rayburn 9 48.0 48.0 48.0 48.0 48.0 48.0Rayburn 10 40.0 40.0 40.0 40.0 40.0 40.0Rio Nogales 1 152.0 152.0 152.0 152.0 152.0 152.0Rio Nogales 2 149.0 149.0 149.0 149.0 149.0 149.0Rio Nogales 3 150.0 150.0 150.0 150.0 150.0 150.0Rio Nogales 4 296.0 296.0 296.0 296.0 296.0 296.0Sam Bertron 3 210.0 210.0 210.0 210.0 210.0 210.0Sam Bertron 4 233.0 233.0 233.0 233.0 233.0 233.0Sam Bertron ST1 161.0 161.0 161.0 161.0 161.0 161.0Sam Bertron ST2 168.0 168.0 168.0 168.0 168.0 168.0Sam Bertron T1 17.0 17.0 17.0 17.0 17.0 17.0Sam Bertron T2 13.0 13.0 13.0 13.0 13.0 13.0San Jacinto SES 1 80.0 80.0 80.0 80.0 80.0 80.0San Jacinto SES 2 82.0 82.0 82.0 82.0 82.0 82.0San Miguel 1 396.0 396.0 396.0 396.0 396.0 396.0Sandhill Energy Center 1 48.0 48.0 48.0 48.0 48.0 48.0Sandhill Energy Center 2 47.0 47.0 47.0 47.0 47.0 47.0Sandhill Energy Center 3 46.0 46.0 46.0 46.0 46.0 46.0Sandhill Energy Center 4 47.0 47.0 47.0 47.0 47.0 47.0Sandhill Energy Center 5A 161.0 161.0 161.0 161.0 161.0 161.0Sandhill Energy Center 5C 151.0 151.0 151.0 151.0 151.0 151.0Silas Ray 5 16.0 16.0 16.0 16.0 16.0 16.0Silas Ray 6 16.0 16.0 16.0 16.0 16.0 16.0Silas Ray 9 38.0 38.0 38.0 38.0 38.0 38.0Silas Ray 10 47.0 47.0 47.0 47.0 47.0 47.0Sim Gideon 1 134.0 134.0 134.0 134.0 134.0 134.0Sim Gideon 2 132.0 132.0 132.0 132.0 132.0 132.0Sim Gideon 3 335.0 335.0 335.0 335.0 335.0 335.0Small Hydro of Texas 1 1.2 1.2 1.2 1.2 1.2 1.2South Texas 1 1,277.0 1,277.0 1,277.0 1,277.0 1,277.0 1,277.0South Texas 2 1,283.0 1,283.0 1,283.0 1,283.0 1,283.0 1,283.0Spencer 4 60.0 60.0 60.0 60.0 60.0 60.0Spencer 5 61.0 61.0 61.0 61.0 61.0 61.0Stryker Creek 1 183.0 183.0 183.0 183.0 183.0 183.0Stryker Creek 2 499.0 499.0 499.0 499.0 499.0 499.0Stryker Creek D1 11.0 11.0 11.0 11.0 11.0 11.0Sweetwater Generation Plant 1 29.0 29.0 29.0 29.0 29.0 29.0Sweetwater Generation Plant 2 69.0 69.0 69.0 69.0 69.0 69.0Sweetwater Generation Plant 3 65.0 65.0 65.0 65.0 65.0 65.0Sweetwater Generation Plant 4 64.0 64.0 64.0 64.0 64.0 64.0T H Wharton 3 107.0 107.0 107.0 107.0 107.0 107.0T H Wharton 31 58.0 58.0 58.0 58.0 58.0 58.0T H Wharton 32 54.0 54.0 54.0 54.0 54.0 54.0T H Wharton 33 58.0 58.0 58.0 58.0 58.0 58.0T H Wharton 34 57.0 57.0 57.0 57.0 57.0 57.0T H Wharton 4 108.0 108.0 108.0 108.0 108.0 108.0T H Wharton 41 58.0 58.0 58.0 58.0 58.0 58.0T H Wharton 42 55.0 55.0 55.0 55.0 55.0 55.0T H Wharton 43 56.0 56.0 56.0 56.0 56.0 56.0
Summer Capacities - 69 of 87
STP000005 May 9, 2011

CDR Report - Summer Capacities June 2006
UnitName 2006 2007 2008 2009 2010 2011
Summer Capacity, MW
T H Wharton 44 57.0 57.0 57.0 57.0 57.0 57.0T H Wharton 51 58.0 58.0 58.0 58.0 58.0 58.0T H Wharton 52 58.0 58.0 58.0 58.0 58.0 58.0T H Wharton 53 58.0 58.0 58.0 58.0 58.0 58.0T H Wharton 54 60.0 60.0 60.0 60.0 60.0 60.0T H Wharton 55 61.0 61.0 61.0 61.0 61.0 61.0T H Wharton 56 59.0 59.0 59.0 59.0 59.0 59.0T H Wharton G1 12.0 12.0 12.0 12.0 12.0 12.0Tenaska-Lamar 1 81.0 81.0 81.0 81.0 81.0 81.0Tenaska-Lamar 2 82.0 82.0 82.0 82.0 82.0 82.0Tenaska-Lamar 3 95.0 95.0 95.0 95.0 95.0 95.0Tessman Road 1 1.4 1.4 1.4 1.4 1.4 1.4Tessman Road 2 1.4 1.4 1.4 1.4 1.4 1.4Tessman Road 3 1.4 1.4 1.4 1.4 1.4 1.4Tessman Road 4 1.4 1.4 1.4 1.4 1.4 1.4Tessman Road 5 1.4 1.4 1.4 1.4 1.4 1.4Tessman Road 6 1.4 1.4 1.4 1.4 1.4 1.4Texas City 1 104.0 104.0 104.0 104.0 104.0 104.0Texas City 2 101.0 101.0 101.0 101.0 101.0 101.0Texas City 3 104.0 104.0 104.0 104.0 104.0 104.0Texas City 4 125.0 125.0 125.0 125.0 125.0 125.0Thomas C Ferguson 1 420.0 420.0 420.0 420.0 420.0 420.0Tradinghouse 1 556.0 556.0 556.0 556.0 556.0 556.0Tradinghouse 2 799.0 799.0 799.0 799.0 799.0 799.0Trinidad 6 236.0 236.0 236.0 236.0 236.0 236.0Trinidad D1 4.0 4.0 4.0 4.0 4.0 4.0Twin Oaks 1 152.0 152.0 152.0 152.0 152.0 152.0Twin Oaks 2 154.0 154.0 154.0 154.0 154.0 154.0V H Braunig 1 225.0 225.0 225.0 225.0 225.0 225.0V H Braunig 2 237.0 237.0 237.0 237.0 237.0 237.0V H Braunig 3 414.0 414.0 414.0 414.0 414.0 414.0W A Parish 1 163.0 163.0 163.0 163.0 163.0 163.0W A Parish 2 165.0 165.0 165.0 165.0 165.0 165.0W A Parish 3 210.0 210.0 210.0 210.0 210.0 210.0W A Parish 4 534.0 534.0 534.0 534.0 534.0 534.0W A Parish 5 662.0 662.0 662.0 662.0 662.0 662.0W A Parish 6 654.0 654.0 654.0 654.0 654.0 654.0W A Parish 7 556.0 556.0 556.0 556.0 556.0 556.0W A Parish 8 594.0 594.0 594.0 594.0 594.0 594.0W A Parish T1 13.0 13.0 13.0 13.0 13.0 13.0W B Tuttle 1 61.0 61.0 61.0 61.0 61.0 61.0W B Tuttle 3 96.0 96.0 96.0 96.0 96.0 96.0W B Tuttle 4 153.0 153.0 153.0 153.0 153.0 153.0Waco LFG 1 1.2 1.2 1.2 1.2 1.2 1.2Weatherford 1 0.3 0.3 0.3 0.3 0.3 0.3Weatherford 2 0.3 0.3 0.3 0.3 0.3 0.3Weatherford 3 0.3 0.3 0.3 0.3 0.3 0.3Weatherford 4 0.5 0.5 0.5 0.5 0.5 0.5Weatherford 6 1.4 1.4 1.4 1.4 1.4 1.4Weatherford 7 1.3 1.3 1.3 1.3 1.3 1.3Weatherford 8 1.3 1.3 1.3 1.3 1.3 1.3
Summer Capacities - 70 of 87
STP000005 May 9, 2011

CDR Report - Summer Capacities June 2006
UnitName 2006 2007 2008 2009 2010 2011
Summer Capacity, MW
Whitney 1 15.0 15.0 15.0 15.0 15.0 15.0Whitney 2 15.0 15.0 15.0 15.0 15.0 15.0Wichita Falls 1 19.6 19.6 19.6 19.6 19.6 19.6Wichita Falls 2 19.6 19.6 19.6 19.6 19.6 19.6Wichita Falls 3 19.6 19.6 19.6 19.6 19.6 19.6Wichita Falls 4 16.6 16.6 16.6 16.6 16.6 16.6Wise County Power Proj. 1 212.0 212.0 212.0 212.0 212.0 212.0Wise County Power Proj. 2 212.0 212.0 212.0 212.0 212.0 212.0Wise County Power Proj. 3 241.0 241.0 241.0 241.0 241.0 241.0Wolf Hollow Power Proj. 1 214.0 214.0 214.0 214.0 214.0 214.0Wolf Hollow Power Proj. 2 213.0 213.0 213.0 213.0 213.0 213.0Wolf Hollow Power Proj. 3 264.0 264.0 264.0 264.0 264.0 264.0Operational 58,573.3 58,573.3 58,573.3 58,573.3 58,573.3 58,573.3
3.0 3.0 3.0 3.0 3.0 3.074.0 74.0 74.0 74.0 74.0 74.080.0 215.0 215.0 215.0 215.0 215.0
248.0 248.0 248.0 248.0 248.0 248.0580.0 580.0 580.0 580.0 580.0 580.035.0 35.0 35.0 35.0 35.0 35.0
251.0 245.0 245.0 245.0 245.0 245.0170.0 164.0 164.0 164.0 164.0 164.0730.0 730.0 730.0 730.0 730.0 730.0299.0 299.0 299.0 299.0 299.0 299.010.0 10.0 0.0 0.0 0.0 0.095.0 95.0 95.0 95.0 95.0 95.0
900.0 900.0 900.0 900.0 900.0 900.0285.0 285.0 0.0 0.0 0.0 0.0
1.0 1.0 1.0 1.0 1.0 1.06.0 6.0 6.0 6.0 6.0 6.0
50.0 50.0 50.0 50.0 50.0 50.0152.0 152.0 152.0 152.0 152.0 152.014.0 14.0 14.0 14.0 14.0 14.0
400.0 400.0 400.0 400.0 400.0 400.0481.0 464.0 464.0 464.0 464.0 464.0236.0 236.0 236.0 236.0 236.0 236.0545.0 545.0 545.0 545.0 545.0 545.0
0.0 0.0 0.0 0.0 0.0 0.0352.0 406.0 406.0 406.0 406.0 406.0325.0 325.0 325.0 325.0 325.0 325.072.0 72.0 72.0 72.0 72.0 72.010.0 6.0 5.0 5.0 5.0 5.015.0 15.0 15.0 15.0 15.0 15.00.0 0.0 0.0 0.0 0.0 0.0
Generation from private networks 6,419.0 6,575.0 6,279.0 6,279.0 6,279.0 6,279.0
Atkins 4 22.0 0.0 0.0 0.0 0.0 0.0Atkins 5 25.0 0.0 0.0 0.0 0.0 0.0Atkins 6 50.0 0.0 0.0 0.0 0.0 0.0Laredo 1 33.0 33.0 33.0 33.0 0.0 0.0Laredo 2 32.0 32.0 32.0 32.0 0.0 0.0
Summer Capacities - 71 of 87
STP000005 May 9, 2011

CDR Report - Summer Capacities June 2006
UnitName 2006 2007 2008 2009 2010 2011
Summer Capacity, MW
Laredo 3 105.0 105.0 105.0 105.0 0.0 0.0RMR 267.0 170.0 170.0 170.0 0.0 0.0
Eagle Pass 36.0 36.0 36.0 36.0 36.0 36.0East 600.0 600.0 600.0 600.0 600.0 600.0Laredo 0.0 100.0 100.0 100.0 100.0 100.0North 220.0 220.0 220.0 220.0 220.0 220.0Sharyland 0.0 150.0 150.0 150.0 150.0 150.0Asynchronous ties 856.0 1,106.0 1,106.0 1,106.0 1,106.0 1,106.0
Kiamichi Power Part. 1 136.0 136.0 136.0 136.0 136.0 136.0Kiamichi Power Part. 2 141.0 141.0 141.0 141.0 141.0 141.0Kiamichi Power Part. 3 300.0 300.0 300.0 300.0 300.0 300.0Kiamichi Power Part. 4 136.0 136.0 136.0 136.0 136.0 136.0Kiamichi Power Part. 5 139.0 139.0 139.0 139.0 139.0 139.0Kiamichi Power Part. 6 299.0 299.0 299.0 299.0 299.0 299.0Tenaska-Frontier 1 161.0 161.0 161.0 161.0 161.0 161.0Tenaska-Frontier 2 132.0 132.0 132.0 132.0 132.0 132.0Tenaska-Frontier 3 151.0 151.0 151.0 151.0 151.0 151.0Tenaska-Frontier 4 389.0 389.0 389.0 389.0 389.0 389.0Tenaska-Gateway 1 152.0 152.0 152.0 152.0 152.0 152.0Tenaska-Gateway 2 128.0 128.0 128.0 128.0 128.0 128.0Tenaska-Gateway 3 146.0 146.0 146.0 146.0 146.0 146.0Tenaska-Gateway 4 400.0 400.0 400.0 400.0 400.0 400.0SWITCHABLE 2,810.0 2,810.0 2,810.0 2,810.0 2,810.0 2,810.0
Big Spring Windpower Fac. E 40.9 40.9 40.9 40.9 40.9 40.9Buffalo Gap Wind Farm 1 120.0 120.0 120.0 120.0 120.0 120.0Callahan Divide Wind Farm (FPL) 114.0 114.0 114.0 114.0 114.0 114.0Delaware Mt. Wind Farm 1 30.0 30.0 30.0 30.0 30.0 30.0Desert Sky Wind Farm 1 84.0 84.0 84.0 84.0 84.0 84.0Desert Sky Wind Farm 2 76.5 76.5 76.5 76.5 76.5 76.5FPL Energy King NE1 79.3 79.3 79.3 79.3 79.3 79.3FPL Energy King NW1 79.3 79.3 79.3 79.3 79.3 79.3FPL Energy King SE1 79.3 79.3 79.3 79.3 79.3 79.3FPL Energy King SW1 40.3 40.3 40.3 40.3 40.3 40.3Green Mountain at Brazos 1 99.0 99.0 99.0 99.0 99.0 99.0Green Mountain at Brazos 2 61.0 61.0 61.0 61.0 61.0 61.0Horse Hollow Wind Farm 1 220.5 220.5 220.5 220.5 220.5 220.5Horse Hollow Wind Farm 3 400.0 400.0 400.0 400.0 400.0 400.0Kunitz 1 44.8 44.8 44.8 44.8 44.8 44.8Orion NWP Indian Mesa I 1 82.5 82.5 82.5 82.5 82.5 82.5Red Canyon 1 84.0 84.0 84.0 84.0 84.0 84.0Southwest Mesa Wind 1 74.6 74.6 74.6 74.6 74.6 74.6Sweetwater Wind 1 36.6 36.6 36.6 36.6 36.6 36.6Sweetwater Wind 2 97.5 97.5 97.5 97.5 97.5 97.5Sweetwater Wind 3 129.0 129.0 129.0 129.0 129.0 129.0Trent Mesa Wind Farm 1 150.0 150.0 150.0 150.0 150.0 150.0Woodward Mountain 1 80.0 80.0 80.0 80.0 80.0 80.0Woodward Mountain 2 80.0 80.0 80.0 80.0 80.0 80.0WIND 2,383.1 2,383.1 2,383.1 2,383.1 2,383.1 2,383.1
Summer Capacities - 72 of 87
STP000005 May 9, 2011

CDR Report - Summer Capacities June 2006
UnitName 2006 2007 2008 2009 2010 2011
Summer Capacity, MW
Colorado Bend Energy Center 1 0.0 86.0 86.0 86.0 86.0 86.0Colorado Bend Energy Center 2 0.0 86.0 86.0 86.0 86.0 86.0Colorado Bend Energy Center 3 0.0 103.0 103.0 103.0 103.0 103.0J. K. Spruce 2 0.0 0.0 0.0 0.0 750.0 750.0Quail Run Energy Center 1 0.0 85.0 85.0 85.0 85.0 85.0Quail Run Energy Center 2 0.0 85.0 85.0 85.0 85.0 85.0Quail Run Energy Center 3 0.0 105.0 105.0 105.0 105.0 105.0New Units with Signed IA 0.0 550.0 550.0 550.0 1,300.0 1,300.0
Camp Springs 1 0.0 130.5 130.5 130.5 130.5 130.5Cirello (Buffalo Gap 2) 0.0 233.0 233.0 233.0 233.0 233.0Forest Creek 1 0.0 215.0 215.0 215.0 215.0 215.0Horse Hollow Wind Farm 2 0.0 186.3 186.3 186.3 186.3 186.3Horse Hollow Wind Farm 4 0.0 0.0 116.0 116.0 116.0 116.0Mesquite Wind 1 0.0 200.0 200.0 200.0 200.0 200.0Mesquite Wind 2 0.0 0.0 200.0 200.0 200.0 200.0Orion Delaware Mt Wind Farm 1 0.0 0.0 175.0 175.0 175.0 175.0Silverstar 1 0.0 60.0 60.0 60.0 60.0 60.0WKN Snyder Wind 1 0.0 60.0 60.0 60.0 60.0 60.0New Wind Generation 0.0 1,084.8 1,575.8 1,575.8 1,575.8 1,575.8
Holly Street 3 0.0 0.0 196.0 196.0 196.0 196.0Holly Street 4 0.0 0.0 197.0 197.0 197.0 197.0Leon Creek 3 0.0 0.0 0.0 58.0 58.0 58.0Units to retire 0.0 0.0 393.0 451.0 451.0 451.0
Atkins 3 12.0 12.0 12.0 12.0 12.0 12.0Atkins 4 0.0 22.0 22.0 22.0 22.0 22.0Atkins 5 0.0 25.0 25.0 25.0 25.0 25.0Atkins 6 0.0 50.0 50.0 50.0 50.0 50.0B M Davis 1 337.0 337.0 337.0 337.0 337.0 337.0B M Davis 2 347.0 347.0 347.0 347.0 347.0 347.0Cedar Bayou 3 751.0 751.0 751.0 751.0 751.0 751.0Collin 1 138.0 138.0 138.0 138.0 138.0 138.0E S Joslin 1 255.0 255.0 255.0 255.0 255.0 255.0Eagle Mountain 1 112.0 112.0 112.0 112.0 112.0 112.0Eagle Mountain 2 100.0 100.0 100.0 100.0 100.0 100.0Eagle Mountain 3 378.0 378.0 378.0 378.0 378.0 378.0Handley 1 36.0 36.0 36.0 36.0 36.0 36.0Handley 2 68.0 68.0 68.0 68.0 68.0 68.0J L Bates 1 71.0 71.0 71.0 71.0 71.0 71.0J L Bates 2 110.0 110.0 110.0 110.0 110.0 110.0La Palma 4 23.0 23.0 23.0 23.0 23.0 23.0La Palma 5 23.0 23.0 23.0 23.0 23.0 23.0La Palma 6 149.0 149.0 149.0 149.0 149.0 149.0La Palma 7 48.0 48.0 48.0 48.0 48.0 48.0Laredo 1 0.0 0.0 0.0 0.0 33.0 33.0Laredo 2 0.0 0.0 0.0 0.0 32.0 32.0Laredo 3 0.0 0.0 0.0 0.0 105.0 105.0Leon Creek 4 95.0 95.0 95.0 95.0 95.0 95.0
Summer Capacities - 73 of 87
STP000005 May 9, 2011
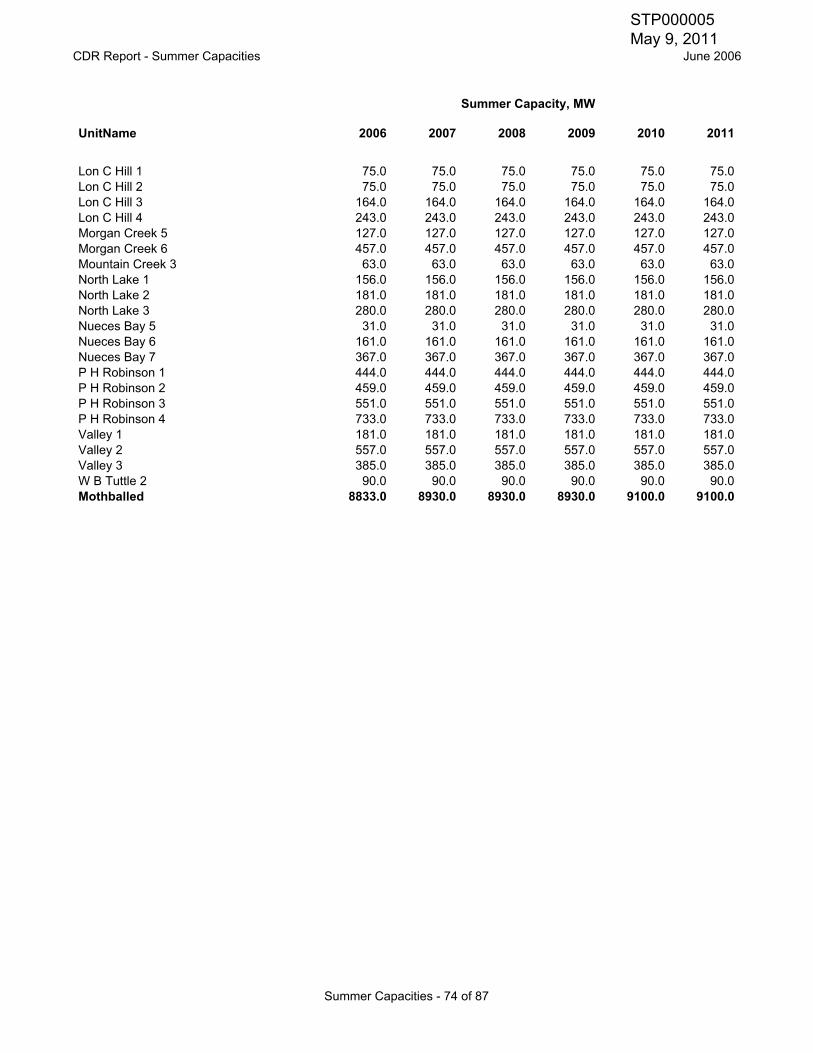
CDR Report - Summer Capacities June 2006
UnitName 2006 2007 2008 2009 2010 2011
Summer Capacity, MW
Lon C Hill 1 75.0 75.0 75.0 75.0 75.0 75.0Lon C Hill 2 75.0 75.0 75.0 75.0 75.0 75.0Lon C Hill 3 164.0 164.0 164.0 164.0 164.0 164.0Lon C Hill 4 243.0 243.0 243.0 243.0 243.0 243.0Morgan Creek 5 127.0 127.0 127.0 127.0 127.0 127.0Morgan Creek 6 457.0 457.0 457.0 457.0 457.0 457.0Mountain Creek 3 63.0 63.0 63.0 63.0 63.0 63.0North Lake 1 156.0 156.0 156.0 156.0 156.0 156.0North Lake 2 181.0 181.0 181.0 181.0 181.0 181.0North Lake 3 280.0 280.0 280.0 280.0 280.0 280.0Nueces Bay 5 31.0 31.0 31.0 31.0 31.0 31.0Nueces Bay 6 161.0 161.0 161.0 161.0 161.0 161.0Nueces Bay 7 367.0 367.0 367.0 367.0 367.0 367.0P H Robinson 1 444.0 444.0 444.0 444.0 444.0 444.0P H Robinson 2 459.0 459.0 459.0 459.0 459.0 459.0P H Robinson 3 551.0 551.0 551.0 551.0 551.0 551.0P H Robinson 4 733.0 733.0 733.0 733.0 733.0 733.0Valley 1 181.0 181.0 181.0 181.0 181.0 181.0Valley 2 557.0 557.0 557.0 557.0 557.0 557.0Valley 3 385.0 385.0 385.0 385.0 385.0 385.0W B Tuttle 2 90.0 90.0 90.0 90.0 90.0 90.0Mothballed 8833.0 8930.0 8930.0 8930.0 9100.0 9100.0
Summer Capacities - 74 of 87
STP000005 May 9, 2011

CDR Report - Winter Capacities June 2006
UnitName 2007 2008 2009 2010 2011 2012
A von Rosenberg 1-CT1 160.0 160.0 160.0 160.0 160.0 160.0A von Rosenberg 1-CT2 161.0 161.0 161.0 161.0 161.0 161.0A von Rosenberg 1-ST1 159.0 159.0 159.0 159.0 159.0 159.0AEODMG 1 5.0 5.0 5.0 5.0 5.0 5.0AES Deepwater 1 142.0 142.0 142.0 142.0 142.0 142.0Amistad Hydro 1 34.0 34.0 34.0 34.0 34.0 34.0Amistad Hydro 2 34.0 34.0 34.0 34.0 34.0 34.0Atascocita 1 10.1 10.1 10.1 10.1 10.1 10.1Atkins 7 21.0 21.0 21.0 21.0 21.0 21.0Austin 1 8.0 8.0 8.0 8.0 8.0 8.0Austin 2 9.0 9.0 9.0 9.0 9.0 9.0Bastrop Energy Center 1 162.0 162.0 162.0 162.0 162.0 162.0Bastrop Energy Center 2 161.0 161.0 161.0 161.0 161.0 161.0Bastrop Energy Center 3 234.0 234.0 234.0 234.0 234.0 234.0Baytown 1 3.9 3.9 3.9 3.9 3.9 3.9Big Brown 1 594.0 594.0 594.0 594.0 594.0 594.0Big Brown 2 602.0 602.0 602.0 602.0 602.0 602.0Bio Energy Partners 1 3.3 3.3 3.3 3.3 3.3 3.3Bio Energy Partners 2 3.3 3.3 3.3 3.3 3.3 3.3Bluebonnet 1 3.9 3.9 3.9 3.9 3.9 3.9Bosque 1 164.0 164.0 164.0 164.0 164.0 164.0Bosque 2 154.0 154.0 154.0 154.0 154.0 154.0Bosque 3 152.0 152.0 152.0 152.0 152.0 152.0Bosque 4 79.0 79.0 79.0 79.0 79.0 79.0Brazos Valley 1 180.0 180.0 180.0 180.0 180.0 180.0Brazos Valley 2 181.0 181.0 181.0 181.0 181.0 181.0Brazos Valley 3 264.0 264.0 264.0 264.0 264.0 264.0Buchanan 1 17.0 17.0 17.0 17.0 17.0 17.0Buchanan 2 17.0 17.0 17.0 17.0 17.0 17.0Buchanan 3 13.0 13.0 13.0 13.0 13.0 13.0C E Newman 5 37.0 37.0 37.0 37.0 37.0 37.0Calenergy 1 75.0 75.0 75.0 75.0 75.0 75.0Calenergy 2 75.0 75.0 75.0 75.0 75.0 75.0Calenergy 3 61.0 61.0 61.0 61.0 61.0 61.0Canyon 1 3.0 3.0 3.0 3.0 3.0 3.0Canyon 2 3.0 3.0 3.0 3.0 3.0 3.0
Unit Capacities - Winter
Units used in determining the generation resources in the Winter Summary
Capacities are based on information from the plant owners. This list includes MW available to the grid from private network (self-serve) units. It also includes distributed generation units that have registered with ERCOT. Data without unit names are for private network units.
Winter Capacity, MW
Winter Capacities - 75 of 87
STP000005 May 9, 2011

CDR Report - Winter Capacities June 2006
UnitName 2007 2008 2009 2010 2011 2012
Winter Capacity, MW
Cedar Bayou 1 750.0 750.0 750.0 750.0 750.0 750.0Cedar Bayou 2 762.0 762.0 762.0 762.0 762.0 762.0Coastal Plains 1 6.7 6.7 6.7 6.7 6.7 6.7Coleto Creek 1 634.0 634.0 634.0 634.0 634.0 634.0Comanche Peak 1 1176.0 1176.0 1176.0 1176.0 1176.0 1176.0Comanche Peak 2 1176.0 1176.0 1176.0 1176.0 1176.0 1176.0Covel Gardens LG Power Station 1 1.6 1.6 1.6 1.6 1.6 1.6Covel Gardens LG Power Station 2 1.6 1.6 1.6 1.6 1.6 1.6Covel Gardens LG Power Station 3 1.6 1.6 1.6 1.6 1.6 1.6Covel Gardens LG Power Station 4 1.6 1.6 1.6 1.6 1.6 1.6Covel Gardens LG Power Station 5 1.6 1.6 1.6 1.6 1.6 1.6Covel Gardens LG Power Station 6 1.6 1.6 1.6 1.6 1.6 1.6Dansby 1 108.0 108.0 108.0 108.0 108.0 108.0Dansby 2 48.0 48.0 48.0 48.0 48.0 48.0Decker Creek 1 347.0 347.0 347.0 347.0 347.0 347.0Decker Creek 2 424.0 424.0 424.0 424.0 424.0 424.0Decker Creek G1 58.0 58.0 58.0 58.0 58.0 58.0Decker Creek G2 58.0 58.0 58.0 58.0 58.0 58.0Decker Creek G3 58.0 58.0 58.0 58.0 58.0 58.0Decker Creek G4 51.0 51.0 51.0 51.0 51.0 51.0DeCordova 1 811.0 811.0 811.0 811.0 811.0 811.0DeCordova A 84.0 84.0 84.0 84.0 84.0 84.0DeCordova B 84.0 84.0 84.0 84.0 84.0 84.0DeCordova C 84.0 84.0 84.0 84.0 84.0 84.0DeCordova D 84.0 84.0 84.0 84.0 84.0 84.0Denison Dam 1 40.0 40.0 40.0 40.0 40.0 40.0Denison Dam 2 40.0 40.0 40.0 40.0 40.0 40.0Dunlop (Schumansville) 1 3.6 3.6 3.6 3.6 3.6 3.6Eagle Pass 1 2.0 2.0 2.0 2.0 2.0 2.0Eagle Pass 2 2.0 2.0 2.0 2.0 2.0 2.0Eagle Pass 3 2.0 2.0 2.0 2.0 2.0 2.0Ennis Power Station 1 243.0 243.0 243.0 243.0 243.0 243.0Ennis Power Station 2 114.0 114.0 114.0 114.0 114.0 114.0ExTex La Porte Power Sta.1 41.0 41.0 41.0 41.0 41.0 41.0ExTex La Porte Power Sta.2 41.0 41.0 41.0 41.0 41.0 41.0ExTex La Porte Power Sta.3 41.0 41.0 41.0 41.0 41.0 41.0ExTex La Porte Power Sta.4 41.0 41.0 41.0 41.0 41.0 41.0Falcon Hydro 1 11.5 11.5 11.5 11.5 11.5 11.5Falcon Hydro 2 11.5 11.5 11.5 11.5 11.5 11.5Falcon Hydro 3 11.5 11.5 11.5 11.5 11.5 11.5Fayette Power Project 1 616.0 616.0 616.0 616.0 616.0 616.0Fayette Power Project 2 608.0 608.0 608.0 608.0 608.0 608.0Fayette Power Project 3 445.0 445.0 445.0 445.0 445.0 445.0FPLE Forney CT1 177.0 177.0 177.0 177.0 177.0 177.0FPLE Forney CT2 169.0 169.0 169.0 169.0 169.0 169.0FPLE Forney CT3 173.0 173.0 173.0 173.0 173.0 173.0FPLE Forney CT4 178.0 178.0 178.0 178.0 178.0 178.0
Winter Capacities - 76 of 87
STP000005 May 9, 2011

CDR Report - Winter Capacities June 2006
UnitName 2007 2008 2009 2010 2011 2012
Winter Capacity, MW
FPLE Forney CT5 169.0 169.0 169.0 169.0 169.0 169.0FPLE Forney CT6 173.0 173.0 173.0 173.0 173.0 173.0FPLE Forney STG1 386.0 386.0 386.0 386.0 386.0 386.0FPLE Forney STG2 357.0 357.0 357.0 357.0 357.0 357.0Freestone Energy Center 1 177.0 177.0 177.0 177.0 177.0 177.0Freestone Energy Center 2 177.0 177.0 177.0 177.0 177.0 177.0Freestone Energy Center 3 182.0 182.0 182.0 182.0 182.0 182.0Freestone Energy Center 4 173.0 173.0 173.0 173.0 173.0 173.0Freestone Energy Center 5 173.0 173.0 173.0 173.0 173.0 173.0Freestone Energy Center 6 185.0 185.0 185.0 185.0 185.0 185.0Frontera 1 150.0 150.0 150.0 150.0 150.0 150.0Frontera 2 150.0 150.0 150.0 150.0 150.0 150.0Frontera 3 171.0 171.0 171.0 171.0 171.0 171.0FW Regional LFG Generation Facility 1 1.5 1.5 1.5 1.5 1.5 1.5GBRA H 4 2.4 2.4 2.4 2.4 2.4 2.4GBRA H 5 2.4 2.4 2.4 2.4 2.4 2.4GBRA TP 4 2.4 2.4 2.4 2.4 2.4 2.4Gibbons Creek 1 464.0 464.0 464.0 464.0 464.0 464.0Graham 1 225.0 225.0 225.0 225.0 225.0 225.0Graham 2 373.0 373.0 373.0 373.0 373.0 373.0Granite Shoals 1 29.0 29.0 29.0 29.0 29.0 29.0Granite Shoals 2 30.0 30.0 30.0 30.0 30.0 30.0Greens Bayou 5 406.0 406.0 406.0 406.0 406.0 406.0Greens Bayou 73 49.0 49.0 49.0 49.0 49.0 49.0Greens Bayou 74 48.0 48.0 48.0 48.0 48.0 48.0Greens Bayou 81 49.0 49.0 49.0 49.0 49.0 49.0Greens Bayou 82 75.0 75.0 75.0 75.0 75.0 75.0Greens Bayou 83 76.0 76.0 76.0 76.0 76.0 76.0Greens Bayou 84 72.0 72.0 72.0 72.0 72.0 72.0Guadalupe Power Partners 1 169.0 169.0 169.0 169.0 169.0 169.0Guadalupe Power Partners 2 162.0 162.0 162.0 162.0 162.0 162.0Guadalupe Power Partners 3 155.0 155.0 155.0 155.0 155.0 155.0Guadalupe Power Partners 4 155.0 155.0 155.0 155.0 155.0 155.0Guadalupe Power Partners 5 192.0 192.0 192.0 192.0 192.0 192.0Guadalupe Power Partners 6 204.0 204.0 204.0 204.0 204.0 204.0Handley 3 396.0 396.0 396.0 396.0 396.0 396.0Handley 4 435.0 435.0 435.0 435.0 435.0 435.0Handley 5 435.0 435.0 435.0 435.0 435.0 435.0Hays Energy Facility 1 245.0 245.0 245.0 245.0 245.0 245.0Hays Energy Facility 2 243.0 243.0 243.0 243.0 243.0 243.0Hays Energy Facility 3 251.0 251.0 251.0 251.0 251.0 251.0Hays Energy Facility 4 233.0 233.0 233.0 233.0 233.0 233.0Hidalgo 1 163.0 163.0 163.0 163.0 163.0 163.0Hidalgo 2 163.0 163.0 163.0 163.0 163.0 163.0Hidalgo 3 180.0 180.0 180.0 180.0 180.0 180.0Holly Street 3 196.0 196.0 196.0 196.0 196.0 196.0Holly Street 4 201.0 201.0 201.0 201.0 201.0 201.0
Winter Capacities - 77 of 87
STP000005 May 9, 2011

CDR Report - Winter Capacities June 2006
UnitName 2007 2008 2009 2010 2011 2012
Winter Capacity, MW
Inks 1 14.0 14.0 14.0 14.0 14.0 14.0J K Spruce 1 566.0 566.0 566.0 566.0 566.0 566.0J T Deely 1 399.0 399.0 399.0 399.0 399.0 399.0J T Deely 2 401.0 401.0 401.0 401.0 401.0 401.0Jack County Generation Facility 1 165.0 165.0 165.0 165.0 165.0 165.0Jack County Generation Facility 2 165.0 165.0 165.0 165.0 165.0 165.0Jack County Generation Facility 3 300.0 300.0 300.0 300.0 300.0 300.0Johnson County Generation Facility 1 175.0 175.0 175.0 175.0 175.0 175.0Johnson County Generation Facility 2 95.0 95.0 95.0 95.0 95.0 95.0Lake Creek 1 91.0 91.0 91.0 91.0 91.0 91.0Lake Creek 2 235.0 235.0 235.0 235.0 235.0 235.0Lake Creek D1 2.0 2.0 2.0 2.0 2.0 2.0Lake Creek D2 2.0 2.0 2.0 2.0 2.0 2.0Lake Creek D3 2.0 2.0 2.0 2.0 2.0 2.0Lake Hubbard 1 396.0 396.0 396.0 396.0 396.0 396.0Lake Hubbard 2 518.0 518.0 518.0 518.0 518.0 518.0Lamar Power Project CT11 170.0 170.0 170.0 170.0 170.0 170.0Lamar Power Project CT12 163.0 163.0 163.0 163.0 163.0 163.0Lamar Power Project CT21 159.0 159.0 159.0 159.0 159.0 159.0Lamar Power Project CT22 168.0 168.0 168.0 168.0 168.0 168.0Lamar Power Project STG1 199.0 199.0 199.0 199.0 199.0 199.0Lamar Power Project STG2 198.0 198.0 198.0 198.0 198.0 198.0Leon Creek 3 65.0 65.0 65.0 65.0 65.0 65.0Leon Creek Peaking 1 48.5 48.5 48.5 48.5 48.5 48.5Leon Creek Peaking 2 48.5 48.5 48.5 48.5 48.5 48.5Leon Creek Peaking 3 48.5 48.5 48.5 48.5 48.5 48.5Leon Creek Peaking 4 48.5 48.5 48.5 48.5 48.5 48.5Lewisville 1 2.8 2.8 2.8 2.8 2.8 2.8Limestone 1 840.0 840.0 840.0 840.0 840.0 840.0Limestone 2 930.0 930.0 930.0 930.0 930.0 930.0Lost Pines 1 126.0 126.0 126.0 126.0 126.0 126.0Lost Pines 2 178.0 178.0 178.0 178.0 178.0 178.0Lost Pines 3 193.0 193.0 193.0 193.0 193.0 193.0Magic Valley 1 250.0 250.0 250.0 250.0 250.0 250.0Magic Valley 2 245.0 245.0 245.0 245.0 245.0 245.0Magic Valley 3 259.0 259.0 259.0 259.0 259.0 259.0Marble Falls 1 18.0 18.0 18.0 18.0 18.0 18.0Marble Falls 2 18.0 18.0 18.0 18.0 18.0 18.0Marshall Ford 1 34.0 34.0 34.0 34.0 34.0 34.0Marshall Ford 2 35.0 35.0 35.0 35.0 35.0 35.0Marshall Ford 3 34.0 34.0 34.0 34.0 34.0 34.0Martin Lake 1 798.0 798.0 798.0 798.0 798.0 798.0Martin Lake 2 800.0 800.0 800.0 800.0 800.0 800.0Martin Lake 3 812.0 812.0 812.0 812.0 812.0 812.0McQueeney (Abbott) 1 1.4 1.4 1.4 1.4 1.4 1.4McQueeney (Abbott) 2 1.4 1.4 1.4 1.4 1.4 1.4Midlothian 1 238.0 238.0 238.0 238.0 238.0 238.0
Winter Capacities - 78 of 87
STP000005 May 9, 2011

CDR Report - Winter Capacities June 2006
UnitName 2007 2008 2009 2010 2011 2012
Winter Capacity, MW
Midlothian 2 230.0 230.0 230.0 230.0 230.0 230.0Midlothian 3 225.0 225.0 225.0 225.0 225.0 225.0Midlothian 4 231.0 231.0 231.0 231.0 231.0 231.0Midlothian 5 255.0 255.0 255.0 255.0 255.0 255.0Midlothian 6 227.0 227.0 227.0 227.0 227.0 227.0Monticello 1 594.0 594.0 594.0 594.0 594.0 594.0Monticello 2 545.0 545.0 545.0 545.0 545.0 545.0Monticello 3 794.0 794.0 794.0 794.0 794.0 794.0Morgan Creek A 83.0 83.0 83.0 83.0 83.0 83.0Morgan Creek B 85.0 85.0 85.0 85.0 85.0 85.0Morgan Creek C 83.0 83.0 83.0 83.0 83.0 83.0Morgan Creek D 85.0 85.0 85.0 85.0 85.0 85.0Morgan Creek E 83.0 83.0 83.0 83.0 83.0 83.0Morgan Creek F 84.0 84.0 84.0 84.0 84.0 84.0Morris Sheppard 1 12.0 12.0 12.0 12.0 12.0 12.0Morris Sheppard 2 12.0 12.0 12.0 12.0 12.0 12.0Mountain Creek 2 24.0 24.0 24.0 24.0 24.0 24.0Mountain Creek 6 126.0 126.0 126.0 126.0 126.0 126.0Mountain Creek 7 123.0 123.0 123.0 123.0 123.0 123.0Mountain Creek 8 568.0 568.0 568.0 568.0 568.0 568.0Nelson Gardens Landfill Power Station 1 1.8 1.8 1.8 1.8 1.8 1.8Nelson Gardens Landfill Power Station 2 1.8 1.8 1.8 1.8 1.8 1.8Nolte 1 1.2 1.2 1.2 1.2 1.2 1.2Nolte 2 1.2 1.2 1.2 1.2 1.2 1.2North Texas 1 18.0 18.0 18.0 18.0 18.0 18.0North Texas 2 18.0 18.0 18.0 18.0 18.0 18.0North Texas 3 39.0 39.0 39.0 39.0 39.0 39.0O W Sommers 1 419.0 419.0 419.0 419.0 419.0 419.0O W Sommers 2 435.0 435.0 435.0 435.0 435.0 435.0O W Sommers 3 2.5 2.5 2.5 2.5 2.5 2.5O W Sommers 4 2.5 2.5 2.5 2.5 2.5 2.5O W Sommers 5 2.5 2.5 2.5 2.5 2.5 2.5O W Sommers 6 2.5 2.5 2.5 2.5 2.5 2.5Odessa-Ector C11 162.0 162.0 162.0 162.0 162.0 162.0Odessa-Ector C12 161.0 161.0 161.0 161.0 161.0 161.0Odessa-Ector C21 161.0 161.0 161.0 161.0 161.0 161.0Odessa-Ector C22 168.0 168.0 168.0 168.0 168.0 168.0Odessa-Ector ST1 215.0 215.0 215.0 215.0 215.0 215.0Odessa-Ector ST2 215.0 215.0 215.0 215.0 215.0 215.0Oklaunion 1 631.0 631.0 631.0 631.0 631.0 631.0Pearsall 1 25.0 25.0 25.0 25.0 25.0 25.0Pearsall 2 25.0 25.0 25.0 25.0 25.0 25.0Pearsall 3 24.0 24.0 24.0 24.0 24.0 24.0Permian Basin 5 117.0 117.0 117.0 117.0 117.0 117.0Permian Basin 6 494.0 494.0 494.0 494.0 494.0 494.0Permian Basin A 69.0 69.0 69.0 69.0 69.0 69.0Permian Basin B 79.0 79.0 79.0 79.0 79.0 79.0
Winter Capacities - 79 of 87
STP000005 May 9, 2011

CDR Report - Winter Capacities June 2006
UnitName 2007 2008 2009 2010 2011 2012
Winter Capacity, MW
Permian Basin C 71.0 71.0 71.0 71.0 71.0 71.0Permian Basin D 74.0 74.0 74.0 74.0 74.0 74.0Permian Basin E 77.0 77.0 77.0 77.0 77.0 77.0Powerlane Plant 1 20.4 20.4 20.4 20.4 20.4 20.4Powerlane Plant 2 26.2 26.2 26.2 26.2 26.2 26.2Powerlane Plant 3 41.5 41.5 41.5 41.5 41.5 41.5R W Miller 1 75.0 75.0 75.0 75.0 75.0 75.0R W Miller 2 120.0 120.0 120.0 120.0 120.0 120.0R W Miller 3 208.0 208.0 208.0 208.0 208.0 208.0R W Miller 4 102.0 102.0 102.0 102.0 102.0 102.0R W Miller 5 105.0 105.0 105.0 105.0 105.0 105.0Ray Olinger 1 75.0 75.0 75.0 75.0 75.0 75.0Ray Olinger 2 109.0 109.0 109.0 109.0 109.0 109.0Ray Olinger 3 146.0 146.0 146.0 146.0 146.0 146.0Ray Olinger 4 90.0 90.0 90.0 90.0 90.0 90.0Rayburn 1 13.5 13.5 13.5 13.5 13.5 13.5Rayburn 10 39.0 39.0 39.0 39.0 39.0 39.0Rayburn 2 13.5 13.5 13.5 13.5 13.5 13.5Rayburn 3 25.0 25.0 25.0 25.0 25.0 25.0Rayburn 4 2.0 2.0 2.0 2.0 2.0 2.0Rayburn 5 2.0 2.0 2.0 2.0 2.0 2.0Rayburn 7 50.0 50.0 50.0 50.0 50.0 50.0Rayburn 8 50.0 50.0 50.0 50.0 50.0 50.0Rayburn 9 50.0 50.0 50.0 50.0 50.0 50.0Rio Nogales 1 179.0 179.0 179.0 179.0 179.0 179.0Rio Nogales 2 180.0 180.0 180.0 180.0 180.0 180.0Rio Nogales 3 180.0 180.0 180.0 180.0 180.0 180.0Rio Nogales 4 308.0 308.0 308.0 308.0 308.0 308.0Sam Bertron 3 232.0 232.0 232.0 232.0 232.0 232.0Sam Bertron 4 230.0 230.0 230.0 230.0 230.0 230.0Sam Bertron ST1 174.0 174.0 174.0 174.0 174.0 174.0Sam Bertron ST2 173.0 173.0 173.0 173.0 173.0 173.0Sam Bertron T1 23.0 23.0 23.0 23.0 23.0 23.0Sam Bertron T2 14.0 14.0 14.0 14.0 14.0 14.0San Jacinto SES 1 83.0 83.0 83.0 83.0 83.0 83.0San Jacinto SES 2 82.0 82.0 82.0 82.0 82.0 82.0San Miguel 1 397.0 397.0 397.0 397.0 397.0 397.0Sandhill Energy Center 1 49.0 49.0 49.0 49.0 49.0 49.0Sandhill Energy Center 2 48.0 48.0 48.0 48.0 48.0 48.0Sandhill Energy Center 3 47.0 47.0 47.0 47.0 47.0 47.0Sandhill Energy Center 4 47.0 47.0 47.0 47.0 47.0 47.0Sandhill Energy Center 5A 180.0 180.0 180.0 180.0 180.0 180.0Sandhill Energy Center 5C 164.0 164.0 164.0 164.0 164.0 164.0Silas Ray 10 44.0 44.0 44.0 44.0 44.0 44.0Silas Ray 5 9.0 9.0 9.0 9.0 9.0 9.0Silas Ray 6 17.0 17.0 17.0 17.0 17.0 17.0Silas Ray 9 42.0 42.0 42.0 42.0 42.0 42.0
Winter Capacities - 80 of 87
STP000005 May 9, 2011

CDR Report - Winter Capacities June 2006
UnitName 2007 2008 2009 2010 2011 2012
Winter Capacity, MW
Sim Gideon 1 135.0 135.0 135.0 135.0 135.0 135.0Sim Gideon 2 133.0 133.0 133.0 133.0 133.0 133.0Sim Gideon 3 334.0 334.0 334.0 334.0 334.0 334.0Small Hydro of Texas 1 1.2 1.2 1.2 1.2 1.2 1.2South Texas 1 1285.0 1285.0 1285.0 1285.0 1285.0 1285.0South Texas 2 1281.0 1281.0 1281.0 1281.0 1281.0 1281.0Spencer 4 61.0 61.0 61.0 61.0 61.0 61.0Spencer 5 62.0 62.0 62.0 62.0 62.0 62.0Stryker Creek 1 182.0 182.0 182.0 182.0 182.0 182.0Stryker Creek 2 514.0 514.0 514.0 514.0 514.0 514.0Stryker Creek D1 11.0 11.0 11.0 11.0 11.0 11.0Sweetwater Generation Plant 1 34.0 34.0 34.0 34.0 34.0 34.0Sweetwater Generation Plant 2 77.0 77.0 77.0 77.0 77.0 77.0Sweetwater Generation Plant 3 74.0 74.0 74.0 74.0 74.0 74.0Sweetwater Generation Plant 4 70.0 70.0 70.0 70.0 70.0 70.0T H Wharton 3 115.0 115.0 115.0 115.0 115.0 115.0T H Wharton 31 61.0 61.0 61.0 61.0 61.0 61.0T H Wharton 32 60.0 60.0 60.0 60.0 60.0 60.0T H Wharton 33 62.0 62.0 62.0 62.0 62.0 62.0T H Wharton 34 62.0 62.0 62.0 62.0 62.0 62.0T H Wharton 4 111.0 111.0 111.0 111.0 111.0 111.0T H Wharton 41 66.0 66.0 66.0 66.0 66.0 66.0T H Wharton 42 63.0 63.0 63.0 63.0 63.0 63.0T H Wharton 43 59.0 59.0 59.0 59.0 59.0 59.0T H Wharton 44 65.0 65.0 65.0 65.0 65.0 65.0T H Wharton 51 62.0 62.0 62.0 62.0 62.0 62.0T H Wharton 52 74.0 74.0 74.0 74.0 74.0 74.0T H Wharton 53 65.0 65.0 65.0 65.0 65.0 65.0T H Wharton 54 65.0 65.0 65.0 65.0 65.0 65.0T H Wharton 55 64.0 64.0 64.0 64.0 64.0 64.0T H Wharton 56 64.0 64.0 64.0 64.0 64.0 64.0T H Wharton G1 13.0 13.0 13.0 13.0 13.0 13.0Tenaska-Lamar 1 95.0 95.0 95.0 95.0 95.0 95.0Tenaska-Lamar 2 96.0 96.0 96.0 96.0 96.0 96.0Tenaska-Lamar 3 99.0 99.0 99.0 99.0 99.0 99.0Tessman Road 1 1.4 1.4 1.4 1.4 1.4 1.4Tessman Road 2 1.4 1.4 1.4 1.4 1.4 1.4Tessman Road 3 1.4 1.4 1.4 1.4 1.4 1.4Tessman Road 4 1.4 1.4 1.4 1.4 1.4 1.4Tessman Road 5 1.4 1.4 1.4 1.4 1.4 1.4Tessman Road 6 1.4 1.4 1.4 1.4 1.4 1.4Texas City 1 121.0 121.0 121.0 121.0 121.0 121.0Texas City 2 116.0 116.0 116.0 116.0 116.0 116.0Texas City 3 117.0 117.0 117.0 117.0 117.0 117.0Texas City 4 124.0 124.0 124.0 124.0 124.0 124.0Thomas C Ferguson 1 430.0 430.0 430.0 430.0 430.0 430.0Tradinghouse 1 562.0 562.0 562.0 562.0 562.0 562.0
Winter Capacities - 81 of 87
STP000005 May 9, 2011

CDR Report - Winter Capacities June 2006
UnitName 2007 2008 2009 2010 2011 2012
Winter Capacity, MW
Tradinghouse 2 818.0 818.0 818.0 818.0 818.0 818.0Trinidad 6 237.0 237.0 237.0 237.0 237.0 237.0Trinidad D1 4.0 4.0 4.0 4.0 4.0 4.0Twin Oaks 1 153.0 153.0 153.0 153.0 153.0 153.0Twin Oaks 2 154.0 154.0 154.0 154.0 154.0 154.0V H Braunig 1 225.0 225.0 225.0 225.0 225.0 225.0V H Braunig 2 240.0 240.0 240.0 240.0 240.0 240.0V H Braunig 3 420.0 420.0 420.0 420.0 420.0 420.0W A Parish 1 163.0 163.0 163.0 163.0 163.0 163.0W A Parish 2 167.0 167.0 167.0 167.0 167.0 167.0W A Parish 3 254.0 254.0 254.0 254.0 254.0 254.0W A Parish 4 532.0 532.0 532.0 532.0 532.0 532.0W A Parish 5 667.0 667.0 667.0 667.0 667.0 667.0W A Parish 6 654.0 654.0 654.0 654.0 654.0 654.0W A Parish 7 590.0 590.0 590.0 590.0 590.0 590.0W A Parish 8 609.0 609.0 609.0 609.0 609.0 609.0W A Parish T1 13.0 13.0 13.0 13.0 13.0 13.0W B Tuttle 1 65.0 65.0 65.0 65.0 65.0 65.0W B Tuttle 3 100.0 100.0 100.0 100.0 100.0 100.0W B Tuttle 4 160.0 160.0 160.0 160.0 160.0 160.0Waco LFG 1 1.2 1.2 1.2 1.2 1.2 1.2Weatherford 1 0.3 0.3 0.3 0.3 0.3 0.3Weatherford 2 0.3 0.3 0.3 0.3 0.3 0.3Weatherford 3 0.3 0.3 0.3 0.3 0.3 0.3Weatherford 4 0.5 0.5 0.5 0.5 0.5 0.5Weatherford 6 1.4 1.4 1.4 1.4 1.4 1.4Weatherford 7 1.3 1.3 1.3 1.3 1.3 1.3Weatherford 8 1.3 1.3 1.3 1.3 1.3 1.3Whitney 1 15.0 15.0 15.0 15.0 15.0 15.0Whitney 2 15.0 15.0 15.0 15.0 15.0 15.0Wichita Falls 1 20.6 20.6 20.6 20.6 20.6 20.6Wichita Falls 2 20.6 20.6 20.6 20.6 20.6 20.6Wichita Falls 3 20.6 20.6 20.6 20.6 20.6 20.6Wichita Falls 4 15.6 15.6 15.6 15.6 15.6 15.6Wise County Power Proj. 1 231.0 231.0 231.0 231.0 231.0 231.0Wise County Power Proj. 2 231.0 231.0 231.0 231.0 231.0 231.0Wise County Power Proj. 3 244.0 244.0 244.0 244.0 244.0 244.0Wolf Hollow Power Proj. 1 233.0 233.0 233.0 233.0 233.0 233.0Wolf Hollow Power Proj. 2 233.0 233.0 233.0 233.0 233.0 233.0Wolf Hollow Power Proj. 3 225.0 225.0 225.0 225.0 225.0 225.0Operational generation 60507.9 60507.9 60507.9 60507.9 60507.9 60507.9
3.0 3.0 3.0 3.0 3.0 3.086.0 86.0 86.0 86.0 86.0 86.095.0 225.0 225.0 225.0 225.0 225.0
340.0 340.0 340.0 340.0 340.0 340.0620.0 620.0 620.0 620.0 620.0 620.0
Winter Capacities - 82 of 87
STP000005 May 9, 2011
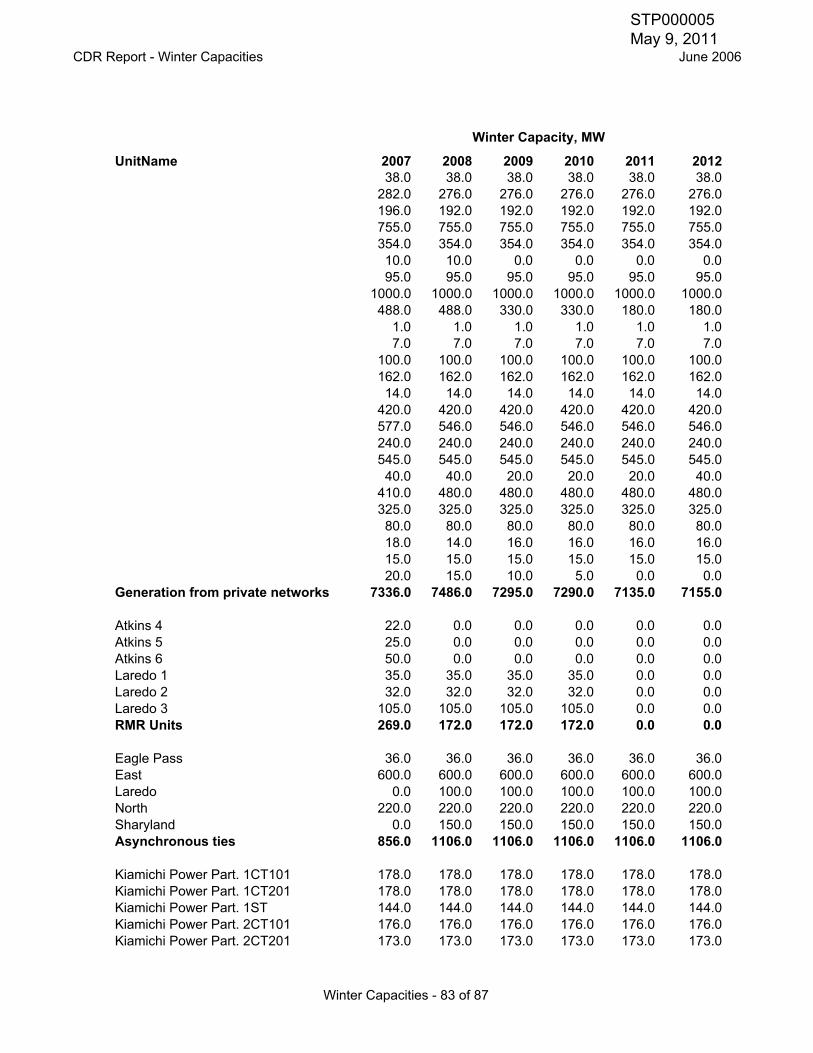
CDR Report - Winter Capacities June 2006
UnitName 2007 2008 2009 2010 2011 2012
Winter Capacity, MW
38.0 38.0 38.0 38.0 38.0 38.0282.0 276.0 276.0 276.0 276.0 276.0196.0 192.0 192.0 192.0 192.0 192.0755.0 755.0 755.0 755.0 755.0 755.0354.0 354.0 354.0 354.0 354.0 354.010.0 10.0 0.0 0.0 0.0 0.095.0 95.0 95.0 95.0 95.0 95.0
1000.0 1000.0 1000.0 1000.0 1000.0 1000.0488.0 488.0 330.0 330.0 180.0 180.0
1.0 1.0 1.0 1.0 1.0 1.07.0 7.0 7.0 7.0 7.0 7.0
100.0 100.0 100.0 100.0 100.0 100.0162.0 162.0 162.0 162.0 162.0 162.014.0 14.0 14.0 14.0 14.0 14.0
420.0 420.0 420.0 420.0 420.0 420.0577.0 546.0 546.0 546.0 546.0 546.0240.0 240.0 240.0 240.0 240.0 240.0545.0 545.0 545.0 545.0 545.0 545.040.0 40.0 20.0 20.0 20.0 40.0
410.0 480.0 480.0 480.0 480.0 480.0325.0 325.0 325.0 325.0 325.0 325.080.0 80.0 80.0 80.0 80.0 80.018.0 14.0 16.0 16.0 16.0 16.015.0 15.0 15.0 15.0 15.0 15.020.0 15.0 10.0 5.0 0.0 0.0
Generation from private networks 7336.0 7486.0 7295.0 7290.0 7135.0 7155.0
Atkins 4 22.0 0.0 0.0 0.0 0.0 0.0Atkins 5 25.0 0.0 0.0 0.0 0.0 0.0Atkins 6 50.0 0.0 0.0 0.0 0.0 0.0Laredo 1 35.0 35.0 35.0 35.0 0.0 0.0Laredo 2 32.0 32.0 32.0 32.0 0.0 0.0Laredo 3 105.0 105.0 105.0 105.0 0.0 0.0RMR Units 269.0 172.0 172.0 172.0 0.0 0.0
Eagle Pass 36.0 36.0 36.0 36.0 36.0 36.0East 600.0 600.0 600.0 600.0 600.0 600.0Laredo 0.0 100.0 100.0 100.0 100.0 100.0North 220.0 220.0 220.0 220.0 220.0 220.0Sharyland 0.0 150.0 150.0 150.0 150.0 150.0Asynchronous ties 856.0 1106.0 1106.0 1106.0 1106.0 1106.0
Kiamichi Power Part. 1CT101 178.0 178.0 178.0 178.0 178.0 178.0Kiamichi Power Part. 1CT201 178.0 178.0 178.0 178.0 178.0 178.0Kiamichi Power Part. 1ST 144.0 144.0 144.0 144.0 144.0 144.0Kiamichi Power Part. 2CT101 176.0 176.0 176.0 176.0 176.0 176.0Kiamichi Power Part. 2CT201 173.0 173.0 173.0 173.0 173.0 173.0
Winter Capacities - 83 of 87
STP000005 May 9, 2011

CDR Report - Winter Capacities June 2006
UnitName 2007 2008 2009 2010 2011 2012
Winter Capacity, MW
Kiamichi Power Part. 2ST 315.0 315.0 315.0 315.0 315.0 315.0Tenaska-Frontier 1 172.0 172.0 172.0 172.0 172.0 172.0Tenaska-Frontier 2 158.0 158.0 158.0 158.0 158.0 158.0Tenaska-Frontier 3 174.0 174.0 174.0 174.0 174.0 174.0Tenaska-Frontier 4 385.0 385.0 385.0 385.0 385.0 385.0Tenaska-Gateway 1 183.0 183.0 183.0 183.0 183.0 183.0Tenaska-Gateway 2 183.0 183.0 183.0 183.0 183.0 183.0Tenaska-Gateway 3 179.0 179.0 179.0 179.0 179.0 179.0Tenaska-Gateway 4 387.0 387.0 387.0 387.0 387.0 387.0Switchable Units 2985.0 2985.0 2985.0 2985.0 2985.0 2985.0
Big Spring Windpower Fac. E 40.9 40.9 40.9 40.9 40.9 40.9Buffalo Gap Wind Farm 1 120.0 120.0 120.0 120.0 120.0 120.0Callahan Divide Wind Farm 1 (FPL) 114.0 114.0 114.0 114.0 114.0 114.0Delaware Mt. Wind Farm 1 30.0 30.0 30.0 30.0 30.0 30.0Desert Sky Wind Farm 1 84.0 84.0 84.0 84.0 84.0 84.0Desert Sky Wind Farm 2 76.5 76.5 76.5 76.5 76.5 76.5Forest Creek 1 215.0 215.0 215.0 215.0 215.0 215.0FPL Energy King NE1 79.3 79.3 79.3 79.3 79.3 79.3FPL Energy King NW1 79.3 79.3 79.3 79.3 79.3 79.3FPL Energy King SE1 79.3 79.3 79.3 79.3 79.3 79.3FPL Energy King SW1 40.3 40.3 40.3 40.3 40.3 40.3Green Mountain at Brazos 1 99.0 99.0 99.0 99.0 99.0 99.0Green Mountain at Brazos 2 61.0 61.0 61.0 61.0 61.0 61.0Horse Hollow Wind Farm 1 220.5 220.5 220.5 220.5 220.5 220.5Horse Hollow Wind Farm 2 186.0 186.0 186.0 186.0 186.0 186.0Horse Hollow Wind Farm 3 400.0 400.0 400.0 400.0 400.0 400.0Kunitz 1 44.8 44.8 44.8 44.8 44.8 44.8Orion NWP Indian Mesa I 1 83.0 83.0 83.0 83.0 83.0 83.0Red Canyon 1 84.0 84.0 84.0 84.0 84.0 84.0Southwest Mesa Wind 1 74.6 74.6 74.6 74.6 74.6 74.6Sweetwater Wind 1 36.6 36.6 36.6 36.6 36.6 36.6Sweetwater Wind 2 97.5 97.5 97.5 97.5 97.5 97.5Sweetwater Wind 3 129.0 129.0 129.0 129.0 129.0 129.0Trent Mesa Wind Farm 1 150.0 150.0 150.0 150.0 150.0 150.0Woodward Mountain 1 80.0 80.0 80.0 80.0 80.0 80.0Woodward Mountain 2 80.0 80.0 80.0 80.0 80.0 80.0Existing Wind Generation 2784.6 2784.6 2784.6 2784.6 2784.6 2784.6
Colorado Bend Energy Center 1 0.0 86.0 86.0 86.0 86.0 86.0Colorado Bend Energy Center 2 0.0 86.0 86.0 86.0 86.0 86.0Colorado Bend Energy Center 3 0.0 103.0 103.0 103.0 103.0 103.0J. K. Spruce 2 0.0 0.0 0.0 0.0 750.0 750.0Quail Run Energy Center 1 0.0 85.0 85.0 85.0 85.0 85.0Quail Run Energy Center 2 0.0 85.0 85.0 85.0 85.0 85.0Quail Run Energy Center 3 0.0 105.0 105.0 105.0 105.0 105.0New Units with Signed IA 0.0 550.0 550.0 550.0 1300.0 1300.0
Winter Capacities - 84 of 87
STP000005 May 9, 2011

CDR Report - Winter Capacities June 2006
UnitName 2007 2008 2009 2010 2011 2012
Winter Capacity, MW
(Capacity is based on Generation Interconnection Request. Actual capacity after the unit is built may be different.)
Camp Springs 1 0.0 130.5 130.5 130.5 130.5 130.5Cirello (Buffalo Gap 2) 0.0 233.0 233.0 233.0 233.0 233.0Horse Hollow Wind Farm 4 0.0 116.0 116.0 116.0 116.0 116.0Mesquite Wind 1 0.0 200.0 200.0 200.0 200.0 200.0Mesquite Wind 2 0.0 0.0 200.0 200.0 200.0 200.0Orion Delaware Mt. Wind Farm 1 0.0 0.0 175.0 175.0 175.0 175.0Silverstar 1 0.0 60.0 60.0 60.0 60.0 60.0WKN Snyder Wind 1 0.0 60.0 60.0 60.0 60.0 60.0New Wind Generation 0.0 799.5 1174.5 1174.5 1174.5 1174.5(Capacity is based on Generation Interconnection Request. Actual capacity after the unit is built may be different.)
Holly Street 3 0.0 196.0 196.0 196.0 196.0 196.0Holly Street 4 0.0 201.0 201.0 201.0 201.0 201.0Leon Creek 3 0.0 0.0 65.0 65.0 65.0 65.0Units to Retire 0.0 397.0 462.0 462.0 462.0 462.0
Atkins 3 12.0 12.0 12.0 12.0 12.0 12.0Atkins 4 22.0 22.0 22.0 22.0 22.0 22.0Atkins 5 25.0 25.0 25.0 25.0 25.0 25.0Atkins 6 50.0 50.0 50.0 50.0 50.0 50.0B M Davis 1 346.0 346.0 346.0 346.0 346.0 346.0B M Davis 2 355.0 355.0 355.0 355.0 355.0 355.0Cedar Bayou 3 760.0 760.0 760.0 760.0 760.0 760.0Collin 1 149.0 149.0 149.0 149.0 149.0 149.0E S Joslin 1 260.0 260.0 260.0 260.0 260.0 260.0Eagle Mountain 1 109.0 109.0 109.0 109.0 109.0 109.0Eagle Mountain 2 95.0 95.0 95.0 95.0 95.0 95.0Eagle Mountain 3 390.0 390.0 390.0 390.0 390.0 390.0Handley 1 43.0 43.0 43.0 43.0 43.0 43.0Handley 2 76.0 76.0 76.0 76.0 76.0 76.0J L Bates 1 72.0 72.0 72.0 72.0 72.0 72.0J L Bates 2 110.0 110.0 110.0 110.0 110.0 110.0La Palma 4 23.0 23.0 23.0 23.0 23.0 23.0La Palma 5 23.0 23.0 23.0 23.0 23.0 23.0La Palma 6 155.0 155.0 155.0 155.0 155.0 155.0La Palma 7 57.0 57.0 57.0 57.0 57.0 57.0Laredo 1 0.0 0.0 0.0 0.0 35.0 35.0Laredo 2 0.0 0.0 0.0 0.0 32.0 32.0Laredo 3 0.0 0.0 0.0 0.0 105.0 105.0
Winter Capacities - 85 of 87
STP000005 May 9, 2011
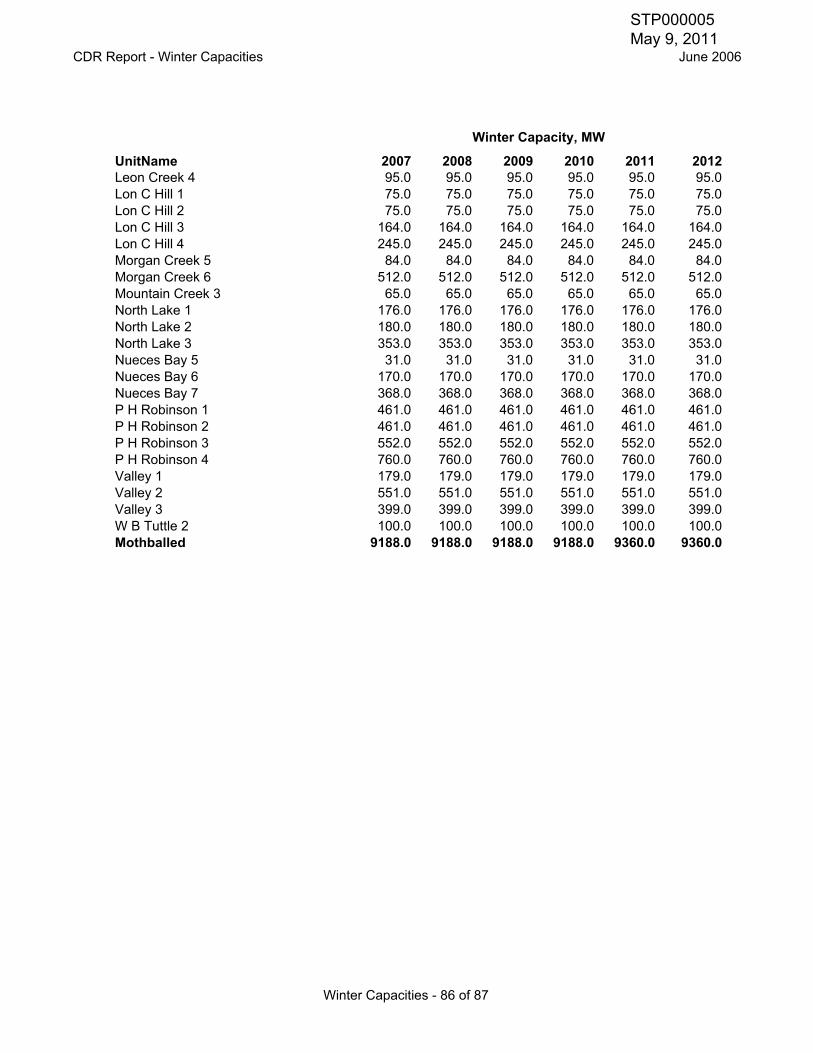
CDR Report - Winter Capacities June 2006
UnitName 2007 2008 2009 2010 2011 2012
Winter Capacity, MW
Leon Creek 4 95.0 95.0 95.0 95.0 95.0 95.0Lon C Hill 1 75.0 75.0 75.0 75.0 75.0 75.0Lon C Hill 2 75.0 75.0 75.0 75.0 75.0 75.0Lon C Hill 3 164.0 164.0 164.0 164.0 164.0 164.0Lon C Hill 4 245.0 245.0 245.0 245.0 245.0 245.0Morgan Creek 5 84.0 84.0 84.0 84.0 84.0 84.0Morgan Creek 6 512.0 512.0 512.0 512.0 512.0 512.0Mountain Creek 3 65.0 65.0 65.0 65.0 65.0 65.0North Lake 1 176.0 176.0 176.0 176.0 176.0 176.0North Lake 2 180.0 180.0 180.0 180.0 180.0 180.0North Lake 3 353.0 353.0 353.0 353.0 353.0 353.0Nueces Bay 5 31.0 31.0 31.0 31.0 31.0 31.0Nueces Bay 6 170.0 170.0 170.0 170.0 170.0 170.0Nueces Bay 7 368.0 368.0 368.0 368.0 368.0 368.0P H Robinson 1 461.0 461.0 461.0 461.0 461.0 461.0P H Robinson 2 461.0 461.0 461.0 461.0 461.0 461.0P H Robinson 3 552.0 552.0 552.0 552.0 552.0 552.0P H Robinson 4 760.0 760.0 760.0 760.0 760.0 760.0Valley 1 179.0 179.0 179.0 179.0 179.0 179.0Valley 2 551.0 551.0 551.0 551.0 551.0 551.0Valley 3 399.0 399.0 399.0 399.0 399.0 399.0W B Tuttle 2 100.0 100.0 100.0 100.0 100.0 100.0Mothballed 9188.0 9188.0 9188.0 9188.0 9360.0 9360.0
Winter Capacities - 86 of 87
STP000005 May 9, 2011