report on the cy 2015 update of the malpractice relative ... · 2015 mp rvu values of other service...
TRANSCRIPT

Final Report on the CY 2015 Update of the
Malpractice Relative Value Units for the Medicare
Physician Fee Schedule
November 2014
Thomas MaCurdy
William Vogt
Sajid Zaidi
David Pham
Elen Shrestha
Silvia Manolache
Arthur Chia
Acumen, LLC 500 Airport Blvd., Suite 365 Burlingame, CA 94010

Executive Summary | Acumen, LLC i
EXECUTIVE SUMMARY
The Centers for Medicare and Medicaid Services (CMS) pays physicians for their
services according to the Physician Fee Schedule (PFS), which specifies a set of allowable
procedures and payments for each service. Payments for services paid under the PFS are
determined based on setting relative value units (RVUs) for each service using a methodology
referred to as the resource-based relative value scale (RBRVS). Specifically, each procedure is
interpreted as being produced by a combination of three categories of inputs: practitioner work
(PW), practice expense (PE), and malpractice insurance (MP). The particular blend of PW, PE,
and MP inputs assessed to produce a service specifies its composition of RVUs. A payment for a
procedure depends on its assigned RVUs and the input prices assessed for each RVU component.
As mandated under Section 1848(c) of the Social Security Act, CMS is required to
establish national RVUs for each of the three categories of inputs. Section 1848(c)(2)(B)(i) of
the Social Security Act requires that CMS review, and, if necessary, adjust RVUs no less often
than every five years. The MP RVUs, which reflect the relative costs to practitioners of
professional liability insurance, were first implemented in the PFS final rule published
November 2, 1999.1
64 FR 59380
For each subsequent review and update of the MP RVUs, CMS is required
to update the malpractice insurance premium data to reflect the amount of professional liability
insurance practitioners typically require to supply medical services. CMS last updated the MP
RVUs in the CY 2010 PFS final rule with comment period.2
74 FR 61758
CMS has scheduled the next round
of review and update of the MP RVUs to occur in the CY 2015 PFS final rule with comment
period (henceforth “CY 2015 update”).
1
2
After evaluating both the current data and methods CMS uses to calculate the MP
RVUs, Acumen implemented seven modifications to the MP RVU framework for the CY 2015
update. These modifications include updating the datasets used in the calculation of the MP
RVUs, including the:
(1) Malpractice premium data;
(2) Locality RVUs and Services (LRS) dataset;
(3) Current Procedural Terminology RVUs and Services (CRS) dataset;
(4) Geographic Practice Cost Index (GPCI) dataset;
(5) National PFS Relative Value (NPFS) dataset;
(6) Clinical RVUs dataset; and
(7) 2014 and 2015 Discounted Utilization for service codes datasets.

ii Acumen, LLC | Executive Summary
Each modification offers an improvement in the data source used to calculate the MP RVU
values.
The remainder of the Executive Summary provides additional information about RVUs
and highlights this report’s key findings. The first section reviews how Medicare uses RVUs
within the PFS. The second section discusses each of the modifications listed above in more
detail. Finally, the third section concludes with highlights from the empirical analysis of the
impact of the above changes.
How RVUs Affect Practitioner Payments
Under the PFS, Medicare pays for practitioner services based on a list of services and
their payment rates. Under the PFS, every practitioner service corresponds to a specific
procedure code within the Healthcare Common Procedure Coding System (HCPCS). Since
1992, CMS has relied on the RBRVS system to determine the fee for each procedure. In the
RBRVS system, payments for each service depend on the relative amounts of inputs required to
perform the procedure. These inputs include the amount of practitioner work needed to provide
a medical service, expenses related to maintaining a practice, and malpractice insurance costs.
CMS estimates the quantity of inputs required to provide these services under the PFS using PW
RVU, PE RVU, and MP RVU, respectively. Higher RVU levels indicate that the service
requires more inputs.
Whereas the RVUs measure the level of inputs used for each service, Geographic
Practice Cost Indices (GPCIs) measure regional variation in the price of each of the three input
categories. In essence, GPCIs increase the price associated with an RVU in high cost regions
and decrease the price associated with an RVU in low cost regions. GPCIs are budget neutral and
do not affect aggregate payment levels; rather, they reallocate payment rates by locality to reflect
regional variation in relative input prices. For instance, a PE GPCI of 1.2 indicates that practice
expenses in that area are 20 percent above the national average, whereas a PE GPCI of 0.8
indicates that practices expenses in that area are 20 percent below the national average. The
three GPCIs are calculated for 89 localities. The localities are defined alternatively by state
boundaries (e.g., Wisconsin), metropolitan statistical areas (MSAs) (e.g., Metropolitan St. Louis,
MO), portions of an MSA (e.g., Manhattan), or rest-of-state area which exclude metropolitan
areas (e.g., Rest of Missouri).
Using the RVUs, GPCIs, and a conversion factor (CF), one can calculate the PFS
payment for any service in any locality. The CF translates the sum of the GPCI-adjusted RVUs
from RVUs into dollars. Current legislation mandates that CMS updates the CF every year
according to the Sustainable Growth Rate (SGR).3 Although the SGR is projected to
3 For more information on the SGR, see: CMS March 2012.

significantly decrease practitioner compensation over the upcoming years, Congress has reversed
the reductions in most years since the SGR was implemented in 2002.4
4 Hahn August 2010.
Most recently, the
Bipartisan Budget Act of 2013 nullifies the SGR and continues current Medicare practitioner
payment rates through March 31, 2014.5
5 U.S. Congress December 2013.
Equation (1) below demonstrates how the PW, PE, and
MP GPCIs combine with the three RVUs and the CF to establish a Medicare practitioner
payment for any service K in locality L6
6 The Medicare physician payment calculated using equation 1 may also be adjusted upwards or downwards through
payment modifiers. For example, physicians use a modifier to bill for a service when they assist in a surgery;
payment for an assistant surgeon is only a percentage of the fee schedule amount for the primary surgeon.
:
(1) , , , , , , ,K L PW L PW K PE L PE K MP L MP KPayment GPCI RVU GPCI RVU GPCI RVU CF
Although GPCIs affect payments for each procedure depending on the relative amounts
of PW, PE, and MP RVUs, one can summarize the approximate combined impact of the three
GPCI components on a locality’s practitioner reimbursement levels using the Geographic
Adjustment Factor (GAF). The GAF is a weighted sum of the three GPCIs for each locality,
where the cost share weights are determined by the Medicare Economic Index (MEI) base year
weights. Using the current MEI base year weights7
7 For 2013, the MEI base year weights come from 2006 data.
, one can calculate the GAF as follows in
equation (2):
(2) , , ,0.48266 0.47439 0.04295L PW L PE L MP LGAF GPCI GPCI GPCI
Calculating the MP RVUs with More Updated Data
There were seven modifications made to update the data sources currently used to
calculate the MP RVUs with more recent data. Table 1 below summarizes the data sources for
the CY 2015 update and compares them to the CY 2010 MP RVU data sources.
Table 1: CY 2015 MP RVU Update Data Source Overview
Dataset Name Source CY 2010 Update CY 2015 Update
Malpractice Premiums State Departments
of Insurance 2006-2007 2011-2012
Locality RVUs and Services CMS 2008 2013
Current Procedural
Terminology RVUs and
Services
CMS 2008 2013
Geographic Practice Cost
Index CMS 2008 20148
8 For the Geographic Practice Cost Index dataset, “2014” refers to the fact that the latest GPCI update (i.e., the
Seventh Update) was finalized in the CY 2014 final rule. For the purpose of the CY 2015 MP RVU update, fully-
implemented Seventh Update GPCI values for CY 2015 were utilized, as the Seventh Update GPCI values were
averaged with the Sixth Update GPCI values for CY 2014,
Executive Summary | Acumen, LLC iii

iv Acumen, LLC | Executive Summary
Dataset Name Source CY 2010 Update CY 2015 Update
National PFS Relative Value
File CMS 2008 20159
Clinical RVUs CMS 2008 201510
Discounted Utilization Files11 CMS Not Used 2014-2015
Summary of the Predicted Impacts of the CY 2015 Update on Total RVUs
To assess the impact of the CY 2015 update on the total RVUs, we calculated the total
RVUs using CY 2014 PW and PE RVUs, with the difference resulting from either the current
CY 2014 or the new CY 2015 MP RVUs. Because the MP RVUs represent the smallest
component of the practitioner payment schedule, when compared to practitioner work and
practice expense components, the overall impact of MP RVUs on Total RVUs is less
pronounced; total RVUs did not substantially change as a result of this update. Table 2
demonstrates the percent change for total RVUs after the updated MP RVUs.
Table 2: Percent Change in Total RVUs, 2014 to Updated, Budget Neutral Values by
Mod/Indicator
Statistic
Subset
All Tech Prof Global Single
Non-Empty Values Count 8,853 917 997 842 6,097
Miles/Times/Units/Services
(MTUS) Weighted Mean 0% 0% 0% 0% 0%
Mean 0% 0% 0% 0% 0%
Minimum -12% -2% -12% -3% -12%
1st Percentile -6% 0% -3% -1% -7%
5th Percentile -2% 0% -2% 0% -2%
10th Percentile -1% 0% -1% 0% -2%
25th Percentile 0% 0% 0% 0% -1%
50th Percentile 0% 0% 0% 0% 0%
75th Percentile 0% 0% 0% 0% 0%
90th Percentile 1% 0% 2% 0% 1%
95th Percentile 1% 0% 3% 1% 1%
99th Percentile 4% 0% 6% 1% 4%
Maximum 18% 0% 9% 4% 18%
Standard Deviation 1% 0% 2% 0% 2%
Table 3 breaks down Total RVU percent change by surgery classification. The weighted
average effect of the MP RVU update on total RVUs is negligible for all categories reported in
Table 3. Similarly, the median effects on total RVUs are very modest, rounding down to zero
9 For the National PFS Relative Value File dataset, “2015” refers to proposed CY 2015 values. 10 For the Clinical RVUs dataset, “2015” refers to proposed CY 2015 values. 11 For the CY 2015 update, the 2015 Discounted Utilization file is used to determine utilization of service codes. The
2014 Discounted Utilization File is used in calculating budget neutrality. The 2015 utilization file is used on 2015
service codes while 2014 utilization file is used on 2014 service codes.

Executive Summary | Acumen, LLC v
percent in all categories in Table 3 except for a one percent decline for obstetric RVUs. In
addition, the update induces minimum and maximum changes that are quite modest. Among all
codes, the minimum change in total RVUs owing to this update is a decline of 12 percent and the
maximum change is an increase of 18 percent. Section 4 of the full report presents the impact of
the CY 2015 update of the MP RVUs by Current Procedural Terminology (CPT) code type, as
well as by specialty.
Table 3: Percent Change in Total RVUs, 2014 to Updated, Budged Neutral Values by
Surgery Class
Statistic
Subset
MAJ OB NS
Non-Empty Values Count 5,571 65 3,217
MTUS Weighted Mean 0% -1% 0%
Mean 0% -1% 0%
Minimum -12% -10% -12%
1st Percentile -6% -10% -3%
5th Percentile -3% -2% -1%
10th Percentile -2% -2% -1%
25th Percentile -1% -1% 0%
50th Percentile 0% -1% 0%
75th Percentile 0% -1% 0%
90th Percentile 1% 0% 1%
95th Percentile 2% 0% 1%
99th Percentile 4% 9% 3%
Maximum 18% 9% 9%
Standard Deviation 2% 2% 1%

vi Acumen, LLC | Table of Contents
TABLE OF CONTENTS
.......................................................................................................................
.............................................................................................................................
.....................................................................
.......................................................................
....................................................................................
..........................
...................................................
.................................................
....................
..........................................................................................................
..........................................................................
........................................
.................
..................................................
..............................
..........................................................
...........................................................................................
................................
................................................................
....
.......................................
.........................................................................
...............................................
.....................................................................................................
......................................................................
.................................................................................
.................................................................
..........................................................................................................
............................................................
....................
....................................................
.........................................................
.............................................................................................
.....................................................
............................................................................................
............................................................
...........................................
................................................................
................................................................
.......................................................................................................
....................................................................................................................................
...............................................................
................................................................................
....................................................
................................................
.....................................................
.......
....
Executive Summary i 1 Introduction 1 2 Brief Overview of the MP RVU Methodology 2
2.1 How RVUs Affect Practitioner Payments 2 2.2 MP RVU Data and Methodology 3
2.2.1 Step 1: Calculating the MP RVU National Average Premiums 4 2.2.2 Step 2: Calculating the MP RVU Risk Factors 5 2.2.3 Step 3: Calculating the MP RVUs by Procedure 6 2.2.4 Step 4: Calculating the MP RVUs Adjusted for Budget Neutrality 7
3 Updating the MP RVUs 9 3.1 Malpractice Premium Data Collection 10
3.1.1 Step 1: Defining a Standard for Malpractice Policies 10
3.1.2 Step 2: Identifying the Primary Medical Malpractice Underwriters 11 3.1.3 Step 3: Collecting Malpractice Premium Data 13
3.1.4 Step 4: Collecting Patient Compensation Fund Surcharges 14 3.2 Constructing the Malpractice Premium Data Set 16
3.3 Adjusting for Missing Data 16 3.3.1 Case 1: Premium Data Missing in Base Year or Became Effective Mid-Year . 16 3.3.2 Case 2: No Premium Data Available from Rate Filings 17
3.4 Defining Specialties 17 3.4.1 Specialties with Insufficient Coverage, No State Coverage, and Extreme
Variation in Premium Amounts 19 3.4.2 Specialties with Surgery and Obstetrics Classes 21 3.4.3 Neurosurgery 22
3.5 Updating the Technical Component Data 23
3.6 Service Codes without Utilization 26 3.7 Service Codes with Crosswalked MP RVUs 26 3.8 CMS Data Update 26
3.8.1 Locality RVUs and Services (LRS) File 26 3.8.2 Current Procedural Terminology RVUs and Services (CRS) File 27
3.8.3 Geographic Practice Cost Index (GPCI) File 27 3.8.4 National PFS Relative Value (NPFS) File 27 3.8.5 Clinical RVUs File 27 3.8.6 2014 and 2015 Discounted Utilization Files 28
4 Impact of the CY 2015 Update 29 4.1 Overall Impact and Impact by CPT Code Type 29
4.1.1 Average MP RVUs and Distribution of MP RVUs 29
4.1.2 Percentage Change in MP RVUs 31 4.1.3 Percentage Change in Total RVUs 32
4.2 Impact by Specialty 34
References 36
Appendix A : Risk Factors of Low Volume Services 37 Appendix B : Summary of MP RVU Data 38 Appendix C : Surgical Codes Outside 10000-69999 Range 48
Appendix D : Service Codes with Crosswalked Risk Factors 51 Appendix E : Service Codes with Crosswalked MP RVUs 56

Table of Contents | Acumen, LLC vii
LIST OF TABLES AND FIGURES
Table 1: CY 2015 MP RVU Update Data Source Overview iii Table 2: Percent Change in Total RVUs, 2014 to Updated, Budget Neutral Values by
Mod/Indicator iv Table 3: Percent Change in Total RVUs, 2014 to Updated, Budged Neutral Values by Surgery
Class v
Table 2.1: MP RVU Data Source Overview 4 Table 3.1: CY 2015 MP RVU Update Data Source Overview 9 Table 3.2: Source of Market Share Data and Most Recent Data Collected by State 12 Table 3.3: Patient Compensation Funds 15 Table 3.4: Number of State Rate Filings Collected for Each Specialty 18
Table 3.5: Reassigned Specialties with Insufficient State Coverage, No State Coverage, and
Extreme Variation in Premium Amounts 20
Table 3.6: TC Specialties Assigned TC-only Risk Factor 21 Table 3.7: HCPCS Code Surgery Classes 22
Table 3.8:
HCPCS Code Surgery Classes 22
Surgery Class Specialty Situations 22 Table 3.9: Distinction among Professional, Technical, and Global CPT Data 23
Table 3.10: Example CPT Code with Modifiers 24 Table 4.1: Distribution of Updated 2015 Budget Neutral MP RVUs by Mod/Indicator 30 Table 4.2: Distribution of Updated 2015 Budget Neutral MP RVUs by Surgery Class 30
Table 4.3: Percent Change in MP RVUs across CPT Codes by Mod/Indicator 31 Table 4.4: Percent Change in MP RVUs across CPT Codes by Surgery and Obstetrics Class 32
Table 4.5: Percent Change in Total RVUs, 2014 to Updated, Budget Neutral Values by
Mod/Indicator 33 Table 4.6: Percent Change in Total RVUs, 2014 to Updated, Budged Neutral Values by Surgery
Class 33
Table 4.7: Impact by Specialty 34 Table A.1: Low Volume Services 37 Table B.1: Summary of MP RVU Data 38
Table C.1: Surgical Codes Outside 10000-69999 Range 48 Table D.1: 2014 New/Revised Service Codes with Crosswalked Risk Factors 51
Table D.2: 2015 New/Revised Service Codes with Crosswalked Risk Factors 53 Table E.1: CPT Codes with Cross-walked MP RVUs .. 56
.........................................................
................................................................................................................................
................................................................................................................................................
...................................................................................
.......................................................
....................
.......................................................................................
........................................
.....................................................................................
............................................................
..........................................................................................................................................................................
..............................................................................
.............................
..........................................................................
..............
..............
...........................
....
...............................................................................................................................
..............................................................................................................................................
.....................................................................................................
.................................................................................................
........................................................................................
.............................................................
...........................
...........................
................................................................

Report on the CY 2015 Update of the MP RVUs for the Medicare PFS | Acumen, LLC 1
1 INTRODUCTION
The Centers for Medicare and Medicaid Services (CMS) pays practitioners for their
services according to the Physician Fee Schedule (PFS), which specifies a set of allowable
procedures and payments for each service. Payments for services paid under the PFS are
determined based on setting relative value units (RVUs) for each service using a methodology
referred to as the resource-based relative value scale (RBRVS). Specifically, each procedure is
interpreted as being produced by a combination of three categories of inputs: practitioner work
(PW), practice expense (PE), and malpractice insurance (MP). The particular blend of PW, PE,
and MP inputs assessed to produce a service specifies its composition of RVUs. A payment for a
procedure depends on its assigned RVUs and the input prices assessed for each RVU component.
As mandated under Section 1848(c) of the Social Security Act, CMS is required to
establish national RVUs for each of the three categories of inputs. Section 1848(c)(2)(B)(i) of
the Social Security Act requires that CMS review, and, if necessary, adjust RVUs no less often
than every five years. The MP RVUs, which reflect the relative costs to practitioners of
professional liability insurance, were first implemented in the PFS final rule published
November 2, 1999.12 For each subsequent review and update of the MP RVUs, CMS is required
to update the malpractice insurance premium data to reflect the amount of professional liability
insurance practitioners typically require to supply medical services. CMS last updated the MP
RVUs in the CY 2010 PFS final rule with comment period.13 CMS has scheduled the next round
of review and update of the MP RVUs to occur in the CY 2015 PFS final rule with comment
period (henceforth “CY 2015 update”).
12 64 FR 59380 13 74 FR 61758
This report describes the results of updating the MP RVUs in support of CY 2015
Medicare PFS rulemaking. For the CY 2015 update, CMS applied the same MP RVU
methodology as the CY 2010 update, but utilized more up-to-date data sources to calculate the
MP RVUs. Section 2 provides a brief overview of how CMS calculates MP RVUs and uses
them to calculate provider payments. Section 3 describes updating the data sources currently
used to calculate the MP RVUs with more recent data. Section 4 concludes with the impacts of
the CY 2015 update.

2 Acumen, LLC | Section 2: Brief Overview of the MP RVU Methodology
2 BRIEF OVERVIEW OF THE MP RVU METHODOLOGY
As part of the PFS, MP RVUs reflect the relative cost to practitioners of professional
liability insurance. This section provides background information regarding how CMS uses MP
RVUs within the Medicare PFS. Section 2.1 describes how RVUs affect Medicare payments to
practitioners. Section 2.2 presents the methodology CMS currently uses to calculate MP RVUs.
2.1 How RVUs Affect Practitioner Payments
Under the PFS, Medicare pays for practitioner services based on a list of services and
their payment rates. Under the PFS, every practitioner service corresponds to a specific
procedure code within the Healthcare Common Procedure Coding System (HCPCS). Since
1992, CMS has relied on the RBRVS system to determine the fee for each procedure. In the
RBRVS system, payments for each service depend on the relative amounts of inputs required to
perform the procedure. These inputs include the amount of practitioner work needed to provide
a medical service, expenses related to maintaining a practice, and malpractice insurance costs.
CMS estimates the quantity of inputs required to provide these services under the PFS using PW
RVU, PE RVU, and MP RVU, respectively. Higher RVU levels indicate that the service
requires more inputs.
Whereas the RVUs measure the level of inputs used for each service, Geographic
Practice Cost Indices (GPCIs) measure regional variation in the price of each of the three input
categories. In essence, GPCIs increase the price associated with an RVU in high cost regions
and decrease the price associated with an RVU in low-cost regions. GPCIs are budget neutral
and do not affect aggregate payment levels; rather, they reallocate payment rates by locality to
reflect regional variation in relative input prices. For instance, a PE GPCI of 1.2 indicates that
practice expenses in that area are 20 percent above the national average, whereas a PE GPCI of
0.8 indicates that practices expenses in that area are 20 percent below the national average. The
three GPCIs are calculated for 89 localities. The localities are defined alternatively by state
boundaries (e.g., Wisconsin), metropolitan statistical areas (MSAs) (e.g., Metropolitan St. Louis,
MO), portions of an MSA (e.g., Manhattan), or rest-of-state area which exclude metropolitan
areas (e.g., Rest of Missouri).
Using the RVUs, GPCIs, and a conversion factor (CF), one can calculate the PFS
payment for any service in any locality. The CF translates the sum of the GPCI-adjusted RVUs
from RVUs into dollars. Current legislation mandates that CMS updates the CF every year
according to the Sustainable Growth Rate (SGR).14 Although the SGR is projected to
significantly decrease practitioner compensation over the upcoming years, Congress has reversed
14 For more information on the SGR, see: CMS March 2012.

Report on the CY 2015 Update of the MP RVUs for the Medicare PFS | Acumen, LLC 3
the reductions in most years since the SGR was implemented in 2002.15 Most recently, the
Bipartisan Budget Act of 2013 nullifies the SGR and continues current Medicare practitioner
payment rates through March 31, 2014.16 Equation (2.1) below demonstrates how the PW, PE,
and MP GPCIs combine with the three RVUs and the CF to establish a Medicare practitioner
payment for any service K in locality L17:
(2.1) , , , , , , ,K L PW L PW K PE L PE K MP L MP KPayment GPCI RVU GPCI RVU GPCI RVU CF
Although GPCIs affect payments for each procedure depending on the relative amounts
of PW, PE, and MP RVUs, one can summarize the approximate combined impact of the three
GPCI components on a locality’s practitioner reimbursement levels using the Geographic
Adjustment Factor (GAF). The GAF is a weighted sum of the three GPCIs for each locality,
where the cost share weights are determined by the Medicare Economic Index (MEI) base year
weights. Using the current MEI base year weights18, one can calculate the GAF as follows in
equation (2.2):
(2.2) , , ,0.48266 0.47439 0.04295L PW L PE L MP LGAF GPCI GPCI GPCI
2.2 MP RVU Data and Methodology
Calculation of the MP RVUs requires information on malpractice premiums linked to the
practitioner work conducted by different specialties that provide Medicare services. Because
malpractice costs vary by state and by specialty, the malpractice information must be weighted
geographically and across specialties. In particular, calculation of the MP RVUs involves seven
data sources, which are summarized in Table 2.1 below. The first column lists the names and
abbreviations of the datasets used in the MP RVU calculation. The second and third columns
present the dataset sources and level of observation within each dataset respectively. The fourth
and fifth columns list the role each data source serves in the MP RVU calculation as well as the
specific methodological steps associated with each dataset respectively.
15 Hahn August 2010. 16 U.S. Congress December 2013. 17 The Medicare physician payment calculated using equation (2.1) may also be adjusted upwards or downwards
through payment modifiers. For example, physicians use a modifier to bill for a service when they assist in a
surgery; payment for an assistant surgeon is only a percentage of the fee schedule amount for the primary surgeon. 18 For 2013, the MEI base year weights come from 2006 data.

4 Acumen, LLC | Section 2: Brief Overview of the MP RVU Methodology
Table 2.1: MP RVU Data Source Overview
Dataset Name Source Observation Level Data Source Role Methodology Step
Malpractice
Premiums
(MP File)
State Departments
of Insurance
County, Specialty,
Surgery Class
Determining
specialty risk
factors
1
Locality RVUs and
Services
(LRS File)
CMS
Physician ZIP Code,
Carrier Number,
Locality, Specialty
Weighting county
level malpractice
premiums and
creating geographic
normalization factor
1
Current Procedural
Terminology RVUs
and Services
(CRS File)
CMS
Carrier Number,
Locality, Specialty,
Current Procedural
Terminology,
Modifier
Weighting the
blended specialties
by their respective
PW RVU
1
Geographic Practice
Cost Index
(GPCI File)
CMS Locality
Geographic
adjustments for
malpractice
premiums
1
National PFS
Relative Value File
(NPFS File)
CMS
Current Procedural
Terminology,
Modifier
Risk of service and
impact reference 3
Clinical RVUs CMS
Current Procedural
Terminology,
Modifier
Risk of service 3
Discounted
Utilization Files CMS
Specialty, Current
Procedural
Terminology,
Modifier
Weighting national
specialty risk
factors and
determining low
volume services and
calculating budget
neutrality
3
The current approach to calculate the MP RVUs largely involves four steps:
(1) Calculating a national average MP premium for each practitioner specialty,
(2) Normalizing specialty premiums against the lowest-cost specialty baseline to create a
specialty-specific risk factor,
(3) Calculating the unadjusted MP RVU for each service, based on the share of specialists
that typically perform a service, and
(4) Adjusting the RVUs for budget neutrality.
The remainder of Section 2.2 describes each step in greater detail.
2.2.1 Step 1: Calculating the MP RVU National Average Premiums
Because the MP RVUs are national measures and the premiums are collected by state and
coverage area within a state, the first step creates national average premiums by specialty and
surgery class. The RVU-weighted national average premiums are calculated as national average
premiums for each specialty and surgery class, normalized by the average MP GPCI. This
normalization is necessary to avoid inflated or deflated values due to potential differences in

Report on the CY 2015 Update of the MP RVUs for the Medicare PFS | Acumen, LLC 5
distribution of specialty-provided services across geographic areas. Normalization adjusts the
national average premiums to account for these geographic differences in cost; as presented in
Equation (2.1), the geographic cost differences are handled through the GPCIs rather than in the
RVUs themselves. The national average premiums by specialty and surgery class are themselves
averages of the most recently available premiums for each county, weighted by the total RVUs in
that county. In mathematical notation, the national average premium for specialty and surgery
class combination S is given by:
(2.3)
,avg
SNS
MP S
PremiumPremium
GPCI
where
(2.4)
share of total RVUs for specialty that are in county S SK
K
Premium P S K and
(2.5) .
, ,avg share of MP RVUs for specialty that are in locality MP S MP L
L
GPCI GPCI S L
In these formulas, K indicates the county; S designates the medical specialty and surgery class
combination; L indicates the locality; N identifies the nation; and GPCIMP is the MP GPCI value.
Total RVU weights are drawn from specialty-ZIP code totals on the LRS file summed by county.
To calculate an average specialty and surgery class premium for each county (PSK), market
shares at the state level for firm F providing coverage in county K (MSKF) were utilized from the
county-level insurance carrier data gathered from State Departments of Insurance. To calculate
PSK, insurance carrier’s county-level specialty and surgery class premiums (PSKF) were averaged,
weighted by each insurance carrier’s market share in each state. In mathematical notation, the
average specialty premium for each county is given by:
(2.6)
SKF KF
SK
F K
P MSP
MS
where MSK refers to the total market share for all firms providing coverage in that county K.
After calculating the normalized premiums across specialties and surgery classes, final
surgery classes were chosen based on state counts, and remapping of specialties was done based
on similarity of specialties and premiums. For some specialties, all surgery classes were blended
together by weighting individual surgery classes by their PW RVUs in the CRS file, while for
others the values of their surgical, non-surgical, or unspecified premiums were used in the
calculations in Step 2.
2.2.2 Step 2: Calculating the MP RVU Risk Factors
The second step calculates relative risk factors (i.e., premium weights) by specialty. Risk
factors for the specialties and surgery classes in the malpractice premium data can be calculated

6 Acumen, LLC | Section 2: Brief Overview of the MP RVU Methodology
simply by normalizing the national average premium to a standard base. Historically, the
standard base has been the lowest premium specialty. Unlike the GPCIs, which norm around
1.0, using a lowest premium base presents all other risk factors as excess risk above the lowest
premium specialty, and all values are greater than or equal to 1.0. Mathematically:
(2.7)
In the case where a specialty does not have MP premium data for 35 or more States, the specialty
is mapped to a specialty with a comparable level of MP risk. For example, in the CY 2010 MP
RVU update, the Oral Surgery and Maxillofacial Surgery specialties were mapped to the Plastic
Reconstructive Surgery specialty. Specialties are mapped to the closest Insurance Service Office
(ISO) code, or if no ISO code can be identified, the specialty is cross-walked to a specialty for
which an ISO code is assigned.
2.2.3 Step 3: Calculating the MP RVUs by Procedure
In the third step, Acumen calculated the MP RVUs by procedure. Each Current
Procedural Terminology/Modifier (CPT/MOD) procedure code’s MP RVUs (MP RVUCPT/MOD) is
calculated as that procedure’s PW RVU (PW RVUCPT/MOD) multiplied by the average risk factor
for the procedure (avgRVUCPT/MOD):
(2.8)
PW RVUs reflect the practitioner time, technical skill, and effort involved with a specific
procedure. If it is higher, the clinical labor RVU for a procedure replaces the PW RVU in
Equation (2.8). The PW RVU values are drawn from the NPFS file provided by CMS.
The average risk factor reflects the relative malpractice liability associated with that
procedure, based on the specialties of the practitioners who perform the service. Specifically,
under the current methodology, the average risk factor is a weighted average of the risk factors
for each specialty that performs the procedure, weighted by the share of the allowed services
count provided by that specialty:
(2.9)
where the weights MTUSCPT/MOD,S are the sum of the number of services performed per specialty
per procedure (Miles/Times/Units/Service (MTUS)), as reported in the 2015 Discounted
Utilization File provided by CMS. If the allowed services count for a procedure is less than 100,
the risk factor of the claims based dominant specialty is utilized. For 23 low volume services
NS
S
Nlowest
PremiumRF
Premium
/ / / avg CPT MOD CPT MOD CPT MODMP RVU RF PW RVU
/ ,
/
/ ,
avgS CPT MOD S
SCPT MOD
CPT MOD S
S
RF MTUS
RFMTUS

Report on the CY 2015 Update of the MP RVUs for the Medicare PFS | Acumen, LLC 7
shown in Appendix A, Acumen overrode the claims based dominant specialty with an assigned
specialty as directed by CMS.
2.2.4 Step 4: Calculating the MP RVUs Adjusted for Budget Neutrality
The fourth step adjusts the MP RVUs for budget neutrality so that the sum of the MP
RVUs after the update, weighted by the service count, is the same as this sum before the update.
Equations (2.10a and 2.10b) and Equations (2.11a and 2.11b) below show the two steps in the
budget neutralization. Specifically, the calculation applies an adjustment factor that scales up the
new MP RVU values if the sum of the MP RVUs across all services is higher under the previous
MP RVUs than under the new MP RVUs and scales down the new MP RVU values if the sum of
the MP RVUs across all services is lower under the previous MP RVUs than under the new MP
RVUs. The numerator is the summation of the 2014 MP RVUs multiplied by 2014 utilization
counts. The denominator is the summation of the 2015 raw MP RVUs multiplied by 2015
utilization counts. This factor is described below by Equation (2.10a):
(2.10a)
where is the budget neutral adjustment factor for the first round of budget
neutralization, indicates the previous MP RVUs, indicates the
newly calculated MP RVUs calculated through Equation (2.8), indicates the
MTUS reported in the 2014 Discounted Utilization File, and indicates the MTUS
reported in the 2015 Discounted Utilization File. The current year raw MP RVUs (
) are the MP RVU values calculated through Equation (2.8) multiplied by this
adjustment factor, as shown in Equation (2.10b):
(2.10b) .
After scaling the raw MP RVUs, a floor of 0.01 is applied and global codes are forced to be
equal to the sum of their professional and technical components (i.e., ). Then, a
second round of budget neutralization is applied using the same approach as above (Equation
2.11a). The numerator is same as that of Equation (2.10a), while the denominator is equal to the
post-first round budget neutralized MP RVUs multiplied by the utilization counts. The budget
neutral adjustment factor for the second round of budget neutralization, , is calculated
as:
/ /
1
/ /
Old Old
CPT MOD CPT MOD
New New
CPT MOD CPT MOD
MP RVU MTUSBN Adj
MP RVU MTUS
1 BN Adj
/ Old
CPT MODMP RVU / New
CPT MODMP RVU
/
Old
CPT MODMTUS
/
New
CPT MODMTUS
1
/ BN
CPT MODMP RVU
1
/ / 1 BN
CPT MOD CPT MODMP RVU MP RVU BN Adj
1 ,
/ BN frc
CPT MODMP RVU
2 BN Adj
8 Acumen, LLC | Section 2: Brief Overview of the MP RVU Methodology
(2.11a)
1
/ /
2 ,
/ /
Old Old
CPT MOD CPT MOD
BN frc New
CPT MOD CPT MOD
MP RVU MTUSBN Adj
MP RVU MTUS
The final budget neutral MP RVUs ( / finalBN
CPT MODMP RVU ) are multiplied by this adjustment factor,
as shown in Equation (2.11 b):
(2.11b) 1 ,
/ / 2 BN frcfinalBN
CPT MOD CPT MODMP RVU MP RVU BN Adj
Report on the CY 2015 Update of the MP RVUs for the Medicare PFS | Acumen, LLC 9
3 UPDATING THE MP RVUS
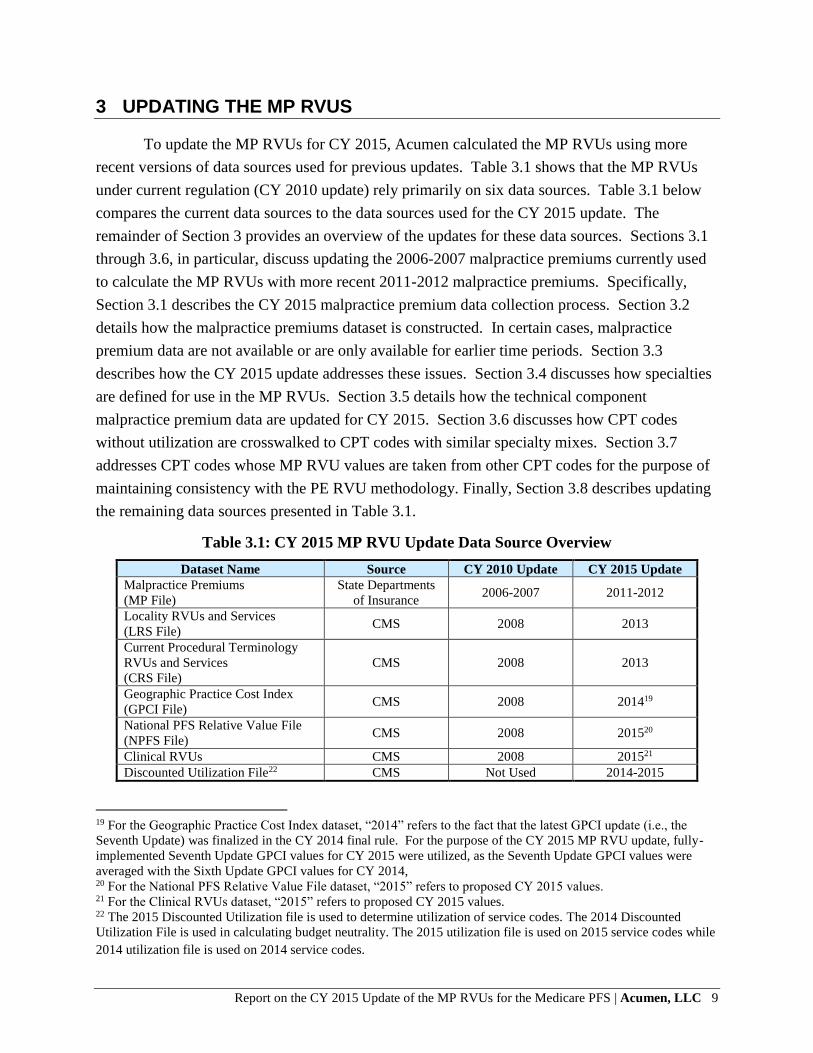
To update the MP RVUs for CY 2015, Acumen calculated the MP RVUs using more
recent versions of data sources used for previous updates. Table 3.1 shows that the MP RVUs
under current regulation (CY 2010 update) rely primarily on six data sources. Table 3.1 below
compares the current data sources to the data sources used for the CY 2015 update. The
remainder of Section 3 provides an overview of the updates for these data sources. Sections 3.1
through 3.6, in particular, discuss updating the 2006-2007 malpractice premiums currently used
to calculate the MP RVUs with more recent 2011-2012 malpractice premiums. Specifically,
Section 3.1 describes the CY 2015 malpractice premium data collection process. Section 3.2
details how the malpractice premiums dataset is constructed. In certain cases, malpractice
premium data are not available or are only available for earlier time periods. Section 3.3
describes how the CY 2015 update addresses these issues. Section 3.4 discusses how specialties
are defined for use in the MP RVUs. Section 3.5 details how the technical component
malpractice premium data are updated for CY 2015. Section 3.6 discusses how CPT codes
without utilization are crosswalked to CPT codes with similar specialty mixes. Section 3.7
addresses CPT codes whose MP RVU values are taken from other CPT codes for the purpose of
maintaining consistency with the PE RVU methodology. Finally, Section 3.8 describes updating
the remaining data sources presented in Table 3.1.
Table 3.1: CY 2015 MP RVU Update Data Source Overview
Dataset Name Source CY 2010 Update CY 2015 Update
Malpractice Premiums
(MP File)
State Departments
of Insurance 2006-2007 2011-2012
Locality RVUs and Services
(LRS File) CMS 2008 2013
Current Procedural Terminology
RVUs and Services
(CRS File)
CMS 2008 2013
Geographic Practice Cost Index
(GPCI File) CMS 2008 201419
National PFS Relative Value File
(NPFS File) CMS 2008 201520
Clinical RVUs CMS 2008 201521
Discounted Utilization File22 CMS Not Used 2014-2015
19 For the Geographic Practice Cost Index dataset, “2014” refers to the fact that the latest GPCI update (i.e., the
Seventh Update) was finalized in the CY 2014 final rule. For the purpose of the CY 2015 MP RVU update, fully-
implemented Seventh Update GPCI values for CY 2015 were utilized, as the Seventh Update GPCI values were
averaged with the Sixth Update GPCI values for CY 2014, 20 For the National PFS Relative Value File dataset, “2015” refers to proposed CY 2015 values. 21 For the Clinical RVUs dataset, “2015” refers to proposed CY 2015 values. 22 The 2015 Discounted Utilization file is used to determine utilization of service codes. The 2014 Discounted
Utilization File is used in calculating budget neutrality. The 2015 utilization file is used on 2015 service codes while
2014 utilization file is used on 2014 service codes.

10 Acumen, LLC | Section 3: Updating the MP RVUs
3.1 Malpractice Premium Data Collection
Acumen collected malpractice data from state departments of insurance, National
Association of Insurance Commissioners (NAIC), and other sources. To collect up-to-date
malpractice premium data for the CY 2015 update of the MP RVUs and construct a new
malpractice premium dataset, Acumen followed several steps, including:
(1) Defining a standard for malpractice policies,
(2) Identifying the medical malpractice underwriters with the larger market shares in each
state,
(3) Collecting the rate filings for MP premiums through state departments of insurance, and
(4) Collecting patient compensation fund (PCF) surcharges.
Subsections 3.1.1 through 3.1.4 explain each step in greater detail.
3.1.1 Step 1: Defining a Standard for Malpractice Policies
The first step of the data collection process identifies the specific characteristics of a
malpractice insurance policy to determine the rate filings to be collected. Malpractice premiums
vary across regions due to a number of factors other than variation in the price of a given level of
coverage. Policy characteristics that affect premiums include: whether the policy is claims made
or occurrence based, the liability limits, years of coverage, and other factors. By collecting
malpractice data for a single malpractice coverage type that is widely used across most regions,
regional variation in malpractice premiums will be due entirely to regional variation in
malpractice premium prices rather than regional variation in the types of coverage practitioners
elect.
The data collection process required malpractice premium rate filings to meet the
following criteria:
Claims-made: Acumen chose claims-made policies because they are the most commonly
used malpractice insurance policies in the United States. Claims-made policy rates were
used rather than occurrence policies. A claims-made policy covers practitioners for the
policy amount in effect when the claim is made, regardless of the date of the event in
question. An occurrence policy covers a practitioner for the policy amount in effect at the
time of the event in question, even if the policy is expired.
1 million/3 million liability (coverage) limits: Acumen chose one million and three
million liability limits because they are the most commonly used liability limits for
medical malpractice insurance policies in the United States. A 1M/3M liability limit
policy means that the most that would be paid on any one claim is $1,000,000 and that
the most that the policy would pay for several claims over the time frame of the policy is
$3,000,000.
Mature rates: Acumen collected mature year rates. Claims-made coverage involves a
step process with premium increases over a set number of years of coverage in

Report on the CY 2015 Update of the MP RVUs for the Medicare PFS | Acumen, LLC 11
increments proportional to the claims reporting for that experience. At the mature year,
premium adjustments are based only on annual rate changes. The number of years that
defines a mature claim differed across insurance companies.
Regional variations: While many rates applied statewide, premiums were adjusted by
geography in some states. Each insurance company reported premium data based upon
territories composed of one or more counties. The number of territories and territory
definitions differed by insurance company and by year. Our dataset broke down company
premium rates to the county level.
3.1.2 Step 2: Identifying the Primary Medical Malpractice Underwriters
In the second step, Acumen identified the top medical malpractice underwriters in each
state based on their 2011 market shares, or share of direct written premiums. Our team used
2011 market shares since 2012 market share reports were generally unavailable. Market share
reports for a given year are typically published after the beginning of the next year. Since our
data collection efforts extended from November 2012 through January 2013, most departments
of insurance had not yet published their 2012 market share data. Whenever possible, our team
identified the primary medical malpractice underwriters in a given state through individual
company level market share data published by state insurance departments (available on state
insurance department websites, the Perr and Knight database,23 or through direct contact with the
state). If market share data were not available from the state, Acumen relied upon an annual
report published by the NAIC.
Market share data from state insurance departments are preferable to market share data
from NAIC because the state market share data are typically more detailed. NAIC generally
reports market share at the group level (i.e., companies with a common NAIC code), whereas
state insurance data often contains market shares for individual insurance companies. In most
cases, the NAIC market share value represented the entire group of underwriters, not just the
individual company of interest. Comparisons of NAIC data with market share data from state
insurance departments revealed that medical malpractice underwriters within the same group
sometimes have vastly different medical malpractice market shares.
The previous update used the NAIC reports as the source for market share data in three-
quarters of the states. For the malpractice GPCI and RVU update, Acumen collected 2011
market share data at the individual company level for all states, the District of Columbia, Puerto
Rico, and Guam. Acumen only needed to supplement these market share data with group-level
market share data for the Virgin Islands. Market share data for American Samoa was not
available through their department of insurance or in the NAIC market share report. In the
previous update, NAIC market share data were used for 37 states, the District of Columbia, and
Puerto Rico. The previous update did not collect data from American Samoa, Guam, or the
23 See https://www.ratefilings.com

12 Acumen, LLC | Section 3: Updating the MP RVUs
Virgin Islands. The third and sixth columns of Table 3.2 show the market share data source by
state/territory.
Table 3.2: Source of Market Share Data and Most Recent Data Collected by State24
State
2011 2012
# of
Companies
Percent
Market Share
Market Share
Source
# of
Companies
Percent
Market Share
Market Share
Source
AL 2 73.29% State 2 73.29% State
AK 2 68.16% PK 2 68.16% PK
AS 0 0.00% Unavailable 0 0.00% Unavailable
AZ 2 92.00% State 2 92.00% State
AR 2 50.41% State 2 50.41% State
CA 3 46.61% State 4 73.21% State
CO 2 61.09% State 2 61.09% State
CT 4 36.56% PK 4 36.56% PK
DE 3 52.31% PK 3 52.31% PK
DC 2 50.48% PK 2 50.48% PK
FL 6 53.29% State 6 53.29% State
GA 4 23.76% PK 4 23.76% PK
GU 0 0.00% State 0 0.00% State
HI 2 51.02% PK 2 51.02% PK
ID 3 70.22% State 3 70.22% State
IL 3 69.86% State 3 69.86% State
IN 3 50.96% PK 3 50.96% PK
IA 3 50.50% State 3 50.50% State
KS 3 61.81% State 3 61.81% State
KY 4 51.23% PK 4 51.23% PK
LA 2 60.21% State 2 60.21% State
ME 2 87.42% State 2 87.42% State
MD 3 55.69% State 3 55.69% State
MA 2 83.01% State 2 83.01% State
MI 3 6.69% State 3 6.69% State
MN 3 8.73% PK 3 8.73% PK
MS 3 5.62% State 4 8.20% State
MO 4 47.55% State 4 47.55% State
MT 4 50.11% State 4 50.11% State
NE 4 60.45% State 4 60.45% State
NV 4 45.74% State 4 45.74% State
NH 4 55.07% State 4 55.07% State
NJ 3 66.47% State 3 66.47% State
NM 3 43.78% PK 3 43.78% PK
NY 3 69.80% NAIC 3 69.80% NAIC
NC 4 55.72% State 4 55.72% State
24 North Carolina and Maryland provided Acumen with rate guides which list premium rates by specialty for
multiple companies.

Report on the CY 2015 Update of the MP RVUs for the Medicare PFS | Acumen, LLC 13
State
2011 2012
# of
Companies
Percent
Market Share
Market Share
Source
# of
Companies
Percent
Market Share
Market Share
Source
ND 0 0.00% State 2 65.60% State
OH 3 51.43% State 3 51.43% State
OK 2 65.05% State 2 65.05% State
OR 2 71.57% State 2 71.57% State
PA 3 25.10% State 3 25.10% State
PR 2 47.02% State 2 47.02% State
RI 2 35.28% PK 2 35.28% PK
SC 3 55.77% State 3 55.77% State
SD 2 87.51% State 2 87.51% State
TN 2 83.15% State 2 83.15% State
TX 4 19.25% State 5 20.39% State
UT 4 89.61% State 4 89.61% State
VT 2 68.24% PK 2 68.24% PK
VI 0 0.00% NAIC 0 0.00% NAIC
VA 3 36.76% State 3 36.76% State
WA 4 66.27% State 4 66.27% State
WV 3 57.44% State 3 57.44% State
WI 3 62.70% State 3 62.70% State
WY 2 82.00% State 2 82.00% State
3.1.3 Step 3: Collecting Malpractice Premium Data
In the third step, Acumen collected rate filings for malpractice insurance premiums
through state departments of insurance. Our team employed both email and telephone outreach
to identify the appropriate contact person and to determine whether data are collected at the state
level. Acumen requested rate filings with effective dates in 2011 and 2012. Our team collected
rate filings with earlier effective dates when 2011 and/or 2012 filings were not available. When
recent rate filings were unavailable, Acumen collected all filings for the companies identified in
the second step with effective dates between 2008 and 2010.
Virtually all state insurance departments have established mechanisms to release rate
filings to the public and required our data collection to follow these established mechanisms.
About sixty percent of the state insurance departments we contacted processed public records
requests internally. For the others, the state insurance departments refer requests to third party
vendors who pull rate filings in person. Therefore, in many states, we were required to hire third
party vendors to pull rate filings, make copies, and ship the documents to Acumen. To obtain
data in unresponsive states and to access more complete data in all states, Acumen also used the
Perr and Knight rate filings database.25 Acumen relied on the Perr and Knight database rate
25See https://www.ratefilings.com

14 Acumen, LLC | Section 3: Updating the MP RVUs
filings exclusively in 7 states, and used the database to supplement the rate filings collected in
the other 43 states and the District of Columbia.26
Compared with the previous update, this update collected rate filings from more states
and territories. While the previous update collected rate filings from 49 states and the District of
Columbia, our team was able to collect rate filings in all 50 states, the District of Columbia, and
Puerto Rico.27 We collected rate filings of companies representing at least 50% of the medical
malpractice market in 36 states and the District of Columbia. In the remaining states and Puerto
Rico, we collected rate filings representing a smaller percentage of the market because rate
filings for the largest companies were unavailable.
Table 3.2 above also lists the number of companies used and the share of the malpractice
insurance market the rate filings from these companies cover for each state. In cases where
Acumen was unable to collect individual company data directly from state insurance
departments, the Perr and Knight database was used for rate filings data. Perr and Knight derives
its data from state insurance departments. All market share calculations in the table are based on
the malpractice insurers’ market share as of 2011.
3.1.4 Step 4: Collecting Patient Compensation Fund Surcharges
In the fourth step, Acumen collected PCF surcharges, which represent an additional cost
to practitioners and surgeons in some states. PCFs are state funds that operate like an excess-
layer of insurance. If a judgment exceeds the practitioner’s primary policy limit, the PCF pays
the amount above the limit (or the amount between the limit and another statutorily-prescribed
amount). PCFs are funded by surcharges (paid directly to the PCF) that practitioners and
hospitals pay in addition to their primary policy premiums. These arrangements give primary
insurers, practitioners, and hospitals an added level of coverage in the event of large judgments.
Eight states have PCFs that charge practitioners a surcharge on top of their primary malpractice
policy premium. In some states participation is mandatory, in others participation is voluntary.
As part of outreach efforts, our team inquired whether or not each state operates a PCF.
For states that responded affirmatively, Acumen requested both the rates for the insurance
company premium and the PCF surcharge. The states that have PCFs are Indiana, Kansas,
Louisiana, Nebraska, New Mexico, Pennsylvania, South Carolina, and Wisconsin. Acumen also
requested background information regarding PCFs, including whether the state’s PCF was
mandatory or voluntary, the private coverage requirements associated with the PCF, and the
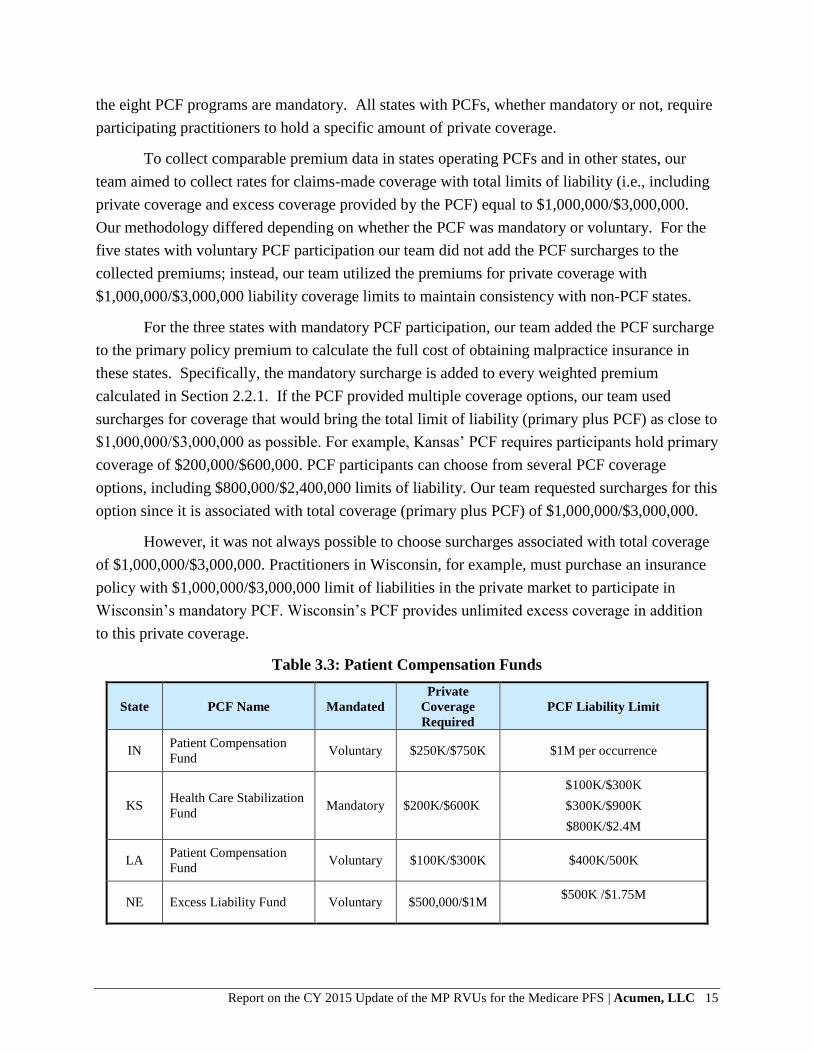
liability limits for the PCF. Table 3.3 summarizes this information for all active PCFs. Three of
26 The Perr and Knight database does not provide rate filings for the four U.S. territories. 27 We were unable to collect rate filings from American Samoa, Guam and Virgin Islands.
Report on the CY 2015 Update of the MP RVUs for the Medicare PFS | Acumen, LLC 15
the eight PCF programs are mandatory. All states with PCFs, whether mandatory or not, require
participating practitioners to hold a specific amount of private coverage.
To collect comparable premium data in states operating PCFs and in other states, our
team aimed to collect rates for claims-made coverage with total limits of liability (i.e., including
private coverage and excess coverage provided by the PCF) equal to $1,000,000/$3,000,000.
Our methodology differed depending on whether the PCF was mandatory or voluntary. For the
five states with voluntary PCF participation our team did not add the PCF surcharges to the
collected premiums; instead, our team utilized the premiums for private coverage with
$1,000,000/$3,000,000 liability coverage limits to maintain consistency with non-PCF states.
For the three states with mandatory PCF participation, our team added the PCF surcharge
to the primary policy premium to calculate the full cost of obtaining malpractice insurance in
these states. Specifically, the mandatory surcharge is added to every weighted premium
calculated in Section 2.2.1. If the PCF provided multiple coverage options, our team used
surcharges for coverage that would bring the total limit of liability (primary plus PCF) as close to
$1,000,000/$3,000,000 as possible. For example, Kansas’ PCF requires participants hold primary
coverage of $200,000/$600,000. PCF participants can choose from several PCF coverage
options, including $800,000/$2,400,000 limits of liability. Our team requested surcharges for this
option since it is associated with total coverage (primary plus PCF) of $1,000,000/$3,000,000.
However, it was not always possible to choose surcharges associated with total coverage
of $1,000,000/$3,000,000. Practitioners in Wisconsin, for example, must purchase an insurance
policy with $1,000,000/$3,000,000 limit of liabilities in the private market to participate in
Wisconsin’s mandatory PCF. Wisconsin’s PCF provides unlimited excess coverage in addition
to this private coverage.
Table 3.3: Patient Compensation Funds
State PCF Name Mandated
Private
Coverage
Required
PCF Liability Limit
IN Patient Compensation
Fund Voluntary $250K/$750K $1M per occurrence
KS Health Care Stabilization
Fund Mandatory $200K/$600K
$100K/$300K
$300K/$900K
$800K/$2.4M
LA Patient Compensation
Fund Voluntary $100K/$300K $400K/500K
NE Excess Liability Fund Voluntary $500,000/$1M $500K /$1.75M

16 Acumen, LLC | Section 3: Updating the MP RVUs
State PCF Name Mandated
Private
Coverage
Required
PCF Liability Limit
NM Patient Compensation
Fund Voluntary $200K/$600K
$400K per occurrence (up to
$600K)
SC Patient Compensation
Fund Voluntary $200K/$600K
$1M/$3M
$2M/$4M
$3M/$6M
$5M/$7M
$10M/$12M
PA
Mcare (Medical Care
Availability and
Reduction of Error)
Mandatory $0.5M/$1.5M $0.5M/$1.5M
WI Patient Compensation
Fund Mandatory $1M/$3M No Limit
3.2 Constructing the Malpractice Premium Data Set
To structure the rate filing information into a dataset for use in developing the MP RVUs,
Acumen developed crosswalks to match rate filing information to CMS data sources. Two
distinct crosswalks were required: specialty and territory. The specialty-crosswalk maps the
specialties listed in the rate filings to specialty codes used in the CMS carrier files. Rather than
select a subset of specialties, Acumen entered premium information for all practitioner and
surgeon and ancillary specialties available in the collected rate filings.
The specialty crosswalk preserved information regarding surgery classes and
categorizations that impact premium rates. For example, many insurance companies classified
general practice practitioners as non-surgical, minor-surgical, or major-surgical, each with
different malpractice premiums. Acumen recorded this information and standardized the data to
CMS carrier codes.
3.3 Adjusting for Missing Data
Missing premium data require alternative strategies. Specifically, Acumen classified
missing data into two types, including (i) premium data missing in the base year or that became
effective mid-year and (ii) no premium data available (i.e., American Samoa, Guam, and Virgin
Islands).
3.3.1 Case 1: Premium Data Missing in Base Year or Became Effective Mid-Year
Our team requested rate filings with effective dates in 2011 and 2012, and whenever
possible, this update uses rates that were in effect on July 1, 2011 and July 1, 2012. However, in
some instances only filings with earlier or later effective dates were available. For most states,
rate filings do not have to be submitted on a regular schedule. Therefore, rate filings can become
effective midyear and/or remain effective for more than one year. The methodology considers a

Report on the CY 2015 Update of the MP RVUs for the Medicare PFS | Acumen, LLC 17
rate to be in effect from its effective date until the effective date of a replacement rate from a
more recent filing. For example, the 2011and 2012 periods, respectively, could be represented by
a filing from January 2010 replaced by one in September 2011.
When recent rate filings were unavailable, it was generally for one or more of the
following reasons: (i) the company in question may not have changed its medical malpractice
rates recently, (ii) the state in question may have flexible rate filings requirements, and/or (iii)
the company in question may be a not-for-profit or risk retention group (RRG).28 These three
cases have different implications for the accuracy of premium rates reported in older filings. The
first case arises because underwriters are often not required to file if rates are unchanged from
the previous rate filing. In this case, the most recent filing accurately represents current premium
rates, even if the most recent filing has an effective date before 2011. The second and third cases
arise because some underwriters are not required to file rates, even when rates have changed. In
these two cases, the most recent filing does not necessarily accurately represent current premium
rates. However, since it is not possible to distinguish between the first case and the second and
third cases, our methodology does not make adjustments to premiums filed prior to 2011. This
methodology is consistent with past updates.
3.3.2 Case 2: No Premium Data Available from Rate Filings
Acumen’s outreach efforts included the four U.S. territories; however we were not able to
collect premium data from American Samoa, Guam, or the Virgin Islands. Though our team
attempted to contact American Samoa several times, they were unresponsive. Guam provided
market share data, but had only recently developed an organized system to categorize rate filings.
Since the largest medical malpractice companies in Guam had not filed recently, Guam was not
able to provide rate filings for the companies of interest. Virgin Islands informed us they do not
provide rate filings to the public.
3.4 Defining Specialties
Equation (2.3) assumes a straightforward definition of specialties, using the CMS carrier
specialty codes listed in Table 3.4. In practice, there are two challenges to defining specialties
for use in the MP RVUs based on the rate filings received by various carriers. First, there are
only a few specialties that are only rarely distinguished from a general practitioner category or
are otherwise not included in the malpractice rate filings. Second, there are a number of
specialties for which some insurance carriers distinguish classes within the specialty, typically
major surgery, minor surgery, no surgery, and obstetrics/no obstetrics. Commonly, some carriers
have class distinctions for a specialty while other carriers do not specify classes for the same
28 RRGs are a form of self-insurance. Whereas typical insurance companies are owned by outside investors, RRGs
are owned by the policyholders.

18 Acumen, LLC | Section 3: Updating the MP RVUs
specialty. In both of these cases, Acumen’s goal is to keep as complete a list of specialties as
possible, but ensure that the risk factors for the specialties are based on a robust set of data.
Appendix B provides summary data before and after MP RVU calculations for each surgery
class – specialty combination using the methodology described in this section.
Table 3.4: Number of State Rate Filings Collected for Each Specialty29
Specialty Code Specialty Name % of Total MTUS States
01 General Practice 0.57 48
02 General Surgery 1.09 50
03 Allergy Immunology 1.21 49
04 Otolaryngology 1.38 50
05 Anesthesiology 0.57 49
06 Cardiology 6.83 50
07 Dermatology 3.91 50
08 Family Practice 8.07 50
09 Interventional Pain Management* 0.39 23
10 Gastroenterology 1.28 49
11 Internal Medicine 12.46 50
12 Osteopathic Manipulative Medicine* 0.05 6
13 Neurology† 1.24 50
14 Neurosurgery† 0.23 24
16 Obstetrics Gynecology 0.57 50
17 Hospice and Palliative Care* 0.02 8
18 Ophthalmology 4.34 50
19 Oral Surgery (dental only) * 0.02 7
20 Orthopedic Surgery 2.71 50
22 Pathology 2.18 50
23 Sports Medicine* 0.04 10
24 Plastic and Reconstructive Surgery 0.17 49
25 Physical Medicine and Rehabilitation 1.18 48
26 Psychiatry 1.54 49
28 Colorectal Surgery (formerly Proctology) 0.07 43
29 Pulmonary Disease 1.80 50
30 Diagnostic Radiology 9.44 49
33 Thoracic Surgery 0.10 48
34 Urology 1.61 50
35 Chiropractic* 1.98 32
36 Nuclear Medicine 0.07 44
37 Pediatric Medicine 0.08 50
38 Geriatric Medicine 0.24 41
39 Nephrology 1.55 43
40 Hand Surgery 0.12 48
41 Optometry** 1.15 36
44 Infectious Disease 0.67 41
46 Endocrinology 0.45 41
29 Independent risk factors are not calculated for specialties with an asterisk, or dagger.

Report on the CY 2015 Update of the MP RVUs for the Medicare PFS | Acumen, LLC 19
Specialty Code Specialty Name % of Total MTUS States
48 Podiatry 2.99 44
60 Public Health or Welfare Agency* 0.01 11
62 Psychologist* 0.02 6
65 Physical Therapist* 7.87 2
66 Rheumatology 0.62 43
67 Occupational Therapist* 0.54 19
71 Registered Dietitian/Nutrition
Professional** 0.05 38
72 Pain Management* 0.22 33
77 Vascular Surgery 0.43 46
78 Cardiac Surgery 0.09 48
79 Addiction Medicine* 0.01 12
81 Critical Care (Intensivists) 0.22 35
82 Hematology 0.09 36
83 Hematology/Oncology* 1.68 17
84 Preventive Medicine 0.02 42
85 Maxillofacial Surgery* 0.01 19
90 Medical Oncology 0.49 41
91 Surgical Oncology* 0.03 25
92 Radiation Oncology 1.14 46
93 Emergency Medicine 2.52 49
94 Interventional Radiology* 0.21 34
97 Physician Assistant** 1.70 43
99 Unknown Physician Specialty* 0.01 38
C0 Sleep Medicine* 0.01 8
† Specialties with a dagger are partially blended with a similar specialty with a dagger to create a
single major surgery risk class and separate non-surgery risk classes; these specialties and the partial
blending methodology are discussed further in Section 3.4.3.
* Specialties with one asterisk are reassigned to similar specialties due to insufficient State coverage
(i.e., fewer than 35 States).
** Specialties with two asterisks are reassigned to similar specialties due to extreme variation in
premium amounts. These specialties are discussed further in Section 3.4.1.
3.4.1 Specialties with Insufficient Coverage, No State Coverage, and Extreme Variation in Premium Amounts
Although Acumen’s outreach efforts collected premium data from all states, some
specialties do not have distinct risk categories in the rate filings from all states. As shown in
Table 3.4, 18 specialties that are coded on the carrier claims were included in rate filings in
fewer than 35 States and 3 specialties had extreme variations in premium amounts. This
methodology leaves 41 specialties, for which we used the malpractice premium data to develop
specialty risk factors.
For practitioner-provided specialties with insufficient state coverage in the MP file,
Acumen matched these specialties to a similar specialty – conceptually or by reported premiums

20 Acumen, LLC | Section 3: Updating the MP RVUs
– for which data are available. These specialties are denoted with an asterisk in Table 3.4. For
example, some of the low-cost specialties (e.g., Addiction Medicine, Clinical Psychologist) are
assigned to the lowest practitioner cost risk factor (Allergy/Immunology).
Similarly, for practitioner-provided specialties with extreme variation in premium
amounts, Acumen also matched these specialties to the Allergy/Immunology specialty, the
specialty with the lowest practitioner professional liability insurance premium for which we had
sufficient and reliable data. These specialties are denoted with two asterisks in Table 3.4; there
are three specialties denoted with two asterisks. First, the Registered Dietician/Nutrition
Professional specialty premium amounts ranged from $85 to $20,813 (a 24,259 percent
difference). Second, the Physician Assistant specialty premium amounts ranged from $614 to
$35,404 (a 5,665 percent difference. Third, the Optometry specialty premium amounts ranged
from $189 to $10,798 (a 5,614 percent difference).
Additionally, Acumen’s outreach efforts did not obtain malpractice premium data for 28
specialties. There are 14 specialties types with utilization under the PFS for which no premium
data were collected that are matched to a similar specialty. There are 6 specialties that are
assigned the Technical Component risk factor described in Section 3.5. The remaining 8
specialties are dropped.
Table 3.5 lists the recoded specialties discussed in this subsection. The 14 specialties for
which no premium data were collected that are matched to a similar specialty are denoted with
an asterisk in Table 3.4. Table 3.6 lists the six specialties assigned the TC risk factor. The
remaining categories are dropped, meaning they are not included in the weighted averages for
calculating the MP RVUs.
Table 3.5: Reassigned Specialties with Insufficient State Coverage, No State Coverage, and
Extreme Variation in Premium Amounts
Specialty
Code Specialty Name
New
Specialty
Code
New Specialty Name
09 Interventional Pain Management 05 Anesthesiology
12 Osteopathic Manipulative Medicine 03 Allergy Immunology
15 Speech Language Pathology* 03 Allergy Immunology
17 Hospice and Palliative Care 03 Allergy Immunology
19 Oral Surgery (dental only) 24 Plastic and Reconstructive Surgery
21 Cardiac Electrophysiology* 06 Cardiology
23 Sports Medicine 01 General Practice
27 Geriatric Psychiatry* 26 Psychiatry
32 Anesthesiologist Assistant* 05 Anesthesiology
35 Chiropractic 03 Allergy Immunology
41 Optometry 03 Allergy Immunology
42 Certified Nurse Midwife* 16 Obstetrics Gynecology
43 Certified Registered Nurse Anesthetist
(CRNA)*
05 Anesthesiology

Report on the CY 2015 Update of the MP RVUs for the Medicare PFS | Acumen, LLC 21
Specialty
Code Specialty Name
New
Specialty
Code
New Specialty Name
50 Nurse Practitioner* 01 General Practice
60 Public Health or Welfare Agency 03 Allergy Immunology
62 Psychologist 03 Allergy Immunology
64 Audiologist* 03 Allergy Immunology
65 Physical Therapist 03 Allergy Immunology
67 Occupational Therapist 03 Allergy Immunology
68 Clinical Psychologist* 03 Allergy Immunology
71 Registered Dietitian/Nutrition Professional 03 Allergy Immunology
72 Pain Management 05 Anesthesiology
76 Peripheral Vascular Disease* 77 Vascular Surgery
79 Addiction Medicine 03 Allergy Immunology
80 Licensed Clinical Social Worker* 03 Allergy Immunology
83 Hematology/Oncology 90 Medical Oncology
85 Maxillofacial Surgery 24 Plastic and Reconstructive Surgery
86 Neuropsychiatry* 26 Psychiatry
89 Certified Clinical Nurse Specialist* 01 General Practice
91 Surgical Oncology 02 General Surgery
94 Interventional Radiology 30 Diagnostic Radiology
97 Physician Assistant 03 Allergy Immunology
98 Gynecological/Oncology 02 General Surgery
99 Unknown Physician Specialty 01 General Practice
C0 Sleep Medicine 01 General Practice
* Denotes the specialty for which no premium data were collected that are matched to a similar
specialty.
Table 3.6: TC Specialties Assigned TC-only Risk Factor
CMS Specialty Code CMS Specialty Name
45 Mammography Screening Center
47 Independent Diagnostic Testing Facility (IDTF)
63 Portable X-Ray Supplier (Billing Independently)
69 Clinical Laboratory (Billing Independently)
74 Radiation Therapy Centers
75 Slide Preparation Facilities
3.4.2 Specialties with Surgery and Obstetrics Classes
A more complicated issue is the fact that over half of the listed specialties can have
premium rates that differ for major surgery, minor surgery, no surgery, and obstetrics. These
classes are designed to reflect differences in risk of professional liability and the cost of
malpractice claims if they occur. The same concept applies to procedures, as some procedures
carry greater liability risks. These liability risks are grouped by surgery, no surgery, and
obstetrics as shown in Table 3.7. Surgery CPTs range from 10000-69999, and also include a list
of G codes and cardiology surgical codes provided by CMS that are outside of the 10000-69999
CPT range. Codes ranging from 59000-59899 identify procedures grouped into the Obstetrics
risk category. All remaining CPT codes are treated as no-surgery risk. With risk varying within

22 Acumen, LLC | Section 3: Updating the MP RVUs
specialty and procedures, the calculation of Equation (2.7) requires distinguishing between
surgical, non-surgical, and obstetrics premiums for the creation of specialty risk factors, which,
in turn, are applied to surgical, non-surgical, and obstetrics procedures in Equation (2.9).
Table 3.7: HCPCS Code Surgery Classes
Surgery Class HCPCS Codes
Surgery 10000-69999, invasive cardiology codes treated as surgery
and surgical G codes30
Obstetrics (OB) 59000-59899
No Surgery (NS) All Other CPT Codes
Consistent with the methodology under current regulation, Acumen does not distinguish
risk between major and minor surgery premium categorizations. Instead, only major surgery
premiums are used to calculate distinct surgery risk factors when there are sufficient major
surgery premium filings. For specialties with distinct surgery and non-surgery risk factors, as well
as substantial data for each surgery class, surgery risk factors are applied to CPT codes in the 10000-
69999 range codes, cardiology surgical codes provided by CMS and on the list of G codes. The non-
surgery risk factors are applied to all other non-surgical and non-obstetrics codes. In instances
where specialties are dominated by surgery classes, only surgery risk factors are applied to CPT
codes. When specialties in which the unspecified class dominates the surgery and non-surgery
classes, the unspecified risk factor is applied to the CPT codes. For all other CPT codes, all
available premium data for a specialty are blended into a single risk class applicable to the
corresponding CPT codes. Specifically, the risk factor is calculated as a weighted average based
on the percentage of PW RVUs for each surgery class. For example, rheumatology has a single,
blended risk factor calculated from surgery, non-surgery, and unspecified class premiums, which
is applied to all procedures. Table 3.8 below summarizes the specialty codes that fall under each
of these four scenarios.
Table 3.8: Surgery Class Specialty Situations
Situation Specialty Codes
1. Substantial Data for Each Class 01, 04, 06, 07, 08 (non-OB), 10, 13, 18, 34, 38, 39, 46, 93
2. Major Surgery Dominates 02, 14, 20, 24, 28, 33, 40, 77, 78
3. Unspecified Dominates 03, 05, 16 (non-OB), 25, 26, 36, 81
4. Blend All Available 11, 22, 29, 30, 37, 44, 48, 66, 82, 84, 90, 92
3.4.3 Neurosurgery
The Neurology and Neurosurgery specialties are partially blended to create a single
surgery risk class. A separate non-surgery risk class is also created for the Neurology specialty.
For the CY 2010 update, independent risk factors were calculated for both the Neurology and
Neurosurgery specialties because both specialties had sufficient State coverage. For the CY
30 Appendix C shows surgical cardiology codes and surgical G codes outside of the 10000-69999 CPT range.

Report on the CY 2015 Update of the MP RVUs for the Medicare PFS | Acumen, LLC 23
2015 update, however, the Neurosurgery specialty recorded rate filings in fewer than 35 States.
Instead of reassigning the Neurosurgery specialty to Neurology using the methodology described
in Section 3.4.1, these specialty types are partially blended, given the close relationship between
the two specialties. Specifically, in the partial blending methodology, only the available major
surgery premiums are weighted based on the total PW RVUs associated with each specialty
using the CRS file. From this point, a single surgical risk factor for both Neurology and
Neurosurgery is calculated as a weighted average based on the percentage of PW RVUs for the
major surgery class. As shown in Table 3.8, Neurosurgery (Specialty Code 14) falls under the
situation where major surgery dominates; as a result, only the blended surgical risk factor is
applied to the CPT codes. Neurology, on the other hand, has substantial data for each surgery
class, as shown in Table 3.8. Accordingly, the blended surgical risk factor is applied to surgical
CPT codes, and a separate non-surgical risk factor is applied to all other non-surgical and non-
obstetrics codes.
3.5 Updating the Technical Component Data
CPT data are distinguished as professional component (PC), technical component (TC),
or global data by modifiers (MOD) and PC/TC indicators according to the NPFS file.
Professional and technical component modifiers were established for some services to
distinguish the portions of services furnished by practitioners. The professional component
includes the practitioner work and associated overhead and malpractice insurance costs involved
in technical services. The technical component includes the cost of equipment, supplies,
technician salaries, and malpractice insurance for procedures. Unmodified CPTs are called
global data and refer to both components when billed together. Table 3.9 summarizes the
differences among professional, technical, and global CPT data. Note that whereas the MOD
variable for the technical component is “TC,” the MOD variable for the professional component
is “26.”
Table 3.9: Distinction among Professional, Technical, and Global CPT Data
Professional Component Technical Component Global
MOD Variable 26 TC None
PC/TC Indicator 2 3 All Other
Description
Practitioner work,
overhead, and
professional liability
Equipment, supplies,
technical salaries, and
liability
PC and TC billed together
The distinction among PC, TC, and global data is important because each modifier has
different associated risk factors. As discussed in Section 2.2, these risk factors distinguish
relative malpractice liability risk associated with procedures based on the specialties of the
practitioners who perform given services. The challenge is determining the associated risk factor
for each modified CPT. Consistent with the CY 2010 update, the collected malpractice premium

24 Acumen, LLC | Section 3: Updating the MP RVUs
data are determined by CMS to represent global data, yielding the Global risk factor (Global
RFCPT).
The methodology to determine modified risk factors starts with the premise that the
global MP RVU for a given CPT (Global MP RVUCPT) equals the sum of the PC MP RVU for
that CPT (MP RVUCPT/26) and the TC MP RVU for that CPT (MP RVUCPT/TC) as shown below in
Equation (3.1):
(3.1) .
/26 / CPT CPT CPT TCGlobal MP RVU MP RVU MP RVU
Table 3.10 shows the MOD, PW RVU, and MP RVU values for CPT 74175 as an example. The
first column lists the CPT code, and the second column lists the associated MOD. The third
column presents a description of the CPT code, and the fourth column lists the PW RVU
associated with each CPT/MOD. The fifth column lists the final, calculated MP RVUs for the
PC/TC group. As described in Equation (3.1), the MP RVU for the TC MOD (MP RVU74175/TC =
0.02) and the MP RVU for the 26 MOD (MP RVU74175/26 = 0.09) add up to the unspecified MOD
global MP RVU (Global MP RVU74175 = 0.11).
Table 3.10: Example CPT Code with Modifiers
CPT MOD Description PW RVU MP RVU
74175 Ct angio abdom w/o & w/ dye 1.9 0.11
74175 26 Ct angio abdom w/o & w/ dye 1.9 0.09
74175 TC Ct angio abdom w/o & w/ dye 0.0 0.02
The challenge in calculating the MP RVUs for the 26 MOD and TC MOD in the fifth
column of Table 3.10 is that there are two missing pieces of data: the PC risk factor – since the
risk factors calculated according to Section 2.2.2 are assumed to correspond to the global risk
factors – and any PW RVUs to associate with the TC as required in Equation (2.8) in Section
2.2. Note that there is no PW RVU for the TC MOD. Because the calculation of a MP RVU in
the fifth column requires a PW RVU according to Equation (2.8), the MP RVU for the TC MOD
cannot be directly calculated. The lack of a PW RVU is addressed by the rule discussed in
Section 2.2 where the greater of the PW RVU or clinical RVU is used to calculate CPT risk. In
this case of TC CPTs, the clinical RVU is always used. The calculation of a MP RVU in the
fifth column also requires a risk factor according to Equation (2.8). Mean premium data
supplied by the Radiology Business Management Association (RBMA) for “umbrella non-
physician malpractice liability” are utilized. The premiums are treated as identical for all TC
modifiers using a risk factor that accounts for minor differences by geographic area; as a result,
the TC risk factor is identical across CPT codes and is calculated using the equivalent of
Equation (2.7):

Report on the CY 2015 Update of the MP RVUs for the Medicare PFS | Acumen, LLC 25
(3.2)
where RFTC is the TC risk factor, Norm PTC is the normalized national average TC premium, and
Norm PLowest is the lowest normalized national average premium. For the CY 2015 update, the
Norm PTC utilized is the Norm PTC established by RBMA data for the CY 2010 update ($9,374)
deflated by 20.41 percent (approximately $7,461), which amounts to the percent change in
average non-surgical premiums between the 2006-2007 rate filings utilized in the CY 2010
update and the 2011-2012 rate filings utilized in the CY 2015 update. The average non-surgical
premiums for the 2006-2007 period and the 2011-2012 period are $18,538 and $14,754,
respectively. As the denominator in Equation (3.2) refers to the lowest physician professional
liability insurance premium (Allergy Immunology), the TC group shows a risk factor of 0.91
On the other hand, while the PW RVU can be applied for the calculation of the MP RVU
for the 26 MOD, PC specialty risk factors cannot directly be derived from premiums. Because
the risk factors calculated according to Section 2.2.2 are assumed to correspond to the global risk
factors, one of the terms on the right hand side of Equation (2.8) is missing. The PC risk factor,
then, is derived from the TC and Global CPT risk factors. With the necessary components for
calculating raw TC MP RVUs established, the remaining value required to calculate PC MP
RVUs can be derived. Consistent with the CY 2010 update, the global data is defined as
equivalent to the sum of the PC and TC data for any given CPT code. Accordingly, the risk
factor for the global code is equal to the sum of the risk factors for the TC and PC. As a result,
the PC risk factor for a CPT is equal to the difference between the global risk factor for that CPT
and the TC risk factor as shown in Equation (3.3):
(3.3)
where is the PC risk factor for a given CPT, Global RFCPT is the global risk factor for
that CPT, and RFTC is the TC risk factor calculated in Equation (3.2).
Since the Global RFCPT is derived using the basic approach described in Section 2.2, the
RFTC can be plugged into Equation (3.3) to get the PC risk factor ( ). The PC MP RVUs
can then be calculated using the standard formula from Equation (2.8), repeated as Equation
(3.4) below, for the PC. As discussed in Section 2.2, unadjusted MP RVUs are the products of
specialty risk factors and PW RVUs.
(3.4) .
Per CMS instructions, Acumen imposes a floor value of 0.01 for all MP RVUs. Due to
restrictions on the relationship between PC, TC, and Global MP RVUs, the imposition can
require a recalculation of Global MP RVUs. For example, after the raw MP RVUs are budget
TCTC
Lowest
Norm PRF
Norm P
,26 CPT CPT TCRF Global RF RF
RFCPT,26
RFCPT,26
,26 ,26 ,26 CPT CPT CPTRaw MP RVU RF PW RVU

26 Acumen, LLC | Section 3: Updating the MP RVUs
neutralized, imposing the floor equally across CPT 92587 along with TC and PC modifiers leads
to all showing a value of 0.01 because each individually show an actual value of 0.01. Equation
(3.3) does not hold true in this example because the components no longer sum to the Global. To
ensure that Equation (3.3) holds true, the floor is applied to the just the PC and TC modifiers.
For cases where the imposition of the floor changes one of these values, the Global component is
recalculated as the sum of the TC and PC component. Because the application of the floor and
the restriction under Equation (3.3) affects budget neutrality, a second round of budget
neutralization is applied.
3.6 Service Codes without Utilization
For new or revised services lacking utilization, listed in Appendix D, Acumen applied a
crosswalk created by CMS that assigns the risk factor of a code with a similar specialty mix.
Existing services that lacked utilization received the weighted average risk factor of all service
codes. The average weighted risk factor of all service codes is 2.11.
3.7 Service Codes with Crosswalked MP RVUs
Acumen applied a crosswalk created by CMS that assigns to several service codes the CY
2015 MP RVU values of other service codes to maintain consistency with the PE RVU
methodology. Appendix E provides a list of service codes which were assigned the CY 2015
MP RVU values of other service codes.
3.8 CMS Data Update
In addition to malpractice premiums data, the CY 2015 update of the MP RVUs also
relies on six additional datasets that CMS owns and maintains, including the LRS, CRS, GPCI,
NPFS, Clinical RVUs files and 2015 and 2014 Discounted Utilization files; the remainder of this
section describes each dataset in detail. Table 2.1 provides more details about the observation
level and role of each dataset in calculating the MP RVUs.
3.8.1 Locality RVUs and Services (LRS) File
The LRS file contains information on RVUs (total, PW, PE, and MP) and service counts
(MTUS) at the Carrier Number, ZIP code, Locality, and County levels. The MP RVU
methodology uses the LRS file to weigh county-level malpractice premiums and to create the
geographic normalization factor (see Section 2.2). Whereas the CY 2010 update relied on 2008
data, the CY 2015 update relies on 2013 LRS data.31
31 The LRS file is not available for public download but can be obtained from CMS through a Data Use Agreement
(DUA).

Report on the CY 2015 Update of the MP RVUs for the Medicare PFS | Acumen, LLC 27
3.8.2 Current Procedural Terminology RVUs and Services (CRS) File
The CRS file includes information on RVUs (total, PW, PE, and MP) and service counts
(MTUS) at the Carrier Number, Locality, County, Specialty, and CPT/MOD levels. The MP
RVU methodology uses the CRS file to weigh the blended specialties by their respective PW
RVU (see Section 2.2). In the CY 2010, the utilization count in the CRS file was also used to
weigh the specialty risk factor. In the current update, this is replaced by the 2015 utilization file
(see Section 3.6.2). The CY 2015 update relies on 2013 CRS data.32
3.8.3 Geographic Practice Cost Index (GPCI) File
The GPCI file provides information on the PW, PE, and MP GPCI values assigned to
each Medicare locality. The MP RVU methodology uses the GPCI file to adjust the malpractice
premiums for geographic differences in professional liability costs (see Section 2.2.1). Whereas
the CY 2010 update relied on 2008 GPCI data, the CY 2015 update relies on 2014 GPCI data. 33
Note that “2014” refers to the fact that the latest GPCI update (i.e., the Seventh Update) was
finalized in the CY 2014 final rule. For the purpose of the CY 2015 MP RVU update, fully-
implemented Seventh Update GPCI values for CY 2015 were utilized, as the Seventh Update
GPCI values were averaged with the Sixth Update GPCI values for CY 2014,
3.8.4 National PFS Relative Value (NPFS) File
The NPFS file contains information on services covered by the proposed CY 2015
Medicare Physician Fee Schedule (MPFS). For more than 10,000 practitioner services, the file
contains the associated relative value units (RVUs), a fee schedule status indicator, and various
payment policy indicators needed for payment adjustment (i.e., payment of assistant at surgery,
team surgery, bilateral surgery, etc.). The MP RVU methodology uses the NPFS file to classify
CPT data as professional component (PC), technical component (TC), or global data by
modifiers (MOD) and PC/TC indicators (see Section 3.5). Whereas the CY 2010 update relied
on 2008 NPFS data, the CY 2015 update relies on proposed 2015 NPFS data.34
3.8.5 Clinical RVUs File
The Clinical RVUs file contains information on the facility PW clinical RVUs and non-
facility PE clinical RVUs associated with a range of HCPCS service codes. As discussed in
Section 2.2.3, the MP RVU methodology uses the Clinical RVUs file to determine the associated
risk factor for each modified CPT if the Clinical RVU for a procedure is higher than the PW
32 The CRS file is not available for public download but can be obtained from CMS through a DUA. 33 The GPCI file for CY 2014 can be downloaded here: http://www.cms.gov/Medicare/Medicare-Fee-for-Service-
Payment/PhysicianFeeSched/PFS-Federal-Regulation-Notices-Items/CMS-1600-FC.html 34 The NPFS file for CY 2015 can be downloaded here: http://www.cms.gov/Medicare/Medicare-Fee-for-Service-
Payment/PhysicianFeeSched/PFS-Relative-Value-
Files.html?DLSort=0&DLPage=1&DLSortDir=descendingRVY14A.zip

28 Acumen, LLC | Section 3: Updating the MP RVUs
RVU. Whereas the CY 2010 update relied on 2008 Clinical RVUs data, the CY 2015 update
relies on the proposed 2015 Clinical RVUs data.35
3.8.6 2014 and 2015 Discounted Utilization Files
The 2014 and 2015 Discounted Utilization files contain information on service counts
(MTUS) at the specialty, and CPT/MOD levels. The MP RVU methodology uses the 2015
Discounted Utilization file to weigh specialty risk factors and to determine low volume services
(see Section 2.2.3). The 2014 Discounted Utilization file is used in the MTUS count of the
numerator of the budget neutralization factor while the 2015 utilization files is used in the
denominator (see Section 2.2.4).
35 CMS directly provided Acumen the Clinical RVUs for CY 2015.
Report on the CY 2015 Update of the MP RVUs for the Medicare PFS | Acumen, LLC 29
4 IMPACT OF THE CY 2015 UPDATE
This section summarizes the impact of the CY 2015 update to the MP RVUs for 8,853
procedures (defined by CPT/MOD codes). Similar to the impacts presented in Acumen’s report
on the CY 2010 update to the MP RVUs, Acumen did not apply the 5 percent threshold for
inclusion of services or specialties; rather, Acumen used the risk factor of the dominant specialty
by services for each procedure with MTUS less than 100. This approach reflects the risk factors
of the specialties that most frequently perform the procedure and avoids skewing from weighting
specialties that rarely perform the procedure. Therefore, this threshold includes all specialties for
which Acumen has services and risk factors for each CPT code, even if the CPT provides fewer
than 100 or less than 5 percent of the services.
4.1 Overall Impact and Impact by CPT Code Type
To describe the MP RVU update, we present both descriptive statistics on the levels of
the updated MP RVU values for 2015 and the percent changes in these values relative to the
values in effect for 2014. These distributions are presented overall, broken down by modifier
(Technical, Professional, Global, Single), and broken down by surgical class (Surgical, Surgical
with Obstetrics, and Non-Surgical).
4.1.1 Average MP RVUs and Distribution of MP RVUs
Table 4.1 presents the distribution of the updated MP RVUs. The first row contains the
count of number of the procedures overall in the All column and by category in the Technical,
Professional, Global, and Single columns. The distinctions among these procedure code types is
discussed in Section 3.5 above.
The distribution over all updated MP RVU values is in the first numeric column. The
(MTUS weighted) average MP RVU value is 0.09 while the unweighted mean is 1.39. More
than 10 percent of MP RVU values reside at their floor value of 0.01, and they range as high as
26.50, with a standard deviation of 2.44. Single CPTs show the highest weighted mean, at 0.11
while Technical CPTs show the lowest, at 0.01. Though the Global CPTs are the sum of their
PC and TC components, the highest PC component does not have an associated Global CPT,
thus is above the highest Global value.
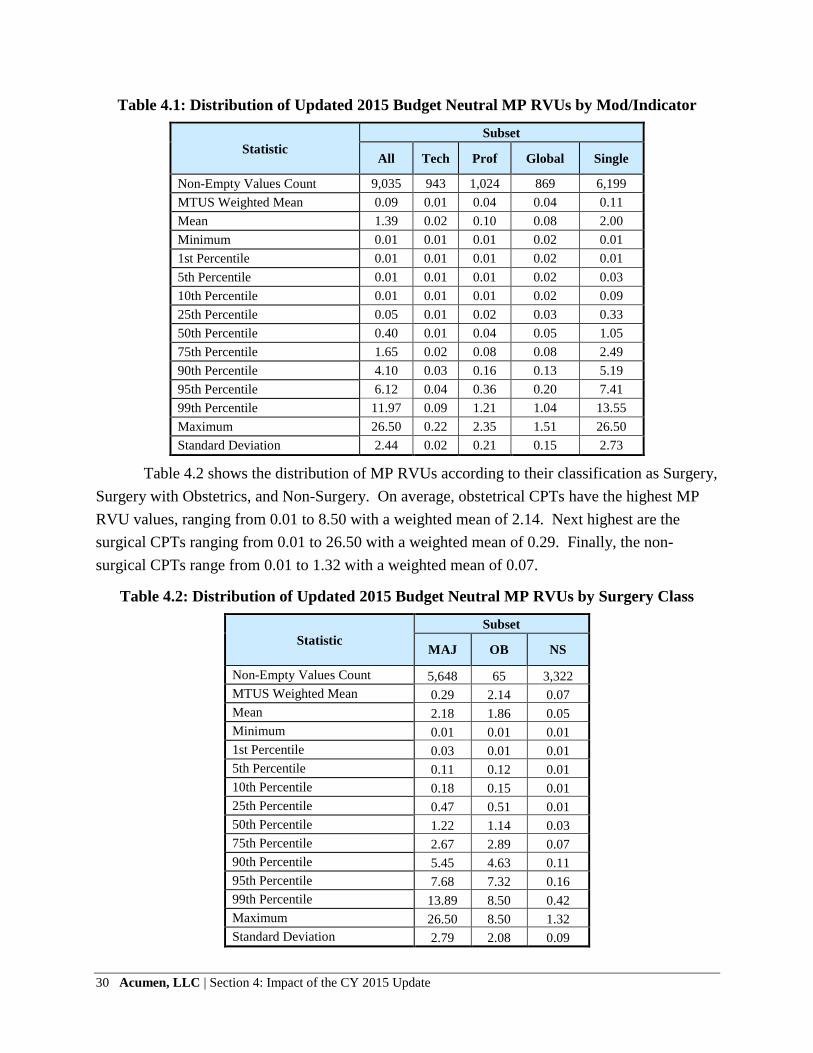
30 Acumen, LLC | Section 4: Impact of the CY 2015 Update
Table 4.1: Distribution of Updated 2015 Budget Neutral MP RVUs by Mod/Indicator
Statistic
Subset
All Tech Prof Global Single
Non-Empty Values Count 9,035 943 1,024 869 6,199
MTUS Weighted Mean 0.09 0.01 0.04 0.04 0.11
Mean 1.39 0.02 0.10 0.08 2.00
Minimum 0.01 0.01 0.01 0.02 0.01
1st Percentile 0.01 0.01 0.01 0.02 0.01
5th Percentile 0.01 0.01 0.01 0.02 0.03
10th Percentile 0.01 0.01 0.01 0.02 0.09
25th Percentile 0.05 0.01 0.02 0.03 0.33
50th Percentile 0.40 0.01 0.04 0.05 1.05
75th Percentile 1.65 0.02 0.08 0.08 2.49
90th Percentile 4.10 0.03 0.16 0.13 5.19
95th Percentile 6.12 0.04 0.36 0.20 7.41
99th Percentile 11.97 0.09 1.21 1.04 13.55
Maximum 26.50 0.22 2.35 1.51 26.50
Standard Deviation 2.44 0.02 0.21 0.15 2.73
Table 4.2 shows the distribution of MP RVUs according to their classification as Surgery,
Surgery with Obstetrics, and Non-Surgery. On average, obstetrical CPTs have the highest MP
RVU values, ranging from 0.01 to 8.50 with a weighted mean of 2.14. Next highest are the
surgical CPTs ranging from 0.01 to 26.50 with a weighted mean of 0.29. Finally, the non-
surgical CPTs range from 0.01 to 1.32 with a weighted mean of 0.07.
Table 4.2: Distribution of Updated 2015 Budget Neutral MP RVUs by Surgery Class
Statistic
Subset
MAJ OB NS
Non-Empty Values Count 5,648 65 3,322
MTUS Weighted Mean 0.29 2.14 0.07
Mean 2.18 1.86 0.05
Minimum 0.01 0.01 0.01
1st Percentile 0.03 0.01 0.01
5th Percentile 0.11 0.12 0.01
10th Percentile 0.18 0.15 0.01
25th Percentile 0.47 0.51 0.01
50th Percentile 1.22 1.14 0.03
75th Percentile 2.67 2.89 0.07
90th Percentile 5.45 4.63 0.11
95th Percentile 7.68 7.32 0.16
99th Percentile 13.89 8.50 0.42
Maximum 26.50 8.50 1.32
Standard Deviation 2.79 2.08 0.09

Report on the CY 2015 Update of the MP RVUs for the Medicare PFS | Acumen, LLC 31
4.1.2 Percentage Change in MP RVUs
Since the update affects each CPT code, it is useful to consider the distribution of
changes in MP RVU values between the CY 2010 and CY 2015 updates. This information is
presented in Table 4.3. Over all codes, MP RVUs increase by one percent with the highest
average increase occurring for Technical CPTs at 8 percent and with a decrease of 5 percent for
Global codes. There were a number of codes which experienced large percentage increases or
decreases. For the most part, these codes had very small MP RVU values in the previous update,
which means that even modest absolute changes in their values in this update caused large
percentage changes.
Table 4.3: Percent Change in MP RVUs across CPT Codes by Mod/Indicator
Statistic
Subset
All Tech Prof Global Single
Non-Empty Values Count 8,857 916 997 842 6,102
MTUS Weighted Mean 1% 8% 1% -5% 1%
Mean 1% 12% 9% 6% -3%
Minimum -96% -91% -96% -92% -96%
1st Percentile -74% -67% -75% -60% -73%
5th Percentile -51% -25% -67% -43% -56%
10th Percentile -31% 0% -34% -26% -31%
25th Percentile -11% 0% -15% -13% -12%
50th Percentile 0% 0% 0% 0% -3%
75th Percentile 4% 0% 0% 13% 4%
90th Percentile 20% 99% 99% 49% 11%
95th Percentile 62% 99% 99% 79% 22%
99th Percentile 189% 99% 268% 179% 166%
Maximum 622% 398% 622% 353% 597%
Standard Deviation 42% 38% 61% 42% 38%
In Table 4.4, the change in MP RVUs according to whether the CPT code was classified
as Surgery, Surgery with Obstetrics, or Non-Surgical is reported. Surgical and obstetric CPTs
saw declines, on average, of 7 percent in their MP RVUs while non-surgical codes saw an
increase of 2 percent, on average. At the median, MP RVU values declined for surgical and
obstetric CPTs, with the largest decline for obstetrics.

32 Acumen, LLC | Section 4: Impact of the CY 2015 Update
Table 4.4: Percent Change in MP RVUs across CPT Codes by Surgery and Obstetrics
Class
Statistic
Subset
MAJ OB NS
Non-Empty Values Count 5,577 65 3,215
MTUS Weighted Mean -7% -7% 2%
Mean -4% -6% 8%
Minimum -85% -78% -96%
1st Percentile -72% -78% -75%
5th Percentile -56% -19% -43%
10th Percentile -30% -16% -34%
25th Percentile -12% -15% -1%
50th Percentile -4% -14% 0%
75th Percentile 4% -12% 0%
90th Percentile 11% 0% 59%
95th Percentile 20% 0% 99%
99th Percentile 163% 258% 199%
Maximum 467% 258% 622%
Standard Deviation 35% 48% 51%
4.1.3 Percentage Change in Total RVUs
Malpractice RVUs are a relatively small component of overall RVUs, so it is reasonable
to expect the effect of an update of MP RVUs to have a modest effect on total RVUs. This
expectation is borne out by the results reported below. The weighted average effect of the MP
RVU update on total RVUs is negligible for all categories reported in Tables 4.5 and 4.6.
Similarly, the median effects on total RVUs are very modest, rounding down to zero percent in
all categories in Tables 4.5 and 4.6 except for a one percent decline for obstetric RVUs. In
addition, even the minimum and maximum changes induced by the update are quite modest.
Among all codes, the minimum change in total RVUs owing to this update is a decline of 14
percent and the maximum change is an increase of 18 percent.

Report on the CY 2015 Update of the MP RVUs for the Medicare PFS | Acumen, LLC 33
Table 4.5: Percent Change in Total RVUs, 2014 to Updated, Budget Neutral Values by
Mod/Indicator
Statistic
Subset
All Tech Prof Global Single
Non-Empty Values Count 8,857 916 997 842 6,102
MTUS Weighted Mean 0% 0% 0% 0% 0%
Mean 0% 0% 0% 0% 0%
Minimum -14% -2% -12% -3% -14%
1st Percentile -6% 0% -4% -1% -7%
5th Percentile -2% 0% -2% 0% -3%
10th Percentile -1% 0% -1% 0% -2%
25th Percentile 0% 0% 0% 0% -1%
50th Percentile 0% 0% 0% 0% 0%
75th Percentile 0% 0% 0% 0% 0%
90th Percentile 1% 0% 2% 0% 1%
95th Percentile 1% 0% 3% 1% 1%
99th Percentile 4% 0% 7% 1% 4%
Maximum 18% 0% 9% 4% 18%
Standard Deviation 2% 0% 2% 0% 2%
Table 4.6: Percent Change in Total RVUs, 2014 to Updated, Budged Neutral Values by
Surgery Class
Statistic
Subset
MAJ OB NS
Non-Empty Values Count 5,577 65 3,215
MTUS Weighted Mean 0% -1% 0%
Mean 0% -1% 0%
Minimum -14% -10% -12%
1st Percentile -7% -10% -3%
5th Percentile -3% -2% -1%
10th Percentile -2% -2% -1%
25th Percentile -1% -2% 0%
50th Percentile 0% -2% 0%
75th Percentile 0% -1% 0%
90th Percentile 1% 0% 0%
95th Percentile 1% 0% 1%
99th Percentile 5% 8% 3%
Maximum 18% 8% 13%
Standard Deviation 2% 2% 1%

34 Acumen, LLC | Section 4: Impact of the CY 2015 Update
4.2 Impact by Specialty
Impacts by specialty are summarized in Table 4.7. The rows contain specialties. The
first numeric column shows the aggregate MTUS for each specialty in 2015. The next two
columns show the MTUS-weighted average MP RVU for each specialty after the update and in
2014. The next column shows the percent change in this average MP RVU for each specialty.
The next three columns show the same figures calculated for total RVUs rather than MP RVUs.
The change in average MP RVU for most specialties is modest. As was the case above,
once attention is shifted to total RVUs, the change occasioned by this update is quite modest at
less than one half of one percent for almost every specialty.
Table 4.7: Impact by Specialty
Specialty Name MTUS
MP RVUs Total RVUs
2015 2014 Percent
Change 2015 2014
Percent
Change
Allergy/ Immunology 12,865,873 0.02 0.02 -1.0% 0.66 0.66 0.0%
Anesthesiology 5,855,721 0.11 0.11 0.0% 3.67 3.67 -0.1%
Cardiac Surgery 953,924 1.08 1.20 -0.2% 14.05 14.17 -0.3%
Cardiology 74,621,888 0.10 0.10 5.6% 3.57 3.57 0.0%
Colon and Rectal
Surgery 771,855 0.42 0.44 -6.1% 8.23 8.25 -0.2%
Critical Care 2,301,108 0.17 0.16 4.4% 4.85 4.84 0.1%
Dermatology 41,582,680 0.08 0.08 -6.1% 2.74 2.75 -0.2%
Emergency Medicine 26,804,031 0.20 0.18 6.8% 3.94 3.92 0.3%
Endocrinology 4,763,534 0.09 0.10 -5.5% 3.44 3.44 -0.2%
Family Practice 76,776,992 0.08 0.08 -2.4% 2.93 2.93 -0.1%
Gastroenterology 13,597,713 0.22 0.24 -5.0% 6.74 6.76 -0.2%
General Practice 5,991,949 0.08 0.09 -2.2% 3.02 3.02 -0.1%
General Surgery 11,868,850 0.41 0.42 -1.9% 7.79 7.80 -0.1%
Geriatrics 2,506,858 0.09 0.10 -1.4% 3.44 3.45 -0.1%
Hand Surgery 1,313,728 0.19 0.20 2.9% 4.96 4.97 -0.1%
Hematology/ Oncology 23,906,633 0.06 0.06 0.9% 3.11 3.11 -0.1%
Infectious Disease 7,158,348 0.11 0.11 6.8% 3.35 3.34 0.2%
Internal Medicine 129,325,437 0.09 0.09 1.7% 3.22 3.22 0.0%
Interventional Pain
Mgmt 6,267,607 0.10 0.10 -2.3% 3.98 3.99 -0.1%
Interventional
Radiology 2,215,895 0.12 0.13 0.2% 7.01 7.01 -0.1%
Multispecialty
Clinic/other Ph 966,029 0.09 0.10 0.4% 3.12 3.13 -0.1%
Nephrology 16,547,824 0.13 0.13 0.2% 4.72 4.73 0.0%
Neurology 13,219,018 0.11 0.12 -0.3% 4.39 4.40 -0.1%
Neurosurgery 2,437,770 1.06 1.03 -1.4% 11.49 11.45 0.0%
Nuclear Medicine 692,758 0.06 0.06 3.8% 2.87 2.87 0.0%
Obstetrics/Gynecology 6,679,605 0.14 0.15 10.3% 3.95 3.96 0.1%
Ophthalmology 46,153,494 0.07 0.15 -40.3% 4.76 4.83 -1.1%

Report on the CY 2015 Update of the MP RVUs for the Medicare PFS | Acumen, LLC 35
Specialty Name MTUS
MP RVUs Total RVUs
2015 2014 Percent
Change 2015 2014
Percent
Change
Orthopedic Surgery 28,724,843 0.24 0.26 -2.6% 4.93 4.95 -0.2%
Otolarngology 14,728,278 0.09 0.09 -1.4% 2.91 2.91 -0.1%
Pathology 23,155,372 0.01 0.02 -5.4% 1.85 1.85 -0.1%
Pediatrics 837,768 0.08 0.08 0.7% 2.60 2.60 0.0%
Physical Medicine 12,461,076 0.08 0.08 4.6% 3.01 3.01 0.0%
Plastic Surgery 1,806,442 0.34 0.40 -8.0% 8.39 8.45 -0.4%
Psychiatry 16,899,659 0.08 0.08 1.1% 2.81 2.81 0.0%
Pulmonary Disease 19,047,196 0.11 0.11 0.9% 3.64 3.64 0.0%
Radiation Oncology 11,623,416 0.07 0.10 0.7% 5.43 5.44 -0.1%
Radiology 101,079,141 0.04 0.04 -1.9% 2.03 2.03 -0.2%
Rheumatology 6,493,569 0.07 0.08 -3.4% 3.15 3.16 -0.2%
Thoracic Surgery 1,031,357 0.94 1.05 -1.0% 12.94 13.05 -0.3%
Urology 17,092,881 0.12 0.12 -5.9% 4.13 4.14 -0.2%
Vascular Surgery 4,741,886 0.32 0.33 5.1% 10.72 10.73 0.0%
Audiologist 1,905,589 0.02 0.02 -15.5% 1.24 1.25 -0.4%
Chiropractor 21,228,830 0.02 0.02 -20.8% 1.29 1.30 -0.4%
Clinical Psychologist 8,182,136 0.07 0.08 2.9% 2.73 2.74 0.0%
Clinical Social Worker 5,743,644 0.07 0.08 -3.8% 2.86 2.87 -0.1%
Diagnostic Testing
Facility 5,368,762 0.03 0.03 11.0% 7.10 7.11 0.0%
Independent laboratory 11,052,718 0.02 0.02 -3.2% 2.83 2.83 -0.1%
Nurse Anes / Anes Asst 165,895 0.12 0.13 -2.1% 3.01 3.01 -0.3%
Nurse Practitioner 27,555,761 0.08 0.09 -2.3% 2.98 2.98 -0.1%
Optometry 12,312,502 0.05 0.08 -34.5% 3.46 3.49 -0.8%
Oral/ Maxillofacial
Surgery 280,027 0.20 0.21 4.2% 6.19 6.20 0.0%
Physical/ Occupational
Therapy 90,336,930 0.02 0.01 42.9% 1.31 1.31 0.3%
Physician Assistant 17,982,621 0.12 0.13 -3.4% 3.21 3.22 -0.1%
Podiatry 32,030,205 0.06 0.06 -5.6% 2.20 2.20 -0.2%
Portable X-Ray
Supplier 5,351,504 0.01 0.01 -0.6% 1.05 1.05 -0.1%
Radiation Therapy
Centers 310,448 0.02 0.02 17.9% 7.00 7.00 0.0%
Other 643,669 0.03 0.04 -34.0% 1.60 1.61 -0.8%

36 Acumen, LLC | References
REFERENCES
CMS (Centers for Medicare and Medicaid Services). “Estimated Sustainable Growth Rate and
Conversion Factor, for Medicare Payments to Physicians in 2013.” March 2012.
http://www.cms.gov/Medicare/Medicare-Fee-for-Service-
Payment/SustainableGRatesConFact/downloads/sgr2013p.pdf
Hahn, Jim. “Medicare Physician Payment Updates and the Sustainable Growth Rate (SGR)
System.” Congressional Research Service. August 2010.
http://assets.opencrs.com/rpts/R40907_20100806.pdf
O’Brien-Strain, Margaret, Sean McClellan, Steve Frances, and Nick Theobald. “Final Report on
GPCI Malpractice RVUs for the CY 2010 Medicare Physician Fee Schedule Rule.”
Burlingame, CA: Acumen, LLC. March 2010.
U.S. Congress. “American Taxpayer Relief Act of 2012.” 112th Congress, Second Session.
January 2012.
U.S. Congress. “Bipartisan Budget Act of 2013.” 113th Congress. December 2013.
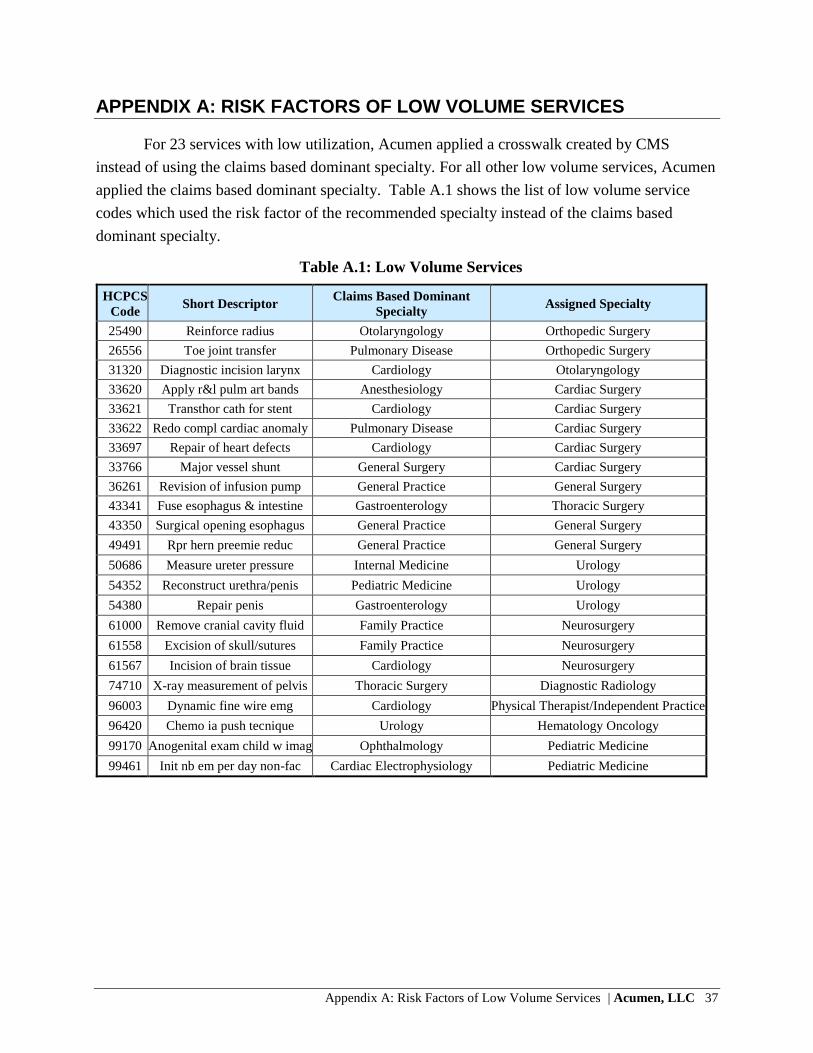
Appendix A: Risk Factors of Low Volume Services | Acumen, LLC 37
APPENDIX A: RISK FACTORS OF LOW VOLUME SERVICES
For 23 services with low utilization, Acumen applied a crosswalk created by CMS
instead of using the claims based dominant specialty. For all other low volume services, Acumen
applied the claims based dominant specialty. Table A.1 shows the list of low volume service
codes which used the risk factor of the recommended specialty instead of the claims based
dominant specialty.
Table A.1: Low Volume Services
HCPCS
Code Short Descriptor
Claims Based Dominant
Specialty Assigned Specialty
25490 Reinforce radius Otolaryngology Orthopedic Surgery
26556 Toe joint transfer Pulmonary Disease Orthopedic Surgery
31320 Diagnostic incision larynx Cardiology Otolaryngology
33620 Apply r&l pulm art bands Anesthesiology Cardiac Surgery
33621 Transthor cath for stent Cardiology Cardiac Surgery
33622 Redo compl cardiac anomaly Pulmonary Disease Cardiac Surgery
33697 Repair of heart defects Cardiology Cardiac Surgery
33766 Major vessel shunt General Surgery Cardiac Surgery
36261 Revision of infusion pump General Practice General Surgery
43341 Fuse esophagus & intestine Gastroenterology Thoracic Surgery
43350 Surgical opening esophagus General Practice General Surgery
49491 Rpr hern preemie reduc General Practice General Surgery
50686 Measure ureter pressure Internal Medicine Urology
54352 Reconstruct urethra/penis Pediatric Medicine Urology
54380 Repair penis Gastroenterology Urology
61000 Remove cranial cavity fluid Family Practice Neurosurgery
61558 Excision of skull/sutures Family Practice Neurosurgery
61567 Incision of brain tissue Cardiology Neurosurgery
74710 X-ray measurement of pelvis Thoracic Surgery Diagnostic Radiology
96003 Dynamic fine wire emg Cardiology Physical Therapist/Independent Practice
96420 Chemo ia push tecnique Urology Hematology Oncology
99170 Anogenital exam child w imag Ophthalmology Pediatric Medicine
99461 Init nb em per day non-fac Cardiac Electrophysiology Pediatric Medicine

38 Acumen, LLC | Appendix B: Summary of MP RVU Data
APPENDIX B: SUMMARY OF MP RVU DATA
Table B.1 shows summary data before and after MP RVU calculations for each surgery class – specialty combination using the
final methodologies described in Section 3.4. The first two columns identify the specialty, and the third column identifies the
classification of the premiums collected for the specialty. The next two columns show the PW RVUs for each specialty and their
distribution with each specialty. The next column shows the normalized premiums for the unblended classifications followed by the
risk factor for each of these specialty/surgery classifications. The column labeled Final Normalized Premium lists the premium used
for the final risk factor calculation, which is calculated using the scenarios listed in Table 3.8. The Final National Risk Factor is
calculated from the final premium, and identifies the specialty risk that is used for MP RVU calculations.36
Table B.1: Summary of MP RVU Data
Specialty
Code Specialty Name
Surgery
Class
Total PW
RVUs
Percent
PW RVUs
by
Specialty
Normalized
Premium
National
Risk Factor
# States
with
Specialty
Final
Normalized
Premium
Final
National
Risk
Factor
Final # of
States with
Specialty
01 General Practice MAJ 627,414 4.5% $33,725 4.11 41 $33,725 4.11 41
01 General Practice NS 6,336,879 45.5% $14,992 1.83 45 $14,992 1.83 45
01 General Practice UNSP 6,964,578 50.0% $25,967 3.17 26
02 General Surgery MAJ 20,737,141 32.2% $59,808 7.30 50 $59,808 7.30 50
02 General Surgery NS 11,489,393 17.8% $11,645 1.42 3
02 General Surgery UNSP 32,226,800 50.0% $28,910 3.53 2
03 Allergy Immunology MAJ 20,788 0.6% $8,198 1.00 46
03 Allergy Immunology NS 1,608,428 49.4% $12,286 1.50 20 $8,198 1.00 46
03 Allergy Immunology UNSP 1,629,221 50.0% $8,198 1.00 46 $8,198 1.00 46
04 Otolaryngology MAJ 5,822,528 21.7% $36,664 4.47 49 $36,664 4.47 49
04 Otolaryngology NS 7,620,481 28.3% $15,978 1.95 41 $15,978 1.95 41
36 For specialties with insufficient state coverage, no state coverage or unreliable data, premium, risk factor and state count reflects the data of the
source specialty.

Appendix B: Summary of MP RVU Data | Acumen, LLC 39
Specialty
Code Specialty Name
Surgery
Class
Total PW
RVUs
Percent
PW RVUs
by
Specialty
Normalized
Premium
National
Risk Factor
# States
with
Specialty
Final
Normalized
Premium
Final
National
Risk
Factor
Final # of
States with
Specialty
04 Otolaryngology UNSP 13,443,010 50.0% $27,249 3.32 29
05 Anesthesiology MAJ 4,607,915 27.4% $24,674 3.01 18 $19,805 2.42 48
05 Anesthesiology NS 3,814,007 22.6% $19,805 2.42 48
05 Anesthesiology UNSP 8,421,931 50.0% $19,805 2.42 48 $19,805 2.42 48
06 Cardiology MAJ 14,076,840 8.5% $58,173 7.10 41 $58,173 7.10 41
06 Cardiology NS 68,492,266 41.5% $17,268 2.11 38 $17,268 2.11 38
06 Cardiology UNSP 82,569,106 50.0% $25,774 3.14 39
07 Dermatology MAJ 20,464,194 31.4% $33,675 4.11 26 $33,675 4.11 26
07 Dermatology NS 12,126,637 18.6% $10,275 1.25 37 $10,275 1.25 37
07 Dermatology UNSP 32,590,830 50.0% $17,518 2.14 38
08 Family Practice MAJ 2,721,160 1.5% $34,258 4.18 42 $34,258 4.18 42
08 Family Practice MAJ w
OB 16,267 0.0% $32,361 3.95 14 $32,361 3.95 14
08 Family Practice NS 85,265,058 48.4% $14,492 1.77 48 $14,492 1.77 48
08 Family Practice UNSP 88,002,484 50.0% $29,113 3.55 16
09 Interventional Pain
Management MAJ 2,722,435 25.2% $42,337 5.16 20 $19,805 2.42 48
09 Interventional Pain
Management NS 2,679,377 24.8% $19,805 2.42 48
09 Interventional Pain
Management UNSP 5,401,812 50.0% $23,832 2.91 7 $19,805 2.42 48
10 Gastroenterology MAJ 16,748,705 27.8% $36,494 4.45 34 $36,494 4.45 34
10 Gastroenterology NS 13,392,694 22.2% $17,702 2.16 35 $17,702 2.16 35
10 Gastroenterology UNSP 30,141,405 50.0% $23,179 2.83 27
11 Internal Medicine BLND $16,941 2.07 50
11 Internal Medicine MAJ 3,798,058 1.1% $32,852 4.01 3
11 Internal Medicine NS 171,933,723 48.9% $15,623 1.91 39
11 Internal Medicine UNSP 175,732,441 50.0% $17,886 2.18 40

40 Acumen, LLC | Appendix B: Summary of MP RVU Data
Specialty
Code Specialty Name
Surgery
Class
Total PW
RVUs
Percent
PW RVUs
by
Specialty
Normalized
Premium
National
Risk Factor
# States
with
Specialty
Final
Normalized
Premium
Final
National
Risk
Factor
Final # of
States with
Specialty
12
Osteopathic
Manipulative
Medicine
MAJ 73,961 5.7% $8,198 1.00 46
12
Osteopathic
Manipulative
Medicine
NS 574,580 44.3% $8,198 1.00 46
12
Osteopathic
Manipulative
Medicine
UNSP 648,541 50.0% $9,776 1.19 6 $8,198 1.00 46
13 Neurology MAJ 764,724 1.8% $96,970 11.83 43 $106,901 13.04 50
13 Neurology NS 20,554,238 48.2% $21,223 2.59 36 $21,223 2.59 36
13 Neurology UNSP 21,318,962 50.0% $24,531 2.99 31
14 Neurosurgery MAJ 8,274,547 77.6% $123,400 15.05 24 $106,901 13.04 50
14 Neurosurgery NS 2,386,952 22.4% $85,708 10.45 4
16 Obstetrics
Gynecology MAJ 3,002,827 19.4% $42,988 5.24 10 $31,167 3.80 42
16 Obstetrics
Gynecology
MAJ w
OB $58,930 7.19 50 $66,024 8.05 35
16 Obstetrics
Gynecology NS 4,343,555 28.1% $27,063 3.30 12 $31,167 3.80 42
16 Obstetrics
Gynecology NS w OB $13,182 1.61 41
16 Obstetrics
Gynecology OB 389,406 2.5% $66,024 8.05 35 $66,024 8.05 35
16 Obstetrics
Gynecology UNSP 7,735,789 50.0% $31,167 3.80 42 $31,167 3.80 42
17 Hospice and Palliative
Care MAJ 4,847 0.6% $8,198 1.00 46
17 Hospice and Palliative
Care NS 384,509 49.4% $14,241 1.74 1 $8,198 1.00 46

Appendix B: Summary of MP RVU Data | Acumen, LLC 41
Specialty
Code Specialty Name
Surgery
Class
Total PW
RVUs
Percent
PW RVUs
by
Specialty
Normalized
Premium
National
Risk Factor
# States
with
Specialty
Final
Normalized
Premium
Final
National
Risk
Factor
Final # of
States with
Specialty
17 Hospice and Palliative
Care UNSP 389,357 50.0% $10,257 1.25 7 $8,198 1.00 46
18 Ophthalmology MAJ 30,236,544 22.7% $18,131 2.21 49 $18,131 2.21 49
18 Ophthalmology NS 36,322,816 27.3% $9,988 1.22 48 $9,988 1.22 48
18 Ophthalmology UNSP 66,559,363 50.0% $24,140 2.94 20
19 Oral Surgery (dental
only) MAJ 147,276 33.7% $17,711 2.16 6 $41,930 5.11 49
19 Oral Surgery (dental
only) UNSP 289,628 66.3% $16,567 2.02 1
20 Orthopedic Surgery MAJ 32,847,791 33.3% $52,344 6.38 50 $52,344 6.38 50
20 Orthopedic Surgery NS 16,420,782 16.7% $13,134 1.60 21
20 Orthopedic Surgery UNSP 49,268,576 50.0% $36,569 4.46 1
22 Pathology BLND $14,637 1.79 50
22 Pathology NS 17,730,006 49.8% $15,939 1.94 31
22 Pathology UNSP 17,850,454 50.2% $13,345 1.63 40
23 Sports Medicine MAJ 219,877 23.1% $33,725 4.11 41
23 Sports Medicine NS 256,678 26.9% $11,400 1.39 8 $14,992 1.83 45
23 Sports Medicine UNSP 476,555 50.0% $7,820 0.95 2
24
Plastic and
Reconstructive
Surgery
MAJ 3,815,732 77.3% $41,930 5.11 49 $41,930 5.11 49
24
Plastic and
Reconstructive
Surgery
NS 1,118,961 22.7% $15,294 1.87 6
25 Physical Medicine and
Rehabilitation MAJ 1,965,407 6.4% $17,252 2.10 10 $11,391 1.39 46
25 Physical Medicine and
Rehabilitation NS 13,316,038 43.6% $12,211 1.49 19 $11,391 1.39 46

42 Acumen, LLC | Appendix B: Summary of MP RVU Data
Specialty
Code Specialty Name
Surgery
Class
Total PW
RVUs
Percent
PW RVUs
by
Specialty
Normalized
Premium
National
Risk Factor
# States
with
Specialty
Final
Normalized
Premium
Final
National
Risk
Factor
Final # of
States with
Specialty
25 Physical Medicine and
Rehabilitation UNSP 15,281,445 50.0% $11,391 1.39 46 $11,391 1.39 46
26 Psychiatry MAJ 19,890 0.0% $12,960 1.58 1 $9,238 1.13 45
26 Psychiatry NS 22,484,594 50.0% $13,252 1.62 24 $9,238 1.13 45
26 Psychiatry UNSP 22,504,484 50.0% $9,238 1.13 45 $9,238 1.13 45
28 Colorectal Surgery
(formerly Proctology) MAJ 1,715,526 74.1% $33,443 4.08 43 $33,443 4.08 43
28 Colorectal Surgery
(formerly Proctology) NS 598,830 25.9% $6,326 0.77 3
29 Pulmonary Disease BLND $19,125 2.33 50
29 Pulmonary Disease MAJ 1,135,598 1.9% $8,715 1.06 2
29 Pulmonary Disease NS 28,295,727 48.1% $20,268 2.47 35
29 Pulmonary Disease UNSP 29,431,325 50.0% $18,428 2.25 33
30 Diagnostic Radiology BLND $24,518 2.99 49
30 Diagnostic Radiology MAJ 6,096,119 4.7% $30,281 3.69 2
30 Diagnostic Radiology NS 58,254,094 45.3% $20,362 2.48 34
30 Diagnostic Radiology UNSP 64,350,226 50.0% $27,734 3.38 39
33 Thoracic Surgery MAJ 4,432,885 81.4% $59,569 7.27 48 $59,569 7.27 48
33 Thoracic Surgery NS 1,012,586 18.6% $21,182 2.58 3
34 Urology MAJ 11,178,952 23.1% $27,760 3.39 42 $27,760 3.39 42
34 Urology NS 12,998,387 26.9% $13,215 1.61 22 $13,215 1.61 22
34 Urology UNSP 24,177,366 50.0% $27,975 3.41 20
35 Chiropractic MAJ $8,198 1.00 46
35 Chiropractic NS 12,717,262 50.0% $7,600 0.93 1 $8,198 1.00 46
35 Chiropractic UNSP 12,717,262 50.0% $3,836 0.47 32 $8,198 1.00 46
36 Nuclear Medicine MAJ 8,031 0.6% $79,353 9.68 2 $11,575 1.41 39
36 Nuclear Medicine NS 663,656 49.4% $13,506 1.65 14 $11,575 1.41 39

Appendix B: Summary of MP RVU Data | Acumen, LLC 43
Specialty
Code Specialty Name
Surgery
Class
Total PW
RVUs
Percent
PW RVUs
by
Specialty
Normalized
Premium
National
Risk Factor
# States
with
Specialty
Final
Normalized
Premium
Final
National
Risk
Factor
Final # of
States with
Specialty
36 Nuclear Medicine UNSP 671,692 50.0% $11,575 1.41 39 $11,575 1.41 39
37 Pediatric Medicine BLND $14,934 1.82 50
37 Pediatric Medicine MAJ 54,495 3.1% $30,939 3.77 19
37 Pediatric Medicine NS 825,801 46.9% $13,150 1.60 40
37 Pediatric Medicine UNSP 880,398 50.0% $15,617 1.90 27
38 Geriatric Medicine MAJ 27,420 0.4% $39,634 4.83 27 $39,634 4.83 27
38 Geriatric Medicine NS 3,742,216 49.6% $14,560 1.78 32 $14,560 1.78 32
38 Geriatric Medicine UNSP 3,769,636 50.0% $13,242 1.62 17
39 Nephrology MAJ 1,028,165 1.5% $35,017 4.27 24 $35,017 4.27 24
39 Nephrology NS 33,863,675 48.5% $14,002 1.71 35 $14,002 1.71 35
39 Nephrology UNSP 34,891,841 50.0% $15,810 1.93 16
40 Hand Surgery MAJ 1,245,281 31.5% $38,602 4.71 48 $38,602 4.71 48
40 Hand Surgery NS 730,082 18.5% $47,967 5.85 1
40 Hand Surgery UNSP 1,975,363 50.0% $37,841 4.62 4
41 Optometry MAJ 828,284 3.1% $8,198 1.00 46
41 Optometry NS 12,408,527 46.9% $8,198 1.00 46
41 Optometry UNSP 13,236,811 50.0% $1,837 0.22 36 $8,198 1.00 46
44 Infectious Disease BLND $19,736 2.41 41
44 Infectious Disease NS 11,511,717 49.9% $21,162 2.58 29
44 Infectious Disease UNSP 11,572,786 50.1% $18,317 2.23 22
46 Endocrinology MAJ 76,816 0.6% $34,656 4.23 25 $34,656 4.23 25
46 Endocrinology NS 6,538,882 49.4% $13,558 1.65 33 $13,558 1.65 33
46 Endocrinology UNSP 6,615,703 50.0% $26,565 3.24 20
48 Podiatry BLND $18,207 2.22 44
48 Podiatry MAJ 12,567,326 25.8% $18,795 2.29 33
48 Podiatry NS 11,810,251 24.2% $11,518 1.40 19

44 Acumen, LLC | Appendix B: Summary of MP RVU Data
Specialty
Code Specialty Name
Surgery
Class
Total PW
RVUs
Percent
PW RVUs
by
Specialty
Normalized
Premium
National
Risk Factor
# States
with
Specialty
Final
Normalized
Premium
Final
National
Risk
Factor
Final # of
States with
Specialty
48 Podiatry UNSP 24,377,577 50.0% $21,145 2.58 33
60 Public Health or
Welfare Agency MAJ $8,198 1.00 46
60 Public Health or
Welfare Agency NS 383 50.0% $17,237 2.10 5 $8,198 1.00 46
60 Public Health or
Welfare Agency UNSP 383 50.0% $14,971 1.83 9 $8,198 1.00 46
62 Psychologist MAJ 0 0.0% $8,198 1.00 46
62 Psychologist NS 323,212 50.0% $8,198 1.00 46
62 Psychologist UNSP 323,212 50.0% $1,228 0.15 6 $8,198 1.00 46
65 Physical Therapist MAJ 1,088,860 1.5% $8,198 1.00 46
65 Physical Therapist NS 35,191,999 48.5% $8,198 1.00 46
65 Physical Therapist UNSP 36,280,859 50.0% $226 0.03 2 $8,198 1.00 46
66 Rheumatology BLND $14,479 1.77 43
66 Rheumatology NS 5,900,720 47.5% $14,034 1.71 35
66 Rheumatology UNSP 6,515,344 52.5% $14,883 1.82 21
67 Occupational
Therapist MAJ 25,741 0.5% $8,198 1.00 46
67 Occupational
Therapist NS 2,531,821 49.5% $8,198 1.00 46
67 Occupational
Therapist UNSP 2,557,561 50.0% $993 0.12 19 $8,198 1.00 46
71
Registered
Dietitian/Nutrition
Professional
MAJ $8,198 1.00 46
71
Registered
Dietitian/Nutrition
Professional
NS 253,948 50.0% $12,958 1.58 15 $8,198 1.00 46

Appendix B: Summary of MP RVU Data | Acumen, LLC 45
Specialty
Code Specialty Name
Surgery
Class
Total PW
RVUs
Percent
PW RVUs
by
Specialty
Normalized
Premium
National
Risk Factor
# States
with
Specialty
Final
Normalized
Premium
Final
National
Risk
Factor
Final # of
States with
Specialty
71
Registered
Dietitian/Nutrition
Professional
UNSP 253,948 50.0% $8,111 0.99 33 $8,198 1.00 46
72 Pain Management MAJ 1,372,183 22.9% $44,540 5.43 21 $19,805 2.42 48
72 Pain Management NS 1,629,160 27.1% $19,358 2.36 14 $19,805 2.42 48
72 Pain Management UNSP 3,001,350 50.0% $27,464 3.35 18 $19,805 2.42 48
77 Vascular Surgery MAJ 6,490,711 64.8% $58,970 7.19 46 $58,970 7.19 46
77 Vascular Surgery NS 3,524,782 35.2% $7,160 0.87 2
78 Cardiac Surgery MAJ 4,653,314 82.9% $59,305 7.23 48 $59,305 7.23 48
78 Cardiac Surgery NS 958,887 17.1% $24,818 3.03 3
79 Addiction Medicine MAJ 1,214 0.5% $8,198 1.00 46
79 Addiction Medicine NS 113,353 49.5% $8,198 1.00 46
79 Addiction Medicine UNSP 114,599 50.0% $10,210 1.25 12 $8,198 1.00 46
81 Critical Care
(Intensivists) MAJ 368,316 3.5% $60,438 7.37 4 $23,218 2.83 35
81 Critical Care
(Intensivists) NS 4,835,068 46.5% $23,218 2.83 35
81 Critical Care
(Intensivists) UNSP 5,203,384 50.0% $23,218 2.83 35 $23,218 2.83 35
82 Hematology BLND $14,850 1.81 36
82 Hematology MAJ 10,911 0.5% $22,396 2.73 2
82 Hematology NS 994,555 49.5% $14,732 1.80 31
82 Hematology UNSP 1,005,465 50.0% $14,886 1.82 10
83 Hematology/Oncology BLND $15,514 1.89 41
83 Hematology/Oncology MAJ 118,067 0.4% $57,343 6.99 1
83 Hematology/Oncology NS 15,711,762 49.6% $19,036 2.32 13
83 Hematology/Oncology UNSP 15,829,829 50.0% $9,724 1.19 4
84 Preventive Medicine BLND $11,768 1.44 42

46 Acumen, LLC | Appendix B: Summary of MP RVU Data
Specialty
Code Specialty Name
Surgery
Class
Total PW
RVUs
Percent
PW RVUs
by
Specialty
Normalized
Premium
National
Risk Factor
# States
with
Specialty
Final
Normalized
Premium
Final
National
Risk
Factor
Final # of
States with
Specialty
84 Preventive Medicine MAJ 23,522 5.1% $24,395 2.98 1
84 Preventive Medicine NS 207,750 44.9% $11,464 1.40 31
84 Preventive Medicine UNSP 231,272 50.0% $10,757 1.31 26
85 Maxillofacial Surgery MAJ 126,738 100.0% $31,195 3.81 19 $41,930 5.11 49
90 Medical Oncology BLND $15,514 1.89 41
90 Medical Oncology MAJ 31,258 0.3% $18,868 2.30 1
90 Medical Oncology NS 4,571,490 49.7% $15,256 1.86 33
90 Medical Oncology UNSP 4,602,748 50.0% $15,747 1.92 19
91 Surgical Oncology MAJ 711,526 100.0% $39,150 4.78 25 $59,808 7.30 50
92 Radiation Oncology BLND $19,353 2.36 46
92 Radiation Oncology MAJ 104,333 0.4% $43,487 5.30 3
92 Radiation Oncology NS 13,287,438 49.6% $18,193 2.22 32
92 Radiation Oncology UNSP 13,391,771 50.0% $20,315 2.48 39
93 Emergency Medicine MAJ 1,948,755 1.6% $42,375 5.17 33 $42,375 5.17 33
93 Emergency Medicine NS 60,662,434 48.4% $27,010 3.29 16 $27,010 3.29 16
93 Emergency Medicine UNSP 62,612,031 50.0% $25,514 3.11 41
94 Interventional
Radiology BLND $24,518 2.99 49
94 Interventional
Radiology MAJ 1,601,677 28.9% $31,872 3.89 5
94 Interventional
Radiology NS 1,166,630 21.1% $28,755 3.51 3
94 Interventional
Radiology UNSP 2,768,306 50.0% $28,730 3.50 29
97 Physician Assistant MAJ 2,509,345 6.2% $12,414 1.51 3 $8,198 1.00 46
97 Physician Assistant NS 17,865,703 43.8% $3,258 0.40 1 $8,198 1.00 46
97 Physician Assistant UNSP 20,375,155 50.0% $6,986 0.85 43 $8,198 1.00 46

Appendix B: Summary of MP RVU Data | Acumen, LLC 47
Specialty
Code Specialty Name
Surgery
Class
Total PW
RVUs
Percent
PW RVUs
by
Specialty
Normalized
Premium
National
Risk Factor
# States
with
Specialty
Final
Normalized
Premium
Final
National
Risk
Factor
Final # of
States with
Specialty
99 Unknown Physician
Specialty MAJ 17,571 10.6% $64,667 7.89 6 $33,725 4.11 41
99 Unknown Physician
Specialty NS 65,529 39.4% $14,833 1.81 30 $14,992 1.83 45
99 Unknown Physician
Specialty UNSP 83,215 50.0% $11,598 1.41 36
C0 Sleep Medicine MAJ 2,115 0.9% $33,725 4.11 41
C0 Sleep Medicine NS 117,259 49.1% $14,992 1.83 45
C0 Sleep Medicine UNSP 119,374 50.0% $15,230 1.86 8

48 Acumen, LLC | Appendix C: Surgical Codes Outside 10000-69999
Range
APPENDIX C : SURGICAL CODES OUTSIDE 10000-69999 RANGE
Table C.1 shows surgical cardiology codes and surgical G codes outside of the 10000-
69999 CPT range. G0105 and G0121 have modifier 53; the remainder of the CPT codes in
Table C.1 do not have a modifier.
Table C.1: Surgical Codes Outside 10000-69999 Range
HCPCS Code
92920
92921
92924
92925
92928
92929
92933
92934
92937
92938
92941
92943
92944
92961
92970
92971
92973
92974
92975
92977
92978
92979
92986
92987
92990
92997
92998
93451
93452
93453
93454
93455
93456
93457
93458
93459
93460

Appendix C: Surgical Codes Outside 10000-69999 Range | Acumen, LLC 49
HCPCS Code
93461
93462
93503
93505
93530
93531
93532
93533
93580
93581
93582
93583
93600
93602
93603
93609
93610
93612
93613
93618
93619
93620
93621
93622
93623
93624
93631
93640
93641
93642
93650
93653
93654
93655
93656
93657
93563
93564
93565
93566
93567
93568
93571
93572

50 Acumen, LLC | Appendix C: Surgical Codes Outside 10000-69999
Range
HCPCS Code
G0101
G0104
G0105
G0121
G0127
G0168
G0186
G0268
G0269
G0278
G0283
G0288
G0289
G0341
G0342
G0343
G0364
G0412
G0413
G0414
G0415
G0429
G0460

Appendix D: CPT Codes with Crosswalked Risk Factors | Acumen, LLC 51
APPENDIX D: SERVICE CODES WITH CROSSWALKED RISK FACTORS
For new or revised services lacking utilization, Acumen applied a crosswalk created by
CMS that assigns the risk factor of a code with a similar specialty mix. Existing services that
lacked utilization received the weighted average risk factor of all services. Table D.1 and D.2
respectively show 2014 and 2015 new/revised service codes which were crosswalked to codes
with a similar specialty mix; the codes in the destination columns received the CPT level risk
factor values of their respective counterparts in the source columns.
Table D.1: 2014 New/Revised Service Codes with Crosswalked Risk Factors
Source Code Destination Code
37200 10030
32553 19081
64480 19082
32551 19083
64480 19084
36565 19085
76812 19086
50387 19281
76812 19282
50387 19283
76812 19284
36569 19285
76812 19286
32551 19287
76812 19288
23472 23333
23472 23334
23472 23335
24363 24160
23430 24164
33979 33366
37660 37217
36247 37236
37223 37237
36247 37238
37223 37239
37204 37241
37204 37242
37204 37243
37204 37244
31575 43191
31575 43192

52 Acumen, LLC | Appendix D: CPT Codes with Crosswalked Risk Factors
Source Code Destination Code
31575 43193
31575 43194
31575 43195
31638 43196
31575 43197
31575 43198
43200 43206
43201 43211
43219 43212
43456 43213
43458 43214
43228 43229
43271 43233
43200 43252
43242 43253
43251 43254
43256 43266
43258 43270
43268 43274
43269 43275
43269 43276
43271 43277
43272 43278
37200 49405
37200 49406
37200 49407
52353 52356
64613 64616
31513 64617
64614 64642
64614 64643
64614 64644
64614 64645
64614 64646
64614 64647
65850 66183
77470 77293
90836 90785
90837 90839
90833 90840
96105 92521
96105 92522
96105 92523
92520 92524

Appendix D: CPT Codes with Crosswalked Risk Factors | Acumen, LLC 53
Source Code Destination Code
93580 93582
93580 93583
91065 G0455
95920 G0453
90846 90791
90846 90792
90846 90832
90846 90833
90846 90834
90846 90836
90846 90837
90846 90838
78452 78072
94668 94669
Table D.2: 2015 New/Revised Service Codes with Crosswalked Risk Factors
Source Code Destination Code
20600 20604
20605 20606
20610 20611
20982 20983
21805 21811
21805 21812
21805 21813
22520 22510
22521 22511
22522 22512
22523 22513
22524 22514
22525 22515
22856 22858
62287 27279
33249 33270
33216 33271
33244 33272
33215 33273
92987 33418
92987 33419
33960 33946
33960 33947
33961 33948
33961 33949
36822 33951
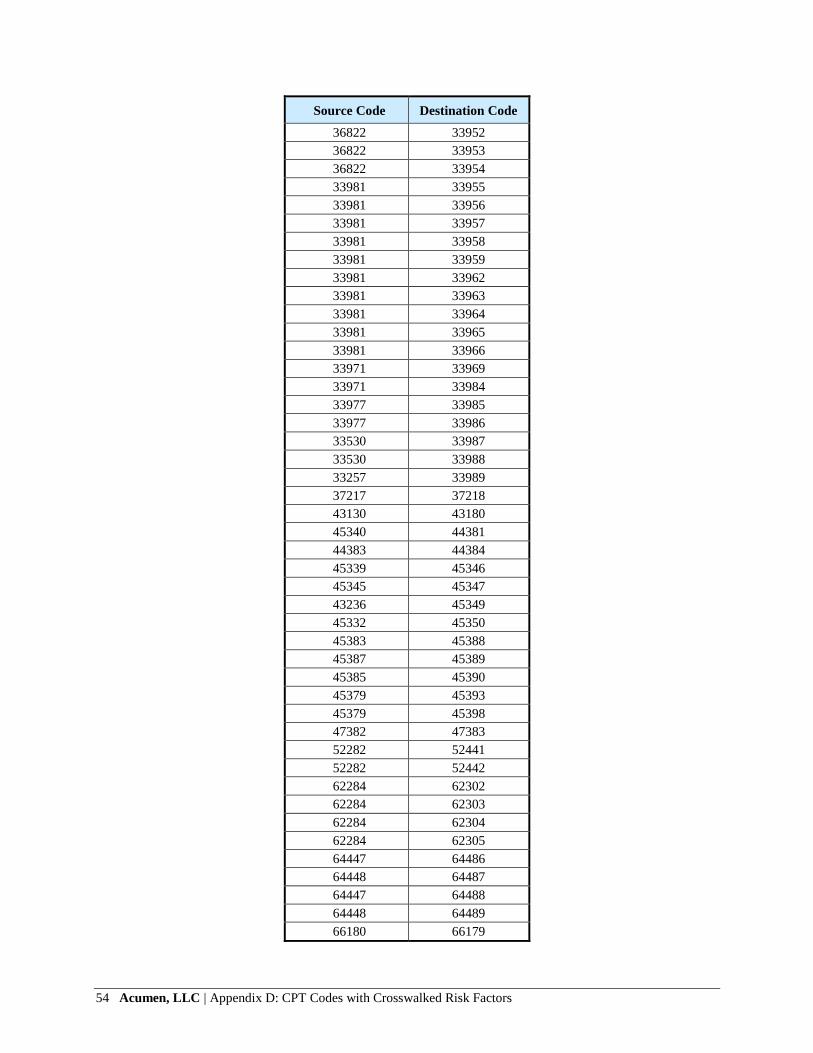
54 Acumen, LLC | Appendix D: CPT Codes with Crosswalked Risk Factors
Source Code Destination Code
36822 33952
36822 33953
36822 33954
33981 33955
33981 33956
33981 33957
33981 33958
33981 33959
33981 33962
33981 33963
33981 33964
33981 33965
33981 33966
33971 33969
33971 33984
33977 33985
33977 33986
33530 33987
33530 33988
33257 33989
37217 37218
43130 43180
45340 44381
44383 44384
45339 45346
45345 45347
43236 45349
45332 45350
45383 45388
45387 45389
45385 45390
45379 45393
45379 45398
47382 47383
52282 52441
52282 52442
62284 62302
62284 62303
62284 62304
62284 62305
64447 64486
64448 64487
64447 64488
64448 64489
66180 66179

Appendix D: CPT Codes with Crosswalked Risk Factors | Acumen, LLC 55
Source Code Destination Code
66185 66184
76645 76641
76645 76642
77057 77063
77080 77085
77082 77086
77305 77306
77315 77307
77326 77316
77327 77317
77328 77318
88342 88341
88342 88344
88365 88364
88365 88366
88368 88369
88367 88373
88367 88374
88368 88377
91132 91200
76514 92145
93282 93260
93289 93261
93312 93355
93642 93644
93701 93702
93882 93895
96110 96127
99291 99184
99212 99490
99183 G0277
77055 G0279
G0477 G0473

56 Acumen, LLC | Appendix E: CPT Codes with Crosswalked MP
RVUs
APPENDIX E: SERVICE CODES WITH CROSSWALKED MP RVUS
Table E.1 shows CPT codes which were assigned the CY 2015 MP RVU values of other
CPT codes to maintain consistency with PE RVU methodology. The codes in the destination
columns received the MP RVU values of their respective counterparts in the source columns.
Table E.1: CPT Codes with Cross-walked MP RVUs
Source Code Destination Code
95940 G0453
45330 45378 (Modifier 53)
45330 G0104
45330 G0105(Modifier 53)
45330 G0121 (Modifier 53)
45378 G0105
45378 G0121
74280 G0106
74280 G0120
76775 G0389
77418 0073T
88141 G0124
88141 G0141
88141 P3001
90472 90461
90472 90474
93000 G0403
93005 G0404
93010 G0405
96372 90460
96372 90471
96372 90473
97803 G0270
97804 G0271
99211 G0102
99221 G0425
99222 G0426
99223 G0427
99231 G0406
99232 G0407
99233 G0408
74280
(Modifier 26) G0106 (Modifier 26)
74280
(Modifier 26) G0120 (Modifier 26)
76775
(Modifier 26) G0389 (Modifier 26)

Appendix E: CPT Codes with Crosswalked MP RVUs | Acumen, LLC 57
Source Code Destination Code
74280
(Modifier TC)
G0106
(Modifier TC)
74280
(Modifier TC) G0120 (Modifier TC)
76775
(Modifier TC) G0389 (Modifier TC)
G0451 96110
37200 10030