report on the effects and roles of teaching assistants in
TRANSCRIPT

The Role and Effects of Teaching Assistants in English Primary Schools (Years 4 to 6) 2000 – 2003:Results from the Class Size and Pupil-Adult Ratios(CSPAR) KS2 Project
Peter Blatchford, Anthony Russell, Paul Bassett, Penelope Brown and Clare Martin: Institute of Education, University of London
Research Report RR605
RESEARCH

Research Report No 605
The Role and Effects of Teaching Assistants in English Primary Schools (Years 4 to 6) 2000 – 2003: Results from the Class Size and Pupil-Adult Ratios
(CSPAR) KS2 Project
Peter Blatchford, Anthony Russell, Paul Bassett, Penelope Brown and Clare Martin:
Institute of Education, University of London
© Queen’s Printer and Controller of HMSO 2004. Published with the permission of DfES on behalf of the Controller of Her Majesty's Stationery Office. Applications for reproduction should be made in writing to The Crown Copyright Unit, Her Majesty's Stationery Office, St Clements House, 2-16 Colegate, Norwich NR3 1BQ. ISBN 1 84478 373 1
1

Contents
Introduction................................................................................................................3 The KS2 study and this report ...................................................................................3 The role and effectiveness of Teaching Assistants: Background ..............................4
Impact of Teaching Assistants ...............................................................................5 Teaching Assistants and pupil outcomes ...............................................................5 Issues connected to effectiveness of Teaching Assistants in relation to pupil outcomes ................................................................................................................5 Conditions of employment and training ................................................................6
The research approach ...............................................................................................6 Sample....................................................................................................................8 Results..................................................................................................................14
1. Teaching Assistant questionnaires 2000 – 2003.................................................15
Conclusions to TA questionnaire.........................................................................26 2. Teacher questionnaires 2000-2003 .....................................................................28
Conclusions to teacher views on TA support ......................................................37 3. Head teacher questionnaires 2000 - 2003)..........................................................39
Conclusions to head teacher questionnaire ..........................................................45 4. Systematic observation study of year 6 classes: the effect of the presence of TAs and other adults on pupil and teacher behaviour .....................................................47
Introduction..........................................................................................................47 Statistical methods and analysis...........................................................................49 Conclusions to systematic observation study ......................................................53
5. Case studies in Years 5 and 6 (2001 – 2003).......................................................54
Results..................................................................................................................55 Conclusions from the case studies .......................................................................59
6. Statistical analysis of the effect of TAs and other additional staff and characteristics of teaching assistants on pupil attainment over KS2 .......................60
Conclusions..........................................................................................................62 General discussion and conclusions.........................................................................64
Conclusion ...........................................................................................................68 References............................................................................................................70
Report on the effects and role of Teaching Assistants.............................................72 APPENDICES .....................................................................................................72
2

Introduction The overall aim of the Institute of Education Class Size and Pupil-Adult Ratios (CSPAR) Project was to help resolve a number of questions about the educational effects of class size differences and pupil-adult ratios. The project is a longitudinal, multi-method study that has followed pupils over reception, Key Stage 1 (KS1) and Key Stage 2 (KS2) – ages 4-11 years, from 1996 to 2003. It has addressed two main questions: 1. the effect of class size differences, pupil-adult ratio differences and the presence of Teaching Assistants (TAs) on pupils’ educational attainment, and 2. the relationships between class size, pupil-adult ratio differences, and the presence of TAs, on the one hand, with classroom processes such as teacher pupil interactions, pupil behaviour and peer relations, and teachers’ professional satisfaction, on the other. Results from the reception and KS1 phase of the study have been reported in a number of publications. As well as the final report and Research Brief to the DfES (both Blatchford, P., Martin, C., Moriarty, V., Bassett, P., and Goldstein, H. 2002), on the effects of pupil-adult ratio differences over reception and KS1 - which included an analysis of the role of Teaching Assistants - we have published our results on relationships between class size and attainment over the reception year (Blatchford, Goldstein, Martin and Browne, 2002); class size and within class groupings (Blatchford, Baines, Kutnick and Martin, 2001); class size and teaching (Blatchford, Moriarty, Edmonds and Martin, 2002); class size and teachers’ and pupils’ behaviour (Blatchford, 2003b); class size and pupil attentiveness and peer relations (Blatchford, Edmonds and Martin, 2003); as well as a book length treatment of the whole reception and KS1 study (Blatchford, 2003a) and a paper summarising the whole study in a Special Issue of the British Educational Research Journal ‘In Praise of Educational Research’ (Blatchford, Bassett, Goldstein and Martin, 2003). The KS2 study and this report Overall, the project aimed to provide, for the first time in the UK, a full analysis of the educational effects of class size and adult-child ratio differences over the whole of reception, KS1 and KS2. In the KS2 part of the study (7-11 years), attention focused more specifically on the role and effects of TAs in classrooms. This report investigates the role and impact of TAs. In this report we concentrate on selected aspects of the data collected, and seek to present results in a way which provides a coherent account of the role, deployment and effectiveness of TAs in classrooms. We examine in turn: 1. Basic characteristics of TAs in the study’s schools and their views on training
courses, tasks carried out, and job satisfaction. 2. Teacher questionnaire answers concerning their experience of the effect of TAs. 3. The view of head teachers about qualifications and training of TAs and the
allocation of TAs to classes. 4. Results from a systematic observation study of the effect of TAs on pupil and
teacher classroom behaviour. 5. Case studies of selected schools concerning the deployment and impact of TAs. 6. The main statistical analysis of the effect of TAs on pupil academic progress and
teaching time across KS2. We end with a concluding section identifying the key results and issues which emerge from the study.
3
The role and effectiveness of Teaching Assistants: Background During the course of the research we have undertaken an extensive review of the literature concerning support staff, including TAs, in schools. There is not space to describe this review in detail here. In this section we identify some key issues which have informed the aims and direction of this report. Recently there has been a large investment in increasing levels of support staff. The Government, in its 1998 and 2001 Green Papers, set out its intention to increase substantially the number of trained TAs in primary and secondary schools. Between 1999 and 2002 the Government made available £350 million through LEAs to recruit an additional 20,000 full-time equivalent TAs, and annual funding is now available to support recruitment and training until 2004. Most recently, the National Agreement signed in January 2003 between the DfES, Welsh Assembly Government, local authority employers and school workforce unions aims to remodel the school workforce and free teachers to focus on teaching represented a consensus on principles relating to tackling teacher workloads and raising standards in schools. It included a reform of support staff roles and administrative arrangements in schools. The agreement envisaged a further increase in the number of support staff in schools and an expansion of the roles they fill. The National Agreement on School Workforce Reform aims to clarify the regulations and guidance of the respective roles of school support staff and teachers. The fieldwork for this study was carried out between 2000 and 2003 and it therefore pre-dates these recent Government initiatives. Latest information from the DfES shows that, for the period January 1997 to January 2003, there has been a dramatic 66% increase in all support staff in English schools. There has been a 99% increase in TAs, including SEN support staff and minority ethnic support staff; a 29% increase in administration staff (despite a slight decline in school secretaries); a 41% increase in technical staff; and a 47% increase in other support staff including medical staff. There are now a variety of different kinds of support staff. Some have direct roles in the classroom, such as TAs and nursery nurses; some have specialist input to child learning, such as music and creative arts specialists; some have administrative roles that can directly affect a teacher’s time in the classroom; and some have roles which have little direct bearing on classroom learning, such as caretakers. There are also a number of new types of support staff beginning to work in schools, such as Higher Level Teaching Assistants, new managers, and Learning Mentors. The DfES, in its reporting of annually collected data, uses the main headings ‘Teaching Assistants’, ‘Administrative Staff’, ‘Technicians’, and ‘Other Staff’. In this Report we restrict our attention to staff who would be called Teaching Assistants, and not other categories of support staff. For convenience, they will be referred to in this Report as ‘TAs’, except when respondents in their answers use a different term (e.g., Classroom Assistant or Learning Support Assistant). The rapid pace of change in this area means that results will not necessarily reflect recent changes and improvements in provision. An increase in the number of support staff and their effective deployment is widely seen as crucial to the success of remodelling the school workforce and, therefore, raising standards. There is much agreement that the recent expansion is a very positive development in education. However, it is recognised the research evidence to date is limited about many aspects of the impact and effectiveness of TAs and
4

although many studies paint a largely positive picture, but for the most part evidence is based on teachers’ reports. . Impact of Teaching Assistants There are particular gaps in knowledge about the impact of TAs in schools. Many studies paint a largely positive picture (e.g Mortimore and Mortimore, 1992; HMI, 2001; HMI, 2002). For the most part, evidence is based on teachers’ reports. The CSPAR reception and KS1 study also found that teachers were largely positive about the contribution of TAs in schools. This was seen in terms of: a. increased attention and support for learning (e.g., more one-to-one attention, support for children with SEN and support for teaching of literacy); b. increased teaching effectiveness (e.g., in terms of productive group work, productive creative and practical activities, lesson delivery and curriculum coverage); c. effective classroom management; and d. effects on children's learning outcomes (Blatchford et al, 2002). Teaching Assistants and pupil outcomes This is one of the most important yet problematic aspects of research in this area. Lee (2002) has concluded that “relatively few studies provided good evidence on which to base conclusions about impact.” Schlapp et al (2001), when faced with difficulties of obtaining reliable data on effects, were forced to conclude that they could not say whether the recent Scottish initiative to increase Classroom Assistants in schools had led to improvement in pupil outcomes. Evidence from studies that have addressed the effects of TAs on pupil outcomes in a more systematic way, e.g., by a numerical analysis of connections between TA provision and pupil attainment test scores, are also unclear. The recent EPPI review (Howes, Farrell, Kaplan and Moss, 2003) could identify only two studies of sufficiently high quality. One of these was the CSPAR reception and KS1 study (Blatchford et al, 2002), which found no appreciable effect of the presence of TAs in classrooms on pupils’ academic progress. Other studies report similar results; for example, Finn, Gerber, Farber and Achilles (2000), on the basis of the often-cited Tennessee STAR project, found that there was no compensatory effect of having extra staff in larger (‘regular’) classes. This negative finding is also found in other recent research (Muijs and Reynolds, 2002). However, other studies report a more positive effect of learning assistants on pupil outcomes (e.g., Wasek and Slavin, 1993), the difference appears to be that these are often tightly controlled experimental studies and/or connected to structured curriculum initiatives. REF TO YR6 TA PILOT here… There are huge challenges for research seeking to measure effects of TAs on pupil outcomes in the context of normal school conditions. We describe our research approach below. Overall, our aim was to assess in a reliable way whether there was an effect of TAs on pupil attainment over the second half of primary education, that is, over KS2. There are many important changes to children over these years, and to the curriculum and assessment arrangements, which will have implications for pupils’ learning and teaching, and little is known about the possibly changing role of TAs over this stage. Issues connected to effectiveness of Teaching Assistants in relation to pupil outcomes Despite the generally positive view of TAs, studies are also consistent in identifying a number of difficulties and tensions which will affect their impact, and which informed the research approach. One concerns the sometimes fragmentary nature of deployment of TAs in schools, and ways that this can make their contribution less effective and affect their own satisfaction with their jobs. This was a main theme to emerge from the CSPAR KS1 case studies of TAs in school. Teachers could spend
5

valuable teaching time supporting staff, and opportunities for a positive contribution to pupil learning, by teachers and TAs, could be lost. An allied theme was the need for more careful planning, a result mirrored in results from Farrell, Balshaw and Polat (2000). There may be particular difficulties in the case of teachers working with Support Staff who are supporting statemented pupils in the classroom. In the reception and KS1 CSPAR project, results suggested there was a need for communication between the teacher and TAs, for example, about lesson plans and learning objectives, and a relationship within which TAs felt valued. Lee (2002) and Schlapp et al (2001) also found that there could be insufficient time for pre- and post-lesson planning by teachers and TAs. A number of studies have identified difficulties concerning the boundaries between teaching and non teaching roles, and the existence of grey areas where uncertainty exists. There has been some concern over which roles and responsibilities should be carried out by teachers and which by TAs. Mortimore and Mortimore (1992) have addressed a specific version of this issue in terms of when it is appropriate to consider TAs ‘substituting’ or ‘augmenting’ the teachers’ role. More recently, in an evaluation of the recent Scottish increase in Classroom Assistants (their preferred term), it was found that boundaries between the teacher’s role and the CA’s role were sometimes unclear and some CAs were judged to overstep a boundary into teaching (Schlapp et al, 2001). MENCAP (no date) has recently pointed to the lack of clarity in roles and responsibilities between teachers and LSAs working with pupils with special needs. Other studies have also addressed the teaching role of TAs. Schlapp et al (2001) suggest that TAs can offer possible benefits for pupil learning, including a wider range of learning experiences, more interactions with adults, increased practical activities, and reinforcement of learning. Our aim in the KS2 study was to describe the deployment of TAs in English schools in Years 4-6, and in particular their role in classrooms and how this is perceived by the key parties involved - TAs themselves, teachers and head teachers. We wanted to establish the extent and ways in which TAs interacted directly with pupils, and the extent and ways in which they supported pupils indirectly through administrative and other support for the teacher. We also wanted, on the basis of systematic observations and case studies, to explore the effect the presence of TAs had on interactions involving pupils and teachers in the same classrooms. Conditions of employment and training Another theme to emerge from previous research and comment is a concern about levels of pay, temporary contracts, and the limited career possibilities for TAs, as well as the way that those doing similar work can be on different pay scales. In Scotland, Schlapp et al (2001) identified the potential for high staff turnover because of dissatisfaction. The training needs of TAs are also recognised by many as vital to their effective deployment, along with mentoring in schools and close attention to ways that teachers and TAs work together. HMI (2002) have pointed to the benefits of training on the performance of TAs but there is much that is not known about the impact of current practice. The research approach The research approach adopted for the KS2 study was similar to that used in the reception and KS1 study. It was set up to examine effects of class size differences on
6

pupil attainment and was conceived in the context of our reviews of previous research (Blatchford, Goldstein and Mortimore, 1998; Goldstein and Blatchford, 1998). A main problem is that previous UK research has not employed designs and measures precise and strong enough (see Goldstein and Blatchford, 1998). In the US, the academic and policy debate is almost exclusively centred on the effects of class size reductions. It is often assumed that the problems of early survey research are best overcome by the use of experimental research or randomised controlled trials. This is one reason for the great attention paid to the Tennessee STAR project, where the aim was to assign teachers and pupils at random to small (around 17 pupils), regular (around 23 students) and regular with a teacher-aide classes within the same school. However, as we have argued elsewhere (Goldstein and Blatchford, 1998), there are reasons why randomised designs are questionable, theoretically in terms of the validity and generalisability of results, and also in terms of their usefulness for policy recommendations. In this study we employed a longitudinal research design to capture effects of naturally occurring differences in class size and pupil-adult ratios. With careful attention to research instruments and statistical modelling such 'observational' designs can offer insights into the effects of class size differences by controlling for other factors that might affect the relationship between class size and children's progress. It is now appreciated that perhaps the main gap in understanding of class size and pupil-adult ratio effects is in terms of classroom processes that might be involved (Anderson, 2000). We will examine the effect of class size and classroom processes over KS2 in separate publications; here we are interested in the effect of TAs. Such an observational design is useful in addressing policy issues in that it is more 'authentic', and because it allows comparisons of differences between class size and pupil-adult effects; experimental and observational designs can be seen as complementary but, in policy terms, conclusions about their effects can have different implications. Our reviews indicated difficulties associated with methods of data collection used in much previous research. Different studies have used various research techniques, including teacher reports and interviews, questionnaires completed by teachers, teacher accounts of time spent, and observation studies, but it is not always clear they are covering the same phenomena. Integration of findings across studies is therefore difficult. A more serious problem is that methods used are not always clearly described or adequate. It seemed to us that one way to advance understanding would be to use a multi-method approach, with data collection organised around a common set of objectives and themes (see Blatchford et al, 2003). We collected quantitative information that would enable us to address basic questions on relationships between class size and the presence of TAs, on the one hand, and teacher and pupil behaviour in class and children’s school attainments, on the other hand. But we also wanted a more qualitative assessment of the contribution of class size and TAs, through the use of methods that captured practitioners’ experiences, and through detailed case studies. We therefore deliberately sought to combine quantitative and qualitative methods of data collection. In the KS2 phase of the research there were several additional methods of data collection, including a questionnaire survey of TAs, conducted when pupils were in Years 4-6. Some of the clearest results from the KS1 stage of the study came from a systematic observation study of pupils in small and large classes when in the reception year. Another feature of the KS2 study was that when the pupils were in Y6, that is, the last year of primary school, we conducted another systematic observation study in which we compared the classroom behaviour and interactions of pupils in large and small classes and assessed what impact the presence of TAs had on their behaviour and that of the teachers.
7

Defining and measuring class size and pupil-teacher and pupil-adult ratios may appear straightforward but there are a number of difficulties, and a number of limitations with existing measures. There is insufficient space to discuss these here (see Blatchford, Goldstein and Mortimore, 1998, Goldstein and Blatchford, 1998). Information was collected on the number of children actually in the class at any time ('experienced' class size), the number according to the class register, and any changes over the course of the school year. We also needed to differentiate between different kinds of adult input: teachers, different forms of non-teaching staff assistance, including what we have labelled TAs, and other adults, often parents. Sample The reception and KS1 phase of the Class Size and Pupil-Adult Ratio Project followed for three years a large cohort of pupils who entered reception classes during 1996/7, and a second separate cohort of pupils who entered reception classes one year later during 1997/8. Numbers of LEAs, schools, classes and pupils in each cohort can be found in Blatchford (2003a). The research design involved a random selection of schools within the participating LEAs. All children entering reception in a selected school during the year were included in the study. The KS2 phase of the research followed for a further three years a large cohort of pupils who entered Year 4 during 2000-2001. Because of the time it took to organise the KS2 research grant, and the time required to locate samples of pupils, it was not possible to obtain data on children during Year 3. We also did not follow up the second KS1 cohort schools. The KS2 sample was comprised of the following schools:
1. 75 Schools who were part of the KS1 study of Class Size and Pupil-Adult Ratios Project (‘Continuing Schools’) and had agreed to continue with the research.
2. 17 Schools not previously part of the research, but now attended by pupils who were part of the KS1 study. For example, Junior schools attended by pupils who had been attending Infant schools (‘Destination Schools’).
3. 110 Schools not previously involved with the study (‘New Schools’). The purpose of identifying an additional sub-sample of new schools and LEAs was, given the inevitable attrition over KS1, to provide an even more solid basis for conclusions about the effects of class size and pupil-adult ratios on pupil progress during KS2. The opportunity was also taken to re-balance to some extent the KS1 sample, which somewhat over-represented shire and rural authorities, by over-sampling urban LEAs. A stratified sample of 30 LEAs was created from all English LEAs, excluding those already involved in the KS1 Project. As a way of identifying relevant strata, a distinction was made between LEAs in metropolitan areas and Greater London, and other LEAs (some of which may now be city based unitary authorities), in order to identify those LEAs covering urban and inner city areas as a separate group.
1. Inner and Outer London, Metropolitan areas (including new unitary authorities in old metropolitan authority areas).
2. Non-Metropolitan areas
8

Of the 30 LEA sample, 65% was selected at random from category 1 LEAs, and 35% was selected at random from category 2 LEAs. Fig. 1 KS2 sample sizes
Sample Sizes The following table gives basic information on numbers of schools, classes and pupils Table 1: Characteristics of the KS2 sample, in terms of numbers of schools, classes and pupils Year Number of Schools Number of Classes Number of Pupils Year 4 202 332 8728 Year 5 173 261 6607 Year 6 153 224 5755
Full Longitudinal Study Pupils followed Reception to Year 6 plus cohort year group in destination schools (92 schools)
Partial Longitudinal Study Pupils followed Year 4 to Year 6 110 schools
TOTAL SAMPLE 202 schools 8728 pupils
9

The following tables summarise the characteristics of the pupils involved in the research at its starting point in Year 4. Table 2: Characteristics of the KS2 sample (gender, ethnic background, free school meals eligibility and pupil first language Gender Number Percentage of Sample Female 4267 49% Male 4433 51% Pupil Ethnic Background Number Percentage of Sample White UK 7489 86% White Other 71 Black African 63 Black Caribbean 43 Black UK 17 Black Other 14 Bangladeshi 24 Chinese/Hong Kong 25 Indian 43 Malaysian 4 Pakistani 58 Sri Lankan 2 Other Asian 29 Other Ethnic Groups 27 Dual Heritage 66 Unclassified (by school) 11
5%
Missing Data 742 9% Free School Meals Number Percentage of Sample Eligible for Free Meals 1616 20% Not Eligible for Free Meals 6619 80% Pupil First Language Number Percentage of Sample English 8041 97% Not English 261 3% The sample is split evenly between females and males. The percentage of children eligible for free school meals (a measure of low income) was 20% - just a little more than the national figure at the same time (January 2001). National figures on pupils’ ethnic background are not exactly comparable, but numbers of white pupils (UK and other) appear a little larger than the population at large (91% vs. 86%). The KS2 sample therefore has slightly fewer pupils from ethnic minority groups, in comparison to the school population as a whole. This is also seen in the reduced numbers of children for whom English is not a first language (3% vs. 9%).
10

Data collection There were a number of forms of data collected in the study. As described above, the aim was to use the strengths of different approaches in a complementary way and to check for consistencies across different forms of data, thereby strengthening the validity of conclusions. Data collection was similar to KS1, and involved measures at class and child level, as well as information from teachers, head teachers, TAs, and pupils. Data varied to some extent over the three years, but main categories of data collected were as follows: For the whole sample:
1. Data on class size, pupil-adult ratios and TAs: this came from (termly) questionnaires completed by teachers which asked a number of questions concerning numbers of pupils on the register and at given times during designated times and days. Questions also covered numbers, and types, of additional adults in the classroom, i.e., in terms of whether TAs, SENCOs, parents, etc.
2. Data on teacher activities: information on teacher activities at given times and days was drawn from the same teacher completed questionnaires. This provided measures of time devoted to management and other non-teaching activities and time involved in teaching activities, sub-divided into whole class, small group or individual teaching, as well as more detailed information on grouping practices and curriculum coverage.
3. Teacher questionnaires which asked for information on biographical details (e.g., age, experience, posts of responsibility, qualifications and in-service courses and training) and views and experiences on a range of issues, e.g., effect support from TAs had on teaching and learning, effect of class size on teaching and pupil behaviour, ratings of their professional satisfaction and stress.
4. Head teacher questionnaires which asked for information on a number of issues including allocation of teachers and TAs to classrooms, and policies on training of TAs, and the effect of class size on teaching and pupil behaviour.
5. Teaching Assistant questionnaires which asked for biographical details (e.g., age, experience, qualifications and in-service courses and training), the nature of their work in schools and deployment in classrooms, the extent to which they have allocated time for planning tasks and activities, and feedback and discussion with teachers, and their professional satisfaction.
6. Assessments of pupils in maths and literacy: these were test scores from KS1, including end of KS1 test results, QCA designed tests for the end of year 4 and 5 (optional but conducted in almost all the study schools), and end of year 6 KS2 test scores (in terms of raw scores in maths, English and science sent to us by schools, once marked and returned to them by the QCA).
7. Teacher completed 'Pupil Behaviour Ratings' (PBR) on each child, comprising three behaviour subscales: Hyperactive/distractible, anxious/fearful, and aggressive; and three peer relations sub scales: asocial, prosocial, and rejected. These data are not used in the analysis of TAs.
8. Pupil background details including age, sex, free school meal entitlement, English language fluency, previous nursery education, attendance and special educational needs. In the case of children new to the project at KS2, this information was needed in full; information on children from KS1 was updated where necessary.
11

For a sub-sample of schools:
9. Case Studies of a sub-sample of classes of a different size in years 5 and 6: these aimed to provide a more detailed portrayal of individual classes, which provided the basis for a more interpretive and grounded analysis of factors related to size of class and deployment of TAs. The methodology involved definition of selected aspects of classroom learning and experience and the collection of data from: a) whole class and selected child observations in terms of event sampling of significant events; b) semi-structured interviews with teachers, TAs and pupils; c) end of session/day comments and judgements by field workers; d) summative judgements by field workers, all organised in terms of the main headings. This component made use of experienced teachers as field workers. Quite deliberately, the aim was to marry aspects of systematic observation (which emphasises the objectivity of data), with professional and interpretive judgments by experienced teachers.
10. Systematic observations. The observation component involved a sub-sample of small and large year 6 classes. We used a systematic observation schedule that had been developed in previous research (Tizard, Blatchford, Burke, Farquhar and Plewis, 1988) and was used in the study of pupils when in the reception year (Blatchford, 2003a and b). It involved a 10 second time sampling method and comprised categories describing how children behaved in three ‘social modes’: when with their teachers, when with other children, and when not interacting. Sub categories within each of these three modes covered work, procedural, social, and off-task activities.
Further details of all these methods of data collection are given when results are presented below. Response Rates Response rates for the teacher, head teacher and TA completed questionnaires, and assessment results, are shown in Table 3. These are generally good for the teacher and head teacher questionnaires, especially given that during this time there was much concern about teacher workloads and many educational research projects have struggled to maintain high teacher involvement. The return rate of the TA questionnaires appears low but it must be remembered that we did not know how many TAs there were in schools and classes involved in the research and so we estimated two per class. This was a generous estimate and the number of dispatched questionnaires could have been greater than numbers of TAs – hence deflating the percentage response rate.
12
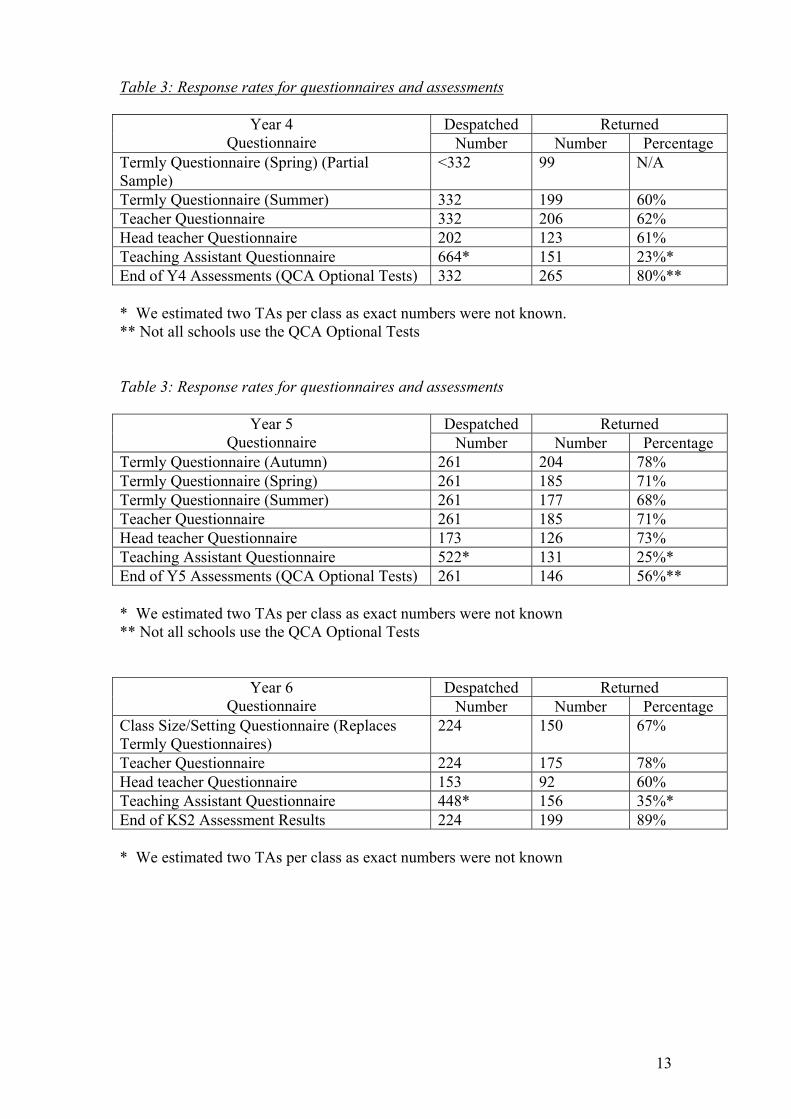
Table 3: Response rates for questionnaires and assessments
Despatched Returned Year 4 Questionnaire Number Number Percentage
Termly Questionnaire (Spring) (Partial Sample)
<332 99 N/A
Termly Questionnaire (Summer) 332 199 60% Teacher Questionnaire 332 206 62% Head teacher Questionnaire 202 123 61% Teaching Assistant Questionnaire 664* 151 23%* End of Y4 Assessments (QCA Optional Tests) 332 265 80%** * We estimated two TAs per class as exact numbers were not known. ** Not all schools use the QCA Optional Tests Table 3: Response rates for questionnaires and assessments
Despatched Returned Year 5 Questionnaire Number Number Percentage
Termly Questionnaire (Autumn) 261 204 78% Termly Questionnaire (Spring) 261 185 71% Termly Questionnaire (Summer) 261 177 68% Teacher Questionnaire 261 185 71% Head teacher Questionnaire 173 126 73% Teaching Assistant Questionnaire 522* 131 25%* End of Y5 Assessments (QCA Optional Tests) 261 146 56%** * We estimated two TAs per class as exact numbers were not known ** Not all schools use the QCA Optional Tests
Despatched Returned Year 6 Questionnaire Number Number Percentage
Class Size/Setting Questionnaire (Replaces Termly Questionnaires)
224 150 67%
Teacher Questionnaire 224 175 78% Head teacher Questionnaire 153 92 60% Teaching Assistant Questionnaire 448* 156 35%* End of KS2 Assessment Results 224 199 89% * We estimated two TAs per class as exact numbers were not known
13

Results In this Report we concentrate on selected aspects of the data collected, and seek to present results in a way which provides a coherent account of the role, deployment and effectiveness of TAs in classrooms. We examine in turn:
1. Basic characteristics of TAs in the study schools and their views on attendance on training courses, tasks carried out, and job satisfaction.
2. Teacher questionnaire answers concerning their experience of the effect of TAs.
3. The view of head teachers about qualifications and training of TAs and the allocation of TAs to classes.
4. Results from a systematic observation study of the effect of TAs on pupil and teacher classroom behaviour.
5. Case studies of selected schools concerning the deployment and impact of TAs.
6. The main statistical analysis of the effect of TAs on pupil academic progress and teaching time across KS2.
The concluding section identifies key results and issues which emerge from the study.
14

1. Teaching Assistant questionnaires 2000 – 2003 There were two main categories of questions in Teaching Assistants’ questionnaires – closed questions where possible answers were devised on the basis of pilot work and supplied on the questionnaires (e.g., concerning length of time working as a teaching assistant), and questions that asked for an open ended answer (e.g., suggestions for improving their job satisfaction). In the case of the latter, two of the researchers independently coded the returns from all Y5 TAs and then agreed a combined set of categories. This was then applied independently to all responses and a high level of agreement was found. This coding frame was then applied to the data from Years 4 and 6 and adapted where necessary to include categories of response which had not been found in the Year 5 data. Results from the closed questions are given in this section, while Appendix 2 contains the tables of data from the open questions. In most cases the data are from three years, but some questions were only asked in two of them.
Biographical details Table 4: The age of TAs TA Age
Year 4 Year 5 Year 6 Key Stage 2 (Total)
Number % Number % Number % Number % 25 and under 6 4% 4 4% 4 5% 14 4 26 to 30 0 0% 5 5% 3 4% 8 2 31 to 40 62 41% 30 30% 30 35% 122 36 41 to 50 54 36% 44 44% 30 35% 128 38 51 to 60 27 18% 16 16% 19 22% 62 18 61 and above 1 1% 1 1% 0 0% 2 <1 Table 4 shows the age profile of the TAs in this study. Since nearly all TAs are women, their age profile reflects the typical child bearing and rearing phases of their lives. The great majority of TAs are aged between 31 and 50, when any children they may have are likely to be at school, or old enough to be relatively independent. This phase of their parenting allows these women to seek employment as TAs, especially as it fits better than many other forms of work, with their children’s needs. As women can retire and receive their state pension at 60 years of age, it is not surprising that so few TAs are more than 60 years old. Table 5: Years experience as a TA
Year 4 Year 5 Year 6 KS2 Years of Experience
Number % Number % Number % Number %
Less than 1 year 25 17% 15 15% 7 8% 47 14 1 to 5 years 84 56% 59 59% 45 53% 188 56 6 to 10 years 20 13% 15 15% 21 25% 56 17 11 years or more
21 14% 11 11% 12 14% 43 13
Table 5 shows the length of time they have been paid as a TA. The majority of TAs (70%) have only up to 5 years experience; only 30% have been a TA for 6 or more years.
15

Table 6: Whether TA is parent of child in school and was volunteer in the school
Year 4 Year 5 Year 6 Key Stage 2 TA Experience Yes No Yes No Yes No Yes No
n n/a n/a 30 70 20 69 50 139 TA is current parent at the school
% n/a n/a 30% 70% 23% 78% 26% 74%
n n/a n/a 38 57 39 50 77 107 TA was parent at the school
% n/a n/a 38% 57% 44% 56% 42% 58%
n n/a n/a 44 56 45 43 89 99 TA was volunteer at the school
% n/a n/a 44% 56% 51% 49% 47% 53%
Table 6 shows that only one quarter of TAs are parents of children currently in the school, though this increases to two thirds (68%) when we include TAs who are parents of children who used to be at the school. We also asked whether, before they were employed as a TA in the school, they were a volunteer at the school. This prior volunteer experience was true of just under half the TAs. These sorts of connections are significant in terms of recruitment, as they represent a constantly renewing source of women who will be interested and available to become TAs in their local schools. Qualifications and Training Table 7: TA highest level of qualification Level of Qualification Held
Year 4 Year 5 Year 6 Key Stage 2
Number % Number % Number % Number % No qualifications 15 11% 8 8% 12 14% 35 11 GCSE Grades D-G/CSE equivalent
16 12% 7 7% 11 12% 34 10
GCSE Grades A-C/O’Level equivalent
54 39% 39 39% 29 33% 122 37
A Level Equivalent
33 24% 29 29% 17 19% 79 24
Degree Equivalent
13 9% 10 10% 12 14% 35 11
Higher Degree 4 3% 1 1% 2 2% 7 2 Other 4 3% 6 6% 6 7% 16 5
Total
328
We asked TAs to tick the highest level of qualification that they held. Results are shown in Table 7. They fell into three general groups. We see that only about 1 in 5 (21%) had either no qualifications or GCSE grades D – G.
16
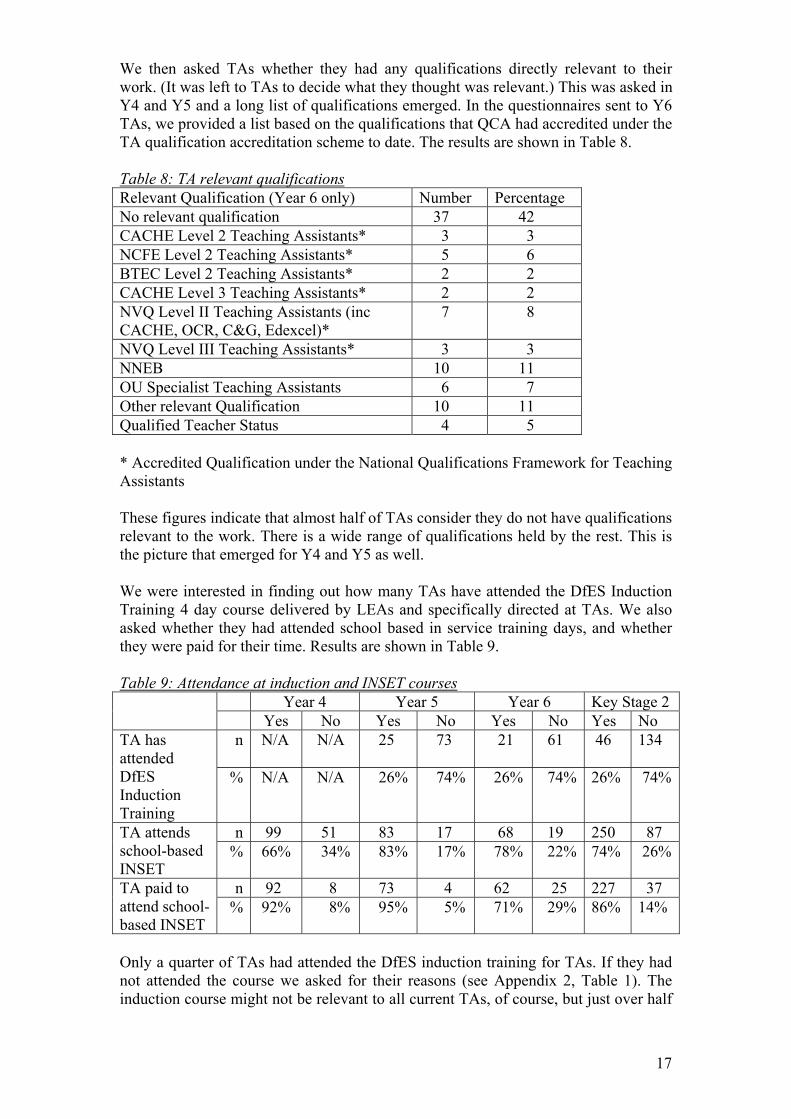
We then asked TAs whether they had any qualifications directly relevant to their work. (It was left to TAs to decide what they thought was relevant.) This was asked in Y4 and Y5 and a long list of qualifications emerged. In the questionnaires sent to Y6 TAs, we provided a list based on the qualifications that QCA had accredited under the TA qualification accreditation scheme to date. The results are shown in Table 8. Table 8: TA relevant qualifications Relevant Qualification (Year 6 only) Number Percentage No relevant qualification 37 42 CACHE Level 2 Teaching Assistants* 3 3 NCFE Level 2 Teaching Assistants* 5 6 BTEC Level 2 Teaching Assistants* 2 2 CACHE Level 3 Teaching Assistants* 2 2 NVQ Level II Teaching Assistants (inc CACHE, OCR, C&G, Edexcel)*
7 8
NVQ Level III Teaching Assistants* 3 3 NNEB 10 11 OU Specialist Teaching Assistants 6 7 Other relevant Qualification 10 11 Qualified Teacher Status 4 5 * Accredited Qualification under the National Qualifications Framework for Teaching Assistants These figures indicate that almost half of TAs consider they do not have qualifications relevant to the work. There is a wide range of qualifications held by the rest. This is the picture that emerged for Y4 and Y5 as well. We were interested in finding out how many TAs have attended the DfES Induction Training 4 day course delivered by LEAs and specifically directed at TAs. We also asked whether they had attended school based in service training days, and whether they were paid for their time. Results are shown in Table 9. Table 9: Attendance at induction and INSET courses
Year 4 Year 5 Year 6 Key Stage 2 Yes No Yes No Yes No Yes No n N/A N/A 25 73 21 61 46 134 TA has
attended DfES Induction Training
% N/A N/A 26% 74% 26% 74% 26% 74%
n 99 51 83 17 68 19 250 87 TA attends school-based INSET
% 66% 34% 83% 17% 78% 22% 74% 26%
n 92 8 73 4 62 25 227 37 TA paid to attend school-based INSET
% 92% 8% 95% 5% 71% 29% 86% 14%
Only a quarter of TAs had attended the DfES induction training for TAs. If they had not attended the course we asked for their reasons (see Appendix 2, Table 1). The induction course might not be relevant to all current TAs, of course, but just over half
17

(53%) said they did not know about the course or they had not been told about or offered it. Another 21% said it was not needed or irrelevant. This includes those whose long-term involvement in TA work, or previous work as teachers, was seen as ruling out the need for the training. Another 13% gave no explanation or did not know why.
“Never been asked to attend the course. I would love to attend it.” Y5 TA “Don’t know anything about it!” Y6 TA “16 years experience as an LSA (so did not feel course was needed).” Y5 TA
If they had attended the DfES Induction Training they were asked to say whether and, if so, in what ways it had changed the way they did things in school. Results are shown in Appendix 2, Table 2. Over half said it had changed how they did things; the main ways being that it provided them with a clearer understanding, provided useful work on behaviour management, and helped them become more aware of learning styles. The majority of responses expressed positive effects on their way of working.
“Most of the induction I was already using in class. The behaviour management section, however, was an extremely helpful part of the course for dealing with children with problems.” Y5 TA “Made me more aware of how pupils learn and how this affects their learning.” Y6 TA
One way of ensuring that TAs get training, is for schools to include TAs in their INSET sessions. As seen in Table 9, 74% of TAs report attendance at school-based INSET and this is encouraging. However this survey did not ask for details of the INSET, or for the TAs’ opinions of how relevant and useful it was in their interactions with pupils. Most TAs who did not attend INSET, gave similar answers to those given for the DfES course, i.e., the main reasons were not being asked to attend or it was not seen as relevant. In addition, some said it was not in their contract, they were not paid or it was on their non-working days (See Appendix 2, Table 3). Reasons for not attending any other training courses (leading to a qualification or other courses outside the school) are given in Appendix 2, Table 4. The main reason again was not being aware of, or not being told about, the courses, and that it would be inconvenient
“I assume lack of funds, never been asked to attend.” Y5 TA “Not paid for this.” Y6 TA “I have not been offered one yet.” Y6 TA
18

Hours of employment in classes Table 10: Hours TA worked in each class
Year 4 Year 5 Year 6 Key Stage 2 Hours worked in class
Number % Number % Number % Number %
2 hours or less per week
24 13% 5 4% 5 4% 34 8%
2 to 5 hours per week
55 29% 23 18% 22 20% 100 23%
5 to 10 hours per week
40 21% 33 26% 36 32% 109 25%
10 to 20 hours per week
48 25% 48 37% 35 31% 131 31%
20 hours or more per week
21 11% 19 15% 15 13% 55 13%
Mean 11.4 hours Min 0.5 hours Max 32.5 hours
Mean 12.2 hours Min 1.0 hours Max 32.5 hours
Mean 11.9 hours Min 0.5 hours Max 37.5 hours
The next question asked for the hours worked in any particular class, rather than their total hours of employment in the school (see Table 10). The figures show that there was a very wide range of responses, from those (31%) with less than 5 hours per week in a class, to those with 5 - 20 hours per week (56%). This indicates that the opportunities for TAs to support teachers and pupils will vary tremendously when taking allocated time into consideration. It is only a small minority who appear to spend most (i.e., more than 20 hours) of their time in one class. Deployment of TAs We asked TAs a number of questions about their work in schools. We first asked them if they were employed to provide support for one or more specified individuals, for example, supporting a statemented pupil. Results are shown in Table 11. Table 11: Extent to which TA employed to support named individuals
Year 4 Year 5 Year 6 Key Stage 2 Yes No Yes No Yes No Yes No
Number
73 76 53 49 41 48 167 173 TA employed to work with at least 1 statemented child
% 49% 51% 52% 48% 46% 54% 49% 51%
Over KS2 about half of the TAs are employed specifically to support at least one named pupil who has SEN of some kind. We then asked them to tell us about their main area of work by ticking one of the boxes in Table 12. This table gives more detail on how they are supporting pupils.
19

For the most part they are supporting specific groups, e.g., for SEN/behaviour (32%), supporting named individuals with SEN (12%), or one individual pupil with SEN (16%). When added together we can therefore estimate that for the majority of TAs (60%) their work consists of supporting specific, named pupils in the class. It is also interesting, however, that over a third of TAs provide general support for all pupils. These two types of support may overlap; the case studies showed that even when ostensibly providing support for named pupils, TAs can interact with and offer support to other pupils, particularly those in the same group. But the main message of the table is that for the most part TAs support the work of the teacher by supporting pupils (rather than through other kinds of support, e.g., preparing materials, photocopying, etc.) Table 12: Main areas of TA work in classrooms
Year 4 Year 5 Year 6 Key Stage 2 Main areas of work
Number % Number % Number % Number %
General support for all pupils
28 25% 48 49% 47 41% 123 37
Support for specific groups e.g.SEN/behaviour
48 43% 26 26% 30 26% 104 32
Support for named individuals (SEN)
13 12% 6 6% 19 17% 38 12
Support for one individual only (SEN)
18 16% 17 17% 16 14% 51 16
Other 5 4% 6 6% 2 2% 13 4 Totals
112
103
114
329
We then asked an open-ended question of TAs, in which they documented the tasks they carried out in the classroom. This provided a detailed and fascinating account of tasks performed and is shown in Appendix 2, Table 5. The results complement those from the last table (Table 12). There are two main types of activity: in line with results from the last table, TAs spend most time supporting pupils (73% responses). This is expressed either through reference to the actual pupils supported (28%), mainly groups or pairs of pupils, but more commonly through reference to the curriculum area in which they provide support for pupils (41%). The most common reference is to literacy (2a + b = 20% of responses), followed by maths (9%). This accords with the teachers’ accounts of how TAs are deployed (see next section). The emphasis on the two core subjects is not surprising, as they take up more time each day than any other part of the curriculum. We can say, therefore, that TAs are providing a pedagogical role in the classroom, in the sense that a main feature of their role consists of face-to-face interactions with the educational purpose of supporting learning. This direct interactive support for pupils forms the largest contribution which TAs make to schools. In the next section we shall see that teachers also agree that this is the predominant activity of TAs. It might be that this result may be at least partly connected to the way we asked the question: that is, we asked TAs to tick the main area of work they worked on within each of the
20

classrooms, and this may have excluded some work outside the classroom, for example, involving administration or photocopying. However, there are two reasons why this is unlikely to account fully for the results. The first is that TAs spend the bulk of their time in classrooms, though it is true that we do not have an exact quantitative account of this. The second reason is that when we turn to the other main aspect of their work – supporting the teacher directly – we find cited a number of activities that must have taken place out of the classroom. In other words, TAs did not restrict their answers just to activities located in the classroom. This category is less commonly mentioned (27% of responses). It is, in turn, divisible into four main activities: handling materials (displays, photocopying, preparation – 14%), administration (4%), activities related to teaching (but not face to face teaching – 6% - marking and correcting pupil’s work, recording marks and keeping records), and general activities such as playground duty (3%). Teachers are therefore mostly using TAs to work with pupils, rather than providing support of other kinds. In other words, support given directly to pupils by far outweighs support given to teachers. We shall see below that the majority of TAs are satisfied or very satisfied with their work, and the second main factor contributing to their level of satisfaction (after relations connected to the teacher) are aspects of their relations with pupils (like enjoying helping them progress) so this seems to indicate that they are happy to be used by teachers to support pupils’ learning.
“Enjoy helping children develop and make progress. Enjoy encouraging confidence and self-reliance in children. Like being used to full by teachers.” Y6 TA “I really enjoy working with this age group. I find it very rewarding working with SEN children, working on their development.” Y5 TA
Putting together several results from this section, we can draw a main conclusion that it is the pupils in most need who are receiving the TA support. As we saw in Table 11, about half are employed to work with at least one statemented child and we saw in Table 12 that 60% of their time is spent supporting specific groups or individuals with special needs. We shall see that teachers are frank about deploying their TAs in support of those pupils in most need – those with SEN, and those with the poorest attainment and behaviour. On the whole, TAs appear content with this but a few raised queries about being set to work with the ‘neediest’ pupils.
“All my time is spent with low ability children…..I find this difficult…poorly behaved and easily distracted….at least 20 different children for such limited amounts of time. I feel I don’t get to know them sufficiently well….frustrating….” Y5 TA
TAs’ answers to questions about training and qualifications show that some are under-prepared for the demands of their interactive role with pupils. The quote below reveals a strong expression of this mismatch between training and role.
“ ….I feel I am being asked to take on more and more responsibility without the training and back up. I feel I am expected to take on some of the jobs that teachers would have done in the past. It’s not that I mind doing it so much as feeling that the children are being ‘short changed’. I do not have qualifications to be a teacher and think that if I had a child with special needs, I would want
21
them to work with the teachers as much as the others do. However experienced we are – we are not teachers.” Y6 TA
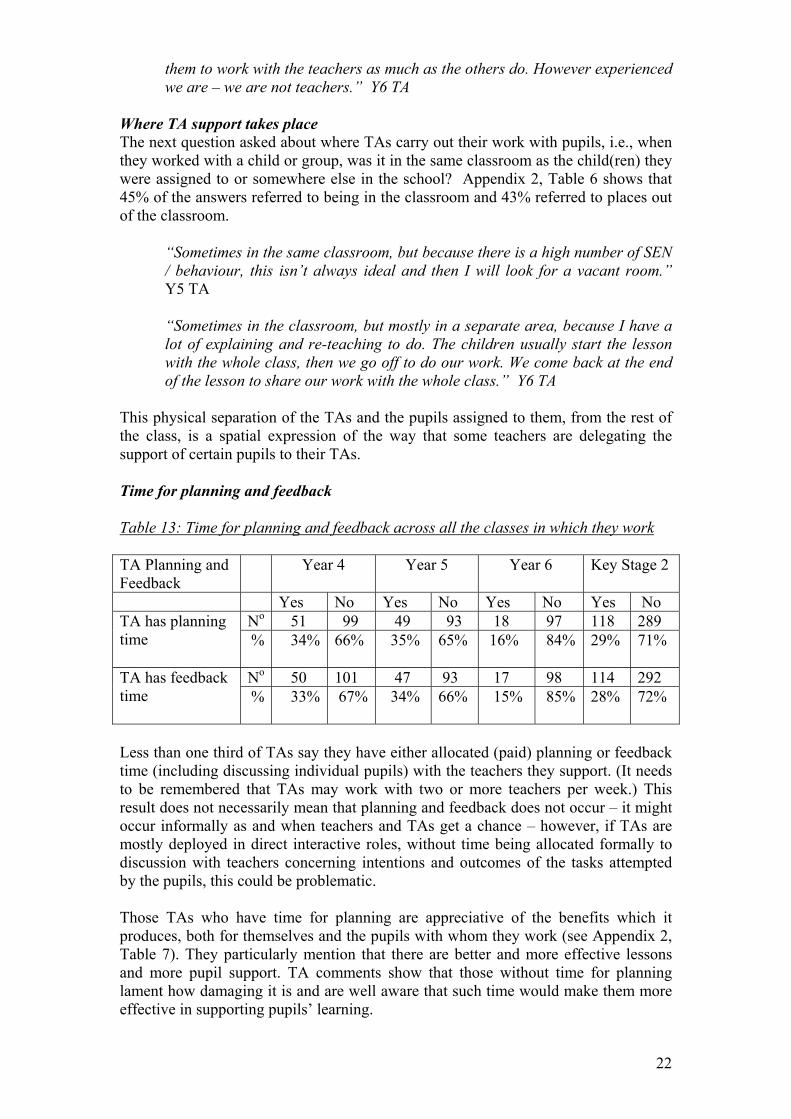
Where TA support takes place The next question asked about where TAs carry out their work with pupils, i.e., when they worked with a child or group, was it in the same classroom as the child(ren) they were assigned to or somewhere else in the school? Appendix 2, Table 6 shows that 45% of the answers referred to being in the classroom and 43% referred to places out of the classroom.
“Sometimes in the same classroom, but because there is a high number of SEN / behaviour, this isn’t always ideal and then I will look for a vacant room.” Y5 TA “Sometimes in the classroom, but mostly in a separate area, because I have a lot of explaining and re-teaching to do. The children usually start the lesson with the whole class, then we go off to do our work. We come back at the end of the lesson to share our work with the whole class.” Y6 TA
This physical separation of the TAs and the pupils assigned to them, from the rest of the class, is a spatial expression of the way that some teachers are delegating the support of certain pupils to their TAs. Time for planning and feedback Table 13: Time for planning and feedback across all the classes in which they work TA Planning and Feedback
Year 4
Year 5 Year 6 Key Stage 2
Yes No Yes No Yes No Yes No No 51 99 49 93 18 97 118 289 TA has planning
time %
34% 66% 35% 65% 16% 84% 29% 71%
No 50 101 47 93 17 98 114 292 TA has feedback time %
33% 67% 34% 66% 15% 85% 28% 72%
Less than one third of TAs say they have either allocated (paid) planning or feedback time (including discussing individual pupils) with the teachers they support. (It needs to be remembered that TAs may work with two or more teachers per week.) This result does not necessarily mean that planning and feedback does not occur – it might occur informally as and when teachers and TAs get a chance – however, if TAs are mostly deployed in direct interactive roles, without time being allocated formally to discussion with teachers concerning intentions and outcomes of the tasks attempted by the pupils, this could be problematic. Those TAs who have time for planning are appreciative of the benefits which it produces, both for themselves and the pupils with whom they work (see Appendix 2, Table 7). They particularly mention that there are better and more effective lessons and more pupil support. TA comments show that those without time for planning lament how damaging it is and are well aware that such time would make them more effective in supporting pupils’ learning.
22

“This makes me more confident. I can back the teacher up. If a pupil did not hear the instructions then I can back the lesson in correct manner.” Y6 TA “I think that it inevitably means that any instructions from the teacher…..have to be carried out in a very hurried manner. This does mean that as you don’t always feel as prepared as you would like to be, that you are not always offering the best level of support.” Y6 TA
However it is also clear from Appendix 2, Table 8 that the most common response from TAs to not having time for planning is that they cope without it, e.g., by seeing the teacher before the lesson, following the teacher’s written plans and tasks written in books, listening to the teacher’s introduction to the lesson, or simply following their own initiative. This shows a commendable adaptation to a busy working arrangement, though whether it maximises the potential of the TAs’ time in the classroom might be questioned. Feedback time is also viewed positively (73% of their comments) by those who receive it (see Appendix 2, Table 9). They realise that their own work with pupils is enhanced when they are able to share the difficulties and successes with the teacher who planned the tasks. Main aspects mentioned are that it is a helpful or good thing, it helps evaluate pupils’ progress, it means that they are more sensitive to pupil needs, work is more productive, and improves communication with the teacher.
“This is an essential part of the day to further produce ‘Plans of action’ etc. for future lessons with pupil/s.” Y5 TA “My opinions/ideas are taken into account when planning the child’s IEP. I feel that this is important as I am the person who observes the child’s initial reactions to the tasks set for him.” Y6 TA “I would prefer more time for feedback as I often feel my work goes un-noticed.” Y6 TA “Sometimes I feel that a child hasn’t understood something or needs to go through it again. If I can’t explain this to the teacher she’ll plan other work and the child loses out.” Y5 TA
Again, the single most frequent comment for those TAs who say they do not have time for feedback is that they have found alternatives, e.g., discussing between lessons, discuss in their own time, or using forms and notes (see Appendix 2, Table 10). Many TAs therefore have working arrangements that mean that all their paid time is allocated to classes, and it is left to them to either adapt as best they can, or use unpaid time to do any preparation or feedback with the teacher.
23

Levels of job satisfaction Table 14: Levels of job satisfaction across all classes in which they work Year 4 Year 5 Year 6 Key Stage 2 Level of TA Satisfaction
Number
% Number
% Number
% Number
%
Very satisfied 89 45% 66 50% 61 54% 216 49 Satisfied 87 44% 48 37% 32 28% 167 38 Neither satisfied nor dissatisfied
14 7% 11 8% 14 12% 39 9
Dissatisfied 5 3% 5 4% 5 4% 15 3 Very Dissatisfied 2 1% 1 1% 2 2% 5 1 Total number 442 When asked a general question about their level of job satisfaction, the overwhelming majority of TAs (532/609) say they derive satisfaction from their work. There are only a very small number of dissatisfied or very dissatisfied TAs. We also asked TAs to give their reasons for their level of satisfaction. The results are shown in detail in Appendix 2, Tables 11 to 15. We shall see in the next section that TAs are viewed by many teachers as a very welcome feature of classroom life. This positive attitude towards them is what TAs seem to look for more than anything else, in terms of job satisfaction. Those who are satisfied or very satisfied make more reference to their relationship with their teachers, than any other factor (27% and 34% of all responses at each level of satisfaction). Common sub categories are reference to having a good relationship with the teacher, working as a team and being partners. They use terms such as ‘respect’, ‘valued’ and ‘appreciated’ and express the good relationship they have, which produces the feeling of being part of a team.
“The teacher and I work extremely well together and have a good level of communication. I feel we work as a team which benefits the class and therefore makes the job very satisfying.” Y4 TA “The teaching staff that I work with treat me as an equal and I share responsibility with them for the education and care of the children we work with and the whole school.” Y5 TA “I get on very well with the Y6 teacher and aware of how she works and how she likes to run the class. I find out exactly from her what is required and what the timescales are and she allows me to then manage my own time. Appreciated by staff and know that my work is valued. It is a lovely school to work in. “ Y6 TA
Clearly, where teachers are able to produce such feelings, the TAs’ level of job satisfaction rises.
The second main reason for being satisfied or very satisfied is connected to pleasure over the progress made by pupils (24% and 28% of all responses for each level of satisfaction). Common sub categories are feeling good about helping pupils progress and learn, working with children, and positive views about the nature of the children they work with.
24

“My satisfaction with my job in all 4 classes is because I get great job satisfaction in seeing how much [difference] my help has made to the children.” Y6 TA (very satisfied) “Knowing that the children have grown in confidence and ability and that they trust me and give me their best.” Y5 TA (very satisfied)
Like teachers, as we shall see in the next section, TAs therefore seem to perceive that pupils make progress through being supported by them. The main reasons for being either dissatisfied or very dissatisfied are references to certain aspects of their role, though there were only 13 such responses over KS2. They included being bored and not having enough to do, things like being hectic and being unprepared, disjointed work and too many pupils, no time to plan or feedback and disagreeing with the teacher or finding her disorganised and unprepared, and finding the job was mostly crowd control. The final question asked TAs if there was anything they felt would improve their level of job satisfaction. Answers are shown in Appendix 2, Table 16. The most common category of answer (25% of responses) was reference to changes in pay and conditions of employment. Sub categories were: a salary to match their qualifications, experience and responsibilities, job security and permanent contracts, being valued by the Government, LEA and school.
“….the level of responsibility and workload have increased dramatically but my pay has not really changed. I would also appreciate a greater acknowledgement of the level of work I do from certain teachers. I believe TAs are looked down on by certain teachers. I believe a clearer job definition and pay linked to workload and responsibility should be looked at for all TAs.” Y5 TA
Some who fall in this category say that role as supporters of pupils’ learning has increased dramatically, but their standing within schools – reflected in things such as admission to staff rooms and meetings, rates of pay and inclusion in lesson planning and feedback – is lagging behind. There is some resentment at the pay differentials across the staff of the school, where some of those who have no pedagogical role at all, are paid more per hour than TAs, who support pupils all or most of the time.
“I would like to see an end to the two-tier system of support staff. Qualified and unqualified both doing the same job but with a huge difference in salary! I am responsible for the ‘teaching’ of the groups I work with. Although I do not expect to be paid as a teacher, I do expect to be paid more than the cleaner!” Y4 TA
Some in this category also make comparisons between teachers’ pay and their own. Whilst accepting the higher levels of qualification and responsibility of teachers, they point out that they provide an important interactive and educational support for pupils, a point also accepted by some head teachers, as we shall see in a later section. Yet, at present, many TAs are still being employed and paid as though they only provide teachers with unskilled, low-level support. In fact, as we shall see in the case study section below, most interact with some pupils for sustained periods, in some cases for longer periods than the class teacher.
25

The second most common suggestion about how to improve their level of job satisfaction was changes in deployment (20%), e.g., being involved in planning, working in only one class or year group, being more involved in school activities, having better communication in the schools, eg., meetings of LSAs, and having more work with pupils. The third main category referred to time changes (17%), e.g., time with the teacher for planning and feedback. The fourth most frequent suggestion (11%) concerns training, e.g., having more courses and INSET during school time. This was also supported by some headteachers:
“Training and qualifications are becoming more important as CAs take on more group work involving delivery of numeracy and literacy. If they are not trained it belittles the professionalism of teachers when it’s perceived they are undertaking teaching duties.” Y5 Head teacher survey
“We are increasingly asking more and more of TAs in some respects they are expected to be ‘quasi-teachers’. With the current level of training this is just not possible.” Y6 Head teacher survey
Overall, therefore, TAs are satisfied with their jobs, but improvements to their level of job satisfaction would come from more attention to their pay and conditions of employment, role definitions and responsibilities, more time for feedback and planning with teachers, and provision of training. It needs to be noted that a few TAs feel that they are not treated well by teachers or schools. At least 5 TAs are not allowed in the staff room or to attend staff meetings, for example. Their expressions of hurt over this appear quite reasonable, considering the close way in which most TAs are now expected to work with teachers and with pupils. Some schools appear to have failed to properly manage the enormous shift in TAs’ roles and some TAs are expressing their grievances in their questionnaire responses.
Conclusions to TA questionnaire • Interactions with pupils dominate the work of TAs. They are mainly employed to
support teaching and learning in face-to-face interactions with pupils. They most often refer to curriculum support and working with pupils
• TAs’ direct support for pupils far outweighs indirect support for pupils, e.g., by
helping the teacher through photocopying. • For most of their time TAs are supporting the pupils in most need, rather than
pupils across the whole range of attainment. • Many TAs have not been specifically prepared for their main task and almost half
have no qualification which they judge relevant. We could therefore conclude that there is a mismatch between the way TAs are deployed and their professional preparation for their most common role – the support of pupils’ learning.
• Most TAs attend school based INSET, but few have attended the DfES Induction
Course. Only about a quarter have paid time allocated to planning with, and feeding back to, teachers.
26

• The great majority of TAs are satisfied or very satisfied with their jobs. The most
common reason for satisfaction with their jobs is having a good relationship with the teacher, working as a team and being partners, followed by satisfaction from working with pupils and seeing them progress.
• The thing that would most improve their job satisfaction would be changes in pay
and conditions of employment to match their qualifications, experience and responsibilities.
• Some have the view that their role as supporters of pupils’ learning has increased
dramatically, but their standing within schools – reflected in such things as admission to staff rooms and meetings, rates of pay and inclusion in lesson planning and feedback – is lagging behind.
27

2. Teacher questionnaires 2000-2003 Questionnaires were sent out to teachers when pupils were in Years 4, 5 and 6. There were 206, 185 and 175 questionnaires returned for Y4 - 6 respectively. One question asked them if they had support from a teaching assistant this year and to comment on the difference this had made (if any) to the teaching and learning in their class. The Year 6 responses were used to devise a coding frame for application across the three sets of responses. Three members of the research team analysed the responses independently and drew up a set of categories. A high level of agreement was found, and two of the researchers then applied it independently to the Year 6 data, coding each teacher’s response for the categories included in their answers. The two sets of codes were then brought together for comparison and there were very few points of disagreement. The final set of categories was then used to code the teachers’ responses from the Years 4 and 5.
The frequencies and percentages for each main and sub-category can be found in Appendix 1, Table 1. There was very close agreement across year groups, and the three sets of data were also combined, that is, across Key Stage 2. The final list of categories was as follows:
A. Differences to teaching and teachers 1. Academic
i) Frees teacher / teacher with more able / teacher concentrates on teaching ii) Enables teacher to do practical lessons / ICT iii) Smaller groups / group work benefits / more differentiation iv) Curriculum: a) literacy
b) numeracy c) other / booster groups
v) Helps mark / record / organise homework vi) Plans lessons vii) Miscellaneous effects
2. Classroom management and control i) Maintains control / rules ii) Non-teaching pupil problems
3. Support role i) Teacher ally / support
4. Practical non-teaching support i) Administration ii) Displays iii) Photocopying iv) Miscellaneous
B. Differences to learning and learners i) Pupil progress / more / faster ii) Pupils stay on task iii) Pupils gain confidence iv) Reinforcement / understanding v) Behaviour
28

vi) Pupils more able to share problems vii) Miscellaneous effects
C. TA role / interaction with pupils i) Works with groups of 2 or more ii) Works with named individuals / statemented iii) Works with pupils 1:1 iv) Works with all abilities v) Works with less able / SEN / disruptive vi) Works with more able vii) Observes and identifies weaknesses
D. General descriptive responses i) Positive opinions ii) Negative opinions :
a) stress; b) time taken; c) limitations of TA The responses therefore fell into four main categories: A. Differences to teaching and teachers; B. Differences to learning and learners; C. TA role / interaction with pupils; and D. General descriptive responses. It is interesting that teachers refer much more to the differences TAs make to teaching and teachers than to learning and learners (37% compared with 16% of the total number of responses). Roughly a third of responses (31%) in each year dealt with the TAs’ role, covering the particular types of pupils supported and the organisational arrangements used (e.g. groups, one to one). The fourth category of responses was unsolicited in the question, but it provides an insight into the feelings and attitudes of the teachers towards the TAs. They constituted 16% of the total responses. Once the coding and collation of data were complete, it was clear that certain categories of response were more significant than others, in terms of the numbers involved. This report confines itself to a consideration of the nine categories with total responses that exceeded 50, and what they reveal about the effects and roles of TAs, as reported by class teachers in KS2. The discussion is illustrated with representative quotes from teachers. Category A 1i): Frees teacher / teacher with more able / teacher concentrates on Teaching There were 94 responses in this category (see Appendix 1, Table 1). The main feature is the way teachers delegate the support of their SEN / less able pupils to their TAs. The result, for them, is to allow them to concentrate on the rest of the class. In the view of teachers, nothing else the TAs do makes such a contribution to teachers' own time and attention.
"They [TAs] have .....enabled me to spend more time with my more able groups, being able to stretch them and improve their level" (Y4) "Usually support from a TA makes it possible for less able children to be focused, freeing me to work more meaningfully with other children in the class." (35) (Y5) "Support has made a great difference and allowed me to focus on the more able without having to worry / constantly re-visit those less able." (Y5)
29

But a general point to make, which we return to below in the commentary on Category Cv, is that this solution to having pupils with SEN integrated into mainstream classes may work from the point of view of the teachers feeling justified in giving more of their attention to the pupils without SEN, but the teachers’ answers raise questions about the effectiveness of the strategy from the point of view of the pupils supported by the TAs (See also Category Bi). Certainly, the pupils supported by the TAs are receiving more adult attention than would otherwise be possible, but this is from TAs, not teachers, and the benefits, at least as reported by teachers, are unclear. We do not have data on the actual interactions with pupils but data from the teacher questionnaires, as well as the questionnaires from TAs, indicates that TAs are not so much supplementing teachers as replacing them, in terms of moment by moment interactions with certain pupils. From the teachers’ questionnaires it is easier to see the benefits for the pupils supported by the class teacher.
One practical outcome arising from the way TAs are generally deployed, is that groups are made smaller or fewer in number for the teacher to support. This potentially increases the amount of interaction each pupil in those groups has with the teacher. But this again raises questions about the extent to which this is at the expense of the pupils working with the TAs.
"The support teacher takes out Literacy and Maths groups so enabling me to teach smaller numbers. I can deal with individuals and groups far easier." (38) (Y5) "It also gives me time to work with smaller groups of children more frequently." (27) (Y5) "Having an ordinary TA allows me to spend more time with smaller grouped tasks..." (Y5) "She can take a group elsewhere to work which means they get the support they need and I have less children in the classroom to pay attention to." (Y4) "Maths - I usually teach - set up the topic - then leave the CA to get on - I work with 3 other groups dividing my time between the groups." (Y6)
A minority of teachers report that their TAs are not confined to the SEN and 'low ability' pupils, but rather they are using them in ways which allow the class teacher to give such pupils more support than would otherwise be possible. This is an alternative approach and has the advantage that the pupils in most need are given greater support by the most professionally trained educator - the teacher.
"She supports either the less able or the more able (differentiation group). This allows me to focus on a group working closely with them and learning outcomes are always much better." (Y4) "They support all abilities, including the more able." (31) (Y5) "Extending higher ability beyond whole class objectives. Supporting lower ability so they are able to complete same tasks as rest of class." (29) (Y4)
30

Another aspect of TA support which releases or frees the teacher is their performance of non-teaching duties, such as preparation of materials, marking and displays. Category A4 contains relatively few such responses (57 overall), so in comparison with their direct, interactive role in the classroom, it seems that such non-teaching support is only a small aspect of most TA's work. It can, however, be beneficial to teachers in what they see as their main occupation - the teaching of their class.
"It has released me from tasks such as photocopying, tabulating results and sorting out children who have specific difficulties (using a lap top for example.) (31) (Y5) "She helps with photocopying, some marking.....and supports generally e.g. dealing with issues that arise - lost PE kit....etc......the tasks she helps with enable me to focus on other matters with more energy." (Y6) "...assistant to help with admin and photocopying has meant time available to plan and research lessons." (Y4)
Another component contributing to teachers, is what TAs do to help them cope with pupil misbehaviour. Again, as with the previous component, the number of responses in Categories A2 and Bv is small, but teachers see a link between the TAs being available to react to misbehaviour and their own ability to remain focused on teaching.
"Also very useful for reinforcing behaviour management strategies." (Y4) "When present they are very effective with providing extra support to those with learning and behavioural difficulties and therefore allows the teacher more time to teach children and assist their learning meaningfully." (Y5) "Behavioural support (works with one very challenging child and one other) - without whom the rest of the class would find their learning completely disrupted at times." (Y6)
Category A 1iv) Curriculum a) literacy It is not surprising that of all the references to aspects of the curriculum, most are about literacy. It is the major preoccupation of primary teachers and so using TAs to support it seems appropriate. This was referred to in 121 responses over the three years, to an equal extent in each year.
"The children who benefit most are the small groups she takes out during registration and assemblies to do spelling and reading practice." (36) (Y5) "20 minute sessions working with 5 children to support in literacy and language skills (ALS). These sessions have supported and helped the children to improve their language skills." (Y4) "The bulk of their time is spent teaching small groups such as FLS, Springboard, Better Reading Partnership." (Y6)
31

"CA play a valuable part during literacy, especially with reading, spelling and general guidance. Support with any worksheets used is a great time saver." (Y6) "Running supported reading sessions in group work in the literacy hour. Assessing pupils' contributions during shared text / word and sentence level work during the literacy hour." (Y4)
Since most TAs are supporting SEN and 'low ability' pupils most of the time, it is to these pupils that most of their literacy support is given. There is hardly any mention of TAs doing literacy tasks with the 'more able' pupils.
"I have supported my least able guided reading group on a daily basis and my TA has worked with the remaining 5 groups on a rotational basis." (37) (Y4)
The vast majority of the references to literacy support do not give any further details of the form or extent of the support, but it is clear that teachers feel it is the area which should absorb most of their TAs’ time and effort. Category A 1iv) Curriculum b) numeracy Numeracy is the second most common curriculum area after literacy in the primary school curriculum, and this is reflected in the use of TAs to support it. There were 72 references to it. Most teachers do not give much information on how the support is organised or focused, but some reveal the teachers' concerns for their pupils in most need.
"Assistant works effectively with less able children in the mathematics group offering much guidance and support." (Y4) "The booster support, one morning per week, has allowed two children to become solid Level 4 mathematicians." (Y6) "We have support during the numeracy lessons (....lowest ability in Year 5). There are only 24 children who have varying degrees of special needs. The daily support of one hour each day is invaluable. Sometimes children just need the question re-reading or need procedure verified. At times the LSA takes one child at a time to practice number bonds. The learning benefits are great." (30) (Y5) "Supporting lower ability in numeracy (e.g. prompting, reiterating instructions, enabling pupils to complete mental / oral starter activity).(Y6)
Category B i): Pupil progress / more / faster As we have seen, 16% of all responses referred to effects on learning and learners. Of those, reference to the progress of the pupils is the largest set, though still only 78 references in all, from a total of 1406.
"Invaluable support.....has lead to a greater participation and concentration from the children and a better level of work." (Y6)
32

"I feel she has enabled these less able children to access the curriculum and achieve their targets." (Y6) "The less able children have had help more quickly and so have been able to achieve more." (Y4) "Helped with meeting needs of top set - pulling children up to potential."(Y4) "Their work is of a higher standard. I could not have achieved this without the support of a CA." (28) (Y5) "The improvement is evident in less able group maths, less clear to define literacy improvements..." (Y4)
Though the open-ended nature of the question makes interpretation difficult, it is perhaps significant that the majority of teachers do not consider the TAs’ impact in the classroom in terms of a link with the progress made by pupils.
Category B iv): Reinforcement / understanding The second most frequently cited aspect of TAs’ impact on learning and learners is through TAs reinforcing pupils' knowledge and developing their understanding. There were 58 such references. This is an expression of teachers' belief that reiteration, repetition and 'drilling', in particular, are ways that adults can help pupils’ learning and are aspects that can be delegated to TAs. This raises interesting questions about the extent to which TAs may be conceived to have a possibly complementary role in regard to pupil learning.
"Able to repeat and reinforce class task." (Y6) "....they were able to work with children and practice their reading and spellings (was particularly good for SEN children.)" (Y4) "They have had more time to practice things they struggle with." (Y5) "Seems to have reinforced basics, but limited effect on test results." (Y5)
Of the 58 responses that refer to reinforcement, most (38) are from Year 4 teachers, suggesting that they are more concerned with the 'basics' and feel that reinforcement is necessary, but exact explanation is not possible from the data. Category C i): Works with groups of 2 or more This is the second most frequently reported form of organisation involving the TAs over KS2 (131 responses – 9% of the total). It can be seen as the way in which teachers attempt to maximise the effect of the TAs’ support.
"Maths - Huge! Children in lowest group are doing much Springboard 5 work but need constant help, support and general 'chivvying'. Literacy - Huge! Children in group are strugglers and need to read daily, do regular
33
comprehensions and generally do different work from the rest of the class." (Y5) "As she works with a small group of 5 she knows their specific needs and provides the necessary support they need." (Y4) "Supported boys’ focus group for literacy." (Y6) "Valuable resource - enables her group to learn more effectively and me to be freed up to do so too." (Y5) "The assistant is able to target a small group of children who either need support or challenging. This has made a considerable difference to the skills and learning of, particularly, the 'poorer’ children. The assistant has also been able to support a group during literacy hour activity time so that - while I have been engaged with another group - these children have had quality learning time instead of having to have an activity which needed no supervision." (Y4)
It is clear that many TAs are assigned the same groups on a regular basis and this is seen as beneficial to the working relationships established between the pupils and the TAs and the assumption is that learning is enhanced. In line with what we have already seen, most of the groups assigned to work with the TAs were those in most need. A few teachers reveal that their TAs work with various groups, rather than being kept always with the same one. These teachers adopt a more flexible approach to the deployment of their TAs, responding to the particular needs of the lessons and the pupils on different occasions.
"....at other times she works with various groups of children or individual children. Often this could be the more able or the less." (Y6) "The TA varies her focus , sometimes she supports the low achievers ....On some occasions she works with a high achieving group....She also focuses for a part of the week on the middle achievers for maths."(Y6)
Some TAs are employed specifically to support individual children who have statements of special educational needs. Rather than isolate such individuals, some teachers integrate the child, with their TA, in a group. In this way the TA's support is available to a wider circle of pupils.
"Sometimes an assistant is in with an autistic child. She sits with lower ability group - going over and over teaching point." (Y5) "One TA is to work with a statemented child individually or with their group." (Y6) "I have a CA who works with a child with Aspergers Syndrome for 15 hours per week. He is incorporated within a group and she supports the whole group." (Y4)
Category C ii):
34

Works with named / statemented individuals The focus of the TA here is on particular named or statemented individual pupils. The types of SEN vary in type and severity. The teachers across the three year groups report very similar levels of this kind of TA deployment (71 responses overall, 5% of the total).
"Specialist teacher and specialist TA have given support to a hearing impaired child. This support has been 1:1 with the child both in and out of the class. This support has not benefited the other children in the class." (Y4) "I have had a pupil support assistant who works specifically with one child in the mornings. This has greatly helped with the learning of this individual." (30) (Y5) "SEN child has half day support for vision. Made little difference to rest of class." (Y5)
As we have seen elsewhere, in reality TAs do not interact exclusively with their assigned pupils.
" My statemented child needs constant 1:1 so my LSA supports him constantly. I would have found it impossible to teach if she was not there." (Y6) "Works specifically with one child who needs her 100% of the time for the 7.5 hours she works with the child in my literacy group - has made little / no difference." (Y6) "The TA works with one child who has cerebral palsy so doesn't really affect the class." (Y6) "The two support staff are attached to the two statemented children and work with them. They are not for class support." (Y6) "I have had support from a TA......focused on managing the behaviour of a particular individual. This has allowed me to concentrate on delivering the curriculum effectively."(Y4)
Category C v): Works with less able / SEN / disruptive This is the most frequent role occupied by TAs, from the teacher’s point of view (175 responses, 12% overall). When this category is explored in more detail, it emerges that Y4 and 5 teachers refer to TAs working with SEN pupils about twice as often as their Y6 colleagues (44% and 42% compared with 22% of references in this category.) On the other hand, Y6 teachers refer more often to the 'least able etc.' (31% compared with 25% and 20%). But, apart from these differences, the general picture is one of TAs being used by teachers across KS2, in support of pupils who have needs that require that more time be spent with them. Category Cv is closely aligned with Cii in that both involve the TA working with particular individuals or individuals with particular needs. When added together this amounts to 17% of all responses, indicating again how much this role is a feature of TA deployment in these schools.
35
These results raise questions about teachers' perceptions of what best serves the educational needs of less able pupils. It seems that such pupils are expected to make at least some, if not more, progress if they are spending time with an adult other than the class teacher. Yet, as we have seen, the responses by teachers do not present a strong case for claiming success in terms of improved progress in learning. They do cite other benefits to pupils - confidence may be improved, they may be on task more, and they spend more time on reinforcement of learning.
“My support assistant has given valuable input to my special needs group. She can explain mathematical problems by giving the group extra coaching. She is also able to read questions to poorer readers. The lower ability children gain in confidence as a result of being more able to share their problems.” (Y5)
However, there are few such references.
Pupils’ behaviour is not often mentioned in relation to TA deployment, with a higher proportion in Year 6 than in Years 4 and 5 (Category Bv).
“I could not cope without 2 TA’s!! Especially as there are so many behaviour problems in the class.” (Y5)
“Statement child - help in mornings. If child not in the right frame of mind the child can be attended to without disturbing the classroom. Teaching of remainder of class can continue.” (Y4) “When I am doing whole class teaching, my assistant keeps more disruptive children joining in with lesson - perhaps by questioning them and keeping them focused. She often sits near the less able and helps them understand concepts.” (Y6)
Category D i): Positive opinions The overwhelming opinion expressed in 193 of the 222 responses in this category is very positive. A large number of teachers (186) expressed no opinion at all, so the positive picture cannot be assumed to be a complete one. But certainly teachers who felt they wanted to add a comment generally express great satisfaction in having TA support, with only a small number expressing a negative view. Teachers appear to view the TAs as thoroughly beneficial, particularly to themselves. The words chosen are indicative of genuine pleasure, relief and gratitude. They seem spontaneous and heartfelt.
“It is brilliant!” (34) (Y5)
“Made a huge difference - my TA is excellent…..” (Y6)
“Amazing difference!” (Y6) “In a nutshell, I don’t think I could have coped without an LSA in my class.” (26) (Y5)
Category A responses show where this support is most appreciated - in the classroom, rather than with non-teaching tasks done elsewhere. So, the positive opinions are
36

related to the TAs’ work with pupils, and as we have seen in terms of ‘freeing’ the teacher. This appears to be the source of most of the teachers’ positive feelings about having a TA in their classes. There were a total of 29 responses which showed any negative feelings or opinions (Category Dii). Most of these refer to the limitations of their particular TAs, who may be inexperienced or unsuitable in some way.
“She is not particularly able to move the able / very able on.” (Y6) “Have 2 TA’s ……Difference made obviously depends on how ‘good’ the TA is.” (Y5)
The other source of dissatisfaction with the TA support arises because of the extra demands which they place on teachers. So, the classroom benefits are offset by these additional aspects of the arrangement.
“As in previous years, support is useful but I do think current trends in use of TA’s is coming from a theorist’s rather than practitioner’s point of view. Too much TA time can be too time consuming for the teacher.” (Y6)
Conclusions to teacher views on TA support
• Teaching Assistants are viewed as a very welcome feature of classroom life, with positive comments far outweighing negative. The reservations expressed are mainly to do with particular TAs or the working arrangements, not with the notion of TA support.
• TAs are seen by teachers to affect teaching and teachers more than learning and
learners. TAs relieve teachers of the demands made on them by SEN and less able pupils, thus freeing them to devote themselves to the needs of the rest of the class. This is achieved by delegation of responsibility to the TAs.
• The most commonly reported context for the TA support is working with
named/statemented individuals and less able pupils or those with SEN. This is followed by working with a group of 2 or more pupils. Only a minority of teachers circulate the TAs’ support across groups of all abilities, or supporting the most able, preferring to see them with the pupils in most need. However, TAs employed to support statemented individuals are sometimes working with their assigned pupils in a group context. Potentially, other pupils therefore benefit.
• A feature of the TA support for pupils is expressed in terms of ‘reinforcement’ of
learning, including such processes as repetition, practice, reiteration and consolidation.
• Teachers are not clear about the benefits to learning which pupils gain through
working with TA support. • Non-teaching tasks given to TAs also contribute, but to a much smaller extent, to
the teachers having more time to plan, teach and assess.
37

• Literacy and numeracy are the main areas of focus for TAs, reflecting their
dominance across the primary curriculum. Since most TAs are supporting SEN / less able pupils most of the time, it is to these pupils that most of their literacy and numeracy support is given.
38

3. Head teacher questionnaires 2000 - 2003) This section covers answers to two questions. The first concerned how important head teachers felt training and/or qualifications were for teaching assistants in their school, and the second asked how they allocated teaching assistants in their school. For both questions, head teachers were asked to comment with reference to their own experience. The method of analysing head teacher answers was similar to that carried out on the TA and Teacher questionnaires. The main categories that emerged from the analysis of the first question are detailed in Appendix 3. They were as follows:
1. How schools handle training /qualifications 2. Evaluation of training/qualification 3. Other features of TAs needed 4. The need for training/qualifications 5. Benefits for literacy and numeracy 6. In-school training of TAs 7. Effects of training/qualifications on TAs 8. Comments on present provision of training/qualifications 9. Attitudes of TAs to training/qualifications 10. Financial aspects of training/qualification 11. Outcomes for schools
This section of the report will present the views of head teachers in ways which complement those of teachers and TAs themselves. In this analysis, the 11 main categories are combined to form the four major issues which appear to be most significant in head teachers’ thinking about TAs:
A. General view of TA training and qualifications B. The limitations of training and qualifications C. TAs and their training D. The management of training and qualifications
A. General view of TA training and qualifications Where head teachers pass judgement on the importance of training, the response is always positive. This is the largest single category of responses (Category 2 in Appendix 3, Table 1), being 23% of the total. This amounts to 65% of head teachers.
“Training is very important! Qualifications less so.” “Essential to have training for all support staff.” “I could not confirm strongly enough the need for training for all TAs, for training which is outside school and leading to qualifications.” “Qualifications not important! Training, yes….” “Initially qualifications are not important upon appointment.”
Head teachers acknowledge that the roles played by TAs in schools at present are vastly different from earlier ones (Category 4). This major shift in the responsibilities
39

of TAs, particularly in their pedagogical support of pupils, already referred to, convinces head teachers that TAs cannot meet the demands of the role without training of some kind. The ‘untrained days are over’, as one puts it.
“Extremely important – assistants are no longer ‘doing the frilly bits.’ They need almost as much knowledge and definitely the skills of the teacher.” “It is vital to have trained TAs since the support they provide often involves those pupils with the lowest ability. Without training the TA has difficulty understanding what and how to support.” “Their roles have changed drastically over the last couple of years and several of them find these changes very difficult. It has become a very different job with greater responsibilities….”
Some focus particularly on the demands included in the Literacy and Numeracy strategies introduced nationally in recent years, emphasising how important it now is for TAs to have very specific knowledge and skills (Category 5). For these head teachers, the quality of TAs’ contribution to classroom work is seen as improved by training as they apply new skills to their work.
“Very important. Requirements for literacy and numeracy meant that when we get TA of the right calibre and training they become almost another teacher.” “Training is essential for ALS, ELS, FLS, Springboard and for supporting children using specific schemes such as PAT etc. Training in the teaching of phonics (PIPs) is hugely important. Specific training for specific purposes.” “TAs with qualifications have a greater understanding of the needs of children, their role of supporting children’s learning and supporting the teacher’s work in the classroom. As children with different needs come into school it is important that TAs receive training. This is an investment for the school as it increased the breadth of knowledge and skills.”
B. The training of TAs A few heads comment on how important it is for TAs to want training, as a way of developing their skills and knowledge (Category 9; 9% of head teachers, 3% of all responses).
“Most want training and are keen to gain qualifications.” “TAs are committed to their positions and very enthusiastic. They are therefore keen to keep up to date and improve their knowledge and skills.”
The effects on the TAs themselves, as distinct from their work, are seen as enhancing, amongst other things, their self-esteem, confidence, status and job satisfaction (Category 7). All these can be seen as potentially having some indirect impact on the quality of their work in the school. Certainly, the heads feel that training their TAs can change the way they are perceived by other staff in the school.
40

“Important that we have a professionally recognised qualification, to enhance the status of the profession and individuals. / The children will benefit from her increased knowledge and input.” “Very important – they give status and credibility to these members of the support staff alongside increased confidence and high self esteem. They also raise the standard of delivery/support – thus raising standards for the pupils.” “TAs need training and status so that they play an effective and valued role in the school.”
C. The limitations of training and qualifications Though most head teachers have a positive view about training and qualifications, a few (Category 8a + b) are not so sure.
“Qualifications have not, as yet, proved significant in performance.” “Training does not mean a person can make a good job of things.”
One feature which troubles these few head teachers is the lack of national training standards and the subsequent failure to insist on minimum standards of entry to the role.
“Currently, the ‘light weight’ training offered to TAs is not enough.” “Qualifications such as NVQ 2 /3 have had little relevance to school-based assistants who are supporting the delivery of core subjects and pupils with specific learning difficulties.” “Important that we have a professionally recognized qualification to enhance the status of the profession and individuals.”
Some courses are criticised for being inadequate and irrelevant and they are seen as failing to prepare the TAs appropriately. However, it needs to be repeated that the general view of training and qualifications is positive and there is very little doubt that most see them as increasingly necessary as TAs’ roles evolve. Some head teachers refer to other features of TAs which they consider important, or even preferable to training and qualifications (Category 3; 12% of responses). Most point out that these personal qualities, character, life experience and skills are not replaceable by formal courses, though these may enhance and develop them. A few heads would choose TAs on the basis of personal qualities and discount their qualifications entirely, but these are the minority. For most, it is ideal if the two aspects are combined in the TA – suitable personal characteristics and relevant training.
“Not as important as dedication, commitment, love of children and a desire to do the best for the school.” “Qualifications are not the only criteria, as some staff have exceptional qualities and skills without formal qualifications.”
41

“Experience as a TA and a ‘good’ attitude (flexible, willing, receptive, pupil-focused) are paramount.” “....important, but not as important as the calibre of the person in the first place – this makes all the difference to how training is received and used.”
It seems that some heads at least feel that training courses can only make a person a successful TA, if they build on the foundation of essential personal aptitudes; training cannot substitute for such features. D. The management of training and qualifications Schools vary tremendously in how they deal with this issue. Clearly there are sometimes conflicts between the attitudes of the heads towards these matters and the realities on the ground, where such details as the supply of suitable candidates, the availability of necessary courses, the funds to support TAs’ professional development and the logistical limitations of coping with absent staff, all make the actual some way short of the ideal. There are 22% of heads who refer to the provision of courses, available to TAs, whether induction or other forms of professional development, and INSET sessions (Category 1). There are references to particular ways in which they attempt to support their TAs, more or less systematically.
“Qualifications guarantee nothing – providing ongoing training, review and support allow professional development to occur.” “We have recently developed a cohesive approach to meet the staff development needs of TAs. Formal qualifications have not been seen to be as important as good quality on- going training.”
One particular method mentioned by 16% of heads (Category 6; 7% of all responses), is to attempt more or less all TA training within the school – ‘on the job’, as several call it.
“We can train the right people for our establishment ourselves but a basic level of knowledge is good.” “Most training is ‘on the job’ or shared with teachers on professional days.” “We provide this ‘on the job’, plus ICT training from the LEA ICT team.” “The majority of training is done by the teaching staff and the SENCO.” “To maintain standards I feel some form of training is essential. I include all CAs in whole school staff development and arrange ongoing training dependent on individual needs when in post. CAs have job descriptions and are included in the performance management policy of the school in that they take part in a professional discussion annually.”
It can be seen that some heads (Category 6a; 34 headteachers) feel that within school training is sufficient, but this also suggests that these TAs are restricted in accessing courses elsewhere. Whilst this may address the doubts which some heads have about
42

the availability of relevant and suitable outside courses, it can limit the TAs' choice and denies them the chance to benefit from trainers who may have skills and knowledge which go beyond those of the school’s own staff. Clearly, there are many valuable opportunities for teachers to train their TAs whilst working with them, but such ‘on the job’ training is not seen by most heads as sufficient in making TAs competent to perform their increasingly demanding role as supporters of pupil learning.
“Training is very important. TAs must know what they are doing. There is a real risk of damage to a child learning if they are ‘taught’ by unskilled or ill informed people. An untrained support assistant is an additional burden for the class teacher who has to give ‘on the job’ training.”
Few heads (7%; 3% of all responses) make specific mention of the financial aspect of TA training; of those that do, they point to the expense of covering the costs of TAs’ attendance. One issue identified by just 4 headteachers (Category 10b) concerns the motivation for TAs to train, in a context where most will receive no financial reward for their efforts. The key problem, as some TAs themselves stated above, is that some do not see a career structure – and this could explain a lack of incentive to train and qualify. Allocation of TAs Head teachers were also asked in the questionnaires how they allocated teaching assistants in their school. The main categories were as follows, in order of frequency of mention:
1. The needs of pupils 2. Support for particular subjects 3. The age of the pupils 4. Some support for every class 5. Class characteristics 6. Teaching Assistant characteristics 7. The needs of teachers 8. The school development plan
This section of the report will present the views of head teachers and link them with the responses of teachers and TAs themselves. The needs of pupils The major factor taken into consideration by head teachers when allocating their TAs to work in classes, is the needs of the pupils (41% of all responses.)
“According to the number of children within the class who have special educational needs and the seriousness / level of that need.” Y5 survey “Based on need – usually TAs are allocated to classes with most significant number of pupils with learning difficulties.” Y6 survey “According to individual pupil and cohort needs.” Y4 survey
43

The head teachers are obviously using pupil need as the basis for TA support allocation. The situation is complicated in the sense that if the needs of some pupils impact on teachers then TAs, who are there to support the children, can be seen to be supporting teachers as well. But on the face of it, heads clearly do not start with the needs of the teachers, which are referred to in only 1% of responses (Category 7). Most support is targeted at pupils with particular learning needs, defined by heads as those with SEN, statements, low test scores or Code of Practice Stage 3 designations. The more pupils in a class with SEN etc, the ‘needier’ it is. One even refers to what amounts to an ‘index of need’, being used to identify where the TAs’ support should be targeted. Once again, this focus on pupils with the most pronounced educational needs, matches the position reported by teachers and TAs themselves. It seems as if decisions about linking TAs with the pupils in most need is handed down to teachers. Indeed, the funding and the provision of TAs for named individuals, appears to have provided the background climate, with respect to how the needs of pupils are addressed. It is assumed that teachers alone will be unable to meet the needs of certain pupils, so TAs must be employed to plug this gap. If all these TAs were qualified and trained to deal with special educational needs, then this strategy could seem wise and sensible. However, there is cause for concern given what we have seen of the limitations in both the training and relevant qualifications of TAs. Support for particular subjects
“One TA per class each morning for maths and literacy. One TA to provide support for ICT across the school …for 3 mornings per week.” Y5 survey
The second most common criterion used by heads to decide where to deploy TAs is ‘support for particular subjects’ (21% of all responses). Of this type of support, 90% is targeted at literacy and numeracy, either in lessons devoted to those areas of the curriculum, or in so-called ‘catch-up’ programmes (e.g. Springboard, ALS). Pupils on ‘catch-up’ programmes, by definition, have fallen behind for some reason in the context of general class work, planned and taught by their teachers. This study did not examine specifically the deployment of TAs in such sessions, but, assuming that TA deployment and training/qualifications follows that found more generally, that is, they work with individual pupils in most need, then questions also arise about the effectiveness of practices that involve such pupils spending much of their time in sessions and programmes supported by TAs. Age of the pupils and some support for every class
“Desire to ensure everyone has some support each week and justice can be seen to be done.” Y5 survey “On a sliding scale according to the age of the children. The younger the children, the greater the hours. Therefore foundation – full-time, Y6 two hours per day.” Y5 survey
These criteria were cited by 16% and 10% of all responses respectively (Categories 3 and 4). Some heads try to share TA time out amongst all classes, or they target more help on the younger pupils than the older ones. Implicit in this latter choice, is the
44

notion that as pupils get older, they need less support. Or it may be that head teachers feel that teachers need less support as the pupils get older. TA characteristics In 4% of responses head teachers indicate that they consider TA characteristics when allocating them (Category 6). We have already commented on how heads rarely mention the adults involved in the allocation of TAs. Only one head admitted to taking TAs’ preferences into account when allocating them to work in particular classes (6e). Three heads take TAs’ qualifications and experience into account and four heads deploy them with the TAs’ professional development needs in mind.
“LSA preferences are considered.” Y4 survey “Staff scheduled to work with a particular group of children are given opportunities to further their expertise in this area – prior to deployment.” Y4 survey
A few heads (Category 6a) report attempts to match TAs’ skills and competence with the needs of the class.
“Specialist TAs are appointed to work with statemented pupils.” Y5 survey “According to the strengths and qualifications of the TA.” Y6 survey
Class characteristics
“Larger classes over 30 have a full-time TA. Smaller classes 25-28 have 17.5 hours per week. Statemented children have attached TAs and these are dependent on hours allocated. Booster groups have TAs allocated where needed.” Y6 survey
The most significant class characteristic, taken into account when allocating TAs, is the size of the class, with larger classes being allocated relatively more TA support than others. Even so, this factor is only mentioned in 6% of responses, so it is not a major consideration when compared with the needs of the pupils. Conclusions to head teacher questionnaire Training:
• Heads appear in no doubt that training (and to a lesser extent, qualifications) is important for TAs. It can enhance their work, confidence, status and job satisfaction.
• They also point out the many personal qualities which TAs should have and in
some cases heads ascribe greater importance to them.
• Some head teachers are critical of the training available.
• The main thrust behind the drive for more training arises from the increased demands being made on TAs in their classroom support role.
45

• Some schools are providing all their training for TAs within the school itself.
• Specific mention is made of the value of training in relation to the demands of
the NLS and NNS. Allocation of TAs to classes:
• Head teachers often apply criteria when allocating TAs to classes. Many arrange these criteria in an order of priority.
• The most important criterion is the needs of the pupils.
• Support is targeted at literacy and numeracy lessons, plus the ‘catch-up’
programmes associated with those subjects.
• Class size is seen as the main class characteristic when allocating TAs.
• A minority of head teachers attempt to provide support for all classes.
• The particular skills, knowledge, training and experience of TAs are rarely taken into consideration by head teachers.
• The needs of particular teachers are rarely taken into consideration by head
teachers when allocating TAs.
46

4. Systematic observation study of year 6 classes: the effect of the presence of TAs and other adults on pupil and teacher behaviour Introduction The systematic observation study involved a sub sample of children in small (25 or under) and large (31 and over) year 6 classes. The methods and procedures were similar to the systematic observation study carried out when the pupils were in the reception year (4/5 years), as described in Blatchford, Edmonds, Moriarty and Martin (2002) and Blatchford (2003a, 2003b). Classes were selected on a random basis from class size information supplied by the school. However, the class size used in analysis was the number of children actually present during the time of observation, what we call the ‘experienced’ class size. In some cases this varied from the registered class size and in a few cases it varied quite significantly, e.g., because a number of pupils were absent or elsewhere in the school. It was more difficult to find small than large classes. There were 42 classes in all, 16 small and 26 large. On the observation forms a note was also made of extra adults in the classroom, and whether they were Teaching Assistants (TAs), additional teachers, volunteers, trainee teachers, SEN teachers, and others. Sample of pupils Teachers were asked to select 9 pupils, three from each ability range - low, medium and high. Six of these were then chosen by the researcher at random for observation, a girl and a boy from each band. If a child was absent for more than a day they were replaced by a reserve drawn from the nine. In a few cases observations were obtained on more than six children per school and there were 257 children in all, 128 girls and 129 boys, 83 low ability, 87 medium ability and 87 high ability. Organisation of observations The basic principle was to observe when classroom-based activities took place. Observations were not conducted during parts of the day when pupils went out of the classroom. The aim was to observe each child over two days. Time available for observation could vary somewhat from day to day. Each of the six children were observed in turn. As with the earlier study of reception classes, observations were conducted in blocks of ten second time intervals, but this time there were gaps of ten seconds between observations to allow recording of what took place in the previous ten second period. After each block of 10 observations, attention switched to the next pupil on the list. There were 22,312 observations in total, with an average of 87 observations per child. Observation categories The schedule comprised categories that provided a description of time spent in different work settings (individual, pupil group, teacher led group, whole class), different school subject areas (English, mathematics, science and ‘other’, e.g., history, geography, RE), and a description of how children behaved when in three social ‘modes’ - with their teachers, other children and when not interacting. Within each of these three ‘modes’ there were categories that denoted work, procedural, social and off task activity. For full definitions and conventions of categories see Blatchford (2003). The categories referred to the ‘target’ child; teachers and other children were observed only when they came into contact with them. The schedule employed a form
47

of predominant activity sampling where behaviours were selected within sets of behaviours (e.g., social modes) when they occurred for the longest period within the ten second interval. A full description of the observation sampling procedure can be found in Blatchford (2003) In order to examine the effect of class size and TA presence, selected categories were chosen on conceptual grounds and on the basis of relatively high frequency of occurrence. Brief definitions of these categories are as follows: Work setting Individual setting: the child is working on his/her own; the work is not group based (though the child could be seated in a group) or teacher led. Group setting: the child is in a group working together, but not led by the teacher Whole class setting: teacher-led whole class settings where the target child is involved. Teacher / pupil interaction Child ‘audience’ vs. ‘focus’ Child is focus: target child is the focus of the teacher’s attention, and this could be in the context of one-to-one, group or whole class sessions, e.g., the target is asked a question about addition in the course of a session in which the teacher is addressing the whole class. These were coded separately as ‘short’, i.e., not for the whole ten second interval, and ‘long’, i.e., contact continued through the whole ten second period – for example, a question from the teacher was followed by an answer from the child and a further probe or comment from the teacher. This therefore gives some measure of extended or sustained interactions between child and teacher. Child is audience: another child is the focus of the teacher’s attention in the group or class involving target child, or teacher interacts to same extent with all children. Child to teacher – attend/listen: the child simply listens to the teacher during the interval and does not interact by responding or initiating. Child on task to teacher: all child behaviours in contact with teacher that are concerned with work. Child off task to teacher: child behaviour when in contact with the teacher obviously inappropriate or unrelated to situation (e.g. not attending). Waiting for interaction with the teacher: the child waits for the teacher. Adult Teach: adult behaviour directly concerned with the substantive content of subject knowledge, i.e. communicating concepts, facts or ideas by explaining, informing, demonstrating, questioning, suggesting. Adult on Task: as adult teach plus contacts concerning the organization and preparation of children’s task activities and not their substantive content. This is therefore the most generic category denoting teacher to pupil work related behaviour. Individual behaviour / not interacting Individual on task: target child is involved in own work activity Individual Off task (active): target child focuses on something other than task in hand. Individual Off task (passive): target child is disengaged during task activity, for example, daydreaming.
48

Child - child interactions Target and Child on task: all contacts with other children that are concerned with work and allocated tasks. Target to child off task: behaviour with other children that is deliberately off task; it would include mucking about and times when the target child is aggressive (verbally or physically) towards other child(ren). It would not include times when children spoke about non-work activities, if this was not deemed unacceptable by the teacher (this would have been coded ‘social’). Computed categories Child on task: total on task behaviours, i.e., behaviours related to the substantive nature of allocated work or preparation for the work across the three social modes, i.e., child to teacher on task, target and child on task, and individual on task. Child off task: total off task behaviours, i.e., all off task behaviours in the three social modes, i.e., child to teacher off task, target to child off task, and individual off task (active and passive) Child procedure: total child procedure behaviours, i.e., all target behaviours related to classroom management and organisation of classroom routine, in the three social modes, i.e., child to adult procedure/routine, target to child procedure/routine, and individual procedure/routine. Active interaction with teacher: the sum of the three child to teacher categories where the child’s role was an active and not a passive (i.e., attends/listens) one, i.e., the child initiates, responds or sustains interactions with the teacher. Any target and child interaction: the sum of all the child-child categories, i.e., all task, social, procedure, and off task behaviours in contact with other children. Observers There were four observers. They were all experienced researchers who were familiar with working in schools, and able to explain the research and put teachers and pupils at their ease. The basic aim was to avoid passing judgments, and to use the schedule as intended. All observers had initial training in which they were provided with an observation manual of categories, conventions and procedures, as well as tips acquired during previous use. Conventions were discussed and there was work on videotapes, accompanied by periodic checks of accuracy and understanding of how to use categories. This was followed by at least a day’s observation in a class not involved in the study, and then a follow up training session to discuss field visits and iron out difficulties. Reliability checks Reliability coefficients for the main sets of mutually exclusive categories were high. Setting, subject, teacher-child ‘social setting’, ‘child role’, ‘teacher content’, child to teacher ‘child contribution’, ‘child content’ and’ not interacting’ all had reliability coefficients (kappa) greater than 0.80. Kappa for child-child content was 0.77 (Blatchford et al, 1987). Statistical methods and analysis A feature of the analysis of the observation data was the way that it was conducted with the 10 second observation interval as the unit of analysis. This allows a greater accuracy and flexibility than simple, but more commonly used, total frequencies of behaviours for each pupil. In particular it provides the basis for powerful and useful analyses of the co-occurrence of behaviours – for example, whether certain
49
behaviours occurred more in one class size than another, when a TA was present or not, or in maths rather than English. This kind of analysis is not possible when simple totals for each pupil are used. The observation variables took the form of binary variables, in the sense of each either being performed, or not being performed, during one time interval. A further feature of this observation study, in contrast to previous research, is that it used multilevel logistic regression. Multilevel models were required, as it is likely that observations from pupils in the same class will be more similar than two observations from pupils in different classes. Similarly, two observations from the same pupil are more likely to be similar than two observations from differing pupils. If this clustering of observation is not taken into account then estimates of relationships between variables can be affected. The basic structure involved three level models with repeat observations contained with pupils, which were nested within classes. However, the observations were made in groups, and it is likely that two observations from a pupil within the same group will be more similar than observations from different groups. This adds a fourth level to the model, and so these were used for the majority of the analysis. The exception is for the work setting categories (individual, group, whole class). Within each group of observations, the pupils were always performing the same type of work. Therefore data for these variables were analysed at the group level with one observation per group. The effect of Teaching Assistants on pupil behaviour The results were first analysed to see if the presence of teaching assistants affected pupil and teacher behaviour. The presence of a TA could change over the course of the day and even from moment to moment during a lesson, and so was recorded for each 10 second time interval. Our results are therefore very sensitive to the effect of a TA’s presence. The results showed that TAs were present in the classroom for 18% of the observations recorded. We look below at the effect of the larger group of adults present, which would include the specific category of TAs. Although it is possible that the adult involved in interactions with pupils could be a TA, the numbers of interactions involving teachers were far more numerous (more than 100 times as frequent), and so the results can be taken as indicating the effects of TAs on interactions between pupils and teachers. The results of the analyses examining the effect of TA occurrence on each of the observation variables are summarised in Table 15. The table contains information on two things: The first column gives the effect of the presence of a TA on each observation variable, in the form of odds ratios. The figures given are the odds of the outcome occurring for an observation where one or more TAs was present, compared to situations where no TAs were present (together with the corresponding confidence interval – C.I.) in brackets). An odds ratio of greater than one shows that the observation variable is more common when there is a TA present, whilst an odds ratio of less than one suggests that the outcome is more common when there are no TAs. The second column shows which of these results were statistically significant, and to help the reader these are presented in bold.
50
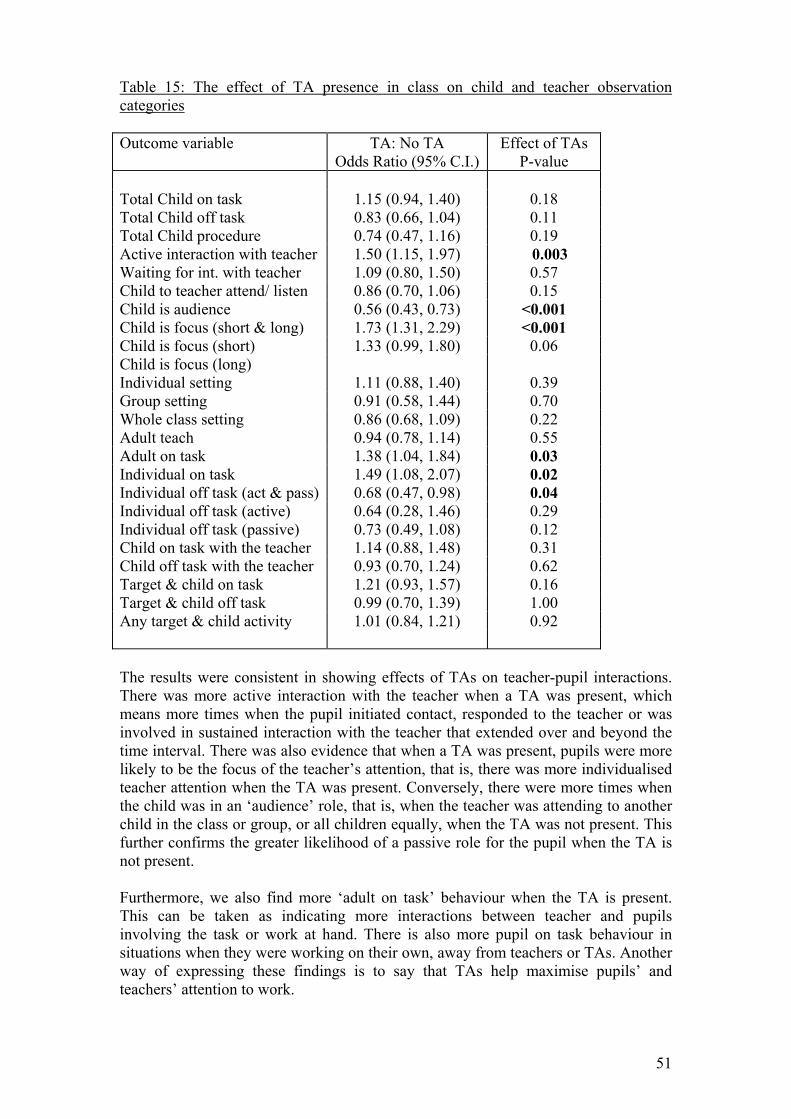
Table 15: The effect of TA presence in class on child and teacher observation categories Outcome variable TA: No TA
Odds Ratio (95% C.I.)Effect of TAs
P-value Total Child on task 1.15 (0.94, 1.40) 0.18 Total Child off task 0.83 (0.66, 1.04) 0.11 Total Child procedure 0.74 (0.47, 1.16) 0.19 Active interaction with teacher 1.50 (1.15, 1.97) 0.003 Waiting for int. with teacher 1.09 (0.80, 1.50) 0.57 Child to teacher attend/ listen 0.86 (0.70, 1.06) 0.15 Child is audience 0.56 (0.43, 0.73) <0.001 Child is focus (short & long) 1.73 (1.31, 2.29) <0.001 Child is focus (short) 1.33 (0.99, 1.80) 0.06 Child is focus (long) Individual setting 1.11 (0.88, 1.40) 0.39 Group setting 0.91 (0.58, 1.44) 0.70 Whole class setting 0.86 (0.68, 1.09) 0.22 Adult teach 0.94 (0.78, 1.14) 0.55 Adult on task 1.38 (1.04, 1.84) 0.03 Individual on task 1.49 (1.08, 2.07) 0.02 Individual off task (act & pass) 0.68 (0.47, 0.98) 0.04 Individual off task (active) 0.64 (0.28, 1.46) 0.29 Individual off task (passive) 0.73 (0.49, 1.08) 0.12 Child on task with the teacher 1.14 (0.88, 1.48) 0.31 Child off task with the teacher 0.93 (0.70, 1.24) 0.62 Target & child on task 1.21 (0.93, 1.57) 0.16 Target & child off task 0.99 (0.70, 1.39) 1.00 Any target & child activity 1.01 (0.84, 1.21) 0.92 The results were consistent in showing effects of TAs on teacher-pupil interactions. There was more active interaction with the teacher when a TA was present, which means more times when the pupil initiated contact, responded to the teacher or was involved in sustained interaction with the teacher that extended over and beyond the time interval. There was also evidence that when a TA was present, pupils were more likely to be the focus of the teacher’s attention, that is, there was more individualised teacher attention when the TA was present. Conversely, there were more times when the child was in an ‘audience’ role, that is, when the teacher was attending to another child in the class or group, or all children equally, when the TA was not present. This further confirms the greater likelihood of a passive role for the pupil when the TA is not present. Furthermore, we also find more ‘adult on task’ behaviour when the TA is present. This can be taken as indicating more interactions between teacher and pupils involving the task or work at hand. There is also more pupil on task behaviour in situations when they were working on their own, away from teachers or TAs. Another way of expressing these findings is to say that TAs help maximise pupils’ and teachers’ attention to work.
51

The results indicated that apart from adult focus (long), there were not found to be any significant interactions between the number of pupils and whether there was a TA in the classroom. This implies that the effect of the number of pupils in the classroom upon the observation variables does not vary by whether there was a TA in the classroom or not, or alternatively that the effect of a TA does not vary by the number of pupils. The results for adult focus (long) are interesting. They indicate that the difference between large and small number of pupils varied depending on whether a TA was present. The results for the number of pupils and also the effects of TAs for the different groups are presented in the table below. Table 16: The effect of TA presence in class on child and teacher observation categories – adult focus (long) Explanatory variable Group Odds Ratio (95% CI) P-value Number of pupils No TA 0.28 (0.17, 0.46) <0.001 (large: small) TA 1.34 (0.60, 2.98) 0.48 TA Small number of pupils 1.04 (0.60, 1.82) 0.88 (some: none) Large number of pupils 4.94 (2.39, 10.21) <0.001 The results indicated that there was significantly less adult focus (long) behaviour for a large number of pupils than a small number when there was no TA present, but no difference between class sizes when there was a TA present. Additionally, there was significantly more adult focus (long) with a TA present compared with when there was no TA for large numbers of pupils, but no effect of a TA when there were a small number of pupils. This indicates that class size effects on the most individualised and sustained teaching (that is, adult focus (long)) only occur when there is no TA present; moreover, in a large class TAs can increase individualised and sustained teaching. In other words, TAs can have a beneficial effect when there is a large number of children in a class. As has been said, there were far fewer interactions involving target pupils and TAs. Results concerning interactions with TAs therefore need to be treated cautiously. It is interesting to note, however, that when the number of occurrences of the category adult focus (long and short added together) were analysed in terms of which type of adult was involved, we found that it was only in the case of TAs where the role of the pupil was more likely to be the focus of attention than not (more than twice as many occurrences of focus vs not focus). From a pupil’s point of view the teacher tends to interact predominantly with the class or other pupils, while the TA spends most of her time interacting specifically with individuals, and in this sense gives them more individualised attention. The effect of extra adults in the classroom The results indicated that one or more extra adult was present in the classroom for 24% of the observations recorded. Results for extra adults are very similar to those for TAs, which is not surprising as most extra adults were TAs. There were three additional results. With extra adults present in the classroom there was significantly
52

more total pupil on task behaviour, and significantly less total off task behaviour, further indicating that help in the classroom can have a beneficial effect. Less obviously, with extra adults present there was evidence of less overall teaching (the strictest form of teaching behaviour that excluded talk about task preparation). Possibly this is connected to another result, which approached statistical significance; i.e., there were signs of more whole class settings when there were no extra adults present. It may be, therefore, that the presence of extra adults helps reduce whole class teaching in favour of more individualised attention. Conclusions to systematic observation study
• The results were consistent in showing the beneficial effects of TAs on teacher-pupil interactions. When a TA was present, pupils had a more active form of interaction with the teacher, initiating contact, responding, or being involved in sustained interaction. When a TA was present, pupils were more likely to be the focus of the teacher’s attention; that is, there was more individualised teacher attention. Conversely, there was greater likelihood of a passive role for the pupil when the TA was not present.
• Furthermore, we also found more interactions between teacher and pupils
involving the task or work at hand. There was also more pupil on task behaviour when working on their own. Another way of expressing these findings is to say that TAs help maximise pupils’ and teachers’ attention to work.
• The results also indicated that TAs can have a beneficial effect when there are
a large number of children in a class, e.g., in a large class the presence of TAs can increase individualised and sustained teaching between teacher and pupils.
53

5. Case studies in Years 5 and 6 (2001 – 2003) Ten case studies were carried out in Year 5 classes, located in six different LEAs. Five were classes of 25 pupils or less (‘small’) and five were classes of 31 or more (‘large’). Ten case studies were also carried out in Year 6 classes, five small and five large, located in six different LEAs. The procedures used in the case studies were identical for both years. Each visit involved a whole day of classroom non-participant observation, followed the next day by interviews with the class teacher, teaching assistant (where present) and the three pupils who were the focus during the classroom observation. The observation included the whole class, the work of the teacher as well as the pupils and any other adult/s present. At times throughout the day the three individual pupils were focused on for periods of five minutes. The three pupils were selected by the researcher, from a list of six, provided by the class teacher. They represented the low, average and high attaining groups within the class. The identity of the three chosen pupils was not revealed to the teacher or the pupils. The classroom observations were recorded on a pro forma devised specifically for the purpose. There was space at the top for recording facts about the class, in terms of number on the roll, number present, numbers of girls and boys, class number, school name, teacher name, date and a space for drawing a sketch plan of the room. Times were recorded down the left hand margin of the sheet and notes were kept of anything which the researcher felt was relevant, based on the eight criteria (‘main headings’) drawn from the previous phases of the Project. These main headings were:
• Grouping practices • Tasks and curriculum • Child / adult interactions • Peer relations • Deployment of adult help • Personal / emotional dimension • Any other issues, including SEN pupils, atmosphere, composition of class • Space
At the end of each day’s observations, the researcher wrote a report which addressed the above points and attempted to summarise the day. It was important to do this prior to the next day’s interviews, as the process of eliciting the views of participants in the class could then be informed by the notes taken by the researcher. The interviews were carried out at times and in locations which suited the schools. Each interviewee was seen separately and in privacy. The interviews for each of the three groups (teachers, other adults and pupils), followed schedules of questions prepared previously and the conversations were taped for later transcription. The same eight main headings formed the basis for the questions. The teachers and other adults were asked the same questions, but ‘angled’ from their particular point of view. The pupils had completely different questions, covering most of the main headings, as appropriate (e.g. there was no question about the personal/emotional dimension of the teacher’s work). At times the researcher asked supplementary questions to allow interviewees to expand or to clarify their earlier answers.
54

All the schools and all the adults and children who participated were fully cooperative and helpful and they should be commended for their willingness to add yet more to their very busy and demanding work. Anonymity was guaranteed to all who took part and the report uses codes to refer to the individual schools, thus making it impossible to identify them. Results A full report on the case studies has been compiled organized in terms of key themes. Given limits on space, in this section we draw selectively from the case studies particularly where they inform results already presented in this report. In order to provide an overview of findings, we will not seek to cover all forms of data collection, but in this section we illustrate points with extracts from the field worker’s notes. The role of the TAs The TAs’ work falls into two distinct parts:
• Support for the teachers, doing tasks such as photocopying, record keeping and displaying pupils’ work.
• Support for pupils with their work.
In line with the data from teachers, TAs and head teachers, reported above, support for the teacher, as defined above, was obviously not their main role. Throughout the case study observations, the TAs spent most of their time interacting with pupils. This was repeatedly emphasised as being their major form of support for the teachers, as it was seen in operation and reported by teachers, TAs and pupils in their respective interviews. Some TAs were assigned to support named individuals, but all bar one of the teachers set the pupil and the TA in a group context, so that the TA could also interact with other pupils. In fact, all the TAs were seen working with groups of pupils. In most cases, the groups were assigned to work regularly with the TAs and it was unusual for a TA to provide support across the class. Some teachers stressed how impossible it would be for them to meet the needs of SEN pupils of various kinds, if their TAs were not available. This confirms the view built up from the questionnaires, that teachers rely on the work of TAs to support the pupils in most need. The following is an extract from the field worker’s notes, written at the end of the visit:
This [SEN] pupil was totally engaged with the work through the LSA, who devoted herself almost exclusively to her all day. The total delegation of the work was only possible because the LSA was fully aware of the tasks in advance, through a fully operational process of shared plans and systematic feedback. The teacher was in her first year of teaching and the LSA, a much more mature woman, had worked in the school for many years. Their experience of children was clearly vastly different and though the teacher was the trained professional, in charge of the other’s work, she was aware of, and made use of, the older person’s obvious knowledge, skills and experience. This underlines the importance of enabling teachers to manage their support staff sensitively and to the best advantage for the pupils. Field workers’ notes, Y6 large class
55
The value of TAs Almost without exception, teachers welcomed and appreciated the extra adults in their classes and they clearly trusted them to work very independently with pupils on pedagogical tasks.
The four teachers who had adult help all used their TA / LSAs to work with groups of pupils. This was equally the case with two LSAs who were designated to work with individuals with SEN related to physical disabilities. They sat with their particular charges, but also worked with other pupils sitting nearby, who were put there by the teacher with that intention. The general TAs in all four classes were left to work with particular groups in maths, literacy and science lessons, without the intervention of the class / set teachers. Two of the TAs did a lot of talking and took control of the pupils’ tasks, in one case to the extent of dictating to the group what they were to write. Two TAs did not have the skills to quell off task or disruptive behaviour, one during the Teacher’s absence from the room. Field worker’s notes, Y6 small classes
Meeting the needs of all pupils In line with the teacher questionnaire results, teachers in the case study classes were attempting to operate the ideal of meeting the needs of all pupils, either through moving around the whole class, or through a combination of giving a group or groups to the TA for them to support and dealing with the remainder of the class themselves. It was very unusual to find both the teacher and the TA circulating around the room, interacting with pupils.
The pupils were happily cooperating with the CA, who helped them with their practical tasks. The fact that she was available meant that they had far more space for their model making and they did not have to worry about mess or disturbance of others in the class – they worked in the area outside the room, under her supervision. She was particularly aware of their need to use tools safely. Field worker’s notes, Y5 small class
Types of interactions with pupils Compared with the teachers, the TAs had much longer periods of interaction with individuals and groups, largely due to the fact that the TA was generally static in one location, with their designated pupils, whilst the teacher moved from group to group in the rest of the class. To some extent this is supported by the systematic observation results, where it was found that TAs were able to give more focused individualised attention to individual pupils. This study was not set up to examine in detail the content or quality of the TA / pupil interactions, so it is not possible to say whether or not the longer periods of interaction were different educationally to those between teachers and pupils. This requires further research.
From the start of the day, a boy with cerebral palsy was supported by an LSA. She left 15 minutes before the end of the day. She worked with him apart from others at times, but mostly they sat at a table with other pupils and she interacted with them all, whilst giving most attention to her designated boy. At times they worked together using a laptop computer.
56

When the class returned from assembly, an LSA came with them. She sat with a group of 3 sometimes and 6 at others, during the maths and story writing sessions. At times she talked and worked with pupils at the same time as the teacher was addressing the class. She talked more or less the whole time and intervened a lot in the pupils’ tasks. The groups which she supported, had clearly been designated by the teacher and at no time did the LSA move about the room from pupil to pupil. The teacher left her to carry out the various tasks with the given pupils, with virtually no input / comment from herself. She was not in class after lunch. Field worker’s notes, Y6 small class
Class size and adult support Differences in the way TAs were deployed by the teachers seemed to reflect the teachers’ or schools’ policies, rather than the size of the class. Most teachers said in interviews that changes in the level of TA support would allow changes in the organisation of the classes, regardless of class size. The main considerations were the size and number of the groups in the class and how these impinged on the provision of support for all pupils. In comments that matched those from the KS1 stage of the study, a few teachers showed that they felt that more adult support would not necessarily be better. Having more adult support was not seen as a positive thing by two teachers, as they cited the extra preparation involved and the management of their time in the class. Two others could see the benefits and would divide large groups and have more active tasks, using space outside the classroom more.
Having fewer adults available would not change the way that three of the teachers organised their classroom, though they said there would be other effects if TA support was reduced. One admitted that they would fail to meet the needs of the SEN child and another could see that science practical work would be difficult to manage. In the Year 5 classes, more support was available in large classes, but in Year 6 one of the large classes was totally without any support, whereas all the small classes had support at some time each week. This illustrates the effect of head teachers applying their two main principles of allocation, that we saw in the analysis of head teacher questionnaires, which give priority to pupil needs and the provision of support to all classes for some time each week, with the pupil age factor as an added weighting. Class size as such does not seem to exercise much control over choices of TA allocation. Consistency of adult support For some teachers there is no consistency in TA support and so they come not to expect or rely upon it. It can mean they are less motivated to prepare for TAs in their class. It can mean that management of adults in the classroom by teachers does not have a real chance to develop satisfactorily, as the relationships are too piecemeal and irregular. Working practices vary from class to class and support staff may have to adapt to them repeatedly throughout the school week. Relationships with individual pupils can also be weakened through the short and irregular nature of their interaction. TAs themselves complained about how unsatisfactory it was to move about so much, with relatively short times in each class. During a day they may work with three or
57
more teachers and there is no way that they could meet with each teacher to plan work together, or to feedback adequately at the end of each session. The principle of ‘fairness’ seems to be working against good practice, so far as making best use of TAs’ time and maximising their impact on pupils are concerned. As was said above, if TAs only carried out non-pedagogical tasks, then it would not matter that they are moved about so much. Pedagogical role of TAs All teachers and TAs who were interviewed about the role of the TA agreed that teaching the whole class was definitely not part of their role. However, there was little articulation of what the pedagogical role of TAs should be. Teachers and TAs were sure, when asked, that lesson planning was not part of the TA’s role, though sharing the process with the teacher was. In the minority of cases where this was happening, it was greatly valued and where it was not happening, it was regretted. Interviews revealed the same situation with respect to time set aside for feedback. Beyond those few points, teachers and TAs across the two years held a variety of opinions about what tasks were appropriate for TAs.
Copying and other forms of administrative tasks are seen as part of their role. Teachers differ in other aspects of the work. One asks support staff to display work, whilst two definitely do not. One asks support staff to keep records of what pupils do when working with them, but two others do not expect recording to be done by their adult colleagues. Two allow the marking of mental maths and spellings, but two others keep all marking for themselves. So, there are some areas of common practice, but more areas of difference. Field worker’s notes, Y6 Small Classes
Pupil views The views of pupils were not collected in any other part of the research; the interviews carried out in the case study classes provide the only ‘window’ into how the TAs’ work in classes is perceived by those receiving their support.
Of the 12 pupils, seven feel the same or better when being supported by the adults as compared with the teacher. Only one feels shy and none resent or reject such help. Some do not get help as they are not the focus of the adults’ work, whilst others do occasionally interact with the adults. Two or more adults in the room are seen as a benefit by all the pupils, for various reasons, many connected with particular subjects which require the performance of practical tasks e.g. art, IT, design technology. The other issue is one of reduced waiting time when two adults are supporting the work. Pupils prefer an instantaneous response and help, and adding adults to the class increases their chance of getting it. There was no hint of criticism or resentment that certain individuals in their classes were being given so much extra support. It seems to be an accepted feature of school life, from their point of view. Field worker’s notes, Y5 Case Studies
The great majority of pupils were happy to be supported by TAs and did not distinguish between their support and that of the teachers. Only a very few mentioned that the quality of teachers’ help was better.
58

Conclusions from the case studies • TAs spent most of their time interacting with pupils. This was repeatedly
emphasised as being their major form of support for the teachers. TAs provided teacher support, with administration and general duties, far less than direct support of pupils.
• Some TAs are deployed to provide support for named individuals. All but one of
these worked with their designated pupils in group contexts and in that way they shared their support with a wider number of pupils.
• Almost without exception, teachers welcomed and appreciated the extra adults in
their classes and they clearly trusted them to work very independently with pupils.
• School policies and the preferences of individual teachers appear to control how
TAs are deployed, rather than the sizes of the classes. • There is a lack of time for lesson planning and feedback with TAs. • Planning lessons independently and taking charge of the whole class are not seen
as part of the TAs’ proper work. • With more adult support, teachers would alter the organization of the class,
particularly in terms of group size and number. These changes would allow more widespread support to be given.
• Pupils recognise the benefits of having more than one adult in the room, with
many referring particularly to reduced time waiting for help and being helped with practical tasks. No pupils reject the support of TAs, but a small minority feel that help from the teacher is preferable.
59

6. Statistical analysis of the effect of TAs and other additional staff and characteristics of teaching assistants on pupil attainment over KS2 In each year of the project (Y4-6) we collected a range of information on TAs and other adults in the classes. On the basis of this information associations with measures of pupils’ progress in the same classes were calculated, the aim being to see if there was any evidence that the presence in class of TAs or other staff and adults, or any characteristics of TAs (such as training, experience), had an influence on pupils’ achievements. Teachers in each year were asked in the termly questionnaire to give details on the number and type of extra adults and staff in the class. Methods for doing this varied to some extent from year to year. In Y4 and Y5 the numbers of staff and adults in the classroom at a given time were recorded once during each term. An average of the three termly values was taken to create a measure of the extra staff and adults in the classroom during the school year. The majority of classes had either no additional adults/staff or an average of less than one over the school year. As a result, these two variables were categorised into three groups for the purposes of analysis (namely none, average of up to one, and average of more than one). Also measured in Y5 were the teachers’ estimates of the number of hours of support that they received during the week. This varied from none to 50 hours per week. This variable was analysed on a continuous scale, and was also split into 3 categories, these being little or no support (< 3 hrs per week), some support (3 to 17 hours per week), and a lot of support (> 17 hours per week). In the case of Y6, information was only collected once, but this time a separate record was made of staff and adults for each different lesson period. These data were combined so that the numbers of extra staff and extra adults in the classroom were available for each school subject separately. An average of the number of staff/adults over the different lessons (if there was more than one) was created for each subject. In addition, an overall value for each pupil was created from a weighted average of the values from each subject (weighted by the length of time spent for each subject). The measure of extra staff calculated for each specific subject could be thought of as being more directly applicable to the attainment outcome. However, it may be that an overall measure is more stable as this has been measured on a number of different occasions. In addition, as this is a more general measure, information is available on a greater number of pupils. The results for Y6 showed that the values for extra staff and adults were almost identical, so there appeared to be little benefit in analysing the effect of both of these two variables; therefore, only the number of extra staff in the class was considered. For the overall pupil measure, three categories were created, no extra staff, an average of less than one, and an average of one or more. For the individual subject measures, there were more pupils with no extra staff, so only two categories were created, no extra staff, and some extra staff. The TA questionnaires also provided information on a number of dimensions that it was felt might be important in affecting the relationship with pupil outcomes. These included number of hours worked, whether working with a statemented pupil, whether working with the whole class, groups or individual pupils, whether they had planning time, feedback time (with teachers), whether satisfied or not, whether a
60

current parent of a child in the school, whether they had been a parent, whether they were a volunteer, their qualification level (up to GCSE vs A level or higher), whether they had a qualification relevant to being a TA, whether they had attended the DfES induction course, attended INSET, whether they had been paid to attend INSET, and amount of experience (0-5 vs. 6 plus years). Descriptive information on these variables was given in Section 1 above. These were entered into analyses in order to see if particular groups of TAs (e.g. those who have received training) had an influence on attainment. In each case it is important to compare with a "control" situation where there are no teaching assistants present in the classroom. Where there was more than one TA in each class, only the characteristics of the TA that provided the most hours of support were considered. The results from any additional TAs were ignored for the purposes of analysis, as it would be extremely difficult to incorporate results from more than one TA in the analysis. However, the total number of TA hours per class was calculated by combining the hours from all the TAs in each class. Each of the TA characteristics was usually split into two groups (either high/low, or yes/no depending on the nature of the variable). Therefore, there were usually three groups for each variable, as the third group represented the group of pupils in classes with no TA. Having created these measures of TAs and other adults in classrooms, the next step was to examine associations with pupils’ attainments in the classes. The literacy, mathematics (and science) scores were converted into ‘normal’ scores to allow the same units of analysis to be used for all years. These are then transformed into a scale with a mean value of zero, and where one unit on the normalised scale equates to one standard deviation of the original outcome variable. All analyses were performed using multilevel regression models. A multilevel approach is needed because each pupil cannot be regarded as being independent of every other pupil. Pupils in the same class and school are likely to be more alike than those from different classes and different schools. In addition, the natural hierarchy in the data is taken into account. Three levels of hierarchy were used, with pupils nested within classes, which were contained within schools. Separate analyses were done for each year, i.e., Y4, 5 and 6. The statistical models included adjustments for previous attainment scores, so that the results will more accurately reflect the effects upon pupil progress in attainment made during the school year.. In all situations, the effect of each variable was added to a statistical model containing class size terms and attainment scores in the previous year, so the effects are adjusted for class size differences and reflect the influence on progress during each year. Results There is not space here to describe results in full. They can be easily expressed: there was no evidence from this quantitative part of the study that either the presence of TAs or any of their characteristics affected pupils’ progress. For illustration, results are given here for Y6 in literacy. The effects of the various extra staff measures upon pupil progress in literacy attainment were examined. The figures reported in Table 17 are the effect upon progress of each category relative to the baseline category for each variable (with corresponding standard error in brackets).
61

Table 17: Effect of extra staff and TAs on progress in literacy over Y6 Variable Category Estimate (S.E.) P-value Extra staff (overall) None 0 0.34 < 1 staff 0.045 (0.062) ≥1 staff -0.053 (0.067) Extra staff (literacy) None 0 0.82 Some staff 0.011 (0.047) TAs None 0 1.00 (termly questionnaire) Some staff -0.002 (0.125) The results indicate that there is no evidence of a significant effect of extra staff/TAs in the classroom upon progress in literacy for any of the three measures examined. Similar analyses were done in the case of mathematics and science and again no clear results emerged. Despite the sophistication of the statistical analysis, it might be argued that relating the presence or not of extra staff in classrooms with the attainment of pupils in that class is rather simplistic, for example, because there may well be differences between classes where the TA works with individual pupils, groups of pupils or the whole class. However, we found no differences between these three groups in associations with pupil progress. It might also be argued that the failure to find increased progress in classes where there are TAs might be a reflection of the fact that TAs tend to be there because of the presence of lower attaining pupils. However, the analyses took account of the prior attainments of the pupils, so this is unlikely to be the case. Nevertheless, one main limitation of these analyses is that they examine relationships between TAs and the academic outcomes for the whole class. Future research in this area will need to target more precisely the connections between TAs and the specific pupils they support, though this will not be an easy task; we saw in the case studies that TAs could be assigned to a particular pupil but sometimes work with other pupils who happened to be in the same group or nearby. Conclusions
• The quantitative results showed that there were no clear effects of the presence in the classroom of TAs or other adults and staff, extra to the teacher, on pupils’ academic progress.
• There were no effects on pupil academic outcomes found for characteristics of
TAs, that is, number of hours worked, whether working with a statemented pupil, whether they had planning time, feedback time (with teachers), whether satisfied or not, whether a current parent of a child in the school, whether they had been a parent, whether they were a volunteer, their qualification level, whether they had a qualification relevant to being a TA, whether they had
62

attended the DfES induction course, attended INSET, whether they had been paid to attend INSET, and amount of experience.
• There were no differences in pupil progress between TAs who worked with
individual pupils, groups of pupils or the whole class. • One limitation of these analyses is that they examine relationships between
TAs and academic outcomes for the whole class, rather than the specific pupils with whom TAs work.
63

General discussion and conclusions The role of TAs Many of the results from the KS2 phase of the research agree with and extend those from the KS1 phase. In this section we identify the main distinctive themes emerging from the KS2 study. The direct role of TAs in relation to pupils The Teaching Assistant’s role in relation to pupils can be seen in two ways: direct, in the sense of interacting directly with pupils, with an educational purpose, and indirect, in the sense of aiding the teacher, through such things as photocopying. This study found that the TA’s role is predominantly a direct interactive one in relation to pupils. For much of their time they are interacting with pupils in the context of their everyday work and their learning. This would include supporting teaching and learning, where these involve the TA in face to face interactions with pupils. In this sense we argue that it is appropriate to consider the TA’s role in terms of its pedagogical function, just as we can consider all interactions with an educational purpose (including those between teachers and pupils) in terms of their pedagogical function. We return to this point below. It is difficult to know whether the prevalence of a role involving direct interaction with pupils has become more pronounced in recent years, but it is now clearly dominant. This appears to have occurred in an informal, piecemeal manner with varying degrees of success, and appears to be independent of, and predates, recent policy initiatives on TAs. The results also show consistently that the main way that the direct role of TAs is exercised is through the support of certain children, in particular, those with SEN, low ability or difficult behaviour. Only rarely were TAs used to work with children of all abilities, or high ability children. As has been said before, there is something paradoxical about the least qualified staff in schools supporting the most educationally needy pupils. Nevertheless, teachers raise very few objections about delegating support of particular groups or individuals to their TAs. Rather, they welcome the opportunity that it gives them to deal with the remainder of the class. TAs are in general satisfied with their jobs, as we have seen, though some also felt that supporting lower attaining children might need higher rather than lower level skills. The effects of Teaching Assistants on pupil learning and attainment Given that the main role of TAs is a direct one in relation to pupil learning, how effective are they? The results from this study allow only a partial answer to this question. It appeared from the case study observations that when compared with the teachers, the TAs had much longer bouts of interaction with individuals and groups, largely due to the fact that the TA was generally static in one location, with their designated pupils, whilst the teacher moved from group to group in the rest of the class. To some extent this is supported by the systematic observation results, where it was found that from a pupil’s point of view teachers rarely interacted with them individually, or focused on them specifically, while TAs were able to give more focused individualised attention to them. There appears to be an assumption built into the approach to special educational needs, that longer periods of interaction with an adult will succeed in meeting the needs of those pupils. To this extent the results suggest that the most needy are receiving more attention. However, it appears to be
64

TAs not teachers who are providing the bulk of the interaction with SEN pupils and others with particular needs. This study was not set up to examine the content or quality of TA / pupil interactions and so it is not possible to say whether or not the longer periods of interaction were different educationally to those between teachers and pupils. Observations conducted as part of the case studies indicated that TAs varied in how effective they were in their support for pupils. But again we are not able to provide a systematic analysis of effectiveness in teaching interactions. It seems to us that a thorough investigation of the effectiveness of TAs, involving close study of the moment by moment interactions between TAs and pupils, is long overdue. It might be noted that despite the generally positive view of teachers about their TAs, there was little articulation of the academic benefits that pupils gain through working with them. A small minority assert that such pupils progress more or faster with the TAs’ input, but most do not refer to pupil progress at all. There is generally no mention of any objective measures providing the basis for these assertions. This is not to say that TAs were not effective in terms of pupil learning. And for their part, a number of TAs, when given reasons for their level of satisfaction, cited satisfaction stemming from helping pupils make progress and pleasure in working with them. But we were struck with how rarely teachers, head teachers, and TAs addressed specific ways in which this might work and be observed. Interestingly, teachers’ comments did indicate that reiteration, repetition and 'drilling' might be one way that TAs could contribute to learning and that this suggests one way that TAs’ interactive role in relation to pupils might complement that of the teacher. It is consideration of these aspects of TAs interactions with pupils that we feel should be addressed more specifically, and what we mean when we argue that there is value in a consideration of the pedagogical roles of teachers and TAs. We need to go deeper than a specification of the TAs role as ‘supporting teaching and learning’ because this does not address precisely enough effectiveness in classroom interaction, nor provide models or advice which teachers and TAs can use. It would be helpful to consider the interactive role in terms of dimensions such as evaluating and assessing learning, methods of questioning pupils, encouraging independence of learning, scaffolding learning, methods of explanation, use of examples, behavioural control and so on. We are not arguing that the TA and teacher roles are or should be the same; rather, it would be helpful to articulate ways in which the TA can complement and support the teacher, in terms of classroom interaction. It is important to remember that TAs are already interacting with pupils and will be informing, questioning and controlling pupils in these interactions. The issue here is how to make this as effective as possible. More broadly, teachers will have other, wider responsibilities, for example in terms of curriculum planning and assessment, within which the TAs contribution can also be positioned. As we argued in the KS1 report (Blatchford et al, 2002), it would therefore be helpful to draw on existing models of teaching and pedagogy, in order to more precisely position the TA’s role. Use might be made of Robin Alexander’s (2000) comprehensive analysis of the pedagogic functions of classroom discourse, and pedagogy more generally. In terms of effects on pupil attainment, the analyses conducted for this study showed few effects of TAs, and other pupil staff ratio measures, on pupil attainments. There is no evidence that the presence of TAs, or any characteristic of TAs, such as training or experience, had a measureable impact on pupil attainment. This is in line with results
65

from the KS1 phase of the project (Blatchford et al, 2002). Moreover, we found no differences in pupil attainment between classes where the TA works with individual pupils, groups of pupils or the whole class. One explanation offered in the KS1 report, suggested by the case studies conducted during that stage of the research, was that TAs varied greatly in their deployment and effectiveness, and this is again a possible explanation for the KS2 results. Despite the lack of clear associations between the presence of TAs and pupil academic attainment, we should be wary of concluding that TAs have no influence on pupils. One limitation of the analyses conducted for this report is that they examined relationships between TAs and the academic outcomes for the whole class. Future research in this area will need to target more precisely the connections between particular TAs and the specific pupils they support, though this will not be an easy task; we have seen that TAs might be assigned to a particular pupil but sometimes work with other pupils who happen to be in the same group or nearby. Another limitation is that the tests of academic achievement used in this study (and many others) may not easily detect the possibly subtle effects on learning and attitudes to learning that might result from a TA working with an individual pupil. The tests were also necessarily designed (by the QCA) to be most relevant to pupils covering the national curriculum, and may not have been so applicable to some of the pupils assisted by TAs. This research has provided perhaps one of the most thorough and large scale analyses of direct relationships between TA presence and pupil attainment, but it is clear that there are still enormous challenges for research in this area, and results to date cannot be seen as conclusive. The indirect role of TAs: benefits to teachers We have reviewed what we know about the direct effects of TAs on pupils. We now turn to indirect effects, in other words, effects not on pupils directly but on teachers – which may then have an indirect effect on pupils. The systematic observation results were clear in showing an effect of TAs in this indirect way, in terms of showing a beneficial effect on the teacher’s interactions with pupils, and the pupils’ interactions with teachers. With a TA present in the classroom, pupils had a more active form of interaction with the teacher, initiating contact, responding, or being involved in sustained interaction. When a TA was present, pupils were more likely to be the focus of the teacher’s attention, that is, there was more individualised teacher attention. Furthermore, we also find more interactions between teacher and pupils involving the task or work at hand. There is also more pupil on task behaviour when working on their own. The presence of TAs therefore helped maximise pupils’ and teachers’ attention to work. We are not able to fully account for this effect. There are two main possibilities. One is that the presence of the TA provides a stimulation for pupils to contribute more – the pupils may, for example, be encouraged to respond to the teacher and get involved by the TA. They may also encourage pupils to attend to their work. The second possibility is that by taking over responsibility for some pupils, the interactions between the teacher and the rest of the class benefit, for example, by allowing more time teaching and opportunities for the rest of the class to be involved in interactions with the teacher. Again further research, based on close attention to interactions between teachers, TAs and individual pupils is needed in order to better understand the classroom dynamics involved. These results, therefore, show that TAs can have an indirect effect on teaching; in other words, their presence can benefit teaching (by class teachers) at KS2, and in this sense they provide for the first time, hard evidence to support the teachers’ own views on the deployment of TAs (as seen in this report, and also in the recent Scottish study by Schlapp et al, 2002). The overwhelming opinion of teachers is that TAs are very
66

effective in supporting them in this way. Teachers, therefore, benefit from delegating the pupils in most need to the TAs because they are able to focus more of their attention on the rest of the class. From the teachers’ point of view, this allows them to more easily satisfy their ideal of meeting the needs of all pupils, which was clearly revealed in their answers to separate questions in the questionnaires about class size and teaching. If some pupil needs are perceived as not met, the pressure and guilt which this generates can be reduced through the deployment of TAs in interactive roles. Pupils with SEN of various kinds and those whose attainment and behaviour is of concern, can be disproportionately demanding of a teacher’s time, so having TAs in the class can make a significant contribution to meeting the needs of all pupils. This is how teachers characterise the impact of their TAs on their own work and they rate it in positive terms, almost without exception. Another way in which the indirect role of TAs on pupils might be manifest is through assistance to teachers in other ways. However, in the study we found that references to non-teaching support, such as the preparation of materials, administration and classroom organization, are relatively few. It is important to say that the results in this study were collected prior to the National Agreement, and cannot therefore be taken as a direct comment on the effectiveness of Government policy of supporting increased levels and training of support staff in schools. This is because the rapid pace of change means that results will not necessarily reflect recent changes and improvements in provision. Planning and feedback There were a number of other findings which replicate those from the KS1 phase of the research, and which are mirrored in other research. The difficulties of finding time for joint planning and feedback for TAs mean that teachers, whether or not they would want it or allow it, are less able to delegate the planning of lessons, or the selection of follow-up tasks, to TAs. Consistency of deployment of TAs In line with results from KS1, a number of questions were also raised about the consistency of the deployment of TAs in different classrooms. For some teachers there was no consistency in the support they received and so they come not to expect or rely upon it. This no doubt further serves to reduce motivation to prepare for the collaboration. The practice of TAs being shared around several classes, in an attempt to be fair to all teachers, needs to be questioned. TAs complained about how unsatisfactory it was to move about so much, with relatively short times in each class, and this movement exacerbated the problems of lack of planning and feedback time. If TAs only carried out non-pedagogical tasks, then it would not matter that they are moved about so much. Training of TAs There are also a number of concerns identified throughout this report about the training of TAs. Head teachers are aware of the changing nature of the TAs’ role and are clear about the importance of training for TAs. However, in line with previous research, training of TAs appeared at the time of the survey to be patchy and take up not extensive. There appeared to be a mismatch between the way TAs are deployed, that is, directly supporting pupils’ learning, and their professional preparation for it.
67
Less than half report having qualifications which are relevant to their work. TAs were not likely to be trained for their direct interactive role with pupils. It was interesting, as was evident at KS1, that some head teachers refer to other features of TAs which they consider important, or even preferable to training and qualifications, such as personal qualities, character, life experience and skills. It seems that some heads feel training courses can only make a person a successful TA if they build on the foundation of essential personal aptitudes; training cannot substitute for such features. There are encouraging signs from a pilot study funded by the DfES, through 18 LEAs, of the impact of targeted training of TAs to support the literacy and numeracy hours (DfES, 2004). There is agreement that school based training is helpful in the pedagogical role of TAs. This could also allow preparation of TAs to be considered in a more holistic way in the school context. Baskind and Thompson (1995) point out that there can be a mismatch between the training of classroom assistants (their term) and class teachers, with the result that teachers do not always make the best use of the skills of TAs. But some schools seemed to rely exclusively on within school training, and appear to be limiting the opportunity of TAs taking courses outside the school. Whilst this policy may reflect the doubts which some heads have about the availability of suitable outside courses, it can deny TAs the chance to benefit from trainers who may have skills and knowledge which go beyond those of the school’s own staff. Indeed, some heads themselves worry whether ‘on the job’ training is sufficient in making TAs competent to perform their increasingly demanding role as supporters of pupil learning. Professional satisfaction and status of TAs In the KS2 study, we were able to extend results from the KS1 study, because this time we collected data directly from TAs about their experiences, i.e., in the questionnaires and case studies. There are messages about the status of TAs and their professional satisfaction, which extend those found during KS1. TAs appear in a general sense to be satisfied with work they do. In response to more specific questions, there are also some who feel that their standing and status within schools – reflected in such things as admission to staff rooms and meetings, rates of pay and inclusion in lesson planning and feedback – is lagging behind their current role in schools. The lack of a national set of employment criteria, including qualification standards, salary levels, contracts and conditions of service, role definitions and responsibilities, is causing dissatisfaction amongst some TAs. Changes in this area would improve their job satisfaction. Conclusion The TA’s role in relation to pupils can be seen in two ways: direct, in the sense of interacting directly with pupils, and indirect, in the sense of aiding the teacher. This study found that the TA’s role is predominantly a direct one and in this sense their role is predominantly pedagogical. The study showed a mainly positive view about the TAs contribution, from teachers, head teachers and TAs themselves, but also some concerns about their preparation for the direct interactive role, in terms of training and qualifications, consistency of deployment between classrooms, and time for planning and feedback. This study found little quantitative evidence that the presence of TAs, or any characteristic of TAs, such as training or experience, had a measurable effect
68

on pupil attainment in the school class where they were deployed. However, results were clear in showing that TAs have an indirect effect on teaching. The presence of a TA in the classroom helped maximise pupils’ and teachers’ attention to work. Pupils had a more active form of interaction with the teacher and there was more individualised teacher attention. This supported teachers’ views that TAs are effective in supporting them in this indirect way. Overall, we conclude that we need even more precise studies which address the impact of TAs on the specific pupils they support, and that more attention needs to be paid to what we call the pedagogical role of TAs. This is important in order that we can get more insight into effective interactions between TAs and pupils and ways in which TAs can successfully augment and support the teacher’s contribution.
69

References Alexander, R. (2000). Culture & Pedagogy: International Comparisons in Primary Education. Blackwell Publishers Ltd: Oxford, UK and Malden, USA Anderson, L. W. (2000). Why should reduced class size lead to increased student achievement? In M. C. Wang and J. D. Finn (Eds.) How Small Classes Help Teachers Do Their Best. Philadelphia: Temple University Center for Research in Human Development. Baskind, S. & Thompson, D. (1995). Using assistants to support the educational needs of pupils with learning difficulties: the sublime or the ridiculous? Educational and Child Psychology, 12(2). Blatchford, P. (2003a) The Class Size Debate: Is Small Better? Open University Press: Maidenhead, U.K. and Philadelphia, U.S.A. Blatchford, P. (2003b) A systematic observational study of teachers' and pupils' behaviour in large and small classes. Learning and Instruction, 13(6), 569-595. Blatchford, P., Baines, E., Kutnick, P., & Martin, C. (2001) Classroom contexts: connections between class size and within class grouping. British Journal of Educational Psychology, 71, 2, 283-302. Blatchford, P., Bassett, P., Goldstein, H., and Martin. C. (2003) Are class size differences related to pupils' educational progress and classroom processes? Findings from the Institute of Education Class Size Study of children aged 5-7 Years. British Educational Research Journal, 29, 5, 709-730. Special Issue 'In Praise of Educational Research', Guest Editors: S. Gorrard, C. Taylor and K. Roberts. Blatchford, P., Edmonds, S., & Martin, C. (2003). Class size, pupil attentiveness and peer relations. British Journal of Educational Psychology. 73, 15-36. Blatchford, P., Burke, J., Farquhar, C., Plewis, I. & Tizard, B. (1987).' A systematic observation study of children's behaviour at infant school'. Research Papers in Education. 2, 1,47-62. Blatchford, P., Goldstein, H., Martin, C. & Browne, W. (2002). A study of class size effects in English school reception year classes. British Journal of Educational Research, 28,2,169-185. Blatchford, P., Goldstein, H., & Mortimore, P. (1998) Research on class size effects: a critique of methods and a way forward. International Journal of Educational Research. 22,691-710. Blatchford, P., Martin, C., Moriarty, V., Bassett, P. & Goldstein, H. (2002). Pupil-adult Ratio Differences and Educational Progress Over Reception and Key Stage 1. Department for Education and Skills. Research Brief No. 335. Blatchford, P., Martin, C., Moriarty, V., Bassett, P., and Goldstein, H. (2002) Pupil-adult Ratio Differences and Educational Progress over Key Stage 1. Final Report to the DfES.
70

Blatchford, P., Martin, C., Moriarty, V., Bassett, P., and Goldstein, H. (2002) Pupil-adult Ratio Differences and Educational Progress over Key Stage 1. Research Brief, DfES. Blatchford, P., Moriarty, V., Edmonds, S., & Martin, C. (2002). Relationships between class size and teaching: a multi-method analysis of English infant schools. American Educational Research Journal. . 39, 1, 101-132. DfES (2004) Primary National Strategy: Teaching Assistants in Year 6 – Lessons learned from the Teaching Assistants in Year 6 Pilot 2002-2003; DfES Farrell, P., Balshaw, M. & Polat, F. (1999). 'The management, role and training of LSAs'. Paper presented at BERA, Brighton. Finn, J. D., Gerber, S. B., Farber, S. L. & Achilles, C.M. (2000). Teacher aides: An alternative to small classes? In M.C. Wang and J.D. Finn (eds) How Small Classes Help Teachers Do Their Best. Philadelphia, PA: Temple University Center for Research in Human Development. Goldstein, H. & Blatchford, P. (1998). Class Size and Educational Achievement: a review of methodology with particular reference to study design. British Educational Research Journal. 24, 3, 255-268. HMI (2001) The national numeracy strategy: the second year and evaluation by HMI. A report by HMI (HMI Report 333). London: OFSTED HMI, (2002). Teaching assistants in Primary Schools: An evaluation of the quality and impact of their work. A report by HMI (HMI Report 434). London: OFSTED Lee, B (2002). Teaching assistants in schools: The current state of play. (NFER Research Summary). Slough: NFER Mortimore, P., Mortimore, J., Thomas, H., Cairns, R. and Taggart, B. (1992). The Innovative Uses of Non-teaching Staff in Primary and Secondary Schools Project: Final Report. London: Institute of Education/DfEE. Muijs, R. D., Reynolds, D. (2000). 'School Effectiveness and Teacher Effectiveness in Mathematics: Some Preliminary Findings from the Evaluation of the Mathematics Enhancement Programme Primary'. School Effectiveness and School Improvement, 11 (3), 28-47. Schlapp, U., Wilson, V. & Davidson, J. (2001) 'An Extra Pair of Hands?' Evaluation of the classroom assistants initiative. Interim Report. Report 104. Edinburgh: SCRE. Tizard, B., Blatchford, P. Burke, J., Farquhar, C. & Plewis, I. (1988). Young Children at School in the Inner City. Hove: LEA. Wasik, B.A. & Slavin, R.E. (1993). 'Preventing early reading failure with one-to-one tutoring: a review of five programs'. Reading Research Quarterly. 28 (2), 179-200.
71
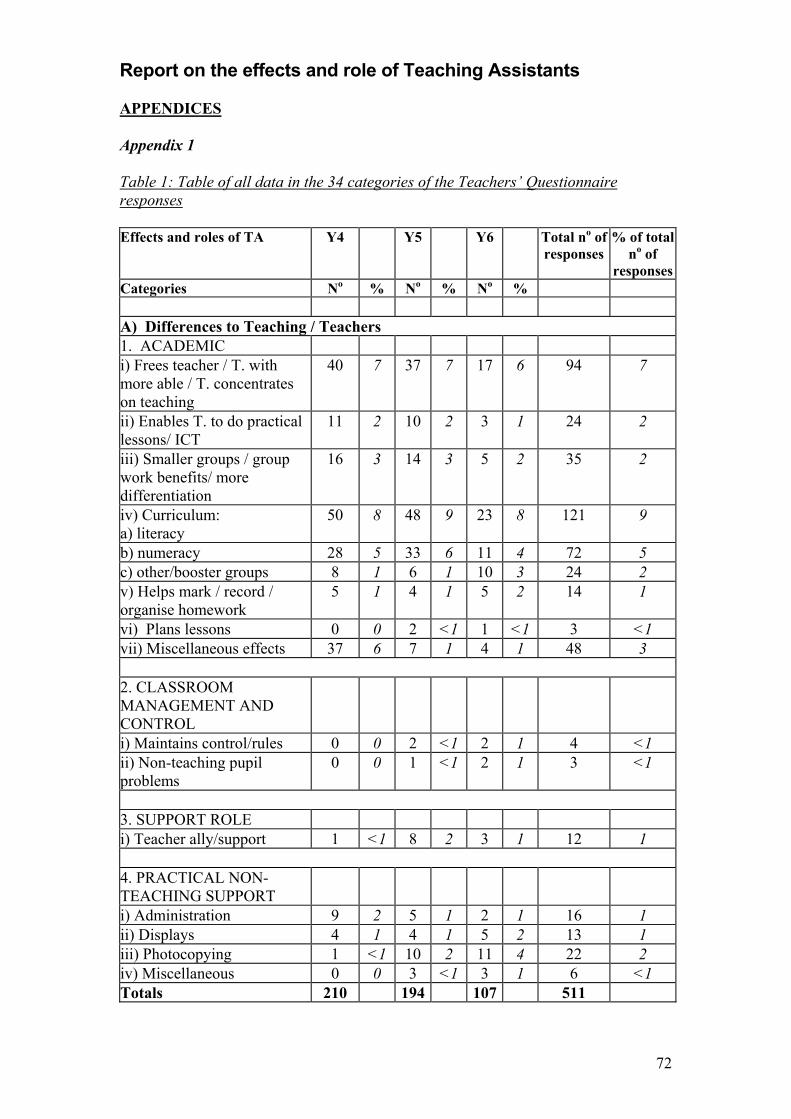
Report on the effects and role of Teaching Assistants APPENDICES Appendix 1 Table 1: Table of all data in the 34 categories of the Teachers’ Questionnaire responses Effects and roles of TA Y4 Y5 Y6 Total no of
responses % of total
no of responses
Categories No % No % No % A) Differences to Teaching / Teachers 1. ACADEMIC i) Frees teacher / T. with more able / T. concentrates on teaching
40 7 37 7 17 6 94 7
ii) Enables T. to do practical lessons/ ICT
11 2 10 2 3 1 24 2
iii) Smaller groups / group work benefits/ more differentiation
16 3 14 3 5 2 35 2
iv) Curriculum: a) literacy
50 8 48 9 23 8 121 9
b) numeracy 28 5 33 6 11 4 72 5 c) other/booster groups 8 1 6 1 10 3 24 2 v) Helps mark / record / organise homework
5 1 4 1 5 2 14 1
vi) Plans lessons 0 0 2 <1 1 <1 3 <1 vii) Miscellaneous effects 37 6 7 1 4 1 48 3
2. CLASSROOM MANAGEMENT AND CONTROL
i) Maintains control/rules 0 0 2 <1 2 1 4 <1 ii) Non-teaching pupil problems
0 0 1 <1 2 1 3 <1
3. SUPPORT ROLE i) Teacher ally/support 1 <1 8 2 3 1 12 1
4. PRACTICAL NON-TEACHING SUPPORT
i) Administration 9 2 5 1 2 1 16 1 ii) Displays 4 1 4 1 5 2 13 1 iii) Photocopying 1 <1 10 2 11 4 22 2 iv) Miscellaneous 0 0 3 <1 3 1 6 <1 Totals 210 194 107 511
72

Table of all data in the 34 categories of the Teachers’ Questionnaire responses continued Effects and roles of TA Y4 Y5 Y6 Total no of
responses % of total
no of responses
Categories No % No % No % B Differences to Learning / Learners i) Pupil progress / more / faster
44 7 24 5 10 3 78 6
ii) Pupils stay on task 11 2 6 1 6 2 23 2 iii) Pupils gain confidence 10 2 6 1 1 <1 17 1 iv) Reinforcement / understanding
38 6 4 3 6 2 58 4
v) Behaviour 4 1 3 <1 11 4 18 1 vi) Social support / share problems
4 1 1 <1 1 <1 6 <1
vii) Miscellaneous effects 17 3 7 3 0 0 34 2 128 22 71 14 35 12 234 16
C) TA Role / Interaction with Pupils i) Works with groups of 2 or more
66 11 30 6 35 12 131 9
ii) Works with named / statemented individuals
28 5 31 6 12 4 71 5
iii) Works with pupils 1:1 18 3 15 3 12 4 45 3 iv) Works with all abilities 5 1 3 <1 1 <1 9 1 v) Works with less able / SEN / disruptive
80 13 61 12 34 12 175 12
vi) Works with more able 0 0 1 <1 2 1 3 <1 vii) Observes and identifies weaknesses
0 0 2 <1 3 1 5 <1
197 32 43 28 99 34 439 31
D. General Descriptive Responses i) Positive opinions 69 11 86 17 38 13 193 14 ii) Negative opinions: a) stress
0 0 1 <1 2 1 3 <1
b) time taken 3 <1 3 <1 3 1 9 1 c) limitations of TA 0 0 11 2 6 2 17 1 72 12 101 20 49 17 222 16
TOTAL number of responses
607 509 290 1406
73

Appendix 2 Table 1: If TA has not been on the DfES ‘Induction Training’ what are the reasons for this?” Reasons Y5
(N=74) Y6 (N=72)
No % No %
Total no of
responses
% of total no of
responses 1. Not offered/did not know / not told
38 51 42 58 80 53
2. Not needed/ irrelevant / experienced
17 23 15 21 32 21
3. No explanation/don’t know why/no answer
11 15 8 11 19 13
4. Didn’t exist when I started 0 0 5 7 5 3 5. Not available/course cancelled 4 5 0 0 4 3 6. Started job recently/will be doing it soon
3 4 2 3 5 3
7. Lack of funding 0 0 2 3 2 1 8. New TAs prioritised/not eligible
0 0 2 3 2 1
9. No time 0 0 1 1 1 1 10. Transferred from other school 0 0 1 1 1 1 Totals 73 78 151
Table 2:“If TA has been on the DfES Training Course have they as a result changed the way they do things in school? Effects/changes Y5
(N=26) Y6 (N=21)
No % No %
Total no of responses
% of total no of
responses 1. No change 10 38 7 33 17 29 2.Changes /effects 10 20 30 52 a. clearer understanding 1 4 6 29 7 12 b. more aware of learning styles 1 4 3 14 4 7 c. behaviour management useful 4 15 2 10 6 10 d. reinforced what I did/more confident
1 4 1 10 2 3
e. adapt to suit individuals 1 4 1 5 2 3 f. gave education background 0 0 1 5 1 2 g. improved ways of teaching 0 0 1 5 1 2 h. using different strategies in Lit. & Num.
0 0 1 5 1 2
i. using different sorts of questions
1 4 1 5 2 3
j. more aware of importance of my help
0 0 1 5 1 2
k. TAs swapped ideas 1 4 1 5 2 3 l. more aware of curriculum links 0 0 1 5 1 2 3. Irrelevant/unclear/no answer 8 31 3 14 11 19 Totals 28 30 58
74

Table 3:“If TA has not attended school-based in-service training days, what are the main reasons for this?” Reasons Y4
(N=45) Y5 (N=19)
Y6 (N=16)
No % No % No %
Total no of responses
% of total no of
responses 1. Never asked 15 33 10 53 6 38 31 39 2. Not relevant 10 22 0 0 5 31 15 19 3. Not in contract / council employee
6 13 0 0 2 13 8 10
4. Not paid / on non-working days/ voluntary
1 2 7 37 2 13 10 13
5. No reason given 0 0 0 0 1 6 1 1 6. Temporary post / new in post
6 13 1 5 0 0 7 9
7. No INSET to attend / infrequent
4 9 1 5 0 0 5 6
8. No time / family / other job
3 7 0 0 0 0 3 4
Total 80 Table 4 “If TA has not attended any other training courses (leading to a qualification or other courses outside the school) what are the reasons.” Reasons Y4
(N=35) Y5 (N=28)
Y6 (N=16)
No % No % No %
Total no of responses
% of total no of responses
1. None offered / told / unaware 11 31 5 18 4 25 20 26 2. No time / inconvenient / family reasons
6 17 4 15 5 31 15 19
3. Not available locally / can’t travel 2 2 1 4 3 19 6 8 4. New in job / temporary post 6 17 3 11 0 0 9 12 5. Lack of funding / school won’t pay
1 3 4 15 2 13 7 9
6. Not needed / already qualified 4 11 0 0 2 13 6 8 7. Too daunting / intense / time commitment
1 3 0 0 1 6 2 3
8. Not yet started / hope to start 0 0 6 21 0 0 6 8 9. Retiring soon 0 0 2 7 0 0 2 3 10. Irrelevant answers 0 0 2 7 0 0 2 3 11. No incentive / no salary increase 0 0 1 4 0 0 1 1 12. Don’t qualify to attend 1 3 0 0 0 0 1 1 13. Various constraints (time, money etc.)
1 3 0 0 0 0 1 1
Total 78
75

Table 5 “The range of tasks carried out by the TA in each of the classes they work in.” Tasks Y5
(N=101) Y6 (N=95)
No % No %
Total no
of responses
% of total no of responses
A. Supporting the Teacher 182 152 334 27 1. Handling materials 87 83 170 14 a. display 35 35 28 29 63 5 b. photocopying 30 30 35 37 65 5 c. preparation/resources 16 16 18 19 34 3 d. laminating 6 6 2 2 8 1
2. Related to teaching 53 19 72 6 a. marking/correcting pupils’ work/evaluation
17 17 9 9 26 2
b. preparing/implementing IEPs 12 12 0 0 12 1 c. planning 10 10 3 3 13 1 d. recording marks/keeping records 10 10 7 7 17 1 e. writing reports 4 4 0 0 4 <1
3. Administration 30 19 49 4 a. admin./filing/clerical/paper work 25 25 14 15 39 3 b. register/ pastoral register 4 4 3 3 7 1 c. collecting money 1 1 2 2 3 <1
4. Other 12 31 43 3 a. playground duty 6 6 10 11 16 1 b. tidying room/ classroom organisation
4 4 1 1 5 <1
c. contacting parents 2 2 5 5 7 1 d. supporting teacher 0 0 7 7 7 1 e. attend SEN reviews 0 0 4 4 4 <1 f. dinner duty 0 0 2 2 2 <1 g. cleaning 0 0 2 2 2 <1
76

Tasks Y5
(N=101) Y6 (N=95)
No % No %
Total no
of responses
% of total no of responses
B. Supporting the Pupils 536 377 913 73 1. Which pupils 209 141 350 28 a. groups / pairs 101 100 46 48 147 12 b. individual pupils 30 30 25 26 55 4 c. SEN pupils 26 26 28 29 54 4 d. general support to whole class 25 25 12 13 37 3 e. statemented pupils 14 14 17 18 31 2 f. lower ability pupils 9 9 13 14 22 2 g. EAL pupils 4 4 0 0 4 <1
2. Which part of curriculum 327 236 506 41 a. individuals reading / guided reading
82 82 31 33 113 9
b. numeracy / maths 76 76 40 42 116 9 c. literacy / spelling / handwriting 94 94 45 47 139 11 d. testing / assessing pupils 14 14 1 0 15 1 e. ICT / typing 10 10 13 14 23 2 f. art 9 9 5 5 14 1 g. homework 6 6 0 0 6 <1 h. design technology 5 5 9 9 14 1 i. scribing for individuals 3 3 0 0 3 <1 j. all curriculum 0 0 19 20 19 2 k. ALS/Springboard/other programmes
0 0 12 13 12 1
l. science 0 0 10 11 10 1 m. SATs revision 0 0 7 7 7 1 n. P.E. 0 0 4 4 4 <1 o. life skills 0 0 1 1 1 <1 p. R.E. 0 0 1 1 1 <1 q. history 0 0 1 1 1 <1 r. geography 0 0 1 1 1 <1 s. swimming 5 5 2 2 7 1
3. General assistance 23 34 57 5 a. behaviour management 12 12 13 14 25 2 b. first aid 5 5 9 9 14 1 c. class outings / field trips 5 5 11 12 16 1 d. personal hygiene 1 1 0 0 1 <1 e. school plays 0 0 1 1 1 <1
C. Other – TA meetings 0 0 1 1 1 <1 Total 1248
77

Table 6:“When TA works with a child or group of children, is this usually in the same classroom as the child/children’s classmates or somewhere else in the school?
Location Y5 (N=99)
Y6 (N=95)
No % No %
Total no of
responses
% of total no of
responses 1. In the classroom 82 81 70 74 152 45 2. Out of the classroom 109 100 76 80 144 43 a. another area of the school / not identified
26 26 24 25 50 15
b. library 20 20 11 123 31 9 c. ICT room / suite 3 3 11 12 14 4 d. SEN room 2 2 6 6 8 2 e. quiet room 15 15 0 0 15 4 f. spare / other room 10 10 0 0 10 3 g. shared area 4 4 0 0 4 1 h. corridor 3 3 0 0 3 1 i. garden 1 1 0 0 1 <1 j. practical area 0 0 6 6 6 2 k. resources room 0 0 1 1 1 <1 l. studio 0 0 1 1 1 <1 3. Not identified 25 25 16 17 41 12 Total 337
78

Table 7:“TA comments on how they feel planning time affects their work in the classroom. YES – have planning time Comments / effects Y4
(N=24) Y5 (N=29)
Y6 (N=18)
No % No % No %
Total no of
responses
% of total no of
responses 1. Positive effects 27 19 9 55 62 a. better / more effective lessons / more pupil support
10 42 10 34 3 17 23 26
b. work is easier / works well
2 8 4 14 2 11 8 9
c. work is more understandable
3 13 1 3 1 6 5 6
d. positive effects on my work
3 13 2 7 1 6 6 7
e. better prepared 9 38 2 7 1 6 12 13 f. more confident 0 0 0 0 1 6 1 1 2. How planning is done 7 15 5 27 30 a. at assembly / lunch times / before school
3 13 7 24 2 11 12 13
b. weekly planning time 0 0 1 3 2 11 3 3 c. half-termly meetings 0 0 0 0 1 6 1 1 d. limited time available / rushed
4 17 7 24 0 0 11 12
3. No effect 1 4 2 7 0 0 3 3 4. No comment / irrelevant answer
0 0 3 10 1 6 4 4
Total 89
79
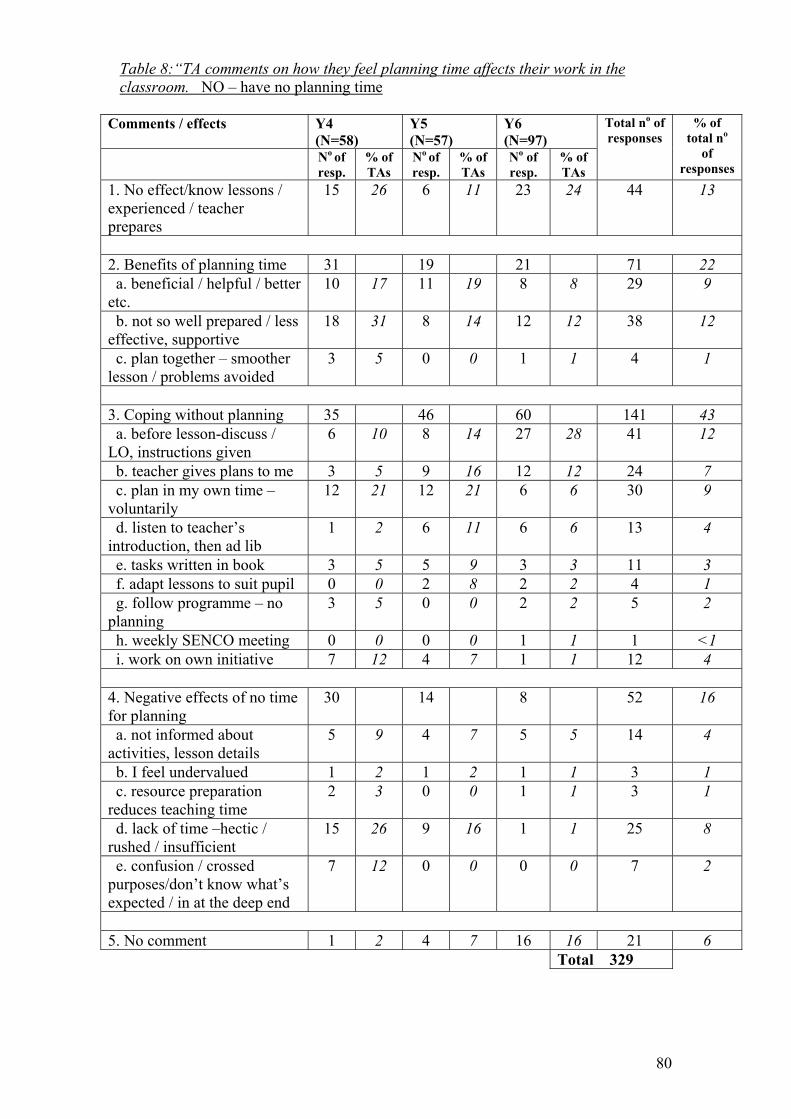
Table 8:“TA comments on how they feel planning time affects their work in the classroom. NO – have no planning time
Comments / effects Y4 (N=58)
Y5 (N=57)
Y6 (N=97)
No of resp.
% of TAs
No of resp.
% of TAs
No of resp.
% of TAs
Total no of responses
% of total no
of responses
1. No effect/know lessons / experienced / teacher prepares
15 26 6 11 23 24 44 13
2. Benefits of planning time 31 19 21 71 22 a. beneficial / helpful / better etc.
10 17 11 19 8 8 29 9
b. not so well prepared / less effective, supportive
18 31 8 14 12 12 38 12
c. plan together – smoother lesson / problems avoided
3 5 0 0 1 1 4 1
3. Coping without planning 35 46 60 141 43 a. before lesson-discuss / LO, instructions given
6 10 8 14 27 28 41 12
b. teacher gives plans to me 3 5 9 16 12 12 24 7 c. plan in my own time – voluntarily
12 21 12 21 6 6 30 9
d. listen to teacher’s introduction, then ad lib
1 2 6 11 6 6 13 4
e. tasks written in book 3 5 5 9 3 3 11 3 f. adapt lessons to suit pupil 0 0 2 8 2 2 4 1 g. follow programme – no planning
3 5 0 0 2 2 5 2
h. weekly SENCO meeting 0 0 0 0 1 1 1 <1 i. work on own initiative 7 12 4 7 1 1 12 4
4. Negative effects of no time for planning
30 14 8 52 16
a. not informed about activities, lesson details
5 9 4 7 5 5 14 4
b. I feel undervalued 1 2 1 2 1 1 3 1 c. resource preparation reduces teaching time
2 3 0 0 1 1 3 1
d. lack of time –hectic / rushed / insufficient
15 26 9 16 1 1 25 8
e. confusion / crossed purposes/don’t know what’s expected / in at the deep end
7 12 0 0 0 0 7 2
5. No comment 1 2 4 7 16 16 21 6 Total 329
80

Table 9: Comments on having allocated time (paid) in which to provide feedback or discuss individual children with the class teacher” YES – have feedback time
Comments / Effects Y4 (N=27) Y5 (N=24) Y6 (N=17)
No of resp
% of TAs
No of resp
% of TAs
No of resp
% of TAs
Total no of
responses
% of total no of
responses
1. Positive effects 43 20 17 80 73 a. helpful / useful / a good thing
14 52 2 8 4 24 20 18
b. helps evaluate pupil progress
7 26 4 17 3 18 14 13
c. more sensitive to pupil needs
10 377 6 25 2 12 18 16
d. work is easier / more understandable
0 0 0 0 2 12 2
e. work is more productive
4 15 2 8 1 6 7 6
f. helps my self improvement
0 0 0 0 1 6 1 1
g. maintains continuity 1 4 1 4 1 6 3 3 h. helps teacher / TA relationship
4 15 0 0 1 6 5 5
i. good communication with teacher
3 5 5 21 2 12 10 9
2. How feedback is done 1 9 3 13 12 a. end of lesson / session 1 4 5 21 2 12 8 7 b. during assembly 0 0 4 17 1 6 5 5
3. Other 3 12 2 17 15 a. not long enough 1 4 9 38 1 6 11 10 b. my knowledge of pupils is taken into account
2 7 1 4 1 6 4 4
c. pupils lose out if no time
0 0 2 8 0 0 2 2
Total 110
2
81

Table10: Comments on having allocated time (paid) in which to provide feedback or discuss individual children with the class teacher” NO – have no feedback time
Comments / effects Y4
(N=44) Y5 (N=54)
Y6 (N=98)
No of resp
% of TAs
No of resp
% of TAs
No of resp
% of TAs
Total no of responses
% of total no of
responses
1. No effects / not necessary/discuss anytime
8 18 3 6 12 12 23 8
2. Benefits of feedback time
23 19 11 53 18
a. give better support 6 14 11 20 5 5 22 8 b. would help greatly / good / nice
10 23 3 6 3 3 16 6
c. more satisfying 4 9 0 0 2 2 6 2 d. vital to be kept aware 3 7 5 9 1 1 9 3
3. Alternatives to feedback time
32 53 65 150 52
a. discuss between lessons
6 14 28 52 38 39 72 25
b. discuss in own time 23 52 13 24 20 20 56 19 c. use forms / notes 3 7 12 22 6 6 21 7 d. feedback to SENCO 0 0 0 0 1 1 1 <1
4. Negative effects 8 2 4 14 5 a. undervalued / work not noticed
3 7 0 0 2 2 5 2
b. rushed / not listened to 5 11 2 4 2 2 9 3
5. Other 21 14 5 40 14 a. feedback sheet rejected 0 0 0 0 1 1 1 <1 b. should have time / limited time
21 48 14 26 4 4 39 13
6. No comment given 1 2 1 2 8 8 10 3 Total 290
82

Table 11: TA reasons for their level of satisfaction with their job below. Very Satisfied
Reasons for level of satisfaction
Y4 (N=89)
Y5 (N=52)
Y6 (N=61)
No of resp
% of TAs
No of resp
% of TAs
No of resp
% of TAs
Total no of
responses
% of total no of responses
1. Teacher issues 23 41 43 107 34 a. good relationship / team / partners
11 12 21 40 23 38 55 18
b. supportive staff 2 2 4 8 10 16 16 5 c. TAs appreciated 7 8 11 21 8 13 26 8 d. can take problems to teacher
2 2 3 6 1 2 6 2
e. teacher well prepared
1 1 2 4 1 2 4 1
2. Pupil issues 27 33 29 89 28 a. helping pupils progress/learn etc.
15 17 17 33 16 26 48 15
b. nature of the children/working with children
12 13 16 31 13 21 41 13
3. Aspects of the role 11 18 24 53 17 a. know what’s expected
2 2 6 12 8 13 16 5
b. given autonomy / use initiative
1 1 1 2 6 10 8 3
c. teacher uses me / my ideas to the full
2 2 4 8 3 5 9 3
d. vital role supporting teacher
2 2 2 4 3 5 7 2
e. challenge 1 1 2 4 2 3 5 2 f. variety / balance 3 3 3 6 2 3 8 3
4. Context –environment / atmosphere
3 3 4 8 3 5 10 3
5. Other – negative points
3 3 2 4 0 0 5 2
6. No reason given 48 54 1 2 1 2 50 16 Totals 115 99 100 314
83

Table 12: TA reasons for their level of satisfaction with their job below. Satisfied
Reasons Y4 (N=87)
Y5 (N=36)
Y6 (N=32)
No of resp.
% of TAs
No of resp.
% of TAs
No of resp.
% of TAs
Total no of responses
% of total no of
responses
1. Teacher issues 25 19 14 58 27 a. good relationship /valued team member
12 14 10 28 10 31 32 15
b. friendly staff / excellent colleagues
6 7 3 8 4 13 13 6
c. TAs valued / appreciated / respected
7 8 6 17 0 0 13 6
2. Pupil issues 27 11 15 53 24 a. pupils progressing / work with pupils / long term
17 20 6 17 14 44 37 17
b. lovely children / working with children
10 11 5 14 1 3 16 7
3. Aspects of the role 10 7 6 23 11 a. teacher explains what’s needed / effective use
3 3 3 8 4 13 10 5
b. challenge / responsibility / autonomy
1 1 2 6 2 6 5 2
c. varied work 2 2 2 6 0 0 4 4 5 0 0 0 0 4 2
4. School environment
4 5 2 6 3 9 9 4
5. Negative points 13 15 17 47 0 0 30 14
6. More training is available
3 3 0 0 0 0 3 1
7. No reason given 39 45 2 6 1 3 42 19 TOTALS 121 58 39 218
2 d. rewarding / worthwhile
84
Table 13: TA reasons for their level of satisfaction with their job below. Neither Satisfied nor Dissatisfied Reasons Y4
(N=14) Y5 (N=12)
Y6 (N=14)
No of resp
% of TAs
No of resp
% of TAs
o of % of TAs
o
of responses
% of total no of
responses
1. Pupil issues 2 4 3 9 20 a. know pupils / understand SEN pupils
0 0 0 0 1 7 1 2
b. problem with pupil/unresponsive pupil
1 7 1 8 2 14 4 9
c. enjoy work with pupils
1 7 3 25 0 0 4 9
2. Aspects of the role 7 5 6 18 41 a. variety 0 0 0 0 1 7 1 2 b. Y6 small part – adds little
0 0 0 0 1 7 1 2
c. could contribute more / bored / SATs dominate
1 7 4 33 2 14 7 16
d. threat of redundancy – stress
0 0 0 0 1 7 1 2
e. pressures of working in all classes
1 7 0 0 1 7 2 5
f. not enough time with individual pupils to progress
2 14 1 8 0 0 3 7
g. acting as teacher/ pupils short-changed
1 7 0 0 0 0 1 2
h. not informed enough about work
2 14 0 0 0 0 2 5
3. Other 2 3 1 6 14 a. fits well with family life
0 0 0 0 1 7 1 2
b. school changes – friction over roles/ poor management
2 14 3 25 0 0 5 11
4. No reason given 7 50 2 17 2 14 11 25 TOTALS 18 14 12 44
Nresp
Total n
85

Table 14: TA reasons for their level of satisfaction with their job below. Dissatisfied
Reasons Y4
(N=5) Y5 (N=2)
Y6 (N=5)
No of resp
% of TAs
No of resp
% of TAs
No % of TAs
Total no of
responses
% of total no
of responses
1. Status 3 0 2 5 28 a. not given professional salary / status / undervalued
1 20 0 0 1 20 2 11
b. untrained & assumed to be competent
1 20 0 0 0 0 1 6
c. feel excluded at times
1 20 0 0 1 20 2 11
2. Pupil behaviour/undermine authority
1 20 1 50 1 20 3 17
3. Aspects of the role 4 2 4 10 56 a. bored / not enough to do
1 20 0 0 2 40 3 17
b. hectic / unprepared 0 0 0 0 2 40 2 11 c. no time to plan or feedback
0 0 1 50 0 0 1 6
d. disjointed work / too many pupils
1 20 1 50 0 0 2 11
e. teacher disorganised / unprepared
1 20 0 0 0 0 1 6
f. disagree with teacher
1 20 0 0 0 0 1 6
4. No reason given 0 0 0 0 0 0 0 0 Totals 8 3 7 18
Table 15: TA reasons for their level of satisfaction with their job below. Very Dissatisfied Reasons Y4
(N=2) Y5 (N=0)
Y6 (N=2)
No of resp
% of No of resp
% of TAs
No of resp
% of TAs
o % of total no
of responses
1. Aspects of the role 1 0 2 3 60 a. crowd control is main job
0 0 0 0 1 50 1 20
b. fed up / no support with SEN pupil
0 0 0 0 1 50 1 20
c. lack of communication / feedback / preparation
1 50 0 0 0 0 1 20
2. No reason given 1 50 0 0 1 50 2 40 Totals 2 0 3 5
TAs
Total nof
responses
86

Table 16: Comments on what TA feels would improve your level of job satisfaction Suggestions Y4
(N=107) Y5 (N=102)
Y6 (N=114)
Total no of responses
% of total no of
responses No of resp
% No of resp
% No of resp
%
1.Changes to pay and conditions
38 36 21 95 25
a. salary to match qualifications / experience / responsibilities etc.
17 16 18 18 14 12 49 13
b. job security / permanent contracts
3 3 5 5 4 4 12 3
c. full-time basis 0 0 0 0 1 1 1 <1 d. match work to training 0 0 0 0 1 1 1 <1 e. join staff room / meetings
4 4 0 0 1 1 5 1
f. clarification of TA role / status
3 3 4 4 0 0 7 2
g. valued by Govt., LEA, school
11 10 9 9 0 0 20 5
2. Changes in deployment 28 17 29 74 20 a. involved in planning / see plans
4 4 2 2 6 5 12 3
b. work in one class / year group
1 1 2 2 3 3 6 2
c. smaller groups of SEN pupils
0 0 2 2 0 0 2 1
d. do more / involved in school / class trips
1 1 2 2 5 4 8 2
e. less administrative work
0 0 1 1 3 3 4 1
f. LSA meetings / share / better communication in school
10 10 5 5 1 1 16 4
g. more organised classroom
1 1 1 1 0 0 2 1
h. room for LSA work / SEN groups
1 1 2 2 0 0 3 1
i. more work with pupils 4 4 0 0 3 3 7 2 j. more discussion with teachers re pupils
1 1 0 4 0 3 3 1
k. more work to do 1 1 0 0 1 1 2 1 l. fewer curriculum subjects
0 0 0 0 1 1 1 <1
87

Suggestions Y4
(N=107) Y5 (N=102)
Y6
No of resp
% No of resp
% No of resp
%
Total no of responses
% of total no of
responses
m. get support in dealing with particular pupil
0 0 0 0 1 1 1 <1
n. work more often with more able pupils
1 1 0 0 1 1 2 1
o. smaller classes 1 1 0 0 1 1 2 1 p. doors on rooms to reduce noise
1 1 0 0 0 0 1 1
q. Head’s support re pupil behaviour
1 1 0 0 0 0 1 1
3. Training 22 10 10 42 11 a. more courses / INSET / degree / in school time
17 16 7 7 9 8 33 9
b. visit other schools to learn from them
0 0 1 1 0 0 1 <1
c. behaviour management 4 4 1 1 1 1 6 2 1 1 1 1 0 0 2
4. Time changes 17 29 17 63 17 a. work more hours / longer lessons / time to organise
5 5 3 3 0 0 8 2
b. breaks at same time as teachers
0 0 1 1 0 0 1 <1
c. more time with individual pupils
0 0 1 1 0 0 1 <1
d. more time / energy 0 0 2 2 17 15 19 5 e. time with teacher for planning / feedback
12 11 22 22 0 0 34 9
5. No suggestions to make 4 4 2 11 2 10 17 5
6. Other 1 0 2 3 1 a. change in pupil attitudes
1 1 0 0 1 1 2 1
b. money for school developments
0 0 0 0 1 1 1 <1
7. No response 40 37 43 42 0 0 83 22 Totals 150 137 377 90
(N=114)
d. better grounding in reading scheme / other subjects
1
88
Appendix 3 Head Teachers’ Questionnaire – Years 5 and 6 (2001/03) Table 1: Responses to the question: How important are training and/or qualifications for teaching assistants? Please comment with reference to your own experience as a teacher and head teacher and your experience in this school.
Y5 (N=126)
Y6 (N=92)
Responses
Total no of resp.
% of total no of resp.
Total nresp.
% of total nresponses
o of % of total no of resp.
Total no of responses
o of
1. How schools handle training/qualifications
81 24 47 19 128 22
a. Induction / courses / professional development for all TAs
28 19
b. TAs attend INSET 16 9 c. TAs all qualified or training for qualifications
13 4
d. TAs encouraged to qualify / for particular roles/ STAC, HNC etc
12 9
e. performance management includes TAs
5 3
f. lack won’t prevent appointment/hard to recruit
5 2
g. school SMT identify needs / direct TAs to what suits them
2 1
2. Evaluation of training / qualification
65 19 70 28 135 23
a. very, extremely, highly important / crucial / essential / invaluable
58 61
b. very good / helpful / valuable 7 9
3. Other features of TAs needed 47 14 22 9 69 12 a. ability to get on with pupils and teachers / understanding learning
9 4
b. common sense / good basic knowledge / good literacy / intelligence
11 3
c. personal qualities / life experience / good motivation / sympathy / love of children / commitment / flexibility / dedication
13 8
89

Y5 (N=126)
Y6 (N=92)
Responses
Total no of resp.
% of total nresp.
o of
Total no of resp.
% of total no of resp.
Total no of responses
% of total no of responses
5 2 e. training can only enhance skills which TA has / nous / aptitude
3 3
f. training not as important as…. reasonably important / enthusiasm not enough
6 2
4. The need for training / qualification
35 10 29 12 64 11
a. increasingly important / more demands in role / untrained days over
14 11
b. especially for SEN, behaviour, ICT, child protection
10 14
c. regular updating of skills 7 3 d. school insists on qualifications at appointment
4 1
5. Benefits for literacy and numeracy
26 8 16 6 42 7
a. need NNS / NLS knowledge / ELS,ALS great benefit / vital / essential
26 16
6. In-school training of TAs 20 6 21 8 41 7 a. can train TAs ‘on the job’ / more important than qualifications
15 19
b. lot time / energy spent / SDP training carried out
4 2
c. no time to train TAs in school 1 0
7. Effects of training / qualifications on TAs
19 6 10 4 29 5
a. confidence, self-esteem, status, job satisfaction, professional identity in school / need training to be valued, effective
19 9
b. training as ITT credits 0 0 1
d. experience / lot to offer
90

Y5 (N=126)
Y6 (N=92)
Responses
Total no of resp.
% of total no of resp.
Total no of resp.
% of total no of resp.
Total no of responses
% of total no of responses
8. Comments on present provision of training / qualifications
14 4 8 3 22 4
6 6
b. no national standard / it is needed / should be increased / pre-appointment
6 0
c. some qualified TAs not up to job / EIC training very good
2 1
d. many courses are available 0 1
9. Attitudes of TAs to training / qualification
13 4 4 2 17 3
8 2
4 2
c. former welfare assistant not keen to train
1 0
10. Financial aspects of training / qualifications
11 3 5 2 16 3
a. school pay policy reflects training / qualifications
3 0
b. low pay, why train? / needs national policy
4 0
c. more funds needed for training / as much as budget allows / expensive, disruptive, problematic
4 5
11. Outcomes for schools 10 3 18 7 28 5 a. better quality work / provides important skills / can add to quality of staff / TAs unwilling to do mundane tasks/teacher attitude vital
64 15
b. qualifications no significant effect on performance / not as important as training
0 3
TOTALS 341 250 591
a. doesn’t match needs of role / inadequate LEA course
a. most TAs keen to train / beginning to value it / positive attitude leads to valuable contributions
b. must be willing / enthusiastic to develop
91

Appendix 4 Head Teachers’ Questionnaire – Years 4 to 6 (2000/3) Responses to the question: Please describe how you allocate teaching assistants in your school.
(N=124) Y4 (N=118)
Y5 Y6 (N=92)
Responses Total no of resp.
% of total no of resp.
Total no of resp. o of
Total no of resp.
% of total no of resp.
Total no of responses
o
1. Needs of pupils 141 49 103 37 75 34 319 41 a. statemented / SEN pupils
59 65 52 176
b. low test scores etc.
16 20 6 42
c. vulnerable pupils / classes
23 5 5 33
d. targeted pupils 23 4 6 33 15 3 1 19
f. pupil behaviour 5 6 5 16
2. Support for particular subjects
51 18 63 23 49 22 163 21
a. literacy / numeracy
25 34 15 74
b. ‘catch-up’ programmes
24 23 27 73
c. ICT 0 5 4 9 d. art / CDT / science
1 1 3 5
e. other 1 0 0 1
3. Age of the pupils 35 12 52 19 41 19 128 16 a. sliding scale across age groups
30 50 31 111
b. ends of KS 1 and KS 2
3 1 7 11
c. early intervention programmes
1 1 2 4
d. years 3 / 4 1 0 1 2
4. Some support for every class
20 7 30 11 26 12 76 10
e. stage 3 CoP/ legal requirements
% of total nresp.
% of total nof responses
92

Responses
Y4 (N=118)
Y5 (N=124)
Y6 (N=92)
Total no of resp.
% of total no of resp.
Total no of resp.
% of total no of resp.
Total no of resp.
% of total no of resp.
Total no of
responses
% of total no
of responses
5. Class characteristics
20 7 16 6 21 10 57 7
a. size 19 15 15 49 b. composition/ mixed age
1 1 6 8
6. TA characteristics
17 6 9 3 6 3 32 4
a. match skills to class /competence
8 6 3 17
b. prior effectiveness / train and review
1 3 0 4
c. professional development of TA
4 0 0 4
d. qualifications / experience
1 0 2 3
e. TA preferences 1 0 0 1 f. compatibility of TA / Teacher
2 0 1 3
7. Needs of teachers 4 1 2 1 2 1 8 1
8. S.D.P. 0 0 2 1 0 0 2 <1 TOTALS 288 277 220 785
93

Copies of this publication can be obtained from:
DfES PublicationsP.O. Box 5050Sherwood ParkAnnesleyNottinghamNG15 0DJ
Tel: 0845 60 222 60Fax: 0845 60 333 60Minicom: 0845 60 555 60Oneline: www.dfespublications.gov.uk
© Queen’s Printer and Controller of HMSO 2004. Publishedwith the permission of DfES on behalf of the Controller ofHer Majesty's Stationery Office. Applications for reproductionshould be made in writing to The Crown Copyright Unit, HerMajesty's Stationery Office, St Clements House, 2-16Colegate, Norwich NR3 1BQ.
Produced by the Department for Education and Skills
ISBN 1 84478 373 1Ref No: RR605www.dfes.go.uk/research