report on the household baseline survey for building
TRANSCRIPT

Report on the Household
Baseline Survey for Building
Community Resilience Project In Poor Pastoral and Agro-Pastoral Communities in Somali
region, Jijiga and Degehabur zones, Arehary and Ubahile
kebeles, Ethiopia
1/17/2014

1
Table of Contents
Acronyms--------------------------------------------------------------------------------------i
List of Tables ---------------------------------------------------------------------------------ii
List of Figures --------------------------------------------------------------------------------iii
Executive Summary--------------------------------------------------------------------------iv
1. Introduction-------------------------------------------------------------------------------1
1.1 Context and Project Background--------------------------------------------------1
1.2 Objectives of the Survey------------------------------------------------------------4
2. Data and Methodology-------------------------------------------------------------------5
2.1 Sample Size Determination---------------------------------------------------------5
2.2 Sampling Technique-----------------------------------------------------------------6
2.3 Training of Enumerators------------------------------------------------------------7
2.4 Field Operation, Data Entry and Analysis---------------------------------------8
3. Results and Discussions-----------------------------------------------------------------8
3.1 Demographic and Socio-economic Characteristics-----------------------------8
3.2 Improving Livestock Rearing -----------------------------------------------------11
3.3 Improving Hygiene and Sanitation-----------------------------------------------15
3.4 Antenatal and Post Natal Care-----------------------------------------------------20
3.5 Malaria--------------------------------------------------------------------------------22
3.6 Road Traffic--------------------------------------------------------------------------22
3.7 Livelihood----------------------------------------------------------------------------23
4. Conclusions and Recommendations---------------------------------------------------23
4.1 Conclusions--------------------------------------------------------------------------23
4.2 Recommendations-------------------------------------------------------------------24
5. Annexes (Questionnaire & FGD) -----------------------------------------------------26

i
Acronyms
CBPP Contagious bovine Pleuro-pneumonia
CCPP Contagious Caprine Pleuro-pneumonia
CHF Swiss Franc
DM Disaster Management
DRR Disaster Risk Reduction
EDHS Ethiopian Demographic and Health Survey
ERCS Ethiopian Red Cross Society
FGD Focus Group Discussion
HIV Human Immune-deficiency Virus
ICR Integrated Community Resilience
IGA Income Generation Activity
KAP Knowledge Attitude Practice
PMER Planning Monitoring Evaluation Reporting
PPH Postpartum Hemorrhage
PPS Probability Proportional to Size
RC Red Cross
RR Response Rate
SRC Swedish Red Cross
TB Tuberculosis
VCA Vulnerability Capacity Assessment
WATSAN Water and Sanitation

ii
List of Tables
Table 1: Determined Sample Size for each of the Survey Areas----------------------------------6
Table 2: Sample versus collected data-----------------------------------------------------------------8
Table 3: Educational Status of the Respondents-----------------------------------------------------10
Table 4: Marital Status of the Respondents------------------------------------------------------------11
Table 5: Type of Landholding Patterns of the Respondents-----------------------------------------12
Table 6: Types of Scarcity Observed in Cultivating a Fodder-------------------------------------13
Table 7: Sanitation Coverage of the Target Areas-----------------------------------------------------16
Table 8: Demonstrations of Hand Washing Practices at Critical Times in the Target Areas---18
Table 9: Starting Month of First Antenatal Visit------------------------------------------------------21
Table 10: Main Source of Income----------------------------------------------------------------------23

iii
List of Figures
Figure 1: Map of Somali region in Ethiopia--------------------------------------------------3 Figure 2: Age of the Respondents--------------------------------------------------------------9 Figure 3: Occupation of the Respondents-----------------------------------------------------10 Figure 4: Experience in Cultivating a Fodder------------------------------------------------12 Figure 5: Usage of Drugs for their animals when they get ill-------------------------------14 Figure 6: Place Where Children Stool Less Than 3 are Disposed---------------------------17 Figure 7: Do You Wash Your Hands?----------------------------------------------------------17 Figure 8: Who Usually Goes to This Water Source for Your Household?-----------------19 Figure 9: Number of Antenatal Visits Made During Pregnancy ------------------------------21

iv
Executive Summary
The Integrated Community Resilience (ICR) project is implemented by Ethiopian Red Cross
Society in collaboration with Swedish Red Cross. The program is a three-year (2014 - 2016)
project with a funding from SRC. A total of 80,215 people are expected to benefit in the region
from this particular ICR project.
The overall goal of the project is that communities in Somali region are better prepared and will
recover better from disasters and other calamities. This integrated community resilience project
will strengthen communities in four different areas: disaster risk reduction, health/ water and
sanitation, livelihood and capacity building.
This report presents the findings of a baseline survey executed in Arehary and Ubahile kebeles
of Somali region between 13th of November to 23rd of November 2013. It is based on the
findings of a quantitative household survey of 340 households and 2 Focused Group Discussions
at community levels. In the main body of the report, important results are disaggregated by
kebele. The baseline survey focused on indicators set in the project document.
Analysis of demographic and socio-economic data reveals: 61.9% of the respondents are
females, 64.0% of the respondents are found in 25-35 & 36-45 age categories, 92.8% of the
respondents are illiterate, 56.6% of the respondents are agro-pastoralist, and 85.5% of them are
married.
Though 88.4% of the respondents have lands, only 21.17% are experienced in cultivating a
fodder. On average they use 9.28 hectare of land for fodder within each household. Less than
half of the respondents (43.6%) have vaccinated their animals’ against infectious diseases.
However, most of them (80.7%) have used drugs for their animals when the get sick. On
average they use 4.55 numbers of drugs with a mean cost of 1,293 birr per annum.
As most of them are agro-pastoralist, fodder cultivation is inevitable. And this can be enhanced
by resolving problems such as scarcity of water, scarcity of farming materials, scarcity of seeds,
etc. There are no local veterinary clinics or animal drug store, if possible construction of animal
health facilities & drug supply stores are recommended.

v
92.9% of the households still practices open defecation. Only 7.1% have access to toilet facility.
From those who have toilet facility, 66.7 answered that the latrine is in a good condition both
inside and outside. 98.82% of the respondents wash their hands but this actually varies when we
come to washing hands at critical times: 91.2% after defecation, 64.3% after cleaning childs
bottom, 58.1% before preparing food, 91.2% before eating food, 51.3% before feeding a child,
and 51.3% after taking care of animals. 35.2% of the respondents have been referred to hospital
or other health facilities. 69.1% of the respondents does use different mechanisms to make the
water safer to drink (they drink only water collected from the field). 87.9% of the respondents
have been pregnant. However, only 11.3% of them received antenatal consultation during
pregnancy, 98.4% of the respondents have given birth in their homes and concerning post natal
care only 11.5% has checked at the health facility following after their delivery.
To declare defecation free environments, communities should be motivated on how to construct
toilets and supply them some incentives like latrine. Community awareness creation programs
should be conducted on washing hands at critical times such as after cleaning childs bottom,
before preparing food, before feeding a child, & after taking care of animals. As referrals are
very tough for this people, equipping local health facilities with the necessary materials and well
trained health personnel is very essential. Awareness creations as well as construction of safe
water facilities and supply of cleaning chemicals are recommended. Antenatal and postnatal care
services are very low and home delivery is extremely very high. Efforts to improve antenatal and
postnatal care should focus on addressing geographical and economic access. Addressing staff
shortages through expanding training opportunities and incentives to health care providers and
developing postnatal care guidelines are key steps to improve maternal and newborn health as
well as helps women to deliver with a skilled attendant.
84.0% of the respondents know about malaria. However, only 43.4% are well aware regarding
the mode of transmission.
As most of them only know about the name malaria, KAP have to be sought about the mode of
transmission and the use of mosquito nets at least for children and pregnant mothers. If possible
net delivery is also a good thing.

vi
Extremely low numbers (5%) of the respondents surveyed know about traffic rules and
regulations.
Traffic rules and regulations which are one of the means of prevention of traffic accidents should
be disseminated to the community members with special emphasis.
Only a few numbers (16.3%) of the respondents has enough money to sustain themselves. The
primary source of income on first place is livestock and agriculture is placed on second.
Only few members of the community have enough money and able to sustain themselves.
Therefore, enhancing food security (like how they increase their livestock (including by
products) and associated agricultural productivity) and teach them some coping mechanisms
when time are tough is very critical.
During the FGD meetings, they had told us their priority needs in a ranked order: Water as 1st,
Health 2nd, Education in 3rd place, and finally at last agricultural materials fourth place.

1
1. Introduction
This report presents the key findings from the Household Baseline Survey for building
community resilience in Somali region, Jijiga and Degehabur zones, Harshin and Ararso
districts, Arehary and Ubahile kebeles. The baseline survey was carried out in Arehary and
Ubahile kebeles between 13th of November to 23rd of November 2013. The survey was
designed, implemented and analyzed by team members composed of Azmeraw Bekele from
Disaster Management (DM), Ashebir Asaminew from Planning, Monitoring, Evaluation and
Reporting (PMER), Degife Dereje from Water and Sanitation (WATSAN) and Jesper Fridolf
country representative of Swedish Red Cross (SRC).
This report is organized as follows. After providing an overview of the implementation site
context and project background, the methodology for the household baseline survey are
described. This is followed by an analysis of general household characteristics, livestock rearing,
hygiene and sanitation, antenatal and postnatal care, malaria, road traffic and finally this section
is concluded by analysis of livelihoods. The report concludes with a summary of findings and
recommendations for further implementation.
1.1 Context and Project Background
Located to the eastern and south eastern parts of the country the Somali regional state has vast
lowland, arid to semi-arid climate where pastoral and agro pastoral livelihood is dominant. The
State of Somali has a very large area size ranking second next to Oromiya. At present the state
comprises 9 administrative zones and 49 woredas. Jijiga is the capital city of the State. The State
has common boundaries with Afar and the Republic of Djibouti in the north, Kenya in the south,
the State of Oromiya in the west, and Somalia in the east and in the South.
Although most of the people of the state of Somali mainly earn their livelihood from livestock,
they practice crop production as well. The major crops cultivated in the region are sorghum and

2
maize. Wheat and barley are also harvested in a smaller amount each year. Commercial activity
is another occupation that is significantly exercised in the region
The region is one of the richest in terms of livestock resources and livestock is the main sources
of food and means of income for the majority of the people. Despite many perennial rivers,
fertile soils, some mid altitude areas with sufficient rainfall and plain lands that are suitable for
agriculture, the crop production is limited to cover the food requirements of the people The
region inhabit more than 4.7 million people the majority of which live in rural settings.
Recurrent drought and its negative consequences are the major hazard that severely affected the
people of the region. Due to its relief feature and climatic condition drought is the most frequent
hazard and made the region the most water scarce region in the country. Safe water coverage is
also one of lowest in the country.
Ethiopian Red Cross Society had conducted a Vulnerability Capacity Assessment (VCA) in two
kebeles (Arehary and Ubhile) of Harshin and Ararso districts of Jijiga and Degahbur zones of
Somali region between 24 and 30 June 2013.
As a result of the VCA findings and recommendations, this integrated community resilience
(ICR) is implemented by Ethiopian Red Cross Society (ERCS) in collaboration with Swedish
Red Cross (SRC). The program is a three- year (2014 - 2016) project with a funding from SRC.
A total of 80,215 people are expected to benefit in the region from this particular ICR project
The integrated community resilience project will also be carried out in these two Kebeles
(Arehrey and Ubahile) of Harshin and Ararso districts, Fafan (also known as Jijiga) and Jarar
(also known as Degehabur) zones of Somali region respectively. Community resilience is
defined as a measure of the sustained ability of a community to utilize available resources to
respond to, withstand, and recover from adverse situations. [See Figure 1]
The two kebeles were selected considering the vulnerability of the majority of the population for
various disasters. The low land topography, the arid climate and the degraded environment are
the major factors contributed to the occurrence of recurrent drought and its negative
consequences over the vulnerable people.

3
Although reduced in frequency and magnitude, there have been conflicts between the
government forces and rebellions. Resource based inter-ethnic conflict along the bordering areas
with Oromia and Afar regions is the most common disaster resulting huge humanitarian crises
including deaths, displacement, loss of livelihood and property.
Figure 1: Map of Somali region in Ethiopia
The project will strengthen the communities in four different areas;
Outcome 1: Disaster risk reduction, Strengthening target communities to reduce risks
and vulnerabilities to disasters
o The focus will be on Disaster Risk Reduction training and the strengthening of
animal husbandry
Outcome 2: Health/water and sanitation (WatSan), Reduce community’s vulnerability to
health and WATSAN related hazards

4
o A focus on malaria reduction, road safety activities and to train community
volunteers in social mobilization on antenatal and postnatal care.
Outcome 3: Livelihood, Improve community’s possibilities to livelihood and thereby
reduce their food insecurities.
o Include income generating activities. Micro loans are facilitated to the targeted
population and technical assistant is provided. A few examples of areas where
training activities will be conducted: cattle fattening, dairy cow management,
apiculture, micro-enterprise management and marketing.
Outcome 4: Capacity building, Improve the capacity of Somali regional branch to
manage long term community resilience programs
o Activities are mainly focusing on the training of staff in different areas, one
example in training in DRR and Community resilience. Volunteer management
activities will further strengthen the branch; one example is the establishment of
a RC club and task force at the Jijiga University.
These outcomes will increase the capability of the population in the two regions to become
more resilient to fast and slow-onset disasters.
1.2 Objectives of the Survey
The primary reason for conducting the baseline survey is to facilitate impact assessment at the
end of the intervention or to facilitate end evaluation and monitoring in the course of project
implementation, with particular focus to the project’s main objectives. The baseline survey has
been designed to ensure that changes in these objectives and indicators can be measured over the
course of the project.
The goal of the project is that communities in Somali region are better prepared and will recover
better from disasters and other calamities.

5
The specific objectives of the Household Baseline Survey are as follows:
1. To understand the perceptions, desires, practices, motivations and constraints of
households in the target area with respect to livestock rearing, hygiene and sanitation,
antenatal and postnatal care, malaria, road traffic and livelihoods,
2. To assist the project and stakeholders in determining whether verifiable indicators and
related targets, stated at the beginning of the project and encapsulated in Outcomes 1, 2, 3
& 4, are being achieved over time,
3. Examine the current situation of the project beneficiaries in terms of their economic and
social aspects and the issues affecting their lives, and
4. Establish a benchmark for the current community resilience project in terms of the
communities’ awareness of health and health related issues, animal rearing practices,
road traffic etc.
2. Data & Methodology
The household baseline survey was conducted in 345 households in Areharay and Ubahile. Data
was collected starting from 13th of November up to 23rd of November, 2013 as part of the survey
to generate a baseline report for the ‘Integrated Community Resilience Project’. Proportional
sample size was considered to determine the actual sample needed for each of data collection
tools for the two project areas (Kebeles). Households’ selection methods are discussed in the
next consecutive sections.
2.1 Sample Size Determination
The formula that was used to determine the sample needed for the survey is given as follows:

6
Where n is the sample size, N is the population size, and e is the level of precision.
Since we have a total target beneficiaries of 15,168 people, we divide this figure by average
family size of 6 to get N=2,528 which is the total household size in our case. Using e=0.05,
inserting this figures in the above formula we get n=345, which is the total sample size for our
study. Probability proportional to size (PPS) sampling is used to calculate the sample size
required for each kebele. [See Table 1]
Table 1: Determined Sample Size for each of the Survey Areas
Zone Woreda Kebele Household Proportion Sample Size
Jijiga Harshin Ararhrey 1,728 0.68 236
Degehabur Ararso Ubahile 800 0.32 109
Total 2,528 345
A total of 345 questionnaires were administered with the total number of household members
covered by the survey numbering 340 members. The response rate for this particular survey was
98.5% and this is quite satisfying.
2.2 Sampling Technique
A method of Single Random Sampling was utilized for the survey. One household per village
was selected for the survey. Selection was mostly random but consideration was also paid to the
distance of households from one another to avoid clustering of households that might be too
close to one another.
A system of Systematic Random Sampling could not be utilized since the Somali population is
mostly pastoralists who are not evenly spread out and therefore households had to be selected
wherever a community happened to be found.
No gender influence was factored into the study. Whether a female or male responded to the
interview depended on the time of day as gender roles and duties would determine at what time
of day a household member was likely to be found at home.

7
A structured questionnaire, incorporating both open and closed-ended questions, was initially
developed by the assigned team members. Questions were derived from a review of the project
log frame for identification of benchmarking indicators as it is suggested by the SRC country
representative. These questions were examined by SRC delegates who made further
contributions to the questionnaire content and finalized through the process of consultation with
the team to ensure that the questionnaire was sufficiently comprehensive [See Annex 1]. Focus
Group Discussion (FGD) were also designed and implemented to gain understanding of the
community level perceptions. [See Annex 2]
Before conducting the survey a pre-test was undertaken in one village of the targeted kebele
(Ubahile) community to establish the quality and comprehensiveness of the survey and to ensure
that the expected answers were drawn out by the interviewers. Note that this same people
(included in the pretest) were excluded on the actual survey not to put so many burdens on them.
All 15 enumerators conducted the pilot survey during the course of one day. The findings from
the pre-test revealed that some of the questions were not clearly understood by the respondents.
In addition, there were some gaps in the questionnaire and it was not deemed sufficiently
comprehensive. The lessons learnt from the pre-test were discussed with the enumerators and
incorporated into a revised version of the questionnaire.
2.3 Training of Enumerators
Fifteen enumerators (11 males and 4 women) with suitable qualifications and experience in
socio-economic data collection were recruited to undertake the survey. Each enumerator was a
4th year university student. In addition three supervisors’ form ERCS and SRC delegate had
given training to the enumerators, supervised their work and organized the entire mission.
Enumerators came from the Jigjiga University for the purposes of geographical identification and
for establishing boundaries and were required to be Somali language speakers. The enumeration
team received one day’s classroom training to develop an understanding of the survey
questionnaire, to gain practice in completing the questionnaire, to understand the definition of
some peculiar technical terms and to practice interviewing techniques with survey colleagues.
8
2.4 Field operation, Data Entry and Analysis
Data collection from the field was conducted over a 10 day period between the13th of November
up to 23rd of November 2013. The Supervisors in the field were constantly on hand to provide
clarification and instruction to the enumeration team on concepts, definitions and to resolve
difficulties in carrying out the field work. Sampled interview question was checked on a question
by question basis and explanations sought for unclear information or errors. The Supervisors
enhanced the team’s potential through identifying the strengths and weaknesses of individuals
within the team and pairing team members accordingly. One important thing to be noted here is
that, the settlements of the community were such a challenging task (much beyond our
expectations) for the survey team as the settlements were found vastly diverse and scattered.
Each village contained few households and the village were far apart many kilo meters away.
Each questionnaire was submitted systematically by each enumerator to the assigned supervisors
(supervisor enumerator ratio is 1 to 5). The survey data from each location, once edited and
cleared, were entered to Statistical Package for Social Sciences (SPSS) software for the
subsequent analysis to be made on the survey.
3. Results and Discussions
3.1 Demographic and Socio-economic Characteristics
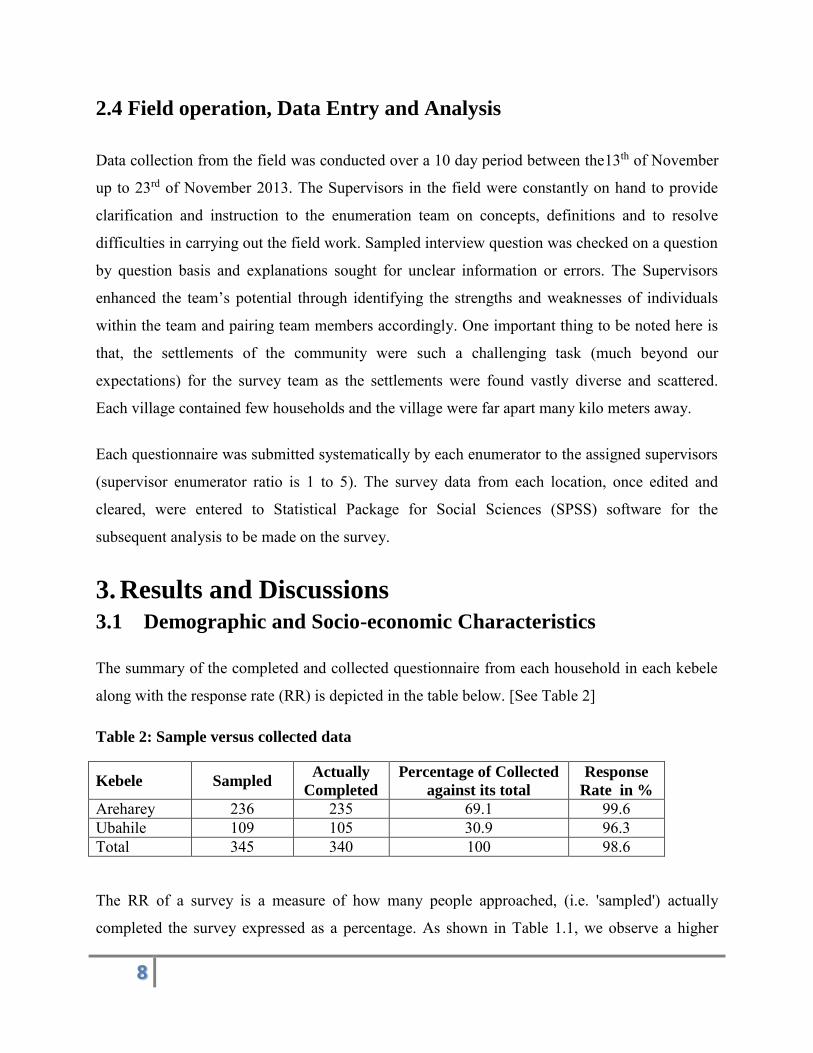
The summary of the completed and collected questionnaire from each household in each kebele
along with the response rate (RR) is depicted in the table below. [See Table 2]
Table 2: Sample versus collected data
Kebele Sampled Actually
Completed
Percentage of Collected
against its total
Response
Rate in %
Areharey 236 235 69.1 99.6 Ubahile 109 105 30.9 96.3 Total 345 340 100 98.6
The RR of a survey is a measure of how many people approached, (i.e. 'sampled') actually
completed the survey expressed as a percentage. As shown in Table 1.1, we observe a higher

9
response rate, which in turn, the more likely the results are representative of the population,
provided the sampling is appropriate in the first place. These figures also imply that the
respondent population is motivated (as they are benefited from the project) and the survey is
well-executed.
As it is also observed from Table 2, majority of the households asked are residing in Areharey
which has more population density than that of Ubahile.
From those who had given valid responses, 61.9% of the respondents are found to be females
while the rest are males. The reason why we get such inflated sex ratio (more female
respondents) is that as the survey is house to house mostly females are likely present in the house
thereby included in the survey. Coming to the age distribution of the respondents, majority of
them are found to be in 25-35 and 36-45 age categories. This shows most of them are on the
productive age which is important for the economic productivity of the pastoral people. [See
Figure 2]
As indicated in Table 2, majority (92.8%) of the respondents surveyed are illiterate. We have
observed this when we were on field work. There was no formal school in both kebeles. In
addition on the FGD this was reflected and it is among one of the most important current needs

10
in the community. This also has its own impact on labor production and productivity. (See Table
3)
Table 3: Educational Status of the Respondents
Education Frequency Percent
None 311 92.8
Primary 24 7.2
335 100
Majority of the respondents (56.6%) of the survey areas are working pastoral activity and
farming on a joint manner for their livelihood. 18.4% are pure pastoralist while 14.7% are pure
farmers and the rest 10.3% do business and other things (like labor and help from other
relatives). [See Figure 3]
Most of the respondents (85.5%) of surveyed answered that they are married. 3.6 % of them are
single while the rest 11.0% are either separated or windowed. From those surveyed, there are
households containing one to twenty one members. On average, there are 6.6 people within each

11
household. The reason for this higher household size is the practice of polygamy mainly visible
in these communities. [See Table 4]
Table 4: Marital Status of the Respondents
Marriage Status Frequency Percent
Single 12 3.6
Married 288 85.5
Windowed 30 8.9
Separated 7 2.1
Total 337 100
3.2 Improving Livestock Rearing
The output needed in this section is to see that Livestock rearing to be improved through the
introduction of various adaptation measures aimed at improving pasture management and
strengthening animal husbandry.
Livestock are domesticated animals raised in an agricultural setting to produce commodities
such as food, fiber and labor. Livestock rearing is a key livelihood and risk mitigation strategy
for small and marginal farmers. Livestock are generally raised for profit. Raising animals
(animal husbandry) is a component of modern agriculture. The economic value of livestock
includes: meat, dairy products, fiber, fertilizer, labor and land management. Survey results are
discussed below briefly.
The land holding patterns are significantly different. Majority of the respondents (52.9%) are
small land holders while 31.9% are big land owners and the rest 15.2% are either marginal land
holders or landless. [See Table 5]

12
Table 5: Type of Landholding Patterns of the Respondents
Type of Land Frequency Percent
Big 105 31.9
Small 174 52.9
Marginal 12 3.6
Landless 38 11.6
Total 329 100
Among those 88.4% who have land, only 21.2% are experienced in cultivating a fodder. This is a
very small figure which depicts narrowed culture of fodder cultivation. [See Figure 4]
From those who have no experience in cultivating a fodder [each of the four choices analysed
separately] 55.9% said there is scarcity of land (44.1% said no land scarcity), 81.4% said there is
scarcity of water [note that this is greatest of all problems observed there] (18.6% said no water
scarcity) and 65.5% answered there is scarcity of seeds (while 34.5% answered no seed scarcity).

13
And finally those who have said there is other type of scarcity include 19.2% which is the least
figure among its four counterparts (80.8% answered no other scarcity). Although small in
numbers from those of 19.2% who answered other type of scarcity, they have listed other
problems like scarcity of animals, scarcity of facilities (cultivating tractors & other farming
materials), I do not want to do, because I am doing business, lack of government help, lack of
finance, and lack of fertilizer. [See Table 6]
Table 6: Types of Scarcity Observed in Cultivating a Fodder
Type of Scarcity Yes No Priority Need Rank
Land 55.9% 44.1% 3
Water 81.4% 18.6% 1
Seed 65.5% 34.5% 2
Other 19.2% 80.8% 4
We have also asked them of their experience regarding animal vaccination. Less than half of
them (43.6%) vaccinated their animals against infectious diseases while the rest 56.4% do not do
so. This figure implies awareness on importance of animal vaccination is low.
However, the reverse is true when we come to use of animal drugs, most of them use animal
drugs. 80.7% of the respondents surveyed answered they have used drugs for their animals while
the rest 19.3% do not do it. From those 19.3% who have replied no animal drug usage, 49.1%
use traditional methods while the rest 50.9% use nothing. [See Figure 5]

14
On FGD meetings in both kebeles we had discussed the animals’ diseases common on the survey
areas. They have told us the symptoms; however, we are not able to list the diseases as we do not
know their scientific names. Therefore we tried to list disease symptoms by animal type as
follows. There is no animal health facility in both areas surveyed. We have tried to list the
symptoms by animals’ disease as follows:
On cows and oxen the disease symptom is it will prohibit movement thereby making it
sit, hindering mouth openings etc. There is also a deadly killer in 24 hours whose
symptom is fatigue and it is called “eteso” in Somali language. If it passes 24 hours, the
chances of survival will increase.
On Camels, there seems to be a seasonal disease. The disease will make the skin to be
sore which makes it to lose some part of its meat. Their legs will darken and their nails

15
will be off from their leg fingers. Sore mouths and swollen necks are also additional
symptoms.
On goats, the symptoms are diarrhea, much fluid via their nose, sore skin, etc
On sheep’s, the symptoms are changing of skin color, abolishes skin hair, it is also
genetically transmitted. There is also insect disease as soon as it entered the sheep will
collapse and die.
Other studies show that Livestock diseases including Trypanasomiasis, Contagious
bovine Pleuro-pneumonia (CBPP), Contagious caprine Pleuro-pneumonia (CCPP),
Anthrax, Sheep and goat pox, Parasite and Barbarossa infestation are commonly
affecting the production and productivity of livestock.
3.3 Improving Hygiene and Sanitation
Safe water and adequate sanitation are basic to the health of every person on the planet, yet many
people throughout the world do not have access to these fundamental needs. An important step
towards resolving this global crisis is to understand its magnitude: how many people lack access
to drinking-water and sanitation?
To help answer this question, household surveys are conducted every year throughout the world
to assess drinking-water, sanitation, and hygiene-related practices at the household level.
Hereafter we present the results of hygiene and sanitation practices of our target areas. The
outcome expected here is to reduce communities’ vulnerability WATSAN related hazards.
Almost all (92.9%) of the households living in the target areas do not have a toilet while only
7.1% have access to toilet. United Nations agencies estimate that the persistent lack of toilets and
sewage treatment leads to the deaths of some 700,000 children a year from diarrhea and other
avoidable ailments linked to fecal contamination.

16
Table 7: Sanitation Coverage of the Target Areas
Kebele Sanitation Type Frequency Percent
Areharey Open Defecation 210 90.1
Unimproved (Traditional Latrine) 5 2.1
Shared 14 6.0
Improved latrine 4 1.7
Total 233 100.0
Ubahile Open Defecation 104 99.0
Unimproved (Traditional Latrine) 1 1.0
Total 105 100.0
Note that the sanitation condition in Areharey is slightly
better than that of Ubahile. As the toilet facilities coverage in the target areas is very low, only
few households 3.06% rinsed in toilet the stool of children under three. 5.5% of them buried it.
The third method which accounts 21.4% which is markedly higher percentage share than the
previous two methods is throwing into a garbage method. This garbage’s are traditional
garbage’s that the households construct to store wastages for a temporary period of time.
However, the majority of the households (70.03%) used other methods like some of them do not
have Childs aged less than 3 and most of them throw it somewhere in the outside. [See Figure 6]

17
Good hand washing is the first line of defense against the spread of many illnesses and it is like a
"do-it-yourself" vaccine—it involves five simple and effective steps (think Wet, Lather, Scrub,
Rinse, Dry) you can take to reduce the spread of from the common cold to more serious illnesses
such as meningitis, bronchiolitis, influenza, hepatitis A, and most types of infectious diarrhea. so
you can stay healthy. Regular hand washing, particularly before and after certain activities, is
one of the best ways to remove germs, avoid getting sick, and prevent the spread of germs to
others. Among all of the respondents almost all (98.8%) of them wash their hands [See Figure 7].
Regarding the frequency of washing hands; 50.6%, 45.3% and 4.1% of the respondents wash
their hands usually, sometimes and rarely respectively.

18
Table 8: Demonstrations of Hand Washing Practices at Critical Times in the Target Areas
Critical Time Areharey Ubahile Total
Yes (%) No (%) Yes (%) No (%) Yes (%) No (%)
After Defecation 94.0 6.0 81.9 18.1 90.3 9.7
After Cleaning Childs Bottom 62.0 38.0 69.5 30.5 64.3 35.7
Before Preparing Food 60.7 39.3 52.4 47.6 58.1 41.9
Before Eating Food 91.0 9.0 91.4 8.6 91.2 8.8
Before Feeding a Child 50.4 49.6 53.3 46.7 51.3 48.7
After Taking Care of Animals 50.0 50.0 54.3 45.7 51.3 48.7
Safe water coverage is 44% in Somali regional state while it is 69% nationally. This is because
all Somali regional state's biggest problem is the lack of water. The community focused on
construction and rehabilitation of community birkeds for improved rainwater storage. Thus this
is the only source of drinking water for all the target areas surveyed.
The time it takes to fetch water is seasonal. During the rainy period it will take them 30 minutes
to 1 hour. However, during dry seasons things are difficult here, they elapse almost a day to fetch
water from their surroundings. Mostly women (49.9%) fetch water but when they get pregnant
the man (25.1%) will take over the mission. Others account 12.7% and they have said some use
car for fetching and some said random chance (anyone who has free time). [See Figure 8]

19
The output needed hereunder is to strengthen health care referral system through community
awareness raising.
Their referral time ranges
from as recent as before two months to 6 years ago. The place where they referred include:
Jijiga, Hargessa, Bale Gudale, Harshin, and Hartsheik. The reasons for referral include
hypertension, arthritis, labor delivery, muscle not working, abnormal menstruation, malaria,
kidney infection, Postpartum hemorrhage (PPH), Tuberculosis (TB), common cold, abdominal
pain, excessive bleeding, gastric, retention of placenta and typhoid. The mode of transport
includes; normal bus, by foot &walking for long period of time, car rent and ambulance.

20
3.4 Antenatal and Postnatal Care
The output expected from this section is to Increase awareness of importance of access to health
services (antenatal delivery and post natal). When a woman's pregnancy has been diagnosed, she
should immediately go to an antenatal clinic to receive regular check-ups before the baby is born.
These are designed to detect problems of the unborn baby before symptoms occur so that more
help can be given. Post natal care is likewise necessary to ensure that no complications have
developed in the woman after childbirth.
Thirty-four percent of women who gave birth in the five years preceding the survey received
antenatal care from a skilled provider, that is, from a doctor, nurse, or midwife, for their most
recent birth. This is a marked improvement from 28 percent in 2005. One woman in every five
(19 percent) made four or more antenatal care visits during the course of her pregnancy, up from
12 percent in 2005. The median duration of pregnancy at the time of the first antenatal visit is 5.2
months. Only 10 percent of births in the past five years were delivered by a skilled provider.
More than six women in every ten (61 percent) stated that a health facility delivery was not
necessary, and three in every ten (30 percent) stated that it was not customary. Just 7 percent of
women received postnatal care in the first two days after their last delivery in the two years
before the survey. The most important barrier to access to health services that women mention is
taking transport to a facility (71 percent), followed by lack of money (68 percent) and distance to
a health facility (66 percent). [EDHS 2011]
Majority (87.9) of the respondents have been pregnant.
Concerning antenatal visits from those 11.3% who make antenatal consultation during pregnancy
24.2%, 18.2%, 30.3%, and 27.3% account for those who made one, two, three, and four & above
times antenatal visits respectively. [See Figure 9]

21
Most of the respondents (47.1%) have started their first visit during the pregnancy period of 5-9
months [See Table 9]. And almost all (97.8%) of them did not receive HIV testing during
delivery. In addition 87.1% of them have not been vaccinated for TT. Regarding knowledge of
the respondents on general danger signs during pregnancy 52.8% know excessive bleeding,
28.9% know convulsion, 54.4% know prolonged labor, 51.6% know high fever and 22.8 know
other additional symptoms like hypertension, anemia, flank pain, unusual headache,
malnutrition, body swelling, being sleepless, and still birth.
Table 9: Starting Month of First Antenatal Visit
Visit Time Frequency Percent
1-3 month 12 35.3 4-6 month 6 17.6 5-9 month 16 47.1 Total 34 100 Majority (98.4%) of the respondents has given birth in their homes, 0.6% in health centers and
0.9% in hospital. 74.8% of them has answered their newborn child started breastfeeding soon.
Exclusive breastfeeding is practiced by 68.2% of the respondents.
The reason why most of the respondents do no check at health

22
facility following after delivery are: lack of transportation, lack of problem after delivery,
because the health post is not functional, lack of finance, lack of education i.e. do not see it as
necessary, women are not allowed to go to the place, lack of public transportation facilities, and
the health centers are from our home.
3.5 Malaria
Malaria is one of the most deadly diseases in Ethiopia. And Somali is one of the environmentally
and geographically prevalent places in Ethiopia for malaria. The output expected in this section
is to reduce the prevalence of malaria in selected communities.
Majority (84.0%) [87.6% in Areharey & 76.0% in Ubahile] of the respondents know about
malaria. However, most of them do not know about the mode of transmission. Only 43.4%
(45.0% in Areharey & 39.8% in Ubahile) are well aware concerning the mode of transmission.
The possible reasons they have given include: at the rain time we see mosquito, the rain water
that stay on the ground, mosquito bite, due to open dam, dirty water and the grass near to their
house.
66.9% of the respondents know the sign and symptoms of malaria. However, a much lessened
number (20.4%) of respondents use mosquito nets for their families for the sake of malaria
prevention. The reason for this low mosquito net usage are: lack of money, lack of external
support, do not have mosquito nets, did not even see what the nets look like, it is not available in
our area, there is no health facility or other organization delivering the net, and do not know the
use of mosquito nets.
3.6 Road Traffic
Extremely low number (5%) [6% in Areharey & 2.9% in Ubahile] of the respondents surveyed
knows about traffic rules and regulation.
They had sometimes heard about road traffic accidents. The reasons for the accidents were road
problem, high speed of cars, drivers not driving on the right road, etc. Regarding their experience
on highways, they do not have preference to go on the right or left side.
23
3.7 Livelihood
Pastoralism is an important livelihood strategy in Ethiopia, yet pastoralist communities are
particularly vulnerable to food insecurity due to climate change, livestock production
infrastructure/facilities problems, market limitations, underdeveloped IGAs, price fluctuations
and policy environment that often neglects the specific needs and potential contribution of
pastoralist communities.
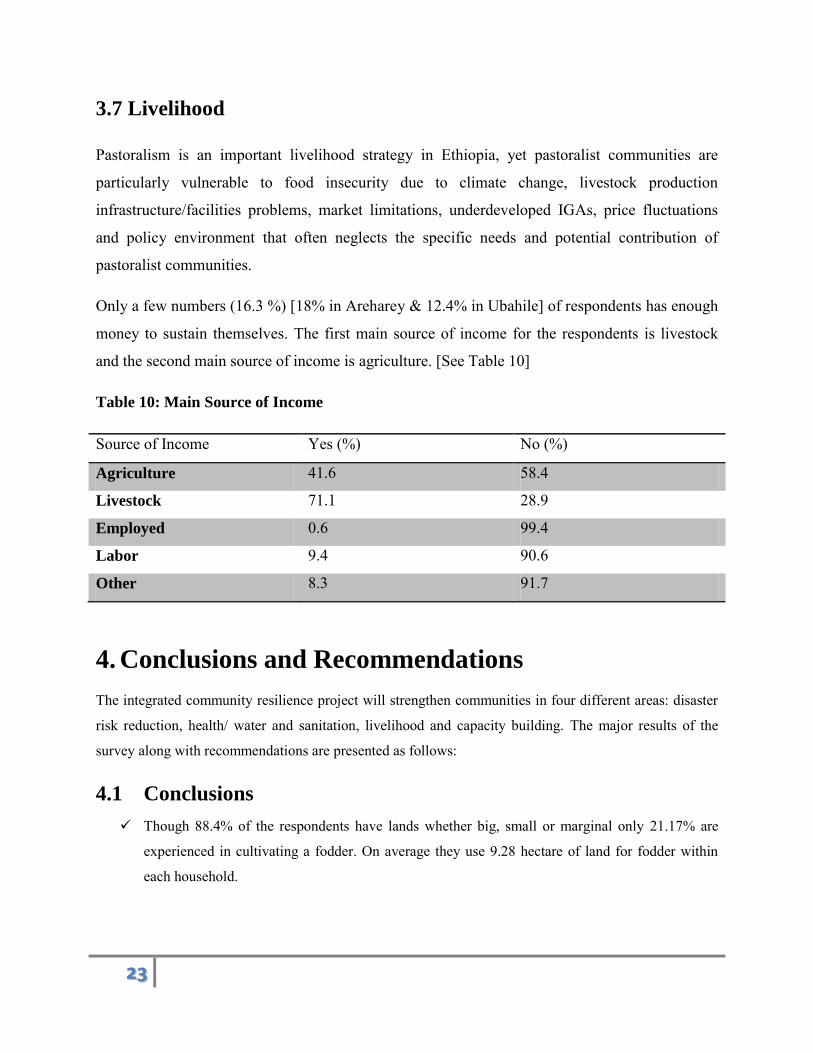
Only a few numbers (16.3 %) [18% in Areharey & 12.4% in Ubahile] of respondents has enough
money to sustain themselves. The first main source of income for the respondents is livestock
and the second main source of income is agriculture. [See Table 10]
Table 10: Main Source of Income
Source of Income Yes (%) No (%)
Agriculture 41.6 58.4
Livestock 71.1 28.9
Employed 0.6 99.4
Labor 9.4 90.6
Other 8.3 91.7
4. Conclusions and Recommendations
The integrated community resilience project will strengthen communities in four different areas: disaster
risk reduction, health/ water and sanitation, livelihood and capacity building. The major results of the
survey along with recommendations are presented as follows:
4.1 Conclusions
Though 88.4% of the respondents have lands whether big, small or marginal only 21.17% are
experienced in cultivating a fodder. On average they use 9.28 hectare of land for fodder within
each household.

24
Less than half of the respondents (43.6%) have vaccinated their animals’ against infectious
diseases. In reverse to this most of them (80.7%) have used drugs for their animals when the get
ill. On average they use 4.55 numbers of drugs with a mean cost of 1,293 birr per annum.
92.9% of the households still practices open defecation. Only 7.1% have access to toilet facility
From those who have toilet facility, 66.7 answered that the latrine is in a good condition both
inside and outside
98.82% of the respondents wash their hands but this actually varies when we come to washing
hands at critical times: 91.2% after defecation, 64.3% after cleaning childs bottom, 58.1% before
preparing food, 91.2% before eating food, 51.3% before feeding a child, and 51.3% after taking
care of animals
35.2% of the respondents have been referred to hospital or other health facilities
69.1% of the respondents does use different mechanisms to make the water safer to drink (they
drink only water collected from the field)
87.9% of the respondents have been pregnant. However, only 11.3% of them received antenatal
consultation during pregnancy, 98.4% of the respondents has given birth in their homes and
concerning post natal care only 11.5% has checked at the health facility following after their
delivery
84.0% of the respondents know about malaria. However, only 43.4% are well aware regarding the
mode of transmission
Extremely low number (5%) of the respondents surveyed know about traffic rules and regulations
Only a few numbers (16.3%) of the respondents has enough money to sustain themselves. The
primary source of income on first place is livestock and agriculture is on second place
4.2 Recommendations
As most of them are agro-pastoralist, fodder cultivation is inevitable which is observed in a poor
stage. The project should do something to resolve problems such as scarcity of water, scarcity of
farming materials, scarcity of seeds, etc.
Most of the respondents use drugs for their animals but there is no veterinary clinic or animal
drug store around their residence. If possible construction of animals health facilities of drug
supply stores are recommended
Open defecation is one of the major problems observed in the target areas. The project should
teach the people the advantage of declaring defecation free environments, how to construct toilets
and supply them some incentives like latrine

25
Washing hands at critical times such as after cleaning childs bottom, before preparing food,
before feeding a child, & after taking care of animals are somewhat at low stages just above
average values. Therefore, community awareness creation programs should be conducted.
Not only referrals but also local health facilities are not suitable. The referrals are very far without
transportation facilities and lack of finance from respondents can be cited as examples. The local
health facilities are not equipped with the necessary materials and well trained health personnel.
Thus, thus possible remedies should be sought by the project as this has been one of the major
problems raised during the FGD discussions.
Access to safe water is very low. They use rain water which is not clean and the mechanisms they
use to clean are not as such perfect. Awareness creations as well as construction of safe water
facilities and supply of cleaning chemicals are recommended.
Antenatal and postnatal care services are very low and home delivery is extremely very high.
Efforts to improve antenatal and postnatal care should focus on addressing geographical and
economic access while striving to make services more culturally sensitive. Antenatal and
postnatal care can offer important opportunities for linking the health system and the community
by encouraging women to deliver with a skilled attendant. Addressing staff shortages through
expanding training opportunities and incentives to health care providers and developing postnatal
care guidelines are key steps to improve maternal and newborn health.
Most of them know about malaria but KAP have to be sought about the mode of transmission and
the use of mosquito nets at least for children and pregnant mothers. If possible net delivery is also
a good thing.
Traffic rules and regulations which are one of the means of prevention of traffic accidents should
be disseminated to the community members with special emphasis.
Only few members of the community have enough money and able to sustain themselves.
Therefore, the project should help in enhancing food security (like how they increase their
livestock (including by products) and associated agricultural productivity) and teach them some
coping mechanisms when time are tough.
During the FGD meetings, they have ranked according to their priority needs Water as 1st, Health
2nd, Education in 3rd place, and finally at last agricultural materials fourth place.

26
Annex 1 Questionnaire

27
Code
Ethiopian Red Cross Society
Somali Region Community Resilience Project
Baseline Survey Questionnaire
This questionnaire is prepared for the baseline for the project Community Resilience to be conducted in Somali region. This baseline survey questionnaire focuses on three different areas; disaster risk reduction, health/water and sanitation (WatSan) and livelihood.
Interviewer Name:________________________
Supervisor Name:_________________________
Date:________________________
28
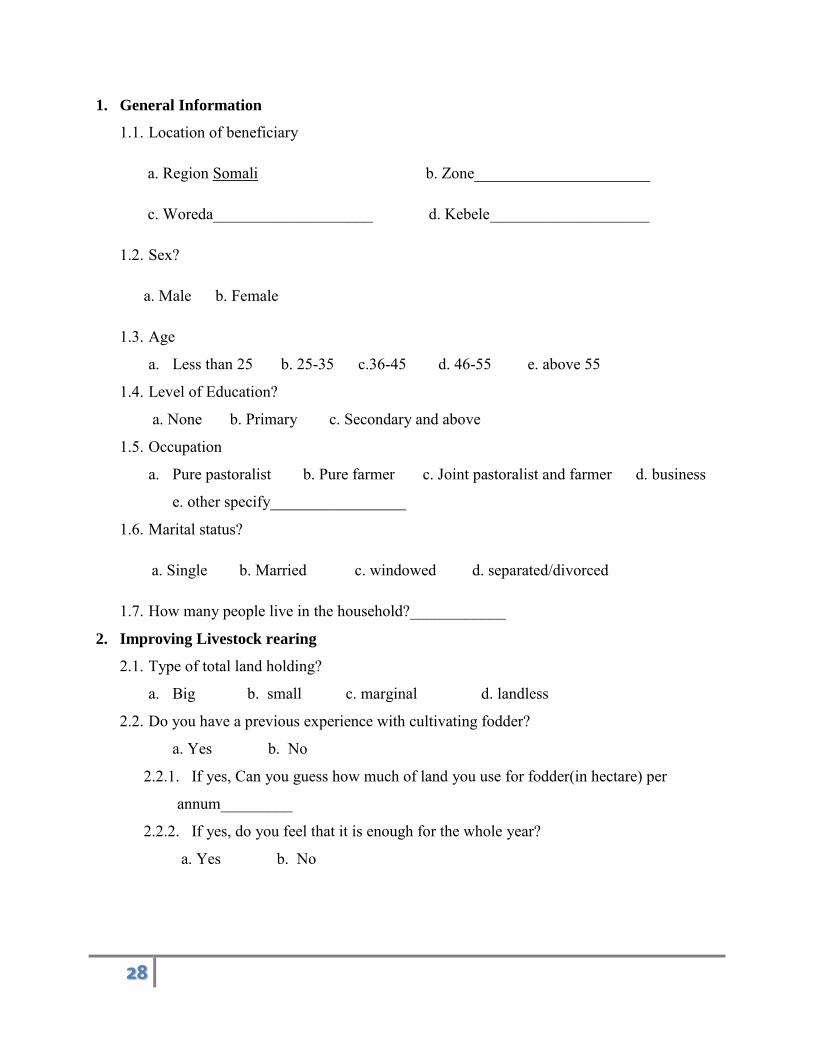
1. General Information
1.1. Location of beneficiary
a. Region Somali b. Zone______________________
c. Woreda____________________ d. Kebele____________________
1.2. Sex?
a. Male b. Female
1.3. Age
a. Less than 25 b. 25-35 c.36-45 d. 46-55 e. above 55
1.4. Level of Education?
a. None b. Primary c. Secondary and above
1.5. Occupation
a. Pure pastoralist b. Pure farmer c. Joint pastoralist and farmer d. business
e. other specify_________________
1.6. Marital status?
a. Single b. Married c. windowed d. separated/divorced
1.7. How many people live in the household?____________
2. Improving Livestock rearing
2.1. Type of total land holding?
a. Big b. small c. marginal d. landless
2.2. Do you have a previous experience with cultivating fodder?
a. Yes b. No
2.2.1. If yes, Can you guess how much of land you use for fodder(in hectare) per
annum_________
2.2.2. If yes, do you feel that it is enough for the whole year?
a. Yes b. No

29
2.2.3. If no, what prevents you from doing so?
a. Scarcity of land b. Scarcity of Water c. Scarcity of seeds
d. Other Specify
___________________________________________________________________
__________________________________________________________________
2.3. Have you ever vaccinated your animals against infections diseases?
a. Yes b. No
2.4. Have you ever used drugs for your animals when they get ill?
a. Yes b. No
2.4.1. If yes, how many drugs will you purchase per annum?__________
2.4.2. How much the drugs cost you per annum?______________
2.4.3. If yes, what kind of animal diseases are common in this area?
___________________________________________________________________
_________________________________________________________________
2.4.4. If no, what will you use?
a. Traditional method b. nothing
3. Improving hygiene and sanitation
3.1. Do you have a toilet?
a. Yes b. No
3.2. What is your practice regarding defecation?
a. Open defecation b. unimproved (traditional latrine) c. shared
d. Improved latrine
3.3. Do you have a practice of washing hands after defecation?
a. Yes b. No
3.4. Do you see the latrine in a good condition (inside and outside)?
a. Yes b. No
3.5. Where do you dispose children stools less than 3?
a. Rinsed in toilet b. buried c. throw in to a garbage
d. other specify
_______________________________________________________________

30
3.6. Do you wash your hands?
a. Yes b. No
3.7. If yes, when do you wash your hands?
a. After defecation b. After cleaning child’s bottom c. Before preparing food
d. Before eating e. Before feeding a child f. After taking care of animals
3.8. If yes tell us about the frequency of washing?
a. Usually b. sometimes c. rarely
3.9. What is the main source of drinking water?
a. Public pipe b. unprotected (dug well, spring, pond etc)
c. Protected (dug well, spring, pond etc) d. Surface water (river, dam, lake etc)
e. other specify______________________________________
3.10. How long does it take to go there, get water and come back? In
hours___________
3.11. Who usually goes to this water source for your household?
a. Adult woman b. adult man c. Female child (under 15) d. male child (under 15)
e. other specfy_______________________
3.12. Do you treat your water in any way to make it safer to drink?
a. Yes b. No
3.13. What do you usually do to the water to make it safer to drink?
a. Boil b. strain it through a cloth c. let it stand and settle d. water filter
e. other specify
___________________________________________________________________
3.14. Have you been referred to hospital or other health facility?
a. Yes b. no
If yes when?____________________________________________________
Where?__________________________________________________
Why?_______________________________________________________________
____________________________________________________________________
___________________________________________________________
What was used as a means of transportation? ______________________________

31
4. Antenatal and postnatal care
4.1. Have you ever been pregnant?
a. Yes b. No
4.2. If yes, have you received antenatal consultation during your pregnancy?
a. Yes b. No
4.3. If yes, how many times?
a. One b. two c. three d. four and above
4.4. If yes, When did you start your first visit of Antenatal care (ANC) which month?
a. 1-3 month b. 4-6 month c. 5-9 month
4.5. Did you receive HIV testing during delivery?
a. Yes b. No
4.6. Have you been vaccinated during your pregnancy for TT?
a. Yes b. No
4.7. Do you know the general danger signs during pregnancy?
a. Excessive bleeding b. convulsion c. prolonged labor d. high fever
e. other specify
____________________________________________________________________
4.8. Place of delivery?
a. Health post b. health center c. hospital d. home
4.9. Does the newborn child start breast feeding soon
a. Yes b. No
4.10. Do you give the child exclusive breastfeeding?
a. Yes b. No
4.11. Have you ever checked at the health facility following your delivery?
a. Yes b. no
4.12. If no why not?
_______________________________________________________________________
_________________________________________________________
5. Malaria
5.1. Do you know about malaria?
a. Yes b. No

32
5.2. Do you know mode of transmission?
a. Yes b. No
5.3. If yes, can you tell the mode of transmission?
_______________________________________________________________________
____________________________________________________________
5.4. Do you know the signs and symptoms of malaria?
a. Yes b. No
5.5. Do you use mosquito nets in your family?
a. Yes b. no
5.6. If no why?
_______________________________________________________________________
_________________________________________________________________
6. Road Traffic
6.1. Have you heard about traffic rules and regulations?
a. Yes b. No
6.2. If yes, what are they?
_______________________________________________________________________
___________________________________________________
7. Livelihood
7.1. Do you have enough money to sustain yourself?
a. Yes b. No
7.2. What is the main source of your income?
a. Agriculture b. Livestock c. Employed d. Labor e. other
Specify_____________________________

33
Annex 2 FGD

34
Points to be raised on FGD
1. About safe water use? Where is your water supply source? How far from the village? How many months you have access to water? Have you been using household water treatment?
2. About road traffic accidents? When you are on motorbike do you wear helmet? Seat belt in a car? Have you ever heard about road accidents? What were the possible reasons for that? Do you walk on highways with your left side? Do you have a practice of watching the car speed and distance before you cross a
road? 3. Water borne diseases?
What water borne diseases are common in this area? What do you do when you and your family get infected?
4. Sanitation condition of the area 5. Exclusive breast feeding implementation by mothers and 6. Cultural norms (bad traditional habits related to breast feeding, delivery, etc)
Key informant Questionnaire
1. Total number of people visiting the health center?(HEW) 2. What was the reason for visiting by major diseases? (HEW) 3. Number of people sent for referral? (HEW) 4. What are the major diseases for cases observed for referral? (HEW) 5. Number of women who take ANC per annum without duplication(HEW) 6. Data on ANC, Delivery and PNC per annum(HEW) 7. Road traffic data of injured people (if possible from worda or zone traffic office)