report on the lcpr study of postretirement adjustments (colas)
TRANSCRIPT
Minnesota Legislative Commission on Pensions and Retirement
Report on the LCPR Study of Postretirement Adjustments (COLAs)
December 2020
Adopted by the LCPR on [__________], 2021
Prepared by LCPR Staff: Chad Burkitt, Analyst Lisa Diesslin, Commission Assistant Susan Lenczewski, Executive Director
Table of Contents I. Introduction ..........................................................................................................................................1
A. Terminology ....................................................................................................................................... 1
B. Description of study process ............................................................................................................. 2
II. Postretirement adjustments in Minnesota ...........................................................................................3
A. Postretirement adjustments prior to 2018 ........................................................................................ 3 1969-1979: Minnesota Adjustable Fixed Benefit Fund (MAFBF) ............................................. 3 1980-1992: Minnesota Post Retirement Investment Fund (Post Fund) .................................. 4 1993-1996: Post Fund restructuring ........................................................................................ 5 1997-2007: Post Fund adjustments ......................................................................................... 6 2008: Post Fund reforms ......................................................................................................... 7 2009: Dissolution of the Post Fund .......................................................................................... 7 2009-2018: Triggers and litigation ........................................................................................... 9
B. Postretirement adjustments, 2018 to date – MSRS, TRA, SPTRFA .................................................. 11
C. Postretirement adjustments, 2018 to date - PERA General and Correctional Plans ....................... 12 Background ........................................................................................................................... 12 How it works ......................................................................................................................... 12
D. Cost of postretirement adjustments ............................................................................................... 13
III. COLAs and protecting the purchasing power of pensions ..................................................................16
A. Purpose of Minnesota’s postretirement adjustment ...................................................................... 16
B. Inflation ............................................................................................................................................ 17 Measuring inflation .............................................................................................................. 18 Predicting inflation ............................................................................................................... 20
C. Retiree cost of living and spending patterns ................................................................................... 20 Health care costs .................................................................................................................. 20 Retiree spending patterns .................................................................................................... 22
IV. Minnesota’s postretirement adjustments and protection against inflation ......................................26
A. How well are current retirees protected from inflation? ................................................................ 26 Retirees in the MSRS and PERA General Plans, TRA, and SPTRFA ........................................ 26 Retirees in the Public Safety and Judges Plans ..................................................................... 28
B. How well will current postretirement adjustments protect against inflation in the future? .......... 29 Retirees in the MSRS and PERA General Plans, TRA, and SPTRFA ........................................ 29 Retirees in the Public Safety and Judges Plans ..................................................................... 31
C. Comparing inflation protection for coordinated and basic members ............................................. 33 Implications for Coordinated Plans ...................................................................................... 35
V. Fixed vs. variable: Is the new PERA method better? ..........................................................................37
A. Vulnerability to inflation .................................................................................................................. 37
B. Intergenerational equity .................................................................................................................. 40
C. Conclusions ...................................................................................................................................... 41
VI. Variations on COLA design ..................................................................................................................42
A. COLAs, generally .............................................................................................................................. 42
B. Common COLA features .................................................................................................................. 44 Ad hoc vs. automatic COLAs ................................................................................................. 44 Compounding vs. simple COLAs ........................................................................................... 45 Delayed onset or minimum age COLA .................................................................................. 45 Limited benefit COLA ............................................................................................................ 46 Optional self-funded COLA ................................................................................................... 48
C. Case studies of the COLA experience of Wisconsin, South Dakota, and Colorado ......................... 48 Wisconsin Retirement System .............................................................................................. 48 South Dakota Retirement System ........................................................................................ 49 Public Employees Retirement Association ("PERA") of Colorado ........................................ 49
D. Trends in public sector COLAs ......................................................................................................... 50 COLA changes affecting new employees .............................................................................. 50 COLA changes affecting current employees ......................................................................... 51 COLA changes affecting current retirees .............................................................................. 51 Increased complexity ............................................................................................................ 52
E. Private sector COLAs ........................................................................................................................ 52
VII. Conclusion ...........................................................................................................................................57
Acknowledgements
Appendix A - Public comments
Appendix B - Notes from case study interviews: Colorado, South Dakota, Wisconsin

Table of Figures Figure 1: Minnesota Adjustable Fixed Benefit Fund, 1971-1979 ................................................................................. 4
Figure 2: Post Fund, 1980-1992 .................................................................................................................................... 5 Figure 3: Post Fund, 1993-2007 .................................................................................................................................... 6 Figure 4: Post Fund Cost of Living Adjustments 1981-2009 ......................................................................................... 8 Figure 5: Postretirement Cost of Living Adjustments 2010-2018 ............................................................................... 10 Figure 6: PERA General and Correctional Plans Post-2018 Experience ...................................................................... 13
Figure 7: Cost of Providing a 1% Fixed Annual Postretirement Adjustment for TRA as a Percentage of Covered Payroll ....................................................................................................................................... 14
Figure 8: Savings Due to Reductions in Postretirement Adjustments in the 2018 Pension Reform Act .................... 15 Figure 9: 20-Year Comparison of CPI-W, R-CPI-E, and CPI-U ...................................................................................... 19 Figure 10: The Impact of the Amount of Consumption and Net Worth on the Average Real Change
in Consumption ...................................................................................................................................... 25 Figure 11: Retiree Benefits in the MSRS and PERA General Plans and TRA as a Percentage of Purchasing
Power by Year Retired ............................................................................................................................. 27
Figure 12: Public Safety and Judges Plan Retiree Benefits as a Percentage of Purchasing Power by Year Retired ... 29 Figure 13: Projected Purchasing Power Over 20 Years for 2011 Retirees and Assuming 2.5% Inflation ................... 30 Figure 14: Projected Purchasing Power Over 20 Years for 2021 Retirees and Assuming 2.5% Inflation ................... 30 Figure 15: Projected Purchasing Power Over 20 Years for 2021
Retirees and Assuming Last 20 Years Inflation Experience ..................................................................... 31 Figure 16: Projected Purchasing Power Over 20 Years for 2011 Retirees and Assuming 2.5% Inflation ................... 32
Figure 17: Projected Purchasing Power Over 20 Years for 2021 Retirees and Assuming 2.5% Inflation ................... 32 Figure 18: Projected Purchasing Power Over 20 Years for 2021 Retirees and Assuming Last 20 Years
Inflation Experience ................................................................................................................................ 33 Figure 19: Projected Benefit of Coordinated vs Basic Benefit; Assuming 2.5% Inflation, 1% Postretirement
Adjustment, Starting Benefit of $3,400 ($1,900-plan, $1,500 SSA) ........................................................ 34 Figure 20: Comparing Coordinated Plan Benefit With and Without Social Security as a Percentage of
Inflation at 2.5% ...................................................................................................................................... 36 Figure 21: PERA General and Correctional Fixed vs. Tied COLA ................................................................................. 37 Figure 22: PERA General, Comparing Purchasing Power for the Old Method and New Method .............................. 38
Figure 23: PERA Correctional Purchasing Power of New Model vs Old Model .......................................................... 39 Figure 24: Measuring Generational Inequity .............................................................................................................. 41 Figure 25: COLA Ingredients and Varieties ................................................................................................................. 44 Figure 26: Select Public Plans by COLA type ............................................................................................................... 45
Figure 27: COLA Provisions in Select Public Pension Plans ......................................................................................... 47 Figure 28: Prevalence of Defined Benefit Plans and Defined Contribution Plans in the Private Sector vs.
Public Sector in 2019 ............................................................................................................................... 54
MN LCPR COLA Study Report
Sec. I. Introduction Page 1
I. Introduction The 2018 Minnesota Legislature passed a comprehensive package of public pension reforms. The reforms included reductions in the postretirement adjustment rate for many Minnesota public pension plans and established a new method for determining the postretirement adjustment rate for the General and Local Government Correctional Plans of the Public Employees Retirement Association ("PERA"). In addition to the reforms, the legislature mandated that the Legislative Commission on Pensions and Retirement (the "Commission" or "LCPR") conduct a study of postretirement adjustments for the statewide public pension plans and the St. Paul Teachers Retirement Fund Association ("SPTRFA").1 Specifically, the legislature mandated that the study:
1. take into account the purpose of postretirement adjustments and whether governing statutes are consistent with the purpose of postretirement adjustments;
2. consider alternative methodologies for determining postretirement adjustments; and
3. evaluate PERA’s new method for determining the postretirement adjustment rate.
LCPR staff conducted the required study as described in subsection B. This report sets forth the study’s findings.
This report provides background information on Minnesota’s postretirement adjustment, including a discussion of the cost to provide a postretirement adjustment. Next, it considers the relationship between the postretirement adjustment and inflation protection, including how to measure inflation, and other effects on retiree purchasing power. The report then analyzes three questions: (1) how well are current retirees protected from inflation? (2) how well will current postretirement adjustments protect retirees in the future? and (3) is PERA’s new method of determining its postretirement adjustment better than the statutory fixed rate method used by the other Minnesota plans?
Finally, the report looks outside of Minnesota for options for providing COLA benefits. This section of the report details common COLA features found in other states; provides case studies on retirement systems in Wisconsin, Colorado, and South Dakota; examines national trends in COLA benefits; and examines private sector experience with COLAs.
A. Terminology
The following is a list of key terms and their meanings as used in this report.
"Cost of living adjustment" or "COLA" means the category of plan features that alters (usually increases) the amount of a pension or annuity after payment has commenced. The term includes Minnesota’s postretirement adjustment benefit but is used in this report only to refer to this category of plan features, whether provided by a Minnesota public pension plan or a public pension plan offered by another state or political subdivision in the U.S.
1 Minn. Laws 2018, Ch. 211, Art. 5, Sec. 14.
MN LCPR COLA Study Report
Sec. I. Introduction Page 2
"Compounding COLA" means a COLA that is added to the prior year’s benefit year after year, much like compound interest is added to the principal and accumulated interest from previous periods. For example, an annually compounding COLA of 3% on a monthly annuity of $1,000 would pay $1,030 per month in the second year (0.03 X $1,000), $1,061 per month in the third year (0.03 X $1,030), $1,092 per month in the third year (0.03 X $1,061), and so on.
"CPI" means the Consumer Price Index, a measure of the average price of a fixed basket of consumer goods.
"Legislature" means the Minnesota Legislature, unless the context clearly indicates otherwise.
"Postretirement adjustment" means the plan features described in Minnesota Statutes, Section 356.415, for the statewide plans and Section 354A.29 for SPTRFA.
"MSRS" means the Minnesota State Retirement System.
"PERA" means the Minnesota Public Employees Retirement Association.
"Simple COLA" means a COLA that is calculated on the base benefit. Unlike a compounding COLA, the increase is not calculated on the prior year’s benefit, as increased by previous years’ COLAs.
"SPTRFA" means the St. Paul Teachers Retirement Fund Association, both the organization and the plan it administers.
"TRA" means the Minnesota Teachers Retirement Association, both the organization and the plan it administers.
"Statewide plans" means the pension plans administered by MSRS, PERA, and TRA
"2018 Pension Reform Act" means Minnesota Laws 2018, Chapter 211, which is the 2018 omnibus pension and retirement bill as enacted.
B. Description of study process
This report sets forth the research, analysis, and conclusions reached in connection with the study of postretirement adjustments and other COLA benefits that was performed by the LCPR staff between November of 2019 and December of 2020. The LCPR staff was assisted by an informal workgroup consisting of the executive directors and legislative staffs from MSRS, PERA, TRA and SPTRFA.
Generally, the study was performed in four phases: research, analysis, preliminary review and comment, and final review. The research phase involved identifying and reviewing available literature, online databases and resources related to public retirement, and memoranda and records maintained by the Commission, MSRS, PERA, TRA, and SPTRFA. The workgroup also interviewed representatives from the Wisconsin Department of Employee Trust Funds ("ETF"), the South Dakota Retirement System ("SDRS"), and the Public Employees’ Retirement Association ("PERA") of Colorado. Those systems were chosen because of their multi-factor
MN LCPR COLA Study Report
Sec. II. Postretirement adjustments in Minnesota Page 3
approaches to setting COLA rates and because, in the case of Wisconsin and South Dakota, they have been able to provide COLAs while maintaining near 100% funding ratios.
The analysis phase consisted of synthesizing the research into short summaries that could be included in the report. LCPR staff also produced several models comparing inflation to postretirement adjustments under several historic and prospective scenarios. Those summaries and models were combined into a draft report that was made available for comment by the workgroup and the public.
The final two phases consisted of workgroup and public review of and comment on the draft report. LCPR staff held a public comment forum on December 8, 2020, to allow participants to publicly comment on the report. The public comment forum was recorded and is available from LCPR staff upon request. LCPR staff also asked members of the public to submit written public comments, if they wished to do so, and these have been appended to this report (see Appendix A). This report is the final version of the report and incorporates many of the public comments submitted to LCPR staff.
II. Postretirement adjustments in Minnesota Like many public pension plans across the country, Minnesota’s plans have revised their postretirement adjustment provisions and methods substantially over time. Many of these changes have been necessary to ensure that the overarching objective of providing a secure lifetime retirement for members is met, particularly in the wake of a number of severe economic crises over the last several decades, such as the Great Financial Crisis of 2008. With that as a backdrop, Minnesota public pension plans continued to balance the desire to provide their membership with some form of protection against inflation against the cost of such protection.
As set forth below, features of Minnesota’s postretirement adjustments have included separate, dedicated retirement benefit pools, investment return-sharing features, variable inflation linked formulas, funded ratio triggers, and fixed rate formulas. An understanding of these approaches is helpful in understanding the framework currently in place, as well as options for potential future modifications. To that end, this section provides a brief history and a description of the current status of postretirement adjustments in Minnesota’s public pension plans, starting with the Minnesota Adjustable Fixed Benefit Fund in 1969 and ending with the changes in the 2018 Pension Reform Act. No substantive changes have been made to postretirement adjustments since 2018.
A. Postretirement adjustments prior to 2018
1969-1979: Minnesota Adjustable Fixed Benefit Fund (MAFBF)
• In 1969, the MAFBF was created to hold the assets for retirees of the three statewide systems (MSRS, PERA, TRA). A separate fund for retiree assets was created due to concerns about the systems' low funding levels. At that time, some of the plans were only 50% funded.

MN LCPR COLA Study Report
Sec. II. Postretirement adjustments in Minnesota Page 4
• The amount of assets transferred to the MAFBF to fund retiree benefits was calculated assuming a 3.5% investment rate of return, which was later modified to 5.0%.
• Annual postretirement adjustments depended on the MAFBF’s funding ratio.
− If the ratio was between 98-102%, no increase was paid.
− If the ratio was over 102%, an annual increase equal to the "excess" over 100% was paid (e.g., if the ratio was 103%, a 3% increase was paid).
− If the ratio was less than 98%, pension amounts could decrease, but never below the original benefit level determined at time of retirement.
• Although this approach was intended to protect retirees from inflation, very low increases were actually paid under the MAFBF mechanism, notwithstanding high real inflation during the 1970's. This outcome was largely driven by a challenging investment environment and poor investment returns. Increases were paid under this mechanism only twice during the 1971-79 period (January 1, 1971, and 1972). An ad hoc increase was paid in 1979 in an effort to help retirees whose purchasing power had been meaningfully eroded during this high inflation time period.2
Figure 1: Minnesota Adjustable Fixed Benefit Fund, 1971-19793
1980-1992: Minnesota Post Retirement Investment Fund (Post Fund)
• In 1980, MAFBF assets were transferred to the Post Fund, a newly created separate fund for retiree assets.
• Accounting principles at the time were such that the Post Fund assets were valued at cost, not market value. Cost value was equal to the actuarial liabilities in the Post Fund.
2 Automatic versus ad hoc COLAs are discussed in more detail Section VI.B. 3 See Section III discussion on CPI-W (Consumer Price Index for Urban Wage Earners and Clerical Workers).
0%
2%
4%
6%
8%
10%
12%
14%
1971 1972 1973* 1974* 1975 1976 1977 1978 1979
Annual Increase (Jan. 1) Inflation (CPI-W, Previous Jan.-Dec.) Ad Hoc Legislative Increase

MN LCPR COLA Study Report
Sec. II. Postretirement adjustments in Minnesota Page 5
• As their members retired, each retirement system calculated the required reserves necessary to fund the lifetime benefit to be paid to the retiring member. For new retirements, assets were transferred from the respective active fund to the Post Fund in an amount determined by using a 5% investment return assumption.
• To ensure realized earnings would be adequate to support monthly benefit payments, approximately half of the Post Fund assets were invested in a dedicated bond portfolio intended to produce 5% annual realized earnings, plus excess earnings to support a target annual postretirement adjustment of 3%. On a combined basis, the Post Fund had a target annual assumed rate of return of 8%.
• From 1980 to 1992, Post Fund increases equaled or exceeded inflation in eight of the 13 years (see Figure 2). Large postretirement adjustments were possible because interest rates were high, boosting the earnings of the Post Fund's bond portfolio.
• As high investment earnings resulted in large annual postretirement adjustments, the State Board of Investment ("SBI") moved more and more assets into bonds in order to generate the necessary realized returns to support the annual increases. By 1992, 90% of the Post Fund was invested in bonds. As interest rates began to decline in the late 1980s, bonds became a far less attractive investment. It was clear a change in the structure was needed so that more of the fund could be invested in equities, which had a higher long-term return potential.
Figure 2: Post Fund, 1980-1992
1993-1996: Post Fund restructuring
• The Post Fund was restructured and a new postretirement adjustment formula created.
• The investment return assumption was increased from 8% to 8.5%.
0%
2%
4%
6%
8%
10%
12%
14%
1980 1981 1982 1983 1984 1985 1986 1987 1988 1989 1990 1991 1992
Annual Increase (Jan. 1) Inflation (CPI-W, Previous Jan.-Dec.)

MN LCPR COLA Study Report
Sec. II. Postretirement adjustments in Minnesota Page 6
• The new postretirement adjustment formula had two components: (1) crediting inflation up to a maximum of 3.5% plus (2) excess investment earnings above 8.5%.
• Due to excellent investment returns, the new formula produced large annual benefit increases, especially in the late 1990s.
1997-2007: Post Fund adjustments
• In 1997, as part of an overall restructuring of retiree and active member benefits, the Post Fund formula was adjusted to lower the inflation component from a maximum of 3.5% to 2.5%.
• To compensate for this lower future inflation component, retirees in the Post Fund were given an actuarially equivalent one-time boost in their benefit base. New retirees after June 30, 1997, received an increase in the benefit formula multiplier from 1.5% to 1.7%.
• This change was actuarially cost neutral but allowed the systems to pay retirees larger initial benefits in exchange for smaller postretirement increases.
• Due to the large increases paid to retirees in the late 1990s (see Figure 3) and a severe market downturn between 2000 and 2003, a large Post Fund deficit materialized and persisted until the fund was closed.
• In 2006, in order to prevent a recurrence of a large future Post Fund deficit, a 5% cap on the combined inflation and investment components (i.e., the total postretirement adjustment) was enacted with a July 1, 2010, effective date.
• In 2007, the LCPR adopted an actuarial assumption change that required the value of Post Fund assets to be set at fair market value, rather than at the cost (liability) value. This change had the effect of more fully measuring and disclosing the funding deficit that had existed in the Post Fund since 2001.
Figure 3: Post Fund, 1993-2007
0%
2%
4%
6%
8%
10%
12%
14%
1993 1994 1995 1996 1997 1998 1999 2000 2001 2002 2003 2004 2005 2006 2007
Annual Increase (Jan. 1) Inflation (CPI-W, Previous Jan.-Dec.)

MN LCPR COLA Study Report
Sec. II. Postretirement adjustments in Minnesota Page 7
2008: Post Fund reforms
In 2008, in the midst of the Great Financial Crisis, the Legislature passed major pension reforms affecting the Post Fund:
• The Post Fund would be dissolved if funding levels dropped to certain benchmark levels. Under this scenario, the assets and liabilities of the Post Fund would be transferred back to their respective active member funds. These transfers would take place if the Post Fund funding ratio either dropped below 80% for one year, or below 85% for two consecutive years.
• The annual postretirement adjustment formula was modified, regardless of whether the Post Fund remained an independent fund or its assets were transferred back to the respective active member funds. The previous investment-based component was eliminated and replaced with modified inflation-based provisions.
• If the Post Fund remained independent and had a funding deficit, a postretirement adjustment equal to the rate of inflation up to 2.5% would be paid. If the Post Fund developed a funding sufficiency, an added inflation component would be payable as actual inflation occurred and as excess funding allowed. The 5% overall cap on benefit adjustments would still be applicable.
• If the Post Fund remained independent, an inflation equalizer component could occur. The inflation equalizer was designed to provide an additional postretirement adjustment to retirees whose benefits had lagged actual inflation since retirement to help restore lost purchasing power. For the inflation equalizer to be paid: (1) inflation had to be less than 2.5%; (2) and the Post Fund’s investment return had to exceed 8.5%; and (3) its funding ratio had to exceed 90%.
• If the Post Fund were dissolved, a fixed postretirement adjustment of 2.5% annually would be payable, regardless of actual inflation, and the inflation equalizer provision would be eliminated.
2009: Dissolution of the Post Fund
The dissolution of the Post Fund was triggered on June 30, 2008, when its funded reached 79.7%. The assets and liabilities of the Post Fund were transferred back to the respective active member funds on June 30, 2009.
MN LCPR COLA Study Report
Sec. II. Postretirement adjustments in Minnesota Page 8
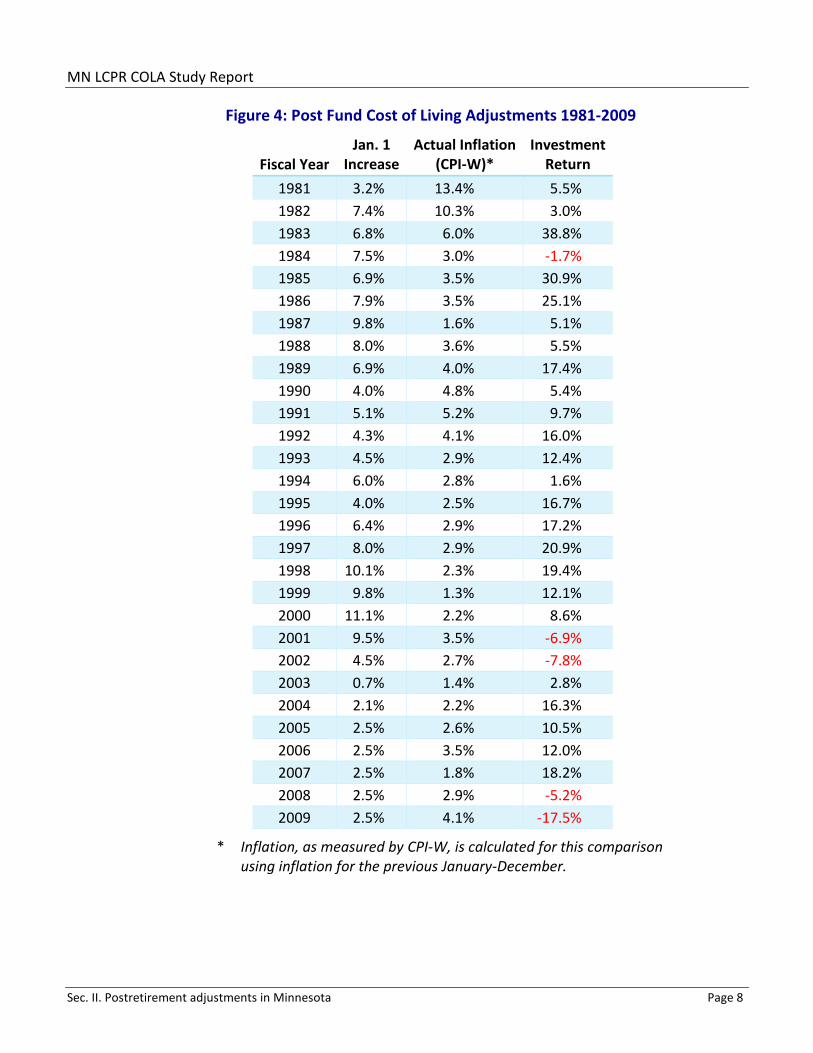
Figure 4: Post Fund Cost of Living Adjustments 1981-2009
Fiscal Year Jan. 1
Increase Actual Inflation
(CPI-W)* Investment
Return 1981 3.2% 13.4% 5.5% 1982 7.4% 10.3% 3.0% 1983 6.8% 6.0% 38.8% 1984 7.5% 3.0% -1.7% 1985 6.9% 3.5% 30.9% 1986 7.9% 3.5% 25.1% 1987 9.8% 1.6% 5.1% 1988 8.0% 3.6% 5.5% 1989 6.9% 4.0% 17.4% 1990 4.0% 4.8% 5.4% 1991 5.1% 5.2% 9.7% 1992 4.3% 4.1% 16.0% 1993 4.5% 2.9% 12.4% 1994 6.0% 2.8% 1.6% 1995 4.0% 2.5% 16.7% 1996 6.4% 2.9% 17.2% 1997 8.0% 2.9% 20.9% 1998 10.1% 2.3% 19.4% 1999 9.8% 1.3% 12.1% 2000 11.1% 2.2% 8.6% 2001 9.5% 3.5% -6.9% 2002 4.5% 2.7% -7.8% 2003 0.7% 1.4% 2.8% 2004 2.1% 2.2% 16.3% 2005 2.5% 2.6% 10.5% 2006 2.5% 3.5% 12.0% 2007 2.5% 1.8% 18.2% 2008 2.5% 2.9% -5.2% 2009 2.5% 4.1% -17.5%
* Inflation, as measured by CPI-W, is calculated for this comparison using inflation for the previous January-December.

MN LCPR COLA Study Report
Sec. II. Postretirement adjustments in Minnesota Page 9
2009-2018: Triggers and litigation
Following the dissolution of the Post Fund on June 30, 2009, postretirement adjustments for each statewide plan began to be paid from their respective pool of assets. The following changes took place during the period that followed, beginning in 2009 to the effective date of the 2018 Pension Reform Act:
• In addition to dissolving the Post Fund and repealing obsolete references to it in statute, the 2009 omnibus pension and retirement bill added Minn. Stat. § 356.415. This new statute consolidated statutory references to postretirement adjustments payable under the plans administered by the statewide pension systems.
• In 2010, the Legislature enacted sustainability measures designed to improve the funded ratios of the statewide pension plans and SPTRFA. This included reductions in postretirement adjustment rates for the MSRS plans (2.5% to 2%) and the PERA plans (2.5% to 1%). The legislation added "triggers," which would cause an automatic increase in the postretirement adjustment rates if the plans’ funding ratio reached 90%. Postretirement adjustments for retirees under TRA were suspended and not paid for 2011 and 2012.
• Retirees unsuccessfully challenged the 2010 reduction in the postretirement adjustment in Howard Swanson v. State of Minnesota (Ramsey County District Court, 62-CV-10-05285, June 29, 2011). Ramsey County District Court Judge Gregg Johnson denied the parties’ motions for summary judgement. In the order, he stated that the Legislature made a modest and reasonable alteration of postretirement adjustments in an attempt to find a balanced approach to address an unprecedented financial deterioration suffered by the retirement plans, and that this alteration was not an unconstitutional impairment of contract or taking of property without compensation. The plaintiffs did not appeal to a higher court.
• In 2012, TRA’s procedure for prorating postretirement adjustments for recently retired annuitants was revised. Under the new language, those who retired within 18 months prior to the adjustment date (January 1) would receive prorated adjustments, rather than having prorating applying only to those retired within 12 months of the adjustment date.4
• During the 2013 legislative session, reductions were made to the postretirement adjustments for the MSRS State Patrol Plan: Effective January 1, 2014, the increases were reduced from 1.5% to 1%; if the Plan reached a funding ratio of 85%, the postretirement adjustment would increase to 1.5%; if it reached a funding ratio of 90%, the postretirement
4 The MSRS General Plan and PERA General Plan have identical proration provisions to the ones enacted for TRA. The
structure of the proration provision results in an up to seven-month delay in commencement of the postretirement adjustment and, as a result, delay in the protection against inflation. For example, a TRA member who retires on January 1, 2020, receives a postretirement increase on January 1, 2021, that is 5/12 of 1%, or 0.42%. The figures in Section IV and Section V take into account this reduced postretirement adjustment in the first year. The SPTRFA has a similar provision in which, regardless of when the member retires during the previous year, their first increase is 50% of the postretirement adjustment otherwise payable that year.

MN LCPR COLA Study Report
Sec. II. Postretirement adjustments in Minnesota Page 10
adjustment would increase to 2.5%. Prior law had provided for a fixed 1.5% annual increase until the plan reached a funding ratio of 90%, at which point it would return to the 2008-2009 postretirement adjustment rate of 2.5%. The postretirement adjustment for the Judges Plan was also decreased, from 2% to 1.75%, until a funding ratio of 70% was reached.
• The postretirement adjustments for the PERA General, Police and Fire, and Local Correctional Plans were also amended in 2013. The rate was set at 1% annually until the applicable plan reached a funding ratio of 90%. In addition, the Police and Fire postretirement adjustment was suspended for retirees who began receiving their annuities after June 1, 2014, for at least 25 months for a partial adjustment or for at least 36 months for a full adjustment.
• In 2014, legislation was enacted that specified that the statewide and major local retirement plans would have to meet or exceed their funding triggers for two consecutive years, rather than for a single year, before postretirement adjustments would be increased.
• In 2015, legislation amended the postretirement adjustment provisions for most of the MSRS plans, to include an automatic trigger that would reduce the increase from 2.5% to 2% if the applicable plan’s funding ratio fell below 85% for two consecutive actuarial valuations or below 80% for the most recent actuarial valuation. A similar trigger was added for the State Patrol Plan, to reduce the increase to 1% if the funding ratio fell below 80% for two consecutive valuations or below 75% for the most recent valuation.
Figure 5: Postretirement Cost of Living Adjustments 2010-2018
Fiscal Year
PERA General Jan. 1
Increase
MSRS General Jan. 1
Increase
TRA Jan. 1
Increase
Actual Inflation (CPI-W)*
Investment Return
2010 2.5% 2.5% 2.5% -0.7% 15.2% 2011 1.0% 2.0% 0.0% 2.1% 23.3% 2012 1.0% 2.0% 0.0% 3.6% 2.4% 2013 1.5% 2.0% 2.0% 2.1% 14.2% 2014 1.0% 2.0% 2.0% 1.4% 18.6% 2015 1.0% 2.0% 2.0% 1.5% 4.4% 2016 1.0% 2.0% 2.0% -0.4% -0.1% 2017 1.0% 2.0% 2.0% 1.0% 15.1% 2018 1.0% 2.0% 2.0% 2.1% 10.3%
* Inflation, as measured by CPI-W, is calculated for this comparison using inflation for the previous January-December.

MN LCPR COLA Study Report
Sec. II. Postretirement adjustments in Minnesota Page 11
B. Postretirement adjustments, 2018 to date – MSRS, TRA, SPTRFA
The 2018 Pension Reform Act implemented a comprehensive set of pension reforms, including a revision of the statutes setting forth the postretirement adjustments for all the state’s pension plans. This section focuses specifically on MSRS, TRA, and SPTRFA.
Prior to the enactment of the 2018 Pension Reform Act, the respective MSRS, TRA, and SPTRFA statutory provisions each included a postretirement adjustment "trigger." This trigger mechanism provided for an automatic increase in the annual adjustment whenever the respective plan’s funded ratio reached a specified threshold, such as 90%, and an automatic decrease in the annual adjustment if the plan’s funded ratio fell below a specified threshold for a period of time. However, the trigger mechanism made it difficult to make any material improvement in the plan’s funded status because any beneficial changes, such as benefit reforms, contribution increases, or positive investment returns, would result in accelerating the date as of which the trigger would be reached. This acceleration would, in turn, increase the plan’s liabilities, even though no actual increase in the postretirement adjustment rate had occurred. The Act repealed the triggers for the MSRS General, Legislators, Correctional, State Patrol, and Unclassified Plans, TRA, and SPTRFA. The triggers for the Judges Plan remain in current statute.
The 2018 Pension Reform Act also reduced or froze postretirement adjustments for the MSRS plans, TRA, and SPTRFA. Postretirement adjustment rates for the MSRS General, Legislators, and Unclassified Plans were reduced from 2% to 1% for five years. After five years, the rate is scheduled to increase to 1.5%. The postretirement adjustment rate for the MSRS Correctional Plan was reduced from 2% to 1.5%. TRA’s postretirement adjustment rate was reduced from 2% to 1% for five years. After five years, the rate is scheduled to increase by 0.1% each year for five years, when it reaches 1.5% for 2028 and future years. Postretirement adjustments for SPTRFA were suspended for 2019 and 2020 and are scheduled to resume at 1% for 2021 and future years.
The 2018 Pension Reform Act also delayed the first year that a member would begin to receive a postretirement adjustment. Previously, when a member retired, the member was generally eligible to receive an adjustment in the year of their retirement. Under the new law, members who retire on or after January 1, 2024, will not begin to receive a postretirement adjustment until the member reaches the member's normal retirement age, either age 65 or 66, depending on when the member began public employment. The new law applies to the MSRS General, Legislators, and Unclassified Plans, TRA, and SPTRFA. The later commencement date does not apply to members who retire under the Rule of 905, disability benefit recipients, and survivor benefit recipients. These individuals will still receive a postretirement adjustment shortly after benefit commencement. Additionally, TRA and SPTRFA members who retire under the Age 62/30 Years of Service Rule are also able to begin receiving postretirement
5 Rule of 90 refers to the eligibility criteria for electing an unreduced pension benefit prior to normal retirement age. If a
member’s age and years of service add up to 90, the member can elect Rule of 90 and begin to receive an unreduced pension even though the member has not yet reached normal retirement age.

MN LCPR COLA Study Report
Sec. II. Postretirement adjustments in Minnesota Page 12
adjustments shortly after benefit commencement and will not have to wait until normal retirement age.
C. Postretirement adjustments, 2018 to date - PERA General and Correctional Plans
Background
The 2018 Pension Reform Act modified the provisions for postretirement adjustments in the PERA General and Local Government Correctional Plans to (1) remove the triggers that would automatically increase the postretirement adjustment rate upon attainment of a specified funding ratio, and (2) move from a fixed rate annual postretirement adjustment to a rate that is linked to inflation, with a floor and a cap. These changes would impact the General Plan’s approximately 87,000 retirees and the Local Government Correctional Plan’s approximately 1,050 retirees. The Act did not include any change to the postretirement adjustment for the Police and Fire Plan, which continues to have an annual postretirement adjustment rate that is fixed at 1.0%.
PERA’s postretirement adjustment changes were intended to provide more directly correlated inflation protection and to improve intergenerational equity. The PERA Board of Trustees considered the change after recognizing that previous statutes that tied increases to investment returns or funding status or specified a fixed rate had resulted in measurable intergenerational inequities across the PERA plans.6 In this context, intergenerational equity refers to the relative level of inflation protection across retirement cohorts over time; it is not a measure of the absolute levels of inflation protection.
The use of an inflation-based postretirement adjustment serves as a way to measure progress on both the inflation protection and intergenerational equity goals. Ideally, if all current and future retirees always received an increase equal to 100% of CPI each year (with no cap), both goals would be met. If, however, the pension plan cannot afford full inflation protection (i.e., 100% of CPI each year), the goal of intergenerational equity would still be met if the annual increase percentage remained consistent each year such that all cohorts of retirees receive the same level of inflation protection relative to other cohorts of retirees. For example, if all members always receive an increase of 50% of CPI each year, then all members will be equally protected against inflation over their lifetimes. If, however, the rate of postretirement adjustments is fixed and not tied to CPI, then protection against inflation will vary considerably depending on whether a retiree’s retirement years coincide with a period of low inflation or high inflation.
How it works
Annual postretirement increases for PERA General Plan members are now tied to the same inflation measure that is used by the Social Security Administration ("SSA") to determine the annual Social Security benefits increase, CPI-W. General Plan retirees receive 50% of the Social
6 See Section V.B. on intergenerational equity.

MN LCPR COLA Study Report
Sec. II. Postretirement adjustments in Minnesota Page 13
Security increase, but not less than 1.0% (the floor) nor greater than 1.5% (the cap). Correctional Plan retirees receive 100% of the Social Security increase, but not less than 1.0% or greater than 2.5%. The Correctional Plan was able to provide a higher level of inflation protection because it was close to 100% funded at the time the change was enacted.
The following chart summarizes actual experience since the 2018 law change.
Figure 6: PERA General and Correctional Plans Post-2018 Experience
Year Social Security (CPI-W)
Retiree Increase General Plan
Retiree Increase Correctional Plan Retiree Increase
2019 2.8% 1.4% 2.5% 2020 1.6% 1.0% 1.6% 2021 1.3% 1.0% 1.3%
Had these changes not occurred, the General Plan retirees would have received 1.0% each year while the Correctional Plan retirees would have received 2.5% per year. Since the effective date of these changes, the General Plan floor has resulted in greater than 50% CPI protection for its retirees. For the Correctional Plan, had these changes not been made, the previously fixed 2.5% postretirement adjustment rate would have resulted in increases that were higher than CPI for two of the three years since the effective date of the changes.
D. Cost of postretirement adjustments
Over the last several decades, public pension plans across the country have made substantial modifications to their COLAs. In Minnesota, these modifications have been part of a broader set of pension reforms intended to keep the plans financially stable and able to continue providing lifetime retirement security for their members. This section will explore the trade-offs between funding and postretirement adjustments in the case of the Minnesota pension plans.
Generally, Minnesota’s public pension plans are funded from three sources: (1) employer and employee contributions, (2) additional state funding, and (3) investment returns.7 The Legislature seeks to set contribution rates and any additional state funding such that, when combined with investment returns, the pension plan will have sufficient funding to pay for new benefits earned and make its scheduled payment toward any unfunded liabilities. Providing a COLA results in an increase in a fund’s liabilities and any unfunded liabilities. Generally, increased liabilities can only be offset in four ways, each of which requires legislative action to implement: (1) additional employer contributions; (2) additional active employee contributions; (3) additional state funding; or (4) offsetting benefit reductions. Public pension plans and the Legislature must constantly consider the competing objectives of providing
7 Many of Minnesota’s pension plans receive a direct appropriation of some kind. Often, direct appropriations are designed
as temporary sources to provide funding for a specific purpose.

MN LCPR COLA Study Report
Sec. II. Postretirement adjustments in Minnesota Page 14
adequate benefit features, including COLAs, while maintaining financial stability and intergenerational equity.
In the context of those competing policy objectives, it is important to consider the cost of postretirement adjustments. One way of analyzing this cost is to examine its contribution to the fund’s Annual Required Contribution (the "ARC"). The ARC is determined annually (as its name implies) and is a measurement of the contributions needed in any year to pay for new benefits earned, administrative expenses, and the scheduled payment toward unfunded liabilities. Often, the ARC is expressed as a percentage of covered payroll. For example, for fiscal year 2020, the MSRS General Plan’s ARC was 10.56% of payroll or about $358 million.8 The ARC fluctuates from year to year, depending on investment performance, funded status, plan experience, and changes in actuarial assumptions.
Figure 7 provides an illustration of the cost of providing a 1% fixed postretirement adjustment for TRA.
Figure 7: Cost of Providing a 1% Fixed Annual Postretirement Adjustment for TRA as a Percentage of Covered Payroll
1% COLA 0% COLA Difference Normal Cost 8.83% 8.22% 0.61% Actuarially Accrued Liability (Actuarial Value of Assets)
6.90% 4.77% 2.13%
Admin Expense 0.32% 0.32% 0.00% Total (ARC) 16.05% 13.31% 2.74%9
As reflected in Figure 7, 2.74% of the Total ARC is attributable to a fixed 1% postretirement adjustment. A similar analysis by SPTRFA and PERA concluded that:
• For SPTRFA, approximately 3.6% of the total ARC is attributable to providing a 1% fixed postretirement adjustment. A 0.25% increase in the postretirement adjustment would increase SPTRFA’s ARC by 0.87% of covered payroll.
• For PERA, approximately 3% of the Total ARC is attributable to a fixed 1% postretirement adjustment.
In a report to the LCPR in 2017, a similar analysis by MSRS showed that a 0.5% postretirement adjustment would contribute approximately 1.9% to the MSRS General Plan’s ARC under the assumptions and funding at the time.
As reflected above, the cost of providing a postretirement adjustment varies for each of the pension plans due to several factors, including plan demographics and funded ratio. The cost
8 State Employees Retirement Fund, July 1, 2020, Funding Valuation, p. 22, www.lcpr.leg.mn/valuations.htm. 9 2.74% of TRA’s FY 2020 covered payroll of $5.17 billion equals about $142 million.

MN LCPR COLA Study Report
Sec. II. Postretirement adjustments in Minnesota Page 15
also changes from year to year as each plan’s unfunded liabilities change. Thus, any future proposed change to postretirement adjustments should not rely on the cost illustrations in this report. In any case, legislative approval would be required for any change in a plan’s postretirement adjustment and the legislature would likely consider an increase in the postretirement adjustment only if the plan identified offsetting cost savings or additional contributions to ensure the plan’s funding remains sustainable.
The 2018 Pension Reform Act reduced postretirement adjustments for some pension plans in order to make the plans’ funding sustainable. As noted above, the 2018 Pension Reform Act made the following changes to postretirement adjustments:
• For the MSRS General, Legislators, and Unclassified Plans, the postretirement adjustment was reduced from 2% to 1% for five years; after five years, the rate is scheduled to increase to 1.5%.
• For the MSRS Correctional Plan, the postretirement adjustment was reduced from 2% to 1.5%.
• For TRA, the postretirement adjustment was reduced from 2% to 1% for five years; after five years, the rate is scheduled to increase by 0.1% each year for five years, until it reaches 1.5%, in 2028 and future years.
• For SPTRFA, postretirement adjustments were suspended for 2019 and 2020; after which, postretirement adjustments are scheduled to resume at 1% for 2021 and future years.
Figure 8: Savings Due to Reductions in Postretirement Adjustments in the 2018 Pension Reform Act
Plan Pre-2018 rate
Change in the 2018 Pension Reform Act
Savings for 2019-1 year ($ millions)
Present value of 30 years of savings
($ millions) MSRS General
2% Reduced by 1%, to 1%, for 5 years; then 1.5% thereafter
69.5 1,184
MSRS Correctional
2% Reduced by 0.5%, to 1.5% 7.7 132
TRA 2% Reduced by 1%, to 1%, for 5 year; then 0.1% increase each year, until 1.5%
141.2 2,338
St. Paul Teachers
1% No postretirement adjustment for 2019 and 2020; then 1%
2.9 47
To emphasize what this means:
• The smallest plan, SPTRFA, had, as of the fiscal year end preceding the 2018 Act, benefit liabilities of $1.611 billion, assets of $1.032 billion (market value), a shortfall of $579

MN LCPR COLA Study Report
Sec. III. COLAs and protecting the purchasing power of pensions Page 16
million, and was 64% funded. By not paying a 1% postretirement adjustment on its retirees’ pension benefits for two years, 2019 and 2020), SPTRFA saved nearly $6 million.
• Another relatively small plan, MSRS Correctional, had, as of the fiscal year end preceding the 2018 Act, benefit liabilities of $1,414.4 million, assets of 1,023.8 million (market value), a shortfall of $390 million, and was 72% funded. By paying a 1.5% postretirement adjustment rather than a 2% adjustment for 2019 (a reduction of 0.5%), this plan saved $7.7 million.
• TRA, on the other end of the spectrum in size, saved just over $141 million by paying a 1% postretirement adjustment for 2019, rather than a 2% postretirement adjustment for 2019. TRA had, as of the fiscal year end preceding the 2018 Act, benefit liabilities of $27.4 billion, assets of $21.3 billion (market value), a shortfall of $6.1 billion, and was 77% funded.
The PERA General Plan is not included in the 2018 savings analysis because the change from a 1% fixed postretirement adjustment to an inflation-tied variable postretirement adjustment added additional cost to the PERA plan. However, the additional cost was offset by removing the triggers for a higher postretirement adjustment rate once PERA’s funding rate improved. In short, the changes made in 2018 to PERA General Plan’s postretirement adjustment did not meaningfully affect funding. It should be noted that PERA reduced its postretirement adjustment from a fixed 2.5% to 1% in 2010 which resulted in substantial savings for the plan.
III. COLAs and protecting the purchasing power of pensions Pensions provide a defined benefit to fund living expenses during retirement. Since inflation erodes the value of a pension over time, it is generally believed that providing a COLA will help maintain that value. In essence, a COLA protects the buying power of retirees’ pension benefits.
As noted above, prior to 2008, Minnesota’s approach to postretirement adjustments depended on the investment success of the Post Fund, which served as a vehicle for sharing surplus investment returns with retirees. However, in 2008, with the dissolution of the Post Fund, Minnesota’s approach to postretirement adjustments changed to focus more on protecting retirees’ pensions from the adverse effect of increasing cost of living.
This section will first examine the purpose of the Minnesota’s postretirement adjustment and then examine the concept of inflation and its impact on retirees.
A. Purpose of Minnesota’s postretirement adjustment
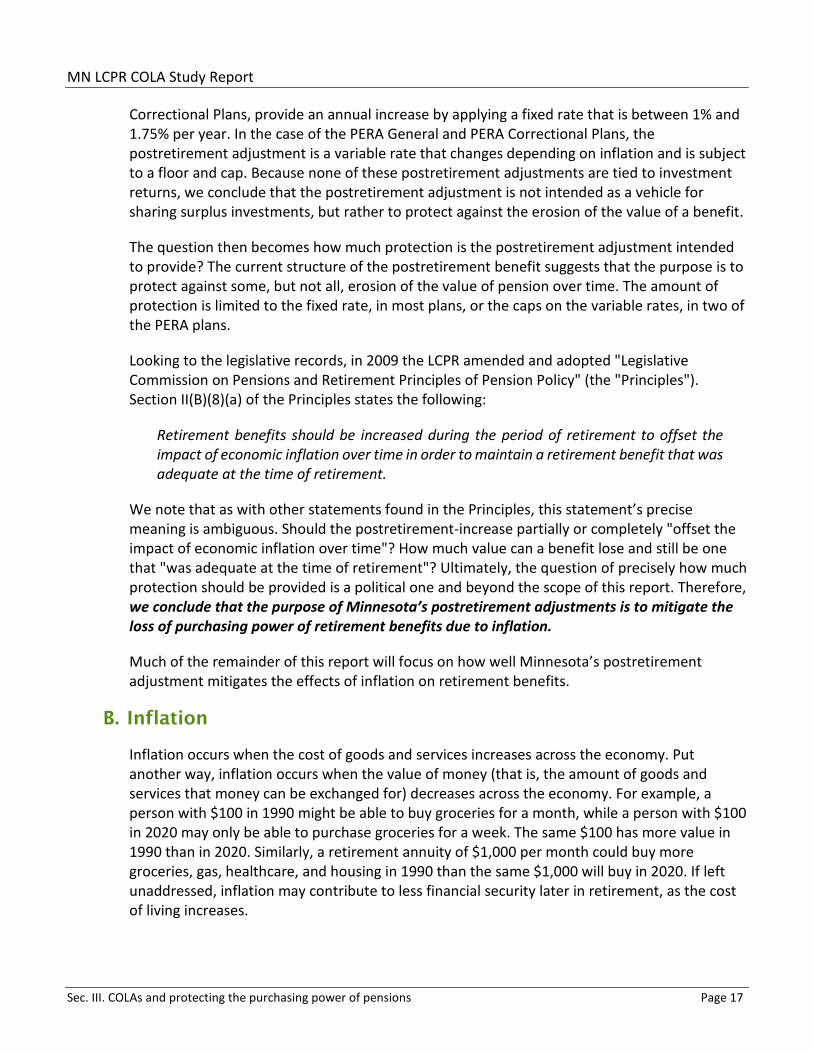
Research suggests that the purpose of a COLA is either to protect against erosion of the value of a benefit over time due to inflation or to share surplus investment returns with retired members. To determine the purpose of Minnesota’s postretirement adjustment, we looked first to the statute and then to relevant legislative records. The statute does not include a statement of legislative purpose but does describe the structure of the postretirement adjustment. Currently, most plans, with the exception of the PERA General and PERA
MN LCPR COLA Study Report
Sec. III. COLAs and protecting the purchasing power of pensions Page 17
Correctional Plans, provide an annual increase by applying a fixed rate that is between 1% and 1.75% per year. In the case of the PERA General and PERA Correctional Plans, the postretirement adjustment is a variable rate that changes depending on inflation and is subject to a floor and cap. Because none of these postretirement adjustments are tied to investment returns, we conclude that the postretirement adjustment is not intended as a vehicle for sharing surplus investments, but rather to protect against the erosion of the value of a benefit.
The question then becomes how much protection is the postretirement adjustment intended to provide? The current structure of the postretirement benefit suggests that the purpose is to protect against some, but not all, erosion of the value of pension over time. The amount of protection is limited to the fixed rate, in most plans, or the caps on the variable rates, in two of the PERA plans.
Looking to the legislative records, in 2009 the LCPR amended and adopted "Legislative Commission on Pensions and Retirement Principles of Pension Policy" (the "Principles"). Section II(B)(8)(a) of the Principles states the following:
Retirement benefits should be increased during the period of retirement to offset the impact of economic inflation over time in order to maintain a retirement benefit that was adequate at the time of retirement.
We note that as with other statements found in the Principles, this statement’s precise meaning is ambiguous. Should the postretirement-increase partially or completely "offset the impact of economic inflation over time"? How much value can a benefit lose and still be one that "was adequate at the time of retirement"? Ultimately, the question of precisely how much protection should be provided is a political one and beyond the scope of this report. Therefore, we conclude that the purpose of Minnesota’s postretirement adjustments is to mitigate the loss of purchasing power of retirement benefits due to inflation.
Much of the remainder of this report will focus on how well Minnesota’s postretirement adjustment mitigates the effects of inflation on retirement benefits.
B. Inflation
Inflation occurs when the cost of goods and services increases across the economy. Put another way, inflation occurs when the value of money (that is, the amount of goods and services that money can be exchanged for) decreases across the economy. For example, a person with $100 in 1990 might be able to buy groceries for a month, while a person with $100 in 2020 may only be able to purchase groceries for a week. The same $100 has more value in 1990 than in 2020. Similarly, a retirement annuity of $1,000 per month could buy more groceries, gas, healthcare, and housing in 1990 than the same $1,000 will buy in 2020. If left unaddressed, inflation may contribute to less financial security later in retirement, as the cost of living increases.

MN LCPR COLA Study Report
Sec. III. COLAs and protecting the purchasing power of pensions Page 18
Measuring inflation
Measuring inflation is a first step to addressing inflation. Occasionally there is disagreement about how best to measure inflation.
The most common way to measure inflation is through the Consumer Price Index ("CPI"), which is maintained by the federal Bureau of Labor Statistics ("BLS").10 BLS surveys the prices of goods and services from across all sectors of the economy, in different cities and rural locations around the country. The prices for these goods and services are recorded and maintained in an index. The prices are weighted according to the percentage of total consumer spending spent on the type of good or service. The weighted average increase or decrease in these indexed prices from one year to the next is the year-over-year inflation rate.
BLS also maintains sub-indices that are made up of selected portions of the CPI. These sub-indices are the CPI-U (Consumer Price Index for All Urban Consumers), which represents about 93% of the U.S. population, and the CPI-W (for All Urban Wage Earners and Clerical Workers), which represents 29% of the U.S. population.11 BLS also maintains a third index called the Chained Consumer Price Index for All Urban Consumers ("C-CPI-U"). The C-CPI-U is notable for taking into account substitutions that consumers make when the price of a particular good increases.12 For example, if the price of beef goes up 50%, some part of consumer spending on beef will be spent on chicken or pork instead. This tends to produce slightly lower average year-over-year inflation figures.
Finally, BLS maintains a handful of unofficial indices, the most notable of which is the R-CPI-E for Americans age 62 and older.13 The R-CPI-E seeks to measure the consumer spending by this segment of Americans and may provide a more accurate measurement of the effect of inflation on retirees than either the CPI-U or CPI-W does. However, BLS publishes the R-CPI-E with a number of disclaimers. Chief among them is that because the R-CPI-E is a subset of CPI-U data, the index is not properly weighted for retiree expenditures. For example, retirees spend more money as a portion of their expenditures on healthcare than the rest of the urban population does, which means that increases in health care costs would be felt more by retirees. But the R-CPI-E does not account for this difference in retiree behavior, making it an imperfect measure of inflation for retirees.
A comparison of CPI-U, CPI-W, and R-CPI-E can be seen in Figure 9, which shows that over the last 20 years CPI-W tends to produce the lowest measurement of inflation and R-CPI-E tends to produce the highest measurement of inflation. However, despite some disparity in specific years, over the last 20 years, the three indices produce very similar results and appear to be
10 Bureau of Labor Statistics, U.S. Department of Labor, "Consumer Price Index," www.bls.gov/cpi. 11 Bureau of Labor Statistics, U.S. Department of Labor, "Consumer Price Index Frequently Asked Questions,"
www.bls.gov/cpi/questions-and-answers.htm. 12 Bureau of Labor Statistics, U.S. Department of Labor, "Chained Consumer Price Index For All Urban Consumers,"
www.bls.gov/cpi/additional-resources/chained-cpi.htm 13 Bureau of Labor Statistics, U.S. Department of Labor, "R-CPI-E Homepage," www.bls.gov/cpi/research-series/r-cpi-e-
home.htm.

MN LCPR COLA Study Report
Sec. III. COLAs and protecting the purchasing power of pensions Page 19
trending towards convergence. This suggests that use of any of the three indices would produce very similar outcomes for individuals over their lifetimes.
Figure 9: 20-Year Comparison of CPI-W, R-CPI-E, and CPI-U
The Legislature has not expressed a clear preference for how to measure inflation for retired public employees. However, there are two factors that suggest a preference for the CPI-W. The first is that the PERA General and Local Government Correctional Plans have postretirement adjustments that are indirectly tied to the CPI-W because the plans use the Social Security Administration’s COLA to set their postretirement increase. As noted above, the Social Security Administration uses the CPI-W to set its COLA. The second factor is that the LCPR has historically used the CPI-W to measure inflation for in its publications and analysis. In other policy areas, where the Legislature has specified a measurement of inflation it has tended to use the CPI-U or the CPI-U for the Minneapolis-St. Paul Metropolitan area.14
14 For example, Minn. Stat. § 43A.17, Subd. 9 (regulating inflation-based increases in state aid for local governments);
Minn. Stat. § 60A.201, Subd. 2 (regulating insurance coverage at certain home values adjusted for inflation).
-1.5%
-0.5%
0.5%
1.5%
2.5%
3.5%
4.5%
2000
2001
2002
2003
2004
2005
2006
2007
2008
2009
2010
2011
2012
2013
2014
2015
2016
2017
2018
2019
2020
CPI-W R-CPI-E CPI-U Linear (CPI-W) Linear (R-CPI-E) Linear (CPI-U)

MN LCPR COLA Study Report
Sec. III. COLAs and protecting the purchasing power of pensions Page 20
Predicting inflation
Pension plans are required to make predictions about future inflation in order to make sure they have enough money on hand to pay benefits when they come due. This means that each of Minnesota’s public pension plans has an inflation assumption that is updated every four to six years. The plans rely on independent, third-party actuaries for setting the inflation assumption. To arrive at these assumptions, each plan’s actuary relies primarily on forward-looking economic data, including the Survey of Professional Forecasters, which produces quarterly projections for annual average Headline CPI over the next ten years; the Congressional Budget Office, which forecasts annual CPI-U; the Trustees of the Social Security system, which forecasts future CPI-W; and analyses of the US Treasury Bond market, which provides an estimate of the bond market’s expectations about inflation.15
Currently each of the statewide plans and the SPTRFA use an inflation assumption of 2.5%. In the most recent experience studies for the statewide plans, the plans’ actuary recommended a reduction to 2.25% because forward-looking economic data predicts lower inflation, especially during the next ten years.16 For the analysis presented in this report we have used 2.5% because that was the assumption adopted by each of the plans at the time the analysis was performed.
C. Retiree cost of living and spending patterns
Inflation reduces purchasing power and is of particular concern for retirees who may not be able to make up this shortfall through employment during their retirement years. As prices for the same goods and services increase, the value of a dollar is reduced, and the fixed incomes that many retirees rely on can become insufficient to meet their needs and wants.
Health care costs
The non-elective nature of medical treatment collides with aging such that seniors need to and do participate more in health care spending than younger Americans. This means that their purchasing power is more significantly impacted by increasing costs in this sector.
It is estimated that a greater cross-section of Americans will reach the later, more expensive years of retirement as life expectancy in the U.S. improves. By 2060, the overall life expectancy is projected to lengthen six years over life expectancy in 2017, from 79.7 to 85.6 years.
15 In determining projections, including inflation and other economic assumptions, plan actuaries are guided by Actuarial
Standards of Practice No. 27, as well as industry-wide generally accepted methodologies. In reaching their conclusions, they consider a range of information, including (1) actual inflation experience over many decades; (2) the forward-looking inflation assumptions embedded in the capital markets assumptions of numerous highly regarded investment firms; (3) the long-range intermediate inflation assumption reflected in the Social Security Trustees report; and (4) the "break-even inflation rate" rate reflected in Treasury Inflation Protected Securities (TIPS), which is widely viewed as an indicator of market participants' forward-looking inflation expectations.
16 See MSRS 2014-2018 Experience Study and PERA 2014-2018 Experience Study, www.lcpr.leg.mn/experience.htm.
MN LCPR COLA Study Report
Sec. III. COLAs and protecting the purchasing power of pensions Page 21
Currently for Americans age 65, life expectancy is already 83.8 for men and 86.4 for women.17 If that longevity experience is overlaid onto current cost trends, healthcare will remain a subject of key importance to retirees.
Health care costs have risen over the past several decades. As measured by the Bureau of Labor Statistics, inflation in this sector has regularly outpaced the overall average inflation rate. In particular, prices for medical and hospital care rose at a greater rate in each year between 2009 and 2016 than all other goods and services tracked by the consumer price index.18 On a household level, an analysis of consumer spending habits found that, adjusted for inflation, Americans spent twice as much on health care in 2018 as they did in 1984.19
The implications of these rising costs follow Americans into retirement when many begin living on fixed incomes. According to Fidelity’s annual Retiree Health Care Cost Estimate, a healthy American couple retiring in 2020 at age 65 will spend about $295,000 on health care over the course of their retirements. This assumes that both are covered by Medicare but excludes premiums for long-term care, prescription medications, vision, and dental treatments.20 This amount is a 3.5% increase over the 2019 projection and an 18% increase since 2010.21
The Kaiser Family Foundation found that health care costs accounted for 14% of Medicare recipients’ total budgets, although those who are older spend more. Compare this with working households, which spend closer to 5% of their budgets on medical care.22
Health care expenditures during retirement do not stay stagnant as individuals age. Generally, the older one gets, the more medical care the individual needs to treat developing and compounding chronic conditions.23 Americans on Medicare who were 85 or older spent more than twice as much as those aged 65-74 on medical costs, in part because of long-term care.24 Actual out-of-pocket costs averaged $5,021 for Medicare recipients aged 65-74 and $5,829 for
17 Lauren Medina, Shannon Sabo, and Jonathan Vespa, US Census Bureau, "Living Longer: Historical and Projected Life
Expectancy in the United States, 1960 to 2060" www.census.gov/content/dam/Census/library/publications/2020/ demo/p25-1145.pdf (Accessed September 11, 2020).
18 Bureau of Labor Statistics, U.S. Department of Labor, "Inflation & Prices: All Urban Consumers, Consumer Price Index," www.bls.gov/data (accessed September 7, 2020).
19 Juliette Cubanski, Tricia Neuman, Anthony Damico, and Karen Smith. "Medicare Beneficiaries’ Out-of-Pocket Health Care Spending as a Share of Income Now and Projections for the Future" Kaiser Family Foundation. January 26, 2018.
20 Fidelity, "How to Plan For Rising Health Care Costs" www.fidelity.com/viewpoints/personal-finance/plan-for-rising-health-care-costs (accessed September 7, 2020).
21 American Society of Pension Professionals and Actuaries, "Health Care Costs in Retirement Might Make You Reconsider an HSA" www.asppa-net.org/news/health-care-costs-retirement-might-make-you-reconsider-hsa (accessed September 7, 2020).
22 Kaiser Family Foundation, Health Care on a Budget: The Financial Burden of Health Spending by Medicare Households, 2014.
23 Tyler Bond and Dan Doonan. National Institute on Retirement Security. "The Growing Burden of Retirement: Rising Costs and More Risk Increase Uncertainty" September 2020.
24 Juliette Cubanski, Tricia Neuman, Anthony Damico, and Karen Smith. "Medicare Beneficiaries’ Out-of-Pocket Health Care Spending as a Share of Income Now and Projections for the Future" Kaiser Family Foundation. January 26, 2018.

MN LCPR COLA Study Report
Sec. III. COLAs and protecting the purchasing power of pensions Page 22
Medicare recipients aged 75-84. For Medicare recipients aged 85 or more, out-of-pocket costs were nearly double the average for younger retirees, at $10,307 annually.25
Assessing the actual out-of-pocket costs, in addition to average percentages of Medicare recipients’ budgets is helpful because of the likelihood that retirees receiving a pension from a public pension plan, in addition to Social Security, have higher average income in retirement than retirees not receiving a pension from a public pension plan. The average annual pension under Minnesota’s public pension plans ranges from $13,177 for the PERA General Plan to $26,701 for TRA.26 Combined with the average annual Social Security benefit of $18,516,27 retirees under Minnesota’s public pension plans have annual incomes, on average, of $31,693 for the PERA General Plan recipients, to $45,217 for TRA recipients. Medicare recipients with an income of $40,000 or more spends an average of 7% of that income on health care, slightly more than half of the 12% reported for all Medicare recipients.28
Retiree spending patterns
If we assume that the primary purpose of a postretirement adjustment (or COLA) is to protect the buying power of retirees’ pension benefits, does the need for a COLA decline if retirees consume less as they age? Put another way, does the need to protect buying power stay constant throughout retirement? Or is less protection needed as retirees age because they are buying less?
We looked at several papers published on this topic in the last five years. Probably the most relevant is a research report published on October 3, 2019, by the Employee Benefit Research Institute ("EBRI") that answers the question: "How Do Retirees' Spending Patterns Change Over Time?"
EBRI analyzed data in the "Health and Retirement Study (2004-2016)" ("HRS"), published by the University of Michigan, which is a biennial survey of a representative sample of people in the U.S. over the age of 50, sponsored by the National Institute on Aging and the Social Security Administration. EBRI describes this study as "the most comprehensive survey of older Americans in the nation." EBRI supplemented their analysis with data from the "Consumption and Activities Mail Survey" ("CAMS"), which surveys a subset of the sample surveyed in the HRS every two years, and collects information on 32 categories of spending.
The data was examined for 2005-2017 among three age groups: 50-64, 65-74, and 75 and older. The report’s conclusions are as follows:
25 Juliette Cubanski, Wyatt Koma, Anthony Damico, and Tricia Neuman. "How Much Do Medicare Beneficiaries Spend Out of
Pocket on Health Care?" Kaiser Family Foundation. November 4, 2019. 26 LCPR. Minnesota Public Pension Plan Basics. June 30, 2019. 27 AARP. "How Much Will I Get From Social Security?" December 23, 2020. 28 Juliette Cubanski, Wyatt Koma, Anthony Damico, and Tricia Neuman. "How Much Do Medicare Beneficiaries Spend Out of
Pocket on Health Care?" Kaiser Family Foundation. November 4, 2019.

MN LCPR COLA Study Report
Sec. III. COLAs and protecting the purchasing power of pensions Page 23
• Average annual spending is lower in older age groups than in younger age groups. For 2005-2017, the average annual household spending by age groups was:
50- to 64-year-olds: never below $49,000 65- to 74-year-olds: rarely above $46,000 75 or older: never exceeded $39,000
• Housing is the largest spending category for every age group, but the percentage of the budget spent on housing was smaller for older groups.
• Older groups spent less on food, entertainment, and work-related expenses, such as transportation and clothing.
• The share of budgets allocated to gifts and contributions increased with age.
• The share of budgets allocated to health care costs increased with age.
• In all age groups, low-income households spent a larger portion of their budgets on housing and food compared with high-income households. Low-income is defined as those with a total income less than the median for their age group and survey year; high-income is defined as those with a total income more than the median for their age group and survey year.
• Median total income was lower and median spending-to-income ratios were higher for households in older age groups. Income includes all sources, including earnings from employment, Social Security benefits, dividends and interest, distributions from 401(k) and similar plans, and pensions.
• The fraction of households who spent more than their income increased with age, while the amount of the overspending was lower for older age groups than compared with younger age groups.
• Median non-housing wealth increased with age but leveled off and declined as households reached ages 75 or older. Non-housing wealth is defined as vehicles, IRAs, stocks, savings, CDs, bonds, any other assets, but not including any employer provided retirement plan, less debt. This suggests that as earnings decline with age, retirees draw down more from these sources of income, thereby reducing non-housing wealth.
What is not clear from this report, however, is whether the change in expenditures (i.e., consumption) is by choice or by need. Do average expenditures decrease because the average retiree does not have enough saved for retirement and is therefore forced to reduce consumption?

MN LCPR COLA Study Report
Sec. III. COLAs and protecting the purchasing power of pensions Page 24
A working paper published by Morningstar29 attempts to answer that question. The working paper used the CAMS data (see description of CAMS above) and applied filters, including a minimum of $10,000 for annual spending and no more than a 50% change in spending from year to year, to create a dataset that they believe was a more reliable indicator of actual retirees. This left a dataset of 591 households, or 11% of the total number of households in the CAMS series. Morningstar then further refined this sample into four groups, based on consumption and total household net worth. The approximate median consumption in the sample was $30,000 per year and the approximate net worth was approximately $400,000.30
Households were categorized as follows:
• "Low Spend, Low Net Worth": household consumption of less than $30,000 and a net worth below $400,000 in an initial year
• "High Spend, High Net Worth": household consumption greater than $30,000 and a net worth above $400,000 in an initial year
• "Low Spend, High Net Worth": household consumption of less than $30,000 and a net worth above $400,000 in an initial year
• "High Spend, Low Net Worth": household consumption greater than $30,000 and a net worth below $400,000 in an initial year
As explained by Morningstar, breaking down the households into these four groups would help to better understand how consumption changes for a household given both its level of consumption and its available resources. Households in which spending and net worth are the same, either Low/Low and High/High are considered to be consuming optimally, i.e., their consumption is roughly consistent with their resources. In contrast, households where spending and net worth are not the same, either High/Low or Low/High, are considered to be consuming sub-optimally, either too much (High/Low) or not enough (Low/High). Morningstar showed the changes in spending habits of these two groups in the following graphs (Figure 6 on page 14 of the Morningstar paper):
29 David Blanchett. "Estimating the True Cost of Retirement" Morningstar Investment Management November 5, 2013. 30 Net worth included any secondary residence and the estimated total value of pensions and Social Security received by the
household. The value of pensions and Social Security was determined by calculating the mortality-weighted net present value of the future payments, in which a discount rate of 2% was assumed for Social Security benefits (since these are assumed to increase with inflation) and a 4% discount rate for pensions (which are assumed to be nominal).

MN LCPR COLA Study Report
Sec. III. COLAs and protecting the purchasing power of pensions Page 25
Figure 10: The Impact of the Amount of Consumption and Net Worth on the Average Real Change in Consumption
The "matched" groups with similar levels of spending and net worth had relatively similar average real changes in expenditures from ages 65 to 75. The lower spending households tended to see lower decreases in spending over time. Morningstar speculated that this may be because a higher percentage of household spending is on nondiscretionary items for the lower income household when compared to the higher income household. The working paper also noted that households with lower levels of consumption (Low Spend, Low Net Worth) tended to have real increases in spending that are greater than households with higher levels of consumption.
For the mismatched households, the working paper noted that there is a much greater difference in the change in real spending. Households that were overfunded and not spending optimally (the "Low Spend, High Net Worth" group) tended to increase consumption as they moved from age 65 to age 75, but at a decreasing rate, with the real increase for these households approaching 0% by age 75. In contrast, households that were underfunded and spending too much tended to see considerable declines in consumption. Morningstar acknowledged that, while there are a number of different potential explanations for this spending decline, it may have been brought on by the realization that the household spending was not expected to be sustainable over the lifetime of that household.
This analysis in the Morningstar working paper suggests that households that start retirement spending consistent with their net worth have relatively similar average changes in expenditures from ages 65 to 75. Lower spending households see lower decreases in spending over time than the higher spending households, until about age 70, when these households have greater increases in spending than households with higher levels of consumption. Contrast this with the mismatched households: the overfunded households increase consumption as they age, until

MN LCPR COLA Study Report
Sec. IV. Minnesota’s postretirement adjustments and protection against inflation Page 26
age 75, when consumption levels off; the underfunded households see significant decline in consumption, at increasing rates as they age.
Morningstar does not conclusively answer the question of whether changes in expenditures as a retiree ages is by choice or by need, except to note that spending is not constant as retirees age, but rather has more to do with whether the retiree household is consuming “optimally.” Households that are overfunded and not spending consistent with their net worth and income tend to increase consumption as they move from age 65 to age 75, but at a decreasing rate, while households that are underfunded and spending too much relative to their net worth and income tend to see considerable declines in spending during retirement.
IV. Minnesota’s postretirement adjustments and protection against inflation The primary purpose of Minnesota’s postretirement adjustments is to mitigate the loss of purchasing power of retirement benefits due to inflation. This section will analyze the amount of inflation protection the statewide pension plans have provided for current retirees and how much inflation protection can be reasonably expected in the future.
A. How well are current retirees protected from inflation?
Retirees in the MSRS and PERA General Plans, TRA, and SPTRFA
To understand how well current retirees are protected from inflation, we looked at a pension benefit in each of the last 30 years and increased it by actual postretirement adjustments to today (January 1, 2021). We compared that amount to the same pension benefit in each year increased by CPI-W for each of the following 30 years until today. This allows us to compare purchasing power for cohorts of plan participants retired in each of the last 30 years. For example, Figure 11 shows that an MSRS General Plan participant who retired in 1998 is currently (as of January 1, 2021) receiving a benefit that has a purchasing power that is approximately 120% of the retiree’s initial benefit versus a participant who retired in the years after 2000 has purchasing power roughly in line with the retiree’s initial benefit. This difference in purchasing power protection afforded different retirement cohorts within the same pension plan illustrates the concept of generational inequity, which is discussed further in Section V.
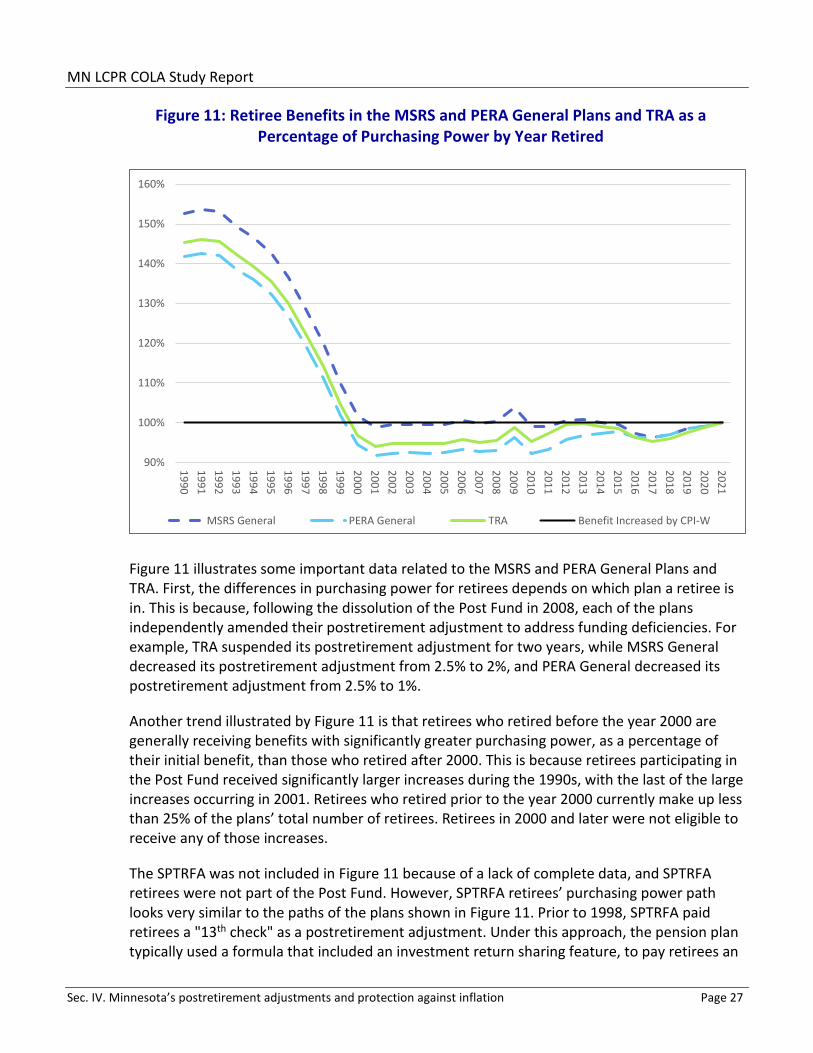
MN LCPR COLA Study Report
Sec. IV. Minnesota’s postretirement adjustments and protection against inflation Page 27
Figure 11: Retiree Benefits in the MSRS and PERA General Plans and TRA as a Percentage of Purchasing Power by Year Retired
Figure 11 illustrates some important data related to the MSRS and PERA General Plans and TRA. First, the differences in purchasing power for retirees depends on which plan a retiree is in. This is because, following the dissolution of the Post Fund in 2008, each of the plans independently amended their postretirement adjustment to address funding deficiencies. For example, TRA suspended its postretirement adjustment for two years, while MSRS General decreased its postretirement adjustment from 2.5% to 2%, and PERA General decreased its postretirement adjustment from 2.5% to 1%.
Another trend illustrated by Figure 11 is that retirees who retired before the year 2000 are generally receiving benefits with significantly greater purchasing power, as a percentage of their initial benefit, than those who retired after 2000. This is because retirees participating in the Post Fund received significantly larger increases during the 1990s, with the last of the large increases occurring in 2001. Retirees who retired prior to the year 2000 currently make up less than 25% of the plans’ total number of retirees. Retirees in 2000 and later were not eligible to receive any of those increases.
The SPTRFA was not included in Figure 11 because of a lack of complete data, and SPTRFA retirees were not part of the Post Fund. However, SPTRFA retirees’ purchasing power path looks very similar to the paths of the plans shown in Figure 11. Prior to 1998, SPTRFA paid retirees a "13th check" as a postretirement adjustment. Under this approach, the pension plan typically used a formula that included an investment return sharing feature, to pay retirees an
90%
100%
110%
120%
130%
140%
150%
160%
19901991199219931994199519961997199819992000200120022003200420052006200720082009201020112012201320142015201620172018201920202021
MSRS General PERA General TRA Benefit Increased by CPI-W
MN LCPR COLA Study Report
Sec. IV. Minnesota’s postretirement adjustments and protection against inflation Page 28
extra check each year to help with the rising cost of living. As a result, cohorts retiring prior to 2000 received significantly higher purchasing power protection than those retiring later under a fixed 1% COLA system.
Figure 11 also illustrates how macroeconomic events affecting inflation can have a long-lasting and arbitrary effect on a benefit’s purchasing power. In each of the plans, retirees who retired in 2009 are better off than those who retired in either 2008 or 2010. This is because in 2009 the U.S. experienced a brief deflationary period. As a result, those who retired just prior to this short deflationary period experienced an immediate increase in the purchasing power of their benefit, as their fixed rate COLA was greater than the real rate of inflation that year. The impact of compounding causes a magnification of early changes and, thus, 2009 stands out on Figure 11. We note that retirees who retired prior to 2009 benefited as well from the deflation in 2009, but Figure 11 does not illustrate that fact.
Perhaps the most important takeaway from Figure 11 is that all of the retirees from the State’s three largest retirement plans have maintained purchasing power that is better than 90% of inflation. This outcome is despite having postretirement adjustments that are not tied to inflation since 2009. Practically, this means that a member whose initial monthly benefit was $2,000 per month has a purchasing power that is greater than $1,800 per month today.
Finally, we note that the majority of retirees in the plans shown in Figure 11 retired in 2000 or later. An analysis of 2017 retirees submitted to the Commission by the Statewide Pension Plans showed that of 208,056 retirees, 57,829 retired before the year 2000. In the years since, the number of pre-2000 retirees has further decreased.
Retirees in the Public Safety and Judges Plans
We did a similar analysis for the public safety plans and the Judges Plan. We looked at how retiree benefits have maintained purchasing power depending on the year in which a member retired. Figure 12 shows that members of the public safety plans and Judges Plan are very similarly situated as those in the general and teacher plans. One minor difference is that the State Patrol Plan and PERA Police and Fire Plan are nearly identical.31 Perhaps more notably, retirees in the two correctional plans and the Judges Plan have maintained benefits that are near or above 100% of the purchasing power of their starting benefit. This is due to having maintained higher postretirement adjustment rates than the other statewide plans.
31 In 2011 and 2012 the PERA P&F Plan had a 1.0% postretirement increase, while the State Patrol Plan had a 1.5% increase.

MN LCPR COLA Study Report
Sec. IV. Minnesota’s postretirement adjustments and protection against inflation Page 29
Figure 12: Public Safety and Judges Plan Retiree Benefits as a Percentage of Purchasing Power by Year Retired
B. How well will current postretirement adjustments protect against inflation in the future?
Retirees in the MSRS and PERA General Plans, TRA, and SPTRFA
This section makes projections about what will happen in certain scenarios.
In Figure 13 and Figure 14, we assumed that inflation is 2.5% for each of the next 20 years, starting in 2021.32 Figure 13 looks just at retirees who retired in 2011 and projects how the purchasing power of their benefit will be affected based on the current postretirement adjustments in law and assuming 2.5% inflation. Figure 13 starts with the purchasing power for 2011 retirees from Figure 11. For example, a person who retired in 2011 and received a benefit from TRA has a benefit in 2021 with a purchasing power that is 97% of the retiree’s initial starting benefit. If inflation is 2.5% for each of the next 20 years and the TRA retiree receives the current postretirement increases, then in 20 years, the retiree’s benefit will have a purchasing power that is about 78% of the initial benefit. Figure 14 does the same analysis except that it looks at retirees who retire in 2021.
32 2.5% is the assumed rate of inflation for each of the statewide plans and SPTRFA, except for the PERA General and MSRS
General plans, which changed their assumption from 2.5% to 2.25% during the 2020 legislative session.
90%
100%
110%
120%
130%
140%
150%
160%
19901991199219931994199519961997199819992000200120022003200420052006200720082009201020112012201320142015201620172018201920202021
State Patrol MSRS State CorrectionalPERA P&F PERA Local Government CorrectionalBenefit Increased by CPI-W Judges

MN LCPR COLA Study Report
Sec. IV. Minnesota’s postretirement adjustments and protection against inflation Page 30
Figure 13: Projected Purchasing Power Over 20 Years for 2011 Retirees and Assuming 2.5% Inflation
Figure 14: Projected Purchasing Power Over 20 Years for 2021 Retirees and Assuming 2.5% Inflation
50%
55%
60%
65%
70%
75%
80%
85%
90%
95%
100%
105%
2021
2022
2023
2024
2025
2026
2027
2028
2029
2030
2031
2032
2033
2034
2035
2036
2037
2038
2039
2040
2041
Assumed Inflation MSRS General Increase PERA General Increase
TRA Increase SPTRFA Increase
50%
55%
60%
65%
70%
75%
80%
85%
90%
95%
100%
105%2021
2022
2023
2024
2025
2026
2027
2028
2029
2030
2031
2032
2033
2034
2035
2036
2037
2038
2039
2040
2041
Assumed Inflation MSRS General Increase PERA General IncreaseTRA Increase SPTRFA Increase

MN LCPR COLA Study Report
Sec. IV. Minnesota’s postretirement adjustments and protection against inflation Page 31
While using a flat 2.5% inflation assumption reflects the plans’ assumptions, in reality, inflation changes from year to year. Figure 15 illustrates the same buying power projection as Figure 14, but uses the inflation experience33 from the last 20 years instead of a flat 2.5% inflation rate. Inflation experience over the past 20 years averages to 2.04% per year. This scenario would result in slightly more favorable outcomes for retirees over the next 20 years, in part because the applied inflation rate is almost half a percent less than the pension plans’ assumed rate.
Figure 15: Projected Purchasing Power Over 20 Years for 2021 Retirees and Assuming Last 20 Years Inflation Experience
Generally, these graphs show that current retirees should expect continued erosion of their benefits’ purchasing power over the next 20 years, because the postretirement adjustments in current law are less than the assumed rate of inflation. Under the postretirement adjustment changes in the 2018 Pension Reform Act, retirees in the MSRS and PERA General Plans, TRA, and SPTRFA can similarly expect that within 20 years their benefits’ purchasing power will have eroded by 10% to 25%, depending on the retiree’s specific plan and on actual inflation experience. If we were to experience a period of higher-than-expected inflation, retirees’ purchasing power could be more meaningfully reduced.
Retirees in the Public Safety and Judges Plans
We performed the same analysis for the public safety plans and the Judges Plan (Figure 16, Figure 17, and Figure 18).
33 See Figure 9: 20-Year Comparison of CPI-W, R-CPI-E, and CPI-U.
50%
55%
60%
65%
70%
75%
80%
85%
90%
95%
100%
105%
2021
2022
2023
2024
2025
2026
2027
2028
2029
2030
2031
2032
2033
2034
2035
2036
2037
2038
2039
2040
2041
Assumed Inflation MSRS General Increase PERA General IncreaseTRA Increase SPTRFA Increase

MN LCPR COLA Study Report
Sec. IV. Minnesota’s postretirement adjustments and protection against inflation Page 32
Figure 16: Projected Purchasing Power Over 20 Years for 2011 Retirees and Assuming 2.5% Inflation
Figure 17: Projected Purchasing Power Over 20 Years for 2021 Retirees and Assuming 2.5% Inflation
50%
55%
60%
65%
70%
75%
80%
85%
90%
95%
100%
105%
2021
2022
2023
2024
2025
2026
2027
2028
2029
2030
2031
2032
2033
2034
2035
2036
2037
2038
2039
2040
2041
Assumed Inflation MSRS State CorrectionalState Patrol PERA P&FPERA Local Government Correctional Judges
50%
55%
60%
65%
70%
75%
80%
85%
90%
95%
100%
105%
2021
2022
2023
2024
2025
2026
2027
2028
2029
2030
2031
2032
2033
2034
2035
2036
2037
2038
2039
2040
2041
Assumed Inflation State PatrolMSRS State Correctional PERA P&FPERA Local Government Correctional Judges

MN LCPR COLA Study Report
Sec. IV. Minnesota’s postretirement adjustments and protection against inflation Page 33
Figure 18: Projected Purchasing Power Over 20 Years for 2021 Retirees and Assuming Last 20 Years Inflation Experience
Figures 16 through 18 show similar results as for the MSRS and PERA General Plans, TRA, and SPTRFA. One difference is that, unlike any of the other plans, the PERA Local Government Correctional Plan maintains rough parity with inflation. This is true as long as inflation remains at or below 2.5%. The graphs also show that the State Patrol and Police and Fire Plans are likely to lag the furthest behind inflation. Since those plans are not coordinated with Social Security, members of the State Patrol and Police and Fire Plans may be particularly vulnerable to the effects of inflation. This issue is addressed in greater depth in the next section.
C. Comparing inflation protection for coordinated and basic members
A "basic" plan is a plan in which the members (referred to as "basic members") do not contribute to Social Security from their covered salary and their covered salary is not counted when determining any Social Security benefit to which they may be entitled due to other employment. The State Patrol Plan, Police and Fire Plan, and Legislators Plan are the only public pension plans in Minnesota with only basic members. The vast majority of active basic members in Minnesota are in one of these plans.
The remaining basic members are in the PERA General Plan, TRA, SPTRFA, and the former Minneapolis Employees Retirement Fund ("MERF"), now part of the PERA General Plan. As of June 30, 2019, these plans had a total of 42 active and deferred basic members and 9,721 recipients of a basic retirement or disability pension. Basic members in these plans were first
50%
55%
60%
65%
70%
75%
80%
85%
90%
95%
100%
105%
2021
2022
2023
2024
2025
2026
2027
2028
2029
2030
2031
2032
2033
2034
2035
2036
2037
2038
2039
2040
2041
Assumed Inflation State PatrolMSRS State Correctional PERA P&FPERA Local Government Correctional Judges

MN LCPR COLA Study Report
Sec. IV. Minnesota’s postretirement adjustments and protection against inflation Page 34
hired before the plans became coordinated with Social Security (generally before 1980). Basic members receive a larger benefit, due to a more generous formula, and make larger contributions than they would if they also received Social Security.
When it comes to inflation protection, generally, coordinated members have an advantage over basic members because Social Security benefits are adjusted for inflation by an annual COLA. If, for example, inflation increases by 3% in 2022, then a coordinated member of TRA would see their TRA benefit increase by 1% and their Social Security benefit increase by 3%. Thus, the Social Security portion of the coordinated benefit is fully protected from inflation and the coordinated member’s total protection from inflation is greater than just the TRA postretirement adjustment amount. Basic members, on the other hand, do not receive the Social Security COLA and thus receives less inflation protection.
Figure 19: Projected Benefit of Coordinated vs Basic Benefit; Assuming 2.5% Inflation, 1% Postretirement Adjustment,
Starting Benefit of $3,400 ($1,900-plan, $1,500 SSA)
Figure 19 compares a coordinated plan member with a basic plan member. The coordinated member and the basic member both receive a 1% postretirement adjustment over 30 years from the pension plan, but actual inflation is 2.5%. The coordinated member also receives a 2.5% COLA on the member’s Social Security benefit. The coordinated member’s starting pension benefit is $1,900 per month (approximately the average starting benefit for a member of one of the general or teacher plans) and $1,500 per month from Social Security (approximately the 2020 average Social Security starting benefit), for a combined monthly income of $3,400. The basic member’s starting pension benefit is $3,400, paid solely from the pension plan. After 20 years of COLAs, the coordinated member’s combined monthly benefit exceeds the basic member’s benefit by $630.
$0
$1,000
$2,000
$3,000
$4,000
$5,000
$6,000
0 1 2 3 4 5 6 7 8 9 10 11 12 13 14 15 16 17 18 19 20 21 22 23 24 25 26 27 28 29 30
Years Since Retirement
Coordinated Member Benefit Coordinated Member SSA benefit
Basic Member Benefit Combined Coordinated Benefit

MN LCPR COLA Study Report
Sec. IV. Minnesota’s postretirement adjustments and protection against inflation Page 35
After 30 years, the coordinated member’s combined monthly benefit exceeds the basic member’s monthly benefit by $1,125.
As Figure 19 illustrates, basic members receive smaller increases over time than coordinated members because of the COLAs on their Social Security benefit. Basic members are thus more vulnerable to a loss of purchasing power due to inflation. Furthermore, members of the public safety plans, especially the State Patrol or Police and Fire Plans, may be especially vulnerable to inflation because they have an earlier normal retirement age. Thus, the average public safety plan member is expected to collect a benefit as much as ten years longer than the average member of one of the general or teacher plans and may experience an additional decade of benefit erosion due to inflation. Moreover, the State Patrol and Police and Fire Plans currently pay a postretirement adjustment of 1%, which is tied (along with the SPTRFA) for the lowest postretirement adjustment rate for Minnesota’s public pension plans. These factors make the members of the State Patrol and Police and Fire Plans the most vulnerable of the statewide plans to a loss of purchasing power due to inflation.
Any proposed modification of the State Patrol and Police and Fire Plans’ postretirement adjustment should consider the plan members’ vulnerability to inflation. However, we recognize that vulnerability to inflation is only one factor among many affecting benefit sufficiency. There are several factors that may cause the State Patrol and Police and Fire Plans to prioritize other plan features. For example, the plans have higher average initial benefits than do the general and teacher plans, and the plans’ members may also have unique pre-career and post-career employment patterns.34 Weighing the relative merits of various plan features is beyond the scope of this report.
Implications for Coordinated Plans
Since Social Security provides coordinated plan members with protection against inflation, it makes sense to consider how much protection is provided to the average coordinated member when considering the two benefits together. Figure 20 illustrates the same scenario as Figure 19 but this time looking only at the coordinated benefits and as a percentage of purchasing power. In the scenario, the member is receiving $1,500 from Social Security increased at the rate of inflation and $1,900 from the pension plan increased at 1%.
34 In 2020, the State Patrol Plan had an average monthly initial benefit of $4,468 per month and the Police and Fire Plan had
an average monthly initial benefit of $4,971.

MN LCPR COLA Study Report
Sec. IV. Minnesota’s postretirement adjustments and protection against inflation Page 36
Figure 20: Comparing Coordinated Plan Benefit With and Without Social Security as a Percentage of Inflation at 2.5%
If looking at only the pension benefit, at 20 years after retirement, the pension benefit has a purchasing power of 74% of the initial benefit and, at 30 years after retirement, purchasing power is 64% of the initial benefit. But if considering the combined pension and Social Security benefit, at 20 years after retirement, the combined benefit has a purchasing power of 86% of the initial combined benefit and, at 30 years after retirement, purchasing power is 80% of the initial combined benefit. In short, Social Security provides a significant mitigating effect to loss of purchasing power, especially in later years.
Finally, we note that the amount of protection attributable to Social Security is not consistent from person to person. This is because the way that Social Security benefits are calculated is different from the way pension benefits are calculated. For example, Social Security currently has a maximum benefit of around $3,000 per month. As a result, high-earning public employees max out their social security earnings and benefit which leads to high-earning public employees receiving a larger portion of their combined benefit from their pension plan, rather than from Social Security. This means that high-earning public employees will have a smaller percentage of their combined benefit that is fully protected from inflation. Furthermore, Social Security calculates its benefits using a lifetime average salary calculation, whereas the statewide plans use a highest 5-year average salary. This means that differences between individuals’ career progressions are reflected in the Social Security benefit but typically only the last - and highest paid - position is reflected in the pension plan benefit. Thus, while Social Security benefits meaningfully offset some of the effects of inflation, the amount of inflation protection provided is different from person to person.
50%
55%
60%
65%
70%
75%
80%
85%
90%
95%
100%
105%
0 1 2 3 4 5 6 7 8 9 10 11 12 13 14 15 16 17 18 19 20 21 22 23 24 25 26 27 28 29 30
Years Since Retirement
Initial Benefit with Inflation Set to 100% Coordinated Plan Benefit AloneCombined Plan and SSA Benefit

MN LCPR COLA Study Report
Sec. V. Fixed vs. variable: Is the new PERA method better? Page 37
V. Fixed vs. variable: Is the new PERA method better? The 2018 Pension Reform Act changed PERA’s method for calculating its postretirement benefit from a fixed-percentage increase (1% for the PERA General and 2.5% for the PERA Correctional Plans) to an increase that is variable and linked to inflation (subject to a minimum and maximum). The changes are detailed in Section II and summarized in Figure 21.
Figure 21: PERA General and Correctional Fixed vs. Tied COLA
Pre-2018 (Old) Method Post-2018 (New) Method PERA-General 1% Annual Increase 1/2 of Social Security increase;
between 1% and 1.5% PERA-Correctional 2.5% Annual Increase Equal to social security increase;
between 1% and 2.5%. This section analyzes whether the 2018 changes to the method for determining the postretirement adjustment each year in the PERA General and Correctional Plans (1) makes the pension benefit less vulnerable to inflation; and (2) improves intergenerational inequity. We note that these two factors are independent and, under certain circumstances, may be at odds with each other. For example, a COLA method could provide for insufficient inflation protection, yet high generational equity by treating all cohorts equally over time. This report does not make a value judgment regarding which factor is more important.
A. Vulnerability to inflation
The 2018 Pension Reform Act made minor changes to how vulnerable to inflation both the PERA General and Correctional Plans are. In the case of PERA General, the new model provides slightly better inflation protection. In the case of PERA Correctional, the new model provides slightly worse inflation protection. The effect of the changes is shown in Figure 22 and Figure 23. Ultimately, the absolute amount of the postretirement increase has a much larger effect on the degree of inflation protection than whether or not the calculation method for calculating the increase is linked to inflation, particularly when caps are used to limit the total amount that can be paid.
The 2018 changes make the PERA General Plan less vulnerable to the effects of inflation. Under the new method, if inflation is at or below 2%, the plan pays a 1% postretirement increase, which is equal to the postretirement increase that would have been paid under the old method. If, however, inflation is greater than 2%, then the postretirement increase will be greater than 1% and will offer a somewhat improved protection against inflation. Figure 22 shows three scenarios based on different assumed inflation rates. In the first scenario, inflation increases at 2.5%, the second at 1.5%, and the third at 3.5%. In all three, members’ purchasing power was maintained or improved under the new method.

MN LCPR COLA Study Report
Sec. V. Fixed vs. variable: Is the new PERA method better? Page 38
Figure 22: PERA General, Comparing Purchasing Power for the Old Method and New Method
PERA’s actuary assumes that the average future postretirement increase will be 1.25%. This is based on running several scenarios but assumes a long-term inflation rate of 2.5%.35 PERA’s postretirement increase assumption may be adjusted in the 2020 valuation because the Commission approved adoption of a lower inflation assumption during the 2020 session. Regardless of actual future inflation, members of the PERA General Plan will be the same or
35 PERA General Employees Retirement Plan Actuarial Valuation Report (2019), p. 4,
www.lcpr.leg.mn//documents/valuations/2019/2019.valuation.pera.general.pdf.
50%
55%
60%
65%
70%
75%
80%
85%
90%
95%
100%
105%
110%
115%
120%
125%
0 1 2 3 4 5 6 7 8 9 10 11 12 13 14 15 16 17 18 19 20
Years Since Retirement
Scenario 1 - 2.5% Inflation: New Method Scenario 1 - 2.5% Inflation: Old MethodScenario 2 - 1.5% Inflation: New Method Scenario 2 - 1.5% Inflation: Old MethodScenario 3 - 3.5% Inflation: New Method Scenario 3 - 3.5% Inflation: Old MethodInflation set to 100%
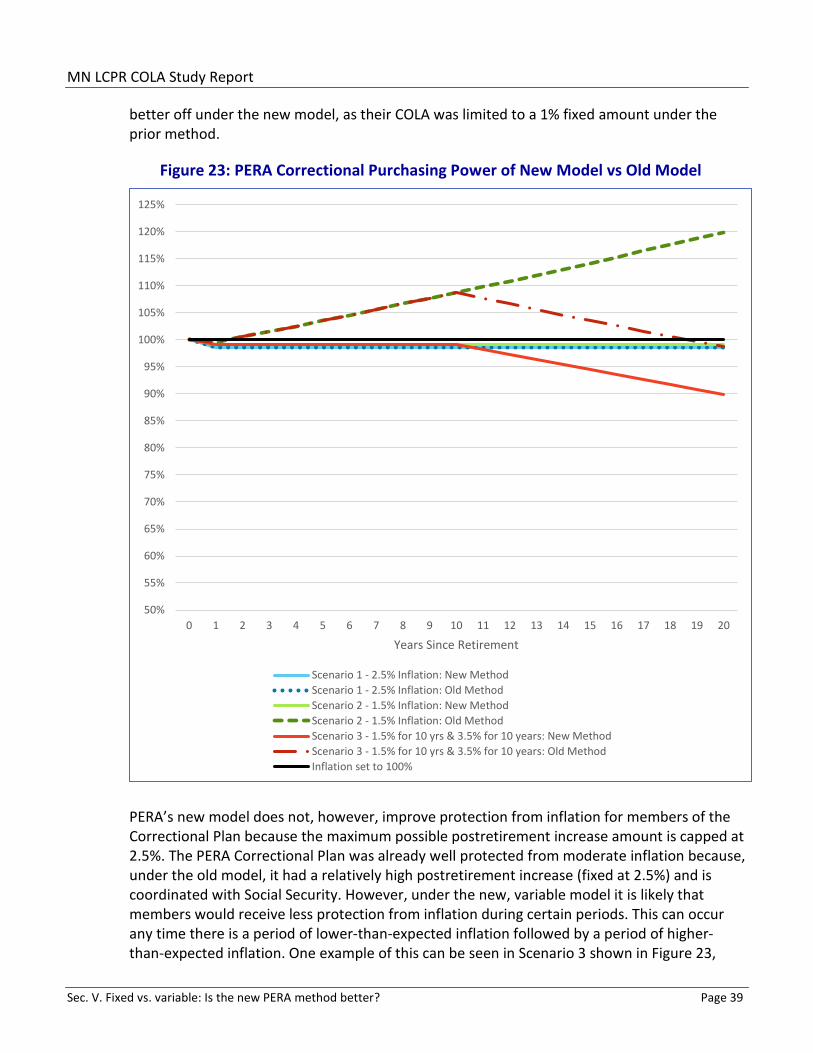
MN LCPR COLA Study Report
Sec. V. Fixed vs. variable: Is the new PERA method better? Page 39
better off under the new model, as their COLA was limited to a 1% fixed amount under the prior method.
Figure 23: PERA Correctional Purchasing Power of New Model vs Old Model
PERA’s new model does not, however, improve protection from inflation for members of the Correctional Plan because the maximum possible postretirement increase amount is capped at 2.5%. The PERA Correctional Plan was already well protected from moderate inflation because, under the old model, it had a relatively high postretirement increase (fixed at 2.5%) and is coordinated with Social Security. However, under the new, variable model it is likely that members would receive less protection from inflation during certain periods. This can occur any time there is a period of lower-than-expected inflation followed by a period of higher-than-expected inflation. One example of this can be seen in Scenario 3 shown in Figure 23,
50%
55%
60%
65%
70%
75%
80%
85%
90%
95%
100%
105%
110%
115%
120%
125%
0 1 2 3 4 5 6 7 8 9 10 11 12 13 14 15 16 17 18 19 20
Years Since Retirement
Scenario 1 - 2.5% Inflation: New MethodScenario 1 - 2.5% Inflation: Old MethodScenario 2 - 1.5% Inflation: New MethodScenario 2 - 1.5% Inflation: Old MethodScenario 3 - 1.5% for 10 yrs & 3.5% for 10 years: New MethodScenario 3 - 1.5% for 10 yrs & 3.5% for 10 years: Old MethodInflation set to 100%

MN LCPR COLA Study Report
Sec. V. Fixed vs. variable: Is the new PERA method better? Page 40
which shows what might happen if the plan experienced ten years of lower-than-expected inflation followed by ten years of greater-than-expected inflation. As well, in any particular year, retirees could receive a lower annual adjustment versus the old method because the new method can produce an adjustment as low as 1%. PERA’s actuary assumes that the plan will pay an average increase of 2% per year, based on simulations assuming a 2.5% inflation assumption.36
B. Intergenerational equity
Intergenerational equity is the idea that members in a plan should receive benefits commensurate with the contributions made during their own service and not have to pay for earlier or subsequent generations of employees. Regarding postretirement adjustments, it refers to each retiree cohort receiving equal protection from inflation over time. As illustrated earlier in Figure 11, the large postretirement increases paid in the 1990s led to generational inequity. For example, all else being equal, a retiree from a statewide plan who retired in 1998 has a benefit that is worth about 20% more than if that same retiree had lived, worked, and retired 20 years later in 2018. In this example, the 2018 retiree also paid higher contribution rates for the lower benefit because the employer and employee contribution rates were raised (in part) to pay off the earlier generation’s postretirement increases.
Intergenerational equity also affects taxpayers in much the same way that it affects members. In the example above, the ultimate payor of employer and employee contributions is the taxpayer who may experience either an increase in taxes or a reduction in government services when contribution rates increase.
As a step toward addressing generational equity, in 2018, PERA advocated for changing the method of calculating the postretirement adjustment. For this study, PERA provided a comparative analysis of the new and old methods of calculating postretirement adjustments.
Figure 24 shows the results of PERA’s analysis of intergenerational equity by comparing two cohorts of retirees who retire 10 years apart. PERA’s analysis:
• Measures the difference (gap) between the two cohorts after 10 years and then again after 20 years for each of the three inflation scenarios, by comparing the percentage of the inflation-adjusted benefit to the actual benefit as adjusted by the postretirement adjustment for one cohort to this percentage for the other cohort.
• Compares the analysis under three different methods for providing a postretirement benefit: new method for the PERA General Plan, the old method for the PERA General Plan, and the new method for the PERA Correctional Plan.
For example, under the new method, if inflation is a fixed 2.25%, then after ten years of receiving a benefit the retirees in the younger cohort will have a purchasing power that is 90%
36 PERA General Employees Retirement Plan Actuarial Valuation Report (2019), p. 4,
www.lcpr.leg.mn/documents/valuations/2019/2019.valuation.pera.correctional.pdf.
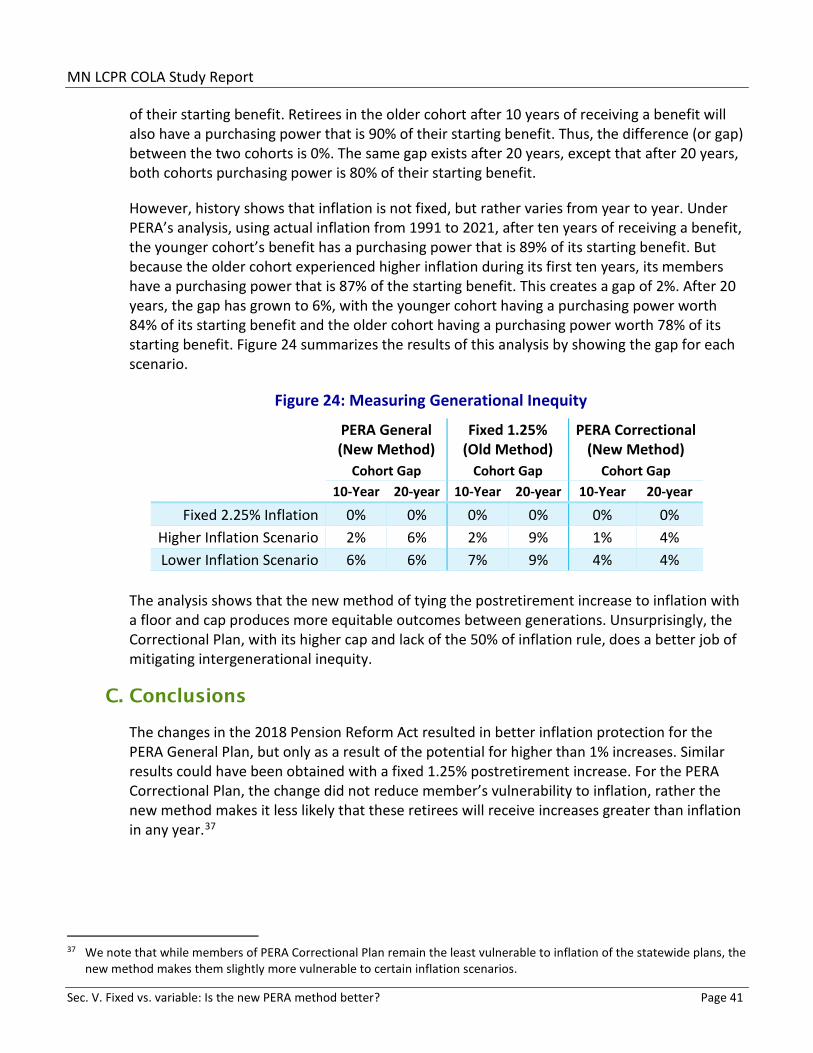
MN LCPR COLA Study Report
Sec. V. Fixed vs. variable: Is the new PERA method better? Page 41
of their starting benefit. Retirees in the older cohort after 10 years of receiving a benefit will also have a purchasing power that is 90% of their starting benefit. Thus, the difference (or gap) between the two cohorts is 0%. The same gap exists after 20 years, except that after 20 years, both cohorts purchasing power is 80% of their starting benefit.
However, history shows that inflation is not fixed, but rather varies from year to year. Under PERA’s analysis, using actual inflation from 1991 to 2021, after ten years of receiving a benefit, the younger cohort’s benefit has a purchasing power that is 89% of its starting benefit. But because the older cohort experienced higher inflation during its first ten years, its members have a purchasing power that is 87% of the starting benefit. This creates a gap of 2%. After 20 years, the gap has grown to 6%, with the younger cohort having a purchasing power worth 84% of its starting benefit and the older cohort having a purchasing power worth 78% of its starting benefit. Figure 24 summarizes the results of this analysis by showing the gap for each scenario.
Figure 24: Measuring Generational Inequity
PERA General (New Method)
Fixed 1.25% (Old Method)
PERA Correctional (New Method)
Cohort Gap Cohort Gap Cohort Gap 10-Year 20-year 10-Year 20-year 10-Year 20-year
Fixed 2.25% Inflation 0% 0% 0% 0% 0% 0% Higher Inflation Scenario 2% 6% 2% 9% 1% 4% Lower Inflation Scenario 6% 6% 7% 9% 4% 4%
The analysis shows that the new method of tying the postretirement increase to inflation with a floor and cap produces more equitable outcomes between generations. Unsurprisingly, the Correctional Plan, with its higher cap and lack of the 50% of inflation rule, does a better job of mitigating intergenerational inequity.
C. Conclusions
The changes in the 2018 Pension Reform Act resulted in better inflation protection for the PERA General Plan, but only as a result of the potential for higher than 1% increases. Similar results could have been obtained with a fixed 1.25% postretirement increase. For the PERA Correctional Plan, the change did not reduce member’s vulnerability to inflation, rather the new method makes it less likely that these retirees will receive increases greater than inflation in any year.37
37 We note that while members of PERA Correctional Plan remain the least vulnerable to inflation of the statewide plans, the
new method makes them slightly more vulnerable to certain inflation scenarios.

MN LCPR COLA Study Report
Sec. VI. Variations on COLA design Page 42
Perhaps the more interesting question is whether the structure of tying the increase to inflation is a more equitable intergenerational approach. The analysis shows that it produces somewhat more equitable benefits between generational cohorts.
The obvious follow-up question is whether the moderate improvement in intergenerational equity is a reason for the other statewide plans and SPTRFA to adopt a similar model for their postretirement benefits. While the improvements in intergeneration equity are demonstrable and measurable, they do not appear to be significant except perhaps for plans with a postretirement adjustment that is close to the inflation assumption. Currently the only plan that applies to is the PERA Correctional Plan. Ultimately, whether the moderate improvement in intergenerational equity is a sufficient reason to adopt the PERA approach for the other statewide plans and SPTRFA is a policy question for the Legislature.
Finally, we note that intergenerational equity is not merely a member issue, but also affects taxpayers who ultimately fund the contributions to these plans.
VI. Variations on COLA design Minnesota’s postretirement adjustment benefit belongs to a family of pension benefits that are generally referred to as a cost of living adjustment or COLA. There are far too many variations in COLA benefits to provide an analysis of them all. Instead, this section sets forth a description of common COLA features found in the United States, including a handful of specific case studies outlining particularly interesting approaches in other states. This section also takes a brief look at trends in both the public and private sector pension plans and what lessons can be drawn from those experiences. This section is intended to be a resource for policy makers should they want to explore other possibilities for structuring postretirement adjustments in Minnesota’s public pension plans.
A. COLAs, generally
Traditionally, the basic purpose of COLA benefits is to reduce or eliminate the erosion of pension benefits’ purchasing power due to inflation. Perhaps the most well-known example of a COLA benefit comes from Social Security. Under federal law enacted in 1972,38 the Social Security Administration increases the previous years’ benefit by a percentage equal to the increase in inflation measured by the Consumer Price Index for Urban Wage Earners and Clerical Workers ("CPI-W"). For example, if a retiree received $1,000 per month last year and the amount being paid by consumers for a number of goods and services as measured by CPI-W increases by 3%, then the retiree's Social Security benefit will increase by 3% to $1,030 per month. As a result, the retiree’s Social Security benefit would be expected to allow the retiree to purchase roughly the same amount of goods and services for the rest of the retiree's life.
Around the country, COLA benefits are commonly found in public employee pension plans. A survey of statewide public pension plans published in 2020 by The National Association of
38 Social Security Amendments of 1972, Public Law 92-603.
MN LCPR COLA Study Report
Sec. VI. Variations on COLA design Page 43
State Retirement Administrators ("NASRA") found that of the 100 systems surveyed, 72 provided some type of automatic COLA benefit.
Although COLA benefits are common plan features, the ways in which they are structured and function vary considerably from state to state. Despite significant variation, COLA benefits can be generally categorized as follows: (1) inflation-based, (2) investment-performance-based, (3) fixed, or (4) ad hoc.
1. An inflation-based COLA is an annual increase where the amount of the increase is determined by the applicable rate of inflation. Given the high cost of such adjustments, there are often limits on the amount of the increase, such as the increase might be capped at 5% or limited to one-half of the inflation rate. For example, the PERA General and Correctional Plans currently have postretirement adjustments that are inflation-based. The postretirement adjustment for the PERA General Plan is one-half the rate of inflation as determined by the Social Security Administration; for the PERA Correctional Plan, the postretirement adjustment is equal to inflation. A 1% floor applies to both plans. The minimum annual postretirement adjustment is 1% and the maximum is 1.5% for the General Plan and 2.5% for the Correctional Plan.
2. An investment-performance-based COLA is arguably not a COLA at all but rather a method of sharing investment returns in excess of the assumed rate of return or another specified threshold. Because an investment-performance-based COLA is not tied to inflation, it may yield benefit increases that differ significantly from inflation. Perhaps the most well-known example of an investment-performance-based COLA comes from the Wisconsin Retirement System, which adjusts its member’s annuities, either up or down, depending on whether and by how much the investment performance exceeded or fell short of expected performance. The Wisconsin structure results in benefit increases in years where strong investment performance is realized (in 2019, annuities were increased by 1.7%); it also results in decreases in years where negative investment performance is realized (following the Great Recession, in 2012, annuities were reduced by 9.6%).39 A more detailed description of Wisconsin’s COLA structure is described in the Case Study section.
3. A fixed COLA provides a consistent increase and is set by law or a governing entity. Several of Minnesota’s statewide plans have a postretirement adjustment that falls into this category. For example, Minnesota law requires TRA Teachers to increase eligible members’ annuities by 1% each year until 2024, when the rate will increase by an additional 0.1% each year until 2028.40
4. An ad hoc COLA exists where the relevant state legislature has granted authority to the retirement system’s governing board or other entity to determine whether to pay a COLA in a particular year. The legislature may also grant authority to determine how much of an increase will be payable or may place various restrictions on when and how large of an
39 WISCONSIN RETIREMENT SYSTEM, Annual Returns, Rates and Adjustments, etf.wi.gov/wrs-performance/annual-returns-
rates-and-adjustments, Accessed 10/30/2020. 40 Minn. Stat. § 356.415, Subd. 1d.
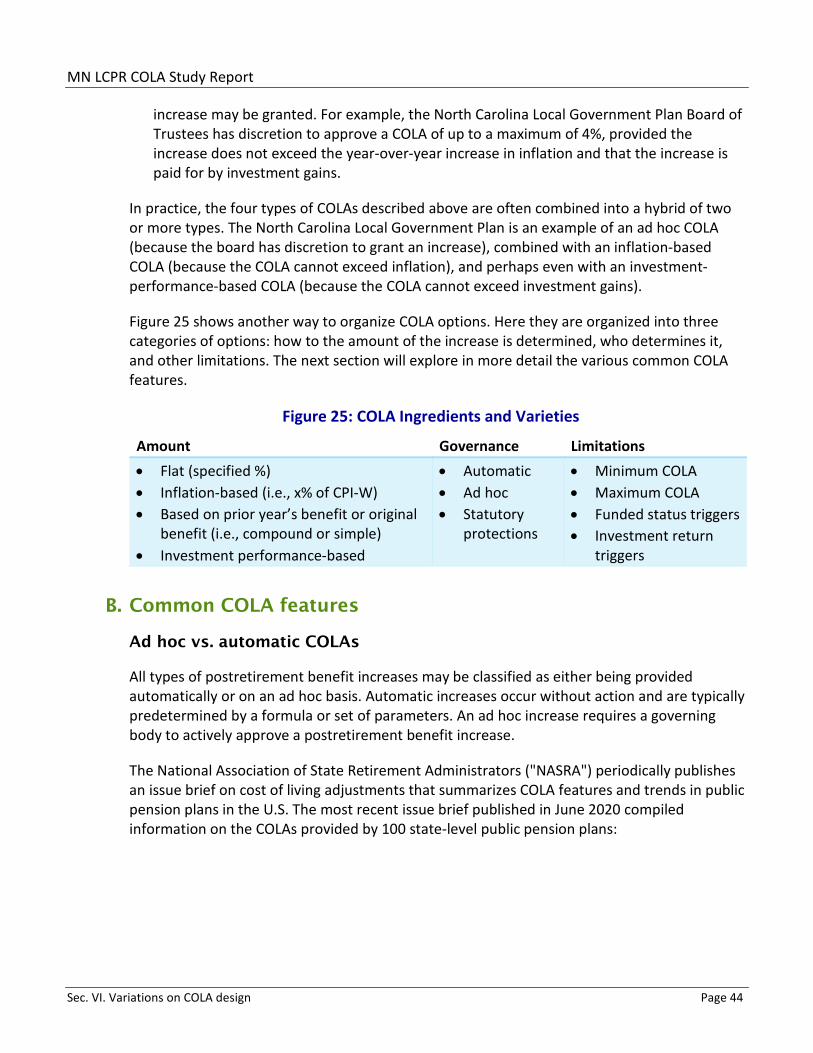
MN LCPR COLA Study Report
Sec. VI. Variations on COLA design Page 44
increase may be granted. For example, the North Carolina Local Government Plan Board of Trustees has discretion to approve a COLA of up to a maximum of 4%, provided the increase does not exceed the year-over-year increase in inflation and that the increase is paid for by investment gains.
In practice, the four types of COLAs described above are often combined into a hybrid of two or more types. The North Carolina Local Government Plan is an example of an ad hoc COLA (because the board has discretion to grant an increase), combined with an inflation-based COLA (because the COLA cannot exceed inflation), and perhaps even with an investment-performance-based COLA (because the COLA cannot exceed investment gains).
Figure 25 shows another way to organize COLA options. Here they are organized into three categories of options: how to the amount of the increase is determined, who determines it, and other limitations. The next section will explore in more detail the various common COLA features.
Figure 25: COLA Ingredients and Varieties
Amount Governance Limitations • Flat (specified %) • Inflation-based (i.e., x% of CPI-W) • Based on prior year’s benefit or original
benefit (i.e., compound or simple) • Investment performance-based
• Automatic • Ad hoc • Statutory
protections
• Minimum COLA • Maximum COLA • Funded status triggers • Investment return
triggers
B. Common COLA features
Ad hoc vs. automatic COLAs
All types of postretirement benefit increases may be classified as either being provided automatically or on an ad hoc basis. Automatic increases occur without action and are typically predetermined by a formula or set of parameters. An ad hoc increase requires a governing body to actively approve a postretirement benefit increase.
The National Association of State Retirement Administrators ("NASRA") periodically publishes an issue brief on cost of living adjustments that summarizes COLA features and trends in public pension plans in the U.S. The most recent issue brief published in June 2020 compiled information on the COLAs provided by 100 state-level public pension plans:

MN LCPR COLA Study Report
Sec. VI. Variations on COLA design Page 45
Figure 26: Select Public Plans by COLA type41
Linked to inflation
Linked to Investment or
funding condition
Fixed percentage or other factor Total
Automatic 47 14 11 72 Ad hoc 5 0 23 28
Total 52 14 34 100 Figure 26 includes the PERA General Plan (linked to inflation), the MSRS General Plan (fixed percentage), and TRA (fixed percentage). In prior years, the Minnesota plans may have been classified as linked to investment or funding conditions.
The variety and complexity of approaches has increased over time. Simple formulas are less common, and the approaches used by some plans are difficult to categorize or fit into multiple categories. For example, the South Dakota State Employees Retirement System provides an automatic increase that is tied to inflation but is also dependent on funding condition. The NASRA Issue Brief includes a summary of the provisions applicable to each plan and demonstrates how unique many of the approaches have become.
Importantly, automatic postretirement increases must be included when determining the actuarial accrued liability for each plan. Inclusion of those expected increases helps to ensure the cost of those future increases is included in the actuarially determined contribution. Ad hoc increases are typically not included in liability measurements because they are not certain. However, actuarial standards require that even the slightest pattern of recurring ad hoc increases are considered in plan costs. A plan sponsor cannot avoid recording liabilities by classifying recurring increases as ad hoc unless they truly are ad hoc in nature.
Compounding vs. simple COLAs
Most COLAs are compounding COLAs, which means that the COLA is added to the prior year’s benefit year after year, much like compound interest is added to the principal and accumulated interest from previous periods. The opposite of this approach is a "simple" COLA. A simple COLA is an increase that is calculated based on the retiree’s benefit at the time of his or her retirement (the "base benefit"). According to NASRA’s 2020 Issue Brief on COLAs, some public pension plans have COLAs that contain both features, i.e., they may be "simple" until the retiree reaches a certain age or year into retirement, at which point the COLA becomes a compounding COLA.
Delayed onset or minimum age COLA
Another feature embedded in many COLA provisions is a delayed onset or minimum age requirement. Under this approach, benefit recipients do not qualify for an annual COLA until
41 NASRA Issue Brief: Cost-of-Living Adjustments, June 2020.
MN LCPR COLA Study Report
Sec. VI. Variations on COLA design Page 46
they meet a threshold age requirement, which typically aligns with the plan’s normal retirement age. This feature is found principally in plans that allow members to elect to draw a benefit prior to reaching normal retirement age.
Early retirements can have a meaningful negative impact on a plan’s liabilities if mitigating features are not also included. For example, early retirements typically truncate employer and employee contributions during what is likely the member’s highest-earning years. Early retirement also typically means that the plan must make payments to the benefit recipient for years longer than would have been the case had the recipient waited to draw a benefit until reaching normal retirement age. Adding to the negative impact of early retirement is the cost of awarding a COLA in each year of early retirement, particularly in the case of a compounding COLA.
To mitigate the cost to the plan of early retirement benefits, plans typically apply a discount feature that progressively reduces benefits every year a member is further out from the normal retirement age. In addition, many plans either reduce or eliminate the COLA until normal retirement age. For example, in Minnesota, the 2018 Pension Reform Act delays the commencement of postretirement adjustments under the MSRS General Plan, PERA General Plan, TRA, and SPTRFA until the early retiree reaches normal retirement age.
There are pros and cons to delaying the commencement of COLAs until normal retirement age. One obvious detractor is that from the commencement of early retirement to normal retirement age, the plan offers its members no protection against inflation. And, in the case of a compounding COLA, that negative impact could be meaningful, especially if the member retires as early as age 55.
On the other hand, there are advantages to both members and pension plans in delaying the commencement of COLAs. From a policy perspective, one role that a defined benefit plan serves is to attract and retain a high-quality workforce. To the extent beneficiaries routinely chose to retire early, that goal is compromised, and the economic and policy objectives are misaligned. Increasingly, early retirement is a benefit accessed by a limited subset of members. In particular, as healthcare costs have grown over time, fewer members can afford to retire before qualifying for Medicare benefits. Those who can typically have another source of income or are leaving the system to continue working elsewhere. Where plans must allocate scarce resources, there is a strong policy argument for preserving financial protection for those working to their normal retirement age.
Limited benefit COLA
Some retirement systems provide a COLA only on a specified portion of a retired member’s benefit, rather than on the entire benefit amount. Under Minnesota’s public pension plans, the COLA is provided on the entire benefit amount. Under a limited benefit COLA, the COLA is provided only on the benefit up to a specified annual or monthly amount. For example, under a limited benefit COLA, a 2% COLA would be applied only to the first $20,000 of a member’s annual benefit. The threshold benefit amount would typically depend on whether the member
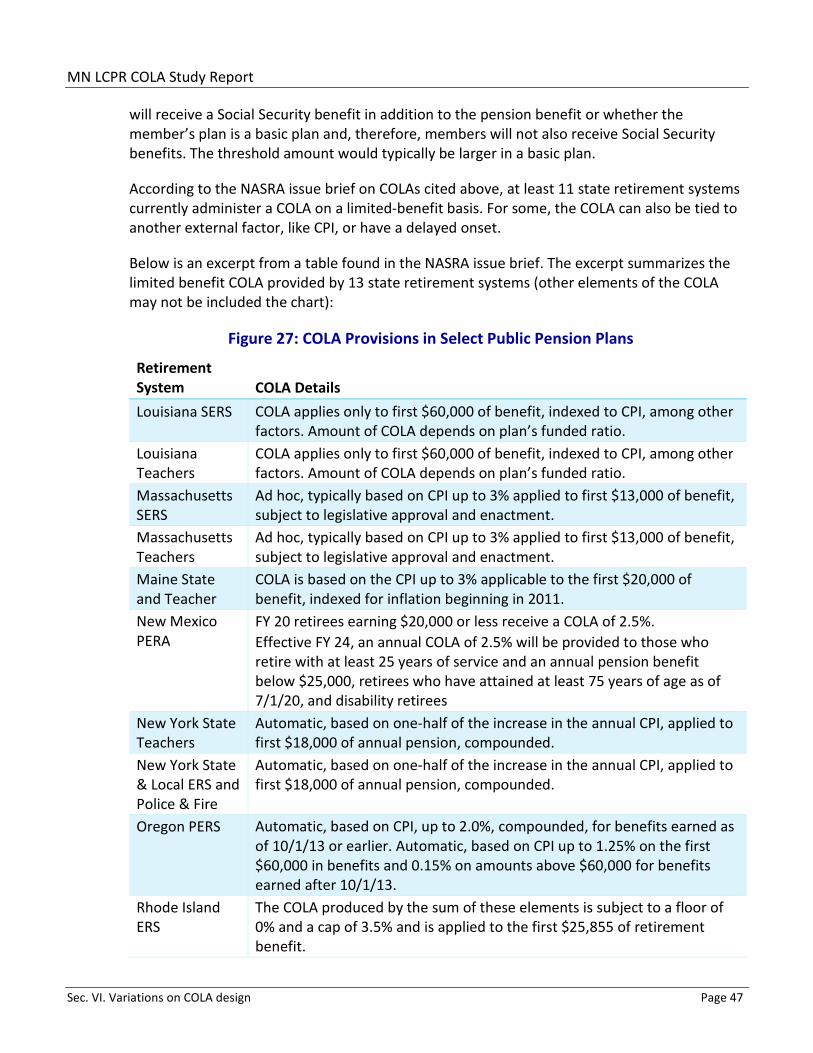
MN LCPR COLA Study Report
Sec. VI. Variations on COLA design Page 47
will receive a Social Security benefit in addition to the pension benefit or whether the member’s plan is a basic plan and, therefore, members will not also receive Social Security benefits. The threshold amount would typically be larger in a basic plan.
According to the NASRA issue brief on COLAs cited above, at least 11 state retirement systems currently administer a COLA on a limited-benefit basis. For some, the COLA can also be tied to another external factor, like CPI, or have a delayed onset.
Below is an excerpt from a table found in the NASRA issue brief. The excerpt summarizes the limited benefit COLA provided by 13 state retirement systems (other elements of the COLA may not be included the chart):
Figure 27: COLA Provisions in Select Public Pension Plans
Retirement System COLA Details Louisiana SERS COLA applies only to first $60,000 of benefit, indexed to CPI, among other
factors. Amount of COLA depends on plan’s funded ratio. Louisiana Teachers
COLA applies only to first $60,000 of benefit, indexed to CPI, among other factors. Amount of COLA depends on plan’s funded ratio.
Massachusetts SERS
Ad hoc, typically based on CPI up to 3% applied to first $13,000 of benefit, subject to legislative approval and enactment.
Massachusetts Teachers
Ad hoc, typically based on CPI up to 3% applied to first $13,000 of benefit, subject to legislative approval and enactment.
Maine State and Teacher
COLA is based on the CPI up to 3% applicable to the first $20,000 of benefit, indexed for inflation beginning in 2011.
New Mexico PERA
FY 20 retirees earning $20,000 or less receive a COLA of 2.5%. Effective FY 24, an annual COLA of 2.5% will be provided to those who retire with at least 25 years of service and an annual pension benefit below $25,000, retirees who have attained at least 75 years of age as of 7/1/20, and disability retirees
New York State Teachers
Automatic, based on one-half of the increase in the annual CPI, applied to first $18,000 of annual pension, compounded.
New York State & Local ERS and Police & Fire
Automatic, based on one-half of the increase in the annual CPI, applied to first $18,000 of annual pension, compounded.
Oregon PERS Automatic, based on CPI, up to 2.0%, compounded, for benefits earned as of 10/1/13 or earlier. Automatic, based on CPI up to 1.25% on the first $60,000 in benefits and 0.15% on amounts above $60,000 for benefits earned after 10/1/13.
Rhode Island ERS
The COLA produced by the sum of these elements is subject to a floor of 0% and a cap of 3.5% and is applied to the first $25,855 of retirement benefit.

MN LCPR COLA Study Report
Sec. VI. Variations on COLA design Page 48
Optional self-funded COLA
Self-funded COLAs are typically offered as another annuity option that may be elected by a member nearing retirement, in the same way that a member can elect a guaranteed five-year annuity or a 100% joint and survivor annuity. Under this design, retiring members elect to receive an actuarially reduced monthly benefit in exchange for a fixed-rate, automatic annual COLA. Some public pension plans, such as the Nebraska State and County Plan and those sponsored by the Kansas Public Employees Retirement System, offer self-funded COLAs as a feature of their newer cash balance plans.42
Other traditional pension plans provide self-funded COLAs as add-ons to standard annuity options. For example, the Wyoming Public Employee Pension Plan offers an option that provides a guaranteed fixed COLA of 1%, 2%, or 3%, commencing after the two-year anniversary of a member’s retirement date. The actuarial reduction is adjusted accordingly for the higher COLA percentages.43
This COLA design places the cost burden onto electing members. When considering their election, retirees assess how long they must collect until the monthly amount of their annuity becomes higher than it would have been under an unreduced benefit. Retirees may nonetheless appreciate the opportunity to receive a COLA, particularly as they age into the statistically more expensive retirement years when health care and long-term care costs rise.
C. Case studies of the COLA experience of Wisconsin, South Dakota, and Colorado
The COLA Study work group interviewed representatives from the Wisconsin Department of Employee Trust Funds ("ETF"), the South Dakota Retirement System ("SDRS"), and the Public Employees’ Retirement Association ("PERA") of Colorado. The questions, answers, and notes from the interviews are attached to this Report as Appendix B.
The interviews allowed the work group to ask questions about different approaches and gain a better understanding of the motivation and context for COLA reforms.
Wisconsin Retirement System
The work group interviewed Matt Stohr, Administrator, Division of Retirement Services, Wisconsin Department of Employee Trust Funds ("ETF"). Wisconsin was selected because (1) it is consistently ranked at the top nationally in lists of the best-funded public pension plans, (2) it is a neighboring state, and (3) it is similar in size to Minnesota’s public pension fund assets and public employee workforce. The Wisconsin Retirement System ("WRS") is part of the ETF.
42 "NASRA Issue Brief: Cost-of-Living Adjustments." June 2020.
www.nasra.org/files/Issue%20Briefs/NASRACOLA%20Brief.pdf 43 "Pension Payout Options" Wyoming Retirement System. Accessed online September 28, 2020.
retirement.state.wy.us/Members/Pension-Payout-Options

MN LCPR COLA Study Report
Sec. VI. Variations on COLA design Page 49
Instead of a COLA, the WRS has a risk-sharing dividend adjustment mechanism for retirees based on investment returns and is designed to maintain full funding. These adjustments are referred to as "annuity adjustments". Annuity adjustments are yearly changes in a retiree ’s monthly pension payment amount for the next 12 months. Payments may increase or decrease based on investment returns. Annuity adjustments are based on investment performance and actuarial factors and are paid from surpluses in the WRS annuity reserves.
Annuity adjustment rates are based on an assumed rate of return on investments of 5%. The annuity adjustment may be higher or lower, depending on whether actual fund performance is above or below 5%. Wisconsin law requires the ETF Board to distribute dividends whenever annuity reserve balances exceed the assumed investment rate of return by at least 0.5%. This annuity adjustment is automatic and is not subject to the legislature or ETF Board, but is a calculation done by the fund’s actuary. The annuity adjustment can be negative, but not below a retiree’s base benefit at the time of retirement, which is the monthly amount determined using the formula based on final average pay, years of service, and a multiplier.
South Dakota Retirement System
The work group interviewed Doug Fiddler, Senior Actuary, South Dakota Retirement System ("SDRS). South Dakota was selected because (1) it is consistently ranked at the top nationally in lists of the best funded public pension plans, (2) it is a neighboring state, and (3) it changed from a fixed COLA to a COLA that is linked to CPI-W, with minimums and maximums, similar to the recent change in PERA’s COLA.
Until 2009, SDRS paid a fixed 3.1% COLA, which constituted about 25% of the annual cost of the system and was determined to be too costly to be sustainable. The legislature adopted a new approach in 2009, which linked the COLA to CPI-W, with a minimum and maximum of 2.1% and 3.1%, respectively. In 2017, the minimum and maximum were adjusted to 0.5% and 3.5%, respectively. The maximum adjusts if the system’s funding ratio changes from the current 100% to ensure that the system remains at 100% funded.
Public Employees Retirement Association ("PERA") of Colorado
The work group interviewed Ron Baker, Executive Director, Colorado PERA. Colorado was selected because (1) it is at the opposite end of the funding spectrum from Wisconsin and South Dakota, but, similar to Minnesota, it took action in 2018 to address chronic underfunding, and (2) is similar in size to Minnesota’s public pension fund assets and public employee workforce.
In 2018, the Colorado legislature suspended the 2018 and 2019 COLA, which is called an "annual increase" or "AI". Beginning in 2020, retirees will not begin receiving an AI until 3 years after retirement their date. In addition, a cost-sharing mechanism was added, which requires automatic adjustments each July 1, as determined by the actuary, to the AI and employer and employee contributions, so retirees, active employees, and employers share in increased costs equally, in equal dollar amounts (not percentages).

MN LCPR COLA Study Report
Sec. VI. Variations on COLA design Page 50
Each member has 1% of pay deducted and deposited in the "annual increase reserve fund." The AI each year is the lesser of CPI-W, 1.25%, or 10% of the AI reserve fund, but cannot be less than 0.5%. The 1.25% cap automatically increases, up to 2%, after a good investment year.
D. Trends in public sector COLAs
Like other plan features, cost of living adjustments within public pension plans have been subject to design and calculation changes. Recent reform trends during the last decade have seen COLA benefits become more conservative and their designs more complex. These changes were made as plan administrators implemented stabilization measures in the wake of nearly universal funding challenges that followed the Great Recession.
Between late 2007 and 2009, public pension plans nationally lost nearly one-third of their value, or $1 trillion.44 The magnitude of this crisis was felt by small and large pension plans alike as their reduced assets translated into rising unfunded liabilities. According to NASRA, nearly every state implemented tailored pension benefit reforms between 2009 and 2018.45 Amidst challenging market conditions and relatively low inflation rates, and in an attempt to distribute stabilization measures across plan membership groups, many plan administrators included COLA adjustments in these changes: six states adjusted COLAs prospectively for future employees, seven states changed future COLAs for currently active employees, and 18 changed COLAs for current retirees.46
COLA changes affecting new employees
Prospective COLA reforms by public pensions in Arizona, Michigan, Mississippi, Nebraska, Nevada, and Utah created tiers of COLA benefits in order to reduce future costs. The differences between these benefit tiers vary because of multiple factors, but the general trend was a reduction in benefits for newer employees. For example, while all members of the Nebraska School Retirement System receive a compounding COLA that is based on CPI and is subject to a cap, this cap is 2.5% for members hired before July 1, 2013, while it is 1% for members hired after that date. The Utah Public Employees Noncontributory Retirement System made a similar change, whereby the CPI-based COLA is capped at 4% for employees hired before July 1, 2011, and 2.5% for those hired after June 30, 2011.47
The Mississippi Public Employee Retirement System applies a combination of simple and compounding COLAs to their retirees’ benefits, but the age at which the COLA goes from simple to compound was pushed back by 2011 legislation. Employees who were hired before July 1, 2011, receive an automatic 3% simple COLA until they reach age 55, at which point the
44 www.federalreserve.gov/releases/z1/20090611/z1.pdf. 45 Brainard, Keith and Alex Brown "Spotlight on Significant Reforms to State Retirement Systems" December 2018.
www.nasra.org/files/Spotlight/Significant%20Reforms.pdf. 46 "NASRA Issue Brief: Cost-of-Living Adjustments." June 2020.
www.nasra.org/files/Issue%20Briefs/NASRACOLA%20Brief.pdf. 47 "NASRA Issue Brief: Cost-of-Living Adjustments." June 2020. Appendix A: COLA Provisions by State-Level Plan and Recent
Changes. www.nasra.org/files/Issue%20Briefs/NASRACOLA%20Brief.pdf.

MN LCPR COLA Study Report
Sec. VI. Variations on COLA design Page 51
COLA becomes compounded. Those in the second tier, who were hired on or after July 1, 2011, receive the same 3% COLA, but it does not begin to compound until age 60.48 This reform therefore changed the impact of the COLA on retirees’ benefits but not the COLA itself.
Michigan Public Schools removed its COLA altogether for employees hired after June 30, 2010, who participate in a hybrid retirement plan rather than a traditional pension. Pre-July 1, 2010 employees who are in the pension plan will receive an automatic 3%, simple COLA on their retirement benefits.
COLA changes affecting current employees
Between 2009 and 2018, public retirement systems in Connecticut, Florida, Kansas, Maryland, Montana, Oregon, and Virginia lowered COLAs for current (and, in some cases, also former) employees. Several systems (such as Oregon Public Employee Retirement System and Maryland PERS and Teachers) created tiers of service credit onto which different increases are applied. Maryland’s COLA also became tied to investment returns.
Effective January 1, 2013, the Virginia Retirement System reduced the COLA cap for non-vested members, from 5% to 3%, and required that early retirees within their system wait at least one year until they receive an increase.
Other states went further and suspended or completely eliminated COLAs for active employees. Beginning in 2011, Maine PERS suspended its COLA for three years and applied a lower cap to future adjustments,49 and the Connecticut State Employees Retirement System suspended its COLA for 2018, 2019, and 2020. 50
The Florida Retirement System terminated its automatic, compounding 3% COLA for all service credit earned after July 1, 2011. The Montana PERS and Teachers systems passed legislation in 2011 to reduce automatic increases for new hires, active members, and retirees and tie it to the plans’ funded ratios. These reforms were challenged in court, however, and only prospectively applied reductions were allowed to stand after a 2015 ruling.
COLA changes affecting current retirees
Minnesota was one of the 18 states that passed reforms to current retiree COLAs between 2009 and 2018. In Washington, the Public Employee Retirement System and Teachers Plan 1 went so far as to eliminate the COLA in 2011. Other states reduced their existing COLAs or changed the metrics by which they were determined. The legality of these reductions was challenged in many cases and upheld in most.51
48 Unless otherwise noted, the data on this page comes from "NASRA Issue Brief: Cost-of-Living Adjustments." June 2020.
Appendix A: COLA Provisions by State-Level Plan and Recent Changes. www.nasra.org/files/Issue%20Briefs/NASRACOLA%20Brief.pdf.
49 www.ncsl.org/research/fiscal-policy/lb-recent-reductions-in-public-pension-colas.aspx. 50 www.ohsers.org/retirees/while-youre-receiving/cost-of-living-adjustment-cola/ 51 www.nasra.org/files/Spotlight/Significant%20Reforms.pdf.

MN LCPR COLA Study Report
Sec. VI. Variations on COLA design Page 52
Increased complexity
As COLA benefits in many public retirement systems were reformed between 2009 and 2018, the complexity of COLA designs increased. Greater sophistication was developed in the nuances of COLA calculation, such as tying the increase to actual rates of inflation. The United States has experienced a relatively low average inflation rate during the last 20 or so years, and the practice of linking COLAs to a measurement of consumer inflation (such as the CPI-W) has become more common.52 According to NASRA’s most recent survey of the 100 largest public pension plans, of the 72 plans with automatic COLAs, 47 are now linked to a reported inflation rate.53
On top of this base measurement tool, caps and floors are sometimes applied to limit the COLA spread, parameters are placed on the benefit amount that is subject to a COLA, and/or the application of an adjustment is made subject to funding or rate of return benchmarks. Some plans use a combination of multiple COLA features to calculate and apply an increase. For example, the South Dakota Retirement System’s three-tiered COLA includes a fixed percentage for one group of members, and two calculations that are tied to CPI-W, with different minimum and maximums for each of the other two groups. The cap is also designed to adjust if the plan’s funded ratio drops below 100%.54
Overall, changes to public sector COLAs have occurred broadly during the last decade as plan sponsors worked to increase the sustainability of their pensions. This has led to the creation of COLA benefit tiers, some suspensions, some eliminations, and much more complexity in the calculation and application of postretirement adjustments.
E. Private sector COLAs
What can we learn from the private sector about COLAs in defined benefit pension plans? As explained in this section, differences between the private sector and the public sector with regard to defined benefit plans, generally, and COLAs, specifically, make the comparison of private sector and public sector somewhat of an "apples to oranges" comparison. Differences include the following:
• Defined benefit plan coverage in the private sector is only a fraction of the defined benefit plan coverage in the public sector.
• COLAs are far less prevalent in private sector pension plans than in public sector pension plans.
52 www.nasra.org/files/Issue%20Briefs/NASRACOLA%20Brief.pdf. 53 NASRA Issue Brief: Cost-of-Living Adjustments" November 2019. - Appendix A: COLA Provisions by State-Level Plan and
Recent Changes. 54 Interview with Doug Fiddler, Senior Actuary, South Dakota Retirement System (SDRS), on Thursday, August 13, 2020.

MN LCPR COLA Study Report
Sec. VI. Variations on COLA design Page 53
• Funding regulations and benefit protections are far more complex and stringent in the private sector than in the public sector.
Based on the scant research and commentary available, it appears that COLAs in private sector defined benefit plans, while never very common, have, for the most part, disappeared for two reasons. First, as full funding requirements tightened, many employers prospectively eliminated non-core benefits, froze future accruals entirely, or terminated their plans. In the private sector, employers that sponsor defined benefit pension plans are subject, under federal law, to substantial penalties if they do not make the annual required minimum funding contribution. Private sector employers do not have the option of maintaining an underfunded defined benefit plan, as public employers do. Private sector minimum funding requirements are also calculated on a much more conservative basis than public sector plans, so the contributions to fund ancillary benefits are comparatively more expensive. This means that private sector employers, if they still sponsor a defined benefit plan at all, have increasingly focused on providing only the core pension benefit. Retaining or adding COLAs would require fully funding them over a short period of time using mandated conservative assumptions.
Second, when an ancillary and expensive benefit cannot be eliminated or reduced from year to year to be responsive to the employer’s reduced financial circumstances or the plan’s poor investment returns, many employers opt to phase out the benefit. Under federal law applicable to private sector retirement plans, "protected benefits" cannot be reduced or eliminated without risking the plan’s qualified status under the Internal Revenue Code. COLAs are considered protected benefits to the extent the COLA relates to the benefit accrued, as that term is used in private sector pension plans.55 Even ad hoc COLAs, given on an intermittent basis, have been found to be protected benefits that cannot be reduced or eliminated. With no flexibility to reduce or eliminate a COLA as the employer’s financial condition or the plan’s investment earnings ebbs, private sector employers have opted to phase out COLAs entirely for new hires and future accrued benefits.
In the private sector, only about one in ten workers are covered by a pension plan. The disparate coverage between the private sector versus public sector looked like this in 2019:56
55 For example, assume a fixed 2% annual COLA is eliminated effective as of a particular date. As of that date, a 45-year-old
member has an "accrued benefit," calculated using salary and service to that date, amounting to a pension of $1,000 per month. The member continues to earn a higher average salary and more years of service, and thereby accrue a larger benefit, after that date. However, when the member retires, the member will receive a 2% COLA each year on the first $1,000 of his monthly benefit, but the portion of the monthly benefit in excess of $1,000 will not be increased by the COLA, because only the COLA on the benefit accrued to the date the COLA was eliminated is "protected."
56 Pension Rights Center calculations based on data from the Bureau of Labor Statistics’ National Compensation Survey for 2019.
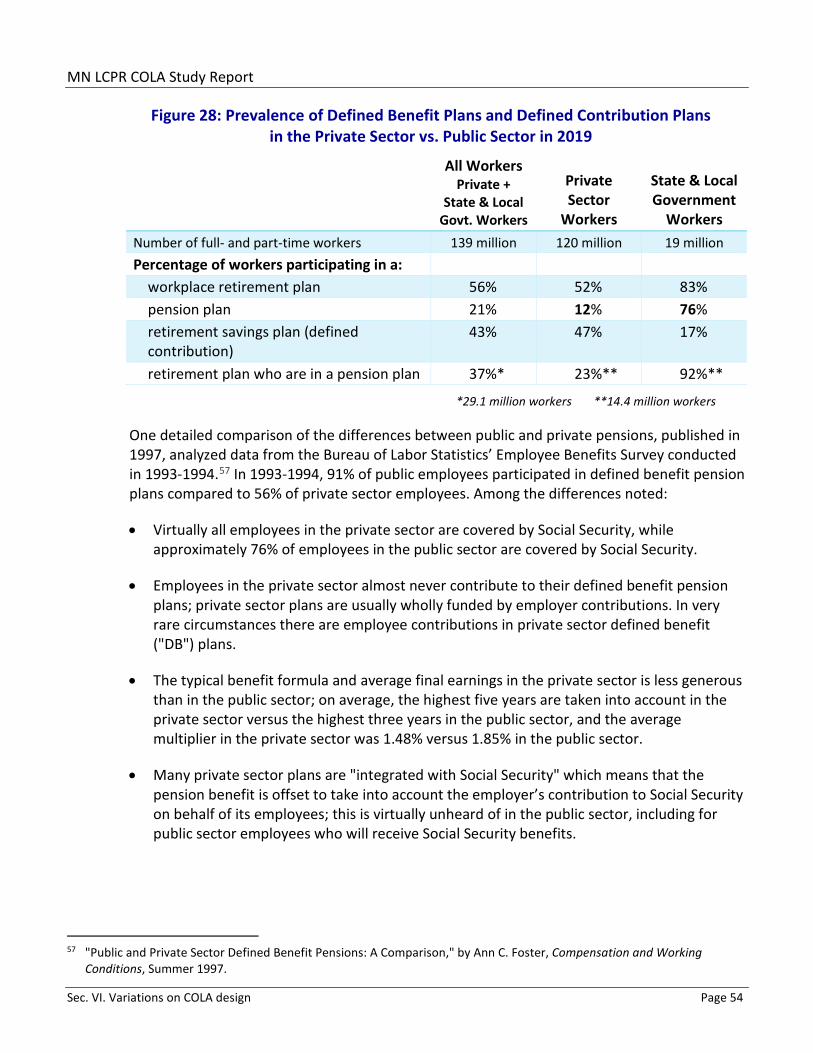
MN LCPR COLA Study Report
Sec. VI. Variations on COLA design Page 54
Figure 28: Prevalence of Defined Benefit Plans and Defined Contribution Plans in the Private Sector vs. Public Sector in 2019
All Workers Private +
State & Local Govt. Workers
Private Sector
Workers
State & Local Government
Workers Number of full- and part-time workers 139 million 120 million 19 million Percentage of workers participating in a:
workplace retirement plan 56% 52% 83% pension plan 21% 12% 76% retirement savings plan (defined
contribution) 43% 47% 17%
retirement plan who are in a pension plan 37%* 23%** 92%**
*29.1 million workers **14.4 million workers
One detailed comparison of the differences between public and private pensions, published in 1997, analyzed data from the Bureau of Labor Statistics’ Employee Benefits Survey conducted in 1993-1994.57 In 1993-1994, 91% of public employees participated in defined benefit pension plans compared to 56% of private sector employees. Among the differences noted:
• Virtually all employees in the private sector are covered by Social Security, while approximately 76% of employees in the public sector are covered by Social Security.
• Employees in the private sector almost never contribute to their defined benefit pension plans; private sector plans are usually wholly funded by employer contributions. In very rare circumstances there are employee contributions in private sector defined benefit ("DB") plans.
• The typical benefit formula and average final earnings in the private sector is less generous than in the public sector; on average, the highest five years are taken into account in the private sector versus the highest three years in the public sector, and the average multiplier in the private sector was 1.48% versus 1.85% in the public sector.
• Many private sector plans are "integrated with Social Security" which means that the pension benefit is offset to take into account the employer’s contribution to Social Security on behalf of its employees; this is virtually unheard of in the public sector, including for public sector employees who will receive Social Security benefits.
57 "Public and Private Sector Defined Benefit Pensions: A Comparison," by Ann C. Foster, Compensation and Working
Conditions, Summer 1997.
MN LCPR COLA Study Report
Sec. VI. Variations on COLA design Page 55
• Private sector plans typically do not offer "Rule of X"58 early retirement with a full pension and have later normal retirement ages to receive a full pension.
In addition to the foregoing differences, public sector and private sector plans differed markedly on the topic of COLAs:
• 53% of public sector participants were in plans that provided an automatic COLA, whereas only 4% of private sector participants were in plans that provided an automatic COLA provision.
• 13% of public sector participants were in plans that provided for a discretionary or ad hoc COLA, whereas 6% of private sector participants were in plans that provided for such a COLA.
Finally, as mentioned above, a significant difference between private and public sector defined benefit pension plans is that private sector plans are subject to stringent funding requirements that are not applicable to governmental plans. Beginning with the passage in 1974 of Internal Revenue Code section 412 and the rest of the Employee Retirement Income Security Act ("ERISA"), Congress has focused on strengthening the funding of defined benefit plans in the private sector, making them increasingly more expensive to maintain (and more likely to be phased out).
Today, Code section 412 requires the sponsoring employer to make an annual minimum required contribution, defined as an amount sufficient to cover the year's accrued benefits and amortize any shortfall over a seven-year period for a plan that is not 100% funded. This amortization period is substantially shorter than the 20- to 30-year periods commonly used in the public sector. The required contributions are also based on corporate bond interest rates instead of the plan’s expected investment return (used by public sector plans), which can make them very expensive in today’s low-interest environment. The employer must make the contribution for each plan year or face an excise tax penalty of 10% per year of the unpaid minimum required contribution and, if the contribution is not paid or the deficiency is not corrected as of the end of the taxable period, an additional 100% of the unpaid contribution or deficiency. Code section 412 does not apply to governmental plans.
In addition to the annual contribution requirements, sponsors of private sector pension plans are also required to pay annual premiums to the Pension Benefit Guaranty Corporation ("PBGC"), which "insures" private sector defined benefit pension plans. Premiums, paid per participant and tied to the plan’s funding status, have increased substantially since 1974. And, as a plan’s funding status declines, premiums increase.
Finally, accounting standards issued by the Financial Accounting Standards Board, applicable to private sector financial statements, have required corporate balance sheets to recognize an
58 Rule of X refers to the eligibility criteria for electing an unreduced pension benefit prior to normal retirement age. If a
member’s age and years of service add up to X, the member can elect Rule of X and begin to receive an unreduced pension even though the member has not yet reached normal retirement age.

MN LCPR COLA Study Report
Sec. VI. Variations on COLA design Page 56
underfunded pension plan as a liability, decades before similar changes to financial reporting in the public sector. These financial reporting requirements are also calculated using corporate bond interest rates instead of the expected investment return and hybrid methods used in Governmental Accounting Standards Board public sector accounting.
Data on the prevalence of COLAs in private sector defined benefit pension plans subsequent to the 1997 publication cited above was not available. Recent mentions of COLAs in the private sector are anecdotal. For example, an actuary on a Q&A website called "BenefitsLink" reported:
Automatic COLAs in private sector DB plans were hardly ever seen. I encountered one or two among regulated utilities -- i.e., where plan costs were borne by rate payers -- but that was about it.
In a variety of industries (finance, energy, manufacturing), occasionally granting an ad hoc COLA did not become uncommon until about 20 years ago. What happened? Obviously increasing cost pressure on DB sponsors was one factor. Another was plan design changes that made lump sum payouts common among new retirees -- corporate decision makers stopped seeing it as important to keep up a COLA precedent for the life annuitants. And starting in the 1990s (I think) the IRS started warning that a regular pattern of plan amendments, such as an ad hoc COLA every few years, could constitute an ongoing commitment to continue that pattern.
As mentioned above, when private sector employers attempted to help retirees with ad hoc COLAs, such as during periods of high inflation, the IRS issued guidance warning that ad hoc COLAs could become protected benefits if given frequently enough and thereafter could not be reduced or eliminated. As stated in Section 7.11.6 of the IRS’ Internal Revenue Manual, which provides direction to IRS auditors, "Plans that adopt ad hoc COLAs (in other words, a one-time benefit increase for retirees in pay status) for several years in a row may violate Internal Revenue Code section 411(d)(6) in the first year that they don’t adopt an ad hoc COLA."
The PBGC does not provide a COLA on the pension benefits it pays to participants in the private sector pension plans it assumes when the sponsoring employer has failed to fund the plan or has gone into bankruptcy.
At least two conclusions can be drawn from the information available on COLAs in defined benefit pension plans in the private sector:
• For the relatively few remaining private sector employers who sponsor a defined benefit plan, COLAs either were never part of the plan’s benefit features or have been eliminated as the margin of error for maintaining a fully funded plan has tightened. Unlike public sector employers, with very few exceptions, private sector employers pay the entire cost of the plan, with no help from employee contributions, and are required to make the required minimum contribution as calculated by the plan’s actuary every year. With no similar

MN LCPR COLA Study Report
Sec. VII. Conclusion Page 57
requirement to fully fund Minnesota's public pension plans, the Legislature has less incentive to reduce or eliminate COLAs.
• The Internal Revenue Code prohibits the reduction or elimination of protected benefits, including a COLA, as a condition of plan qualification and ERISA gives participants the ability to enforce their right to those benefits. If a private sector employer’s financial condition declines or the plan’s investment earnings decline, a private sector employer does not have the option to reduce or eliminate a COLA. This has led private sector employers to phase out COLAs, by eliminating COLAs for future accruals and new hires.
Under Minnesota law, employees have no constitutional, contractual, quasi-contractual, or property ownership right in a COLA in public sector defined benefit pension plans. When public pension plan investments have underperformed, the legislature has reduced or frozen COLAs as determined necessary to maintain a funded status that is considered sustainable. This ability to reduce or freeze COLAs without fear of litigation may be one reason Minnesota’s public sector pension plans will not find it necessary to follow the lead of the private sector by eliminating COLAs altogether.
VII. Conclusion This report was required to "take into account the purpose of postretirement adjustments and whether governing statutes are consistent with the purpose of postretirement adjustments." We conclude that the purpose of Minnesota’s postretirement adjustments is to mitigate the loss of purchasing power of retirement benefits due to inflation. With regard to whether postretirement adjustments are consistent with the purpose:
• For SPTRFA and the statewide plans other than the PERA Correctional Plan, governing statutes prescribe a postretirement adjustment that provides some protection from the loss of purchasing power due to inflation. However, members of those plans will experience erosion of their purchasing power if actual inflation matches the assumed rate of inflation.
• For the PERA Correctional Plan, governing statutes provide for a postretirement adjustment that is likely to substantially or completely offset future inflation if inflation assumptions are met.
• A subset of the statewide plans, PERA’s Police and Fire Plan and MSRS’ State Patrol Plan, are most vulnerable to loss of purchasing power because they are not coordinated with Social Security.
Whether the protection against inflation provided by these postretirement adjustments is sufficient is a political question for the Legislature.
This report was also required to "evaluate PERA’s new method for determining the postretirement adjustment rate." We found that PERA’s new method is not likely to provide additional protection against inflation, but it may provide moderately more intergenerational equity than the fixed-rate method.

MN LCPR COLA Study Report
Sec. VII. Conclusion Page 58
Finally, this report was also required to "consider alternative methodologies for determining postretirement adjustments." The report sets forth a summary of different methodologies, but we could not identify a clearly superior approach. However, we think that several of the approaches outlined in Section VI could be appropriate in Minnesota. For example, if cost reductions become a priority, the Legislature may want to consider the limited benefit COLA described on page 46, which provides a COLA on a portion of the pension benefit, up to specified dollar threshold.
The fundamental questions for the Legislature are: Should Minnesota’s current postretirement adjustment laws be changed? And if so, how should the benefit be structured? This report organizes and presents the information necessary for an informed discussion on these questions, but it does not present a recommendation. While there are many alternatives for providing a COLA, as summarized in this report, changing Minnesota’s current structure should be made only after considering the cost of the change, the impact of the change on members and retirees, and other tradeoffs.
MN LCPR COLA Study Report
Sec. VII. Conclusion Page 59
Acknowledgements
LCPR Staff would like to extend our thanks and acknowledge the contribution of the following individuals of research, writing, and the sharing of time, energy, and expertise that went into the production of this report:
Doug Anderson, Executive Director, Public Employees Retirement Association Amy Strenge, Policy Coordinator, Public Employees Retirement Association
Erin Leonard, Executive Director, Minnesota State Retirement System Holly Dayton, Legislative Liaison, Minnesota State Retirement System
Jay Stoffel, Executive Director, Teachers Retirement Association Rachel Barth, Legal and Legislative Director, Teachers Retirement Association
Jill Schurtz, Executive Director, St. Paul Teachers Retirement Fund Association
And to the following representatives from public pension systems in Wisconsin, Colorado, and South Dakota, who gave of their time to answer our questions:
Matt Stohr, Administrator, Division of Retirement Services, Wisconsin Department of Employee Trust Funds
Ron Baker, Executive Director, Public Employees Retirement Association of Colorado
Doug Fiddler, Senior Actuary, South Dakota Retirement System

Appendix A
Public comments

From: Kurt WinkelmannTo: Susan LenczewskiCc: Chad Burkitt; Lisa DiesslinSubject: COLA DraftDate: Thursday, November 26, 2020 4:15:48 PM
Hi Susan,
Thank you for forwarding the COLA draft report to me. Overall I found it to be a very comprehensive and well donereport. I have a few comments, some of which are more substantive than others. I will try to identify them as eithermerely informative or substantive.
INFORMATIVE1. You mention forecasts for inflation. An additional source that you may want to cite is the forecast embedded infinancial markets. Market practitioners usually look at the difference between the yield on nominal and real USTreasury bonds.(Nominal bonds are not adjusted for inflation, real bonds are).As of yesterday, the yield on 30-yearNominal US Treasury bonds was about 1.62%, while the yield on real US Treasury bonds was about -.29%. Marketpractitioners would take this to mean that the bond market is pricing in an annualized inflation rate for the next 30years of around 1.91%.
2. It is definitely worth pointing out that forecasts can be wrong. Moreover, when inflation happens, it tends to besuddenly, not gradually. So, even though inflations seems relatively benign now, over the next 10 years there couldbe significant negative surprises.
3. Your illustrations of the effects on purchasing power to retirees of the various plans under the old and newmethods was quite good.
4. You have a discussion of life expectancy and that it is predicted to increase. I believe that the numbers you arequoting are life expectancy at birth. However, a more meaningful number for retirees is life expectancy at 65, whichwill be different than life expectancy at birth. This figure is also available on various actuarial tables.
5. As a general point, I thought that your discussion of separating post-retirement changes into inflation- orinvestment- related components was quite good. It separates the issues nicely, and helps set up the discussion ofwhat other states have done.
MORE SUBSTANTIVE1. Your discussion of the different types of COLA processes is good. I would add one point- regardless of thepolicy area, economists tend to prefer rules-based approaches to more ad hoc approaches. And, if more ad hocmeasures are going to be used, economists tend to prefer clear guidance as to when decisions will be ad hoc. Themain reason is that when workers, investors, consumers know what the rules are, they can form better plans aboutindividual decisions. Ad hoc rules tend to make such planning more difficult.
2. There is a point that you allude to in a couple of places in the report, and that is the tension between COLAsand contributions. The three places you allude to it are (a) the illustration of the cost savings from the various COLAmeasures; (b) the notion of policy tradeoffs (which you point out in the conclusions) and (c) the discussion of whatWisconsin and South Dakota have done. I will work backwards on these points. It is true that both SD and WI haveintroduced different forms of retirement benefit adjustment, of which some is COLA-based. The report observes thatthese adjustments are tied to the funding level. Here is the missing point- both states have commitments to fullfunding and have adjustments in contributions as well. Moreover, I believe that both have long histories of payingthe full ARC. In WI’s case, because the ARC has been met, retirement benefits can be adjusted as a function ofinvestment performance, which creates the annuity-like structure you describe. Your discussion of the cost-savingsof the COLA reforms actually highlights the policy choice that was made in Minnesota. To be blunt, the choice wasto reduce the budget hit through reductions in COLAs versus paying the ARCs.

3. To continue on the same point from above. The two important components for paying employee retirementbenefits are investment returns and contributions. Failing to make regular contributions at the required rate onlylocks in persistent underfunding, which is exacerbated if investment returns are poor. According to our quickanalysis, the Minnesota State Board of Investments has done a good job in reaching their investment return targets.By contrast, contributions seem to be persistently below the ARC. Consequently, the only other lever that isavailable to pull for budget relief is the COLA. So, it isn’t really a surprise that (a) there are cost-savings from theCOLA policy and (b) real retiree income decreases. I know that this point seems to be outside the area that the reportis meant to look at, but it is, nevertheless, an important one.
Once again, I thought that the report was very well done and informative. I hope that some of this is helpful to you.If it would be useful, I would be happy to make comments in the public call.
Thanks, and I hope all is well.
Kurt Winkelmann
December 4, 2020
Susan Lenczewski Executive Director LCPR 100 Rev. Dr. Martin Luther King Jr. Blvd. State Office Building, Room 55 St. Paul, MN 55155
RE: Comments to the First Draft Study Report of the Post Retirement Adjustments (COLAs)
Dear Ms. Lenczewski:
I am the Executive Director of AFSCME Council 5, a union comprised of over 43,000 state and local government employees. Please accept this letter as our comments on the November 20, 2020 draft of the above referenced matter.
AFSCME Council 5 worked with a number of public sector labor unions, affiliated retired employee groups, and other interested parties to shape the historic 2018 Pension Reform legislation. Through the Public Employees Pension Coalition (PEPC) we helped negotiate and build support for the 2018 Pension Reform legislation which helped preserve a solid, stable, and viable defined benefit pension system in Minnesota.
Defined benefit pensions are highly valued by public employees in Minnesota. While the pensions are modest, the promise of a stable, reliable pension is a major incentive for individuals to work for state and local governments in Minnesota. Most of the pensions in the state are coordinated with Social Security. The defined benefit pension combined with Social Security provides retirement income security for over 10% of Minnesota’s entire workforce.
We have reviewed the first draft of the Study Report on Post Retirement Adjustments and wanted to compliment you and your staff for laying out some important basic information. We do think, however, that there can be much more added to this debate including who pays for these pensions. To be clear, Minnesota public employees pay a significant portion of their salaries for the benefits that are promised through these pension systems. In fact, Minnesota public employees pay amongst the highest share of the total pension cost throughout the country. While

we appreciate the contributions made by our public employers, no one can seriously dispute that Minnesota public employees are paying more than their fair share of the cost of the pensions.
As is noted on page 12 of your draft report, the most significant savings in the 2018 Pension Reform Act came from reductions in COLAs that retired Minnesota public employees agreed to. For the MSRS general plan it amounted to $1.2 billion in present cost savings and the MSRS Correctional Plan took a $132 million reduction in future COLAs. Other public employees throughout the state took similar or even greater reductions to help make the reform bill possible.
With that in mind, as the Pension Commission looks for ways to ensure the retirement income security of hundreds of thousands of Minnesotans, AFSCME Council 5 believes that at a minimum the state needs to maintain some level of fixed COLA which will provide protection against inflation. Secondly, we could support and do believe it’s appropriate to have a COLA that is tied to inflation to ensure that the erosion of retirement income does not happen to our retirees. As I said, our retirees already experienced significant change in their COLA from legislation passed in 2018 and other years. No one can reasonably expect them to face other reductions in benefits.
Thank you very much for the opportunity to comment on this study and please include AFSCME Council 5 in any future deliberations on this matter.
Very Truly Yours,
Julie Bleyhl Executive Director AFSCME Council 5, AFL-CIO

MINNESOTA PROFESSIONAL FIRE FIGHTERS
8100 Wayzata Boulevard· St. Louis Park, MN 55426-1338
phone: 763-545-8100 • fax: 763-545-0018
Susan Lenczewski
Executive Director LCPR 100 Rev. Dr. Martin Luther King Jr. Blvd. State Office Building, Room 55 St. Paul, MN 55155
December 4, 2020
RE: Comments to the First Draft Study Report of the Post Retirement Adjustments (COLAs)
Dear Ms. Lenczewski:
I am the President of the Minnesota Professional Fire Fighters. We are an organization that represents over 1800 professional fire fighters and EMS personnel in over 47 different cities throughout the state. I have reviewed the draft of the COLA study that you and your staff have
prepared.
I appreciate the fact that you have separately discussed the effect of the 1 % PERA COLA on members and the fact that it does not keep up with inflation. As you know, public safety employees in Minnesota are not covered by social security, based on the state's decision not to join the Social Security Compact. Public safety employees, particularly fire fighters and EMS personnel are acutely aware that we need to look to the legislature for our pensions. While social security is directly tied to inflation through a COLA formula, the PERA Police and Fire plan is not. The 1 % COLA has been in place for over a decade now and it is eroding the initial pension
our members have received.
We want to stay involved in this discussion and be at the table when a plan can be put in place to
provide better protection for the benefits that our members and other public safety officers have
earned and deserve.
;r Jj\t:___ �!n:
President, MPFF

1
From: Johnson, David H. <[email protected]>Sent: Friday, December 4, 2020 4:25 PMTo: Lisa DiesslinCc: 'Leonard Krumm'Subject: Comments on First Draft of COLA Report
Thank you for the opportunity to review and comment on the first draft of the Study Report on Post Retirement Adjustments (“COLA’s”). I represent the Minnesota Municipal Retirement Association (“MMRA”) a group primarily composed of former members of the Minneapolis Employees Retirement Fund who are now basic plan members of PERA‐General. As the draft correctly notes these basic plan members do not receive social security benefits and, as a result, do not receive the inflationary protections that coordinated members receive through social security COLAs. The following are MMRA’s comments to the first draft.
1. The draft report concludes that the purpose of Minnesota’s postretirement adjustments is to mitigate thedecline in the value of a fixed monthly payment due to inflation. Draft Report at page 13. This seemsinconsistent with The LCPR’s Principles of Pension Policy, which was adopted by the Commission and serves asthe basis for evaluating proposed public pension legislation. With respect to post‐retirement benefit increasesthe principles provide that “retirement benefits should be increased during the period of retirement to offsetthe impact of economic inflation over time in order to maintain a retirement benefit that was adequate at thetime of retirement.” See Principles of Pension Policy, Paragraph 8a. The principles speak of offsetting the costsof inflation over time in order to maintain a benefit that was adequate at the time of retirement, not of mitigatethe benefit’s decline. MMRA believes that the purpose of post‐retirement benefits reflected in the reportshould conform to the longstanding principles adopted by, and adhered to, by the Commission.
2. On a related note the current PERA‐General plan limits COLA increases to 50% of the Social Security (CPI‐W) increase. The 50% cap results in a retiree’s benefit eroding relative to inflation (CPI‐W) over time. While thedraft report lauds this mechanism relative to the previous COLA it does not discuss the limitations of the PERA‐General COLA relative to the pension commission principle referenced above or the “declining benefit” standardarticulated in the report. MMRA believes this analysis would be especially helpful with respect to basic planmembers who do not, as the first draft notes, receive inflation protection from social security COLAs.
3. There are a number of references in the draft report about the significant COLA increases public employeeretirees received in the 1990s, including in the section on intergenerational equity. However, there is noanalysis as to how many current retirees retired prior to the late 1990s and actually receive the significant COLAincreases of the late 1990s referenced in the report. It is our understanding that only a relatively smallpercentage of current PERA retirees actually received these 1990s COLA increases. Instead, most retireesretired after the late 1990s receiving much smaller COLA increases. Without some discussion of when currentpublic employees retired we are concerned that the report leaves a skewed impression of the types of benefitincreases most current retirees have received.
4. Finally we note that page 12 of the draft contains information on the significant savings to various state fundsfor COLA reductions contained in the 2018 Pension Reform Act. There is no similar analysis for PERA‐General. Pension legislation in 2010 reduced the PERA ‐General COLA to 1.0%, resulting in significant savings tothe fund. In fact the vast majority of the savings came from significantly reduced COLAs for retirees. We believethat the report should include the same historical data for PERA General that is included for other funds in thechart on page 12.
Again, thank you for the opportunity to comment on this first draft. We look forward to continuing to engage in this process and participating in the discussion on December 8th. If you have any questions please let me know.

2
David H. Johnson Partner
Connect: vCard / LinkedIn / Twitter
+1 612 766 7506 direct / +1 612 701 3638 mobile / +1 612 766 1600 fax
Faegre Drinker Biddle & Reath LLP
2200 Wells Fargo Center, 90 South Seventh Street Minneapolis, Minnesota 55402, USA
This message and any attachments are for the sole use of the intended recipient(s) and may contain confidential and/or privileged information. Any unauthorized review, use, disclosure or distribution is prohibited. If you are not the intended recipient, please contact the sender by reply email and destroy all copies of the original message and any attachments.
***************************** This message and any attachments are for the sole use of the intended recipient(s) and may contain confidential and/or privileged information. Any unauthorized review, use, disclosure or distribution is prohibited. If you are not the intended recipient, please contact the sender by reply email and destroy all copies of the original message and any attachments. Thank you. *****************************


Retired Educators Association of Minnesota
4 December 2020
We want to express our thanks to the Legislative Commission on Pensions and Retirement (LCPR) Staff for their comprehensive and data-oriented report. Tracing the history of Minnesota's statewide pensions and postretirement adjustments (COLAs) gives context to the ongoing task of delivering a stable, defined benefit pension that supports the retirement of a quarter-million Minnesotans. The oversight of the LCPR has brought us through good times and bad. When the Legislature enacted pension changes in 2018, they also mandated a study of COLA policies. This action demonstrates an active oversight role, in this case, of the expressed purpose of COLAs. The report states successes, along with several factors that deserve further attention.
To what extent have past pension funding "fixes" been remedied by the pension's present and future recipients? The COLA Study highlights data showing that active members, cities, counties, and the state have been asked to contribute more dollars to remedy. The COLA has likewise been employed to remedy underfunding when fund levels trend poorly. This practice has served to assist funding levels, but it has not helped retirees' purchasing power. The report concludes that the purpose of Minnesota's postretirement adjustments is to mitigate the decline in the value (loss of purchasing power) of a fixed monthly payment due to inflation. The expressed purpose of COLAs has not fully benefitted Minnesota's retirees. The COLA Study reports that purchasing power has been steadily decreasing. It also states: "For the statewide plans other than the Public Employees Retirement Association (PERA) Correctional Plan, it is unlikely that the postretirement adjustments will fully cover retiree's loss of purchasing power and retirees will experience an erosion of their benefits' purchasing power."
The Minnesota Legislature enacted a new COLA calculation for PERA in 2018. The PERA General Plan now uses the CPI Social Security COLA model as an automatic guide for adjusting its COLAs. This practice mirrors the COLAs of many other states (Colorado, South Dakota, Wisconsin, and others) with "automatic" adjustments and maybe worth further consideration. It employs reliable measures for calculating the COLA and also serves to balance generational inequities. The LCPR Report also states that improving the retiree purchasing power "will involve tradeoffs." Our feeling is that there have already been significant tradeoffs regarding COLAs. The Teachers Retirement Association (TRA) COLAs were taken away entirely in 2011 and 2012 before being restored. TRA COLAs were then cut in half in 2019, creating a pathway that continues to diverge from the COLAs assumed goal.
With the Study's information, it is hoped that the LCPR, and subsequently the Legislature as a whole, will remember COLAs assumed goal and will seek to answer the question: How do we make COLAs that reach the goal and better serve our retirees?
Paul H. Ehrhard REAM President
REAM Co-Chairs Legislative Committee:
Henry Carbone Lonnie Duberstein Past President John Fisher Past President Tim Moynihan Vice President
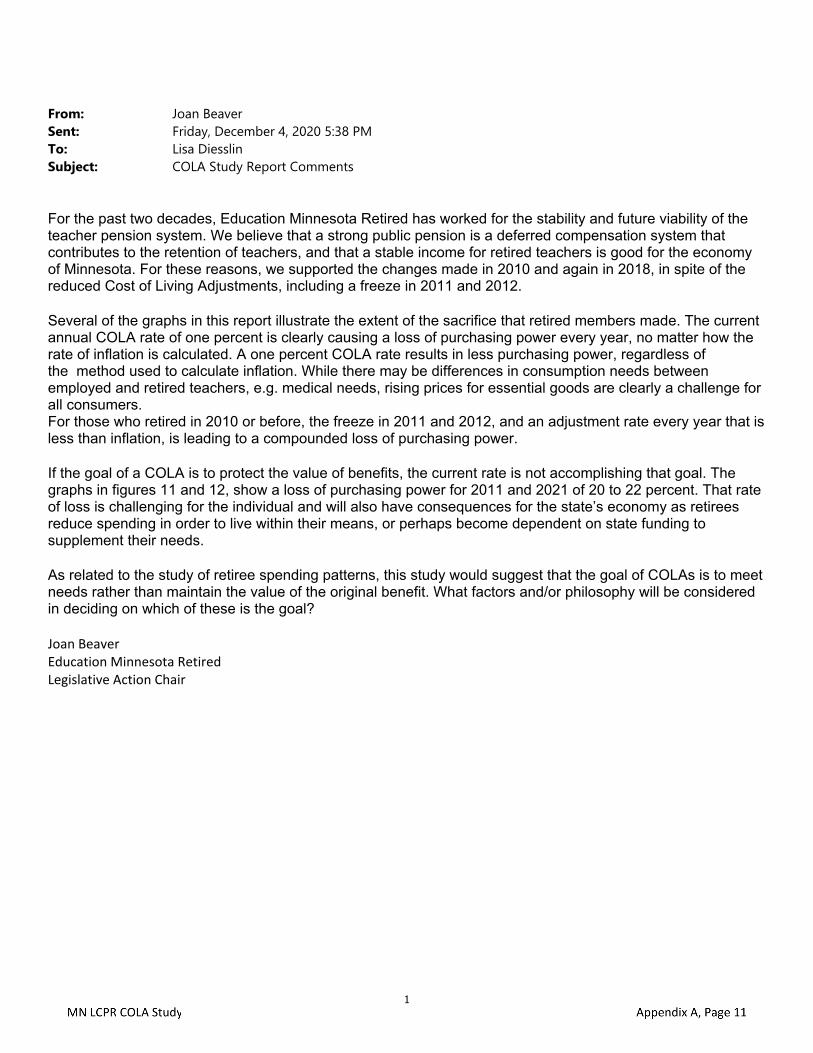
1
From: Joan Beaver Sent: Friday, December 4, 2020 5:38 PMTo: Lisa DiesslinSubject: COLA Study Report Comments
For the past two decades, Education Minnesota Retired has worked for the stability and future viability of the teacher pension system. We believe that a strong public pension is a deferred compensation system that contributes to the retention of teachers, and that a stable income for retired teachers is good for the economy of Minnesota. For these reasons, we supported the changes made in 2010 and again in 2018, in spite of the reduced Cost of Living Adjustments, including a freeze in 2011 and 2012.
Several of the graphs in this report illustrate the extent of the sacrifice that retired members made. The current annual COLA rate of one percent is clearly causing a loss of purchasing power every year, no matter how the rate of inflation is calculated. A one percent COLA rate results in less purchasing power, regardless of the method used to calculate inflation. While there may be differences in consumption needs between employed and retired teachers, e.g. medical needs, rising prices for essential goods are clearly a challenge for all consumers. For those who retired in 2010 or before, the freeze in 2011 and 2012, and an adjustment rate every year that is less than inflation, is leading to a compounded loss of purchasing power.
If the goal of a COLA is to protect the value of benefits, the current rate is not accomplishing that goal. The graphs in figures 11 and 12, show a loss of purchasing power for 2011 and 2021 of 20 to 22 percent. That rate of loss is challenging for the individual and will also have consequences for the state’s economy as retirees reduce spending in order to live within their means, or perhaps become dependent on state funding to supplement their needs.
As related to the study of retiree spending patterns, this study would suggest that the goal of COLAs is to meet needs rather than maintain the value of the original benefit. What factors and/or philosophy will be considered in deciding on which of these is the goal?
Joan Beaver Education Minnesota Retired Legislative Action Chair

From: Mark Haveman Sent: Tuesday, December 8, 2020 5:24 PM To: Susan Lenczewski Subject: Couple of things
Hi Susan
[Unrelated requests deleted]
Also just one comment on your important health care cost discussion. You have health care cost trend information relative to other goods and services; health care costs relative to Medicare recipients total budgets, and senior health care spending as a percent of total budgets compared to other age groups. Perspective that is missing, and important I believe, is actual out-of-pocket spending on health care by seniors in dollars. (You can sort by age cohort and service using the table about halfway through, it's still $3,144 for 75-84, only after 85 does it (relatively) take off to over 8 grand when long term care starts to make its presence known
A dollar based perspective is an important complement to a percentage of budget perspective as I suspect a significant majority of retired career employees in state and local government combined plans have incomes around $50,000 or higher - the highest cohort Kaiser reports. (A 35 year career at a high five of $53,720 plus the average U.S. Social Security payment gets you to $50,000.) The $50,000 cohort spends an average of 7% on income on health care, half of the 14% reported for all medicare recipients.
-- Mark Haveman Executive Director Minnesota Center for Fiscal Excellence 651-224-7477 x 102

From: Kurt WinkelmannSent: Thursday, December 10, 2020 8:55 AM To: Susan Lenczewski Cc: Jordan Pandolfo; Chad Burkitt; Lisa Diesslin Subject: Re: Thanks
Thanks Susan.
In terms of timing for us to show you some of our results, it would probably be better to leave it to sometime in January. We’re looking at much more than the COLAs, and we won’t be in a position to discuss until then. I would be happy, though, to comment on the next draft.
In terms of our brief on WI and SD, yes, we probably could have written more. The main point, though, is pretty straightforward- those plans are fiscally solvent because they have kept pace on contributions AND they have mechanisms in place to ensure that they always keep pace on contributions (nothing ad hoc). I didn’t say this in my earlier email or on the call, but to me the relevance to the COLA discussion is that if COLAs are paid, the state needs to commit to a policy of full funding, with the corresponding knock-on effect on contributions. Clearly the latter effect will raise a political question- who funds the increased contributions? Is it employers (tax increases or service reductions) or is it employees (with no increase in wages)? Those (as you alluded to in the draft report) are the main (and difficult) tradeoffs). Our work is specifically getting at a framework to evaluate these choices.
Kurt
From: Kurt Winkelmann Sent: Wednesday, December 9, 2020 10:26 AM To: Susan Lenczewski; Chad BurkittCc: Jordan Pandolfo Subject: Thanks
Hi Susan and Chad,
Thanks for asking me to participate in yesterday’s call. I hope that my comments were helpful.
Two quick points: first, we recently wrote a short piece on commitment to paying contributions and some of the tradeoffs (https://cla.umn.edu/heller-hurwicz/news-events/story/policy-brief-good-pension-fund-governance). The piece explicitly talks about some of the things that SD and WI have done. It is not comprehensive, but it should give some sense for how those states handled the tradeoffs and why.
Second, we are working on a number of analyses (using some of our models) related to some of the tradeoffs in pension policy in Minnesota. If it would be helpful to you, we’d be happy to share some of the results. In particular, we’ve incorporated the effects of COLA policy in our analysis.
Thanks, and I hope that all is well.
Kurt

Appendix B
Notes from case study interviews:
Colorado South Dakota Wisconsin

Legislative Commission on Pensions and Retirement Meeting Notes
Notes from meeting with Ron Baker CO PERA 8.13.2020.docx Page 1
COLA Study Group Zoom meeting with Ron Baker, Executive Director, Colorado PERA,
on Thursday, August 13, 2020
Prepared by: Susan Lenczewski, Executive Director Date: August 31, 2020 Chad Burkitt, Analyst
Participants
Erin Leonard, MSRS Holly Dayton, MSRS Doug Anderson, PERA Amy Strenge, PERA Jay Stoffel, TRA Jill Schurtz, SPTRFA Chad Burkitt, LCPR Susan Lenczewski, LCPR
Questions
Ron's responses are in italics.
Pension background questions:
1. How many and what type of retirement plans do you administer?
The Public Employees’ Retirement Association of Colorado (PERA) has 5 divisions: divisionscovers all government employees, state, local, judges, teachers; NOT firefighters and police.
Plan is a DB with a cash balance or money purchase pension plan (MPP) (since 1995).
2. What is the funded status of each plan?
State: 58%Teachers: 59%Local employees and judges: closer to 75%
3. What is the formula multiplier for each plan?
2.5% X average highest 3 or 5 years salary X years of service OR, if better, account in theMPP.
MN LCPR COLA Study Appendix B, Page 1

R. Baker 8.13.20 Meeting Notes
Notes from meeting with Ron Baker CO PERA 8.13.2020.docx Page 1
4. What is the normal retirement age (or first age for unreduced benefits) for each plan?
64 + 30 years of serviceNRA = 65
5. What is the vesting schedule for each plan? 5 years.
6. Is your retirement plan coordinated with Social Security? No.
7. What are the contribution rates?
Employer: 20.5% of payEmployee: 10.5% of pay
COLA questions:
8. Do your retirees receive a Cost of Living Adjustment (COLA)?
Yes, called an annual increase (AI).
a. If yes, what is the design of the COLA?
COLA starts 3 years after retirement date.
After 1/1/2007:1% of pay deposited in the “annual increase reserve fund” COLA each year is the lesser of CPI-W, 1.25% cap, or 10% of AI fund Cap will automatically increase after a good investment year, up to 2% COLA cannot be less than 0.5%
From Ron, after the meeting:
Our annual increase provisions are in part 10 of our statute. Our statute is section 24-51 of the Colorado statutes. The section that specifically addresses the Annual Increase formula for the members hired on or after 1/1/2007 can be found under 24-51-1009(4).
Changes in 2018: Automatic adjustments will be made each July 1, as determined by the actuary, to the COLA and employer and employee contributions, so retirees, active employees, and employers share equally, in equal dollar amounts (not percentages) No AI in 2018 and 2019
b. If yes, who has authority to grant, suspend, or adjust the COLA?
Adjustment happens automatically, per statute, based on actuary’s determination.
MN LCPR COLA Study Appendix B, Page 2

R. Baker 8.13.20 Meeting Notes
Notes from meeting with Ron Baker CO PERA 8.13.2020.docx Page 1
9. What is the proportion of retirees to active employees in each plan?
10. Has the plan design or COLA changed over the years?a. If yes, how?b. What was the motivation for the change? (i.e., funding challenges, demographics, etc.)c. What reactions did stakeholders have to the changes?d. Do you have any “lessons learned” from any COLA design changes?
11. Describe your engagement efforts with stakeholders.
12. Did you consult with actuaries or other professionals when developing your COLA design?
Work only with their actuary to develop the COLA design
13. Have you balanced or considered balancing the cost of your COLA with other benefit reforms?
14. What retirement income and expense challenges do your members report experiencing?
Health care costs are increasing faster than the AI.CPI-W doesn’t accurately reflect the rising costs of health care for retirees.
Other information provided by Ron at the meeting
Assumed rate of return on investments: 7.25%.
Cost of benefit (normal cost) = 11% of pay, so employer contributions almost entirely goes toward the underfunding.
Reason funded status is so low: had 3.5% fixed COLAs in the 90s and for many years, employees could buy service credit at 50% of the actuarial value.
Legislative Commission on Pensions and Retirement
55 State Office Building 100 Rev. Dr. Martin Luther King Jr. Blvd. St. Paul, MN 55155-1201 Phone: 651-296-2750 TDD: 651-296-9896; Fax: 651-297-3697 www.lcpr.leg.mn
MN LCPR COLA Study Appendix B, Page 3

Legislative Commission on Pensions and Retirement Meeting Notes
Notes from meeting with Doug Fiddler SDRS 8.14.2020.docx Page 1
COLA Study Group Zoom meeting with Doug Fiddler, Senior Actuary, South Dakota Retirement System (SDRS),
on Friday, August 14, 2020
Prepared by: Susan Lenczewski, Executive Director Date: August 31, 2020 Chad Burkitt, Analyst
Participants
Erin Leonard, MSRS Holly Dayton, MSRS Doug Anderson, PERA Amy Strenge, PERA Rachel Barth, TRA Jill Schurtz, SPTRFA Christine MacDonald, SPTRFA Chad Burkitt, LCPR Susan Lenczewski, LCPR
Questions
Doug Fiddler's responses are in italics.
Pension background questions:
1. How many and what type of retirement plans do you administer?
SDRS, one plan, covers nearly all public employees, except employees of Sioux Falls. Public safety employees and judges have a different formula from the other employees.
The plan is a DB plan with hybrid features, and fixed contributions, at 6% employer and 6% employee.
2. What is the funded status of each plan?
100%. Normal cost is around 12%, so equal to ER/EE contributions.
3. What is the formula multiplier for each plan?
MN LCPR COLA Study Appendix B, Page 4

D. Fiddler 8.13.20 Meeting Notes
Notes from meeting with Doug Fiddler SDRS 8.14.2020.docx Page 2
New tier (effective 1/1/2017): 1.8% X high 5 salary X years of service. New tier has accumulation account that receives 1.5% of pay, which is paid out in a lump sum or annuity with the pension.
Old tier: 1.55% (but old tier had Rule of 85, unreduced spousal survivor benefit, and other additional benefits).
4. What is the normal retirement age (or first age for unreduced benefits) for each plan?
67; reduced by 5% per year for each year of earlier retirement.
Average retirement age trending older, around age 65, because SD has no post-retirement health care for public employees.
5. What is the vesting schedule for each plan? 3 years.
6. Is your retirement plan coordinated with Social Security? Yes;
Higher paid employees’ benefits are offset (integrated) by Social Security
COLA questions:
7. Do your retirees receive a Cost of Living Adjustment (COLA)? Yes.
a. If yes, what is the design of the COLA?
To 2009: 3.1% fixed (about 25% of the cost of the plan) 2010 to 2016: linked to CPI-W, minimum and maximum: 2.1 - 3.1% 2017: CPI-W, minimum and maximum: .5 - 3.5% Maximum adjusts if funding ratio changes from current 100%
b. If yes, who has authority to grant, suspend, or adjust the COLA?
Legislature; standing retirement laws committee, to which plan board bring legislative proposals.
8. What is the proportion of retirees to active employees in each plan?
9. Has the plan design or COLA changed over the years?
a. If yes, how?
b. What was the motivation for the change? (i.e., funding challenges, demographics, etc.)
COLA was too expensive. To be more responsive to the needs of younger employees.
MN LCPR COLA Study Appendix B, Page 5

D. Fiddler 8.13.20 Meeting Notes
Notes from meeting with Doug Fiddler SDRS 8.14.2020.docx Page 3
c. What reactions did stakeholders have to the changes?
Retiree organizations have been supportive of COLA changes. SD does not have a strong union presence.
d. Do you have any “lessons learned” from any COLA design changes?
Yes, expand lower end of range to 0%; he sees that as a probable future change.
Allow for less than 100% funded (?)
Would provide “auto correction” for any retirees whose benefit is less than what it would have been had it been increased by CPI-W each year since commencement.
10. Describe your engagement efforts with stakeholders.
11. Did you consult with actuaries or other professionals when developing your COLA design?
12. Have you balanced or considered balancing the cost of your COLA with other benefit reforms?
13. What retirement income and expense challenges do your members report experiencing?
Some retirees challenge the use of CPI-W and want CPI-E to better reflect the rising cost of health care in retirement.
Other information provided by Doug Fiddler at the meeting
Term vested members get a COLA (like our augmentation).
Assumed rate of return: 6.5% (since 2016).
Assumed inflation: 2.25%.
Legislative Commission on Pensions and Retirement
55 State Office Building 100 Rev. Dr. Martin Luther King Jr. Blvd. St. Paul, MN 55155-1201 Phone: 651-296-2750 TDD: 651-296-9896; Fax: 651-297-3697 www.lcpr.leg.mn
MN LCPR COLA Study Appendix B, Page 6

Legislative Commission on Pensions and Retirement Meeting Notes
Notes from meeting with Matt Stohr WI ETF 8.17.2020.docx Page 1
COLA Study Group Zoom meeting with Matt Stohr, Administrator, Division of Retirement Services, Wisconsin Employee Trust Funds (ETF), on Monday, August 17, 2020
Prepared by: Susan Lenczewski, Executive Director Date: August 31, 2020 Chad Burkitt, Analyst
Participants
Holly Dayton, MSRS Amy Strenge, PERA Jay Stoffel, TRA Rachel Barth, TRA Jill Schurtz, SPTRFA Chad Burkitt, LCPR Susan Lenczewski, LCPR
Questions
Matt provided written answers to these questions. Please see the attached.
Pension background questions:
1. How many and what type of retirement plans do you administer?2. What is the funded status of each plan?3. What is the formula multiplier for each plan?4. What is the normal retirement age (or first age for unreduced benefits) for each plan?5. What is the vesting schedule for each plan?6. Is your retirement plan coordinated with Social Security?
COLA questions:
7. Do your retirees receive a Cost of Living Adjustment (COLA)?a. If yes, what is the design of the COLA?b. If yes, who has authority to grant, suspend, or adjust the COLA?
8. What is the proportion of retirees to active employees in each plan?9. Has the plan design or COLA changed over the years?
a. If yes, how?b. What was the motivation for the change? (i.e., funding challenges, demographics, etc.)c. What reactions did stakeholders have to the changes?d. Do you have any “lessons learned” from any COLA design changes?
MN LCPR COLA Study Appendix B, Page 7

M. Stohr 8.17.20 Meeting Notes
Notes from meeting with Matt Stohr WI ETF 8.17.2020.docx Page 1
10. Describe your engagement efforts with stakeholders. 11. Did you consult with actuaries or other professionals when developing your COLA design? 12. Have you balanced or considered balancing the cost of your COLA with other benefit reforms? 13. What retirement income and expense challenges do your members report experiencing?
Other information provided by Matt at the meeting (Matt's responses are in italics)
ETF: 1,500 employers 210,000 retired 260,000 active employees 175,000 inactive (deferred)
ETF covers all employees of the state, UW system, counties, cities, except Milwaukee.
Contribution rates are determined by the actuary each year; not fixed in statutes. Annuity adjustment is determined by the actuary each year.
If the investment return was 19% last calendar year, why was the annuity adjustment only 1.7%?
• Smoothing of asset value over 5 years • Experience and demographic factors affect assumptions • 5% rate of return threshold
Question asked: What is the purpose of ETFs annuity adjustments?
No relationship to inflation. Share investment gains? Plan pays out the entire gain in excess of 5% each year.
Hypothetical retiree starts payments at $1,000 per month (the “floor benefit”). Year 2: 5% increase, so benefit is now $1,050 per month Year 3: 10% reduction, so benefit goes back to the floor benefit (“clawback”)
Retirees who have been receiving annuity adjustments for years, have more to lose than newer retirees. Multiple consecutive years of “clawback” leads to higher % of reduction for smaller population of retirees.
History of annuity adjustments since 1986: https://etf.wi.gov/wrs-performance/annual-returns-rates-and-adjustments
Core fund: diversified portfolio Variable fund: can elect to transfer 50% of benefit to variable fund which is 100% invested in equities
Legislative Commission on Pensions and Retirement
55 State Office Building 100 Rev. Dr. Martin Luther King Jr. Blvd. St. Paul, MN 55155-1201 Phone: 651-296-2750 TDD: 651-296-9896; Fax: 651-297-3697 www.lcpr.leg.mn
MN LCPR COLA Study Appendix B, Page 8

Legislative Commission on Pensions and Retirement
Notes from meeting with Matt Stohr WI ETF 8.17.2020.docx Attachment, Page i
Attachment
COLA Study Group Questions for Outside Retirement Systems
Responses from Matt Stohr, Administrator, Division of Retirement Services, Wisconsin Department of Employee Trust Funds (ETF)
Received via email on August 12, 2020
Questions
Pension background questions:
1. How many and what type of retirement plans do you administer?
The Wisconsin Department of Employee Trust Funds (“ETF”) administers the Wisconsin Retirement System (“WRS”). The WRS is classified as a Defined Benefit plan by the Internal Revenue Service (“IRS”). The WRS, because it has a money purchase (cash balance) option, is sometimes informally referred to as a hybrid plan. However, the WRS is not considered a hybrid plan by the IRS.
In addition to the primary WRS administration, ETF administers programs such as health insurance, life insurance, long-term and short-term disability, employee reimbursement accounts, deferred compensation and the accumulated sick leave conversion credit program.
2. What is the funded status of each plan?
WRS funding has remained steady over the last 25 years. The WRS funding ratio has consistently remained above 90% during the last 25 years and has been at (or near) 100% since 2004 using our current frozen initial liability measure. The funding ratio varies when using market value.
3. What is the formula multiplier for each plan?
The WRS formula multipliers (of formula factors) have changed over time. The formula multiplier that will apply to a participant’s account depends on the employment category for that individual. Currently the rates are as follows:
Employment Category Factor (as %) General and Teachers 1.6 Executive and Elected 1.6 Protective with Social Security 2.0
MN LCPR COLA Study Appendix B, Page 9

M. Stohr Responses to Questions
Notes from meeting with Matt Stohr WI ETF 8.17.2020.docx Attachment, Page ii
Protective without Social Security 2.5
4. What is the normal retirement age (or first age for unreduced benefits) for each plan?
Normal retirement age in the WRS has changed over time and is dependent on the category of employment and years of service. The age a participant becomes eligible for an unreduced annuity is:
General & Teachers Protective Executive & Elected Age Service Age Service Age Service 65 Any 1 54 Any 62
(65 after 2017) Any
57 30 53 25 57 30
5. What is the vesting schedule for each plan?
Vesting in the WRS has changed over time. For participants who began service after 7/1/2011, members are vested after five (5) years of service. For participants who began service prior to 7/1/2011, participants (with some exceptions) were vested immediately.
6. Is your retirement plan coordinated with Social Security?
Yes, the WRS has a 218 Agreement with the Social Security Administration. To join the WRS, employers must be eligible for and come under the State’s 218 agreement and cover all their employees. The only exceptions are for certain protective occupation employees (e.g., firefighters), part-time board/commission members, and the federally mandated exclusions.
COLA questions:
7. Do your retirees receive a Cost of Living Adjustment (COLA)?
No, the WRS structure does not grant COLAs but does include a unique risk-sharing dividend adjustment mechanism for pension recipients based on investment returns. These adjustments are commonly referred to as “annuity adjustments”. Annual adjustments made to retiree accounts are based on investment performance, plan design, and actuarial factors (like mortality rates). A fuller detailed explanation of the calculations can be found in ETF’s annual Actuarial Valuation of Retired Lives report, prepared by ETF’s actuary. More information can also be found on our website (HERE).
a. If yes, what is the design of the COLA? b. If yes, who has authority to grant, suspend, or adjust the COLA?
1 Requires a member to be vested in the system. Vesting requirements are discussed in Question 5, below.
MN LCPR COLA Study Appendix B, Page 10

M. Stohr Responses to Questions
Notes from meeting with Matt Stohr WI ETF 8.17.2020.docx Attachment, Page iii
Post-retirement annuity adjustments are authorized under s. 40.27(2) and s. 40.28(2) of the Wisconsin Statutes.
8. What is the proportion of retirees to active employees in each plan?
The WRS has ~ 258,000 active employees and ~209,000 total annuitants along with ~175,000inactive employees (Pg. 16, 2018 Comprehensive Annual Financial Report).
9. Has the plan design or COLA changed over the years?
a. If yes, how?
In the WRS, post-retirement annuity adjustments are currently authorized under s. 40.27(2)and s. 40.28(2) of the Wisconsin Statutes. This wasn’t always the case, there is a long historydating back to the 1950’s wherein the Wisconsin Constitution was interpreted to prohibitpost retirement dividend payments. It wasn’t until the early 1970’s that it was definitivelydetermined that surpluses in the WRS annuity reserves could be used to pay post-retirementmonies.
The most significant change to annuity adjustments, after it was determined that they wereconstitutionally allowable, came during the merger of the state-administered retirementsystems. That merger was completed via Chapter 96, Laws of 1981, and required the ETFBoard to distribute dividends whenever annuity reserve surpluses were sufficient to generatean increase of at least 2.0% annually for all annuities. This threshold was modified under2003 Act 153, which provided that dividends were to be distributed when investmentearnings on annuity reserve balances exceeded the assumed benefit rate by at least 0.5% (orby a different percent, as specified under ETF rules).
b. What was the motivation for the change? (i.e., funding challenges, demographics, etc.)
The motivation for the changes provided directly above were the result of an increasedappreciation that ETF (along with its actuary) were in a better position than the legislature tojudge and determine necessary annuity adjustments. In 2003, ETF provided the followingpoints:
i. Annuitants would be better served by lowering the threshold for annuity increases.ii. ETF financial modeling at the time showed that a 2% threshold could result in no
dividend payments over an extended period.iii. The changes give increased authority to modify thresholds and provide more
flexibility and responsiveness to changing circumstances.
c. What reactions did stakeholders have to the changes?
MN LCPR COLA Study Appendix B, Page 11
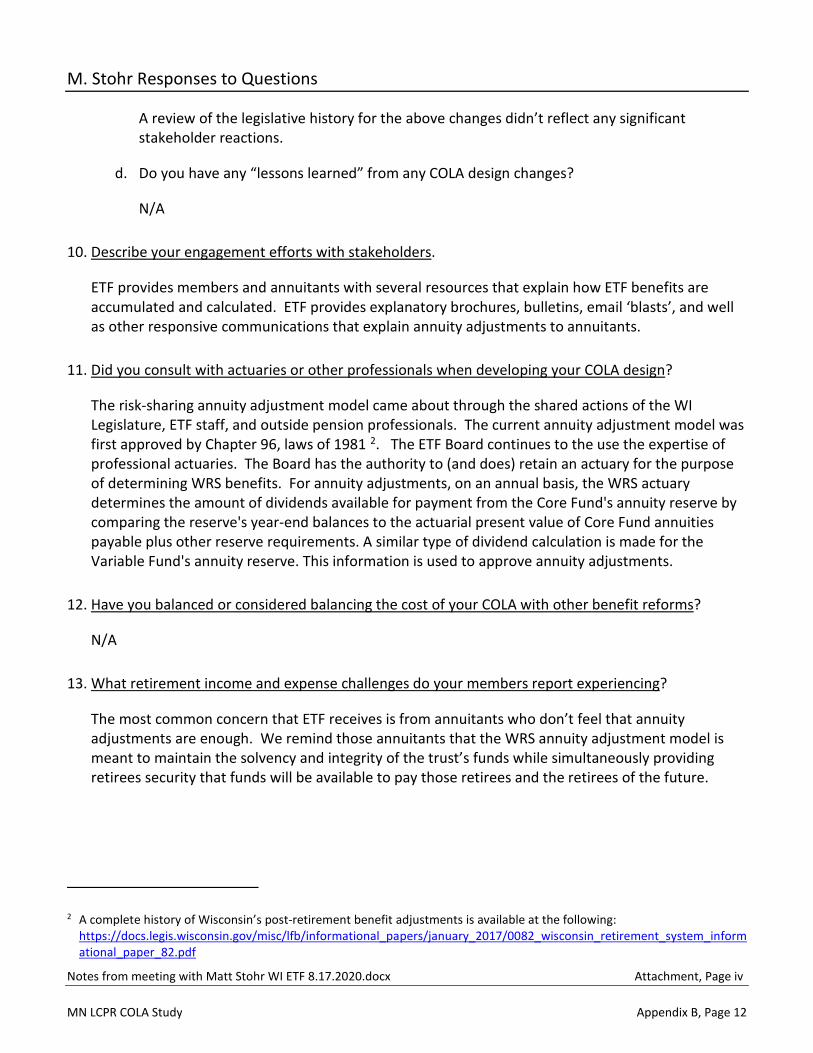
M. Stohr Responses to Questions
Notes from meeting with Matt Stohr WI ETF 8.17.2020.docx Attachment, Page iv
A review of the legislative history for the above changes didn’t reflect any significant stakeholder reactions.
d. Do you have any “lessons learned” from any COLA design changes?
N/A
10. Describe your engagement efforts with stakeholders.
ETF provides members and annuitants with several resources that explain how ETF benefits areaccumulated and calculated. ETF provides explanatory brochures, bulletins, email ‘blasts’, and wellas other responsive communications that explain annuity adjustments to annuitants.
11. Did you consult with actuaries or other professionals when developing your COLA design?
The risk-sharing annuity adjustment model came about through the shared actions of the WILegislature, ETF staff, and outside pension professionals. The current annuity adjustment model wasfirst approved by Chapter 96, laws of 1981 2. The ETF Board continues to the use the expertise ofprofessional actuaries. The Board has the authority to (and does) retain an actuary for the purposeof determining WRS benefits. For annuity adjustments, on an annual basis, the WRS actuarydetermines the amount of dividends available for payment from the Core Fund's annuity reserve bycomparing the reserve's year-end balances to the actuarial present value of Core Fund annuitiespayable plus other reserve requirements. A similar type of dividend calculation is made for theVariable Fund's annuity reserve. This information is used to approve annuity adjustments.
12. Have you balanced or considered balancing the cost of your COLA with other benefit reforms?
N/A
13. What retirement income and expense challenges do your members report experiencing?
The most common concern that ETF receives is from annuitants who don’t feel that annuityadjustments are enough. We remind those annuitants that the WRS annuity adjustment model ismeant to maintain the solvency and integrity of the trust’s funds while simultaneously providingretirees security that funds will be available to pay those retirees and the retirees of the future.
2 A complete history of Wisconsin’s post-retirement benefit adjustments is available at the following: https://docs.legis.wisconsin.gov/misc/lfb/informational_papers/january_2017/0082_wisconsin_retirement_system_informational_paper_82.pdf
MN LCPR COLA Study Appendix B, Page 12