report on the proposed 2016 cancer claim cost … report on the proposed 2016 cancer claim cost...
TRANSCRIPT

1
Report on the Proposed 2016 Cancer Claim Cost Valuation Tables
Joint American Academy of Actuaries and Society of Actuaries Cancer Claims Cost Tables Work Group
Presented to the National Association of Insurance Commissioners’ Health Actuarial Task Force
August 25, 2016
The American Academy of Actuaries is an 18,500+ member professional association whose mission is to serve the public and the U.S. actuarial profession. For more than 50 years, the Academy has assisted public policymakers on all levels by providing leadership, objective expertise, and actuarial advice on risk and financial security issues. The Academy also sets qualification, practice, and professionalism standards for actuaries in the United States. The Society of Actuaries (SOA) is an educational, research and professional organization dedicated to serving the public, its members and its candidates. The SOA’s mission is to advance actuarial knowledge and to enhance the ability of actuaries to provide expert advice and relevant solutions for financial, business and societal problems. The SOA’s vision is for actuaries to be the leading professionals in the measurement and management of risk.

2
Cancer Claims Cost Tables Work Group
Brad Spenney, MAAA, FSA—Chairperson
Members
Ashlee Borcan, MAAA, FSA
Alex Faynberg, MAAA, FSA
Matthew Fleischman, MAAA, CERA, ASA Monique Hacker, MAAA, FSA
Li Hwan Hwang, MAAA, ASA, FCAS
Darrell Knapp, MAAA, FSA
Peter Miller, MAAA, ASA
Jeffrey Morris, MAAA, FSA
Steve Niu, MAAA, FSA, EA
Thomas Persichetti, MAAA, ASA, FCA
Scott Randles, MAAA, FSA
Anita Recchio, MAAA, FSA
Frank Reynolds, MAAA, FSA, FCIA
Timothy Robinson, MAAA, FSA, FCA
Richard Schaefer, MAAA, FSA
Tomasz Serbinowski, MAAA, FSA
D. Joeff Williams, MAAA, FSA
Teresa Winer, MAAA, FSA
Ali Zaker-Shahrak, MAAA, FSA
Special thanks to Aolin Zhang, MAAA, ASA for assistance with data graduation

3
Table of Contents I. SUMMARY OF RESULTS ............................................................................................................. 4
II. INTRODUCTION ............................................................................................................................ 7
III. WORK GROUP FORMATION ..................................................................................................... 7
IV. INDUSTRY ....................................................................................................................................... 8
V. DATA CALL, PROCESSING, AND CALCULATIONS ............................................................. 9
A. Overview ................................................................................................................................................ 9
B. Data Scrubbing ...................................................................................................................................... 9
C. Incidence and Exposure ....................................................................................................................... 11
D. Data Scaling ......................................................................................................................................... 13
E. Scaled and Processed Data................................................................................................................... 13
VI. SIGNIFICANT FINDINGS IN THE RAW DATA ..................................................................... 15
A. Older and younger ages ....................................................................................................................... 15
B. Length of Stay ...................................................................................................................................... 16
C. Selection ............................................................................................................................................... 16
VII. CREATION OF THE BASIC TABLES ...................................................................................... 17
A. First Occurrence .................................................................................................................................. 18
B. Each Payment Hospitalization ............................................................................................................. 20
C. All Payment Hospitalization ................................................................................................................ 25
VIII. CREATION OF THE LOADED VALUATION TABLES ........................................................ 29
IX. CLAIM COST AND RESERVE COMPARISONS TO THE 1985 CANCER TABLES ........ 31
A. Claim Costs Comparison ..................................................................................................................... 31
B. Reserve Comparisons........................................................................................................................... 33
X. APPENDICES

4
I. Summary of Results
This section will summarize the most significant results of this study. The purpose of this project was twofold:
• To develop a new set of valuation tables for use with cancer insurance policies • To aid actuaries pricing and reviewing product filings by providing information
about the initial data provided by the industry in response to the data call.
The current tables used to value reserves for cancer policies were developed in 1985 based on experience data from the late 1970s. Since that time there have been changes in the medical treatment of cancer and therefore the product design of cancer policies. These trends and changes have limited the relevance of the 1985 tables, which can be seen in the results of this study. The study was limited to two benefits included in typical cancer policies: first occurrence benefit and cancer hospitalization. The first occurrence benefit is generally a lump sum amount paid on the first occurrence of cancer. Hospitalization benefits are generally indemnity amounts paid on a per day basis when the covered person is confined to a hospital for the treatment of a covered cancer. Key results of our work are provided below:
• The incidence of cancer in the proposed valuation table shows a slightly different pattern by attained age than that in the 1985 table. The proposed table for first occurrence rates shows higher incidence rates in the middle-age years than the 1985 tables. We believe that this is due to better medical tests for presence of cancer. The situation reverses in older ages, with the 1985 table first occurrence rates being higher than the proposed table. Figure 1 below demonstrates this difference.

5
This results in reserves for this benefit that rise faster but peak lower and fall faster than those computed off the 1985 tables.
• The hospitalization claims costs by attained age are significantly lower than those
in the 1985 tables. While we cannot separate the 1985 tables into incidence and length of stay, we believe that both are drivers of the difference. Overall medical trends have shown that outpatient surgery has trended higher since the 1985 tables, with a corresponding decrease in inpatient surgery stays. The overall length of hospital stays also have trended shorter. Figures 2 and 3 below demonstrate the difference in claims costs by age on each payment and all payment bases, respectively.
0
5
10
15
20
25
30
18 21 24 27 30 33 36 39 42 45 48 51 54 57 60 63 66 69 72 75 78 81 84 87 90 93 96 99
Firs
t Occ
urre
nce
Rate
per
100
0
Attained Age
Figure 1—First Occurrence Rate Comparison: 1985 to Proposed
1985 Female 1985 Male Proposed Female Proposed Male

6
-
10
20
30
40
50
60
70
80
90
100
18 21 24 27 30 33 36 39 42 45 48 51 54 57 60 63 66 69 72 75 78 81 84 87 90 93 96 99
Clai
m C
ost f
or $
100
of D
aily
Hos
pita
l Ben
efit
Attained Age
Figure 2—Each Payment Hospitalization Claim Cost Comparison: 1985 to Proposed
1985 Female 1985 Male Proposed Female Proposed Male
-
10
20
30
40
50
60
70
80
90
18 21 24 27 30 33 36 39 42 45 48 51 54 57 60 63 66 69 72 75 78 81 84 87 90 93 96 99
Clai
m C
ost f
or $
100
Daily
Ben
efit
Attained Age
Figure 3—All Payment Hospitalization Claim Cost Comparison: 1985 to Proposed
1985 Female 1985 Male Proposed Female Proposed Male

7
The result of the difference in claim costs is a significantly lower reserve buildup using the proposed table as compared to the 1985 table.
• The initial raw data showed declining first occurrence rates, hospital incidence
rates, and lengths of stay at older attained ages (approximately age 80 depending on the gender and whether all payment or each payment incurral dating is being considered). The 1985 first occurrence rates also exhibited a decline, but only at ages over 90. The Cancer Claims Cost Tables Work Group (work group) agreed that the declining pattern of incidence rates for both genders should be removed due to the risk of negative reserve calculations. A discussion of how the work group graduated the data can be found in section VII.
• The work group elected not to produce a select and ultimate table for the final
work product. In conducting the analysis, the group found a pattern of anti-selection in the first several durations. A presentation of those findings can be found in section VI and the proposed tables can be found in the appendicies.
II. Introduction
This report describes the work performed by the work group. The purpose of this report is to propose new cancer valuation tables for cancer policies as well as to document the processes followed by the work group in preparing the proposed tables. In addition to the proposed valuation tables and documentation provided, the work group has also included experience information from the cancer claim cost study conducted in order to make this information available to practitioners in the industry.
III. Work Group Formation
On May 12, 2004, Julia Philips, chair of the Accident and Health Working Group (AHWG) of the Life and Annuity Task Force of the National Association of Insurance Commissioners (NAIC) requested the SOA Board Advisory Group on Research to review the 1985 cancer tables. This charge was subsequently taken over by the NAIC’s Health Actuarial Task Force (HATF) following its formation. The request is provided below:
The Accident and Health Working Group of the Life and Health Actuarial Task Force accepted a proposal at the NAIC 2004 Spring National Meeting to pursue a review of the 1985 NAIC Cancer Claim Cost Tables used as the minimum valuation standard for contract reserves for individual policies currently being issued. It was noted that these tables have become dated and could produce inadequate reserves when used. Specifically, cancer detection methods and treatment procedures, such as chemotherapy and prescription drugs, have materially changed in the years since the 1985 tables were adopted. This could cause a change in the claim cost patterns for the product types being offered today from those offered when the 1985 tables data was collected and reviewed. In addition,

8
regulators have seen significant rate increases for policies that used the 1985 tables to price cancer products. The Accident and Health Working Group requests the assistance of the Society of Actuaries in pursuing said review. Please consider undertaking a study of recent cancer claim costs as compared to those in the 1985 tables along with subsequent suggestions for appropriate tables for use as the future valuation standard for individual cancer policies. Please advise us of your ability to undertake such a study and any resulting timeframe for expected completion. The Accident and Health Working Group stands ready to answer any questions you may have regarding this request.
In April 2010, the AHWG requested the Academy provide guidance on how to adjust the cancer tables to account for the current level of benefits, and the SOA and the Academy then formed the work group. The original intent of the work group was to generate new cancer valuation tables with the same breadth of benefits as the 1985 tables. To achieve this objective, a broad data call was sent to carriers in the industry requesting historical experience on the wide variety of benefits typically included in cancer policies. The response to this data call was poor, resulting in a reassessment of the task by the work group. Given the difficulties, the work group elected to revise the data call to request a smaller subset of key cancer benefits rather than the large number previously requested. First occurrence and hospitalization were identified as particularly important. Radiation and chemotherapy benefits were also considered, but given the wide range of benefit configurations in the industry, it was not feasible to collect and aggregate radiation and chemotherapy claim data from a broad range of carriers in a meaningful way. As a result, the data collected and processed in support of this report is for the first occurance and hospitalization benefits only.
IV. Industry
Fifteen insurers responded to a request by the SOA to supply claim data on first occurrence and hospitalization benefits from cancer policies (excluding critical illness policies) covering years 2001 through 2010. These 15 companies included the major writers of cancer policies and, in total, represented about 69 percent of the industry in terms of 2008 annual earned premium.
The companies that submitted data were:
• American Family Life Assurance Company of Columbus • American Family Life Assurance Company of New York • American Fidelity Assurance Company • American Heritage Life Insurance Company

9
• Central United Life Insurance Company (submission representing both direct business and business assumed/acquired)
• CNO Financial Group (submission representing both direct business and business assumed/acquired)
• Colonial Life & Accident Insurance Company • Combined Insurance Company of America • Combined Life Insurance Company of New York • Continental American Insurance Company • Family Heritage Life Insurance Company of America • Humana Insurance Company (submission representing both direct business and
acquired business from Kanawha Insurance Company) • Life Insurance Company of Alabama • The MEGA Life and Health Insurance Company • Mid-West National Life Insurance Company of Tennessee
V. Data Call, Processing, and Calculations
A. Overview The objective of the study was to receive and summarize detailed policyholder experience data from 2001 through 2011 from insurers that have provided cancer insurance. The data was collected and analyzed for use by the work group. The data call provided to all potential study participants is included in Appendix 1. Milliman Inc. was engaged by the SOA to complete the data compilation of the cancer experience. This section describes the data scubbing, scaling, and deidentification processes performed by Milliman and the SOA.
B. Data Scrubbing
The data was gathered from the companies and subjected to a rigorous data scrubbing process. The scrubbing process better assured that the data presented to the work group was appropriate for use. Across all submissions, data was excluded for a variety of reasons. If Milliman could not reliably identify key information for the insured, key information for the claim, and a reliable link between the two, the data was not included in the study. After considerable correspondence with each of the submitters, this missing data was populated if available, and any residual insureds with missing data were excluded. In some instances, entire datasets were excluded. General information with respect to the data submissions is included below. Routine data maintenance items, such as exclusions due to missing birthdates or gender indicators as well as non-covered benefit types, are not included in the list below.

10
• Data was submitted for primary insureds for all submitters. Some submitters were also able to provide spousal information. No submitter included reliable child data.
• With respect to spousal data, in some instances only a spouse’s gender was provided and not the spouse’s date of birth. In these instances an age difference study at the submitter company level was utilized to populate the birthdate of the spouse based on the birthdate and gender of the primary insured.
• There were instances of overlapping exposure in the study. These instances were collapsed down to continuous single exposure records to avoid duplicative contributions.
• Often the data submissions included gaps in coverage. Specific feedback was received from the submitting companies in order to properly account for these gaps.
• Where possible, skin cancer and in situ claims were specifically excluded from the study; however, there were instances where these claims may have been present and Milliman was unable to identify them.
Successive Hospital Stays Consistent with industry practice, successive hospital stays have been considered as a single confinement if they are separated by 30 days or less. Successive stays that meet this requirement have been combined to a single confinement incidence with a length of stay calculated as total confinement days for the applicable stays. Truncating Based on Age For all companies, all records associated with an issue age of less than 18 years old or greater than 90 years old were removed from the raw data submitted to the work group. Results were also excluded for attained ages greater than 90 due to limited exposure and a perceived lack of reliability associated with the results for these ages. Outlier Data Within the study there were cells that contained obvious outlier data. Commonly these outliers were visible where exposure is sparse at the high and low ages. The raw data provided to the work group was not processed or smoothed to remove outliers, as they are expected in any large data set. Spouse Data Where covered spouse data was submitted, it has been included under the spouse’s characteristics, not the characteristics of the primary insured. As an example, for a 50-year-old male covered with his 48-year-old female spouse, the spouse would be included in the appropriate contribution cell for a 48-year-old female, not aggregated with the primary insured’s data as a 50-year-old male.

11
C. Incidence and Exposure
Once the data provided by the submitters was processed, incidence, exposure, and length of stay information was calculated. Any user of this report and the proposed valuation tables needs to be cognizant of the methodology used to develop the exposure and incidence presented to assure that the approach is appropriate for and consistent with the user’s intended application, particularly in determining premium rates and reserves. The scrubbed data for the first occurrence portion of the study has been processed into incidence rate results. The scrubbed data for the hospitalization portion of the study has been processed into incidence rate and length of stay results. Where possible, the hospitalization data has been presented using two calculation methodologies: “Each Payment” and “All Payment.” While the exposure calculated between the methodologies is equal for a given policyholder, incidence and length of stay is derived differently under each methodology. These two methodologies are provided because they are both used by insurance companies active in the market. Exposure and Incidence—First Occurrence All calculations are on an age last birthday (ALB) basis and are associated with the attained age of the insured person on the most recent policy anniversary.
• If the policy is in force for the entire policy year and no claim has been recorded, incidence is equal to 0 and exposure is equal to 1.
• If the policy is in force for the entire policy year and a first occurrence claim is recorded, incidence is equal to 1 and exposure is equal to 1.
• If the policy terminated before the end of the policy year and no claim has been recorded in the partial policy year, incidence is equal to 0 and exposure is equal to the proportion of the policy year during which the coverage was in force. For example, if the policy was in force for half a year, the exposure would be 0.5.
• If the policy terminated before the end of the policy year and a claim has been recorded, incidence is set to 1 and exposure is set to 1.
It should be noted that when a policy incurred a first occurrence claim, no subsequent exposure for this policy was included in the study. This is consistent with an administration philosophy that terminates policyholders following a first occurrence benefit for an individual as no subsequent first occurrence benefit is available.

12
Exposure and Incidence—Hospitalization—Each Payment All calculations are on an ALB basis and are associated with the attained age of the insured person on the most recent policy anniversary.
• If the policy is in force for the entire policy year and no claim has been recorded, incidence is equal to 0 and exposure is equal to 1.
• If the policy is in force for the entire policy year and one or more claims have been recorded, incidence is equal to the number of distinct hospitalizations and exposure is equal to 1.
• If the policy terminated before the end of the policy year and no claims have been recorded in the partial policy year, incidence is equal to 0 and exposure is equal to the proportion of the policy year during which the coverage was in force. For example, if the policy was in force for half a year, the exposure would be 0.5.
• If the policy terminated before the end of the policy year and one or more claims have been recorded in the partial policy year, incidence is equal to the number of distinct hospitalizations and exposure is equal to the proportion of the policy year during which the coverage was in force.
Exposure and Incidence—Hospitalization—All Payment All exposure calculations are on an ALB basis and are associated with the age of the individual on the most recent policy anniversary. Incidence for claims are calculated consistently with the “Hospitalization—Each Payment” approach, but the claims are associated with the policy year (duration) during which the first hospitalization occurred. It is important to note that these claims are dated based upon the first hospitalization, not the first occurrence of cancer or first instance of any type of non-wellness cancer claim.
• If the policy is in force for the entire policy year and no claim has been recorded, incidence is equal to 0 and exposure is equal to 1.
• If the policy is in force for the entire policy year and one or more claims have been recorded, exposure is equal to 1. Incidence is equal to the number of distinct hospitalizations and is recognized with the incidence for the policy year when the first hospitalization for the covered insured occurred.
• If the policy terminated before the end of the policy year and no claims have been recorded in the partial policy year, incidence is equal to 0 and exposure is equal to the proportion of the policy year during which the coverage was in force. For example, if the policy was in force for half a year, the exposure would be 0.5.
• If the policy terminated before the end of the policy year and one or more claims have been recorded in the partial policy year, exposure is equal to the proportion of the policy year during which the coverage was in force. Incidence is equal to the number of distinct hospitalizations and is
13
recognized with the policy year during which the first hospitalization occurred.
Hospitalization—Length of Stay Length of stay for the study was calculated by summing the total days of stay and dividing by the total number of claims for a given data cell.
D. Data Scaling
The scrubbed data was scaled to meet the confidentiality guidelines set forth by the SOA. The guidelines require that for each gender and age combination there have to be at least five distinct companies that contribute exposure (five companies requirement). Additionally, no company can contribute more than 25 percent of the exposure for a given gender and age combination (25 percent limit). This helps avoid one company’s experience from unduly influencing the overall results of the study. For the All Payment Hospitalization study as well as First Occurrence study, each age and gender combination met the five companies requirement. However, some age and gender combination failed the 25 percent limit requirement and the data for these age and gender combinations had to be scaled. As a result, incidence and days of stay are often presented as fractional values. For the Each Payment study, the five companies requirement was not met for males at certain younger and older ages as well as age 43. Therefore, male results were aggregated at certain points into age bands such that each age band met the requirement (18-37 band, 43-44 band, and 76-90 band). There was no need to aggregate any of the female data, so the female results are presented on an age-distinct basis. Again, both male and female data had to be scaled for many ages due to failing the 25 percent limit requirement. Where the male data was aggregated, the aggregated data is presented for an age band and represents the sum of the data for all ages within the band. The aggregated data for the age band has not been divided in order to provide an implied exposure per age.
E. Scaled and Processed Data
After scaling and processing, the data was in a form to provide to the work group. It was deidentified as to participant. In total, approximately 27 million life years of exposure are included in the first occurrence portion of the study. The data tables containing the raw data have been included in this report as Appendix 2. It should be noted that while this data has been processed and scaled as described above, it is unsmoothed or otherwise refined for use. Below is a summary of final scaled total exposure amounts by age band and gender.

14
TABLE 1 FIRST OCCURRENCE EXPOSURE BY AGE BAND AND GENDER
Life Years Distribution
Age Band Female Male Female Male
18-39 3,375,534 2,152,416 12.6% 8.0%
40-49 4,849,821 2,965,059 18.1% 11.1%
50-59 5,298,167 3,056,370 19.8% 11.4%
60-69 2,466,416 1,484,292 9.2% 5.5%
70+ 722,902 417,417 2.7% 1.6%
Total 16,712,840 10,075,554 62.4% 37.6%
Approximately 25 million life years of exposure are included in each of the hospital confinement portions of the study. Below is a summary of the final scaled total exposure amounts by age band and gender for both the Each Payment and the All Payment study results. It should be noted that some submissions were specific to a particular hospital confinement calculation methodology. This accounts for the difference in the overall exposure between the two methodologies.
TABLE 2 HOSPITALIZATION—EACH-PAYMENT EXPOSURE BY AGE BAND AND GENDER
Life Years Distribution
Age Band Female Male Female Male
18-39 3,327,847 1,962,415 13.3% 7.8%
40-49 4,794,804 2,594,810 19.1% 10.4%
50-59 5,344,557 2,750,622 21.3% 11.0%
60-69 2,262,747 1,315,465 9.0% 5.2%
70+ 425,772 291,743 1.7% 1.2%
Total 16,155,727 8,915,055 64.4% 35.6%

15
TABLE 3 HOSPITALIZATION—ALL-PAYMENT EXPOSURE BY AGE BAND AND GENDER
Life Years Distribution
Age Band Female Male Female Male
18-39 3,331,863 2,028,091 13.0% 7.9%
40-49 4,848,404 2,712,846 18.9% 10.5%
50-59 5,362,188 2,834,298 20.9% 11.0%
60-69 2,308,912 1,377,106 9.0% 5.3%
70+ 546,500 357,905 2.1% 1.4%
Total 16,397,867 9,310,246 63.9% 36.1%
VI. Significant Findings in the Raw Data
Once the data processing was complete and the data was provided to the work group, the characteristics of the data were analysed and evaluated. Additionally, the data was reviewed for overall reasonableness by the group as a whole. In order to facilitate the review of the data, the work group formed subcommittes to consider specific topics. The subgroups and key summaries of their analysis are presented below.
A. Older and younger ages
The subgroup working on older and younger ages observed a decline in incidence rates at the older ages that was inconsistent with the 1985 cancer tables. Given the limited amount of data at older ages, it was difficult to determine whether the drop in incidence rates was due to a lack of credible data or indicative of a true decline. The subgroup reviewed cancer incidence data available from the National Cancer Institute Surveillance, Epidemiology, and End Result Program (SEER). The incidence rates presented in SEER also supported a decline in incidence rates at advanced ages. The subgroup presented these findings to the work group as a whole for discussion. Based on the information available to the work group as well as the group’s collective experience, it was determined that there was sufficient evidence to be comfortable with a materially flatter older age claim cost curve relative to the 1985 tables. It was decided that the data should be graduated and smoothed, but that it was not necessary to artificially induce an older age curve consistent with the slope of the 1985 tables. The subgroup observed increased volatility at the very old and very young ages due to limited exposure. This was expected, and the work group anticipated that this volatility would be smoothed prior to the finalization of the tables.

16
The subgroup made a number of observations with respect to gender differences at the older ages and overall patterns. Based on discussion within the subgroup and subsequent discussion with the work group, none of the patterns observed created any material concerns.
B. Length of Stay There have been significant changes in the health care delivery system since the original study on cancer incidence and length of stay in 1985. Advances in screening and detection technology as well as treatment and advances in surgical techniques have had significant impacts on the results. Notably, overall lengths of stay for inpatient hospital admissions have dropped significantly over the past 25 years. The subgroup working on length of stay observed decreased lengths of stay in the new study data compared to the 1985 tables, consistent with observed treatment trends. Other notable observations from the length of stay data:
• The data indicated that adults with incidence of cancer at younger ages (<30 years) have a higher average length of stay, with a distinct difference between males and females.
o Further research, including discussions with physicians, indicated that the types of cancer diagnosed in adults less than 30 is materially different than those in older ages, typically more leukemia and lymphoma requiring longer treatment as compared to site tumors, which more often require a surgical stay for extraction.
o It is more likely that incidence of cancer at older ages is detected sooner, thereby requiring less acute resources.
• The data implied that length of stay begins to increase in older ages, but at a relatively slow rate, likely reflecting the overall trend of all admissions as individuals age.
Overall this subgroup had no material concerns with respect to the data and supported the development of separate incidence and length of stay tables to be created for the proposed valuation tables.
C. Selection The subgroup working on selection conducted analysis on the durational data gathered for the study in order to determine whether selection was present and should be reflected in the proposed tables. No discernible positive selection was observed. On the contrary, the group observed some anti-selection in early durations of the first occurrence data and to a lesser extent for the hospitalization data, where ultimate rates were lower than select period rates, but patterns were not uniform. Based on its analysis, the subgroup recommended that the proposed valuation tables be presented in ultimate rather than select and ultimate form. The subgroup

17
recommended that the anti-selection observed in the First Occurrence data be included in the final work group cancer table report. Aggregate, age-adjusted durational selection patterns observed in the raw first occurrence data have been included with this report as Appendix 3. In order to calculate the age-adjusted selection factors, the durational data received from Milliman was analyzed. Data by unique duration was provided by Milliman for durations 1-4 only; durations 5 and higher were aggregated. First, data by duration was aggregated to calculate the relative incidence rate between each duration and the ultimate 5+ duration. These incidence rate relationships were then adjusted to remove the calculated impact of aging across the durations. This was done by analyzing the average age for each duration (i.e., 1, 2, 3, 4, and 5+) and determining the average impact of aging utilizing the incidence trends from the raw first occurrence data. The impact of aging between each duration and the ultimate 5+ duration was then removed from the unadjusted selection factors in order to produce the age-adjusted selection factors included in Appendix 3. The basic and loaded tables included with this report represent the aggregate experience across all durations without an adjustment for the anti-selection observed in the earlier durations. The exposure-weighted average duration for the raw first occurrence data used in the study, where all durations past 4 are assigned duration 5, is 3.5.
Throughout the review of the data, all subgroups and the work group as a whole considered the differences between the 1985 cancer tables and the proposed cancer tables. Where material differences were present, the work group found them to be explicable based upon known trends in medical treatment as well as other incidence rate and historical experience information available to us from public sources as well as our own experience.
VII. Creation of the Basic Tables
The scaled initial data exhibited volatility typical in industry data collection. The data needed to be graduated prior to finalizing basic and valuation tables. The work group tested a large number of graduation methods to achieve several goals:
• Smooth the inherent volatility in the data collected • Provide a good fit to the initial data • Demonstrate flexibility to control the risk of negative reserve calculations
due to declining data patterns for younger and older ages • Demonstrate flexibility to develop reasonable patterns where data over a
number of attained ages had to be aggregated in order to meet SOA confidentiality guidelines
The work group chose a graduation method termed GLM-3, a form of generalized linear model, as the best choice for graduating the cancer study data. A generalized linear model
18
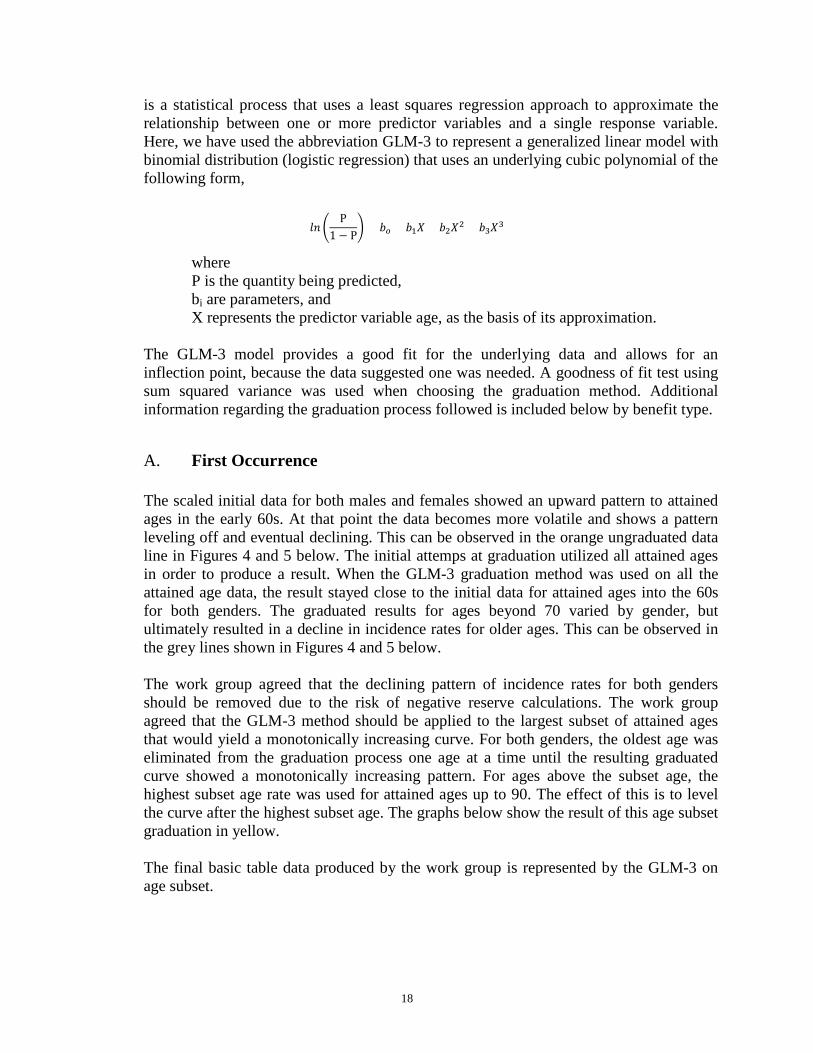
is a statistical process that uses a least squares regression approach to approximate the relationship between one or more predictor variables and a single response variable. Here, we have used the abbreviation GLM-3 to represent a generalized linear model with binomial distribution (logistic regression) that uses an underlying cubic polynomial of the following form,
𝑙𝑙 �(P)
1 − P� = 𝑏𝑜 + 𝑏1𝑋 + 𝑏2𝑋2 + 𝑏3𝑋3
where P is the quantity being predicted, bi are parameters, and X represents the predictor variable age, as the basis of its approximation.
The GLM-3 model provides a good fit for the underlying data and allows for an inflection point, because the data suggested one was needed. A goodness of fit test using sum squared variance was used when choosing the graduation method. Additional information regarding the graduation process followed is included below by benefit type.
A. First Occurrence The scaled initial data for both males and females showed an upward pattern to attained ages in the early 60s. At that point the data becomes more volatile and shows a pattern leveling off and eventual declining. This can be observed in the orange ungraduated data line in Figures 4 and 5 below. The initial attemps at graduation utilized all attained ages in order to produce a result. When the GLM-3 graduation method was used on all the attained age data, the result stayed close to the initial data for attained ages into the 60s for both genders. The graduated results for ages beyond 70 varied by gender, but ultimately resulted in a decline in incidence rates for older ages. This can be observed in the grey lines shown in Figures 4 and 5 below. The work group agreed that the declining pattern of incidence rates for both genders should be removed due to the risk of negative reserve calculations. The work group agreed that the GLM-3 method should be applied to the largest subset of attained ages that would yield a monotonically increasing curve. For both genders, the oldest age was eliminated from the graduation process one age at a time until the resulting graduated curve showed a monotonically increasing pattern. For ages above the subset age, the highest subset age rate was used for attained ages up to 90. The effect of this is to level the curve after the highest subset age. The graphs below show the result of this age subset graduation in yellow. The final basic table data produced by the work group is represented by the GLM-3 on age subset.

19
0
5
10
15
20
25
30
35
40
45
18 23 28 33 38 43 48 53 58 63 68 73 78 83 88
Inci
denc
e Ra
te p
er 1
000
Attained Age
Figure 4—Male First Occurrence Rate Summary
Ungraduated GLM3 on All Attained Ages GLM3 on Age Subset
0
2
4
6
8
10
12
14
16
18
20
18 23 28 33 38 43 48 53 58 63 68 73 78 83 88
Inci
denc
e Ra
te p
er 1
000
Attained Age
Figure 5—Female First Occurrence Rate Summary
Ungraduated GLM3 on All Attained Ages GLM3 on Age Subset

20
B. Each Payment Hospitalization Beyond the distinction between all payment and each payment hospitalization claims, the hospital claim cost data is presented separately by incidence and length of stay. The work group graduated incidence and length of stay data separately in order to preserve the disctinction in the proposed valuation tables. The older age male rates were combined due to SOA confidentiality guidelines as described in the data scaling section presented earlier in this report. As such, it was necessary to make an adjustment to the graduation process utilized in order to account for the banding. Where banding was present, the exposure-weighted average age from the appropriate ages in the female each payment hospitalization data was utilized to define the modeled age for each of the age bands in the male data. As an example, the female each payment exposure-weighted average age for ages 76-90 was 80.1; therefore, 80 was the assumed modeled age for the combined male ages 76-90 band for graduation purposes. The total exposure for the age band was then assigned to the assumed modeled age in order to perform the graduation. The work group considered and tested multiple methodologies in order to appropriately consider the male age bands, with little variability in results. Due to the presence of banding in the male each payment data, a trend in older ages incidence rates is not readily apparent in the orange ungraduated data line in Figure 6 below. Use of all attained ages in the graduation process again resulted in a decrease in incidence rates at higher ages, as shown in the gray line in Figure 6 below. As a result, a consistent subset age methodology was utilized in order to flatten the incidence rates at older ages. The final age subset graduation result can be observed as the yellow line in Figure 6 below.

21
The rates for females show a declining pattern at older ages, consistent with ungraduated first occurrence data presented in Figures 4 and 5 above. The application of GLM-3 with all ages, as previously discussed, results in an increasing pattern by attained age. Therefore, consistent with the other benefit type presented previously, an age subset was utilized to develop the graduated female hospitalization each payment data.
-
0.0050
0.0100
0.0150
0.0200
0.0250
0.0300
18 23 28 33 38 43 48 53 58 63 68 73 78 83 88
Inci
denc
e Ra
te
Attained Age
Figure 6—Male Hospitalization Each Payment Incidence Rate Summary
Ungraduated GLM3 on All Attained Ages GLM3 on Age Subset

22
As described in the hospitalization each payment discussion above, due to data aggregation, male length of stay was banded at certain ages. The banding can be observed in Figure 8 below, which contains the presentation of the male each payment length of stay graduation results. The methodology for graduating with the age bands for the length of stay data is consistent with the approach utilized for the hospitalization each payment incidence rate data. Female each payment length of stay rates were very high at young ages before stabilizing, which can be observed in Figure 9. The scale of the female graph below is not able to show the outlier young age length of stay. As an example, the age 20 female length of stay was 79.6 days. The exact length of stay for each age can be found in Appendix 2 of this report. The method used for graduation for both males and females was similar to that described for first occurrence. The figures below show the result of this graduation method (initial data, GLM-3 graduation on all attained ages, and GLM-3 on age subset) for male and female each payment lengths of stay.
-
0.0050
0.0100
0.0150
0.0200
0.0250
0.0300
18 23 28 33 38 43 48 53 58 63 68 73 78 83 88
Inci
denc
e Ra
te
Attained Age
Figure 7—Female Hospitalization Each Payment Incidence Rate Summary
Ungraduated GLM3 on All Attained Ages GLM3 on Age Subset

23
-
5.0
10.0
15.0
20.0
25.0
18 23 28 33 38 43 48 53 58 63 68 73 78 83 88
Leng
th o
f Sta
y (d
ays)
Attained Age
Figure 8—Male Hospitalization Length of Stay Each Payment Summary
Ungraduated GLM3 on All Attained Ages GLM3 on Age Subset
0.0
5.0
10.0
15.0
20.0
25.0
30.0
18 23 28 33 38 43 48 53 58 63 68 73 78 83 88
Leng
th o
f Sta
y (d
ays)
Attained Age
Figure 9—Female Hospitalization Length of Stay Each Payment Summary
Ungraduated GLM3 on All Attained Ages GLM3 on Age Subset

24
The claim cost graphs are the product of the incidence and length of stay rates. These graphs are detailed below.
0.00
0.05
0.10
0.15
0.20
0.25
0.30
18 21 24 27 30 33 36 39 42 45 48 51 54 57 60 63 66 69 72 75 78 81 84 87 90
Clai
m C
ost p
er $
1 of
Dai
ly H
ospi
tal B
enef
it
Attained Age
Figure 10—Male Hospitalization Aggregate Claim Cost Each Payment Summary
Ungraduated GLM3 on All Attained Ages GLM3 on Age Subset
0.00
0.05
0.10
0.15
0.20
0.25
0.30
18 23 28 33 38 43 48 53 58 63 68 73 78 83 88
Clai
m C
ost p
er $
1 of
Dai
ly H
ospi
tal B
enef
it
Attained Age
Figure 11—Female Hospitalization Aggregate Claim Cost Each Payment Summary
Ungraduated GLM3 on All Attained Ages GLM3 on Age Subset

25
When reviewing the each payment hospitalization results, it should be noted that shock hospitalization claims (i.e., those with a length of stay longer than 30 days) were not excluded from the analysis.
C. All Payment Hospitalization As observed in the data discussed earlier in this report, hospital incidence on all payment basis for both males and females declined at older attained ages. There was no issue with the five companies requirement for the all payment data; therefore, no age aggregation occurred. The graphs below show the development of the graduated curves for all payment hospital incidence. The method of graduation was similar to that described for first occurrence and hospitalization each payment rates above. The graphs below show the result of this graduation method (initial data, GLM-3 graduation on all attained ages, and GLM-3 on age subset) for male and female all payment hospital incidence.
-
0.0050
0.0100
0.0150
0.0200
0.0250
0.0300
18 23 28 33 38 43 48 53 58 63 68 73 78 83 88
Inci
denc
e Ra
te
Attained Age
Figure 12—Male Hospitalization Incidence All Payment Rate Summary
Ungraduated GLM3 on All Attained Ages GLM3 on Age Subset

26
The all payment hospital length of stay exhibited similar characteristics as the female each payment length of stay. For the all payment length of stay data for both genders, the young attained ages stays were quite long. The work group discussed the general length of stay for the young attained ages with physicians who attributed it to treatment for blood cancers in young people. These treatment regimens cause long hospital stays. The stay for males age 19 was 220.9 days and the stay for females age 20 was 56.3 days in the initial data. The results for each age can be found in Appendix 2. The method of graduation used for all payment length of stay was similar to that described for first occurrence rates. For male all payment length of stay, the GLM-3 with adjusted tail is the same as GLM-3 with unadjusted tail because the tail already exhibits a monotonically increasing nature. The graphs below show the result of this graduation method (initial data, GLM-3 graduation on all attained ages, and GLM-3 on age subset) for male and female all payment lengths of stay.
-
0.0050
0.0100
0.0150
0.0200
0.0250
18 21 24 27 30 33 36 39 42 45 48 51 54 57 60 63 66 69 72 75 78 81 84 87 90
Inci
denc
e Ra
te
Attained Age
Figure 13—Female Hospitalization Incidence All Payment Rate Summary
Ungraduated GLM3 on All Attained Ages GLM3 on Age Subset

27
-
5.0
10.0
15.0
20.0
25.0
30.0
18 23 28 33 38 43 48 53 58 63 68 73 78 83 88
Leng
th o
f Sta
y (d
ays)
Attained Age
Figure 14—Male Hospital Length of Stay All Payment Summary
Ungraduated GLM3 on All Attained Ages GLM3 on Age Subset
0.0
5.0
10.0
15.0
20.0
25.0
30.0
18 23 28 33 38 43 48 53 58 63 68 73 78 83 88
Leng
th o
f Sta
y (d
ays)
Attained Age
Figure 15—Female Hospital Length of Stay All Payment Summary
Ungraduated GLM3 on All Attained Ages GLM3 on Age Subset

28
The claim cost graphs are the product of the incidence and length of stay rates. These graphs are detailed below.
0.00
0.05
0.10
0.15
0.20
0.25
0.30
18 23 28 33 38 43 48 53 58 63 68 73 78 83 88
Clai
m C
ost p
er $
1 of
Dai
ly H
ospi
tal B
enef
it
Attained Age
Figure 16—Male Hospitalization All Payment Aggregate Claim Cost Summary
Ungraduated GLM3 on All Attained Ages GLM3 on Age Subset
0.00
0.02
0.04
0.06
0.08
0.10
0.12
0.14
0.16
0.18
0.20
18 23 28 33 38 43 48 53 58 63 68 73 78 83 88
Clai
m C
ost p
er $
1 of
Dai
ly H
ospi
tal B
enef
it
Attained Age
Figure 17—Female Hospitalization Aggregate Claim Cost All Payment Rate Summary
Ungraduated GLM3 on All Attained Ages GLM3 on Age Subset

29
When reviewing the all payment hospitalization results, it should be noted that shock hospitalization claims (i.e. those with a length of stay longer than 30 days) were not excluded from the analysis.
Attained Ages Above 90 The data provided by Milliman stopped at age 90. The work group decided to extend the data to present a proposed valuation table with data through age 99. This is consistent with the 1985 cancer table construction. In order to extend the table, the rates for age 90 for each data element (first occurrence, hospitalization incidence all payment and each payment, and hospital length of stay all payment and each payment) were used as the values for attained ages 91-99. Actuarial judgment should be utilized where data is needed beyond age 99. Final Basic Tables The proposed basic tables approved by the work group have been included as Appendix 4.
VIII. Creation of the Loaded Valuation Tables
For statuatory conservatism, the work group developed separate loads to apply to each of the basic tables for cancer incidence, each payment hospitalization aggregate claim cost and all payment hospitalization aggregate claim cost. These loads were meant to cover the variation in individual company experience around the mean of the total aggregate experience. At the Fall, 2015 NAIC meeting, the work group proposed to HATF that the loads should be large enough to cover at least 80 percent of the contributing companies, and HATF accepted the work group’s proposal.
Before loading, the experience underlying the basic tables varied significantly across the contributing companies. The actual-to-expected ratios by company ranged from 70 to 137 percent for cancer incidence, from 86 to 113 percent for each payment hospitalization aggregate claim cost, and from 82 to 119 percent for all payments hospitalization aggregate claim cost. Due to the large variances across companies, the loads developed by the work group needed to be large enough to cover some companies with actual-to-expected results well over 100 percent.
To attain the goal of covering at least 80 percent of the companies, a 15.35 percent load needed to be added to the basic incidence rate table for the first occurrence incidence rates. For the hospitalization aggregate claim cost experience, the committee looked at the expected number of days on claim separately for the each payment and all payment experience. The number of days on claim was determined from the hospitalization claim incidence and the hospitalization claim length of stay results. The analysis for each payment hospitalization aggregate claim cost resulted in an 8.68 percent load to the basic aggregate claim cost table and covered 80 percent of the contributing companies. The analysis for the all payment hospitalization aggregate claim cost resulted in a 7.35 percent

30
load to the basic aggregate claim cost table and covered 80 percent of the contributing companies.
After the loads for the aggregate claims costs for the all payment and each payment benefit types were determined, the loads for the incidence and length of stay rates were developed. The relationship between the aggregate cost load, the incidence load and the length of stay load is:
𝑎𝑎𝑎𝑎𝑎𝑎𝑎𝑎𝑎 𝑐𝑙𝑎𝑐𝑐 𝑐𝑐𝑐𝑎 𝑙𝑐𝑎𝑙
= [ (1 + 𝑐𝑙𝑐𝑐𝑙𝑎𝑙𝑐𝑎 𝑙𝑐𝑎𝑙) ∗ (1 + 𝑙𝑎𝑙𝑎𝑎ℎ 𝑐𝑜 𝑐𝑎𝑎𝑠 𝑙𝑐𝑎𝑙)]− 1
Using the given aggregate claim cost load and an assumed load for incidence of 5 percent (same load for incidence in the 1985 cancer table), the load for length of stay rates can be determined using the following formula:
𝑙𝑎𝑙𝑎𝑎ℎ 𝑐𝑜 𝑐𝑎𝑎𝑠 𝑙𝑐𝑎𝑙 =(𝑎𝑎𝑎𝑎𝑎𝑎𝑎𝑎𝑎 𝑐𝑙𝑎𝑐𝑐 𝑐𝑐𝑐𝑎 𝑙𝑐𝑎𝑙 + 1)
(1 + 0.05)− 1
The resulting length of stay loads were:
Aggregate Incidence Length of Stay
All Payment 7.35% 5.00% 2.238% Each Payment 8.68% 5.00% 3.505%
The final, loaded 2016 cancer tables are shown in Appendix 5 and are produced by multiplying 1 plus the appropriate load from the above table and the applicable graduated incidence and length of stay rates from Appendix 4.
For example, for a male, age 35, the loaded rates are:
• Cancer incidence: 0.000871 x 1.1535 = 0.001005
• All Payment hospitalization aggregate claim cost: 0.012475 x 1.0735 =
0.013392
• Each Payment hospitalization aggregate claim cost: 0.011775 x 1.0868 = 0.012797
An additional analysis looked at the experience by age and by company to determine whether a load that varied by age would produce a more efficient coverage if the mix of business by age were to change in the future. The results of this analysis did not show a large variance of actual-to-expected loss ratios by age and confirmed the work group’s decision to propose a level load across all ages.

31
IX. Claim Cost and Reserve Comparisons to the 1985 Cancer Tables
The work group analyzed the impact the proposed tables would have to claim costs and reserves. Below is a summary of the analysis that was conducted.
A. Claim Costs Comparison Figure 18 below shows the comparison of first occurrence rates for the 1985 and the proposed valuation tables.
For the young attained ages, the two tables are very close. As the attained ages increase into the middle-age years, the proposed table first occurrence rates are higher. This higher pattern continues until attained ages in the 60s and 70s depending on gender. For older attained ages, the 1985 table shows higher rates. The 1985 table rates decrease in the attained ages 90-99. This area was held level in the current study through the work group’s choice of graduation method. Figure 19 below shows the each Payment hospitalization claim cost comparison for the 1985 and prposed tables.
0
5
10
15
20
25
30
18 23 28 33 38 43 48 53 58 63 68 73 78 83 88 93 98
Firs
t Occ
urre
nce
Rate
per
100
0
Attained Age
Figure 18—First Occurrence Rate Comparison
1985 Female 1985 Male Proposed Female Proposed Male

32
The 1985 claim costs are fairly close for the youngest ages but diverge for attained ages in the 20s and are significantly higher for all ages above 35. The work group believes that trends in all hospitalization stays are the most significant reason for the difference compounded by changes in cancer treatments that rely more heavily on outpatient treatment. Figure 20 below shows the each payment hospitalization claim cost comparison for the 1985 and proposed tables.
-
10
20
30
40
50
60
70
80
90
100
18 23 28 33 38 43 48 53 58 63 68 73 78 83 88 93 98
Clai
m C
ost f
or $
100
of D
aily
Hos
pita
l Ben
efit
Attained Age
Figure 19—Each Payment Hospitalization Claim Cost Comparison
1985 Female 1985 Male Proposed Female Proposed Male

33
The all payment hospitalization claim costs largely follow the same pattern as each payment hospitalization. The 1985 table claim costs are significantly higher than those for the proposed table.
B. Reserve Comparisons The following graphs show comparisons of reserves for the first occurrence rates for the 1985 and proposed tables. The reserves are based on a $10,000 lump sum benefit upon occurrence of cancer. The lapse rates and interest are the same between calculations. Results are shown for ages 35, 45, and 55. Male and female reserve comparisons are shown in separate graphs.
-
10
20
30
40
50
60
70
80
90
18 23 28 33 38 43 48 53 58 63 68 73 78 83 88 93 98
Clai
m C
ost f
or $
100
Daily
Ben
efit
Attained Age
Figure 20—All Payment Hospitalization Claim Cost Comparison
1985 Female 1985 Male Proposed Female Proposed Male

34
-
200
400
600
800
1,000
1,200
1,400
1,600
1,800
2,000
1 6 11 16 21 26 31 36 41 46 51 56 61
Rese
rve
per p
olic
y 10
,000
ben
efit
Duration (years)
Figure 21—Male First Occurrence Reserves
Proposed Table Age 35 Proposed Table Age 45 Proposed Table Age 55
85 Table Age 35 85 Table Age 45 85 Table Age 55
-
100
200
300
400
500
600
700
800
900
1,000
1 6 11 16 21 26 31 36 41 46 51 56 61
Rese
rve
per p
olic
y 10
,000
ben
efit
Duration (years)
Figure 22—Female First Occurrence Reserves
Proposed Table Age 35 Proposed Table Age 45 Proposed Table Age 55
85 Table Age 35 85 Table Age 45 85 Table Age 55

35
Male reserve calculations are similar for early durations but tend to peak lower and earlier than the reserves the 1985 table produced. This is a result of the higher and older age peak occurrence rates in the 1985 table and the flattening of older attained age occurrence rates in the proposed table. The female reserve calculations are more comparable between the 1985 and proposed tables. The proposed table reserves peak at levels slightly lower than 1985 table. The proposed table reserves tend to decrease from their peak at a faster rate than the 1985 table as well. Figures showing reserve comparisons for the each payment hospitalization tables are below. The reserves are based on a $100 per day hospitalization benefit. The lapse rates and interest are the same between calculations. Results are shown for ages 35, 45, and 55. Male and female reserve comparisons are shown in separate graphs.
-
100
200
300
400
500
600
700
1 6 11 16 21 26 31 36 41 46 51 56 61
Rese
rve
per p
olic
y $1
00 b
enef
it
Duration (years)
Figure 23—Male Each Payment Hospital Reserves
Proposed Table Age 35 Proposed Table Age 45 Proposed Table Age 55
85 Table Age 35 85 Table Age 45 85 Table Age 55

36
Figure 24—Female Each Payment Hospital Reserves 350
300
250
200
150
100
50
-
1 6 11 16 21 26 31 36 41 46 51 56 61
Duration (years) Proposed Table Age 35 Proposed Table Age 45
Proposed Table Age 55 85 Table Age 35
85 Table Age 45 85 Table Age 55
The reserves produced by the proposed table are significantly lower than those produced
by the 1985 tables. The claim cost table comparisons shown above show a significant
decrease between the two studies, resulting in the much lower reserve build-up using the
proposed valuation table.
A comparison of all payment hospitalization reserve calculations are shown below. The
reserves are based on a $100 per day hospitalization benefit. The lapse rates and interest
are the same between calculations. Results are shown for ages 35, 45, and 55. Male and
female reserve comparisons are shown in separate graphs.
Res
erve
per
po
licy
$10
0 b
en
efi
t

37
-
100
200
300
400
500
600
1 6 11 16 21 26 31 36 41 46 51 56 61
Rese
rve
per p
olic
y $1
00 b
enef
it
Duration (years)
Figure 25—Male All Payment Hospital Reserves
Proposed Table Age 35 Proposed Table Age 45 Proposed Table Age 5585 Table Age 35 85 Table Age 45 85 Table Age 55
-
50
100
150
200
250
300
1 6 11 16 21 26 31 36 41 46 51 56 61
Rese
rve
per p
olic
y $1
00 b
enef
it
Duration (years)
Figure 26—Female All Payment Hospital Reserves
Proposed Table Age 35 Proposed Table Age 35 Proposed Table Age 5585 Table Age 35 85 Table Age 45 85 Table Age 55

38
The all payment reserve patterns follow the each payment hospitalization closely but the peak reserves are lower for all payment versus each payment. This is consistent with the expectation that an each payment method will have higher future policy benefit reserves and an all payment method will have a higher claim reserve.

1
APPENDIX I
Society of Actuaries
Cancer Experience Study Data Requirements
General Information The study includes experience for: (dates subject to change)
Cancer insurance policies in the United States,
Exposure from Jan. 1, 1994 to December 31, 2003,
Claims incurred from Jan. 1, 1994 to December 31, 2003, and
Claims paid through December 31, 2004 and incurred in claims incurral study period.
The exposure and claims experience is to come from the same insurance experience.
Please submit exposure and claim information, gross of any reinsurance, on insureds and
groups with coverage during any portion of these years. The committee will use the effective
date and termination date to determine the exposure and claim rate calculations. To avoid
double reporting of experience for reinsured/sold business, please include data for periods
where the business was administered by your company. For example, if a block of business
was sold by Company A to Company B on December 31, 1998 and administration was
switched over on July 1, 1999, Company A would submit experience for the period from the
beginning of the study period and paid through June 30, 1999. Company B would submit
experience for the period paid from July 1, 1999 through the end of the study period.
Below is a request with a suggested format for 3 different files:
Exposure Records
Claim Records
Policy Form Details
If you are unable to submit data in this format, please contact Jack Luff at the SOA office. The
SOA and an outside data vendor will work with participants to be as accommodating as
possible.
Definitions for Fields See the explanation of data fields at the end of this document.
Control Totals / Additional Information Requested Along with your contribution to be sent to the Compiler, please include control totals, consisting
of the following:
The number of Exposure records
The number of Claim records
Total $ amount of claims

2
APPENDIX I
Also, please send to Jack Luff at the Society of Actuaries:
A copy of the policy forms used, with benefit schedule, including for each policy form a
reference to what policy form code is used to report its experience. If the Contributor has a
significant number of policy forms, those that should be submitted are those with the most
significant exposures or are most representative of the contributor’s exposures. Also include
with the policies a copy of the surgical schedule if applicable.
A copy of the Contributor’s claim incurral dating rules. Some examples are:
• whether a company uses a diagnosis date or service date as the incurred date
• rules to determine if a hospitalization is a continuation of a prior hospital stay or a new
stay
• rules for coding radiation/chemotherapy claims
A description of anything believed to be unusual about the coverage provided to determine
how best to record the experience for that product or group.
Examples include:
• Changes in claims-paying practices due to litigation
• Group issued without underwriting
Method of Submission The Committee would prefer contributions to be made via cartridges, diskette (size permitting)
or CD ROM. If any of these are not practical, the contributor should contact Jack Luff at the
SOA, or Sue Rynearson, Committee Chairperson, to determine an acceptable alternative
arrangement. Contact the Compiler if any technical questions arise regarding the form of the
contribution.
Privacy Protection The SOA wants to inform all participating companies that the individual information submitted
for every insured and claimant to this study will be protected from disclosure in compliance with
all current laws and regulations. Additionally, company aggregate data will be kept confidential
as to overall experience. Companies with a large proportion of the total experience will be
scaled back to prevent this experience from dominating the study.

3
APPENDIX I
File #1 - Data Requirements for Insured Exposure
Primary Insured’s Exposure Fields Description – Suggested Format
Field
Submitting Company Characteristics
Size Start End
Submitting Company Code (assigned by SOA) 3 1 3
Original Writing Company Code (assigned by SOA) 3 4 6
Primary Insured Characteristics
Policy Form Identification Code
7
7
13
Policyholder Identifier 12 14 25
Subgroup Code Identifier of subgroup or class 3 26 28
Issue Date YYYYMMDD 8 29 36
Effective Date YYYYMMDD 8 37 44
(= beg. date of study if inforce at beg. of study)
Termination Date YYYYMMDD 8 45 52
(= end date of study if inforce at end of study)
Primary Date of Birth YYYY MMDD 8 53 60
Primary Gender M=Male F=Female U=Unknown 1 61 61
Issue Channel W=Worksite O=Other U = Unknown 1 62 62
Issue State 2-character 2 63 64
Family Code I = Individual P=Primary & Spouse 1 65 65
S=One-parent Family F=Two-parent Family
N=Family where only other choice is Individual O=Other U=Unknown
Insured covered under a return of premium benefit? Y/N 1 66 66
Insured covered under a paid-up policy? Y/N 1 67 67
Policy Conversion? Y/N

4
APPENDIX I
Suggested Submission for changes to a policyholder’s coverage:
Submit multiple records with different effective and termination dates.
Example: An individual converts coverage from policy form A1 to policy form A2 on July
1, 2000.
Record 1 Record 2
Submitting company code 123 123
Original Writing Company Code 123 123
Policy form identification code A1 A2
Policyholder identifier CA123456 CA123456
Subgroup code identifier 2 2
Issue date 19990701 19990701
Effective date 19990701 20000701
Termination date 20000630 20010630
Primary Date of Birth 19620621 19620621
Primary Gender F F
Issue Channel W W
Issue State NC NC
Family Code I I
Insured covered ROP N N
Insured covered Paid-Up Policy N N
Policy conversion N Y
If the original issue date is not available, please put in conversion effective date.

5
APPENDIX I
File #2 - Data Requirements for Claims Claim Fields Description – Suggested Format
Field Size Start End
Submitting Company Characteristics Submitting Company Code (assigned by SOA)
3
1
3
Original Writing Company Code (assigned by SOA) 3 4 6
Primary Insured Characteristics Policyholder Identifier
12
7
18
Claim Data
Amount Paid (rounded to nearest whole $)
8
19
26
Diagnostic codes/Procedure codes 10 27 36
Benefit code/Benefit description See List Below 3 37 39
Date of initial diagnosis of cancer
(first incurral date) YYYYMMDD 8 40 47
Incurred date YYYYMMDD 8 48 55
Date of payment YYYYMMDD 8 56 63
Days of hospitalization or number of treatments 4 64 67
Claimant age at time of claim 3 68 70
Claimant gender M=Male F=Female U=Unknown 1 71 71
Relationship code P=Primary S=Spouse C=Child 1 72 72
U=Unknown
We only want claim information for the following benefits:
Suggested benefit codes
Initial diagnosis/1st
Occurrence of cancer FOC Hospitalization HOS
Radiation RAD
Chemotherapy CHM
Blood or Plasma BLD
Surgical Schedule SUR
Prescription Drugs DRG
Anti-Nausea/Side Effect Drugs NAU
Immunotherapy IMM
If Radiation and Chemotherapy are combined in your database, please use code RCM

6
APPENDIX I
File #3 – Policy Form Details
Policy Form Identification Code
Number of family tiers
Does the form offer a ROP feature? Y/N
If yes, is it optional? Y/N
Does the form offer a paid-up feature? Y/N
If yes, is it optional? Y/N
Has the form ever been rerated? Y/N
Ratio of average current rate to original rate
Benefit Provisions
Benefits Y/N Lump Sum/First Diagnosis Benefit
Hospital Benefit
Surgical Schedule
Blood/Platelets/Plasma
Prescription drugs
Radiation and Chemotherapy
Immunotherapy
Benefit Type – ACT=Actual Charge RAC=Reasonable and Customary
CAP = Actual Charge to Cap IND = Fixed Indemnity
Hospital Benefit
Surgery Benefit
Blood Benefit
Drug Benefit
Radiation and Chemotherapy
Immunotherapy
Daily Maximum per covered insured
Hospital Benefit
Surgery Benefit
Blood Benefit
Drug Benefit
Radiation and Chemotherapy
Immunotherapy
Monthly Maximum per covered insured
Hospital Benefit
Surgery Benefit
Blood Benefit
Drug Benefit
Radiation and Chemotherapy
Immunotherapy
Annual Maximum per covered insured
Hospital Benefit
Surgery Benefit
Blood Benefit
Drug Benefit

7
APPENDIX I
Radiation and Chemotherapy
Immunotherapy
Lifetime Maximum per covered insured
Hospital Benefit
Surgery Benefit
Blood Benefit
Drug Benefit
Radiation and Chemotherapy
Immunotherapy

8
APPENDIX I
Description of Data Fields
File #1 - Exposure Submitting Company Code – (assigned by the SOA) This field is to be used to identify the
company submitting the data. We would like to avoid double reporting of experience. If
the business was sold or is being administered by another company, only the company
administering the data records needs to submit the experience.
Original Writing Company Code – (assigned by the SOA) If available, this field will be used to
identify the company that originally issued the policy.
Policy Form Identification Code – Code used to identify a separate cancer insurance form with
differences in benefits, underwriting, or other features that might significantly affect
experience. This code does not necessarily have to be the same as the policy form
number used in product filings. It will be used to connect the exposure and claims
experience with the policy so we can identify how policy features affect experience.
Policyholder Identifier – Code used to distinguish policyholders from each other. Does not
necessarily need to be the same as the actual policyholder number used at your company.
Subgroup Code Identifier of subgroup or class – Use this code to distinguish blocks of business
that have distinct underwriting, marketing, or other features that might affect claims
experience.
Issue Date – The original issue date of this policy.
Effective Date – The beginning of the period of exposure for this record. If this is the first record
for this policy, the effective date will be the later of issue date or the beginning of the
study period. For subsequent records, the effective date will be the date that the change
in coverage starts.
Termination Date – The end of the period of exposure for this record. The termination date will
be the earlier of the last date of policy coverage and the end of the study period.
Primary Date of Birth - DOB of the primary insured, if available. Age at issue if DOB not
available.
Primary gender – If this information is available, the gender of the primary insured.
Issue Channel – If this policy was issued to an individual, and the marketing method was to offer
sales to multiple employees at their worksite, and the employer offers some type of
assistance in collecting and remitting premiums for this policy, enter W for worksite.
Issue State – Use the standard 2 character abbreviations for the 50 states in the U.S., and please
include a list of abbreviations used for other geographical entities.
Family Code – Distinguishes who is covered
Suggested Codes: I = Individual P = Primary & Spouse
S = One-parent Family F = Two-parent Family O = Other
Insured covered under a return of premium benefit? Y/N Include Y if the policyholder had a
Return of Premium type benefit
Insured covered under a paid-up policy? Y/N Include Y if the policy was in a paid-up status.
Policy Conversion? Y/N Include Y if the policy was converted from another Cancer policy, with
or without new underwriting
File #2 - Claims Please include separate data records for distinct benefits, even if the benefits were paid in a
single payment.

9
APPENDIX I
Some of these fields are the same as in the Exposure file and are used to match claims to
exposure. The Policyholder Identifier will be used to get policy and policyholder
information from the exposure records.
Amount Paid – Rounded to nearest $
Diagnostic codes/Procedure codes – An example would be the ICD-9 codes which can be used to
specify the type of cancer.
Benefit code/Benefit description – Please include only claims for the benefits listed in the Claims
File field description. Include other claims if unsure about classification and please
include separate codes with descriptions sent with data.
Date of initial diagnosis of cancer – Include the date the claimant was first diagnosed with cancer
even if this benefit payment was for a later treatment.
Incurred date – Include the incurred date as defined by your company. Please also include a
description of your company’s incurral-dating methods.
Date of payment – Date claim was paid.
Days of hospitalization or number of treatments – If the benefit was for hospitalization, include
the number of days for which this payment was made. If the benefit was for radiation,
chemotherapy, or other recurring or separate treatments, include the number of treatments
for which this payment was made. For First Diagnosis of Cancer or other single
occurrence benefits, you may leave blank.
Claimant age at time of claim – Please include the age of the person who received treatment, if
available.
Claimant gender M=Male F=Female U=Unknown – Please include the gender of the person who
received treatment, if available.
Relationship code P=Primary S=Spouse C=Child – Please include the relationship to the primary
insured of the person who received treatment.
File #3 – Policy Forms The purpose of this file is to contain policy form details. The Policy Form Identification Code is
to be made up by each submitter for each policy form included in the data submitted. This
simplifies the data records in the exposure and claims files because the policy form detail
will not have to be included in each claim or exposure record. This file is expected to have
far fewer records than the other files but the format is left open in order to provide the
submitter with more flexibility in providing important benefit and other policy provision
details.
Policy Form Identification Code – Assigned by submitting company. Used to match exposure
and claim records to specific policy form details.
Number of family tiers – 2=Individual and 2-Parent Family options only
3=Individual, 2-Parent Family, and 1-Parent Family options
4=Individual, 2-Parent Family, 1-Parent Family, and 2-Adult options
Does the form offer a ROP feature? – Return of Premium or similar benefit
Does the form offer a paid-up feature? – Include yes if it possible to be in a paid-up status
Has the form ever been rerated? – Include yes if premium rates have been changed.
Ratio of average current rate to original rate – Cumulative effect of all rerates for this policy

10
APPENDIX I
We would like to receive the following information on each of the major benefits included in this
study:
Benefits – The $ amount paid or paid-up-to for each of the following benefits. (If the amount
payable is unlimited, leave blank and indicate in the next section, Benefit Type):
Lump Sum/First Diagnosis Benefit
Hospital Benefit
Surgical Schedule
Blood/Platelets/Plasma
Prescription drugs
Radiation and Chemotherapy
Immunotherapy
Benefit Type – Identify the policy provision for determining the amount to be paid for each
single incident of the major benefits included.
ACT=Actual Charge – This is for benefits which pay unlimited benefits equal to the
actual charge. Daily, Monthly, and other caps are to be entered in later sections.
CAP = Actual Charge to Cap – Include this code if the benefit is actual charge but is
capped per incident of this benefit. Daily, Monthly, and other caps are to be entered in
later sections.
IND = Fixed Indemnity – Include this code if the benefit is a fixed amount.
Please list the following caps for each of the major benefits. Some benefits will have multiple
caps. For caps which do not apply, leave blank or enter 0(zero).
Daily Maximum per covered insured
Monthly Maximum per covered insured
Annual Maximum per covered insured
Lifetime Maximum per covered insured
Please also list any other policy provisions which might affect claim incidence or severity. The
SOA and this Committee will make every reasonable effort to work with the Submitting
Companies in order to include their experience in our study.

Appendix 2First Occurence Study Data - Initial
Incidence Rates per 1,000Females and Males
Female MaleAge Total Exposure Total Incurral Incidence Total Exposure Total Incurral Incidence18 3,470.55 3.6864 1.062190 3,260.58 - - 19 9,670.73 2.1175 0.218958 8,883.40 3.7552 0.422722 20 17,461.11 13.0347 0.746500 15,185.10 12.0303 0.792243 21 26,768.42 13.8691 0.518115 21,856.81 9.5039 0.434824 22 40,424.04 25.5430 0.631877 29,734.49 16.1580 0.543408 23 56,786.29 44.1794 0.777995 39,031.49 18.8133 0.482003 24 73,625.32 62.3588 0.846975 48,334.72 28.4794 0.589212 25 90,660.83 96.7150 1.066778 58,050.88 40.9184 0.704870 26 106,299.08 110.7595 1.041961 67,032.14 27.6460 0.412430 27 121,304.64 165.8198 1.366970 76,116.69 47.4044 0.622786 28 135,702.60 149.3380 1.100480 85,597.27 55.2837 0.645858 29 151,968.25 200.5865 1.319924 95,713.75 68.8618 0.719456 30 168,655.82 217.0711 1.287065 106,679.07 83.8789 0.786273 31 185,421.05 346.2583 1.867416 117,693.37 76.1010 0.646604 32 202,217.95 327.8709 1.621374 128,541.02 125.1812 0.973862 33 218,944.97 417.6444 1.907531 139,948.50 122.4639 0.875064 34 238,378.54 450.9472 1.891727 151,513.98 99.7527 0.658373 35 260,901.35 505.1162 1.936043 164,573.60 126.1747 0.766677 36 281,365.83 592.2428 2.104885 176,517.39 169.6547 0.961122 37 303,774.60 747.3882 2.460338 191,141.28 220.1418 1.151723 38 328,014.44 845.1349 2.576517 205,549.43 235.8164 1.147249 39 353,717.60 1,023.1961 2.892692 221,461.16 257.9003 1.164540 40 379,638.69 1,181.0812 3.111066 236,669.11 301.6300 1.274480 41 404,179.48 1,277.2253 3.160045 251,628.21 383.8485 1.525459 42 430,098.46 1,472.4610 3.423544 267,501.90 492.0007 1.839242 43 458,035.76 1,706.7997 3.726346 284,057.03 475.6244 1.674398 44 486,292.84 1,902.9260 3.913128 301,679.48 652.0099 2.161267 45 508,690.62 2,110.4826 4.148853 312,410.85 689.5422 2.207165 46 524,081.80 2,289.4007 4.368403 319,123.91 826.8532 2.591010 47 538,884.22 2,613.3325 4.849525 325,452.63 957.9209 2.943350 48 552,931.02 2,751.3327 4.975906 330,697.71 1,109.4058 3.354743 49 566,988.43 2,864.1502 5.051514 335,837.68 1,352.9612 4.028616 50 572,435.24 3,194.5889 5.580699 335,623.20 1,479.4313 4.408013 51 574,159.96 3,464.5271 6.034080 333,508.12 1,713.7606 5.138587 52 572,429.93 3,499.1669 6.112830 330,564.10 1,754.8252 5.308578 53 569,531.14 3,549.9308 6.233076 327,708.57 1,963.1802 5.990628 54 559,914.41 3,694.2772 6.597932 321,181.60 2,140.6476 6.664914 55 539,675.74 3,842.1234 7.119318 308,789.12 2,296.7678 7.437982 56 514,902.48 3,906.7180 7.587297 294,512.86 2,363.6086 8.025485 57 491,321.29 3,792.0940 7.718155 281,972.74 2,635.1308 9.345339 58 466,203.57 3,889.9302 8.343845 268,468.69 2,769.3413 10.315323 59 437,593.23 3,785.0085 8.649605 254,041.47 2,725.1264 10.727093 60 405,141.77 3,814.6617 9.415622 237,127.48 2,740.0859 11.555328 61 367,437.40 3,558.7924 9.685439 216,952.65 2,848.0366 13.127457 62 327,465.99 3,266.5724 9.975303 193,688.32 2,602.9685 13.438954 63 289,443.52 3,041.6444 10.508594 172,584.22 2,561.7652 14.843566 64 253,719.71 2,696.0155 10.625960 154,200.00 2,346.0128 15.214091 65 215,393.78 2,369.6304 11.001388 132,459.42 2,289.7860 17.286698 66 186,043.01 2,159.9506 11.609953 115,080.00 1,980.5104 17.209858 67 160,366.40 1,852.5737 11.552131 99,738.86 1,757.1341 17.617347 68 139,138.52 1,675.7891 12.044034 86,573.84 1,503.6123 17.367976 69 122,265.59 1,363.1138 11.148793 75,887.67 1,448.9156 19.092899 70 104,493.22 1,294.1357 12.384877 64,365.41 1,193.4163 18.541268 71 88,687.65 1,087.8374 12.265940 54,189.22 1,003.2273 18.513410 72 76,145.24 906.7382 11.908009 46,179.98 872.5856 18.895322 73 66,230.91 756.4155 11.420884 39,918.66 871.1443 21.822985 74 58,017.34 765.9495 13.202080 34,728.95 758.8463 21.850539 75 49,944.04 654.2734 13.100130 29,429.35 522.6269 17.758695 76 43,146.01 548.1712 12.705026 25,068.94 479.1189 19.112051 77 37,830.85 474.7157 12.548375 21,541.99 411.4324 19.099090 78 33,297.26 403.3344 12.113141 18,640.96 354.7157 19.028832 79 29,372.32 388.3769 13.222549 16,235.97 247.7527 15.259494 80 25,403.10 367.9650 14.485044 13,771.47 250.1665 18.165560 81 21,963.40 268.4292 12.221658 11,551.00 174.3068 15.090188 82 18,925.45 281.2274 14.859746 9,775.70 175.4038 17.942833 83 15,977.61 209.9672 13.141339 8,044.39 156.8008 19.491949 84 13,397.67 155.8784 11.634739 6,504.14 95.9621 14.754003 85 11,078.22 191.1552 17.255050 5,198.74 84.6406 16.280974 86 8,923.84 110.9189 12.429509 4,009.56 56.2287 14.023650 87 7,155.32 68.4771 9.570098 3,089.29 56.5121 18.292911 88 5,578.23 75.9439 13.614335 2,313.84 80.9604 34.989648 89 4,219.88 39.2636 9.304444 1,666.97 70.2834 42.162370 90 3,114.62 2.1982 0.705784 1,192.38 7.8223 6.560208

Appendix 2All Payment Hospitalization Data - Initial
Study Data - Females and MalesFemale Male
Age Total Exposure Total Incurral Total Days Incidence Length of Stay Total Exposure Total Incurral Total Days Incidence Length of Stay18 3,427.90 4.1541 15.9080 0.001212 3.8294 3,173.87 - - - - 19 9,577.67 2.3430 46.1908 0.000245 19.7143 8,650.12 3.4348 758.6998 0.000397 220.8880 20 17,158.52 45.9504 2,585.4570 0.002678 56.2662 14,793.87 15.2998 141.3594 0.001034 9.2393 21 26,157.36 2.9397 43.4416 0.000112 14.7778 21,154.08 6.6235 45.4763 0.000313 6.8659 22 39,491.86 29.3963 625.5306 0.000744 21.2792 28,667.21 56.1872 920.0308 0.001960 16.3744 23 55,308.81 15.4905 169.6571 0.000280 10.9523 37,557.88 16.1090 102.7266 0.000429 6.3770 24 71,710.26 38.5055 254.3095 0.000537 6.6045 46,319.91 15.1674 136.8717 0.000327 9.0241 25 88,279.92 110.7938 982.2768 0.001255 8.8658 55,728.30 46.0311 661.5416 0.000826 14.3716 26 103,692.57 115.9409 698.6840 0.001118 6.0262 64,368.28 71.1749 661.9042 0.001106 9.2997 27 118,581.12 146.2044 834.5864 0.001233 5.7084 72,964.58 29.7631 562.4771 0.000408 18.8985 28 132,769.01 151.2942 962.7431 0.001140 6.3634 81,820.70 38.3923 511.2339 0.000469 13.3160 29 149,158.56 152.1214 1,411.6006 0.001020 9.2794 91,294.94 67.3429 810.5713 0.000738 12.0365 30 165,840.81 196.9611 1,366.9243 0.001188 6.9401 101,315.79 81.6611 725.8625 0.000806 8.8887 31 182,866.30 353.3169 3,200.5659 0.001932 9.0586 111,644.70 90.8094 2,105.3816 0.000813 23.1846 32 200,089.38 309.8664 1,701.9327 0.001549 5.4925 121,605.96 160.5249 1,370.6483 0.001320 8.5385 33 216,987.17 399.8123 4,178.0770 0.001843 10.4501 132,085.42 113.5071 1,406.6841 0.000859 12.3929 34 236,648.86 589.6611 3,467.6032 0.002492 5.8807 142,827.83 124.2397 933.9163 0.000870 7.5171 35 258,871.11 518.8992 3,325.9945 0.002004 6.4097 154,807.85 149.7078 1,646.1394 0.000967 10.9957 36 278,762.22 683.3927 4,921.3441 0.002452 7.2013 164,872.20 195.6027 1,921.3210 0.001186 9.8226 37 301,207.88 772.1981 3,745.5372 0.002564 4.8505 177,707.11 185.1026 1,749.0787 0.001042 9.4492 38 324,986.98 992.9618 6,232.4496 0.003055 6.2766 190,455.92 268.5593 4,008.6590 0.001410 14.9265 39 350,289.01 971.3783 5,543.9862 0.002773 5.7073 204,274.37 372.5496 3,248.1049 0.001824 8.7186 40 376,006.10 1,184.5170 6,539.9615 0.003150 5.5212 217,797.36 341.7082 3,209.8191 0.001569 9.3935 41 400,327.98 1,255.5678 7,645.8503 0.003136 6.0896 231,168.10 428.5426 7,805.3508 0.001854 18.2137 42 427,030.00 1,582.6747 11,363.0958 0.003706 7.1797 245,371.48 503.1826 4,532.0810 0.002051 9.0068 43 455,933.12 1,750.3324 10,024.8989 0.003839 5.7274 260,101.46 635.8579 7,198.5415 0.002445 11.3210 44 485,686.78 2,047.4643 11,899.0830 0.004216 5.8116 276,438.20 598.9620 5,098.1767 0.002167 8.5117 45 509,380.46 2,070.9821 14,175.7937 0.004066 6.8450 285,994.32 812.7532 7,426.9195 0.002842 9.1380 46 525,396.08 2,206.1097 14,458.7342 0.004199 6.5540 291,325.20 770.7790 6,234.6028 0.002646 8.0887 47 541,034.82 2,543.4162 16,561.4909 0.004701 6.5115 296,621.24 1,031.7628 8,847.9672 0.003478 8.5756 48 556,467.48 2,835.1115 19,267.5893 0.005095 6.7961 301,447.69 1,170.2643 9,916.1927 0.003882 8.4735 49 571,141.17 2,997.8335 21,499.0557 0.005249 7.1715 306,580.95 1,345.0006 11,336.4941 0.004387 8.4286 50 578,136.82 3,423.6765 23,326.2590 0.005922 6.8132 307,286.80 1,502.0069 11,241.2438 0.004888 7.4841 51 580,599.40 3,501.8515 23,371.7027 0.006031 6.6741 305,496.87 1,721.6612 13,763.1165 0.005636 7.9941 52 579,460.09 3,694.1037 27,760.2247 0.006375 7.5147 303,323.75 1,760.2963 14,513.5712 0.005803 8.2450 53 576,525.26 3,665.8485 24,938.1984 0.006359 6.8028 301,344.40 1,766.3763 13,554.1588 0.005862 7.6734 54 568,162.45 3,960.8290 26,438.6472 0.006971 6.6750 297,136.03 2,049.1803 16,670.1273 0.006896 8.1350 55 549,058.69 4,152.4756 30,847.0527 0.007563 7.4286 287,846.51 2,139.9910 18,620.7305 0.007434 8.7013 56 523,411.38 4,066.4864 30,047.0036 0.007769 7.3889 275,440.27 2,276.6188 18,314.3002 0.008265 8.0445 57 497,575.13 3,893.1273 25,302.2052 0.007824 6.4992 264,317.64 2,633.3725 20,340.3734 0.009963 7.7241 58 470,163.61 4,169.2557 30,602.3413 0.008868 7.3400 252,426.53 2,732.2555 21,873.9592 0.010824 8.0058 59 439,094.78 4,020.1558 32,500.9062 0.009156 8.0845 239,679.14 2,619.8901 20,138.4432 0.010931 7.6868 60 403,564.19 4,114.4859 33,453.8023 0.010195 8.1307 224,037.29 2,554.4537 20,116.3876 0.011402 7.8750 61 361,961.44 3,710.0607 29,205.7883 0.010250 7.8721 205,067.35 2,806.9434 23,969.7630 0.013688 8.5395 62 318,344.39 3,501.7978 26,607.3475 0.011000 7.5982 183,144.96 2,625.8423 20,188.3883 0.014338 7.6883 63 276,734.71 3,306.7632 26,497.1634 0.011949 8.0130 162,624.23 2,253.2436 19,313.9179 0.013856 8.5716 64 237,431.19 2,993.6535 23,748.8100 0.012609 7.9331 144,054.48 2,219.3033 17,999.6637 0.015406 8.1105 65 196,631.15 2,515.6630 21,526.7423 0.012794 8.5571 122,228.97 2,107.3150 17,334.5617 0.017241 8.2259 66 165,112.38 2,237.8519 18,278.9928 0.013554 8.1681 104,925.16 1,865.4274 16,512.1286 0.017779 8.8517 67 137,908.03 1,956.3661 16,018.0897 0.014186 8.1877 89,533.49 1,667.0895 12,768.2101 0.018620 7.6590 68 114,819.47 1,695.2981 13,824.0604 0.014765 8.1544 76,178.88 1,403.8956 11,389.3081 0.018429 8.1126 69 96,404.85 1,392.6508 12,733.2474 0.014446 9.1432 65,311.39 1,192.7390 9,342.6622 0.018262 7.8329 70 80,098.20 1,218.9831 9,849.1599 0.015219 8.0798 55,264.46 1,019.4729 7,940.2624 0.018447 7.7886 71 65,636.41 1,050.0245 8,874.1018 0.015998 8.4513 45,889.89 1,048.3296 8,994.5989 0.022844 8.5799 72 53,933.57 866.0683 7,290.1934 0.016058 8.4176 38,079.64 782.8229 6,821.9896 0.020558 8.7146 73 45,099.25 762.4510 6,966.2414 0.016906 9.1366 31,910.92 686.5063 6,134.9742 0.021513 8.9365 74 38,342.33 622.9188 4,964.7284 0.016246 7.9701 27,256.36 606.8524 5,335.2227 0.022265 8.7916 75 33,073.62 622.6973 5,594.8367 0.018828 8.9848 23,201.20 469.3118 4,351.8543 0.020228 9.2728 76 29,206.92 473.9530 4,821.5823 0.016227 10.1731 20,103.07 514.7533 5,057.4025 0.025606 9.8249 77 26,375.74 429.1406 4,047.6819 0.016270 9.4321 17,737.71 365.5348 3,158.9771 0.020608 8.6421 78 24,279.83 382.0129 3,890.6005 0.015734 10.1845 15,686.25 326.1083 2,768.0301 0.020789 8.4881 79 22,434.21 364.0565 4,073.0161 0.016228 11.1879 13,947.60 267.2238 2,381.5632 0.019159 8.9122 80 20,519.98 295.6571 2,550.9842 0.014408 8.6282 12,419.27 273.4953 2,450.6162 0.022022 8.9604 81 18,653.82 281.4858 2,531.4096 0.015090 8.9930 10,939.31 233.0525 1,912.1610 0.021304 8.2048 82 16,935.85 300.7552 2,983.7101 0.017758 9.9207 9,630.75 197.7859 1,881.0526 0.020537 9.5106 83 15,158.41 306.7273 2,318.1836 0.020235 7.5578 8,243.85 150.7142 1,491.5916 0.018282 9.8968 84 13,295.33 192.8222 1,682.9106 0.014503 8.7278 6,911.99 139.1507 1,228.7679 0.020132 8.8305 85 11,495.05 159.5419 1,251.8081 0.013879 7.8463 5,774.60 115.4352 887.4630 0.019990 7.6880 86 9,744.16 145.8733 1,131.1294 0.014970 7.7542 4,743.91 81.4590 803.7370 0.017171 9.8668 87 7,920.57 96.5996 909.5316 0.012196 9.4155 3,783.33 64.0016 830.6488 0.016917 12.9786 88 6,205.90 87.2254 724.1403 0.014055 8.3019 2,860.72 48.2509 368.3179 0.016867 7.6334 89 4,704.90 59.8008 352.3420 0.012710 5.8919 2,061.74 24.6951 193.6964 0.011978 7.8435 90 3,385.79 29.0919 236.6932 0.008592 8.1361 1,458.54 37.0948 128.7979 0.025433 3.4721

Appendix 2Each Payment Hospitalization Data - Initial
Study Data - FemalesFemale
Age Total Exposure Total Incurral Total Days Incidence Length of Stay18 2,935.20 1.2135 4.2471 0.000413 3.5000 19 8,892.71 1.8647 42.5766 0.000210 22.8333 20 16,395.85 18.1982 1,448.6849 0.001110 79.6058 21 25,392.04 22.1897 863.9507 0.000874 38.9348 22 38,956.15 26.2911 160.8479 0.000675 6.1180 23 55,181.32 18.8641 168.5141 0.000342 8.9330 24 71,917.14 22.8302 159.6892 0.000317 6.9947 25 88,831.52 73.9271 490.9589 0.000832 6.6411 26 104,508.96 117.2432 1,081.3627 0.001122 9.2232 27 119,493.84 140.7700 1,029.9710 0.001178 7.3167 28 133,729.51 136.1482 1,001.7816 0.001018 7.3580 29 149,993.35 146.2372 1,047.1479 0.000975 7.1606 30 166,507.32 176.5134 1,779.2302 0.001060 10.0799 31 183,281.08 263.9227 1,899.8382 0.001440 7.1985 32 200,376.01 288.8972 1,569.5418 0.001442 5.4329 33 217,113.29 350.9281 2,200.0933 0.001616 6.2694 34 236,550.41 508.0613 4,172.3190 0.002148 8.2122 35 258,573.98 501.0119 4,179.2606 0.001938 8.3416 36 278,065.13 623.5283 4,084.1619 0.002242 6.5501 37 300,175.96 752.2314 4,566.0469 0.002506 6.0700 38 323,306.72 802.6013 6,055.5477 0.002482 7.5449 39 347,669.52 894.8475 5,428.7831 0.002574 6.0667 40 372,241.33 1,139.3529 6,355.2882 0.003061 5.5780 41 395,714.47 1,272.6686 6,923.2315 0.003216 5.4399 42 421,487.40 1,444.4654 9,307.3627 0.003427 6.4435 43 448,946.81 1,665.9398 9,820.1857 0.003711 5.8947 44 476,320.17 1,885.9279 12,831.7825 0.003959 6.8040 45 501,988.51 2,022.7876 13,897.0030 0.004030 6.8702 46 519,639.47 2,068.4497 13,590.8501 0.003981 6.5705 47 536,697.44 2,405.3579 14,314.2511 0.004482 5.9510 48 553,014.78 2,570.1361 15,363.2661 0.004647 5.9776 49 568,753.91 2,862.4217 19,129.4255 0.005033 6.6830 50 576,496.06 3,174.6948 20,916.5339 0.005507 6.5885 51 579,514.16 3,291.3308 21,014.0971 0.005679 6.3847 52 578,687.93 3,265.1337 21,875.8778 0.005642 6.6998 53 574,996.74 3,544.2641 25,068.2554 0.006164 7.0729 54 565,325.53 3,694.4920 27,130.9081 0.006535 7.3436 55 546,946.50 3,885.8215 26,369.3582 0.007105 6.7860 56 521,562.35 3,944.0847 26,644.2612 0.007562 6.7555 57 495,826.83 3,762.8393 25,019.1537 0.007589 6.6490 58 468,293.66 4,100.8927 29,617.6313 0.008757 7.2222 59 436,907.18 3,897.6849 28,485.2594 0.008921 7.3083 60 400,955.05 3,811.0551 28,556.2135 0.009505 7.4930 61 358,854.90 3,654.3593 27,679.1526 0.010183 7.5743 62 314,067.18 3,244.9549 23,710.8990 0.010332 7.3070 63 270,943.40 3,093.2137 21,145.2037 0.011416 6.8360 64 230,525.07 2,882.5319 23,140.2154 0.012504 8.0277 65 190,755.94 2,516.3514 20,031.3298 0.013191 7.9605 66 159,766.63 2,260.2304 17,835.2981 0.014147 7.8909 67 133,320.56 2,018.9574 14,847.0648 0.015144 7.3538 68 110,762.71 1,713.9062 12,134.0925 0.015474 7.0798 69 92,795.91 1,500.5196 12,767.2593 0.016170 8.5086 70 76,713.80 1,310.0450 10,661.0488 0.017077 8.1379 71 62,230.58 1,130.2571 8,641.3522 0.018162 7.6455 72 50,318.70 895.1353 6,848.4405 0.017789 7.6507 73 40,966.40 809.3330 5,944.4061 0.019756 7.3448 74 33,390.79 659.4215 5,164.7754 0.019749 7.8323 75 27,231.54 562.0505 4,176.3080 0.020640 7.4305 76 22,466.40 510.3566 4,624.6885 0.022716 9.0617 77 18,818.11 342.3706 2,691.7110 0.018194 7.8620 78 15,979.48 323.3936 2,487.6418 0.020238 7.6923 79 13,734.74 330.8522 3,085.7193 0.024089 9.3266 80 11,726.19 211.2023 1,819.4405 0.018011 8.6147 81 9,975.62 265.7918 2,141.6222 0.026644 8.0575 82 8,573.65 188.0509 2,235.3598 0.021934 11.8870 83 7,364.10 110.0574 788.8450 0.014945 7.1676 84 6,257.14 99.8295 572.3304 0.015954 5.7331 85 5,260.16 80.9262 556.8512 0.015385 6.8810 86 4,409.59 57.8635 418.8772 0.013122 7.2391 87 3,619.37 35.4927 296.0970 0.009806 8.3425 88 2,882.51 35.2086 227.8645 0.012215 6.4718 89 2,208.10 30.8915 147.1334 0.013990 4.7629 90 1,644.61 17.0647 76.8417 0.010376 4.5030

Appendix 2Each Payment Hospitalization Data - Initial
Study Data - Males
MaleAge Total Exposure Total Incurral Total Days Incidence Length of Stay
18-37 1,582,065.85 1,324.0236 14,562.0220 0.000837 10.9983 38 183,713.77 235.1665 2,282.9619 0.001280 9.707852 39 196,634.91 353.4476 2,937.6472 0.001797 8.311408 40 209,158.34 342.3990 3,154.5558 0.001637 9.213097 41 221,479.56 364.6942 3,643.0654 0.001647 9.989369 42 234,531.57 461.3125 4,499.8006 0.001967 9.754343
43-44 507,539.61 1,186.8982 11,716.7487 0.002339 9.871739 45 271,642.70 616.9404 6,140.3346 0.002271 9.952882 46 278,546.51 769.5906 6,208.1434 0.002763 8.066813 47 284,850.38 925.4074 7,542.5357 0.003249 8.150503 48 290,557.37 1,138.0167 9,249.7540 0.003917 8.127960 49 296,504.33 1,219.1596 10,172.3689 0.004112 8.343755 50 297,911.17 1,411.1107 11,962.5158 0.004737 8.477376 51 296,976.28 1,525.2513 12,720.7792 0.005136 8.340120 52 295,187.32 1,619.1876 12,228.4229 0.005485 7.552196 53 292,799.40 1,650.3776 12,307.0214 0.005637 7.457094 54 287,580.96 1,983.8010 13,920.9197 0.006898 7.017296 55 279,186.91 1,968.5402 15,141.0917 0.007051 7.691533 56 267,240.60 2,226.8059 18,306.8001 0.008333 8.221103 57 256,501.17 2,401.2027 17,589.4154 0.009361 7.325252 58 244,876.98 2,611.7648 21,039.6982 0.010666 8.055740 59 232,361.27 2,561.5802 21,796.2827 0.011024 8.508921 60 216,966.02 2,466.7765 18,649.9900 0.011369 7.560470 61 198,111.61 2,487.1014 19,097.1407 0.012554 7.678473 62 176,034.21 2,647.2673 20,172.6603 0.015038 7.620183 63 155,042.63 2,369.1742 18,179.7460 0.015281 7.673453 64 135,956.80 2,232.2419 18,737.4698 0.016419 8.394014 65 115,594.70 2,232.5177 18,517.8943 0.019313 8.294624 66 99,261.76 1,862.7483 15,255.5357 0.018766 8.189800 67 84,707.99 1,757.1387 12,778.9964 0.020743 7.272617 68 72,036.89 1,564.0536 11,178.5069 0.021712 7.147138 69 61,752.31 1,344.1278 11,025.2404 0.021766 8.202524 70 52,111.38 1,117.6059 8,501.9847 0.021446 7.607319 71 43,003.44 1,041.8993 8,113.8375 0.024228 7.787545 72 35,319.25 879.1192 7,383.7749 0.024891 8.399060 73 29,012.99 715.8737 5,588.3125 0.024674 7.806282 74 24,005.77 642.2198 5,199.1476 0.026753 8.095589 75 19,597.49 555.1672 4,959.8845 0.028328 8.934037
76-90 88,692.77 2,258.2070 19,118.7146 0.025461 8.466325

Appendix 3First Occurence Study Data - Raw
Observed Age Adjusted Selection Patterns
Duration Selection1 1.564662 2 1.427362 3 1.315744 4 1.276115
5+ 1.000000

Appendix 4First Occurence Study Data - Basic
Incidence Rates per 1,000Females and Males
Female MaleAge Incidence Incidence18 0.627924 0.881829 19 0.674180 0.801936 20 0.724071 0.739746 21 0.777858 0.691831 22 0.835817 0.655659 23 0.898239 0.629367 24 0.965428 0.611592 25 1.037702 0.601366 26 1.115394 0.598026 27 1.198850 0.601162 28 1.288427 0.610573 29 1.384493 0.626246 30 1.487428 0.648333 31 1.597617 0.677146 32 1.715454 0.713153 33 1.841334 0.756981 34 1.975655 0.809418 35 2.118813 0.871430 36 2.271195 0.944166 37 2.433181 1.028975 38 2.605137 1.127423 39 2.787408 1.241306 40 2.980315 1.372669 41 3.184147 1.523812 42 3.399157 1.697306 43 3.625555 1.895990 44 3.863497 2.122967 45 4.113083 2.381581 46 4.374345 2.675387 47 4.647242 3.008086 48 4.931649 3.383454 49 5.227351 3.805224 50 5.534035 4.276947 51 5.851280 4.801813 52 6.178553 5.382431 53 6.515203 6.020575 54 6.860448 6.716900 55 7.213380 7.470622 56 7.572952 8.279194 57 7.937985 9.137977 58 8.307156 10.039941 59 8.679009 10.975414 60 9.051950 11.931912 61 9.424257 12.894089 62 9.794084 13.843824 63 10.159468 14.760489 64 10.518346 15.621404 65 10.868563 16.402500 66 11.207892 17.079180 67 11.534048 17.627351 68 11.844714 18.024594 69 12.137560 18.251409 70 12.410266 18.292454 71 12.660551 18.292454 72 12.886202 18.292454 73 13.085094 18.292454 74 13.255229 18.292454 75 13.394756 18.292454 76 13.502005 18.292454 77 13.575509 18.292454 78 13.614037 18.292454 79 13.616610 18.292454 80 13.616610 18.292454 81 13.616610 18.292454 82 13.616610 18.292454 83 13.616610 18.292454 84 13.616610 18.292454 85 13.616610 18.292454 86 13.616610 18.292454 87 13.616610 18.292454 88 13.616610 18.292454 89 13.616610 18.292454 90 13.616610 18.292454 91 13.616610 18.292454 92 13.616610 18.292454 93 13.616610 18.292454 94 13.616610 18.292454 95 13.616610 18.292454 96 13.616610 18.292454 97 13.616610 18.292454 98 13.616610 18.292454 99 13.616610 18.292454
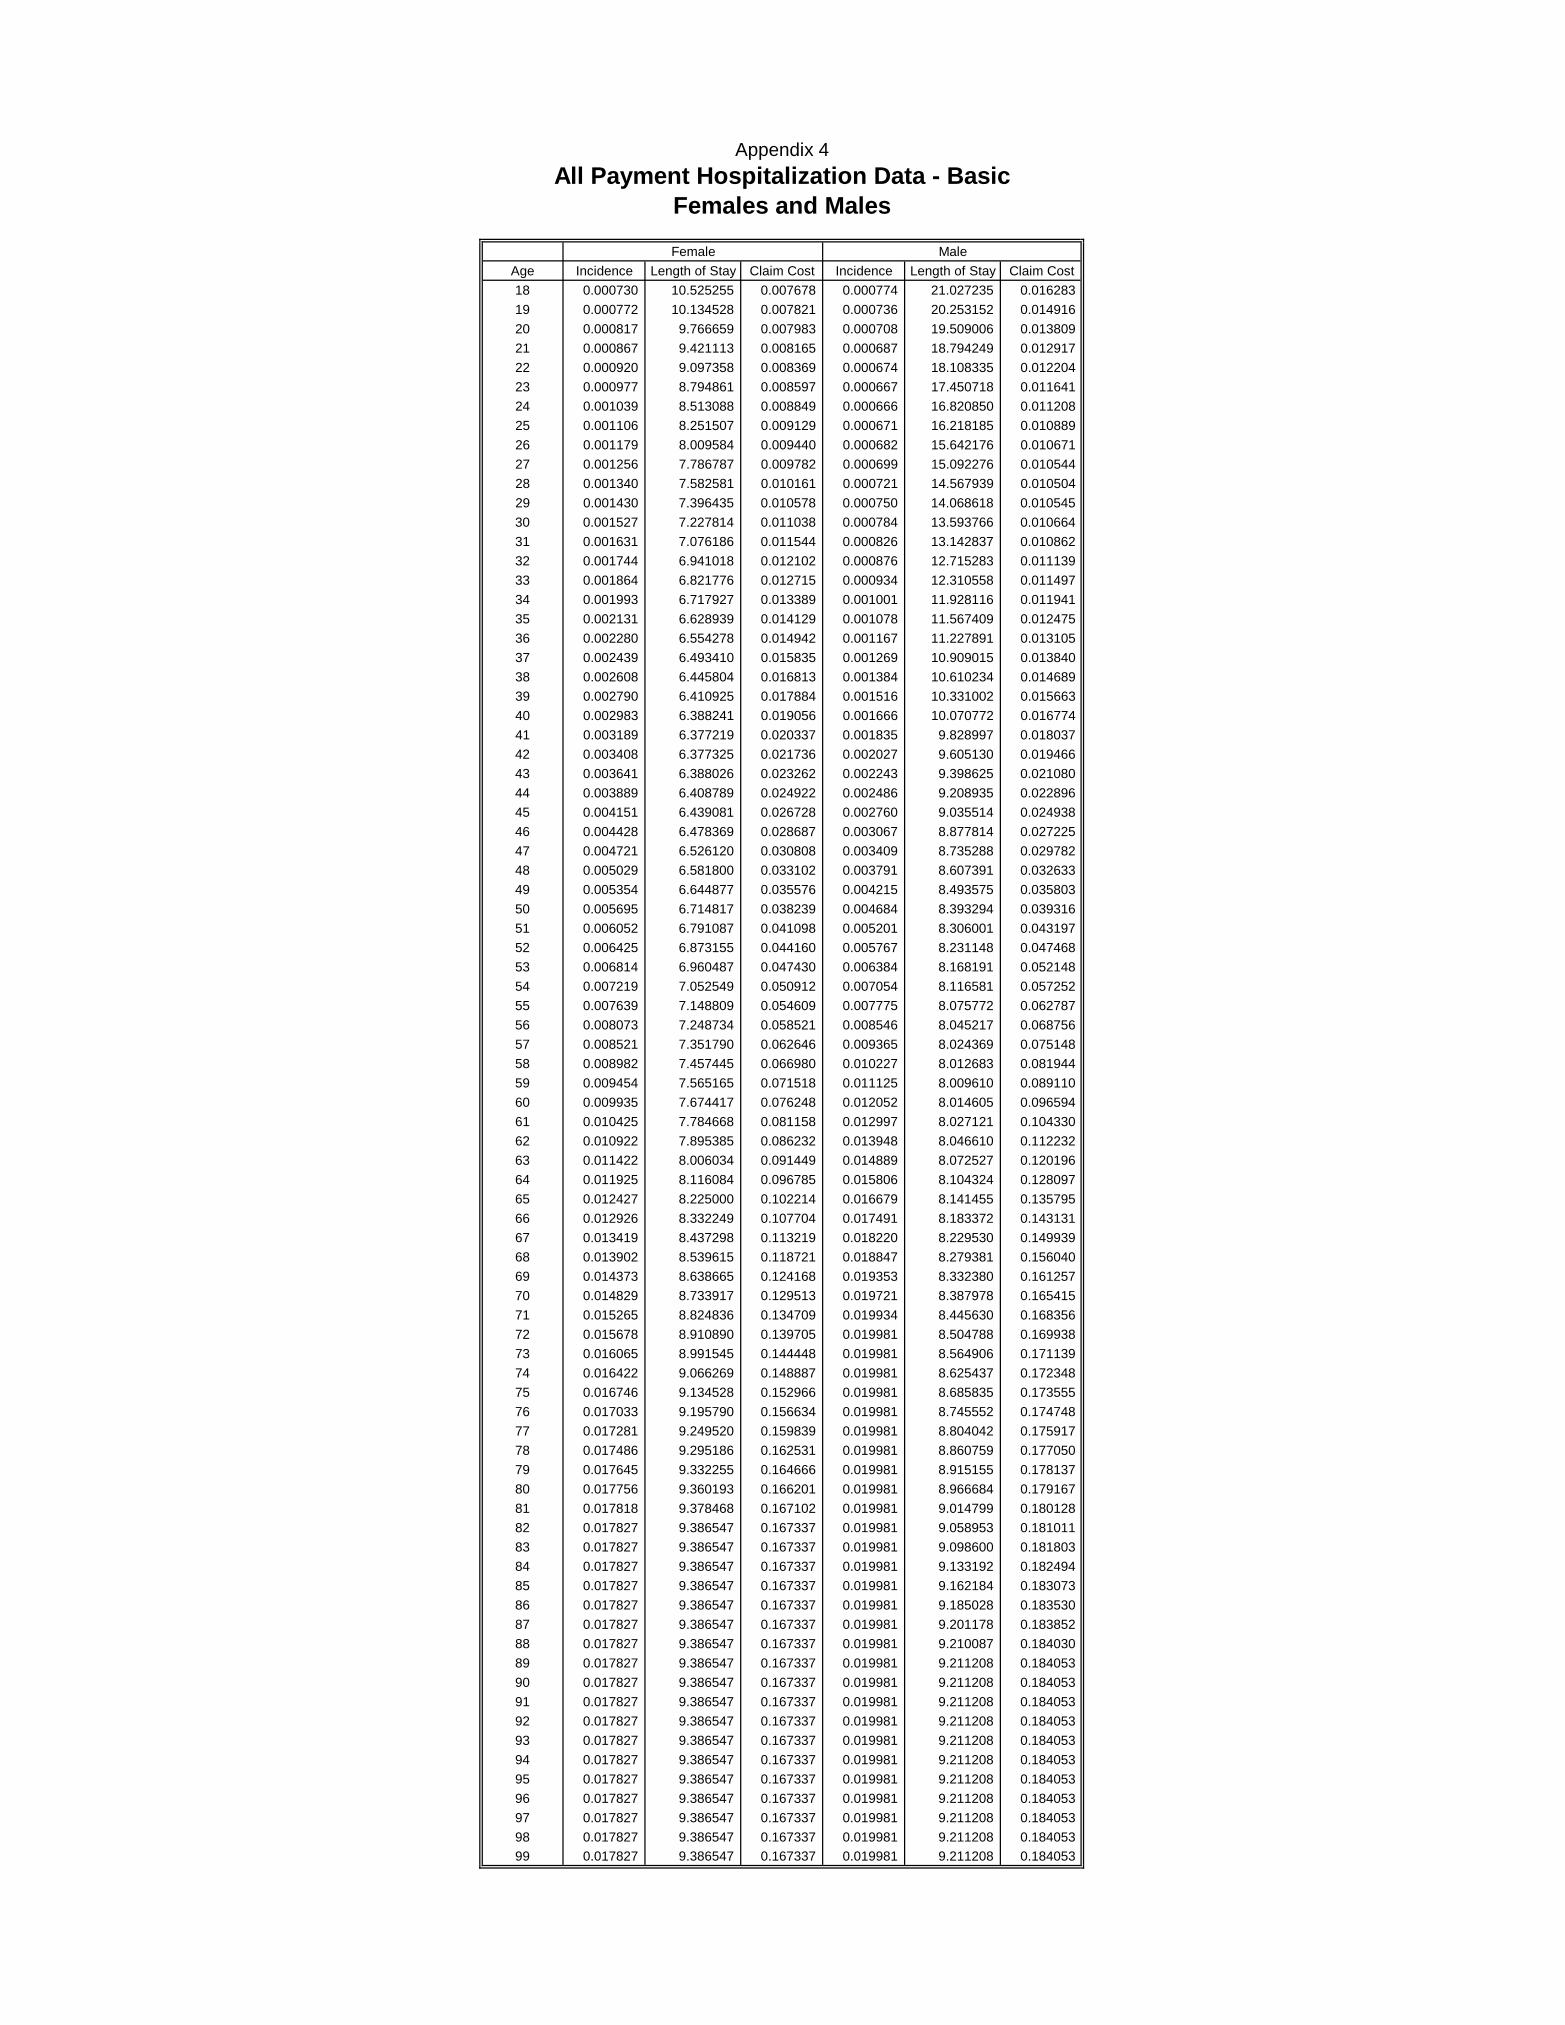
Appendix 4All Payment Hospitalization Data - Basic
Females and Males
Female MaleAge Incidence Length of Stay Claim Cost Incidence Length of Stay Claim Cost18 0.000730 10.525255 0.007678 0.000774 21.027235 0.016283 19 0.000772 10.134528 0.007821 0.000736 20.253152 0.014916 20 0.000817 9.766659 0.007983 0.000708 19.509006 0.013809 21 0.000867 9.421113 0.008165 0.000687 18.794249 0.012917 22 0.000920 9.097358 0.008369 0.000674 18.108335 0.012204 23 0.000977 8.794861 0.008597 0.000667 17.450718 0.011641 24 0.001039 8.513088 0.008849 0.000666 16.820850 0.011208 25 0.001106 8.251507 0.009129 0.000671 16.218185 0.010889 26 0.001179 8.009584 0.009440 0.000682 15.642176 0.010671 27 0.001256 7.786787 0.009782 0.000699 15.092276 0.010544 28 0.001340 7.582581 0.010161 0.000721 14.567939 0.010504 29 0.001430 7.396435 0.010578 0.000750 14.068618 0.010545 30 0.001527 7.227814 0.011038 0.000784 13.593766 0.010664 31 0.001631 7.076186 0.011544 0.000826 13.142837 0.010862 32 0.001744 6.941018 0.012102 0.000876 12.715283 0.011139 33 0.001864 6.821776 0.012715 0.000934 12.310558 0.011497 34 0.001993 6.717927 0.013389 0.001001 11.928116 0.011941 35 0.002131 6.628939 0.014129 0.001078 11.567409 0.012475 36 0.002280 6.554278 0.014942 0.001167 11.227891 0.013105 37 0.002439 6.493410 0.015835 0.001269 10.909015 0.013840 38 0.002608 6.445804 0.016813 0.001384 10.610234 0.014689 39 0.002790 6.410925 0.017884 0.001516 10.331002 0.015663 40 0.002983 6.388241 0.019056 0.001666 10.070772 0.016774 41 0.003189 6.377219 0.020337 0.001835 9.828997 0.018037 42 0.003408 6.377325 0.021736 0.002027 9.605130 0.019466 43 0.003641 6.388026 0.023262 0.002243 9.398625 0.021080 44 0.003889 6.408789 0.024922 0.002486 9.208935 0.022896 45 0.004151 6.439081 0.026728 0.002760 9.035514 0.024938 46 0.004428 6.478369 0.028687 0.003067 8.877814 0.027225 47 0.004721 6.526120 0.030808 0.003409 8.735288 0.029782 48 0.005029 6.581800 0.033102 0.003791 8.607391 0.032633 49 0.005354 6.644877 0.035576 0.004215 8.493575 0.035803 50 0.005695 6.714817 0.038239 0.004684 8.393294 0.039316 51 0.006052 6.791087 0.041098 0.005201 8.306001 0.043197 52 0.006425 6.873155 0.044160 0.005767 8.231148 0.047468 53 0.006814 6.960487 0.047430 0.006384 8.168191 0.052148 54 0.007219 7.052549 0.050912 0.007054 8.116581 0.057252 55 0.007639 7.148809 0.054609 0.007775 8.075772 0.062787 56 0.008073 7.248734 0.058521 0.008546 8.045217 0.068756 57 0.008521 7.351790 0.062646 0.009365 8.024369 0.075148 58 0.008982 7.457445 0.066980 0.010227 8.012683 0.081944 59 0.009454 7.565165 0.071518 0.011125 8.009610 0.089110 60 0.009935 7.674417 0.076248 0.012052 8.014605 0.096594 61 0.010425 7.784668 0.081158 0.012997 8.027121 0.104330 62 0.010922 7.895385 0.086232 0.013948 8.046610 0.112232 63 0.011422 8.006034 0.091449 0.014889 8.072527 0.120196 64 0.011925 8.116084 0.096785 0.015806 8.104324 0.128097 65 0.012427 8.225000 0.102214 0.016679 8.141455 0.135795 66 0.012926 8.332249 0.107704 0.017491 8.183372 0.143131 67 0.013419 8.437298 0.113219 0.018220 8.229530 0.149939 68 0.013902 8.539615 0.118721 0.018847 8.279381 0.156040 69 0.014373 8.638665 0.124168 0.019353 8.332380 0.161257 70 0.014829 8.733917 0.129513 0.019721 8.387978 0.165415 71 0.015265 8.824836 0.134709 0.019934 8.445630 0.168356 72 0.015678 8.910890 0.139705 0.019981 8.504788 0.169938 73 0.016065 8.991545 0.144448 0.019981 8.564906 0.171139 74 0.016422 9.066269 0.148887 0.019981 8.625437 0.172348 75 0.016746 9.134528 0.152966 0.019981 8.685835 0.173555 76 0.017033 9.195790 0.156634 0.019981 8.745552 0.174748 77 0.017281 9.249520 0.159839 0.019981 8.804042 0.175917 78 0.017486 9.295186 0.162531 0.019981 8.860759 0.177050 79 0.017645 9.332255 0.164666 0.019981 8.915155 0.178137 80 0.017756 9.360193 0.166201 0.019981 8.966684 0.179167 81 0.017818 9.378468 0.167102 0.019981 9.014799 0.180128 82 0.017827 9.386547 0.167337 0.019981 9.058953 0.181011 83 0.017827 9.386547 0.167337 0.019981 9.098600 0.181803 84 0.017827 9.386547 0.167337 0.019981 9.133192 0.182494 85 0.017827 9.386547 0.167337 0.019981 9.162184 0.183073 86 0.017827 9.386547 0.167337 0.019981 9.185028 0.183530 87 0.017827 9.386547 0.167337 0.019981 9.201178 0.183852 88 0.017827 9.386547 0.167337 0.019981 9.210087 0.184030 89 0.017827 9.386547 0.167337 0.019981 9.211208 0.184053 90 0.017827 9.386547 0.167337 0.019981 9.211208 0.184053 91 0.017827 9.386547 0.167337 0.019981 9.211208 0.184053 92 0.017827 9.386547 0.167337 0.019981 9.211208 0.184053 93 0.017827 9.386547 0.167337 0.019981 9.211208 0.184053 94 0.017827 9.386547 0.167337 0.019981 9.211208 0.184053 95 0.017827 9.386547 0.167337 0.019981 9.211208 0.184053 96 0.017827 9.386547 0.167337 0.019981 9.211208 0.184053 97 0.017827 9.386547 0.167337 0.019981 9.211208 0.184053 98 0.017827 9.386547 0.167337 0.019981 9.211208 0.184053 99 0.017827 9.386547 0.167337 0.019981 9.211208 0.184053

Appendix 4Each Payment Hospitalization Data - Basic
Females and Males
Female MaleAge Incidence Length of Stay Claim Cost Incidence Length of Stay Claim Cost18 0.000671 10.417035 0.006990 0.000858 18.148450 0.015564 19 0.000710 10.048067 0.007130 0.000814 17.555131 0.014287 20 0.000751 9.700279 0.007287 0.000780 16.983762 0.013248 21 0.000796 9.373157 0.007463 0.000755 16.433962 0.012406 22 0.000845 9.066186 0.007658 0.000737 15.905351 0.011727 23 0.000897 8.778853 0.007875 0.000727 15.397546 0.011189 24 0.000954 8.510642 0.008116 0.000722 14.910168 0.010770 25 0.001015 8.261040 0.008381 0.000724 14.442835 0.010458 26 0.001080 8.029532 0.008674 0.000732 13.995167 0.010239 27 0.001151 7.815604 0.008996 0.000745 13.566782 0.010107 28 0.001227 7.618742 0.009351 0.000764 13.157301 0.010054 29 0.001310 7.438431 0.009741 0.000789 12.766341 0.010077 30 0.001398 7.274156 0.010170 0.000821 12.393522 0.010173 31 0.001493 7.125404 0.010641 0.000859 12.038463 0.010341 32 0.001596 6.991660 0.011158 0.000904 11.700784 0.010583 33 0.001706 6.872411 0.011726 0.000958 11.380103 0.010900 34 0.001825 6.767140 0.012348 0.001020 11.076039 0.011296 35 0.001952 6.675335 0.013031 0.001091 10.788212 0.011775 36 0.002089 6.596480 0.013778 0.001174 10.516240 0.012342 37 0.002235 6.530062 0.014597 0.001268 10.259744 0.013005 38 0.002393 6.475567 0.015493 0.001375 10.018341 0.013773 39 0.002561 6.432479 0.016474 0.001497 9.791651 0.014655 40 0.002741 6.400284 0.017545 0.001635 9.579293 0.015663 41 0.002934 6.378469 0.018715 0.001792 9.380887 0.016810 42 0.003140 6.366518 0.019992 0.001969 9.196051 0.018110 43 0.003360 6.363918 0.021383 0.002170 9.024404 0.019581 44 0.003595 6.370154 0.022898 0.002396 8.865566 0.021240 45 0.003844 6.384712 0.024545 0.002650 8.719155 0.023108 46 0.004110 6.407078 0.026333 0.002936 8.584791 0.025208 47 0.004392 6.436736 0.028272 0.003257 8.462094 0.027562 48 0.004692 6.473173 0.030371 0.003616 8.350681 0.030197 49 0.005009 6.515875 0.032640 0.004017 8.250172 0.033140 50 0.005345 6.564327 0.035086 0.004463 8.160186 0.036420 51 0.005700 6.618015 0.037720 0.004958 8.080343 0.040066 52 0.006074 6.676424 0.040550 0.005506 8.010261 0.044108 53 0.006467 6.739040 0.043584 0.006110 7.949560 0.048574 54 0.006881 6.805349 0.046827 0.006773 7.897858 0.053494 55 0.007315 6.874837 0.050288 0.007497 7.854775 0.058891 56 0.007769 6.946988 0.053970 0.008285 7.819930 0.064787 57 0.008243 7.021290 0.057876 0.009136 7.792942 0.071198 58 0.008737 7.097226 0.062008 0.010051 7.773430 0.078132 59 0.009250 7.174284 0.066366 0.011028 7.761013 0.085590 60 0.009783 7.251949 0.070946 0.012064 7.755311 0.093558 61 0.010334 7.329706 0.075743 0.013153 7.755942 0.102012 62 0.010902 7.407041 0.080749 0.014288 7.762525 0.110910 63 0.011486 7.483440 0.085953 0.015460 7.774680 0.120195 64 0.012084 7.558388 0.091339 0.016657 7.792026 0.129790 65 0.012696 7.631372 0.096891 0.017865 7.814182 0.139597 66 0.013319 7.701876 0.102585 0.019067 7.840767 0.149497 67 0.013952 7.769386 0.108396 0.020245 7.871400 0.159353 68 0.014591 7.833389 0.114294 0.021378 7.905700 0.169006 69 0.015234 7.893369 0.120246 0.022444 7.943286 0.178281 70 0.015878 7.948813 0.126214 0.023421 7.983777 0.186990 71 0.016521 7.999206 0.132155 0.024285 8.026794 0.194934 72 0.017159 8.044034 0.138026 0.025014 8.071953 0.201911 73 0.017788 8.082782 0.143776 0.025585 8.118876 0.207724 74 0.018405 8.114936 0.149355 0.025980 8.167180 0.212184 75 0.019006 8.139982 0.154708 0.026182 8.216486 0.215121 76 0.019587 8.157405 0.159778 0.026182 8.266411 0.216428 77 0.020144 8.166691 0.164508 0.026182 8.316576 0.217742 78 0.020672 8.167326 0.168838 0.026182 8.366599 0.219051 79 0.021169 8.158795 0.172712 0.026182 8.416099 0.220347 80 0.021629 8.140585 0.176071 0.026182 8.464696 0.221620 81 0.022048 8.112180 0.178860 0.026182 8.512008 0.222858 82 0.022424 8.073066 0.181027 0.026182 8.557656 0.224054 83 0.022751 8.022730 0.182522 0.026182 8.601257 0.225195 84 0.023026 7.960656 0.183303 0.026182 8.642431 0.226273 85 0.023247 7.886330 0.183332 0.026182 8.680797 0.227278 86 0.023410 7.886330 0.184617 0.026182 8.715974 0.228199 87 0.023512 7.886330 0.185427 0.026182 8.747581 0.229026 88 0.023512 7.886330 0.185427 0.026182 8.775238 0.229750 89 0.023512 7.886330 0.185427 0.026182 8.798564 0.230361 90 0.023512 7.886330 0.185427 0.026182 8.817177 0.230848 91 0.023512 7.886330 0.185427 0.026182 8.817177 0.230848 92 0.023512 7.886330 0.185427 0.026182 8.817177 0.230848 93 0.023512 7.886330 0.185427 0.026182 8.817177 0.230848 94 0.023512 7.886330 0.185427 0.026182 8.817177 0.230848 95 0.023512 7.886330 0.185427 0.026182 8.817177 0.230848 96 0.023512 7.886330 0.185427 0.026182 8.817177 0.230848 97 0.023512 7.886330 0.185427 0.026182 8.817177 0.230848 98 0.023512 7.886330 0.185427 0.026182 8.817177 0.230848 99 0.023512 7.886330 0.185427 0.026182 8.817177 0.230848

Appendix 5First Occurence Study Data - Valuation
Incidence Rates per 1,000Females and Males
Female MaleAge Incidence Incidence18 0.724310 1.017189 19 0.777667 0.925033 20 0.835216 0.853297 21 0.897260 0.798027 22 0.964115 0.756303 23 1.036119 0.725974 24 1.113621 0.705471 25 1.196989 0.693676 26 1.286607 0.689823 27 1.382873 0.693440 28 1.486200 0.704296 29 1.597013 0.722375 30 1.715748 0.747852 31 1.842852 0.781088 32 1.978776 0.822622 33 2.123979 0.873177 34 2.278919 0.933664 35 2.444050 1.005195 36 2.619823 1.089095 37 2.806675 1.186922 38 3.005026 1.300482 39 3.215275 1.431847 40 3.437793 1.583373 41 3.672913 1.757717 42 3.920928 1.957842 43 4.182077 2.187024 44 4.456544 2.448842 45 4.744441 2.747154 46 5.045807 3.086058 47 5.360594 3.469827 48 5.688657 3.902814 49 6.029749 4.389326 50 6.383509 4.933459 51 6.749451 5.538891 52 7.126961 6.208634 53 7.515286 6.944733 54 7.913527 7.747944 55 8.320633 8.617362 56 8.735401 9.550050 57 9.156465 10.540657 58 9.582304 11.581072 59 10.011236 12.660140 60 10.441424 13.763460 61 10.870881 14.873331 62 11.297476 15.968851 63 11.718947 17.026224 64 12.132912 18.019290 65 12.536888 18.920284 66 12.928303 19.700834 67 13.304525 20.333149 68 13.662878 20.791369 69 14.000675 21.053001 70 14.315241 21.100346 71 14.603946 21.100346 72 14.864234 21.100346 73 15.093656 21.100346 74 15.289907 21.100346 75 15.450851 21.100346 76 15.574562 21.100346 77 15.659350 21.100346 78 15.703792 21.100346 79 15.706760 21.100346 80 15.706760 21.100346 81 15.706760 21.100346 82 15.706760 21.100346 83 15.706760 21.100346 84 15.706760 21.100346 85 15.706760 21.100346 86 15.706760 21.100346 87 15.706760 21.100346 88 15.706760 21.100346 89 15.706760 21.100346 90 15.706760 21.100346 91 15.706760 21.100346 92 15.706760 21.100346 93 15.706760 21.100346 94 15.706760 21.100346 95 15.706760 21.100346 96 15.706760 21.100346 97 15.706760 21.100346 98 15.706760 21.100346 99 15.706760 21.100346

Appendix 5All Payment Hospitalization Data - Valuation
Females and Males
Female MaleAge Incidence Length of Stay Claim Cost Incidence Length of Stay Claim Cost18 0.000766 10.760820 0.008243 0.000813 21.497845 0.017480 19 0.000810 10.361348 0.008396 0.000773 20.706437 0.016012 20 0.000858 9.985246 0.008570 0.000743 19.945636 0.014824 21 0.000910 9.631966 0.008766 0.000722 19.214882 0.013867 22 0.000966 9.300966 0.008984 0.000708 18.513617 0.013100 23 0.001026 8.991698 0.009228 0.000700 17.841282 0.012497 24 0.001091 8.703619 0.009500 0.000700 17.197317 0.012032 25 0.001162 8.436184 0.009801 0.000705 16.581163 0.011689 26 0.001237 8.188846 0.010133 0.000716 15.992263 0.011455 27 0.001319 7.961063 0.010501 0.000734 15.430056 0.011319 28 0.001407 7.752286 0.010908 0.000757 14.893983 0.011276 29 0.001502 7.561974 0.011356 0.000787 14.383487 0.011320 30 0.001604 7.389579 0.011849 0.000824 13.898007 0.011448 31 0.001713 7.234558 0.012393 0.000868 13.436986 0.011660 32 0.001831 7.096365 0.012991 0.000920 12.999863 0.011958 33 0.001957 6.974454 0.013649 0.000981 12.586080 0.012342 34 0.002093 6.868281 0.014373 0.001051 12.195079 0.012819 35 0.002238 6.777301 0.015168 0.001132 11.826299 0.013392 36 0.002394 6.700969 0.016041 0.001226 11.479182 0.014068 37 0.002560 6.638739 0.016998 0.001332 11.153169 0.014858 38 0.002739 6.590067 0.018048 0.001454 10.847701 0.015769 39 0.002929 6.554408 0.019198 0.001592 10.562220 0.016815 40 0.003132 6.531216 0.020457 0.001749 10.296165 0.018007 41 0.003349 6.519947 0.021832 0.001927 10.048979 0.019362 42 0.003579 6.520056 0.023334 0.002128 9.820102 0.020897 43 0.003824 6.530996 0.024971 0.002355 9.608975 0.022629 44 0.004083 6.552224 0.026754 0.002611 9.415040 0.024579 45 0.004358 6.583194 0.028692 0.002898 9.237737 0.026770 46 0.004649 6.623361 0.030795 0.003220 9.076508 0.029226 47 0.004957 6.672181 0.033073 0.003580 8.930792 0.031971 48 0.005281 6.729107 0.035535 0.003981 8.800033 0.035031 49 0.005622 6.793596 0.038191 0.004426 8.683669 0.038434 50 0.005980 6.865101 0.041050 0.004918 8.581144 0.042206 51 0.006354 6.943078 0.044119 0.005461 8.491897 0.046372 52 0.006746 7.026983 0.047406 0.006055 8.415369 0.050957 53 0.007155 7.116269 0.050916 0.006704 8.351003 0.055981 54 0.007580 7.210392 0.054654 0.007406 8.298238 0.061460 55 0.008021 7.308806 0.058622 0.008163 8.256515 0.067402 56 0.008477 7.410968 0.062822 0.008973 8.225277 0.073809 57 0.008947 7.516330 0.067250 0.009833 8.203962 0.080672 58 0.009431 7.624350 0.071904 0.010738 8.192014 0.087967 59 0.009926 7.734481 0.076774 0.011682 8.188873 0.095659 60 0.010432 7.846178 0.081852 0.012655 8.193979 0.103693 61 0.010947 7.958896 0.087123 0.013647 8.206776 0.111998 62 0.011468 8.072091 0.092570 0.014645 8.226701 0.120481 63 0.011994 8.185217 0.098170 0.015634 8.253198 0.129030 64 0.012521 8.297730 0.103899 0.016596 8.285706 0.137512 65 0.013049 8.409083 0.109727 0.017513 8.323669 0.145775 66 0.013572 8.518733 0.115620 0.018365 8.366524 0.153652 67 0.014090 8.626133 0.121541 0.019131 8.413715 0.160959 68 0.014598 8.730740 0.127447 0.019789 8.464681 0.167509 69 0.015092 8.832007 0.133294 0.020321 8.518867 0.173109 70 0.015570 8.929390 0.139032 0.020707 8.575709 0.177573 71 0.016028 9.022344 0.144610 0.020931 8.634651 0.180730 72 0.016462 9.110324 0.149973 0.020980 8.695133 0.182428 73 0.016868 9.192784 0.155065 0.020980 8.756597 0.183717 74 0.017243 9.269181 0.159830 0.020980 8.818482 0.185016 75 0.017583 9.338967 0.164209 0.020980 8.880232 0.186311 76 0.017885 9.401601 0.168147 0.020980 8.941286 0.187592 77 0.018145 9.456533 0.171587 0.020980 9.001085 0.188847 78 0.018360 9.503221 0.174477 0.020980 9.059071 0.190064 79 0.018527 9.541120 0.176769 0.020980 9.114685 0.191230 80 0.018644 9.569683 0.178417 0.020980 9.167367 0.192336 81 0.018708 9.588367 0.179384 0.020980 9.216559 0.193368 82 0.018719 9.596627 0.179636 0.020980 9.261701 0.194315 83 0.018719 9.596627 0.179636 0.020980 9.302235 0.195165 84 0.018719 9.596627 0.179636 0.020980 9.337602 0.195907 85 0.018719 9.596627 0.179636 0.020980 9.367242 0.196529 86 0.018719 9.596627 0.179636 0.020980 9.390598 0.197019 87 0.018719 9.596627 0.179636 0.020980 9.407109 0.197366 88 0.018719 9.596627 0.179636 0.020980 9.416218 0.197557 89 0.018719 9.596627 0.179636 0.020980 9.417364 0.197581 90 0.018719 9.596627 0.179636 0.020980 9.417364 0.197581 91 0.018719 9.596627 0.179636 0.020980 9.417364 0.197581 92 0.018719 9.596627 0.179636 0.020980 9.417364 0.197581 93 0.018719 9.596627 0.179636 0.020980 9.417364 0.197581 94 0.018719 9.596627 0.179636 0.020980 9.417364 0.197581 95 0.018719 9.596627 0.179636 0.020980 9.417364 0.197581 96 0.018719 9.596627 0.179636 0.020980 9.417364 0.197581 97 0.018719 9.596627 0.179636 0.020980 9.417364 0.197581 98 0.018719 9.596627 0.179636 0.020980 9.417364 0.197581 99 0.018719 9.596627 0.179636 0.020980 9.417364 0.197581

Appendix 5Each Payment Hospitalization Data - Valuation
Females and Males
Female MaleAge Incidence Length of Stay Claim Cost Incidence Length of Stay Claim Cost18 0.000705 10.782127 0.007596 0.000900 18.784510 0.016915 19 0.000745 10.400228 0.007748 0.000855 18.170397 0.015528 20 0.000789 10.040251 0.007919 0.000819 17.579002 0.014398 21 0.000836 9.701664 0.008110 0.000793 17.009933 0.013482 22 0.000887 9.383934 0.008323 0.000774 16.462796 0.012745 23 0.000942 9.086531 0.008559 0.000763 15.937193 0.012160 24 0.001001 8.808920 0.008820 0.000758 15.432734 0.011705 25 0.001065 8.550570 0.009109 0.000760 14.949022 0.011365 26 0.001134 8.310948 0.009427 0.000768 14.485664 0.011128 27 0.001209 8.089522 0.009777 0.000782 14.042265 0.010984 28 0.001289 7.885761 0.010163 0.000802 13.618433 0.010926 29 0.001375 7.699130 0.010587 0.000829 13.213771 0.010951 30 0.001468 7.529098 0.011053 0.000862 12.827885 0.011056 31 0.001568 7.375132 0.011565 0.000902 12.460382 0.011239 32 0.001676 7.236701 0.012127 0.000950 12.110869 0.011502 33 0.001792 7.113273 0.012744 0.001006 11.778949 0.011847 34 0.001916 7.004312 0.013420 0.001071 11.464228 0.012277 35 0.002050 6.909290 0.014162 0.001146 11.166313 0.012797 36 0.002193 6.827671 0.014974 0.001232 10.884809 0.013413 37 0.002347 6.758925 0.015864 0.001331 10.619324 0.014134 38 0.002512 6.702520 0.016838 0.001444 10.369460 0.014969 39 0.002689 6.657922 0.017904 0.001572 10.134825 0.015927 40 0.002878 6.624599 0.019068 0.001717 9.915024 0.017023 41 0.003081 6.602019 0.020340 0.001882 9.709665 0.018269 42 0.003297 6.589649 0.021727 0.002068 9.518351 0.019682 43 0.003528 6.586958 0.023239 0.002278 9.340688 0.021281 44 0.003774 6.593413 0.024886 0.002516 9.176283 0.023084 45 0.004037 6.608481 0.026676 0.002783 9.024741 0.025114 46 0.004316 6.631631 0.028619 0.003083 8.885667 0.027396 47 0.004612 6.662328 0.030726 0.003420 8.758670 0.029954 48 0.004926 6.700042 0.033008 0.003797 8.643352 0.032818 49 0.005260 6.744241 0.035473 0.004218 8.539321 0.036017 50 0.005612 6.794391 0.038132 0.004686 8.446181 0.039582 51 0.005985 6.849961 0.040994 0.005206 8.363540 0.043544 52 0.006377 6.910417 0.044070 0.005782 8.291002 0.047936 53 0.006791 6.975227 0.047367 0.006416 8.228173 0.052791 54 0.007225 7.043860 0.050892 0.007112 8.174659 0.058137 55 0.007681 7.115784 0.054653 0.007872 8.130066 0.064002 56 0.008157 7.190463 0.058654 0.008699 8.094000 0.070410 57 0.008655 7.267369 0.062899 0.009593 8.066066 0.077378 58 0.009174 7.345967 0.067390 0.010554 8.045870 0.084914 59 0.009713 7.425726 0.072126 0.011580 8.033018 0.093019 60 0.010272 7.506113 0.077104 0.012667 8.027116 0.101679 61 0.010850 7.586595 0.082317 0.013810 8.027769 0.110866 62 0.011447 7.666640 0.087758 0.015002 8.034583 0.120537 63 0.012060 7.745717 0.093413 0.016233 8.047164 0.130628 64 0.012689 7.823292 0.099268 0.017490 8.065118 0.141056 65 0.013331 7.898833 0.105301 0.018758 8.088050 0.151714 66 0.013985 7.971808 0.111489 0.020020 8.115567 0.162473 67 0.014649 8.041684 0.117805 0.021257 8.147274 0.173185 68 0.015320 8.107931 0.124215 0.022447 8.182776 0.183676 69 0.015996 8.170013 0.130684 0.023566 8.221679 0.193756 70 0.016672 8.227400 0.137169 0.024592 8.263589 0.203221 71 0.017347 8.279559 0.143626 0.025500 8.308114 0.211854 72 0.018017 8.325958 0.150006 0.026265 8.354856 0.219437 73 0.018677 8.366064 0.156256 0.026865 8.403423 0.225755 74 0.019325 8.399345 0.162319 0.027279 8.453420 0.230601 75 0.019956 8.425269 0.168136 0.027491 8.504454 0.233794 76 0.020566 8.443303 0.173646 0.027491 8.556129 0.235214 77 0.021151 8.452914 0.178787 0.027491 8.608052 0.236642 78 0.021706 8.453571 0.183494 0.027491 8.659828 0.238065 79 0.022227 8.444741 0.187704 0.027491 8.711063 0.239473 80 0.022710 8.425893 0.191354 0.027491 8.761363 0.240856 81 0.023151 8.396493 0.194385 0.027491 8.810334 0.242203 82 0.023545 8.356008 0.196740 0.027491 8.857581 0.243501 83 0.023888 8.303908 0.198365 0.027491 8.902711 0.244742 84 0.024177 8.239658 0.199214 0.027491 8.945328 0.245914 85 0.024409 8.162727 0.199245 0.027491 8.985038 0.247005 86 0.024580 8.162727 0.200642 0.027491 9.021448 0.248006 87 0.024688 8.162727 0.201522 0.027491 9.054163 0.248906 88 0.024688 8.162727 0.201522 0.027491 9.082789 0.249693 89 0.024688 8.162727 0.201522 0.027491 9.106933 0.250356 90 0.024688 8.162727 0.201522 0.027491 9.126198 0.250886 91 0.024688 8.162727 0.201522 0.027491 9.126198 0.250886 92 0.024688 8.162727 0.201522 0.027491 9.126198 0.250886 93 0.024688 8.162727 0.201522 0.027491 9.126198 0.250886 94 0.024688 8.162727 0.201522 0.027491 9.126198 0.250886 95 0.024688 8.162727 0.201522 0.027491 9.126198 0.250886 96 0.024688 8.162727 0.201522 0.027491 9.126198 0.250886 97 0.024688 8.162727 0.201522 0.027491 9.126198 0.250886 98 0.024688 8.162727 0.201522 0.027491 9.126198 0.250886 99 0.024688 8.162727 0.201522 0.027491 9.126198 0.250886