report on the scaling of the 2020 nsw hsc - uac
TRANSCRIPT

1
Report on the Scaling of the 2020 NSW Higher School Certificate

Contents
Report on the Scaling of the 2020 NSW Higher School Certificate i
Preface ii
Acknowledgements iii
Definitions 01
1 The Higher School Certificate (HSC) 021.1 Eligibility for an HSC 021.2 Reporting student achievement in the HSC 02
2 The Australian Tertiary Admission Rank (ATAR) – an overview 042.1 Background 042.2 Categorisation of ATAR courses 052.3 Eligibility for an ATAR in 2020 052.4 Calculation of the ATAR 052.5 The ATAR Advice Notice 06
3 Calculating the ATAR in 2020 073.1 Overview 073.2 The scaling process in 2020 08
4 The HSC and ATAR in 2020 – some results 134.1 Overview 134.2 Percentage of students receiving an ATAR 134.3 Number of units of ATAR courses completed 14 4.4 Course enrolments – Table A1 144.5 Distributions of HSC marks – Table A2 154.6 Descriptive statistics of HSC and scaled marks – Table A3 154.7 Distribution of ATARs – Table A7 164.8 ATAR percentiles and relationship between ATAR and aggregates
– Tables A8, A9 174.9 Relationship between subject choice, band and ATAR 174.10 Gender differences 194.11 University offers 20
5 Trends and other issues 215.1 Variation in patterns of HSC marks – Tables A4, A5 215.2 Distributions of English and mathematics marks: 2017–2020 215.3 Courses that contribute to the ATAR – Table A6 25
6 Frequently asked questions 266.1 Why is my ATAR low in comparison to my HSC marks? 266.2 Why does this course contribute to my ATAR when another course
where I received a higher mark does not count? 286.3 Other frequently asked questions 31
7 Appendix 33Table A1 Course enrolments, gender, ATAR eligibility and
maximum ATAR by course 34Table A2 Distributions of HSC marks by course 37Table A3 Descriptive statistics and selected percentiles for HSC marks
and scaled marks by course 40Table A4 Distributions of HSC marks by course: 2019 and 2020 45Table A5 Distributions of scaled marks by course: 2019 and 2020 50Table A6 Courses that contribute to the ATAR (more than 10 units) 54Table A7 ATAR distribution 57Table A8 ATAR percentiles: 2016–2020 59Table A9 Relationship between the ATAR and aggregates, 2016–2020 59
ii
Preface
In New South Wales student achievement in Stage 6 (Years 11 and 12) is reported in two ways: through the Higher School Certificate Record of Achievement and through the Australian Tertiary Admission Rank (ATAR).
A student’s Higher School Certificate Record of Achievement presents a profile of their achievement in the courses they have completed, both academic and vocational. Their achievement is reported in terms of the standards they have reached in the courses they have completed.
In contrast, the Australian Tertiary Admission Rank (ATAR) is a numerical measure of a student’s overall academic achievement in the HSC in relation to that of other students. This measure allows the comparison of students who have completed different combinations of HSC courses and indicates the position of a student in relation to other students. The ATAR is calculated solely for use by universities, either on its own or in conjunction with other selection criteria, to rank and select school leavers for admission to university.
Calculation of the ATAR is the responsibility of the Technical Committee on Scaling on behalf of the NSW Vice‑Chancellors’ Committee. The NSW Education Standards Authority (NESA) provides the HSC data from which the ATARs are calculated and the Universities Admissions Centre (UAC) advises individual students of their ATARs.
This report contains information on the calculation of the ATAR in 2020.
Assoc Prof Rod YagerChair, Technical Committee on Scaling Macquarie University March 2021

iiiReport on the Scaling of the 2020 NSW Higher School Certificate
Acknowledgements
Calculating individual ATARs each year and distributing them to the students who requested them is a major task. It requires a high degree of expertise, commitment and co‑operation between the staff of several agencies:
− staff of the NSW Education Standards Authority (NESA) who supply the HSC data from which the ATARs are calculated
− staff of UAC who distribute the ATARs to individual students, handle enquiries from students following the release of the results and distribute information about the ATAR to schools during the year
− members of the Technical Committee on Scaling who play a central role with responsibility for translating policy decisions into processes, and for developing and maintaining programs that ensure the integrity of the data and the accuracy of the individual ATARs
− those members of the Technical Committee on Scaling who work closely with the Chair of the Committee when the ATARs are calculated, and at other times during the year.
Without the skill and commitment of these people, the calculation and distribution of the ATARs would not be possible.

iv

01Definitions
Definitions
ABSThe ABS is the Australian Bureau of Statistics.
ATAR cohortATAR cohort is used to refer to those students who received an ATAR in a particular year. The students may have accumulated courses over a five‑year period.
ATAR coursesATAR courses are Board Developed courses for which there are examinations conducted by NESA that yield graded assessments. Life Skills courses and Board Endorsed courses are not ATAR courses. If students wish to have English Studies, Mathematics Standard 1 or a VET course contribute to their ATAR eligibility requirements and calculation, they must enrol in the appropriate additional examination course and complete the examination.
Board Developed coursesBoard Developed courses are courses whose syllabuses have been developed by NESA.
Board Endorsed coursesBoard Endorsed courses are courses whose syllabuses have been approved by NESA but which do not have formal examinations conducted by NESA.
HSC cohortHSC cohort refers to students who have completed at least one ATAR course in a particular year.
NESANESA refers to the NSW Education Standards Authority (NESA). Prior to 1 January 2017, NESA was known as the Board of Studies, Teaching and Education Standards (BOSTES).
VET examination coursesThe VET Curriculum Frameworks are based on training packages where the assessment is competency based. As competency‑based assessment does not yield a mark that can be used in the ATAR calculations, NESA introduced an additional course for each VET Curriculum Framework that includes an examination. If students wish to have a VET course contribute to their ATAR eligibility requirements and calculation, they must enrol in the appropriate additional course and complete the examination. These additional courses are termed VET examination courses. Students who do not want their VET courses to contribute towards their ATARs are not required to complete these optional examinations.
02
1 The Higher School Certificate (HSC)
The Higher School Certificate (HSC) is an exit certificate awarded and issued by NESA. It marks the completion of 13 years of schooling, is the gateway to further study and employment, and presents a profile of student achievement in a set of courses.
1.1 Eligibility for an HSCTo qualify for an HSC, students must complete a pattern of Preliminary and HSC courses containing at least 12 units of Preliminary courses and at least 10 units of HSC courses.
These HSC courses must include at least: − 6 units of Board Developed courses − 2 units of a Board Developed course in English − three courses of 2‑unit value or greater (either Board Developed or Board Endorsed courses) − four subjects.
Further details about HSC eligibility and HSC courses can be found on NESA’s website.
1.2 Reporting student achievement in the HSCFor most ATAR courses, NESA reports student achievement against published standards by:
− an examination mark − a school assessment mark − an HSC mark − a performance band.
These results are shown on a student’s Record of Achievement. A Course Report is also provided for most Board Developed courses. The report describes the standard achieved in the course using performance bands and provides a graph indicating the student’s position in the course candidature.
1.2.1 Defining standards by performance bandsStandards in a course are described in terms of the content, skills, concepts and principles relevant to the course and represent the range of achievement expected of students completing the course. Performance band descriptors, which describe typical achievement at different standards (bands), have been developed for each course. There are six performance bands for 2‑unit courses and four performance bands for Extension courses.
The percentage of students in any performance band depends only on how many students enrolled in that course perform at the standard specified by the performance band descriptor. There are no predetermined percentages of students to be placed in the performance bands.
It follows that, although the standards described by the performance bands in a course will be the same from year to year, standards in different courses are not the same as they are based on different criteria. Because of this, it should not be expected that the percentages of students in the six bands will be the same across courses. For any course, the percentages will also vary from year to year if the performance of the cohort choosing that subject changes.
03The Higher School Certificate (HSC)
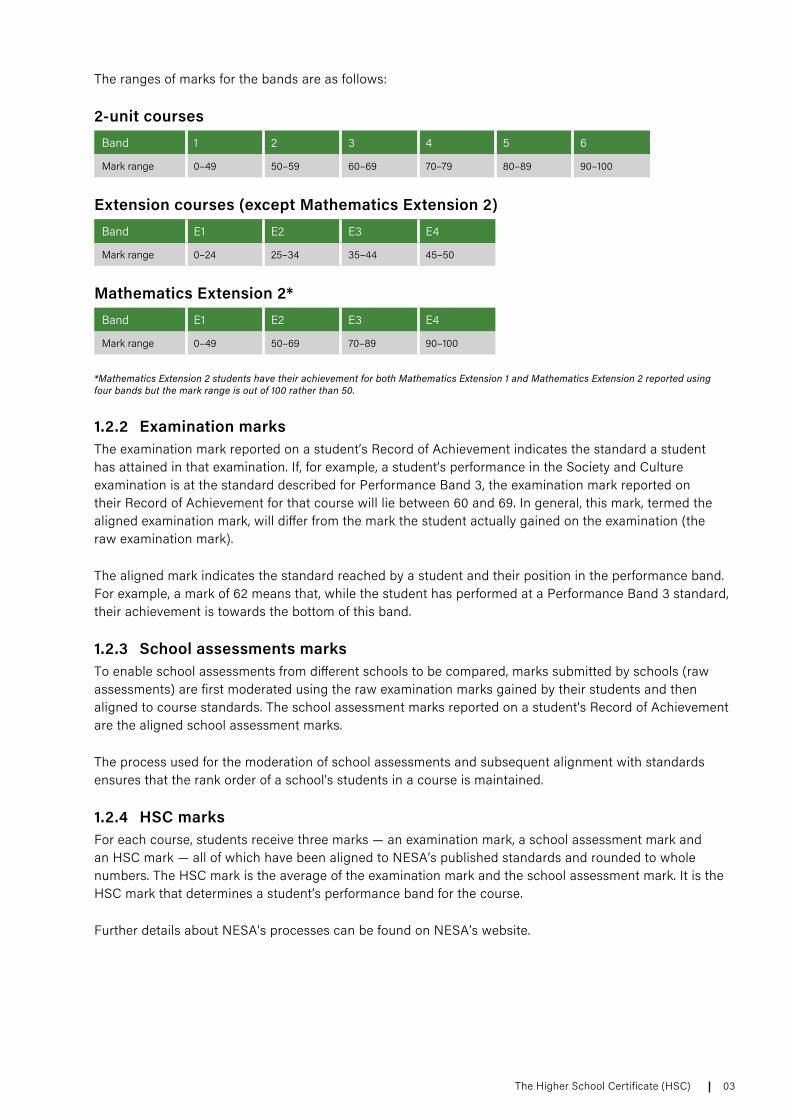
The ranges of marks for the bands are as follows:
2-unit coursesBand 1 2 3 4 5 6
Mark range 0–49 50–59 60–69 70–79 80–89 90–100
Extension courses (except Mathematics Extension 2)Band E1 E2 E3 E4
Mark range 0–24 25–34 35–44 45–50
Mathematics Extension 2*Band E1 E2 E3 E4
Mark range 0–49 50–69 70–89 90–100
*Mathematics Extension 2 students have their achievement for both Mathematics Extension 1 and Mathematics Extension 2 reported using four bands but the mark range is out of 100 rather than 50.
1.2.2 Examination marksThe examination mark reported on a student’s Record of Achievement indicates the standard a student has attained in that examination. If, for example, a student’s performance in the Society and Culture examination is at the standard described for Performance Band 3, the examination mark reported on their Record of Achievement for that course will lie between 60 and 69. In general, this mark, termed the aligned examination mark, will differ from the mark the student actually gained on the examination (the raw examination mark).
The aligned mark indicates the standard reached by a student and their position in the performance band. For example, a mark of 62 means that, while the student has performed at a Performance Band 3 standard, their achievement is towards the bottom of this band.
1.2.3 School assessments marksTo enable school assessments from different schools to be compared, marks submitted by schools (raw assessments) are first moderated using the raw examination marks gained by their students and then aligned to course standards. The school assessment marks reported on a student’s Record of Achievement are the aligned school assessment marks.
The process used for the moderation of school assessments and subsequent alignment with standards ensures that the rank order of a school’s students in a course is maintained.
1.2.4 HSC marksFor each course, students receive three marks — an examination mark, a school assessment mark and an HSC mark — all of which have been aligned to NESA’s published standards and rounded to whole numbers. The HSC mark is the average of the examination mark and the school assessment mark. It is the HSC mark that determines a student’s performance band for the course.
Further details about NESA’s processes can be found on NESA’s website.

04
2 The Australian Tertiary Admission Rank (ATAR) – an overview
2.1 BackgroundThe Australasian Conference of Tertiary Admission Centres (ACTAC) agreed that, as of 2010, all states and territories would adopt a common name for the ranking index used to rank students for university admission. The agreed name was the Australian Tertiary Admission Rank (ATAR). The name change was to emphasise the common scale used for reporting student ranks. NSW and the ACT adopted the new name in 2009.
The ATAR is a numerical measure of a student’s overall academic achievement in the HSC in relation to that of other students. This measure allows the overall achievement of students who have completed different combinations of HSC courses to be compared. The ATAR is calculated solely for use by tertiary institutions, either on its own or in conjunction with other criteria, to rank and select school leavers for admission. Calculation of the ATAR is the responsibility of the Technical Committee on Scaling on behalf of the NSW Vice‑Chancellors’ Committee.
The ATAR, which aims to provide a fair and equitable method of ranking applicants from all states, is based on the assumption that the age cohorts from which the states’ Year 12 cohorts are drawn are equally able to undertake tertiary study. That is, if everyone in the age group completed Year 12, it would be fair to consider the same proportion of each state’s students as admissible to any particular university course.
The result of this procedure in NSW is a number which represents the position of a student in the appropriate age cohort, based on their overall academic achievement in the HSC.
From 1998 until 2013 NSW used data from the School Certificate tests administered by NESA as the link that enabled the positions of HSC students relative to their Year 10 group to be estimated from their positions relative to their Year 12 group. With the move to the ATAR in 2009, the School Certificate group was augmented to more accurately reflect the entire HSC aged population of the state. The last School Certificate tests were held in 2011 so that procedure is no longer available.
From 2014 to 2016, a two‑parameter logistic function was used to translate the HSC students’ positions based on their scaled aggregate marks into ATARs. This was consistent with the procedure that had been used in most other jurisdictions without Year 10 examinations.
In 2016, all jurisdictions agreed to transition to a consistent process using a one‑parameter cubic spline function, depending only on the proportion of the age cohort that is ATAR eligible, as the means for converting student aggregates into ATARs. This was implemented in NSW in 2017, and with Queensland adopting the same methodology in 2020, all jurisdictions across Australia are now using the one‑parameter cubic spline function. It should be emphasised that these changes do not alter the rank order of students, and that the changes in methodology outlined above are sufficiently small to permit valid comparisons of ATARs obtained in different years.
The ATAR is calculated as a number between 0 and 99.95 with increments of 0.05. The ATAR is not a mark. Specifically, a student’s ATAR indicates the position of that student relative to the entire HSC aged population of the state. Students who receive an ATAR of 80.00 in 2020, for example, have performed well enough in the HSC to place them 20% from the top if every HSC aged person in the state had been ATAR eligible.
Students who indicate on their HSC entry forms that they wish to be notified of their ATARs will receive an ATAR Advice Notice from UAC. ATARs are also made available to institutions for selection purposes.
05The Australian Tertiary Admission Rank (ATAR) – an overview
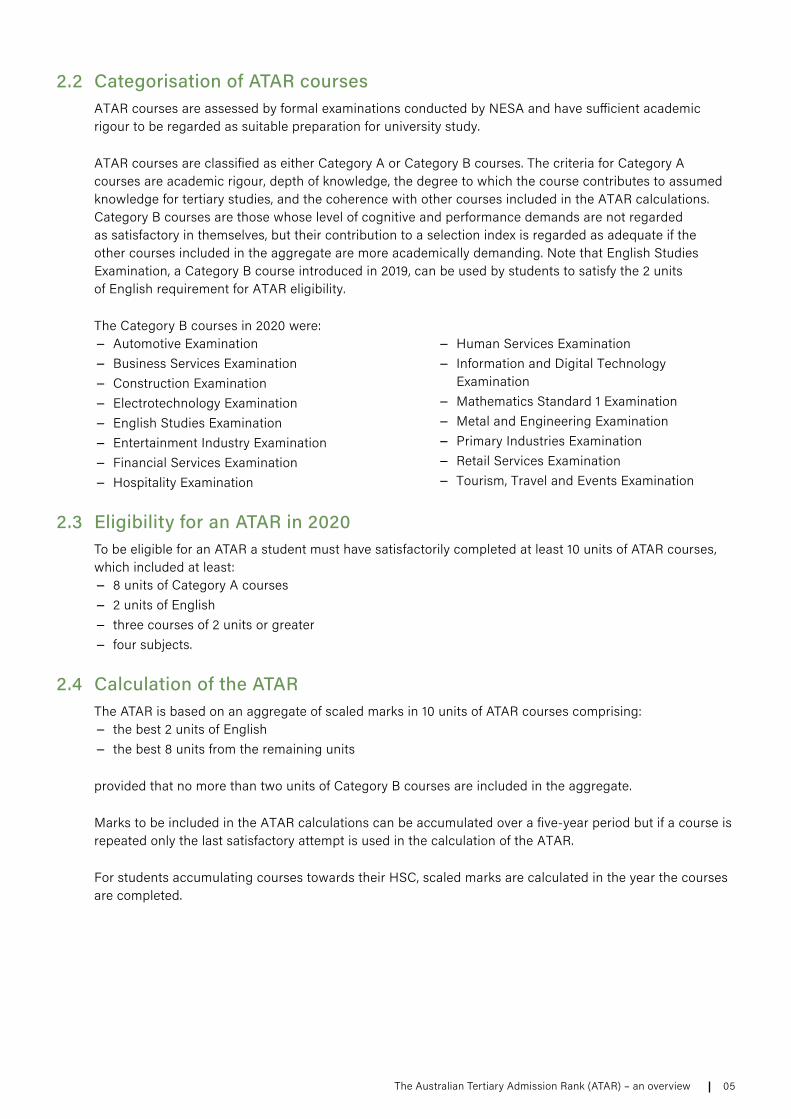
2.2 Categorisation of ATAR coursesATAR courses are assessed by formal examinations conducted by NESA and have sufficient academic rigour to be regarded as suitable preparation for university study.
ATAR courses are classified as either Category A or Category B courses. The criteria for Category A courses are academic rigour, depth of knowledge, the degree to which the course contributes to assumed knowledge for tertiary studies, and the coherence with other courses included in the ATAR calculations. Category B courses are those whose level of cognitive and performance demands are not regarded as satisfactory in themselves, but their contribution to a selection index is regarded as adequate if the other courses included in the aggregate are more academically demanding. Note that English Studies Examination, a Category B course introduced in 2019, can be used by students to satisfy the 2 units of English requirement for ATAR eligibility.
The Category B courses in 2020 were: − Automotive Examination − Business Services Examination − Construction Examination − Electrotechnology Examination − English Studies Examination − Entertainment Industry Examination − Financial Services Examination − Hospitality Examination
− Human Services Examination − Information and Digital Technology
Examination − Mathematics Standard 1 Examination − Metal and Engineering Examination − Primary Industries Examination − Retail Services Examination − Tourism, Travel and Events Examination
2.3 Eligibility for an ATAR in 2020To be eligible for an ATAR a student must have satisfactorily completed at least 10 units of ATAR courses, which included at least:
− 8 units of Category A courses − 2 units of English − three courses of 2 units or greater − four subjects.
2.4 Calculation of the ATARThe ATAR is based on an aggregate of scaled marks in 10 units of ATAR courses comprising:
− the best 2 units of English − the best 8 units from the remaining units
provided that no more than two units of Category B courses are included in the aggregate.
Marks to be included in the ATAR calculations can be accumulated over a five‑year period but if a course is repeated only the last satisfactory attempt is used in the calculation of the ATAR.
For students accumulating courses towards their HSC, scaled marks are calculated in the year the courses are completed.
06
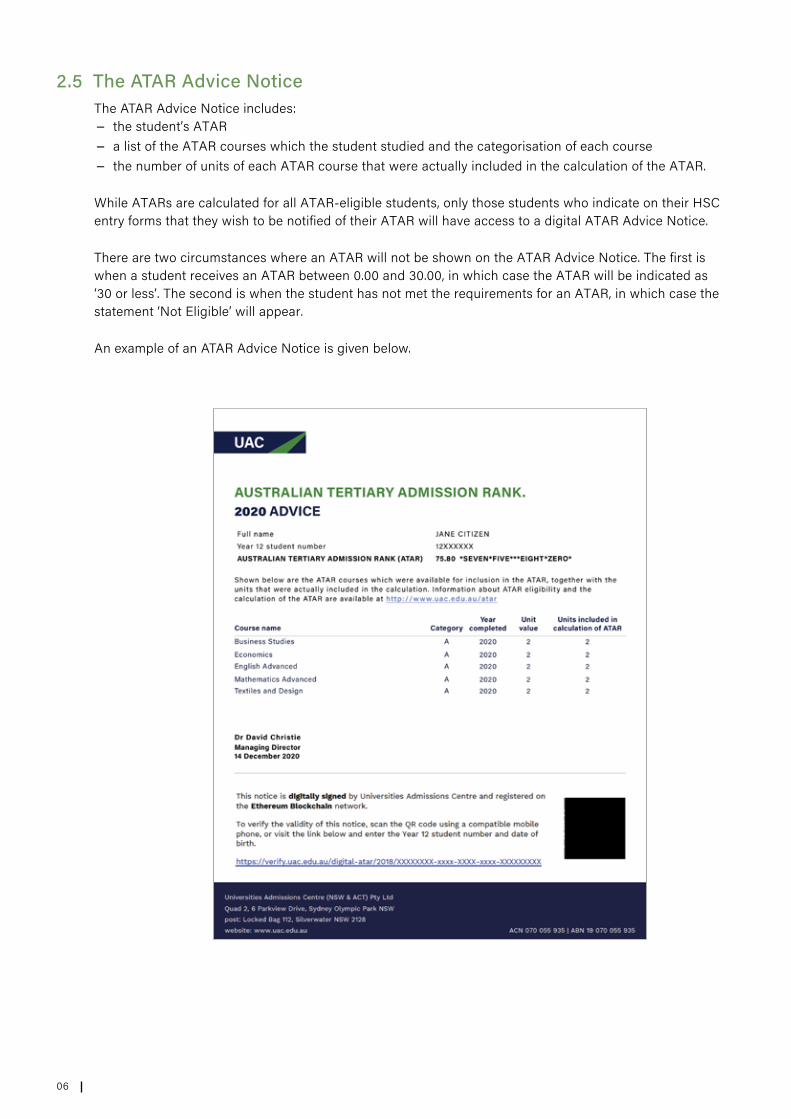
2.5 The ATAR Advice NoticeThe ATAR Advice Notice includes:
− the student’s ATAR − a list of the ATAR courses which the student studied and the categorisation of each course − the number of units of each ATAR course that were actually included in the calculation of the ATAR.
While ATARs are calculated for all ATAR‑eligible students, only those students who indicate on their HSC entry forms that they wish to be notified of their ATAR will have access to a digital ATAR Advice Notice.
There are two circumstances where an ATAR will not be shown on the ATAR Advice Notice. The first is when a student receives an ATAR between 0.00 and 30.00, in which case the ATAR will be indicated as ‘30 or less’. The second is when the student has not met the requirements for an ATAR, in which case the statement ‘Not Eligible’ will appear.
An example of an ATAR Advice Notice is given below.

07Calculating the ATAR in 2020
3 Calculating the ATAR in 2020
3.1 OverviewTertiary institutions are concerned with ranking school leaver applicants. From their perspective, the importance of HSC marks is that they convey information about a student’s position in relation to other students.
With the exception of English, which is compulsory, students are free to choose their courses of study. Consequently, individual course candidatures vary in size and nature, and there are many different enrolment patterns. In 2020 there were 25,917 different enrolment patterns for ATAR eligible students; only 218 of these 25,917 combinations were completed by 20 or more students and 18,845 were taken by only one student. Given the choice available, it follows that a student’s rank in different courses will not necessarily have the same meaning, as good rankings are more difficult to obtain when the student is competing against students of high academic ability.
Because of the lack of comparability of HSC marks achieved in different courses, either when reported against standards or in terms of ranking, marks of individual students are scaled before they are added to give the aggregates from which the ATARs are determined.
The scaling process is designed to encourage students to take the courses for which they are best suited and which best prepare them for their future studies. The underlying principle is that a student should neither be advantaged nor disadvantaged by choosing one HSC course over another. The scaling algorithm estimates what students’ marks would have been if all courses had been studied by all students and all courses had the same distribution of marks.
The scaling model assumes that a student’s position in a course depends on the student’s developed ability in that course and the ‘strength of the competition’. Since the ATAR is a rank that reflects academic achievement, ‘strength of the competition’ is defined in terms of the demonstrated overall academic attainment of a course candidature.
Scaling first modifies the mean, the standard deviation (SD) and the maximum mark in each course. Adjustments are then made to the marks of individual students to produce scaled marks, which are the marks the students would have received if all courses had the same candidature and the same mark distribution.
Although scaled marks are generally different from the raw marks from which they are derived, the ranking of students within a course is not changed.
Once the raw marks have been scaled, aggregates are calculated for ATAR‑eligible students. In most cases, the ranking or order of merit based on these aggregates is quite different from the order of merit using aggregates based on HSC marks.
The penultimate step is to determine what the percentiles would have been if all HSC aged persons in the state were eligible for an ATAR. The last step is to truncate these percentiles to the nearest 0.05. These are the ATARs.
Each ATAR corresponds to a range of aggregates. The target for the number of students with each ATAR varies and is calculated using the cubic spline function referred to in section 2.1. The presence of candidates tied on the same aggregate means that the actual number of students with each ATAR may differ slightly from the calculated target.

08
The scaling process is carried out afresh each year. It does not assume that one course is intrinsically more difficult than another or that the quality of the course candidature is always the same. All students who complete at least one ATAR course in a given year are included in the scaling process for that year. Students who are accumulating courses towards their HSC have their scaled mark for each course calculated in the year that the course is completed.
3.2 The scaling process in 2020Despite the disruptions experienced in 2020 and the consequent changes to the examination arrangements in some subjects, the scaling procedure used to produce the aggregates in 2020 was unchanged from that used in 2019.
3.2.1 Marks used in the ATAR calculationsFor each course a student completes, NESA provides the following marks:
− a raw examination mark − a raw moderated school assessment mark1
− an examination mark, which has been aligned to course standards − a moderated school assessment mark, which has been aligned to course standards − an HSC mark.
All marks are provided on a 1‑unit basis to one decimal place. In the description of the scaling process that follows, to cater for both 2‑unit and Extension courses, marks are described on a 1‑unit basis.
3.2.2 Raw HSC marksRaw HSC marks, rather than NESA’s reported HSC marks, are used in the scaling process. A student’s raw HSC mark in a course is the average of their raw examination mark and their raw moderated school assessment mark. These marks are not reported to students.
3.2.3 Combined coursesAs NESA places English Studies, English Standard and English Advanced raw marks on a common scale, these courses are combined and scaled as a single course but are reported as separate courses in order to be consistent with NESA’s reporting practice.
Similarly, while the examinations for the Automotive, Information and Digital Technology, and Hospitality VET Frameworks are separated into two or more streams, NESA places the raw examination marks for the various streams in each framework on a common scale. Consequently, the Automotive Exam, Information and Digital Technology Exam and Hospitality Exam are each scaled as a single course.
In 2020, NESA implemented changes to the examination arrangements for Mathematics Standard 1, Mathematics Standard 2 and Mathematics Advanced which enables them to provide additional information which could be used as the basis for placing the raw marks of these three subjects on a common scale. Currently, neither NESA, nor the ATAR calculation process make any use of this data. While studies are underway to evaluate its usefulness and reliability for ATAR calculation, there are no current plans to change the scaling procedures used for these courses. If it is determined that changes are desirable, they will be announced before the first cohort affected begins their Year 11 studies.
3.2.4 Initial standardisationBefore the scaling algorithm is implemented, a linear transformation is applied to the raw HSC marks in each course to set the top mark to a common value. The marks in each course are then standardised to a mean of 25 and standard deviation of 12 on a 1‑unit basis.
1 These are school assessment marks that have been moderated using the raw examination marks

09Calculating the ATAR in 2020
3.2.5 Calculating scaled means and standard deviationsThe model underpinning the scaling algorithm specifies that the scaled mean in a course is equal to the average academic achievement of the course candidature where, for individual students, the measure of academic achievement is taken as the average scaled mark in all courses completed. The model specification leads to a set of simultaneous equations from which the scaled means of 2‑unit courses are calculated.
The scaled standard deviation for a 2‑unit course is the standard deviation of the measure of overall academic achievement of the candidature of that course.
For Extension courses, the scaled means and standard deviations are determined by the performance of the Extension students on the corresponding 2‑unit courses. The exceptions are History Extension which can be completed by both Modern History and Ancient History students, Science Extension which can be taken by students doing up to three 2‑unit science courses (out of Biology, Chemistry, Earth and Environmental Science, Investigating Science and Physics), and the second Extension courses in English and Mathematics: English Extension 2 and Mathematics Extension 2.
A scaled mean is determined for the Modern History students in History Extension on the basis of their performance in the 2‑unit Modern History course. A scaled mean for the Ancient History students in History Extension is found in a similar manner. The scaled mean for History Extension is then set equal to the weighted average of these two scaled means. The scaled standard deviation is found in a similar manner.
In the same way, the scaled mean and standard deviation of Science Extension are the weighted average of the scaled means and standard deviations of five groups of students, with each of the scaled mean and standard deviation calculated for students in Science Extension on the basis of their separate performances in 2‑unit Biology, Chemistry, Earth and Environmental Science, Investigating Science and Physics.
Scaled means and standard deviations for English and Mathematics Extension 1 courses are calculated as described above. The scaled mean and standard deviation for the Mathematics Extension 2 course are then determined by the performance of the Extension 2 students in the Mathematics Extension 1 course. For English Extension 2, the scaled mean and standard deviation are determined by the performance of the Extension 2 students in English Advanced. (This option is not available for Mathematics as the Extension 2 students do not complete the Mathematics 2‑unit paper.)
10
3.2.6 Setting maximum marks The maximum scaled mark in a course is determined according to the academic quality of the course candidature in such a way that the maximum scaled mark for the combined 2‑unit English candidature is 50 on a 1‑unit basis. With the introduction of English Studies Examination in 2019, the combined 2‑unit English candidature consists of students who have taken English Studies Examination, English Standard and English Advanced.
In 2020 the maximum scaled mark in a course was given by the smaller of 50 and the scaled mean + 2.47 times the initial scaled standard deviation, where the scaled mean and initial scaled standard deviation of the course are determined using the scaling algorithm.
The multiple used here to determine the maximum scaled mark in a course, which in 2020 was 2.47, is calculated afresh each year.
3.2.7 Scaling individual marksOnce the scaled means and standard deviations are determined, individual raw marks are scaled using a non‑linear transformation which preserves the scaled mean and standard deviation of a course and restricts the scaled marks to the range (0–50).
If this transformation results in a maximum scaled mark which is less than the maximum scaled mark described in 3.2.6, a further linear transformation is applied. The effect of this linear transformation is to increase the standard deviation so that the actual maximum scaled mark in the course is changed to be the same as the maximum scaled mark described in 3.2.6. This further transformation does not affect the scaled mean. In all tables presented in this report, the modified scaled standard deviations rather than the initial scaled standard deviations are shown.
For some courses with very small candidatures the non‑linear transformation is not always appropriate, in which case alternative transformations, which are consistent with the principles of the scaling algorithm, are used.
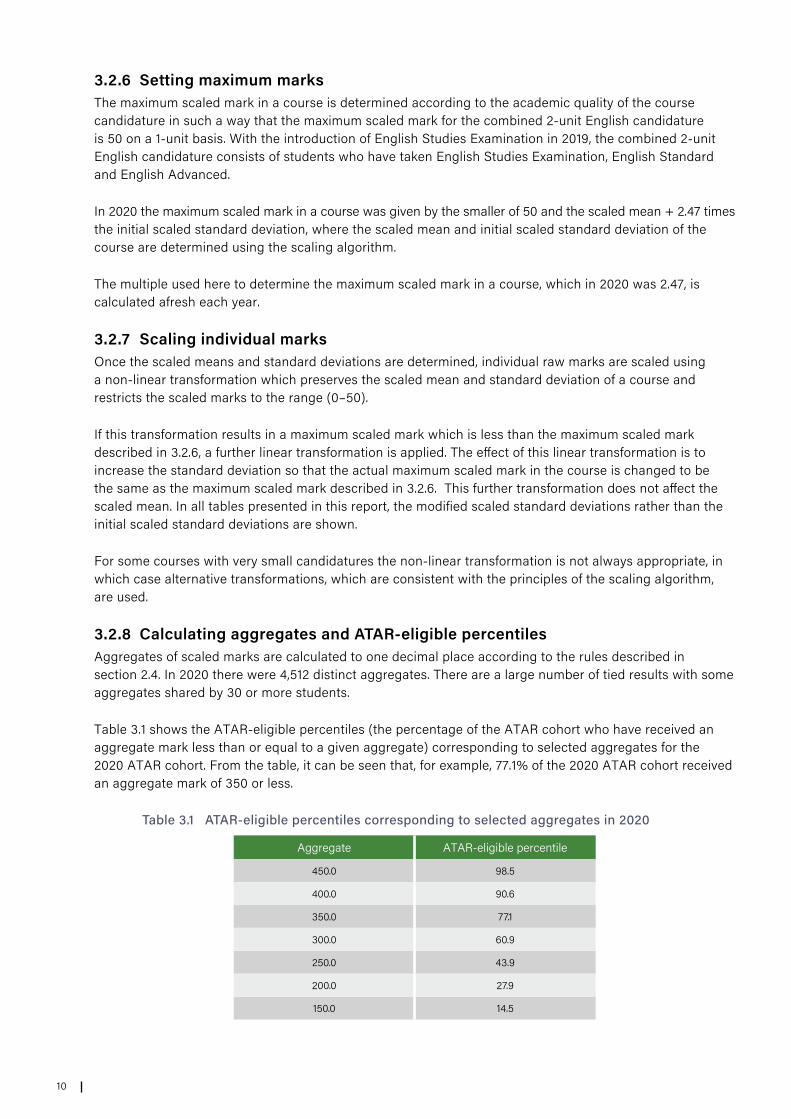
3.2.8 Calculating aggregates and ATAR-eligible percentilesAggregates of scaled marks are calculated to one decimal place according to the rules described in section 2.4. In 2020 there were 4,512 distinct aggregates. There are a large number of tied results with some aggregates shared by 30 or more students.
Table 3.1 shows the ATAR‑eligible percentiles (the percentage of the ATAR cohort who have received an aggregate mark less than or equal to a given aggregate) corresponding to selected aggregates for the 2020 ATAR cohort. From the table, it can be seen that, for example, 77.1% of the 2020 ATAR cohort received an aggregate mark of 350 or less.
Table 3.1 ATAR-eligible percentiles corresponding to selected aggregates in 2020
Aggregate ATAR‑eligible percentile
450.0 98.5
400.0 90.6
350.0 77.1
300.0 60.9
250.0 43.9
200.0 27.9
150.0 14.5

11Calculating the ATAR in 2020
0.0
0.2
0.4
0.6
0.8
1.0
1.2
1.4
1.6
1.8
2.0
0 10 20 30 40 50 60 70 80 90
per c
ent w
ith A
TAR
trun
cate
d
ATAR truncated
allocatedtarget
3.2.9 Calculating the ATAR In 2020 a one‑parameter cubic spline model was used to translate the ATAR‑eligible percentiles into ATARs. This model was adopted by some jurisdictions in 2016, was used in all jurisdictions except Queensland from 2017, and was adopted by Queensland in 2020. The model depends only on the participation rate observed in the jurisdiction.
The specific form of the cubic spline function will depend on the proportion of students in the target population who are ATAR‑eligible. This proportion is called the participation rate. The target population served by UAC consists of students from the ACT and NSW. In 2020 the ACT and NSW combined participation rate, determined using ABS data, was 57.8%, down from 58.5% in 2019. To avoid distortions to the model that might impact the comparability of ATARs obtained in different jurisdictions, the processes described in this section are implemented with reference only to the results of students whose studies took place in NSW or the ACT and who were aged 16‑20 on 30 June 2020.
For jurisdictions with participation rates between 25% and 75%, the model expects that the proportion of people whose percentile rank within the target population is x who will be ATAR eligible is given by
where α is 1.5 – 2*(participation rate). In 2020, the value of α in NSW was 0.34.
In particular, the model expects all the most able candidates to complete Year 12 and be eligible for an ATAR, and so the top category should contain 1/2000th of the target population. In 2020 this target frequency for an ATAR of 99.95 was N = 49 for ACT and NSW combined, meaning that the number of students from these two jurisdictions receiving 99.95 should not exceed 49.
With the 2020 ACT and NSW combined participation rate, the model expects that 93.7% of candidates who are at the 70th percentile in the target population will complete Year 12 and be eligible for an ATAR. Accordingly, the target frequency for an ATAR of 70.00 is 93.7% of 1/2000th of the target population, which was 46 students.
In order to implement this model, each ACT student is allocated a notional aggregate using the process to equate NSW HSC and ACT Board of Senior Studies results in use since 2006. (Annual studies are undertaken to ensure that this process continues to be valid). Starting with the highest aggregate, the candidates are progressively allocated to ATAR bands to achieve the cumulative target frequencies, without exceeding them. (In 2020, the 99.95 ATAR band consisted of 47 NSW students and 2 ACT students.) There is noise in the allocation due to ties in the aggregates. The resulting pattern is shown in Figure 3.1.
Figure 3.1 Percentage of NSW ATAR-eligible students in each ATAR truncated band in 2020
if 0≤ x ≤100α and 1 — if 100α≤ x ≤100x3
(1000α)2(100-x)3
(1000-1000α)2

12
The relationship between the NSW ATAR and ATAR‑eligible percentile in 2020 is shown in Figure 3.2.
Figure 3.2 The relationship between NSW ATAR and ATAR-eligible percentile in 2020
The relationship between aggregates and ATARs in 2020 is shown graphically in Figure 3.3.
Figure 3.3 Relationship between aggregate and NSW ATAR in 2020
Each ATAR corresponds to a range of aggregate marks. The range of aggregates corresponding to one ATAR is greatest in the extremes of the distribution of aggregates and smallest near the middle of the distribution of aggregates. Table 3.2 gives ATARs for selected aggregates based on the 2020 data.
Table 3.2 Relationship between NSW aggregate and ATAR in 2020
Aggregate ATAR
450.0 99.10
400.0 94.50
350.0 86.50
300.0 76.85
250.0 66.25
200.0 55.35
150.0 44.70
0
10
20
30
40
50
60
70
80
90
100
0 10 20 30 40 50 60 70 80 90 100
ATAR
ATAR-eligible percentile
0.00
10.00
20.00
30.00
40.00
50.00
60.00
70.00
80.00
90.00
100.00
0 50 100 150 200 250 300 350 400 450 500
ATAR
Aggregate

13The HSC and ATAR in 2020 – some results
4 The HSC and ATAR in 2020 – some results
4.1 OverviewA total of 75,040 students completed at least one HSC course in 2020, but 4,574 were removed from the database as they completed no ATAR course. Of the remaining pool of 70,466 students, 89.6% received an HSC and 77.9% received an ATAR. There were 345 students who received an ATAR but did not receive the HSC award, primarily because they had not yet provided evidence of meeting the minimum standards in literacy and numeracy, a requirement for the HSC award introduced by NESA for the 2020 Year 12 cohort. While courses contributing to the underlying aggregate may be accumulated over a five‑year period, 93.1% of those receiving an ATAR in 2020 included only 2020 courses in their aggregate.
The percentage of students enrolled in at least one ATAR course who were female was 52.8% (up from 52.3% in 2019), and 54.4% of students who received an ATAR were female (also up from 53.7% in 2019).
4.2 Percentage of students receiving an ATARHSC students who do not receive an ATAR fall into one of two broad groups:
− Those who are studying less than 10 units. These include private study students who enrol in one or two courses, mature age students who are studying a limited HSC program and students who are accumulating their HSC over two or more years.
− Those who enrol in a full HSC program which does not satisfy the requirements for an ATAR. These students normally complete 6 or 8 units of Board Developed courses, and choose the remaining units from Board Endorsed courses. They receive an HSC but not an ATAR. In 2020 there were 8,605 such students.
Table 4.1 Proportion of students receiving an ATAR, 2016–2020
Students receiving an ATAR
Year HSC candidature Number %
2016 72,014 55,956 77.7
2017 72,708 57,061 78.5
2018 71,407 56,127 78.6
2019 69,560 55,031 79.1
2020 70,466 54,894 77.9

14
4.3 Number of units of ATAR courses completedThe pattern in 2020 was similar to that observed in 2019, with 49.3% completing exactly 10 ATAR units and 29.0% completing more than the required minimum number of ATAR units (Table 4.2).
Table 4.2 Percentage of students completing specified numbers of units1 of ATAR courses, 2016–2020
2020
Number of units
2017 %
2018 %
2019 % % Number
1 0.5 0.6 0.7 0.7 466
2 7.4 7.4 7.3 8.0 5,656
3 0.6 0.6 0.5 0.6 409
4 4.9 4.7 4.2 4.4 3,070
5 0.1 0.1 0.2 0.1 69
6 4.8 4.8 4.3 4.6 3,257
7 0.1 0.1 0.1 0.1 96
8 2.8 2.8 3.0 3.1 2,168
9 0.1 0.1 0.1 0.1 104
10 47.1 48.3 49.0 49.3 34,749
11 17.2 16.8 17.5 16.8 11,852
12 12.7 12.1 11.3 10.7 7,535
13 1.3 1.3 1.3 1.2 811
14 0.3 0.2 0.3 0.3 195
15+ 0.1 0.0 0.1 0.0 29
HSC cohort 72,708 71,401 69,560 70,466
1 The units include current year units and units accumulated in previous years.
4.4 Course enrolments – Table A1Table A1 in the Appendix provides for each course the size of the candidature, the number who received an HSC in 2020, the number who received an ATAR in 2020, the percentage of females and the maximum ATAR gained by a student enrolled in that course. The table includes students who completed the course in 2020 as well as those who completed the course in previous years and completed at least one ATAR course in 2020. The table excludes courses where there were less than 10 students.
What is clear is that in almost all courses some students gained an ATAR in excess of 95.00, and for the majority of courses the maximum ATAR is higher.
In Table A6 we have included a column showing for each course the maximum ATAR of any student doing the course in any year and including all units from that course in the ATAR calculation. For the vast majority of courses, the values for the maximum ATAR in Tables A1 and A6 agree.
The pattern of ‘male‑dominated’ and ‘female‑dominated’ courses was similar to the pattern exhibited previously. Female students were in the majority in languages, creative arts and the humanities, while males were in the majority in technology and computing courses.

15The HSC and ATAR in 2020 – some results
A total of 20,045 students enrolled in at least one VET course, of which 11,680 students enrolled in a VET examination course. The proportion taking a VET examination course (58.3%) is lower than the corresponding proportion for 2019 (61.2%).
Overall, 77.9% of the 2020 HSC cohort received ATARs but the percentage varied across courses, from 51.9% to 99.7% for Category A courses with candidatures exceeding 100. For students enrolled in any VET courses, the overall figure was 52.5% but was higher, at 78.3%, for students enrolled in VET examination courses.
4.5 Distributions of HSC marks – Table A2 Table A2 in the Appendix shows the distributions of HSC marks in 2020. For each course the percentage of students in Bands 2 to 6 are given, together with the median HSC mark and the Band in which the median lies. Data are not provided for courses with less than 10 students.
Since the introduction of standards referenced reporting in 2001, marks reported to students have not been constrained to a set distribution. Students demonstrating the highest level of achievement in a 2‑unit course are placed in Band 6 and receive HSC marks of 90 and above. The data show clearly that patterns of HSC marks vary across courses.
There are few students in Band 1. For most 2‑unit courses the median HSC mark lies in Band 4.
Comparison of Table A2 with the corresponding table in 2019 shows that distributions of HSC marks have changed for some courses (see section 5.1).
4.6 Descriptive statistics of HSC and scaled marks – Table A3 Table A3 in the Appendix presents, for each course, descriptive statistics and the 99th, 90th, 75th, 50th and 25th percentiles for HSC and scaled marks. Data is not provided for courses with less than 10 students or courses in which all the students have a total of less than 25 results from other current year scaling courses. Percentiles are not included for courses with less than 40 students.
Although HSC marks are not used as the basis for scaling they are shown in Table A3 because raw marks are not released to students or teachers and hence cannot be presented in this report. Scaled marks are generally lower than HSC marks: few students receive HSC marks less than 25 (on a 1‑unit basis) whereas the average scaled mark for the total HSC candidature is approximately 25.
In the table, marks are shown on a 1‑unit basis, so the range is 0 to 50. The percentiles in a course are based on all students completing that course in 2020 irrespective of whether they were eligible for an ATAR or not.
When reading the table, it must be remembered that an HSC mark indicates a standard reached whereas a scaled mark reflects the position a student would have obtained in the course candidature had all students completed that course. Because HSC marks and scaled marks serve different purposes, comparing HSC and scaled marks is of little value and can lead to misinterpretations that may adversely affect student choices of courses to study.
Table A3 should not be used as a simple HSC to scaled mark conversion table for reasons explained below.
16
NESA reports HSC marks rounded to the nearest integer whereas raw marks are calculated to one decimal place. NESA aligns the raw marks to bands that best describe the standards that the students achieve. This can compress a range of raw marks to a smaller number of HSC marks. For example, all Band E4 performances in an Extension course (except for Mathematics Extension 2) are allocated one of the six integer marks 45 to 50. Thus after aligning and rounding, for each HSC mark there can be a range of raw marks and hence a range of scaled marks. There is, in general, no unique scaled mark for an HSC mark.
A given HSC mark often corresponds to a range of raw and scaled marks and hence to a range of percentiles. Table A3 gives the HSC mark at the specified percentile. Not all students with that HSC mark will be at that percentile when the raw marks are considered. For example, in History Extension the HSC mark at the 90th percentile was 46.0. Students with a History Extension HSC mark of 46.0 in fact corresponded to the scaled mark percentile range 83.3 to 93.0.
The scaled marks reported in Table A3 are the scaled marks at the specified percentiles. The 90th percentile of the scaled mark distribution in History Extension was 42.2 but there was a range of scaled marks achieved by those with an HSC mark of 46.0.
Looking at Music Extension in Table A3 we see that the 99th and 90th percentiles of the HSC distribution are both 50.0 whereas the scaled marks at the corresponding percentiles are 50.0 and 49.5. This illustrates that there is not a unique scaled mark corresponding to a given HSC mark.
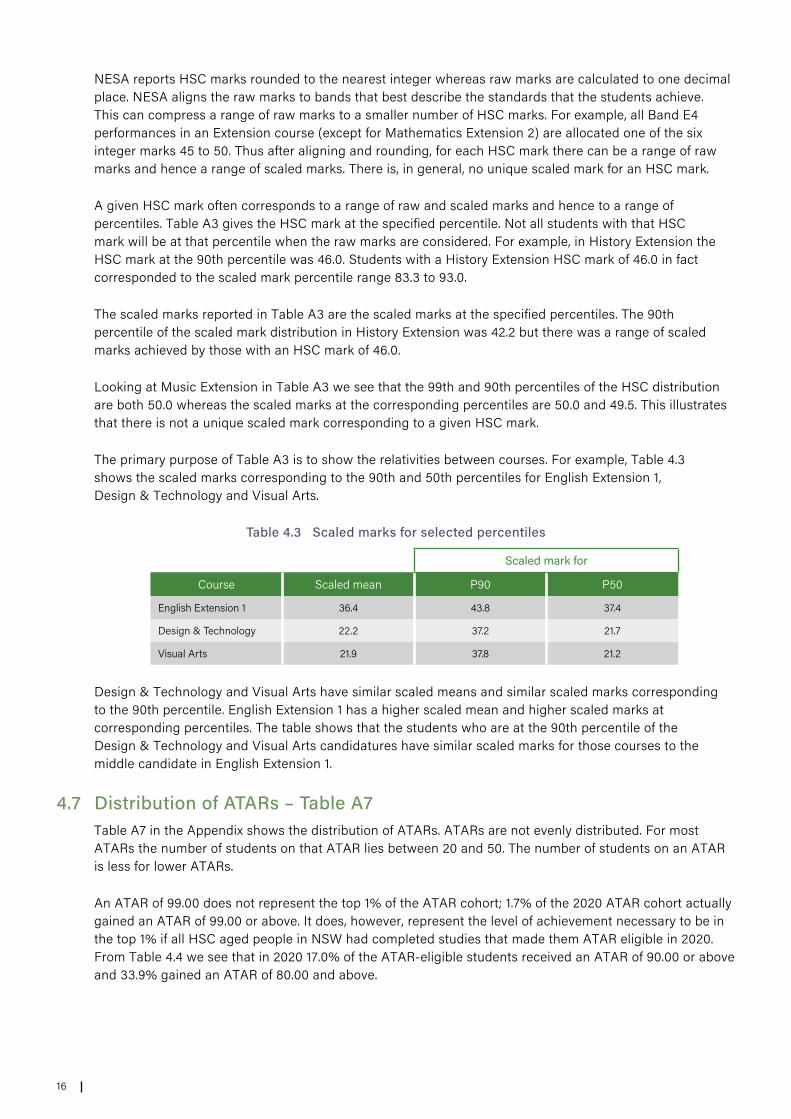
The primary purpose of Table A3 is to show the relativities between courses. For example, Table 4.3 shows the scaled marks corresponding to the 90th and 50th percentiles for English Extension 1, Design & Technology and Visual Arts.
Table 4.3 Scaled marks for selected percentiles
Scaled mark for
Course Scaled mean P90 P50
English Extension 1 36.4 43.8 37.4
Design & Technology 22.2 37.2 21.7
Visual Arts 21.9 37.8 21.2
Design & Technology and Visual Arts have similar scaled means and similar scaled marks corresponding to the 90th percentile. English Extension 1 has a higher scaled mean and higher scaled marks at corresponding percentiles. The table shows that the students who are at the 90th percentile of the Design & Technology and Visual Arts candidatures have similar scaled marks for those courses to the middle candidate in English Extension 1.
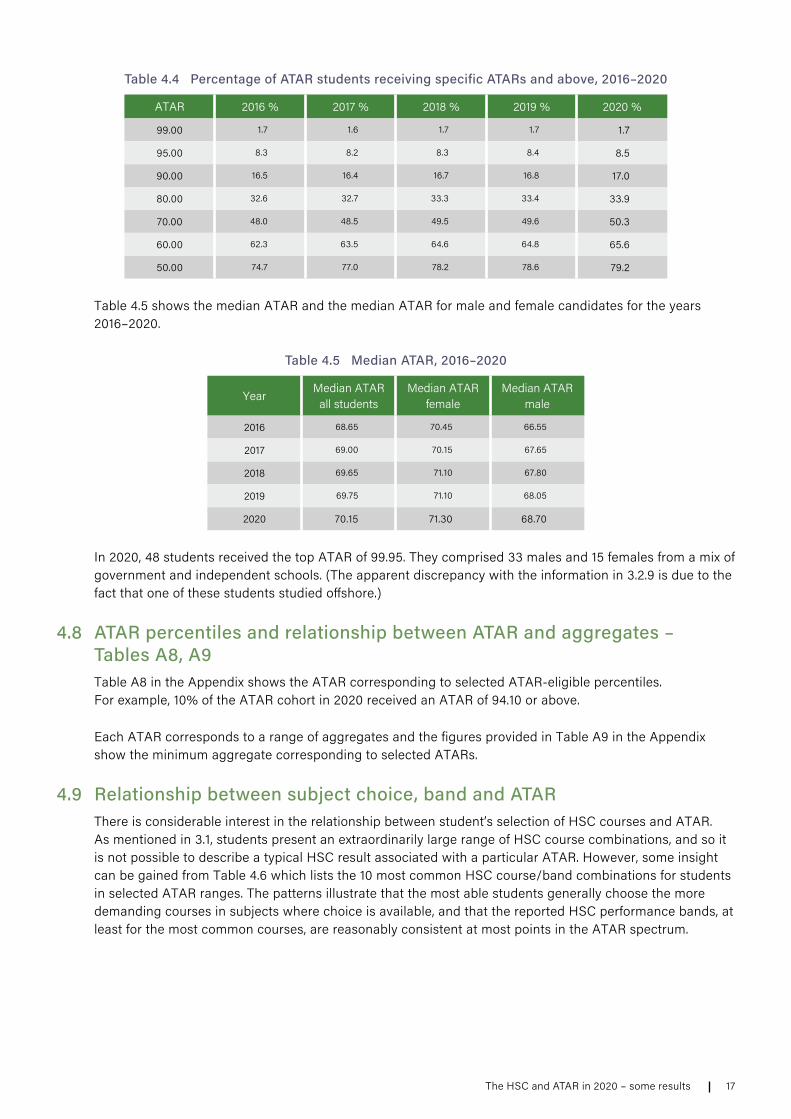
4.7 Distribution of ATARs – Table A7Table A7 in the Appendix shows the distribution of ATARs. ATARs are not evenly distributed. For most ATARs the number of students on that ATAR lies between 20 and 50. The number of students on an ATAR is less for lower ATARs.
An ATAR of 99.00 does not represent the top 1% of the ATAR cohort; 1.7% of the 2020 ATAR cohort actually gained an ATAR of 99.00 or above. It does, however, represent the level of achievement necessary to be in the top 1% if all HSC aged people in NSW had completed studies that made them ATAR eligible in 2020. From Table 4.4 we see that in 2020 17.0% of the ATAR‑eligible students received an ATAR of 90.00 or above and 33.9% gained an ATAR of 80.00 and above.
17The HSC and ATAR in 2020 – some results
Table 4.4 Percentage of ATAR students receiving specific ATARs and above, 2016–2020
ATAR 2016 % 2017 % 2018 % 2019 % 2020 %
99.00 1.7 1.6 1.7 1.7 1.7
95.00 8.3 8.2 8.3 8.4 8.5
90.00 16.5 16.4 16.7 16.8 17.0
80.00 32.6 32.7 33.3 33.4 33.9
70.00 48.0 48.5 49.5 49.6 50.3
60.00 62.3 63.5 64.6 64.8 65.6
50.00 74.7 77.0 78.2 78.6 79.2
Table 4.5 shows the median ATAR and the median ATAR for male and female candidates for the years 2016–2020.
Table 4.5 Median ATAR, 2016–2020
YearMedian ATAR
all studentsMedian ATAR
femaleMedian ATAR
male
2016 68.65 70.45 66.55
2017 69.00 70.15 67.65
2018 69.65 71.10 67.80
2019 69.75 71.10 68.05
2020 70.15 71.30 68.70
In 2020, 48 students received the top ATAR of 99.95. They comprised 33 males and 15 females from a mix of government and independent schools. (The apparent discrepancy with the information in 3.2.9 is due to the fact that one of these students studied offshore.)
4.8 ATAR percentiles and relationship between ATAR and aggregates – Tables A8, A9Table A8 in the Appendix shows the ATAR corresponding to selected ATAR‑eligible percentiles. For example, 10% of the ATAR cohort in 2020 received an ATAR of 94.10 or above.
Each ATAR corresponds to a range of aggregates and the figures provided in Table A9 in the Appendix show the minimum aggregate corresponding to selected ATARs.
4.9 Relationship between subject choice, band and ATARThere is considerable interest in the relationship between student’s selection of HSC courses and ATAR. As mentioned in 3.1, students present an extraordinarily large range of HSC course combinations, and so it is not possible to describe a typical HSC result associated with a particular ATAR. However, some insight can be gained from Table 4.6 which lists the 10 most common HSC course/band combinations for students in selected ATAR ranges. The patterns illustrate that the most able students generally choose the more demanding courses in subjects where choice is available, and that the reported HSC performance bands, at least for the most common courses, are reasonably consistent at most points in the ATAR spectrum.

18
Table 4.6 The 10 most common HSC courses and results achieved by students at selected ATAR ranges, 2020
ATAR range HSC Course HSC BandPercentage of students in this ATAR range with this result contributing to their ATAR
99.00 – 99.95 English Advanced 6 83%
Mathematics Extension 1 E4 83%
Mathematics Extension 2 E4 60%
Chemistry 6 58%
Physics 6 36%
Mathematics Advanced 6 20%
Economics 6 19%
Biology 6 18%
English Extension 1 E4 15%
Modern History 6 15%
90.00 – 90.95 English Advanced 5 67%
Biology 5 28%
Mathematics Advanced 5 27%
Mathematics Extension 1 E3 23%
Chemistry 5 18%
Business Studies 5 18%
Modern History 5 17%
Mathematics Advanced 6 16%
English Standard 5 15%
Mathematics Standard 2 5 14%
70.00 – 70.95 English Standard 4 46%
English Advanced 4 32%
Mathematics Standard 2 4 29%
Biology 4 29%
Business Studies 4 24%
Mathematics Advanced 4 18%
Mathematics Standard 2 5 16%
PDH&PE 4 16%
Modern History 4 14%
English Advanced 5 12%
50.00 – 50.95 English Standard 3 44%
Mathematics Standard 2 3 39%
English Standard 4 37%
Business Studies 3 23%
Biology 3 23%
PDH&PE 3 21%
Community & Family Studies 4 17%
Mathematics Standard 2 2 14%
Mathematics Standard 2 4 14%
Modern History 3 13%
19The HSC and ATAR in 2020 – some results
4.10 Gender differencesAs in previous years, female students outperformed male students in the majority of courses and had a higher median ATAR. The percentages of students receiving ATARs on or above specified values who were female are given in Table 4.6.
Table 4.7 Percentage of students receiving ATARs on or above specified values who were female, 2016–2020
ATAR % female 2016 % female 2017 % female 2018 % female 2019 % female 2020
99.00 45.9 44.2 45.9 47.2 45.1
98.00 47.2 46.6 51.0 52.6 47.9
95.00 52.2 51.1 55.4 55.8 51.7
90.00 54.4 53.6 58.0 57.7 54.3
80.00 56.7 55.5 58.5 56.9 56.1
70.00 56.3 55.7 53.2 57.2 56.4
60.00 55.5 55.4 53.5 53.0 56.1
50.00 54.8 55.0 48.0 54.8 55.4
40.00 54.3 54.5 50.4 48.4 55.0
30.00 53.9 54.0 47.6 46.5 54.5
Total cohort 53.3 53.7 53.7 54.1 54.4
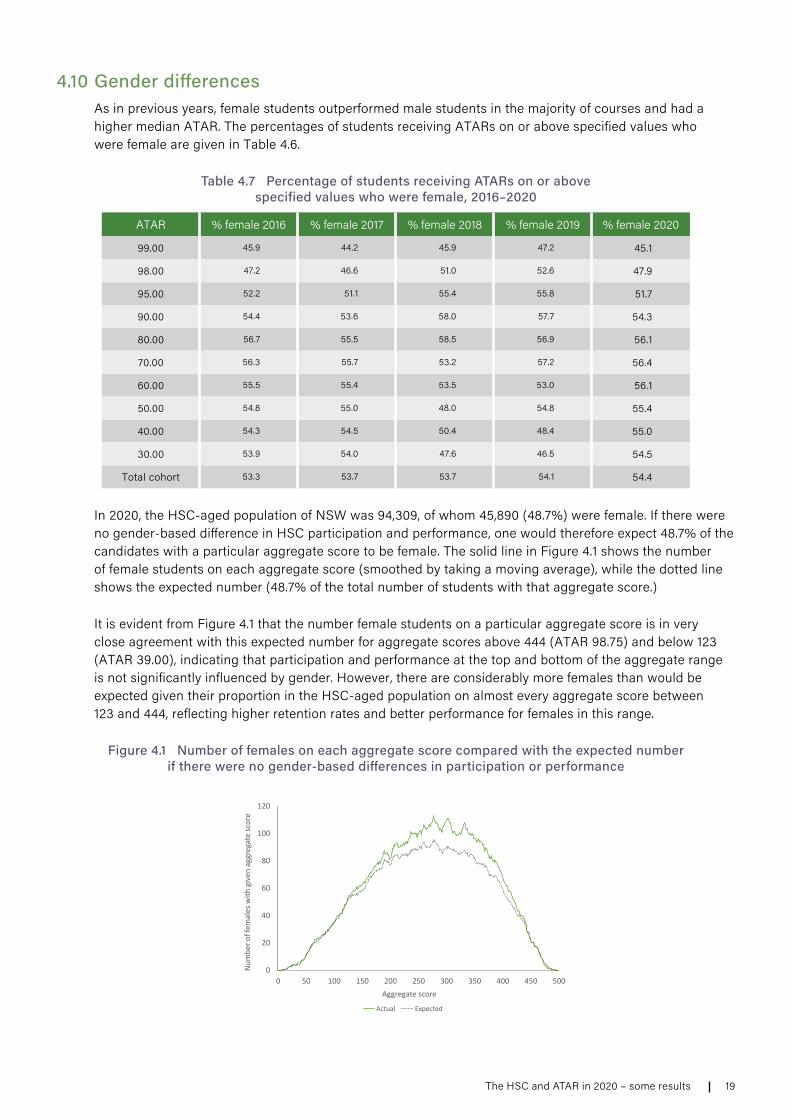
In 2020, the HSC‑aged population of NSW was 94,309, of whom 45,890 (48.7%) were female. If there were no gender‑based difference in HSC participation and performance, one would therefore expect 48.7% of the candidates with a particular aggregate score to be female. The solid line in Figure 4.1 shows the number of female students on each aggregate score (smoothed by taking a moving average), while the dotted line shows the expected number (48.7% of the total number of students with that aggregate score.)
It is evident from Figure 4.1 that the number female students on a particular aggregate score is in very close agreement with this expected number for aggregate scores above 444 (ATAR 98.75) and below 123 (ATAR 39.00), indicating that participation and performance at the top and bottom of the aggregate range is not significantly influenced by gender. However, there are considerably more females than would be expected given their proportion in the HSC‑aged population on almost every aggregate score between 123 and 444, reflecting higher retention rates and better performance for females in this range.
Figure 4.1 Number of females on each aggregate score compared with the expected number if there were no gender-based differences in participation or performance
0
20
40
60
80
100
120
0 50 100 150 200 250 300 350 400 450 500
Num
ber o
f fem
ales
with
giv
en a
ggre
gate
scor
e
Aggregate score
Actual Expected
20
4.11 University offersUAC makes several rounds of offers for semester 1 courses, starting from August and going through to February. The majority of offers to Year 12 students are made in December and January.
Of the 54,894 students who received an ATAR in 2020, 78.8% applied through UAC for a university course. The table below shows that the higher the ATAR, the greater the percentage of students applying for university through UAC.
Table 4.8 Applicants for university places by ATAR – domestic and international
Applicants
ATAR band Total number of students Number Percentage1
90.00 – 99.95 9,343 9,132 97.7
80.00 – 89.95 9,276 8,774 94.6
70.00 – 79.95 8,992 8,023 89.2
60.00 – 69.95 8,411 6,761 80.4
50.00 – 59.95 7,475 5,183 69.3
Below 50.00 11,397 5,380 47.2
Total 54,894 43,253 78.8
1 These are percentages of the total number of students in the given ATAR band.
Of those domestic students applying through UAC for undergraduate courses in semester 1, 92.5% were made at least one offer of a place. Of these applicants receiving at least one offer, 64.2% had an ATAR of 70 and above, and 91.0% had an ATAR of 50 and above.
It is important to note that not all applicants are made an offer solely on the basis of their ATAR. For some courses, alternative criteria are used and ATARs are not considered at all, and for other courses ATARs are supplemented by additional criteria.

21Trends and other issues
5 Trends and other issues
5.1 Variation in patterns of HSC marks – Tables A4, A5 As noted in Chapter 3, the scaling process uses the raw marks, not the HSC marks that NESA uses to report student achievement. Further, the raw marks for each course undergo an initial standardisation to a common mean and standard deviation before the scaling algorithm is implemented. The HSC marks that NESA uses to report student achievement are not used in the scaling process so any variation in the distribution of these marks across courses does not impact on the ATAR calculation.
A common question is whether changes in the pattern of HSC marks from one year to the next affects the pattern of scaled marks and hence the pattern of ATARs. For the reason given above, the answer is no. It is to be expected that the patterns of HSC marks may change from year to year, reflecting differences in student achievement against the published standards in individual courses. In contrast, one would expect to see differences in the patterns of scaled marks only if the overall academic quality of a course candidature changed.
Tables A4 and A5 in the Appendix show the distributions of HSC and scaled marks, respectively, in 2020 and 2019. The marks are on a per‑unit basis (0–50) and courses with less than 40 students in either year are not included. Table A4 shows the percentages of each course candidature with an HSC mark less than 45, 40, 35, 30 and 25 for 2020 and 2019. Table A5 provides similar information for scaled marks. The data show that while the distributions of HSC marks have changed for some courses, the distributions of scaled marks were generally the same.
Legal Studies is an example of a course where the candidature was comparable between 2019 and 2020 but there is a change in the distributions of HSC marks (Table 5.1). The distributions of scaled marks in the two years were, however, similar.
Table 5.1 Distributions of HSC and scaled marks for Legal Studies, 2019 and 2020, on a 1-unit basis
Percentage of students with mark less than:
Mark Year Number 45 40 35 30 25
HSC mark 2020 10,651 84.8 60.1 31.8 10.8 2.5
2019 10,516 86.4 58.4 34.3 15.7 5.7
Scaled mark 2020 10,651 98.4 90.7 78.6 65.4 50.2
2019 10,516 98.7 91.4 78.2 62.6 47.7
Taken together, the data indicate that the 2020 candidature in Legal Studies performed less well than the corresponding cohort in 2019 in terms of the performance standards for Legal Studies. However, their overall performance as judged by their scaled marks is almost the same.
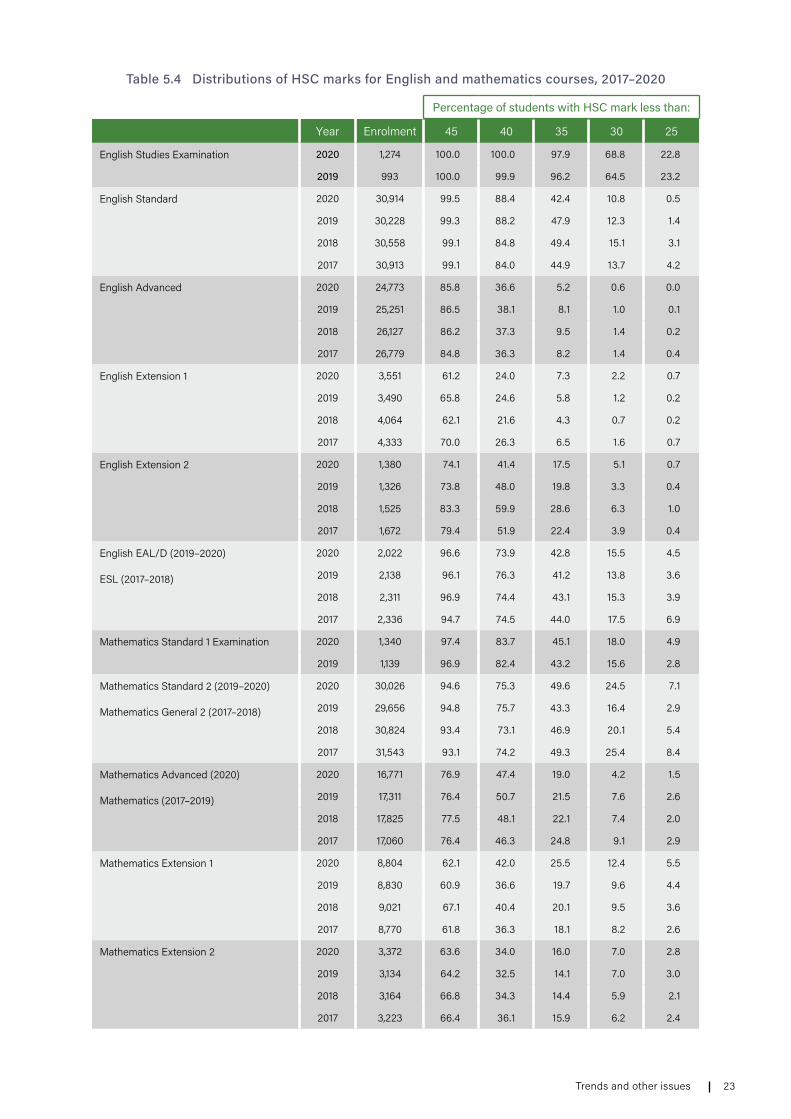
5.2 Distributions of English and mathematics marks: 2017–2020Because all students study English, and most study Mathematics, comparative data are shown for English and Mathematics courses for the four years, 2017 to 2020. Table 5.4 shows the distributions of HSC marks and Table 5.5 shows the distributions of scaled marks.
Compared to 2019, there were small increases in the number of students completing English Extension 1 and English Extension 2 in 2020. English Studies Examination was offered as a Category B for the first time in 2019 and could be used to meet ATAR eligibility requirements, and 1,274 students completed this course in 2020, up from 993 in 2019. English Advanced had fewer students in 2020 than in 2019, whereas English Standard had more.
22
In 2020, 13.5% of ATAR eligible students did not complete a mathematics course and 20.5% of those awarded an HSC did not include a Board developed mathematics course in their Year 12 HSC subjects.
When considering the English marks, recall English Studies Examination, English Standard and English Advanced are scaled as a single group. In 2020, English Studies Examination, English Standard and English Advanced all shared common questions worth 26 marks. In addition, English Studies Examination shared an additional question worth 4 marks with English Standard, and English Advanced shared three additional questions worth 30 marks with English Standard. These shared elements provide sufficient information for NESA to calibrate the marks on the remaining 57% of the English Studies Examination paper, 44% of the English Advanced Examination papers and 40% of the English Standard Examination papers so that they are all on the same calibrated raw mark scale. NESA then moderates school assessments for English Studies Examination, English Standard and English Advanced using these calibrated raw marks, and the usual NESA Standard Setting process is applied to transform these calibrated marks into HSC marks aligned to the common standard shared by all three courses, and these aligned marks are reported to students.
It is the calibrated raw marks for English Standard Examination, English Standard and English Advanced which are used for scaling. These marks are all combined and scaled as a single course. Thus, a given calibrated raw HSC mark yields the same scaled mark for English Studies Examination, English Standard and English Advanced students.
By contrast, the courses Mathematics Standard 1, Mathematics Standard 2 and Mathematics Advanced are distinct 2‑unit courses. In 2020, all three papers shared 3 items in common worth a total of 4 marks. In addition, the Mathematics Standard 2 paper shared an additional 8 items worth 15 marks with the Mathematics Standard 1 paper and an additional 8 items worth 19 marks with the Mathematics Advanced paper. However NESA does not use this information to calibrate the marks on the remaining 76% of the Mathematics Standard 1 paper, the remaining 62% of the Mathematics Standard 2 paper or the remaining 77% of the Mathematics Advanced paper. Consequently, the total raw examination marks used in scaling obtained by Mathematics Standard 1 students are on a different scale to those obtained by Mathematics Standard 2 papers, and these two scales in turn are different to the raw mark scale for Mathematics Advanced.
For these reasons, Mathematics Standard 1, Mathematics Standard 2 and Mathematics Advanced are scaled as separate courses. As mentioned in 3.2.3, NESA has provided information derived from these common items which could form the basis of a process to align the raw marks in these three courses. While studies are being undertaken to determine whether such a process should be adopted at some point in the future, no change is currently anticipated.
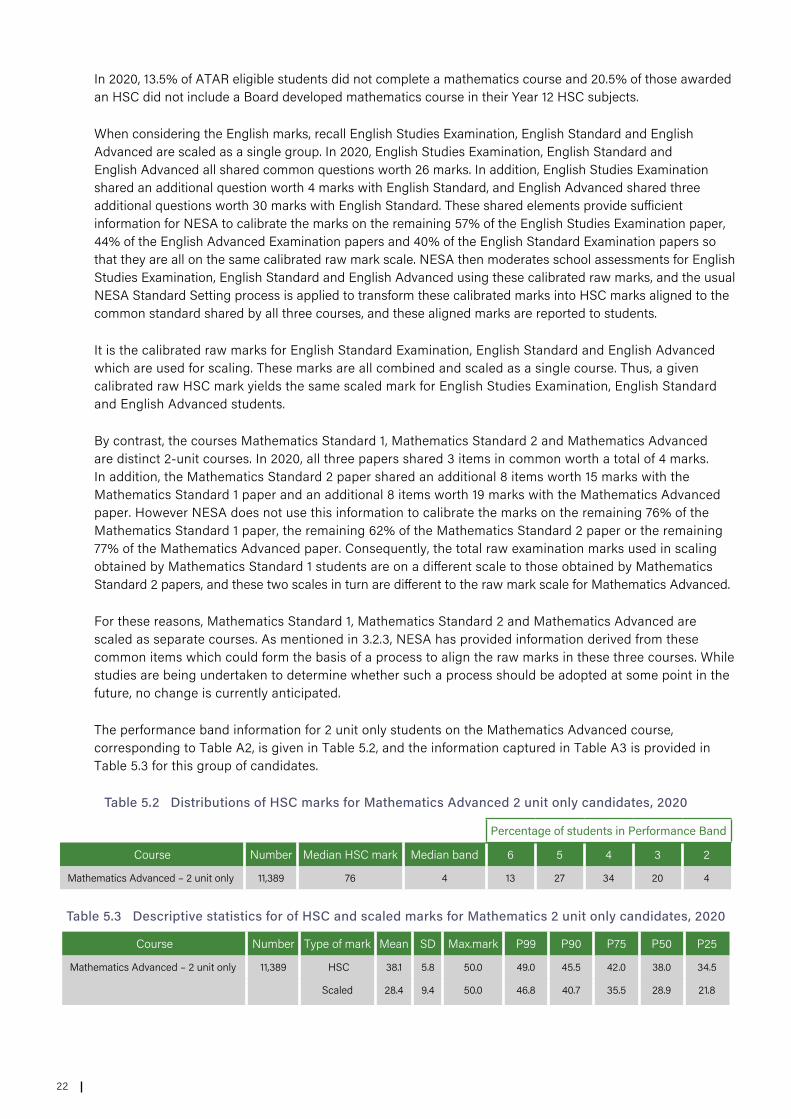
The performance band information for 2 unit only students on the Mathematics Advanced course, corresponding to Table A2, is given in Table 5.2, and the information captured in Table A3 is provided in Table 5.3 for this group of candidates.
Table 5.2 Distributions of HSC marks for Mathematics Advanced 2 unit only candidates, 2020
Percentage of students in Performance Band
Course Number Median HSC mark Median band 6 5 4 3 2
Mathematics Advanced – 2 unit only 11,389 76 4 13 27 34 20 4
Table 5.3 Descriptive statistics for of HSC and scaled marks for Mathematics 2 unit only candidates, 2020
Course Number Type of mark Mean SD Max.mark P99 P90 P75 P50 P25
Mathematics Advanced – 2 unit only 11,389 HSC 38.1 5.8 50.0 49.0 45.5 42.0 38.0 34.5
Scaled 28.4 9.4 50.0 46.8 40.7 35.5 28.9 21.8
23Trends and other issues
Table 5.4 Distributions of HSC marks for English and mathematics courses, 2017–2020
Percentage of students with HSC mark less than:
Year Enrolment 45 40 35 30 25
English Studies Examination 2020 1,274 100.0 100.0 97.9 68.8 22.8
2019 993 100.0 99.9 96.2 64.5 23.2
English Standard 2020 30,914 99.5 88.4 42.4 10.8 0.5
2019 30,228 99.3 88.2 47.9 12.3 1.4
2018 30,558 99.1 84.8 49.4 15.1 3.1
2017 30,913 99.1 84.0 44.9 13.7 4.2
English Advanced 2020 24,773 85.8 36.6 5.2 0.6 0.0
2019 25,251 86.5 38.1 8.1 1.0 0.1
2018 26,127 86.2 37.3 9.5 1.4 0.2
2017 26,779 84.8 36.3 8.2 1.4 0.4
English Extension 1 2020 3,551 61.2 24.0 7.3 2.2 0.7
2019 3,490 65.8 24.6 5.8 1.2 0.2
2018 4,064 62.1 21.6 4.3 0.7 0.2
2017 4,333 70.0 26.3 6.5 1.6 0.7
English Extension 2 2020 1,380 74.1 41.4 17.5 5.1 0.7
2019 1,326 73.8 48.0 19.8 3.3 0.4
2018 1,525 83.3 59.9 28.6 6.3 1.0
2017 1,672 79.4 51.9 22.4 3.9 0.4
English EAL/D (2019–2020)
ESL (2017–2018)
2020 2,022 96.6 73.9 42.8 15.5 4.5
2019 2,138 96.1 76.3 41.2 13.8 3.6
2018 2,311 96.9 74.4 43.1 15.3 3.9
2017 2,336 94.7 74.5 44.0 17.5 6.9
Mathematics Standard 1 Examination 2020 1,340 97.4 83.7 45.1 18.0 4.9
2019 1,139 96.9 82.4 43.2 15.6 2.8
Mathematics Standard 2 (2019–2020)
Mathematics General 2 (2017–2018)
2020 30,026 94.6 75.3 49.6 24.5 7.1
2019 29,656 94.8 75.7 43.3 16.4 2.9
2018 30,824 93.4 73.1 46.9 20.1 5.4
2017 31,543 93.1 74.2 49.3 25.4 8.4
Mathematics Advanced (2020)
Mathematics (2017–2019)
2020 16,771 76.9 47.4 19.0 4.2 1.5
2019 17,311 76.4 50.7 21.5 7.6 2.6
2018 17,825 77.5 48.1 22.1 7.4 2.0
2017 17,060 76.4 46.3 24.8 9.1 2.9
Mathematics Extension 1 2020 8,804 62.1 42.0 25.5 12.4 5.5
2019 8,830 60.9 36.6 19.7 9.6 4.4
2018 9,021 67.1 40.4 20.1 9.5 3.6
2017 8,770 61.8 36.3 18.1 8.2 2.6
Mathematics Extension 2 2020 3,372 63.6 34.0 16.0 7.0 2.8
2019 3,134 64.2 32.5 14.1 7.0 3.0
2018 3,164 66.8 34.3 14.4 5.9 2.1
2017 3,223 66.4 36.1 15.9 6.2 2.4

24
Table 5.5 Distributions of scaled marks for English and Mathematics courses, 2017–2020
Percentage of students with scaled mark less than:
Year Enrolment 45 40 35 30 25 20
English Studies Examination 2020 1,274 100.0 100.0 100.0 100.0 99.8 98.7
2019 993 100.0 100.0 100.0 99.9 99.1 96.2
English Standard 2020 30,914 99.9 99.3 96.3 87.6 71.9 49.8
2019 30,228 99.9 99.1 95.7 87.5 71.8 50.6
2018 30,558 99.9 98.9 95.1 85.9 70.0 50.4
2017 30,913 99.9 99.0 94.8 86.0 71.1 50.8
English Advanced 2020 24,773 97.4 82.1 58.7 34.9 17.4 7.2
2019 25,251 97.5 83.6 60.1 37.1 19.4 9.0
2018 26,127 98.0 84.2 61.2 38.6 21.3 9.8
2017 26,779 97.4 83.3 61.6 39.7 22.1 10.5
English Extension 1 2020 3,551 94.3 68.0 35.9 14.6 5.4 2.1
2019 3,490 93.6 68.5 37.5 15.2 5.2 1.5
2018 4,064 95.2 71.8 39.6 18.5 6.0 2.0
2017 4,333 95.5 71.4 38.6 17.1 5.7 2.1
English Extension 2 2020 1,380 91.4 68.3 37.2 16.3 5.5 1.2
2019 1,326 89.7 66.7 42.4 18.3 5.5 1.3
2018 1,525 91.2 72.4 48.0 23.7 7.5 2.2
2017 1,672 90.7 71.0 45.5 24.0 7.1 1.3
English EAL/D (2019–2020)
ESL (2017–2018)
2020 2,022 98.7 94.9 86.1 74.9 64.5 49.9
2019 2,138 98.6 94.0 85.9 74.2 59.3 44.6
2018 2,311 99.0 93.8 84.0 71.6 56.0 42.3
2017 2,336 98.4 92.8 84.5 72.5 58.9 44.2
Mathematics Standard 1 Examination 2020 1,340 100.0 100.0 100.0 96.1 88.6 76.0
2019 1,139 100.0 100.0 100.0 96.0 89.6 80.2
Mathematics Standard 2 (2019–2020)
Mathematics General 2 (2017–2018)
2020 30,026 100.0 97.5 88.5 74.5 58.6 42.5
2019 29,656 100.0 97.2 88.1 75.4 60.8 45.1
2018 30,824 99.8 95.5 86.6 75.0 61.8 47.2
2017 31,543 99.9 96.4 87.4 74.8 60.9 45.8
Mathematics Advanced (2020)
Mathematics (2017–2019)
2020 16,771 94.6 78.5 59.4 42.0 26.4 14.2
2019 17,311 95.9 81.3 61.3 40.7 24.3 13.5
2018 17,825 96.4 81.5 60.5 40.5 24.0 13.2
2017 17,060 94.0 78.7 60.0 41.1 25.3 14.6
Mathematics Extension 1 2020 8,804 74.9 43.3 21.9 11.4 5.6 2.3
2019 8,830 82.0 45.5 21.7 10.2 4.8 1.9
2018 9,021 78.8 45.6 21.4 9.9 3.9 1.5
2017 8,770 77.5 48.6 24.0 10.1 3.4 1.0
Mathematics Extension 2 2020 3,372 48.1 15.5 5.8 2.5 1.1 0.7
2019 3,134 64.5 18.6 6.3 2.4 0.8 0.1
2018 3,164 52.5 13.7 4.6 1.5 0.7 0.3
2017 3,223 60.1 17.4 5.2 2.0 1.0 0.4

25Trends and other issues
5.3 Courses that contribute to the ATAR – Table A6 If students complete only 10 units all courses must be counted in the calculation of the ATAR, whereas if students complete more than 10 units at least 1 unit will be omitted. In 2020 34,492 students out of the 54,894 ATAR eligible students (62.8%) presented exactly 10 units.
Table A6 in the Appendix provides some information about students who completed more than 10 units. Data are not provided for courses with less than 10 students.
For each course: − The first column shows the total number of students who did the course in any year and received an
ATAR in 2020. − The second column shows the number of these students who completed more than 10 units. − The third column expresses this number as a percentage. − The fourth column gives the percentage of these students who counted all units of that course towards
their ATAR. The percentage is based on the number of students in the course who had completed more than 10 units.
− The final column shows the maximum ATAR of any student doing the course in any year and including all units of that course in the ATAR calculation.
Of the 111 courses listed in Table A6, 77 have 70% or more of their students counting the course. The data also show that, while there are differences in the percentages of students who count a particular course towards their ATARs, there is no evidence of systematic differences across Key Learning Areas.
26
6 Frequently asked questions
in recent years most of the enquiries from students received by the ATAR Enquiry Centre at UAC concerned the relationship between their HSC marks and their ATARs, and the reason why one course contributed to their ATAR and not another. These two major enquiries will be discussed below, followed by a summary of some of the other frequently asked questions.
6.1 Why is my ATAR low in comparison to my HSC marks?The ATAR is a rank, not a mark, and so there is no reason why the scores should be close. From Table A2 we can see that the median HSC mark for most 2‑unit courses is between 70 and 80. The median ATAR is 70.15 which is lower than the median score for almost all courses. So for students in the middle of the candidature, the ATAR will typically be lower than their average HSC mark.
There is, however, no simple rule to convert HSC marks to ATARs. Courses are unlikely to have the same scaled means from year to year and the pattern of HSC marks varies across courses so that the same HSC mark does not necessarily indicate the same position across courses. The following examples illustrate the complexity of the relationship between HSC marks and ATARs.
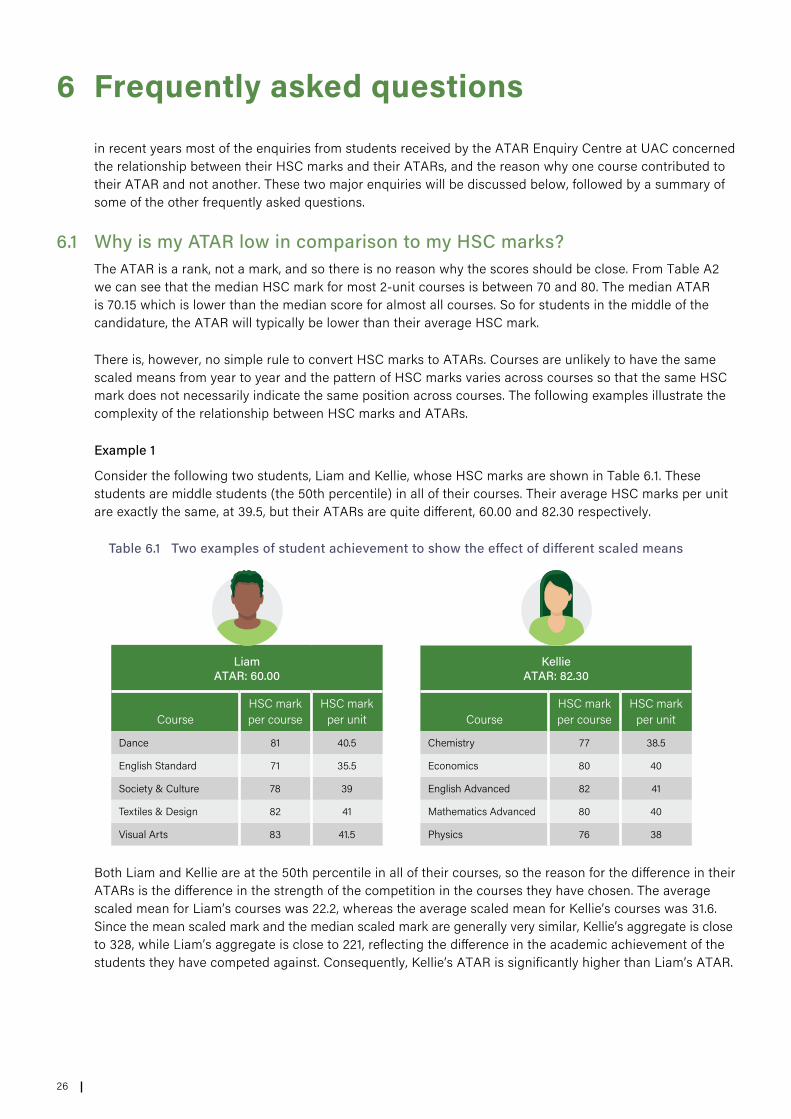
Example 1
Consider the following two students, Liam and Kellie, whose HSC marks are shown in Table 6.1. These students are middle students (the 50th percentile) in all of their courses. Their average HSC marks per unit are exactly the same, at 39.5, but their ATARs are quite different, 60.00 and 82.30 respectively.
Table 6.1 Two examples of student achievement to show the effect of different scaled means
LiamATAR: 60.00
KellieATAR: 82.30
CourseHSC mark per course
HSC mark per unit Course
HSC mark per course
HSC mark per unit
Dance 81 40.5 Chemistry 77 38.5
English Standard 71 35.5 Economics 80 40
Society & Culture 78 39 English Advanced 82 41
Textiles & Design 82 41 Mathematics Advanced 80 40
Visual Arts 83 41.5 Physics 76 38
Both Liam and Kellie are at the 50th percentile in all of their courses, so the reason for the difference in their ATARs is the difference in the strength of the competition in the courses they have chosen. The average scaled mean for Liam’s courses was 22.2, whereas the average scaled mean for Kellie’s courses was 31.6. Since the mean scaled mark and the median scaled mark are generally very similar, Kellie’s aggregate is close to 328, while Liam’s aggregate is close to 221, reflecting the difference in the academic achievement of the students they have competed against. Consequently, Kellie’s ATAR is significantly higher than Liam’s ATAR.
27Frequently asked questions
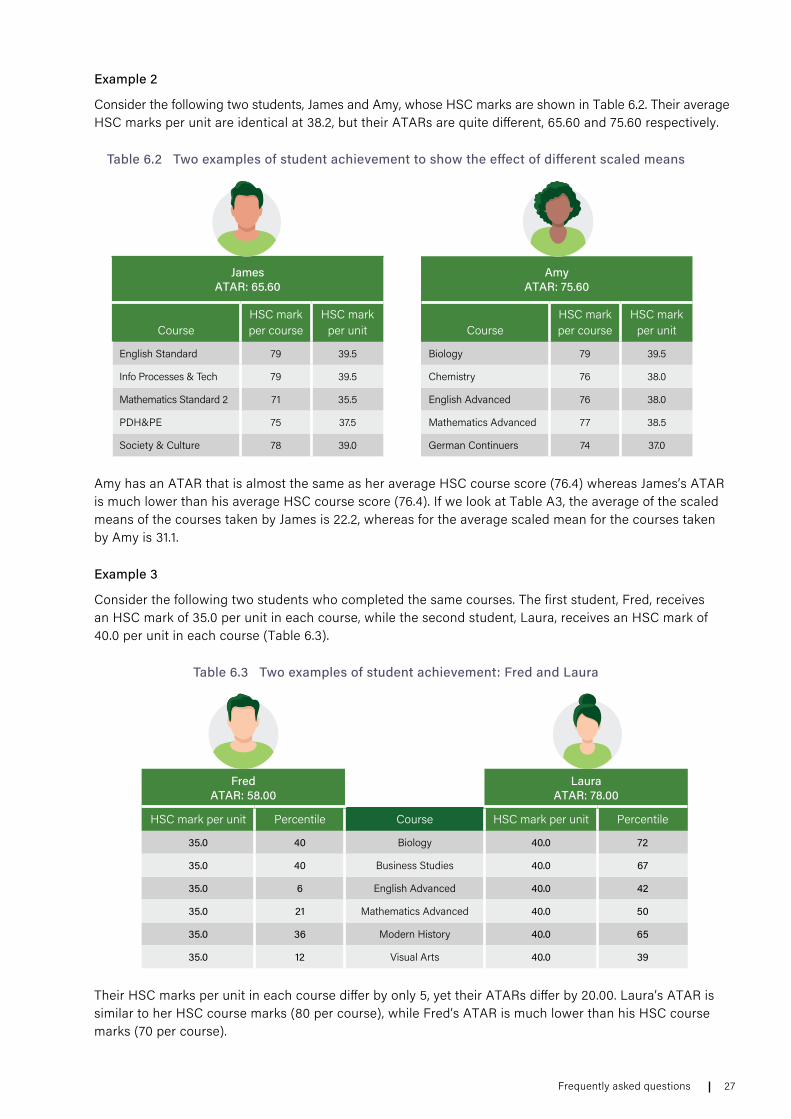
Example 2
Consider the following two students, James and Amy, whose HSC marks are shown in Table 6.2. Their average HSC marks per unit are identical at 38.2, but their ATARs are quite different, 65.60 and 75.60 respectively.
Table 6.2 Two examples of student achievement to show the effect of different scaled means
JamesATAR: 65.60
AmyATAR: 75.60
CourseHSC mark per course
HSC mark per unit Course
HSC mark per course
HSC mark per unit
English Standard 79 39.5 Biology 79 39.5
Info Processes & Tech 79 39.5 Chemistry 76 38.0
Mathematics Standard 2 71 35.5 English Advanced 76 38.0
PDH&PE 75 37.5 Mathematics Advanced 77 38.5
Society & Culture 78 39.0 German Continuers 74 37.0
Amy has an ATAR that is almost the same as her average HSC course score (76.4) whereas James’s ATAR is much lower than his average HSC course score (76.4). If we look at Table A3, the average of the scaled means of the courses taken by James is 22.2, whereas for the average scaled mean for the courses taken by Amy is 31.1.
Example 3
Consider the following two students who completed the same courses. The first student, Fred, receives an HSC mark of 35.0 per unit in each course, while the second student, Laura, receives an HSC mark of 40.0 per unit in each course (Table 6.3).
Table 6.3 Two examples of student achievement: Fred and Laura
FredATAR: 58.00
LauraATAR: 78.00
HSC mark per unit Percentile Course HSC mark per unit Percentile
35.0 40 Biology 40.0 72
35.0 40 Business Studies 40.0 67
35.0 6 English Advanced 40.0 42
35.0 21 Mathematics Advanced 40.0 50
35.0 36 Modern History 40.0 65
35.0 12 Visual Arts 40.0 39
Their HSC marks per unit in each course differ by only 5, yet their ATARs differ by 20.00. Laura’s ATAR is similar to her HSC course marks (80 per course), while Fred’s ATAR is much lower than his HSC course marks (70 per course).
28
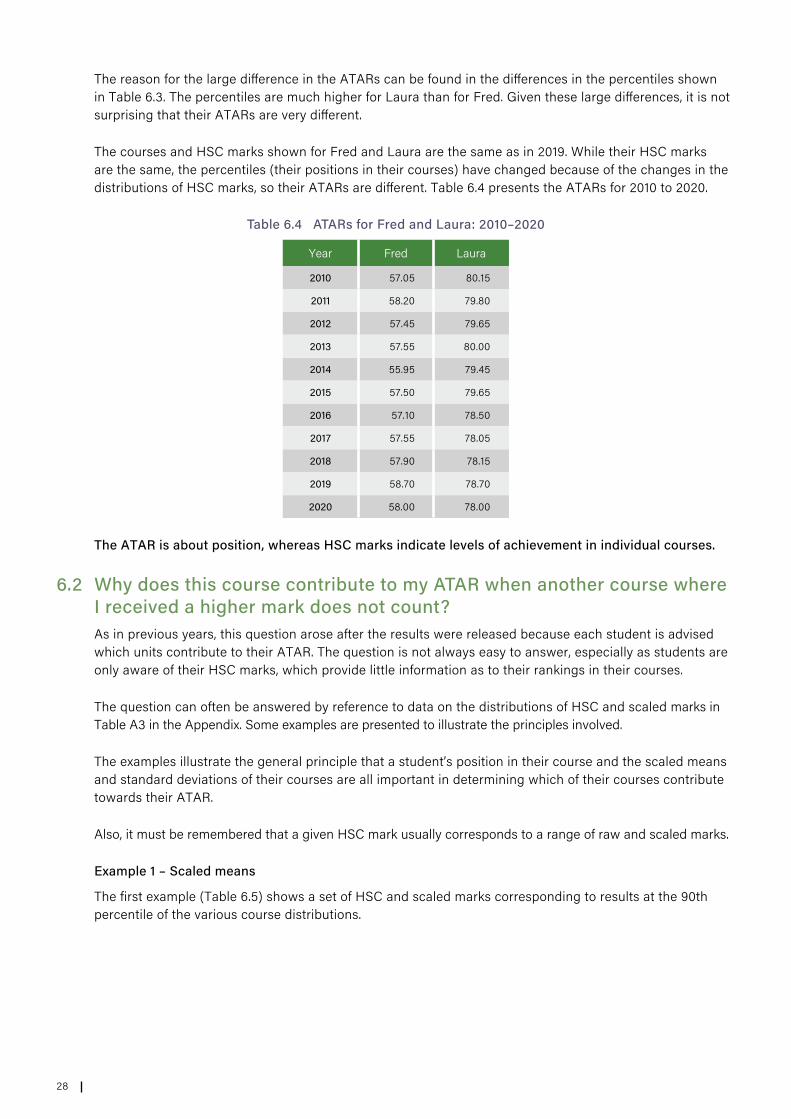
The reason for the large difference in the ATARs can be found in the differences in the percentiles shown in Table 6.3. The percentiles are much higher for Laura than for Fred. Given these large differences, it is not surprising that their ATARs are very different.
The courses and HSC marks shown for Fred and Laura are the same as in 2019. While their HSC marks are the same, the percentiles (their positions in their courses) have changed because of the changes in the distributions of HSC marks, so their ATARs are different. Table 6.4 presents the ATARs for 2010 to 2020.
Table 6.4 ATARs for Fred and Laura: 2010–2020
Year Fred Laura
2010 57.05 80.15
2011 58.20 79.80
2012 57.45 79.65
2013 57.55 80.00
2014 55.95 79.45
2015 57.50 79.65
2016 57.10 78.50
2017 57.55 78.05
2018 57.90 78.15
2019 58.70 78.70
2020 58.00 78.00
The ATAR is about position, whereas HSC marks indicate levels of achievement in individual courses.
6.2 Why does this course contribute to my ATAR when another course where I received a higher mark does not count?As in previous years, this question arose after the results were released because each student is advised which units contribute to their ATAR. The question is not always easy to answer, especially as students are only aware of their HSC marks, which provide little information as to their rankings in their courses.
The question can often be answered by reference to data on the distributions of HSC and scaled marks in Table A3 in the Appendix. Some examples are presented to illustrate the principles involved.
The examples illustrate the general principle that a student’s position in their course and the scaled means and standard deviations of their courses are all important in determining which of their courses contribute towards their ATAR.
Also, it must be remembered that a given HSC mark usually corresponds to a range of raw and scaled marks.
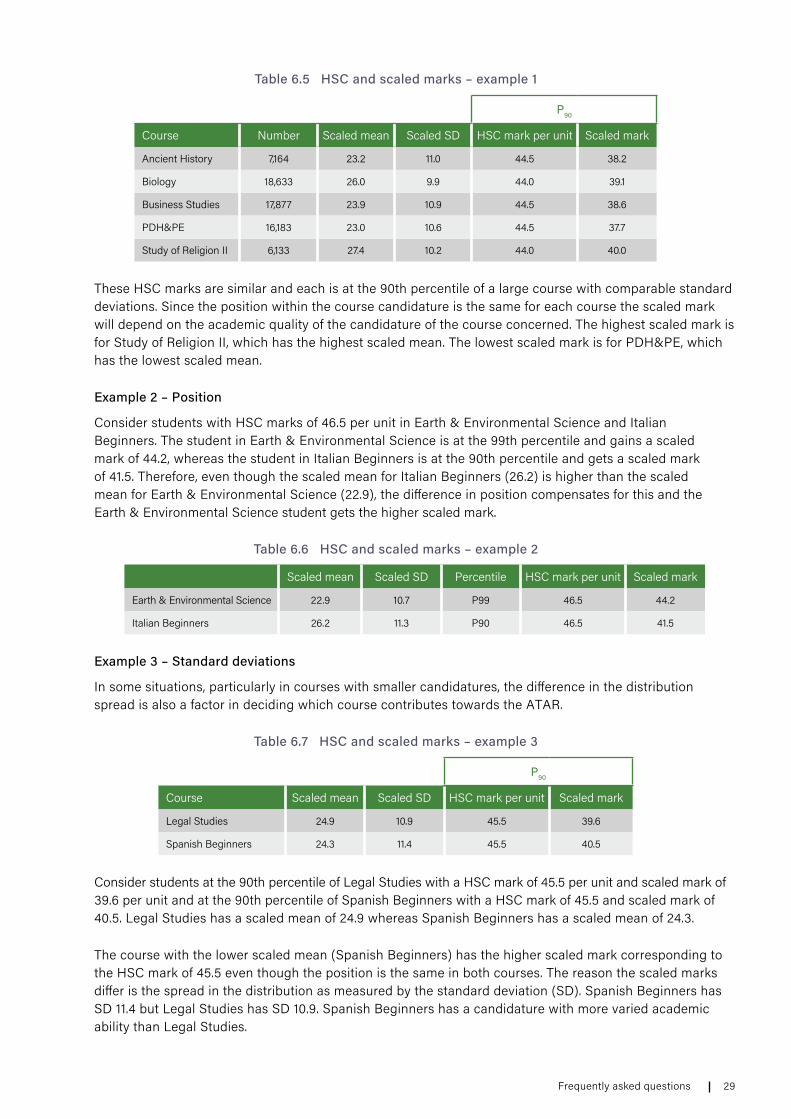
Example 1 – Scaled means
The first example (Table 6.5) shows a set of HSC and scaled marks corresponding to results at the 90th percentile of the various course distributions.
29Frequently asked questions
Table 6.5 HSC and scaled marks – example 1
P90
Course Number Scaled mean Scaled SD HSC mark per unit Scaled mark
Ancient History 7,164 23.2 11.0 44.5 38.2
Biology 18,633 26.0 9.9 44.0 39.1
Business Studies 17,877 23.9 10.9 44.5 38.6
PDH&PE 16,183 23.0 10.6 44.5 37.7
Study of Religion II 6,133 27.4 10.2 44.0 40.0
These HSC marks are similar and each is at the 90th percentile of a large course with comparable standard deviations. Since the position within the course candidature is the same for each course the scaled mark will depend on the academic quality of the candidature of the course concerned. The highest scaled mark is for Study of Religion II, which has the highest scaled mean. The lowest scaled mark is for PDH&PE, which has the lowest scaled mean.
Example 2 – Position
Consider students with HSC marks of 46.5 per unit in Earth & Environmental Science and Italian Beginners. The student in Earth & Environmental Science is at the 99th percentile and gains a scaled mark of 44.2, whereas the student in Italian Beginners is at the 90th percentile and gets a scaled mark of 41.5. Therefore, even though the scaled mean for Italian Beginners (26.2) is higher than the scaled mean for Earth & Environmental Science (22.9), the difference in position compensates for this and the Earth & Environmental Science student gets the higher scaled mark.
Table 6.6 HSC and scaled marks – example 2
Scaled mean Scaled SD Percentile HSC mark per unit Scaled mark
Earth & Environmental Science 22.9 10.7 P99 46.5 44.2
Italian Beginners 26.2 11.3 P90 46.5 41.5
Example 3 – Standard deviations
In some situations, particularly in courses with smaller candidatures, the difference in the distribution spread is also a factor in deciding which course contributes towards the ATAR.
Table 6.7 HSC and scaled marks – example 3
P90
Course Scaled mean Scaled SD HSC mark per unit Scaled mark
Legal Studies 24.9 10.9 45.5 39.6
Spanish Beginners 24.3 11.4 45.5 40.5
Consider students at the 90th percentile of Legal Studies with a HSC mark of 45.5 per unit and scaled mark of 39.6 per unit and at the 90th percentile of Spanish Beginners with a HSC mark of 45.5 and scaled mark of 40.5. Legal Studies has a scaled mean of 24.9 whereas Spanish Beginners has a scaled mean of 24.3.
The course with the lower scaled mean (Spanish Beginners) has the higher scaled mark corresponding to the HSC mark of 45.5 even though the position is the same in both courses. The reason the scaled marks differ is the spread in the distribution as measured by the standard deviation (SD). Spanish Beginners has SD 11.4 but Legal Studies has SD 10.9. Spanish Beginners has a candidature with more varied academic ability than Legal Studies.

30
31Frequently asked questions
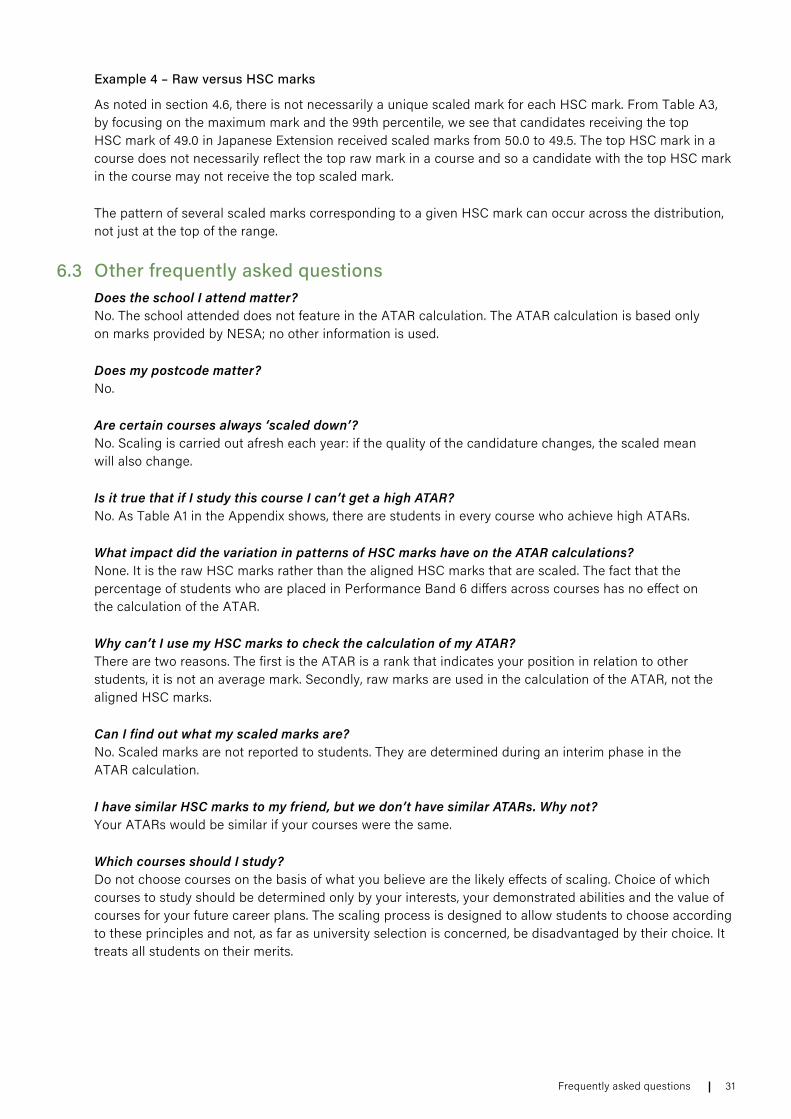
Example 4 – Raw versus HSC marks
As noted in section 4.6, there is not necessarily a unique scaled mark for each HSC mark. From Table A3, by focusing on the maximum mark and the 99th percentile, we see that candidates receiving the top HSC mark of 49.0 in Japanese Extension received scaled marks from 50.0 to 49.5. The top HSC mark in a course does not necessarily reflect the top raw mark in a course and so a candidate with the top HSC mark in the course may not receive the top scaled mark.
The pattern of several scaled marks corresponding to a given HSC mark can occur across the distribution, not just at the top of the range.
6.3 Other frequently asked questionsDoes the school I attend matter?No. The school attended does not feature in the ATAR calculation. The ATAR calculation is based only on marks provided by NESA; no other information is used.
Does my postcode matter?No.
Are certain courses always ‘scaled down’?No. Scaling is carried out afresh each year: if the quality of the candidature changes, the scaled mean will also change.
Is it true that if I study this course I can’t get a high ATAR?No. As Table A1 in the Appendix shows, there are students in every course who achieve high ATARs.
What impact did the variation in patterns of HSC marks have on the ATAR calculations? None. It is the raw HSC marks rather than the aligned HSC marks that are scaled. The fact that the percentage of students who are placed in Performance Band 6 differs across courses has no effect on the calculation of the ATAR.
Why can’t I use my HSC marks to check the calculation of my ATAR?There are two reasons. The first is the ATAR is a rank that indicates your position in relation to other students, it is not an average mark. Secondly, raw marks are used in the calculation of the ATAR, not the aligned HSC marks.
Can I find out what my scaled marks are?No. Scaled marks are not reported to students. They are determined during an interim phase in the ATAR calculation.
I have similar HSC marks to my friend, but we don’t have similar ATARs. Why not?Your ATARs would be similar if your courses were the same.
Which courses should I study? Do not choose courses on the basis of what you believe are the likely effects of scaling. Choice of which courses to study should be determined only by your interests, your demonstrated abilities and the value of courses for your future career plans. The scaling process is designed to allow students to choose according to these principles and not, as far as university selection is concerned, be disadvantaged by their choice. It treats all students on their merits.

32
Do I get a better ATAR if I study more units?This is a common question. While the data show that students who study more units tend to gain higher ATARs, determining causality is difficult. The relationship between the number of units studied and ATAR might result from personal attributes including interest, motivation, effort and time management. You cannot assume that simply by studying more units your ATAR will be increased.
What happens if I repeat a course?If a course is repeated only the last satisfactory attempt is used towards the calculation of the ATAR. Your aggregate will be re‑calculated using your new mark. Your aggregate may increase, remain the same or decrease; it depends on your new mark. Since you are being compared with a different cohort your ATAR may increase, remain the same or decrease, even if your aggregate remains the same.
What happens if I accumulate the HSC?Students who accumulate courses towards their HSC have their scaled marks calculated the year they complete the courses.
What happens if I already have an ATAR and add a new ATAR course the following year?Your aggregate will be re‑calculated using your new course and your previous courses. Provided all your previous courses were taken within the last 5 years, your aggregate may increase or stay the same but it will not go down. However, since you are being compared with a different cohort your ATAR may increase, remain the same or decrease.
Any courses taken more than 5 years ago will be ineligible for inclusion in your new aggregate.
If I’m eligible to get selection rank adjustments, does my ATAR change?No. Selection rank adjustments do not change your ATAR. They change your selection rank for a particular preference or course.
If selection rank adjustments don’t increase my ATAR, then how do they work? Universities allocate selection rank adjustments for different reasons. Examples include students with a strong performance in specific HSC courses, students who live in or attend school in an area defined by the university and students who have applied for consideration through Educational Access Schemes.
As the selection rank adjustments schemes for each university, and often each course at the same university, are different then your selection rank can be different for each course you list in your course preferences. For some Year 12 applicants, their selection rank for each preference is their ATAR. However, if a university allocates adjustments to you for a particular course then your selection rank for that preference is your ATAR plus adjustments.
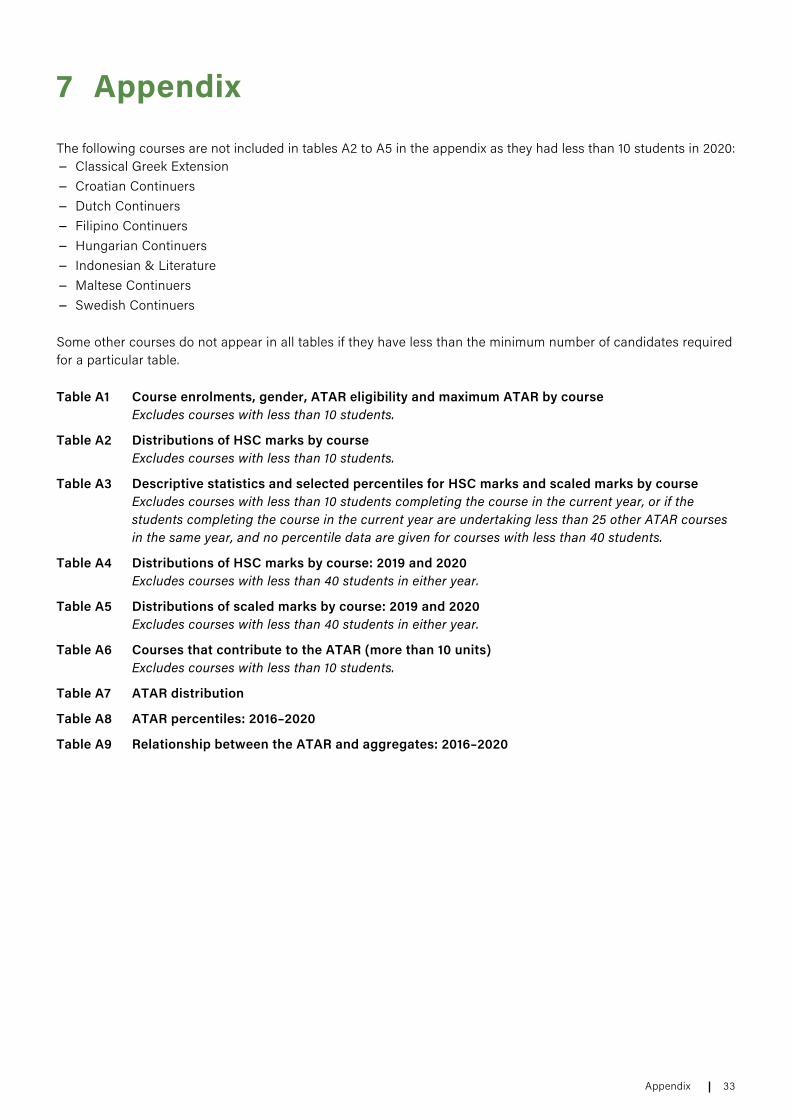
33Appendix
7 Appendix
The following courses are not included in tables A2 to A5 in the appendix as they had less than 10 students in 2020: − Classical Greek Extension − Croatian Continuers − Dutch Continuers − Filipino Continuers − Hungarian Continuers − Indonesian & Literature − Maltese Continuers − Swedish Continuers
Some other courses do not appear in all tables if they have less than the minimum number of candidates required for a particular table.
Table A1 Course enrolments, gender, ATAR eligibility and maximum ATAR by course Excludes courses with less than 10 students.
Table A2 Distributions of HSC marks by course Excludes courses with less than 10 students.
Table A3 Descriptive statistics and selected percentiles for HSC marks and scaled marks by course Excludes courses with less than 10 students completing the course in the current year, or if the students completing the course in the current year are undertaking less than 25 other ATAR courses in the same year, and no percentile data are given for courses with less than 40 students.
Table A4 Distributions of HSC marks by course: 2019 and 2020 Excludes courses with less than 40 students in either year.
Table A5 Distributions of scaled marks by course: 2019 and 2020 Excludes courses with less than 40 students in either year.
Table A6 Courses that contribute to the ATAR (more than 10 units) Excludes courses with less than 10 students.
Table A7 ATAR distribution
Table A8 ATAR percentiles: 2016–2020
Table A9 Relationship between the ATAR and aggregates: 2016–2020
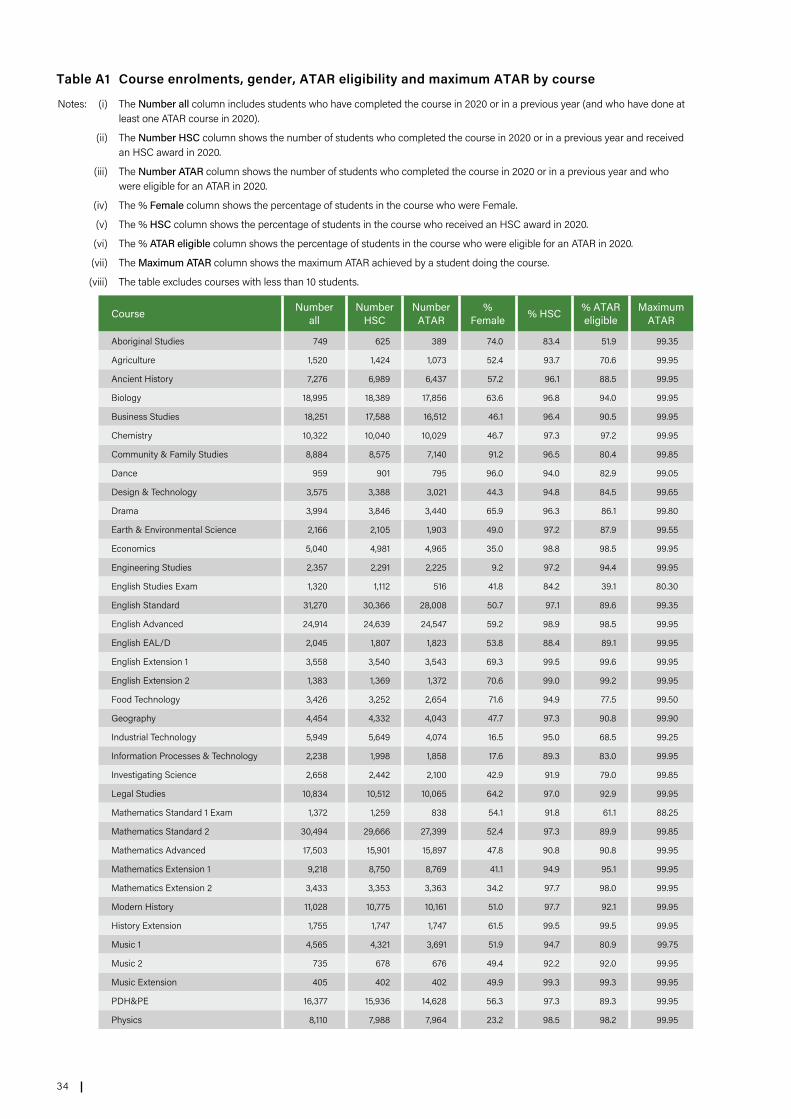
34
Table A1 Course enrolments, gender, ATAR eligibility and maximum ATAR by course
Notes: (i) The Number all column includes students who have completed the course in 2020 or in a previous year (and who have done at least one ATAR course in 2020).
(ii) The Number HSC column shows the number of students who completed the course in 2020 or in a previous year and received an HSC award in 2020.
(iii) The Number ATAR column shows the number of students who completed the course in 2020 or in a previous year and who were eligible for an ATAR in 2020.
(iv) The % Female column shows the percentage of students in the course who were Female.
(v) The % HSC column shows the percentage of students in the course who received an HSC award in 2020.
(vi) The % ATAR eligible column shows the percentage of students in the course who were eligible for an ATAR in 2020.
(vii) The Maximum ATAR column shows the maximum ATAR achieved by a student doing the course.
(viii) The table excludes courses with less than 10 students.
Course Number all
Number HSC
Number ATAR
% Female % HSC % ATAR
eligibleMaximum
ATAR
Aboriginal Studies 749 625 389 74.0 83.4 51.9 99.35
Agriculture 1,520 1,424 1,073 52.4 93.7 70.6 99.95
Ancient History 7,276 6,989 6,437 57.2 96.1 88.5 99.95
Biology 18,995 18,389 17,856 63.6 96.8 94.0 99.95
Business Studies 18,251 17,588 16,512 46.1 96.4 90.5 99.95
Chemistry 10,322 10,040 10,029 46.7 97.3 97.2 99.95
Community & Family Studies 8,884 8,575 7,140 91.2 96.5 80.4 99.85
Dance 959 901 795 96.0 94.0 82.9 99.05
Design & Technology 3,575 3,388 3,021 44.3 94.8 84.5 99.65
Drama 3,994 3,846 3,440 65.9 96.3 86.1 99.80
Earth & Environmental Science 2,166 2,105 1,903 49.0 97.2 87.9 99.55
Economics 5,040 4,981 4,965 35.0 98.8 98.5 99.95
Engineering Studies 2,357 2,291 2,225 9.2 97.2 94.4 99.95
English Studies Exam 1,320 1,112 516 41.8 84.2 39.1 80.30
English Standard 31,270 30,366 28,008 50.7 97.1 89.6 99.35
English Advanced 24,914 24,639 24,547 59.2 98.9 98.5 99.95
English EAL/D 2,045 1,807 1,823 53.8 88.4 89.1 99.95
English Extension 1 3,558 3,540 3,543 69.3 99.5 99.6 99.95
English Extension 2 1,383 1,369 1,372 70.6 99.0 99.2 99.95
Food Technology 3,426 3,252 2,654 71.6 94.9 77.5 99.50
Geography 4,454 4,332 4,043 47.7 97.3 90.8 99.90
Industrial Technology 5,949 5,649 4,074 16.5 95.0 68.5 99.25
Information Processes & Technology 2,238 1,998 1,858 17.6 89.3 83.0 99.95
Investigating Science 2,658 2,442 2,100 42.9 91.9 79.0 99.85
Legal Studies 10,834 10,512 10,065 64.2 97.0 92.9 99.95
Mathematics Standard 1 Exam 1,372 1,259 838 54.1 91.8 61.1 88.25
Mathematics Standard 2 30,494 29,666 27,399 52.4 97.3 89.9 99.85
Mathematics Advanced 17,503 15,901 15,897 47.8 90.8 90.8 99.95
Mathematics Extension 1 9,218 8,750 8,769 41.1 94.9 95.1 99.95
Mathematics Extension 2 3,433 3,353 3,363 34.2 97.7 98.0 99.95
Modern History 11,028 10,775 10,161 51.0 97.7 92.1 99.95
History Extension 1,755 1,747 1,747 61.5 99.5 99.5 99.95
Music 1 4,565 4,321 3,691 51.9 94.7 80.9 99.75
Music 2 735 678 676 49.4 92.2 92.0 99.95
Music Extension 405 402 402 49.9 99.3 99.3 99.95
PDH&PE 16,377 15,936 14,628 56.3 97.3 89.3 99.95
Physics 8,110 7,988 7,964 23.2 98.5 98.2 99.95
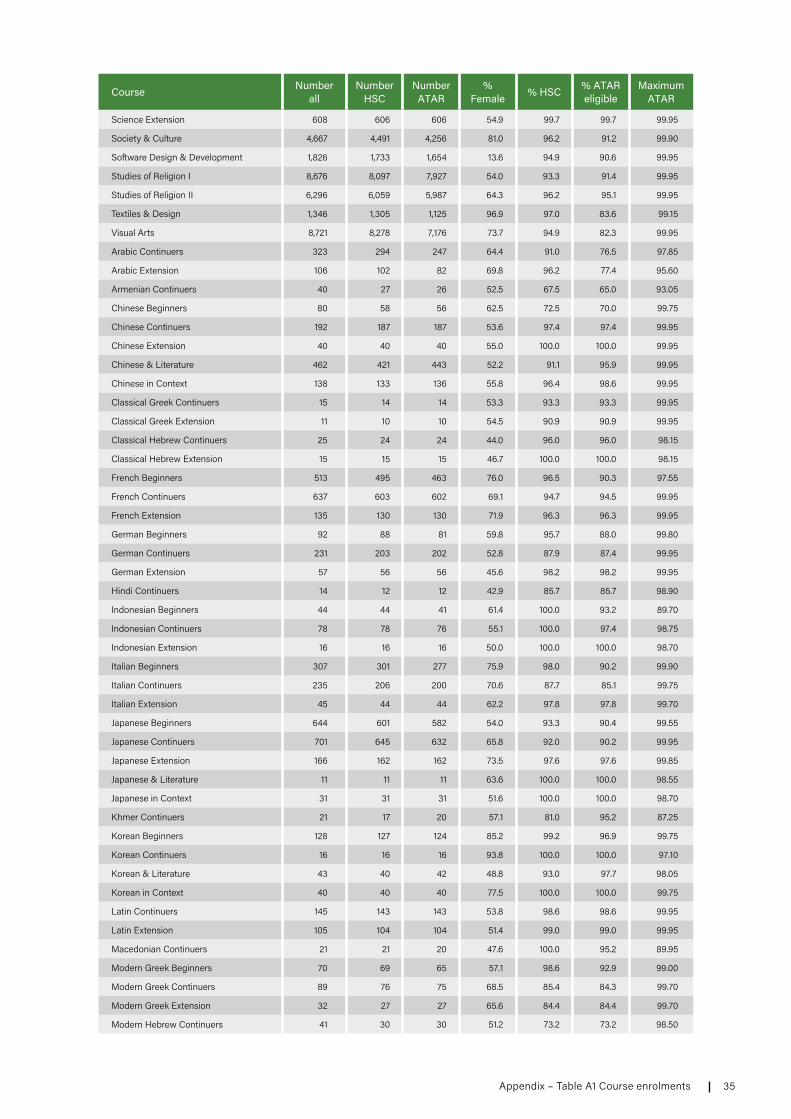
35Appendix – Table A1 Course enrolments
Course Number all
Number HSC
Number ATAR
% Female % HSC % ATAR
eligibleMaximum
ATAR
Science Extension 608 606 606 54.9 99.7 99.7 99.95
Society & Culture 4,667 4,491 4,256 81.0 96.2 91.2 99.90
Software Design & Development 1,826 1,733 1,654 13.6 94.9 90.6 99.95
Studies of Religion I 8,676 8,097 7,927 54.0 93.3 91.4 99.95
Studies of Religion II 6,296 6,059 5,987 64.3 96.2 95.1 99.95
Textiles & Design 1,346 1,305 1,125 96.9 97.0 83.6 99.15
Visual Arts 8,721 8,278 7,176 73.7 94.9 82.3 99.95
Arabic Continuers 323 294 247 64.4 91.0 76.5 97.85
Arabic Extension 106 102 82 69.8 96.2 77.4 95.60
Armenian Continuers 40 27 26 52.5 67.5 65.0 93.05
Chinese Beginners 80 58 56 62.5 72.5 70.0 99.75
Chinese Continuers 192 187 187 53.6 97.4 97.4 99.95
Chinese Extension 40 40 40 55.0 100.0 100.0 99.95
Chinese & Literature 462 421 443 52.2 91.1 95.9 99.95
Chinese in Context 138 133 136 55.8 96.4 98.6 99.95
Classical Greek Continuers 15 14 14 53.3 93.3 93.3 99.95
Classical Greek Extension 11 10 10 54.5 90.9 90.9 99.95
Classical Hebrew Continuers 25 24 24 44.0 96.0 96.0 98.15
Classical Hebrew Extension 15 15 15 46.7 100.0 100.0 98.15
French Beginners 513 495 463 76.0 96.5 90.3 97.55
French Continuers 637 603 602 69.1 94.7 94.5 99.95
French Extension 135 130 130 71.9 96.3 96.3 99.95
German Beginners 92 88 81 59.8 95.7 88.0 99.80
German Continuers 231 203 202 52.8 87.9 87.4 99.95
German Extension 57 56 56 45.6 98.2 98.2 99.95
Hindi Continuers 14 12 12 42.9 85.7 85.7 98.90
Indonesian Beginners 44 44 41 61.4 100.0 93.2 89.70
Indonesian Continuers 78 78 76 55.1 100.0 97.4 98.75
Indonesian Extension 16 16 16 50.0 100.0 100.0 98.70
Italian Beginners 307 301 277 75.9 98.0 90.2 99.90
Italian Continuers 235 206 200 70.6 87.7 85.1 99.75
Italian Extension 45 44 44 62.2 97.8 97.8 99.70
Japanese Beginners 644 601 582 54.0 93.3 90.4 99.55
Japanese Continuers 701 645 632 65.8 92.0 90.2 99.95
Japanese Extension 166 162 162 73.5 97.6 97.6 99.85
Japanese & Literature 11 11 11 63.6 100.0 100.0 98.55
Japanese in Context 31 31 31 51.6 100.0 100.0 98.70
Khmer Continuers 21 17 20 57.1 81.0 95.2 87.25
Korean Beginners 128 127 124 85.2 99.2 96.9 99.75
Korean Continuers 16 16 16 93.8 100.0 100.0 97.10
Korean & Literature 43 40 42 48.8 93.0 97.7 98.05
Korean in Context 40 40 40 77.5 100.0 100.0 99.75
Latin Continuers 145 143 143 53.8 98.6 98.6 99.95
Latin Extension 105 104 104 51.4 99.0 99.0 99.95
Macedonian Continuers 21 21 20 47.6 100.0 95.2 89.95
Modern Greek Beginners 70 69 65 57.1 98.6 92.9 99.00
Modern Greek Continuers 89 76 75 68.5 85.4 84.3 99.70
Modern Greek Extension 32 27 27 65.6 84.4 84.4 99.70
Modern Hebrew Continuers 41 30 30 51.2 73.2 73.2 98.50

36
Course Number all
Number HSC
Number ATAR
% Female % HSC % ATAR
eligibleMaximum
ATAR
Persian Continuers 21 19 18 71.4 90.5 85.7 96.85
Polish Continuers 18 17 16 55.6 94.4 88.9 95.60
Portuguese Continuers 31 29 26 74.2 93.5 83.9 93.35
Punjabi Continuers 15 15 15 53.3 100.0 100.0 92.85
Russian Continuers 27 25 25 59.3 92.6 92.6 97.90
Serbian Continuers 30 29 29 60.0 96.7 96.7 94.95
Spanish Beginners 330 324 301 73.9 98.2 91.2 99.90
Spanish Continuers 169 160 156 70.4 94.7 92.3 99.85
Spanish Extension 55 52 51 74.5 94.5 92.7 99.85
Swedish Continuers 18 9 9 50.0 50.0 50.0 98.30
Tamil Continuers 57 20 21 68.4 35.1 36.8 98.40
Turkish Continuers 37 26 26 59.5 70.3 70.3 91.25
Vietnamese Continuers 191 151 171 64.9 79.1 89.5 99.95
Automotive Exam 265 198 127 8.7 74.7 47.9 96.30
Business Services Exam 1,232 1,086 926 71.8 88.1 75.2 99.30
Construction Exam 1,778 1,646 1,226 5.5 92.6 69.0 93.30
Electrotechnology Exam 231 215 153 3.9 93.1 66.2 89.90
Entertainment Industry Exam 733 703 606 55.1 95.9 82.7 97.25
Financial Services Exam 87 64 63 28.7 73.6 72.4 99.65
Hospitality Exam 4,616 4,253 3,861 72.5 92.1 83.6 98.55
Human Services Exam 711 700 637 91.8 98.5 89.6 97.60
Information & Digital Technology Exam 497 423 384 14.3 85.1 77.3 96.30
Metal & Engineering Exam 286 255 165 7.0 89.2 57.7 91.65
Primary Industries Exam 567 500 366 53.3 88.2 64.6 98.10
Retail Services Exam 906 756 660 67.8 83.4 72.8 98.50
Tourism, Travel & Events Exam 168 158 145 90.5 94.0 86.3 96.70
Total 70,466 63,154 54,894 52.8 89.6 77.9 99.95

37Appendix – Table A2 Distributions of HSC marks by course
Table A2 Distributions of 2020 HSC marks by course
Notes: (i) The Number column shows the number of students who completed the course in 2020.
(ii) The Median HSC mark column shows the median HSC mark per course.
(iii) The Median Band column indicates the Performance Band in which the median HSC mark lies.
(iv) The Percentage of Students in Performance Band columns show the percentage of a course candidature in each of the Performance Bands 6 to 2. Extension courses show only Bands 4 to 2 as they have four Bands only: E1 to E4.
(v) This table excludes courses with less than 10 students.
Percentage students in Performance Band
Course Number Median HSC mark
Median Band 6 5 4 3 2
Aboriginal Studies 653 72 4 13 16 28 21 13
Agriculture 1,470 74 4 10 28 23 22 12
Ancient History 7,164 74 4 9 25 30 22 10
Biology 18,633 74 4 7 24 32 24 11
Business Studies 17,877 74 4 9 26 27 21 11
Chemistry 10,137 77 4 13 30 26 21 8
Community & Family Studies 8,774 75 4 5 29 36 21 8
Dance 914 81 5 9 48 30 11 1
Design & Technology 3,484 79 4 16 32 36 15 2
Drama 3,902 79 4 19 28 43 8 1
Earth & Environmental Science 2,117 73 4 6 23 32 24 10
Economics 5,010 80 5 13 38 26 14 6
Engineering Studies 2,313 75 4 12 22 35 23 6
English Studies Exam 1,274 55 2 0 0 2 29 46
English Standard 30,914 71 4 1 11 46 32 10
English Advanced 24,773 82 5 14 49 31 5 1
English EAL/D 2,022 72 4 3 23 31 27 11
English Extension 1 3,551 43 E3 39 54 7
English Extension 2 1,380 41 E3 26 57 17
Food Technology 3,376 73 4 9 21 30 24 13
Geography 4,396 77 4 13 29 29 16 8
Industrial Technology 5,856 70 4 8 16 29 28 13
Information Processes & Technology 2,024 73 4 8 25 26 23 12
Investigating Science 2,589 73 4 5 24 30 26 11
Legal Studies 10,651 76 4 15 25 28 21 8
Mathematics Standard 1 Exam 1,340 71 4 3 14 39 27 13
Mathematics Standard 2 30,026 70 4 5 19 26 25 17
Mathematics Advanced 16,771 80 5 23 29 28 15 3
Mathematics Extension 1 8,804 84 E3 38 37 20
Mathematics Extension 2 3,372 86 E3 36 48 13
Modern History 10,860 76 4 10 27 29 18 9
History Extension 1,746 39 E3 21 56 22
Music 1 4,500 83 5 22 43 26 7 1
Music 2 688 88 5 38 49 12 <1
Music Extension 400 47 E4 69 29 2
PDH&PE 16,183 74 4 9 25 27 24 10
Physics 7,991 76 4 13 28 27 19 10
Science Extension 608 37 E3 7 67 25

38
Percentage students in Performance Band
Course Number Median HSC mark
Median Band 6 5 4 3 2
Society & Culture 4,566 78 4 11 33 36 14 5
Software Design & Development 1,737 75 4 13 25 28 23 8
Studies of Religion I 8,129 39 4 8 36 33 17 5
Studies of Religion II 6,133 78 4 7 37 30 18 6
Textiles & Design 1,323 82 5 17 39 28 11 3
Visual Arts 8,580 83 5 17 48 25 8 2
Arabic Continuers 299 79 4 9 41 31 15 3
Arabic Extension 101 40 E3 32 45 24
Armenian Continuers 26 87 5 38 46 15
Chinese Beginners 80 77 4 24 24 13 15 10
Chinese Continuers 187 88 5 43 33 13 7 2
Chinese Extension 40 46 E4 70 28 3
Chinese & Literature 461 84 5 17 52 24 4 2
Chinese in Context 137 90 6 55 34 10 1
Classical Greek Continuers 10 90 6 50 20 20 10
Classical Hebrew Continuers 25 90 6 52 32 16
Classical Hebrew Extension 15 48 E4 80 20
French Beginners 507 80 5 25 27 19 15 9
French Continuers 593 84 5 31 33 22 11 3
French Extension 133 41 E3 27 54 19
German Beginners 89 80 5 30 21 20 21 4
German Continuers 212 83 5 25 40 22 8 5
German Extension 55 45 E4 53 47
Hindi Continuers 12 87 5 42 17 42
Indonesian Beginners 44 82 5 27 30 25 11 7
Indonesian Continuers 78 83 5 26 37 19 15 3
Indonesian Extension 16 41 E3 25 69 6
Italian Beginners 306 78 4 16 30 28 16 7
Italian Continuers 210 82 5 27 31 29 10 2
Italian Extension 42 45 E4 57 36 7
Japanese Beginners 635 73 4 17 18 24 21 13
Japanese Continuers 671 82 5 29 27 23 16 4
Japanese Extension 163 44 E3 44 45 10
Japanese & Literature 11 83 5 18 45 18 18
Japanese in Context 30 85 5 10 63 20 7
Khmer Continuers 21 85 5 19 67 10 5
Korean Beginners 127 81 5 18 35 35 6 4
Korean Continuers 16 92 6 56 38 6
Korean & Literature 43 86 5 33 51 14 2
Korean in Context 39 93 6 69 26 5
Latin Continuers 142 90 6 50 39 7 4
Latin Extension 104 48 E4 87 13
Macedonian Continuers 21 82 5 5 62 19 5 10
Modern Greek Beginners 70 88 5 40 40 10 9 1
Modern Greek Continuers 72 88 5 44 36 15 4
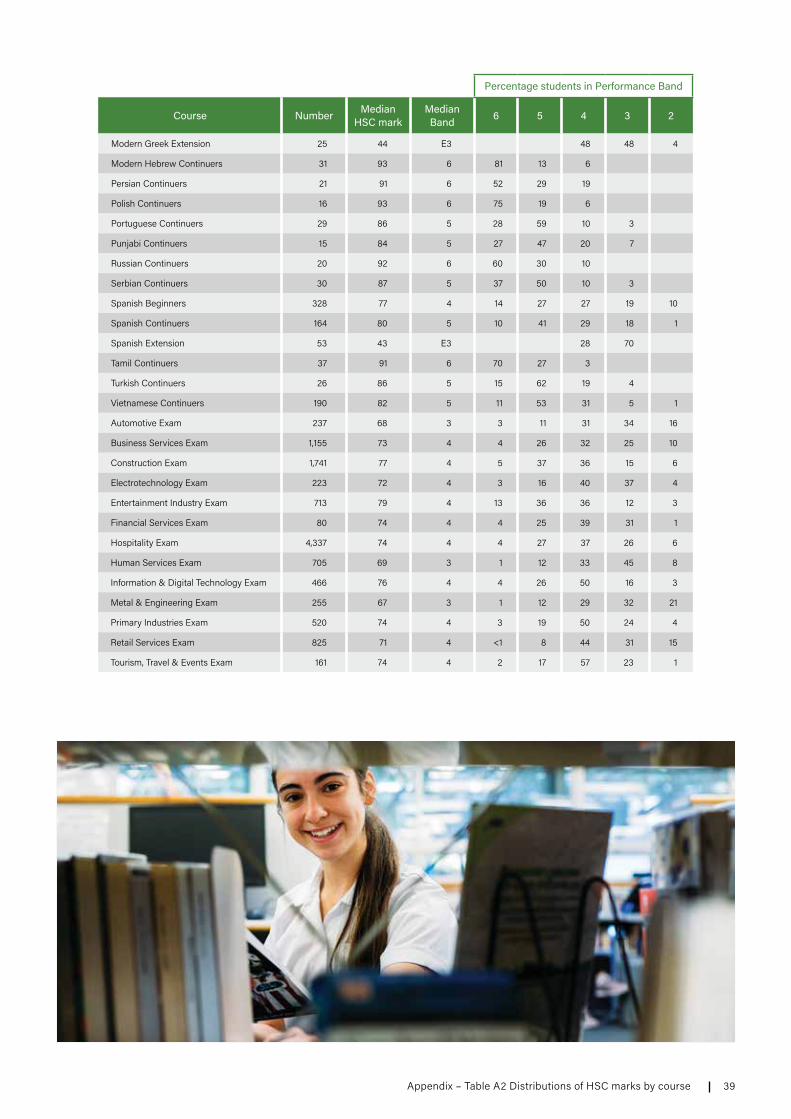
39Appendix – Table A2 Distributions of HSC marks by course
Percentage students in Performance Band
Course Number Median HSC mark
Median Band 6 5 4 3 2
Modern Greek Extension 25 44 E3 48 48 4
Modern Hebrew Continuers 31 93 6 81 13 6
Persian Continuers 21 91 6 52 29 19
Polish Continuers 16 93 6 75 19 6
Portuguese Continuers 29 86 5 28 59 10 3
Punjabi Continuers 15 84 5 27 47 20 7
Russian Continuers 20 92 6 60 30 10
Serbian Continuers 30 87 5 37 50 10 3
Spanish Beginners 328 77 4 14 27 27 19 10
Spanish Continuers 164 80 5 10 41 29 18 1
Spanish Extension 53 43 E3 28 70
Tamil Continuers 37 91 6 70 27 3
Turkish Continuers 26 86 5 15 62 19 4
Vietnamese Continuers 190 82 5 11 53 31 5 1
Automotive Exam 237 68 3 3 11 31 34 16
Business Services Exam 1,155 73 4 4 26 32 25 10
Construction Exam 1,741 77 4 5 37 36 15 6
Electrotechnology Exam 223 72 4 3 16 40 37 4
Entertainment Industry Exam 713 79 4 13 36 36 12 3
Financial Services Exam 80 74 4 4 25 39 31 1
Hospitality Exam 4,337 74 4 4 27 37 26 6
Human Services Exam 705 69 3 1 12 33 45 8
Information & Digital Technology Exam 466 76 4 4 26 50 16 3
Metal & Engineering Exam 255 67 3 1 12 29 32 21
Primary Industries Exam 520 74 4 3 19 50 24 4
Retail Services Exam 825 71 4 <1 8 44 31 15
Tourism, Travel & Events Exam 161 74 4 2 17 57 23 1
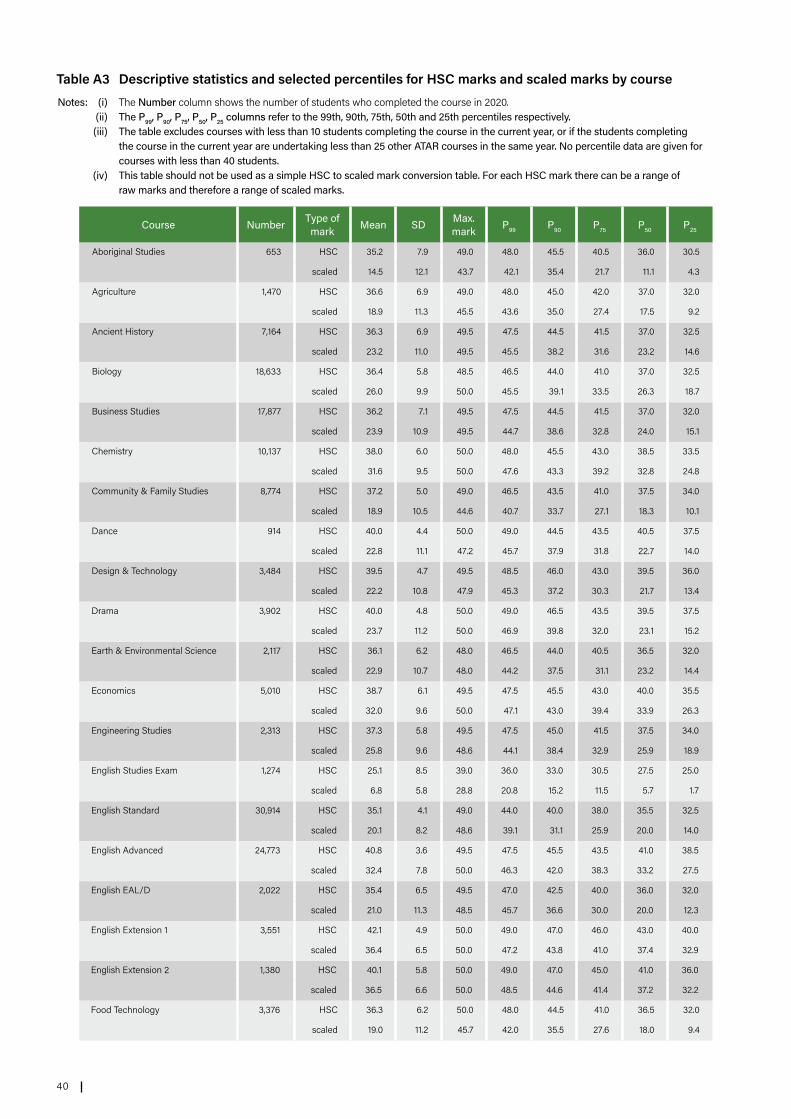
40
Table A3 Descriptive statistics and selected percentiles for HSC marks and scaled marks by courseNotes: (i) The Number column shows the number of students who completed the course in 2020. (ii) The P99, P90, P75, P50, P25 columns refer to the 99th, 90th, 75th, 50th and 25th percentiles respectively. (iii) The table excludes courses with less than 10 students completing the course in the current year, or if the students completing
the course in the current year are undertaking less than 25 other ATAR courses in the same year. No percentile data are given for courses with less than 40 students.
(iv) This table should not be used as a simple HSC to scaled mark conversion table. For each HSC mark there can be a range of raw marks and therefore a range of scaled marks.
Course Number Type of mark Mean SD Max.
mark P99 P90 P75 P50 P25
Aboriginal Studies 653 HSC 35.2 7.9 49.0 48.0 45.5 40.5 36.0 30.5
scaled 14.5 12.1 43.7 42.1 35.4 21.7 11.1 4.3
Agriculture 1,470 HSC 36.6 6.9 49.0 48.0 45.0 42.0 37.0 32.0
scaled 18.9 11.3 45.5 43.6 35.0 27.4 17.5 9.2
Ancient History 7,164 HSC 36.3 6.9 49.5 47.5 44.5 41.5 37.0 32.5
scaled 23.2 11.0 49.5 45.5 38.2 31.6 23.2 14.6
Biology 18,633 HSC 36.4 5.8 48.5 46.5 44.0 41.0 37.0 32.5
scaled 26.0 9.9 50.0 45.5 39.1 33.5 26.3 18.7
Business Studies 17,877 HSC 36.2 7.1 49.5 47.5 44.5 41.5 37.0 32.0
scaled 23.9 10.9 49.5 44.7 38.6 32.8 24.0 15.1
Chemistry 10,137 HSC 38.0 6.0 50.0 48.0 45.5 43.0 38.5 33.5
scaled 31.6 9.5 50.0 47.6 43.3 39.2 32.8 24.8
Community & Family Studies 8,774 HSC 37.2 5.0 49.0 46.5 43.5 41.0 37.5 34.0
scaled 18.9 10.5 44.6 40.7 33.7 27.1 18.3 10.1
Dance 914 HSC 40.0 4.4 50.0 49.0 44.5 43.5 40.5 37.5
scaled 22.8 11.1 47.2 45.7 37.9 31.8 22.7 14.0
Design & Technology 3,484 HSC 39.5 4.7 49.5 48.5 46.0 43.0 39.5 36.0
scaled 22.2 10.8 47.9 45.3 37.2 30.3 21.7 13.4
Drama 3,902 HSC 40.0 4.8 50.0 49.0 46.5 43.5 39.5 37.5
scaled 23.7 11.2 50.0 46.9 39.8 32.0 23.1 15.2
Earth & Environmental Science 2,117 HSC 36.1 6.2 48.0 46.5 44.0 40.5 36.5 32.0
scaled 22.9 10.7 48.0 44.2 37.5 31.1 23.2 14.4
Economics 5,010 HSC 38.7 6.1 49.5 47.5 45.5 43.0 40.0 35.5
scaled 32.0 9.6 50.0 47.1 43.0 39.4 33.9 26.3
Engineering Studies 2,313 HSC 37.3 5.8 49.5 47.5 45.0 41.5 37.5 34.0
scaled 25.8 9.6 48.6 44.1 38.4 32.9 25.9 18.9
English Studies Exam 1,274 HSC 25.1 8.5 39.0 36.0 33.0 30.5 27.5 25.0
scaled 6.8 5.8 28.8 20.8 15.2 11.5 5.7 1.7
English Standard 30,914 HSC 35.1 4.1 49.0 44.0 40.0 38.0 35.5 32.5
scaled 20.1 8.2 48.6 39.1 31.1 25.9 20.0 14.0
English Advanced 24,773 HSC 40.8 3.6 49.5 47.5 45.5 43.5 41.0 38.5
scaled 32.4 7.8 50.0 46.3 42.0 38.3 33.2 27.5
English EAL/D 2,022 HSC 35.4 6.5 49.5 47.0 42.5 40.0 36.0 32.0
scaled 21.0 11.3 48.5 45.7 36.6 30.0 20.0 12.3
English Extension 1 3,551 HSC 42.1 4.9 50.0 49.0 47.0 46.0 43.0 40.0
scaled 36.4 6.5 50.0 47.2 43.8 41.0 37.4 32.9
English Extension 2 1,380 HSC 40.1 5.8 50.0 49.0 47.0 45.0 41.0 36.0
scaled 36.5 6.6 50.0 48.5 44.6 41.4 37.2 32.2
Food Technology 3,376 HSC 36.3 6.2 50.0 48.0 44.5 41.0 36.5 32.0
scaled 19.0 11.2 45.7 42.0 35.5 27.6 18.0 9.4
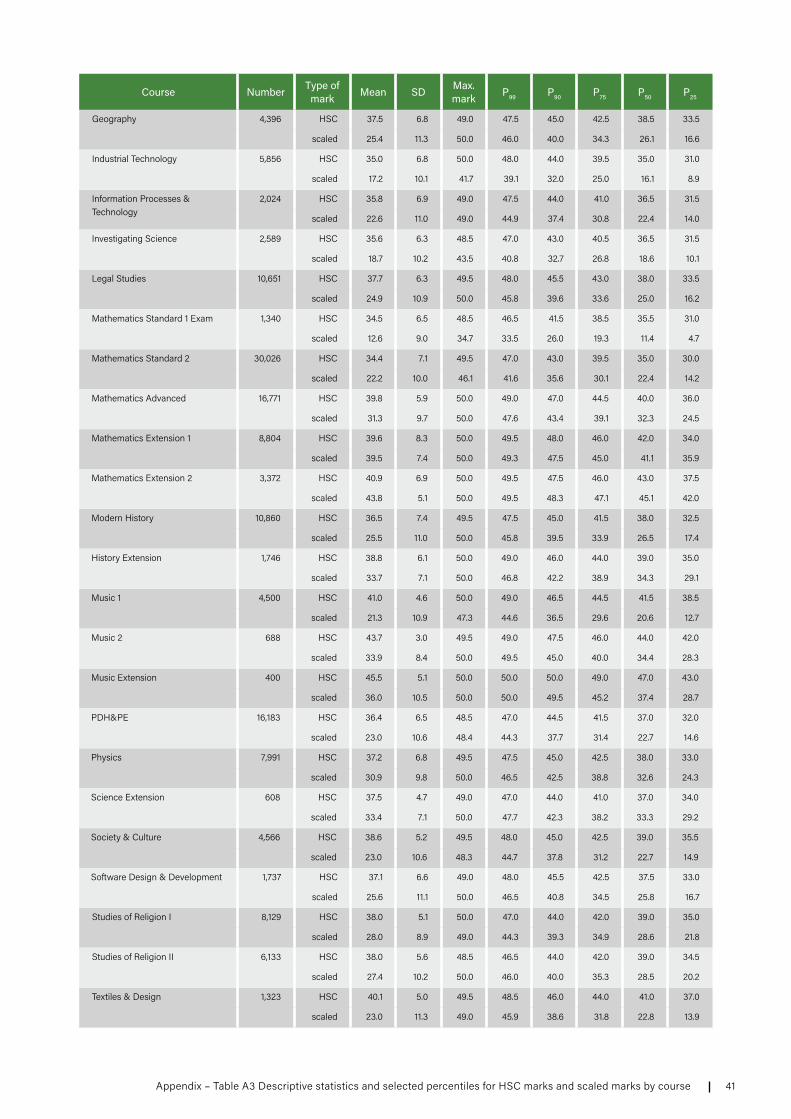
41Appendix – Table A3 Descriptive statistics and selected percentiles for HSC marks and scaled marks by course
Course Number Type of mark Mean SD Max.
mark P99 P90 P75 P50 P25
Geography 4,396 HSC 37.5 6.8 49.0 47.5 45.0 42.5 38.5 33.5
scaled 25.4 11.3 50.0 46.0 40.0 34.3 26.1 16.6
Industrial Technology 5,856 HSC 35.0 6.8 50.0 48.0 44.0 39.5 35.0 31.0
scaled 17.2 10.1 41.7 39.1 32.0 25.0 16.1 8.9
Information Processes & Technology
2,024 HSC 35.8 6.9 49.0 47.5 44.0 41.0 36.5 31.5
scaled 22.6 11.0 49.0 44.9 37.4 30.8 22.4 14.0
Investigating Science 2,589 HSC 35.6 6.3 48.5 47.0 43.0 40.5 36.5 31.5
scaled 18.7 10.2 43.5 40.8 32.7 26.8 18.6 10.1
Legal Studies 10,651 HSC 37.7 6.3 49.5 48.0 45.5 43.0 38.0 33.5
scaled 24.9 10.9 50.0 45.8 39.6 33.6 25.0 16.2
Mathematics Standard 1 Exam 1,340 HSC 34.5 6.5 48.5 46.5 41.5 38.5 35.5 31.0
scaled 12.6 9.0 34.7 33.5 26.0 19.3 11.4 4.7
Mathematics Standard 2 30,026 HSC 34.4 7.1 49.5 47.0 43.0 39.5 35.0 30.0
scaled 22.2 10.0 46.1 41.6 35.6 30.1 22.4 14.2
Mathematics Advanced 16,771 HSC 39.8 5.9 50.0 49.0 47.0 44.5 40.0 36.0
scaled 31.3 9.7 50.0 47.6 43.4 39.1 32.3 24.5
Mathematics Extension 1 8,804 HSC 39.6 8.3 50.0 49.5 48.0 46.0 42.0 34.0
scaled 39.5 7.4 50.0 49.3 47.5 45.0 41.1 35.9
Mathematics Extension 2 3,372 HSC 40.9 6.9 50.0 49.5 47.5 46.0 43.0 37.5
scaled 43.8 5.1 50.0 49.5 48.3 47.1 45.1 42.0
Modern History 10,860 HSC 36.5 7.4 49.5 47.5 45.0 41.5 38.0 32.5
scaled 25.5 11.0 50.0 45.8 39.5 33.9 26.5 17.4
History Extension 1,746 HSC 38.8 6.1 50.0 49.0 46.0 44.0 39.0 35.0
scaled 33.7 7.1 50.0 46.8 42.2 38.9 34.3 29.1
Music 1 4,500 HSC 41.0 4.6 50.0 49.0 46.5 44.5 41.5 38.5
scaled 21.3 10.9 47.3 44.6 36.5 29.6 20.6 12.7
Music 2 688 HSC 43.7 3.0 49.5 49.0 47.5 46.0 44.0 42.0
scaled 33.9 8.4 50.0 49.5 45.0 40.0 34.4 28.3
Music Extension 400 HSC 45.5 5.1 50.0 50.0 50.0 49.0 47.0 43.0
scaled 36.0 10.5 50.0 50.0 49.5 45.2 37.4 28.7
PDH&PE 16,183 HSC 36.4 6.5 48.5 47.0 44.5 41.5 37.0 32.0
scaled 23.0 10.6 48.4 44.3 37.7 31.4 22.7 14.6
Physics 7,991 HSC 37.2 6.8 49.5 47.5 45.0 42.5 38.0 33.0
scaled 30.9 9.8 50.0 46.5 42.5 38.8 32.6 24.3
Science Extension 608 HSC 37.5 4.7 49.0 47.0 44.0 41.0 37.0 34.0
scaled 33.4 7.1 50.0 47.7 42.3 38.2 33.3 29.2
Society & Culture 4,566 HSC 38.6 5.2 49.5 48.0 45.0 42.5 39.0 35.5
scaled 23.0 10.6 48.3 44.7 37.8 31.2 22.7 14.9
Software Design & Development 1,737 HSC 37.1 6.6 49.0 48.0 45.5 42.5 37.5 33.0
scaled 25.6 11.1 50.0 46.5 40.8 34.5 25.8 16.7
Studies of Religion I 8,129 HSC 38.0 5.1 50.0 47.0 44.0 42.0 39.0 35.0
scaled 28.0 8.9 49.0 44.3 39.3 34.9 28.6 21.8
Studies of Religion II 6,133 HSC 38.0 5.6 48.5 46.5 44.0 42.0 39.0 34.5
scaled 27.4 10.2 50.0 46.0 40.0 35.3 28.5 20.2
Textiles & Design 1,323 HSC 40.1 5.0 49.5 48.5 46.0 44.0 41.0 37.0
scaled 23.0 11.3 49.0 45.9 38.6 31.8 22.8 13.9
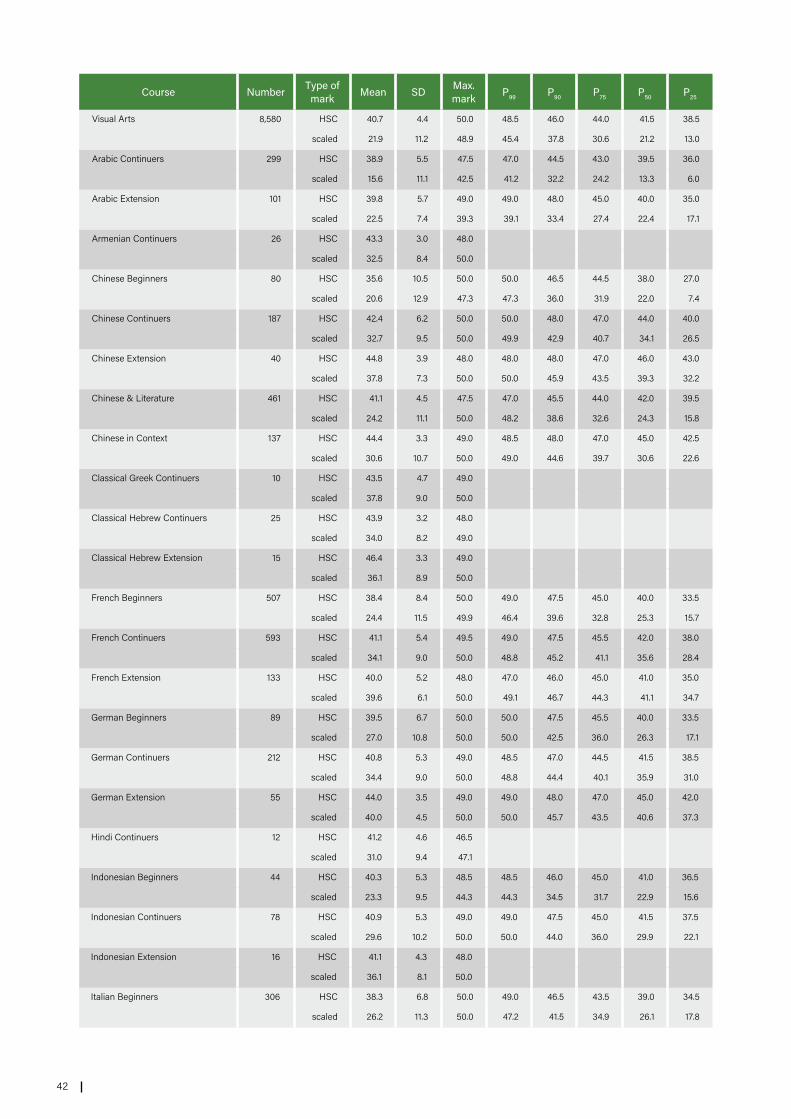
42
Course Number Type of mark Mean SD Max.
mark P99 P90 P75 P50 P25
Visual Arts 8,580 HSC 40.7 4.4 50.0 48.5 46.0 44.0 41.5 38.5
scaled 21.9 11.2 48.9 45.4 37.8 30.6 21.2 13.0
Arabic Continuers 299 HSC 38.9 5.5 47.5 47.0 44.5 43.0 39.5 36.0
scaled 15.6 11.1 42.5 41.2 32.2 24.2 13.3 6.0
Arabic Extension 101 HSC 39.8 5.7 49.0 49.0 48.0 45.0 40.0 35.0
scaled 22.5 7.4 39.3 39.1 33.4 27.4 22.4 17.1
Armenian Continuers 26 HSC 43.3 3.0 48.0
scaled 32.5 8.4 50.0
Chinese Beginners 80 HSC 35.6 10.5 50.0 50.0 46.5 44.5 38.0 27.0
scaled 20.6 12.9 47.3 47.3 36.0 31.9 22.0 7.4
Chinese Continuers 187 HSC 42.4 6.2 50.0 50.0 48.0 47.0 44.0 40.0
scaled 32.7 9.5 50.0 49.9 42.9 40.7 34.1 26.5
Chinese Extension 40 HSC 44.8 3.9 48.0 48.0 48.0 47.0 46.0 43.0
scaled 37.8 7.3 50.0 50.0 45.9 43.5 39.3 32.2
Chinese & Literature 461 HSC 41.1 4.5 47.5 47.0 45.5 44.0 42.0 39.5
scaled 24.2 11.1 50.0 48.2 38.6 32.6 24.3 15.8
Chinese in Context 137 HSC 44.4 3.3 49.0 48.5 48.0 47.0 45.0 42.5
scaled 30.6 10.7 50.0 49.0 44.6 39.7 30.6 22.6
Classical Greek Continuers 10 HSC 43.5 4.7 49.0
scaled 37.8 9.0 50.0
Classical Hebrew Continuers 25 HSC 43.9 3.2 48.0
scaled 34.0 8.2 49.0
Classical Hebrew Extension 15 HSC 46.4 3.3 49.0
scaled 36.1 8.9 50.0
French Beginners 507 HSC 38.4 8.4 50.0 49.0 47.5 45.0 40.0 33.5
scaled 24.4 11.5 49.9 46.4 39.6 32.8 25.3 15.7
French Continuers 593 HSC 41.1 5.4 49.5 49.0 47.5 45.5 42.0 38.0
scaled 34.1 9.0 50.0 48.8 45.2 41.1 35.6 28.4
French Extension 133 HSC 40.0 5.2 48.0 47.0 46.0 45.0 41.0 35.0
scaled 39.6 6.1 50.0 49.1 46.7 44.3 41.1 34.7
German Beginners 89 HSC 39.5 6.7 50.0 50.0 47.5 45.5 40.0 33.5
scaled 27.0 10.8 50.0 50.0 42.5 36.0 26.3 17.1
German Continuers 212 HSC 40.8 5.3 49.0 48.5 47.0 44.5 41.5 38.5
scaled 34.4 9.0 50.0 48.8 44.4 40.1 35.9 31.0
German Extension 55 HSC 44.0 3.5 49.0 49.0 48.0 47.0 45.0 42.0
scaled 40.0 4.5 50.0 50.0 45.7 43.5 40.6 37.3
Hindi Continuers 12 HSC 41.2 4.6 46.5
scaled 31.0 9.4 47.1
Indonesian Beginners 44 HSC 40.3 5.3 48.5 48.5 46.0 45.0 41.0 36.5
scaled 23.3 9.5 44.3 44.3 34.5 31.7 22.9 15.6
Indonesian Continuers 78 HSC 40.9 5.3 49.0 49.0 47.5 45.0 41.5 37.5
scaled 29.6 10.2 50.0 50.0 44.0 36.0 29.9 22.1
Indonesian Extension 16 HSC 41.1 4.3 48.0
scaled 36.1 8.1 50.0
Italian Beginners 306 HSC 38.3 6.8 50.0 49.0 46.5 43.5 39.0 34.5
scaled 26.2 11.3 50.0 47.2 41.5 34.9 26.1 17.8

43Appendix – Table A3 Descriptive statistics and selected percentiles for HSC marks and scaled marks by course
Course Number Type of mark Mean SD Max.
mark P99 P90 P75 P50 P25
Italian Continuers 210 HSC 40.4 5.8 49.0 48.5 46.5 45.0 41.0 37.0
scaled 31.7 10.1 50.0 48.7 44.2 40.2 32.1 24.4
Italian Extension 42 HSC 43.6 4.5 49.0 49.0 48.0 47.0 45.0 43.0
scaled 38.3 6.7 50.0 50.0 46.3 43.3 38.9 36.0
Japanese Beginners 635 HSC 36.1 8.2 49.5 48.5 46.0 42.5 36.5 31.0
scaled 23.8 11.4 48.5 45.5 39.2 33.3 23.8 14.8
Japanese Continuers 671 HSC 40.2 6.3 50.0 49.5 48.0 45.0 41.0 36.0
scaled 30.6 10.1 50.0 48.2 43.9 38.3 31.1 23.4
Japanese Extension 163 HSC 42.1 5.3 49.0 49.0 48.0 46.0 44.0 38.0
scaled 37.7 6.2 50.0 49.5 45.8 42.8 37.6 33.2
Japanese & Literature 11 HSC 40.4 4.7 46.5
scaled 28.5 11.3 47.4
Japanese in Context 30 HSC 41.7 3.6 49.0
scaled 30.2 7.7 48.1
Khmer Continuers 21 HSC 42.7 2.9 47.5
scaled 17.6 9.7 38.5
Korean Beginners 127 HSC 40.0 5.3 49.0 48.5 46.5 44.0 40.5 37.0
scaled 25.2 11.3 50.0 48.0 40.5 33.5 25.2 16.7
Korean Continuers 16 HSC 44.8 2.6 48.0
scaled 32.8 9.0 47.2
Korean & Literature 43 HSC 42.9 3.6 48.5 48.5 47.5 46.0 43.0 41.0
scaled 25.0 10.5 47.6 47.6 40.0 33.8 23.6 17.9
Korean in Context 39 HSC 45.7 2.5 49.5
scaled 26.6 9.6 48.7
Latin Continuers 142 HSC 43.9 3.7 48.5 48.5 47.5 46.5 44.5 42.5
scaled 41.1 7.1 50.0 50.0 48.4 45.9 42.9 38.1
Latin Extension 104 HSC 47.0 2.6 50.0 50.0 49.0 49.0 48.0 46.0
scaled 42.1 6.3 50.0 50.0 48.5 46.2 43.9 39.2
Macedonian Continuers 21 HSC 39.8 5.0 48.5
scaled 25.2 8.9 45.5
Modern Greek Beginners 70 HSC 42.8 5.0 50.0 50.0 48.0 46.5 43.5 41.0
scaled 28.2 11.5 50.0 50.0 42.6 37.7 28.7 21.0
Modern Greek Continuers 72 HSC 43.2 4.2 49.5 49.5 48.0 46.5 43.5 40.5
scaled 27.5 10.2 48.5 48.5 39.7 35.4 27.3 18.8
Modern Greek Extension 25 HSC 43.0 5.1 49.0
scaled 32.7 8.4 47.5
Modern Hebrew Continuers 31 HSC 45.9 2.8 49.0
scaled 35.6 7.6 50.0
Persian Continuers 21 HSC 44.3 3.8 49.0
scaled 20.4 12.5 45.7
Polish Continuers 16 HSC 45.9 2.9 49.5
scaled 32.2 9.1 50.0
Portuguese Continuers 29 HSC 42.6 3.2 48.5
scaled 25.0 8.2 45.6
Punjabi Continuers 15 HSC 41.8 3.6 47.0
scaled 27.0 9.5 45.8
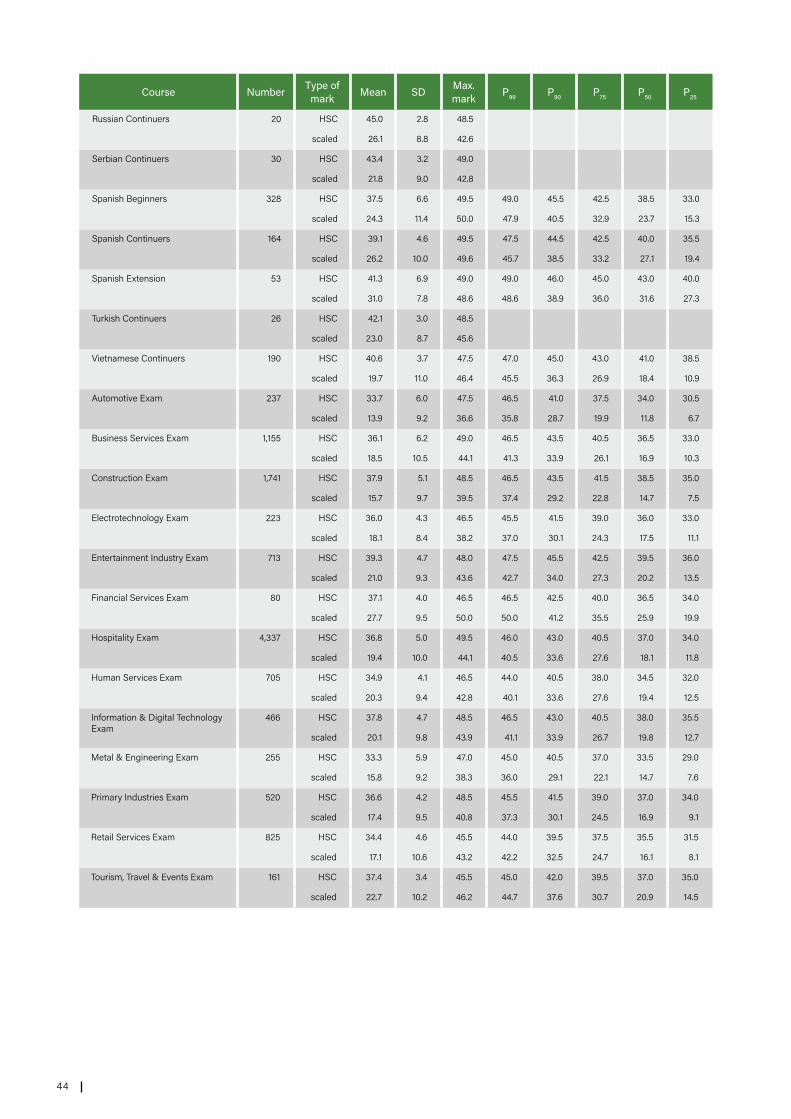
44
Course Number Type of mark Mean SD Max.
mark P99 P90 P75 P50 P25
Russian Continuers 20 HSC 45.0 2.8 48.5
scaled 26.1 8.8 42.6
Serbian Continuers 30 HSC 43.4 3.2 49.0
scaled 21.8 9.0 42.8
Spanish Beginners 328 HSC 37.5 6.6 49.5 49.0 45.5 42.5 38.5 33.0
scaled 24.3 11.4 50.0 47.9 40.5 32.9 23.7 15.3
Spanish Continuers 164 HSC 39.1 4.6 49.5 47.5 44.5 42.5 40.0 35.5
scaled 26.2 10.0 49.6 45.7 38.5 33.2 27.1 19.4
Spanish Extension 53 HSC 41.3 6.9 49.0 49.0 46.0 45.0 43.0 40.0
scaled 31.0 7.8 48.6 48.6 38.9 36.0 31.6 27.3
Turkish Continuers 26 HSC 42.1 3.0 48.5
scaled 23.0 8.7 45.6
Vietnamese Continuers 190 HSC 40.6 3.7 47.5 47.0 45.0 43.0 41.0 38.5
scaled 19.7 11.0 46.4 45.5 36.3 26.9 18.4 10.9
Automotive Exam 237 HSC 33.7 6.0 47.5 46.5 41.0 37.5 34.0 30.5
scaled 13.9 9.2 36.6 35.8 28.7 19.9 11.8 6.7
Business Services Exam 1,155 HSC 36.1 6.2 49.0 46.5 43.5 40.5 36.5 33.0
scaled 18.5 10.5 44.1 41.3 33.9 26.1 16.9 10.3
Construction Exam 1,741 HSC 37.9 5.1 48.5 46.5 43.5 41.5 38.5 35.0
scaled 15.7 9.7 39.5 37.4 29.2 22.8 14.7 7.5
Electrotechnology Exam 223 HSC 36.0 4.3 46.5 45.5 41.5 39.0 36.0 33.0
scaled 18.1 8.4 38.2 37.0 30.1 24.3 17.5 11.1
Entertainment Industry Exam 713 HSC 39.3 4.7 48.0 47.5 45.5 42.5 39.5 36.0
scaled 21.0 9.3 43.6 42.7 34.0 27.3 20.2 13.5
Financial Services Exam 80 HSC 37.1 4.0 46.5 46.5 42.5 40.0 36.5 34.0
scaled 27.7 9.5 50.0 50.0 41.2 35.5 25.9 19.9
Hospitality Exam 4,337 HSC 36.8 5.0 49.5 46.0 43.0 40.5 37.0 34.0
scaled 19.4 10.0 44.1 40.5 33.6 27.6 18.1 11.8
Human Services Exam 705 HSC 34.9 4.1 46.5 44.0 40.5 38.0 34.5 32.0
scaled 20.3 9.4 42.8 40.1 33.6 27.6 19.4 12.5
Information & Digital Technology Exam
466 HSC 37.8 4.7 48.5 46.5 43.0 40.5 38.0 35.5
scaled 20.1 9.8 43.9 41.1 33.9 26.7 19.8 12.7
Metal & Engineering Exam 255 HSC 33.3 5.9 47.0 45.0 40.5 37.0 33.5 29.0
scaled 15.8 9.2 38.3 36.0 29.1 22.1 14.7 7.6
Primary Industries Exam 520 HSC 36.6 4.2 48.5 45.5 41.5 39.0 37.0 34.0
scaled 17.4 9.5 40.8 37.3 30.1 24.5 16.9 9.1
Retail Services Exam 825 HSC 34.4 4.6 45.5 44.0 39.5 37.5 35.5 31.5
scaled 17.1 10.6 43.2 42.2 32.5 24.7 16.1 8.1
Tourism, Travel & Events Exam 161 HSC 37.4 3.4 45.5 45.0 42.0 39.5 37.0 35.0
scaled 22.7 10.2 46.2 44.7 37.6 30.7 20.9 14.5
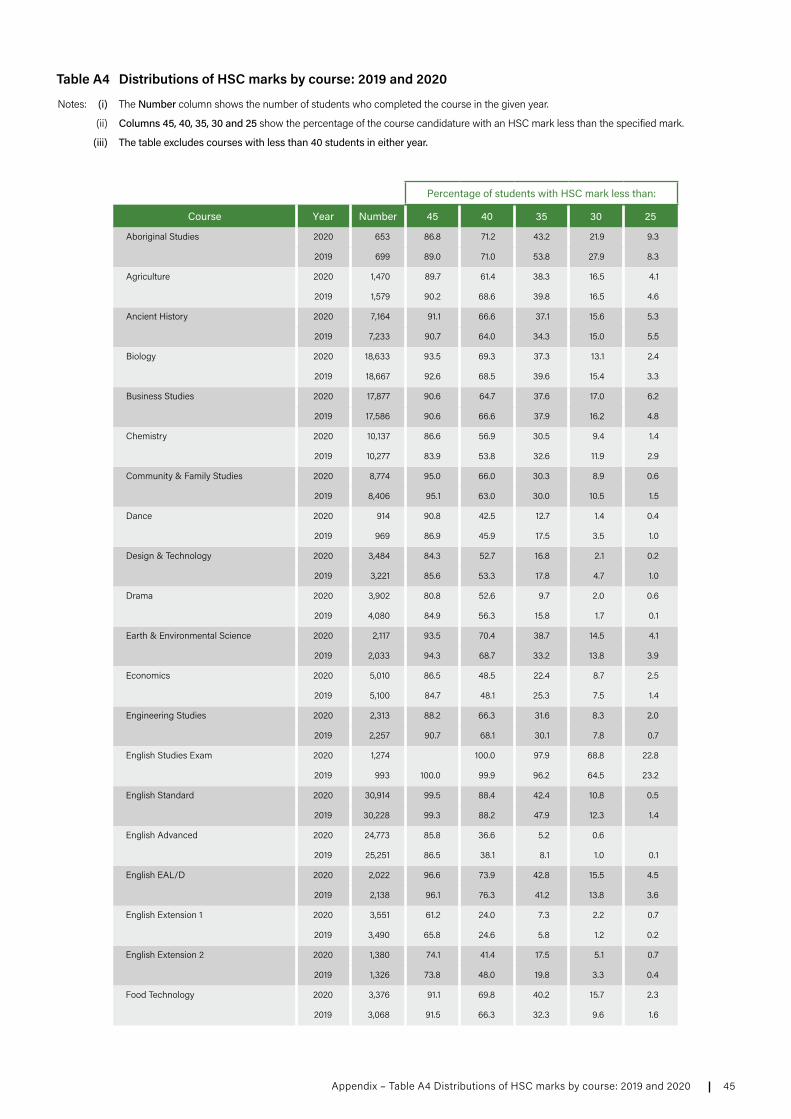
45Appendix – Table A4 Distributions of HSC marks by course: 2019 and 2020
Table A4 Distributions of HSC marks by course: 2019 and 2020
Notes: (i) The Number column shows the number of students who completed the course in the given year.
(ii) Columns 45, 40, 35, 30 and 25 show the percentage of the course candidature with an HSC mark less than the specified mark.
(iii) The table excludes courses with less than 40 students in either year.
Percentage of students with HSC mark less than:
Course Year Number 45 40 35 30 25
Aboriginal Studies 2020 653 86.8 71.2 43.2 21.9 9.3
2019 699 89.0 71.0 53.8 27.9 8.3
Agriculture 2020 1,470 89.7 61.4 38.3 16.5 4.1
2019 1,579 90.2 68.6 39.8 16.5 4.6
Ancient History 2020 7,164 91.1 66.6 37.1 15.6 5.3
2019 7,233 90.7 64.0 34.3 15.0 5.5
Biology 2020 18,633 93.5 69.3 37.3 13.1 2.4
2019 18,667 92.6 68.5 39.6 15.4 3.3
Business Studies 2020 17,877 90.6 64.7 37.6 17.0 6.2
2019 17,586 90.6 66.6 37.9 16.2 4.8
Chemistry 2020 10,137 86.6 56.9 30.5 9.4 1.4
2019 10,277 83.9 53.8 32.6 11.9 2.9
Community & Family Studies 2020 8,774 95.0 66.0 30.3 8.9 0.6
2019 8,406 95.1 63.0 30.0 10.5 1.5
Dance 2020 914 90.8 42.5 12.7 1.4 0.4
2019 969 86.9 45.9 17.5 3.5 1.0
Design & Technology 2020 3,484 84.3 52.7 16.8 2.1 0.2
2019 3,221 85.6 53.3 17.8 4.7 1.0
Drama 2020 3,902 80.8 52.6 9.7 2.0 0.6
2019 4,080 84.9 56.3 15.8 1.7 0.1
Earth & Environmental Science 2020 2,117 93.5 70.4 38.7 14.5 4.1
2019 2,033 94.3 68.7 33.2 13.8 3.9
Economics 2020 5,010 86.5 48.5 22.4 8.7 2.5
2019 5,100 84.7 48.1 25.3 7.5 1.4
Engineering Studies 2020 2,313 88.2 66.3 31.6 8.3 2.0
2019 2,257 90.7 68.1 30.1 7.8 0.7
English Studies Exam 2020 1,274 100.0 97.9 68.8 22.8
2019 993 100.0 99.9 96.2 64.5 23.2
English Standard 2020 30,914 99.5 88.4 42.4 10.8 0.5
2019 30,228 99.3 88.2 47.9 12.3 1.4
English Advanced 2020 24,773 85.8 36.6 5.2 0.6
2019 25,251 86.5 38.1 8.1 1.0 0.1
English EAL/D 2020 2,022 96.6 73.9 42.8 15.5 4.5
2019 2,138 96.1 76.3 41.2 13.8 3.6
English Extension 1 2020 3,551 61.2 24.0 7.3 2.2 0.7
2019 3,490 65.8 24.6 5.8 1.2 0.2
English Extension 2 2020 1,380 74.1 41.4 17.5 5.1 0.7
2019 1,326 73.8 48.0 19.8 3.3 0.4
Food Technology 2020 3,376 91.1 69.8 40.2 15.7 2.3
2019 3,068 91.5 66.3 32.3 9.6 1.6
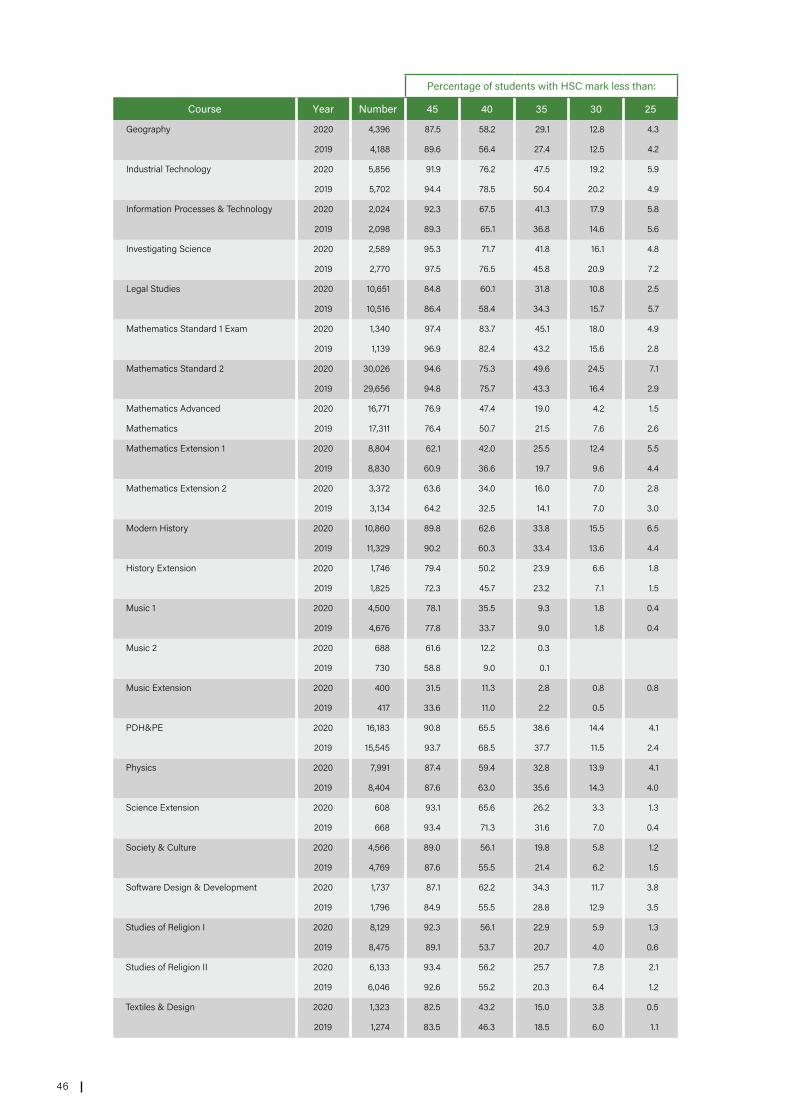
46
Percentage of students with HSC mark less than:
Course Year Number 45 40 35 30 25
Geography 2020 4,396 87.5 58.2 29.1 12.8 4.3
2019 4,188 89.6 56.4 27.4 12.5 4.2
Industrial Technology 2020 5,856 91.9 76.2 47.5 19.2 5.9
2019 5,702 94.4 78.5 50.4 20.2 4.9
Information Processes & Technology 2020 2,024 92.3 67.5 41.3 17.9 5.8
2019 2,098 89.3 65.1 36.8 14.6 5.6
Investigating Science 2020 2,589 95.3 71.7 41.8 16.1 4.8
2019 2,770 97.5 76.5 45.8 20.9 7.2
Legal Studies 2020 10,651 84.8 60.1 31.8 10.8 2.5
2019 10,516 86.4 58.4 34.3 15.7 5.7
Mathematics Standard 1 Exam 2020 1,340 97.4 83.7 45.1 18.0 4.9
2019 1,139 96.9 82.4 43.2 15.6 2.8
Mathematics Standard 2 2020 30,026 94.6 75.3 49.6 24.5 7.1
2019 29,656 94.8 75.7 43.3 16.4 2.9
Mathematics Advanced 2020 16,771 76.9 47.4 19.0 4.2 1.5
Mathematics 2019 17,311 76.4 50.7 21.5 7.6 2.6
Mathematics Extension 1 2020 8,804 62.1 42.0 25.5 12.4 5.5
2019 8,830 60.9 36.6 19.7 9.6 4.4
Mathematics Extension 2 2020 3,372 63.6 34.0 16.0 7.0 2.8
2019 3,134 64.2 32.5 14.1 7.0 3.0
Modern History 2020 10,860 89.8 62.6 33.8 15.5 6.5
2019 11,329 90.2 60.3 33.4 13.6 4.4
History Extension 2020 1,746 79.4 50.2 23.9 6.6 1.8
2019 1,825 72.3 45.7 23.2 7.1 1.5
Music 1 2020 4,500 78.1 35.5 9.3 1.8 0.4
2019 4,676 77.8 33.7 9.0 1.8 0.4
Music 2 2020 688 61.6 12.2 0.3
2019 730 58.8 9.0 0.1
Music Extension 2020 400 31.5 11.3 2.8 0.8 0.8
2019 417 33.6 11.0 2.2 0.5
PDH&PE 2020 16,183 90.8 65.5 38.6 14.4 4.1
2019 15,545 93.7 68.5 37.7 11.5 2.4
Physics 2020 7,991 87.4 59.4 32.8 13.9 4.1
2019 8,404 87.6 63.0 35.6 14.3 4.0
Science Extension 2020 608 93.1 65.6 26.2 3.3 1.3
2019 668 93.4 71.3 31.6 7.0 0.4
Society & Culture 2020 4,566 89.0 56.1 19.8 5.8 1.2
2019 4,769 87.6 55.5 21.4 6.2 1.5
Software Design & Development 2020 1,737 87.1 62.2 34.3 11.7 3.8
2019 1,796 84.9 55.5 28.8 12.9 3.5
Studies of Religion I 2020 8,129 92.3 56.1 22.9 5.9 1.3
2019 8,475 89.1 53.7 20.7 4.0 0.6
Studies of Religion II 2020 6,133 93.4 56.2 25.7 7.8 2.1
2019 6,046 92.6 55.2 20.3 6.4 1.2
Textiles & Design 2020 1,323 82.5 43.2 15.0 3.8 0.5
2019 1,274 83.5 46.3 18.5 6.0 1.1
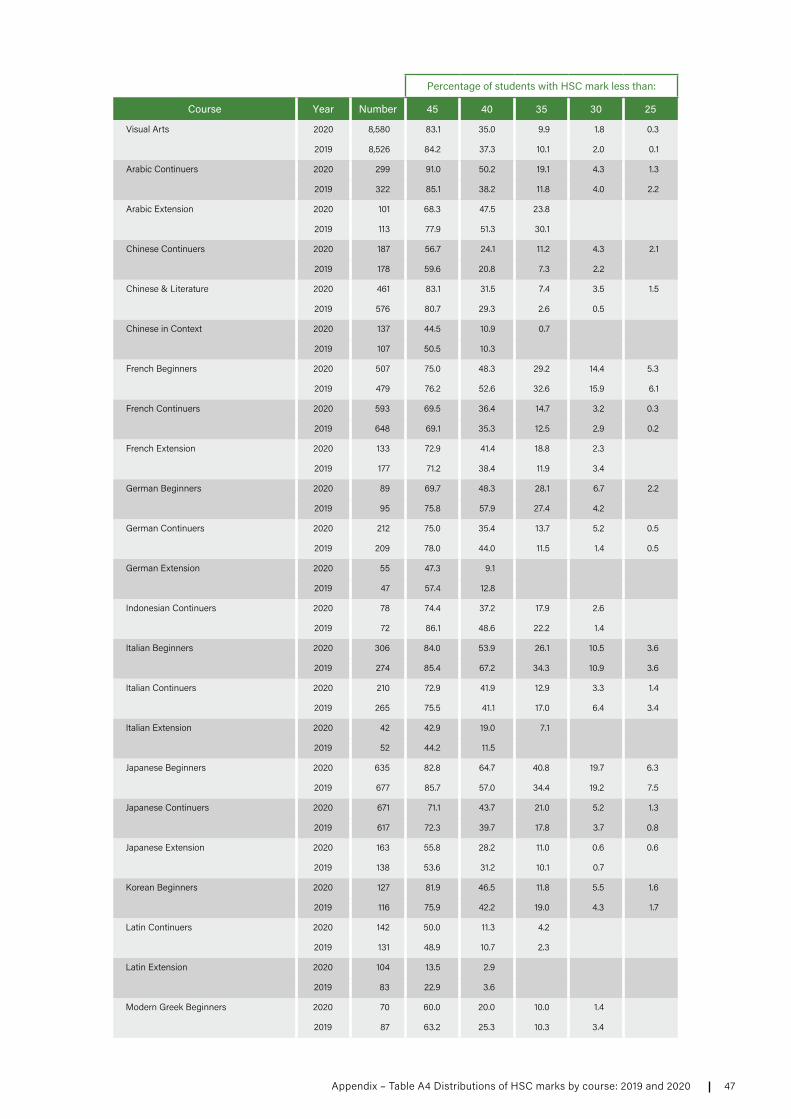
47Appendix – Table A4 Distributions of HSC marks by course: 2019 and 2020
Percentage of students with HSC mark less than:
Course Year Number 45 40 35 30 25
Visual Arts 2020 8,580 83.1 35.0 9.9 1.8 0.3
2019 8,526 84.2 37.3 10.1 2.0 0.1
Arabic Continuers 2020 299 91.0 50.2 19.1 4.3 1.3
2019 322 85.1 38.2 11.8 4.0 2.2
Arabic Extension 2020 101 68.3 47.5 23.8
2019 113 77.9 51.3 30.1
Chinese Continuers 2020 187 56.7 24.1 11.2 4.3 2.1
2019 178 59.6 20.8 7.3 2.2
Chinese & Literature 2020 461 83.1 31.5 7.4 3.5 1.5
2019 576 80.7 29.3 2.6 0.5
Chinese in Context 2020 137 44.5 10.9 0.7
2019 107 50.5 10.3
French Beginners 2020 507 75.0 48.3 29.2 14.4 5.3
2019 479 76.2 52.6 32.6 15.9 6.1
French Continuers 2020 593 69.5 36.4 14.7 3.2 0.3
2019 648 69.1 35.3 12.5 2.9 0.2
French Extension 2020 133 72.9 41.4 18.8 2.3
2019 177 71.2 38.4 11.9 3.4
German Beginners 2020 89 69.7 48.3 28.1 6.7 2.2
2019 95 75.8 57.9 27.4 4.2
German Continuers 2020 212 75.0 35.4 13.7 5.2 0.5
2019 209 78.0 44.0 11.5 1.4 0.5
German Extension 2020 55 47.3 9.1
2019 47 57.4 12.8
Indonesian Continuers 2020 78 74.4 37.2 17.9 2.6
2019 72 86.1 48.6 22.2 1.4
Italian Beginners 2020 306 84.0 53.9 26.1 10.5 3.6
2019 274 85.4 67.2 34.3 10.9 3.6
Italian Continuers 2020 210 72.9 41.9 12.9 3.3 1.4
2019 265 75.5 41.1 17.0 6.4 3.4
Italian Extension 2020 42 42.9 19.0 7.1
2019 52 44.2 11.5
Japanese Beginners 2020 635 82.8 64.7 40.8 19.7 6.3
2019 677 85.7 57.0 34.4 19.2 7.5
Japanese Continuers 2020 671 71.1 43.7 21.0 5.2 1.3
2019 617 72.3 39.7 17.8 3.7 0.8
Japanese Extension 2020 163 55.8 28.2 11.0 0.6 0.6
2019 138 53.6 31.2 10.1 0.7
Korean Beginners 2020 127 81.9 46.5 11.8 5.5 1.6
2019 116 75.9 42.2 19.0 4.3 1.7
Latin Continuers 2020 142 50.0 11.3 4.2
2019 131 48.9 10.7 2.3
Latin Extension 2020 104 13.5 2.9
2019 83 22.9 3.6
Modern Greek Beginners 2020 70 60.0 20.0 10.0 1.4
2019 87 63.2 25.3 10.3 3.4

48
Percentage of students with HSC mark less than:
Course Year Number 45 40 35 30 25
Modern Greek Continuers 2020 72 55.6 19.4 4.2
2019 80 52.5 21.3 3.8 1.3
Spanish Beginners 2020 328 86.0 58.8 32.0 12.8 2.4
2019 259 82.2 63.7 36.3 16.2 4.6
Spanish Continuers 2020 164 90.2 48.8 19.5 1.8 0.6
2019 172 93.0 52.9 18.6 2.3 1.2
Spanish Extension 2020 53 71.7 24.5 1.9 1.9 1.9
2019 48 75.0 25.0 6.3
Vietnamese Continuers 2020 190 89.5 36.3 5.8 1.1 0.5
2019 175 92.0 30.9 8.0 2.3 1.7
Automotive Exam 2020 237 97.5 86.1 54.9 21.1 4.6
2019 259 96.1 80.7 56.8 18.5 2.7
Business Services Exam 2020 1,155 95.6 69.5 38.0 13.0 2.9
2019 1,119 94.2 62.4 22.5 4.8 1.3
Construction Exam 2020 1,741 94.5 57.9 22.2 7.0 1.0
2019 1,614 98.6 74.1 32.5 9.3 0.6
Electrotechnology Exam 2020 223 97.3 81.6 41.3 4.5 0.4
2019 239 98.3 84.5 44.8 16.7
Entertainment Industry Exam 2020 713 87.0 51.3 15.3 3.2 0.4
2019 735 90.9 58.0 22.0 5.3 0.4
Financial Services Exam 2020 80 96.3 71.3 32.5 1.3
2019 62 98.4 67.7 46.8 4.8 3.2
Hospitality Exam 2020 4,337 96.4 69.2 32.5 7.0 1.0
2019 4,518 96.3 66.7 35.5 11.2 2.3
Human Services Exam 2020 705 99.3 86.8 53.3 8.8 0.4
2019 735 99.5 92.5 53.6 12.8 1.6
Information & Digital Technology Exam 2020 466 96.1 70.0 19.5 3.9 1.3
2019 483 98.3 74.3 20.7 3.1 0.6
Metal & Engineering Exam 2020 255 98.8 86.7 58.0 26.3 5.1
2019 276 99.6 94.9 66.3 32.2 7.6
Primary Industries Exam 2020 520 97.5 78.8 29.2 5.4 1.3
2019 567 94.9 74.8 25.6 2.5 0.4
Retail Services Exam 2020 825 99.5 91.6 47.2 16.5 1.5
2019 841 99.2 87.3 47.7 15.1 1.5
Tourism, Travel & Events Exam 2020 161 97.5 80.1 23.6 0.6
2019 188 98.4 82.4 34.6 3.2
49Appendix – Table A4 Distributions of HSC marks by course: 2019 and 2020

50
Table A5 Distributions of scaled marks by course: 2019 and 2020
Notes: (i) The Number column shows the number of students who completed the course in the given year.
(ii) Columns 45, 40, 35, 30, 25, 20 and 15 show the percentage of the course candidature with a scaled mark less than the specified mark.
(iii) The table excludes courses with less than 40 students in either year.
Percentage of students with scaled mark less than:
Course Year Number 45 40 35 30 25 20 15
Aboriginal Studies 2020 653 100.0 96.8 89.6 84.4 79.0 72.7 60.0
2019 699 100.0 95.4 89.6 84.5 77.1 69.8 61.9
Agriculture 2020 1,470 99.7 95.9 90.1 81.6 68.6 55.8 42.1
2019 1,579 99.9 95.3 88.9 80.2 70.9 57.8 43.4
Ancient History 2020 7,164 98.7 93.0 83.4 70.7 55.5 40.4 26.2
2019 7,233 98.8 92.8 82.5 68.1 52.6 36.7 23.9
Biology 2020 18,633 98.7 91.9 79.6 62.8 45.4 29.0 15.5
2019 18,667 98.9 92.4 79.8 62.8 45.9 29.5 16.0
Business Studies 2020 17,877 99.1 93.0 81.0 67.2 53.2 38.6 24.8
2019 17,586 99.3 92.7 81.0 67.2 52.7 38.2 24.1
Chemistry 2020 10,137 95.1 77.8 58.5 41.0 25.4 13.9 5.8
2019 10,277 95.8 77.9 57.1 39.7 26.4 15.7 7.6
Community & Family Studies 2020 8,774 100.0 98.6 92.4 81.9 69.5 55.1 39.7
2019 8,406 100.0 98.3 92.1 82.2 69.7 55.4 40.4
Dance 2020 914 98.7 94.6 83.6 71.0 57.5 42.0 28.4
2019 969 99.3 92.8 83.1 70.5 55.4 40.6 24.9
Design & Technology 2020 3,484 98.8 93.9 86.0 74.1 61.0 45.2 29.4
2019 3,221 99.3 94.7 86.6 74.1 59.8 43.4 27.2
Drama 2020 3,902 97.3 90.6 81.0 69.8 55.9 40.1 24.3
2019 4,080 97.7 91.6 82.2 70.2 56.4 40.7 24.9
Earth & Environmental Science 2020 2,117 99.2 94.7 84.6 71.8 55.8 40.2 26.2
2019 2,033 99.3 95.1 85.1 71.7 55.4 39.7 25.7
Economics 2020 5,010 96.0 78.0 55.3 35.0 21.7 13.1 6.7
2019 5,100 96.7 78.6 56.0 36.8 22.7 13.5 6.6
Engineering Studies 2020 2,313 99.5 93.4 80.6 64.2 46.5 28.1 14.9
2019 2,257 98.5 92.9 80.0 65.5 46.8 29.1 14.5
English Studies Exam 2020 1,274 100.0 99.8 98.7 89.6
2019 993 100.0 99.9 99.1 96.2 86.8
English Standard 2020 30,914 99.9 99.3 96.3 87.6 71.9 49.8 28.7
2019 30,228 99.9 99.1 95.7 87.5 71.8 50.6 28.7
English Advanced 2020 24,773 97.4 82.1 58.7 34.9 17.4 7.2 2.5
2019 25,251 97.5 83.6 60.1 37.1 19.4 9.0 3.4
English EAL/D 2020 2,022 98.7 94.9 86.1 74.9 64.5 49.9 33.4
2019 2,138 98.6 94.0 85.9 74.2 59.3 44.6 29.9
English Extension 1 2020 3,551 94.3 68.0 35.9 14.6 5.4 2.1 0.7
2019 3,490 93.6 68.5 37.5 15.2 5.2 1.5 0.5
English Extension 2 2020 1,380 91.4 68.3 37.2 16.3 5.5 1.2
2019 1,326 89.7 66.7 42.4 18.3 5.5 1.3 0.2
Food Technology 2020 3,376 99.9 96.6 89.1 80.3 68.5 54.9 42.1
2019 3,068 99.5 95.7 88.0 78.5 66.2 52.6 38.3
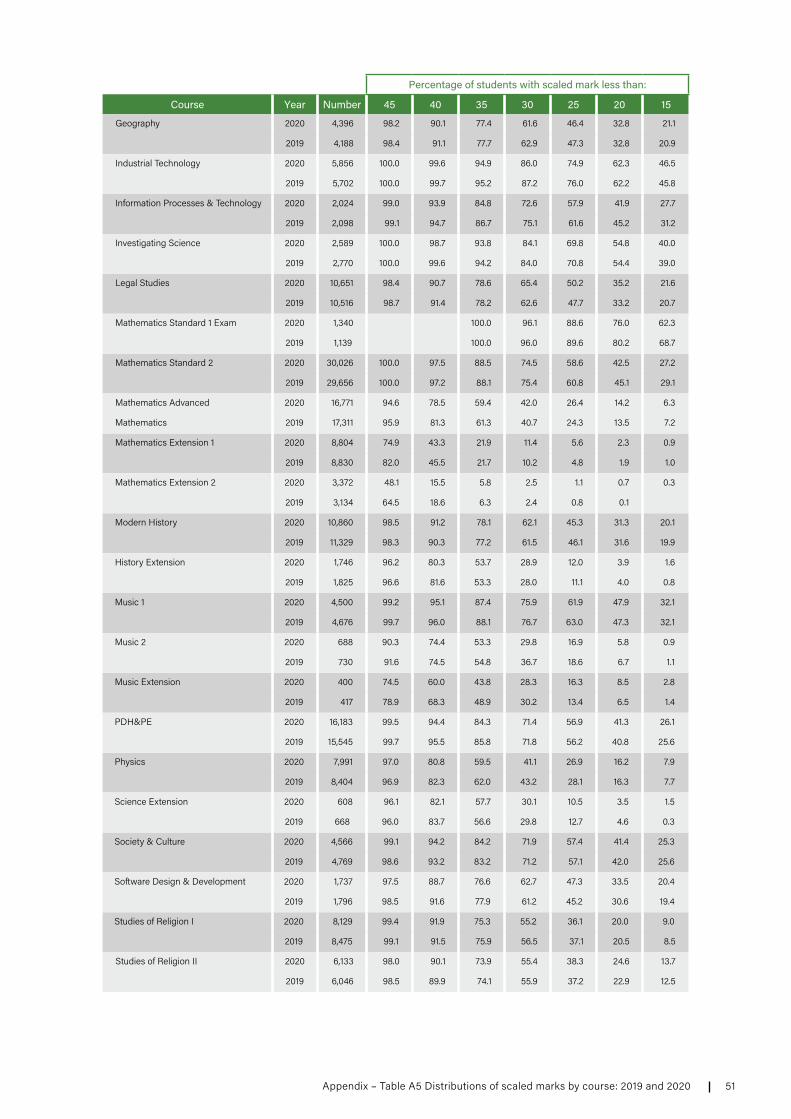
51Appendix – Table A5 Distributions of scaled marks by course: 2019 and 2020
Percentage of students with scaled mark less than:
Course Year Number 45 40 35 30 25 20 15
Geography 2020 4,396 98.2 90.1 77.4 61.6 46.4 32.8 21.1
2019 4,188 98.4 91.1 77.7 62.9 47.3 32.8 20.9
Industrial Technology 2020 5,856 100.0 99.6 94.9 86.0 74.9 62.3 46.5
2019 5,702 100.0 99.7 95.2 87.2 76.0 62.2 45.8
Information Processes & Technology 2020 2,024 99.0 93.9 84.8 72.6 57.9 41.9 27.7
2019 2,098 99.1 94.7 86.7 75.1 61.6 45.2 31.2
Investigating Science 2020 2,589 100.0 98.7 93.8 84.1 69.8 54.8 40.0
2019 2,770 100.0 99.6 94.2 84.0 70.8 54.4 39.0
Legal Studies 2020 10,651 98.4 90.7 78.6 65.4 50.2 35.2 21.6
2019 10,516 98.7 91.4 78.2 62.6 47.7 33.2 20.7
Mathematics Standard 1 Exam 2020 1,340 100.0 96.1 88.6 76.0 62.3
2019 1,139 100.0 96.0 89.6 80.2 68.7
Mathematics Standard 2 2020 30,026 100.0 97.5 88.5 74.5 58.6 42.5 27.2
2019 29,656 100.0 97.2 88.1 75.4 60.8 45.1 29.1
Mathematics Advanced 2020 16,771 94.6 78.5 59.4 42.0 26.4 14.2 6.3
Mathematics 2019 17,311 95.9 81.3 61.3 40.7 24.3 13.5 7.2
Mathematics Extension 1 2020 8,804 74.9 43.3 21.9 11.4 5.6 2.3 0.9
2019 8,830 82.0 45.5 21.7 10.2 4.8 1.9 1.0
Mathematics Extension 2 2020 3,372 48.1 15.5 5.8 2.5 1.1 0.7 0.3
2019 3,134 64.5 18.6 6.3 2.4 0.8 0.1
Modern History 2020 10,860 98.5 91.2 78.1 62.1 45.3 31.3 20.1
2019 11,329 98.3 90.3 77.2 61.5 46.1 31.6 19.9
History Extension 2020 1,746 96.2 80.3 53.7 28.9 12.0 3.9 1.6
2019 1,825 96.6 81.6 53.3 28.0 11.1 4.0 0.8
Music 1 2020 4,500 99.2 95.1 87.4 75.9 61.9 47.9 32.1
2019 4,676 99.7 96.0 88.1 76.7 63.0 47.3 32.1
Music 2 2020 688 90.3 74.4 53.3 29.8 16.9 5.8 0.9
2019 730 91.6 74.5 54.8 36.7 18.6 6.7 1.1
Music Extension 2020 400 74.5 60.0 43.8 28.3 16.3 8.5 2.8
2019 417 78.9 68.3 48.9 30.2 13.4 6.5 1.4
PDH&PE 2020 16,183 99.5 94.4 84.3 71.4 56.9 41.3 26.1
2019 15,545 99.7 95.5 85.8 71.8 56.2 40.8 25.6
Physics 2020 7,991 97.0 80.8 59.5 41.1 26.9 16.2 7.9
2019 8,404 96.9 82.3 62.0 43.2 28.1 16.3 7.7
Science Extension 2020 608 96.1 82.1 57.7 30.1 10.5 3.5 1.5
2019 668 96.0 83.7 56.6 29.8 12.7 4.6 0.3
Society & Culture 2020 4,566 99.1 94.2 84.2 71.9 57.4 41.4 25.3
2019 4,769 98.6 93.2 83.2 71.2 57.1 42.0 25.6
Software Design & Development 2020 1,737 97.5 88.7 76.6 62.7 47.3 33.5 20.4
2019 1,796 98.5 91.6 77.9 61.2 45.2 30.6 19.4
Studies of Religion I 2020 8,129 99.4 91.9 75.3 55.2 36.1 20.0 9.0
2019 8,475 99.1 91.5 75.9 56.5 37.1 20.5 8.5
Studies of Religion II 2020 6,133 98.0 90.1 73.9 55.4 38.3 24.6 13.7
2019 6,046 98.5 89.9 74.1 55.9 37.2 22.9 12.5
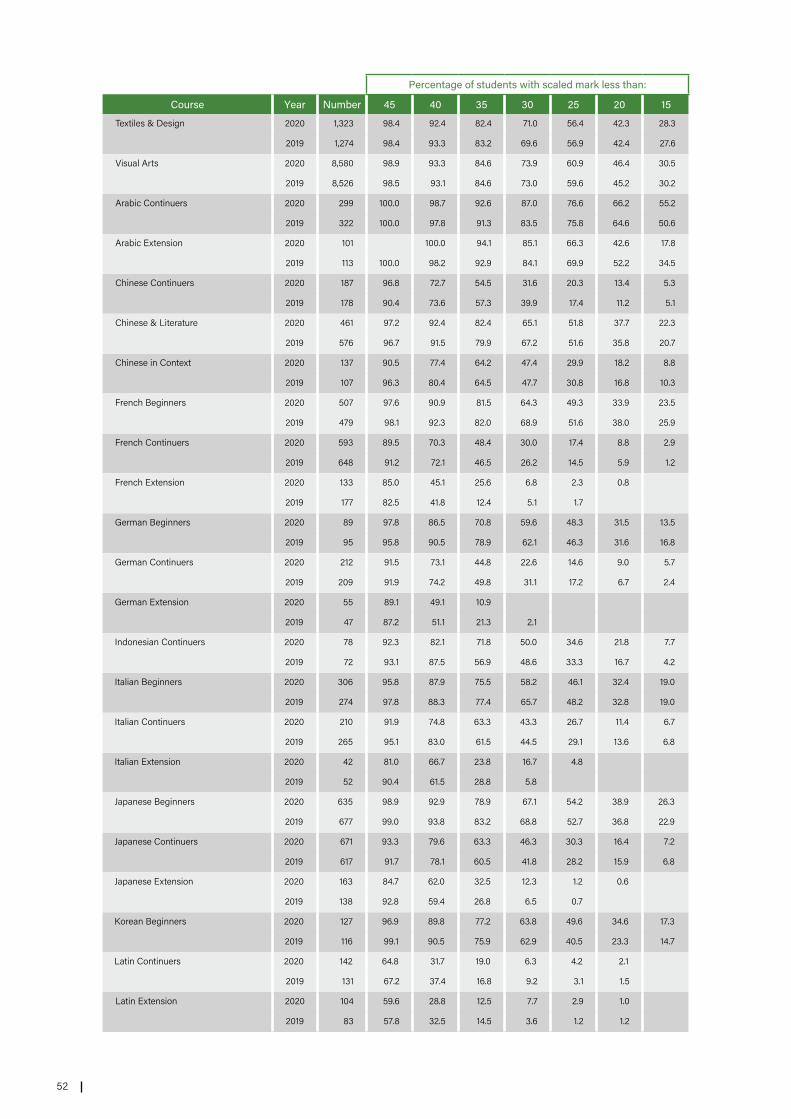
52
Percentage of students with scaled mark less than:
Course Year Number 45 40 35 30 25 20 15
Textiles & Design 2020 1,323 98.4 92.4 82.4 71.0 56.4 42.3 28.3
2019 1,274 98.4 93.3 83.2 69.6 56.9 42.4 27.6
Visual Arts 2020 8,580 98.9 93.3 84.6 73.9 60.9 46.4 30.5
2019 8,526 98.5 93.1 84.6 73.0 59.6 45.2 30.2
Arabic Continuers 2020 299 100.0 98.7 92.6 87.0 76.6 66.2 55.2
2019 322 100.0 97.8 91.3 83.5 75.8 64.6 50.6
Arabic Extension 2020 101 100.0 94.1 85.1 66.3 42.6 17.8
2019 113 100.0 98.2 92.9 84.1 69.9 52.2 34.5
Chinese Continuers 2020 187 96.8 72.7 54.5 31.6 20.3 13.4 5.3
2019 178 90.4 73.6 57.3 39.9 17.4 11.2 5.1
Chinese & Literature 2020 461 97.2 92.4 82.4 65.1 51.8 37.7 22.3
2019 576 96.7 91.5 79.9 67.2 51.6 35.8 20.7
Chinese in Context 2020 137 90.5 77.4 64.2 47.4 29.9 18.2 8.8
2019 107 96.3 80.4 64.5 47.7 30.8 16.8 10.3
French Beginners 2020 507 97.6 90.9 81.5 64.3 49.3 33.9 23.5
2019 479 98.1 92.3 82.0 68.9 51.6 38.0 25.9
French Continuers 2020 593 89.5 70.3 48.4 30.0 17.4 8.8 2.9
2019 648 91.2 72.1 46.5 26.2 14.5 5.9 1.2
French Extension 2020 133 85.0 45.1 25.6 6.8 2.3 0.8
2019 177 82.5 41.8 12.4 5.1 1.7
German Beginners 2020 89 97.8 86.5 70.8 59.6 48.3 31.5 13.5
2019 95 95.8 90.5 78.9 62.1 46.3 31.6 16.8
German Continuers 2020 212 91.5 73.1 44.8 22.6 14.6 9.0 5.7
2019 209 91.9 74.2 49.8 31.1 17.2 6.7 2.4
German Extension 2020 55 89.1 49.1 10.9
2019 47 87.2 51.1 21.3 2.1
Indonesian Continuers 2020 78 92.3 82.1 71.8 50.0 34.6 21.8 7.7
2019 72 93.1 87.5 56.9 48.6 33.3 16.7 4.2
Italian Beginners 2020 306 95.8 87.9 75.5 58.2 46.1 32.4 19.0
2019 274 97.8 88.3 77.4 65.7 48.2 32.8 19.0
Italian Continuers 2020 210 91.9 74.8 63.3 43.3 26.7 11.4 6.7
2019 265 95.1 83.0 61.5 44.5 29.1 13.6 6.8
Italian Extension 2020 42 81.0 66.7 23.8 16.7 4.8
2019 52 90.4 61.5 28.8 5.8
Japanese Beginners 2020 635 98.9 92.9 78.9 67.1 54.2 38.9 26.3
2019 677 99.0 93.8 83.2 68.8 52.7 36.8 22.9
Japanese Continuers 2020 671 93.3 79.6 63.3 46.3 30.3 16.4 7.2
2019 617 91.7 78.1 60.5 41.8 28.2 15.9 6.8
Japanese Extension 2020 163 84.7 62.0 32.5 12.3 1.2 0.6
2019 138 92.8 59.4 26.8 6.5 0.7
Korean Beginners 2020 127 96.9 89.8 77.2 63.8 49.6 34.6 17.3
2019 116 99.1 90.5 75.9 62.9 40.5 23.3 14.7
Latin Continuers 2020 142 64.8 31.7 19.0 6.3 4.2 2.1
2019 131 67.2 37.4 16.8 9.2 3.1 1.5
Latin Extension 2020 104 59.6 28.8 12.5 7.7 2.9 1.0
2019 83 57.8 32.5 14.5 3.6 1.2 1.2
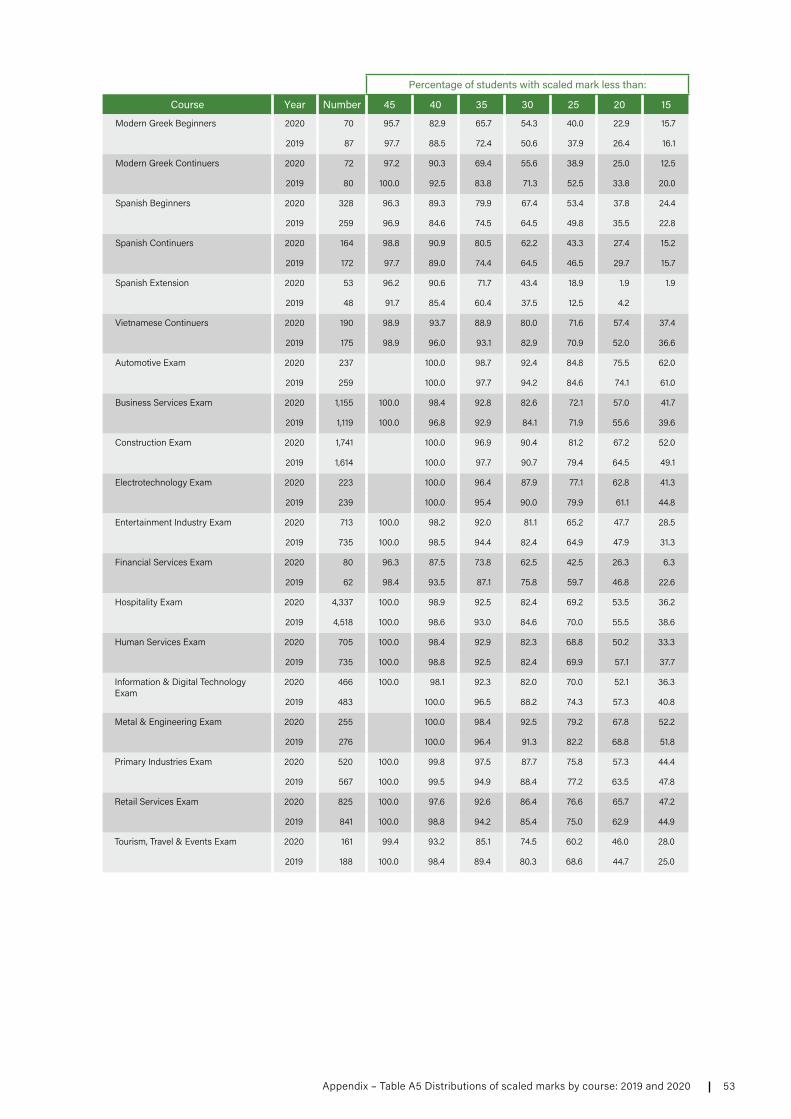
53Appendix – Table A5 Distributions of scaled marks by course: 2019 and 2020
Percentage of students with scaled mark less than:
Course Year Number 45 40 35 30 25 20 15
Modern Greek Beginners 2020 70 95.7 82.9 65.7 54.3 40.0 22.9 15.7
2019 87 97.7 88.5 72.4 50.6 37.9 26.4 16.1
Modern Greek Continuers 2020 72 97.2 90.3 69.4 55.6 38.9 25.0 12.5
2019 80 100.0 92.5 83.8 71.3 52.5 33.8 20.0
Spanish Beginners 2020 328 96.3 89.3 79.9 67.4 53.4 37.8 24.4
2019 259 96.9 84.6 74.5 64.5 49.8 35.5 22.8
Spanish Continuers 2020 164 98.8 90.9 80.5 62.2 43.3 27.4 15.2
2019 172 97.7 89.0 74.4 64.5 46.5 29.7 15.7
Spanish Extension 2020 53 96.2 90.6 71.7 43.4 18.9 1.9 1.9
2019 48 91.7 85.4 60.4 37.5 12.5 4.2
Vietnamese Continuers 2020 190 98.9 93.7 88.9 80.0 71.6 57.4 37.4
2019 175 98.9 96.0 93.1 82.9 70.9 52.0 36.6
Automotive Exam 2020 237 100.0 98.7 92.4 84.8 75.5 62.0
2019 259 100.0 97.7 94.2 84.6 74.1 61.0
Business Services Exam 2020 1,155 100.0 98.4 92.8 82.6 72.1 57.0 41.7
2019 1,119 100.0 96.8 92.9 84.1 71.9 55.6 39.6
Construction Exam 2020 1,741 100.0 96.9 90.4 81.2 67.2 52.0
2019 1,614 100.0 97.7 90.7 79.4 64.5 49.1
Electrotechnology Exam 2020 223 100.0 96.4 87.9 77.1 62.8 41.3
2019 239 100.0 95.4 90.0 79.9 61.1 44.8
Entertainment Industry Exam 2020 713 100.0 98.2 92.0 81.1 65.2 47.7 28.5
2019 735 100.0 98.5 94.4 82.4 64.9 47.9 31.3
Financial Services Exam 2020 80 96.3 87.5 73.8 62.5 42.5 26.3 6.3
2019 62 98.4 93.5 87.1 75.8 59.7 46.8 22.6
Hospitality Exam 2020 4,337 100.0 98.9 92.5 82.4 69.2 53.5 36.2
2019 4,518 100.0 98.6 93.0 84.6 70.0 55.5 38.6
Human Services Exam 2020 705 100.0 98.4 92.9 82.3 68.8 50.2 33.3
2019 735 100.0 98.8 92.5 82.4 69.9 57.1 37.7
Information & Digital Technology Exam
2020 466 100.0 98.1 92.3 82.0 70.0 52.1 36.3
2019 483 100.0 96.5 88.2 74.3 57.3 40.8
Metal & Engineering Exam 2020 255 100.0 98.4 92.5 79.2 67.8 52.2
2019 276 100.0 96.4 91.3 82.2 68.8 51.8
Primary Industries Exam 2020 520 100.0 99.8 97.5 87.7 75.8 57.3 44.4
2019 567 100.0 99.5 94.9 88.4 77.2 63.5 47.8
Retail Services Exam 2020 825 100.0 97.6 92.6 86.4 76.6 65.7 47.2
2019 841 100.0 98.8 94.2 85.4 75.0 62.9 44.9
Tourism, Travel & Events Exam 2020 161 99.4 93.2 85.1 74.5 60.2 46.0 28.0
2019 188 100.0 98.4 89.4 80.3 68.6 44.7 25.0

54
Table A6 Courses that contribute to the ATAR (more than 10 units)
Notes: (i) This table shows the percentage of the course candidature who completed more than 10 units of ATAR courses and for whom all units of that course contributed to their ATAR.
(ii) The Number receiving ATAR column shows the number of students who did the course in 2020 or a previous year, and received an ATAR in 2020.
(iii) The ATAR students with > 10 units columns show the number and percentage of ATAR students who completed more than 10 units of ATAR courses.
(iv) The Percentage who counted course column shows the percentage of the ATAR students who completed more than 10 units of ATAR courses for whom all units of that course contributed towards their ATAR.
(v) The Maximum ATAR including the course column shows the maximum ATAR of any student doing the course in any year and including all units from that course in their ATAR calculation.
(vi) The table excludes courses with less than 10 students.
ATAR students with > 10 units
Course Number receiving ATAR Number Percentage Percentage who
counted courseMaximum ATAR
including the course
Aboriginal Studies 389 103 26 77 98.40
Agriculture 1,073 406 38 79 99.70
Ancient History 6,437 2,438 38 85 99.95
Biology 17,856 7,440 42 82 99.95
Business Studies 16,512 5,689 34 85 99.95
Chemistry 10,029 5,829 58 75 99.95
Community & Family Studies 7,140 2,065 29 88 98.20
Dance 795 227 29 65 99.05
Design & Technology 3,021 1,092 36 75 99.20
Drama 3,440 1,281 37 77 99.80
Earth & Environmental Science 1,903 634 33 83 99.55
Economics 4,965 2,567 52 76 99.95
Engineering Studies 2,225 1,095 49 71 99.85
English Studies Exam 516 103 20 100 80.30
English Standard 28,008 7,823 28 100 99.35
English Advanced 24,547 11,906 49 99 99.95
English EAL/D 1,823 570 31 100 99.95
English Extension 1 3,543 2,341 66 88 99.95
English Extension 2 1,372 820 60 86 99.95
Food Technology 2,654 824 31 87 98.35
Geography 4,043 1,606 40 84 99.90
Industrial Technology 4,074 1,254 31 74 96.90
Information Processes & Technology 1,858 770 41 73 99.95
Investigating Science 2,100 723 34 84 98.85
Legal Studies 10,065 3,762 37 85 99.95
Mathematics Standard 1 Exam 838 217 26 53 83.75
Mathematics Standard 2 27,399 8,013 29 72 99.50
Mathematics Advanced 15,897 8,739 55 72 99.95
Mathematics Extension 1 8,769 6,236 71 89 99.95
Mathematics Extension 2 3,363 1,798 53 98 99.95
Modern History 10,161 4,266 42 84 99.95
History Extension 1,747 1,400 80 83 99.95
Music 1 3,691 1,297 35 65 99.75
Music 2 676 474 70 66 99.95
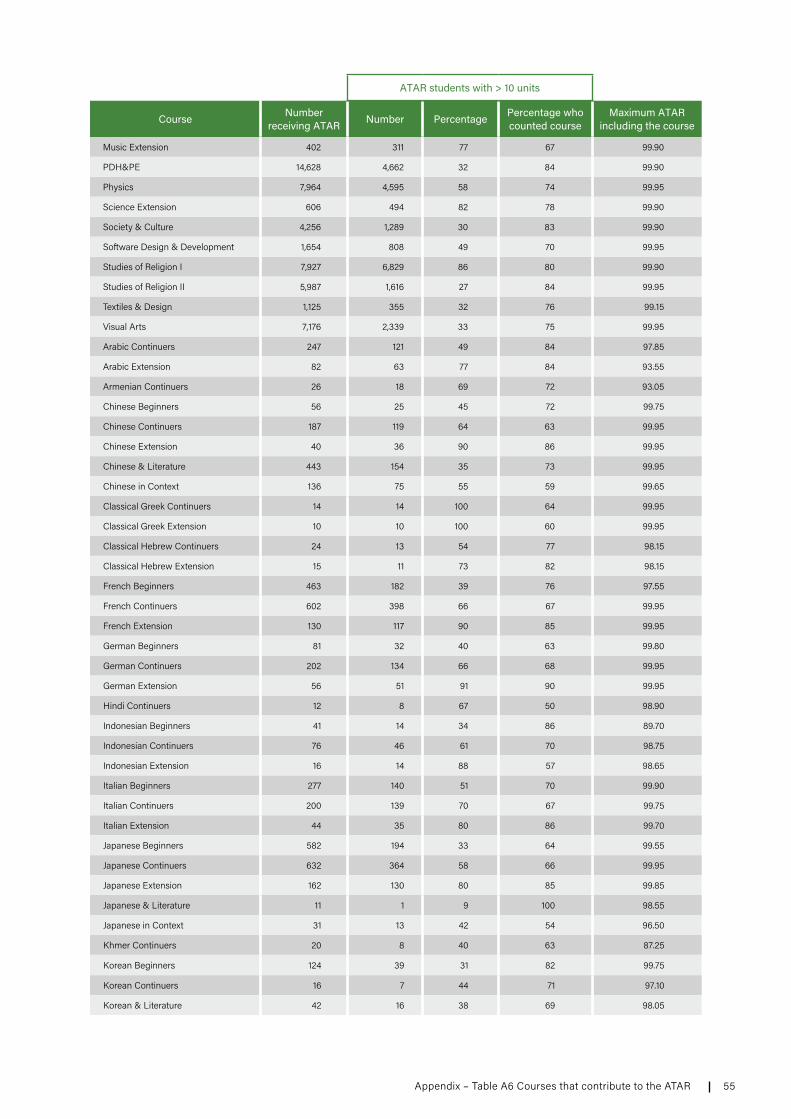
55Appendix – Table A6 Courses that contribute to the ATAR
ATAR students with > 10 units
Course Number receiving ATAR Number Percentage Percentage who
counted courseMaximum ATAR
including the course
Music Extension 402 311 77 67 99.90
PDH&PE 14,628 4,662 32 84 99.90
Physics 7,964 4,595 58 74 99.95
Science Extension 606 494 82 78 99.90
Society & Culture 4,256 1,289 30 83 99.90
Software Design & Development 1,654 808 49 70 99.95
Studies of Religion I 7,927 6,829 86 80 99.90
Studies of Religion II 5,987 1,616 27 84 99.95
Textiles & Design 1,125 355 32 76 99.15
Visual Arts 7,176 2,339 33 75 99.95
Arabic Continuers 247 121 49 84 97.85
Arabic Extension 82 63 77 84 93.55
Armenian Continuers 26 18 69 72 93.05
Chinese Beginners 56 25 45 72 99.75
Chinese Continuers 187 119 64 63 99.95
Chinese Extension 40 36 90 86 99.95
Chinese & Literature 443 154 35 73 99.95
Chinese in Context 136 75 55 59 99.65
Classical Greek Continuers 14 14 100 64 99.95
Classical Greek Extension 10 10 100 60 99.95
Classical Hebrew Continuers 24 13 54 77 98.15
Classical Hebrew Extension 15 11 73 82 98.15
French Beginners 463 182 39 76 97.55
French Continuers 602 398 66 67 99.95
French Extension 130 117 90 85 99.95
German Beginners 81 32 40 63 99.80
German Continuers 202 134 66 68 99.95
German Extension 56 51 91 90 99.95
Hindi Continuers 12 8 67 50 98.90
Indonesian Beginners 41 14 34 86 89.70
Indonesian Continuers 76 46 61 70 98.75
Indonesian Extension 16 14 88 57 98.65
Italian Beginners 277 140 51 70 99.90
Italian Continuers 200 139 70 67 99.75
Italian Extension 44 35 80 86 99.70
Japanese Beginners 582 194 33 64 99.55
Japanese Continuers 632 364 58 66 99.95
Japanese Extension 162 130 80 85 99.85
Japanese & Literature 11 1 9 100 98.55
Japanese in Context 31 13 42 54 96.50
Khmer Continuers 20 8 40 63 87.25
Korean Beginners 124 39 31 82 99.75
Korean Continuers 16 7 44 71 97.10
Korean & Literature 42 16 38 69 98.05
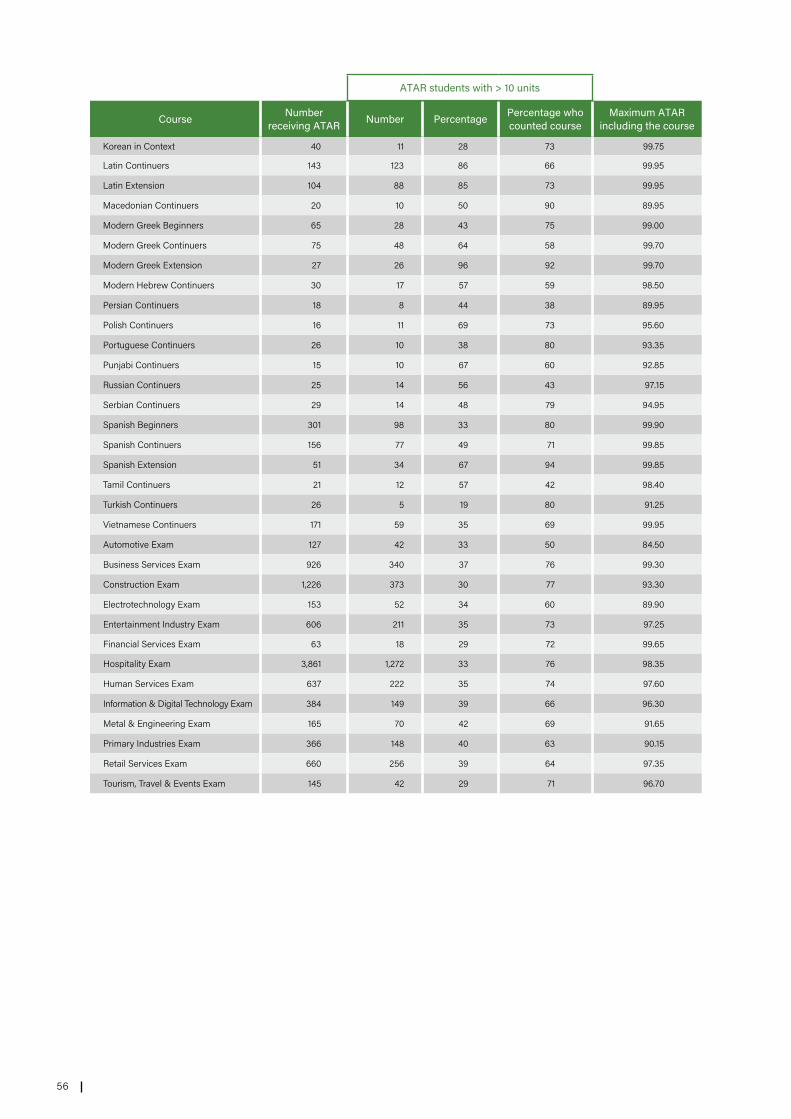
56
ATAR students with > 10 units
Course Number receiving ATAR Number Percentage Percentage who
counted courseMaximum ATAR
including the course
Korean in Context 40 11 28 73 99.75
Latin Continuers 143 123 86 66 99.95
Latin Extension 104 88 85 73 99.95
Macedonian Continuers 20 10 50 90 89.95
Modern Greek Beginners 65 28 43 75 99.00
Modern Greek Continuers 75 48 64 58 99.70
Modern Greek Extension 27 26 96 92 99.70
Modern Hebrew Continuers 30 17 57 59 98.50
Persian Continuers 18 8 44 38 89.95
Polish Continuers 16 11 69 73 95.60
Portuguese Continuers 26 10 38 80 93.35
Punjabi Continuers 15 10 67 60 92.85
Russian Continuers 25 14 56 43 97.15
Serbian Continuers 29 14 48 79 94.95
Spanish Beginners 301 98 33 80 99.90
Spanish Continuers 156 77 49 71 99.85
Spanish Extension 51 34 67 94 99.85
Tamil Continuers 21 12 57 42 98.40
Turkish Continuers 26 5 19 80 91.25
Vietnamese Continuers 171 59 35 69 99.95
Automotive Exam 127 42 33 50 84.50
Business Services Exam 926 340 37 76 99.30
Construction Exam 1,226 373 30 77 93.30
Electrotechnology Exam 153 52 34 60 89.90
Entertainment Industry Exam 606 211 35 73 97.25
Financial Services Exam 63 18 29 72 99.65
Hospitality Exam 3,861 1,272 33 76 98.35
Human Services Exam 637 222 35 74 97.60
Information & Digital Technology Exam 384 149 39 66 96.30
Metal & Engineering Exam 165 70 42 69 91.65
Primary Industries Exam 366 148 40 63 90.15
Retail Services Exam 660 256 39 64 97.35
Tourism, Travel & Events Exam 145 42 29 71 96.70

57Appendix – Table A7 ATAR distribution
Table A7 ATAR distribution
Note: (i) This table shows the number of students receiving each ATAR from 99.95 to 99.00 and the number corresponding to the stated ATAR ranges down to 30.00–30.95.
(ii) The median ATAR in 2020 was 70.15.
ATAR Number Number on or above
Percentage on or above
99.95 48 48 0.1
99.90 44 92 0.2
99.85 48 140 0.3
99.80 46 186 0.3
99.75 47 233 0.4
99.70 47 280 0.5
99.65 46 326 0.6
99.60 46 372 0.7
99.55 45 417 0.8
99.50 51 468 0.9
99.45 45 513 0.9
99.40 47 560 1.0
99.35 41 601 1.1
99.30 55 656 1.2
99.25 44 700 1.3
99.20 47 747 1.4
99.15 43 790 1.4
99.10 46 836 1.5
99.05 50 886 1.6
99.00 45 931 1.7
99.00 ‑ 99.95 931 931 1.7
98.00 ‑ 98.95 935 1,866 3.4
97.00 ‑ 97.95 937 2,803 5.1
96.00 ‑ 96.95 941 3,744 6.8
95.00 ‑ 95.95 923 4,667 8.5
94.00 ‑ 94.95 939 5,606 10.2
93.00 ‑ 93.95 945 6,551 11.9
92.00 ‑ 92.95 939 7,490 13.6
91.00 ‑ 91.95 928 8,418 15.3
90.00 ‑ 90.95 925 9,343 17.0
89.00 ‑ 89.95 945 10,288 18.7
88.00 ‑ 88.95 923 11,211 20.4
87.00 ‑ 87.95 935 12,146 22.1
86.00 ‑ 86.95 919 13,065 23.8
85.00 ‑ 85.95 941 14,006 25.5
84.00 ‑ 84.95 930 14,936 27.2
83.00 ‑ 83.95 919 15,855 28.9
82.00 ‑ 82.95 928 16,783 30.6
81.00 ‑ 81.95 915 17,698 32.2
80.00 ‑ 80.95 921 18,619 33.9
79.00 ‑ 79.95 912 19,531 35.6
78.00 ‑ 78.95 908 20,439 37.2
77.00 ‑ 77.95 905 21,344 38.9
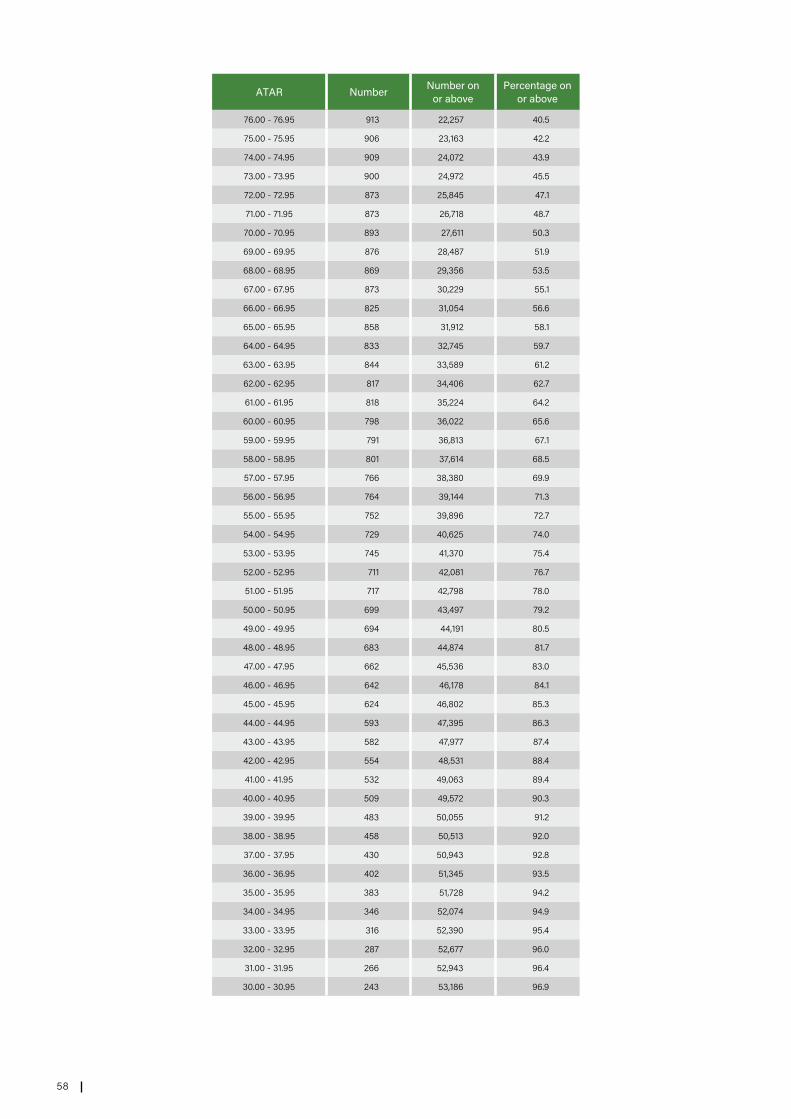
58
ATAR Number Number on or above
Percentage on or above
76.00 ‑ 76.95 913 22,257 40.5
75.00 ‑ 75.95 906 23,163 42.2
74.00 ‑ 74.95 909 24,072 43.9
73.00 ‑ 73.95 900 24,972 45.5
72.00 ‑ 72.95 873 25,845 47.1
71.00 ‑ 71.95 873 26,718 48.7
70.00 ‑ 70.95 893 27,611 50.3
69.00 ‑ 69.95 876 28,487 51.9
68.00 ‑ 68.95 869 29,356 53.5
67.00 ‑ 67.95 873 30,229 55.1
66.00 ‑ 66.95 825 31,054 56.6
65.00 ‑ 65.95 858 31,912 58.1
64.00 ‑ 64.95 833 32,745 59.7
63.00 ‑ 63.95 844 33,589 61.2
62.00 ‑ 62.95 817 34,406 62.7
61.00 ‑ 61.95 818 35,224 64.2
60.00 ‑ 60.95 798 36,022 65.6
59.00 ‑ 59.95 791 36,813 67.1
58.00 ‑ 58.95 801 37,614 68.5
57.00 ‑ 57.95 766 38,380 69.9
56.00 ‑ 56.95 764 39,144 71.3
55.00 ‑ 55.95 752 39,896 72.7
54.00 ‑ 54.95 729 40,625 74.0
53.00 ‑ 53.95 745 41,370 75.4
52.00 ‑ 52.95 711 42,081 76.7
51.00 ‑ 51.95 717 42,798 78.0
50.00 ‑ 50.95 699 43,497 79.2
49.00 ‑ 49.95 694 44,191 80.5
48.00 ‑ 48.95 683 44,874 81.7
47.00 ‑ 47.95 662 45,536 83.0
46.00 ‑ 46.95 642 46,178 84.1
45.00 ‑ 45.95 624 46,802 85.3
44.00 ‑ 44.95 593 47,395 86.3
43.00 ‑ 43.95 582 47,977 87.4
42.00 ‑ 42.95 554 48,531 88.4
41.00 ‑ 41.95 532 49,063 89.4
40.00 ‑ 40.95 509 49,572 90.3
39.00 ‑ 39.95 483 50,055 91.2
38.00 ‑ 38.95 458 50,513 92.0
37.00 ‑ 37.95 430 50,943 92.8
36.00 ‑ 36.95 402 51,345 93.5
35.00 ‑ 35.95 383 51,728 94.2
34.00 ‑ 34.95 346 52,074 94.9
33.00 ‑ 33.95 316 52,390 95.4
32.00 ‑ 32.95 287 52,677 96.0
31.00 ‑ 31.95 266 52,943 96.4
30.00 ‑ 30.95 243 53,186 96.9
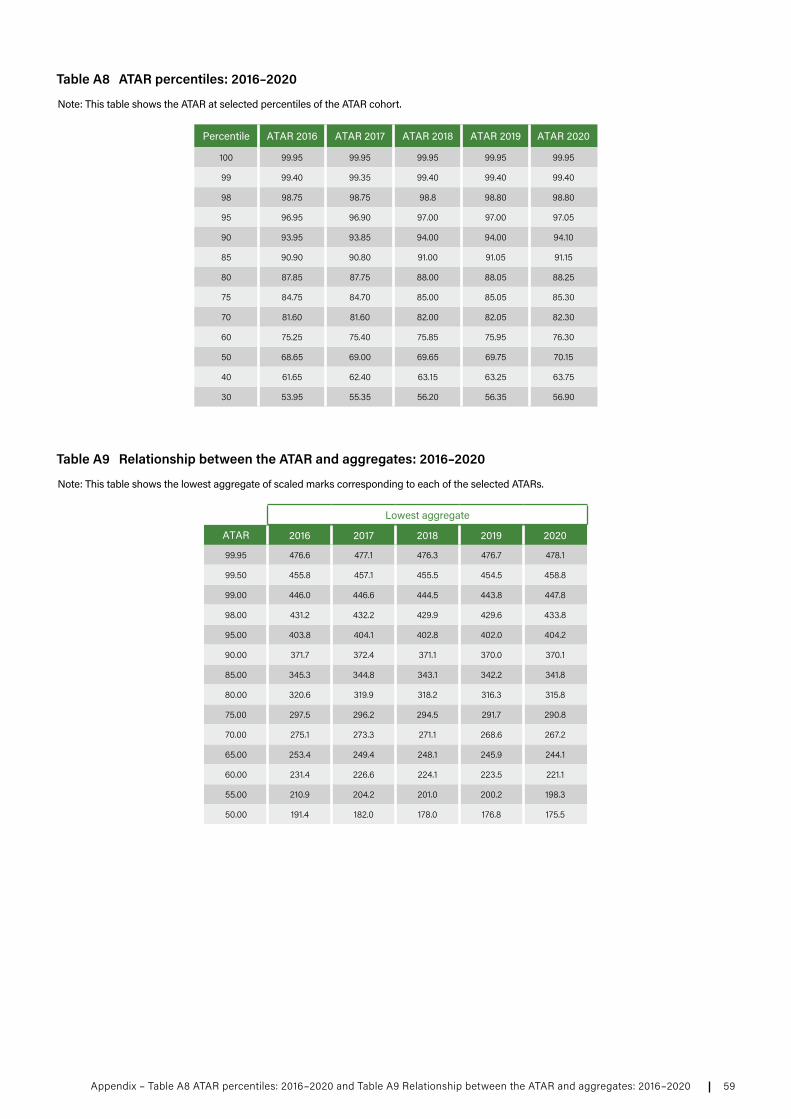
59Appendix – Table A8 ATAR percentiles: 2016–2020 and Table A9 Relationship between the ATAR and aggregates: 2016–2020
Table A8 ATAR percentiles: 2016–2020
Note: This table shows the ATAR at selected percentiles of the ATAR cohort.
Percentile ATAR 2016 ATAR 2017 ATAR 2018 ATAR 2019 ATAR 2020
100 99.95 99.95 99.95 99.95 99.95
99 99.40 99.35 99.40 99.40 99.40
98 98.75 98.75 98.8 98.80 98.80
95 96.95 96.90 97.00 97.00 97.05
90 93.95 93.85 94.00 94.00 94.10
85 90.90 90.80 91.00 91.05 91.15
80 87.85 87.75 88.00 88.05 88.25
75 84.75 84.70 85.00 85.05 85.30
70 81.60 81.60 82.00 82.05 82.30
60 75.25 75.40 75.85 75.95 76.30
50 68.65 69.00 69.65 69.75 70.15
40 61.65 62.40 63.15 63.25 63.75
30 53.95 55.35 56.20 56.35 56.90
Table A9 Relationship between the ATAR and aggregates: 2016–2020
Note: This table shows the lowest aggregate of scaled marks corresponding to each of the selected ATARs.
Lowest aggregate
ATAR 2016 2017 2018 2019 2020
99.95 476.6 477.1 476.3 476.7 478.1
99.50 455.8 457.1 455.5 454.5 458.8
99.00 446.0 446.6 444.5 443.8 447.8
98.00 431.2 432.2 429.9 429.6 433.8
95.00 403.8 404.1 402.8 402.0 404.2
90.00 371.7 372.4 371.1 370.0 370.1
85.00 345.3 344.8 343.1 342.2 341.8
80.00 320.6 319.9 318.2 316.3 315.8
75.00 297.5 296.2 294.5 291.7 290.8
70.00 275.1 273.3 271.1 268.6 267.2
65.00 253.4 249.4 248.1 245.9 244.1
60.00 231.4 226.6 224.1 223.5 221.1
55.00 210.9 204.2 201.0 200.2 198.3
50.00 191.4 182.0 178.0 176.8 175.5

60

61
Report on the Scaling of the 2020 NSW Higher School Certificate
© 2021 Universities Admissions Centre (NSW & ACT) Pty Ltd ACN 070 055 935 ABN 19 070 055 935
ISSN 1449‑8723
Published May 2021 Printer: IVE Print, Silverwater NSW
UAC and the Technical Committee on Scaling are the owners of the Copyright in this publication.
Apart from any fair dealing for the purpose of private study, criticism or review, or otherwise as permitted under the Copyright Act 1968, no part may be reproduced by any process without UAC’s written permission. Enquiries should be addressed to the Managing Director, UAC.
UAC and the Technical Committee on Scaling endeavour to consider copyright requests on their individual merits. As UAC and the Technical Committee on Scaling does not endorse the use of ATAR calculators or other predictive applications, requests for the use of data for this purpose will generally not be granted.
UAC has no objection to schools and tertiary institutions reproducing the publication provided it is for use only within their own institution and this copyright statement is included. If the document is not reproduced in full, individual sections should not be reproduced out of context where information could be incomplete and/or misleading. Schools and tertiary institutions must ensure that this information is not transmitted to any other person or body without prior permission from UAC.
ATAR is a registered trademark of the Victorian Tertiary Admissions Centre on behalf of all Australian tertiary admissions centres.
About this publication
This report contains information on the calculation of the Australian Tertiary Admission Rank (ATAR) in 2020. It includes an overview of the HSC and the ATAR, a breakdown of the scaling process, analysis of HSC and ATAR statistics and notes on trends for the year.
Images
Good. Thanks. Media.
UAC disclaimerWhile UAC and the authors of this publication have used their best endeavours to ensure that information and analyses of information contained in this publication are correct, any use or reliance whatsoever on the publication by any person is that person’s responsibility and UAC and the authors of this publication disclaim any responsibility or liability in relation to that use or reliance.
Your privacyWhen you apply to the Universities Admissions Centre (NSW & ACT) (UAC) you provide a lot of personal information, sometimes including health information.
UAC values the privacy of your personal information and recognises the importance of protecting it. UAC is bound by the following legislation:
− Privacy and Personal Information Protection Act 1998 (NSW) − Privacy Act 1988 (Cth) − Health Records and Information Privacy Act 2002 (NSW).
This means that UAC must uphold the NSW State Information Protection Principles, the Australian Privacy Principles and the NSW Health Privacy Principles. UAC is committed to upholding these principles and has implemented policies and procedures to ensure they are met.
You can view UAC’s Privacy Policy and applicant declarations at uac.edu.au/privacy.

UACUniversities Admissions Centre (NSW & ACT) Pty Ltd
ABN 19 070 055 935 ACN 070 055 935Quad 2, 6 Parkview Drive, Sydney Olympic Park NSW Locked Bag 112, Silverwater NSW 2128T (+61 2) 9752 0200
uac.edu.au
uacinfo
uacinfo
uacinfo
ACCESS YOUR POTENTIAL.