report on the success of the california classified school
TRANSCRIPT

Report on the Success of the California Classified School Employee
Teacher Credentialing Program
Prepared for the
Commission on Teacher Credentialing
By William Rolland Ph.d. Lois Abel-Priester Ph.D. Amy Schutter MPA
May 24, 2021

2
Table of Contents
1 EXECUTIVE SUMMARY ...............................................................7
1.1 FINDINGS………………………………………………………………………... 7
1.1.1 Outcomes ........................................................................................................... 7
1.1.2 Satisfaction ........................................................................................................ 7
1.1.3 Implementation ................................................................................................ 8
1.1.4 Challenges And Confounding Variables ..................................................... 9
1.1.5 Potential Long-Term Impact .......................................................................... 10
1.2 DECISION ON THE SUCCESS OF THE CLASSIFIED PROGRAM .........................................11
1.3 RECOMMENDATIONS ..................................................................................................11
2 INTRODUCTION ........................................................................13
2.1 CALIFORNIA CLASSIFIED EMPLOYEE TEACHER CREDENTIALING PROGRAM .................13
2.2 EVALUATION OVERVIEW .............................................................................................14
2.2.1 Required Program Evaluation ....................................................................... 14
2.2.2 Objectives .......................................................................................................... 14
2.2.3 How To Read This Report .............................................................................. 15
2.2.4 Interpretation Of Graphs And Data ............................................................. 15
3 METHODS ..................................................................................17
3.1 EVALUATION DESIGN ..................................................................................................17
3.2 LOGIC MODEL .............................................................................................................18
3.3 PHASES AND TIMING ...................................................................................................19
3.4 DEVELOPMENT OF DATA COLLECTION TOOLS ............................................................19
3.5 SAMPLING STRATEGIES ...............................................................................................20
3.5.1 Sampling Of Qualitative Data ........................................................................ 20
3.5.2 Sampling Of Quantitative Data ..................................................................... 20
3.6 DATA ANALYSIS .........................................................................................................21
3.6.1 Analysis Of Qualitative Data ......................................................................... 21
3.6.2 Analysis Of Quantitative Data ...................................................................... 22

3
3.7 RELIABILITY AND VALIDITY OF RESULTS .....................................................................23
4 FINDINGS ...................................................................................24
4.1 DEMOGRAPHICS ..........................................................................................................24
4.2 IMPLEMENTATION (INPUTS) ........................................................................................27
4.2.1 Section Summary ............................................................................................. 27
4.2.2 Program Expectations ..................................................................................... 30
4.2.3 Program Management ..................................................................................... 30
4.2.4 Addressing Areas of Teacher Shortage ...................................................... 35
4.2.5 Program Recruitment and Monitoring ........................................................ 39
4.2.6 Collaboration Between Classified Programs And IHE ............................. 44
4.2.7 Financial Support For Classified Participants ........................................... 47
4.2.8 Perceptions Of Fund Utilization ................................................................... 49
4.2.9 Areas Where Classified Program Funds Were Used ................................. 51
4.2.10 Individualized (Non-Financial) Support For Classified Participants .... 51
4.3 CHALLENGES (CONFOUNDING VARIABLES) .................................................................56
4.3.1 Section Summary ............................................................................................. 56
4.3.2 Challenges In Recruitment For/Joining Classified Programs ................ 58
4.3.3 Challenges Of The Classified Program And IHE Collaboration ............. 63
4.3.4 Challenges To Retention/Remaining In The Classified Program .......... 64
4.3.5 Financial Challenges ........................................................................................ 68
4.3.6 Time Challenges For Participants ................................................................ 71
4.3.7 Impact Of Covid-19 ......................................................................................... 73
4.4 SATISFACTION (OUTPUTS) ..........................................................................................81
4.4.1 Section Summary ............................................................................................. 81
4.4.2 Participant Satisfaction With The Classified Program ............................ 82
4.4.3 Manager Satisfaction With The Classified Program ................................. 84
4.4.4 Comparison Of Participant And Manager Satisfaction ........................... 87
4.5 OUTCOMES .................................................................................................................90
4.5.1 Section Summary ............................................................................................. 90
4.5.2 Participant Intention To Become A Fully Credentialed California Teacher 90
4.5.3 Beginning And Current Goal Comparisons ................................................ 91
4.5.4 Intention to Continue With Or Without Support ...................................... 91

4
4.5.5 Likelihood Participants Take A Teaching Job In District ........................ 92
4.5.6 Reasons For Not Taking A Teaching Position In District........................ 92
4.5.7 Participants Leaving Before Obtaining Teaching Position Or Credential 94
4.6 IMPACT .......................................................................................................................94
4.6.1 Section Summary ............................................................................................. 95
4.6.2 Aspects Of Life Improved Because Of Classified Program .................... 95
4.7 NEEDS ASSESSMENT ....................................................................................................97
4.7.1 Section Summary ............................................................................................. 97
4.7.2 Manager Needs Assessment .......................................................................... 97
4.7.3 Participant Needs Assessment ...................................................................... 101
5 CONCLUSIONS ...........................................................................103
5.1 JUSTIFICATION OF CONCLUSIONS ...............................................................................103
5.2 DECISIONS REGARDING THE SUCCESS OF THE CLASSIFIED PROGRAM..........................103
6 RECOMMENDATIONS FROM THE EVALUATION TEAM ..............104
7 LIMITATIONS OF THE EVALUATION .........................................106
8 APPENDIX A: CODEBOOK ..........................................................107
9 APPENDIX B: FOCUS GROUP QUESTIONS ...................................109
10 APPENDIX C: IN-DEPTH INTERVIEW GUIDES .........................113
11 APPENDIX D: LIST OF ADDITIONAL JOBS HELD BY
PARTICIPANTS ......................................................................116
12 REFERENCES: .........................................................................118

5
Table of Tables
Table 1: Phases of the Classified Program Evaluation ........................................................... 19
Table 2: Distribution of ethnicity and gender among survey respondents ...................... 24
Table 3: Number of survey participants from Classified Programs ................................... 25
Table 4: Change in working hours due to COVID-19.............................................................. 74
Table 5: Manager rating of suggested improvements in rank-order .................................. 99
Table 6: Participant rating of suggested improvement in rank-order .............................. 101
Table 7: List of additional jobs participants reported ......................................................... 116
Table of Figures
Figure 1: Mixed methods evaluation plan ................................................................................. 17
Figure 2: Logic model of the Classified Program evaluation ................................................ 18
Figure 3: Participants teaching areas and aligned credential ............................................... 26
Figure 4: Length of time as Classified Program managers .................................................... 32
Figure 5: Box-&-Whisker plot - Time spent managing the Classified Program ................. 34
Figure 6: Histogram - Time spent managing the Classified Program ................................. 34
Figure 7: Manager's ability to balance professional responsibilities. ................................. 35
Figure 8: Information shared about teacher shortage areas ................................................ 36
Figure 9: Participant and manager knowledge of service area teacher shortages ........... 37
Figure 10: Participant awareness and teaching intention in areas of teacher shortage . 38
Figure 11: Distribution of participant credential and teaching field .................................. 39
Figure 12: Methods used for recruitment ................................................................................. 41
Figure 13: Distribution of methods that managers use to monitor participant progress
........................................................................................................................................ 43
Figure 14: Frequency of checks on participant progress ...................................................... 44
Figure 15: Manager and participant perceptions about program-IHE collaboration ...... 46
Figure 16: Managers agreement regarding IHE partnerships ............................................... 47
Figure 17: Financial supports participants use to obtain a credential ............................... 49
Figure 18: Box-&-Whisker Plot - % experiencing all financial supports .............................. 50
Figure 19: Histogram - % experiencing all financial supports .............................................. 50
Figure 20: Areas Classified Program funds were used .......................................................... 51
Figure 21: Individualized (non-financial) support provisions/experiences ...................... 53
Figure 22: Program supports that were not provided/experienced ................................... 54
Figure 23: Comparison regarding most effective supports .................................................. 55
Figure 24: Recruitment challenges for managers .................................................................... 60
Figure 25: Retention challenges for managers ......................................................................... 61
Figure 26: Comparison of manager and participant ratings regarding challenges to
recruiting/joining ....................................................................................................... 62
Figure 27: Manager belief regarding challenges working with IHEs ................................... 63
Figure 28: Distribution - Manager challenges to the retention of participants ................ 66

6
Figure 29: Distribution - Participant challenges to remaining in the program ................ 67
Figure 30: Comparison of manager and participant ratings regarding challenges to
retention/remaining .................................................................................................... 67
Figure 31: Distribution - Financial challenges for participants during enrollment ......... 69
Figure 32: Frequency of manager beliefs about participant challenges ............................ 70
Figure 33: Hours participants worked on classified program activities ............................ 72
Figure 34: Additional weekly hours participants worked additional job .......................... 72
Figure 35: Manager & participant comparison of COVID-19 impact .................................. 73
Figure 36: Changes in ratings for program success resulting from Covid-19 .................. 75
Figure 37: Comparison of changes in participant satisfaction resulting from COVID-19
.......................................................................................................................................... 76
Figure 38: Comparison of changes in participant satisfaction resulting from COVID-19
(cont.) ............................................................................................................................. 77
Figure 39: Change in ratings of participants challenges resulting from Covid-19 .......... 78
Figure 40: Comparison of changes in participant “challenges experienced” resulting
from COVID-19............................................................................................................ 79
Figure 41: Changes in manager perceptions of challenges faced by participants
resulting from Covid-19 ............................................................................................ 80
Figure 42: Extent participants would recommend Classified Program .............................. 82
Figure 43: Distribution – Participant ratings of program satisfaction ............................... 83
Figure 44: Extent managers rate recruiting/retaining and facilitating participant
progress ........................................................................................................................ 84
Figure 45: Manager satisfaction with the Classified Program .............................................. 85
Figure 46: Distribution – Manager ratings regarding program success ............................. 86
Figure 47: Comparison of participant and manager satisfaction with the program ...... 87
Figure 48: Distribution- Comparison of participant and manager satisfaction with the
program ........................................................................................................................ 88
Figure 49: Distribution- Comparison of participant and manager satisfaction with the
program (cont.) ........................................................................................................... 89
Figure 50: Participant intention to continue with or without support ............................... 91
Figure 51: Participants likelihood of teaching in district ...................................................... 92
Figure 52: Participant reasons for NOT taking a district teaching job ............................... 93
Figure 53: Box-&-Whisker Plot showing manager estimate of % leaving the program .... 94
Figure 54: Histogram showing manager estimate of % leaving the program ................... 94
Figure 55: Participants rating of lifestyle improvements ...................................................... 96
Figure 56: Percent of programs already offering suggested program improvements ... 98
Figure 57: Manager rating regarding improvements that would positively impact
program ...................................................................................................................... 100
Figure 58: Participant ratings regarding improvements that would positively impact
credential attainment .............................................................................................. 102

7
1 EXECUTIVE SUMMARY
California is faced with chronic teacher shortages, often most acutely visible in high-need fields and high-need schools. These disproportionately impact students of color and those from low-income families. Shortages are most dire in STEM, bilingual, and special education (Carver-Thomas et al., 2021). The California Classified School Employee Teacher Credentialing Program (Classified Program) aims to help meet the need for teachers by recruiting classified school employees into a program designed to "encourage them to enroll in teacher training programs and provide instructional service as teachers in public schools." Education Code 44393 (a) The Classified Program has shown promise in ameliorating the teacher shortage by facilitating participants earning nearly 800 credentials since the program's inception (California Commission on Teacher Credentialing, 2020).
Since 2016, to meet the need for diverse teachers in hard-to-hire subjects, California has dedicated $45 million to develop 42 Classified Programs across the state. The Governor’s Budget May Revision proposes to increase funding for the program from $25 million to $125 million, which will be available for five years (California Commission on Teacher Credentialing, May 14, 2021). These grant-funded programs were led by partnerships between local education agencies (LEAs) and colleges or universities (IHEs). While these programs aimed to assist all qualified classified staff employees moving into a credentialed teaching position, additional focus was placed on recruiting participants to meet the need in the highest-demand fields (STEM, bilingual, and special education teachers).
Shasta College, in partnership with Sinclair Research Group, conducted a mixed-methods evaluation of the Classified Program. Qualitative and quantitative data were collected from program managers, IHE liaisons, and classified participants using focus groups, in-depth interviews, and questionnaires. Targets examined were the program's implementation, successes and challenges, stakeholders' satisfaction, and program outcomes. The overarching goal of the evaluation was to determine if this program met the legislative goals. This report summarizes learnings gleaned from the evaluation and provides recommendations for improvement.
1.1 FINDINGS
1.1.1 Outcomes
The Classified Program initiative made progress toward moving classified staff into teaching roles. A survey was sent to a sample from the entire list of classified participants. Half of those responding to the participant survey were already teachers of record in classrooms, generally without a clear credential. Those participants who entered the program with a BA degree were generally more successful in obtaining a credential and receiving a teaching position. Virtually all program participants who are not already in the classroom intend to continue pursuing a teaching credential. In comparing the willingness of participants to continue to pursue their credential whether or not they received Classified Program support, the number of participants that said they would not continue to pursue a credential if support were not available Satisfaction

8
There is great appreciation for the Classified Program among all groups (program managers, program participants, and IHE partners). Program participants highly valued the support they received from the Classified Program, expressing deep gratitude for the financial support. The vast majority of participants believed the program was successful and would highly recommend the program to others interested in moving into teaching roles. Program Managers (LEA-appointed Classified Program Managers, hereafter referred to as “Managers”) were highly satisfied with the program overall and believe it effectively moved participants toward obtaining teaching credentials. Managers believe they successfully recruited participants and retained them in the program. However, this continues to be a very challenging aspect of their role. In addition to financial support, participants greatly appreciated the individualized (non-financial) support they received. In particular, they valued personal "check-ins," test preparation classes and working with groups of their peers. Managers agreed that these were the most effective support strategies. These were optional services offered by some programs, but not all. Maintaining continuous and frequent personal connections between managers and participants was especially valuable. The more the program "checked in" personally with participants, the more satisfied participants were with the program. Programs that evidenced strong interpersonal relationships and good communication elicited more positive feedback from stakeholders.
1.1.2 Implementation
Programs are making progress toward increasing the number of teachers of color and those in hard-to-hire areas (STEM, bilingual, and special education). Approximately 2/3 of those participating in the evaluation were participants of color. The areas of stated teacher shortage were closely aligned to the areas where participants reported they intended to teach. Managers were committed to recruiting classified staff of color and those interested in teaching hard-to-hire subjects, but they found this challenging.
Recruitment methods vary widely, and retention is a challenge. Managers reported that emails and printed materials were their most common recruitment strategy. Participants, however, reported they were most frequently persuaded to join the program through a one-on-one personal approach. Many managers believe that recruitment and retention (keeping all their grantee "slots" filled) was a significant challenge.
Monitoring participant progress through personal "check-ins" is a robust approach. Many (but not all) managers had difficulty monitoring the progress of their participants. Some programs conducted regular quarterly "check-ins," either in person or by examining documents, but many did not. There was a lack of clarity among managers regarding what constituted “sufficient annual progress” for participants. A significant number of programs had difficulty identifying their program participants. Many programs did not have up-to-date names and emails for their participants.

9
Support for program management varies widely. There is high turnover among managers, and many of those surveyed were new to this role. Managers greatly appreciated their focus group because it allowed them to share and learn about best practices from other managers, and they expressed a desire to have more of these meetings. New managers need more consultant support. While managers were very busy in other roles, they felt they could effectively balance their Classified Program leadership work with their other professional responsibilities. There was a wide disparity in financial support retained by grantees for program management among the LEAs. Some LEAs provided in-kind support for program administration and distributed all grant funds to participants, while other programs kept a portion of the grant for program administration. Of the allowable $4,000 per participant allotment, managers reported they kept between $200 to $2500 of these funds for program management. Additionally, critical components of program management were significantly strengthened when there were strong LEA/IHE partnerships and shared implementation. Support for participants varied widely All participants expressed deep appreciation for the financial support they received. Qualified reimbursements varied widely from program to program. The development of cohorts for participants and supporting them in moving through the program as a group was a very successful strategy. The provision of individualized (non-financial) support was lacking in most programs. For example, programs which provided participants with a mentor and test preparation classes were more successful in assisting participants in passing their required assessments and in program retention and completion.
1.1.3 Challenges And Confounding Variables
There are ongoing challenges to recruitment and retention in the Classified Program. The most significant challenges to managers were reaching a diverse candidate pool and recruiting in specialties identified as teacher shortage areas. Participants face financial barriers and family/personal challenges in joining the program. Participants are sometimes fearful of the commitment to the program. Failure to obtain time off from their classified job during required observations and student teaching and financial and family constraints inhibited retention. Participants experience challenges in passing required tests. Some participants found difficulty passing the CBEST, RICA, or CSET. Some expressed disappointment that they could not continue in the program as a consequence. Managers also agreed that participants passing these required tests was a hurdle, particularly for English language learners. Several programs provided test preparation classes to prepare participants for these tests, and some programs developed cohorts to study together. Participants were very grateful for these types of additional support.
LEA and IHE collaboration was complex for most programs. Several programs and IHEs were beginning to build strong working relationships, but there were challenges to most collaborations. Some partnerships worked well, and

10
other collaborations did not exist. Many managers and IHE liaisons found collaboration and communication complex due to leadership turnover. About 1/3 of programs reported no IHE partnership. There continue to be many financial challenges for participants. Classified Program participants were offered a small stipend for their time to participate in the evaluation. Despite financial challenges, over 40% of participants donated their evaluation stipend to Scholarship America. This generosity demonstrated their altruism and commitment to education. The financial assistance provided by the program was highly valued. The Classified Program was the primary source of financing for most participants to pursue a teaching credential. Many participants struggled to meet their financial needs, necessitating them to draw on additional sources of financial support (loans, scholarships, grants, and part-time jobs). Approximately one in five participants worked a second job in addition to their classified or teaching employment. Distribution of funds to participants from programs varied widely and had differing definitions of what costs were qualified for reimbursement (such as tuition, books, childcare, transportation). Participants were less successful with completing their coursework at private IHE’s because of the high financial costs. Participants were asked how likely they were to continue pursuing a credential whether or not they received financial support from this program. The number of participants that said they would not continue to pursue a credential grew from one in twenty to one in four (approximately 5% to 25%) if Classified Program support was not available. Time to get everything accomplished is a continuing challenge for participants. Participants spent an average of 16 hours per week on Classified Program activities. Approximately 1/5 of the participants also worked an additional part-time job. This means these participants worked 63 hours per week or approximately 13 hours per day.
In the COVID-19 crisis, participants faced significant challenges with internet access. Internet access challenges grew significantly because of the COVID-19 disruptions. Food and housing insecurity showed slight increases. There was little evidence that the COVID-19 pandemic caused a rise in transportation challenges or added to participants' inability to pay living expenses and school-related bills. Participants had concerns about whether COVID-19 disruptions would negatively affect their ability to obtain teaching positions.
1.1.4 Potential Long-Term Impact
Assessing the long-term impact of this program was difficult at this stage. However, the evaluation team decided to assess participants using the "Quality of Life Indicators" developed by the World Health Organization (Skevington et al., 2004). Participants believed the Classified Program positively impacted their quality of life in terms of education level, security, environment, mental health, wealth, safety, social belonging, freedom, and physical health. The only area with no demonstrable positive impact was recreation/leisure time.
11
1.2 DECISION ON THE SUCCESS OF THE CLASSIFIED PROGRAM
As yet, there are no state-adopted Standards for the Classified Program. The Evaluation Leadership Team decided to use the preponderance of the evidence standard for this judgment, which is defined as "clear and convincing proof which results in reasonable certainty of the truth" (Garner, 2004; Orloff & Stedinger, 1983).
Each Leadership Team member individually rated the extent that the Classified Program successfully achieved each of the four goals outlined by the legislature. All team members independently decided the level of success for each goal on a 1-5 Likert scale (1-not successful, 2-slightly, 3-moderately, 4-very, and 5-completely successful.) The results from the Leadership Team ratings were as follows:
Legislative Goal 1: Supporting the LEA recruitment of classified school employees into teaching careers - Very successful
Legislative Goal 2: Supporting undergraduate education of classified employees - Very successful
Legislative Goal 3: Supporting teacher preparation of classified school employees - Moderately successful
Legislative Goal 4: Supporting classified school employees' subsequent certification as credentialed California teachers - Moderately successful
The Evaluation Leadership Team collectively believes that the Classified Program has indeed been a success, notwithstanding the challenges in implementation. It is deemed a valuable program that is helping to alleviate the shortage of teachers in California.
1.3 RECOMMENDATIONS
Based on the qualitative and quantitative evaluation findings and broader research from the field, the Evaluation Leadership Team offers the following recommendations to policymakers, advocates, and other leaders supporting Classified Programs:
1. Develop a "Program Management Guide" that includes reporting requirements,
rules, procedures, and allowable expenses.
2. Encourage stable leadership and management roles in both the LEA and IHE.
3. Clarify expectations of and desired outcomes for IHE/LEA collaboration.
4. Ensure all managers have access to the Program Management Guide to
safeguard continuity during management changes.
5. The wide disparity in the amount of funds kept for program management
should be further investigated with an eye toward equity among participants.
The CTC should impose an upper limit to ensure fairness to all participants.

12
6. Collect data from program inception to now regarding all allowed expenses to
identify the broadest possible scope of financial supports for participants.
7. Provide clarity that Classified Program funds can be received by participants IN
ADDITION TO receiving alternative sources of financial aid (such as the Golden
State Teacher Program, other scholarships, grants, and loans).
8. Prioritize best practices in providing individualized non-financial support (such
as test preparation, mentoring, or cohort models), and share these with
managers and IHE liaisons.
9. Create a forum for managers and IHE liaisons to frequently share best practices.
10. Continue the Commission's course of addressing inequitable barriers to passing
the professional teacher licensure exams and encourage Classified Programs to
provide additional support to overcome these barriers.
11. Consider allowing funding for classified staff to take time off to complete
required fieldwork/student teaching.
12. Provide additional structure in the RFA to set more explicit expectations of LEAs
as follows:
a. Incorporate accountability structures into the RFA that support program
delivery and consistent collaboration with IHEs.
b. Require each program to keep an up-to-date list of participants' contact
information and send it to the CTC annually. The list should include (at
minimum) name, current email, current phone number, and information
about their enrollment status.
c. Clarify the most comprehensive scope of allowable expenditures on
which funds may be spent to encourage standardization across
programs.
d. State an appropriate % of funds the LEA may use for program
management.
e. Clarify a minimum of required individualized non-financial supports
which must be in place.
f. Give guidance and require programs to clarify rules for funding
participants that replace those who dropped out.
g. Ensure plans are in place to assist participants in finding preservice
placements and teaching positions.
h. State the policy for funding time off for participants to complete required
fieldwork/student teaching.
i. Describe plans for data collection and continuous improvement.
13. Continue to provide and extend ongoing technical assistance opportunities to
funded programs individually and as a group to support new managers and best
practices in implementation.
14. Implement a statewide system for Classified Program continuous improvement.

13
2 INTRODUCTION
Since 2015, California has faced a protracted decline in the pool of fully qualified teachers attributed to the steep declines in the production of new teachers as demand has steadily increased (Darling-Hammond et al., 2018). Adding to teacher shortages, COVID-19 has furthered the exodus of teachers as vastly higher workloads increase teacher burnout causing more staff to change careers or retire early (Carver-Thomas et al., 2021). Teacher shortages are more common and severe in high-need schools and specialized subject areas, such as STEM, bilingual, and special education, disproportionately impacting students of color and those from low-income families (Carver-Thomas et al., 2020; Podolsky et al., 2019). Efforts mitigating teacher shortages have generally aimed to reduce the rate of attrition or open the pipeline of new teachers. Teachers in specialty fields, those serving in Title 1 schools, or those with little preparation are more prone to flounder and quit (Carver-Thomas et al., 2020). Therefore, since the passage of SB2042 in 1998, California has mandated new teachers complete a two-year Induction program of job-embedded support to develop their teaching practice and prevent attrition. Long-term solutions at boosting the pipeline of new teachers have taken the form of teacher residency programs and “Grow Your Own” teacher preparation models. Initiatives like the California Teacher Residency Program and the Golden State Teacher Program aim at improving the rate of credentialing by providing grant funding to those enrolled in preliminary credential programs if they commit to a period of serving in high-need areas after earning their credentials. However, those without an undergraduate degree cannot enroll in a credential program and are therefore ineligible for these grants. The Paraprofessional Teacher Training Program, California’s first attempt at a Grow Your Own model, successfully recruited, supported, and funded community college, bachelor’s degrees, and teacher preparation expenses for more than 2,200 racially and linguistically diverse paraprofessionals, 92% of whom were still public school teachers by the 13th year of the program (Podolsky et al., 2016).
2.1 CALIFORNIA CLASSIFIED EMPLOYEE TEACHER CREDENTIALING
PROGRAM
In 2016 the Legislature passed AB2122, creating the California Classified School Employee Teacher Credentialing Program (Classified Program). Administered by the California Commission on Teacher Credentialing (CTC), the Classified Program is a Grow Your Own modeled program that provides grant funding to Local Education Agencies (LEAs). They partner with universities or colleges to recruit classified school employees, associate degrees or higher, into teaching careers and support their undergraduate education, professional teacher preparation, and certification as credentialed California teachers (Education Code Section 44483(e)). Participating LEAs are expected to focus on recruiting and supporting classified staff interested in teaching in areas with a specific shortage in their region (generally STEM, bilingual and special education). Classified staff in the program receive financial assistance for degree and credentialing-related expenses such as tuition, fees, books, examination

14
costs, academic guidance, and other forms of individualized support to help them become credentialed teachers in public schools. Since its launch, the Legislature has provided $45 million in funding for the Classified Program with over 2,000 classified staff enrolled and nearly 800 credentials earned by participants (California Commission on Teacher Credentialing, 2020). The Governor’s Budget May Revise proposes to increase funding for this program from $25 million (January 2021 budget proposal) to $125 million, which will be available for five years (California Commission on Teacher Credentialing, May 14, 2021).
2.2 EVALUATION OVERVIEW
This evaluation intends to answer several critical questions about the Classified Program: 1) Was the Classified Program a success? 2) What were the best practices contributing to and challenges inhibiting the program’s success, and 3) How can the program be improved?
2.2.1 Required Program Evaluation
The legislation dictates that the CTC shall contract with an independent evaluator with a proven record of experience in assessing teacher training programs to conduct an evaluation to determine the success of the program 44483(e). Shasta College and Sinclair Research Group evaluated the first five years of the Classified Program. The evaluation was carried out to inform the legislature how grantees were progressing toward the four legislative goals mandated by Education Code Section 44483(f): 1) support LEA recruitment of classified school employees into teaching careers, 2) support undergraduate education of classified school employees, 3) support professional teacher preparation of classified school employees, and 4) support classified school employee subsequent certification as credentialed California teachers. Summarily, a decision was sought on the program's success over five years in assisting classified staff to become credentialed California teachers. Formatively, the purpose of the evaluation was to examine the program's strengths and areas for growth and suggest possible improvements should the program be continued.
2.2.2 Objectives
Data were gathered on the range of experience and supports of classified participants and the perspectives of program management. The objectives of the evaluation were to examine:
• the extent the program was implemented as intended,
• the collaboration between LEA/IHE,
• participant recruitment (particularly in areas of teacher shortage),
• how participants were monitored
• provision of financial and non-financial support,
• sufficiency of participant annual progress,
• meeting teacher shortage needs, and

15
• employment as intern teachers or fully credentialed California teachers.
2.2.3 How To Read This Report
Following the introduction above, this report is broadly grouped into a methods section, the evaluation findings, followed by the conclusions and recommendations for program improvement.
The methods section of this report first describes the evaluation design and logic model. These are followed by a description of the phases of the work and the timing. The sampling strategies for collecting both the qualitative data and quantitative data are explained. Analyzing qualitative data (focus groups and interviews) and quantitative data (survey responses) are then described. The reliability and validity of methods used in this evaluation are then discussed.
Following reporting of demographics, the evaluation findings are broken into six sections, one for each evaluation target stemming from the process and outcome evaluations in the logic model: implementation (inputs), challenges (confounding variables), satisfaction (outputs), outcomes, impact, and needs assessment. Each section begins with a summary of findings followed by subsections that provide evidence of findings. Both qualitative and quantitative data are reported simultaneously as triangulation of data sources was used to develop conclusions.
To wrap up the report, justification of the conclusions are addressed, followed by the decisions made by the Evaluation Leadership Team regarding the success of the Classified Program. Recommendations for improvement follow. Lastly, a discussion of the limitations of the evaluations is offered.
2.2.4 Interpretation Of Graphs And Data
Questions asked of a perceptual nature often utilize a positively weighted 4-point Likert scale that results in answers falling in the agree/positive range (slightly agree, moderately agree, and strongly agree), leaving negative responses grouped as one body of answers. To more deeply examine agreement and disagreement, the answer choices used a balanced, evenly weighted bi-directional six-point scale (+3=Strongly agree, +2=moderately agree, +1=slightly agree, -1=slightly disagree, -2=moderately disagree, -3=strongly disagree).
The questions in the online surveys used either positive wording (where agreement would indicate satisfaction or positive outcome) or negative wording (where agreement would indicate an area for improvement or a challenge). Asking questions about identical concepts positively and negatively facilitated a higher level of validity.
Results from rating questions are shown using simple scatter plots and stacked bar charts. Simple scatter plots with standard deviation bars on a vertical axis of the six-point scale (falling between +3 and -3) are used to quickly and easily show average responses to questions. However, utilizing only averages and standard deviation often overlooks portions of the sampled population. Two questions with the same average could result from different proportions of answer choices. To prevent the loss of any

16
critical perceptual data, stacked bar charts were used to depict the relative percentages of answer choices given by respondents to each question.
Continuous/scaled data (such as the percent of participants in the Classified Program estimated by managers or total work hours reported by participants) are represented in frequency distribution charts (histograms) and box-and-whisker plots. Histograms show the range of continuous data and plots the frequencies of responses within specified intervals of that range. Box-and-whisker plots are used to show where the majority of responses fell (the interquartile range) and represent the mean, median, maximum and minimum values and the presence of any potential outliers.

17
3 METHODS
3.1 EVALUATION DESIGN
The evaluation design used a mixed-methods approach containing qualitative (focus groups, in-depth one-on-one interviews, and narrative responses from online surveys) and quantitative measures (online surveys). This strategy provided a deeper understanding of the success of the Classified Program than using either methodology alone (Gardner et al., 2014). For the qualitative research, a Generic Qualitative Research Design supported a discovery-oriented, descriptive approach and focus on the "who, what, how" of participant experiences and enabled those experiences to surface from the raw data. They were appropriate because evaluators explored issues, contexts, interactions, experiences, and the processes that influence outcomes (Kahwati & Kane, 2018). Evaluators needed to understand why stakeholders believed the program worked or did not work. Quantitative measures were appropriate because predetermined outcomes were assessed. A simple Retrospective Quasi-Experimental Design was used since the independent variable (participation in the Classified Program) had been implemented before the dependent variable (entry into certified teaching positions in California) was measured. Quasi-experiments are the most common design used in evaluating the effectiveness of treatment (Cook et al., 2002). The population was large enough to generate conclusions with an adequate confidence level and margin of error. Ultimately, evaluators measured differences within and among groups.
This mixed-methods design (figure 1) was integrated sequentially (data from one source informed the data collection for the following data source). This sequential integration supported both the inductive approach (what was heard or observed in focus groups/interviews developed into generalized conclusions) and the deductive approach (measuring based on generalized principles) (Linfield & Posavac, 2018). Triangulation was used concurrently to compare information from different independent sources.
Figure 1: Mixed methods evaluation plan

18
3.2 LOGIC MODEL
Several types of evaluations were combined for this study (See figure 2, below). A Process Evaluation helped to determine how successfully the Classified Program followed the strategies laid out in the program design. Implementation issues can surface important confounding variables when studying outcomes and impacts (Adom et al., 2018).
The Process Evaluation focused on inputs, activities, participation, and how these made a difference towards the outcomes. It allowed the evaluators to make the critical distinction between implementation failure and the failure of the Classified Program itself. Evaluators were also able to make evident the types and amounts of services delivered, who benefited from those services, the resources used to provide the services, practical problems encountered, and how issues were resolved. The Process Evaluation also supported the examination of program management and infrastructure to assess whether an LEA did not have the capacity to deliver expected outcomes. Information from the Process Evaluation was used to determine how program impacts and outcomes were achieved.
It was essential to ascertain whether and to what extent the stated objectives of the Classified Program were met. Using an Outcome Evaluation supported the assessment of the effectiveness of the Classified Program in producing change. Evaluating short- and medium-term outcomes is essential for ongoing quality management, and these serve as program effectiveness indicators (Chen, 2014). Further, evaluators aimed to establish if these changes were because of the program's interventions or other variables. Outcome evaluation enabled assessing the participants, the program services, the leadership, program successes, the most effective services, and programmatic issues.
While evaluators did not intend to examine long-term outcomes, the evaluators could determine a link between the Classified Program and subsequent improvements for participants (e.g., quality of life, income) and the LEAs (e.g., employment as teachers). The Impact Evaluation contributed to the evidence base that supported recommendations (Gertler et al., 2016). It supported the evaluator's conclusion, based on the preponderance of the evidence (defined as "clear and convincing proof which results in reasonable certainty of the truth"), that the Classified Program was a success in achieving legislative goals (Garner, 2004; Orloff & Stedinger, 1983).
Figure 2: Logic model of the Classified Program evaluation

19
3.3 PHASES AND TIMING
The evaluation team gathered primary data via focus groups, interviews, and online surveys from Classified Program managers (LEA appointed Classified Program Managers, hereafter referred to as “Managers”), IHE partners, and classified participants. Data were collected in five phases, each phase with three subsets (as shown in Table 1) between October 2020 and April 2021.
Table 1: Phases of the Classified Program Evaluation
Phase 1 – Focus Groups – October to
December 2020 - Convenience Sample
• Manager Focus Groups – 5
• IHE Focus Groups – 2
• Participant Focus Groups - 5
Phase 2 – Pilot Interviews – January 2021
Convenience Sample from Focus Group
Cohort
• Manager Pilot Interviews - 2
• IHE Pilot Interviews - 2
• Participant Pilot Interviews - 6
Phase 3 – In-depth Interviews – January to
February 2021 – Stratified Random
Sample
• Managers Interviews - 3
• IHE Liaison Interviews – 2
• Classified Participant Interviews - 39
Phase 4 – Pilot Surveys – February 1 to
15, 2021 - Convenience Sample from In-
depth Interview cohort
• Program Manager Pilot Surveys - 6
• IHE Pilot Surveys – 6
• Participant Pilot Surveys - 40
Phase 5 – Surveys – March 1 to April 25 –
Stratified Random Sample (Participants),
Population (Managers and IHE)
• Participant Survey– Random Sample – 557
• Manager Survey – Population Survey - 40
• IHE Survey – Population Survey - 11
3.4 DEVELOPMENT OF DATA COLLECTION TOOLS
To appropriately develop the evaluation tools, each phase of the study impacted the direction of data collection for subsequent stages. After five rounds of negotiated inductive coding on focus groups, a final code structure was developed and the Codebook written (Appendix A). The results from the focus group coding guided the development of interview questions which were then piloted with all role groups before final refinement. The coding of interviews clarified topics to probe more deeply in surveys. Survey questions were also piloted with all role groups before the final questions were developed.
In addition, the evaluation Leadership Team (made up of the Project Director, the Principal Investigator, the Executive Director, a contracted facilitator, a school principal, and a researcher) was heavily involved in the development of goals and questions. They gave feedback on and approved all focus group, interview, and survey questions. As a final step in the evaluation, the Leadership Team developed the recommendations. It came to a consensus on the overall success of the program.

20
The evaluation was carried out when California was at the height of the COVID-19 pandemic, and school districts had suspended in-person learning. Many survey items asked stakeholders to reflect on their experiences before and after disruptions related to COVID-19. This strategy supported the evaluators in making comparisons. It enabled them to understand better how the programs had progressed and identify confounding variables.
3.5 SAMPLING STRATEGIES
3.5.1 Sampling Of Qualitative Data
All classified participants in focus groups and interviews were paid a stipend of $20 for their time. The compensation ensured that more participants were willing to join the study. An open invitation was sent to all managers, IHE liaisons, and classified participants requesting focus group participation. Convenience sampling resulted in 63 participants selected for the 12 focus groups.
Manager and IHE liaison interviewees were chosen to enable deeper probing of comments given in focus groups (purposeful sampling). Stratified random sampling was used to select participant interviewees. At least one interviewee was selected from each program. In addition, interviewees were selected from the nine programs with 60-89 classified participants. Four interviewees were chosen from the one program with 90-119 participants and eight from the one program with 222 classified participants. A total of 39 participant interviews were completed before the interview team agreed that theoretical saturation (the point where no new information emerges through coding) had been achieved (Saunders et al., 2018).
3.5.2 Sampling Of Quantitative Data
Contacts for Classified Programs, provided by the CTC, were used to send the Program Manager Survey to the entire population of Classified Program managers in California (42 programs). The list of IHE liaisons was more challenging to collect. Some managers did not have specific IHE liaisons. Some liaisons had retired and responded that they were not working with the program. Other liaisons reported they were working with multiple programs. Eventually, 53 IHE liaison names and emails were collected and invited to complete the IHE Liaison Survey. However, many did not respond to repeated requests to take the survey. Eleven IHE liaisons finally completed the survey. Having captured such a low response rate for that survey made interpreting the quantitative results fraught with issues of reliability. Therefore, analysis of the quantitative survey data from IHE liaisons was omitted.
Names and emails of Classified Program participants were received from all programs but one. Of the 2,230 funded classified participant slots, information sent by managers indicated that 2,159 slots were filled. Two programs pre-screened those willing to participate in the study, leaving the total population to draw the random sample at 1,968. To encourage participation, Classified Program participants that completed the online survey were given a $10 stipend (which they could choose to donate to Scholarship America). A random number generator was used to select those participants chosen to respond to the Participant Survey. Random numbers were

21
stratified and carefully monitored to ensure responses from each of the 41 responding programs from which participant names had been received. Those not yet responding were reminded weekly until either they opted out or sufficient data had been collected
3.6 DATA ANALYSIS
3.6.1 Analysis Of Qualitative Data
The evaluators' goal was to ensure that the approach to focus groups was inductive (Thomas, 2006). Therefore, the research team initially developed several basic questions derived from the goals of the evaluation. However, most questions were designed only to start the conversation and assist the facilitator in understanding the group's opinions. After each focus group, questions were rewritten for clarity and conciseness. The eventual focus group questions are provided in Appendix B.
Based on the results of coding completed on focus group data, Pilot Interview questions were developed for each role group. Pilot interviews were implemented with two managers, two IHE liaisons, and six classified participants. Final Interview questions and interviewing protocols were developed and practiced. To ensure inter-rater reliability, evaluation staff and interviewers met for training and discussions regarding the questions and protocols (McDonald et al., 2019). Appendix C provides the guides and interview questions used to support the interviewers.
All focus groups and interviews were completed via zoom and recorded with the permission of the group members and interviewees. All media was stored on a secure server with restricted access to ensure privacy and protection. Results were transcribed using NVivo (QSR International Pty Ltd., Version 12, 2018) software. Initially, transcripts for the five Program Manager Focus Groups were analyzed inductively without bringing any coding structure to the analysis. This Descriptive Coding methodology emerged with 16 themes.
The coding team then completed a second round of coding on these same five transcripts using an In-Vivo Coding methodology – the actual language of the focus group members (Jackson & Bazeley, 2019). While the In-Vivo Coding stimulated evocative language and a clearer picture of focus group member perceptions, it resulted in a proliferation of codes that the coding team found confusing.
At this point, the coding team re-examined the data. The group changed the resulting statements into Process Codes (translating In-Vivo words into action-oriented gerunds which label conceptual actions). This step helped to clarify and deepen the previous thematic codes. A set of 49 codes/subcodes emerged that embraced the Descriptive, In-Vivo, and Process Coding stages.
This code set was applied to the fourth round of coding using the same five transcripts. The fourth round enabled the coding team to collapse and rename categories into 28 codes/subcodes. The codes were then applied in a fifth round of coding the same transcripts. To ensure inter-rater reliability and that all coders understood the various codes, definitions were written for each code. The codebook can be found in Appendix A. This careful development of code structures resulted in a

22
comprehensive, fully coded set of narrative data that enabled analysis at a more complex level across all qualitative data.
From this point forward, the coding team used this Initial Code Structure as a starting point for coding each subsequent focus group, all interviews, and qualitative data from the surveys. The team frequently negotiated and revised the code structures as they moved back and forth across the balance of the transcripts and data points. While the code structures changed somewhat for the different role groups and processes, codes remained the same.
3.6.2 Analysis Of Quantitative Data
Survey data were downloaded from the Qualtrics survey platform before being cleaned and transformed. Data were stored on a secure server with restricted access to ensure privacy and protection. Missing data were due to either item non-response (respondents skipping or not finishing the question) or participant attrition (failing to complete the entire questionnaire due to fatigue or boredom) (Schlomer et al., 2010). A stipend of $10 for survey completion may have improved the rate program participants fully completed their online surveys, thereby reducing participant attrition. The missing data were examined for patterns and determined to be missing at random. Survey results reporting proportionality of responses or percentages accounted for missing data in their calculations.
Analysis of quantitative data was conducted using IBM SPSS Statistics for Windows, Version 26. To put data into perspective (improving external validity) and understand it in detail, univariate descriptive statistical measures were generated (frequencies of the answer choice, mean, median, mode, variance, standard deviation, and interquartile range). Normality status was assessed. Knowing the normality status and whether the data analysis is univariate (a single measured variable), bivariate (comparing two variables), or multivariate (comparing three or more variables) helped the evaluator to determine the appropriate statistical measures. In some cases, matching data sets was necessary to provide valid inferences. Chi-square tests and t-tests of means were implemented to establish statistical significance in the comparisons using a threshold p-value of 5%.
Perceptual ratings fell on a 6-point evenly weighted bi-directional scale (Strongly agree, moderately agree, slightly agree, slightly disagree, moderately disagree, and strongly disagree). This scale allowed for capturing the intensity of feeling, attitude, or belief. Using a scale of this type prevented respondents from taking the “easy out” and picking the neutral option when they did not want to spend effort thinking about the question. Grouping together the agreement or disagreement levels (for example, strongly agree, moderately agree, and slightly agree) yielded conclusive statements that were easier to understand and discuss. Making available the gradations of agreement and disagreement supported examining the degree to which groups agreed or disagreed. Results from rating questions are shown using simple scatter plots and stacked bar charts. Continuous/scaled data (such as the percent of participants estimated by managers or total participant work hours) were represented in frequency distribution (histograms) and box/whisker plots to show relevant statistics and interquartile range.

23
3.7 RELIABILITY AND VALIDITY OF RESULTS
While qualitative studies rarely address reliability and validity, the evaluators made extraordinary efforts to ensure both. The difficulties of obtaining inter-rater reliability were addressed through joint training of facilitators and interviewers on questioning strategies and protocols. Qualitative questions were repeated under the same conditions across similar and different role groups, with attention paid to consistency. Initial code structures were developed inductively by a team, with code structures compared and negotiated through repeated coding cycles. The coders jointly developed code definitions to increase their shared understanding. The final code structure was implemented across all qualitative data collection processes/tools and all role groups.
Responses to surveys of managers were received from over 90% of all Classified Programs (40 managers from 38 of the 42 programs). Therefore, results should have high reliability as they apply to the overall population of Classified Program managers in California.
For the quantitative surveys, a random sample of 557 responses was received from a population of 1,968. Evaluators are 95% confident (±3.29) that results are reliable as they apply to Classified Program participants in California.
With just a 20% response rate from IHE liaisons (11 from 53 liaison names), quantitative results cannot be considered reliable. Therefore, findings for IHE liaisons in this report stem from qualitative focus groups and interviews only.
The possibility for validity was increased by more deeply probing questions in focus groups and interviews and further exploring these issues in quantitative surveys (Bazeley, 2017). Results from questions intended to measure similar concepts were compared, resulting from each separate data set. Asking questions about identical concepts positively and negatively facilitated a higher level of validity.
24
4 FINDINGS
4.1 DEMOGRAPHICS
Forty-two current and former managers responded to the online survey from 38 programs. Eleven IHE liaisons responded to their online survey. The survey of participants received 557 responses.
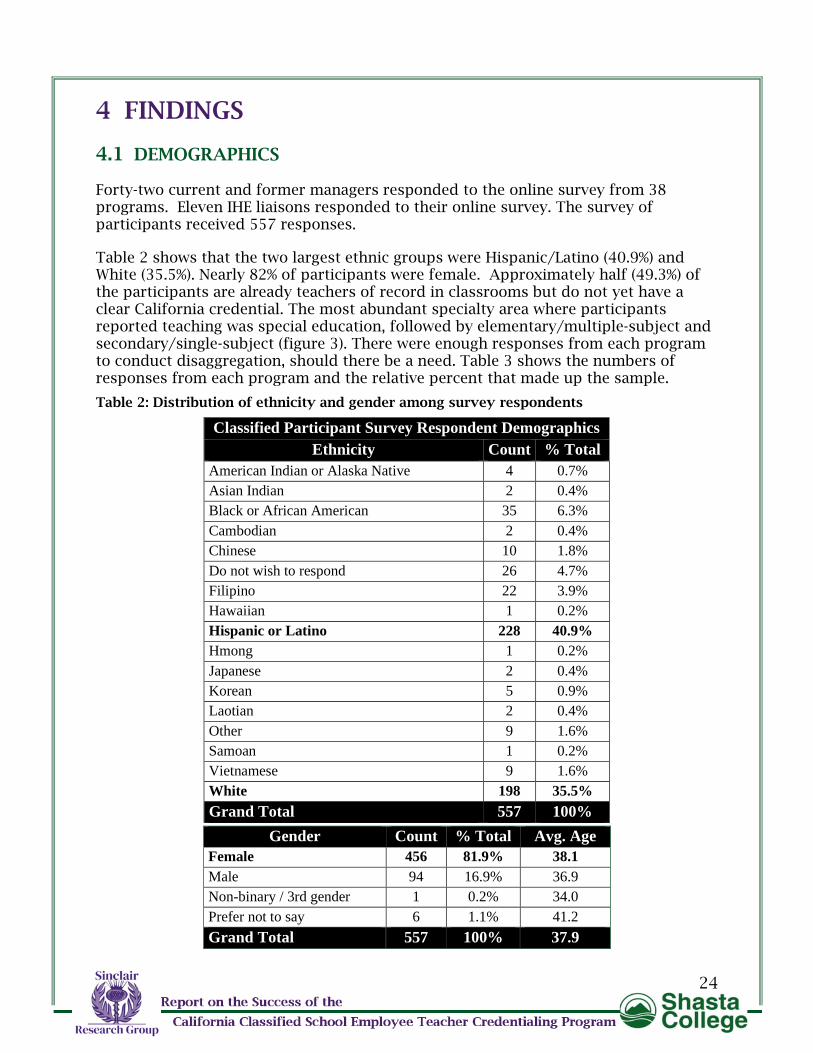
Table 2 shows that the two largest ethnic groups were Hispanic/Latino (40.9%) and White (35.5%). Nearly 82% of participants were female. Approximately half (49.3%) of the participants are already teachers of record in classrooms but do not yet have a clear California credential. The most abundant specialty area where participants reported teaching was special education, followed by elementary/multiple-subject and secondary/single-subject (figure 3). There were enough responses from each program to conduct disaggregation, should there be a need. Table 3 shows the numbers of responses from each program and the relative percent that made up the sample.
Table 2: Distribution of ethnicity and gender among survey respondents
Classified Participant Survey Respondent Demographics
Ethnicity Count % Total
American Indian or Alaska Native 4 0.7%
Asian Indian 2 0.4%
Black or African American 35 6.3%
Cambodian 2 0.4%
Chinese 10 1.8%
Do not wish to respond 26 4.7%
Filipino 22 3.9%
Hawaiian 1 0.2%
Hispanic or Latino 228 40.9%
Hmong 1 0.2%
Japanese 2 0.4%
Korean 5 0.9%
Laotian 2 0.4%
Other 9 1.6%
Samoan 1 0.2%
Vietnamese 9 1.6%
White 198 35.5%
Grand Total 557 100%
Gender Count % Total Avg. Age
Female 456 81.9% 38.1
Male 94 16.9% 36.9
Non-binary / 3rd gender 1 0.2% 34.0
Prefer not to say 6 1.1% 41.2
Grand Total 557 100% 37.9

25
Table 3: Number of survey participants from Classified Programs
Program Name Count % Total
Alhambra USD 14 2.5%
Berkeley USD 5 0.9%
Chico USD 7 1.3%
Clovis USD 6 1.1%
Davis Joint USD 14 2.5%
Elk Grove USD 5 0.9%
Fairfield-Suisun USD 7 1.3%
Fresno USD 10 1.8%
Garden Grove USD 16 2.9%
Huntington Beach Union HSD 5 0.9%
Kern Co. Superintendent of Schools 9 1.6%
Lake COE 7 1.3%
Los Angeles COE 15 2.7%
Los Angeles USD 13 2.3%
Marin COE 14 2.5%
Merced COE 14 2.5%
Modesto City Schools 6 1.1%
Monterey COE 9 1.6%
Moreno Valley USD 6 1.1%
Mt Diablo USD 6 1.1%
Oakland USD 11 2.0%
Orange County DoE 61 11.0%
Placer COE 14 2.5%
Pomona USD 5 0.9%
Riverside COE 19 3.4%
Sacramento COE 20 3.6%
San Bernardino Co. Superintendent of Schools 19 3.4%
San Francisco USD 17 3.1%
San Joaquin COE 11 2.0%
San Juan USD 5 0.9%
San Luis Obispo COE 16 2.9%
San Mateo COE 8 1.4%
San Ramon Valley USD 10 1.8%
Santa Ana USD 16 2.9%
Santa Barbara COE 20 3.6%
Santa Clara COE 20 3.6%
Sonoma COE 42 7.5%
Ventura COE 13 2.3%
Visalia USD 17 3.1%
West Contra Costa USD/East Bay Consortium 9 1.6%
Westside Union SD 16 2.9%
Grand Total 557 100%

26
Figure 3: Participants teaching areas and aligned credential

27
5 IMPLEMENTATION (INPUTS)
5.1 SECTION SUMMARY
Managers began the program with great excitement and high hopes for what could be accomplished. Participants and managers generally said the program met their expectations for financial support. However, most participants believed that they did not receive the expected additional individualized (non-financial) supports.
There was a wide range of manager experience and length of time in that role. Nearly half of the managers have been in their position since the Classified Program began. However, over 1/4 of managers are in their first or second year. Managers also had many other roles and responsibilities. Managers generally spent between 10% and 25% of their time running the Classified Program. There were several outliers. One large program has a full-time manager, and one reported spending just 5% of their time on the program. Ninety-five percent reported that they could balance their Classified Program work with their other professional responsibilities.
Managers expressed appreciation for the support they received from the CTC. They clearly desired more sharing of best practices and problem solving with other programs. There was a desire for more consultant support, particularly for new managers.
Some programs reported that they had kept no grant money for program management, which was a regret. Sixty-five percent of managers reported their program kept a portion of the funds (from the state-awarded $4000 per participant) for program management. Of that 65%, the amounts varied widely, from $200 to $2500.
Managers strongly agreed that their program had a clear process for recruiting classified staff and monitoring their progress. Generally, managers had more difficulty recruiting in teacher shortage areas (special education, bilingual, and STEM) and regularly communicating with classified participants about their progress. They made special efforts to inform prospective participants about needs and to recruit in these subjects. Over half of participants reported that information was shared with them about areas of teacher shortage when they were recruited.
In comparing where participants and managers believe there are teacher shortage areas, manager awareness is grimmer than participants. There is some alignment between participant awareness of teacher shortage areas and the areas in which participants reported they intend to teach. Education Specialist was the area of both the most need and the most participant interest. Programs generally had admission criteria for the areas of teacher shortage. These criteria became were not as strictly followed in recent years.
Managers report that their most frequently used recruitment methodology was email and printed materials. Half of the participants learned about the program through email. Approximately 20% of participants said they learned about the program through flyers or other printed materials. More successful recruitment strategies were evidenced in one program where one IHE liaison was very involved in program
28
leadership. This program was described as having a “personal touch.” The manager and IHE liaison met frequently, recruited together via Job-Fairs, chose participants together, and held joint meetings throughout the year. They also developed specialized workshops together to support getting participants through the required tests. Personal contacts with participants included connections with teaching or administrative staff, coworkers, a personal visit from the program leadership to their campus, and direct communication with teaching or administrative staff. Over 2/3 of programs held group presentations, but just 5.9% of participants reported finding out about the program in this way. When responses from managers and participants were compared, there were statistically significant differences in all areas.
Manager definitions of “sufficient annual progress” vary widely. All programs monitor participant progress through tracking reimbursements. The most successful monitoring strategy was personal one-on-one visits, with 3/4 of managers reporting they did this in their program. However, when both participants and managers were asked about the frequency of personal “check-ins,” participants reported significantly less frequent communication from their program. Over ¼ of the participants reported they had never been contacted.
While most managers said they had a good collaboration with their IHE, they did not talk in concrete terms about that cooperation. When managers were asked to rate the specific aspects of the working relationship with IHEs, ratings were all in the “moderately agree” range. Participants also agreed the IHE’s were collaborative but gave lower average ratings. These were statistically significant differences.
The majority of managers reported that the IHEs had little involvement with their program. Collaboration with an IHE was less when participants were allowed to go to any IHE of their choosing. Nearly 40% of managers reported they did not have any IHE liaison.
IHEs were most involved when just one IHE partnered with the program. They seemed to understand better how the program was managed, and recruitment and retention seemed to be more successful. When participants were allowed to attend the IHE of their choice, there appeared little involvement from IHEs. Over 40% of managers reported that their IHE was not very involved in the Classified Program. When participants moved into the classroom as intern teachers, collaboration with the IHE increased.
Classified participants consistently expressed deep appreciation for the funding given
to them. They were thrilled that they were chosen and report making good use of the
funds. The possibility of financial support stood out as the most significant attractor
for participants in this program.
Participants and managers reported a wide range of items for which the program
would reimburse participants. Some programs only reimbursed tuition and sent it
directly to the university. Several participants stated that they could be compensated
only for tuition and books. Others programs allowed reimbursement for a wide range
of expenses (such as registrations for tests, accommodation, and travel to testing
sites). Participants who were solely reimbursed for tuition and books spoke about how

29
helpful it would have been to be compensated for other things required to obtain their
credentials.
Some managers expressed their frustration with participants not using their allotted $4000. They felt they could not move those funds to other needy participants. However, most managers believe that participants experienced the full range of financial supports and spent all of the funds allotted to them. When participants were asked about sources of funding that helped cover their costs for becoming credentialed, the highest funding source (81.3%) was Classified Program funds. Nearly half of them also responded that they took out loans. One-third applied for scholarships, fellowships, and grants. Over 16% of participants reported having a job in addition to their classified or teaching position. There was disagreement between managers and participants regarding Classified Program funds spending estimates. Managers estimated expenditure in all areas at a significantly higher percentage rate than participants. About half of the participants reported they spent their allotted funds on textbooks, test preparation courses, and test registration fees. In contrast, managers reported these same expenses at a much higher rate (approximately 80%). Most managers said they did not provide much individualized (non-financial) support to participants. The most frequently mentioned non-financial supports were classes to assist in passing required tests and moving participants through the process in a cohort. Participants were particularly outspoken on the benefits of these types of relational support. A much more substantial percentage of managers reported providing these supports than did participants report experiencing them. These differences were significantly different. There was a seeming consensus that cohort groups having classes together and study partners to assist them in passing required tests were the individualized support that worked best. Participants who did not have these supports said they felt those supports might have helped them "get there" much sooner. A few participants also reported that they received advice from university counselors, which was very helpful. However, when interviewed, one participant said that she did not have any university advice initially and took classes that were not counted toward the credential requirements. Participants also talked about the need for a mentor. One program provides them. A few programs ask participants to obtain their own mentors.

30
5.1.1 Program Expectations
Managers reported that they began the program with great excitement and high hopes for what the program would accomplish.
We were super excited to be able to offer this to the classified employees because they are the perfect people to know what it means to work in a classroom and understand the challenges of it.
They wanted to "create as many opportunities for as many classified employees to get their credentials" as possible. Participants agreed that the program met their expectations for financial support to obtain their degree or credential. They expressed great appreciation for this aspect.
The part that definitely worked was the money. I'd say, financially, everything worked.
Most participants expected additional non-financial support but reported they did not get this.
I kind of felt that there would be a little more support, a little more check-in during the program. I'm at the end of the program. I'm going to be submitting the application for recommendation for preliminary credential, but have not had a lot of interaction with the county office other than when they announced that they're going to do the financial support at the end of the year. Personally, I thought that I was going to have more workshops, just more support overall. I really think maybe because it was the first time that they had implemented the program, it was lacking a few things. Can I be honest? I felt like I had a lot of work keeping track of deadlines and making sure to submit everything. So I guess the support in that sense was just not there. While the financial part of it was good, I didn't have another part. It's only been financial. I've just received emails saying, “Where are you at in the program?” And that's literally it. No meetings, no nothing.
5.1.2 Program Management
Manager experience/length of time in the role
During focus groups and interviews, it became clear that there was an extensive range of experience among managers. Several managers reported having written the grant and managing it since the beginning.
I wrote the grant because our county had a significant teacher shortage, especially in education specialists, math, and science. Once I read the proposal, I understood that if candidates could complete their BA or credential within their district, then

31
retention would be higher, and support would be greater. We felt that growing our own teachers from the classified pool would be extremely valuable and very relevant. I’ve directed it since the beginning, and at this point, we are at 100% retention in their same districts.
I wrote the grant when I was in HR and directed it. Then I became assistant superintendent of educational services, and the grant followed me.
Some newer managers expressed frustration with not knowing more about the program. They attributed this to not having been in the position long enough or found no information on managing the program.
I'm the fifth person in five years, and clearly, some people were stronger at the organization part of it. I feel like I am recreating the wheel. It would have been great to have had standard documents used to track people. I'll be quite frank. I'm still not entirely sure who is in the program and who is not. I'm reaching out to old names, but people aren't getting back to me. So it's been a challenge just with the turnover of different departments and different people leading in this position.
Newer managers frequently commented about not knowing who was actually in their program and about being unfamiliar with the processes and policies for the grant.
That's been the same challenge for me. I'm only the third in the last four and a half, but I felt like I spun my wheels a lot at first trying to find like, where is the document that says these are the rules of the grant. I did a lot of sifting through files to piece together the evidence. In November, I finally figured out who is no longer eligible to officially remove them and then look for replacements to shuffle people in and make sure that the grant money was being used.
Managers who were new to their role were much more able to effectively run the program when left with explicit processes and policy.
She was previously running the program, and she is now my supervisor. She had things in place. I just walked into this great program that has been seamlessly happening. The support we get and the resources available to us have really benefitted the program.
Survey data showed that nearly half of the managers have been in their role since the Classified Program began. However, over a 1/4 of managers are in their first (11.9%) or second year (16.7%).

32
Figure 4: Length of time as Classified Program managers

33
Management roles, responsibilities, and resources
Managers spoke about the wide variety of their roles and responsibilities in other areas. Most felt they were able to manage their various commitments adequately. There were statements shared about not having the administrative support they needed. In follow-up interviews, some managers expressed regret that the program had decided to give all the allotted funds to the participants and had kept nothing to support management. Managers had to find administrative assistants to keep track of who was in the program.
The purpose of the grant was to support educators in getting their credentials. And what ended up happening was all the money for the grant went to the students, which was great. But then I had to find other funding sources within our budget to cover the cost of administering the grant. So, it was fairly costly for us actually to implement the grant in the end.
Managers generally expressed appreciation for the support they received from the CTC. They also appreciated that there was not much state oversight or many reporting requirements. They could run the grant as they wished.
Whenever I had some trouble or questions, I would call the commission, and I got the information right away. In the beginning, there were several times we got Q&A documents that were helpful. But I think for me, just calling when needed and somebody always answered my questions.
I appreciated that there weren't lots of minor details within the grant to which you had to pay close attention. The grant was straightforward, and that made it really easy to implement.
Many managers expressed the desire for additional support from the CTC and more sharing with other programs.
We were kind of left on our own to do it. I don't feel like CTC reached out to us with any gems of wisdom to give us or any guidelines or anything. So, I think we are left on our own accord to figure this out. It probably would have been helpful for the CTC to each year have us get together and have a conversation about what each group is doing so we could learn from each other.
It was cool to hear what ___ said about her attending the cohort to sort of honor
participants. I feel like we are missing that. I actually took some notes on our
discussion because I thought there were such great ideas. I love the ideas.
I think it would have been great if we could have had this same kind of sharing that
we are doing today throughout the years of the grant - maybe once a year or in
between semesters.
Sixty-five percent of managers responded that their programs kept a portion of the funds for program management. These amounts ranged from $200 to $2500. This range is very wide. At the top end is nearly 2/3 of the potential funds granted to participants. This aspect needs to be further investigated with an eye towards equity among participants.

34
Percentage of time spent managing the program
Managers were asked how much of their time was spent running their program. The following two figures show the distribution of answers from managers. The majority reported spending between 10% and 25% of their time on Classified Program activities (figure 5), with the average response being approximately 20% of their time managing their program. A manager from one of the largest programs reported they were working 100% of their time on Classified Program activities. The histogram (figure 6) shows that 16 managers reported working between 5% and 15% of their time on the classified program. Fifteen managers and eight managers reported working 15-25% and 25-35%, respectively. One manager reported working 10-14 hours per month while in a retired part-time work capacity.
Figure 5: Box-&-Whisker plot - Time spent managing the Classified Program
Figure 6: Histogram - Time spent managing the Classified Program

35
Manager’s ability to balance professional responsibilities
Managers strongly agreed that they could balance their Classified Program work with their other professional responsibilities. Approximately 95% of managers reported some level of agreement.
Figure 7: Manager's ability to balance professional responsibilities.
5.1.3 Addressing Areas of Teacher Shortage
In focus groups and interviews, managers and participants generally reported that
their region was short of special education, bilingual, science, and math teachers.
Many managers reported that they made a special effort to recruit in these areas. They
reported that they used a list of preference criteria and that the list was made known
to applicants.
Right now, we have spots open in both of our rounds because I think we've been really specific about what we wanted. We didn't want people that just wanted some money to maybe, you know, finish a degree. We were trying to get people that wanted a teaching credential and gave preference to those that were seeking credentials in our highest-need areas. So it was special education, of course
What this is allowing me to do is to look at my applicants, and whichever ones are either already working in special ed or seeking a specialized credential. I siphoned them into that funding program.
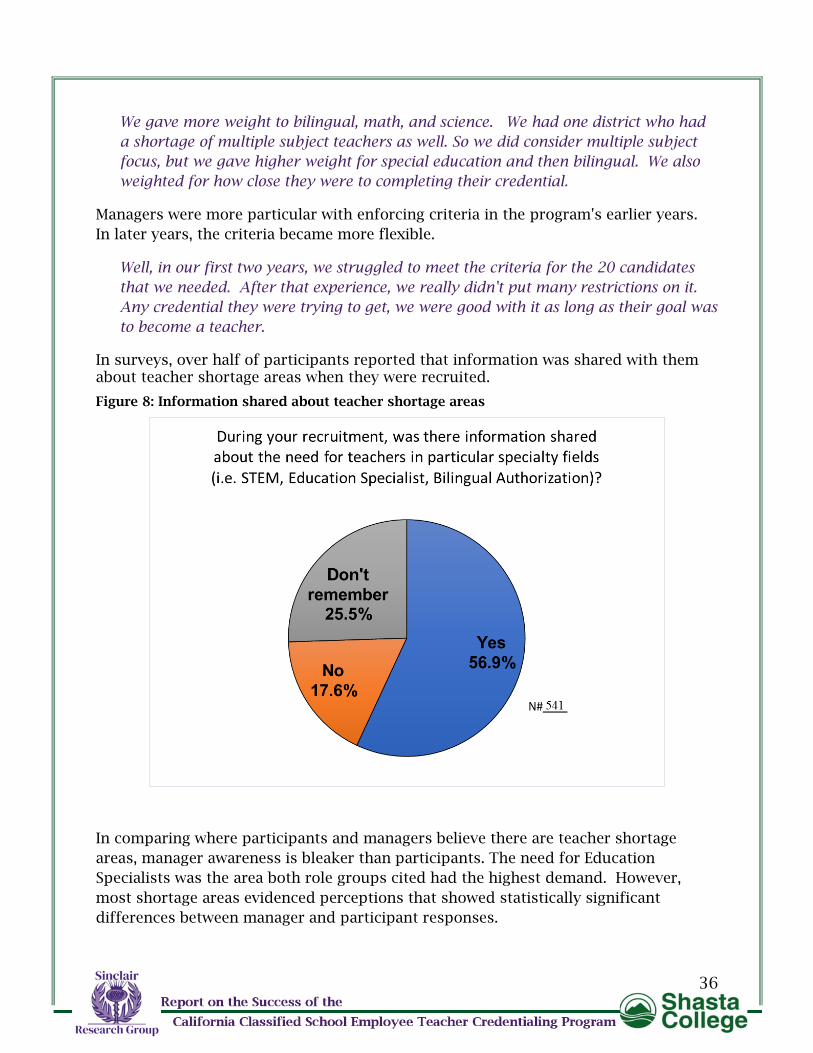
36
We gave more weight to bilingual, math, and science. We had one district who had
a shortage of multiple subject teachers as well. So we did consider multiple subject
focus, but we gave higher weight for special education and then bilingual. We also
weighted for how close they were to completing their credential.
Managers were more particular with enforcing criteria in the program's earlier years.
In later years, the criteria became more flexible.
Well, in our first two years, we struggled to meet the criteria for the 20 candidates
that we needed. After that experience, we really didn't put many restrictions on it.
Any credential they were trying to get, we were good with it as long as their goal was
to become a teacher.
In surveys, over half of participants reported that information was shared with them about teacher shortage areas when they were recruited.
Figure 8: Information shared about teacher shortage areas
In comparing where participants and managers believe there are teacher shortage
areas, manager awareness is bleaker than participants. The need for Education
Specialists was the area both role groups cited had the highest demand. However,
most shortage areas evidenced perceptions that showed statistically significant
differences between manager and participant responses.

37
Figure 9: Participant and manager knowledge of service area teacher shortages
There is some alignment between participant awareness of teacher shortages areas and
the areas in which they are preparing to teach. This finding may be attributed to
programs adhering to a list of recruiting preferences or recruiting participants already
working in special education. Education Specialists were the shortage area of most
need and most preparation.
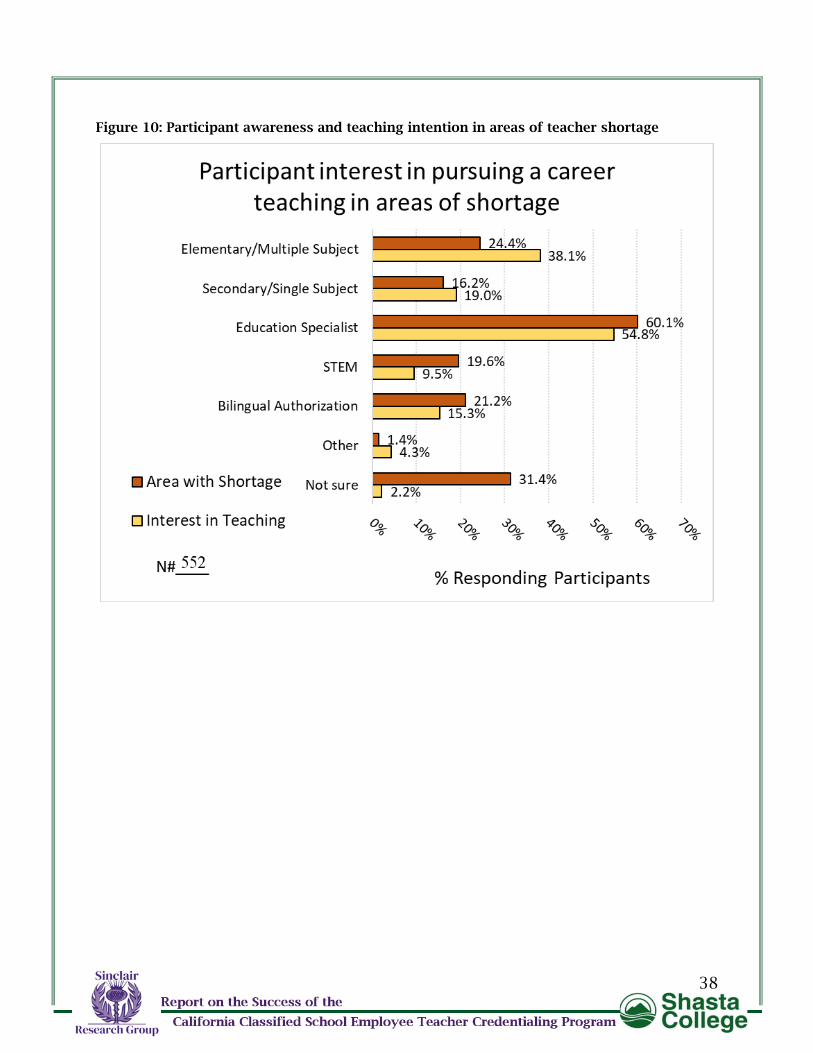
38
Figure 10: Participant awareness and teaching intention in areas of teacher shortage

39
Figure 11: Distribution of participant credential and teaching field
5.1.4 Program Recruitment and Monitoring
Ways in which managers recruited and participants learned about the program
During the qualitative investigation, it was found that managers commonly used email to recruit classified staff. Participants generally affirmed this strategy as to how they first heard about the program. Several managers used meetings or Job-Fairs as recruitment strategies. One program did so in conjunction with their IHE and felt this strategy was very successful. The programs that seemed to have the most success in recruiting classified staff went to the sites and talked directly to the classified staff. In the program's initial years, managers stuck very closely to their original criteria for program entry. However, after the first year, it seemed necessary to loosen the criteria to keep the slots filled or over-enroll participants.

40
I found it important to overlook a little bit. We have 45 slots approved, but I'll put
more people in just because I know there'll be attrition. So that's been a way of
keeping our slots filled.
Another successful strategy was to work closely with Human Resources.
We spent a lot of time recruiting with our H.R. departments to really help them
understand the magnitude of this opportunity. And so that was huge. Because they
already recruit our interns, it was a perfect match for our info session. I had one
hundred candidates in there. We also helped the director or the H R teams create
their screening. If they needed help, we helped.
After receiving the initial email, some participants reported that they had difficulty
finding out about the program. They did not know whom to contact and had to be
persistent to get information and apply to the program.
Unfortunately, after signing up for the program, I had to call every day for a long
time before I got a response.
The thing that attracted most participants to the program was the possibility of
receiving financial support. However, others just stated their goal to become teachers
or get their credentials.
What attracted me was that there was going to be a stipend that was beneficial for
me. I wanted to learn more about the program because I knew they were going to
offer those courses. If I was going to get a little something in return, it was a win-
win.
I was an instructional assistant, and I just wanted to become a teacher.
I was already teaching without a credential and this was a way to solidify getting a
credential.
Survey responses showed that the managers used a wide array of strategies for recruitment, most frequently using printed materials and emails as recruitment strategies. Participant responses clearly showed that not all strategies were effective. The frequencies reported by participants and mentors were quite disparate for all strategies. All differences were statistically significant. For example, while flyers and printed materials were the most common method, only 21.3% of participants reported they were recruited to the program in this manner. Additionally, nearly 70% of programs held group presentations, but just under 6% of participants reported finding out about the program in this way. Secondary to emails, participants were recruited most often by forms of personal contacts, including connections with teaching or administrative staff and their coworkers or paraprofessionals

41
Figure 12: Methods used for recruitment
Monitoring progress and retaining participants
All managers report they monitor participant progress in some way. Most of them do
so through participant reimbursements. Some track participants once per year. One
large program with great success in recruiting, monitoring, and retaining uses one-on-
one mentoring and person-to-person checking.
I have one-on-one meetings with them. It's following up on just coursework that
they've completed and then what their goal is. I also check with each individual
participant. During that time, we reflect back on where we were last semester - did
we meet our goal and what needs to happen next in order for them to continue. We
created a five-year plan for participants. We always made goals in order to meet that
five-year benchmark or when the grant ended.
Several programs received support from the IHE to stay connected with candidates and monitor their progress. Also, those participants that were part of a cohort stayed better connected, were easier to monitor, and seemed to have higher completion rates.
We had a cohort of 20 that went from A.A. degree through their bachelor's degrees.
In one cohort, I had one partner, Amy, to reach out to. We would connect together.
And so we just made it.

42
Our cohort made it streamlined. It turned out they got really connected. They felt
close. They weren't just lost out there at the IHE. So it built this natural community
for them. And I think it's what got most of them graduated, honestly.
We get a transcript from them, so we know where they're starting. And then we
follow them as they go through. And that's a shared responsibility between Fresno
State and me. And then we had one person whose responsibility it was to directly
connect with the candidates.
Programs closely connected with just one university partner seem to have better
success with tracking participants.
We remain in very close contact with our IHE partner and have a very free-flowing
conversation with them, and we continue to stay in contact. So when something
occurs, they notify us. The IHE takes on most of the responsibility of monitoring our
candidates.
Participants that entered the program with a B.A. seemed to have higher completion
rates.
Those that already had their B.A. when they entered the program…we’re at 100%
retention in their same districts where they started. This is phenomenal. Those that
just had their A.A. have had a harder time. However, some of them have made it
and I am so glad for them.
Our greatest success was with those that already had their bachelor’s degree.
Those people who came to the program with a bachelor’s degree were more likely to
go into teaching and finish their credential and their induction program than those
who did not have it.
In our program, we only accepted them if they had their B.A. and had passed the
CBEST.
When participants became intern teachers and entered the Intern Program, there were
far fewer problems with monitoring and support.
We found that those individuals who went into the intern program they did form that
cohort support system. But for those that were going to other places, if there weren't
other classified employees in their district, they were kind of on their own. It seemed
like those individuals that had some support, peer support, were more successful.
When managers talked about monitoring participants' progress, no common definition surfaced for what was meant by "sufficient annual progress." There were many different descriptors and requirements – from the very specific:
Completing one course per semester Taking at least six unites on a plan developed by the university advisor

43
Sufficient annual progress for our program participants is when a student completes course work at a minimum of.75% of full time for each academic year. That they maintain a GPA that is required for admissions to a teacher preparation blended, residency, alternative certification or traditional credential program. Another indicator for sufficient annual progress is that a participant does not have to pause coursework for more than one term in order to study for and pass a CSET exam.
to the very vague:
Moving through the program at the expected pace Getting candidates across the finish line Moving forward a step Getting closer to the credential Turning in more money for reimbursements
Seventy-five percent of managers reported monitoring participant progress through personal contact in the surveys (figure 13). When both participants and managers were asked how frequently they “checked in” with participants regarding their progress, 26% reported they had never been contacted (figure 14). Participants report less frequent communications from the program than do managers. “Monthly,” “quarterly,” and “never” differences were statistically significant.
Figure 13: Distribution of methods that managers use to monitor participant progress

44
Figure 14: Frequency of checks on participant progress
5.1.5 Collaboration Between Classified Programs And IHE
In focus groups and interviews, some managers report that IHE liaisons were very involved in leading the Classified Program. They worked directly with an appointed person at one university, met frequently, recruited together via "Job-Fairs," chose participants together, and held joint meetings throughout the year. They also developed specialized workshops together to support getting participants through the required tests.
We had a cohort model, so we had our own cohort through our (IHE). We were in
constant communication. We co-selected the instructors. We co-monitored the
participant's progress. I would say the IHE was heavily involved. It wasn't just one
thing. It was a variation of things.
Several participants reported good collaboration between their Program and the IHE.
My school district provided a presentation on this grant. They laid out what the
expectations were. I know we were currently partners partnering with Cal State
Long Beach, but I did let them know that I was currently finishing my bachelors at
Cal State Fullerton and they said they would be able to work with them. I did receive
the grant and they worked with Cal State Fullerton. And it was a pleasant experience
for me.

45
However, the vast majority say that the IHEs had little involvement with their program.
Some managers could not identify their IHE liaison, and some reported they did not
have any IHE liaison.
We intended to have a relationship with (IHE), but then they tried to do the cohort
model, and it was just too small to get started. So we ended up not having a
relationship with them, although many of our folks do go there for the programs.
IHEs were most involved when just one IHE partnered with the program. Also, those IHE liaisons working with one district seemed to understand better how the program was managed. When participants were allowed to attend the IHE of their choice, there seemed to be little involvement from IHEs. When it came to interns, there seems to have been much more collaboration with IHEs.
We had close contact with the Intern Program because it is also part of what we do
for those interested in teaching. So we had that contact with the instructors, with
the director of that program, and with the administrative assistant.
While most managers reported they got along well with their IHE, they did not talk in concrete terms about collaboration. Little collaboration was particularly true of those programs that allowed their participants to go to any IHE of their choosing. In surveys, 61% (26 of 42) managers reported they partner with an IHE. While IHE-partnered managers “slightly agree” (+0.22) that their IHE liaisons are involved in their programs, nearly 44% of managers disagreed to some extent (figure 15).
The majority of managers agreed that IHE’s were collaborative. Participants also agreed the IHE’s were collaborative, but there was significantly less agreement relative to managers.

46
Figure 15: Manager and participant perceptions about program-IHE collaboration

47
When managers were asked to rate the specific aspects of the working relationship
with IHEs, ratings were all in the “moderately agree” range (figure 16). The highest
ratings were the extent to which they were comfortable dealing with problems and
disagreements. It should be noted that the number of respondents for data in this
section reflects the number of managers who knew their IHE partnership. Only
managers who reported they had an IHE partnership (26 of 42) responded to these
questions. A significant number of managers could not answer these rating questions.
Figure 16: Managers agreement regarding IHE partnerships
5.1.6 Financial Support For Classified Participants
Participants consistently expressed deep appreciation for their funding in focus groups and interviews. They were thrilled that they were chosen and report making good use of the funds
I was so excited when I got accepted to the program and had some money to get through. The financial part was the most effective and helpful.
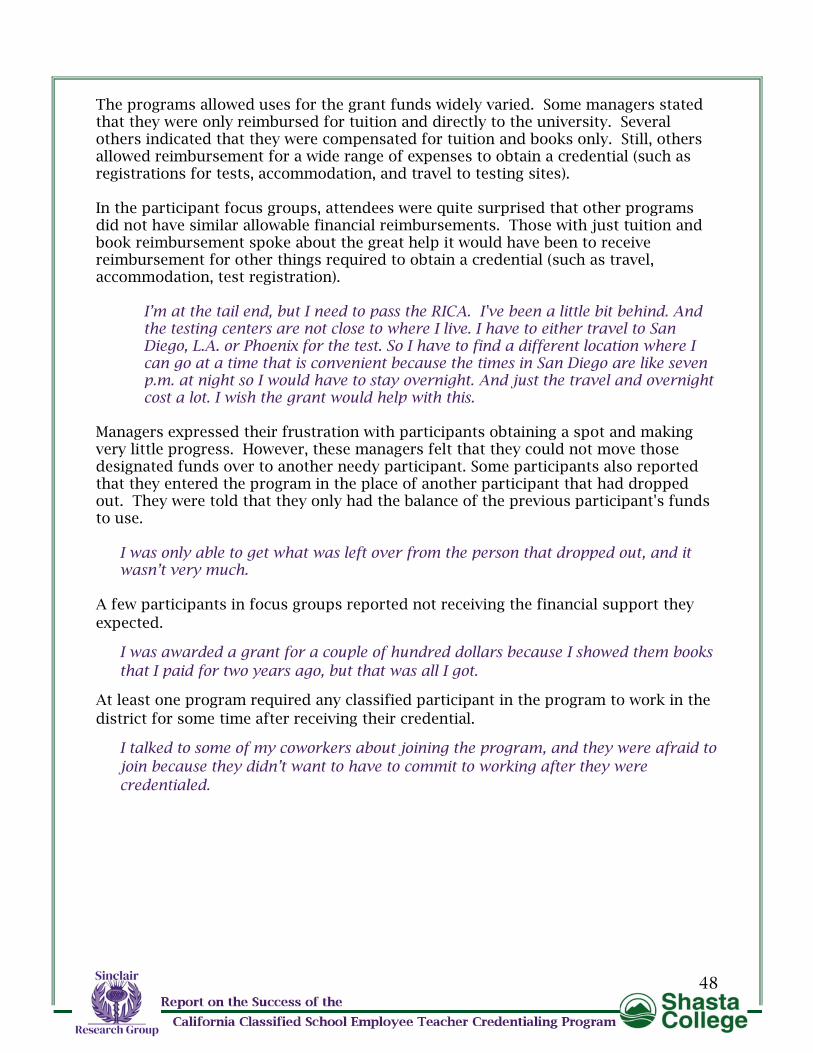
48
The programs allowed uses for the grant funds widely varied. Some managers stated that they were only reimbursed for tuition and directly to the university. Several others indicated that they were compensated for tuition and books only. Still, others allowed reimbursement for a wide range of expenses to obtain a credential (such as registrations for tests, accommodation, and travel to testing sites). In the participant focus groups, attendees were quite surprised that other programs did not have similar allowable financial reimbursements. Those with just tuition and book reimbursement spoke about the great help it would have been to receive reimbursement for other things required to obtain a credential (such as travel, accommodation, test registration).
I’m at the tail end, but I need to pass the RICA. I've been a little bit behind. And the testing centers are not close to where I live. I have to either travel to San Diego, L.A. or Phoenix for the test. So I have to find a different location where I can go at a time that is convenient because the times in San Diego are like seven p.m. at night so I would have to stay overnight. And just the travel and overnight cost a lot. I wish the grant would help with this.
Managers expressed their frustration with participants obtaining a spot and making very little progress. However, these managers felt that they could not move those designated funds over to another needy participant. Some participants also reported that they entered the program in the place of another participant that had dropped out. They were told that they only had the balance of the previous participant's funds to use.
I was only able to get what was left over from the person that dropped out, and it wasn’t very much.
A few participants in focus groups reported not receiving the financial support they
expected.
I was awarded a grant for a couple of hundred dollars because I showed them books
that I paid for two years ago, but that was all I got.
At least one program required any classified participant in the program to work in the
district for some time after receiving their credential.
I talked to some of my coworkers about joining the program, and they were afraid to
join because they didn’t want to have to commit to working after they were
credentialed.

49
5.1.7 Perceptions Of Fund Utilization
When participants were asked about sources of funding that helped cover their costs of becoming credentialed, the highest funding source (81.3% ) was Classified Program funds. Nearly half of them also responded that they took out loans. Approximately 1/3 also applied for scholarships, fellowships, and grants. Sixteen percent of participants reported that they had an additional job (in addition to their classified or teaching position) to help them pay their expenses. Some responses to the question asking what additional jobs participants held were: “I have work in stores and in the fields… I waitress in a restaurant on the weekends… Doordash delivery driver…” Appendix D provides a table listing
the types of jobs held by classified participants.
Figure 17: Financial supports participants use to obtain a credential

50
On average, managers reported that approximately 80% of their participants received the full range of financial supports. However, the percentages managers reported we highly variable (from as few as 15% up to 100% of participants experienced the full range). Most believed that the majority of their participants got the full range of supports. Twenty-seven managers reported 80% or more participants. However, six managers reported that less than half of their participants received the full range of financial supports offer
Figure 18: Box-&-Whisker Plot - % experiencing all financial supports Figure 19: Histogram - % experiencing all financial supports
Approximately ninety-three percent (92.7%) of managers believe that participants spent all of the funds allotted to them.

51
5.1.8 Areas Where Classified Program Funds Were Used
In surveys, managers were asked about the range of financial supports provided to participants. Participants were asked an aligned question about the financial supports they had used. There were sizeable differences between the result from the two groups. A much more substantial percentage of managers reported providing these supports than did participants report experiencing them in all cases. For example, approximately 80% of managers reported making available textbooks, test preparation courses, and test registration fees, but around half of the participants experienced these supports.
Figure 20: Areas Classified Program funds were used
5.1.9 Individualized (Non-Financial) Support For Classified Participants
The most frequently mentioned non-financial support were classes to assist in passing required tests and moving participants through the process in a cohort. They were particularly outspoken on the benefits to participants of this type of relational support. Being part of an organized peer group and having classes and study partners to assist them in passing required tests were the individualized support that worked best for them. The consensus seemed to be that these two supports seemed to help them make better progress toward their credential goal. Participants who did not have these said supports would have helped them "get there" much sooner.
It's definitely the test preparation. “Study dotcom.” was really helpful, and the weekly meetings whenever we have them. That pertains to the test that we will have to take. That's definitely helpful.

52
I really did like the cohort system. It was nice. I started with people in 2017 and finished in 2019. We really reached out and helped each other. I’m still friends with a lot of them. I really struggled in math. If it had not been for a lot of people in the cohort helping to tutor, I would not have passed math. The whole cohort experience was awesome. I appreciated the cohort. The camaraderie was great.
Most managers admitted that they did not provide much individualized (non-financial) support to participants. Participants agreed with this.
The financial part was helpful. But that is the only thing I’ve had in this program.
The only support I received was when I called the university about the financial support from the grant. I really haven’t had any other support.
A few participants reported that they received advice from university counselors, which was very helpful. One participant reported that she did not have any university advice initially and took classes that were not counted toward the credential requirements. Another had a bad experience when he asked the university counselor for advice.
When I asked the university advisor about the difference between the ED TPA and the Cal TPA, he got very upset with me and said, “Well, if you want to go that route…”.
Those that did not have individualized support mentioned how helpful it would have been.
But if we would have someone that we can study with, like a study group, that would have been helpful.
Participants also talked about the need for a mentor.
I thought having a mentor of some sort would really benefit me. I felt I had a hard time. I would call my university advisor, and then I wouldn't get a callback, or I would send out an email asking something, and I would not get a reply until maybe a couple of days later. I just feel that support isn't there. We used to recruit teachers to be mentors, but now we don't. Now we ask candidates
to recruit their own mentors.

53
Prevalence of individualized (non-financial) support strategies
In surveys, managers were asked about the range of individualized (non-financial) supports provided to participants. Participants were asked an aligned question about the individualized supports they had experienced. There were sizeable differences between the result from the two groups. A much more substantial percentage of managers reported providing these supports than did participants report experiencing them in all cases. These differences were particularly significant in the provision/experience of university advising and being part of a cohort. Almost a ¼ participants reported not experiencing even one of the modes of individualized support. The most considerable disparity between participants and managers was the number that said “check-ins” were not part of their program (only 5% of managers and over 20% of participants).
Figure 21: Individualized (non-financial) support provisions/experiences

54
Figure 22: Program supports that were not provided/experienced
Most helpful individualized moving participant toward a teaching credential
Managers and participants were asked which support (non-financial) strategies were most helpful in moving participants forward toward obtaining a credential. Managers rated five areas as “strongly agree.” Those in rank-order being: Personal mentoring, regular check-ins to see how participants are doing, university advising, being part of a cohort of peers, and test preparation courses.
Participant highest ratings were in the “moderately agree” range. Those supports in rank-order were: Regular check-ins, test preparation courses, and being part of a cohort of peers. All other ratings from participants fell into the “slightly agree” category. Participants rated all questions much lower than did managers. Comparisons of results for managers and participants contain statistically significant differences in all areas.

55
Figure 23: Comparison regarding most effective supports

56
5.2 CHALLENGES (CONFOUNDING VARIABLES)
5.2.1 Section Summary
In focus groups and interviews, managers were nearly unanimous in their perspective that recruiting ("keeping their slots filled") was an ongoing challenge. They attribute their lack of recruiting success to the financial difficulties faced by participants, unattractive/unclear recruiting materials, and the grant criteria. Most believed it was a struggle to get answers to emails and get classified staff to meetings. They also talked about the difficult financial situations in which classified staff found themselves. Several participants felt they had a challenge in getting information about the program. There seemed to be some level of confusion regarding program requirements and processes. There was frequent mention of changing/new staff. Several programs had a great deal of success recruiting by spending time making personal contacts with classified staff. These programs had waiting lists and reported less difficulty in recruiting participants. In surveys, managers were asked about their challenges to recruiting participants. Participants were also asked several aligned questions regarding challenges in joining the program. The most significant challenges for both role groups were financial barriers and family/personal challenges. Significant statistical differences between manager and participant ratings were found in all but one question. Participants rated the obstacles as far less challenging than did managers. Also, over half of the managers reported challenges reaching a diverse candidate pool and recruiting in specialties where their region has teaching shortages During the qualitative portion of the evaluation, it became clear that there was a great deal of room for improvement in LEA/IHE collaboration. Changing staff and lack of timely email response were frequently cited as causes for both leadership and participant discouragement. Some managers did not know their IHE liaison. Collaboration was a particular challenge where participants were allowed to attend any college or university of their choosing. In the survey, managers were asked about the challenges of working with their IHE(s). Between one-third and 40% of managers responded that lack of communication and changing staff made collaboration challenging. Retention and progress monitoring was also a challenge for the majority of programs. Many mentioned that they had difficulty keeping track of candidates and staying connected. The experience of the evaluators reflects these sentiments. Many programs did not have up-to-date lists of the participants in their programs or recent contact information. During this evaluation, it took many months to obtain participant names and email addresses. When these lists were finally shared, many of the participants were not in the program or had incorrect contact information.

57
There was surprise among participants in two participant focus groups when they heard one program had quarterly meetings and made visits to the campuses of participants several times a year to find out how they were doing. These visits included reflection and goal planning sessions which other participants said would have been valuable. In some programs, participants had never talked to anyone administering the program and only turned in receipts for payment. Some managers discussed their difficulties with their participants passing required
tests. If participants could not pass the tests, managers believed they could not be
retained in the program. Some managers also reported that candidates had to be
dropped because they were not continuously enrolled in an IHE.
Managers were asked about the challenges of retaining participants in the program. Participants were asked an aligned question about challenges to remaining in the program. These two perspectives were compared. Both role groups rated the financial barriers and passing required tests as the most frequent barriers to retention in the program. Managers more frequently agreed that all barriers were challenging than did participants. These differences were statistically significant for financial obstacles, passing required tests, and family/personal challenges.
Participants made many comments about their deep appreciation for the financial support from this program. However, they also said that they needed more of this financial support. Participants expressed fears that they would not have the ability to support their families when they were required to complete student teaching.
The range of allowable reimbursements varied widely. During focus group sharing, some participants were dismayed that other programs had been allowed so many additional items for reimbursement. They commented on how this more comprehensive range of reimbursement would have been helpful. One interviewee talked about how she lived near the southern border of California and had to travel a long way to take tests and how she would have appreciated travel reimbursement. One IHE working with several districts expressed frustration with the different payment processes.
Participants were asked about their financial challenges during their Classified Program enrollment. Participants agreed there were challenges in all areas investigated. Approximately half of the participants agreed that paying living expenses and school-related expenses were challenging. Results from managers mirrored these findings. Participants reported that they spent an average of 16 hours per week in classified program-aligned activities. Sixteen percent of the participants reported working another job (besides their classified or teaching position) with an average of 13 hours per week spent at these jobs. Some participants talked about the stress of taking an additional job and their full-time classified/teaching position. These extra jobs included Doordash delivery, in-home care services, and “working in the fields.” In the qualitative portion of this evaluation, most managers reported that participants initially did not understand the time commitment for program participation. This lack of understanding caused some participants to drop out.

58
In focus groups and interviews, participants frequently expressed concern that COVID-19 might make their job search more difficult. In the survey, there was strong agreement that Covid-19 had negatively impacted participant progress. Managers moderately agreed that Covid-19 had negatively impacted the success of the Classified Program. When pre and post-COVID-19 results were compared, participants had the most increased difficulty accessing the internet. Participants also reported increased food and housing insecurity. Covid-19 did not change the hours participants worked on program activities or in extra jobs.
5.2.2 Challenges In Recruitment For/Joining Classified Programs
In focus groups and interviews, managers were nearly unanimous in their perspective that recruiting ("keeping their slots filled") was an ongoing challenge. They attribute their lack of recruiting success to the financial challenges of the participants, unattractive and unclear recruiting materials, or the grant criteria they had initially set up. Most managers felt that it was a struggle to get responses to emails and get classified staff to attend meetings.
Why do we have trouble giving away money? What's going on? And I think that
maybe it was just some of the promotion wasn't very clear or the actual materials
sent out to our classified employees weren't very attractive to visually appealing.
Our recruiting just didn't work. So I started just going through that list and whoever
had the most units at that point was the B.A. people. I just started emailing them,
seeing if they were interested, looking at what their B.A. was in before I emailed
them, and I just started that way. At this point, I'm very open with our with our
bargaining unit also to get it in their newsletter. We have a slot open; if you're
interested, email me. So it's kind of changed over time of how I'm going about
recruiting when I have a slot.
We got the impression we were initially full, but we certainly are not now. But I think the first couple of years when it was popular, it was full and had a waitlist, but no longer the case. We would like a greater emphasis on diversity. It seems that after a while, because our slots weren't filling, that we were happily accepting anybody that met the minimum requirements. But we didn't keep our eye on that diversity. We need to work at really highlighting the need for that diversity so that it better serves the population of students that they are serving, which is clearly diverse. We need to have some more intentionality behind that message being shared.
We actually had enough candidates, but then we had a group that. Either that foreign transcript evaluations that needed to be done and they didn't get completed, we had some people who just could not pass the test, and all those folks dropped off.

59
Managers also spoke about the difficult financial situations in which classified staff found themselves.
Why can we not fill these spots? And we've been trying to do more marketing. I feel
like it's (money). We give just over three thousand dollars to the students. Honestly,
people with full-time jobs and families have trouble figuring out how in the world
they're going to pop out of their job to finish the program, ultimately
Several participants felt that they had a real challenge in getting information about the program. There seemed to be some level of confusion regarding program requirements and processes. There was frequent mention of changing/new staff.
So the district doesn't seem to know what's going on with the program.
They changed the director because she retired. And then we got a second one for just a couple of months. And then she retired, and then we had a third one. And I think she's the one who still in place. Twice they changed the actual system they used - where we submit the paperwork, the schedule, the fees.
One program spent a lot of its staff time going out to schools, making direct contacts with classified staff, inviting them to apply for the program, and answering questions. This program reported no difficulty recruiting or retaining participants and had a waiting list. In surveys, managers were asked about their challenges in recruiting participants. Participants were also asked several aligned questions regarding challenges in joining the program. The results of the matched questions are compared in figure 26. (Separate figures for both sets of questions of which some are slightly different are shown in figures 24 & 25) The most significant challenges for both role groups were financial barriers and family/personal challenges. Significant statistical differences between manager and participant mean ratings were found in all but one question. Participants rated the obstacles as far less challenging than did managers. Over half (54%) of the managers report challenges reaching a diverse candidate pool and recruiting in specialties where their area has teaching shortages.

60
Figure 24 shows were over half (54%) of the managers report challenges reaching a
diverse candidate pool and recruiting in specialties where their area has teaching
shortages.
Figure 24: Recruitment challenges for managers

61
Figure 25: Retention challenges for managers

62
Figure 26: Comparison of manager and participant ratings regarding challenges to recruiting/joining

63
5.2.3 Challenges Of The Classified Program And IHE Collaboration
During the qualitative portion of the evaluation, it became clear that there was much to be done in LEA/IHE collaboration. Changing staff and lack of timely email response were frequently cited as discouragement causes. Several IHE liaisons also stated they had the same problem with LEAs. Some managers did not know whom they were liaising with at the IHE. This problem was especially true in programs where participants could go to any college or university of their choosing. Participants did not say a lot about the IHE/LEA partnership. One offered the observations that “The district and the university don’t seem to know what each other is doing.”
In surveys, managers were asked about the challenges to working with their IHE(s). While, overall, they slightly disagreed that there were challenges, between 35 and 45% reported that the lack of communication and changing staff made collaboration difficult.
Figure 27: Manager belief regarding challenges working with IHEs

64
5.2.4 Challenges To Retention/Remaining In The Classified Program
Progress monitoring was not easy for most programs. Many mentioned that they had difficulty keeping track of candidates and staying connected.
It's been hard to communicate with who is exactly in the program, who is active. So constant communication with them has been a little troubling.
The biggest problem was definitely candidate continuity and just keeping track.
Sometimes people just dropped off. They just didn't respond, and they had used funds and then they just kind of disappeared.
For us, monitoring progress was ineffective in just following the candidates through the process. I think we certainly could have done a better job. It's like they were in the program, and we would check-in at the end of the year with the survey. But there was no ongoing progress monitoring from our standpoint.
I think the most difficult pieces to implement were our regular connections with the
candidates and what we found is that these candidates are full-time employees, at
least to start until they get to student teaching, And so often they've got families
lives, full-time jobs, and sometimes would have to pop out for a semester. We've had
some people that stopped working for our district and therefore weren't eligible for
the grant anymore. And so there's been a lot of fluidity with our candidates. And it
has been very difficult for me. It's been hard for me to communicate with the IHE,
which has our students. It's been hard to communicate with who is exactly in the
program, who is active, and so constant communication with them has been a little
troubling
The tracing piece was complicated." Where are you? Have you taken CBEST? Have you taken steps you were supposed to?" The ongoing communication and tracking piece has been the hardest. It would be nice if the state could send out a link to everybody who's a participant and basically, twice a year ask them a series of questions. Hold that all in a database and let us know that this is where your people are at. This is the feedback that they gave. It looks like this person didn't respond. Follow up. It is probably as simple a survey that exports into a database on the state level. If it was coming from the state, they would take it more seriously.
The experience of the evaluators reflects these sentiments. Many programs did not have up-to-date lists of the participants in their programs or recent contact information. It took many months and contacts to obtain the lists of contact names and email addresses. Approximately 1/3 of the lists contained incorrect email addresses for participants that had to be corrected or replaced by the programs. Many participants were surprised when they heard from one program visited with participants at their workplace every quarter for reflection and planning meetings. Others did not know who oversaw the program at all. Others reported that the program had never contacted them, but they just turned in receipts for payment.

65
Some managers found it difficult to retain candidates because they could not pass the
required tests or were not continuously enrolled.
I felt like I was constantly shuffling that enrollment data as we wouldn't lose a lot,
one or two. They weren't making it through the testing, so they weren't spending any
money. And so the money was not being used because we had named that person as
one of the participants. If we had a little more flexibility, I think we could have
maximized the funding better
Just looking at how much money was actually left on the table, If I did it again, I
might have folks on this grant come in with those CSETs passed. But that is going to
take the diversity right out of it.
Getting the participants to take a path in a somewhat linear fashion is difficult -
making sure that they stay enrolled and attempting to take their tests, whether it be
the CBEST, RICA, or the CSET, in a timely fashion.
Many participants did not realize they needed to be continuously enrolled. And so
they were taking one class here and one class there. Those who were starting at the
bachelor's level were attempting to take electives that were not aligned to
credentialing. And we have had to sift through a lot of what's allowed by the grant
parameters and what's not. And we've had quite a number that have had to drop out
or drop their participation because they weren't actively enrolled. Then they would
come back a semester or a year later asking if we could be re-enrolled. So just a lot
of logistics that come with working with that many people that are enrolled in the
program and everybody taking their own path at their own speed has really created
a number of challenges in the way that money is being spent. We have not spent all
of the money that's been allocated to us for those reasons.
Some participants nearly left the program because of a lack of support from their school district for doing observations or student teaching and the difficulty in getting hired locally.
I had an expectation that I would receive support from my school district for observation hours and help with student teaching. I'm very sad to say that not only myself but another colleague who was also in the grant program didn't receive very much support from our school district. And about five or six of my classmates that were in the same grant program cohort applied to work at our school district, and nobody was hired. In fact, the administration went to recruit in Texas - another state. Nobody was recruited from our local candidates or employees that were part of this grant program. So it was really disheartening. The assistant superintendent told me that I would never get hired because I didn't have teaching experience. You have to start and get experience somewhere. I really appreciate this program, but I would say the lack of support from my district’s assistant superintendent to get my 70 hours of observation done was a problem. I requested to do it in my own school, which was okay with my principal, but the assistant superintendent denied the request. So then I had to go look for another school district that would allow it. So that was a barrier or an obstacle because he denied me being able to look in a classroom within my school district

66
during the summer months when I wasn't working my regular hours in a migrant setting. So then I had to look at neighboring schools and see who would let me in to let me do this requirement so I can continue on with my education. And fortunately, there was another classmate where her school district allowed her to do this. So I made time after work to go talk to the principal. She referred me to the district office. The secretary there asked the principal in charge of a small school in the language immersion program. And he gave me permission to come to the school and he assigned me a teacher. I found that school site so supportive. I cried when I had to leave in my last observation because they provided me so much support. I could compare my school district with their school district, and I would say there was 200 percent more support at that school district for the same program.
In surveys, managers were asked about the challenges of retaining participants in the program. Participants were asked an aligned question about challenges to remaining in the program. These two perspectives were compared and shown in figure 28. Both role groups rated the financial barriers and passing required tests as the highest barriers to retention and remaining in the program. Managers rated all questions as more significant challenges than did participants. These differences were statistically significant in the areas of financial obstacles, passing required tests, and family/personal challenges.
Figure 28: Distribution - Manager challenges to the retention of participants

67
Figure 29: Distribution - Participant challenges to remaining in the program
Figure 30: Comparison of manager and participant ratings regarding challenges to retention/remaining

68
5.2.5 Financial Challenges
Participants made many comments about their deep appreciation for the financial support from this program. However, they also say that they need more of this financial support.
I was a paraprofessional, so I wanted to be a teacher and I heard that the
program could help me financially and I could use all the help I could get. It has
been great!
My district gave me two options for getting this grant. Go to university at
Laverne or Cal. Cal had a waiting list for two years and I wanted to join that
year, so I had to go to Laverne. Laverne is very expensive now. I am now getting
my credential but it has cost me $51,000. I got $12,000 from the grant and I
really appreciate it, but I still have to pay back $51,000. So the way it is stressful
is the way how much money I have to pay back
Some participants expressed the fear that they would not have the ability to support their families when they were required to complete student teaching.
If you're doing your student teaching during the school year and you have to
have unpaid leave of absence from your job to do it, you don't have any money.
My dilemma was whether I would do the student teaching only and of course not
get paid or be an intern and get paid less.
What the university does here is you take classes and student teaching at the
same time so they cannot be working. And there was no way I would have been
able to do the program if I didn't have a job. So I appreciated the fact that at the
other program everything was online and that I could keep working my full time
job
In focus groups, participants shared what was allowed for reimbursement. Some participants were surprised that other programs had very different allowable expenses and very different allowed maximums. There seemed to be no consistency. Some programs allowed reimbursement only for tuition; some would also reimburse for books. Other programs reimbursed application fees and test preparation classes, and registration.
Our money can't be used for tuition for the continuation of the second phase. So
if we could get support with certifications to add to the credential, it would help. I
was declined due to the fact that the grant doesn't allow that.
Our grant only allows $1400, but that came in handy.
We are allowed about $3,000 per year per physical year, so it was helpful. I was
really hoping that I was going to get a little bit more so I could pay for books, but
our grant doesn’t cover books.
Another problem is that when you apply for reimbursement, you need to submit
receipts first. So you have to pay first and then to get the money back. So

69
sometimes, I don't know how can I manage it. And each semester I have to pay
like $5000 now and the grant is less than $2000.
One interviewee talked about how she lived near the southern border and had to travel a long way to take tests and how she would have appreciated that assistance.
One IHE was working with several districts, expressed frustration with the different
payment processes.
It was tough because each district ran it so differently, some direct pay, some
reimbursement to the students. It meant flagging the student for the CTC grant and
became, like herding feral cats just to know that they were going through. Some
districts handled it fabulously, and in others, it was more just to let the student
decide what they want to do.
In surveys, participants were asked about their financial challenges during their Classified Program enrollment. While all averages fell into the “disagree” area, the wide range of participant responses can be seen in the high standard deviations in figure 31. This disparity in results can also be seen in the frequency chart following. Half of the participants agreed that it was a challenge to pay school-related expenses, and 40% found it difficult to pay some living expenses.
Figure 31: Distribution - Financial challenges for participants during enrollment
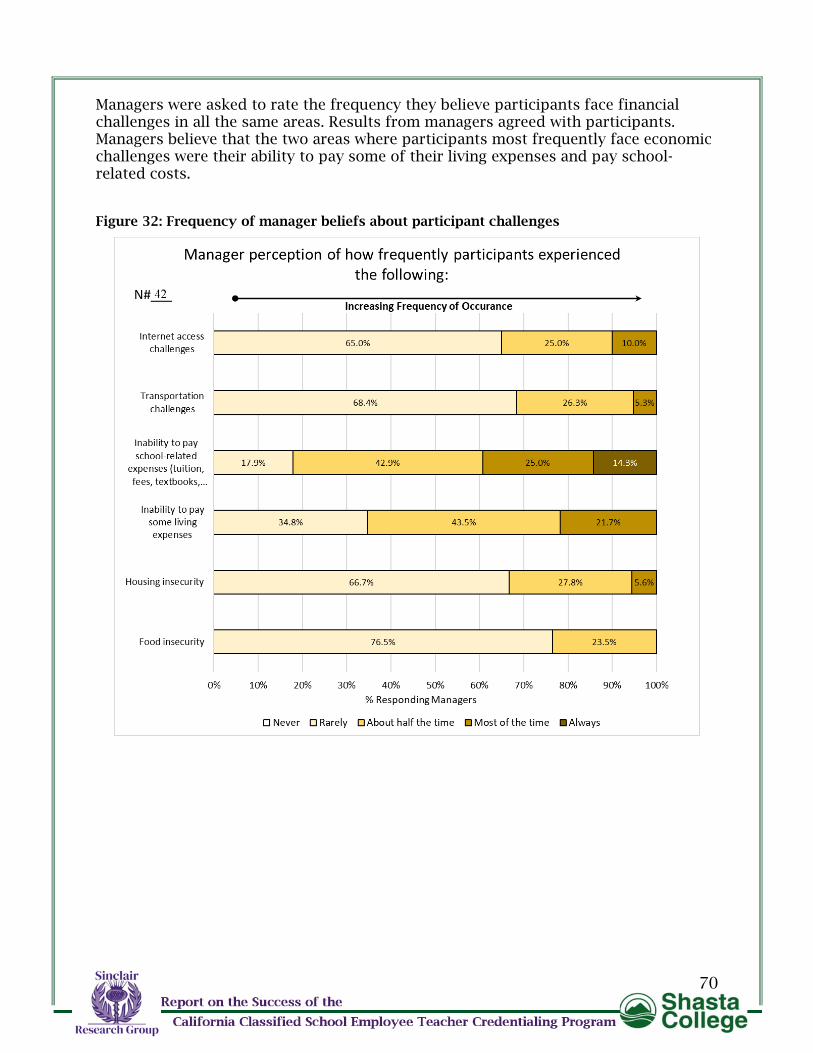
70
Managers were asked to rate the frequency they believe participants face financial challenges in all the same areas. Results from managers agreed with participants. Managers believe that the two areas where participants most frequently face economic challenges were their ability to pay some of their living expenses and pay school-related costs.
Figure 32: Frequency of manager beliefs about participant challenges

71
5.2.6 Time Challenges For Participants
In the qualitative portion of this evaluation, managers reported that most participants initially did not understand the time it would take to stay in the program. This lack of understanding caused some participants to drop out.
The part that became difficult is for the participants to understand what it looks like to work full time, go to school full time, and most of them have families of their own. So it was a struggle for them just in a workload capacity to be able to accomplish all those things that they wanted to do.
Participants talked about the stress of not having enough time and having too much to do.
It was very, very time consuming and I got a little overwhelmed many times with
just having to do it all.
You're just doing school. You're meeting deadlines. You're doing discussion
boards. Coming from someone that I haven't been to school in many, many years,
it just was way more work than I expected. I was just so done when I got near the
end, it was just way more than I anticipated.
I just don't have enough time or money right now.
The length of the participant work week was investigated further in the surveys. Participants reported that they spent an average of 16.2 hours per week in classified program-aligned activities. Eighty-eight participants (16.1%) reported working in another job. Seventy-four participants responded to the question, “How many hours per week do you work at another job?” (besides their classified or teaching position). They reported an additional approximately 13 hours (average) spent at these jobs. Appendix D provides a list of these additional jobs.

72
Figure 33: Hours participants worked on classified program activities
Figure 34: Additional weekly hours participants worked additional job

73
5.2.7 Impact Of Covid-19
The main concern among participants voiced in focus groups and interviews was that COVID-19 might inhibit hiring in their district. They feared there would/was less opportunity for them to get a job in their district.
COVID made it really hard for me to pass the tests. They were cancelled several times and rescheduled for different places that weren’t convenient at all.
One participant talked about the challenge of accessing the internet during the pandemic.
I wish my grant allowed me to get a new laptop. Everything is online now and my computer doesn’t work very well. I have really bad internet and I often can’t get on it from home.
In surveys, participants moderately agreed that Covid-19 had negatively impacted their progress toward becoming credentialed California teachers, with two-thirds agreeing and a quarter of participants strongly agreeing. More so, managers agreed more frequently that Covid-19 had negatively impacted the success of the Classified Program.
Figure 35: Manager & participant comparison of COVID-19 impact

74
Covid-19 did not significantly change the additional working hours (extra jobs, program activities) of participants.
Table 4: Change in working hours due to COVID-19
Shifts in Workload Due to Covid
Δ= Change Working in another job
Working on program-aligned
activities
Δ Mean -0.4hr -1.6hr
Δ SD 0.9hr -0.1hr
Δ Min 0.0hr 0.0hr
Δ Median 0.0hr -5.0hr
Δ Max -2.0hr -3.0hr
Participants reported that Covid-19 primarily increased their difficulty in accessing the internet. Transportation challenges and the inability to pay school-related expenses had the most significant increase in disagreement.

75
Figure 36: Changes in ratings for program success resulting from Covid-19

76
Figure 37: Comparison of changes in participant satisfaction resulting from COVID-19

77
Figure 38: Comparison of changes in participant satisfaction resulting from COVID-19 (cont.)

78
Figure 39: Change in ratings of participants challenges resulting from Covid-19

79
Figure 40: Comparison of changes in participant “challenges experienced” resulting from COVID-19 (please note that “strongly disagree” is the more positive result and therefore it is listed on top of the chart)

80
Figure 41: Changes in manager perceptions of challenges faced by participants resulting from Covid-19

81
5.3 SATISFACTION (OUTPUTS)
5.3.1 Section Summary
Participants expressed high satisfaction with the extent to which the classified program supported them financially. They were grateful and often stated that they could not have done it without the program's financial support. In addition to the financial support, the participants were most satisfied with: (1) moving together through the program with cohorts of peers and (2) taking test preparation classes. Those participants who experienced a peer cohort model were more vocal about how it helped them study and make progress. Those who received test preparation classes described the benefits of assisting them in passing their required tests. The programs about which participants spoke most positively were those with the "personal touch." Participants strongly agreed (95%) that they would recommend the Classified program to others who wish to become teachers. When they were asked about their satisfaction with the various aspects of the Classified Program, all results but one were in the “moderately agree“ range. The two statements that got relatively higher ratings were, “The program was successful overall” and “The program gave me the financial support I expected.”
The one area in which there was some evidence that participants were not as satisfied was the extent the program provided them with individualized (non-financial) support based on their needs.
Nearly all managers verbally expressed that they felt the program successfully accomplished what it intended. Managers agreed that they successfully recruited participants and retained them in the program and that participants had made sufficient annual progress. They generally agreed that they were satisfied with the various aspects of the program. The top four rated areas were that the program was effective in helping classified participants obtain their teaching credentials, was successful overall, well organized, and implemented a thorough process of recruiting classified participants.
Most managers were not satisfied with their collaboration with IHE partners. In surveys, the lowest-rated area was the extent management collaborated effectively with their IHE partner(s). Also, new managers were more vocal about their difficulty discerning program processes and policies.
Common questions about satisfaction, asked of managers and participants, were matched. Managers rated all their matched questions higher than did participants. On average, managers “strongly agreed” that leadership effectively moved participants toward obtaining a credential, that the program effectively communicated, and that the program was successful overall. Participant responses averaged in the “moderately agree” range, except for one (providing participants with individualized support based on needs – averaging only slight agreement).

82
When role group responses were compared, there were several statistically significant differences. These were in the areas of program effectiveness in helping move participants toward obtaining a teaching credential, the sufficiency of communication from program leadership, leadership awareness of participant progress toward becoming a teacher, the overall success of the program.
5.3.2 Participant Satisfaction With The Classified Program
As previously stated, in focus groups and interviews, participants expressed high satisfaction with the extent to which the classified program supported them financially. They were grateful and often reported that they could not have done it without the program's financial support. Those participants who experienced a peer cohort model were more vocal about how it helped them study and make progress. Also, those who had test preparation classes reported that it was beneficial to get through those hurdles. Participants said they would recommend the Classified program to others who wish to become teachers. On the surveys, over 95% agreed.
Figure 42: Extent participants would recommend Classified Program

83
When participants were asked about their satisfaction with the various aspects of the Classified Program, all but one statement averaged moderate agreement. The two statements that got relatively higher ratings were:
• The program was successful overall. • The program gave me the financial support I expected.
Both of these were rated +1.63 or above. The lowest rating (+0.67-slightly agree) was for the extent the program provided participants with individualized (non-financial) support based on their needs.
Figure 43: Distribution – Participant ratings of program satisfaction

84
5.3.3 Manager Satisfaction With The Classified Program
In focus groups and interviews, managers agreed that the program financially supported classified staff in moving toward obtaining a teaching credential. They were generally satisfied with most aspects of the program. When dissatisfaction was expressed, it was generally from those managers new to their role and having difficulty discerning program process and policy. However, most managers were not satisfied with the level of collaboration they had with the IHE. In surveys, managers averaged strong agreement that they successfully recruited participants and retained them in the program.
Figure 44: Extent managers rate recruiting/retaining and facilitating participant progress

85
Managers generally agreed that they were satisfied with the various aspects of the program. The top four rated areas (all averaging “strongly agree”) were that the program was:
• effective in helping classified participants obtain their teaching credential • successful overall • well organized • implemented a thorough process of recruiting classified participants
The lowest rated area was the extent management collaborated effectively with their IHE partner(s).
Figure 45: Manager satisfaction with the Classified Program

86
Figure 46: Distribution – Manager ratings regarding program success

87
5.3.4 Comparison Of Participant And Manager Satisfaction
The opportunity was taken to match satisfaction levels for common questions asked of managers and participants in reporting survey results. Managers rated all matched questions higher than did participants. They averaged strong agreement that leadership effectively moved participants toward obtaining a credential, that the program effectively communicated, and that the program was successful overall. Participant responses were at the “moderately agree” level, except for one (providing participants with individualized support based on needs – averaging “slightly agree”).
When role group responses were compared, there were several statistically significant differences. These were in the areas of:
• Program effectiveness in helping move participants toward obtaining a teaching credential
• Sufficiency of communication from program leadership
• Leadership awareness of participant progress toward becoming a teacher
• The overall success of the program
Figure 47: Comparison of participant and manager satisfaction with the program

88
Figure 48: Distribution- Comparison of participant and manager satisfaction with the program

89
Figure 49: Distribution- Comparison of participant and manager satisfaction with the program (cont.)

90
5.4 OUTCOMES
5.4.1 Section Summary
Managers talked with pride about the number of classified participants they had already placed in intern positions. Those participants who were already in classrooms or near that goal spoke very positively about how the financial support the program had given them had helped them reach their goal.
Managers believe approximately 20% of participants leave the Classified Program before obtaining their teaching credentials or a teaching position. The range was from 81% in one program to 0%. Most responses were between 10% and 30%. Participants overwhelmingly expressed the desire to become a fully credentialed California teacher. In the survey, they were asked if this was their goal when they began the program. That result was compared with their current goal. Just 1% of participants said this was not their goal at the start. The number stating it was not their current goal rose slightly, but the change was not significant.
Participants not yet in the classroom overwhelmingly expressed their desire to continue in the program and the hope that the program would continue to be funded. In the survey, they were asked if they would be willing to continue to pursue becoming a fully credential California teacher “with” and then “without” continued support from this Classified Program. They strongly agreed they would continue WITH continued support (+2.44) and moderately agreed (+1.20) that they would continue WITHOUT continued support. The difference in the two average ratings was statistically significant. The number of participants that said they would not continue to pursue a credential grew from one in twenty to one in four when Classified Program support was not available.
Most participants reported wanting to take a teaching job in their own district but feared no jobs were available. They talked about the need for the program to assist them in finding these jobs.
In the survey, participants were asked whether they would take a teaching job in their district when they qualified. They averaged strong agreement (+2.43). Of the respondents who were “unsure” or “disagreed” (132) about taking a job teaching in their district, ¼ responded that there were too few job openings or that COVID-19 had impacted hiring.
5.4.2 Participant Intention To Become A Fully Credentialed California Teacher
Managers talked about the number of classified participants they had already placed in intern positions. Those participants who had already been placed in classrooms or near that goal spoke very positively about how the program had helped them get there.
Participants not yet in the classroom overwhelmingly expressed their desire to continue in the program and the hope that the program would continue to be funded.

91
Most participants reported that they wanted to take a teaching job in their own district but feared there would be no jobs left for them. They did talk about the need for the program to assist them in finding these jobs.
5.4.3 Beginning And Current Goal Comparisons
Participants were asked if it was their goal to become a fully credentialed California teacher when they began the program and their current goal. Just 1.1% of participants said this was not their goal at the start. This number moved up slightly to 4.4%. However, this was not a significant difference.
5.4.4 Intention to Continue With Or Without Support
Participants were asked if they would be willing to continue to pursue becoming a fully credential California teacher “with” and then “without” continued support from this Classified Program. They strongly agreed they would continue WITH continued support (+2.44) and moderately agreed (+1.20) that they would continue WITHOUT continued support. The difference in the two mean ratings is statistically significant. The number of participants that said they would not continue to pursue a credential grew from one in twenty to one in four when Classified Program support was not available. Figure 50: Participant intention to continue with or without support

92
5.4.5 Likelihood Participants Take A Teaching Job In District
Participants were asked whether they would take a teaching job in their district when they qualified. They strongly agreed (+2.43).
Figure 51: Participants likelihood of teaching in district
5.4.6 Reasons For Not Taking A Teaching Position In District
Respondents who were “unsure” or “disagreed” (N=116) about taking a job teaching in their district. One quarter responded that there were too few job openings in their district or that COVID-19 had impacted hiring. Twenty percent responded that they already had a position that they did not intend to leave.

93
Figure 52: Participant reasons for NOT taking a district teaching job
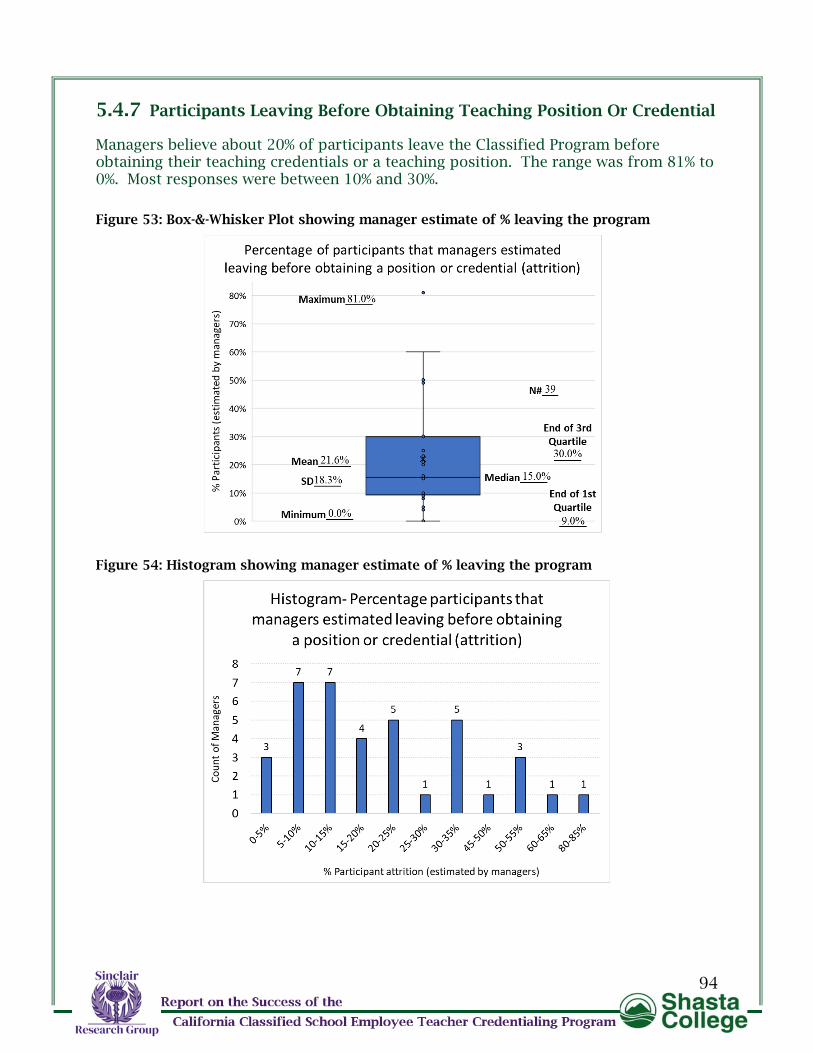
94
5.4.7 Participants Leaving Before Obtaining Teaching Position Or Credential
Managers believe about 20% of participants leave the Classified Program before obtaining their teaching credentials or a teaching position. The range was from 81% to 0%. Most responses were between 10% and 30%.
Figure 53: Box-&-Whisker Plot showing manager estimate of % leaving the program
Figure 54: Histogram showing manager estimate of % leaving the program

95
5.5 IMPACT
5.5.1 Section Summary
To measure program impact, researchers decided that participants would be asked to rate the extent to which the Classified Program had impacted their quality of life (QOL), defined by the World Health Organization as “an individual’s perception of their position in life in the context of the culture and value systems in which they live and in relation to their goals, expectations, standards, and concerns.” (Skevington et al., 2004)
This measure examined wealth, employment, the environment, physical and mental health, education, recreation and leisure time, social belonging, safety, security, and freedom. Participants reported that the Classified Program has positively impacted every QOL Indicator except for leisure time. The QOL Indicators with the most strongly rated impact were education level and employment. Participants also reported that the program had improved their security, environment, mental health, wealth, safety, social belonging, freedom, physical health, and recreation.
5.5.2 Aspects Of Life Improved Because Of Classified Program
Participants believe the Classified Program has positively impacted every QOL Indicator except for leisure time. The QOL Indicators with the most strongly rated impact were education level and employment. Participants also reported that the program had improved their security, environment, mental health, wealth, safety, social belonging, freedom, physical health, and recreation.

96
Figure 55: Participants rating of lifestyle improvements

97
5.6 NEEDS ASSESSMENT
5.6.1 Section Summary
During focus group sharing and one-on-one interviews with managers and participants, suggestions on best practices were collected. Managers were then asked to identify any of these practices already implemented in their programs and the extent any might positively impact their program. Managers reported that all suggested improvements would positively impact their program (average ratings ranged from +2.26 to +0.79). The suggestions that managers believe will impact their program were additional support for passing required tests and ideas for recruiting diverse populations. Participants were also asked to rate any program improvement that might positively impact their progress in obtaining a credential. Like managers, participants agreed that all suggested areas would improve their potential to progress (+2.27 and +1.28). The suggestions that participants believe would most positively impact their progress in obtaining a California teaching credential were additional financial resources, additional supports for passing required tests, and a broader scope for financial reimbursement.
5.6.2 Manager Needs Assessment
Managers (and participants) wanted additional funding to be provided by the state to continue this program. During focus group sharing and one-on-one interviews, it became clear that the Classified Program was implemented in very different ways across the state. Many programs did not provide many support structures other than financial reimbursement. One area that was particularly troublesome for managers was recruiting teachers of color. As managers shared ideas, those in attendance were inspired to move forward and implement these ideas in their programs. There was consensus that one of the most needed things was a forum for sharing ideas and learning from each other. The best practices were collected from these focus groups and interviews and then used in surveys as part of a quantitative needs assessment. Managers were asked to identify any of these practices already implemented in their programs. The frequency of implementation is shown below.

98
Figure 56: Percent of programs already offering suggested program improvements

99
Managers were asked which of these suggestions might positively impact their programs. The mean ratings for managers in all suggested areas were positive (between +2.26 and +0.79). Managers agreed that all suggestions would positively impact their programs. All desired improvements are shown in the table below in rank order from highest to lowest mean rating. This table is followed by a frequency chart that shows the percentage of managers selecting each of the six answer choices.
Table 5: Manager rating of suggested improvements in rank-order
Please tell us the extent you agree/disagree that any of these
improvements would positively impact your program. Mean
(Rank Order) SD
Additional support for passing required tests (CBEST, RICA, etc.) +2.26 1.34
Ideas for recruiting diverse populations +2.20 1.21
Strategies for recruiting in areas of high teaching need +1.94 1.35
Infrastructure that ensures all participants have access to the same
financial and support opportunities +1.90 1.18
An approved policy for providing participants with paid time off to
complete preclinical and/or student teaching +1.79 1.55
Authentic inter-institutional partnership +1.77 1.54
Continuity between incoming/outgoing managers +1.73 1.82
Additional financial allocations for program management +1.68 1.70
Having one person appointed to answer questions for participants +1.60 1.78
Wider scope for financial reimbursement +1.58 1.84
Repository and sharing of recruitment materials +1.54 1.57
Centralized system for tracking participant information +1.50 1.93
Virtual meetings/conference to share ideas/successes with other
program staff across the state +1.48 1.71
Assistance for participants in finding a pre-clinical and/or student
teaching position. +1.46 1.77
Clear definition of the sufficiency of annual progress of the
participant +1.39 1.75
Infrastructure that ensures all programs are implementing the basic
program components +1.36 1.93
Developing cohorts of participants to support each other +1.30 1.54
Collection and use of data for continuous improvement +1.27 1.63
Provision of mentors to support participants +1.22 1.72
Additional assistance to help participants find teaching positions +1.10 2.10
Additional support for English Language Learners +1.00 1.90
Additional contacts from the program to support participants and
find out how they are doing +0.85 1.85
A policy in place to share annual feedback on progress with
participants +0.79 1.90
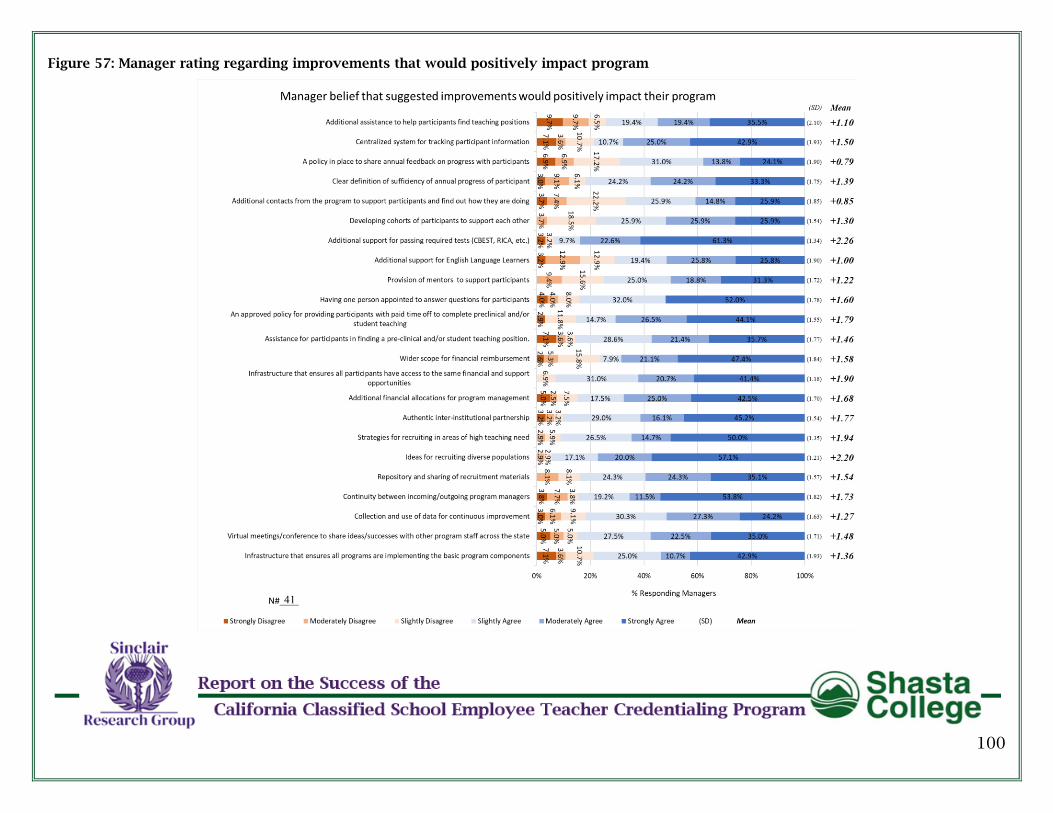
100
Figure 57: Manager rating regarding improvements that would positively impact program

101
5.6.3 Participant Needs Assessment
During participant focus group sharing and one-on-one interviews, suggestions on best practices were collected. Participants were then given these suggestions and asked to rate them according to how they might help them succeed in attaining their California credentials. Results clearly showed that they believe all these improvements would make a positive difference. The rank order table below shows the average ratings and standard deviations (from highest rated to lowest +2.27 and +1.28). The table is followed by a frequency chart showing the distribution of responses from participants.
Table 6: Participant rating of suggested improvement in rank-order
To what extent do you agree/disagree that the following
improvements in the Classified Program would help you be more
successful in becoming a fully credentialed California teacher.
Average (Rank Order)
SD
Additional financial resources +2.27 1.25
A wider scope for financial reimbursement +2.13 1.30
Additional supports for passing required tests (CBEST, RICA, etc.) +2.05 1.44
Assistance to help me find a teaching position +1.96 1.55
Having a centralized system that I can access for tracking my path
toward a teaching credential +1.87 1.53
The same financial opportunities as participants in other classified
programs +1.85 1.46
Arrangements to have paid time off during preclinical and/or student
teaching +1.82 1.74
Having one contact person to answer my questions +1.82 1.63
Providing me with a mentor +1.70 1.69
Developing a cohort of peers that go through the program with me for
shared ideas and support +1.67 1.66
Additional contacts from the program to encourage me and check if I
am having problems +1.65 1.65
Feedback on my annual progress +1.61 1.62
Assistance in helping me find a pre-clinical and/or student teaching
position +1.53 1.70
Additional support for English Language Learners +1.28 1.85

102
Figure 58: Participant ratings regarding improvements that would positively impact credential attainment

103
6 CONCLUSIONS
6.1 JUSTIFICATION OF CONCLUSIONS
It was the role of the evaluation Leadership Team to make a judgment on the success of the Classified Program. The team used the Justifying Standards (Utility, Feasibility, Propriety, and Accuracy) to assist them in making these decisions (Program Evaluation Guide - Step 5 - CDC, 2012). The team:
• Carefully described the perspectives, procedures, and rationale used to interpret the findings
• Considered different approaches for interpreting the findings • Approached the analysis and interpretation in a way appropriate to the
expertise and resources • Considered the standards and values of those less powerful or those most
affected by program success • Explicitly justified the conclusions • Developed conclusions that were understandable to stakeholders
6.2 DECISIONS REGARDING THE SUCCESS OF THE CLASSIFIED
PROGRAM
As yet, there are no state-adopted Standards for the Classified Program. The evaluation Leadership Team decided to use the preponderance of the evidence standard for this judgment, which is defined as "clear and convincing proof which results in reasonable certainty of the truth" (Garner, 2004; Orloff & Stedinger, 1983).
Each Leadership Team member individually rated the extent that the Classified Program successfully achieved each of the four goals outlined by the legislature. All team members independently decided the level of success for each goal on a 1-5 Likert scale (1-not successful, 2-slightly, 3-moderately, 4-very, and 5-completely successful.) The results from the Leadership Team ratings were as follows:
Legislative Goal 1: Supporting the LEA recruitment of classified school employees into teaching careers - Very successful
Legislative Goal 2: Supporting the undergraduate education of classified employees - Very successful
Legislative Goal 3: Supporting the teacher preparation of classified school employees - Moderately successful
Legislative Goal 4: Supporting classified school employees' subsequent certification as credentialed California teachers - Moderately successful
The evaluation Leadership Team collectively believes that, notwithstanding the challenges in implementation, the Classified Program has indeed been a success and is a valuable program helping to ameliorate teacher shortages in California.
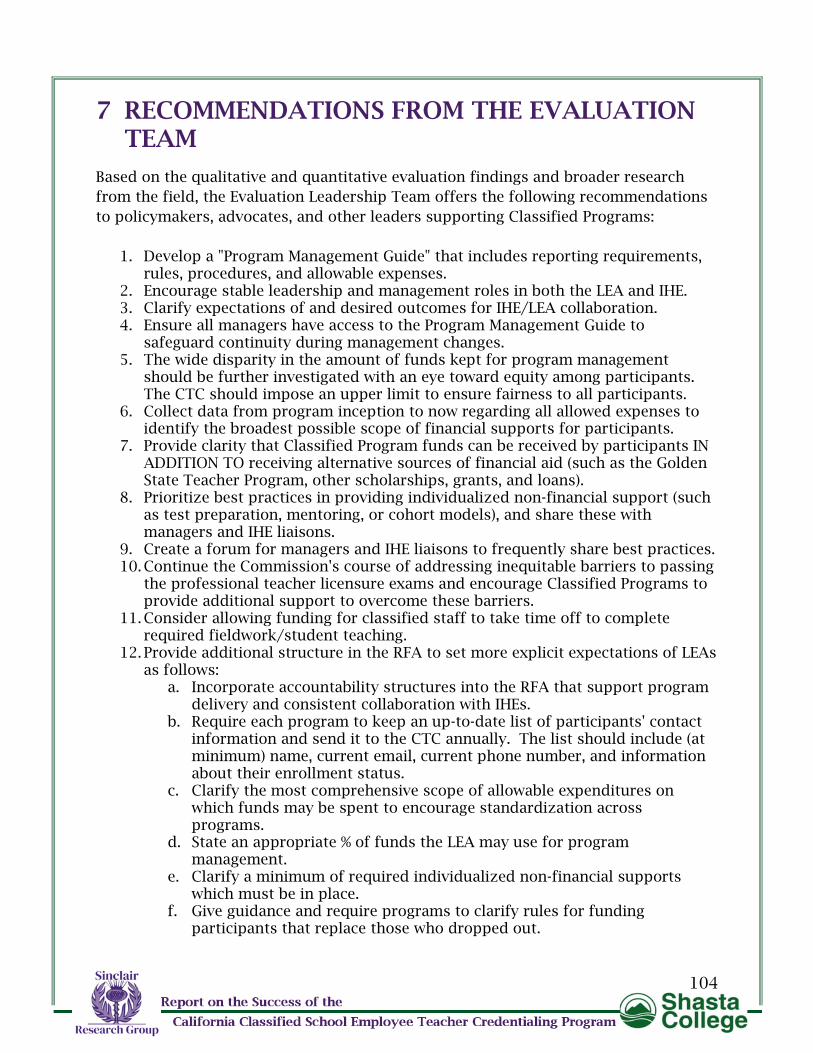
104
7 RECOMMENDATIONS FROM THE EVALUATION TEAM
Based on the qualitative and quantitative evaluation findings and broader research
from the field, the Evaluation Leadership Team offers the following recommendations
to policymakers, advocates, and other leaders supporting Classified Programs:
1. Develop a "Program Management Guide" that includes reporting requirements, rules, procedures, and allowable expenses.
2. Encourage stable leadership and management roles in both the LEA and IHE. 3. Clarify expectations of and desired outcomes for IHE/LEA collaboration. 4. Ensure all managers have access to the Program Management Guide to
safeguard continuity during management changes. 5. The wide disparity in the amount of funds kept for program management
should be further investigated with an eye toward equity among participants. The CTC should impose an upper limit to ensure fairness to all participants.
6. Collect data from program inception to now regarding all allowed expenses to identify the broadest possible scope of financial supports for participants.
7. Provide clarity that Classified Program funds can be received by participants IN ADDITION TO receiving alternative sources of financial aid (such as the Golden State Teacher Program, other scholarships, grants, and loans).
8. Prioritize best practices in providing individualized non-financial support (such as test preparation, mentoring, or cohort models), and share these with managers and IHE liaisons.
9. Create a forum for managers and IHE liaisons to frequently share best practices. 10. Continue the Commission's course of addressing inequitable barriers to passing
the professional teacher licensure exams and encourage Classified Programs to provide additional support to overcome these barriers.
11. Consider allowing funding for classified staff to take time off to complete required fieldwork/student teaching.
12. Provide additional structure in the RFA to set more explicit expectations of LEAs as follows:
a. Incorporate accountability structures into the RFA that support program delivery and consistent collaboration with IHEs.
b. Require each program to keep an up-to-date list of participants' contact information and send it to the CTC annually. The list should include (at minimum) name, current email, current phone number, and information about their enrollment status.
c. Clarify the most comprehensive scope of allowable expenditures on which funds may be spent to encourage standardization across programs.
d. State an appropriate % of funds the LEA may use for program management.
e. Clarify a minimum of required individualized non-financial supports which must be in place.
f. Give guidance and require programs to clarify rules for funding participants that replace those who dropped out.

105
g. Ensure plans are in place to assist participants in finding preservice placements and teaching positions.
h. State the policy for funding time off for participants to complete required fieldwork/student teaching.
i. Describe plans for data collection and continuous improvement. 13. Continue to provide and extend ongoing technical assistance opportunities to
funded programs individually and as a group to support new managers and best practices in implementation.
14. Implement a statewide system for Classified Program continuous improvement.
106
8 LIMITATIONS OF THE EVALUATION
As with most studies, the design of the current evaluation is subject to limitations. Given that there were not enough responses from IHE liaisons to ensure the reliability of the quantitative analysis, the examination of perspectives from IHEs was limited to drawing findings from focus groups and interviews. While IHE qualitative data collection tools yielded valuable findings, triangulation could not be completed using quantitative data. The COVID-19 state health orders required focus groups and interviews to be conducted via Zoom web conferencing. While these interactions were recorded, intonation and expression noted, it was challenging to assess non-verbal information. It is possible that this important aspect of qualitative data collection could have been overlooked or not captured in the recording. Online surveys collected self-reported information from respondents. Therefore issues of selective memory, telescoping the timing of one event into another, false attribution, or exaggeration were possible. The evaluators felt this more applicable to data gleaned from managers. While feedback from managers was compulsory, the participants were able to decline. Therefore more participants who had highly positive or highly negative experiences, either wanting to sing praises or having a “beef to pick,” could have been included in the data collection. Participant contact information was difficult to gather from managers. Early in this evaluation, several rounds of administrative support were needed to properly update the final list of participant contacts used for random sampling. Some participants were not able to be contacted. This may have lead to a more constrained population from which to randomly sample. Employment data for participants was not used in this evaluation. This information would have yielded additional data on participant employment rates, promotion, and attrition. It could also have assisted in assessing employment levels in specialty high-need fields or areas serving underrepresented groups. Stratified random sampling was used to gather representative data from all programs without artificially biasing one program over another. It yielded a broad representative view, but evaluators did not sample everyone. Therefore it is possible that some issues occurring at a finer level were overlooked. Longitudinal effects were difficult to assess in this evaluation. Further studies are needed to examine long-term outcomes such as employment, food, and housing insecurity.

107
9 APPENDIX A: CODEBOOK
CODE BOOK
Communication with
Partners
Communication with IHE, districts, counties, HR,
communication problems, and successes
Financial
Participants Financial constraints or supports for participants in the program
Program Financial considerations for program management and IHE
Implementation How the program was implemented, resources used, successes
and challenges to implementation,
As intended Was the program implemented as intended when they wrote the
grant? In what ways did it change, and why?
Resources Supports for implementation, resources already in place and that
needed to be created, financial resources
Created Processes or resources that had to be created to support the
implementation
For Program Managers Resources that were or were not available to support Classified
Program Managers
In place already Resources already in place that supported the implementation
Improvement ideas Ideas for improving any part of the program
Financial Recommendations for improving the way finances are handled
with programs or participants
Management Recommendations for improving the way the program is
managed
Recruiting Recommendations for improving recruitment
Monitoring progress
How programs monitored or checked on participants to see if
they were making progress toward obtaining their teaching
credential and the meaning of “sufficient annual progress.”
Negative (Double coding) Any negative: challenge, not effective, hardest, no impact, not
satisfied
Outcomes
Impact or outcomes expected and actual - participant, region,
county, district. Surprise or unanticipated outcomes. Impact on
teacher shortage
Actual Outcomes that they have observed as a result of the program
Expected Outcomes or impacts that they expected when they began to
implement the grant

108
Surprise-unanticipated Any unexpected outcomes
Teacher shortage Outcomes that specifically impacted teacher shortage areas
Positive (Double coding) Any positives: success, effective, easiest, most impact, satisfied
(double coded)
Recruitment How did they go about recruiting participants? What worked/did
not work.
Criteria Any criteria that programs used for participant entry into the
program, how this was applied, and any changes
Filling slots Successes in filling slots, why slots were/were not filled, ideas for
filling slots
Recruitment Methodology The methods that were used to recruit participants, which worked
best
Retention Problems or successes in retaining participants in the program
Working with partners Ways in which they worked with districts/county/HR & other
departments – ease of partnership, communication, challenges
Specifically working with
IHE
Assessing their partnership with IHEs - the ways in which
programs worked together with IHEs, the success of those
partnerships, areas that worked/did not work.

109
10 APPENDIX B: FOCUS GROUP QUESTIONS
Classified Program Managers IHE Liaisons Participants
GOAL 1: Program implemented as intended
1. How did you expect this program to
impact your district/county? (What
was the actual impact?)
2. What resources/supports were
already in place that supported
program implementation? What was
not in place that you had to put in
place? (i.e., financial, academic
guidance, individualized mentoring,
release time from job to take classes)?
3. What parts of the program were
easiest/hardest to implement?
(Difficult? Impossible?)
4. What kinds of problems or challenges
were encountered when implementing
the program?
5. How did you monitor and decide if
participants were making sufficient
annual progress?
6. In what ways did you collaborate with
IHEs (communication, advisement,
transitioning)
1. What is your role in your IHE?
2. How frequently do you work with
CCSET program
managers/leadership?
3. What has been your level of
involvement in planning and
decision-making for the CCSET
program?
4. Explain how this program is
implemented in your IHE?
5. What resources are available to
participants through your IHE?
6. What kinds of problems or
challenges have you encountered in
implementing this program in your
IHE?
7. In what ways do you collaborate with
the CCSET program?
8. What aspects of your support plan
for participants in your IHE have you
had to adjust/change?
9. What support or resources, if any,
were provided to you as an IHE
1. How did you expect this program to
function for you?
2. Which parts of the program worked
or did not work for you?

110
7. What aspects of this program were
implemented as you initially intended,
and which were not? And why?
8. What support or resources, if any,
were provided to you as a Program
Manager to facilitate your role in the
initiative?
liaison to facilitate your role in the
initiative?
GOAL 2: Sufficiency of participant recruitment efforts
1. Explain how you went about
recruiting participants? (What entities
were approached and how?)
2. What were the specific criteria in your
program for recruitment (aside from
what was listed in the legislation)?
3. In what ways did you consider areas
of teacher shortage in your recruitment
efforts?
4. Why did you or did you not fill all
your participant slots? (Waiting list?)
5. How would you change your
recruitment efforts if you did it again?
1. What participation did you have in
recruitment efforts?
2. What would you change about
recruitment efforts or participant
selection if you could?
1. How did you hear about this
program?
2. What attracted you to want to be part
of this program?
3. Explain how you were
recruited/onboarded to this program?
(Who approached you?)
4. What suggestions do you have to
increase recruitment or get the word
out regarding future programs?

111
GOAL 3: Identify the range of experience and supports (Compare all perspectives)
1. Explain the typical participant
experience in your program?
2. Give an example of participant
experiences that stand out in your
mind (positive or negative).
3. What participant supports were not in
place that you had to put in place?
(i.e., financial, academic guidance,
individualized career mentoring)
4. Of the supports you put in place, what
were the most/least impactful for your
participants (challenging)
5. What percentage of your participants
do you believe experienced the full
range of supports? (why did some not
receive the full range?)
6. In what ways was your program
effective/ineffective at supporting
candidates in this program?
7. In what ways were your collaborations
with the IHE effective/ineffective?
1. Explain the typical participant
experience in your IHE?
2. Give an example of participant
experiences in your IHE that stand
out in your mind (positive or
negative).
3. What was not in place in your IHE
that you had to put in place? (i.e.,
financial, academic guidance,
individualized career mentoring)
4. Of the supports you put in place,
what were the most/least impactful
for your participants affiliated with
your IHE (challenging)
5. What percentage of participants in
your IHE do you believe experienced
the full range of supports? (why did
some not receive the full range?)
6. In what ways was your IHE
effective/ineffective in supporting
candidates in this program?
7. In what ways were your
collaborations with the program
administration effective/ineffective?
1. Tell us about your experience in this
program?
2. What was in place that was most
helpful to you (i.e., financial,
academic guidance, individualized
career mentoring)
3. What supports did you need that were
not available to you?
4. What supports were available, but not
helpful or necessary?
5. In what ways was your program
effective/ineffective in helping you
achieve your goal?
6. How effective/ineffective was your
IHE? Where did you receive support
or mentoring?
7. How does your experience compare
to that of your colleagues in your
program?

112
GOAL 4: Examine outcomes
1. In what ways were you satisfied/not
satisfied with the outcomes/results of
your program?
2. What outcomes of the program
surprised you?
3. What were the unanticipated benefits
or positive outcomes as a result of this
initiative or partnership?
1. In what ways were you satisfied/not
satisfied with the outcomes/results of
the CCSET program?
2. What outcomes of the CCSET
program surprised you?
3. What were the unanticipated benefits
or positive outcomes as a result of
this initiative or partnership?
1. How did you expect this program to
impact your lifestyle, career, goals?
(Did this happen?)
2. What outcomes of the program
surprised you?
3. In what ways were you satisfied/not
satisfied with the outcomes/results of
your program?
4. Would you recommend this program
to your family, friends, or colleagues?
GOAL 5: Evaluate program success
1. In what ways was your program
successful/not successful? (Barriers?)
2. Retrospective: If you could start this
CCSET program again, what would
you do differently?
1. In what ways was the CCSET
program successful/not successful?
(Barriers?)
2. Retrospective: If you could start this
CCSET program again, what would
you do differently?
1. In what ways was your experience in
this program successful/not
successful? (Barriers?)
2. Retrospective: If you could start this
CCSET program again, what would
you do differently?

113
11 APPENDIX C: IN-DEPTH INTERVIEW GUIDES
PROGRAM MANAGER IN-DEPTH INTERVIEW GUIDE Goals: A – Program Implemented as Intended
B – Sufficiency of Participant Recruitment Efforts C – Identify the range of experience and supports D – Examine Outcomes, E – Evaluate Program Success
Prefacing Demographic Questions: • What district/county do you work in? • Would you term your district/county as urban or rural? • How many teachers are there in your district/county? • What portion of your district/county are people of color? • What is your current role? • Besides this Classified program, for what other programs are you responsible? • How long have you been in charge of the Classified program? • How many participants are in your Classified program? 1A. What was easy to manage about this program? Why?
2A. What was hard to manage? Why?
3A. What could be implemented to make this program easier to manage?
4A. Was it easy or hard to keep track of the progress your participants were
making? Why?
5A. What could be implemented to help better monitor participant progress??
6A. How would you rate your collaboration with your IHE – strong or not strong?
What are your reasons for this rating?
1B. What were your two most successful participant recruitment strategies?
2B. Are your participant slots nearly always full? (Do you have a waiting list?)
Why/why not?
3B. Do you have any new recruitment ideas that you would like to put in place in
the future? (If yes, “Tell me about those.”)
1C. Tell me about a participant experience that stands out in your mind (positive or
negative).
2C. Of the supports provided to participants, which do you believe is the most
helpful to them? Why?
3C. What part of this program is the most difficult part for your participants?
1D. When you think about the results of this program, in what areas do you feel the
overall program was most successful?
2D. In what areas was the program less successful?
1E. What would be one thing that you wish you could have done differently with
this program?
2E. Do you believe this program is worth continuing in the future? Why?

114
CLASSIFIED PARTICIPANT IN-DEPTH INTERVIEW GUIDE Goals: A – Program Implemented as Intended
B – Sufficiency of Participant Recruitment Efforts C – Identify the range of experience and supports D – Examine Outcomes E – Evaluate Program Success
Prefacing Demographic Questions: • What district do you work in? (If necessary/You don’t know - Would you call this a
rural or an urban district?) • How long have you been with the district? • What’s your current job? • How long have you been doing this job? • Do you have any other jobs besides ________? Tell me about your other job. • How long have you been enrolled in this Classified Program? • What area are you most interested in teaching? • Where are you in the process of graduating or getting your teaching credential?
(earned your BA, preliminary credential, intern, clear cred.) 1A. Think back to when you first heard about this program. What did you expect
this program to do for you?
1B. Tell me, how did you hear about this program? (Who approached you?)
2B. How were how you were recruited? (What made you decide to join)
2A. Which parts of the program worked for you?
2B. Which parts of the program did not work for you?
2C. What were the barriers that made it difficult to advance in the program? (Was
there anything in place that helped you overcome these barriers?)
3C. What support did you utilize the help you progress in the program?
4C. What support did you need that wasn’t available?
5C/E. In what ways was your program effective/ineffective in helping you move
toward getting your credential?
6C. Tell us about the support you received from your IHE.
1D. How did this program impact your lifestyle and/or career?
2D. What outcomes of this experience surprised you?
3D. In what ways were you satisfied/not with your experience in the program?
2E. If you could start this Classified Program again, what would you do differently?
2F. Is there anything else you would like to tell me?

115
IHE LIAISON IN-DEPTH INTERVIEW GUIDE Goals: A – Program Implemented as Intended
B – Sufficiency of Participant Recruitment Efforts C – Identify the range of experience and supports D – Examine Outcomes, E – Evaluate Program Success
Prefacing Demographic Questions: • In which IHE do you work? • What is your current role? • With which Classified programs do you liaise. • Besides this Classified program, for what other programs are you responsible? • How long have you been a liaison with your Classified program? • How many Classified participants are enrolled in your IHE?
1. Would you say you were very involved or slightly involved in the planning and
decision-making for this Classified Program? Why do you rate it at________?
2A. In what ways does your IHE supports program participants to achieve success?
Which supports are the most helpful to participants?
3A. What would make it easier to work effectively with this Classified program?
1B. How did your IHE help in any recruiting efforts or selection of participants for
this program? (If yes, what assistance did you carry out?
2B. Do you have any recruitment ideas that you would like to put in place in the
future? (If yes, “Tell me about those?)
1C. (and 2A) In what other ways could your IHE provide additional support for
Classified candidates?
2C. Tell me about a participant's experience in your IHE that stand out in your mind
(positive or negative).
3C. Would you describe your collaboration with the district/county and this
Classified program as effective or ineffective? Why?
1D. When you think about the results of this program, in what areas do you feel it
has been most successful?
2D. In what areas was it less successful?
1E. What would be one thing that you wish you could have done differently with
this program?
2E. What would you like to see happen with this program in the future?

116
12 APPENDIX D: LIST OF ADDITIONAL JOBS HELD BY PARTICIPANTS
Table 7: List of additional jobs participants reported
List of unique responses for participants answering what additional jobs they
held
A care giver on the weekends to help support the cost of school
ABA in home behavior therapist
Academic Tutoring.
After school program.
Amazon and Catering job to make ends meet. Para jobs or the first couple years of
teaching do not pay enough to sustain rent in the bay area.
Babysitting
Bartender
Behavioral therapist
California Psych Care Autism Therapy
Camp Director
Care Taker
Church Cantor and Host/Busser
Clinician at Learning Center
Coaching
Coaching and Beverage Service
Dance Instructor
Daycare attendant
Doordash delivery driver
ELD Homework Hotline
Extended Day program, Instructional Assistant
Home Care Health Care Worker
Housekeeper
I have work in stores and in the fields.
I waitress at a restaurant on the weekends.
I was a School Community Liaison…
I work as a behavior support with a company. I go into clients home and help the
client with their behaviors.
I work as a part time clerk for a Community College.
I work as a volleyball coach in the district. I also run a program for teens with Autism
in our County.
In Home Supportive Services
Infant Developmental Specialist Teacher
Instructional assistant, STEM Tutor, substitute teacher
Instructional Provider for School District
Instructor at College
Intervention Aide, Bookroom Clerk
Landscape designer

117
Library Assistant
Medical Assistant
Nanny and student
Part time caregiver
Part-time tutor at Sylvan Learning
Personal Assistant
Personal trainer
Regional sales tech rep & girls golf coach
Resource Teacher
Respite Care Provider
Ropes Course Instructor & Art Teacher
Sales associate trust specialist at David's bridal
Small business owner
Substitute for Child Care Center.
Substitute Instructional Assistant (after school program at the Pre-K)
Summer camp and ymca
Tutor
Waitress at local restaurant
Work Training Center
Yearbook advisor

118
13 REFERENCES:
Adom, D., Hussein, E. K., & Agyem, J. A. (2018). Theoretical and conceptual framework:
Mandatory ingredients of a quality research. International journal of scientific research, 7(1), 438-441.
Bazeley, P. (2017). Integrating analyses in mixed methods research. Sage.
California Commission on Teacher Credentialing. (2020). Update on the California Classified School Employee Teacher Credentialing Program.
California Commission on Teacher Credentialing. (May 14, 2021). New Funding for Teacher Recruitment and Retention in Governor's May Budget Proposal
Carver-Thomas, D., Kini, T., & Burns, D. (2020). Sharpening the divide: How California’s teacher shortages expand inequality. Palo Alto, CA: Learning Policy Institute.
Carver-Thomas, D., Leung, M., & Burns, D. (2021). California Teachers and COVID-19. In How the Pandemic is Impacting the Teacher Workforce: Learning Policy Institute.
Chen, H. T. (2014). Practical program evaluation: Theory-driven evaluation and the integrated evaluation perspective. Sage Publications.
Cook, T. D., Campbell, D. T., & Shadish, W. (2002). Experimental and quasi-experimental designs for generalized causal inference. Houghton Mifflin Boston, MA.
Darling-Hammond, L., Sutcher, L., & Carver-Thomas, D. (2018). Teacher Shortages in California: Status, Sources, and Potential Solutions. Research Brief. Learning Policy Institute.
Gardner, D., Haeffele, L., Vogt, E., & Vogt, W. (2014). Selecting the right analysis for your data: Quantitative, qualitative, and mixed methods. In: New York, NY: Guilford.
Garner, B. A. (2004). Black's law dictionary.
Gertler, P. J., Martinez, S., Premand, P., Rawlings, L. B., & Vermeersch, C. M. (2016). Impact evaluation in practice. The World Bank.
Jackson, K., & Bazeley, P. (2019). Qualitative data analysis with NVivo. Sage.
Kahwati, L. C., & Kane, H. L. (2018). Qualitative comparative analysis in mixed methods research and evaluation (Vol. 6). SAGE Publications.
Linfield, K. J., & Posavac, E. J. (2018). Program evaluation: Methods and case studies. Routledge.
McDonald, N., Schoenebeck, S., & Forte, A. (2019). Reliability and inter-rater reliability in qualitative research: Norms and guidelines for CSCW and HCI practice. Proceedings of the ACM on Human-Computer Interaction, 3(CSCW), 1-23.
Orloff, N., & Stedinger, J. (1983). A Framework for Evaluating the Preponderance-of-the-Evidence Standard. University of Pennsylvania Law Review, 131(5), 1159-1174.
Podolsky, A., Darling-Hammond, L., Doss, C., & Reardon, S. (2019). California’s positive outliers: Districts beating the odds. Learning Policy Institute: Positive Outliers Series.

119
Podolsky, A., Kini, T., Bishop, J., & Darling-Hammond, L. (2016). Solving the Teacher Shortage: How to Attract and Retain Excellent Educators. Learning Policy Institute.
Program Evaluation Guide - Step 5 - CDC. (2012, 2020-03-24T01:54:52Z). Center for Disease Control and Prevention, Program Performance Evaluation Office. https://www.cdc.gov/eval/guide/step5/index.htm
Saunders, B., Sim, J., Kingstone, T., Baker, S., Waterfield, J., Bartlam, B., Burroughs, H., & Jinks, C. (2018). Saturation in qualitative research: exploring its conceptualization and operationalization. Quality & quantity, 52(4), 1893-1907.
Schlomer, G. L., Bauman, S., & Card, N. A. (2010). Best practices for missing data management in counseling psychology. Journal of counseling psychology, 57 1, 1-10.
Skevington, S. M., Lotfy, M., & O'Connell, K. A. (2004). The World Health Organization's WHOQOL-BREF quality of life assessment: Psychometric properties and results of the international field trial. A Report from the WHOQOL Group. Quality of Life Research: An International Journal of Quality of Life Aspects of Treatment, Care & Rehabilitation, 13(2), 299-310. https://doi.org/10.1023/B:QURE.0000018486.91360.00
Thomas, D. R. (2006). A general inductive approach for analyzing qualitative evaluation data. American journal of evaluation, 27(2), 237-246.