report on valuation of distribution assets of mula pravara ...mercindia.org.in/pdf/order 58...
TRANSCRIPT

1
Report on valuation of distribution assets of Mula Pravara Electric
Co-operative Society Ltd in accordance with the judgement issued by ATE in appeal
Number 221 of 2014
This report is submitted to the Maharashtra Electricity Regulatory Commission on the 31st of
March, 2016
Prepared by:
44, Maker Chambers III, Nariman Point, Mumbai- 400021 022-49265000

2
Table of Contents
Chapter 1 Executive Summary ........................................................................................................ 6
1.1 Background ...................................................................................................................................... 6
1.2 Scope of work .................................................................................................................................. 6
1.3 Sampling methodology..................................................................................................................... 7
1.4 Valuation methodology..................................................................................................................... 7
1.5 User charge determination ............................................................................................................... 9
1.6 Applicability of wheeling charge to the current case ...................................................................... 10
Chapter 2 Introduction .................................................................................................................... 11
2.1 Mula-Pravara Electric Co-operative Society Ltd ............................................................................ 11
2.2 Sequence of events ....................................................................................................................... 13
Chapter 3 Scope & Methodology ................................................................................................... 15
3.1 Scope of the assignment................................................................................................................ 15
3.2 Methodology for physical verification ............................................................................................. 16
3.3 Methodology for valuation .............................................................................................................. 18
3.4 Scrutiny of Asset Register and other documents ........................................................................... 20
3.5 Approach to physical verification ................................................................................................... 21
Chapter 4 Technical assessment .................................................................................................. 24
4.1 Observations from physical verification ......................................................................................... 24
4.2 Survey observations ....................................................................................................................... 25
4.3 Assessment of useful life of assets ................................................................................................ 31
Chapter 5 Valuations of assets of MPECS ................................................................................... 34
5.1 Valuation as per replacement cost ................................................................................................. 35
5.2 Reconciliation with ASCI report ..................................................................................................... 39
Chapter 6 User charge determination ........................................................................................... 40
6.1 User charges .................................................................................................................................. 40
6.2 Payout to MPECS going forward ................................................................................................... 44
6.3 Applicability of wheeling charge to the current case ......................................................................... 46
Chapter 7 Annexures ...................................................................................................................... 49
7.1 Documents received from MPECS and MSEDCL ......................................................................... 49
7.2 Inspection of records at MPECS head office ................................................................................. 51
7.3 Computation of weighted average Interest rates (State Bank of India) ......................................... 52
7.4 Monthly pay out schedule .............................................................................................................. 53
7.5 Physical verification schedule ........................................................................................................ 60
7.6 Assessment of replaced assets of MPECS ................................................................................... 61
7.7 Quantity of assets owned by MPECS ............................................................................................ 64
7.8 Land area and cost ........................................................................................................................ 68

3
7.9 References used ............................................................................................................................ 69

4
Table 1: Sample size for verification of distribution assets of MPECS Table 2: Valuation of assets by replacement cost Table 3: Illustrative weighted average cost of capital computation for 2011-12 Table 4: Sequence of events Table 5: Sample size for verification of distribution assets of MPECS Table 6: Quantity details of the distribution assets of MPECS Table 7: Data collected from 20 sub-stations during physical verification Table 8: Representation of major additions/modification in infrastructure MPECS network Table 9: Balance life from 2011 calculation based on the capacity (MVA) added. Table 10: Book value of distribution assets of MPECS Table 11: Quantity details of distribution assets as per MPECS asset register Table 12: Cost of construction as per MSEDCL rates Table 13: Valuation of MPECS distribution assets as per replacement cost method Table 14: Illustrative weighted average cost of capital computation for 2015-16 Table 15: Depreciation table Table 16: User charge table for annual pay out Table 17: Pay out table adjusted for amount already deposited Table 18: Wheeling charge computation for FY 2011-12
5
Figure 1: Nodal Officer MSDCL teams, Alia Consulting Project Leader and Nodal Officer MPECS.
Figure 2: Sub-station survey at Rahuri Sub-station
Figure 3: Sub-station feeder
Figure 4: MPECS Power Transformers in working condition
Figure 5: MPECS Power Transformer in yard (In working condition)
Figure 6. DTC on RSJ Poles (New DTR installed by MSEDCL)
Figure 7: Scrap DTR in Sutgirni, Shreerampur
6
Chapter 1 Executive Summary
1.1 Background
The Mula Pravara Electric Co-operative Society (“MPECS”), Shrirampur was established in 1969
as a farmers' cooperative society by the support of the Government of India to supply electricity
to rural consumers. It was one of the five pilot rural electric co-operative societies established in
India. MPECS area comprises 183 villages of the Shrirampur, Rahuri, Rahata, Newasa and
Sangamner talukas of Ahmednagar district including 3 municipal councils at Shrirampur, Rahuri
and Deolali Pravara in Ahmednagar district in the state of Maharashtra. The Head Office of the
society is situated at Shrirampur. MPECS started its commercial operation in 1971 to distribute
power in four specific Talukas (MPECS area) in the District of Ahmednagar in Maharashtra. The
MPECS commenced its functioning w.e.f. 1 March, 1971 and took over the electrical distribution
network of Maharashtra State Electricity Board (“MSEB”). The GoM renewed the said license for
another 20 years i.e. from 1991 to 2011. MPECS serves a total of 183 villages in 5 talukas. The
term of license of MPECS expired on 31 January, 2011.
In 2011, upon expiry of the license, the Maharashtra Electricity Regulatory Commission (MERC)
directed the Maharashtra State Electricity Distribution Co. Ltd. (MSEDCL) to take over the
distribution of electricity in the MPECS area. As a consequence of this decision and a series of
orders from various authorities (outlined in section 2.1) it was concluded that fair valuation be
undertaken of the assets owned by MPECS and used by MSEDCL and charges to be paid to
MPECS for use of these assets.
1.2 Scope of work
The scope of work covered in this project includes two part – valuation of assets and charge
determination. In order to arrive at an accurate valuation, important tasks included scrutiny of
asset register, physical verification of asset, asset classification and categorization and employing
industry and regulator accepted valuation tools. The scope of work included valuation of
distribution assets only. General assets, directly linked to distribution operations which includes
land and buildings are included. For charge determination, there is no standard industry
methodology available for the given context. The wheeling charge computation is one of the
options considered along with other options that uses standard finance theory led “rental charge”
for usage of assets (further explained in section 3.1 chapter 3).

7
1.3 Sampling methodology
Given the physically dispersed nature of the assets and the quantum of assets involved, it was
required that a sampling methodology be used that can give an accurate representation of the
entire asset base. We have followed a sampling methodology based on the practices of the
Bureau of Energy Efficiency Projects and Indian standard 5002 of 1969 (Method for determination
of sample size) in order to arrive at an optimal number of samples to be reviewed from the asset
register. This sampling methodology assumes a 95% confidence level of the universe of
distribution assets of MPECS. The samples physically verified is given below.
Table 1: Sample size for verification of distribution assets of MPECS
Sr. No. Work Scope Units Total Quantity
Sample Size
1 Physical verification of substation Nos 20* 20*
2 Physical verification of 33 kV line KM 233 68
3 Sample basis physical verification of 11 kV line KM 2494 93
4 Sample basis physical verification of DTC's Nos 3378 99
5 Sample basis physical verification of LT line KM 9157 95
*Note: 100% of sub-station (Sr. No 1) and its equipment’s is considered for verification.
1.4 Valuation methodology
We have evaluated four options for the purpose of valuation of assets.
Discounted cash flow method
Book value method
Comparable method
Replacement cost method
We have determined that the replacement cost methodology is the only appropriate method for
estimating value of the assets – given the nature of business, illiquid nature of assets and no
similar transactions available in the market. Further details of each of the methodology is given in
section 3.3 of chapter 3. The results from the same are given in the table below.

8
Table 2: Valuation of assets by replacement cost (Rs. In crs)
Distribution Assets Units
Qty Handed over as on 2011
Total life of Asset
Remaining
life of asset
Total Material Cost at 2011-12 (In crs)
Total build Cost
(In crs)
Replacement cost
(In crs)
Replacement
cost for Balance
life* (In crs)
High voltage plants
Land Sq.Mtr 1,33,700 0.59 2.59 2.59
Land Leasehold 0.04 0.04 0.04
Buildings 1.72 1.72 1.72
Sub-stations Nos 20 25 14 35.09 15.90 50.99 28.56
High voltage line 33KVA
Km 233 25 14 10.02 4.54 14.55 8.15
Total A 45.11 20.43 65.55 36.71
High voltage plants
T/C above 100KVA Nos 2,146 25 14 96.91 43.90 140.81 78.85
T/C below 100KVA Nos 1,232 25 14 19.85 8.99 28.84 16.15
H.T Line (11kV Lines) Km 2,494 25 14 67.41 30.54 97.95 54.85
Metering equipment Nos 189 25 14 0.08 0.04 0.12 0.07
Total B 184.25 83.47 267.72 149.92
Medium and low voltage
L.T Line km 9,157 25 14 154.20 69.85 224.05 125.47
S.C Metering equipment
Nos 1,19,741 25 14 15.57 7.05 22.62 12.67
Capacitor banks Nos 83 25 14 0.85 0.38 1.23 0.69
Three phase metering Nos 5,168 25 14 7.33 3.32 10.65 5.96
Total C 177.94 80.61 258.55 144.79
Total A+B+C 407.31 596.17 335.77
*The balance life determined is 14 years (please refer section 4.3).
The replacement cost adjusted for residual life comes to Rs. 335.77 crores as on
February 2011.

9
1.5 User charge determination
For determining user charges due to MPECS for the use of its distribution assets, we have used
standard finance principles of compensating MPECS for the cost of capital (as indicated by the
value of assets) and the value of assets over the lifetime of the assets. Further, in computing the
actual payout to MPECS, we have factored in the carrying cost on past due amount which have
as yet not been paid to MPECS while adjusting for the interim amount deposited MSEDCL with
the commission. Key assumptions / principles are outlined below:
Depreciation schedule: The asset value of Rs. 335.77 cr has been depreciated linearly
over 14 years at 7.14% annually in line with the remaining useful life of assets.
Cost of Capital: The cost of capital has been calculated using a 70:30 mix of debt and
equity, 15.5% as cost of equity and “Weighted average of SBI Base Rates + 2.0%” for cost
of debt. Cost of debt has been taken in line with what institutions such as MPECS will bear
if they were to take market loans. The cost of capital is calculated for each year in the
past. For future years, we have carried forward the FY’16 cost of capital.
Carrying cost: Carrying cost for unpaid past due charges have been taken at “SBI Base
Rate + 1.5%". The carrying cost considered has been arrived at a nominal interest that
can be charged for past due amounts - taking into account the SBI base rate and what
could be a nominal premium on top of that. Such interest rates are charged as per
standard practice in multiple industries. The number used is also in line with MYT
regulations 2015.
Adjustment for interim payment: As interim relief to MPECS, the Commission in its
interim Order dated 15 October, 2012 determined an interim amount as Rs. 1 crore per
month, i.e, Rs. 12 crore per annum to be paid by MSEDCL to MPECS, on an ad hoc basis
as charges for continuation of existing arrangement. A total amount of Rs. 62.64 crores in
principle has been deposited from October of 2015 by MSEDCL for a period of 5 years
from 2011 to 2016. The same has been assumed as charges which have been paid by
MSEDCL and therefore does not incur carrying cost. All amount in this account
including any accrued interest should come due to MPECS.
Payout schedule: We have assumed the first payout in March 2016 and all subsequent
payouts annually up until March 2025.

10
Table 3: Illustrative weighted average cost of capital computation for 2011-12
Particulars Cost Weight WACC
Cost of Equity 15.50% 30% 4.65%
Cost of Debt 11.71% 70% 8.20%
Weighted Average Cost of Capital 12.85%
Coming from this, Rs. 325.11 Crs is due to MPECS in March 2016, which includes
past due charges with carrying cost built in and charges for the year 2015-16.
Further, all proceeds in the account where MSEDCL has been depositing the
interim relief payout should be made available to MPECS (Rs. 62.64 cr + accrued
interest)
Going forwards, MSEDCL should pay user charges as given in section 6.2 based
on the principles outlined above.
1.6 Applicability of wheeling charge to the current case
The wheeling charge (Annual Revenue Requirement) methodology was developed with the
specific purpose of ensuring that any entity that builds distribution assets and wheels electricity
on those assets is able to get a suitable return from the project that covers both the cost of capital
and cost of operations and maintenance of those assets. The wheeling charge therefore is meant
to determine what should be the appropriate unit charge (to consumers) that can provide the
appropriate return to the operating entity.
In the current scenario at hand, this methodology is not appropriate for the reasons which are
detailed out in section 6.3 of chapter 6.

11
Chapter 2 Introduction
2.1 Mula-Pravara Electric Co-operative Society Ltd
The Mula Pravara Electric Co-Operative Society Ltd. (“MPECS”) was granted a Distribution
license with a validity of 20 years under the Indian Electricity Act, 1910 by the Government of
Maharashtra (“GoM”) on 28th January 1971 for distribution of electricity in 183 villages spread
over an area of 1880 sq.km in five talukas namely Shrirampur, Rahuri, Nevasa, Sangamner and
Rahata talukas of Ahmednagar District. Further this license was extended for a period of 20 years,
i.e. up to 2011 with effect from 1st February 1991 by GoM vide Government Resolution (GR)
dated 21st May 1999. The Distribution License of MPECS was expiring on 31st January 2011.
MPECS had submitted an application for grant of Distribution License before the Maharashtra
Electricity Regulatory Commission (the Commission). Another application was received for the
same area from Maharashtra State Electricity Distribution Co. Ltd. (MSEDCL).
By an order dated 27 January, 2011, the Commission granted license to MSEDCL and amended
the license of MSEDCL by merging MPECS’ area of supply with MSEDCL’s area of supply. The
application of MPECS was rejected for the reasons provided in the said order. MPECS was
directed to handover the distribution network and allied equipment’s etc., belonging to MPECS to
MSEDCL with the qualification that MPECS will be entitled to claim value for the assets handed
over, for which MPECS may file a separate petition before the Commission for deciding transfer
value of their assets, with all relevant documentary evidence. MPECS filed an appeal before the
Hon’ble Appellate Tribunal for Electricity (“ATE”) challenging the order of the Commission. By
Judgment dated 16 December, 2011 in Appeal No. 39 of 2011, Hon’ble ATE remanded the
aforesaid Case to the Commission with the direction to reconsider the application of license of
MPECS and to dispose of on merits with a further direction to consider for grant of license to both
the Parties by allowing them to operate in the same area. Hon’ble ATE also directed as follows:-
“After pronouncement of judgment, the learned Counsel for the parties request for issuing of
consequential directions with regard to the existing arrangements and the time frame.
Accordingly, we direct the Commission that the process to be completed within three months from
today and in the meantime, the existing arrangement may be continued subject to payment of
charges to the Appellant to be decided by the Commission after hearing all the parties concerned.”

12
MPECS had filed the present Petition on 7 March, 2012 for determination of the aforesaid charges
for the use of the distribution network and connected equipments and allied assets with effect
from February 1, 2011 by MSEDCL. The Commission had passed an interim Order dated 15
October, 2012 for granting interim relief to MPECS, the Commission in its interim Order in the
present matter dated 15 October, 2012 has considered only capital expenditure related expenses
and determined the interim amount as Rs. 1 crore per month, i.e, Rs. 12 crore per annum to be
paid by MSEDCL to MPECS, on an adhoc basis as charges for continuation of existing
arrangement and directed MSEDCL to carry out valuation of distribution assets of MPECS before
30 November, 2012. The Commission directed that the Commission will pass an order revisiting
the charges aforesaid once valuation of the distribution network is available. In spite of several
directives of the Commission, the valuation of assets was not completed by MSEDCL.
Accordingly, vide Order dated 18 June, 2014, the Commission disposed of the Petition of MPECS
in Case No. 24 of 2012 directing MPECS to submit the asset register to the Commission and
MSEDCL and further directing MSEDCL to carry out asset valuation within 3 months of the receipt
of asset register.
This Order was challenged by MPECS before the Appellate Tribunal for Electricity (ATE), ATE
vide, its Judgment dated 13 March, 2015 remanded the matter back to the Commission to decide
the said petition on merits. The Commission was directed to get the evaluation of the assets of
MPECS done through some independent agency or through some impartial agency or the
Commission itself.
With this, it was concluded that fair valuation be undertaken of the assets owned by MPECS and
used by MSEDCL and user charges to be paid to MPECS for use of these assets.

13
2.2 Sequence of events
Table 4: Sequence of events
Year Event
1969 MPECS was established as a Farmer's Co-operative Society for rural electrification and
distribution of electricity.
1971 GoM (Government of Maharashtra) granted 20 year Distribution license to MPECS.
2011 MPECS & MSEDCL’s files for application for grant of Distribution License for MPECS
Area of Supply as MPECS license is due to expire
MERC order dated 27-01-2011 rejects the application of MPECS for grant of distribution
license and amends the license of MSEDCL by merging MPECS area of supply with
MSEDCL area of supply and directs MPECS to hand over the distribution network and
allied equipment to MSEDCL without any wheeling charges from zero hours on
February 1, 2011. (Case No 85 and 87 of 2010, MERC Order dated 27-01-2010)
MPECS challenges MERC order to transfer the assets to MSEDCL. Hon’ble APTEL
concludes that MPECS is entitled to claim compensation for the assets handed over
APTEL order dated 16-12-2011 Appeal No 39 of 2011:
Sets aside the MERC Order 27-01-2011 on revocation of MPECS license as due
process under the EA 2003 was not followed under Section 15(6) and 15 (b)(6).
-The directions to MPECS to “transfer the assets to the MDESCL is not in accordance
with the law” and is liable to be set aside.
In the same order, APTEL clarified that the present arrangement may be continued i.e.
payment of charges to MPECS by MSEDCL for use of its distribution network.
2012 In order to determine a charge, MERC orders MSEDCL to carryout valuations of the
assets of MPECS. (MSEDCL has not carried out any valuation of MPECS)
MERC's Order Case No 24 of 2012 dated 15-10-2012 determines an interim amount of
Rs.1 cr per month i.e. Rs 12 crs p.a. to be paid by MSEDCL to MPECS on an ad hoc
basis as charges for continuing the existing arrangements until the matter of grant of
license is finally determined by the Commission. The final charges would be decided
once the valuation of assets of MPECS is done.
2013 MERC reiterates and confirms its Order of 12-10-2012 and rejects the review petition.
MERC directs MPECS to submit a copy of asset register of electricity business within a
week of issuance of this Order to MSEDCL. MSEDCL shall carry out the valuation

14
Year Event
exercise of assets of MPECS and submit the valuation report to the Commission within
a month of issuance of this Order. Case No 121 of 2012 and No 6 of 2012, 03-09-2013.
2014 ATE in case 221 of 2014 directs that the existing arrangement namely use of distribution
line / network of the appellant petitioner (MPECS) by the respondent No.2(MSEDCL),
distribution licensee may be continued subject to payment of charges to the appellant
which is to be decided by the State Commission after hearing all the parties concerned
2015 MERC published a notice for appointment of an External Independent
Agency/Consulting Firm for asset valuation of MPECS in accordance with the
judgement issued by APTEL in Appeal No. 221 of 2014 and invited EOI from
independent agencies & consulting firms
2016 Valuation report consists of the following:
1. Valuation of distribution assets of MPECS
2. Charge payable by MSEDCL to MPECS for the use of the distribution assets

15
Chapter 3 Scope & Methodology
3.1 Scope of the assignment
Our scope of work is to value the distribution assets of MPECS which is presently being used by
MSEDCL for distribution of electricity to consumers in MPECS’s license area of supply. The
distribution assets include all facilities, lines, meters, utilities, plants, premises, works, substations,
distribution transformer centres/distribution transformers, connected equipment and allied assets.
Based on the project timeline and deliverables as per our scope, below mentioned objectives has
been completed.
1. Scrutiny of asset register submitted by Mula-Pravara: Reviewing current stock of
physical assets based on the reports duly submitted by the MPECS. As this being the
starting approach for the project. Verifying the accounting methods used to record the
transactions reported in asset register. To completely rely on the asset register a physical
verification has been conducted.
2. Physical verification of assets jointly with Mula Pravara and MSEDCL. We have
completed the physical verification and analysis of the current state of physical assets
deployed in the area of the assessed sites.
3. Identify the assets of Mula-Pravara being used by MSEDCL and categorize the same:
As part of the scope is also to determine the assets utilized or altered by MSEDCL, we have
captured this information and analysed this claim against records submitted. But it is
confirmed fact that an entire distribution network was handed over to MSEDCL in February
of 2011 which was also verified physically.
4. Deciding principles for valuation of assets based on accounting principles or any
other applicable principle including Tariff Regulations of MERC: After verifying the
accuracy of the asset register, we have looked further into valuing them. Industry methods
to value these assets have been adopted. Valuation methods have been explained for the
understanding of the best approach possible for the current situation of MPECS.
16
5. Submission of draft Asset Valuation report to the Commission: The report will collate
all the valuation of assets utilised, the impact of utilisation and the right methodology
adopted.
6. Based on final Asset valuation, determination of the compensation to be paid by the
MSEDCL to Mula Pravara: We have computed the amount that MSEDCL has to pay Mula-
Pravara for utilising its assets during the period of operations after February, 2011 as per
the directions of the Hon’ble ATE
7. Incorporating the feedback received on draft report: Based on milestone completion
review session & interaction with the state commission, feedback/comments on the draft
valuation report will be duly reflected while presenting the final report & order will be
prepared as per the scope of this service.
8. Preparation of draft order and finalization of the order: We will be preparing the draft
order in this matter.
3.2 Methodology for physical verification
Given the physically dispersed nature of the assets and the quantum of assets involved, it was
required that a sampling methodology be used that can give an accurate representation of the
entire asset base. As part of the project, we followed best industry practices for sampling of
assets. The sampling methodology adopted is based on the references taken from the Bureau of
Energy Efficiency Projects (India) and Indian standard 5002 of 1969 (Method for determination of
sample size) in order to arrive at an optimal number of samples to be reviewed from the asset
register. This sampling methodology provides a 95% confidence level of the universe of
distribution assets. Our field sampling indicates that the asset registry provided by MPECS is
accurate.
The formula for calculation the sample Size as follows
SS = {Z2 *(p)*(1-p)} / (C2)
Where,

17
Z= Z value (e.g. 1.96 for 95% confidence Level)
P = Percentage Picking a Choice, expressed as decimal
C = Confidence Interval (Expressed as Decimal)
Sample Size – Finite Population
SS = SS1 / {(1 + (SS1 – 1)/ Pop)}
Where,
Pop = Population
The minimum sample size calculation is as follows for 33 kV line,
Pop = 233, population size
Z = 1.96 for 95% Confidence interval
P = 0.05 Picking percentage
5% as standard practice
C = 0.1 as 10% confidence interval
Therefore, as per formula, SS1 = (1.96*1.96)*(0.05)*(1-0.05) = 96.04
(0.1)2
New sample size for the finite population of 233 km,
SS = SS1 / {(1 + (SS1 – 1)/ Pop)}
= 96.04
1+ (96.04 - 1)
233
= 68.23 ~ 68
The table below illustrates the sample sizes of the asset type for physical verification

18
Table 5: Sample size for verification of distribution assets of MPECS
Sr. No. Work Scope Units Total Quantity
Sample Size
1 Physical verification of substation Nos 20 20
2 Physical verification of 33 kV line KM 233 68
3 Sample basis physical verification of 11 kV line KM 2494 93
4 Sample basis physical verification of DTC's Nos 3378 99
5 Sample basis physical verification of LT line KM 9154 95
Physical scrutiny of assets as per the above methodology indicated that the asset register shared
by MPECS is accurate. Relevant purchase registers/vouchers have been verified against the
sample surveyed. MSEDCL and MPECS have signed the survey reports which confirms our
sample verification. (Survey reports submitted separately)
3.3 Methodology for valuation
There are four methods to value the assets of MPECS as being used by MSEDCL.
1. Discounted Cash flow Method (Net Present Value Method)
2. Book Value
3. Comparable method
4. Replacement cost
1. Discounted Cash Flow Method assumes the entity to be a going concern and generates
enough surplus that creates value for the business. Given the nature of the business of
electricity distribution (regulated tariffs, collection issues etc.), it is difficult to estimate future
Valuation methods for MPECS
Discounted Cash Flow
Comparable Method Book Value Replacement Cost

19
cash flows and the discounting rate. Thus, we are of the opinion that DCF will not be an
appropriate method to compute the value of the assets.
2. The Book Value method estimates the value of the assets coming from standard accounting
principles as captured in the financial statements of the company. This method is conservative
and often leads to under-valuing the business as depreciation of assets follows accounting
principles (typically takes as over 10 years and sometimes accelerated even more for taxation
purposes).
3. The Comparable method estimates the value of the assets by benchmarking the assets
against a similar transaction that may have happened in the market. The benchmark
transaction is then adjusted for size (number of assets, number of households connected etc)
before determining the value of the assets. Given, there were no viable comparable transaction
in the market, this method was not used. Further, given regulated nature of business marketing
the assets and finding a willing buyer is not an option.
4. Replacement cost method is based on the principle of substitution. For the acquiring party,
the cost of setting up a similar infrastructure is determined. Since book value of MPECS assets
follows a conservative accounting approach (in order to take taxation benefits from accelerated
depreciation), the real value of the assets is higher than those reported in the books. To be fair
to both parties, transfer of assets should happen at market prices or cost of replacements.
The cost so determined is then adjusted for the remaining life of the existing assets to arrive
at the valuation number.
We have determined that replacement cost methodology is the only appropriate method for
estimating value of the assets – given the nature of business, illiquid nature of assets and no
similar transactions available in the market. This method estimates the cost that will be incurred
both in terms of material / components costs and the cost to build / construct. Moreover, as the
distribution assets were operational at the time of takeover, this method is considered to be
appropriate.
20
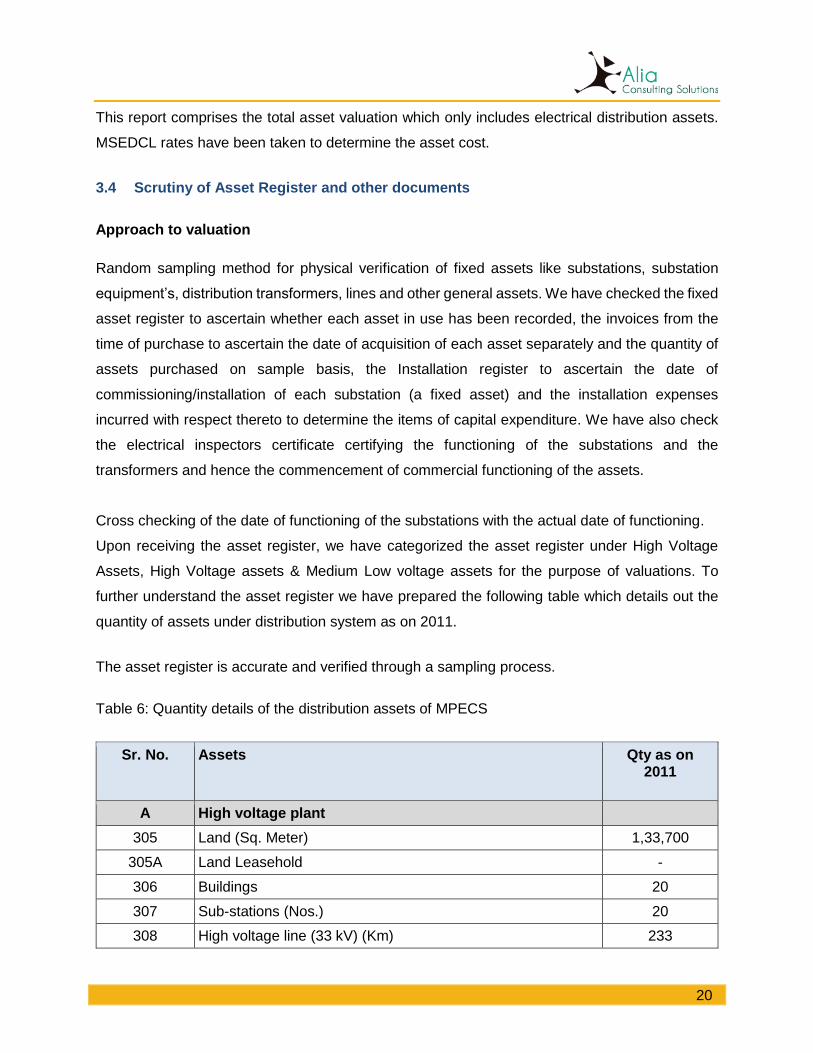
This report comprises the total asset valuation which only includes electrical distribution assets.
MSEDCL rates have been taken to determine the asset cost.
3.4 Scrutiny of Asset Register and other documents
Approach to valuation
Random sampling method for physical verification of fixed assets like substations, substation
equipment’s, distribution transformers, lines and other general assets. We have checked the fixed
asset register to ascertain whether each asset in use has been recorded, the invoices from the
time of purchase to ascertain the date of acquisition of each asset separately and the quantity of
assets purchased on sample basis, the Installation register to ascertain the date of
commissioning/installation of each substation (a fixed asset) and the installation expenses
incurred with respect thereto to determine the items of capital expenditure. We have also check
the electrical inspectors certificate certifying the functioning of the substations and the
transformers and hence the commencement of commercial functioning of the assets.
Cross checking of the date of functioning of the substations with the actual date of functioning.
Upon receiving the asset register, we have categorized the asset register under High Voltage
Assets, High Voltage assets & Medium Low voltage assets for the purpose of valuations. To
further understand the asset register we have prepared the following table which details out the
quantity of assets under distribution system as on 2011.
The asset register is accurate and verified through a sampling process.
Table 6: Quantity details of the distribution assets of MPECS
Sr. No. Assets Qty as on 2011
A High voltage plant
305 Land (Sq. Meter) 1,33,700
305A Land Leasehold -
306 Buildings 20
307 Sub-stations (Nos.) 20
308 High voltage line (33 kV) (Km) 233

21
B High voltage plants
313 T/c Above 100kVA (Nos.) 90
314 T/c 100kVA & Below (Nos.) 3,288
317 H/T Line (Km) 2,496
345B Metering equipment’s (TOD Meter) (Nos.) 187
C Medium and low voltage plant
337 L.T. line (KM) 8,937
344 S.C. Metering equipment’s (Nos.) 1 Phase 1,19,741
345 S.C. Metering equipment’s (Nos.) 3 Phase 5,168
345A Capacitor / Capacitor banks (Nos.) 83
3.5 Approach to physical verification
Approach to physical valuation involves 4 distinct steps
1) Data collection from MPECS
In order to prepare a plan for physical verification and survey the assets of MPECS, it was
important to check the validity of the documents (eg. Asset register, maintenance register, sample
purchase notes, etc.) Documents are required to identify the asset type, quantity and its
distribution across the geography. Documents requested from the MPECS are mentioned below.
2) Format preparation and deciding the physical verification plan
After receiving the documents, a format for the verification of the assets was prepared outlining
the specifications of the assets to be checked and sample quantity to be verified at the site. (The
same has been circulated to MPECS and MSEDCL before the survey)
Following which a plan for physical verification outlining the dates, areas to be visited,
requirements of engineers/officials, etc. was prepared and circulated in advance.
3) Joint verification with MPECS & MSEDCL
As part of the scope of our work, the verification was to be conducted in the presence of both the
parties involved that is MPECS and MSEDCL given the current arrangement. The physical
verification was successfully conducted with the participation of both the parties. The survey
sheets/ formats have been signed by both the entities during the time of survey.
22
4) Inspection of documents of MPECS
During and after the physical verification process, our engineers and chartered accountants
inspected various records of MPECS to ascertain the accuracy of the asset register, validity of
important documents, etc. Many documents were requested when the physical verification was
on going. (The same has been communicated to MERC)
3.5.1 Note on physical verification
Survey of 33kV lines
a. Electrical Inspectors notes was verified before survey
b. During survey conductor type and respective length was noted
c. Poles type verified
d. Span Length verified
e. Condition of the lines assessed
f. 2 km length of each sample feeder was surveyed by walking alongside and rest of the feeders
will be reviewed with the use of vehicles.
Survey of the substation & its components
a. Team visited 20 substations and conducted physical verification of the power transformers
and major equipment’s like VCBs and Panels.
b. During visit to substation, control room area and substation area was reviewed and cross
verified with valid documents.
c. GPS location of the Substation captured.
d. Observations on physical condition of the substation
Survey of 11 kV lines
a. As per the Network Diagram obtained from the MPECS, the field team visited 11 kV line
samples. Up to 5km for each feeder.
b. Conductor type and respective length verified
c. Poles type information for the sample feeders will be collected
d. Span Length of the sample feeder collected

23
e. Condition of the lines assessed
g. 2 km length of each sample feeder was surveyed by walk and rest of the feeders will be
reviewed through vehicles
Survey of LT lines survey
a. Randomly selected DTR’s based LT line surveyed
b. Connected DTR’s also observed in the process
c. Conductor type and respective length verified
d. Pole type verified
e. Span Length verified
Survey of DTR’S on sample basis
a. DTR’S on sample basis (up to 100 for entire network)
b. DTR’s type i.e. Aluminum or Copper wound
c. Count of DTR’s matched of randomly selected feeder
d. Condition of the DTR’s will be assessed
3.5.2 Documents verified
1. The Electrical Distribution Assets Register
2. The General Assets Register
3. The Substations Installation Register
4. Land Drawings
5. Electrical Inspectors Certificate
6. Government Notifications/Circulars
7. Bills for Assets purchased
8. Letter of Intent of MPECS
9. Fixed Assets Maintenance Record
10. Audited Statements of Account and the Auditor’s Report
11. Line diagrams
Please refer Annexure 7.2 for list documents verified at the MPECS head office in Shrirampur.
24
Chapter 4 Technical assessment
4.1 Observations from physical verification
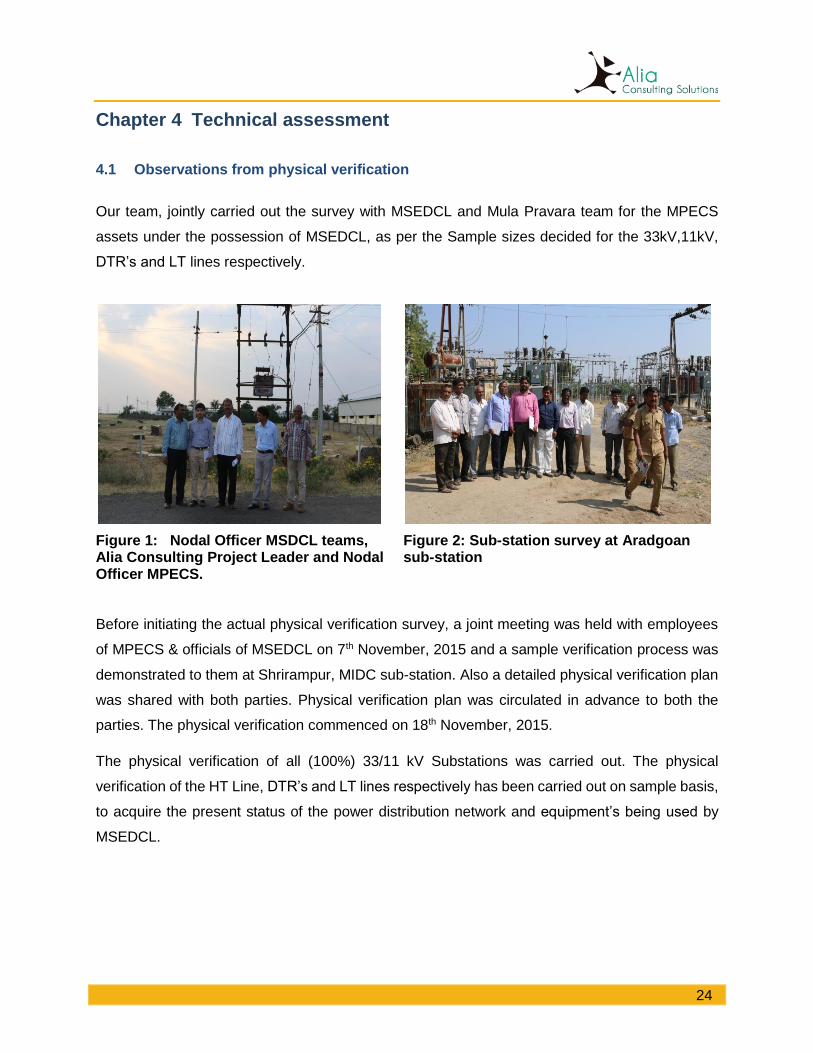
Our team, jointly carried out the survey with MSEDCL and Mula Pravara team for the MPECS
assets under the possession of MSEDCL, as per the Sample sizes decided for the 33kV,11kV,
DTR’s and LT lines respectively.
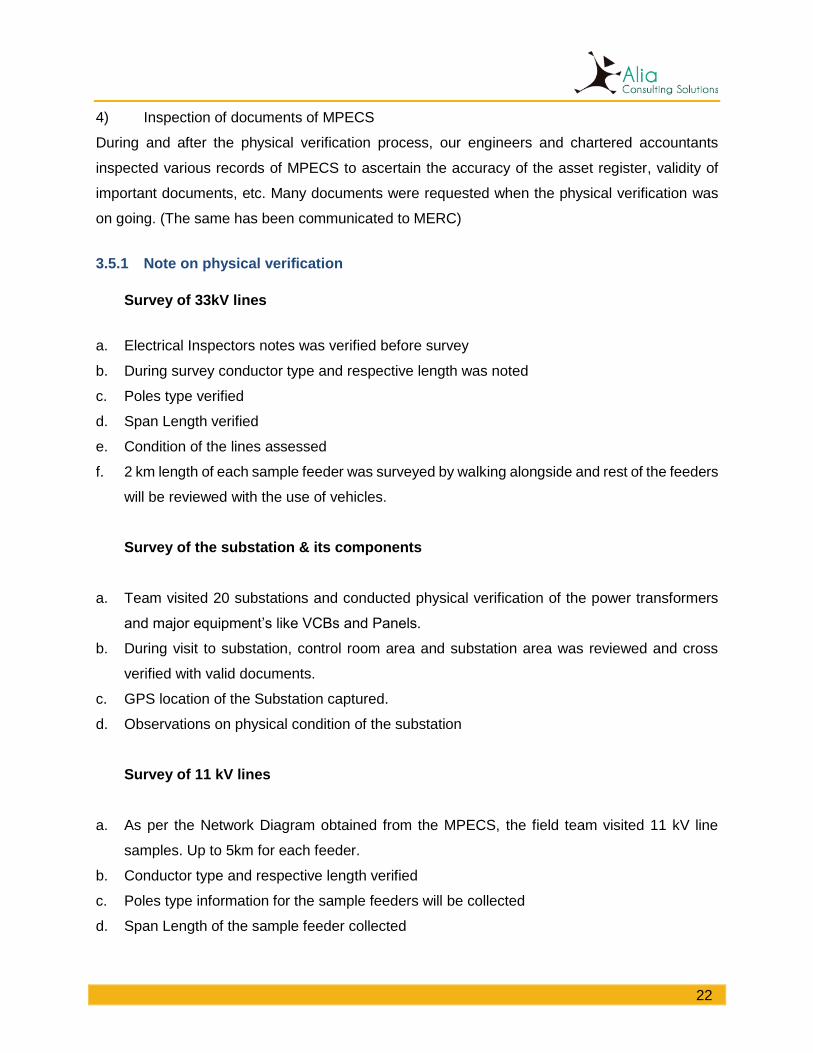
Figure 1: Nodal Officer MSDCL teams, Alia Consulting Project Leader and Nodal Officer MPECS.
Figure 2: Sub-station survey at Aradgoan sub-station
Before initiating the actual physical verification survey, a joint meeting was held with employees
of MPECS & officials of MSEDCL on 7th November, 2015 and a sample verification process was
demonstrated to them at Shrirampur, MIDC sub-station. Also a detailed physical verification plan
was shared with both parties. Physical verification plan was circulated in advance to both the
parties. The physical verification commenced on 18th November, 2015.
The physical verification of all (100%) 33/11 kV Substations was carried out. The physical
verification of the HT Line, DTR’s and LT lines respectively has been carried out on sample basis,
to acquire the present status of the power distribution network and equipment’s being used by
MSEDCL.

25
Observations during physical verification
a) MSEDCL has replaced major substation equipment’s.
b) Replaced equipment’s of MPECS includes working items & failed items, most equipment’s
are stored in the open yard outside or inside the sub-station.
c) MSEDCL has not made any major changes in the HT lines, LT lines.
d) MSEDCL holds custody of all replaced items of MPECS.
e) MSEDCL has constructed new sub-station rooms/building in the MPECS owned sub-
station land.
f) Disagreement on quantity of certain equipment’s like distribution transformers, structures
(to be resolved by the commission).
Challenges faced during physical verification
a) While evaluating MPECS sub-station equipment, there were minor disagreement with
respect to quantity handed over in 2011. Also, as MSEDCL has inadequate staff it was
difficult for them to remember the quantity handed over in 2011. But the records submitted
by MPECS along with valid inspector certificates and material lists, conclude the asset
register to be accurate.
b) Replaced items were difficult to locate as they were not stored in systematic manner.
4.2 Survey observations
1. 33 kV Lines
The 33 kV Lines feeder during survey were found to be as per the records.
a) 233.18 km of 33 KV line is under the custody of MSEDCL, most of the feeders remain
unchanged.
b) The span length of the 33kV during survey was found to be 0.8 meters.
c) There have been no changes observed in the 33kV lines in our samples visited.
26
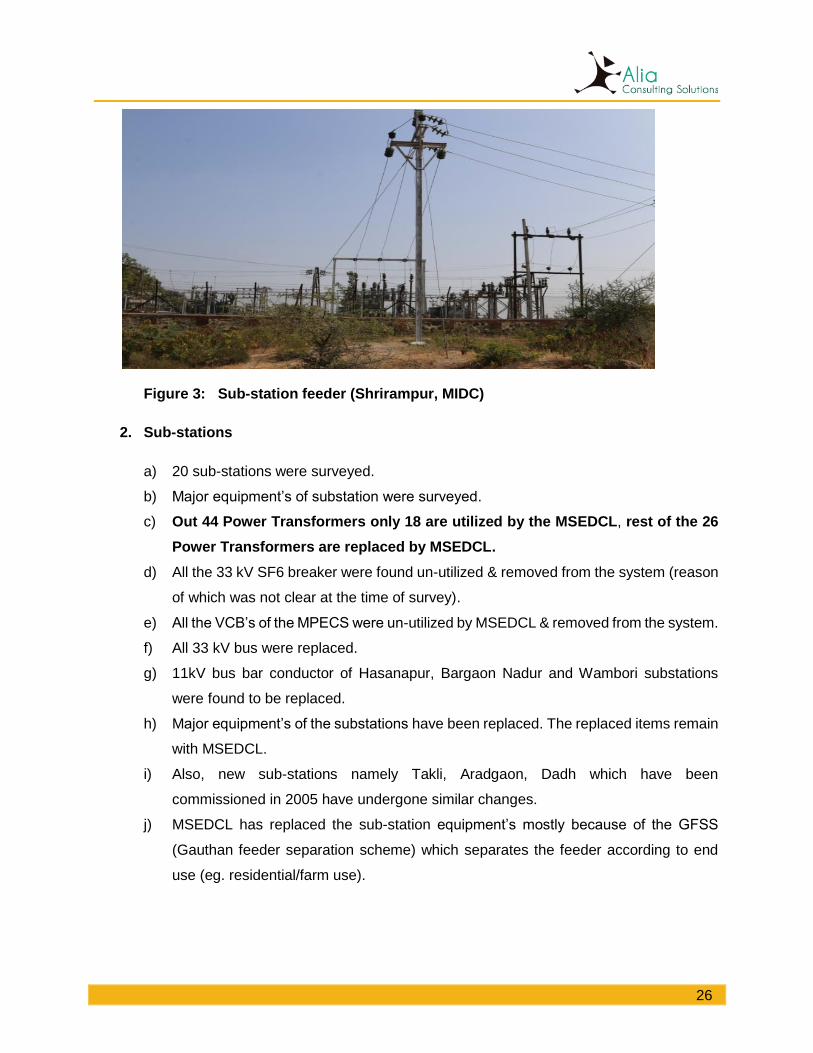
Figure 3: Sub-station feeder (Shrirampur, MIDC)
2. Sub-stations
a) 20 sub-stations were surveyed.
b) Major equipment’s of substation were surveyed.
c) Out 44 Power Transformers only 18 are utilized by the MSEDCL, rest of the 26
Power Transformers are replaced by MSEDCL.
d) All the 33 kV SF6 breaker were found un-utilized & removed from the system (reason
of which was not clear at the time of survey).
e) All the VCB’s of the MPECS were un-utilized by MSEDCL & removed from the system.
f) All 33 kV bus were replaced.
g) 11kV bus bar conductor of Hasanapur, Bargaon Nadur and Wambori substations
were found to be replaced.
h) Major equipment’s of the substations have been replaced. The replaced items remain
with MSEDCL.
i) Also, new sub-stations namely Takli, Aradgaon, Dadh which have been
commissioned in 2005 have undergone similar changes.
j) MSEDCL has replaced the sub-station equipment’s mostly because of the GFSS
(Gauthan feeder separation scheme) which separates the feeder according to end
use (eg. residential/farm use).
Figure 3. 33 KV Incoming Line

27
Table 7: Data collected from 20 sub-stations during physical verification
Sr No. Particulars
Unit
2011-12
2015-16 2015-16 2015-16
Assets of 33kv/11kv Substation Utilized Replaced
1 Gantry Column for 33Kv incoming and outgoing feeder
No. 20 20 19 1
2 Structure for 33Kv & and 11Kv Swing bus
No. 20 20 8 12
3 Structure for top mounted AB switch on 11 & 33 Kv Bus (Bus Coupler)
No. 0
4 Structure for 11kv take off with top mounted AB switch & division of lighting arrestor
No. 55 42
33
9
5 Structure for 33Kv & and 11Kv isolators
No. 177 232 89 143
6 Structure of installation of 33 Kv /110v.PT
No. 20 20 20
7 Structure of installation of 11Kv /110v.PT
No. 20 20 20
8 Structure of installation of 33kv CT
No. 20 36 12 24
9 Structure of installation of 11kv CT
No. 51 51 51
10 33Kv post insulator structure No. 40
11 11Kv post insulator structure No. 82
12 33 kV, 1250A Outdoor SF6 CB No. 20 20 11 9
13 33/11Kv Power transformer 3.15MVA
No. 38 44 18 26
14 33Kv/110volts, potential transformer
Set 20 18 5 13
15 11Kv/110volts, potential transformer
Set 51 51 51
16 33Kv CT Set 20 20 20
17 11Kv CT Set 51 51 51
18 Disc. Ins for 33Kv Swing bus & Incoming Bay
Set 0
19 33Kv Lighting arrestor Set 40 37 26 11

28
Sr No. Particulars
Unit
2011-12
2015-16 2015-16 2015-16
20 33Kv post insulator No. 18
21 11kv Vacuum circuit breaker with panel etc.
Set 76 74 74
22 11Kv post insulator No. 0 0 0 0
23 Disc. ins for 11Kv Swing bus & Take off structure
No. 0 0 0 0
24 33Kv 3 pin type AB switch:630 AMPS
Set 0 0 0 0
25 33Kv vacuum circuit Breaker with panel etc.
Set 0 20 11 9
26 11 kV AB Switch ( 630A ) No. 99 65 16 49
27 11Kv lighting arrestor Set 76 36 15 21
28 ACSR Raccon conductor kM 0.9 0.9 0.9
29 Battery with battery charging unit complete(32V):as per REC specification
Set 20 19 12 7
30 Control cable : various sizes as per requirement
LS 1 0 0 0
31 Aluminum pipe: 65mm. Dia as per requirement
LS 0 0 0 0
32 Different sizes of aluminum connectors
LS 0 0 0 0
33 Lighting of substation yard including control Room
LS 20 20 0 20
34 Earthing Complete Nos 224 150 0 150
35 Equipment Earthing LS 0 0 0
36 Painting of structures LS 0 0 0 0
37 (a)415v, AC distribution board Set 0 0 0 0
38 (b)30v, Distribution board Set 0 0 0 0
39 Fencing for yard Mtr 4627 3990 0 3990
40 Transformer Foundation Nos 22 22 18 4
41 Barbed fencing with Fabricated Gates
kg 59 0

29
Figure 4: MPECS Power Transformers in
working condition
Figure 5: MPECS Power Transformer in yard
(In working condition)
3. 11 KV lines
The 11 kV line feeders during survey were found to be as per the records.
a) On an average, 10 PSC and 3 RSJ poles were found during the survey.
b) Span length on an average was 0.7 to 0.8km.
4. Distribution Transformer Centre (DTC)
The DTC during survey were found to be as per the records.
a) As per the survey samples of DTC (99 samples), 56 were found to be to be utilized and
43 were found to be replaced by the MSEDCL.
b) Most of the transformers replaced are stored in a filter unit.
c) Working transformers also stored in filter warehouses of MSEDCL.
d) Repairable transformers are not utilized and remain in the custody with MSEDCL (may
lead to deterioration as observed).

30
Figure 6. DTC on RSJ Poles (New DTR installed by MSEDCL)
5. Low Voltage Lines
The LT lines during survey were found to be as per the records.
a) Most of the LT lines network is been utilized by MSEDCL.
b) The LT lines network is being strengthened by the MSEDCL by inserting the poles to between
existing MPSEC network.
6. Sub-station land
a) MSEDCL has built its own control rooms at almost all sub-stations adjacent to the sub-station
land owned by MPECS.
b) Old control rooms are also utilized by MSEDCL staff for various administrative and other
purpose.
c) All replaced equipment’s of MPECS are removed and stored either inside the sub-station or
outside.
d) Land where control rooms are constructed is owned by MPECS.
31
4.3 Assessment of useful life of assets
Power Distribution network is a combination of various equipment. The various equipment’s such
as 33 kV Line, 33/11 kV Substations, 11kV Lines, distribution transformers (DTRs), LT Lines,
Service lines and consumer meters’ transfers power from grid substation to consumers. In order
to install a new sub-station, a new infrastructure is required to be developed. Under this theory,
the balance life of the power network evaluation is carried out based on the commissioning / major
modification dates of all substations, also other major equipment are commissioned in same
period accordingly. Life of sub-station equipment is 25 accordingly the useful life of all other assets
is therefore taken to be of the same life as of the sub-station. Sub-station modifications and major
capacity additions are taken as reference for evaluating the balance life of MPECS power
distribution network. While this is a simplistic assumption, this is the best approximation possible
in arriving at residual life as other distribution assets require constant maintenance and deriving
precise scientific basis for residual life is difficult.
It is informed by MPECS that power distribution network was commissioned in various phases
over the period from 1995 to 2005. (Details of which have been verified- Sub-station installation
register 33/11 KV sub-station register showing details of commissioning of sub-station/capacity
addition, details of land & civil construction, list of sub-station equipment’s, etc). All equipments
are commissioned to supply power to various consumers and cater the increasing power demand
of consumers over the period.
Table: 8 Representation of major additions/modification in infrastructure MPECS network
Sr. No Substation Name Year of major modifications/
additions
Capacity (MVA)
End year of useful
life
1 33/11 KV Vambori 1995 9.45 2020
2 33/11 KV Deolali 1995 9.45 2020
3 33/11 KV Hasanapur 1996 9.45 2021
4 33/11 KV MIDC 1997 9.45 2022
5 33/11 KV Mamdapur 1998 6.30 2023
6 33/11 KV Taharabad 1998 3.15 2023
7 33/11 KV Bramhani 1998 6.30 2023
8 33/11 KV Loni 2000 6.30 2025
9 33/11 KV Satral 2000 6.30 2025

32
Sr. No Substation Name Year of major modifications/
additions
Capacity (MVA)
End year of useful
life
10 33/11 KV Haregaon 2001 6.30 2026
11 33/11 KV Taklibhan 2001 9.45 2026
12 33/11 KV B'Nandur 2001 3.15 2026
13 33/11 KV Naur 2002 3.15 2027
14 33/11 KV Wakadi 2003 3.15 2028
15 33/11 KV Matapur 2005 3.15 2030
16 33/11 KV Dadh 2005 3.15 2030
17 33/11 KV Babhulgaon 2005 3.15 2030
18 33/11 KV Ambi 2005 6.30 2030
19 33/11 KV Taklimiya 2005 3.15 2030
20 33/11 KV Aradgaon 2005 9.45 2030
Total 119.75
Table 9: Balance life from 2011 calculation based on the capacity (MVA) added.
Sr. No Year of modification /
commissioning
Balance life Capacity (MVA)
Weighted average
1 1995 9 18.9 170.10
2 1996 10 9.45 94.50
3 1997 11 9.45 103.95
4 1998 12 15.75 189.00
5 2000 14 12.60 176.40
6 2001 15 18.90 283.50
7 2002 16 3.15 50.40
8 2003 17 3.15 53.55
9 2005 19 28.35 538.65
Total 119.75 1660.05
Average balance life (in years) ~14
The above table explains that almost 25% of the capacity was built in year 2005 and around 35%
after year 2000 and around 40% before year 2000. Life of substation equipments is 25 years.

33
Based on the above date of operationalization, the average life of asset comes to 11 years and
therefore 14 years of balance life. Similarly, it is assumed that all the other power distribution
infrastructure (Line, DTCs, etc.) is incorporated according to substations incorporation year and
assumes the same life of the sub-station.
Hence weighted average is taken to establish the overall balance life which is 14 years.

34
Chapter 5 Valuations of assets of MPECS
The date of transfer of asset from MPECS to MSEDCL was 2011. We were presented with the
option of estimating the value of the assets as of 2011 or 2015. This gives rise to issues related
to whether the assets are still under use and all the assets that MSEDCL has replaced over the
last five years. MSEDCL has replaced ~30% of the assets of MPECS from 2011 to 2015. It is not
clear why these assets were replaced and if anything could have been done to increase life of
existing assets
Given that MSEDCL took over a fully operational asset in 2011, we have considered the following:
The assets should be valued as of 2011 and user charges computed keeping that date in
mind. Therefore the base year is taken as 2011.
All charges so computed can then be implemented with a carrying cost as per the MYT
guidelines, 2015 (Weighted average SBI base rate + 1.5%) added to address the four-
year lag in the pay-out of the charges. This should adjust for any interim payment made
by MSEDCL.
Electricity Distribution Assets shown in the table 11 have been built by MPECS over the past 40
years. These acquisition details are easily traceable to the fixed assets register, substation
installation register, purchase orders and several other documents which have been verified by
us. Land and leasehold land as mentioned in the table are lands used specifically for constructing
substations. Hence land is an important component of the electricity distribution assets. Land
means the freehold land owned by MPECS. Leasehold land means land obtained from third party
on annual lease payments for a lease period of 99 years. Building means building constructed
near the substation area. The study of the asset register after all write-offs and scrap sale
produces original cost of acquisition of Rs.157.80 crores as on 2011.
Table 10: Book value of distribution assets of MPECS
Distribution Assets Asset value (Amount in Rs.)
Depreciation (Amount in Rs.)
Book value 2011 (Amount in Rs.)
High voltage plants
Land 59,14,476 - 59,14,476
Land Leasehold 4,16,180 - 4,16,180

35
Distribution Assets Asset value (Amount in Rs.)
Depreciation (Amount in Rs.)
Book value 2011 (Amount in Rs.)
Buildings 104,04,127 21,43,564 82,60,562
Sub-stations 3020,33,520 1529,53,933 1490,79,586
High voltage line 33KVA 666,49,166 369,20,282 297,28,883
Total A 854,17,470 1920,17,781 1933,99,688
High voltage plant
T/C above 100KVA 1658,51,728 686,75,035 971,76,692
T/C below 100KVA 1434,91,262 783,53,981 651,37,280
H.T Line 44,14,461 936,22,693 1007,91,768
Metering equipment 30,21,451 6,30,443 23,91,007
Total B 5067,78,904 2412,82,154 2654,96,749
Medium and low voltage
L.T Line 4670,51,110 2540,46,236 2130,04,873
S.C Metering equipment 1964,94,223 832,70,221 1132,24,001
Capacitor banks 222,41,004 127,71,397 94,69,607
Total C 6857,86,338 3500,87,855 3356,98,482
Total A+B+C 15779,82,712 7833,87,791 7945,94,921
5.1 Valuation as per replacement cost
Table 11: Quantity details of distribution assets as per MPECS asset register
Sr. No. Assets 2010-2011 Quantity
A High voltage plants
305 Land (Sq. mtr) 1,33,700
305A Land Leasehold
306 Buildings 20
307 Sub-stations (Nos.) 20
308 High voltage Line (33 kV) (Km) 233
B High voltage assets
313 T/c above 100kVA (Nos.) 90
314 T/c 100kVA & below (Nos.) 3,288

36
Sr. No. Assets 2010-2011 Quantity
317 H/T Line (Km) 2,496
345B Metering equipment’s (TOD meter) (Nos.) 187
C Medium & low voltage plants
337 L.T. Line (Km) 8,937
344 S.C. Metering equipment’s (Nos.) 1 Phase 1,19,741
345 S.C. Metering equipment’s (Nos.) 3 Phase 5,168
345A Capacitor / Capacitor banks (Nos.) 83
To evaluate the MPECS assets, the REC approved MSEDCL cost data is used.
Land value is based on the prevalent government rate of 2011 (Annexure attached 7.3)
S.C metering 3 phase quantity is 5,168 as per the records in the MPECS asset register
Table 12: Cost of construction as per MSEDCL rates
Sr. No.
Particulars % of total cost of material
Cost of Material 100
1 Erection on material (Labour) 10.00% 10.0
2 Transportation on material 5.00% 5.0
3 Insurance on material 1.00% 1.0
4 Service tax @ (12.24% on 1+2+3) 1.96% 2.0
5 Contingencies on material 3.00% 3.0
6 T & P on material 1.50% 1.5
7 Contractor supervision on charges on material 5.00% 5.0
Sub-Total -I 127.46
8 Contractor profit on total project cost i.e. on sub-total-I 5.00% 6.37
Sub-Total -II 133.83
9 Price escalation on material cost 0.00% 0.0
Sub-Total -III 133.83
10 H.O. supervision charges @ 1.5% (i.e. 15% of 10% on erection of material)
1.50% 2.01
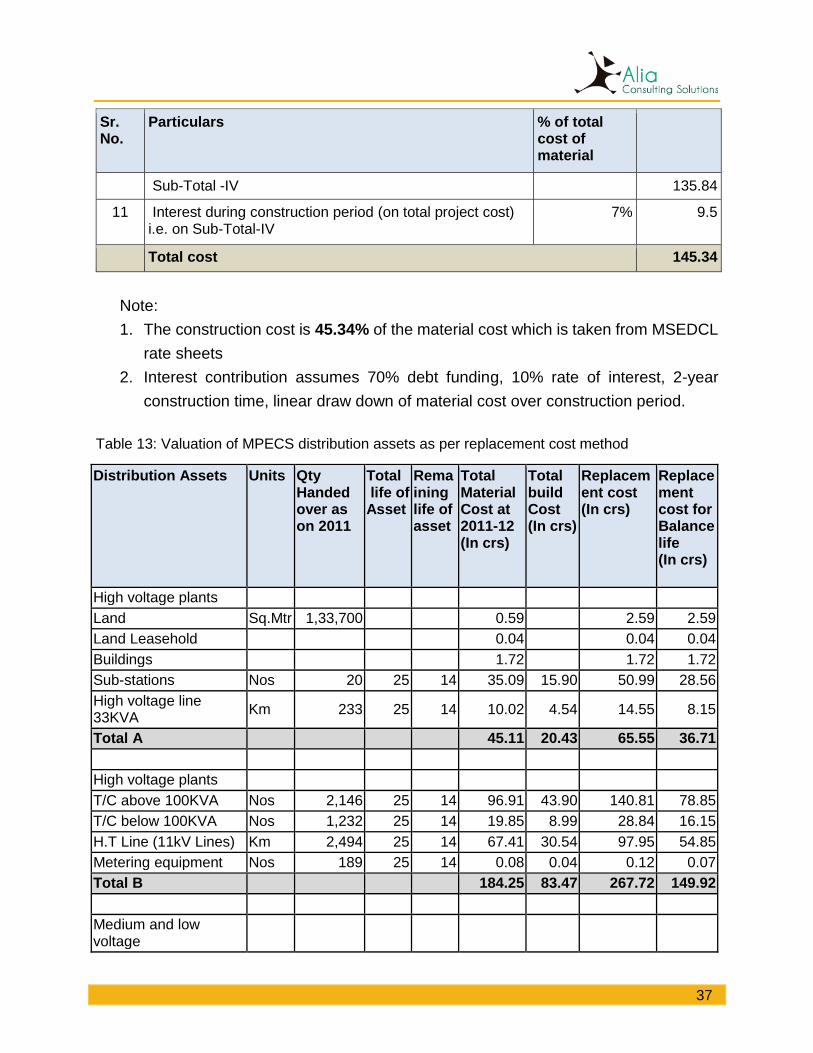
37
Sr. No.
Particulars % of total cost of material
Sub-Total -IV 135.84
11 Interest during construction period (on total project cost) i.e. on Sub-Total-IV
7% 9.5
Total cost 145.34
Note:
1. The construction cost is 45.34% of the material cost which is taken from MSEDCL
rate sheets
2. Interest contribution assumes 70% debt funding, 10% rate of interest, 2-year
construction time, linear draw down of material cost over construction period.
Table 13: Valuation of MPECS distribution assets as per replacement cost method
Distribution Assets Units Qty Handed over as on 2011
Total life of Asset
Remaining life of asset
Total Material Cost at 2011-12 (In crs)
Total build Cost (In crs)
Replacement cost (In crs)
Replacement cost for Balance life (In crs)
High voltage plants
Land Sq.Mtr 1,33,700 0.59 2.59 2.59
Land Leasehold 0.04 0.04 0.04
Buildings 1.72 1.72 1.72
Sub-stations Nos 20 25 14 35.09 15.90 50.99 28.56
High voltage line 33KVA
Km 233 25 14 10.02 4.54 14.55 8.15
Total A 45.11 20.43 65.55 36.71
High voltage plants
T/C above 100KVA Nos 2,146 25 14 96.91 43.90 140.81 78.85
T/C below 100KVA Nos 1,232 25 14 19.85 8.99 28.84 16.15
H.T Line (11kV Lines) Km 2,494 25 14 67.41 30.54 97.95 54.85
Metering equipment Nos 189 25 14 0.08 0.04 0.12 0.07
Total B 184.25 83.47 267.72 149.92
Medium and low voltage

38
Distribution Assets Units Qty Handed over as on 2011
Total life of Asset
Remaining life of asset
Total Material Cost at 2011-12 (In crs)
Total build Cost (In crs)
Replacement cost (In crs)
Replacement cost for Balance life (In crs)
L.T Line km 9,157 25 14 154.20 69.85 224.05 125.47
S.C Metering equipment
Nos 1,19,741 25 14 15.57 7.05 22.62 12.67
Capacitor banks Nos 83 25 14 0.85 0.38 1.23 0.69
Three phase metering Nos 5,168 25 14 7.33 3.32 10.65 5.96
Total C 177.94 80.61 258.55 144.79
Total A+B+C 407.31 596.17 335.77
Note:
1. Only land under sub-station has been considered and not the adjoining land parcel also owned
by MPECS. While commercial usage of the overall (adjoining) land parcel may not be possible
by MPECS, given the scope of this assignment to value distribution assets only, we have not
considered the entire land parcel.
2. Remaining life of assets is explained in section 4.3 of chapter 4.
3. For Distribution transformation centers:
Cost taken for DCT above 100 KVA is the average cost of DCT 100KVA, DCT 200 KVA,
DCT 315 KVA, DCT 500 KVA: Rs.4,51,586/-
Cost taken for DCT below 100 KVA is the average cost of DCT 15 KVA, DCT 25 KVA, DCT
50 KVA, DCT 63 KVA: Rs.1,61,115/-
4. Fire extinguishers have not been located on site, hence it is not considered in valuation.
The asset value without accounting for residual life is Rs. 596.17 crores based on
the replacement cost principle as on February 2011.
The replacement cost adjusted for residual life is Rs. 335.77 crores as on February
2011

39
5.2 Reconciliation with ASCI report
MPECS approached the Administrative Staff College of India (ASCI) to undertake a study on the
valuation of the Distribution Network of the MPECS in October 2013.
The scope of services determined by the MPECS to ASCI covers:
1. To undertake fair valuation of the Distribution Network of the society on a going concern basis
at the date of handing over the network to Maharashtra Electricity Distribution Co. Ltd.
(MSEDCL) i.e. 1st Feb 2011, by using appropriate method/ methods and engaging experts &
consultants thereof;
2. To evaluate the Distribution Network in two parts.
Valuation of the distribution network handed over to MSEDCL for its use to distribute
electricity in the area of operation of the society
Valuation of the General Assets retained by the Society
3. To advise what should be the rate of return/ charges to be applied for use of society's assets
Consistent with our approach, ASCI also considered the same valuation methodology. As per
ASCI report, the value of the asset as per replacement cost methodology came to Rs. 411.52
crores – higher than our estimated value by Rs. 85 crores. The difference arises due to three
reason:
The balance life assumed for the distribution assets in the ASCI report is 40 years for LT
lines and 15 years for all other distribution assets whereas we have taken 14 years for all
assets.
There is a Rs. 10 cr difference between ASCI and our report within general assets. We
have not been able to identify the basis for the difference as we do not have back up
calculations that has gone behind the calculations.

40
Chapter 6 User charge determination
6.1 User charges
For determining user charges due to MPECS for the use of its distribution assets, we have used
standard finance principles of compensating MPECS for the cost of capital (as indicated by the
value of assets) and the value of assets over the lifetime of the assets.
Capital cost determination
Charge determination requires as the first step, to compute an appropriate capital cost from the
perspective of MPECS. For the purpose of computing the cost of capital, we have made the
following assumptions:
The assets are assumed to be funded 30:70 by equity and debt as per Multi Year Tariff
(MYT) regulations.
Cost of equity is taken as 15.5% as per MYT regulations, 2011
Cost of debt is calculated by taking the weighted average of SBI base rates in a
particular year + 2%. (The methodology for computation of SBI base rates is given in
annexure 7.3)
o Cost of debt for 2015-2016 is as 9.53% + 2%= 11.53%
o Cost of debt for 2014-2015 is as 10.00%+ 2%= 12.00%
o Cost of debt for 2013-2014 is as 9.84% + 2%= 11.84%
o Cost of debt for 2012-2013 is as 9.85% + 2%= 11.85%
o Cost of debt for 2011-2012 is as 9.71% + 2%= 11.71%
Table 14: Illustrative weighted average cost of capital computation for 2015-16
Particulars Cost Weight WACC
Cost of Equity 15.50% 30% 4.65%
Cost of Debt 11.53% 70% 8.07%
Weighted Average Cost of Capital 12.72%
Coming from the above, the Weighted Average Cost of Capital comes to 12.72% for 2015- 16.
Similarly we have calculated for the every year starting 2011.
Weighted average cost of capital 2015-16 is 12.72%

41
Weighted average cost of capital 2014-15 is 13.05%
Weighted average cost of capital 2013-14 is 12.94%
Weighted average cost of capital 2012-13 is 12.95%
Weighted average cost of capital 2011-12 is 12.85%
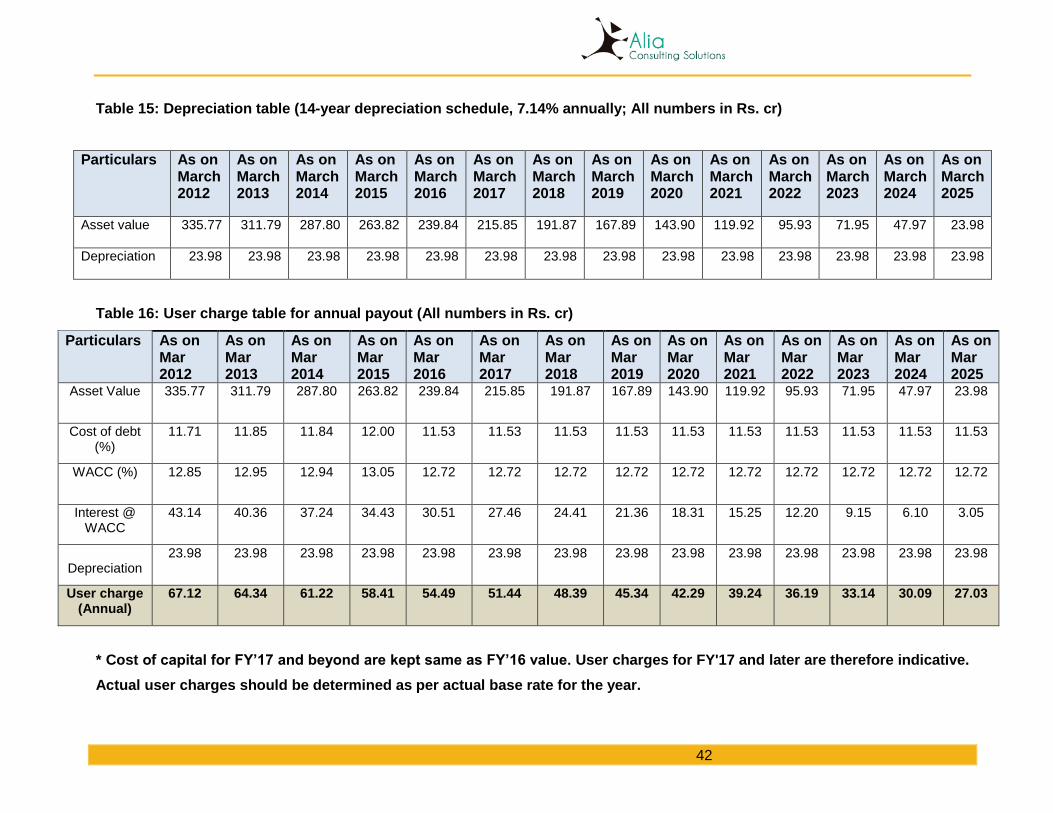
Asset depreciation and useful life
As discussed in section 4.3, the weighted average remaining useful of the distribution assets has
been determined to be 14 years. In line with this, we have made a depreciation assumption that
reduces the value of these assets linearly over a period of 14 years to zero by 2025 – an effective
depreciation rate of 7.14% every year. At a value Rs. 335.77 cr as of March 2012, the annual
depreciation amount comes to Rs. 23.98 cr. The same will need to be included as part of the user
charges paid to MPECS by MSEDCL.
Tables 15 and 16 below gives the year-on-year depreciation, cost of capital and the user charges
due to MPECS over the lifetime of the assets – from 2012 to 2025.
42
Table 15: Depreciation table (14-year depreciation schedule, 7.14% annually; All numbers in Rs. cr)
Particulars As on March 2012
As on March 2013
As on March 2014
As on March 2015
As on March 2016
As on March 2017
As on March 2018
As on March 2019
As on March 2020
As on March 2021
As on March 2022
As on March 2023
As on March 2024
As on March 2025
Asset value
335.77 311.79 287.80 263.82 239.84 215.85 191.87 167.89 143.90 119.92 95.93 71.95 47.97 23.98
Depreciation
23.98 23.98 23.98 23.98 23.98 23.98 23.98 23.98 23.98 23.98 23.98 23.98 23.98 23.98
Table 16: User charge table for annual payout (All numbers in Rs. cr)
Particulars As on Mar 2012
As on Mar 2013
As on Mar 2014
As on Mar 2015
As on Mar 2016
As on Mar 2017
As on Mar 2018
As on Mar 2019
As on Mar 2020
As on Mar 2021
As on Mar 2022
As on Mar 2023
As on Mar 2024
As on Mar 2025
Asset Value 335.77 311.79 287.80 263.82 239.84 215.85 191.87 167.89 143.90 119.92 95.93 71.95 47.97 23.98
Cost of debt (%)
11.71 11.85 11.84 12.00 11.53 11.53 11.53 11.53 11.53 11.53 11.53 11.53 11.53 11.53
WACC (%) 12.85 12.95 12.94 13.05 12.72 12.72 12.72 12.72 12.72 12.72 12.72 12.72 12.72 12.72
Interest @ WACC
43.14 40.36 37.24 34.43 30.51 27.46 24.41 21.36 18.31 15.25 12.20 9.15 6.10 3.05
Depreciation
23.98 23.98 23.98 23.98 23.98 23.98 23.98 23.98 23.98 23.98 23.98 23.98 23.98 23.98
User charge (Annual)
67.12 64.34 61.22 58.41 54.49 51.44 48.39 45.34 42.29 39.24 36.19 33.14 30.09 27.03
* Cost of capital for FY’17 and beyond are kept same as FY’16 value. User charges for FY'17 and later are therefore indicative.
Actual user charges should be determined as per actual base rate for the year.

43
** Base rate calculation from FY’12 to FY’16 is given in annexure 7.3. Similar principle should be followed for future years
Note: We have used FY 2011-2012 as the starting year as that year is the first complete year after the transfer of assets in
February of 2011.

44
6.2 Payout to MPECS going forward
In determining the actual payout to MPECS going forward, we have made the following
assumptions and adjustments:
The payouts start 31st March 2016 and the first payout will cover all past due charges
Carrying cost for unpaid past due charges have been taken at “SBI Base Rate + 1.5%".
The carrying cost considered has been arrived at a nominal interest that can be charged
for past due amounts - taking into account the SBI base rate and what could be a nominal
premium on top of that. Such interest rates are charged as per standard practice in multiple
industries. The number used is also in line with MYT regulations 2015.
The payout will adjust for the amount deposited by MSEDCL in compliance with the interim
Order dated 15 October, 2012 issued by MERC that determined an interim amount as Rs.
1 crore per month, i.e, Rs. 12 crore per annum to be paid by MSEDCL to MPECS, on an
ad hoc basis as charges for continuation of existing arrangement. A total amount of Rs.
62.64 crores in principle has been deposited by MSEDCL over a period of 5 years from
2011 to 2016.
The actual annual payout table is given in Table-17 below.

45
Table 17: Pay out table adjusted for amount already deposited (All numbers in Rs. cr)
Particulars As on Mar 2012
As on Mar 2013
As on Mar 2014
As on Mar 2015
As on Mar 2016
As on Mar 2017
As on Mar 2018
As on Mar 2019
As on Mar 2020
As on Mar 2021
As on Mar 2022
As on Mar 2023
As on Mar 2024
As on Mar 2025
User charge for the year 67.12 64.34 61.22 58.41 54.48 51.43 48.38 45.33 42.28 39.23 36.18 33.13 30.08 27.03
Carrying cost (%) 11.21 11.35 11.34 11.50 00.00 00.00 00.00 00.00 00.00 00.00 00.00 00.00 00.00 00.00
WACC (%) 12.85 12.95 12.94 13.05 12.72 12.72 12.72 12.72 12.72 12.72 12.72 12.72 12.72 12.72
Payout carry forward
67.12 138.99 215.98 298.89 0.00 0.00 0.00 0.00 0.00 0.00 0.00 0.00 0.00
Amount deposited by MSEDCL** 62.64 0.00 0.00 0.00 0.00 0.00 0.00 0.00 0.00 0.00
Carrying cost on unpaid due amount
7.52 15.78 24.49 34.37 0.00 0.00 0.00 0.00 0.00 0.00 0.00 0.00 0.00
Payout* 325.11 51.44 48.39 45.34 42.29 39.24 36.19 33.14 30.09 27.03
* Payout for FY'17 and later will be updated as per the actual cost of debt and WACC for the year
** Additionally, the entire amount of Rs. 62.64 cr deposited by MSEDCL with MERC and the interest accrued in that account will
be paid out to MPECS in March 2016
*** The above user charge and pay out assumes annual payment mode. Payment schedule if monthly mode followed is given
in Annexure 7.4

46
6.3 Applicability of wheeling charge to the current case
Computation of Wheeling Charges
Section 2 (76) of EA 2003 defines “wheeling” as the operation whereby the distribution system
and associated facilities of a transmission licensee or distribution licensee, as the case may be,
are used by another person for the conveyance of electricity on payment of charges to be
determined under section 62.
The wheeling charges for Distribution Wires Business of the Distribution Licensee shall provide
for the recovery of the Aggregate Revenue Requirement, as provided in Regulation 78 of these
Regulations and shall comprise the following:
Aggregate Revenue Requirement:
(a) Return on Equity Capital;
(b) Interest on Loan Capital;
(c) Depreciation;
(d) Operation and maintenance expenses;
(e) Interest on working capital and deposits from consumers and Distribution System Users;
(f) Provision for Bad and doubtful debts; and
(g) Contribution to contingency reserves.
Wheeling charges = Aggregate Revenue Requirement, as above, minus:
(h) Non-tariff income; and
(i) Income from Other Business, to the extent specified in these Regulations, and
(j) Receipts on account of additional surcharge on charges of wheeling.
The wheeling charge (Annual Revenue Requirement) methodology was developed with the
specific purpose of ensuring that any entity that builds distribution assets and wheels electricity
on those assets is able to get a suitable return from the project that covers both the cost of capital
and cost of operations and maintenance of those assets. The wheeling charge therefore is meant
to determine what should be the appropriate unit charge (to consumers) that can provide the
appropriate return to the operating entity.
Wheeling charges calculation: This option evaluated is the wheeling charge (ARR) as per
MERC regulations, 2011. Wheeling charges are used to determine tariff by calculating aggregate

47
revenue requirements of the entity wheeling electricity. The computation allows for entity to
recover return on its capital expenditure and allowable expenses and other provisions. We have
calculated the same for MPEC for the year of 2011-2. Computation for subsequent years is not
possible, as we have insufficient data because year-wise break up of replaced assets is not
available. Assets of MPECS have undergone major replacement (outlined in the annexure7.4)
The amount payable as on March 2012 is Rs.26.78 Crores.
Table 18: Wheeling charge computation for FY 2011-12
Particulars Amount (Rs. In crores)
Return on Equity 7.34
Interest on Loan Capital 11.99
Depreciation 4.55
Operation and Maintenance Expenses (Pl refer MYT Regulation 2015 page no. 99 Item 59)
N.A
Salary / dues N.A
Other 0.54
R and M Expenses 0.00
Interest on Working Capital and Deposits from Consumers 0.62
Contribution to Contingency Reserves 0.41
Other Expenses 0.00
Total 25.45
Provision for Bad and Doubtful Expenses 1.33
Annual Revenue Requirement 26.78
NOTE:
1. Return on equity: 15.50% (Applied on 30% on gross block of Rs.157 crores – As per MPECS
audited balance sheet figure of FY 2011-12)
2. Interest on debt: 10.91% (Applied on 70% on gross block of Rs.157 crores – As per MPECS
audited balance sheet figure of FY 2011-12)
3. Operations and Maintenance is not considered as system is operated by MSEDCL
4. Expenses linked to voluntary retirement scheme amounting to Rs. 121 Crores have not
been considered as they are not linked to core operations of the distribution franchise.

48
Handling of this cost (both accuracy of the claim and resolution of this claim) should be
handled outside of the scope wheeling charge computation.
In the current scenario at hand, this methodology is not appropriate for the following
reasons.
The entity to whom the charge is due (MPECS) is not the operating entity of the assets.
The expenses linked to operations and maintenance are borne by MSEDCL and therefore
if such costs of MPECS are added, it will lead to inaccuracy and double counting.
The wheeling charge exercise is an annual exercise that looks at performance of assets
of the prior year and any adjustment required towards net addition and deletion of assets
(for any replacement or addition) and re-computes the charge for the following year. Given
that the data on assets replaced are maintained by one party of the dispute, there is an
inherent conflict which may lead to further disputes in the future.
Most importantly, the charge that MSEDCL should pay for usage of MPECS assets should
be linked to the opportunity cost paved by MSEDCL in not having to build the assets. This
is best represented by replacement cost methodology as that represents the true value of
MPECS assets. The gross block, on the basis of which wheeling charges are determined,
do not truly represent this value as factors such as inflation, procurement and build
efficiency of MPECS do not get factored in.

49
Chapter 7 Annexures
7.1 Documents received from MPECS and MSEDCL
Documents received from MPECS
1. Copy of Asset Register duly certified by practicing Chartered Accountant (in soft & hard
copies)
2. ASCI Valuation Report (in soft & hard copies)
3. List of location of 183 villages
4. Latest report on number of assets with locations
Location wise list of sub stations (AC No. 307) with associated 33 KV lines (AC No. 308)
and 11 KV lines (AC No. 317)
Location wise list of Distribution Transformer Centers (DTC)/Distribution Transformers
100 KVA & Above (AC No. 313) and below 100 KVA (AC No. 314)
Location wise list of consumers/service connections with metering equipment’s (AC No.
344 & 345)
Address of land & building of MPECS
5. Line Diagrams
The point of supply diagram of 33 KV and 11 KV lines
Compilation of copies of (Sample) DTC LT line diagrams along with corresponding DTC
details
Topographical map showing 33 KV & 11 KV network, with locations of the sub stations
6. Sub Station installation register
33/11 KV sub-station register showing details of commissioning of sub-station/capacity
addition, details of land & civil construction, list of sub-station equipment’s, 7/12 abstracts
and lease agreements, Electrical Inspector's respective permission letters and approved
sub-station layout drawings
7. Fixed asset maintenance records
Circulars issued
Compliance reports for periodical/annual and pre-monsoon maintenance
Maintenance register for sub stations, HT lines, Transformers (DTCs) and LT lines
8. Trial Run Certificates
33/11 KV Sub Station trial Run Certificates (Samples)

50
Copies of Electrical Inspector, I.E. & L. Deptt; Govt. of Maharashtra Annual Inspection Fee
Notes for 33/11 KV Sub Stations (Samples)
Copies of Electrical Inspector, I.E. & L. Deptt; Govt. of Maharashtra Annual Inspection Fee
Notes for Dist. Transformer Centers (Samples)
Copy of Certificate of Calibration for Single Phase R.S.S. meter issued by IDEMI, Mumbai
(Sample)
Copy of Certificate of Calibration for Three Phase R.S.S. meter issued by IDEMI, Mumbai
(Sample)
9. Compilation of copies of samples of Purchase orders and respective supplier invoices/bills,
Bill clearance certificates and Debit (Docket) Vouchers for major distribution assets for the
years 2001-02 to 2010-11
10. MPECS Annual reports for FY 2010-11, 2011-12, 2012-13, 2013-14 & 2014-15
11. Notification of Ministry of Power, Govt. of India for depreciation rate
12. Documents pertaining to employee voluntary retirement scheme
GoM meeting proceeding Dtd. 04/04/2012
GoM meeting proceeding Dtd. 29/08/2012
Scanned copy of MPECS VRS proposal recommended by Labour Commissioner
of GoM
Statement showing the details of provisions made for VRS payments & amounts paid during
2012-13 to 2014-15
The following documents have been provided by MSEDCL
1. Sub-Station details of MPECS
2. DTC failure reports
3. List of augmented DTC
4. List of replaced items
5. Maintenance records
6. List of power transformers replaced by MSEDCL
7. Meter replacement statistics
8. Additional assets of MSEDCL (infra 2)
9. Scrap list of DTC
10. GFSS details

51
7.2 Inspection of records at MPECS head office
1. All the Electrical Distribution Assets are owned by the society and are in the name of the
society.
2. All the Electrical Distribution Assets have been physically verified and are in running/usable
condition. (Exceptions have been recorded separately)
3. The Substations Installation Register have been checked on sampling basis to ascertain the
date of commissioning/installation of each substation (a fixed asset) and the installation
expenses incurred.
4. The electrical inspector’s certificates have been checked certifying the functioning of the
substations and the transformers and hence the commencement of commercial functioning
of the assets.
5. The trial runs for the Electrical Distribution Assets have been checked location wise and
Feeder wise with Relay Test Certificates/Reports containing the relay details and relay
characteristics.
6. The Purchase Invoices for Fixed Assets purchased have been checked on sampling basis to
ascertain the date of acquisition of each asset separately and the quantity of assets
purchased.
7. Materials are accepted by MPECS only if they conform to the drawings and specifications
provided to the supplier.
8. Straight Line Method of providing depreciation on Fixed Assets have been followed as per
the Electricity Act.
9. Original cost of the fixed assets have been taken and cross checked with the Fixed Assets
Register.

52
7.3 Computation of weighted average Interest rates (State Bank of India)
Period SBI Base Rate Months SBI Base Rate for the year
Fy 2015-2016
15.10.2015 9.30 6
9.53 08.06.2015 9.70 4
10.04.2015 9.85 2
Fy 2014- 2015
2014 No change 10.00
Fy 2013-2014
07.11.2013 10.00 5
9.84 19.09.2013 9.80 2
01.04.2013 9.70 5
Fy 2012-2013
04.02.2013 9.70 2
9.85 20.09.2012 9.75 5
01.04.2012 10.00 5
Fy 2011-2012
13.08.2011 10.00 8
9.71 11.07.2011 9.50 1
12.05.2011 9.25 2
25.04.2011 8.50 1

53
7.4 Monthly pay out schedule
Month and year
Asset Value
Opening
Cost of debt (SBI base rate)
Cost of debt + 2%
WACC Interest @WACC
Deprecia-tion
User charge for the month
Payout carry
forward from prior
month
Amount depo-
sited by MSEDCL
Carrying cost on unpaid
due amount
Monthly payout
Apr-11 335.77 8.50% 10.50% 12.00% 3.36 2.00 5.36 0.00 0.00 0.00
May-11 333.77 9.25% 11.25% 12.53% 3.48 2.00 5.48 5.36 0.00 0.05
Jun-11 331.77 9.25% 11.25% 12.53% 3.46 2.00 5.46 10.89 0.00 0.10
Jul-11 329.77 9.50% 11.50% 12.70% 3.49 2.00 5.49 16.45 0.00 0.15
Aug-11 327.78 10.00% 12.00% 13.05% 3.56 2.00 5.56 22.09 0.00 0.21
Sep-11 325.78 10.00% 12.00% 13.05% 3.54 2.00 5.54 27.86 0.00 0.27
Oct-11 323.78 10.00% 12.00% 13.05% 3.52 2.00 5.52 33.67 0.00 0.32
Nov-11 321.78 10.00% 12.00% 13.05% 3.50 2.00 5.50 39.51 0.00 0.38
Dec-11 319.78 10.00% 12.00% 13.05% 3.48 2.00 5.48 45.39 0.00 0.43
Jan-12 317.78 10.00% 12.00% 13.05% 3.46 2.00 5.45 51.30 0.00 0.49
Feb-12 315.78 10.00% 12.00% 13.05% 3.43 2.00 5.43 57.24 0.00 0.55
Mar-12 313.79 10.00% 12.00% 13.05% 3.41 2.00 5.41 63.23 0.00 0.61
Apr-12 311.79 10.00% 12.00% 13.05% 3.39 2.00 5.39 69.24 0.00 0.66
May-12 309.79 10.00% 12.00% 13.05% 3.37 2.00 5.37 75.30 0.00 0.72
Jun-12 307.79 10.00% 12.00% 13.05% 3.35 2.00 5.35 81.39 0.00 0.78
Jul-12 305.79 10.00% 12.00% 13.05% 3.33 2.00 5.32 87.51 0.00 0.84
Aug-12 303.79 10.00% 12.00% 13.05% 3.30 2.00 5.30 93.67 0.00 0.90
Sep-12 301.79 9.75% 11.75% 12.88% 3.24 2.00 5.24 99.87 0.00 0.94
Oct-12 299.79 9.75% 11.75% 12.88% 3.22 2.00 5.22 106.05 0.00 0.99
Nov-12 297.80 9.75% 11.75% 12.88% 3.20 2.00 5.19 112.26 0.00 1.05
Dec-12 295.80 9.75% 11.75% 12.88% 3.17 2.00 5.17 118.50 0.00 1.11
Jan-13 293.80 9.75% 11.75% 12.88% 3.15 2.00 5.15 124.79 0.00 1.17
Feb-13 291.80 9.70% 11.70% 12.84% 3.12 2.00 5.12 131.11 0.00 1.22
Mar-13 289.80 9.70% 11.70% 12.84% 3.10 2.00 5.10 137.45 0.00 1.28

54
Month and year
Asset Value
Opening
Cost of debt (SBI base rate)
Cost of debt + 2%
WACC Interest @WACC
Deprecia-tion
User charge for the month
Payout carry
forward from prior
month
Amount depo-
sited by MSEDCL
Carrying cost on unpaid
due amount
Monthly payout
Apr-13 287.80 9.70% 11.70% 12.84% 3.08 2.00 5.08 143.83 0.00 1.34
May-13 285.80 9.70% 11.70% 12.84% 3.06 2.00 5.06 150.25 0.00 1.40
Jun-13 283.81 9.70% 11.70% 12.84% 3.04 2.00 5.04 156.71 0.00 1.46
Jul-13 281.81 9.70% 11.70% 12.84% 3.02 2.00 5.01 163.21 0.00 1.52
Aug-13 279.81 9.70% 11.70% 12.84% 2.99 2.00 4.99 169.75 0.00 1.58
Sep-13 277.81 9.80% 11.80% 12.91% 2.99 2.00 4.99 176.32 0.00 1.66
Oct-13 275.81 9.80% 11.80% 12.91% 2.97 2.00 4.97 182.97 0.00 1.72
Nov-13 273.81 10.00% 12.00% 13.05% 2.98 2.00 4.98 189.66 0.00 1.82
Dec-13 271.81 10.00% 12.00% 13.05% 2.96 2.00 4.95 196.46 0.00 1.88
Jan-14 269.82 10.00% 12.00% 13.05% 2.93 2.00 4.93 203.29 0.00 1.95
Feb-14 267.82 10.00% 12.00% 13.05% 2.91 2.00 4.91 210.17 0.00 2.01
Mar-14 265.82 10.00% 12.00% 13.05% 2.89 2.00 4.89 217.10 0.00 2.08
Apr-14 263.82 10.00% 12.00% 13.05% 2.87 2.00 4.87 224.07 0.00 2.15
May-14 261.82 10.00% 12.00% 13.05% 2.85 2.00 4.85 231.08 0.00 2.21
Jun-14 259.82 10.00% 12.00% 13.05% 2.83 2.00 4.82 238.14 0.00 2.28
Jul-14 257.82 10.00% 12.00% 13.05% 2.80 2.00 4.80 245.25 0.00 2.35
Aug-14 255.82 10.00% 12.00% 13.05% 2.78 2.00 4.78 252.40 0.00 2.42
Sep-14 253.83 10.00% 12.00% 13.05% 2.76 2.00 4.76 259.60 0.00 2.49
Oct-14 251.83 10.00% 12.00% 13.05% 2.74 2.00 4.74 266.85 0.00 2.56
Nov-14 249.83 10.00% 12.00% 13.05% 2.72 2.00 4.72 274.14 0.00 2.63
Dec-14 247.83 10.00% 12.00% 13.05% 2.70 2.00 4.69 281.49 0.00 2.70
Jan-15 245.83 10.00% 12.00% 13.05% 2.67 2.00 4.67 288.88 0.00 2.77
Feb-15 243.83 10.00% 12.00% 13.05% 2.65 2.00 4.65 296.32 0.00 2.84
Mar-15 241.83 10.00% 12.00% 13.05% 2.63 2.00 4.63 303.81 0.00 2.91
Apr-15 239.84 9.85% 11.85% 12.95% 2.59 2.00 4.59 311.35 0.00 2.94

55
Month and year
Asset Value
Opening
Cost of debt (SBI base rate)
Cost of debt + 2%
WACC Interest @WACC
Deprecia-tion
User charge for the month
Payout carry
forward from prior
month
Amount depo-
sited by MSEDCL
Carrying cost on unpaid
due amount
Monthly payout
May-15 237.84 9.85% 11.85% 12.95% 2.57 2.00 4.56 318.88 0.00 3.02
Jun-15 235.84 9.70% 11.70% 12.84% 2.52 2.00 4.52 326.46 0.00 3.05
Jul-15 233.84 9.70% 11.70% 12.84% 2.50 2.00 4.50 334.03 0.00 3.12
Aug-15 231.84 9.70% 11.70% 12.84% 2.48 2.00 4.48 341.65 0.00 3.19
Sep-15 229.84 9.70% 11.70% 12.84% 2.46 2.00 4.46 349.32 0.00 3.26
Oct-15 227.84 9.30% 11.30% 12.56% 2.38 2.00 4.38 357.03 57.64 3.21
Nov-15 225.85 9.30% 11.30% 12.56% 2.36 2.00 4.36 306.99 1.00 2.76
Dec-15 223.85 9.30% 11.30% 12.56% 2.34 2.00 4.34 313.12 1.00 2.82
Jan-16 221.85 9.30% 11.30% 12.56% 2.32 2.00 4.32 319.28 1.00 2.87
Feb-16 219.85 9.30% 11.30% 12.56% 2.30 2.00 4.30 325.47 1.00 2.93
Mar-16 217.85 9.30% 11.30% 12.56% 2.28 2.00 4.28 331.70 1.00 2.99 337.96
Apr-16 215.85 9.30% 11.30% 12.56% 2.26 2.00 4.26 0.00 0.00 0.00 4.26
May-16 213.85 9.30% 11.30% 12.56% 2.24 2.00 4.24 0.00 0.00 0.00 4.24
Jun-16 211.85 9.30% 11.30% 12.56% 2.22 2.00 4.22 0.00 0.00 0.00 4.22
Jul-16 209.86 9.30% 11.30% 12.56% 2.20 2.00 4.20 0.00 0.00 0.00 4.20
Aug-16 207.86 9.30% 11.30% 12.56% 2.18 2.00 4.17 0.00 0.00 0.00 4.17
Sep-16 205.86 9.30% 11.30% 12.56% 2.15 2.00 4.15 0.00 0.00 0.00 4.15
Oct-16 203.86 9.30% 11.30% 12.56% 2.13 2.00 4.13 0.00 0.00 0.00 4.13
Nov-16 201.86 9.30% 11.30% 12.56% 2.11 2.00 4.11 0.00 0.00 0.00 4.11
Dec-16 199.86 9.30% 11.30% 12.56% 2.09 2.00 4.09 0.00 0.00 0.00 4.09
Jan-17 197.86 9.30% 11.30% 12.56% 2.07 2.00 4.07 0.00 0.00 0.00 4.07
Feb-17 195.87 9.30% 11.30% 12.56% 2.05 2.00 4.05 0.00 0.00 0.00 4.05
Mar-17 193.87 9.30% 11.30% 12.56% 2.03 2.00 4.03 0.00 0.00 0.00 4.03
Apr-17 191.87 9.30% 11.30% 12.56% 2.01 2.00 4.01 0.00 0.00 0.00 4.01
May-17 189.87 9.30% 11.30% 12.56% 1.99 2.00 3.99 0.00 0.00 0.00 3.99

56
Month and year
Asset Value
Opening
Cost of debt (SBI base rate)
Cost of debt + 2%
WACC Interest @WACC
Deprecia-tion
User charge for the month
Payout carry
forward from prior
month
Amount depo-
sited by MSEDCL
Carrying cost on unpaid
due amount
Monthly payout
Jun-17 187.87 9.30% 11.30% 12.56% 1.97 2.00 3.97 0.00 0.00 0.00 3.97
Jul-17 185.87 9.30% 11.30% 12.56% 1.95 2.00 3.94 0.00 0.00 0.00 3.94
Aug-17 183.87 9.30% 11.30% 12.56% 1.92 2.00 3.92 0.00 0.00 0.00 3.92
Sep-17 181.88 9.30% 11.30% 12.56% 1.90 2.00 3.90 0.00 0.00 0.00 3.90
Oct-17 179.88 9.30% 11.30% 12.56% 1.88 2.00 3.88 0.00 0.00 0.00 3.88
Nov-17 177.88 9.30% 11.30% 12.56% 1.86 2.00 3.86 0.00 0.00 0.00 3.86
Dec-17 175.88 9.30% 11.30% 12.56% 1.84 2.00 3.84 0.00 0.00 0.00 3.84
Jan-18 173.88 9.30% 11.30% 12.56% 1.82 2.00 3.82 0.00 0.00 0.00 3.82
Feb-18 171.88 9.30% 11.30% 12.56% 1.80 2.00 3.80 0.00 0.00 0.00 3.80
Mar-18 169.88 9.30% 11.30% 12.56% 1.78 2.00 3.78 0.00 0.00 0.00 3.78
Apr-18 167.89 9.30% 11.30% 12.56% 1.76 2.00 3.76 0.00 0.00 0.00 3.76
May-18 165.89 9.30% 11.30% 12.56% 1.74 2.00 3.73 0.00 0.00 0.00 3.73
Jun-18 163.89 9.30% 11.30% 12.56% 1.72 2.00 3.71 0.00 0.00 0.00 3.71
Jul-18 161.89 9.30% 11.30% 12.56% 1.69 2.00 3.69 0.00 0.00 0.00 3.69
Aug-18 159.89 9.30% 11.30% 12.56% 1.67 2.00 3.67 0.00 0.00 0.00 3.67
Sep-18 157.89 9.30% 11.30% 12.56% 1.65 2.00 3.65 0.00 0.00 0.00 3.65
Oct-18 155.89 9.30% 11.30% 12.56% 1.63 2.00 3.63 0.00 0.00 0.00 3.63
Nov-18 153.89 9.30% 11.30% 12.56% 1.61 2.00 3.61 0.00 0.00 0.00 3.61
Dec-18 151.90 9.30% 11.30% 12.56% 1.59 2.00 3.59 0.00 0.00 0.00 3.59
Jan-19 149.90 9.30% 11.30% 12.56% 1.57 2.00 3.57 0.00 0.00 0.00 3.57
Feb-19 147.90 9.30% 11.30% 12.56% 1.55 2.00 3.55 0.00 0.00 0.00 3.55
Mar-19 145.90 9.30% 11.30% 12.56% 1.53 2.00 3.53 0.00 0.00 0.00 3.53
Apr-19 143.90 9.30% 11.30% 12.56% 1.51 2.00 3.50 0.00 0.00 0.00 3.50
May-19 141.90 9.30% 11.30% 12.56% 1.49 2.00 3.48 0.00 0.00 0.00 3.48
Jun-19 139.90 9.30% 11.30% 12.56% 1.46 2.00 3.46 0.00 0.00 0.00 3.46

57
Month and year
Asset Value
Opening
Cost of debt (SBI base rate)
Cost of debt + 2%
WACC Interest @WACC
Deprecia-tion
User charge for the month
Payout carry
forward from prior
month
Amount depo-
sited by MSEDCL
Carrying cost on unpaid
due amount
Monthly payout
Jul-19 137.91 9.30% 11.30% 12.56% 1.44 2.00 3.44 0.00 0.00 0.00 3.44
Aug-19 135.91 9.30% 11.30% 12.56% 1.42 2.00 3.42 0.00 0.00 0.00 3.42
Sep-19 133.91 9.30% 11.30% 12.56% 1.40 2.00 3.40 0.00 0.00 0.00 3.40
Oct-19 131.91 9.30% 11.30% 12.56% 1.38 2.00 3.38 0.00 0.00 0.00 3.38
Nov-19 129.91 9.30% 11.30% 12.56% 1.36 2.00 3.36 0.00 0.00 0.00 3.36
Dec-19 127.91 9.30% 11.30% 12.56% 1.34 2.00 3.34 0.00 0.00 0.00 3.34
Jan-20 125.91 9.30% 11.30% 12.56% 1.32 2.00 3.32 0.00 0.00 0.00 3.32
Feb-20 123.92 9.30% 11.30% 12.56% 1.30 2.00 3.30 0.00 0.00 0.00 3.30
Mar-20 121.92 9.30% 11.30% 12.56% 1.28 2.00 3.27 0.00 0.00 0.00 3.27
Apr-20 119.92 9.30% 11.30% 12.56% 1.26 2.00 3.25 0.00 0.00 0.00 3.25
May-20 117.92 9.30% 11.30% 12.56% 1.23 2.00 3.23 0.00 0.00 0.00 3.23
Jun-20 115.92 9.30% 11.30% 12.56% 1.21 2.00 3.21 0.00 0.00 0.00 3.21
Jul-20 113.92 9.30% 11.30% 12.56% 1.19 2.00 3.19 0.00 0.00 0.00 3.19
Aug-20 111.92 9.30% 11.30% 12.56% 1.17 2.00 3.17 0.00 0.00 0.00 3.17
Sep-20 109.92 9.30% 11.30% 12.56% 1.15 2.00 3.15 0.00 0.00 0.00 3.15
Oct-20 107.93 9.30% 11.30% 12.56% 1.13 2.00 3.13 0.00 0.00 0.00 3.13
Nov-20 105.93 9.30% 11.30% 12.56% 1.11 2.00 3.11 0.00 0.00 0.00 3.11
Dec-20 103.93 9.30% 11.30% 12.56% 1.09 2.00 3.09 0.00 0.00 0.00 3.09
Jan-21 101.93 9.30% 11.30% 12.56% 1.07 2.00 3.07 0.00 0.00 0.00 3.07
Feb-21 99.93 9.30% 11.30% 12.56% 1.05 2.00 3.04 0.00 0.00 0.00 3.04
Mar-21 97.93 9.30% 11.30% 12.56% 1.03 2.00 3.02 0.00 0.00 0.00 3.02
Apr-21 95.93 9.30% 11.30% 12.56% 1.00 2.00 3.00 0.00 0.00 0.00 3.00
May-21 93.94 9.30% 11.30% 12.56% 0.98 2.00 2.98 0.00 0.00 0.00 2.98
Jun-21 91.94 9.30% 11.30% 12.56% 0.96 2.00 2.96 0.00 0.00 0.00 2.96
Jul-21 89.94 9.30% 11.30% 12.56% 0.94 2.00 2.94 0.00 0.00 0.00 2.94

58
Month and year
Asset Value
Opening
Cost of debt (SBI base rate)
Cost of debt + 2%
WACC Interest @WACC
Deprecia-tion
User charge for the month
Payout carry
forward from prior
month
Amount depo-
sited by MSEDCL
Carrying cost on unpaid
due amount
Monthly payout
Aug-21 87.94 9.30% 11.30% 12.56% 0.92 2.00 2.92 0.00 0.00 0.00 2.92
Sep-21 85.94 9.30% 11.30% 12.56% 0.90 2.00 2.90 0.00 0.00 0.00 2.90
Oct-21 83.94 9.30% 11.30% 12.56% 0.88 2.00 2.88 0.00 0.00 0.00 2.88
Nov-21 81.94 9.30% 11.30% 12.56% 0.86 2.00 2.86 0.00 0.00 0.00 2.86
Dec-21 79.95 9.30% 11.30% 12.56% 0.84 2.00 2.84 0.00 0.00 0.00 2.84
Jan-22 77.95 9.30% 11.30% 12.56% 0.82 2.00 2.81 0.00 0.00 0.00 2.81
Feb-22 75.95 9.30% 11.30% 12.56% 0.79 2.00 2.79 0.00 0.00 0.00 2.79
Mar-22 73.95 9.30% 11.30% 12.56% 0.77 2.00 2.77 0.00 0.00 0.00 2.77
Apr-22 71.95 9.30% 11.30% 12.56% 0.75 2.00 2.75 0.00 0.00 0.00 2.75
May-22 69.95 9.30% 11.30% 12.56% 0.73 2.00 2.73 0.00 0.00 0.00 2.73
Jun-22 67.95 9.30% 11.30% 12.56% 0.71 2.00 2.71 0.00 0.00 0.00 2.71
Jul-22 65.95 9.30% 11.30% 12.56% 0.69 2.00 2.69 0.00 0.00 0.00 2.69
Aug-22 63.96 9.30% 11.30% 12.56% 0.67 2.00 2.67 0.00 0.00 0.00 2.67
Sep-22 61.96 9.30% 11.30% 12.56% 0.65 2.00 2.65 0.00 0.00 0.00 2.65
Oct-22 59.96 9.30% 11.30% 12.56% 0.63 2.00 2.63 0.00 0.00 0.00 2.63
Nov-22 57.96 9.30% 11.30% 12.56% 0.61 2.00 2.61 0.00 0.00 0.00 2.61
Dec-22 55.96 9.30% 11.30% 12.56% 0.59 2.00 2.58 0.00 0.00 0.00 2.58
Jan-23 53.96 9.30% 11.30% 12.56% 0.56 2.00 2.56 0.00 0.00 0.00 2.56
Feb-23 51.96 9.30% 11.30% 12.56% 0.54 2.00 2.54 0.00 0.00 0.00 2.54
Mar-23 49.97 9.30% 11.30% 12.56% 0.52 2.00 2.52 0.00 0.00 0.00 2.52
Apr-23 47.97 9.30% 11.30% 12.56% 0.50 2.00 2.50 0.00 0.00 0.00 2.50
May-23 45.97 9.30% 11.30% 12.56% 0.48 2.00 2.48 0.00 0.00 0.00 2.48
Jun-23 43.97 9.30% 11.30% 12.56% 0.46 2.00 2.46 0.00 0.00 0.00 2.46
Jul-23 41.97 9.30% 11.30% 12.56% 0.44 2.00 2.44 0.00 0.00 0.00 2.44
Aug-23 39.97 9.30% 11.30% 12.56% 0.42 2.00 2.42 0.00 0.00 0.00 2.42

59
Month and year
Asset Value
Opening
Cost of debt (SBI base rate)
Cost of debt + 2%
WACC Interest @WACC
Deprecia-tion
User charge for the month
Payout carry
forward from prior
month
Amount depo-
sited by MSEDCL
Carrying cost on unpaid
due amount
Monthly payout
Sep-23 37.97 9.30% 11.30% 12.56% 0.40 2.00 2.40 0.00 0.00 0.00 2.40
Oct-23 35.98 9.30% 11.30% 12.56% 0.38 2.00 2.38 0.00 0.00 0.00 2.38
Nov-23 33.98 9.30% 11.30% 12.56% 0.36 2.00 2.35 0.00 0.00 0.00 2.35
Dec-23 31.98 9.30% 11.30% 12.56% 0.33 2.00 2.33 0.00 0.00 0.00 2.33
Jan-24 29.98 9.30% 11.30% 12.56% 0.31 2.00 2.31 0.00 0.00 0.00 2.31
Feb-24 27.98 9.30% 11.30% 12.56% 0.29 2.00 2.29 0.00 0.00 0.00 2.29
Mar-24 25.98 9.30% 11.30% 12.56% 0.27 2.00 2.27 0.00 0.00 0.00 2.27
Apr-24 23.98 9.30% 11.30% 12.56% 0.25 2.00 2.25 0.00 0.00 0.00 2.25
May-24 21.98 9.30% 11.30% 12.56% 0.23 2.00 2.23 0.00 0.00 0.00 2.23
Jun-24 19.99 9.30% 11.30% 12.56% 0.21 2.00 2.21 0.00 0.00 0.00 2.21
Jul-24 17.99 9.30% 11.30% 12.56% 0.19 2.00 2.19 0.00 0.00 0.00 2.19
Aug-24 15.99 9.30% 11.30% 12.56% 0.17 2.00 2.17 0.00 0.00 0.00 2.17
Sep-24 13.99 9.30% 11.30% 12.56% 0.15 2.00 2.15 0.00 0.00 0.00 2.15
Oct-24 11.99 9.30% 11.30% 12.56% 0.13 2.00 2.12 0.00 0.00 0.00 2.12
Nov-24 9.99 9.30% 11.30% 12.56% 0.10 2.00 2.10 0.00 0.00 0.00 2.10
Dec-24 7.99 9.30% 11.30% 12.56% 0.08 2.00 2.08 0.00 0.00 0.00 2.08
Jan-25 6.00 9.30% 11.30% 12.56% 0.06 2.00 2.06 0.00 0.00 0.00 2.06
Feb-25 4.00 9.30% 11.30% 12.56% 0.04 2.00 2.04 0.00 0.00 0.00 2.04
Mar-25 2.00 9.30% 11.30% 12.56% 0.02 2.00 2.02 0.00 0.00 0.00 2.02
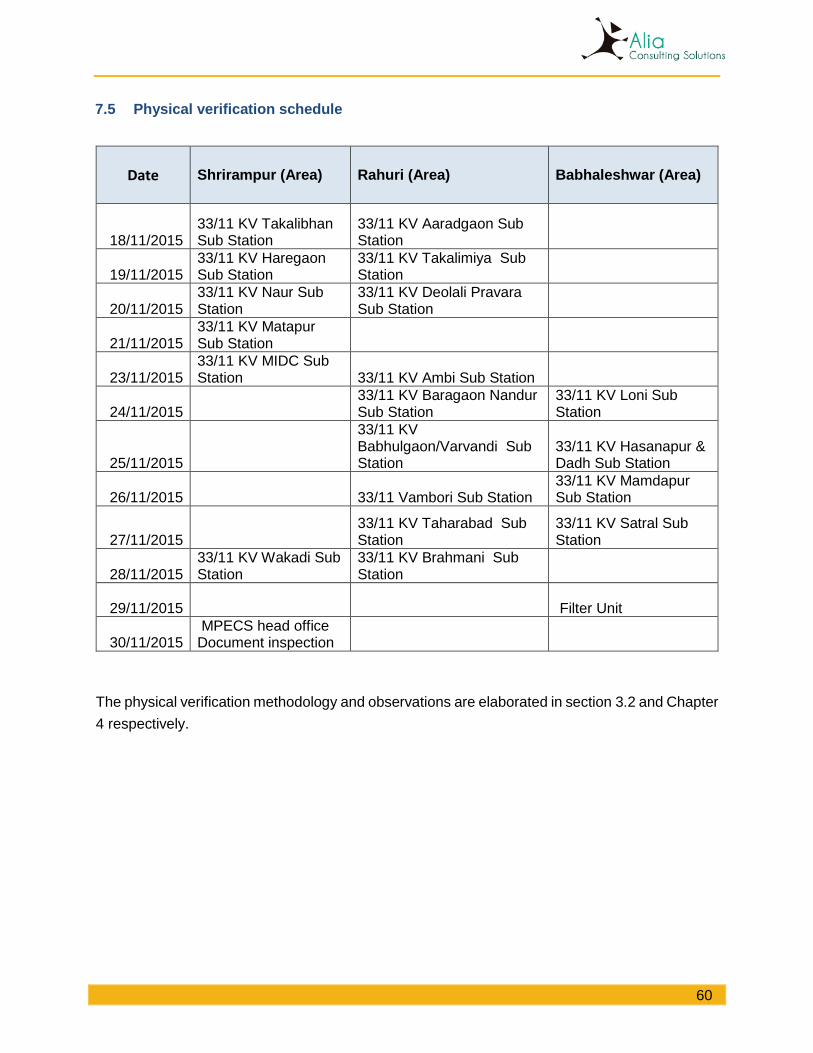
60
7.5 Physical verification schedule
Date Shrirampur (Area) Rahuri (Area) Babhaleshwar (Area)
18/11/2015 33/11 KV Takalibhan Sub Station
33/11 KV Aaradgaon Sub Station
19/11/2015 33/11 KV Haregaon Sub Station
33/11 KV Takalimiya Sub Station
20/11/2015 33/11 KV Naur Sub Station
33/11 KV Deolali Pravara Sub Station
21/11/2015 33/11 KV Matapur Sub Station
23/11/2015 33/11 KV MIDC Sub Station 33/11 KV Ambi Sub Station
24/11/2015 33/11 KV Baragaon Nandur Sub Station
33/11 KV Loni Sub Station
25/11/2015
33/11 KV Babhulgaon/Varvandi Sub Station
33/11 KV Hasanapur & Dadh Sub Station
26/11/2015 33/11 Vambori Sub Station 33/11 KV Mamdapur Sub Station
27/11/2015 33/11 KV Taharabad Sub Station
33/11 KV Satral Sub Station
28/11/2015 33/11 KV Wakadi Sub Station
33/11 KV Brahmani Sub Station
29/11/2015 Filter Unit
30/11/2015 MPECS head office Document inspection
The physical verification methodology and observations are elaborated in section 3.2 and Chapter
4 respectively.

61
7.6 Assessment of replaced assets of MPECS
MSEDCL has replaced approximately 800 distribution transformers.
Physical Survey Report- 99 DTR
DTR Not replaced Replaced Total
100 KVA and Above 35 36 71
100 KVA and Below 21 7 28
Total 56 43 99
The total transformers replaced as per MSEDCL data.
Break of the Survey for 3378 DTR
DTR Not replaced Replaced Total
100 KVA and Above 2424 - 2424
100 KVA and Below 954 - 954
Replaced by MSEDCL 800
Total 3378 800 3378
Meters replaced by MSEDCL
As per data submitted bv MSEDCL and MPECS
Quantity as on 2011
Replaced by MSEDCL
Balance
S.C Metering (1 phase) 1,19,741 1,41,287 21,546
As per MPECS asset register only 1,19,741 S.C meters (1 phase) have been installed till 2011.
The balance of 21,546 have not been recorded in the asset register. Hence, for valuation purpose
we have only considered the recorded quantity in the asset register. The balance quantity of
21,546 have been installed in 2010 and 2011 as per MPECS but not been recorded.
Assessment of sub-station asset position as on 2011 and 2015 based on survey
Sr No. Particulars Unit 2011-12 2015-16
Assets of 33kv/11kv Substation Position as on 2011
Replaced
1 Gantry Column for 33Kv incoming and outgoing No. 20 1
2 Structure for 33Kv & and 11Kv Swing bus No. 20 12

62
Sr No. Particulars Unit 2011-12 2015-16
3 Structure for top mounted AB switch on 11 & 33 Kv Bus (Bus Coupler)
No. 0
4 Structure for 11kv take off with top mounted AB switch & division of lighting arrestor
No. 55 9
5 Structure for 33Kv & and 11Kv isolators No. 177 143
6 Structure of installation of 33 Kv /110v.PT No. 20 20
7 Structure of installation of 11Kv /110v.PT No. 20 20
8 Structure of installation of 33kv CT No. 20 24
9 Structure of installation of 11kv CT No. 51 51
10 33Kv post insulator structure No. 40
11 11Kv post insulator structure No. 82
12 33 kV, 1250A Outdoor SF6 CB No. 20 9
13 33/11Kv Power transformer 3.15MVA No. 38 26
14 33Kv/110volts, potential transformer Set 20 13
15 11Kv/110volts, potential transformer Set 51 51
16 33Kv CT Set 20 20
17 11Kv CT Set 51 51
18 Disc. Ins for 33Kv Swing bus & Incoming Bay Set 0
19 33Kv Lighting arrestor Set 40 11
20 33Kv post insulator No. 18
21 11kv Vacuum circuit breaker with panel etc. Set 76 74
22 11Kv post insulator No. 0 0
23 Disc. ins for 11Kv Swing bus & Take off structure
No. 0 0
24 33Kv 3 pin type AB switch:630 AMPS Set 0 0
25 33Kv vacuum circuit Breaker with panel etc. Set 0 9
26 11 kV AB Switch ( 630A ) No. 99 49
27 11Kv lighting arrestor Set 76 21
28 ACSR Raccon conductor kM 0.9 0.9
29 Battery with battery charging unit complete(32V):as per REC specification
Set 20 7
30 Control cable :various sizes as per requirement LS 1 0
31 Aluminum pipe: 65mm. Dia as per requirement LS 0 0
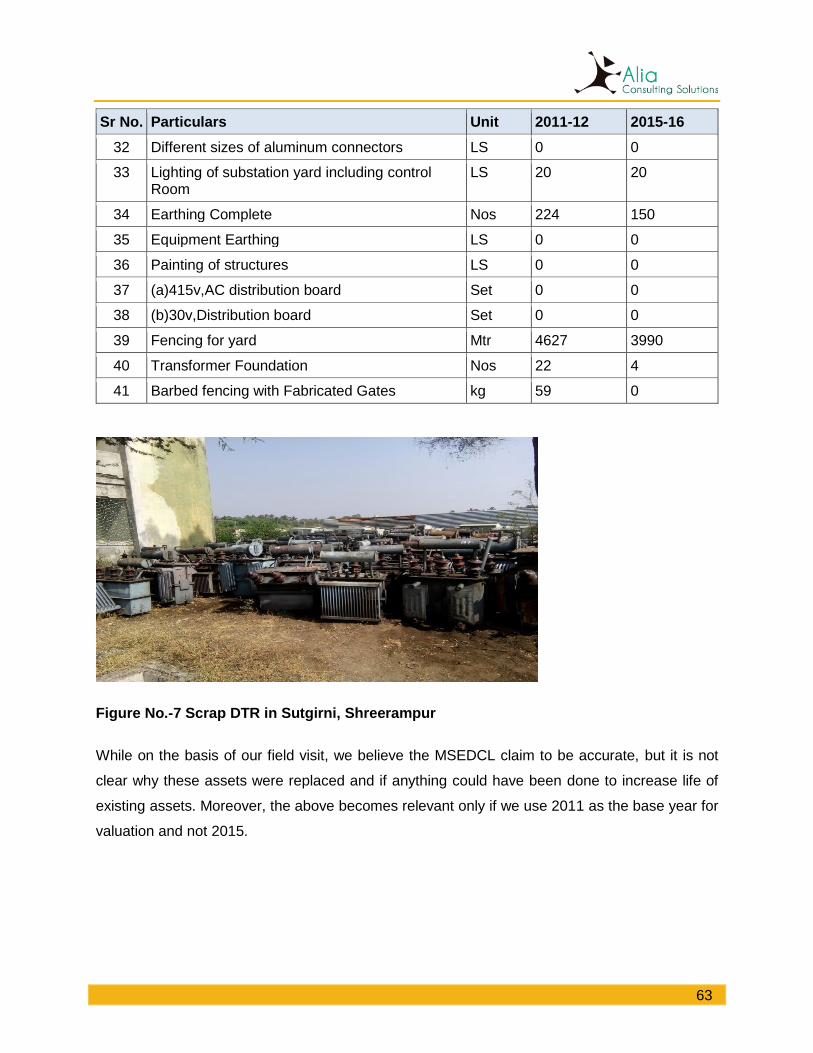
63
Sr No. Particulars Unit 2011-12 2015-16
32 Different sizes of aluminum connectors LS 0 0
33 Lighting of substation yard including control Room
LS 20 20
34 Earthing Complete Nos 224 150
35 Equipment Earthing LS 0 0
36 Painting of structures LS 0 0
37 (a)415v,AC distribution board Set 0 0
38 (b)30v,Distribution board Set 0 0
39 Fencing for yard Mtr 4627 3990
40 Transformer Foundation Nos 22 4
41 Barbed fencing with Fabricated Gates kg 59 0
Figure No.-7 Scrap DTR in Sutgirni, Shreerampur
While on the basis of our field visit, we believe the MSEDCL claim to be accurate, but it is not
clear why these assets were replaced and if anything could have been done to increase life of
existing assets. Moreover, the above becomes relevant only if we use 2011 as the base year for
valuation and not 2015.

64
7.7 Quantity of assets owned by MPECS
Sr No. Particulars Unit Quantity
33kV lines
1 33KV Lines Raccon Conductor (33KV Line) KM. 233.18
Substation
2 Assets of 33kv/11kv Substation
Gantry Column for 33Kv incoming and outgoing feeder No. 20
Structure for 33Kv & and 11Kv Swing bus No. 20
Structure for top mounted AB switch on 11 & 33 Kv Bus (Bus Coupler)
No. 0
Structure for 11kv take off with top mounted AB switch & division of lighting arrestor
No. 55
Structure for 33Kv & and 11Kv isolators No. 177
Structure of installation of 33 Kv /110v.PT No. 20
Structure of installation of 11Kv /110v.PT No. 20
Structure of installation of 11kv CT No. 51
33Kv post insulator structure No. 40
11Kv post insulator structure No. 82
33Kv,100 kva stn. Service transformer No. 20
33 kV, 1250A Outdoor SF6 CB No. 20
33/11Kv Power transformer 3.15MVA No. 38
33Kv/110 volts, potential transformer Set 20
11Kv/110 volts, potential transformer Set 51
33Kv CT Set 20
11Kv CT Set 76
Disc. Ins for 33Kv Swing bus & Incoming Bay Set 0
33Kv Lighting arrestor Set 40
33Kv post insulator No. 18
11kv Vacuum circuit breaker with panel etc. Set 76
11Kv post insulator No. 0
Disc. ins for 11Kv Swing bus & Take off structure Nos 0
33Kv 3 pin type AB switch:630 AMPS Set 0

65
Sr No. Particulars Unit Quantity
33Kv vacuum circuit Breaker with panel etc. Set 0
11 kV AB Switch ( 630A ) No. 99
11Kv lighting arrestor Set 76
ACSR Raccon conductor kM 0.9
Battery with battery charging unit complete(32V):as per REC specification
Set 20
Control cable: various sizes as per requirement LS 1
Aluminium pipe: 65mm. Dia as per requirement LS 0
Different sizes of aluminium connectors LS 0
Lighting of substation yard including control Room LS 20
Earthing Compelet NOS 224
Equipment Earthing LS 0
Painting of structures LS 0
(a)415v, AC distribution board Set 0
11KV Lines
4 11KV Lines Rabbit Conductor KM 728
11KV Lines Weasel Conductor KM 1767
4.a Distribution Transformer Centre’s (i.e.,DTC'S = 3378 numbers) & DTR'S
DCT 15 kVA (Aluminium coil) Nos. 1
DCT 15 kVA (Copper coil) Nos. 0
DCT 25 kVA (Aluminium coil) Nos. 6
DCT 25 kVA (Copper coil) Nos. 0
DCT 63 kVA (Aluminium coil) Nos. 661
DCT 63 kVA (Copper coil) Nos. 489
DCT 50 kVA (Aluminium coil) Nos. 45
DCT 50 kVA (Copper coil) Nos. 30
DCT 100 kVA (Aluminium coil) Nos. 1376
DCT 100 kVA (Copper coil) Nos. 683
DCT 200 kVA (Aluminium coil) Nos. 30
DCT 200 kVA (Copper coil) Nos. 54
DCT 315 kVA (Aluminium coil) Nos. 0

66
Sr No. Particulars Unit Quantity
DCT 315 kVA (Copper coil) Nos. 2
DCT 500 kVA (Aluminium coil) Nos. 0
DCT 500 kVA (Copper coil) Nos. 1
Metering Equipment’s (TOD Meter) (Nos.) Nos 187
5 LT Lines
LT Lines 3 ph 5 wire KM 330.12
LT Lines 3 ph 4 wire KM 7040.74
LT Lines 1 ph 3 wire KM 303.17
LT Lines 1 ph 2 wire KM 1262.94
LT Lines Double ckt KM 220.22
6 Capacitor Banks
Active Capacitors Nos 41
Passive Capacitors Nos 42
S.C. Metering Equipment’s (Nos.) 1 Phase Nos 112884
3 Phase Nos 54049
Cost of General assets owned by MPECS
Register A/c no.
General Assets (Position as on March)
Original Cost (In lacs)
360 Land 7.21
360B Land Leasehold 0.00
362 Buildings 125.19
362E Workshop Shed 0.31
362F Temporary Shed (Sub-station) 4.58
362G Temporary Vehicle Shed 2.46
363 Office furniture & equipment’s 78.57
363A Office furniture of small value 3.35
363B Computers 54.54
363C Generator & Machinery 12.34
364 Vehicles 72.88
365 Meter Testing Benches 14.09
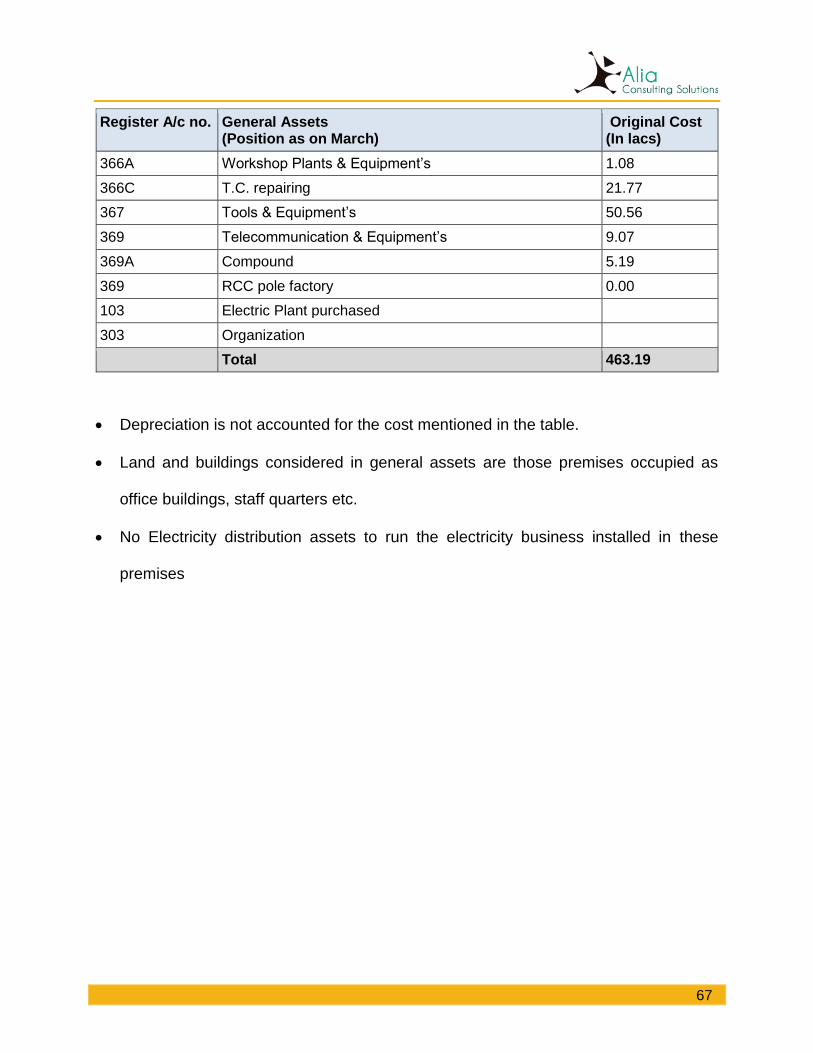
67
Register A/c no.
General Assets (Position as on March)
Original Cost (In lacs)
366A Workshop Plants & Equipment’s 1.08
366C T.C. repairing 21.77
367 Tools & Equipment’s 50.56
369 Telecommunication & Equipment’s 9.07
369A Compound 5.19
369 RCC pole factory 0.00
103 Electric Plant purchased
303 Organization
Total 463.19
Depreciation is not accounted for the cost mentioned in the table.
Land and buildings considered in general assets are those premises occupied as
office buildings, staff quarters etc.
No Electricity distribution assets to run the electricity business installed in these
premises

68
7.8 Land area and cost
Sub-station Village Area (Hecters. Ares)
Area of Land utilized for Sub Station Yard
Open Land Area
Total Land
Rate for N. A. Land for the Year 2012 (Rs./Sq. Mtr)
Value of Land utilized for Sub Station Yard
Open Land Area
Total
1 Naigaon/ Naur Naigaon 0.80 3500 4500 8000 260 910000 1170000 2,080,000.00
2 Wakadi Wakadi 0.80 3800 4200 8000 640 2432000 2688000 5,120,000.00
3 Mamdapur Nandur 0.80 3800 4200 8000 350 1330000 1470000 2,800,000.00
4 Loni Loni 0.60 3800 4200 8000 1220 4636000 5124000 9,760,000.00
5 Hasanapur Hasanapur 1.53 4000 11300 15300 350 1400000 3955000 5,355,000.00
6 Satral Satral 0.80 3500 4500 8000 710 2485000 3195000 5,680,000.00
7 Davangaon Davdangaon 0.92 3900 5300 9200 280 1092000 1484000 2,576,000.00
8 Baragaon Nandur/
Baragaon Nandur
0.74 3600 3800 7400 360 1296000 1368000 2,664,000.00
9 Taharabad Mhaisgaon 0.80 3000 5000 8000 120 360000 600000 960,000.00
10 Varvandi/ Babhulgaon 0.60 3900 2100 6000 220 858000 462000 1,320,000.00
11 Brahmani Brahmani 0.80 3200 4800 8000 710 2272000 3408000 5,680,000.00
12 Takalimiya Takalimiya 1.01 3800 6300 10100 360 1368000 2268000 3,636,000.00
13 Takalibhan Takalibhan 0.80 3600 4400 8000 500 1800000 2200000 4,000,000.00
14 Matapur Padhegaon 0.80 3700 4300 8000 570 2109000 2451000 4,560,000.00
15 Vambori Vambori 1.60 3200 12800 16000 500 1600000 6400000 8,000,000.00
Total 25,948,000.00 38,243,000.00 64,191,000.00

69
7.9 References used
1. Multi Year Tariff regulations, 2011
2. Multi Year Tariff regulations, 2015
3. Orders in matter of Mula-Pravara
4. Electricity Act, 2003
5. MSEDCL rates 2008, 20011
6. REC rates 2011
7. Bureau of Energy Efficiency
8. Indian standard 5002 of 1969 (Method for determination of sample size)

70