report - powell river
TRANSCRIPT

REPORT
City of Powell River Consolidated Wastewater Treatment Plant Environmental Impact Study for the Marine Receiving Environment
April 2018


P:\20172098\00_Pwll_Rvr_WWTP\Environmental_Sciences\04.02_Assessment_Reports\Ltr_Pow_Eis_Moe_20180403_Tr.Docx
April 3, 2018
File: 2017-2098.00.ES.04.02
Trevor Hamelin
Environmental Protection Officer
The Ministry of Environment
10470 - 152 Street
Surrey, BC V3R 0Y3
Re: CITY OF POWELL RIVER - CONSOLIDATED WASTEWATER TREATMENT PLANT
ENVIRONMENTAL IMPACT STUDY FOR THE MARINE RECEIVING ENVIRONMENT
Dear Mr. Hamelin:
Associated Engineering provides this Environmental Impact Study (EIS) as part of the City of Powell River’s
ongoing Municipal Wastewater Regulation (MWR) registration process, and the City’s Consolidated
Wastewater Treatment Project. The EIS was undertaken following the guidelines provided by the B.C.
Ministry of Environment.
Please contact the undersigned if you have any questions or require additional information.
Yours truly,
Tom Robinson, M.A.Sc., P.Eng.
Project Manager
TR/RH/lp
Rob Hoogendoorn, R.P.Bio.
Senior Environmental Scientist

REPORT
i
Executive Summary
The City of Powell River currently discharges wastewater effluent from the Wildwood, Townsite, and
Westview wastewater treatment plants (WWTPs) through three separate outfalls into Malaspina Strait. A
key decision of the City’s 2017 Liquid Waste Management Plan (LWMP) process is to construct and
operate a new Consolidated WWTP that combines the flows from the three existing plants and is designed
and operated to meet all provincial and federal treatment requirements.
This Environmental Impact Study (EIS) was completed within the regulatory framework of the Municipal
Wastewater Regulation (MWR) and accompanying guidelines published by the Ministry of Environment
(MoE). Within our defined local study area (LSA; zone of direct project influence) and regional study area
(RSA; zone of indirect influence from the project and other projects), we described existing marine outfalls,
including influent and effluent flow rates and water quality, and compared these with the planned outfall
effluent characteristics.
We considered the biophysical constraints and the receiving environment of the planned outfall, which
traverses through intertidal and sub-tidal marine habitats. The regional study area includes fish resources
such as salmon, groundfish, herring, prawn, shrimp, and crab. Some commercial fisheries are mapped for
the area (e.g. herring roe and shellfish); however, information from local sources revealed that fisheries in
the LSA are very limited or do not occur. Much of the intertidal area along the Powell River mainland shore,
and the subtidal area between Harwood and Texada islands is closed to shellfish harvesting due to existing
sanitary contamination concerns.
We applied the Visual Plumes numerical model to determine the dilution and dispersion characteristics of
the planned outfall’s treated effluent plume following discharge to Malaspina Strait. Ten modelling scenarios
were developed based on preliminary outfall and diffuser design and combinations of effluent and receiving
environment characteristics. There were four winter, three fall, and three summer scenarios. The objective
was to predict the water quality at the edge of the initial dilution zone (IDZ) at a radius of 100 m from the
diffuser.
Based on the review of background information and dilution modelling results, the key effects identified
through this environmental assessment are:
• The effluent plume traps below the surface under all scenarios. The shallowest trapping depths are
likely to occur during slack tide conditions and high effluent flow rates. The shallowest modelled
trapping depth was 29 m, which occurred during the summer slack current and a 2 times average
dry weather flow (ADWF) effluent flow rate.
• Dilution at the edge of the IDZ ranged from 100:1 to 410:1, with the lowest ratio occurring during fall
slack tide and a 2 times ADWF effluent flow rate. Slack tide conditions (i.e. where the current

City of Powell River
ii \\s-bur-fs-01\projects\20172098\00_pwll_rvr_wwtp\environmental_sciences\04.02_assessment_reports\rpt_pow_eis_20180403_rl.docx
velocity is zero or near zero) occur for about four hours/day, so the dilution ratio is greater than
100:1 about 80% of the time.
• Dilution at the edge of the IDZ for all flood tide scenarios are predicted to range from 220:1 to
450:1.
• Assuming a dilution of 100:1 as a conservative estimate for the lowest dilution achieved at the edge
of the IDZ, the most stringent and applicable water quality guidelines for total suspended solids,
carbonaceous biochemical oxygen demand, ammonia nitrogen and nitrate nitrogen, and fecal
coliforms will all be readily achievable at the edge of the IDZ.
• The planned outfall effluent is not a new waste stream compared to baseline conditions. Within the
LSA, the most significant change will be approximately a four-fold increase in effluent flows.
However, effluent quality will be improved.
• Within the RSA, effluent flow will remain the same as baseline conditions and effluent quality will be
improved.
• No sensitive aquatic habitats or biota have been identified in the LSA. The effects on existing
aquatic life are expected to be negligible based on the predicted effluent quality, and dilution at the
edge of the IDZ.
• The effects on recreational use are likely to be improved due to improved effluent quality. The risk
of exposure to treated effluent will be very low due to deep plume trapping depths.
• Since the Consolidated WWTP is not a new waste stream, potential cumulative effects will not likely
change compared to the baseline situation for the RSA. Effluent flow from the Consolidated WWTP
is projected to be approximately 5% of the effluent flow from the Catalyst Paper Corporation paper
mill.
The EIS analysis indicates that the planned outfall location will meet the MWR requirements for protecting
the environment and human health, assuming the “end-of-pipe” effluent quality meets the provincial and
federal treatment standards.
Recommendations for the pre-discharge monitoring are included at the end of the report and are based on
the MWR. Key components of the monitoring include characterizing pre-discharge seasonal conditions at
the edge of the IDZ and at three reference sites. The proposed monitoring includes water quality, sediment
quality, and benthic invertebrate sampling and analysis. Coordination of the City’s monitoring with the on-
going Environmental Effects Monitoring (EEM) being carried out by Catalyst Paper is recommended to
optimize the level of effort and enable data sharing to better evaluate potential cumulative effects.

Acknowledgements
iii
Acknowledgements
Associated Engineering would like to thank the people and organizations that provided information that was
used to prepare this report, including Phil Lum (Catalyst Paper Corporation), Jane Guo (Indigenous
Services Canada) and Northern Affairs Canada), as well as multiple individuals at the Department of
Fisheries and Oceans Canada.
We also thank Stephanie Little and Trevor Hamelin, from the Ministry of Environment, for confirmation of
documents received by the Ministry within the Liquid Waste Management Plan process, and guidance on
how to proceed with the EIS.
This EIS was completed by Rob Hoogendoorn, M.Sc., R.P.Bio., Robert Larson, M.Sc., P.H. with assistance
from Chris Hegele, B.Sc., B.I.T, and Dan Austin, MGIS, GISP (Associated Engineering). Local bathymetry
and existing outfall information was provided by Paul Steffens, P.Eng. (Atek Hydrographic Surveys Ltd.).
Dr. Donald O. Hodgins, Ph.D., P.Eng., AFCA (Seaconsult) provided guidance and technical review for the
dilution and dispersion modelling sections, and senior review was by Dr. Hugh Hamilton, Ph.D., P.Ag.

City of Powell River
iv \\s-bur-fs-01\projects\20172098\00_pwll_rvr_wwtp\environmental_sciences\04.02_assessment_reports\rpt_pow_eis_20180403_rl.docx
Table of Contents
SECTION PAGE NO.
Executive Summary i
Acknowledgements iii
Table of Contents iv
List of Abbreviations vi
1 Introduction 1-1
1.1 Project Background and Rationale for a New Wastewater Treatment Plant 1-1
1.2 Objectives and Scope of this Environmental Impact Study 1-1
1.3 Outfall Location and Study Area 1-2
2 Influent and Effluent WWTP Characteristics 2-1
2.1 Effluent Flow Rates – Recent and Projected Future 2-1
2.2 Influent and Effluent Quality 2-2
2.3 Projected Treated Effluent Quality 2-3
2.4 Environmental Control Measures 2-4
3 Other Regional Study Area Discharges 3-1
3.1 Tla’amin WWTP 3-1
3.2 Catalyst Mill 3-2
4 Receiving Environment Characteristics 4-1
4.1 Strait of Georgia and Malaspina Strait 4-1
4.2 Overview of Normal Wind Direction, Tides, and Currents 4-1
4.3 Temperature, Salinity, and Dissolved Oxygen 4-6
4.4 Climate Change 4-7
4.5 Biological Environment 4-8
4.6 Receiving Water Uses 4-16
5 Considerations for WWTP and Outfall Locations Selection 5-1
5.1 Plant Location Rationale 5-1
5.2 Outfall Terminus Location Constraints 5-1
6 Environmental Assessment 6-1
6.1 Available Data 6-1
6.2 Modelling Objective and Outfall Configuration 6-10
6.3 Dilution Analysis 6-11

Table of Contents
v
6.4 Predicted Water Quality at Edge of IDZ 6-15
6.5 Effects Assessment 6-17
7 Recommended Environmental Monitoring 7-1
7.1 Pre-Discharge Environmental Monitoring Program 7-1
7.2 Operational Monitoring 7-6
8 Conclusion 8-1
References
Certification Page
Appendix A - Table of Concordance

City of Powell River
vi \\s-bur-fs-01\projects\20172098\00_pwll_rvr_wwtp\environmental_sciences\04.02_assessment_reports\rpt_pow_eis_20180403_rl.docx
List of Abbreviations
Abbreviation Description
AAF Average Annual Flow
ADWF Average Dry Weather Flow
AOX Adsorbable organic halides
AWWF Average Wet Weather Flow
BC British Columbia
BCMCA BC Marine Conservation Analysis
BOD Biological oxygen demand
Catalyst mill Catalyst Paper Corporation paper mill
CBOD Carbonaceous biological oxygen demand
CCME Canadian Council of Ministers of the Environment
CDC Conservation Data Centre
CTD Conductivity, temperature, and depth
CWWF Clean Water and Wastewater Fund
DFO Department of Fisheries and Oceans Canada
DO Dissolved oxygen
EC Environment Canada
EEM Environmental Effects Monitoring
EIS Environmental Impact Study
GHG Greenhouse gas
HHW High high water
IDZ Initial dilution zone
IOS Institute of Ocean Sciences
LLW Low low water
LSA Local Study Area
LWMP Liquid Waste Management Plan
MELP Ministry of Environment, Lands and Parks

List of Abbreviations
vii
Abbreviation Description
MoE Ministry of Environment
MWR Municipal Wastewater Regulation
N/A Not applicable
POD Point of diversion
PPER Pulp and Paper Effluent Regulations
PWWF Peak Wet Weather Flow
RSA Regional study area
TSS Total suspended solids
USEPA United States Environmental Protection Agency
WSER Wastewater Systems Effluent Regulation
WWTP Waste water treatment plant
Units
Unit Description
% Percent
° Degrees
°C Degrees Celsius
CFU/100 mL Colony forming units per 100 mL
cm Centimetre
d Day
hr Hour
kg Kilograms
kg/ADt Kilograms per air dry tonne of pulp
km Kilometres
L Litre
m Metre
m3/day Metre cubed per day
m3/s Cubic metre per second
mg/L Milligrams per litre
mL Millilitre

City of Powell River
viii \\s-bur-fs-01\projects\20172098\00_pwll_rvr_wwtp\environmental_sciences\04.02_assessment_reports\rpt_pow_eis_20180403_rl.docx
Unit Description
MS Megalitres per second
MD Megalitres per day
MPN/100 mL Most probable number (of culturable bacteria) per 100 mL
MY Megalitres per year
ppb Parts per billion
pH Acidity units
ppt Parts per trillion

REPORT
1-1
1 Introduction
1.1 PROJECT BACKGROUND AND RATIONALE FOR A NEW WASTEWATER TREATMENT
PLANT
In 1998, the City of Powell River initiated a Liquid Waste Management Plan (LWMP) to guide the future
management of municipal wastewater, stormwater, and other liquid wastes. The Stage 3 report of the
LWMP (Opus DaytonKnight 2015) was conditionally approved by the Ministry of Environment (MoE) via a
letter dated June 3, 2016. The purpose of the LWMP process is to address municipal sewage, sewer
overflows, stormwater runoff, septic tank contents, sewage treatment plant sludge (biosolids), and other
municipal wastes detrimental to the environment. The City currently discharges wastewater effluent from
the Wildwood, Townsite, and Westview wastewater treatment plants (WWTPs) through three separate
outfalls into Malaspina Strait. An additional nearby outfall discharges treated effluent from the Tla’amin
Nation.
One of the key outcomes of the Stage 3 LWMP was the decision to construct and operate a new
wastewater treatment Plant (WWTP) that consolidates the flows from the three existing plants into a single
plant (the “Consolidated WWTP”) that is designed and operated to meet all provincial and federal treatment
requirements. The City confirmed with the MoE on September 29, 2017 that one outfall will be designed to
discharge treated effluent from the Wildwood, Townsite, and Westview plants, and that all the existing
outfalls will be decommissioned.
In a letter dated October 12, 2017, the MoE consented to include the Tla’amin Nation’s servicing catchment
to the existing Townsite plant (MoE 2017a). The authorization will effectively allow the Tla’amin Nation’s
wastewater effluent to eventually be connected to the Consolidated WWTP. This future connection is
expected to further increase the economic, social, and environmental benefits of the Consolidated WWTP
project.
Regulatory authorization for the new Consolidated WWTP is to be obtained through Registration under the
BC Municipal Wastewater Regulation (MWR) (87/2012). One of the MWR requirements for registration is
completion of an Environmental Impact Study (EIS) to guide the design of the treatment system and to
confirm the treatment standards for the liquid discharge.
This document builds on the Stage 3 LWMP and presents the EIS results. It has been prepared by
Associated Engineering (AE) on behalf of the City for review by the Ministry of Environment (MoE),
following the guidelines published by the BC Ministry of Environment, Lands and Parks (BC MELP 2000) as
a companion document to the MWR.
1.2 OBJECTIVES AND SCOPE OF THIS ENVIRONMENTAL IMPACT STUDY
Subsequent to the identification of a suitable discharge location, and in accordance with the MWR, an EIS
is necessary to assess the extent to which the planned discharge of treated municipal wastewater could
potentially affect human health and the receiving environment. The goal of the EIS is to evaluate the

City of Powell River
1-2 \\s-bur-fs-01\projects\20172098\00_pwll_rvr_wwtp\environmental_sciences\04.02_assessment_reports\rpt_pow_eis_20180403_rl.docx
potential environmental effects of the discharge from the Consolidated WWTP at the selected discharge
location to inform the engineering design and future operation of the system. The new treatment system is
being designed to meet all provincial MWR and federal Wastewater Systems Effluent Regulation (WSER)
(SOR/2012-139) standards, and one of the key EIS goals is to determine whether more stringent treatment
standards are warranted to protect the receiving environment (e.g. if the receiving environment is
particularly sensitive or unique).
The scope of the EIS was discussed with Mr. Trevor Hamelin of MoE at the Pre-Registration meeting that
was held in the Ministry’s office on January 23, 2018. Given the availability of physical and biological data
for the receiving environment, and the preliminary dilution modelling results, AE recommended that the EIS
be completed and presented in a single stage report (this document) 1, which addresses all components
outlined in MoE’s guidelines for facilities discharging more than 10,000 m3/day to open marine waters (BC
MELP 2000). A table of concordance is included to facilitate the review of this document and to compare
the contents relative to the guidelines (Appendix 1). Pre-discharge monitoring will begin before the plant
becomes operational (Section 7.1).
1.3 OUTFALL LOCATION AND STUDY AREA
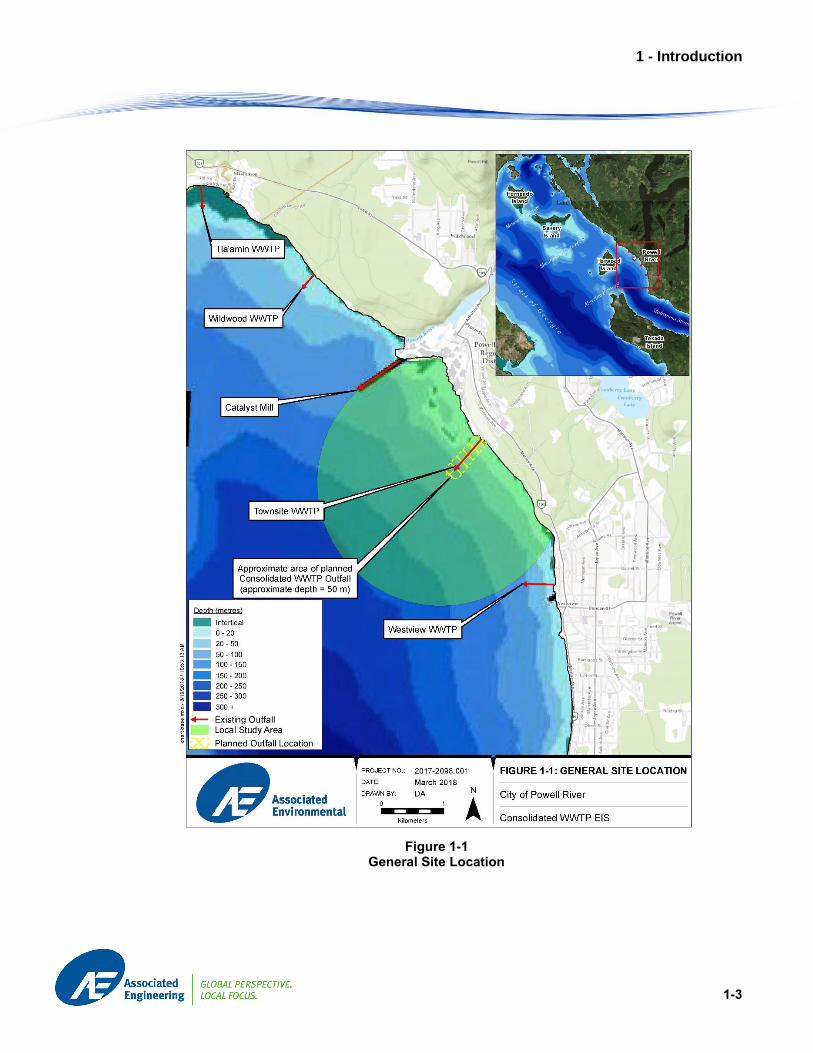
The Consolidated WWTP is planned to be located near the site of the existing Townsite plant. The outfall
will be located near the WWTP and run through the foreshore and intertidal zones before terminating in
marine waters at a depth of approximately 50 m below the average water level (Figure 1-1). The general
location for the outfall terminus is discussed in Section 5.2 in the context of biological and physical
constraints. Details concerning diffuser design and operation will be determined based on the dilution
modelling presented in this report (Section 6).
For this EIS, potential effects are considered at two spatial scales:
• The Local Study Area (LSA) encompasses the zone of influence of the project, including areas that
may be directly affected by the Project. The LSA corresponds to the marine area within a radius of
2 km surrounding the planned outfall location. The LSA includes the Townsite WWTP outfall; the
Catalyst Paper Corporation paper mill (Catalyst mill) outfall is at the LSA boundary.
• The Regional Study Area (RSA) includes the LSA and the marine area that extends approximately
5–10 km north and south of the planned outfall location to consider potential impacts from nearby
outfalls, as well as indirect and cumulative impacts from the project. The smaller extent of the RSA
approximately corresponds to the map extent shown in (Figure 1-1); the larger extent of the RSA
approximately corresponds to the extents of the maps shown in Section 4. The RSA includes the
existing Tla’amin, Wildwood, Townsite and Westview WWTP outfalls, as well the Catalyst mill
outfall.
1 The EIS guidelines suggest that the study be undertaken in 2 Stages (Section 5.2) if site-specific data collection is needed to support
the assessment. This EIS is presented as a single report because site specific bathymetric data were compiled in 2017 to support outfall design; and local modelling data are available from the Catalyst mill.
1 - Introduction
1-3
Figure 1-1 General Site Location


REPORT
2-1
2 Influent and Effluent WWTP Characteristics
The flows for the three existing WWTP plants to be consolidated in the short-term (i.e. Westview, Townsite,
and Wildwood) are considered in this section. While discussions are underway to connect the Tla’amin
WWTP effluent to the Consolidated WWTP, the timeline is currently uncertain. Therefore, the influent and
effluent characteristics of the Tla’amin WWTP are considered in Section 3 in the context of other regional
discharges.
2.1 EFFLUENT FLOW RATES – RECENT AND PROJECTED FUTURE
In the Powell River area, maximum daily flows occur during the winter when precipitation is highest, and the
wastewater collection system is susceptible to increased inflow and infiltration. Based on information from
the Stage 3 LWMP, Table 2-1 summarizes the effluent flow rates for the existing WWTPs that will be
consolidated with the planned outfall.
The typical effluent flows, based on daily flows rates, are defined as follows:
• AAF: Average annual flow
• ADWF: Average dry weather flow
• AWWF: Average wet weather flow
• PWWF: Peak wet weather flow.
Table 2-1 Flows at Westview, Townsite, and Wildwood WWTPs, 2000 – 2012
AAF
(m3/d)
ADWF
(m3/d)
AWWF
(m3/d)
PWWF
(m3/d)
Westview 5,501 4,450 8,090 12,944
Townsite 2,082 1,616 3,016 4,703
Wildwood 777 429 1,276 No data
Total 8,361 6,494 12,382 N/A1
Note: 1N/A = not applicable
Based on the draft Consolidated WWTP Design Basis2, system flows are projected to increase steadily
from 2020 to 2070 (Table 2-2). The projections include provision for future flows from the Teeshoshsum
catchment (Tla’amin First Nation). The two times ADWF projections are included to be consistent with the
effluent quality requirements listed in Table 11 of the of the MWR. Effluent flow rates for the two times
ADWF are approximately 10% larger than the AWWF.
2 Technical Memorandum completed by Associated Engineering, September 2017.

City of Powell River
2-2 \\s-bur-fs-01\projects\20172098\00_pwll_rvr_wwtp\environmental_sciences\04.02_assessment_reports\rpt_pow_eis_20180403_rl.docx
Table 2-2 Projected Flow for Consolidated WWTP
Year AAF
(m3/d)
ADWF
(m3/d)
2 × ADWF
(m3/d)
AWWF
(m3/d)
PWWF
(m3/d)
2020 8,190 6,905 13,810 12,824 32,467
2030 8,290 6,989 13,978 12,980 32,625
2040 8,391 7,074 14,148 13,138 32,786
2050 8,493 7,160 14,320 13,298 32,948
2060 8,596 7,247 14,494 13,459 33,112
2070 8,701 7,335 14,670 13,623 33,278
2.2 INFLUENT AND EFFLUENT QUALITY
Based on the Stage 3 LWMP, current average annual total suspended solids (TSS) loads range from
90 kg/d at the Wildwood WWTP to 680 kg/d at the Westview WWTP (Table 2-3). Average annual biological
oxygen demand (BOD) loads range from 120 kg/d at the Wildwood WWTP to 940 kg/day at the Westview
WWTP. The influent loads reported in Table 2-3 are a reasonable approximation of the expected loads to
the Consolidated WWTP at start-up. The influent loads would increase over time in proportion to the
change in flows shown in Table 2-2.
Table 2-3 Average Influent TSS and BOD Loads at Westview, Townsite and Wildwood, 2000 – 2012
TSS (kg/d) BOD (kg/d)
Average Annual Maximum Month Average Annual Maximum Month
Westview 680 1,480 940 1,570
Townsite 220 410 260 480
Wildwood 90 170 120 200
Total 990 2060 1320 2250
The number of exceedances of MWR treatment standards for total suspended solids (TSS) and
carbonaceous BOD (cBOD) for the two most recent years was calculated based on effluent water quality
data for the three existing outfalls (F. D’Angio, personal communication, 2017). The exceedances were
determined based on the standards prescribed by flows that are greater than the ADWF and greater than
two times the ADWF, as stipulated in MWR Table 11. In addition to the exceedances, and as identified in
the Stage 3 LWMP, MoE has expressed concerns related to effluent bypasses at the Westview and
Townsite WWTPs.

2 - Influent and Effluent WWTP Characteristics
2-3
Table 2-4 MWR Exceedances for TSS and cBOD at Existing Outfalls, 2016-2017
TSS (number) cBOD (number)
Westview 26 20
Townsite 10 16
Wildwood 9 1
Total 45 37
2.3 PROJECTED TREATED EFFLUENT QUALITY
Each of the existing plants currently provides secondary level of treatment, and additional information on
the existing facilities is provided in the Stage 3 LWMP. The Consolidated WWTP will be a new “greenfield”
development to replace the existing Wildwood, Townsite, and Westview WWTPs. It will have the following
key design aspects:
• Secondary-level treatment through the entirety of predicted wet weather flows to the plant.
• Incorporates provisions to upgrade to tertiary level treatment in the future.
• Effluent will meet all current MWR and WSER treatment standards (summarized in Table 2-5).
Table 2-5 WSER and MWR Treatment Standards
Effluent Quality Parameter WSER Part 1 Section 6 (1)
(mg/L)
MWR Table 11 Criteria and Section 95
(mg/L, except pH)
Carbonaceous BOD ≤ 25 < 2x ADWF ≤ 45
>= 2x ADWF (interim) ≤ 130
TSS ≤ 25 < 2x ADWF ≤ 45
>= 2x ADWF (interim) ≤ 130
pH N/A < 2x ADWF 6 – 9 pH units
Total phosphorus (P) N/A < 2x ADWF N/A
Ortho-phosphate N/A < 2x ADWF N/A
Total residual chlorine ≤ 0.02 N/A
Un-ionized ammonia1 ≤ 1.25 N/A
Notes: N/A = not applicable 1 Expressed as nitrogen (N), at 15 °C +/- 1 °C

City of Powell River
2-4 \\s-bur-fs-01\projects\20172098\00_pwll_rvr_wwtp\environmental_sciences\04.02_assessment_reports\rpt_pow_eis_20180403_rl.docx
In addition to the MWR Table 11 criteria, Section 95 of the MWR specifies criteria for ammonia and fecal
coliforms. The maximum allowable concentration of ammonia is back calculated from the edge of the IDZ,
considering i) ambient temperature and pH of the receiving water, and ii) water quality guidelines for
ammonia. Fecal coliform counts must meet applicable requirements at the edge of the IDZ, depending on if
the discharge is to shellfish bearing waters or recreational use waters.
2.4 ENVIRONMENTAL CONTROL MEASURES
2.4.1 Source Control
Source controls are implemented to reduce the discharge of wastes to the sanitary (and associated storm)
sewer systems. Deleterious discharges may degrade the receiving environment or decrease the efficiency
of treatment facilities. Source control components stated in the Stage 3 LWMP include the development of
a sanitary sewer source control bylaw (no. 2054, 2005), development of a monitoring and enforcement
program for the bylaw, and an education program aimed at public and private sector sewage dischargers.
The bylaw regulates the operation and use of the sanitary sewer and storm drain systems. The Stage 2
LWMP (Dayton and Knight 2005) contains a summary of the bylaw as well as the other source controls.
2.4.2 Climate Change Mitigation and Sustainability
To reduce greenhouse gas (GHG) emissions, the City included energy consumption (pumping costs) as a
site-selection criterion for the Consolidated WWTP. In designing the treatment facilities, the City also
committed to consider the use of treatment processes with minimal energy demand (Stage 3 LWMP).
The City will consider resource recovery, which can include reclaimed water, recovery of heat from the
wastewater stream, production of biogas for generation of combined heat and power, recovery of nutrients
(e.g. struvite pellets for use as fertilizer), and beneficial use of solid residuals as a natural fertilizer and
soil conditioner (Stage 3 LWMP).
2.4.3 Other Measures
Other environmental control measures referenced in the Stage 3 LWMP include the following:
• General wastewater volume reduction at source.
• Stormwater management to reduce the volume that is discharged to surface waters and improve
stormwater quality.
• Non-point source pollution control (e.g. study the feasibility of eliminating all septic tank and ground
disposal systems, improve handling of trucked waste, and add a boat holding tank pump-out station
at Westview Marina).
• Infrastructure management and spill reporting.

REPORT
3-1
3 Other Regional Study Area Discharges
Existing discharges within the RSA were identified from available reports, and the provincial authorizations
database, and were mapped3. Apart from the existing effluent discharges that will be consolidated within
the new WWTP, the Tla’amin WWTP and the Catalyst mill are the other two sources of discharge to
receiving waters within the RSA (Figure 1-1).
3.1 TLA’AMIN WWTP
In 2016, the Tla’amin WWTP served a population of about 670 persons and the effluent average annual
flow (AAF) was 306 m3/d. The system includes collection lines, septic tank, rotating biological contactor
(RBC), and chlorination/dichlorination and the outfall (J. Guo, personal communication, 2017).
Effluent from the treatment system has been sampled and tested monthly. Table 3-1 and
Table 3-2 summarize the influent and effluent quality, respectively, from samples collected during the period
from June 1988 to February 2017 (J. Guo, personal communication 2017). Figure 3-1 shows an example
results chart for average carbonaceous biological oxygen demand (cBOD) and total suspended solids
(TSS) for the period 2013 to 2016. Effluent concentrations for cBOD and TSS remained below the WSER
limit for most quarters, except for TSS in the second quarter of 2014.
Table 3-1 Tla’amin Wastewater Treatment Plant Influent Quality Summary, 1988-2017
pH
(field)
Ammonia
(mg/L-N)
CBOD5
(mg/L)
TSS
(mg/L)
Number of samples (n) 58 33 123 126
Average 6.7 15.3 86 33
Maximum 8.6 25.9 188 132
Table 3-2 Tla’amin Wastewater Treatment Plant Effluent Quality Summary, 1988-2017
pH
(lab)
BOD
(mg/L)
cBOD
(mg/L)
TSS
(mg/L)
Ammonia
(mg/L-N)
NH3 Calculated
(mg/L-N)
Fecal Coliform
(CFU/100 mL)
Number of
samples (n)
102 81 65 131 98 104 104
Average 6.7 16 9 11 6.6 11 73,904
Maximum 7.8 61 23 45 26.4 0.016 2,400,000
3 MoE DataMart website: https://www2.gov.bc.ca/gov/content/environment/waste-management/waste-discharge-authorization/search-
status-and-documents

City of Powell River
3-2 \\s-bur-fs-01\projects\20172098\00_pwll_rvr_wwtp\environmental_sciences\04.02_assessment_reports\rpt_pow_eis_20180403_rl.docx
Figure 3-1 Tla’amin WSER Results Summary for cBOD5 and TSS, 2013-2016 (from Guo pers. comm. 2017)
3.2 CATALYST MILL
Catalyst Paper Corporation’s Powell River Division operates a paper mill located at the north end of
Malaspina Strait, and on the south bank of Powell River at its mouth (Figure 1-1). The Catalyst mill
produces newsprint and uncoated mechanical specialty papers4 and currently employs 383 people. The mill
has been in operation since 1912 and since that time its effluent has been discharged to the marine
environment. Environmental monitoring programs were initiated in the 1970s, following growing
environmental awareness about the release of chlorinated organic contaminants due to semi-bleached
Kraft production, which started in 1967.
4 See http://www.catalystpaper.com/about/our-facilities/powell-river for information on the Catalyst mill.
3 - Other Regional Study Area Discharges
3-3
Since 1967, significant operational improvements were made to reduce effluent flows and contaminant
concentrations. Key milestones included the installation of a primary clarifier (1980), eliminating elemental
chlorine from the process (1991), installing secondary treatment (1992), and discontinuing the Kraft process
(2002). The operational history and a summary of the plume delineation of the mill is included in the
Environmental Effects Monitoring (EEM) pre-design report (Hatfield 1994).
In 1992, the federal government implemented the Pulp and Paper Effluent Regulations (PPER) under the
Fisheries Act that mandated pulp mills to monitor the chemistry and toxicity of mill effluent and assess its
potential effects on the receiving environment through a Pulp and Paper EEM program. EEM programs are
typically conducted in three-year cycles to directly study the potential effects of effluent on fish populations,
fish tissue and the benthic invertebrate community.
Four environmental effects monitoring cycles were completed for the mill from 1992, when the PPER were
originally released, to 2007. Since 2007, the following cycles have been completed by Hatfield Consultants
for Catalyst:
• Cycle Five: 2007 to 2010
• Cycle Six: 2010 to 2012
• Cycle Seven: 2013 to 2016
The EEM studies have linked operational changes to improvements in marine environment conditions. This
is demonstrated for example through reduced concentrations of total suspended solids (TSS), biological
oxygen demand (BOD), and adsorbable organic halides (AOX) (Figure 3-2).

City of Powell River
3-4 \\s-bur-fs-01\projects\20172098\00_pwll_rvr_wwtp\environmental_sciences\04.02_assessment_reports\rpt_pow_eis_20180403_rl.docx
Figure 3-2 Annual Average Mill Effluent Quality, 1973 to 2015 (presented in Hatfield 2016)

3 - Other Regional Study Area Discharges
3-5
The Cycle Seven EEM report (Hatfield 2016) summarizes a set of process effluent quality variables for the
period 2003 to 2015 (Table 3-3) and the environmental monitoring that has been conducted since 1993.
Among other analyses, a benthic invertebrate survey was conducted in March 2015, including supporting
water and sediment quality sampling. Figure 3-3 shows the location of the monitoring points, which
surround the planned Consolidated WWTP outfall location.
The EEM data and reports have been submitted to both the provincial and federal governments. The
Hatfield (2016) monitoring data are useful to characterize the general conditions in the receiving
environment for this EIS.
Table 3-3 Paper Mill Production and Selected Effluent Quality Variables
Year Production
(Air dry [AD] t/d)
Discharge
(m3/d)
TSS
(t/d)
BOD
(t/d)
2003 1,296 112,670 0.9 0.3
2004 1,235 116,600 2.1 0.70
2005 1,215 113,440 2.4 1.0
2006 1,305 113,134 2.5 0.78
2007 1,328 99,758 2.2 0.86
2008 1,330 91,388 1.5 0.55
2009 1,322 88,688 1.5 0.65
2010 1,268 94,121 1.7 0.66
2011 1,453 90,741 1.54 0.57
2012 1,248 157,2541 1.24 0.54
2013 1,215 144,7761 1.9 0.96
2014 1,150 163,6421 1.8 0.95
2015 931 149,8101 1.7 0.91
Mean 1,254 118,156 1.8 0.7
Note: 1Includes discharge from excess cooling water from the G12 Power Increase Project.

City of Powell River
3-6 \\s-bur-fs-01\projects\20172098\00_pwll_rvr_wwtp\environmental_sciences\04.02_assessment_reports\rpt_pow_eis_20180403_rl.docx
Figure 3-3 Key Monitoring Locations

REPORT
4-1
4 Receiving Environment Characteristics
4.1 STRAIT OF GEORGIA AND MALASPINA STRAIT
The Strait of Georgia is formed by the northwest-southeast trending Georgia Depression, which runs from
the northwest near Quadra Island and Campbell River down to the southeast near Orcas Island and
Bellingham, USA. Approximately 70% of the province’s population is located on the periphery of the Strait
of Georgia, making it one of the most important marine regions in British Columbia (Georgia Strait Alliance
2017). The strait is a waterway for commercial and recreational activity and supports an important salmon
fishery. The strait also receives industrial and domestic wastes from rural areas and large centres such as
Metro Vancouver. The area’s shores and natural resources thus require protection. The general
oceanography of the Strait of Georgia has been studied and summarized by Thomson (1981, 1994).
The Malaspina Strait separates Texada Island from the upper Sunshine Coast-Malaspina Peninsula area.
The following sections 4.2 to 4.6 draw on information from the Hatfield (1994) report, including information
from earlier studies that are relevant to the RSA and Malaspina Strait.
4.2 OVERVIEW OF NORMAL WIND DIRECTION, TIDES, AND CURRENTS
4.2.1 Wind
Wind patterns can influence effluent dispersion at the ocean surface. Based on Thomson (1981), winds in
the Strait of Georgia generally blow toward the southeast (i.e. approximately 135 degrees true) in summer
and toward the northwest (i.e. approximately 300 degrees true) in the winter (Figure 4-1). Wind data has
been collected at the Catalyst mill by the operators since 2006 (P. Lum, personal communication, 2017),
and at the Powell River airport by Environment Canada since 1994 (EC 2017). The mean monthly wind
speeds and directions, calculated from the mean hourly wind speeds and directions and covering the period
from October 2016 to October 2017, for each station are shown in
Figure 4-2.
The general seasonal wind directions estimated by Thomson (1981) were compared with the mean monthly
wind directions for the June to September 2017 and October to March 2017 periods at both stations.
Compared to the general seasonal wind directions estimated by Thomson (1981), the wind directions at the
Catalyst mill for the summer period were similar and for the winter period they were opposite (Figure 4-2).
At the Powell River airport, the seasonal wind directions were relatively consistent and did not reflect the
seasonal differences estimated by Thomson (1981). The mean monthly maximum wind speeds were
16.9 km/hr and 13.7 km/hr and occurred in October and November at the mill and airport, respectively.
The distance from the mill wind sensor to the closest shoreline is approximately 350 m, while the airport
wind sensor is approximately 2 km from the shore. Based on the wind data analysed, the data from the
Catalyst mill are most appropriate to assess wind effects on the LSA due to the proximity and exposure of
the wind sensor.

City of Powell River
4-2 \\s-bur-fs-01\projects\20172098\00_pwll_rvr_wwtp\environmental_sciences\04.02_assessment_reports\rpt_pow_eis_20180403_rl.docx
Figure 4-1 Prevailing seasonal wind directions in the Strait of Georgia (Thomson 1981)

4 - Receiving Environment Characteristics
4-3
Figure 4-2 Monthly Mean Wind Speed and Direction at Catalyst mill and Powell River Airport;
October 2016 to September 2017 (Lum, pers. comm 2017; Thompson 1981)
4.2.2 Tides and Currents
In the Strait of Georgia, there is a general counter-clockwise surface flow that moves northwest up the
mainland side and southeast along Vancouver Island (Hatfield 1994). Local currents are driven by a
combination of winds, tidal circulation, and seasonal freshwater movement into the region. Relative to the
surface winds at the mill site, Hodgins (1989) and Hodgins and Stronach (1991) observed a strong counter-
current moving in an opposite direction, but below the thermocline (deeper cold water below the warmer
surface water). This counter-current was observed to entrain and transport the mill effluent (Hodgins 1989,
Hodgins and Stronach 1991).
The sea state in the Malaspina Strait is relatively calm as the area is sheltered by Texada and Harwood
Islands; and larger wind waves that are formed by the Strait of Georgia have minimal influence on surface
dispersion. Tides at Powell River are mainly diurnal, with a mean tide water level range from high high to
low low of 3.5 m (Table 4-1).

City of Powell River
4-4 \\s-bur-fs-01\projects\20172098\00_pwll_rvr_wwtp\environmental_sciences\04.02_assessment_reports\rpt_pow_eis_20180403_rl.docx
Table 4-1 Tide Elevations and Mean Water Level at Powel River (CHS 1993)
Tide Cycle Water Level Tide Elevation (m) above chart datum
Large Tides High high water (HHW) 5.4
Low low water (LLW) 0.1
Mean Tides High high water (HHW) 4.7
Low low water (LLW) 1.2
Mean Water Level 3.3
Flood tides move northwest up the strait and ebb tides flow southeast (Thomson 1994). Hodgins (1989)
created schematics showing these tides using results from dye dispersion studies. These tide schematics
are valuable as they provide a sense of the potential effluent dispersion patterns within the area of interest
for this EIS (Figure 4-3).
Current velocities during the flood and ebb tides can be assumed to be of similar magnitude, though the
flow directions are opposite. Between the flood and ebb tides, slack tide conditions occur. During these
conditions, current velocities are comparatively slow. Section 6.1 contains more details on tide current
profiles within the study area.

4 - Receiving Environment Characteristics
4-5
Figure 4-3 Tidal Pattern Information and Wind Sensor Locations

City of Powell River
4-6 \\s-bur-fs-01\projects\20172098\00_pwll_rvr_wwtp\environmental_sciences\04.02_assessment_reports\rpt_pow_eis_20180403_rl.docx
4.3 TEMPERATURE, SALINITY, AND DISSOLVED OXYGEN
Marine water temperatures recorded at the surface in the area range from a high of 7°C in winter to near
18°C in late summer. Water temperatures are relatively constant between 7°C and 10°C at depths below
approximately 45 m throughout the year. A thermocline develops in summer, between 25 and 45 m in
depth, which affects the vertical dispersal and mixing of effluent in the area (Hatfield 1994). The depth and
strength of this thermocline progressively breaks down as winter approaches and surface waters cool.
In the area of the mill outfall, the top 1-2 m of the water column in summer normally contains a thin layer of
salt water that is diluted (brackish water) from freshwater inputs from inflowing coastal streams, primarily
from the Fraser River. Below that lens and throughout the rest of the year, salinity remains relatively
constant both laterally and vertically, increasing from approximately 27 ppt at 5 m to about 30 ppt at depths
below 50 m (Hatfield 1994). Section 6 contains a more detailed analysis of temperature and salinity profiles
within the study area.
Near the area of the mill, dissolved oxygen (DO) varies seasonally in surface waters due to uptake by
phytoplankton (Hatfield 1994). In the late spring and early summer, dissolved oxygen levels are between
10.5 mg/L and 12.0 mg/L. During this time, photosynthesis from phytoplankton produces oxygen, increasing
the DO concentrations. The processes reverse during the late fall as phytoplankton become less active;
and DO concentrations near the surface decrease to between 8.5 mg/L and 10.0 mg/L. Dissolved oxygen
levels decrease with depth in all seasons, to between approximately 4 mg/L and 6 mg/L at the bottom.
Dissolved oxygen data collected by the Institute for Ocean Sciences (IOS) during the summer and fall were
obtained for three locations near the planned outfall (Figure 3-3) (R. Hourston, personal communication
2017). For the July to October time period, the data show slightly lower DO compared to that described
above for the late fall at the mill. The DO ranged from 6.8 to 8.1 mg/L at the surface and it ranged from 2.8
to 4.1 mg/L at 60 m depth (Figure 4-4).

4 - Receiving Environment Characteristics
4-7
Figure 4-4 Dissolved Oxygen Profiles for Summer and Fall for Locations near the Planned Outfall
4.4 CLIMATE CHANGE
The influences of climate change on the Strait of Georgia are projected to include increasing sea-level,
changing ocean circulation patterns, and changing marine water chemistry. Projected sea-level rise for the
year 2100 for the median value of the high-emissions scenario for Campbell River is 20 to 30 cm (Lemmen
et al. 2016). (Note: Campbell River is the closest location to Powell River where such projections have been
made. Changes in sea level at Powell River are expected to be similar).
For the Pacific Coast of Canada, trends and projections show that the ocean is likely becoming warmer,
fresher, and more stratified (Christian and Foreman 2013). However, the magnitude and timing of changes
on the multiple factors influencing stratification are not known well enough to determine how this will impact
effluent dilution and trapping compared to current conditions.
Circulation patterns could be affected by changing the amount of fresh water that flows into the ocean. As
more precipitation falls as rain (rather than as snow), the volume of fresh water flow of coastal rivers will
decrease, particularly in the spring and fall. Such long-term seasonal reductions have been observed in the
Fraser River, which has led to changing annual patterns of nearshore salinity in the Strait of Georgia.
Changes in ocean temperature and freshwater inputs could result in an increase in acidity and decrease in
dissolved oxygen. The chemical changes within the ocean waters is likely to affect coastal ecosystems in
the Strait of Georgia. However, the net effect of these changes is not well known (Lemmen et al. 2016).

City of Powell River
4-8 \\s-bur-fs-01\projects\20172098\00_pwll_rvr_wwtp\environmental_sciences\04.02_assessment_reports\rpt_pow_eis_20180403_rl.docx
4.5 BIOLOGICAL ENVIRONMENT
4.5.1 Marine Habitat Types
The planned outfall will traverse through intertidal areas extending out into the sub-tidal area, with the
diffuser located at a mean depth of approximately 50 m (see Section 5.2). A large breakwater extends out
from the shoreline near the planned pipe and outfall alignment (Figure 5-1). The shoreline and intertidal
habitat to the south of the large breakwater consist of mainly sand substrate mixed with gravel, and some
large boulders interspersed (Hatfield 1994). Driftwood is also present along the high tide line. A moderate
abundance of rockweed and barnacles are present on cobble and boulders in intertidal areas. North of the
breakwater, the shoreline and intertidal area consists of anthropogenic materials including rip rap, asphalt,
and pilings (Hatfield 1994). Sediment sampling in adjacent subtidal areas found substrates consisted of
mainly sand with small amounts of gravel and silt (Hatfield 1994 and 2016). Some small amounts of wood
waste have also been found in sediments throughout the area (Hatfield 1994).
Habitat classification and mapping is available for the marine areas surrounding the planned outfall, which
assigns habitat types based on a selection of biophysical characteristics such as slope, sediment type,
vegetation, and depth and tidal inundation. Shoreline habitat types are determined based on shoreline
morphology and substrate. Based on mapping in the Marine Atlas of Pacific Canada, shoreline habitat
types near the planned outfall location consist of primarily sand and gravel flats (BCMCA 2017) (Figure 4-
5). Benthic habitat types have been mapped based on landscape features (depressions, slopes, flats,
ridges), depth, and substrate types (hard, mud, sand, undefined). Benthic habitat types to be traversed by
the outfall pipe and diffuser include primarily muddy flat benthic habitats with some muddy sloped habitats
(BCMCA 2017) (Figure 4-5).

4 - Receiving Environment Characteristics
4-9
Figure 4-5 Shoreline and Benthic Habitat Classes

City of Powell River
4-10 \\s-bur-fs-01\projects\20172098\00_pwll_rvr_wwtp\environmental_sciences\04.02_assessment_reports\rpt_pow_eis_20180403_rl.docx
Video imagery recorded in along the substrate in subtidal areas near the planned pipe alignment and outfall
location using a submersible towable or dive video camera also showed soft substrates and some evidence
of wood waste.
4.5.2 Fish and Other Forms of Aquatic Life
Numerous finfish are present in Malaspina Strait near the City of Powell River including species that are
harvested and those that are not. Generally, larger finfish occurring in the area are highly mobile and
migratory through at least part of their life and are part of more widely ranging populations. Harvested finfish
including salmon, herring, and groundfish are the most economically important (Hatfield 1994 and 1996).
Salmon use the Malaspina Strait as a migratory corridor, both as juveniles entering the Pacific Ocean
through the Johnstone Strait and as adults returning during spawning migrations (Hatfield 1994 and 1996).
Herring are a schooling pelagic finfish that use primarily open water areas and use kelp beds and other
nearshore areas to spawn. Herring have been documented spawning in habitats on the mainland shore of
the Malaspina Strait (Figure 4-6) (BCMCA 2017), but these spawnings are small (Hay et al. 1989 in Hatfield
1994) and the cumulative number of historical spawning occurrences ranges from low to moderate in the
Powell River area (BCMCA 2017, DFO 2017a).
Groundfish are fish species that spend most of their time on or near the sea bottom and are divided into
four general groups with similar characteristics including roundfish, flatfish, rockfish and elasmobranchs
(Fargo et al. 2007). Groundfish species generally inhabit specific substrates and bottom habitats, which
vary depending on the life stage, with juveniles often occupying a different niche than the adults. For
example, English sole and other flatfishes inhabit estuaries and shallow waters (<50 m) as juveniles and
move further offshore into deeper waters as they grow and mature (Hatfield 1996). Typical commercially
harvested groundfish species found in the Malaspina Strait include Pacific hake and walleye pollock;
common species in the Powell River area include rockfish, lingcod, and ratfish (Hatfield 1994).
Finfish populations near Powell River also include numerous species that are not harvested commercially.
Some fish species commonly found in habitats near Powell River include sculpin, surfperch, gunnel, blenny
eels, stickleback, and ratfish (Hatfield 1994 and 1996).
Shellfish species occurring in Malaspina Strait include shrimp, prawn, sea urchin, oysters, intertidal clams,
and crab (Hatfield 1994). Mapping of clam beds based on local knowledge and commercial shellfish
locations in the Powell River area is provided in Figure 4-7 and 4-8 (BCMCA 2017).
The most common benthic invertebrates in the area consist of sedentary and errant polychaete worms,
Phoronids (horseshoe worms), the mollusk, Axinopsida serricata, and the crustacean Euphilomedes
producta (Hatfield 2016).

4 - Receiving Environment Characteristics
4-11
Figure 4-6 Sensitive Marine Habitat

City of Powell River
4-12 \\s-bur-fs-01\projects\20172098\00_pwll_rvr_wwtp\environmental_sciences\04.02_assessment_reports\rpt_pow_eis_20180403_rl.docx
Figure 4-7 Commercial Fisheries

4 - Receiving Environment Characteristics
4-13
Figure 4-8 Recreational Fisheries

City of Powell River
4-14 \\s-bur-fs-01\projects\20172098\00_pwll_rvr_wwtp\environmental_sciences\04.02_assessment_reports\rpt_pow_eis_20180403_rl.docx
Based on mapping available from Fisheries and Oceans Canada, 21 aquatic species at risk have been
identified as potentially present in the South West area, which includes an area within the Strait of Georgia
extending from approximately Desolation Sound to the north end of the Malaspina Strait (Table 4-2) (DFO
2017b). No occurrences of aquatic species at risk area were identified within either the LSA nor within a
larger 10 km area from the planned outfall, based on a search of the BC Conservation Data Centre
database (BC CDC 2017).
Table 4-2 Aquatic Species at Risk Found Within South West Mapped Area
Common Name* Population Scientific Name Taxon Species at Risk
Status
Bluntnose Sixgill Shark
None Hexanchus griseus Fishes Special Concern
Green Sturgeon None Acipenser medirostris Fishes Special Concern
Grey Whale Eastern North Pacific Eschrichtius robustus Mammals Special Concern
Harbour Porpoise Pacific Ocean Phocoena Mammals Special Concern
Humpback Whale North Pacific Megaptera
novaeangliae Mammals Threatened
Killer Whale Northeast Pacific
Northern Resident Orcinus orca Mammals Threatened
Killer Whale Northeast Pacific
Southern Resident Orcinus orca Mammals Endangered
Killer Whale Northeast Pacific
Transient Orcinus orca Mammals Threatened
Leatherback Sea Turtle Pacific Dermochelys coriacea Reptiles Endangered
Northern Abalone None Haliotis kamtschatkana Molluscs Endangered
Olympia Oyster None Ostrea lurida Molluscs Special Concern
Paxton Lake Benthic
Threespine Stickleback None
Gasterosteus
aculeatus Fishes Endangered
Paxton Lake Limnetic
Threespine Stickleback None
Gasterosteus
aculeatus Fishes Endangered
Rougheye Rockfish type I None Sebastes sp. Type I Fishes Special Concern
Rougheye Rockfish type II None Sebastes sp. Type II Fishes Special Concern
Steller Sea Lion None Eumetopias jubatus Mammals Special Concern
Vananda Creek Benthic
Threespine Stickleback None
Gasterosteus
aculeatus Fishes Endangered

4 - Receiving Environment Characteristics
4-15
Common Name* Population Scientific Name Taxon Species at Risk
Status
Vananda Creek Limnetic
Threespine Stickleback None
Gasterosteus
aculeatus Fishes Endangered
Western Brook Lamprey Morrison Creek Lampetra richardsoni Fishes Endangered
Yelloweye Rockfish Pacific Ocean Inside
Waters Sebastes ruberrimus Fishes Special Concern
Yelloweye Rockfish Pacific Ocean Outside
Waters Sebastes ruberrimus Fishes Special Concern
4.5.3 Vegetation near Outfall Site
The areas upland at the planned site of the outfall are heavily disturbed and mainly consist of weedy
species (i.e. Rubus armeniacus) with some young deciduous trees (i.e. Alnus rubra) that border a wide
gravel roadway. Vegetation within the intertidal zone consisted mainly of kelp (i.e. Fucus gardneri) on rock
surfaces. The potential effects of the construction and routine operation of the new Consolidated WWTP,
including any changes to terrestrial habitat, is addressed under separate cover in the Construction and
Operation EIS [MWR Section 19(1)] that is included with the registration application.
No occurrences of vegetation species at risk area were identified within the LSA of 2 km from the planned
outfall, based on a search of the BC Conservation Data Centre database (BC CDC 2017). Three at risk
ecological communities have been documented within the general Powell River area; Western Redcedar /
Common Snowberry, Grand Fir / Dull Oregon-grape, and Grand Fir / Three-leaved Foamflower (BC CDC
2017). (Note: The field assessment for the Construction and Operation EIS will determine the presence or
absence of these communities within the project footprint).
4.5.4 Birds
Rocky intertidal shores along the Malaspina Strait and near the planned outfall location provide important
feeding areas for a variety of waterfowl and shorebirds. Typical sea duck species found in these habitats in
the Strait of Georgia include harlequin ducks, surf scoter, black scoter, and Barrow’s goldeneye (Hatfield
1996). Shorebirds commonly encountered include oystercatchers, black turnstones, surfbirds, and rock
sandpipers (Hatfield 1996). Three species of sea ducks feed along sandy substrates, which are found near
the planned outfall, and include common golden eye, bufflehead, and white-winged scoter (Hatfield 1994).
The great blue heron was the only bird species at risk identified within the LSA of 2 km, and within a larger
10 km area from the planned outfall, based on a search of the BC Conservation Data Centre database (BC
CDC 2017).

City of Powell River
4-16 \\s-bur-fs-01\projects\20172098\00_pwll_rvr_wwtp\environmental_sciences\04.02_assessment_reports\rpt_pow_eis_20180403_rl.docx
4.6 RECEIVING WATER USES
4.6.1 Fisheries Resources
As described in Section 4.5.2, a wide variety of fish species have been documented in the Regional Study
Area. Commercial fisheries in Malaspina Strait near Powell River include salmon, groundfish, herring,
prawn, shrimp, and crab (BCMCA 2017; Figure 4-6 and 4-7).
Salmon fishing is an important commercial fishery in British Columbia. In 2015, a total of 6,500 tonnes of
salmon was harvested with approximate value of $18 million, including 2,600 tonnes in the South Coast
district with a value of $8.4 million (DFO 2017c). However, in the Malaspina strait, salmon fishing is
generally limited to recreational fishing, although some trolling occurs in some years (Hatfield 1994). Since
1996, there has been no commercial salmon harvest reported in the fishery management area of Powell
River (Area 15) (J. Davidson, personal communication 2017).
Groundfish, such as hake and pollock, are harvested by commercial trawl fisheries throughout the
Malaspina Strait. A commercial groundfish fishery is located south of Powell River between Texada Island
and the mainland shore (BCMCA 2017) (Figure 4-6). However, areas located north and south of the strait
receive much more focus by commercial fishing and the finfish fisheries in the strait and Powell River area
are relatively low compared to most other areas of the Strait of Georgia (Hatfield 1994). There was no
commercial groundfish harvest reported in 2016 in the fishery management area of Powell River (Area 15)
and previous landings from this area were sparse, with only a few landings from 1 or 2 vessels in any given
year (M. Surry, personal communication 2017).
A commercial herring roe fishery is located in the strait from near the north end of Texada Island to past the
north end of Harwood Island (BCMCA 2017) (Figure 4-6). However, herring spawning has been noted as
limited in the fishery management area of Powell River (Area 15) (Hatfield 1994, DFO 2017a), and there as
been no commercial herring catch since the herring season from July 1, 2010 to June 30, 2011 (K. Daniel,
personal communication 2017).
Compared to other areas in the Strait of Georgia, shellfish make a larger proportional contribution to the
fisheries in the Powell River area; especially the prawn and intertidal clam fisheries (Hatfield 1994). In Area
15, the largest shellfish catch was Manila clams at approximately 81 tonnes, followed by prawns at 54
tonnes, sea cucumber at 14 tonnes, pink shrimp at 13 tonnes, and sidestripe shrimp at 5 tonnes (L. Barton,
personal communication 2017),
Historically, a small commercial crab fishery took place in the Malaspina Strait along the shores of the City
of Powell River and a commercial shrimp fishery was in the strait between Harwood and Texada islands
(Hatfield 1994, BCMCA 2017) (Figure 4-7). However, currently much of the intertidal area along the
mainland shore, and the subtidal area between Harwood and Texada islands is closed to shellfish
harvesting due to sanitary contamination concerns (DFO 2017d). Prawn and shrimp fisheries are also
located further from Powell River on the west side of Harwood and Texada islands, and further north along
the mainland shore.

4 - Receiving Environment Characteristics
4-17
4.6.2 Traditional Uses
The planned Powell River consolidated wastewater treatment plant and outfall study area is located within
the traditional territory of Tla’amin First Nation which encompasses an area of 609,000 hectares including
marine areas5. The Tla’amin people use the whole territory to exercise their aboriginal rights and title
including the right to harvest fish and aquatic plants for food, social and ceremonial purposes.
4.6.3 Water Licences
A search of the BC database of existing water licences was completed for the area surrounding the planned
WWTP and outfall in the City of Powell River. Table 4-3 lists the licences and applications for licences
within 4 km of the planned WWTP and outfall. All of the points of diversion are for freshwater and will be
unaffected by the project.
Table 4-3 Current Water Licences and Recent Applications near the Project
File No. Licensee Purpose Quantity Units Status
0056929 Powell River Energy Inc. Stream Storage: Power 775032488.4 MY Current
0056929 City of Powell River Waterworks: Local
Provider
893,469 MY Current
0098646 City of Powell River Waterworks: Local
Provider
894,375 MY Current
0136254 City of Powell River Waterworks: Local
Provider
165,932 MY Current
0152095 McCune Robert & Marvel Irrigation: Private 617 MY Abandoned
0196058 Powell River Energy Inc. Current
0264374 Catalyst Paper Corporation Pulp Mill 1 MS Current
0264381 City of Powell River Land Improvement:
General
9 MD Current
0322358 Powell River Energy Inc. Power: General 21 MS Current
0323031 John P. Carlson, and M.
Elizabeth
Land Improvement:
General
2 MD Abandoned
0365614 City of Powell River Conservation:
Construct W
9 MD Current
0367722 Catalyst Paper Corporation Pulp Mill 0.5 MS Current
5 http://sliammonfirstnation.com/wp-content/uploads/2016/08/Tlaamin-Certainty-Factsheet.pdf

City of Powell River
4-18 \\s-bur-fs-01\projects\20172098\00_pwll_rvr_wwtp\environmental_sciences\04.02_assessment_reports\rpt_pow_eis_20180403_rl.docx
File No. Licensee Purpose Quantity Units Status
2000686 Donald F. McLeod Irrigation: Private 617 MY Abandoned
2001906 Glacial Water Shipping
Corp.
Refused
Application
2001987 Powell River Energy Inc. Power: General 82 MS Current
2002576 Catalyst Paper Corporation Pulp Mill 3 MD Current
2002576 Catalyst Paper Corporation Stream Storage: Non-
Power
26,667,838 MY Current
Source: BC Water Resource Atlas (Government of British Columbia 2017) Units: MS – megalitres/second; MD – megalitres/day; MY – megalitres/year
4.6.4 Shipping and Navigation
The Powell River marine terminal and ferry dock is located approximately 3 km south of the Consolidated
WWTP and outfall location. Two car and passenger ferries are currently operated by BC Ferries from
Powell River; one travelling to Courtney/Comox, and one travelling to Texada Island. Ferry traffic generally
represents the highest proportion of regular marine traffic in the Powell River terminal and area with other
types of intermittent marine traffic including pleasure crafts, tugs, fishing vessels, and other vessels6.
4.6.5 Recreational Uses
Recreational fishing in the Powell River area and in the Malaspina Strait is an important aspect to the
community (DFO 2011, Boogards et al. 2016). Mapping of recreational fishing locations in the Powell River
area based on local knowledge is provided in Figure 4-8 (BCMCA 2017). However, significant numbers of
finfish are only captured in limited areas (Hatfield 1994). The recreational harvest of salmon near Powell
River generally is lower than in other tidal waters of the province, and primarily includes chinook salmon
(Hatfield 1994, DFO 2017e), lingcod, and rockfish (DFO 2017e).
As stated in the Stage 3 LWMP, shellfish harvesting is not permitted in intertidal areas surrounding Powell
River, due to the potential for contamination from stormwater runoff and non-point source fecal
contamination related to suburban development.
Recreational activities in the strait and near Powell River also include boating, windsurfing and other water
sports. Since the early 1900s, First Beach has been a valued recreational area by local residents. The
beach is located within 100 m south of the existing Townsite WWTP, and is located adjacent to the
breakwater jetty (Figure 5-1). It is anticipated that, with population growth, water-based recreation will
increase.
6 http://www.marinetraffic.com/en/ais/details/ports/21699/Canada_port:POWELL%20RIVER

REPORT
5-1
5 Considerations for WWTP and Outfall Locations Selection
5.1 PLANT LOCATION RATIONALE
The consolidated WWTP plant is planned to be constructed on a site that is adjacent to the existing
Townsite WWTP, after a thorough review of options (Dayton and Knight 2007). The site was recommended
due to its central location relative to the receiving catchment areas of the existing WWTPs. This will reduce
the distance and associated energy consumption (pumping costs) of the required conveyance lines.
Additionally, the recommended location is industrially-zoned. There is a potential for a future market for
recovered resources, such as heat, water, biogas, and nutrients that could be generated from the
Consolidated WWTP and sold to nearby industries. In planning for this economic opportunity, the Stage 3
LWMP recommended that the design of the treatment plant facilities allow for expansion to include future
resource recovery facilities.
The initiative to consolidate the WWTPs was facilitated by the federal and provincial governments’ Clean
Water and Wastewater Fund (CWWF). The funding amount is $3.3 million, representing approximately 83%
of the total project costs.
The City undertook extensive public and stakeholder consultation during the development of the Stage 2
and Stage 3 LWMP, and a summary of the results is included in the Stage 3 LWMP. The City engaged a
facilitator in 2011 to assist in the development of a formal Public Consultation Plan, which included an
Information Phase (in the form of a public open house) and a Dialogue Phase (in the form of a discussion
session). The public and stakeholder consultation concluded in 2015 with the Accountability Phase, through
a town hall meeting to communicate Council’s decisions to the public.
As outlined in Section 4, the Malaspina Strait near the Powell River area provides significant social and
economic value to the local community, based on the traditional, economic, land, water, and recreational
uses. Many of those values are rooted in environmental quality.
5.2 OUTFALL TERMINUS LOCATION CONSTRAINTS
The outfall pipe will be buried in the intertidal areas, and will not be visible by residents recreating at First
Beach. Some distance from the low tide elevation, in the shallow sub-tidal zone, the pipe will emerge from
the substrate and be placed on the bottom of the strait on concrete anchors. The multi-port diffuser will sit
on a support structure about 1 m off the bottom of the seabed.
Based on the review of the receiving environment characteristics (Section 4), there are no significant
biological/environmental constraints in the LSA of the planned outfall site. However, there are three
practical physical/heritage constraints that will determine the final outfall terminus location. The constraints
include the existing outfall lines, the breakwater jetty, and the shipwreck of the Malahat schooner
(Figure 5-1). The Malahat foundered in Barkley Sound in 1944, and was subsequently towed to Powell
River.

City of Powell River
5-2 \\s-bur-fs-01\projects\20172098\00_pwll_rvr_wwtp\environmental_sciences\04.02_assessment_reports\rpt_pow_eis_20180403_rl.docx
Figure 5-1 Outfall Location Constraints

REPORT
6-1
6 Environmental Assessment
6.1 AVAILABLE DATA
Past studies (Dobrocky 1981, Hodgins 1989, Hodgins and Stronach 1991) combined with data collected by
the Department of Fisheries and Oceans (DFO) provide a comprehensive description of the oceanographic
properties of Malaspina Strait affecting the initial dilution, trapping and dispersion of the treated effluent
discharged from the planned outfall. Since dilution analysis is the core component of this environmental
assessment, a summary of the available background data is presented in the following sections.
6.1.1 Current Meter Data
Moored current meters were installed by the Institute of Ocean Sciences (IOS) in Malaspina Strait,
approximately 5 km south of the planned outfall in water depths of 15 m, 100 m, and 200 m. The data from
15 m are most relevant for this study (Figure 6-1). The bivariate histogram of speed and cardinal direction
(Table 6-1) shows that currents are strongly bimodal with principal flow directions aligned with bottom
contours and shoreline. Flood tide currents range up to 50 cm/s, about equal in speed to ebb currents.
The time-series were filtered to isolate the tidal currents from the non-tidal, or residual flow in the strait.
These time-series are plotted in Figure 6-2 showing that non-tidal flows can account for speeds up to about
10 cm/s. These non-tidal currents likely arise from winds in Malaspina Strait and current velocities can be
relatively fast at shallow depths.

City of Powell River
6-2 \\s-bur-fs-01\projects\20172098\00_pwll_rvr_wwtp\environmental_sciences\04.02_assessment_reports\rpt_pow_eis_20180403_rl.docx
Figure 6-1 Time-series of Measured Current Speed and Direction in Malaspina Strait. Data obtained by
Institute of Ocean Sciences in 1970 at a depth of 15 m.
0
0.1
0.2
0.3
0.4
0.5
27-Oct 1-Nov 6-Nov 11-Nov 16-Nov 21-Nov 26-Nov 1-Dec 6-Dec
sp
eed
(m
/s)
0
90
180
270
360
27-Oct 1-Nov 6-Nov 11-Nov 16-Nov 21-Nov 26-Nov 1-Dec 6-Dec
dir
ecti
on
to
(d
eg
geo
gra
ph
ic)

6 - Environmental Assessment
6-3
Table 6-1 Bivariate Frequency Table for the Current Meter Data in Figure 6-1 (15 m depth Malaspina Strait).
Frequency is shown in parts per thousand for clarity.
Speed
(m/s)
NE E SE S SW W NW N
0
0.05 3 17 30 16 10 28 40 16
0.1 4 35 67 17 10 56 61 11
0.15 3 32 65 4 3 27 61 0.4
0.2 1 11 69 1 1 33 30
0.25 1 9 49 12 31
0.3 0.2 3 41 0.2 3 15
0.35 1 21 3 6
0.4 0.2 19 1 2
0.45 11 3
0.5 5 1
0.55
0.6
0.65
0.7

City of Powell River
6-4 \\s-bur-fs-01\projects\20172098\00_pwll_rvr_wwtp\environmental_sciences\04.02_assessment_reports\rpt_pow_eis_20180403_rl.docx
Figure 6-2 Time-series of Filtered Current Data Showing Non-tidal and Tidal Components (u is East-West
and v is North-South)
A series of current measurements was made by Dobrocky (1981) during a three-day effluent dispersion
survey (reproduced in Figure 6-3). These data were collected at the deep-water outfall for the paper mill.
Although of limited duration, these data show near-surface speeds ranging from 50 to 60 cm/s, decreasing
to about 20 to 30 cm/s at 35 m depth. Flood tide directions are toward the northwest at both depths, and to
the southeast on the ebb tide. Flows are strongly bimodal, most especially at 35 m depth, and are aligned
with bottom contours and the shoreline. Speeds at this depth are slightly lower than the IOS measurements
approximately 5 km south in Malaspina Strait. This is expected since the width of the passage is greater off
the mill than at the IOS site, providing a greater cross-sectional area for the flow.
-0.6
-0.4
-0.2
0.0
0.2
0.4
27-Oct 1-Nov 6-Nov 11-Nov 16-Nov 21-Nov 26-Nov 1-Dec 6-Dec
u (
m/s
)
residual tide
-0.3
-0.2
-0.1
0.0
0.1
0.2
0.3
27-Oct 1-Nov 6-Nov 11-Nov 16-Nov 21-Nov 26-Nov 1-Dec 6-Dec
v (
m/s
)
residual tide

6 - Environmental Assessment
6-5
Figure 6-3 Current Measurements Reproduced from Dobrocky (1981), Obtained Near the Mill Outfall
Diffuser

City of Powell River
6-6 \\s-bur-fs-01\projects\20172098\00_pwll_rvr_wwtp\environmental_sciences\04.02_assessment_reports\rpt_pow_eis_20180403_rl.docx
6.1.2 Dye Dispersion Measurements
A detailed survey of the Catalyst mill effluent was made in December 1988 by Seaconsult Marine Research
Ltd. (Hodgins 1989) using a towed fluorometer combined with sensors to measure depth, temperature and
conductivity (salinity). The effluent was marked with Rhodamine WT dye and two injections were made: one
at high-tide slack water and a second on a large flood tide. The results provided detailed maps of the
dispersion patterns, and cross-sections of the effluent plume clearly showing trapping depths and vertical
mixing. The December period was selected because water column stratification is generally weakest during
winter, resulting in the greatest likelihood of effluent plume surfacing.
Key results from these surveys showed that effluent was strongly trapped at 40 to 50 m depth with only
weak or no vertical mixing during dispersion following discharge. On flood tides the plume was advected to
the northwest near mid-channel, with no inter-tidal shoreline contact consistent with deep trapping. The
situation was similar on ebb tide when effluent was advected to the southeast, to about Westview, until the
turn of the tide after which it was carried back to the northwest (see Figure 4-3). These dispersion patterns
are consistent with the ISO current meter data in all respects.
6.1.3 Previous Effluent Dispersion Modelling
To provide a continuous dispersion analysis of the Catalyst mill plume for different seasons and
oceanographic conditions, numerical modelling was carried out and reported by Hodgins and Stronach
(1991). This study was based on a three-dimensional time-varying hydrodynamic model of the Strait of
Georgia accounting for tides, wind, and density stratification, combined with a transport-diffusion model for
the effluent component. The model was implemented on two grid scales, the finest of which was 975 m in
Malaspina Strait. Trapping depth for various seasons was modelled with UMERGE, the predecessor of the
United States Environmental Protection Agency (US EPA) Visual Plumes model (Frick et al. 2003). The
plume model results were used to initialize a 3-dimensional dispersion model.
Simulations were made for summer, fall, and winter to examine the effects of seasonal changes in seawater
density. The summer simulation corresponded with high near-surface stratification resulting from fresh
water runoff, particularly from the Fraser River. The fall simulation matched conditions arising from the
seasonal intrusion of ocean bottom water in the strait, and the winter simulation was a typical weak
stratification and a mixed water column. All simulations were 30 days long, and included wind forcing.
The principal findings from the Hodgins and Stronach (1991) study were as follows:
• Effluent is trapped below surface at depths ranging from 35 to 50 m and remains trapped for
distances of 20 km or more.
• Vertical mixing is weak and largely downward; upward mixing is inhibited by density stratification.
• The dominant dispersion pathways are northward past Harwood and Savary Islands and into the
Strait of Georgia through Shearwater Passage, and southeastward down Malaspina Strait.

6 - Environmental Assessment
6-7
• Far-field mixing and dilution are more rapid in Malaspina Strait than along the northward route. The
simulations indicated effective dilutions of about 1,000:1 in the vicinity of Savary Island and over
2,000:1 by Grief Point (at 45 m depth).
• Far-field dispersion patterns were found to be highly variable in response to wind. A steady-state
pattern did not arise, but rather the plume dispersed in sequences of episodically repeating patterns
associated with the wind forcing.
6.1.4 Salinity, Temperature, and Current Profiles
A large archive of water column data for the Strait of Georgia has been created by IOS, but for determining
outfall plume dilution and trapping characteristics, measurements in Malaspina Strait are the most relevant.
Salinity-temperature-depth data for this area were obtained from IOS and analyzed to provide seasonal
profiles for input to the plume model. Figure 6-4 shows representative profiles for winter, summer, and fall.
The profiles are based on IOS measurement locations 12-0018, 17-0351, and 41-0045, respectively
(Figure 3-3). Comparison of the winter profile with measurements made during the 1988 dye study
(Figure 6-5) shows close similarity, with a thermocline and halocline at 40-45 m depth. The fluorometer
measurement of dye concentration shows that this gradient in the density structure is effective in trapping
the effluent plume from the mill diffuser.
The salinity and temperature profiles were combined with two current profiles (Figure 6-4), as follows:
• The slack tide current profile presents a possible worst case for plume surfacing. For example, this
is the condition chosen for the first dye injection in the 1988 field program at the mill. The slack
current profile was specified as a flow velocity of 0.05 m/s, uniformly distributed over the water
column.
• The flood current profile is for a strong flood (or strong ebb) tide that potentially leads to minimum
dilutions at the edge of the initial dilution zone (IDZ). The flood current speeds associated for each
of the seasons were derived from the current meter measurements in Dobrocky (1981). Vertical
variations in flood current speeds were matched qualitatively to the seasonal stratification profiles.

Figure 6-4
Current speed, salinity and temperature profiles used for dilution modelling

6 - Environmental Assessment
6-9
Figure 6-5 Measurements of temperature (T), fluorometer (dye concentration in ppb, log scale), and
salinity (SAL) from the 1988 survey using the towed instrument system (reproduced from Hodgins, 1989)
As demonstrated in this section, in the planned outfall location considerable data exist, including current
meter measurements, drogue studies, detailed dye dispersion measurements, and three-dimensional
modelling. The principal dispersion pathways are well understood and consistent in all respects with the
measured currents. Moreover, buoyant plume trapping behaviour and its relationship to the seasonal
changes in density stratification, are well documented and conform closely with the dilution modelling
predictions conducted historically for the mill.
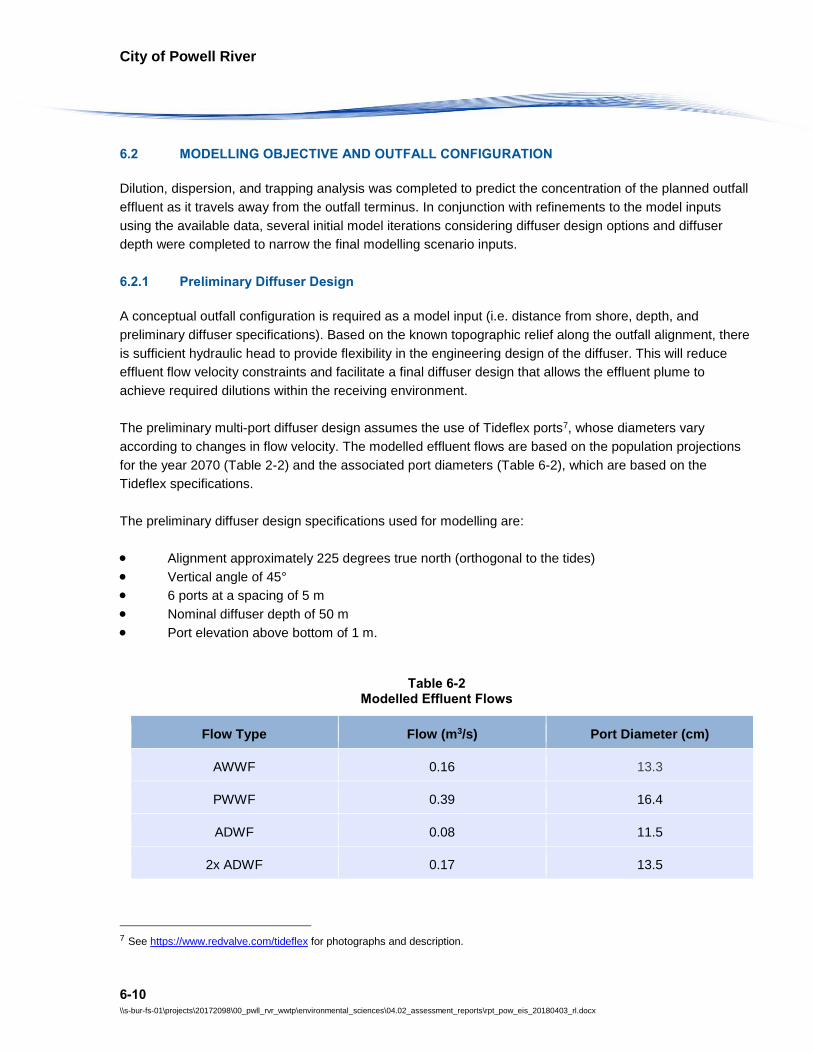
City of Powell River
6-10 \\s-bur-fs-01\projects\20172098\00_pwll_rvr_wwtp\environmental_sciences\04.02_assessment_reports\rpt_pow_eis_20180403_rl.docx
6.2 MODELLING OBJECTIVE AND OUTFALL CONFIGURATION
Dilution, dispersion, and trapping analysis was completed to predict the concentration of the planned outfall
effluent as it travels away from the outfall terminus. In conjunction with refinements to the model inputs
using the available data, several initial model iterations considering diffuser design options and diffuser
depth were completed to narrow the final modelling scenario inputs.
6.2.1 Preliminary Diffuser Design
A conceptual outfall configuration is required as a model input (i.e. distance from shore, depth, and
preliminary diffuser specifications). Based on the known topographic relief along the outfall alignment, there
is sufficient hydraulic head to provide flexibility in the engineering design of the diffuser. This will reduce
effluent flow velocity constraints and facilitate a final diffuser design that allows the effluent plume to
achieve required dilutions within the receiving environment.
The preliminary multi-port diffuser design assumes the use of Tideflex ports7, whose diameters vary
according to changes in flow velocity. The modelled effluent flows are based on the population projections
for the year 2070 (Table 2-2) and the associated port diameters (Table 6-2), which are based on the
Tideflex specifications.
The preliminary diffuser design specifications used for modelling are:
• Alignment approximately 225 degrees true north (orthogonal to the tides)
• Vertical angle of 45°
• 6 ports at a spacing of 5 m
• Nominal diffuser depth of 50 m
• Port elevation above bottom of 1 m.
Table 6-2 Modelled Effluent Flows
Flow Type Flow (m3/s) Port Diameter (cm)
AWWF 0.16 13.3
PWWF 0.39 16.4
ADWF 0.08 11.5
2x ADWF 0.17 13.5
7 See https://www.redvalve.com/tideflex for photographs and description.

6 - Environmental Assessment
6-11
6.3 DILUTION ANALYSIS
Dilution, dispersion, and trapping analysis based on the preliminary diffuser design was carried out for this
EIS using the US EPA Visual Plumes model (Frick et al. 2003). This modelling package is recommended by
the MoE (BC MELP 2000). The following sections describe the scenarios that were developed and the
associated model inputs, as well as the model results.
6.3.1 Modelling Scenarios
Ten (10) scenarios were modelled, corresponding to the various effluent flow rates (Table 6-2) and the
three seasonal changes in stratification, with two current speed profiles. The seasonal flood current, salinity,
and temperature profile values used are tabulated in Table 6-3. Current direction was specified as 315
degrees true north at all depths and modelled as flow orthogonal to the diffuser in Visual Plumes for both
current profiles.
Table 6-3 Oceanographic Profiles for Input to Visual Plumes
Winter Summer Fall
Depth
(m)
Speed
(m/s)
Sal.
(ppt)
Temp.
(°C)
Speed
(m/s)
Sal.
(ppt)
Temp.
(°C)
Speed
(m/s)
Sal.
(ppt)
Temp.
(°C)
0 0.55 28.45 6.94 0.65 22.72 17.31 0.55 27.53 12.68
5 0.55 28.51 7.07 0.65 23.46 16.77 0.55 27.53 12.69
10 0.45 28.88 7.27 0.40 26.15 13.98 0.50 27.60 12.69
15 0.40 28.94 7.31 0.30 28.00 11.46 0.45 27.73 12.65
20 0.38 28.97 7.32 0.25 28.78 10.14 0.43 27.77 12.61
25 0.36 29.06 7.42 0.23 29.02 9.89 0.40 27.81 12.57
30 0.34 29.14 7.50 0.20 29.23 9.61 0.38 27.97 12.37
35 0.25 29.19 7.56 0.20 29.29 9.44 0.25 28.84 10.99
40 0.20 29.61 8.01 0.20 29.43 9.26 0.22 29.35 9.99
45 0.20 29.81 8.26 0.20 29.49 9.16 0.20 29.69 9.62
50 0.20 29.95 8.43 0.20 29.56 9.06 0.20 29.83 9.53
55 0.15 30.05 8.53 0.15 29.64 8.96 0.15 29.90 9.51

City of Powell River
6-12 \\s-bur-fs-01\projects\20172098\00_pwll_rvr_wwtp\environmental_sciences\04.02_assessment_reports\rpt_pow_eis_20180403_rl.docx
Winter Summer Fall
Depth
(m)
Speed
(m/s)
Sal.
(ppt)
Temp.
(°C)
Speed
(m/s)
Sal.
(ppt)
Temp.
(°C)
Speed
(m/s)
Sal.
(ppt)
Temp.
(°C)
0 0.55 28.45 6.94 0.65 22.72 17.31 0.55 27.53 12.68
60 0.15 30.15 8.59 0.15 29.72 8.88 0.15 29.96 9.53
The matrix of effluent flow rates, seasonal stratifications and current profiles included four winter, three
summer, and three fall scenarios (Table 6-4). These scenarios represent a range of effluent and receiving
environment characteristics. The scenarios focus on conditions that are likely to result in shallow trapping
depth or low dilutions, to be conservative from the perspective of meeting applicable water quality
guidelines.
Table 6-4 Scenario Matrix
Winter Summer Fall
Flood Slack Flood Slack Flood Slack
AWWF ✓ ✓
PWWF ✓ ✓
ADWF ✓ ✓
2x ADWF1 ✓ ✓ ✓ ✓
Note: 1Recommended in EIS guidelines (BC MELP 2000).
The effluent mixing parameters for model input were as follows:
• Far-field dispersion coefficient: 0.0003 m2/3/s
• Aspiration coefficient: 0.1
• Effluent salinity: 0 ppt
• Winter effluent temperature: 10°C
• Summer effluent temperature: 20°C
• Fall effluent temperature: 15°C
6.3.2 Model Results
The predicted trapping depths and volumetric dilutions of the effluent plume at the edge of the IDZ are
provided in Table 6-5 and are shown with respect to distance from the point of discharge. Note that the
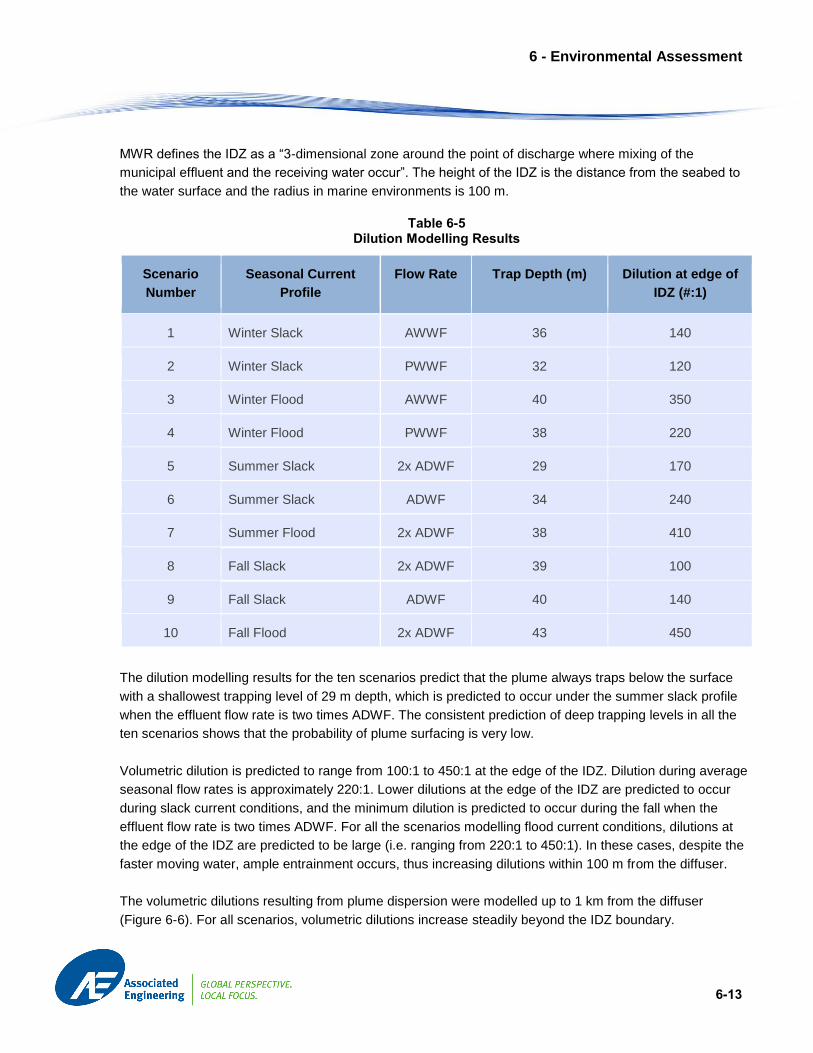
6 - Environmental Assessment
6-13
MWR defines the IDZ as a “3-dimensional zone around the point of discharge where mixing of the
municipal effluent and the receiving water occur”. The height of the IDZ is the distance from the seabed to
the water surface and the radius in marine environments is 100 m.
Table 6-5 Dilution Modelling Results
Scenario
Number
Seasonal Current
Profile
Flow Rate Trap Depth (m) Dilution at edge of
IDZ (#:1)
1 Winter Slack AWWF 36 140
2 Winter Slack PWWF 32 120
3 Winter Flood AWWF 40 350
4 Winter Flood PWWF 38 220
5 Summer Slack 2x ADWF 29 170
6 Summer Slack ADWF 34 240
7 Summer Flood 2x ADWF 38 410
8 Fall Slack 2x ADWF 39 100
9 Fall Slack ADWF 40 140
10 Fall Flood 2x ADWF 43 450
The dilution modelling results for the ten scenarios predict that the plume always traps below the surface
with a shallowest trapping level of 29 m depth, which is predicted to occur under the summer slack profile
when the effluent flow rate is two times ADWF. The consistent prediction of deep trapping levels in all the
ten scenarios shows that the probability of plume surfacing is very low.
Volumetric dilution is predicted to range from 100:1 to 450:1 at the edge of the IDZ. Dilution during average
seasonal flow rates is approximately 220:1. Lower dilutions at the edge of the IDZ are predicted to occur
during slack current conditions, and the minimum dilution is predicted to occur during the fall when the
effluent flow rate is two times ADWF. For all the scenarios modelling flood current conditions, dilutions at
the edge of the IDZ are predicted to be large (i.e. ranging from 220:1 to 450:1). In these cases, despite the
faster moving water, ample entrainment occurs, thus increasing dilutions within 100 m from the diffuser.
The volumetric dilutions resulting from plume dispersion were modelled up to 1 km from the diffuser
(Figure 6-6). For all scenarios, volumetric dilutions increase steadily beyond the IDZ boundary.

City of Powell River
6-14 \\s-bur-fs-01\projects\20172098\00_pwll_rvr_wwtp\environmental_sciences\04.02_assessment_reports\rpt_pow_eis_20180403_rl.docx
Figure 6-6 Predicted Dilution and Dispersion of the Effluent Plume
Section 5.2.2 of the BC MELP (2000) guidance document recommends current meter and/or drogue
studies to verify current directions for model refinement. However, the estimated dilution and trapping
characteristics for the planned outfall are consistent with the previous field and modelling studies conducted
for the Catalyst mill and what would be expected for a multi-port diffuser at 50 m depth. Additional current
meter data would not improve confidence in the modelled and expected plume behaviour, and accordingly
collecting additional current meter data is not recommended.
As shown by the dilution modelling results, trapping well below surface is predicted for all seasons. While
drogue studies have some value for near-surface dispersion mapping (depths < 10 m), the difficulties of
designing and using drogues for deeper depths outweigh the information collected. Given this, deep
trapping drogue studies are not likely to improve model performance compared to use of existing baseline
data.

6 - Environmental Assessment
6-15
6.4 PREDICTED WATER QUALITY AT EDGE OF IDZ
The WWTP will be designed such that the effluent water quality will comply with MWR and WSER
standards for concentrations at the end-of-pipe. We used the minimum predicted dilution at the edge of the
IDZ, which was 100:1, to conservatively estimate water quality at the end-of-pipe and/or at the edge of the
IDZ, depending on what is applicable. Concentration metrics for TSS, cBOD, ammonia-N and nitrate-N, and
fecal coliforms were calculated, based on dilution mass balance, to compare with the MWR standards and
the BC approved and working water quality guidelines (BC MoE 2015, 2016, 2017b) (Table 6-6). For the
parameters evaluated, the BC guidelines were the most stringent or equal to the Health Canada (HC)
guidelines for Canadian recreational water quality (HC 2012) and the Canadian Council of Ministers of the
Environment (CCME) guidelines for the protection of aquatic life (CCME 1999). The following sections
detail how the standards and guidelines apply to each of the parameters.
Table 6-6 Summary of Standards, Guidelines, and Performance - 100:1 Dilution
Notes: 1 Based on the applicable water quality guideline and a dilution of 100:1. 2 Based on the maximum anticipated end-of-pipe operating range and a dilution of 100:1. 3 Based on the approved water quality guideline for aquatic life (BC MoE 2015), which includes a narrative that links the guideline to background concentration. The 5 mg/L guideline is based on change from background at any one time for a duration of 30 days in all waters during clear flows or in clear waters. 4 The MWR standard is a back-calculation at end-of-pipe based on the guideline applied at the edge of the IDZ. 5 The MWR states that fecal coliform must meet applicable requirements at the edge of the IDZ if it intersects shellfish bearing waters (14 mpn/100 mL). The standard thus implies a maximum allowable concentration that is back-calculated from the edge of the IDZ. The disinfection treatment level can be adjusted to ensure that fecal coliforms remain below the standard.
MWR End-
of-Pipe
Treatment
Standard
Max. Allowable
End-of-Pipe
Concentration1
Anticipated
Maximum
Concentration
at Edge of
IDZ2
BC Approved
or Working
Water Quality
Guideline
Anticipated
End-of-Pipe
Operating
Range
Anticipated
Concentration
at Edge of IDZ
as % of
Guideline
TSS (mg/L) 45 500 0.40 53 5 – 40 1% – 8%
cBOD (mg/L) 45 N/A 0.30 N/A 5 – 30 N/A
Ammonia-N
(mg/L)
N/A 664 0.3 0.66 1 – 30 2% – 45%
Nitrate-N
(mg/L)
N/A 370 0.1 3.7 1 – 10 0.3% – 3%
Fecal Coliform
(mpn/100 mL)
N/A 14005 14 N/A 500 – 1400 36% – 100%
City of Powell River
6-16 \\s-bur-fs-01\projects\20172098\00_pwll_rvr_wwtp\environmental_sciences\04.02_assessment_reports\rpt_pow_eis_20180403_rl.docx
6.4.1 Total Suspended Solids
The end-of-pipe MWR standard is a maximum of ≤45 mg/L when effluent flow is less than two times the
ADWF, and a maximum of ≤ 130 mg/L when effluent flow is greater than or equal to two times the ADWF.
The end-of-pipe WSER standard for total suspended solids is an average of ≤ 25 mg/L. The BC approved
water quality guideline for aquatic life (BC MoE 2015) based on an increase over the background
concentration. For example, the guideline is a change from background of 5 mg/L at any one time for a
duration of 30 days (shown as a conservative value in Table 6-6). Based on the minimum predicted dilution
of 100:1 (Table 6-2) and assuming an effluent TSS at end-of-pipe concentration of 5 to 40 mg/L, the TSS
concentration at the IDZ boundary could range from 0.05 to 0.4 mg/L. Even if TSS background
concentration is assumed to be zero, the TSS guideline is predicted to be achieved with considerable
margin of safety (i.e. approximately 1% to 8% of the guideline).
6.4.2 Ammonia-N, Un-ionized ammonia, and Nitrate-N
The MWR standard for effluent total ammonia requires a back calculation to obtain an end-of-pipe
concentration, based on the minimum predicted dilution at the edge of the IDZ and the most conservative
water quality guideline for total ammonia nitrogen (ammonia-N). The applicable guideline is 0.66 mg/L,
which is based on the long-term average water quality guidelines for ammonia-N to protect marine aquatic
life, for marine water with a salinity of 20 ppt, a temperature of 20°C, and a pH of 8.2 (BC MoE 2017b).
Based on the guideline and the minimum dilution, the recommended maximum allowable effluent total
ammonia-N at end-of-pipe concentration is therefore 66 mg/L. This should be readily achievable given that
the preliminary design projected end-of-pipe concentration is a range of 1 to 30 mg/L, which is 2% to 45%
of the back-calculated guideline maximum for total ammonia-N.
There is no MWR standard for un-ionized ammonia, but the WSER standard is ≤ 1.25 mg/L. The WSER
provides a formula to calculate un-ionized ammonia concentration based on total ammonia and effluent pH.
Using the recommended maximum allowable effluent total ammonia at end-of-pipe concentration of
66 mg/L and a conservative effluent pH of 7.5, the end-of-pipe un-ionized ammonia concentration would be
0.57 mg/L. This is approximately 50% of the end-of-pipe un-ionized ammonia concentration prescribed by
the WSER standard.
There is no end-of-pipe treatment standard for nitrate-N concentration but a discussion of the nitrate-N
guideline is included here for information. The approved long-term water quality guideline for nitrate-N for
marine aquatic life is 3.7 mg/L (BC MoE 2017b). With the minimum predicted dilution and based on the
range of predicted end-of-pipe concentrations of 1-10 mg/L, the maximum concentration of nitrate-N at the
edge of the IDZ would be 0.1 mg/L. This concentration is approximately 3% of the guideline maximum.
6.4.3 Fecal Coliforms
Water quality guidelines for fecal coliforms are based on the receiving water uses and the location of
potential receptors. Based on the inventory of fisheries resources (see Section 4.6.1), The IDZ is likely to be
within “shellfish bearing waters” (MWR Section 96), although it is not currently used for commercial or

6 - Environmental Assessment
6-17
Indigenous fishing, and recreational fishers are unlikely to use the area. The applicable end-of-pipe MWR
concentration standard for fecal coliforms within shellfish bearing waters is 14 MPN/100 mL (median or
geometric mean). At the predicted minimum dilution of 100:1, the end-of-pipe concentration of fecal
coliforms must be ≤1400 MPN/100 mL and not exceed a maximum of 4,300 MPN/100 mL in more than
10% of samples. This standard will be readily achievable as the WWTP will include an ultraviolet
disinfection system with appropriate redundancy.
6.4.4 Carbonaceous Biochemical Oxygen Demand
The end-of-pipe MWR standard for cBOD is a maximum of ≤45 mg/L when effluent flow is less than two
times the ADWF, and a maximum of ≤ 130 mg/L when effluent flow is greater than or equal to two times
ADWF. Unlike the parameters discussed above, the change in cBOD in the receiving environment resulting
from effluent discharge cannot be determined through dilution mass balance. Upon reaching the receiving
environment, cBOD in the effluent will affect the dissolved oxygen (DO) based on a number of factors
including pH, presence of certain microorganisms, and the type of organic and inorganic material in the
water. The guideline for DO is 5 mg/L O2 (BC MoE 2017b), and the long-term average water quality
guideline is 8 mg/L O2.
6.5 EFFECTS ASSESSMENT
Based on the dilution modelling (Section 6.3) and the projected water quality conditions at the edge of the
IDZ (Section 6.4), this section provides a discussion of potential effects on aquatic life, and recreation and
human health.
The consolidation of the three existing WWTP outfalls into one means that the planned outfall is not a new
waste stream compared to baseline conditions. Within the LSA, the most significant change that is
expected is a four-fold increase in effluent flow (Table 2-1), offset by the elimination of flows from the
Townsite WWTP that will be decommissioned. Compared to baseline conditions the MWR exceedances
resulting from effluent bypass at the Townsite (Table 2-4) are anticipated to be eliminated resulting in
improved water quality. Within the RSA, total effluent flow will not change compared to baseline conditions
(i.e. with three WWTPs) and effluent quality is expected to be improved compared to baseline conditions.
6.5.1 Aquatic Life Effects
As described in Section 6.4, based on the planned WWTP design, the end-of-pipe effluent quality will be
well-within the provincial and federal standards and provide an overall improvement to quality of municipal
effluent discharged to the LSA and RSA. In addition, dilution analysis of the receiving environment in the
LSA demonstrates a high-level of dilution (at least 100:1 and average about 220:1) and water quality
parameters at the edge of the IDZ are predicted to be well within guidelines for the protection of aquatic life,
with a considerable margin of safety for most parameters. The existing biota and habitat conditions in the
receiving environment within the LSA are similar to other areas in the RSA, and no sensitive habitats,
ecosystems, or biota have been identified outside the IDZ. As such, no significant adverse effects to aquatic
life in the receiving environment as a result of the planned discharge of treated effluent are anticipated.

City of Powell River
6-18 \\s-bur-fs-01\projects\20172098\00_pwll_rvr_wwtp\environmental_sciences\04.02_assessment_reports\rpt_pow_eis_20180403_rl.docx
6.5.2 Recreation and Human Health Effects
The baseline effluent water quality discharged from the three outfalls is currently a potential health hazard
to recreational fishers, boaters, and other recreationalists, due to the MWR exceedances and occasional
bypasses of untreated effluent. With the elimination of these issues following construction of the
Consolidated WWTP, the quality of the treated effluent discharged to the environment will be improved.
Furthermore, the modelling indicates that the effluent plume will always trap below the surface, and the risk
of exposure by recreational users to the treated effluent at the surface will be very low. The combined
outcome of improved treatment and the plume trapping below the surface will result in a positive effect on
recreational use from the project.
6.5.3 Cumulative Effects
Cumulative effects can be defined as “changes to environmental, social and economic values caused by
the combined effect of past, present and potential future human activities and natural processes”
(Government of British Columbia 2016). Within the Malaspina Strait the existing actions or events that
combine with the existing WWTP outfalls to be consolidated include the Catalyst mill, the Tla’amin outfall,
and smaller activities with comparatively minor influence such as accidental spills of fuel from boats. At
present, there are no upcoming major industrial or commercial developments planned for Powell River or
Malaspina Strait that are reasonably foreseeable.
The discharge of treated effluent to the environment in Malaspina Strait is not a new discharge, so the
cumulative loading of potential contaminants to the strait will not increase from baseline conditions, and is
expected to decrease as a result of improved treatment. Discussions are underway to further consolidate
the planned outfall to include the effluent from the current Tla’amin outfall. This action would reduce
cumulative impacts to Malaspina Strait due to improvements in effluent water quality. The effluent flow
contribution from the Tla’amin outfall is approximately 4% of the effluent flow from the Consolidated WWTP.
The most important regional source of organic matter and potential contaminants within the RSA is from the
Catalyst mill. The projected effluent flows for the Consolidated WWTP for the year 2020 represents
approximately 5% of the 2015 mill effluent flow8 (Table 6-7). The loading of TSS, organic matter, and
nutrients discharged from the planned outfall is also comparatively small compared to the loading
discharged from the mill. For example, loading from the planned outfall as a percentage of loading from the
mill will range from approximately 2% to 19% for TSS, and approximately 5% to 27% for cBOD.
8 The estimated effluent flow for the Consolidated WWTP is based on the projection for the year 2020, and the mill effluent flow is
based on the year 2015.

6 - Environmental Assessment
6-19
Table 6-7 Effluent Flow and Loading from the Planned Outfall and the Mill
Effluent Flow
(m3/d)
Average TSS loading
(kg/d)
Average cBOD loading
(kg/d)
Consolidated WWTP (2020) 8,190 41 – 3281 41 – 2461
Catalyst Mill (2015) 149,810 1,700 910
Proportion of Planned Outfall
compared to Mill Outfall
5% 2% – 19% 5% – 26%
Notes:
1 The loading for the Consolidated WWTP is based on the anticipated operating end-of-pipe range of 5 – 40 mg/L TSS
and 5 – 30 mg/L cBOD.
6.5.4 Effects Assessment Summary
To apply the dilution and dispersion model, ten scenarios were developed based on preliminary outfall and
diffuser design and combinations of effluent and receiving environment characteristics. There were four
winter, three fall, and three summer scenarios. While the scenarios represented a range of conditions, they
included those that could be considered as worst case from the perspective of meeting applicable water
quality guidelines.
Based on the review of background information and dilution modelling results, the key effects identified
through this environmental assessment are:
• The effluent plume traps below the surface under all scenarios. The shallowest trapping depths are
likely to occur during slack tide conditions and high effluent flow rates. The shallowest modelled
trapping depth was 29 m, which occurred during the summer slack current and a two times average
dry weather flow (ADWF) effluent flow rate.
• Dilution at the edge of the IDZ ranged from 100:1 to 410:1, with the lowest ratio occurring during fall
slack tide and a two times ADWF effluent flow rate. Slack tide conditions (i.e. where the current
velocity is zero or near zero) occur for about four hours/day, so the dilution ratio is greater than
100:1 about 80% of the time.
• Dilution at the edge of the IDZ for all flood tide scenarios are predicted to range from 220:1 to
450:1.
• Assuming a dilution of 100:1 as a conservative estimate for the lowest dilution achieved at the edge
of the IDZ, the most stringent and applicable water quality guidelines for total suspended solids
(TSS), carbonaceous biochemical oxygen demand (cBOD), ammonia nitrogen (ammonia-N) and
nitrate-nitrogen (nitrate-N), and fecal coliforms will all be readily achievable at the edge of the IDZ.
• The planned outfall effluent is not a new waste stream compared to baseline conditions. Within the
LSA, the most significant change will be approximately a four-fold increase in effluent flows.
However, effluent quality will be improved compared to baseline conditions.

City of Powell River
6-20 \\s-bur-fs-01\projects\20172098\00_pwll_rvr_wwtp\environmental_sciences\04.02_assessment_reports\rpt_pow_eis_20180403_rl.docx
• Within the RSA, effluent flow will remain the same as baseline conditions and effluent quality will be
improved.
• No sensitive aquatic habitats or biota have been identified in the LSA. The effects on existing
aquatic life are expected to be negligible based on the predicted effluent quality, and dilution at the
edge of the IDZ.
• The effects on recreational use are likely to be improved due to improved effluent quality. The risk
of exposure to effluent will be very low due to deep plume trapping depths.
• Since the Consolidated WWTP is not a new waste stream, cumulative effects will be equal to those
described for the RSA. Effluent flow from the Consolidated WWTP is projected to be approximately
5% of the effluent flow from the mill.
Based on the EIS results and planned end-of-pipe treatment to MWR and WSER standards, it is expected
that both aquatic life and recreational use will be protected beyond the IDZ boundary. End-of-pipe treatment
standards more stringent than the MWR and WSER standards are therefore not warranted. The proposed
monitoring program will be used to evaluate the EIS projections and determine whether there is a need for
further mitigation via treatment or operations.

REPORT
7-1
7 Recommended Environmental Monitoring
7.1 PRE-DISCHARGE ENVIRONMENTAL MONITORING PROGRAM
7.1.1 Regulatory Framework for Monitoring
The regulatory requirements for environmental monitoring to begin in advance of a new discharge are
contained in Sections 19 and 20 of the Municipal Wastewater Regulation. Section 19 states that the EIS
must establish a monitoring plan for both pre- and post-discharge that include details on monitoring
locations, sampling parameters and frequencies. Section 20 requires the receiving environmental
monitoring program to:
• Provide at least one reference sampling station outside the influence of the IDZ [S. 20(1)(a)].
Obtain data to assess potential impacts of the discharge [S. 20(1)(b)i].
• Assess whether the discharge causes applicable water quality guidelines to be exceeded beyond
the edge of the IDZ [S. 20(1)(b)ii].
• Document pre-discharge conditions [S. 20(1)(c)], especially during “the most critical period of the
year” [S. 20(2)].
This requirement, to begin the monitoring program sufficiently in advance of beginning a discharge to
characterize baseline conditions, is consistent with environmental assessment monitoring for other
municipal and industrial sectors. Other sections of the MWR that refer to the receiving environment9
monitoring are:
• S53(b) – Monitoring of the receiving environment is required to determine MWR compliance.
S55(4) – After two years a discharger may apply to the Director for permission to alter the
monitoring program, if supported by suitable data and/or a recommendation from a Qualified
Professional.
• S55(5) – The monitoring data must be provided to MoE.
• S58(2)(c) – Toxicity monitoring of the treated effluent is not required if the dilution ratio at the edge
of the IDZ is greater than 100:1 (pre-discharge monitoring is important for assessing the post-
discharge monitoring data).
• Table 11 – Lists the effluent quality requirements. Although not explicitly stated, the receiving
environment monitoring should include these parameters as a minimum in order to verify the levels
of dilution (TSS, BOD, total P, ortho-P, and pH). S95 and S96 indicates that ammonia-N and fecal
coliforms should also be monitored.
Further guidance on the pre-discharge monitoring is provided in the guideline (BC MELP 2000). Key points
include:
9 Other MWR sections provide requirements for monitoring the quality of the final effluent.

City of Powell River
7-2 \\s-bur-fs-01\projects\20172098\00_pwll_rvr_wwtp\environmental_sciences\04.02_assessment_reports\rpt_pow_eis_20180403_rl.docx
• The EIS must establish pre-discharge conditions through a review of baseline information and, if
needed, new baseline studies (p. 2).
• The goals of monitoring are to 1) determine whether water quality guidelines are being met outside
the IDZ; 2) to confirm that sediment biota, chemistry and toxicity are not adversely affected; and 3)
to test previous modeling and predictive assessments are correct (p. 10 – emphasis added).
• There should be at least one reference (“upstream”) monitoring site.
• There should be “several” downstream sites, at and beyond the edge of the IDZ.
• The water quality sampling should include a “5 samples in 30 days” program during the most critical
period of the year. “Critical” is defined as the period when Water Quality Guidelines are most likely
to be exceeded or when sediment chemistry and biota are most likely to be adversely impacted
(p.11).
7.1.2 Recommended Pre-Discharge Monitoring
The planned City of Powell River pre-discharge monitoring program will make use of the previous work
completed by Catalyst Paper Corporation, DFO, and other organizations, and includes sampling of water
quality, sediment quality, and benthic invertebrate communities. The study design involves establishment of
reference (control) sites outside the influence of the municipal effluent plume and “downstream” impact
sites located 100 m and approximately 400 m from the outfall. The sites will have similar bottom sediment
and water depth characteristics to enable comparisons between sites. The study design considers the
potentially confounding effects of the Catalyst mill discharge, and the natural characteristics of Malaspina
Strait.
Following is an outline of the planned monitoring program, which was developed utilizing the available
baseline information, the results of the preliminary effluent dilution and dispersion modelling described in
Section 6, and the regulatory requirements and guidelines discussed above in Section 7.1.1. The major
objectives are to:
• Characterize baseline (pre-discharge) conditions at the reference and downstream impact sites;
• Determine if there are any differences between sites; and
Based on the findings, adjust the post-discharge monitoring study design if warranted.
Monitoring Sites
The benthic invertebrate, water quality, and sediment quality information presented in the Catalyst EEM
reports provide an understanding of the conditions within Malaspina Strait around the mill. The City’s
planned outfall site is within an area potentially influenced by the mill. Therefore, the impact and reference
sites will be located to minimize confounding effects from the mill discharge when interpreting the City’s
monitoring data.
There will be two near-field impact sites located “downstream” at the edge of the IDZ (100 m from diffuser)
in the area where the preliminary modelling shows maximum effluent plume concentrations; one north of
the diffuser (I-1) and one south of the diffuser (I-2) to monitor the areas most influenced by the flood and
ebb tides, respectively (Figure 7-1).

7 - Recommended Environmental Monitoring
7-3
There will be two reference site(s) located > 400 m north (R-1) and south (R-2) of the outfall. If possible, the
reference sites will be established in the same location as sites sampled as part of Catalyst’s EEM program
(Section 3.2) (Figure 3-3).
There will be one additional reference site located approximately 3 km south of the outfall (R-3). This
reference site will be established outside of areas currently sampled as part of Catalyst’s EEM program and
potentially influenced by the mill.

City of Powell River
7-4 \\s-bur-fs-01\projects\20172098\00_pwll_rvr_wwtp\environmental_sciences\04.02_assessment_reports\rpt_pow_eis_20180403_rl.docx
Figure 7-1 Pre-Discharge Monitoring Sites

7 - Recommended Environmental Monitoring
7-5
Schedule
• The pre-discharge monitoring will begin in late summer or autumn 2018 and run until autumn 2019.
• The period of lowest dilution occurs during both fall and winter during slack tides. The summer
period is the most sensitive due to increased recreation use throughout the season.
• Four water quality sampling periods:
• Winter (one sampling date at each site),
• Spring (one sampling date at each site),
• Summer (5 sampling dates within 30 days at each site to enable comparison to water
quality guidelines for specified variables), and
• Autumn. Given the late summer 2018 start, the summer and fall programs will take place
twice, and the winter and spring sampling once.
• One sediment and benthic invertebrate sampling trip will be completed in the late summer/early fall
of 2018 coinciding with water quality sampling.
Water Quality
• Use a field meter to measure DO, temperature, salinity, conductivity, and pH at each site.
• Complete a DO, temperature, and salinity profile at each site during all sampling periods – measure
every 1 m depth.
• Obtain water samples above (2 m below surface) and below the halocline/thermocline (1 m below
the halocline) at sites where stratification is present.
• Sampling and laboratory analysis will be for pH, TSS, BOD, total P, ortho-P, ammonia-N, nitrate+
nitrite-N, total N, Enterococci and fecal coliforms (4 samples per year).
• Of the five samples collected during the summer period, only the mid-month sample will be
analyzed for the full suite of parameters. The other four will be analyzed for fecal coliforms and
Enterococci since these are the only parameters where the water quality guideline is based on five
samples in 30 days. However, the field measurements will also be completed on each of those five
dates.
Sediment Quality
• Use the same field and laboratory methods as Catalyst to allow comparison of results.
• Each site is a composite of 5 sub-samples collected within about 5 m of each other.
• Analyze for particle size, total organic carbon, sulphide, total N, and total P.
Benthic Invertebrates
• Benthic invertebrates will be collected from each of the five sub-samples that were composited for
sediment analyses (i.e. 5 replicates per site).
• Sampling will follow BC MELP (2002) Protocols for Marine Environmental Monitoring.
• Sorting, identification, and data analysis will be completed by a qualified benthic taxonomist with
experience in B.C. marine and estuarine environments. If possible, use the same analyst that
completed the most-recent Catalyst work.
• Assess benthic community composition through calculations of abundance, species richness,
evenness, and diversity.

City of Powell River
7-6 \\s-bur-fs-01\projects\20172098\00_pwll_rvr_wwtp\environmental_sciences\04.02_assessment_reports\rpt_pow_eis_20180403_rl.docx
Data Analyses, Management and Reporting
The data from the pre-discharge monitoring will be compiled into MS-Excel and provided to MoE in a format
that is compatible with the Provincial Environmental Monitoring System (EMS) database. A pre-discharge
report presenting the findings and recommendations will be provided approximately two months after the
last round of sampling is complete. Table 7-1 summarizes the features of the planned pre-discharge
monitoring program.
Table 7-1 Draft Planned Pre-Discharge Monitoring Program
Task Objective Sampling Location
and Schedule
Analyses
Water Column
Impact Sites Collect water quality
data at edge of initial
dilution zone (IDZ)
4 surveys/year for 2
years; 2 sites
• Field: Temperature,
salinity, DO, pH
• Lab: TSS, TP, TKN,
ammonia, N,
pathogens,
chlorophyll
• Visual: water clarity,
marine mammal
observations
Reference Sites Collect water quality
data with similar
sediment & depth
characteristics as
impact sites
4 surveys/year for 2
years; 3 sites
Bottom Substrate
Impact and Reference
Sites (same as water)
Evaluate sediment
quality and benthos
community
1 survey
2 impact sites
3 reference sites
• Sediment chemistry
• Benthic community
composition
7.2 OPERATIONAL MONITORING
After the Consolidated WWTP is commissioned, the receiving environment monitoring will follow the same
design as the pre-discharge monitoring. The plant is expected to be commissioned in 2020, and the first
round of operational monitoring of the receiving environment will take place in the autumn of 2021. After
that, the receiving environment program will occur on the three-year schedule (i.e. 2024, 2027, etc.)
Sampling and analysis of the final effluent will proceed according to the schedule in the MWR for the
variables required by the MWR and the WESR.

REPORT
8-1
8 Conclusion
This EIS document has included a review of baseline information and application of the US EPA Visual
Plumes dilution model to predict the effects on the receiving environment resulting from the consolidation of
three existing WWTP outfalls into one WWTP outfall. The document content followed the MoE’s guidelines,
which is summarized in a table of concordance (Appendix 1). The dispersion modelling indicates that all
applicable water quality guidelines will be met at the edge of the IDZ and that the effluent plume will trap
below the surface. Furthermore, no sensitive habitats would be affected by the effluent plume. The
anticipated project effects on aquatic life and recreational use are predicted to be low. End-of-pipe
treatment standards more stringent than the MWR and WSER standards are therefore not warranted.
Recommended pre-discharge and operational monitoring programs have been developed to evaluate the
EIS projections and to determine if differences between impact sites influenced by the municipal effluent
and reference sites are significant.


REPORT
References
Barton, L. 2017. Program Head, Shellfish Data Unit, Aquatic Resources Research and Assessment Division
Pacific Biological Station, Fisheries and Oceans Canada. Personal communication (e-mail) with Robert
Hoogendoorn of Associated. October 30, 2017.
British Columbia Conservation Data Center (BCCDC). 2017. Species and Ecosystem Explorer database.
Available at: www.env.gov.bc.ca/cdc. Accessed October 2017.
British Columbia Marine Conservation Analysis (BCMCA). 2017. Maps, data and reports available at:
http://bcmca.ca/. Accessed October 2017.
BC Ministry of Environment (MoE). 2015. Working Water Quality Guidelines for British Columbia. Website
address: http://www2.gov.bc.ca/assets/gov/environment/air-land-water/water/waterquality/wqgs-
wqos/bc_env_working_water_quality_guidelines.pdf
BC Ministry of Environment (MoE). 2016. Approved Water Quality Guidelines. Website address:
http://www2.gov.bc.ca/gov/topic.page?id=044DD64C7E24415D83D07430964113C9
BC Ministry of Environment (MoE). 2017a. Letter addressed to the City of Powell River Regarding “Your
application for a change in servicing/catchment area for Permit PE-171 under the Environmental
Management Act”. October 2017.
BC Ministry of Environment (MoE). 2017b. British Columbia Approved Water Quality Guidelines: Aquatic
Life, Wildlife & Agriculture. Website address: https://www2.gov.bc.ca/assets/gov/environment/air-land-
water/water/waterquality/wqgs-wqos/approved-wqgs/wqg_summary_aquaticlife_wildlife_agri.pdf
BC Ministry of Environment, Lands, and Parks (BC MELP). 2000. Environmental impact study guideline – a
companion document to the municipal sewage regulation. Victoria.
BC Municipal Wastewater Regulation (87/2012). Environmental Management Act. Deposited April 20, 2012.
Website address: http://www.bclaws.ca/civix/document/id/lc/statreg/87_2012. Accessed August 23,
2017.
Boogards, R., P. Galinski and L.M. Zwarn. 2016. City of Powell River, Tla’amin Nation and the Powell River
Regional District, Expanded Regional Recreation Initiative Study. December 8, 2016. Available at:
http://www.powellriverrd.bc.ca/wp-content/uploads/Expanded-Reg-Rec-Initiative-Study.pdf

City of Powell River
Canadian Council of Ministers of the Environment (CCME). 1999. Canadian Water Quality Guidelines for
the Protection of Aquatic Life. Website address: http://ceqg-rcqe.ccme.ca/download/en/312. Accessed:
15 April 2016.
Canadian Hydrographic Service. 1993. British Columba Plans – Strait of Georgia (Powell River and
Westview). Map number 3536.
Christian, J. R. and M.G.G. Foreman. 2013. Climate trends and projections for the Pacific Large Aquatic
Basin. Can. Tech. Rep. Fish. Aquat. Sci. 3031: xi + 113 p.
Daniel, K. Fisheries and Oceans Canada. Personal communication (e-mail) with Robert Hoogendoorn of
Associated. October 20, 2017.
D’Angio, F. City of Powell River. Manager of Engineering Services. Personal communication (e-mail) with
Jason Leong of Associated. September 2018.
Davidson, J. Data Analyst, Fisheries Management Data Unit, Fisheries and Oceans Canada. Personal
communication (e-mail) with Robert Hoogendoorn of Associated. October 20, 2017.
Dayton and Knight. 2007. City of Powell River – Update to the Westview/Townsite Plant Consolidation
Study.
Department of Fisheries and Oceans Canada (DFO). 2011. Lang Creek Beach Fishery 2008/2009: Creel
Survey Catch and Effort Estimates. Canadian Manuscript Report of Fisheries and Aquatic Sciences
2889. ix + 44 p. Available at: http://publications.gc.ca/collections/collection_2014/mpo-dfo/Fs97-4-2889-
eng.pdf
Department of Fisheries and Oceans Canada (DFO). 2017a. Herring Geographic Bulletin, Section 152,
Powell River (North & South) Herring Spawn Records. Available at: http://www.pac.dfo-
mpo.gc.ca/science/species-especes/pelagic-pelagique/herring-hareng/herspawn/152fig-eng.html
Department of Fisheries and Oceans Canada (DFO). 2017b. Aquatic Species at Risk, Critical Habitat Map,
British Columbia South West, Map 2 of 13, July 2017. Available at: http://www.dfo-mpo.gc.ca/species-
especes/images/maps-cartes/bcsw-socb-2-eng.jpg
Department of Fisheries and Oceans Canada (DFO). 2017c. 2015-2016 Shellfish Average Prices to Client
Data. Provided by Martin Data Analyst, FM Data Unit, Business and Client Services Division, Fisheries
Management Branch, Ecosystems and Fisheries Management Sector. October 24, 2017.

References
Department of Fisheries and Oceans Canada (DFO). 2017d. Area 15 - Sanitary contamination closures.
Available at: http://www.pac.dfo-mpo.gc.ca/fm-gp/contamination/sani/a-s-15-eng.html
Department of Fisheries and Oceans Canada (DFO). 2017e. Strait of Georgia Creel Survey – 2009.
Available at: http://www.dfo-mpo.gc.ca/stats/rec/pac/gs/summ-somm/gs2009-eng.html. Accessed
October 2017.
Dobrocky. 1981. Effluent tracer dye study of the Powell River Diffuser. Prepared for MacMillan Bloedel Ltd.,
Powell River Division. Vancouver, B.C. Cited in: Hodgins (1989).
Environment Canada (EC). 2017. Historical Data Stations Search. Website address:
http://climate.weather.gc.ca/historical_data/search_historic_data_stations_e.html?searchType=stnNam
e&timeframe=1&txtStationName=powell+river&searchMethod=contains&optLimit=yearRange&StartYea
r=1840&EndYear=2017&Year=2017&Month=10&Day=30&selRowPerPage=25. Accessed October
2017.
Fargo, J., MacDougall, L., Pearsall, I. 2007. Appendix G: Groundfish. In Ecosystem overview: Pacific
North Coast Integrated Management Area (PNCIMA). Edited by Lucas, B.G., Verrin, S., and Brown, R.
Can. Tech. Rep. Fish. Aquat. Sci. 2667: vi + 28 p. Available at:
http://www.pncima.org/media/documents/pncima-publications/pncima_eoar_328842_g_groundfish.pdf
Fisheries Act (R.S.C., 1985, c. F-14). Government of Canada. Minister of Justice. Website: http://laws-
lois.justice.gc.ca/eng/acts/f-14/. Accessed July 14, 2017.
Frick, W.E., P.J.W. Roberts, L.R. Davis, J. Keyes, D.J. Baumgartner, and K.P. George. 2003. Dilution
Models for Effluent Discharges. 4th Edition (Visual Plumes). United States Environmental Protection
Agency (USEPA). March 2003.
Georgia Strait Alliance. 2017. About the Straight. Website address: http://georgiastrait.org/issues/about-the-
strait-2/. Accessed November 2, 2017.
Government of British Columbia. 2016. Cumulative Effects Framework – Interim Policy (Approved). October
2016. Website address: https://www2.gov.bc.ca/assets/gov/environment/natural-resource-
stewardship/cumulative-effects/cef-interimpolicy-oct_14_-2_2016_signed.pdf
Guo, J. Senior Engineer, Water/Wastewater Systems. 2017. Indigenous Services Canada (ISC), BC
Region. October 17, 2017. Personal communication (e-mail) with Robert Larson of Associated.
Hatfield Consultants. 1994. Powell River Environmental Effects Monitoring (EEM) Pre-Design Reference
Document. Prepared for MacMillan Bloedel Limited. June 1994.

City of Powell River
Hatfield Consultants. 1996. Strait of Georgia Fisheries Sustainability Review. Vancouver, BC., 441 p.
January 1996.
Hatfield Consultants. 2016. Powell River Environmental Effects Monitoring (EEM) Cycle Seven Interpretive
Report. Prepared for Catalyst Paper Corporation. March 2016.
Health Canada. 2012. Guidelines for Canadian Recreational Water Quality, Third Edition. Water, Air and
Climate Change Bureau, Healthy Environments and Consumer Safety Branch, Health Canada, Ottawa,
Ontario. (Catalogue No H129-15/2012E).
Hodgins, D. 1989. Powell River Surface and Deep Water Effluent Dispersion Study. Prepared for Hatfield
Consultants. January 1989.
Hodgins, D. and J. Stronach. 1991. Subsurface Dispersion of Powell River Mill Effluent. Prepared for
MacMillan Bloedel Limited. September 1991.
Hourston, R. Data Products Supervisor, Ocean Sciences Division. Institute of Ocean Sciences (IOS),
Department of Fisheries and Oceans Canada (DFO). August 2017. Personal communication (e-mail)
with Robert Larson of Associated.
Lemmen, D.S., Warren, F.J., James, T.S. and Mercer Clarke, C.S.L. editors. 2016. Canada’s Marine
Coasts in a Changing Climate; Government of Canada, Ottawa, ON, 274p.
Lum, P. Manager, Environment, Catalyst Paper Corporation, Powell River Division, Paper Mill. September
2017. Personal communication (e-mail) with Robert Larson of Associated.
Opus DaytonKnight. 2015. City of Powell River Liquid Waste Management Plan - Stage 3. “Draft 8”. April
2015.
Surry, M. Program Head, Groundfish Data Unit, Science Branch, Fisheries and Oceans Canada. October
24, 2017. Personal communication (e-mail) with Robert Hoogendoorn of Associated.
Thomson, R.E. 1981. Oceanography of the British Columbia Coast. Can. Sp. Publ Fish. Aquat Sci. 56. 291
pp.
Thomson, R.E. 1994. Physical Oceanography of the Strait of Georgia-Puget Sound-Juan de Fuca Strait
system. Can. Tech. Repo. Fish. Aquat. Scie. 1948:36-100.
Wastewater Systems Effluent Regulations (SOR/2012-139). Government of Canada. Website address:
http://laws-lois.justice.gc.ca/eng/regulations/SOR-2012-139/FullText.html. Accessed August 23, 2017.


REPORT
A-1
Appendix A - Table of Concordance


\\s-bur-fs-01\projects\20172098\00_Pwll_Rvr_WWTP\Environmental_Sciences\04.02_Assessment_Reports\Appendix 1 - Table of Concordance_16Mar2018.docx
Table of Concordance – Part A: MWR Requirements for Discharges to Marine Waters
Section1 RequirementConforms to
Requirement2Notes
15 Professional certifications ü Applicable documents will be signed/sealed by qualified professionals
18 EIS ü EIS will support a registration package for the City’s Consolidated WWTP.
19 EISü
Construction/Operation [19(1)] and Receiving Environment EIS [19(2)] reports will be
submitted.
20 Receiving environment monitoring ü The planned monitoring program is described in EIS Section 7.
21 Overflow Environmental Impact Study Not applicable Not applicable. Design will provide sufficient capacity to avoid overflows.
34,35 Reliability category ü To be determined based on final Consolidated WWTP design.
51 Water quality guidelinesü
Combination of treatment and diffuser design will result in applicable water quality
guidelines being met at edge of Initial Dilution Zone (IDZ).
52(1) Disinfectionü
Disinfection will be used to meet recreational use water quality guidelines at edge of
IDZ and shellfish guidelines at foreshore.
52(2) Disinfection method ü Chlorine will not be used for disinfection.
53-60 General monitoring ü Monitoring will be carried out as required by Sections 53-60.
91 IDZ edge locationü
The diffuser will be at least 400 m (i.e. 100 m IDZ plus 300 m buffer) from any shellfish
harvest areas, intakes, beaches, and recreational boat launches.
92 IDZ definitionü
The edge of the IDZ will be located outside of the shallow water zone and extends
horizontally 100 m from the first and last diffuser ports. .
94(1)Applicable effluent quality
requirements üTable 11 applies because the projected maximum daily flow will exceed 50 m3/day.
94(2-5) Dilution ratio and effluent quality ü The minimum dilution ratio is 100:1.
96 Allowable fecal coliform counts
ü
Edge of IDZ is in shellfish bearing waters. Despite the area being closed to commercial
fisheries, disinfection will be designed to achieve geometric mean for fecal coliforms of
≤14 counts/100 mL.
99 Outfall and diffuser design ü All requirements of Section 99 will be incorporated into outfall and diffuser design.
100(2)c D1 at least 10 m, D2 at least 30 mü
D1 and D2 determined by EIS and computer modelling. D2 currently designed to be at
least 40 m from mean low water.
1 Only Sections specific to a marine discharge or of particular interest to the City of Powell River are listed. The City of Powell River intends to comply with the applicable MWRsections.2 The symbol “ü” indicates conformance with MWR. “S” indicates that a substitution will be requested from the Director.
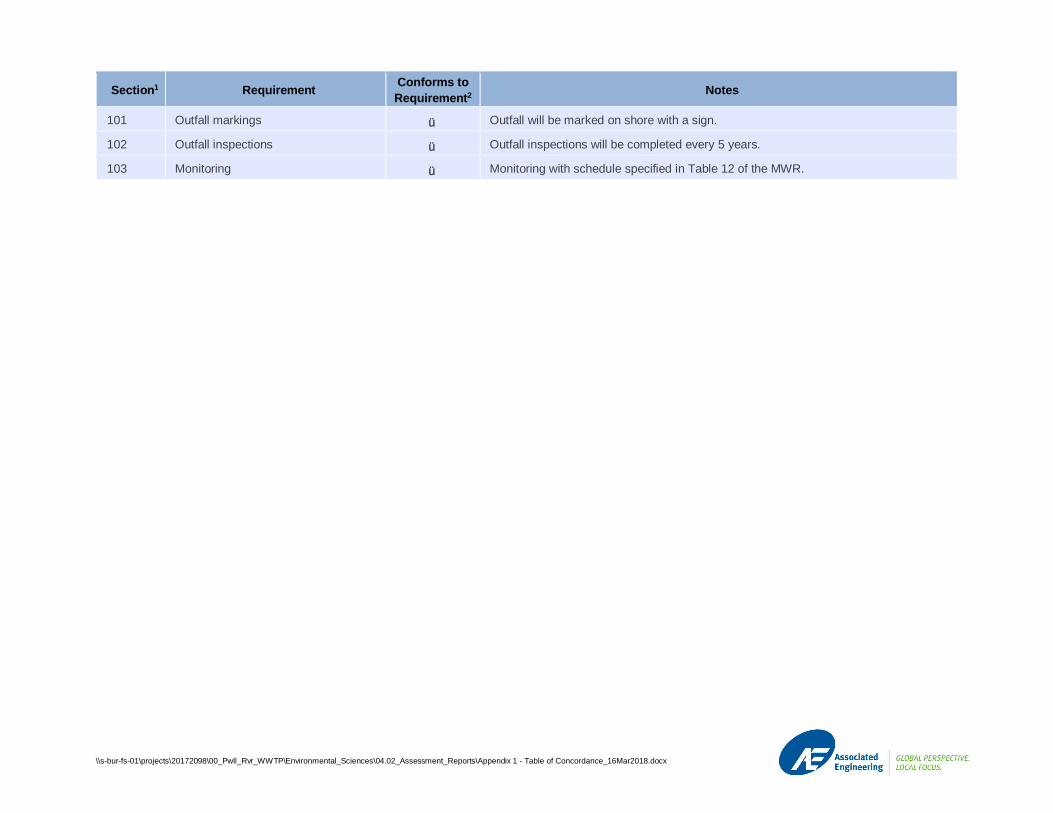
\\s-bur-fs-01\projects\20172098\00_Pwll_Rvr_WWTP\Environmental_Sciences\04.02_Assessment_Reports\Appendix 1 - Table of Concordance_16Mar2018.docx
Section1 RequirementConforms to
Requirement2Notes
101 Outfall markings ü Outfall will be marked on shore with a sign.
102 Outfall inspections ü Outfall inspections will be completed every 5 years.
103 Monitoring ü Monitoring with schedule specified in Table 12 of the MWR.

\\s-bur-fs-01\projects\20172098\00_Pwll_Rvr_WWTP\Environmental_Sciences\04.02_Assessment_Reports\Appendix 1 - Table of Concordance_16Mar2018.docx
Table of Concordance – Part B: Environmental Impact Study Guidelines
(Ministry of Environment, Land & Parks 2000).
Section3 RequirementConforms to
Requirement4Notes
3.1 Effluent disinfection ü EIS confirms that disinfection will be required to meet shellfish bearing water guidelines.
3.2 Toxicity
Based on confirmation of final design flows, EIS team to confirm if toxicity monitoring is
required as per Section 58 and Table 2 of the MWR. Will likely require sampling 6
times/year with testing for acute lethality to rainbow trout.
3.3 Reclaimed water Not applicable
3.4 Discharge to WaterSee Part C
EIS components 3.41 to 3.43 addressed according to EIS components listed in Table
Part C (below).
3.5 Discharge to Ground Not applicable
3.6 Advanced treatmentThe need for advanced treatment will be considered once the final design flows are
confirmed.
3.7 Design & Construction
To be addressed in separate document as per Section 19(1) of EIS. It will follow
acceptance of receiving environment EIS [Section 19(2)] and be submitted no later than
90 days before construction begins.
3.8 Monitoring ü General study design presented in EIS Section 7.
3.9 Combined sewer overflows ü Consolidated WWTP will be designed to treat wet weather flows.
4.0 Qualified professionals
ü
Study team includes registered professionals with backgrounds in fisheries biology, water
quality, aquatic toxicology, vegetation/wetland ecology, hydrology, physical oceanography,
and environmental engineering.
5.21Stage 1 (Part 1) – Assessment of
Available Data.
ü
· EIS report addresses all Tasks 1 through 9 listed in Guideline Section 5.1, based on
outfall location considering the information specified in Guidelines 5.21 Task 2, and
known fisheries resources, shellfish areas, recreational uses, and commercial foreshore
uses.
· EIS estimates receiving water quality at edge of IDZ using the Visual Plumes model (a
model listed as acceptable in Appendix 4 of Guideline).
· The recommended pre-discharge monitoring program is presented in the EIS Section 7.
3 Only Sections specific to a marine discharge or of particular interest to the City of Powell River are listed. The City of Powell River intends to be in compliance with theapplicable MWR sections.4 The symbol “ü” indicates conformance with MWR. “S” indicates that a substitution will be requested from the Director.

\\s-bur-fs-01\projects\20172098\00_Pwll_Rvr_WWTP\Environmental_Sciences\04.02_Assessment_Reports\Appendix 1 - Table of Concordance_16Mar2018.docx
Section3 RequirementConforms to
Requirement4Notes
5.22Stage 2 (Part 2) – Site Specific Data
Evaluation.
The EIS work included a detailed analysis of available historical and local current, dye
dispersion, and effluent water quality data. Further current and profile data collection is not
recommended. The proposed pre-discharge monitoring includes water and sediment
sampling upstream and downstream of the planned outfall site. At present, the City plans to
initiate the pre-discharge monitoring in late summer 2018. Late summer/autumn is the
recommended time for receiving environment monitoring at Powell River based on the
combination of low river flows and warm water.

\\s-bur-fs-01\projects\20172098\00_Pwll_Rvr_WWTP\Environmental_Sciences\04.02_Assessment_Reports\Appendix 1 - Table of Concordance_16Mar2018.docx
Table of Concordance – Part C: Details on Section 3.4 of EIS Guidelines
Section5 RequirementConforms to
Requirement6Notes
3.41(1) Characterize bathymetry ü Figures 1-1 and 5-1. Bathymetry is also available from a marine chart.
3.41(2)Assess currents and seasonal or other
stratification
üEIS, Section 4.2.
3.41(3)Calculate minimum available dilution in
receiving environment Not applicable
3.41(4)Select optimum outfall location and
characteristics
üEIS Section 5.2.
3.41(5)Effluent plume modeling and dilution
calculations
üEIS Section 6.
3.41(6) Assess flushing action Not applicable According to MSR Section 1, applies to embayed marine waters
3.41(7) Other discharges to the water body ü EIS Section 3.
3.4.1(8) Lake limnology Not applicable
3.42(1) Commercial shellfish inventory ü EIS Section 4.6.1
3.42(2)Aquatic life and fisheries habitat
inventory üEIS, Section 4.6.1.
3.42(3) Benthic invertebrate assessmentü
Baseline data available from Catalyst’s EEM. Benthic invertebrate surveys planned for
pre-discharge monitoring.
3.43(1) Discharge quantity and quality ü EIS Section 2.
3.43(2) Nutrient loading calculations ü EIS Section 6.5.3
3.43(3) Receiving water assimilative capacity ü Modelling considered range of tidal conditions.
3.43(4) Existing receiving water quality ü Part of pre-discharge monitoring.
3.43(5)Pre-discharge conditions of sediment
biota and chemistry üPart of pre-discharge monitoring.
3.43(6) Receiving water quality at edge of IDZ ü EIS considered a range of seasonal conditions.
5 Only Sections specific to a marine discharge or of particular interest to the City of Powell River are listed. The City of Powell River intends to comply with the applicable MWRsections.6 The symbol “ü” indicates conformance with MWR. “S” indicates that a substitution will be requested from the Director.