report q4 2013 - aker bppsa audit, covering material handling and working environment on the ivar...
TRANSCRIPT

Report Q4 2013Trondheim, February 19, 2014www.detnor.no Q4

2

3
3
Table of contentsFourth quarter summary ....................................................................................4 Summary of financial results and operating performance .................................5 Financials...........................................................................................................6 Field performance and oil prices........................................................................6 Health, safety and the environment...................................................................6 PDO approved projects .....................................................................................6 Other projects ....................................................................................................7 Exploration .........................................................................................................7 Business development.......................................................................................7 Events after the quarter .....................................................................................7 Outlook...............................................................................................................8 Financial Statements .........................................................................................9

44
Report for the fourth quarter 2013
Fourth quarter summary(All figures in brackets apply to the fourth quarter 2012)
Det norske oljeselskap ASA (“Det norske” or “the company”) reported revenues of NOK 254 (117) million in the fourth quarter. Exploration expenses amounted to NOK 544 (195) million, contributing to an operating loss of NOK 1,182 (358) million. Net financial expenses were NOK 106 (14) million.Net loss for the fourth quarter was NOK 329 (47) million, following a tax income of NOK 959 (325) million.
Det norske’s four producing assets – Jette, Atla, Varg and Jotun – produced 4,328 boepd on average during the quarter, whereof Jette accounted for 63 percent. The average realized oil price was USD 109 (110) per barrel.
The Ivar Aasen development project, where Det norske is operator with a 35 percent interest, is on schedule. First steel was cut and construction commenced both at the yard at Arbatax in Sardinia, where Saipem is buildingthe steel jacket, and in Singapore, where SMOE is constructing the topside.
On the Johan Sverdrup project, the pre-unit operator Statoil presented their recommended Phase 1 development concept in late 2013. After the close of the quarter, the formal partner decision to pass Decision Gate 2 (DG2) was made. The plan is to submit a Plan for Development and Operations (PDO) that can be approved by the Norwegian Parliament in the first half of 2015, with first oil production in late 2019. The pre-unit operator Statoil has estimated gross field contingent resources in the range of 1,800 to 2,900 million barrels of oil equivalents.
In the fourth quarter, Det norske participated in a discovery at Askja (PL 272).Two targets gave good results and preliminary estimates of the resources are between 19 and 44 million barrels of oil equivalents (boe). Det norske is also a licensee in the adjacent Krafla discovery, and a joint development with Askja may provide between 69 and 124 million boe. The Mantra prospect in PL 551 was completed in the fourth quarter, but came in dry.
Key events during the fourth quarter 2013
On 24 December, Det norske announced that exploration well 31/3-4on the Mantra prospect on PL 551 in the North Sea was dry.
On 20 December, Det norske provided an update to the market on the progress of the Johan Sverdrup project.
On 19 December, Det norske sold 10 percent interest in PL 659 in the Barents Sea, where the drilling on the Langlitinden prospect is ongoing. Det norske is the operator and will hold 20 percent in the licence following the transaction.
On 4 November, Det norske confirmed – as partner in PL 272 with a 25 percent interest – the presence of hydrocarbons in exploration well 30/11-9 S on the Askja prospect.
On 8 October, Karl Johnny Hersvik was appointed as the new Chief Executive Officer of Det norske. He comes from the position as Senior Vice President of Statoil’s Research and development division.
Key events after the quarter
On 13 February, pre unit operator Statoil provided an update on the concept selection and DG2 for Johan Sverdrup. The field will be developed in multiple phases, and the production capacity in the first phase will be between 315,000 and 380,000 barrels of oil equivalents per day.
On 21 January, Det norske announced that Gro G. Haatvedt had been appointed as the new Senior Vice President Exploration in Det norske. She comes from the job as SVP Exploration for the NCS in Statoil.
On 21 January, Det norske was awarded six new licenses in the APA 2013, of which two as operator.
On 2 January, Det norske announced oil discoveries in two targets at Askja in PL 272. Exploration well 30/11-9 S encountered a 90 metre gas column and appraisal well 30/11-9 A encountered a 40 metre oil column.

5
5
Summary of financial results and operating performance
MNOK= NOK million Q4 13 Q3 13 Q2 13 Q1 13 Q4 12 2013 2012
Jette (boepd), 70% 2 710 4 378 3 594 0 0 2 683 0
Atla (boepd), 10% 1 031 981 1 446 1 253 2 070 1 177 513
Varg (boepd), 5% 412 377 398 425 395 403 556
Glitne (boepd), 10% 0 0 0 43 75 11 174
Enoch (boepd), 2% 0 0 0 0 0 0 4
Jotun Unit (boepd), 7% 175 204 175 209 231 191 210
Total production (boepd) 4 328 5 940 5 613 1 929 2 771 4 463 1 458
Oil and gas production (Kboe) 398 547 511 174 255 1 629 545
Oil price realised (USD/barrel) 109 112 103 112 110 107 115
Operating revenues (MNOK) 254 324 286 80 117 944 332
Cash flow from production (MNOK) 151 269 227 37 40 684 114
Exploration expenses (MNOK) 544 588 271 234 195 1 637 1 609
Total exploration expenditures (expensed and capitalised) (MNOK) 400 581 373 306 375 1 659 1 656
Operating loss (MNOK) -1 182 -518 -277 -251 -358 -2 227 -3 843
Net loss for the period (MNOK) -329 -158 -41 -20 -47 -548 -957
No of licences (operatorships) 80 (33) 74 (30) 72 (30) 69 (28) 67 (26) 80 (33) 67 (26)

6
6
FinancialsFourth quarter accountsOperating revenues in the fourth quarter was NOK 254 (117) million. The main cause of increase is that Jette has commenced production during 2013.The production increased by 56 percent from 2,771 barrels of oil equivalents per day (boepd) in the fourth quarter 2012 to 4,328 boepd this quarter. Jette accounted for 2,710 (0) boepd and Atla for 1,031 (2,070) boepd.
Exploration expenses amounted to NOK 544 (195) million. The company has during the quarter expensed all capitalized costs related to the Grevlingdiscovery in PL 038D with NOK 316 million and also expensed costs related to the Mantra well in PL 551 incurred in the fourth quarter 2013.
The operating loss increased to NOK 1,182 (358) million, mainly due to impairment charges on several producing licenses, whereof Jette accounted for NOK 349 million. Net financial expenses in the fourth quarter amounted to NOK 106 (14) million.
The net loss for the period was NOK 329 (47) million after a tax income of NOK 959 (325) million.
Net cash flow from operating activities was NOK 920 (1,167) million and included tax refund of NOK 1,318 (1,443) million. Net cash flow from investment activities amounted to NOK -635 (-1,031) million, largely as a result of exploration expenses and investments in fields under development. Net cash flow from financing activities totalled NOK 207 (284) million as the company issued new debt and repaid existing debt.
The company’s cash and cash equivalents amounted to NOK 1,709 (1,154)million as of 31 December. Tax receivables for disbursement in December 2014 amounted to NOK 1,411 (1,274) million.
The equity ratio at the end of the fourth quarter 2013 was reduced to 30 (45)percent. Discoveries and fields under development contributed to a total asset balance of NOK 10,541 (8,364) million as of 31 December 2013.
Field performance and oil pricesDet norske produced 398,180 barrels of oil equivalents (boe) in the fourthquarter of 2013. This corresponds to 4,328 (2,771) boepd.
The average realized oil price was USD 109 (110) per barrel, while gas revenues were recognized at market value of NOK 2.3 (2.3) per standard cubic metre (scm).
Jette came on stream in May and produced 2,710 boepd net on average in the fourth quarter, accounting for 63 percent of total production. Operations on Jette have been stable during the fourth quarter, but the production level is slowly declining. Jette resources have been downward revised, and as a result an impairment charge of NOK 349 million has been made in the fourthquarter.
Atla produced 1,031 (2,070) boepd net on average in the fourth quarter and accounted for 24 percent of the total production. Atla’s production was stable in October and December, but production was lower than expected in the second half of November due to some technical problems on Heimdal.
Varg produced 412 (395) boepd net to Det norske in the fourth quarter, or 10 percent of total production. Production has been stable in the fourth quarter.
The average production rate on Jotun of 175 boepd net to Det norske represented about 4 percent of total production. Production remained stable during the quarter.
Health, safety and the environmentNo serious incidents were reported from Det norske’s operations in the fourth quarter. In December a lost time injury occurred in Det norske’s activities,following a minor injury due to a person that slipped and fell at a yard on contract for Det norske. The Petroleum Safety Authority (PSA) performed anaudit of technical and operational barriers on Ivar Aasen in the fourth quarter,pointing out three deviations and eight areas for improvement. A previous PSA audit, covering material handling and working environment on the Ivar Aasen platform, was closed by the PSA in November.
PDO approved projectsIvar Aasen – PL 001B/242/028B (35% operator)The Ivar Aasen field development project is progressing according to schedule towards planned start up in Q4 2016.

7
7
Ivar Aasen is being developed with a steel jacket platform. The topsides will include living quarters and a processing facility for first stage separation. The detailed engineering for the topside is being carried out by Mustang Engineering outside London, UK. First steel cutting for both jacket and topsides fabrication was performed early November. The fabrication of the topsides’ primary structural steel members commenced in Indonesia and Singapore in the fourth quarter.
In December 2012, the partners in PL 457 encountered oil in the 16/1-16 and 16/1-16A wells. PL 457 is located adjacent and to the east of Ivar Aasen. The Ivar Aasen partners have signed a pre-unitization agreement with the partners in PL 457. The agreement allows for a coordinated development of the discoveries and sets out principles for the work processes towards an initial unitization split. The unitization agreement is to be finalized by June 2014. This will reduce Det norske’s total ownership in the enlarged field.
Gina Krog – PL 029B/029C/048/303 (3.3% partner)The Gina Krog field is progressing according to schedule with planned start up in 2017.
The development plan for the field includes a steel jacket and integratedtopside with living quarters and processing facilities. Oil from Gina Krog will be exported to the markets with shuttle tankers while exit for the gas is via the Sleipner platform.
Other projectsJohan Sverdrup – PL 265 (20% partner) & PL 502 (22.22% partner)The pre-unit operator Statoil has recommended a concept for the first phase. Statoil communicated gross field recoverable contingent resources between 1,800 and 2,900 million barrels oil equivalents. In February 2014, the formal partner decision to pass Decision Gate 2 (DG2) was made and the selected concept was communicated to the public. The selected concept is further described in the section “Events after the quarter”.
ExplorationAskja – PL 272 (25% partner)In September, the semi submersible drilling rig Ocean Vanguard spudded exploration well 30/11-9S on the Askja prospect, south of the Oseberg field. After encountering a 90 metre gas column in the lower part of the Heather
formation and in the upper to middle part of Tarbert in well 30/11-9S, another prospect was tested in appraisal well 30/11-9A. This well encountered oil in a 40 metre net column in the lower part of the Heather formation and the upper part of Tarbert.
Preliminary estimates indicate volumes between 19 and 44 million barrels of oil equivalents. Askja is located adjacent to the Krafla discovery, containing between 50 and 80 million barrels of oil equivalents, and a joint development may provide between 69 and 124 million barrels of oil equivalents.
Mantra – PL 551 (20% partner)In December, exploration well 31/3-4 on the Mantra prospect offshore Norway encountered reservoir quality sands but all intervals were water-bearing. The well was drilled by the semi-submersible rig Transocean Barents. The well has been plugged and abandoned.
Business developmentAs a part of a continuous program to optimise its exploration portfolio, Det norske relinquishes, and farms in and out of licenses on a regular basis.
In the fourth quarter, Det norske entered into an agreement with Atlantic Petroleum Norge AS concerning the sale of a 10 percent interest in PL 659 in the Barents Sea. The licence contains the Langlitinden prospect, which spudded in January 2014. Det norske is the operator and will hold 20 percent in the license following the transaction. As compensation, Atlantic Petroleum will carry part of Det norske’s drilling costs related to the exploration well. The agreement is subject to approval by the authorities.
Events after the quarterJohan Sverdrup concept selectionStatoil, as the pre unit operator on the Johan Sverdrup field, made the key parts of the concept selection known to the public in February 2014, as Decision Gate 2 (DG2) was passed in the Johan Sverdrup pre-unit partnership.
The Johan Sverdrup field will be developed in multiple phases. For the first phase, the Plan for Development and Operations (PDO) will comprise the establishment of a field centre, composed of four platforms: a processing platform, a well head and drilling platform, a riser, utilities and export platform
8
8
and a living quarter platform, all steel jackets. In addition, three subsea installations for water injection will be installed. The production capacity in the first phase will be between 315,000 and 380,000 barrels of oil equivalents per day.
Statoil communicated gross field recoverable contingent resources between 1,800 and 2,900 million barrels oil equivalents. Preliminary estimated recovery factor is about 60%. However, the ambition is to increase this towards 70%. Total investments for the first phase are estimated to be between NOK 100 and 120 billion. Phase 1 has capacity to produce more than 70% of the resources. The estimate includes all investments in platforms, subsea installations, wells, pipelines and power from shore, including contingencies and market adjustment allowances. The partnership works continuously to reduce the level of investments in the first phase.
The first phase development is robust and has flexibility to secure an optimal development of the total field resources, including IOR/EOR, as well as potential 3rd party production.
The concept for future phases will be decided in a separate process after the phase 1 PDO. Full field production capacity is expected to be in the range 550,000 to 650,000 barrels of oil equivalents. From both a technical and commercial perspective, the expected life of the Johan Sverdrup field is approximately 50 years.
The oil and gas from the Johan Sverdrup will be exported to shore via dedicated pipelines. The oil will be transported to the Mongstad terminal in the county of Hordaland, whereas the gas will be transported via the Statpipe line to Kårstø in the county of Rogaland for processing and onward transportation.
The plan is to submit a Johan Sverdrup PDO to the authorities by the first quarter of 2015. The Johan Sverdrup field spans across three licenses, and aunitization negotiation process will take place between the Johan Sverdrup licensees. The unit agreement needs to be closed before the PDO can be handled by the authorities.
Exploration drillingIn February, the company reported that it, as operator, had confirmed hydrocarbon shows on Langlitinden in PL 659.
In the Awards in Predefined Areas (APA) 2013, Det norske was awarded six new licenses, of which two as operator. All six licenses are located in the North Sea.
Changes in managementIn January, Gro Haatvedt accepted an offer to become Senior Vice PresidentExploration in Det norske oljeselskap ASA. Haatvedt was previously Senior Vice President for Exploration on the Norwegian Continental Shelf in Statoil. Time of taking office is yet to be decided, but will be no later than August 2014.
OutlookIvar Aasen and Johan Sverdrup are the most important field development projects for Det norske. Both these projects are progressing satisfactory. In 2014, Det norske will take part in unitisation negotiations both for the Ivar Aasen field and the Johan Sverdrup field.
Det norske is targeting strong production growth. This will require large investments. Over the past two years, the company has strengthened its equity position and in recent months it has put in place both a NOK 1.9 billion unsecured bond and a USD 1 billion bank facility. The board has taken these steps in order to secure a solid financial basis for the field development projects and will continue to work on obtaining an optimal financing structure for the company.
Based on current plans, Det norske will participate in around 10 exploration wells through 2014.
Det norske carries out significant offshore operations on the NCS. The company is also operating the Ivar Aasen field development project, and is a partner in the Johan Sverdrup and Gina Krog field developments. These operations activities involve thousands of workers in different countries on different continents. All our activities entail risk. Risk can never be eliminated, but it can be minimized through careful handling and good management. Det norske recognizes its responsibility to the safety of people and the environment, and is devoted to spend time and resources to meet all regulations and the highest HSE standards in the oil industry.

9

1011
STATEMENT OF INCOME TOTAL COMPREHENSIVE INCOME (Unaudited) (Audited) (Unaudited) (Audited) (Unaudited) (Audited) (Unaudited) (Audited)
(All figures in NOK 1,000) Note 2013 2012 2013 2012 (All figures in NOK 1,000) 2013 2012* 2013 2012*
Petroleum revenues 2 248 716 113 946 933 162 325 093 Profit/loss for the period -328 647 -47 264 -548 600 -957 252Other operating revenues 2 5 636 2 851 10 719 7 351
Items which not will be Total operating revenues 254 353 116 797 943 881 332 444 reclassified over profit and loss:
Exploration expenses 3 544 400 194 924 1 637 063 1 609 314 Taxes relating to OCI -3 170 1 333 -3 170 5 331Production costs 97 602 74 027 249 619 210 962Payroll and payroll-related expenses 6 3 854 267 38 025 11 000 -327 752 -47 640 -547 706 -958 756Depreciation 5 124 021 56 505 470 529 111 687Net impairment losses 4,5 657 597 127 155 666 135 2 149 653 *see note 1 for information about comparative figures.Other operating expenses 6 8 811 21 995 109 886 82 799
Total operating expenses 1 436 285 474 873 3 171 256 4 175 414
Operating profit/loss -1 181 933 -358 076 -2 227 375 -3 842 970
Interest income 7 13 063 13 630 40 750 54 997Other financial income 7 15 838 26 667 80 567 68 399Interest expenses 7 103 397 35 084 301 834 128 250Other financial expenses 7 31 355 18 977 137 435 101 050
Net financial items -105 851 -13 763 -317 952 -105 906
Profit/loss before taxes -1 287 784 -371 839 -2 545 327 -3 948 876
Taxes (+)/tax income (-) 8 -959 137 -324 575 -1 996 727 -2 991 624
Net profit/loss -328 647 -47 264 -548 600 -957 252
Weighted average no. of shares outstanding 140 707 363 136 581 048 140 707 363 128 649 729Weighted average no. of shares fully diluted 140 707 363 136 581 048 140 707 363 128 649 729Earnings/(loss) after tax per share -2,34 -0,35 -3,90 -7,44 Earnings/(loss) after tax per share fully diluted -2,34 -0,35 -3,90 -7,44
Total comprehensive income in period
Q4 1.1 - 31.12 1.1 - 31.12Q4
Actuarial gain/loss pension plan 4 064 4 064 -6 834-1 709
1112
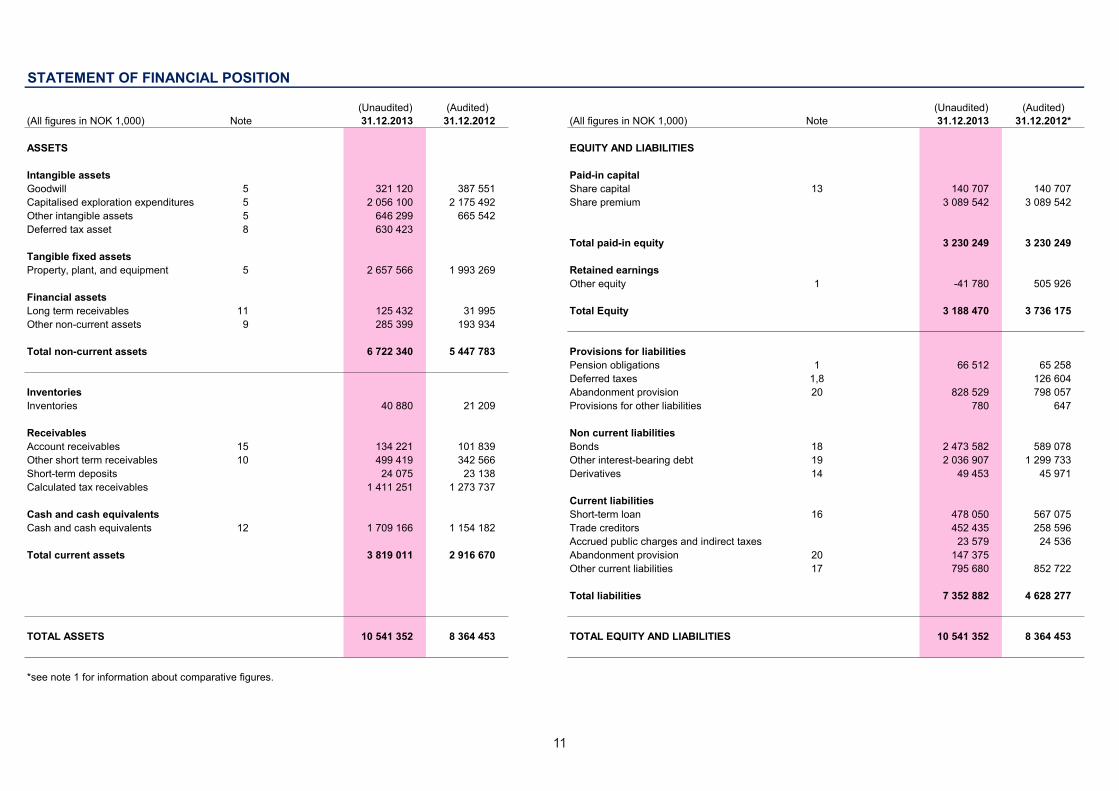
STATEMENT OF FINANCIAL POSITION
(All figures in NOK 1,000) Note 31.12.2013 31.12.2012 (All figures in NOK 1,000) Note 31.12.2013 31.12.2012*
ASSETS EQUITY AND LIABILITIES
Intangible assets Paid-in capitalGoodwill 5 321 120 387 551 Share capital 13 140 707 140 707Capitalised exploration expenditures 5 2 056 100 2 175 492 Share premium 3 089 542 3 089 542Other intangible assets 5 646 299 665 542Deferred tax asset 8 630 423
Total paid-in equity 3 230 249 3 230 249Tangible fixed assetsProperty, plant, and equipment 5 2 657 566 1 993 269 Retained earnings
Other equity 1 -41 780 505 926Financial assetsLong term receivables 11 125 432 31 995 Total Equity 3 188 470 3 736 175Other non-current assets 9 285 399 193 934
Total non-current assets 6 722 340 5 447 783 Provisions for liabilitiesPension obligations 1 66 512 65 258Deferred taxes 1,8 126 604
Inventories Abandonment provision 20 828 529 798 057Inventories 40 880 21 209 Provisions for other liabilities 780 647
Receivables Non current liabilitiesAccount receivables 15 134 221 101 839 Bonds 18 2 473 582 589 078Other short term receivables 10 499 419 342 566 Other interest-bearing debt 19 2 036 907 1 299 733Short-term deposits 24 075 23 138 Derivatives 14 49 453 45 971Calculated tax receivables 1 411 251 1 273 737
Current liabilitiesCash and cash equivalents Short-term loan 16 478 050 567 075Cash and cash equivalents 12 1 709 166 1 154 182 Trade creditors 452 435 258 596
Accrued public charges and indirect taxes 23 579 24 536Total current assets 3 819 011 2 916 670 Abandonment provision 20 147 375
Other current liabilities 17 795 680 852 722
Total liabilities 7 352 882 4 628 277
TOTAL ASSETS 10 541 352 8 364 453 TOTAL EQUITY AND LIABILITIES 10 541 352 8 364 453
*see note 1 for information about comparative figures.
(Unaudited)(Unaudited) (Audited) (Audited)

1213
STATEMENT OF CHANGES IN EQUITY (Unaudited)
(All figures in NOK 1,000)
Equity as of 31.12.2011 127 916 2 083 271 1 465 364 3 676 551
Pension adjustment, see note 1 -684 -684Equity as of 31.12.2011 (adjusted) 127 916 2 083 271 1 464 680 3 675 867
Private placement 12 792 1 006 271 1 019 063Profit/loss for the period 1.1.2012 - 31.12.2012 -957 251 -957 251Pension adjustment, see note 1 -1 504 -1 504Equity as of 31.12.2012 140 707 3 089 542 505 926 3 736 175
Profit/loss for the period 1.1.2013 - 31.12.2013 -547 706 -547 706Equity as of 31.12.2013 140 707 3 089 542 -41 780 3 188 470
Retained earnings Total equityShare capital Share premium

1314
STATEMENT OF CASH FLOW (Unaudited)
(All figures in NOK 1,000) Note 2013 2012 2013 2012
Cash flow from operating activitiesProfit/loss before taxes -1 287 784 -371 839 -2 545 327 -3 948 876Taxes paid during the period -26 585 -26 585Tax refund during the period 1 318 430 1 443 140 1 318 430 1 443 140Depreciation 5 124 021 56 505 470 529 111 687Net impairment losses 4 657 597 127 155 666 135 2 149 653Accretion expenses 20 11 083 4 502 42 765 17 519Reversal of tax item related to shortfall value of purchase price allocation (PPA) 3 -57 000Losses on sale of license -2 500 734 13 461Changes in derivatives 7 9 310 1 174 3 174 44 847Amortization of interest expenses and arrangement fee 7 9 162 14 763 88 458 39 576Expensed capitalized dry wells 3,5 394 367 126 346 1 150 541 1 116 403Changes in inventories, accounts payable and receivables 120 777 -258 309 141 786 44 467Changes in other current balance sheet items -410 386 26 510 -394 934 444 144Net cash flow from operating activities 919 992 1 167 448 915 707 1 419 020 Cash flow from investment activitiesPayment for removal and decommissioning of oil fields 20 -16 176 12 632 -36 739 -678Disbursements on investments in fixed assets 5 -365 069 -737 426 -1 495 709 -2 874 627Disbursements on investments in capitalised exploration expenditures and other intangible assets 5 -255 230 -309 159 -1 358 941 -1 114 277Sale/farmout of tangible fixed assets and licenses 983 2 575 86 472 414 336Net cash flow from investment activities -635 492 -1 031 378 -2 804 917 -3 575 247 Cash flow from financing activitiesNet equity issue 1 019 063 1 019 063Repayment of short-term debt 16 -1 200 000 -1 800 000 -1 500 000 -2 000 000Repayment of long-term debt 18,19 -600 000 -2 185 102 -600 000Proceeds from issuance of long-term debt 18,19 707 167 1 065 093 4 729 297 1 849 749Proceeds from issuance of short-term debt 16 700 000 600 000 1 400 000 2 200 000Net cash flow from financing activities 207 167 284 156 2 444 195 2 468 812 Net change in cash and cash equivalents 491 667 420 226 554 985 312 584
Cash and cash equivalents at start of period 12 1 217 500 733 957 1 154 182 841 599Cash and cash equivalents at end of period 1 709 166 1 154 182 1 709 166 1 154 182Specification of cash equivalents at end of period:Bank deposits, etc. 1 693 319 1 140 750 1 693 319 1 140 750Restricted bank deposits 15 847 13 432 15 847 13 432
12 1 709 166 1 154 182 1 709 166 1 154 182
01.01-31.12
Cash and cash equivalents at end of period
Q4
14
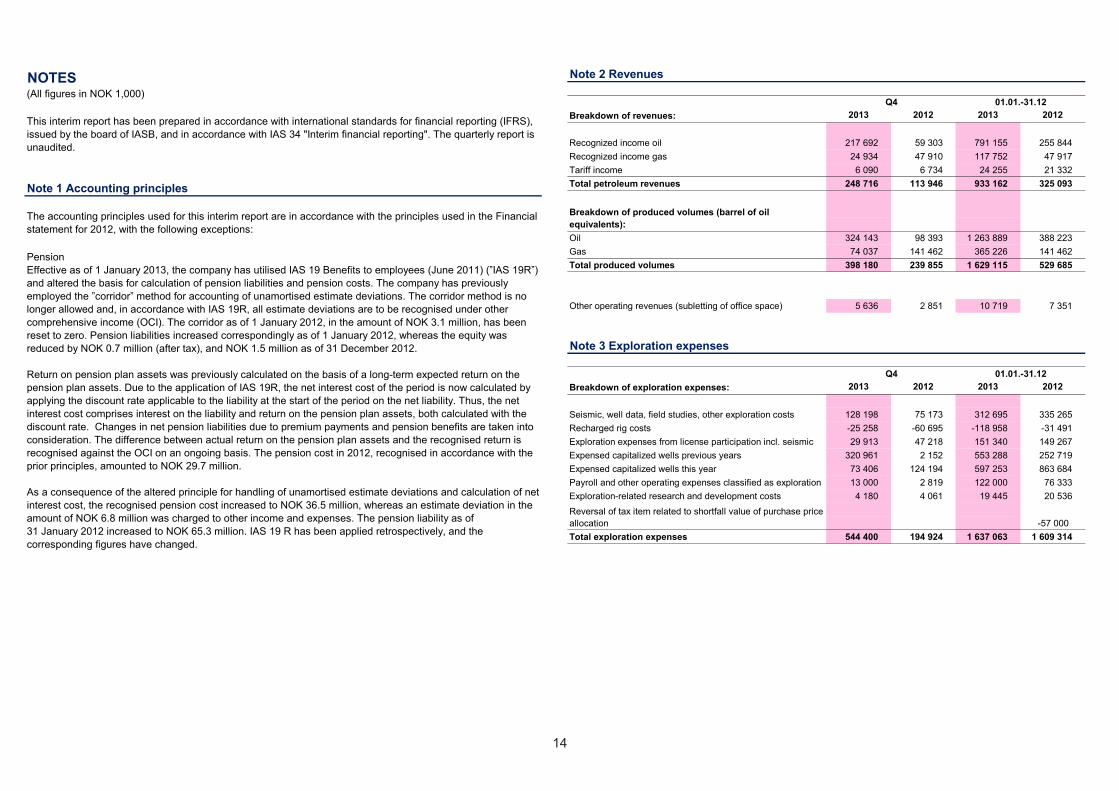
NOTES(All figures in NOK 1,000)
Note 1 Accounting principles
This interim report has been prepared in accordance with international standards for financial reporting (IFRS), issued by the board of IASB, and in accordance with IAS 34 "Interim financial reporting". The quarterly report is unaudited.
The accounting principles used for this interim report are in accordance with the principles used in the Financial statement for 2012, with the following exceptions:
PensionEffective as of 1 January 2013, the company has utilised IAS 19 Benefits to employees (June 2011) (”IAS 19R”) and altered the basis for calculation of pension liabilities and pension costs. The company has previously employed the ”corridor” method for accounting of unamortised estimate deviations. The corridor method is no longer allowed and, in accordance with IAS 19R, all estimate deviations are to be recognised under other comprehensive income (OCI). The corridor as of 1 January 2012, in the amount of NOK 3.1 million, has been reset to zero. Pension liabilities increased correspondingly as of 1 January 2012, whereas the equity was reduced by NOK 0.7 million (after tax), and NOK 1.5 million as of 31 December 2012.
Return on pension plan assets was previously calculated on the basis of a long-term expected return on the pension plan assets. Due to the application of IAS 19R, the net interest cost of the period is now calculated by applying the discount rate applicable to the liability at the start of the period on the net liability. Thus, the net interest cost comprises interest on the liability and return on the pension plan assets, both calculated with the discount rate. Changes in net pension liabilities due to premium payments and pension benefits are taken into consideration. The difference between actual return on the pension plan assets and the recognised return is recognised against the OCI on an ongoing basis. The pension cost in 2012, recognised in accordance with the prior principles, amounted to NOK 29.7 million.
As a consequence of the altered principle for handling of unamortised estimate deviations and calculation of net interest cost, the recognised pension cost increased to NOK 36.5 million, whereas an estimate deviation in the amount of NOK 6.8 million was charged to other income and expenses. The pension liability as of 31 January 2012 increased to NOK 65.3 million. IAS 19 R has been applied retrospectively, and the corresponding figures have changed.
Note 2 Revenues
Breakdown of revenues: 2013 2012 2013 2012
Recognized income oil 217 692 59 303 791 155 255 844Recognized income gas 24 934 47 910 117 752 47 917Tariff income 6 090 6 734 24 255 21 332Total petroleum revenues 248 716 113 946 933 162 325 093
Oil 324 143 98 393 1 263 889 388 223Gas 74 037 141 462 365 226 141 462Total produced volumes 398 180 239 855 1 629 115 529 685
Other operating revenues (subletting of office space) 5 636 2 851 10 719 7 351
Note 3 Exploration expenses
Breakdown of exploration expenses: 2013 2012 2013 2012
Seismic, well data, field studies, other exploration costs 128 198 75 173 312 695 335 265Recharged rig costs -25 258 -60 695 -118 958 -31 491Exploration expenses from license participation incl. seismic 29 913 47 218 151 340 149 267Expensed capitalized wells previous years 320 961 2 152 553 288 252 719Expensed capitalized wells this year 73 406 124 194 597 253 863 684Payroll and other operating expenses classified as exploration 13 000 2 819 122 000 76 333Exploration-related research and development costs 4 180 4 061 19 445 20 536
Total exploration expenses 544 400 194 924 1 637 063 1 609 314
01.01.-31.12Q4
Q4
-57 000
01.01.-31.12
Reversal of tax item related to shortfall value of purchase price allocation
Breakdown of produced volumes (barrel of oil equivalents):

15
Note 4 Impairments
* discount rate of 10.7 percent nominal after tax (Weighted average cost of capital - WACC)* a long term inflation of 2.5 percent* a long term exchange rate of NOK/USD 6.00
The following nominal oil price assumptions are applied:Year 2014 2015 2016 2017Oil price average USD 106 98 90 84
For producing licenses and licenses in the development phase, recoverable amount is estimated based on discounted future after tax cash flows. Future cash flows are calculated on the basis of expected production profiles and estimated proven and probable remaining reserves. The following assumptions have been applied:
An impairment test of goodwill and pertaining licences was carried out in the fourth quarter in accordance with the company’s accounting principles. The test was carried out as of 31 December 2013. Goodwill is capitalised as a consequence of the requirement in IFRS 3 to make provision for deferred tax in connection with a business combination, even if the transactions are made on an "after-tax" basis as a result of a section 10 decision in line with applicable petroleum taxation. The offsetting entry to deferred tax is goodwill.
is assessed for each well. Impairment are recognised when the book value of an asset or a cash flow-generating unit exceeds the recoverable amount. The recoverable amount is the higher of the asset’s net sales value and utility value. In the assessment of the value in use, the expected future cash flow is discounted to the net present value by applying a discount rate after tax that reflects the current market valuation of the time value and the specific risk related to the asset.
The valuation unit used for assessment of impairment will depend on the lowest level at which it is possible to identify cash flows that are independent of cash flows from other groups of fixed assets. For oil and gas assets, this is carried out at the field or licence level. The loss in value for capitalised exploration costs
* oil prices are based on forward curve, and it is expected that 2017 will be the final year of production for fields that are currently under production.
In the fourth quarter four of the company's producing fields were impaired. The impairment was mainly due to reduction in reserves and increase in the estimate of the abandonment provision. The remaining impairments for 2013 are related to exploration licences that have been or are in the process of being relinqushed.
The following impairments have been recorded:
2013 2012 2013 2012
Impairment of tangible fixed assets 564 663 123 501 564 663 1 963 351Impairment of other intangible assets/licence rights 111 058 3 863 124 694 226 194Impairment of goodwill 63 082 1 328 66 430 135 062Deferred tax -81 206 -1 536 -89 653 -174 955Total impairments 657 597 127 155 666 135 2 149 653
See note 5 for a breakdown of impairment charges.
When a license is sold or relinquished and the company previously has accounted for deferred taxes and goodwill from a business combination, both goodwill and deferred taxes will be included in the calculation of gains and losses. In assessing a potential impairment, a similar assumption is made and goodwill and deferred taxes are evaluated together with the value of the corresponding license.
Q4 01.01.-31.12

16
Note 5 Tangible assets and intangible assets
Intangible assets Software Total Goodwill
Book value 31.12.2012 661 643 3 899 665 542 2 175 492 387 551
Acquisition cost 31.12.2012 1 104 425 45 180 1 149 604 2 175 492 644 570Additions 118 629 1 353 119 982 1 013 006Disposals/Expensed dry wells 467 467 973 352Reclassification -12 984Acquisition cost 30.09.2013 1 222 588 46 533 1 269 121 2 202 163 644 570Accumulated depreciation and impairments 469 946 43 138 513 084 260 368Book value 30.09.2013 752 642 3 395 756 035 2 202 163 384 202
Acquisition cost 30.09.2013 1 222 588 46 533 1 269 121 2 202 163 644 570Additions 3 346 1 565 4 910 250 611Disposals/Expensed dry wells 396 674Relinquished licenses 323 229 323 229 178 917Acquisition cost 31.12.2013 902 705 48 098 950 803 2 056 100 465 653Accumulated depreciation and impairments 261 089 43 414 304 503 144 532Book value 31.12.2013 641 616 4 684 646 299 2 056 100 321 120
Depreciation Q4 2013 3 186 276Depreciation 1.1 - 31.12.2013 16 714 2 133Impairments in Q4 2013 111 058 63 082Impairments 1.1 - 31.12.2013 124 694 66 430
Other intangible assets
*The Ivar Aasen-field has an obligation related to investments to enable the Edvard Grieg facilites to receipt fluids from the Ivar Aasen field. These processing rights are considered as an "Intangible asset" and included with NOK 89.8 million as of 31.12.2013.
Licenses etc.*
Exploration expenditures
Book value of licences as of 31 December 2013 relates to fields in the exploration and evalation phase, development phase and production phase with NOK 399.3 million, NOK 216.7 million, and NOK 25.6 million, respectively. Corresponding figures for 2012 was NOK 499.2 million, NOK 121.5 million and NOK 40.9 million.
Software is depreciated linearly over the software's lifetime, which is three years. Licences related to fields in production is depreciated using the Unit of Production method.
Book value 31.12.2012 1 364 097 577 290 51 882 1 993 269
Acquisition cost 31.12.2012 3 163 747 1 232 675 126 062 4 522 484Additions 1 021 974 147 710 22 927 1 192 610Reclassification -2 874 622 2 887 606 12 984Acquisition cost 30.09.2013 1 311 099 4 267 992 148 989 5 728 079Accumulated depreciation and impairments 30.09.2013 2 771 026 89 313 2 860 339Book value 30.09.2013 1 311 099 1 496 965 59 676 2 867 740
Acquisition cost 30.09.2013 1 311 099 4 267 992 148 989 5 728 080Additions 336 074 131 460 7 386 474 920Acquisition cost 31.12.2013 1 647 173 4 399 452 156 375 6 203 000Accumulated depreciation and impairments 31.12.2013 3 451 496 93 938 3 545 434Book value 31.12.2013 1 647 173 947 956 62 437 2 657 567
Depreciation Q4 2013 115 934 4 625 120 559Depreciation 1.1 - 31.12.2013 431 925 19 758 451 683Impairments in Q4 2013 564 663 564 663Impairments 1.1 - 31.12.2013 -1 799 650 2 364 313 564 663
Reconciliation of depreciation in the income statement: 2013 2012 2013 2012
Depreciation of tangible fixed assets 120 559 48 319 451 683 100 751Depreciation of intangible assets 3 462 8 185 18 847 10 936Total depreciation in the income statement 124 021 56 505 470 529 111 687
See note 4 for a breakdown of total impairments in 2013.
Q4 01.01.-31.12
Fixtures and fittings, office
machinery Total Fields under development
Production facilities including
wells
Tangible fixed assets
Capitalized exploration expenditures are classified as "Fields under development" when the field enteres into the development phase. Fields under development are classified as "Production facilities" from start of production. Production facilities, including wells, are depreciated in accordance with the Unit of Production Method. Office machinery, fixtures and fittings etc. are depreciated using the straight-line method over their useful life, i.e. 3-5 years. Removal and decommisioning costs are included as "Production facilities".

17
Note 6 Payroll and other operating expenses
Breakdown of payroll expenses: 2013 2012 2013 2012
123 354 103 069 444 025 371 616
-119 500 -102 801 -406 000 -360 616Net payroll expenses 3 854 267 38 025 11 000
Breakdown of other operating expenses: 2013 2012 2013 2012
Gross other operating expenses 77 738 72 127 307 288 281 964
-68 927 -50 132 -197 403 -199 165Net other operating expenses 8 811 21 995 109 886 82 799
Note 7 Financial items
2013 2012 2013 2012
Interest income 13 063 13 630 40 750 54 997
Return on financial investments 865 988 1 628Currency gains 15 838 25 090 70 502 66 771Fair value of derivatives 712 9 077Total other financial income 15 838 26 667 80 567 68 399
Interest expenses 114 699 68 512 340 112 217 142Capitalized interest cost development projects -20 465 -48 190 -126 737 -128 468Amortized loan costs and accreation expence 9 162 14 763 88 458 39 576Total interest expenses 103 397 35 084 301 834 128 250
Currency losses 18 423 14 672 113 222 54 022Realised loss on derivatives 3 572 11 912 1 941Fair value of derivatives 9 310 3 828 12 250 44 847Decline in value of financial investments 50 478 50 240Total other financial expenses 31 355 18 977 137 435 101 050
Net financial items -105 851 -13 763 -317 952 -105 906
01.01.-31.12
01.01.-31.12
Gross payroll expenses
Q4
Q4
Q4
Share of payroll expenses classified as exploration, development or production expenses, and expenses invoiced to licences
Share of other operating expenses classified as exploration, development or production expenses, and expenses invoiced to licences
01.01.-31.12
Note 8 Taxes
Taxes for the period appear as follows: 2013 2012 2013 2012
Calculated current year exploration tax refund -356 222 -312 041 -1 413 159 -1 299 985Change in deferred taxes -585 897 -20 048 -567 368 -1 729 168
Prior period adjustments -17 018 7 514 -16 201 -19 472Total taxes (+) / tax income (-) -959 137 -324 575 -1 996 727 -2 991 624
Calculated tax receivables: 31.12.2013 31.12.2012
Calculated current year exploration tax refund 1 413 159 1 299 985Prior period adjustments -1 908 -26 249Total tax receivables 1 411 251 1 273 737
Deferred taxes/deferred tax asset: 31.12.2013 31.12.2012
Deferred taxes 1.1. -126 604 -2 039 627Change in deferred taxes 567 368 1 672 167Deferred tax related to change in accounting principle (see note 1) 5 331Deferred tax related to impairment and disposal of licenses 192 829 178 525Deferred tax recorded towards OCI -3 170Correction of deferred tax on excess values 57 000Total deferred taxes asset 630 423 -126 604
Tax effect of tax losses carryforward: 31.12.2013 31.12.2012
Tax losses carryforward 27 % -479 558 -325 590Tax losses carryforward 51 % -939 713 -588 853
Temporary differences of tax losses carryforward is incuded in the deferred taxes.
Q4 01.01.-31.12
Applied tax rate
57 000
A full tax calculation has been carried out in accordance with the accounting principles described in the annual report for 2012. The calculated exploration tax receivable as result of exploration activities in 2013 is recognised as a current asset in the the balance sheet. The tax refund for this item is expected to be paid in December 2014.
The tax rate for general corporate tax is changed from 28 to 27 percent from 1 January 2014. The rate for special tax is from the same date changed from 50 to 51 percent. The deferred tax / deferred tax asset is calculated with the new rates as of 31 December 2013. Also the uplift, a special income deduction in the basis for calculation of special tax (can be regarded as an extra depreciation deduction in the special tax basis), is from 5 May 2013 changed to 5.5 percent for four year, totaling 22 percent of the investment. Before this date the uplift was 7.5 percent for four year, with a total of 30 percent of the investment.
Reversal of tax item related to shorfall value of purchase price allocation (PPA), accounted as exploration expenses

18
Note 9 Other non-current assets
31.12.2013 31.12.2012
Shares in Sandvika Fjellstue AS 12 000 12 000Debt service reserve 260 446 169 241Tenancy deposit 12 954 12 694Total other non-current assets 285 399 193 934
Note 10 Other short-term receivables
31.12.2013 31.12.2012
Receivables related to deferred volume at Atla 3 103Pre-payments, including rigs 146 977 33 648VAT receivable 11 444 21 289Underlift/ overlift (-) 18 611 24 288Other receivables, including operator licences 319 283 263 341Total other short-term receivables 499 419 342 566
Note 11 Long term receivables
31.12.2013 31.12.2012
Receivables related to deferred volume at Atla 125 432 31 995Total long term receivables 125 432 31 995
The physical production volumes from Atla were higher than the commercial production volumes. This was caused by the high pressure from the Atla-field which temporarily has stalled the production from the neighbouring field Skirne. This is expected to continue through 2014 and into 2015. Income is recognised based on physical production volumes measured at market value. This deferred compensation is recorded as a long term or short term receivables, depending on when the income will occur, see Note 10.
For information about receivables related to deferred volume at Atla, see note 11.
Note 12 Cash and cash equivalents
Breakdown of cash and cash equivalents: 31.12.2013 31.12.2012
Cash 5 5Bank deposits 1 693 314 1 140 745Restricted funds (tax withholdings) 15 847 13 432Short-term placements 1 709 166 1 154 182
Unused exploration facility loan 815 991 587 759Unused revolving credit facility 3 945 286 1 383 498
Note 13 Share capital
31.12.2013 31.12.2012
Share capital 140 707 140 707Total number of shares (in 1.000) 140 707 140 707Nominal value per share in NOK 1.00 1.00
Note 14 Derivatives
31.12.2013 31.12.2012
Unrealized losses interest rate swaps 49 453 45 971Total derivatives 49 453 45 971
Note 15 Accounts receivables
31.12.2013 31.12.2012
Receivables related to sale of petroleum 70 885 23 236Receivables related to license transaction 1 284Invoicing related to expense refunds including rigs 62 052 78 603Total account receivable 134 221 101 839
The item 'Cash and cash equivalents' consists of bank accounts and short-term investments that constitute parts of the company's transaction liquidity.
The company has entered into three interest rate swaps. The purpose is to swap floating rate loans to fixed rate. These rate swaps are market to market and recognized to the Statement of income.

19
Note 16 Short-term loans
31.12.2013 31.12.2012
Exploration facility 478 050 567 075Total short-term loans 478 050 567 075
Note 17 Other current liabilities
31.12.2013 31.12.2012
Current liabilities related to overcall in licences 202 037 113 072Share of other current liabilities in licences 310 673 519 439Overlift of petroleum 9 588Other current liabilities 273 382 220 211Total other current liabilities 795 680 852 722
Included in other current liabilities is
Note 18 Bond
31.12.2013 31.12.2012
Principal, bond Norsk Tillitsmann 1) 592 304 589 078Principal, bond Norsk Tillitsmann 2) 1 881 278Total bond 2 473 582 589 078
1)The loan runs from 28 Januar 2011 to 28 January 2016 and carries an interest rate of 3 month NIBOR + 6.75 percent. The principal falls due on 28 January 2016 and interest is paid on a quarterly basis. The loan is unsecured.
The interest rate is three months' NIBOR plus a margin of 1.75 percent, with a utilization fee of 0.25 percent on outstanding loan up to NOK 2,750 million and 0.5 percent if the utilized credit exceeds NOK 2,750 million. In addition a commitment fee of 0.7 percent is also paid on unused credit.
For information about the unused part of the credit facility for exploration purposes, see Note 12 - "Cash and cash equivalents".
2)The loan runs from July 2013 to July 2020 and carries an interest rate of 3 month NIBOR + 5 percent. The principal falls due on July 2020 and interest is paid on a quarterly basis. The loan is unsecured.
The current facility of NOK 3,500 million was established in December 2012 and the company can draw on the facility until 31 December 2015 with a final date for repayment in December 2016. The maximum utilization including interest is limited to 95 percent of tax refund related to exploration expenses. The lender have security in the company's tax receivable. The calculated exploration tax receivable as result of exploration activities in 2013 is expected to be paid in December 2014, and will be used to repay this loan. See note 8
Note 19 Other interest-bearing debt
31.12.2013 31.12.2012
Revolving credit facility 1 992 055 1 331 467Unrealized currency 44 852 -31 734Total other interest-bearing debt 2 036 907 1 299 733
In September 2013, the company entered into a USD 1 billion revolving credit facility with a group of nordic and international banks. The revolving credit facility can be increased with USD 1 billion on certain future conditions. The company can draw on the facility until September 2018 with a final date for repayment as of September 2018. The facility replaced the company's USD 500 million tranche which originally matured on 31 December 2015.
The interest rate on the revolving credit facility is from 1 - 6 months NIBOR/LIBOR pluss a margin of 3 percent, with a utilization fee of 0.5 percent or 0.75 percent based on the amount drawn under the facility. In addition commitment fee of 1.20 percent is also paid on unused credit.
Note 20 Provision for abandonment liabilities
31.12.2013 31.12.2012
Provisions as of 1 January 798 057 285 201Incurred cost removal -36 739 -677Accreation expense - present value calculation 42 765 17 519Change in estimates and incurred liabilities on new fields 171 822 496 015Total provision for abandonment liabilities 975 904 798 057
Break down of the provision to short- and long-term liabilitiesShort term 147 375Long term 828 529Total provision for abandonment liabilities 975 904
Note 21 Uncertain commitments
The company's removal and decommissioning liabilities relate to the fields Jette, Glitne, Varg, Atla, Enoch, and Jotun. Time of removal is expected to come in 2018 for Jette, 2014-2016 for Glitne, 2016-2018 for Varg, 2018-2020 for Atla, 2017 for Enoch and in 2018-2021 for Jotun.
The estimate is based on executing a concept for removal in accordance with the Petroleum Activities Act and international regulations and guidelines.
During the second quarter 2012, the company announced that it had received a notice of reassessment from the Norwegian Oil Taxation Office (OTO) in respect of 2009 and 2010. Subsequently the notice has been extended to include 2011 and 2012. At the end of the third quarter 2012, the company responded to the notice of reassessment by submitting detailed comments.
During the normal course of its business, the company will be involved in disputes. The company provides accruals in its financial statements for probable liabilities related to litigation and claims based on the company's best judgement. Det norske does not expect that the financial position, results of operations or cash flows will be materially affected by the resolution of these disputes.

20
Note 22 Investments in jointly controlled assets
Licence - partner-operated: Licence - operatorships:PL 019C*** 30,0 % 0,0 % PL 001B 35,0 % 35,0 %PL 019D*** 30,0 % 0,0 % PL 026B*** 62,1 % 0,0 %PL 029B 20,0 % 20,0 % PL 027D*** 100,0 % 60,0 %PL 035 25,0 % 25,0 % PL 027ES*** 40,0 % 0,0 %PL 035B 15,0 % 15,0 % PL 028B 35,0 % 35,0 %PL 035C 25,0 % 25,0 % PL 103B 70,0 % 70,0 %PL 038 5,0 % 5,0 % PL 169C 50,0 % 50,0 %PL 038D 30,0 % 30,0 % PL 242 35,0 % 35,0 %PL 048B 10,0 % 10,0 % PL 337* 0,0 % 45,0 %PL 048D 10,0 % 10,0 % PL 356* 0,0 % 50,0 %PL 102C 10,0 % 10,0 % PL 364 50,0 % 50,0 %PL 102D 10,0 % 10,0 % PL 414 40,0 % 40,0 %PL 102F*** 10,0 % 0,0 % PL 414B 40,0 % 40,0 %PL 102G*** 10,0 % 0,0 % PL 450*** 80,0 % 60,0 %PL 265 20,0 % 20,0 % PL 460 100,0 % 100,0 %PL 272 25,0 % 25,0 % PL 482* 0,0 % 65,0 %PL 332 40,0 % 40,0 % PL 494**** 30,0 % 0,0 %PL 362 15,0 % 15,0 % PL 494B**** 30,0 % 0,0 %PL 438 10,0 % 10,0 % PL 494C**** 30,0 % 0,0 %PL 440S* 0,0 % 10,0 % PL 497 35,0 % 35,0 %PL 442 20,0 % 20,0 % PL 497B 35,0 % 35,0 %PL 453S 25,0 % 25,0 % PL 504*** 47,6 % 29,3 %PL 492*** 40,0 % 50,0 % PL 504BS*** 83,6 % 58,5 %PL 494**** 0,0 % 30,0 % PL 504CS*** 21,8 % 0,0 %PL 494B**** 0,0 % 30,0 % PL 512 30,0 % 30,0 %PL 494C**** 0,0 % 30,0 % PL 542 *** 45,0 % 60,0 %PL 502 22,2 % 22,2 % PL 542B**/*** 45,0 % 0,0 %PL 522 10,0 % 10,0 % PL 549S 35,0 % 35,0 %PL 531 10,0 % 10,0 % PL 553 40,0 % 40,0 %PL 533 20,0 % 20,0 % PL 573S 35,0 % 35,0 %PL 535*** 10,0 % 20,0 % PL 593* 0,0 % 60,0 %PL 535B*****/*** 10,0 % 0,0 % PL 626 50,0 % 50,0 %PL 550*** 10,0 % 20,0 % PL 659 30,0 % 30,0 %PL 551 20,0 % 20,0 % PL 663** 30,0 % 0,0 %PL 554 20,0 % 20,0 % PL 677** 60,0 % 0,0 %PL 554B 20,0 % 20,0 % PL 709***** 40,0 % 0,0 %PL 558 20,0 % 20,0 % PL 715***** 40,0 % 0,0 %PL 561* 0,0 % 20,0 % Number 33 26PL 563 30,0 % 30,0 %PL 567 40,0 % 40,0 % * Relinquised licenses or Det norske has withdrawn from the license.PL 568 20,0 % 20,0 %PL 571 40,0 % 40,0 % ** Interest awarded in APA-round (Application in Predefined Areas) in 2012. Offers were announced in 2013.PL 574*** 10,0 % 0,0 %PL 613 35,0 % 35,0 % *** Aqcuired/changed through license transaction or license is split.PL 619 30,0 % 30,0 %PL 627 20,0 % 20,0 % **** Det norske previously partner, now operator.PL 652* 0,0 % 20,0 %PL 667** 30,0 % 0,0 % ***** Interest awarded in 22nd licensing round.PL 672** 25,0 % 0,0 %PL 676S** 20,0 % 0,0 %PL 678S** 25,0 % 0,0 %PL 681** 16,0 % 0,0 %PL 706***** 20,0 % 0,0 %Number 47 41
31.12.2013
On the 21 January 2014, Det norske was offered ownership interest in six licenses in APA 2013. For two of these Det norske will be Operator.
31.12.2013 31.12.2012 31.12.2012

21
Note 23 Results from previous interim reports
Q4 Q3 Q2 Q1 Q4 Q3 Q2 Q1
Total operating revenues 254 353 323 563 285 626 80 339 116 797 49 014 69 603 97 031
Exploration expenses 544 400 588 289 270 635 233 738 194 924 402 635 417 140 594 616Production costs 97 602 53 419 57 086 41 512 74 027 45 515 46 154 45 266Payroll and payroll-related expenses 3 854 4 129 28 515 1 527 267 1 280 703 8 750
Depreciation 124 021 163 666 147 844 34 997 56 505 15 056 19 780 20 346Impairments 657 597 6 837 1 700 127 155 1 880 953 140 669 875Other operating expenses 8 811 25 247 56 619 19 208 21 995 21 140 16 050 23 614
Total operating expenses 1 436 285 841 588 562 400 330 983 474 873 2 366 579 640 497 693 467
Operating profit/loss -1 181 933 -518 025 -276 773 -250 644 -358 076 -2 317 565 -570 894 -596 436
Net financial items -105 851 -131 089 -48 915 -32 097 -13 763 -45 784 -23 065 -23 293
Profit/loss before taxes -1 287 784 -649 114 -325 688 -282 741 -371 839 -2 363 349 -593 959 -619 728Taxes (+)/tax income (-) -959 137 -490 975 -284 200 -262 415 -324 575 -1 774 462 -376 558 -516 030
Net profit/loss -328 647 -158 139 -41 488 -20 326 -47 264 -588 887 -217 401 -103 698
2013 2012

22
10
Det norske oljeselskap ASAwww.detnor.noPostal and office address:Føniks, Munkegata 26NO-7011 TrondheimTelephone: +47 90 70 60 00Fax: +47 73 54 05 00

23

Report Q4 2013Trondheim, February 19, 2014www.detnor.no Q4