report re leeds bradford international airport ...democracy.leeds.gov.uk/documents/s133968/lbia dtz...
TRANSCRIPT

PRIVATE & CONFIDENTIAL www.dtz.com
DTZ, a UGL company
Job No/Ref:
Leeds Bradford International Airport - commercial hub assessment
Prepared on behalf of Leeds Bradford International Airport 26 November 2014

Page 2
Contents
Executive Summary 1
1 Introduction 6
2 LBIA Growth Context 8
3 LBIA Growth Drivers: Policy 15
4 LBIA Growth Drivers: Economic 19
5 LBIA Growth Drivers: Aviation 27
6 LBIA Growth Drivers: Commercial 34
7 Airport Land Development Strategy 46
8 Economic Impact Assessment 57
Appendix 1: benchmarking other regional airports 63

Page 1
Executive Summary
Creating a commercial growth hub at Leeds Bradford International Airport is important to the future development and expansion of the Leeds City Region economy. Specifically, it will:
Support the growth of the airport as a key piece of strategic infrastructure in the local economy
Enhance the portfolio of land and premises available to prospective occupiers and investors
Enable the creation of substantial net additional jobs, investment and tax revenues to Leeds City Region
The growth of Leeds Bradford International Airport is recognised and supported as a key policy objective at the regional level as reflected in the One North proposition, the LEP’s Strategic Economic Plan, the City Region Transport Strategy and Leeds Council’s recent Executive Board meeting (15th October 2014). The development of a commercial hub is regarded an integral component of the growth strategy. DTZ has been instructed to examine and develop the case for the commercial growth hub in light of the proposed surface access improvements and provide advice on the land development strategy. The case for the commercial hub is summarised as follows:
The Airport needs space to grow
Leeds is one of the largest city region economies in the UK, but has only the 16th largest airport (in terms of passenger numbers). LBIA is forecast to double its passenger numbers by 2030 and it requires space to grow in order to realise this growth. The growth of Leeds Bradford International Airport is recognised and supported nationally, regionally and locally, as reflected in the Chancellor’s Autumn 2014 statement, the One North proposition, the LEP Strategic Economic Plan, the City Transport Strategy and Leeds Council’s recent Executive Board meeting (15th October 2014). The development of a commercial hub is regarded by LBIA as an integral component of the growth strategy for the Airport. The hub will support the Airport’s growth by:
Providing space for the expansion of core operational and supply chain activities
Enhancing its profile and ‘investability’ particularly to flight operating companies for route
development
Strengthening the case for improved connections and accessibility.
The Airport’s expansion is a key element of Leeds’ economic growth requirement and the Site Allocations DPD is the opportunity to create the right environment for growth over the next 10-15 years.

Page 2
Leeds needs a compelling airport land and property offer to compete nationally/
internationally for commercial investment
All core regional cities are bringing forward strategic employment sites at their airports marketed as distinct airport business parks. Some have designated EZs at Airports to incentivise and target footloose inward investment (Manchester, Cardiff, Newquay, Sheffield). Leeds needs to enhance the scale and quality of land available at its airport to compete for national and international investment and retain existing growing businesses, responding to the opportunities presented by improving surface access.
The commercial hub will complement, not compete
with, Leeds’ emerging employment land supply – it is a
‘special case’ and unique opportunity in the City Region
Leeds is one of the largest regional city economies and is anticipated to grow substantially in the future. Its growth is forecast to focus on a number of key sectors, most of which rely heavily on international connectivity:
Financial, professional and business services
Advanced manufacturing
Health and bio-science
Creative and digital industries
Food and drink
Low carbon industries
The economy’s growth will drive demand for a considerable quantity of commercial land and premises, and it will be important that Leeds can offer the right mix of types, locations and segments to meet these requirements. There is a recognised quantitative need for new sites and premises to meet Leeds’ long term requirements. The Council’s employment land evidence indicates the need for new allocations of approximately 180 hectares (444 acres) for the next Local Plan period. Evidence of take up in the out of town office market (which has experienced a take up of approximately 400,000 sq ft of floor space per annum over the last 10 years) suggests that Leeds Council needs to plan for the next generation of business parks to complement the city centre offer and provide the ‘margin of choice’ to match occupiers’ and investors’ location decisions. Irrespective of the quantitative need, there is considered to be a ‘special case’ for the Airport Commercial Hub due to the distinctive, differentiated offer that it will bring to Leeds’ commercial property portfolio. The site will target the following overlapping occupier types:
Airport linked /supply chain occupiers, such as flight operating and travel companies, air freight
logistics and freight forwarders, catering and repairs, hotel and leisure;
Airport Commercial land
development
pipeline of over 25
hectares
Leeds Bradford XNewcastle
East Midlands
Liverpool
Manchester
Newquay
Birmingham
Inverness
Dusseldorf

Page 3
Occupiers seeking / requiring an airport location, due to the profile and connectivity of such
locations and associated accessibility to clients, suppliers, parent companies;
R&D and general innovation, meeting local demand and addressing the recognised gap in the
supply of dedicated business parks for such activities; and
SMEs based in the inner and outer North Leeds area who require premises close to where their
leaders live.
Because of the differentiated focus and attributes of the commercial hub the effect will be to complement, rather than compete with, other strategic sites in Leeds such as the City Centre (financial and professional service focus), Leeds Enterprise Zone (large scale motorway orientated manufacturing and logistics focus) and Kirkstall Forge (general business activities). The site’s main competition will be airport business parks in other City Regions such as Manchester (Airport City) and Sheffield Doncaster Robin Hood Airport for those occupiers seeking an airport location.
Employment land at LBIA is worth 1½ times more economic benefit than elsewhere
Because the Commercial Hub will address a gap in the supply of land and premises in Leeds and appeal to a distinct occupier mix, it will attract occupiers and activities that might otherwise not be attracted/retained in Leeds. As a result it can generate a greater level of economic benefit than a typical employment site, where there is likely to be higher displacement of local occupiers from within the administrative area of Leeds. An assessment has been provided to demonstrate this benefit. The assessment calculates the net additional economic benefit of 1 ha of employment land at Leeds Bradford International Airport versus the 1 ha of employment land at a typical employment site in the Leeds area. It indicates that 1 ha at LBIA generates a potential net Gross Value Added (GVA) benefit of £140m to the Leeds economy, compared to a GVA £90million for a typical employment site. This is a 1½ times greater economic benefit. Put another way, there is an opportunity cost of £50million (i.e. £50m lost) to the Leeds economy of not promoting the Airport Commercial Hub.
NB
1 ha of employment land based on 50/50 office/industrial
GVA (Gross Value Added) is a measure of economic output derived from net additional job estimates over a fixed
period of 10 years
Net additional jobs based on assumptions about displacement, leakage and multiplier effects
LBIA GVA predicated on a lower level of displacement (40% office, 50% industrial) than elsewhere (60% office, 70%
industrial) due to differentiation factor of airport
LBIA
GVA of
£140m Typical employment
Land – GVA of
£90m
£50m – opportunity cost

Page 4
The development and expansion of the commercial hub at the airport as a whole will generate substantial net additional jobs, investment and tax revenues for Leeds City Region, estimated as follows:
Net additional job hosting capacity of development 5,500 jobs
NPV of GVA contribution to the local economy £2.6bn-£3.3bn based on job hosting capacity over 25 year period
There is a risk of the further loss of occupiers from Leeds
Because of gaps in the City’s land and property portfolio there have been a number of well publicised losses of businesses to neighbouring districts/city regions. Recent examples include:
Produmax – an advanced manufacturing firm specialising in the R&D of parts for aircraft (clients
include Boeing). The firm has recently committed to move from Otley to a 25,000 sq ft R&D
building at Buck Lane in Baildon (Bradford District).
University of Leeds – the University generates a number of business spin outs each year from its
R&D activity which often leak to other areas because of the lack of suitable accommodation for
‘move on’. An example is Tissue Regenerix, a bio science engineering firm which grew out of one
of the University’s on site bio science labs, relocated to York Bio Centre, and have now got their
own premises and employ 50-60 people.
Elbee – the manufacturing firm relocated from Leeds to Ashroyd Business Park in Barnsley due to
the lack of suitable premises in Leeds.
Therefore if the City does not provide the right type of land and premises to meet its economic needs there is a very real risk that it will not only miss opportunities for inward investment and growth of firms, but may also lose existing businesses.
Public private collaboration can ensure the delivery of maximum benefits
The commercial potential of the proposed hub is predicated on improvements to surface access and collaboration between public and private sector partners will provide the best prospect of delivering the development vision. The following measures that could aid delivery are proposed for consideration:
Creation of ‘Mini Enterprise Zone’ status – many competing cities across the UK have designated Enterprise Zones on land adjacent to airports to enable the EZ incentive package to be used to attract occupiers and facilitate enabling infrastructure investment. There is an opportunity for Leeds City Region to offer the business rate to the de minimus level to occupiers within the Airport Growth Hub, funded by business rate additionality accumulated in Leeds Enterprise Zone. This would help to both brand the Growth Hub in a positive way and attract occupiers.
‘Land value for infrastructure’ funding – where the value of the land is deployed to pay for the infrastructure works required to unlock / enable delivery. This is an approach that has been used to enable the delivery of public sector sites that have significant enabling/infrastructure costs or abnormals and the public sector wishes to help facilitate/enable delivery.

Page 5
Tax increment financing (TIF) – under the current arrangements that came into effect from 1st April 2013, local authorities are entitled to retain up to 50% of business rate income generated within their areas, with the potential for additional rates retention under Growth Deals. Therefore, the potential exists to establish a TIF zone around the Growth Hub site that would enable finance to be raised against the anticipated additional business rate receipts that the Council retains.
Direct public investment – innovation and R&D parks tend to exist because of public sector and HE investment. The possibility of utilising existing and emerging funding streams such as the Local Growth Fund to invest in property projects should be examined in view of the clear alignment of the Growth Hub masterplan and the Strategic Economic Plan for Leeds City Region.
Page 6
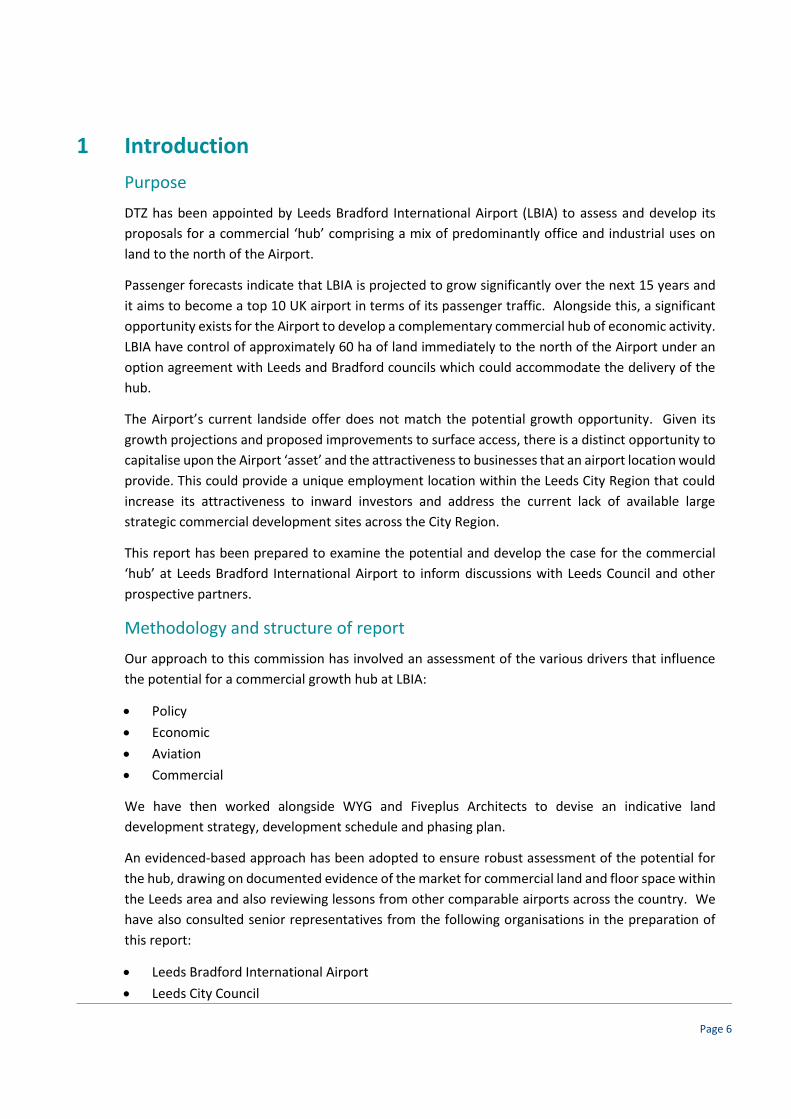
1 Introduction
Purpose
DTZ has been appointed by Leeds Bradford International Airport (LBIA) to assess and develop its
proposals for a commercial ‘hub’ comprising a mix of predominantly office and industrial uses on
land to the north of the Airport.
Passenger forecasts indicate that LBIA is projected to grow significantly over the next 15 years and
it aims to become a top 10 UK airport in terms of its passenger traffic. Alongside this, a significant
opportunity exists for the Airport to develop a complementary commercial hub of economic activity.
LBIA have control of approximately 60 ha of land immediately to the north of the Airport under an
option agreement with Leeds and Bradford councils which could accommodate the delivery of the
hub.
The Airport’s current landside offer does not match the potential growth opportunity. Given its
growth projections and proposed improvements to surface access, there is a distinct opportunity to
capitalise upon the Airport ‘asset’ and the attractiveness to businesses that an airport location would
provide. This could provide a unique employment location within the Leeds City Region that could
increase its attractiveness to inward investors and address the current lack of available large
strategic commercial development sites across the City Region.
This report has been prepared to examine the potential and develop the case for the commercial
‘hub’ at Leeds Bradford International Airport to inform discussions with Leeds Council and other
prospective partners.
Methodology and structure of report
Our approach to this commission has involved an assessment of the various drivers that influence
the potential for a commercial growth hub at LBIA:
Policy
Economic
Aviation
Commercial
We have then worked alongside WYG and Fiveplus Architects to devise an indicative land
development strategy, development schedule and phasing plan.
An evidenced-based approach has been adopted to ensure robust assessment of the potential for
the hub, drawing on documented evidence of the market for commercial land and floor space within
the Leeds area and also reviewing lessons from other comparable airports across the country. We
have also consulted senior representatives from the following organisations in the preparation of
this report:
Leeds Bradford International Airport
Leeds City Council

Page 7
Leeds City Region Local Enterprise Partnership
University of Leeds
Leeds Beckett University
Leeds Trinity University
Craven College (Aviation Academy)
Freight providers
This report first outlines the LBIA baseline and growth context before assessing the various growth
drivers. It then outlines the development potential and makes recommendations on the quantum
and mix of development and means of delivery. It concludes by providing an assessment of the
economic benefits of the commercial hub.

Page 8
2 LBIA Growth Context History LBIA is located approximately seven miles to the North West of Leeds City Centre. It opened in
1931 as Yeadon Aerodrome. Domestic schedule flights commenced in 1935 and it served an
important role during World War II, with the development of an adjacent military aircraft factory.
By the 1950s the airport was running commercial flights to the Isle of Man, Liverpool, Belfast,
Jersey, Ostend, Southend, the Isle of Wight and Dusseldorf. In 1953 Yeadon Aviation Ltd was set
up to run the flying school and commercial airfield operation but the ownership was transferred to
five local councils in 1987 through a limited company with Leeds and Bradford councils each
owning 40% and Wakefield, Calderdale and Kirklees sharing the remaining 20%.
Scheduled domestic and European flights re-commenced after the war and these expanded rapidly
during the later 1970s/80s as the popularity of package holidays boomed. It was owned jointly by
the five neighbouring local authority areas of Leeds, Bradford, Calderdale, Kirklees and Wakefield
until 2007, when it was announced that Bridgepoint Capital was the preferred bidder, acquiring the
asset for approximately £145million.
Bridgepoint Capital owns the airport outright but the 5 councils hold a 'special share' interest in the
airport, to protect the name and continued operation as the major air transport gateway for
Yorkshire. The Airport has had a masterplan in place since 2004/05, and Bridgepoint submitted a
planning application for a £28m investment programme in late 2008 which was approved in 2009,
although the focus of this has principally upon the airside operations to date. The airport had
already seen significant improvements made prior to the Bridgepoint acquisition including a
significantly enlarged terminal building, a £5m food court refurbishment in 2006 and an £8m
development on the south end of the airport with two new hangars, maintenance facilities and
executive aviation terminal.
Current flight operators There are 11 regular scheduled airlines operating from LBIA, as listed below:
Aer Lingus Regional
British Airways
KLM
Thomson
Easyjet
Flybe
Jet2
Monarch

Page 9
Eastern Airways
Ryanair
SAS
Jet2 has the largest presence at the airport, with its national HQ and 13 aircraft on site. The most
recent additional airline is Aer Lingus which was announced in September this year with up to two
daily flights to Dublin. Passengers flying to Dublin can connect to Aer Lingus’ mainline transatlantic
services to New York, Boston, Chicago, Orlando, San Francisco and Toronto. Earlier in the year in
March, the Airport also secured Scandinavian Airlines (SAS) with a twice weekly service to
Copenhagen. Flybe is also about to operate a new ‘FlyShuttle’ service that enables travel all the
way from Jersey to Aberdeen on one flight, with brief stops at Southampton and Leeds. It is a
‘hop-on, hop off’ service that will operate three times a day both northbound and southbound.
Monarch also recently announced a number of new destinations for this summer following its
decision to locate at the Airport in 2013. The Airport is committed to both working with its existing
airlines to expand the available routes and also to exploring opportunities to secure new flight
operating companies.
Flight routes/destinations
The airport offers direct flights to over 75 destinations across the UK and around the world, with
connections on to significantly more through the hub airports of London Heathrow, Amsterdam
and also Dublin (for flights to the USA). The direct British Airways flight to Heathrow is key to
providing onward flights to the rest of the world, to over 150 destinations. Direct flights are largely
European-based, although Jet2 does offer direct flights to New York around Christmas. Current
destinations include France, Germany, Italy, Austria, Switzerland and Spain, amongst others. It
serves both holiday and business destinations with varying summer and winter timetables.
Ownership and management of LBIA The Airport is 100% owned by Bridgepoint Capital, an international private equity group, which
acquired the Airport for €214m (£145m) in 2007. Bridgepoint invested £27m to acquire a 24%
stake in Birmingham Airport in 1997, disposing of its interest four years later for £84m. It therefore
has experience in the aviation sector. As stated, the 5 councils hold a 'special share' interest in the
airport to ensure that it remains as an operational airport for the Yorkshire region. The Airport is
operated by Leeds Bradford International Airport Limited.
Page 10
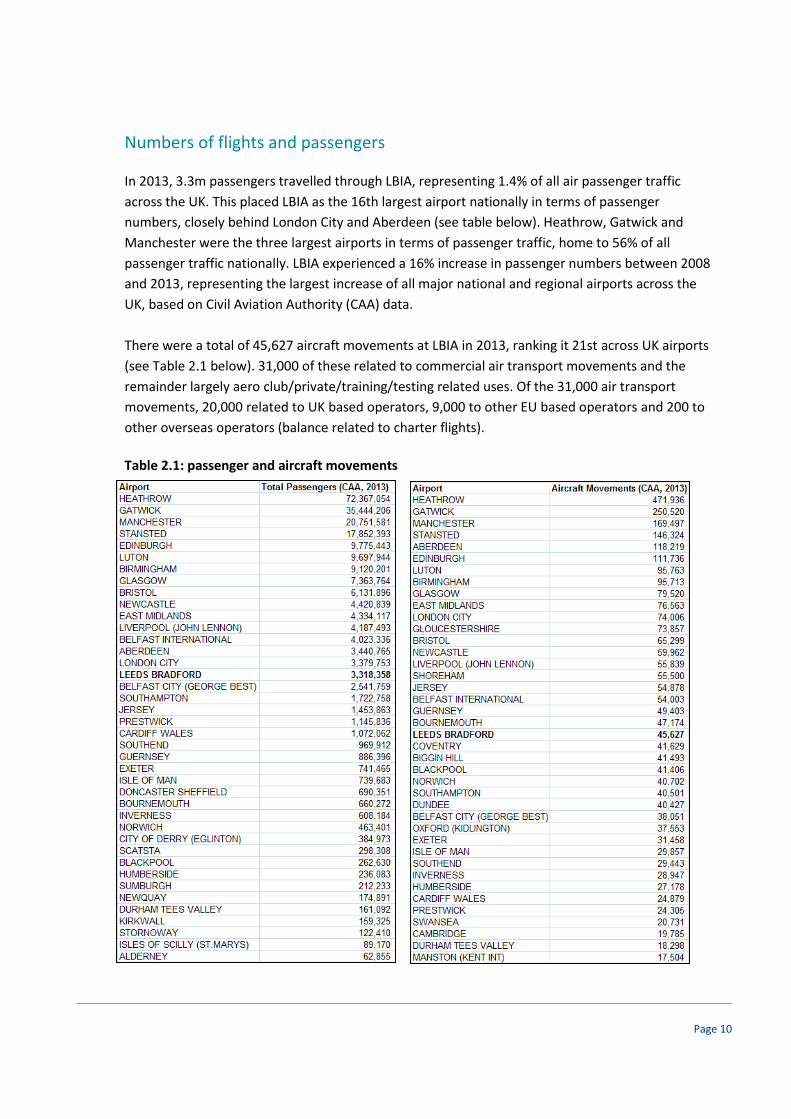
Numbers of flights and passengers
In 2013, 3.3m passengers travelled through LBIA, representing 1.4% of all air passenger traffic
across the UK. This placed LBIA as the 16th largest airport nationally in terms of passenger
numbers, closely behind London City and Aberdeen (see table below). Heathrow, Gatwick and
Manchester were the three largest airports in terms of passenger traffic, home to 56% of all
passenger traffic nationally. LBIA experienced a 16% increase in passenger numbers between 2008
and 2013, representing the largest increase of all major national and regional airports across the
UK, based on Civil Aviation Authority (CAA) data.
There were a total of 45,627 aircraft movements at LBIA in 2013, ranking it 21st across UK airports
(see Table 2.1 below). 31,000 of these related to commercial air transport movements and the
remainder largely aero club/private/training/testing related uses. Of the 31,000 air transport
movements, 20,000 related to UK based operators, 9,000 to other EU based operators and 200 to
other overseas operators (balance related to charter flights).
Table 2.1: passenger and aircraft movements
Page 11
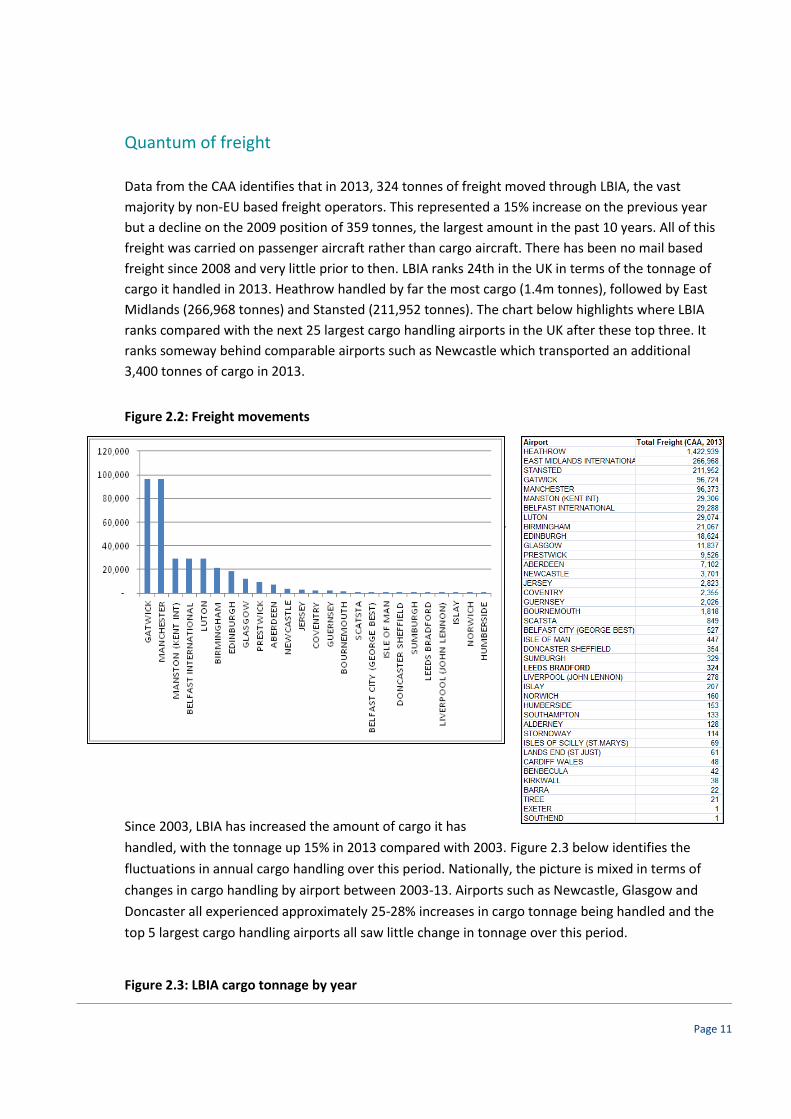
Quantum of freight
Data from the CAA identifies that in 2013, 324 tonnes of freight moved through LBIA, the vast
majority by non-EU based freight operators. This represented a 15% increase on the previous year
but a decline on the 2009 position of 359 tonnes, the largest amount in the past 10 years. All of this
freight was carried on passenger aircraft rather than cargo aircraft. There has been no mail based
freight since 2008 and very little prior to then. LBIA ranks 24th in the UK in terms of the tonnage of
cargo it handled in 2013. Heathrow handled by far the most cargo (1.4m tonnes), followed by East
Midlands (266,968 tonnes) and Stansted (211,952 tonnes). The chart below highlights where LBIA
ranks compared with the next 25 largest cargo handling airports in the UK after these top three. It
ranks someway behind comparable airports such as Newcastle which transported an additional
3,400 tonnes of cargo in 2013.
Figure 2.2: Freight movements
Since 2003, LBIA has increased the amount of cargo it has
handled, with the tonnage up 15% in 2013 compared with 2003.
The graph below identifies the fluctuations in annual cargo
handling over this period. Nationally, the picture is mixed in
terms of changes in cargo handling by airport between 2003-13.
Airports such as Newcastle, Glasgow and Doncaster all
experienced c.25-28% increases in cargo tonnage being handled
and the top 5 largest cargo handling airports all saw little
change in tonnage over this period.
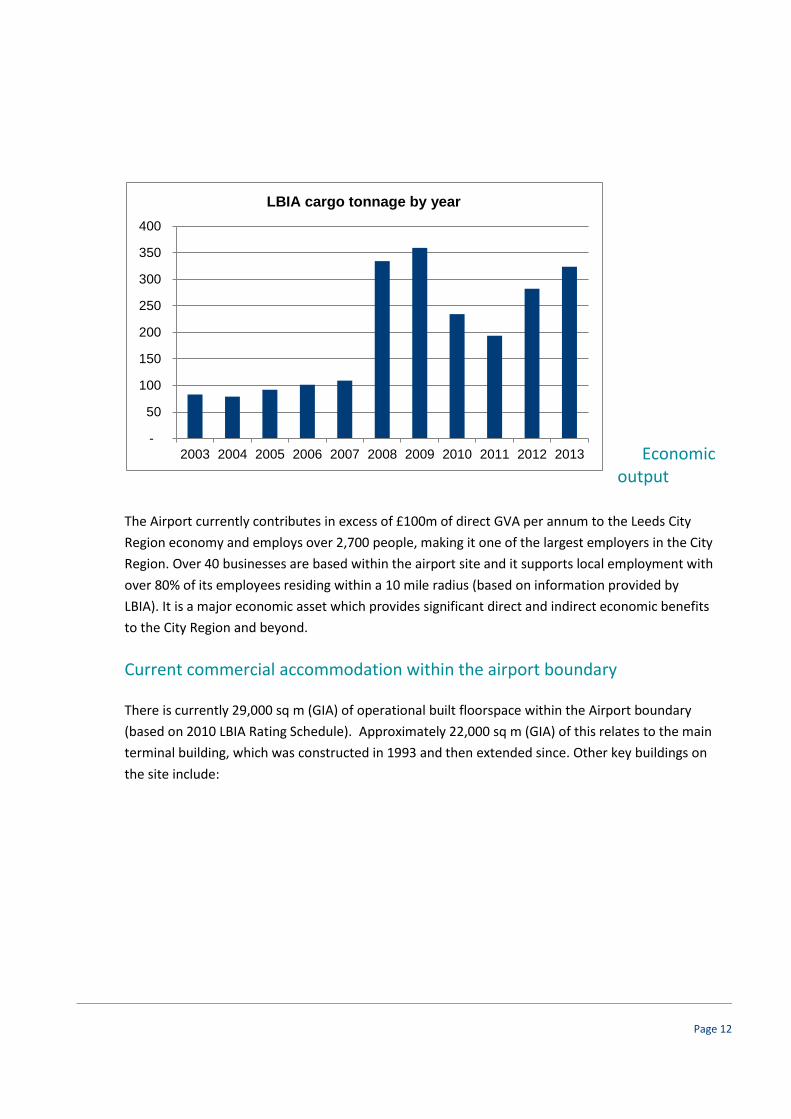
Since 2003, LBIA has increased the amount of cargo it has
handled, with the tonnage up 15% in 2013 compared with 2003. Figure 2.3 below identifies the
fluctuations in annual cargo handling over this period. Nationally, the picture is mixed in terms of
changes in cargo handling by airport between 2003-13. Airports such as Newcastle, Glasgow and
Doncaster all experienced approximately 25-28% increases in cargo tonnage being handled and the
top 5 largest cargo handling airports all saw little change in tonnage over this period.
Figure 2.3: LBIA cargo tonnage by year
Page 12
Economic output
The Airport currently contributes in excess of £100m of direct GVA per annum to the Leeds City
Region economy and employs over 2,700 people, making it one of the largest employers in the City
Region. Over 40 businesses are based within the airport site and it supports local employment with
over 80% of its employees residing within a 10 mile radius (based on information provided by
LBIA). It is a major economic asset which provides significant direct and indirect economic benefits
to the City Region and beyond.
Current commercial accommodation within the airport boundary
There is currently 29,000 sq m (GIA) of operational built floorspace within the Airport boundary
(based on 2010 LBIA Rating Schedule). Approximately 22,000 sq m (GIA) of this relates to the main
terminal building, which was constructed in 1993 and then extended since. Other key buildings on
the site include:
-
50
100
150
200
250
300
350
400
2003 2004 2005 2006 2007 2008 2009 2010 2011 2012 2013
LBIA cargo tonnage by year

Page 13
Table 2.1: Accommodation on site
Building Floorspace (sqm) (GIA)
Fire-station 979
Control Tower/Centres 401
Engineering Offices 752
Catering Centre 1,179
Freight Offices 308
Repair Garages 678
Airedale House 376
Electricians Store 137
Transit Sheds 1,081
Fuel Store Offices/Maintenance 166
Boiler House/Substation 137
Aero House Rooms 90
Source: 2010 rating list
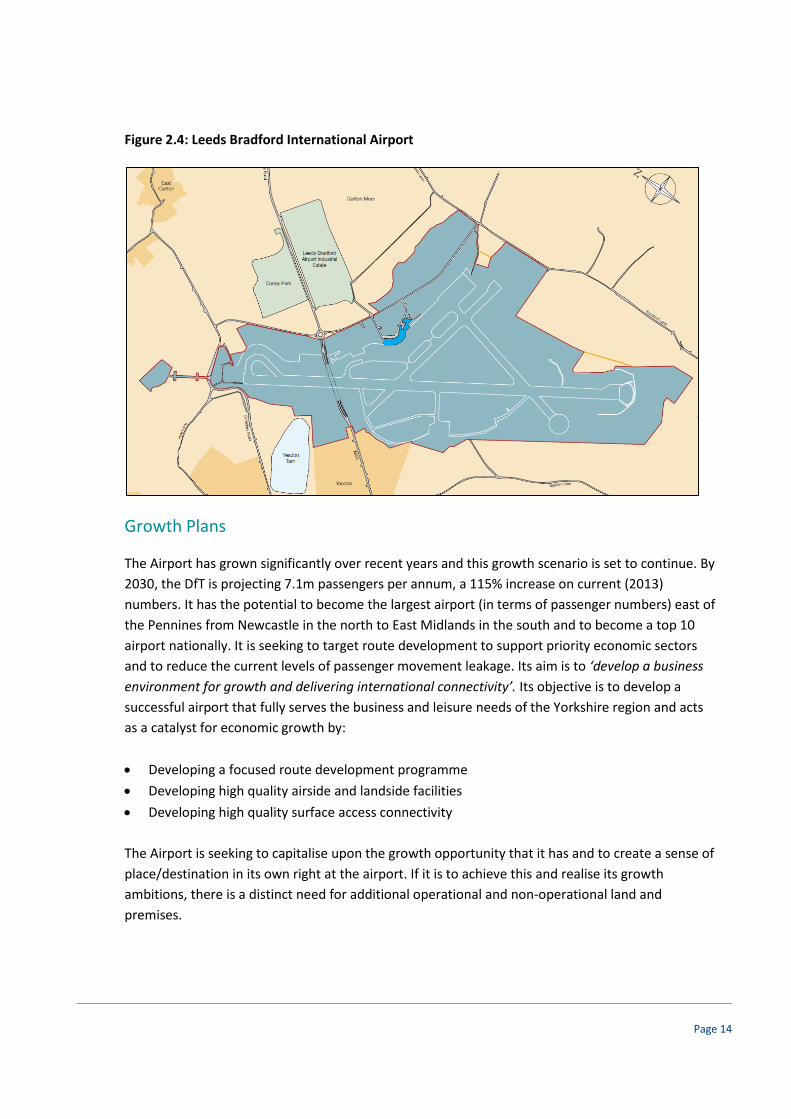
A large proportion of the site is occupied, as one would expect, by runways, aprons and taxiways as well as access roads and car parking. The main terminal itself includes the following facilities/uses in addition to standard waiting areas, check-in desks and LBIA’s offices:
World Duty Free
WH Smith
Superdrug
Travelex
Burger King
Saltaire Bar/Eatery
Camden Food Company
Sports Bar
Cafe Ritazza
Car hire desks – Avis, Enterprise, Europcar, Hertz
Yorkshire Premier Lounge A plan illustrating the spatial extent of the current airport operational area is presented below (shaded in turquoise):
Page 14
Figure 2.4: Leeds Bradford International Airport
Growth Plans
The Airport has grown significantly over recent years and this growth scenario is set to continue. By
2030, the DfT is projecting 7.1m passengers per annum, a 115% increase on current (2013)
numbers. It has the potential to become the largest airport (in terms of passenger numbers) east of
the Pennines from Newcastle in the north to East Midlands in the south and to become a top 10
airport nationally. It is seeking to target route development to support priority economic sectors
and to reduce the current levels of passenger movement leakage. Its aim is to ‘develop a business
environment for growth and delivering international connectivity’. Its objective is to develop a
successful airport that fully serves the business and leisure needs of the Yorkshire region and acts
as a catalyst for economic growth by:
Developing a focused route development programme
Developing high quality airside and landside facilities
Developing high quality surface access connectivity
The Airport is seeking to capitalise upon the growth opportunity that it has and to create a sense of
place/destination in its own right at the airport. If it is to achieve this and realise its growth
ambitions, there is a distinct need for additional operational and non-operational land and
premises.

Page 15
3 LBIA Growth Drivers: Policy
Aviation Policy Framework (2013)
The 2013 Aviation Policy Framework replaced the 2003 Air Transport White Paper as Government’s
policy on the aviation sector. This acknowledges that the sector contributes around £18 billion per
annum of economic output to the UK economy and employs around 220,000 employees directly.
The Government’s primary objective as defined within this policy framework is to achieve long-
term economic growth. It recognises that airports are in some ways cities in themselves, creating
local jobs and generating opportunities for economic rebalancing in their wider are and fully
recognises the vital contribution they can make to the growth of regional economies. The
document suggests that many airports act as focal points for business development and
employment. The focus is on London’s airports as the largest carriers of passengers, however it
identifies that the number of passengers using non-London airports has increased by over a third
since 2000.
The framework identifies that LBIA is a “vital contributor to the economy of the Yorkshire and
Humber region, and in particular the Leeds City region”. It states that the airport supports up to
2,800 direct jobs and generates £102m of direct GVA. In addition, it acts as a catalyst to a further
320 jobs and £10.8 million of GVA. It suggests that the services of the airport and international
connectivity will continue to contribute towards improved export activity, performance and
business competitiveness. Based on forecast passenger growth at the airport, it is estimated that
this will grow to around 8,000 jobs and £290 million GVA by 2030.
The Policy Framework recognises that the scope exists for LEPs to develop local strategies to
maximise the catalytic effects of airports to attract business and support growth. It suggests that
LEPs, in partnership with local authorities, have a range of tools at their disposal to help support
businesses in the vicinity of airports and that the Government encourages airport operators to
engage actively with their LEPs to ensure that they are fully integrated into their LEP’s overall
economic strategy for the area, and to maximise the benefits to local economies.
The Policy Framework also underlines that nationally a number of Enterprise Zones have been
designated around regional airports to support their growth. Examples include Manchester’s
Airport City (£600m, 150-acre development which will transform the airport into an international
business destination) and the Newquay ‘Aerohub’ (55ha, including aviation related space and more
generic commercial employment land). The Enterprise Zone in Cardiff has also been expanded to
incorporate the airport.

Page 16
Leeds City Region Strategic Economic Plan
The Leeds City Region Strategic Economic Plan (SEP) was submitted to Government in March 2014
by the Leeds City Region Local Enterprise Partnership (LEP), as part of its Growth Deal negotiations
to secure devolved funding and responsibilities. This acknowledges that the Leeds City Region is
the largest City Region outside of London and that despite its economic strengths and assets, it is
not realising its full potential. Its vision is “to unlock the potential of the City Region, developing an
economic powerhouse that will create jobs and prosperity”. The SEP sets out a vision to
“dramatically accelerate growth, creating a further £5.2bn in economic output and an additional
62,000 jobs so that by 2021, the City Region economy will be almost a quarter bigger with almost
10% more jobs”.
The SEP identifies 4 strategic investment priorities:
1) Supporting growing businesses
2) Developing a skilled and flexible workforce
3) Building a resource smart City Region
4) Delivering the infrastructure for growth.
Over the long term under Priority 1, the LEP’s ambition is to “enable vibrant private sector growth,
based on innovation and exports”. It recognises that SMEs drive economic growth through
innovation, competition and job creation and that the City Region offers significant opportunities
to support a growing enterprise base that can help to drive productivity gains, including leading
global businesses and centres of research, innovation and knowledge creation. Under Priority 4,
the LEP recognises that there is a distinct opportunity to “develop a pipeline of delivery ready
employment sites to cater for the growing economy”. This is in response to the identified challenge
facing many areas “to provide the right commercial and residential sites in the right locations
supported by appropriate transport, digital and energy connections”.
The SEP identifies a number of key growth sectors where it recognises existing clusters of particular
expertise and opportunity:
Innovative manufacturing
Financial & professional services
Health & life sciences
Low carbon & environmental industries
Digital & creative industries
Food & drink.
The SEP recognises that the “transformation of the City Region’s local, national and international
transport connectivity is central to its plans for growth”. It acknowledges that good international
connectivity plays an increasingly important part in promoting trade and attracting inward
Page 17
investment. The SEP identifies that “the City Region benefits from a growing regional airport, which
is one of the fastest growing nationally”. It recognises that it has “the potential to deliver much
improved international connectivity, benefitting existing businesses and attracting inward
investment in our key priority sectors”. The SEP also makes reference to the fact that improved
surface connectivity is a priority and that a better connected airport will help to support the LEP’s
key sectors and attract more inward investment.
Leeds Local Plan
The Core Strategy Development Plan Document for the Leeds Metropolitan District was formally
adopted on 12th November 2014. This document defines the spatial vision for the District to 2028
and sets out a number of objectives and policies to achieve this. The Core Strategy recognises that
LBIA is a “major part of the strategic Infrastructure for the City Region and that it is also an
economic resource for employment, business development and tourism”. It acknowledges that
the airport’s economic benefits stem beyond just the airport site across the wider City Region and
that there is potential for growth in terms of passenger numbers and freight. The Core Strategy
also acknowledges that there is ongoing work currently being undertaken by the airport to define
its longer term aspirations, as part of the Airport’s Masterplan.
The Core Strategy recognises that the Airport provide key components of strategic infrastructure,
for businesses, residents and visitors and that it provides a ‘gateway’ to the City Region as a whole.
Spatial Policy 12 within the Core Strategy is entitled ‘Managing the growth of Leeds Bradford
International Airport’ and suggests that the continued development of Leeds Bradford
International Airport will be supported to enable it to fulfil its role as an important regional airport
subject to a number of points, particularly relating to the much needed surface access
improvements.
The Leeds City Council Employment Land Review 2010 Update, which represents the most up to
date published Council employment land document supporting the emerging Local Plan, provides
an assessment of the requirements and availability for land for office use over the period 2010-
2028. It concludes that there is a requirement for 880,000 sq m of office floor space, against a
committed pipeline (i.e. permissions with planning consent) of 706,250 sq m, leaving a residual
need for new land allocations to accommodate 173,750 sq m. It also concludes that there is a need
for 536 ha of employment land for industrial purposes over the period 2010-2028, set against a
portfolio of 350 ha to be rolled forward (these being comprised of sites which the review considers
are suitable for continued employment use), leaving a residual requirement of 186 ha of new
allocations. A key part of the Local Plan making process will involve the allocation of new sites for
employment use and the Airport represents a key opportunity that can help meet the Local Plan’s
needs.
Page 18
One North – A Proposition for an Interconnected North
The ‘One North – a proposition for an Interconnected North’ is a policy statement produced in July
2014 by the five City Regions of Leeds, Liverpool, Manchester, Newcastle and Sheffield to lobby
Government for enhanced investment in transport infrastructure in the north of the country to
drive economic growth and competitiveness. It sets out a vision for a well connected northern
zone predicated on multi-modal transport networks for logistics and personal travel.
Airports represent a key element of the statement, underlining the importance of airports’ growth
in helping deliver the multi-modal well connected vision. Specifically, it states that achieving a
suitable rail/light rail connection to Leeds Bradford International Airport “remains an ambition
that, under this proposition, needs to be turned into a fully realised project”.
Growth implications for LBIA LBIA’s growth is embedded in national aviation policy which also recognises the importance of
growing the mix of commercial operations around airports to reinforce their growth potential. It is
important that local policies – through both planning and economic development – respond to
accommodate the needs of the airport’s expansion.
The Local Enterprise Partnership’s vision to accelerate economic growth of the Leeds City Region
requires a strong airport with international routes. It also requires a diverse, high quality range of
commercial land and property to accommodate its growth needs, including premises and sites for
high value operations that are innovation and technology related – an area of property in which
Leeds punches well below its weight. LBIA Commercial Hub can play a key role in this regard by
offering a unique selling point that will appeal to occupiers seeking high profile and well connected
locations.
The additional powers and resources being committed to LEPs provides public and private sector
partners with the ability to be innovative in the way that it can support and facilitate the delivery
of economic development projects such as the commercial hub. Therefore there is an opportunity
for the LBIA to work collaboratively with the LEP and other partners to deliver the vision for a
commercial hub.
Page 19
4 LBIA Growth Drivers: Economic
This section presents an analysis of the current economic position and performance of the Leeds
City Region economy. It draws upon a number of published secondary data sources to provide an
overview of the local economy as context for the growth ambitions of the Airport, located at the
geographic heart of the City Region. Data has been used to show how the Leeds City Region
performs against GB benchmarks and also its nearest competitor Manchester City Region.
The Leeds City Region (LCR) comprises ten local authority areas including Leeds, Bradford, York,
Kirklees, Barnsley, Wakefield, Selby, Calderdale, Harrogate and Craven. The City Region’s economy
is worth £54bn per annum (5% of the national Gross Domestic Product), the LCR is widely regarded
as the largest financial and legal centre outside of London and the City Region claims to have more
company HQ’s than any other LEP area in the north of England. The City Region markets itself on
the fact that it is home to world leading companies and universities, as well as some of the most
beautiful physical landscapes in the country – it comprises a diverse mix of urban and rural land
uses.
Population and demographic trends
The most recent Office of National Statistics (ONS) Mid Year Population Estimates indicate that
2.97 million people were resident within the Leeds City Region in 2012. The population of the
Leeds City Region represents over half (55.9%) of the Yorkshire and Humber Region’s total resident
population (5.32 million people).
Between 1995 and 2012, the population of the Leeds City Region increased by 8.7%, a higher rate
of growth than the wider regional Yorkshire and Humber rate of 7.2% and also that of the
Manchester City Region (6.4%).
Working Age Population and Projected Growth
The 2012 Mid Year Population Estimates indicate that 1.91 million people of working age reside
within the Leeds City Region, representing 64.3% of the respective total resident populations.
Positively, these figures represent a higher proportion of the population than the wider regional
average of Yorkshire and the Humber and Great Britain as a whole (64.2%).
At the national level, working age population growth of 3.7% is anticipated over the decade to
2021. A growth rate of 4.4% is projected at the Leeds City Region level, which exceeds the 2.4%
anticipated across the wider Yorkshire and Humber region (2011 based ONS sub-national
population projections.)

Page 20
Economic Activity
It is not just the size of the working age population that determines the scale of the local labour
market, but the extent to which the working age population is economically active. Economic
activity is defined as those in employment (or self-employment) or those that are unemployed but
available for work. The economic activity rate represents the extent to which the working-age
population is engaged with the labour market and indicates the absolute scale of the labour force
from which organisations can source employment. Limits to the size of the resident labour force
result in in-commuting and/or inhibit economic growth.
Economic activity rates within the Leeds City Region broadly tracked the national rate at around
76.5% of the working age population and exceeded the wider Yorkshire and Humber rate of 75.7%
until the onslaught of the recession in 2008. Economic activity rates then fell dramatically to 74.8%
in 2010 and 2011, just below the regional rate of 75% at this time, before tracking the regional rate
of recovery back to around 77% in 2013 (Annual Population Survey, 2013).
Occupation
The occupational structure and characteristics of a City Region’s resident labour market is central
to its overall competitiveness and shapes the economic opportunities that residents are able to
access. In turn, the type of skills implied by an area’s occupational structure can shape the
economy’s ability to attract and support higher-value economic activity and attract higher skilled
non-resident workers into the economy.
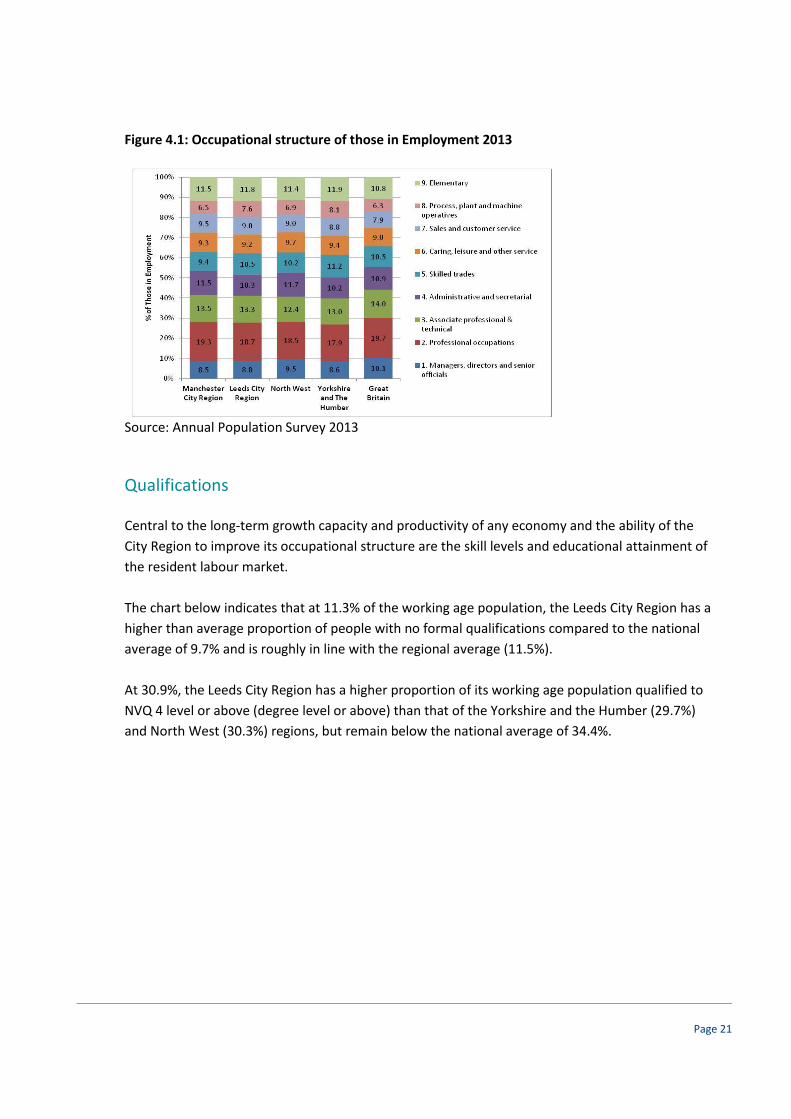
Figure 4.1 illustrates the resident occupational structure of the Leeds City Region, compared with
Manchester City Region and wider regional and national benchmarks. 40.8% of employees within
the Leeds City Region are employed in the top three occupational groups (those classified 1-3
within the Annual Population Survey). This is higher than the Yorkshire & Humber (39.5%) and
North West (40.4%) averages but lower than the 41.3% rate across the Manchester City Region and
the Great Britain average of 43.8%.
Page 21
Figure 4.1: Occupational structure of those in Employment 2013
Source: Annual Population Survey 2013
Qualifications
Central to the long-term growth capacity and productivity of any economy and the ability of the
City Region to improve its occupational structure are the skill levels and educational attainment of
the resident labour market.
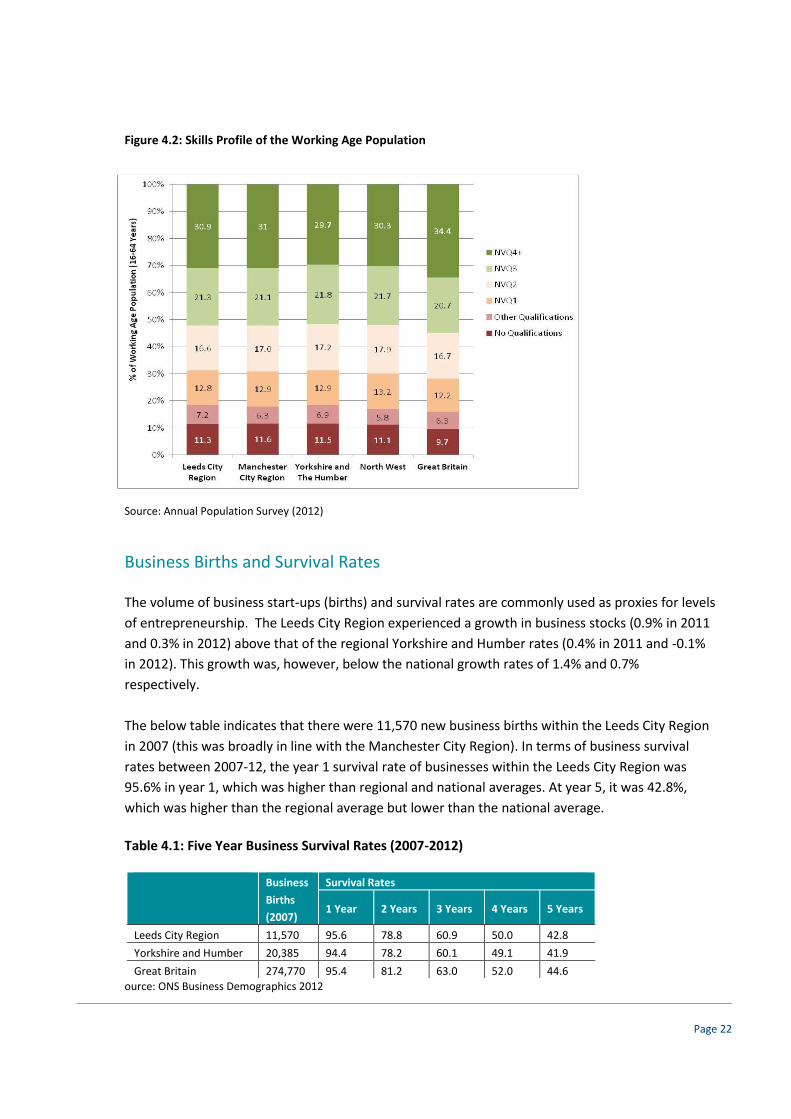
The chart below indicates that at 11.3% of the working age population, the Leeds City Region has a
higher than average proportion of people with no formal qualifications compared to the national
average of 9.7% and is roughly in line with the regional average (11.5%).
At 30.9%, the Leeds City Region has a higher proportion of its working age population qualified to
NVQ 4 level or above (degree level or above) than that of the Yorkshire and the Humber (29.7%)
and North West (30.3%) regions, but remain below the national average of 34.4%.
Page 22
Figure 4.2: Skills Profile of the Working Age Population
Source: Annual Population Survey (2012)
Business Births and Survival Rates
The volume of business start-ups (births) and survival rates are commonly used as proxies for levels
of entrepreneurship. The Leeds City Region experienced a growth in business stocks (0.9% in 2011
and 0.3% in 2012) above that of the regional Yorkshire and Humber rates (0.4% in 2011 and -0.1%
in 2012). This growth was, however, below the national growth rates of 1.4% and 0.7%
respectively.
The below table indicates that there were 11,570 new business births within the Leeds City Region
in 2007 (this was broadly in line with the Manchester City Region). In terms of business survival
rates between 2007-12, the year 1 survival rate of businesses within the Leeds City Region was
95.6% in year 1, which was higher than regional and national averages. At year 5, it was 42.8%,
which was higher than the regional average but lower than the national average.
Table 4.1: Five Year Business Survival Rates (2007-2012)
Business
Births
(2007)
Survival Rates
1 Year 2 Years 3 Years 4 Years 5 Years
Leeds City Region 11,570 95.6 78.8 60.9 50.0 42.8
Yorkshire and Humber 20,385 94.4 78.2 60.1 49.1 41.9
Great Britain 274,770 95.4 81.2 63.0 52.0 44.6
ource: ONS Business Demographics 2012

Page 23
Employment Sectors
An analysis has been undertaken of the key employment sectors within the Leeds City Region, compared
with the national picture. This identifies that there are a higher proportion of the workforce employed in the
following sectors in the Leeds City Region compared with England as a whole:
Manufacturing (10.5% compared with 8.4% nationally)
Education (10.7% compared with 9.6% nationally)
Health (13.5% compared with 13.1% nationally)
Business administration (9% compared with 8.6% nationally)
Transport/storage (5.2% compared with 4.5% nationally)
A report recently produced for the Leeds City Region Secretariat by Ekosgen (February 2014) has
examined the sector strengths of the local economy. It reviewed the level of specialisation and
growth across all standard economic sectors to identify recommended priorities for the Leeds City
Region to invest in. The report concludes that the following sectors should be prioritised by the
Leeds City Region for development and investment:
Financial, professional and business services
Advanced manufacturing
Health and bio-science
Creative and digital industries
Food and drink
Low carbon industries
Table 4.2 below illustrates the various sector strengths which include significant strengths in a
number of sectors which have international markets and a research and development focus.

Page 24
Table 4.2: Leeds City Region Sector Strengths
Source: Key Sectors Policy for Leeds City Region Draft report by Ekosgen February 2014
Education
The LCR is home to 7 Higher Education institutions (universities) and 14 Further Education Colleges,
accommodating a total student population of around 230,000. Universities include the University
of Leeds, University of York, Leeds Metropolitan University, University of Huddersfield, Leeds
Trinity University, University of Bradford and University of York St John. In total, these produce in
the region of 36,000 graduates every year. The Universities of Leeds and York are members of the
White Rose University Consortium, which together rank alongside Oxford and Cambridge in terms
of research capabilities.
Exporting Potential Inward investment
potential
Research Strengths National Innovation
Priorities
Financial services
High-tech goods
Communication
Construction services
Education
Financial services
intelligence
Health innovation
Advanced digital
technologies
Powertrain & precision
engineering
De-carbonised energy
and renewables
Agri-science
Advanced materials
Big Data
Regenerative medicine
Robotics
Satellites
Bio-science
Advanced materials
ICT
Healthcare
Energy
High value manufacturing
Leeds City Region Sector Performance
Employment (numbers) Employment (specialism) Gross Value Added
Education
Retail
Health
Public administration
Food and beverage service
Manufacture of textiles
Manufacture of beverages
Water collection, treatment and supply
Manufacture of furniture
Printing / recorded media
Wholesale
Retail
Electricity, gas etc
Specialised construction
Manufacture of food
Employment Growth (%) Productivity GVA Growth
Professional services
Computing and information
Administrative and support services
Land transport
Media activities
Electricity, gas etc
Air transport
Rental and leasing
Telecommunications
Manufacture of basic pharmaceuticals
Finance
Real estate
Retail
Wholesale
Professional services
Page 25
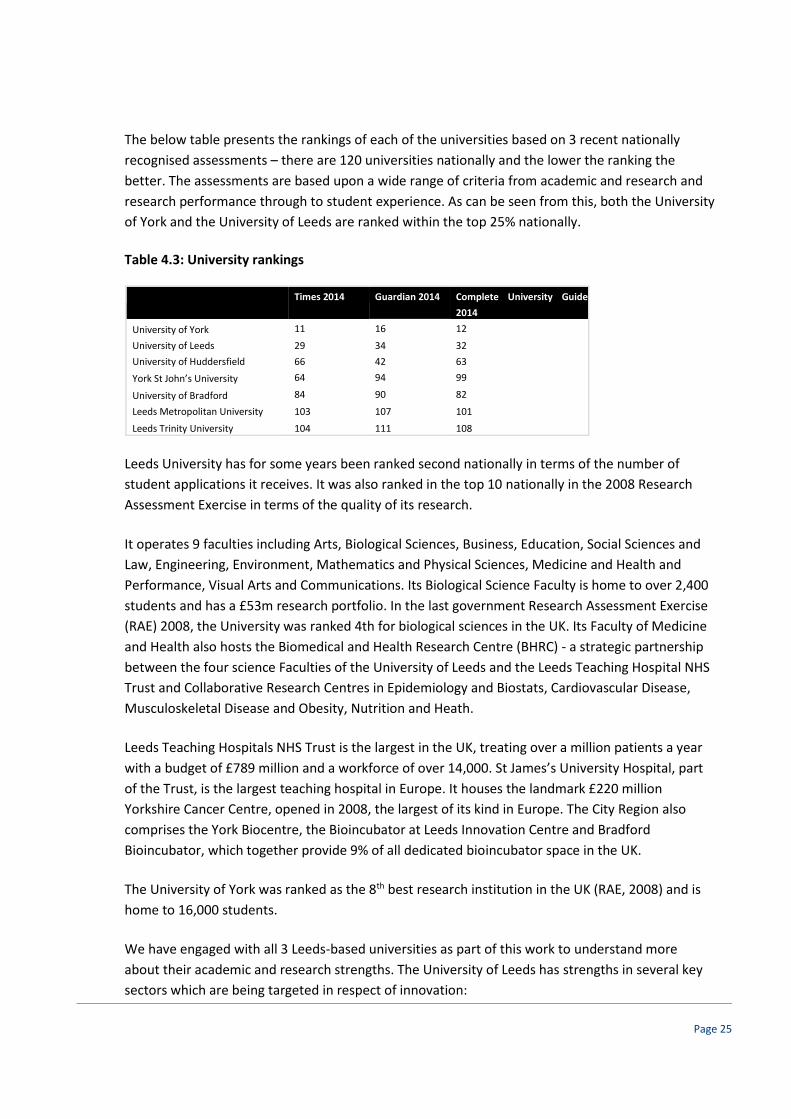
The below table presents the rankings of each of the universities based on 3 recent nationally
recognised assessments – there are 120 universities nationally and the lower the ranking the
better. The assessments are based upon a wide range of criteria from academic and research and
research performance through to student experience. As can be seen from this, both the University
of York and the University of Leeds are ranked within the top 25% nationally.
Table 4.3: University rankings
Times 2014
Guardian 2014 Complete University Guide
2014
University of York 11 16 12
University of Leeds 29 34 32
University of Huddersfield 66 42 63
York St John’s University 64 94 99
University of Bradford 84 90 82
Leeds Metropolitan University 103 107 101
Leeds Trinity University 104 111 108
Leeds University has for some years been ranked second nationally in terms of the number of
student applications it receives. It was also ranked in the top 10 nationally in the 2008 Research
Assessment Exercise in terms of the quality of its research.
It operates 9 faculties including Arts, Biological Sciences, Business, Education, Social Sciences and
Law, Engineering, Environment, Mathematics and Physical Sciences, Medicine and Health and
Performance, Visual Arts and Communications. Its Biological Science Faculty is home to over 2,400
students and has a £53m research portfolio. In the last government Research Assessment Exercise
(RAE) 2008, the University was ranked 4th for biological sciences in the UK. Its Faculty of Medicine
and Health also hosts the Biomedical and Health Research Centre (BHRC) - a strategic partnership
between the four science Faculties of the University of Leeds and the Leeds Teaching Hospital NHS
Trust and Collaborative Research Centres in Epidemiology and Biostats, Cardiovascular Disease,
Musculoskeletal Disease and Obesity, Nutrition and Heath.
Leeds Teaching Hospitals NHS Trust is the largest in the UK, treating over a million patients a year
with a budget of £789 million and a workforce of over 14,000. St James’s University Hospital, part
of the Trust, is the largest teaching hospital in Europe. It houses the landmark £220 million
Yorkshire Cancer Centre, opened in 2008, the largest of its kind in Europe. The City Region also
comprises the York Biocentre, the Bioincubator at Leeds Innovation Centre and Bradford
Bioincubator, which together provide 9% of all dedicated bioincubator space in the UK.
The University of York was ranked as the 8th best research institution in the UK (RAE, 2008) and is
home to 16,000 students.
We have engaged with all 3 Leeds-based universities as part of this work to understand more
about their academic and research strengths. The University of Leeds has strengths in several key
sectors which are being targeted in respect of innovation:

Page 26
Health / bio science
Water
Energy
Future Cities
Food
Culture
The University has expressed the view that there is an inadequate supply of sites and premises in
Leeds to accommodate research and development businesses emerging from its campus, and that
as a result there has been a leakage of occupiers to other cities/city regions. The University is
developing plans for creating a new innovation centre on its campus off Woodhouse Lane in Leeds
but has identified the importance of large, multi scale, dedicated R&D parks to accommodate
move on and facilitate greater level of interaction with supply chains in these sectors.
Leeds Beckett University has a number of sector strengths in sport, business, law, finance, music
and the arts. The Universities are keen to develop their respective innovation capacities and
capabilities and are exploring opportunities to do this both on and off campus at present.
Leeds Trinity University is currently growing and has an expressed an interest in occupying space
for work based training within an Airport Hub. They regard the proposed hub as an opportunity to
show-case the University on the national and international stage.
Growth implications for LBIA
The LCR is one of the highest performing regional economies in terms of labour market performance and growth. Its position as the largest city regional economy outside of London contrasts markedly with the airport’s status as 16th largest; the growth of the economy in the future will drive the potential for growth of the airport, and vice versa. Of particular significance to the Airport commercial hub vision is the fact that the city region has strengths in a number of economic sectors which will drive demand for commercial land and floor space and present opportunities for the hub. Key growth sectors include professional/financial services, advanced manufacturing, health and bio-science, creative and digital industries, food and drink and low carbon industries. Many of these sectors will benefit from high profile well connected locations such as the Airport where being at the ‘front door’ to the city region assists connections with suppliers, parent companies, and clients. Evidence from UK and abroad demonstrates there to be a healthy appetite from occupiers to locate close to airports. Our analysis of the R&D sector reveals a particular opportunity for more land and premises to meet demand. The University of Leeds has confirmed the leakage of many of the businesses that emerge from campus as a result of a lack of suitable premises. LBIA can offer a unique location for accommodating this potential demand.

Page 27
5 LBIA Growth Drivers: Aviation Demand for commercial land and premises
The DfT is projecting an increase in its passenger numbers from 3.3m passengers per annum at
present to 7.1m passengers per annum by 2030. This significant growth in passenger numbers will
require the airport to expand its footprint and will drive demand for additional land and premises
across three key areas:
Core operational requirements – to meet the growth ambitions, there will be a need to
increase the capacity of the passenger terminal and other associated operational facilities such
as aprons, taxiways, hangars, baggage handling, fuel stores and maintenance facilities. We
have been advised by the Airport that it will require the expanse of land to the west of the
existing terminal building currently comprising office and ancillary accommodation. This area
is approximately 3.2 ha, and therefore additional land outside the main airport boundary will
be required to accommodate the relocation of existing uses on the site.
Non-operational ancillary commercial land/floorspace requirements – there will be a need
for additional land and floorspace for additional/expanded flight operating companies (crew
facilities/office space/maintenance facilities), catering organisations, ground handling facilities
(e.g. Swissport) and others such as flight training/skills development facilities (i.e. the Aviation
Academy/Multiflight etc). There is an opportunity for the Airport to develop its freight/cargo
operations. It is currently ranked 24th nationally in terms of its cargo tonnage in 2013 (324
tonnes) and the airport considers there to be an opportunity to increase this perhaps ten-fold
over the medium term to around 3,000-4,000 tonnes per annum, in line with the current
tonnage at Newcastle Airport. This would have implications for the need for additional
cargo/freight handling facilities, transit sheds and distribution facilities.
Supply chain related requirements (aviation businesses / occupiers) – as the airport expands
there is the potential for it to attract occupiers in the aviation sector which have a preference
to be located in close proximity to the airport. These may include for example, aircraft
component manufacturing/supply businesses, freight forwarders, which typically seek to
locate adjacent to airports.
Benchmarking comparable airports
We have undertaken a review of a number of comparable regional airports elsewhere across the
UK to understand more about the extent of their spatial footprint and the extent to which they
have either current or planned commercial floorspace either within or in close proximity to the
airport boundary. We have undertaken a review of the following as part of this, with a summary
below and a more detailed analysis is presented within Appendix I:

Page 28
Newcastle Airport – accommodates 7,000 sq m Freight Village (with expansion land) and the
Airport Industrial Estate is located 3 miles from the Airport, comprising 18,000 sq m of light
industrial floorspace (only c.460 sq m is vacant). The Newcastle International Airport Business
Park is currently being marketed and comprises 50 hectares owned by the Airport which could
accommodate up to 1m sq ft of commercial development (allocated in emerging Local Plan).
There are 7 hotels within a 2.5 mile radius of the airport.
Liverpool John Lennon Airport - TNT distribution facility on a 1.6 ha (4 acre) site to the east of
terminal. An expanded cargo and maintenance facility is planned adjacent to the airport of
around 7 ha. Liverpool International Business Park is a 157 acre (62 hectare) site situated
adjacent to Liverpool John Lennon Airport. Planning consent has been granted for B1/B2/B8
uses on the site and buildings ranging from 50,000 sq. ft. (4,645 sq. m.) to 500,000 sq. ft.
(46,452 sq. m.) can be accommodated. 14 ha (35 acres) of development land is currently being
marketed. Estimated to be circa 340,000 sq m (3.5 million sq ft) of mixed office, industrial,
warehousing and commercial leisure accommodation within 2 km (1.2 miles) of JLA when
these sites are fully built out (including existing local employment sites). 4 hotels immediately
adjacent to airport.
Bournemouth Airport - the Aviation Park is adjacent to the Airport, comprising a mix of
technology, industry and freight uses across 80 hectares (200 acres) of land and buildings
allocated for employment use. It provides approximately 150,000 sq m of business space being
developed by the owners of the airport. There are plans to develop a further 50,000 sq m of
employment space on this site (outline consent secured).
East Midlands Airport – home to 17,000 sq m of cargo floorspace and a further 66,000 sq m of
commercial floorspace owned by the Airport on site. The Pegasus Business Park is located
adjacent to the Airport and comprises 26 ha of land (10 ha remain undeveloped) and a total of
20,000 sq m of B1 floor space. Plans to bring forward the remaining 10ha at Pegasus for office,
logistics, general warehousing and hotel uses. Land to the south of the Pegasus Business Park,
has been identified as potential employment land. Land has also been reserved for the further
development of the DHL Hub building at Cargo West and land will also be safeguarded for a
second major integrator hub in Cargo East. Plans are also being developed to deliver a rail
freight terminal capable of providing up to 600,000 sq m of B8 floorspace. 4 hotels
immediately adjacent to airport
Aberdeen Airport - Existing cargo facilities on the airport site occupy 2,400 sq m of floorspace.
Adjacent to the Airport are two well established industrial estates with a number of large
oil/gas company occupiers. Also adjacent to the Airport is the 54 acre ABZ Business Park, with
outline planning consent for a mix of office, industrial and hotel uses. Also in close proximity to
the Airport is the D2 Business Park with outline planning consent for 100,000 sq m of
Page 29
office/industrial/ancillary employment uses. Adjacent to this is additional land allocated for
employment or HE/research use. 6 hotels within close proximity of the airport
In summary, it is evident that all 5 of these comparator airports have either an established or
pipeline supply of employment land adjacent to their operational boundaries as well as
cargo/freight handling facilities within the airport boundaries. In terms of adjacent commercial
employment land, Bournemouth has an 80 ha employment site, Liverpool a 62 ha site, Newcastle a
60 ha site, East Midlands a 26 ha site and Aberdeen a 22 ha site. These are all dedicated business
parks that are being developed and marketed on the back of their proximity to the airport assets.
Potential for growth at LBIA
Estimates of the likely future land and premises requirements of the Airport are set out below
based upon the assumed passenger and cargo growth projections and using benchmarks from
comparator airports elsewhere.
Core operational requirements – as above and advised by LBIA, it is assumed that there is a
requirement for an additional 3.2ha of land to accommodate the existing office/ancillary functions
to the west of the main terminal building. This would enable the airport to expand its core
operational floorspace on this vacated land to meet its growth projections.
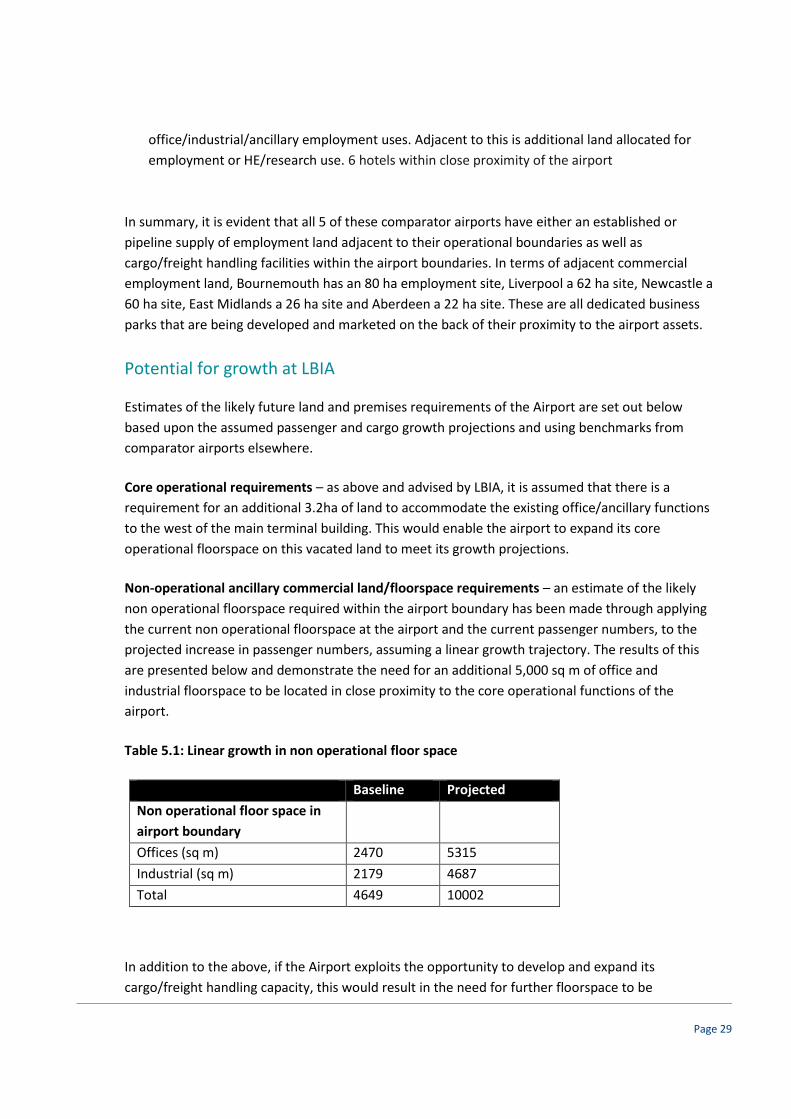
Non-operational ancillary commercial land/floorspace requirements – an estimate of the likely
non operational floorspace required within the airport boundary has been made through applying
the current non operational floorspace at the airport and the current passenger numbers, to the
projected increase in passenger numbers, assuming a linear growth trajectory. The results of this
are presented below and demonstrate the need for an additional 5,000 sq m of office and
industrial floorspace to be located in close proximity to the core operational functions of the
airport.
Table 5.1: Linear growth in non operational floor space
In addition to the above, if the Airport exploits the opportunity to develop and expand its
cargo/freight handling capacity, this would result in the need for further floorspace to be
Baseline Projected
Non operational floor space in
airport boundary
Offices (sq m) 2470 5315
Industrial (sq m) 2179 4687
Total 4649 10002

Page 30
developed to provide cargo handling/freight forwarding/distribution facilities. If it is assumed that
LBIA develops a similar scale cargo handling level as currently at Newcastle Airport (c.3,000 – 4,000
tonnes per annum), it could be assumed that it may require a similar scale of cargo/freight
floorspace to support this. This would equate to the need for a minimum of 7,000 sq m of cargo-
related floorspace within/immediately adjacent to the airport site to enable this.
If the provision of skills-based facilities increases (i.e growth in the Aviation Academy/Multiflight
facilities), this could support the need for further on site floorspace given the need for these
facilities to be airside. The Aviation Academy has recently leased additional space from Multiflight
as is expanding and so this could be a realistic possibility over the medium term.
In addition to this, there would also be the likely need for a consolidation centre at the airport if it
is to realise its growth ambitions and again this would require further land.
Supply chain related requirements – it is difficult to quantify the likely spatial requirements of
aviation related businesses that may be attracted to the airport location over the medium term. By
way of example, Bournemouth’s Aviation Park has just secured a deal with Aim Aviation which
manufactures aviation interiors, to develop a 16,000 sq m advanced manufacturing and R&D
facility.

Page 29
Summary of benchmark airports across the UK
Airport Passenger
Numbers (million)
Cargo Movements
(tonnes)
Airport
Operation
al Area
Direct
number
of FTE
jobs on
Airport
site
Existing employment uses
within/adjacent to Airport
Planned/pipeline employment uses
within/adjacent to Airport
2013 Projected
(2030)
2013 Projecte
d (2030)
Newcastle 4.42 8.50 3,701
(plus
6,512
tonnes
of mail)
Growth
planned
374 ha 3,200 7 hotels within 2.5 mile radius
Freight Village – 7,000 sqm
Airport Industrial Estate (3 miles from
the Airport). 91 light industrial units
totalling 202,766 sq ft (18,838 sqm).
Only 5,000 sqft vacant.
Newcastle International Airport Business
Park – 50 hectares owned by the Airport –
up to 1m sqft of commercial development
(allocated in emerging Local Plan). Phase 1
for 175,000 sqft of B1 Grade A floorspace
has outline planning consent. Additional
land that can accommodate 450,000 sqft of
freight/distribution space (planning
application being developed). Third plot for
major HQ. Sites currently being marketed
by agents. UK Land Estates on board as
developer.
Freight Village expansion land
East
Midlands
4.33 10.0 (2040) 266,96
8 (plus
30,000
tonnes
of mail)
618,000
tonnes
(2035)
and
700,000
445 ha 6,500 17,094sqm (184,000sqft) cargo
floorspace including 728sqft freight
handling units to 67,918 sqft transit
sheds.
East Midlands Gateway Strategic Rail
Freight Interchange - plans are being
developed to deliver a rail freight terminal
capable of providing up to 6m sqft of B8
floorspace

Page 30
tonnes
(2040)
plus
30,000
tonnes of
Further 66,000 sqm of commercial
floorspace owned by airport let on
ground leases. Over 100 tenants in
total at Airport
Pegasus Business Park - in the south
west corner of the airport site. 26
hectares, of which 10 remain
undeveloped. Total of c.200,00 sqft of
B1 floorspace, including 25,000 sqft
Regus building, PWC Office, National
Grid
4 hotels including 3 at Pegasus
Business Park including
Land has been reserved for the further
development of the DHL Hub building at
Cargo West and land will also be
safeguarded for a second major integrator
hub in Cargo East.
Pegasus Business Park has an extant
planning consent for business park
development including hotels and
conference centres – 10 hectares to be
developed. Commercial development
proposals associated with the airport will be
brought forward for sites within the Pegasus
Business Park. These uses will include
offices, logistics, general warehousing and
hotels.
Land to the south of the Pegasus Business
Park, has been identified as potential
employment land in the North West
Leicestershire Employment Land Availability
Assessment (2013).
Liverpool 4.19 12.3 (2030) 278
(down
from
9,000
tonnes
in 2004
due to
contrac
t
220,000
tonnes
(2030)
186 ha 2,150 TNT invested £6 million in the
provision of a new large distribution
facility on a 1.6 ha (4 acre) site to the
east of terminal.
Hotels - Crown Plaza, Hampton by
Hilton (on site), Holiday Inn Express,
Premier Inn
An expanded cargo and maintenance
facility is planned adjacent to the airport of
around 7 ha to handle forecast growth of
cargo to around 40,000 tonnes pa
Liverpool International Business Park is a
157 acre (62 hectare) site situated adjacent
to Liverpool John Lennon Airport. Planning
consent has been granted for B1/B2/B8
uses on the site and buildings ranging from
50,000 sq. ft. (4,645 sq. m.) to 500,000 sq.
Page 31
withdra
wals
ft. (46,452 sq. m.) can be accommodated.
Current occupiers include B&M and
Prinovis. 35 acres of development land is
currently being marketed.
Including the above plus the Wings Leisure
and Entertainment Park and Blue Lands
Business Park, when fully developed out
these will provide over 340,000m2 (3.5
million ft2) of mixed office, industrial,
warehousing and commercial leisure
accommodation within 2 km (1.2 miles) of
JLA.
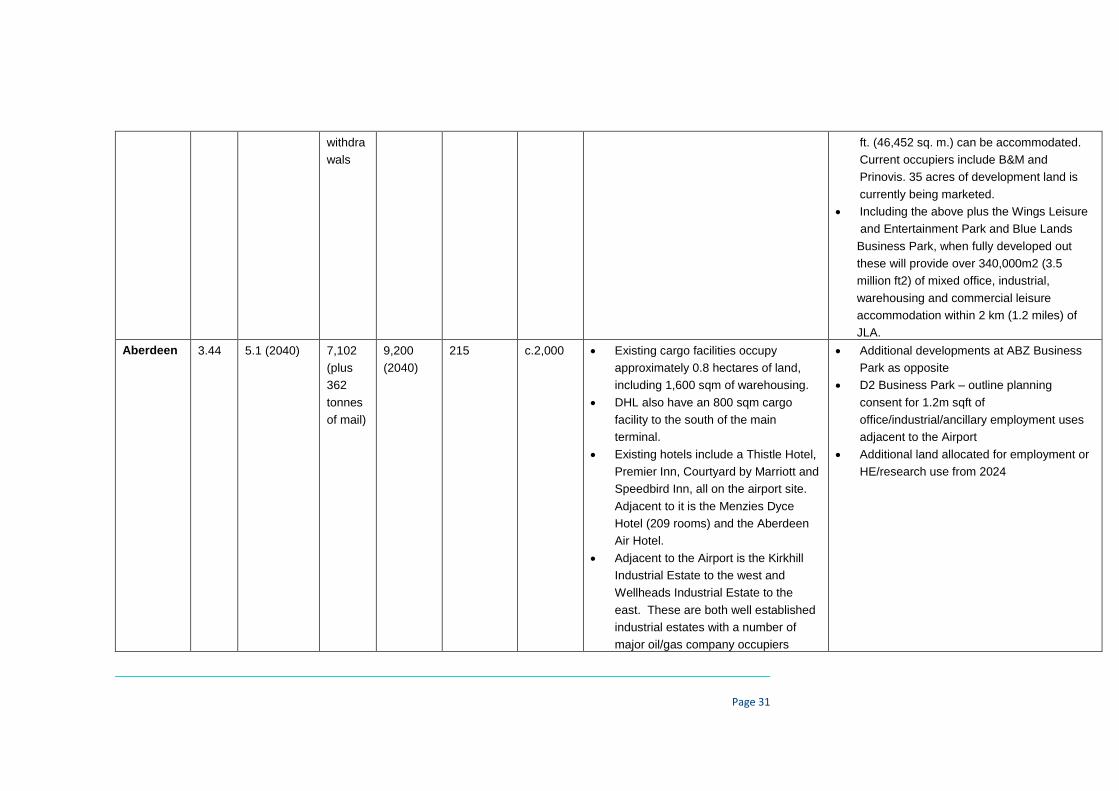
Aberdeen 3.44 5.1 (2040) 7,102
(plus
362
tonnes
of mail)
9,200
(2040)
215 c.2,000 Existing cargo facilities occupy
approximately 0.8 hectares of land,
including 1,600 sqm of warehousing.
DHL also have an 800 sqm cargo
facility to the south of the main
terminal.
Existing hotels include a Thistle Hotel,
Premier Inn, Courtyard by Marriott and
Speedbird Inn, all on the airport site.
Adjacent to it is the Menzies Dyce
Hotel (209 rooms) and the Aberdeen
Air Hotel.
Adjacent to the Airport is the Kirkhill
Industrial Estate to the west and
Wellheads Industrial Estate to the
east. These are both well established
industrial estates with a number of
major oil/gas company occupiers
Additional developments at ABZ Business
Park as opposite
D2 Business Park – outline planning
consent for 1.2m sqft of
office/industrial/ancillary employment uses
adjacent to the Airport
Additional land allocated for employment or
HE/research use from 2024

Page 32
Also adjacent to the Airport is the 54
acre ABZ Business Park. It has outline
planning consent for a mix of office,
industrial and hotel uses and some
speculative office development is
already underway, with a number of
occupiers having already taken space
on the site. Development is also
underway to construct a 200 bedroom
4-star Holiday Inn and a 130 bedroom
3-star Holiday Inn Express, expected
to open in late 2015. Regus is also
due to open a business centre on the
site in 2015.
Bournemo
uth
0.66 4.5 (2030) 1,818
(plus
7,600
tonnes
of mail)
Assumes
current
level
maintain
ed
366 ha 2,700
(2005
data)
The Aviation Park is adjacent to the
Airport, comprising a mix of
technology, industry and freight uses
across 80 hectares (200 acres) of land
and buildings allocated for
employment use. It provides c.1.6m sq
ft of business space, supports over
200 businesses and around 2,500
jobs. It comprises offices, industrial
units, distribution, hangars and
workshop sites, with a mix of both
aviation and non-aviation related
In 2012, MAG Developments unveiled a
ten-year masterplan vision for the
development of 540,000 sqft of new
business space – including offices,
industrial units, warehousing and
distribution facilities, and aviation uses such
as hangars.MAG Developments has already
secured outline planning permission for the
project – granted December 2011 – to
deliver a range of quality new business
premises and commercial space, split

Page 33
occupiers, which are generally
attracted by the prestige of being
based at the airport It is owned and
operated by the Manchester Airport
Group, the owners of the Airport. It
includes a Basepoint Business Centre
across five separate plots, totalling around
35 acres.
Page 34
6 LBIA Growth Drivers: Commercial
In this section we examine the commercial potential of the Airport hub through providing an
assessment of the mainstream office and industrial commercial markets operating in Leeds. We
have examined the market for land and premises across each sector at both the local LBIA (within a
2 mile radius) and wider Leeds levels.
The Leeds office market
Leeds is one of the UK’s largest regional office centres with particular strengths in the financial and
professional service sector. It is home to a number of major banks and accountancy firms and is
becoming one of the most important legal centres outside of London. The size and strength of the
labour market drives demand for office floor space from a wide range of sectors and occupier
types and the City has healthy Out-of-Town, as well as City Centre, office markets.
Recent market conditions have been characterised by increasing take up and falling supply which
has put pressure on rents and yields with many predicting a tipping point on the horizon and a
return to more widespread development activity than has so far been observed. A number of
development starts are underway and occupier and investor sentiment is now beginning to
improve for the out of town market as well as the City Centre.
2013 saw a record-breaking volume of lettings in Leeds with approximately 120,000 sq m (1.3m sq
ft) transacted in the City Centre and out of town markets combined, significantly above the long
term average of 85,000 sq m (920,000 sq ft). Although this year has so far indicated a return to
average levels, there remains strong pent up interest driven by a number of pre let requirements
with lease events in 2015/16.
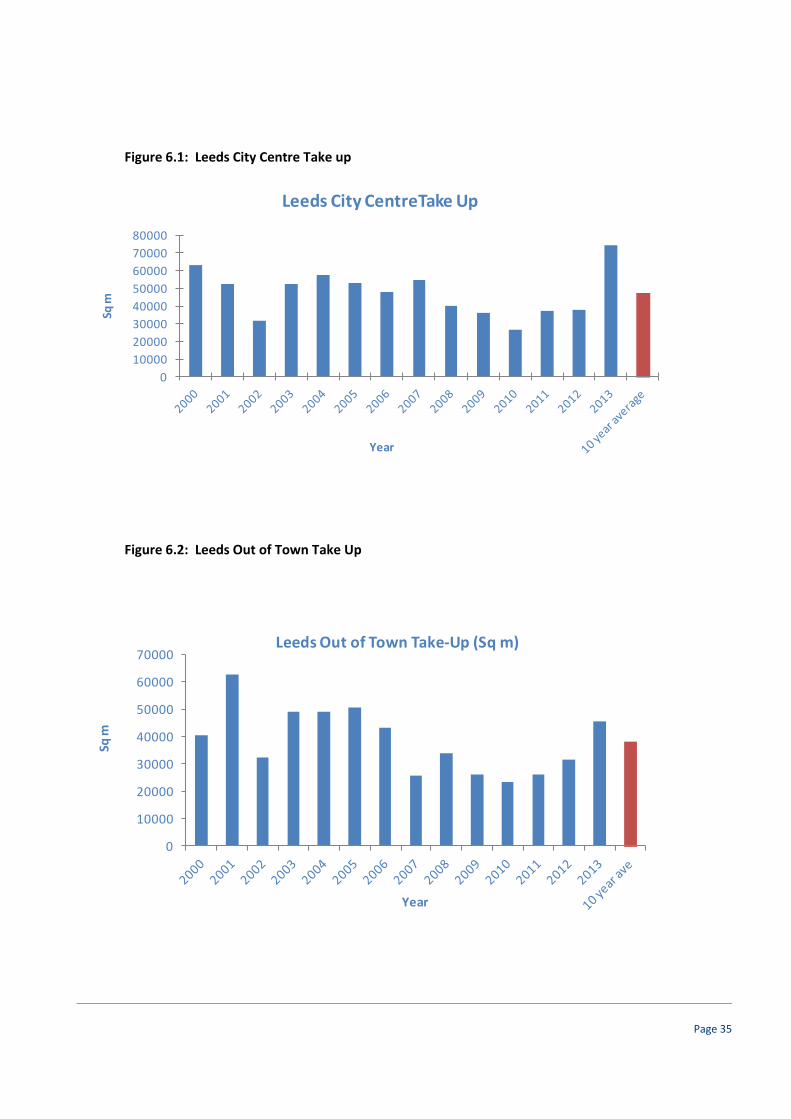
As Figure 6.1 below shows, there has been a gradual increase in take up in the City Centre office
market from 2010 onwards with a peak in 2013. The long term 10 year average is 47,500 sq m
(500,000 sq ft). Figure 6.2 shows a similar pattern for the out of town market in the last three
years with a long term 10 year average of 38,300 sq m (400,000 sq ft).
Availability has been in a period of decline as a result of the lack of development activity with the
level of Grade A premises on the market falling to circa 20,000 sq m (215,000 sq ft), less than half a
year’s supply. Figure 6.3 below illustrates the long term trends in availability showing the
dramatic fall in total availability from peak in 2010.
The development pipeline has responded. For example, No. 6 Wellington Place (105,000 sq ft) is
under construction and due for delivery in December 2015. Similarly, Wellington Street (220,000 sq
ft) is due to be delivered in Q1 2016. Sovereign Square, Sovereign Street (95,000 sq ft) has detailed
planning consent and construction is due to start in December 2014 for delivery in Q2 2016.
Page 35
Figure 6.1: Leeds City Centre Take up
Figure 6.2: Leeds Out of Town Take Up
0
10000
20000
30000
40000
50000
60000
70000
80000
Sq m
Year
Leeds City CentreTake Up
0
10000
20000
30000
40000
50000
60000
70000
Sq m
Year
Leeds Out of Town Take-Up (Sq m)

Page 36
Figure 6.3: Grade A office availability in Leeds 1997 to 2013 (Sq m)
Looking at the future supply of land for office development in the City, there are a number of
major office schemes proposed as illustrated in Table 6.1 below. Within the City Centre, the
remaining development parcels at Wellington Place represent the most significant scheme in the
pipeline with approximately 110,000 sq m still to be built out. In the out of town market, there are
only two major sites, with Thorpe Park offering land for over 110,000 sq m of office floor space and
Leeds Valley Park almost 10ha.
Table 6.1: Proposed office developments
Office sites Acres Ha Sq ft Sq m
City Centre
Wellington Place 0.00 1,200,000 111,480
Yorkshire Post Site 5.00 2.02 300,000 27,870
Lattitude 2.00 0.81 375,000 34,838
City Square House 175,000 16,258
Sovereign Square 83,000 7,711
Central Square 225,000 20,903
Whitehall Riverside 500,000 46,450
Out of town
Thorpe Park 1,200,000 111,480
Leeds Valley Park 24 9.71
0
10000
20000
30000
40000
50000
60000
700001
99
7 Q
1
19
97
Q3
19
98
Q1
19
98
Q3
19
99
Q1
19
99
Q3
20
00
Q1
20
00
Q3
20
01
Q1
20
01
Q3
20
02
Q1
20
02
Q3
20
03
Q1
20
03
Q3
20
04
Q1
20
04
Q3
20
05
Q1
20
05
Q3
20
06
Q1
20
06
Q3
20
07
Q1
20
07
Q3
20
08
Q1
20
08
Q3
20
09
Q1
20
09
Q3
20
10
Q1
20
10
Q3
20
11
Q1
20
11
Q3
20
12
Q1
20
12
Q3
20
13
Q1
20
13
Q3
20
14
Q1
20
14
Q3

Page 37
However whilst these schemes may appear on the surface to give Leeds a substantial quantum of years’ supply, given the scale of annual take up, they may be exhausted within the next plan period. In strategic planning the future market there is a need to consider the next wave of office schemes to ensure there is enough of the right quantity and quality to meet market requirements. In summary, office market conditions are improving and as occupier and investor sentiment continue to strengthen there is likely to be a resurgence of demand for developing new schemes. The scale of demand year on year is such that Leeds needs to bring forward new development opportunities in both in and out of town locations to meet long term market requirements, underlining the potential of Leeds Bradford International Airport.
LBIA office market
There is an established local office market operating in close proximity to Leeds Bradford Airport, with a small number of well occupied office buildings/parks:
Airport West, Lancaster Way – modern purpose built business park located off A658 Harrogate Road opposite the White House Lane entrance to the airport
Moorfield Business Estate located immediately to the south of the Airport on the west side of A658 Harrogate Road, comprising a mix of office and industrial accommodation
Aireview Court on the A65, period renovation multi occupancy premises
Rawdon Park, Green Lane, purpose built offices
Airport West is the most significant of these, a scheme delivered close to the peak of last property cycle. The scheme was developed by Rushbond with the first two phases of the scheme completed in 2006/07 comprising 8,770 sq m (94,000 sq ft) across seven buildings. A further 2,480 sq m is proposed as part of Phase 3 with Phase 4 being promoted for a pub/restaurant. These office premises cater for a wide range of occupiers including professional services, IT / media, airport related. Occupiers at Airport West include Leeds Bradford International Airport, Nunwood Consulting (a management consultancy), Towergate Risk Solutions (insurance brokers), WLP (digital media company), Westgate Properties (property consultancy). There has been a regular churn of occupiers and new lettings in recent years resulting from the relocations both within and from outside the local area. The Estates Gazette Interactive database (EGi) recorded a number of building lettings and sales in the last 30 months, as illustrated in Table 6.2 below, indicating a healthy demand for property on a leasehold and freehold basis. Transactions have been predominantly at the smaller end of the size spectrum with lettings typically 500 sq m (5,400 sq ft) and under. According to EGi, over the period 2008-2013, there has been an average of 2881 sq m (31,000 sq ft) of floor space transacted per annum.

Page 38
Table 6.2: Office transactions 2012-2014 within a 2 mile radius of LBIA (source EGi)
In respect of availability, according to EGi there is currently approximately 3,195 sq m (34,000 sq ft)
of office floor space available on the market in the local area, with a pipeline of a further 2,480 sq
m comprising the outstanding phase of development at Airport West (see Table 6.3 below). The
existing properties are generally small in size and second hand.
Table 6.3: Existing Availability of office property within 2 mile radius of LBIA (EGi)
The existing office market at Leeds Bradford International Airport therefore shows potential for
growth in the future. With an average take up of 2881 sq m per annum (31,000 sq ft), there is a
healthy demand for new floor space which, allowing for the take up of outstanding/projected
availability (5,675 sq m), could generate demand for new floor space in approximately 2 years’
time.
Transaction Deal/Auction
type Address date Size (sq m) Size(sq ft) Purchaser/Lessee
Auction Albion House, Rawdon Park, Yeadon, Leeds, LS19 7XX 27/03/2014
Lease Ground Floor, Rawdon Court, 20 Leeds Road, Rawdon, Leeds, LS19
6AX
01/03/2014 251 2,700 Claims Management Solutions
LimitedSale Elmwood House, Ghyll Royd, Guiseley, Leeds, West Yorkshire, LS20
9LT
01/03/2014 591 6,366 JM Glendinning (Insurance
Brokers) LimitedLease Unit 10, 8-10 New Road Side, Rawdon, Leeds, LS19 6HN 01/12/2013 30 328 Undisclosed letting
Sale Unit 8, Airport West, Lancaster Way, Yeadon, Leeds, LS19 7ZA 01/10/2013 1,161 12,500 Romero Insurance Brokers
LimitedSale Airport West, 2 Lancaster Way, Harrogate Road, Yeadon, Leeds, LS19
7ZA
01/08/2013 571 6,141 Undisclosed Occupier
Lease Unit 1, Airport West, Lancaster Way, Yeadon, Leeds, LS19 7ZA 01/08/2013 372 4,000 Complete Care Agency Limited
Sale Unit 2, Airport West, Lancaster Way, Yeadon, Leeds, LS19 7ZA 01/06/2013 557 6,000 One Global
Lease Unit A (part), Home Farm Industrial Park, The Avenue, Esholt, Shipley,
West Yorkshire, BD17 7RH
01/06/2013 122 1,317
Sale Unit K, Home Farm Industrial Park, The Avenue, Esholt, Shipley, West
Yorkshire, BD17 7RH
01/04/2013 46 500 Orthodontics
Lease Unit E, 1st Floor, Home Farm - Esholt Hall, Esholt Hall Estate, Esholt,
Shipley, West Yorkshire, BD17 7QU
15/01/2013 63 675 Summer Boarding Courses
LimitedLease Airport West - Altitude 4, Lancaster Way, Yeadon, Leeds, LS19 7ZA 15/01/2013 101 1,091 Toriga Energy Limited
Lease 1st and 2nd Floor, Sizer's Court, 1 Henshaw Lane, Yeadon, Leeds,
LS19 7RW
01/10/2012 252 2,714 Undisclosed Occupier
Lease Airport West - Altitude 4, Lancaster Way, Yeadon, Leeds, LS19 7ZA 01/09/2012 199 2,145 Customer Metrics Limited
Lease Unit 3, Airport West, Lancaster Way, Yeadon, Leeds, LS19 7ZA 01/07/2012 825 8,880 Filtronic Plc
Lease Unit E, Home Farm Industrial Park, The Avenue, Esholt, Shipley, West
Yorkshire, BD17 7RH
01/07/2012 63 675 Circle Controls
Lease Unit A (part), Home Farm Industrial Park, The Avenue, Esholt, Shipley,
West Yorkshire, BD17 7RH
01/04/2012 268 2,886 Brilliant UK Limited
Lease Unit 5/7, Moorfield Industrial Estate, Moorfield Road Estate, Yeadon,
Leeds, LS19 7BN
01/03/2012 133 1,430 Undisclosed Occupier
Lease Moorfield Industrial Estate, Moorfield Road Estate, Yeadon, Leeds,
LS19 7BN
01/03/2012 121 1,300 Undisclosed Occupier
Lease Unit 8, 8-10 New Road Side, Rawdon, Leeds, LS19 6HN 01/03/2012 30 323 Undisclosed Occupier
Sale 12 New Road Side, Rawdon, Leeds, LS19 6HN 01/03/2012 187 2,010 Undisclosed Occupier
Sale Unit D, Home Farm - Esholt Hall, Esholt Hall Estate, Esholt, Shipley,
West Yorkshire, BD17 7QU
15/02/2012 475 5,112 PPS
Lease Unit D, Home Farm Industrial Park, The Avenue, Esholt, Shipley, West
Yorkshire, BD17 7RH
01/02/2012 475 5,112 PPS
Sale Rawdon House, Leeds Road, Leeds, West Yorkshire, LS19 7XX 25/01/2012 3,149 33,891 Emis Limited
Total space
Type of
Address Unit description Unit size (sq m) Unit size (sq ft) tenure Grade of space
Realtex House, 2 Leeds Road, Leeds, LS19 6AX 1st (part) 54 581 Leasehold Second-hand Grade
BRealtex House, 2 Leeds Road, Leeds, LS19 6AX 1st (part) 84 909 Leasehold Second-hand Grade
BAire View Court, Low Green, Leeds, LS19 6HB Ground (part) 67 720 Leasehold Second-hand Grade
BAire View Court, Low Green, Leeds, LS19 6HB 2nd (part) 121 1300 Leasehold Second-hand Grade
B1a Harrogate Road, Leeds, LS19 6HW 1st 45 479 Leasehold New - Refurb
(existing)Moorfield Road Estate, Leeds, LS19 7BN Unit 2 268 2880 Leasehold Second-hand Grade
BKirkfields Business Centre, Kirk Lane, Leeds, LS19 7ET Entire Building 904 9735 Leasehold New - Refurb
(existing)High Street House, 2 High Street, Leeds, LS19 7PP Suite 7 17 180 Leasehold Second-hand Grade
BHigh Street House, 2 High Street, Leeds, LS19 7PP Suite 4 19 205 Leasehold Second-hand Grade
BHigh Street House, 2 High Street, Leeds, LS19 7PP Suite 5 26 285 Leasehold Second-hand Grade
BHigh Street House, 2 High Street, Leeds, LS19 7PP Suite 1 28 300 Leasehold Second-hand Grade
BKmh House, High Street, Leeds, LS19 7PP Ground (part) 44 473 Leasehold Second-hand Grade
BBritannia Chambers, 67 High Street, Leeds, LS19 7SP 1st and 2nd 93 1003 Leasehold Second-hand Grade
BTarn House, 77 High Street, Leeds, LS19 7SP 1st 168 1810 Leasehold Second-hand Grade
BSpringfield House, White House Lane, Leeds, LS19 7UE Springfield Cottage Ground Floor 84 902 Leasehold Second-hand Grade
BFairbank House, 1 Moorfield Close, Leeds, LS19 7YA Unit 1 74 800 Leasehold New - Refurb
(existing)Fairbank House, 1 Moorfield Close, Leeds, LS19 7YA Unit 5/7 133 1430 Leasehold Second-hand Grade
BMoorfield Business Park, Moorfield Close, Leeds, LS19 7YA Unit 15 468 5040 Leasehold or
Freehold
Second-hand Grade
BMoorfield Business Park, Moorfield Close, Leeds, LS19 7YA Axiom House, Unit 7 0 0 Leasehold Second-hand Grade
BAirport West, Lancaster Way, Leeds, LS19 7ZA Unit 7 167 1796 Leasehold Second-hand Grade
BBuilding One, Lancaster Way, Leeds, LS19 7ZA Ground and 1st 331 3561 Leasehold Second-hand Grade
BLancaster House, Lancaster Way, Leeds, LS19 7ZA Entire Building 2480 26700 Leasehold or
Freehold
New - New Build
(pre-construction)

Page 39
Regional industrial market
Market conditions have been gradually improving in the industrial sector across the UK. Gross
Domestic Product grew by 1.9% in 2013, the fastest since 2007 and business surveys have reported
an improvement in export demand in the last 12 months together with increasing investment
intentions.
Improvement in the general economic environment has transmitted itself unevenly to the
industrial sector. Total take up over 2013 actually fell nationally, although the quantity of ‘prime’
deals increased, driven by an upturn in built-to-suit activity. However, Yorkshire bucked the
general trend where a record level of take up was observed and a significant drop in prime space in
the market.
Take-up for industrial / warehouse premises in Yorkshire (buildings over 10,000 sq m) reached a
record 5 year high of over 400,000 sq m in 2013. For the larger space occupiers, total availability in
the region is reported to be approximately 350,000 sq m and includes 3 buildings that returned to
the market at Wakefield Europort and Bretton Park in Dewsbury. Average take up of large
buildings over the past 5 years has been approximately 325,000 sq m per annum and therefore
predictions are that the region will run out of available buildings in the next 18 months.
Whilst development activity remains largely restricted to build to suit deals, there is a generally
held view among industrial agents that a return to development is now on the horizon in the short
to medium term as a result of rental pressure and growing occupier sentiment. DTZ Research
predicts rental growth of an average of 2% per annum over the period 2014-2018 in the Leeds
industrial market.

Page 40
Figure 6.4: Yorkshire Industrial take up (sq m)
Figure 6.5: Yorkshire Grade A availability (sq m)
Leeds employment land market
The above charts provide details of the take up and availability of land for the region as a whole
which disguise the shortage of readily available land and premises in the Leeds area. The lack of
readily available sites and premises in Leeds has meant that many occupiers have failed to find
suitable accommodation and as a result have sought property in other regions. An example of this
0
20000
40000
60000
80000
100000
120000
140000
160000
180000
Yorkshire Industrial take up (sq m)
-
100,000.00
200,000.00
300,000.00
400,000.00
500,000.00
600,000.00
700,000.00
800,000.00
20
09
Q3
20
09
Q4
20
10
Q1
20
10
Q2
20
10
Q3
20
10
Q4
20
11
Q1
20
11
Q2
20
11
Q3
20
11
Q4
20
12
Q1
20
12
Q2
20
12
Q3
20
12
Q4
20
13
Q1
20
13
Q2
20
13
Q3
20
13
Q4
20
14
Q1
20
14
Q2
20
14
Q3
Yorkshire Industrial Grade A Availability (Sq m)
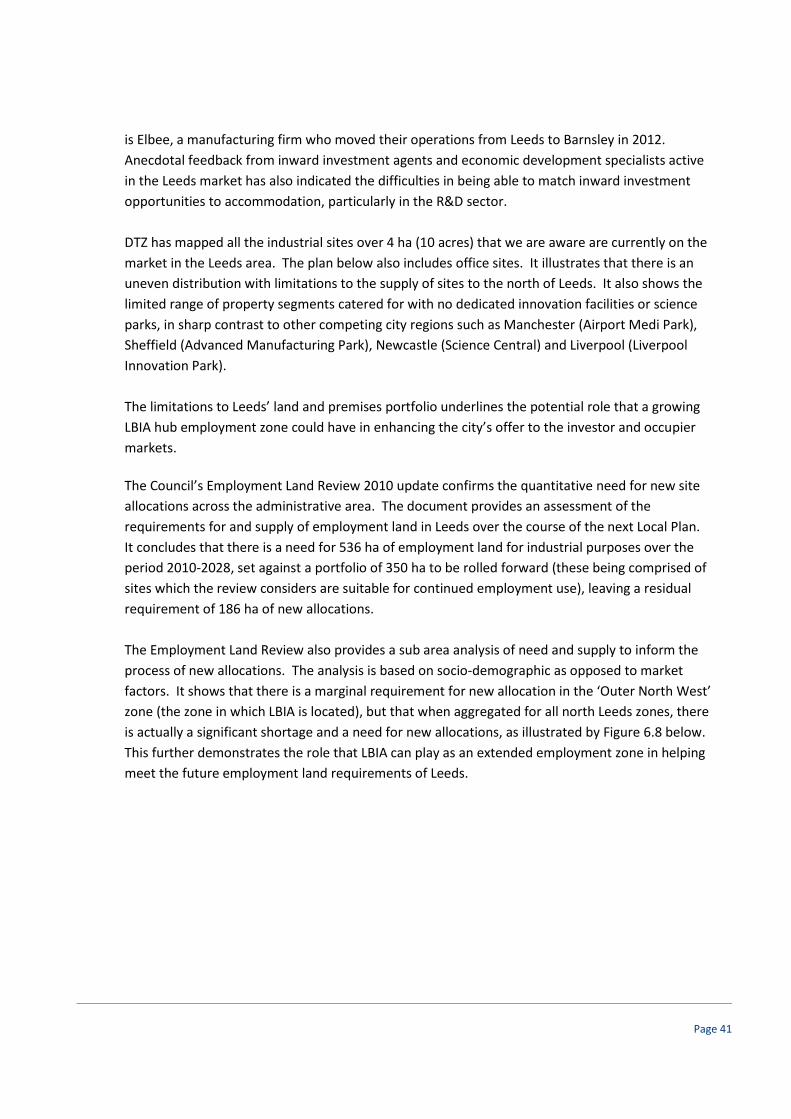
Page 41
is Elbee, a manufacturing firm who moved their operations from Leeds to Barnsley in 2012.
Anecdotal feedback from inward investment agents and economic development specialists active
in the Leeds market has also indicated the difficulties in being able to match inward investment
opportunities to accommodation, particularly in the R&D sector.
DTZ has mapped all the industrial sites over 4 ha (10 acres) that we are aware are currently on the
market in the Leeds area. The plan below also includes office sites. It illustrates that there is an
uneven distribution with limitations to the supply of sites to the north of Leeds. It also shows the
limited range of property segments catered for with no dedicated innovation facilities or science
parks, in sharp contrast to other competing city regions such as Manchester (Airport Medi Park),
Sheffield (Advanced Manufacturing Park), Newcastle (Science Central) and Liverpool (Liverpool
Innovation Park).
The limitations to Leeds’ land and premises portfolio underlines the potential role that a growing
LBIA hub employment zone could have in enhancing the city’s offer to the investor and occupier
markets.
The Council’s Employment Land Review 2010 update confirms the quantitative need for new site
allocations across the administrative area. The document provides an assessment of the
requirements for and supply of employment land in Leeds over the course of the next Local Plan.
It concludes that there is a need for 536 ha of employment land for industrial purposes over the
period 2010-2028, set against a portfolio of 350 ha to be rolled forward (these being comprised of
sites which the review considers are suitable for continued employment use), leaving a residual
requirement of 186 ha of new allocations.
The Employment Land Review also provides a sub area analysis of need and supply to inform the
process of new allocations. The analysis is based on socio-demographic as opposed to market
factors. It shows that there is a marginal requirement for new allocation in the ‘Outer North West’
zone (the zone in which LBIA is located), but that when aggregated for all north Leeds zones, there
is actually a significant shortage and a need for new allocations, as illustrated by Figure 6.8 below.
This further demonstrates the role that LBIA can play as an extended employment zone in helping
meet the future employment land requirements of Leeds.
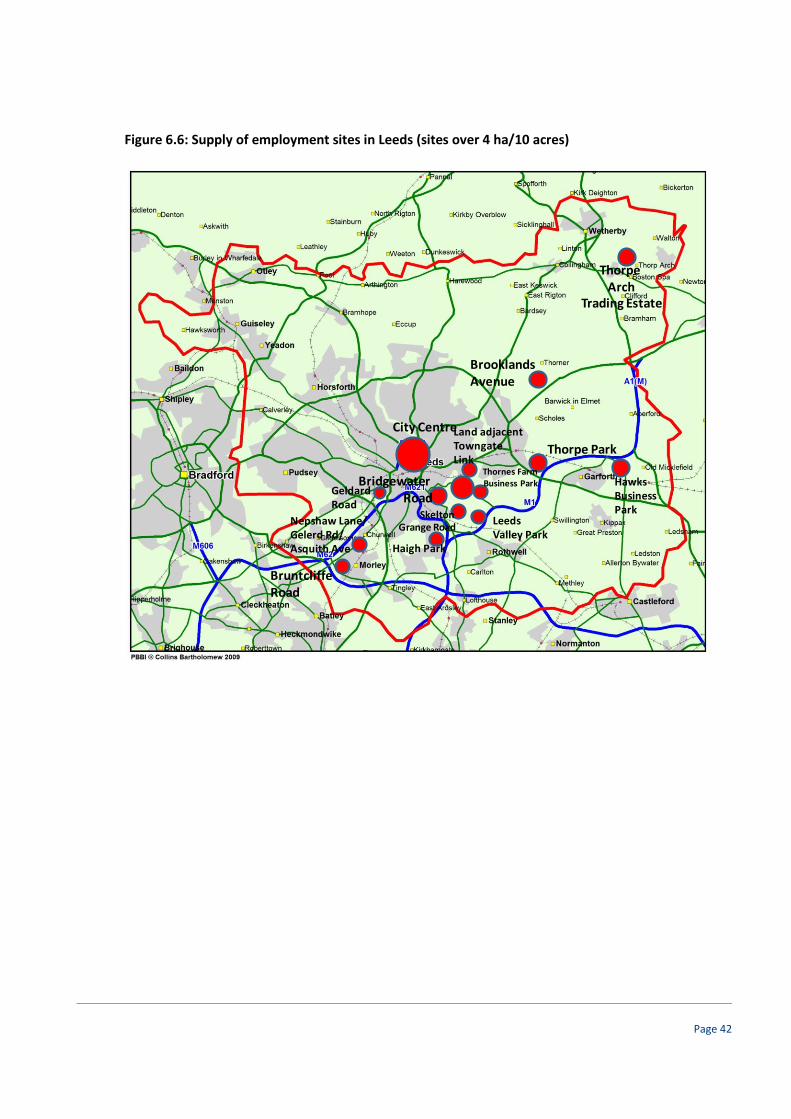
Page 42
Figure 6.6: Supply of employment sites in Leeds (sites over 4 ha/10 acres)
City Centre
Thorpe Park
Leeds Valley Park
Haigh Park
GeldardRoad
Bridgewater Road
Skelton Grange Road
Land adjacent TowngateLink
BrooklandsAvenue
Thorpe Arch
Trading Estate
BruntcliffeRoad
Thornes FarmBusiness Park
Nepshaw Lane/Gelerd Rd/Asquith Ave
HawksBusiness Park

Page 43
Figure 6.7: Leeds employment land requirements (ha)
Figure 6.8: North Leeds employment land requirements (ha)
0
100
200
300
400
500
600
Land equivalent (ha) Sites to be retained and carried forward (ha)
Shortfall
0
20
40
60
80
100
120
140
160
180
Inner North East
Inner North West
Outer North East
Outer North West
Total North Leeds
Land requirement to 2028 (ha)
Existing porfolio (ha)

Page 44
LBIA Industrial market
At the local level there is a significant amount of industrial accommodation in the immediate
surroundings of the airport, concentrated on the following estates
Leeds Bradford International Airport Industrial Building, A658 Harrogate Road
Moorfield Business Estate, A658 Harrogate Road
Carlton Industrial Estate, Cemetery Road
Westfield Industrial Estate, Kirk Lane, Yeadon
South View Business Park, off A65
These parks are well occupied and accommodate a range of light industrial and manufacturing
occupiers.
There has been a regular churn of occupiers and new lettings in recent years resulting from the
relocations both within and from outside the local area. The Estates Gazette Interactive database
(EGi) recorded a number of building lettings and sales in the last 30 months, as illustrated in Table
6.4 below, indicating a healthy demand for property on a leasehold and freehold basis. Over the
last six years (2008-2013) there has been an average of 11,602 sq m per annum (125,000 sqft).
Table 6.4: Industrial transactions 2012-2014 within a 2 mile radius of LBIA (source EGi)
Existing availability is limited to three buildings, two of which at Leeds Bradford Airport Industrial
Estate, together totalling 12,414 sq m (134,000 sq ft):
Table 6.5: Existing Availability of office property within 2 mile radius of LBIA (EGi)
As with the local office market, the level of occupier activity and transactions on the estates surrounding Leeds Bradford International Airport underlines the potential for further occupancy in the future. On the basis of the prevailing average take up levels (11,602 sq m), the existing supply of 11,602 sq m will be exhausted in little more than one year.
Deal/Auction
Address date Size (sq m) Size(sq ft) Purchaser/Lessee
Unit 3, Moorfield Industrial Estate, Moorfield Road Estate, Yeadon,
Leeds, LS19 7BN
01/08/2014 283 3,042 Private
Unit 3, Leeds Bradford Airport Industrial Estate, Harrogate Road,
Yeadon, Leeds, West Yorkshire, LS19 7WP
31/10/2013 8,331 89,669 Fuzzw ire
Unit 1B, Leeds Bradford Airport Industrial Estate, Harrogate Road,
Yeadon, Leeds, West Yorkshire, LS19 7WP
31/10/2013 8,191 88,162 Fuzzw ire
Unit 10b, Leeds Bradford Airport Industrial Estate, Harrogate Road,
Yeadon, Leeds, West Yorkshire, LS19 7WP
01/07/2013 3,127 33,663 Private individual(s)
Unit 1, Southview Business Park, Ghyll Royd, Guiseley, Leeds,
West Yorkshire, LS20 9LT
01/03/2013 534 5,750
Building 3, Airport West, Lancaster Way, Yeadon, Leeds, LS19
7ZA
01/08/2012 883 9,500
Unit 1A, Leeds Bradford Airport Industrial Estate, Harrogate Road,
Yeadon, Leeds, West Yorkshire, LS19 7WP
01/07/2012 14,246 153,339 Private individual(s)
Unit A, Carlton Industrial Estate, Cemetery Road, Yeadon, Leeds,
LS19 7BD
31/03/2012 465 5,000 Loxa Limited
Total space
Type of
Address Unit description Unit size (sq m) Unit size (sq ft) tenure Grade of space
Carlton Industrial Estate, Cemetery Road, Leeds, LS19 7BD Unit E 1359 14633 Leasehold Second-hand Grade
BLeeds Bradford Airport Industrial Estate, Harrogate Road, Leeds,
LS19 7WP
Unit 10b 2787 30000 Leasehold Second-hand Grade
BLeeds Bradford Airport Industrial Estate, Harrogate Road, Leeds,
LS19 7WP
Unit 3 8268 88999 Leasehold Second-hand Grade
B

Page 45
Summary
Commercial market conditions are improving with the office and industrial sectors emerging
strongly from the downturn. Increasing take-up and falling supply are evident and a return to
more widespread development is anticipated in the near future.
Looking at the long term, there is a projected need for new high quality serviced employment land
to meet market requirements. The dynamics of the office market in Leeds are such that there is a
strong in and out of town market and a real opportunity for LBIA to help fulfil the future
requirements of the out of the town market whilst offering an alternative, differentiated product.
There is a shortage of industrial sites – both quantitative and qualitative – to meet the long term
market requirements of Leeds. Allied to the potential for surface access enhancements and airport
related growth, there is considerable potential for commercial pressures to drive the delivery of
major hub and employment zone at the Airport.
Page 46
7 Airport Land Development Strategy
Demand for a commercial hub at LBIA
There is a major opportunity to enhance Leeds’ commercial portfolio of land and premises through
the creation of a commercial hub at the airport. The hub will reinforce the growth of the Airport
and will help drive forward the economic ambitions set out in the LEP’s Strategic Economic Plan, in
particular plugging gaps in the city’s commercial property offer.
There is an established demand for new commercial land and floor space at Leeds Bradford
International Airport that arises from the concentration of occupiers locally and the growth of the
Leeds economy and its associated accommodation requirements. The collated evidence set out in
Section 6 shows that there is a healthy churn of new lettings year on year in respect of both
industrial and office accommodation and, over time, there have been new development schemes
such as Airport West and Moorfield Industrial Estate which have been built to respond to these
occupier requirements.
Looking forward, we consider there to be a major opportunity to expand the commercial offer
alongside the growth of the airport and surface connections to create a hub that exploits the
potential of the aviation sector and the attributes of the location for office and industrial occupiers
seeking an international ‘front door’. There are a number of sources of demand that can be
targeted:
Occupiers expanding/downsizing or moving from local business estates – as demonstrated by
the collated evidence in Section 6
New occupiers seeking airport or north Leeds location – DTZ is aware of recent requirements
from occupiers seeking airport location in respect of both office and industrial accommodation
Footloose national/international occupiers seeking high quality/differentiated and branded
location
Occupiers linked to the airport – operational and non operational activities linked to the
growth of the airport, as dealt with in Section 5 of this report.
The hub can reinforce the economy of Leeds City Region providing a differentiated commercial real
estate opportunity to attract new investment and growing firms, particularly focused on
knowledge based businesses with international networks.
In respect of the office sector there is potential to attract aviation occupiers including flight
operating businesses with requirements for national/regional HQ and call centre activities. For
example, Jet2 have potential substantial accommodation requirements in Leeds that could
potentially be relocated to LBIA. Other flight operators could be targeted in conjunction with the
projected growth of the airport.
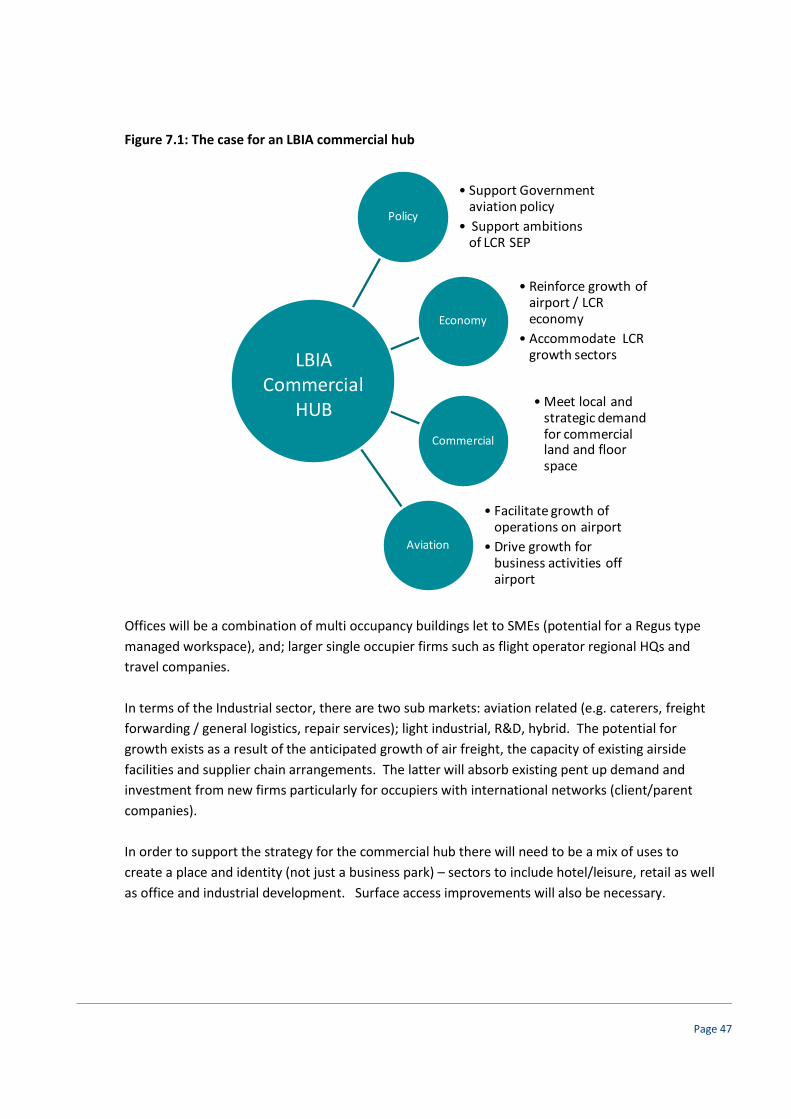
Page 47
Figure 7.1: The case for an LBIA commercial hub
Offices will be a combination of multi occupancy buildings let to SMEs (potential for a Regus type
managed workspace), and; larger single occupier firms such as flight operator regional HQs and
travel companies.
In terms of the Industrial sector, there are two sub markets: aviation related (e.g. caterers, freight
forwarding / general logistics, repair services); light industrial, R&D, hybrid. The potential for
growth exists as a result of the anticipated growth of air freight, the capacity of existing airside
facilities and supplier chain arrangements. The latter will absorb existing pent up demand and
investment from new firms particularly for occupiers with international networks (client/parent
companies).
In order to support the strategy for the commercial hub there will need to be a mix of uses to
create a place and identity (not just a business park) – sectors to include hotel/leisure, retail as well
as office and industrial development. Surface access improvements will also be necessary.
Policy
• Support Government aviation policy
• Support ambitions of LCR SEP
Economy
• Reinforce growth of airport / LCR economy
• Accommodate LCR growth sectors
Commercial
Aviation
• Facilitate growth of operations on airport
• Drive growth for business activities off airport
• Meet local and strategic demand for commercial land and floor space
LBIA Commercial
HUB

Page 48
Quantitative assessment
A quantitative assessment has been produced to determine the potential land requirements of a
commercial hub at Leeds Bradford International Airport. The assessment is based on a projection
of occupier demand, estimated aviation operational requirements and additional growth space for
the impact of surface access improvements. The land requirements have also been ‘sense-
checked’ through comparison with commercial hubs being promoted at similar sized UK airports.
A) Projection of local demand
Based on the above market analysis an assessment of the potential quantity of demand has been
produced drawing on data of lettings within the local area. The approach taken has involved
projecting forward the annual average quantity of floor space lettings (the level of take up of floor
space) recorded from the period 2008-2013 over fifteen years to align with the Local Plan period.
Existing vacant floor space on the market in the local area has been subtracted from the 15 year
figure which has then been iterated into a land area by the application of standard plot ratios (35%
for industrial accommodation, 80% for office accommodation).
The data used to derive the annual average take up figures is sourced from Estates Gazette
Interactive (EGi), and where necessary DTZ has made adjustments to remove repeat lettings of the
same property that have occurred within the 2008-2013 period.
The results indicate that there is potential occupier demand within the local area to accommodate some 52 ha (128 acres) of land over the fifteen year period.
Table 7.1: Local occupier projection
*Land based on cover assumptions of 35% (industrial) and 80% (offices)
B) Impact of airport expansion
The growth of the airport will drive demand for commercial land and floor space within and
outside the existing airport boundary. There are two components to this growth: operational and
non operational.
In respect of the operational requirements, LBIA has identified the need for expansion space of 3.2
ha at the western end of the existing operational area. To facilitate this expansion the existing
accommodation (comprised of Jet2 office accommodation and ancillary premises) need to be
relocated off airport, thus generating a requirement for 3.2 ha of additional commercial land.
Industrial Office
Floor area take up per annum 2008-2013 (Sq m) 11,602 2,881
15 year's demand of floor space take up (sq m) 174,030 43,215
Less existing availability (Sq m) 161,616 37,540
Implied land demand potential ha* 46.2 5.87

Page 49
In respect of non operational activities, occupiers and uses directly and intrinsically linked to the
airport are included such as flight operating companies, support services, engineers. To determine
the growth requirements for this category a simple linear growth projection has been made based
on the projected growth in passenger numbers. This results in an additional requirement for 5,000
sq m or 1.1 ha of land.
Table 7.2: Airport related growth
C) Step change factor
The final component of the quantitative assessment is to determine the potential for achieving a
step change in the delivery of commercial development as a result of the growth of the airport, the
delivery of rail related surface access improvements and other investments.
It is very difficult to predict with any certainty what effects the mooted infrastructure investments
will have but in planning for the commercial hub it is considered beneficial to allow for the upper
potential for such growth.
An assumption has been made that the level of annual office take up could be doubled from 2881
sq m to 5762. This increased level of take up still only represents 15% of the long term average out
of town average take up level and is therefore not considered unrealistic given the potential
impact of enhanced surface access and its related appeal to office occupiers. Allowing for the
likelihood that a new station and rail link would not be installed until approximately 10 years into
the programme, only 5 years’ of take up at this level has been allowed for, which generates a
potential demand for an additional 14,405 sq m and 2.25 ha (net land area).
In respect of industrial demand, an additional 7,000 sq m / 2 ha overall has been allowed which is
representative of the potential increase in cargo and consequent freight related activities at the
airport based on benchmarking evidence of comparable airports.
Baseline Projected
Oprational
Expansion space required (ha) 3.20
Non operational floor space in
airport boundary
Offices (sq m) 2470 5315
Industrial (sq m) 2179 4687

Page 50
Table 7.3: Step Change Factor
Industrial Office
Additional floor area (sq m) 7,000 14,405
Implied land requirement (ha) 2 2.25
Aggregate quantitative assessment
Table 7.4 below provides a summary of the total potential based on the above analysis. Taking into
account the existing employment site allocations at Coney Park and Whitehouse Lane
(representing 21 ha in total), this leaves a residual quantitative potential for 40 ha (119 acres) for
the local area. This represents a net land potential for industrial and office uses only, therefore
additional land for other commercial uses (hotels, retail etc) will also need to be allowed for. This
land requirement is broadly within the range of comparable regional airports that are also
promoting the development of commercial hubs, and provides the requisite critical mass to give
the hub the best chance of success.
Table 7.4: Aggregate gross and net employment land requirement
Indicative Masterplan
A conceptual masterplan has been prepared for the area to the north of Leeds Bradford
International Airport to illustrate the potential of the growth hub. The masterplan has been
produced by Five Plus architects in collaboration with WYG and DTZ. The masterplan incorporates
Floor area (sq m) Land (Ha) Floor area (sq m) Land (Ha)
Local demand (projected floor space take up
from local business/industrial estates at
annual rate over 15 years) 37540 5.87 161616 46.20
Airport growth (linear growth in demand for
non operational commercial floor space
linked to passenger growth) 2845 0.44 2509 0.72
Non operational area displaced by expansion
of operations
Step Change (surface access enhancements,
growth of air freight) 14405 2.25 7000 2.00
Total potential over 15 years 54790 8.57 171125 48.92
Total gross employment land requirement (ha) 61
Less existing employment land (ha) 21
Coney Park, Harrogate Road 17
White House Lane, 5
Total net employment land requirement (ha) 40
Industrial (B1b, B1c, B2, B8)Office (B1a)
3.2 ha

Page 51
LBIA’s existing land holdings together with the parcel of Greenfield land to the north which is under
their control via option agreement with Leeds and Bradford Councils.
The total of the net developable areas is estimated at approximately 37 ha, which is less than the
residual total indicated in the above quantitative analysis. However, it is considered broadly to be
in accordance with commercial hub land areas at comparable airports.
The masterplan illustrates the route of road and rail surface access improvements together with
three principal land use zones for the following development:
Air Innovation Park
A Business Park providing accommodation for occupiers in identified LCR growth sectors. A high
quality environment with a focus on innovation and incubation facilities with strong linkages to
University based R&D. The Air Innovation Park would incorporate a range of accommodation types
to meet the variety of business functions benefiting from the airport location including offices,
R&D hybrid units, light industry and logistics. The business park would respond to an identified gap
in the supply of quality land and property options for inward investors and high value growth
businesses seeking well connected and high profile locations.
Airport Village
A new mixed use commercial centre providing vital services and accommodation to support the
growth of the airport. This zone would provide accommodation for activities directly and
intrinsically related to the economy of the airport, such as flight operating company (/regional)
head quarters and support functions, hospitality and general amenities (comprising new hotels,
conference and meeting facilities and restaurants and retail).
Air Freight Park
New Industrial accommodation to serve the growth in demand anticipated from the increase in air
freight cargos. Direct access to the airside boundary required to facilitate the transfer on and off
aircraft. Freight transfer, caterers, repair and support functions. Logistics operators.
Figures 7.2 and 7.3 on the following pages illustrate the concept plan and development plots.

Page 52
Figure 7.2: Indicative Masterplan
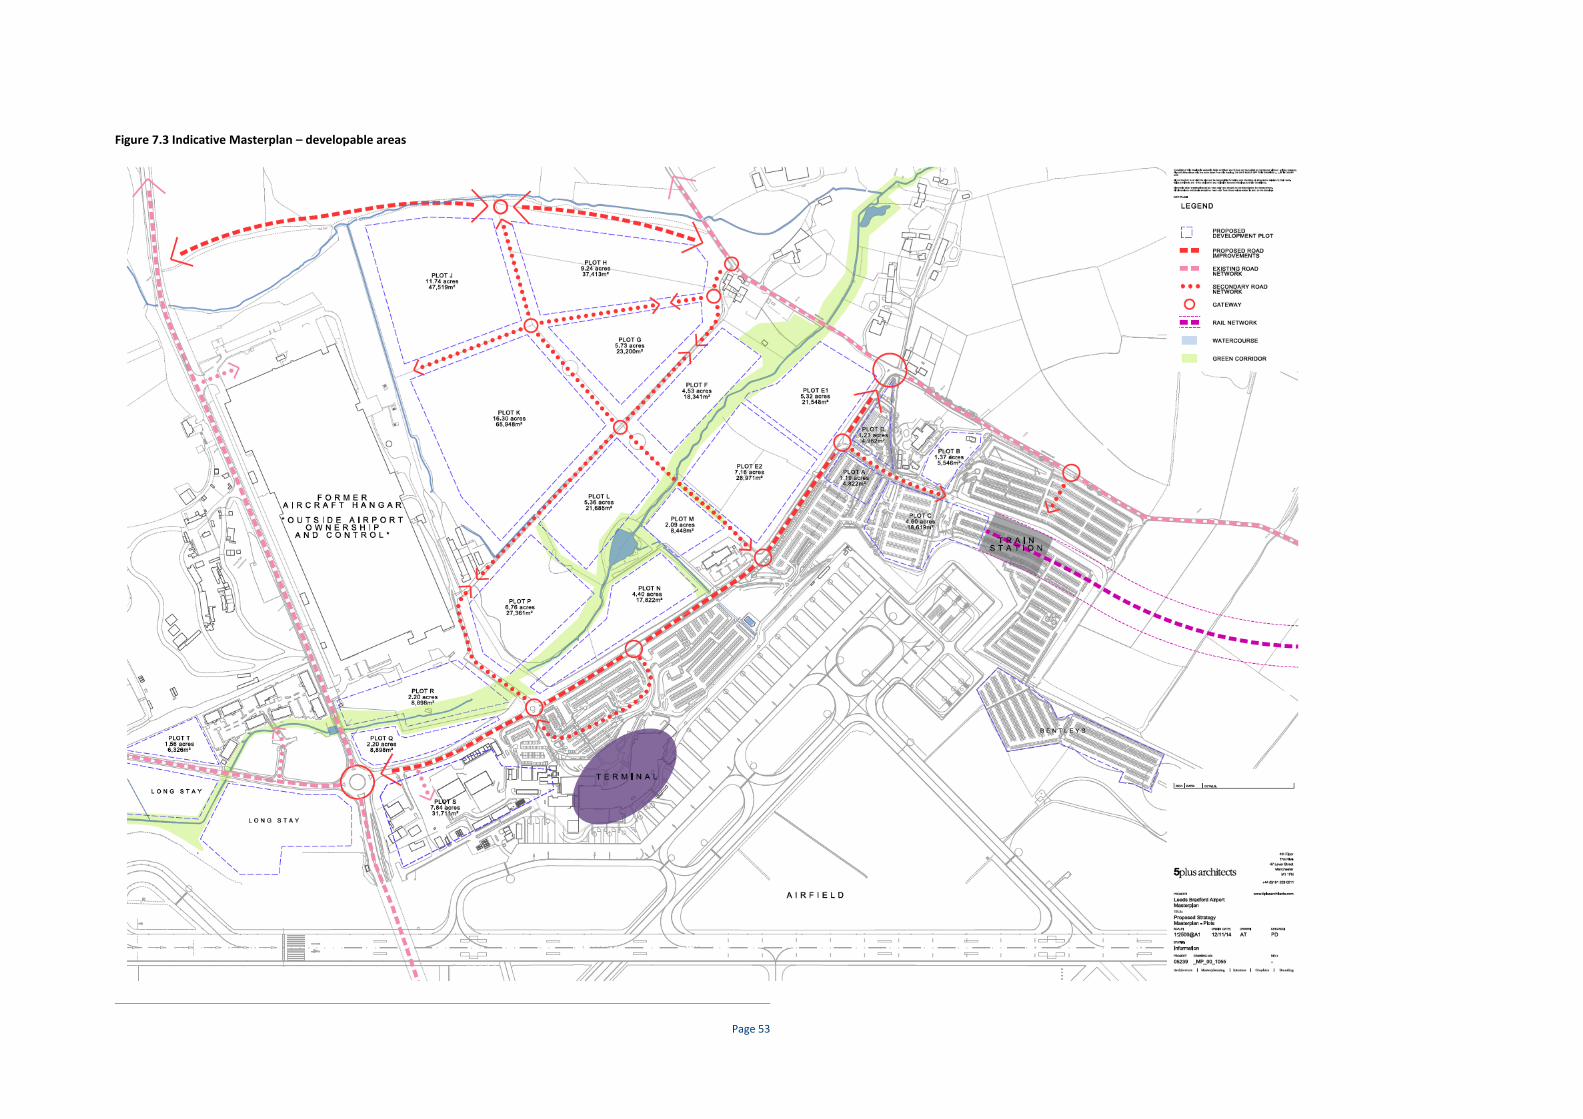
Page 53
Figure 7.3 Indicative Masterplan – developable areas

Page 54
Based on the above concept plan, an indicative development schedule has been produced
corresponding to the plot references on Figure 7.3. The accommodation mix is based broadly on
the quantitative analysis outlined earlier in this section, with offices and industrial, and then R&D
and logistics representing sub-sectors of these main property classes. Two hotels, restaurant and
convenience retail development have also been allowed for consistent with the vision of creating
an ‘airport village’.
The accommodation listed is indicative only, and it should be noted that in practice we see the
delivery of the scheme being highly flexible to the requirements of the market and the investment
requirements of public sector partners.
Table 7.5: Indicative development schedule
Table 7.6 below provides details of a possible phasing plan, with the development divided into
three tranches. The phasing plan prioritises development parcels that can be accessed directly
from the existing road infrastructure and is slightly back-loaded to reflect the step change impact
brought about by surface access improvements in later years.
Plot
reference Proposed use Zone
Net site area
(sq m)
Plot ratio
assumed
GIA floor
area (sq
m) NIA
A Hotel (60 bed) Airport Village 4,822 n/a n/a
B Retail Airport Village 5,546 35% 1,941 1,553
C Hotel (100 bed) Airport Village 18,619 n/a n/a
D Retail Airport Village 4,982 35% 1,744 1,395
E Office Airport Village 52,056 80% 41,645 33,316
F R&D Air Innovation Park 18,341 35% 6,419 5,135
G Industrial Air Innovation Park 23,200 35% 8,120
H Logistics Air Innovation Park 37,413 35% 13,095
J Industrial Air Innovation Park 47,519 35% 16,632
K Industrial Air Innovation Park 65,948 35% 23,082
L R&D Air Innovation Park 20,685 35% 7,240 5,792
M Office Airport Village 8,448 80% 6,758 5,407
N Office Airport Village 17,822 80% 14,258 11,406
P R&D Air Innovation Park 27,361 35% 9,576 7,661
Q Logistics Air Freight 8,898 35% 3,114
R Logistics Air Freight 8,898 35% 3,114
370,558 156,738Total

Page 55
Table 7.6: Indicative phasing schedule
Delivery mechanisms
DTZ understands that the majority of the land that is proposed for the commercial hub is the
subject of an option agreement between LBIA and Leeds and Bradford Councils. DTZ has not
reviewed the terms of the option agreement nor the title documents and therefore a full review
will be required to determine the existence and nature of any encumbrances which could affect
the developability of the land. In broad terms, it is understood that the option agreement allows
LBIA to draw down and purchase the freehold title of the land.
The delivery structure for building out the masterplan has not yet been determined. LBIA may
either seek to work in collaboration with a third party developer/investor in a joint venture
capacity or look to sell on plots of land on the basis of an agreed masterplan.
The funding and installation of surface access infrastructure improvements are a key consideration
in the delivery programme. It is anticipated that public sector funding will be confirmed for the
new link road shortly that will enable the road to be constructed in 2018/19. In respect of the rail
line and station, it is understood that options for both public and private sector funding are being
explored.
Collaboration between public and private sector partners will provide the best prospect of
delivering the vision for a commercial growth hub at Leeds Bradford Airport. The following
measures are proposed for consideration:
Creation of ‘Mini Enterprise Zone’ status – many competing cities across the UK have
designated Enterprise Zones on land adjacent to airports to enable the EZ incentive package to
be used to attract occupiers and facilitate enabling infrastructure investment. There is an
opportunity for Leeds City Region to offer the business rate discounts at the de-minimus level
to occupiers within the Airport Growth Hub, funded by business rate additionality
accumulated in Leeds Enterprise Zone. This would help to both brand the Growth Hub in a
positive way and attract occupiers.
Phase 1 (GIA sq m) Phase 2 (GIA sq m) Phase 3 (GIA sq m)
Total GIA
(sq m)
Office 14,258 20,822 27,581 62,661
Industrial 16,632 8,120 23,082 47,833
R&D 0 9,576 13,659 23,235
Logistics 6,229 13094.55 0 19,323
Retail 3,685 3,685
Hotels 60 bed 100 bed
Total 37,118 51,613 68,007 156,738

Page 56
Land value for infrastructure funding – where the value of the land is deployed to pay for the
infrastructure works required to unlock / enable delivery. This is an approach that has been
used to enable the delivery of public sector sites that have significant enabling/infrastructure
costs or abnormals and the public sector wishes to help facilitate/enable delivery.
Tax increment financing (TIF) – under the current arrangements that came into effect from 1st
April 2013, local authorities are entitled to retain 50% of business rate income generated
within their areas. There may be potential given the ongoing devolution of powers for an
Accelerated Development Zone in which 100% of business rate additionality could be retained.
Therefore, the potential exists to establish a TIF zone around the Growth Hub site that would
enable finance to be raised against the anticipated additional business rate receipts that the
Council retains.
Direct public investment – innovation and R&D parks tend to exist because of public sector
and HE investment. The possibility of utilising existing and emerging funding streams such as
the Local Growth Fund to invest in property projects should be examined in view of the clear
alignment of the Growth Hub masterplan and the Strategic Economic Plan for Leeds City
Region.
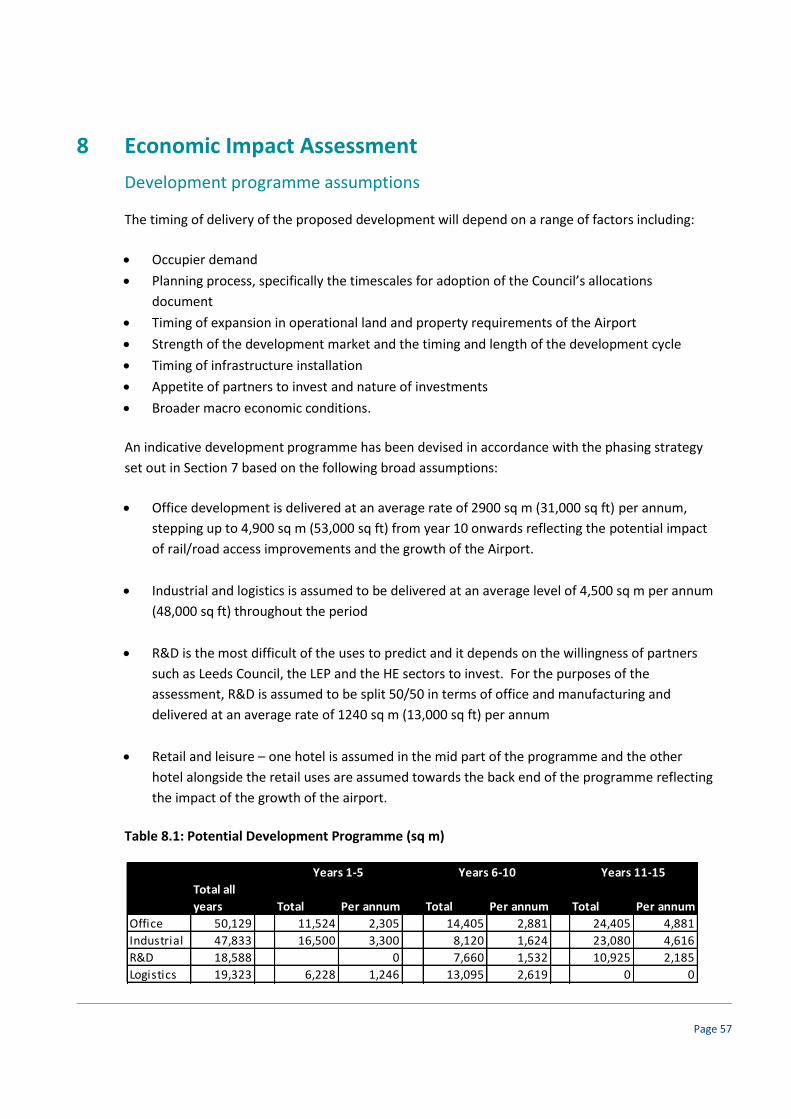
Page 57
8 Economic Impact Assessment
Development programme assumptions
The timing of delivery of the proposed development will depend on a range of factors including:
Occupier demand
Planning process, specifically the timescales for adoption of the Council’s allocations
document
Timing of expansion in operational land and property requirements of the Airport
Strength of the development market and the timing and length of the development cycle
Timing of infrastructure installation
Appetite of partners to invest and nature of investments
Broader macro economic conditions.
An indicative development programme has been devised in accordance with the phasing strategy
set out in Section 7 based on the following broad assumptions:
Office development is delivered at an average rate of 2900 sq m (31,000 sq ft) per annum,
stepping up to 4,900 sq m (53,000 sq ft) from year 10 onwards reflecting the potential impact
of rail/road access improvements and the growth of the Airport.
Industrial and logistics is assumed to be delivered at an average level of 4,500 sq m per annum
(48,000 sq ft) throughout the period
R&D is the most difficult of the uses to predict and it depends on the willingness of partners
such as Leeds Council, the LEP and the HE sectors to invest. For the purposes of the
assessment, R&D is assumed to be split 50/50 in terms of office and manufacturing and
delivered at an average rate of 1240 sq m (13,000 sq ft) per annum
Retail and leisure – one hotel is assumed in the mid part of the programme and the other
hotel alongside the retail uses are assumed towards the back end of the programme reflecting
the impact of the growth of the airport.
Table 8.1: Potential Development Programme (sq m)
Total all
years Total Per annum Total Per annum Total Per annum
Office 50,129 11,524 2,305 14,405 2,881 24,405 4,881
Industrial 47,833 16,500 3,300 8,120 1,624 23,080 4,616
R&D 18,588 0 7,660 1,532 10,925 2,185
Logistics 19,323 6,228 1,246 13,095 2,619 0 0
Years 11-15Years 6-10Years 1-5

Page 58
A further scenario has been developed to illustrate the impact of a less optimistic, longer programme
of delivery. The development programme has been extended from 15 to 25 years, with office
delivery averaging 2,000 sq m (21,500 sq ft), industrial and logistics 2,500 sq m (27,000 sq ft), and
R&D, 900 sq m (10,000 sq ft).
The following sections examine the economic benefits of both scenarios. It has been assumed for
the purposes of this analysis that the area of impact is at the Leeds City Region level. All economic
benefits have been modelled over a 25 year timeframe.
Job hosting capacity (gross and net additional)
Employment benefits have been estimated through the application of standard worker floor area
ratios which are presented as gross and net. Gross jobs are estimates of the job hosting capacity of
the development based on the scale of development anticipated. Net jobs take account of factors
such as displacement, leakage and multiplier effects. The figures quoted are based on the full job
hosting capacity of the scheme and make no allowance for voids and therefore should be
interpreted as the maximum job hosting capacity of the scheme.
The quantum of gross and net employment capacity is the same under both scenarios as the same
level of floorspace is delivered under both (only the timescale for delivery is different).
Table 8.2: Job hosting capacity
15 year delivery 25 year delivery
Gross Jobs 8,040 8,040
Net Additional Jobs 5,547 5,547
A breakdown of the gross/net additional jobs by use type is set out below: Table 8.3: Gross and net jobs by land use
Use Type Gross Jobs Net Additional Jobs
Office 5,013 3,503
Industrial 1,329 846
R&D 1,188 968
Logistics 276 141
Hotel 80 33
Retail 155 56

Page 59
Assumptions
Gross jobs have been estimated through applying the following employment densities to the
floorspace in accordance with the 2010 HCA Employment Density Guide (2nd Edition):
Table 8.4: Job density assumptions
Use Type Sqm per FTE (GIA/GEA unless specified)
Office 10 (NIA)
Industrial 36
R&D Assumed 50% office, 50% industrial as above
Logistics 70
Hotel 1 employee per 2 bedrooms
Retail 19
To estimate the net additional employment capacity, consideration has been given to factors of additionality by use type as below: Table 8.5: Additionality assumptions
Leakage Displacement Multiplier Deadweight
Office 15% 40% 1.37 Nil
Industrial 7% 50% 1.37 Nil
R&D 15% 30% 1.37 Nil
Logistics 7% 60% 1.37 Nil
Hotel 7% 70% 1.47 Nil
Retail 7% 70% 1.30 Nil
Further explanation is provided below and all assumptions have been ‘sense checked’ against the
2014 HCA Additionality Guide.
Leakage – analysis of the 2001 Census travel to work data identifies that at the LCR level, there is a
leakage rate of 7% and this has therefore been used for all of the use types apart from office and
R&D. A higher rate of 15% has been prudently applied to these higher value uses to reflect the
increased likelihood of these attracting employees residing outside of the LCR.
Displacement – assumptions range from 30% for R&D uses through to 70% for leisure/retail. This
reflects the fact that higher value R&D and office activity is likely to result in a lower level of
displacement of existing economic activity within the City Region. A proportion of the R&D space
may also be occupied by new businesses and spin-outs from HE establishments which would
further reduce the propensity for displacement. Lower value logistics/leisure/retail uses by their
very nature have a propensity for high rates of displacement. The HCA guidance refers to 25% as
being low and 75% as being high and these therefore correlate with this.

Page 60
Multiplier – as per the HCA Additionality Guidance Paper. An average of the local and regional
multiplier was applied to reflect the City Region scale of assumed impact for this assessment.
Deadweight – a nil deadweight position has been assumed throughout (i.e. in the absence of the
LBIA proposals, no other economic outputs would be delivered on this site).
Gross Value Added (GVA)
GVA is used as an indicator of economic output and measures the contribution to the economy of individual producers, industries or sectors. It is estimated through the application of typical annual GVA per worker data to the net job capacity estimates outlined above.
Impacts
Cumulative undiscounted and discounted GVA impacts over a 25 year timeframe are presented below under each of the scenarios:
Table 8.6: GVA
15 year delivery 25 year delivery
Cumulative Undiscounted GVA
£5.6bn £4.6bn
Cumulative NPV GVA £3.3bn
£2.6bn
Assumptions
Average GVA per worker figures by sector at the Leeds Local Authority level have been estimated
based upon the total annual GVA output for a number of relevant sectors (ONS, NUTS 3 data,
2010) divided by the total number of workers in the sector (Business Register and Employment
Survey, ONS, 2010). This has then been multiplied by the net additional job outputs associated with
each of the commercial components of the scheme. In some instances, informed SIC related
assumptions were made to align the GVA data with the employment data. R&D based GVA has
been based upon the office use type average with an assumed GVA uplift of 10% to reflect the
higher value nature of R&D activity. The following GVA per worker figures were applied based
upon this:
Table 8.7: Assumptions Use Type Annual GVA per Worker (£)
Office 63,560
Industrial 53,066
R&D 69,916
Logistics 30,798
Hotel 30,798
Retail 30,798

Page 61
GVA data is not published at a detailed SIC level at the LA scale which explains why a generic GVA
per worker of £30,798 has been applied to logistics/hotel/retail uses based upon the GVA and
employment data for the ‘distribution, transport accommodation and food’ classification. The HM
Treasury discount rate of 3.5% was applied to calculate the Net Present Value of the cumulative
GVA impacts over the 25 year period.
Business rate income
Under the arrangements that came into effect from the 1st April 2013, local authorities can retain up to 50%
of business rate income generated locally. Commercial development sites such as the Airport Hub that
attract new occupiers into the area therefore offer the potential for generating additional business rate
receipts for the local authority.
Wider benefits The proposals will deliver a number of additional economic impacts which have not been
quantified at this stage, as below:
Supporting additional Airport operational growth – the proposals will enable existing non-operational airport uses to relocate to free up land for core airport operational growth. This would enable the airport to enhance the scale and quality of its offer and operations, both in terms of passenger and freight numbers, resulting in significant economic benefits to the City Region.
Creating construction jobs – the delivery of the proposed new commercial floor space will support a significant number of construction jobs over a 15-25 year period, a large proportion of which could be sourced locally. The supply chain expenditure relating to this construction activity could also be significant.
Leveraging private sector investment – the delivery of the scheme will be private sector led and will therefore leverage a significant level of private sector investment to the City Region given the scale of the proposals.
Providing skills development and training opportunities – the proposals will attract high value uses and occupiers which will provide high quality and accredited skills and training development opportunities. There is the potential for the existing FE presence at the Airport to expand and for it to attract additional FE/HE activity, particularly though the proposals for innovation-based activity on part of the site. There is also the opportunity for additional aviation related skills and learning providers to be based at the Airport as it expands.
Providing local employment opportunities – the proposals will create a significant number of and range of employment opportunities to meet the demographic needs of the LCR economy. It is envisaged that a high proportion of the jobs will be taken by local people given the low rates of leakage across the City Region as a whole.

Page 62
Driving City Region competitiveness – the proposals have the potential to attract significant inward investment and to enhance the overall offer of the City Region economy as a business destination to ensure that it can compete with locations such as Manchester and Birmingham on an international level.
Summary
A summary of the core quantitative economic impacts modelled over a 25 year period is presented below:
15 year delivery 25 year delivery
Total New Floorspace (GIA, excl 160 hotel beds)
156,738 sq m 156,738 sq m
Gross Jobs hosting capacity 8,040 8,040
Net Additional Job hosting capacity 5,547 5,547
Gross cumulative GVA £5.6bn £4.6bn
NPV cumulative GVA £3.3bn £2.6bn
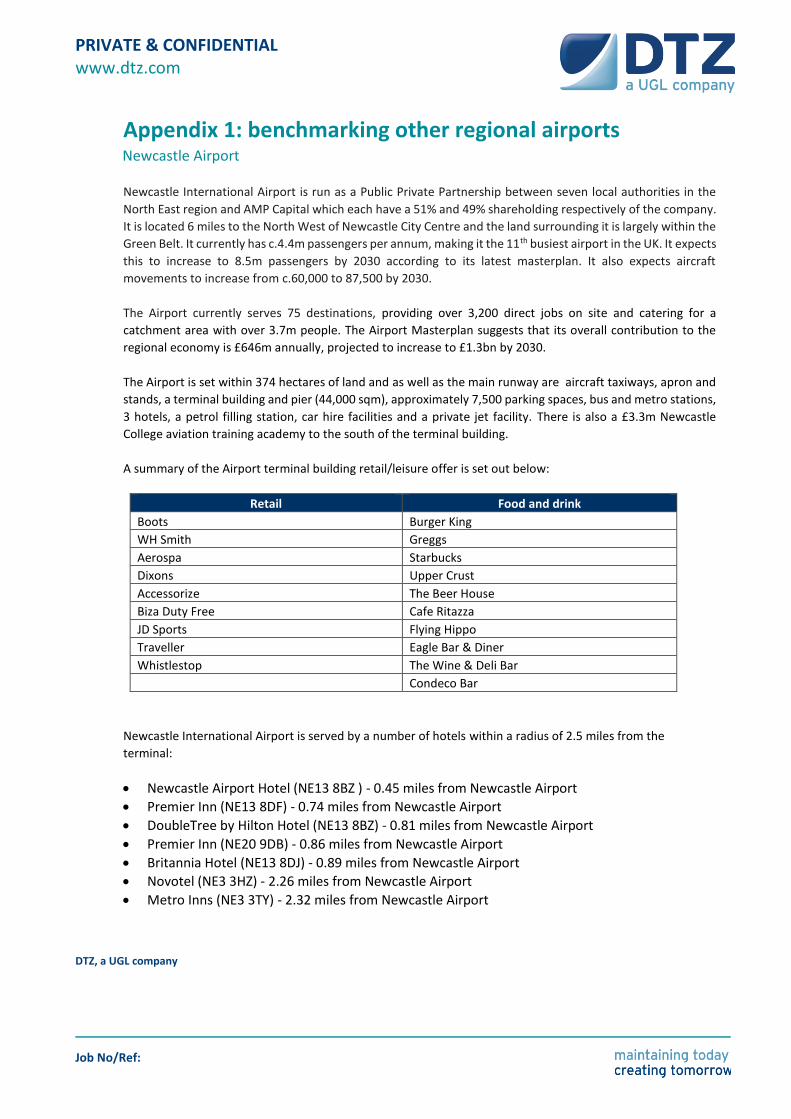
PRIVATE & CONFIDENTIAL www.dtz.com
DTZ, a UGL company
Job No/Ref:
Appendix 1: benchmarking other regional airports Newcastle Airport
Newcastle International Airport is run as a Public Private Partnership between seven local authorities in the
North East region and AMP Capital which each have a 51% and 49% shareholding respectively of the company.
It is located 6 miles to the North West of Newcastle City Centre and the land surrounding it is largely within the
Green Belt. It currently has c.4.4m passengers per annum, making it the 11th busiest airport in the UK. It expects
this to increase to 8.5m passengers by 2030 according to its latest masterplan. It also expects aircraft
movements to increase from c.60,000 to 87,500 by 2030.
The Airport currently serves 75 destinations, providing over 3,200 direct jobs on site and catering for a
catchment area with over 3.7m people. The Airport Masterplan suggests that its overall contribution to the
regional economy is £646m annually, projected to increase to £1.3bn by 2030.
The Airport is set within 374 hectares of land and as well as the main runway are aircraft taxiways, apron and
stands, a terminal building and pier (44,000 sqm), approximately 7,500 parking spaces, bus and metro stations,
3 hotels, a petrol filling station, car hire facilities and a private jet facility. There is also a £3.3m Newcastle
College aviation training academy to the south of the terminal building.
A summary of the Airport terminal building retail/leisure offer is set out below:
Retail Food and drink
Boots Burger King
WH Smith Greggs
Aerospa Starbucks
Dixons Upper Crust
Accessorize The Beer House
Biza Duty Free Cafe Ritazza
JD Sports Flying Hippo
Traveller Eagle Bar & Diner
Whistlestop The Wine & Deli Bar
Condeco Bar
Newcastle International Airport is served by a number of hotels within a radius of 2.5 miles from the
terminal:
Newcastle Airport Hotel (NE13 8BZ ) - 0.45 miles from Newcastle Airport
Premier Inn (NE13 8DF) - 0.74 miles from Newcastle Airport
DoubleTree by Hilton Hotel (NE13 8BZ) - 0.81 miles from Newcastle Airport
Premier Inn (NE20 9DB) - 0.86 miles from Newcastle Airport
Britannia Hotel (NE13 8DJ) - 0.89 miles from Newcastle Airport
Novotel (NE3 3HZ) - 2.26 miles from Newcastle Airport
Metro Inns (NE3 3TY) - 2.32 miles from Newcastle Airport
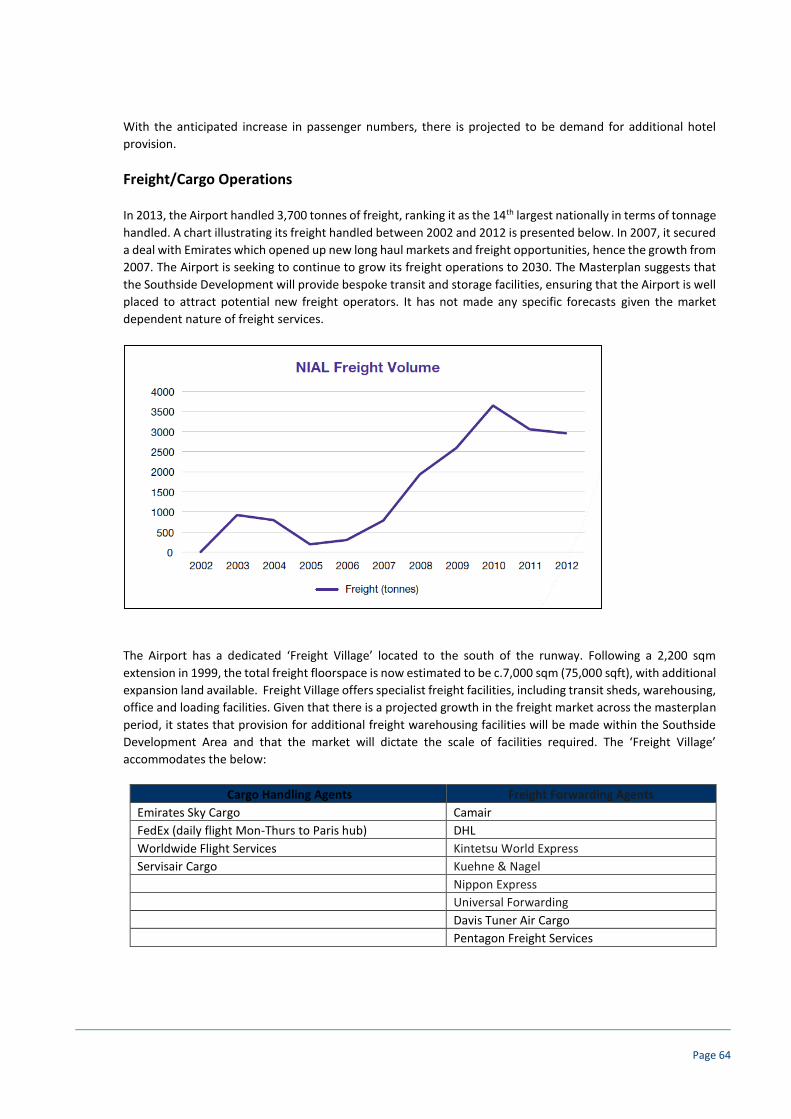
Page 64
With the anticipated increase in passenger numbers, there is projected to be demand for additional hotel
provision.
Freight/Cargo Operations
In 2013, the Airport handled 3,700 tonnes of freight, ranking it as the 14th largest nationally in terms of tonnage
handled. A chart illustrating its freight handled between 2002 and 2012 is presented below. In 2007, it secured
a deal with Emirates which opened up new long haul markets and freight opportunities, hence the growth from
2007. The Airport is seeking to continue to grow its freight operations to 2030. The Masterplan suggests that
the Southside Development will provide bespoke transit and storage facilities, ensuring that the Airport is well
placed to attract potential new freight operators. It has not made any specific forecasts given the market
dependent nature of freight services.
The Airport has a dedicated ‘Freight Village’ located to the south of the runway. Following a 2,200 sqm
extension in 1999, the total freight floorspace is now estimated to be c.7,000 sqm (75,000 sqft), with additional
expansion land available. Freight Village offers specialist freight facilities, including transit sheds, warehousing,
office and loading facilities. Given that there is a projected growth in the freight market across the masterplan
period, it states that provision for additional freight warehousing facilities will be made within the Southside
Development Area and that the market will dictate the scale of facilities required. The ‘Freight Village’
accommodates the below:
Cargo Handling Agents Freight Forwarding Agents
Emirates Sky Cargo Camair
FedEx (daily flight Mon-Thurs to Paris hub) DHL
Worldwide Flight Services Kintetsu World Express
Servisair Cargo Kuehne & Nagel
Nippon Express
Universal Forwarding
Davis Tuner Air Cargo
Pentagon Freight Services
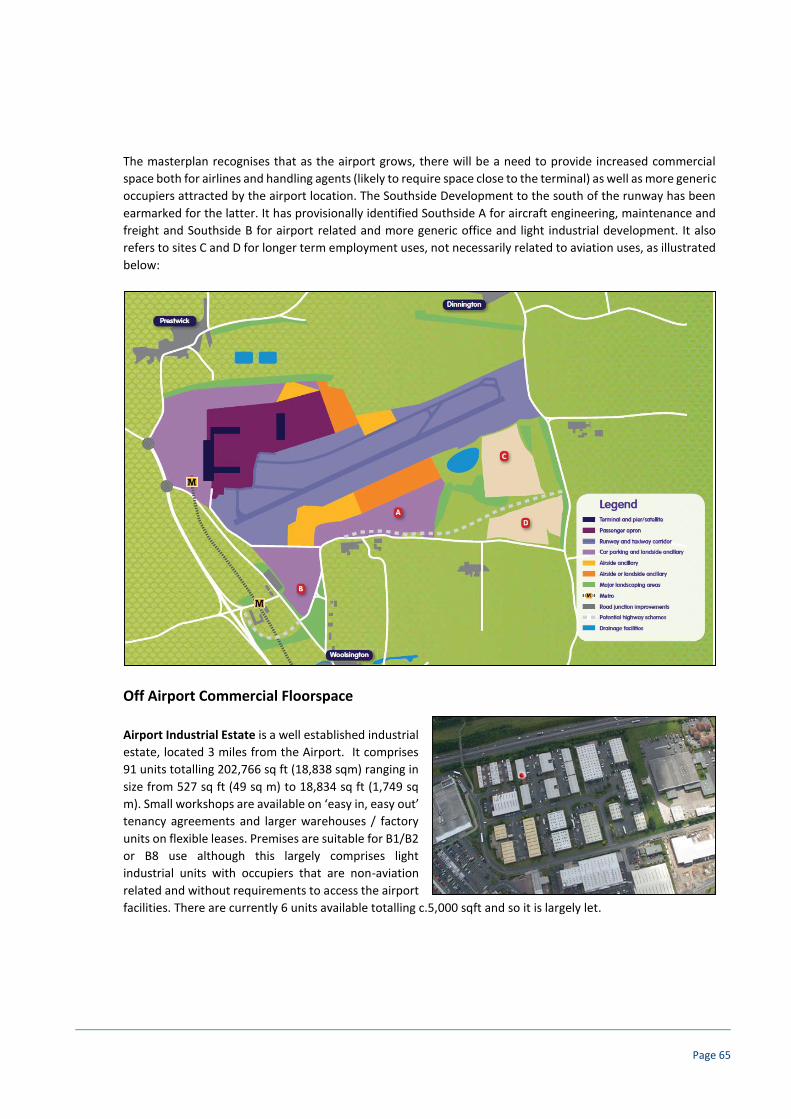
Page 65
The masterplan recognises that as the airport grows, there will be a need to provide increased commercial
space both for airlines and handling agents (likely to require space close to the terminal) as well as more generic
occupiers attracted by the airport location. The Southside Development to the south of the runway has been
earmarked for the latter. It has provisionally identified Southside A for aircraft engineering, maintenance and
freight and Southside B for airport related and more generic office and light industrial development. It also
refers to sites C and D for longer term employment uses, not necessarily related to aviation uses, as illustrated
below:
Off Airport Commercial Floorspace
Airport Industrial Estate is a well established industrial
estate, located 3 miles from the Airport. It comprises
91 units totalling 202,766 sq ft (18,838 sqm) ranging in
size from 527 sq ft (49 sq m) to 18,834 sq ft (1,749 sq
m). Small workshops are available on ‘easy in, easy out’
tenancy agreements and larger warehouses / factory
units on flexible leases. Premises are suitable for B1/B2
or B8 use although this largely comprises light
industrial units with occupiers that are non-aviation
related and without requirements to access the airport
facilities. There are currently 6 units available totalling c.5,000 sqft and so it is largely let.

Page 66
Newcastle International Airport Business Park is being marketed as one of the North East’s premier business
locations. In total it could accommodate up to 1m sqft of employment floorspace, including existing freight
accommodation at the ‘Freight Village’. The Business Park is located directly to the south of the airport and is
currently being marketed for a range of B1/B2/B8 uses. It is envisaged that it will incorporate a range of high
quality industrial/warehouse, office and hanger accommodation, with the potential for a phase 1 development
of 175,000 sqft of Grade A office space (already has outline planning consent), over 450,000 sqft of air freight,
hanger and warehouse/ distribution space (planning application being developed) and a third 14 ha plot for a
major single occupier. The latest version of the Newcastle Core Strategy Local Plan document (Examination
Version, Feb 2014) identifies supports the development of these sites and a further site to the east as below
i. 4 hectares (net) of land for small business units/industrial
ii. 32 hectares (net) of land for predominately air freight and warehousing
iii. 14 hectares (net) of land to be promoted for a single user

Page 67

Page 68
East Midlands Airport
East Midlands Airport is located in the heart of England and is easily accessible to the M1/M42, resulting in it
having a significant catchment area. It is estimated that there are over 11 million people that live within a 90
minute drive of East Midlands Airport. It is the UK’s leading express freight airport, with three of the major
global integrated freight airlines based at the airport. In 2013, East Midlands Airport connected over 4.2m
passengers with more than 90 destinations, making it the 11th busiest passenger airport in the UK. It is owned
by Manchester Airport Group (MAG) and the existing operational area of the airport extends to some 445
hectares of land, directly employing c.6,500 people on site. As the UK’s number one provider of ‘pure’ freight,
it transported 267,000 tonnes of freight in 2013. A review of the airport’s traffic forecasts show that East
Midlands could achieve a passenger throughput of 10 million passengers a year in the period 2030 – 2040.
Details of the airport’s terminal-based commercial offer are set out below:
Retail Food and drink
Dixons Leon Fast Food
WH Smith Burger King
Boots Castle Rock Tap Room
Superdrug Flat White Coffee Club
World Duty Free Frankie & Bennys
Aviation Gift Centre Grab & Fly
Pork & Pickle
There are six main functional zones on the airport site:
1. Airfield - the airport’s runway and taxiways take up almost half of the total area of the airport site.
2. Central Passenger Zone - the passenger terminal, an aircraft apron, car parking, petrol-filling station, flight catering, two fuelfarms, and vehicle maintenance. The Thistle Hotel is also within the Central Passenger Zone at the airport’s main entrance.
3. Cargo West - the DHL hub facility and its associated aircraft parking apron is the principal activity in the Cargo West zone. At the western end of the DHL facility are two of the airport’s long-stay car parks. There is land available for a major extension to the DHL hub.
4. Cargo East - UPS, TNT and Royal Mail have their operations at Cargo East and share the existing
aircraft parking apron area. Also at Cargo East there are landside facilities that include the Air Cargo Village and a range of cargo office and warehouse units. There is land available for significant cargo development within Cargo East.
5. Aircraft Maintenance Zone - this is a large area of land between the Central Passenger Zone and
Cargo West. It contains a number of aircraft maintenance hangars that are of various sizes, along with aircraft apron. There is also some operational office accommodation and a flying school in this area.
Page 69
6. Pegasus Business Park - this area is located in the south-east corner of the airport site and it contains a number of modern office buildings and three hotels (Radisson Blu, Premier Travel Inn and Holiday Inn Express). There is land available for the further development of the Business Park.
Freight/Cargo Operations
The Airport comprises a 17,094sqm (184,000sqft) cargo portfolio, in addition to the 66,424sqm let on ground
lease arrangements. The units are diverse ranging from 76.6sqm (728sqft) freight handling units to 6,310sqm
(67,918sqft) transit sheds. It is home to leading air freight operators, such as DHL, TNT and UPS, as well as being
a major national air-hub for the Royal Mail.
All the following airlines operate regular scheduled services through the Airport
It is also home to the following Freight Forwarding Agents

Page 70
In 2013, it transported 267,000 tonnes of cargo freight and 30,000 tonnes of mail. The forecast for future cargo
tonnage is for some 618,000 tonnes in 2035 and some 700,000 tonnes in 2040. The airport’s forecasts assume
that the mail flight network and overall mail volumes will remain relatively unchanged from the current 35,000
tonnes as a result of structural changes to the mail market. This is as a result of the shift from letters to parcels.
Air cargo movements are expected to grow. In 2013 the airport handled 23,805 cargo movements (freight and
mail), and by 2040 the number of movements could grow to around 42,600. This reflects the growth of the
integrated carriers and that the average freight load per cargo aircraft movement is predicted to increase from
14.4 tonnes in 2012 to 17.9 tonnes at 2040. The area to the north east of the airport, between Castle Donington
and the M1 has been identified as the East Midlands Gateway Strategic Rail Freight Interchange. Plans are
being developed to deliver a rail freight terminal that is capable of providing up to 6million square feet of large-
scale warehousing. Land has been reserved for the further development of the DHL Hub building at Cargo West
and land will also be safeguarded for a second major integrator hub in Cargo East. Land is also reserved for the
development of an integrator hub at Cargo East
Off Airport Commercial Floorspace
The airport site itself is home to around 100 commercial tenants involved in aviation related activity. In
addition to this is the Pegasus Business Park, in the south west corner of the airport site. Owned by MAG, the
Pegasus site covers some 26 hectares with around 10 hectares still available for development. In accordance
with the emerging Core Strategy policy the further development of the Business Park should provide for
activities and uses that derive a greater benefit from an airport location. Commercial development proposals
associated with the airport will be brought forward for sites within the Pegasus Business Park. These uses will
include offices, logistics, general warehousing and hotels. PWC are located at the Business Park and there is
also a Regus Business Centre.
Land to the west of the Moto Service Area has been identified as potential employment land in the North West
Leicestershire Employment Land Availability Assessment (2013).
There are 4 airports within proximity of the Airport, 3 of which are located within the Pegasus Business Park
including the Holiday Inn Express (90 rooms), Premier Travel Inn (80 rooms) and the Radisson Blu (218 rooms).
There is also a Thistle Hotel at the airport’s main entrance.
Bournemouth Airport
Bournemouth Airport was incorporated under the Airports Act in 1986 and was owned by Bournemouth
Borough Council (BBC) and Dorset County Council (DCC). It passed into private ownership in April 1995 and in
2001 was acquired by the Manchester Airports Group. Bournemouth Airport is a key national and international

Page 71
gateway to Southern England, serving around 36 destinations across Europe. The airport’s passenger
throughput increased from 271,000 in 2000 to 495,000 in 2004 to 660,000 in 2013. Locations including
Southampton, Portsmouth, Winchester, Salisbury, Dorchester and Weymouth are all within an hour’s drive of
the airport. Its passenger throughflow is expected to increase to 4.5m by 2030 according to its masterplan. The
total area of the airport site (i.e. north & south sectors) is approximately 366 hectares. Sixty
seven hectares are designated as areas of nature conservation interest.
Details of the airport’s terminal-based commercial offer are set out below:
Retail Food and drink
WH Smith Est Presso
World Duty Free Joes Kitchen & Coffee House
Olive Tree Cafe
Freight/Cargo Operations
Bournemouth Airport is a fast-developing cargo hub. It is the UK gateway for cargo to and from the Channel
Islands and a major spoke for UK Royal Mail and newspaper operations. It has expansion space and is able to
offer the following benefits from a cargo perspective:
2271m / 7451ft runway
Excellent good weather record
Congestion free, with no slot restrictions
Experienced in handling many cargo aircraft including the AN-124 Ruslan
‘Freighter friendly’ airport management
Cargo operations are located in the southern sector and handled 11,600 tonnes of cargo in
2005, principally mail, newspapers and magazines. This reduced to 9,418 tonnes in 2013 and the Airport
Masterplan does not contain any specific proposals for the growth of cargo traffic, although it is anticipated
that the current levels will be maintained.

Page 72
Off Airport Commercial Floorspace
Adjacent to Bournemouth Airport, is the Aviation Park. This is a key strategic employment site within Dorset
for technology, industry and freight related activity. As the largest brownfield employment site in Dorset, it has
80 hectares (200 acres) of land and buildings allocated for employment uses, it is home to in excess of 180
businesses across a mix of offices and workshops. It is owned and managed by Manchester Airport Group, the
owners of the Airport. A number of the business occupiers are directly linked to the aviation/aerospace sector
and it home to a Basepoint Business Centre. Current occupancy levels are around 96%. It offers serviced sites
as well as existing buildings and is marketing opportunities for a wide range of aviation-related and other non-
aviation businesses. Outline planning consent has been granted for c.540,000 sqft of additional space
comprising B1 offices, B1c light industrial, B2 industrial, B8 storage, as well as distribution and aviation uses in
accordance with the masterplan. It has recently been announced that the site has secured an £11m investment
from a specialist aerospace interiors company to develop a 160,000 sq ft unit.
Aberdeen Airport
Aberdeen airport is located approximately seven miles north west of Aberdeen city centre. It is bounded to the
north and south by open farmland, to the west by Kirkhill Industrial Estate and to the east by the village of
Dyce. Aberdeen airport is an important gateway to the north of Scotland with 20 airlines providing links to over
40 destinations. Passenger numbers were 3.44m in 2013 and are forecast to grow to 4 million in 2020 and to
5.09 million in 2040. Based on current levels of
employment and the predicted passenger growth forecasts, an additional 1,110 jobs are expected to be
created by2030, generating an additional £42 million GVA for the Scottish economy.
There is a Thistle Hotel, Premier Inn, Courtyard by Marriott and Speedbird Inn on the airport site. Development
is also underway to construct a 200 bedroom 4-star Holiday Inn and a 130 bedroom 3-star Holiday Inn Express,
expected to open in late 2015. Aircraft maintenance facilities occupy approximately 17 hectares across 12 aircraft
hangers providing 27,000m2 of floor space.
Freight/Cargo Operations
Cargo facilities occupy approximately 0.8 hectares of land at the airport. Facilities here include 1,600m2 of
warehousing served by a dedicated cargo apron. DHL also have an 800m2 cargo facility to the south of the
main terminal. Aberdeen’s cargo business includes cargo flown on passenger services (belly hold), dedicated
cargo flights and cargo transported by road to other major freight airports such as Heathrow. In the 12 months
to the end of 2011, 6,191 tonnes of cargo were handled through Aberdeen airport and this represents an
increase of 20% over the previous year. In 2013, this increased to 7,100 tonnes and this is expected to increase
to 9,200 tonnes by 2040.
The Masterplan states that new cargo developments will be undertaken only as a result of specific requests
from cargo operators and that detailed plans would be prepared and brought forward should demand arise.
As a general development principle, the airport is seeking to consolidate cargo and maintenance facilities away
from the existing terminal area.
Off Airport Commercial Floorspace

Page 73
There are a number of established industrial estates surrounding the airport including Kirkhill Industrial Estate, Raiths Industrial Estate and Pitmedden Industrial Estate. Also adjacent to the Airport is the 54 acre ABZ Business Park. It has outline planning consent for a mix of office, industrial and hotel uses and some speculative office development is already underway, with a number of occupiers having already taken space on the site. Development is also underway to construct a 200 bedroom 4-star Holiday Inn and a 130 bedroom 3-star Holiday Inn Express, expected to open in late 2015. Regus is also due to open a business centre on the site in 2015.
Adjacent to this is the D2 Business Park, being marketed and developed by Miller Developments. This has planning permission granted for 1.4m sq ft of office, industrial and ancillary accommodation and an initial 300,000 sq ft Office HQ has already been committed for Aker A.S.A. The new Aberdeen Western Peripheral Route (AWPR), due for completion in 2015, will provide a direct link between this site and the Airport. Adjacent to the D2 Business Park is a large plot of land allocated for employment or education/research uses from 2024 in planning policy.

Page 74
Liverpool John Lennon Airport
The Airport was officially opened on 1st July 1933 and is located 7 miles South East of Liverpool City Centre,
adjacent to the River Mersey. After various ownership structures, it is now 100% owned by the Peel Group and
has been since April 2014. LJLA is one of the UK’s busiest airports and handled 4.2 million passengers in 2013.
Passenger numbers have increased almost ten-fold since the mid-1990′s, with the Airport moving from 20th to
the 12th busiest airport in the UK with flights to approximately 60 destinations in the UK and across Europe.
Passengers are projected to increase to 12.3m by 2030 according to the Airport Masterplan. Airlines at JLA
include two of Europe’s largest low cost airlines, EasyJet and Ryanair, both of whom have large bases at JLA.
Other airlines include Blue Air, Wizz Air and Flybe. Significant investments in recent years include £130 million
in a range of infrastructure works including a new and subsequently expanded terminal building, air traffic
control centre, hangars, apron extensions, runway refurbishing and upgrading, multi-storey car park and on
site hotel.
Freight/Cargo Operations
The Airport transported 278 tonnes of cargo in 2013, down from 9,000 tonnes in 2004. This was due to a
number of contract withdrawals during this period. However, the Airport has undertaken an analysis of the
potential to expand and diversify the current UK and European cargo activities which include facilities for TNT
and a number of smaller operators. TNT has recently invested £6m in the provision of a new large distribution
facility on a 1.6 ha (4 acre) site to the east of terminal. TNT has a well established operation at JLA having been
based there since 1988. TNT offers key parcel delivery services between business customers in the UK and
global markets, including a nightly service linking into its European hub at Liege in Belgium. There are two
bonded transit sheds at JLA; i.e. buildings with both land-side and air-side access, which are approved by HM
Customs and Excise for the control and distribution of import and export cargo. TNT manages its own shed, but
the main shed is managed by Servisair.
Business and general aviation facilities are situated to the east of the terminal complex. Ravenair operates two
purpose built hangars having a combined footprint of 4,750sqm with a third facility planned. Ravenair offers
maintenance and storage of aircraft, flight training, and business charter services. Keenair operates a CAA
approved maintenance facility from a 1,670 sqm (18,000ft2) hangar.
Total office floor space at the airport is in the region of 3,500 sqm and much of this relates to administration
and airline offices housed in accommodation to the east of the terminal. The Airport Masterplan recognises
that these modest facilities do not meet airline and other user expectations and restrict the ability of the Airport
to attract further airport related business activity to JLA.
Off Airport Commercial Floorspace
An expanded cargo and maintenance facility is planned adjacent to the airport of around 7 ha to handle
forecast growth in cargo tonnage. In addition to this there are plans for further development at the Peel
Holdings owned Liverpool International Business Park is a 157 acre (62 hectare) site situated adjacent to

Page 75
Liverpool John Lennon Airport. Planning consent has been granted for B1/B2/B8 uses on the site and buildings
ranging from 50,000 sq. ft. (4,645 sq. m.) to 500,000 sq. ft. (46,452 sq. m.) can be accommodated. Current
occupiers include B&M and Prinovis and 35 acres of development land is currently being marketed. The
Hampton by Hilton hotel and Holiday Inn Express at Liverpool John Lennon Airport are both in close proximity
to the Business Park, as is the New Mersey Shopping Park and David Lloyd Fitness Club. Including the above
business park and other adjacent employment sites, when fully developed out these will provide over 340,000
sqm (3.5 million ft2) of mixed office, industrial, warehousing and commercial leisure accommodation within 2
km (1.2 miles) of the Airport.