report - southern california edison · report executive summary: 2015–2025 demand response...
TRANSCRIPT

REPORT
Executive Summary: 2015–2025 Demand Response Portfolio of Southern California Edison Company
April 1, 2015
Prepared for
Southern California Edison Co.
Prepared by
Candice A. Churchwell
Senior Consultant
Nexant, Inc.

i
Table of Contents
1 Introduction ............................................................................................................ 1
2 Overview of Demand Response Programs ............................................................. 4
2.1 Emergency Programs ........................................................................................ 4
2.1.1 Base Interruptible Program ............................................................................ 4
2.1.2 Agricultural and Pumping Interruptible Program ............................................. 4
2.2 Price-responsive Programs ................................................................................ 5
2.2.1 Summer Discount Plan – Commercial ........................................................... 5
2.2.2 Summer Discount Plan – Residential ............................................................. 5
2.2.3 Critical Peak Pricing ....................................................................................... 6
2.2.4 Demand Bidding Program .............................................................................. 6
2.3 Demand Response Aggregator-managed Programs .......................................... 6
2.3.1 Capacity Bidding Program ............................................................................. 6
2.3.2 Aggregator-managed Portfolio ....................................................................... 7
2.4 SmartConnect®-enabled Programs .................................................................... 7
2.5 Non-event Based Programs ............................................................................... 7
2.5.1 Real-time Pricing ........................................................................................... 7
2.5.2 SMB Non-residential Time-of-Use Pricing ...................................................... 7
2.5.3 Permanent Load Shifting ............................................................................... 8
2.6 Program Enrollment ........................................................................................... 8
3 Methodology ......................................................................................................... 11
3.1 Selection of Ex Ante Weather Conditions ......................................................... 12
3.2 Overview of Evaluation Methods ...................................................................... 14
3.3 Program Specific Analysis Methods ................................................................. 16
4 Ex Post Load Impact Estimates ............................................................................ 22
4.1 Summary of 2014 Events ................................................................................. 22
5 Ex Ante Load Impacts .......................................................................................... 31
5.1 Projected Change in Portfolio Load Impacts from 2015–2025 .......................... 31
5.2 2015 Portfolio Aggregate Load Impacts by Month ............................................ 32
5.3 Portfolio Load Impacts by Program Type ......................................................... 33
5.4 Portfolio Load Impacts by Program .................................................................. 35
6 Recommendations................................................................................................ 39

ii
6.1 Emergency Programs ...................................................................................... 39
6.2 Price-responsive Programs .............................................................................. 39
6.3 Aggregator-managed Programs ....................................................................... 40
6.4 SmartConnect®-enabled Programs .................................................................. 40
6.5 Non-event Based Programs ............................................................................. 41
Appendix A Ex Ante Weather Proxy Days .................................................................. 42
Appendix B Regression Specifications ....................................................................... 43
B.1 Base Interruptible Program .......................................................................... 43
B.2 Agricultural and Pumping Interruptible Program ........................................... 46
B.3 Summer Discount Plan – Commercial ......................................................... 47
B.4 Summer Discount Plan – Residential ........................................................... 49
B.5 Critical Peak Pricing ..................................................................................... 52
B.6 Demand Bidding Program ............................................................................ 56
B.7 Capacity Bidding Program and Aggregator-managed Programs .................. 58
B.8 Save Power Day .......................................................................................... 59
B.9 Real-time Pricing ......................................................................................... 59
B.10 SMB Non-residential Time-of-Use Pricing .................................................... 60
Appendix C Portfolio Aggregate Ex Ante Load Impact Estimates for 1-in-2
SCE-specific System Conditions by Month and Forecast Year ................ 62
Appendix D Portfolio Aggregate Ex Ante Load Impact Estimates for 1-in-10
SCE-specific System Conditions by Month and Forecast Year ................ 73
Appendix E Program-specific Aggregate Ex Ante Load Impact Estimates for
1-in-2 SCE-specific System Conditions by Month and Forecast Year ...... 84
Appendix F Program-specific Ex Ante Load Impact Estimates for 1-in-10
SCE-specific System Conditions by Month and Forecast Year ................ 95
Appendix G Portfolio Aggregate Ex Ante Load Impact Estimates for
1-in-2 CAISO System Conditions by Month and Forecast Year ............. 107
Appendix H Portfolio Aggregate Ex Ante Load Impact Estimates for
1-in-10 CAISO System Conditions by Month and Forecast Year ........... 118
Appendix I Program-specific Aggregate Ex Ante Load Impact Estimates for
1-in-2 CAISO System Conditions by Month and Forecast Year ............. 130
Appendix J Program-specific Ex Ante Load Impact Estimates for 1-in-10 CAISO
System Conditions by Month and Forecast Year ................................... 141

Introduction
1
1 Introduction
This report summarizes the load reduction capabilities of the Southern California Edison Co.
(SCE) portfolio of demand response (DR) programs. It details the load impacts from 2014
events (ex post load impacts) and load reduction capabilities for 2015 through 2025 under
normal (1-in-2 year) and 1extreme (1-in-10 year) system conditions (ex ante load impacts). This
report adheres to the April 8, 2010 decision by the California Public Utilities Commission
(CPUC) that requires a DR portfolio summary and specifies the format and content of
the summary.1
SCE’s DR portfolio is comprised of 15 DR resources listed in Table 1-1. Two programs listed in
the CPUC decision are not included in this report. Optional Binding Mandatory Curtailment
(OBMC) is a program of last resort, triggered immediately prior to rolling blackouts and is not
considered a DR program by SCE. The Scheduled Load Reduction Program (SLRP) is also not
included because there are no participants in the program and no enrollments are projected for
future years.
Table 1-1: Categorization of SCE DR Programs
Emergency Price-responsive
Demand Response
Aggregator-managed
SmartConnect®-enabled
Non-event Based
Base Interruptible Program with 15-minute advance notice (BIP-15)
Summer Discount Plan - Commercial (SDP-C)
Capacity Bidding Program with Day-ahead Notification (CBP-DA)
Save Power Day (SPD) - with enabling technology
Real-time Pricing (RTP)
Base Interruptible Program with 30-minute advance notice (BIP-30)
Summer Discount Plan - Residential (SDP-R)
Capacity Bidding Program with Day-of Notification (CBP-DO)
Save Power Day (SPD) - without enabling technology
Permanent Load Shifting (PLS)
Agricultural and Pumping Interruptible Program (AP-I)
Default Critical Peak Pricing (CPP) - Large
Aggregator-managed Programs (AMP)
SMB Non-res. Time-of-Use (TOU) Pricing
Default Critical Peak Pricing (CPP) - Medium
Default Critical Peak Pricing (CPP) - Small
Demand Bidding Program (DBP)
1 Decision (D.) 10-04-006

Introduction
2
The following reports from the 2014 program evaluations for all of SCE’s DR resources were
filed with the CPUC by SCE on April 1, 2014 in accordance with the CPUC Load Impact
Protocols2 (Protocols):
Bell, George, and Oh. 2014 Load Impact Evaluation of Southern California Edison’s Agricultural and Pumping Interruptible and Real-time Pricing Programs. Final Report. April 1, 2015.
Hansen and Huegerich. 2014 Load Impact Evaluation of California’s Statewide Base Interruptible Programs for Non-residential Customers: Ex post and Ex Ante Report. April 1, 2015.
Schellenberg, Blundell, and George. 2014 Load Impact Evaluation of California’s Statewide Non-residential Critical Peak Pricing Program. Final Report. April 1, 2015.
Braithwait, Hansen, and Armstrong. 2014 Statewide Load Impact Evaluation of California Aggregator Demand Response Programs: Ex Post and Ex Ante Report. April 1, 2015.
Hansen, Armstrong, and Braithwait. 2014 Load Impact Evaluation of California Statewide Demand Bidding Programs (DBP) for Non-residential Customers: Ex Post and Ex Ante Report. April 1, 2015.
Bell and George. 2014 Load Impact Evaluation of Southern California Edison’s Peak Time Rebate Program. Final Report. April 1, 2015.
Wikler, Steele-Mosey, and Ward. 2014 Load Impact Evaluation of Southern California Edison’s Residential and Commercial Summer Discount Plan (SDP) Programs. Final Report. April 1, 2015.
Hansen and Patton. 2014 Load Impact Evaluation of Southern California Edison’s Mandatory Time-of-Use Rates for Small, Medium, and Agricultural Customers: Ex Post and Ex Ante Report. April 1, 2015.
Bell and George. 2014 Load Impact Evaluation of the California Statewide Permanent Load Shifting Program. Final Report. April 1, 2015
Ex post load impacts are summarized for all programs that experienced an event in 2014. Ex
post load impacts determine what happened over an historical period, based on the conditions
that were in effect during that time. Because historical performance is tied to past conditions
such as weather, price levels, and dispatch strategy (e.g., localized dispatches), ex post load
impacts may not reflect the full option value of a DR resource.
Ex ante load impacts are summarized for each program and for SCE’s DR portfolio as a whole.
Portfolio impacts summarize the load reduction that can be expected from all of SCE’s DR
programs if jointly dispatched. In other words, they avoid double counting load impacts from
dually-enrolled customers. Ex ante load impacts are forward-looking and are designed to reflect
the load reduction capability of a DR resource under a standard set of conditions. Ex ante load
impacts are estimated under normal (1-in-2 year) and extreme (1-in-10 year) weather
conditions. For the first time, estimates were developed this year for two sets of weather
conditions, one based on SCE-specific peaking conditions and one based on CAISO system
2 See CPUC Rulemaking 07-01-041, D.08-04-050, “Adopting Protocols for Estimating Demand Response Load Impacts”
and Attachment A, “Protocols.”

Introduction
3
peaking conditions. Estimates contained in the main body of this report are based on SCE-
specific conditions. Estimates based on CAISO-specific peaking conditions are contained in the
appendices.
This report begins with a description of SCE's DR programs reported on in this executive
summary, including current and forecasted program enrollment. The program overview section
is followed by a summary of the methods employed in analyzing the ex post and ex ante load
impacts for each program. The next two sections summarize the ex post and ex ante results for
each program as well as the portfolio of programs collectively. The final section summarizes the
recommendations contained in the 2014 program evaluation reports. Appendix A shows the
proxy day used to develop ex ante weather conditions for SCE. Appendix B describes the
regression specifications that were used in modeling customer load or estimating load impacts
for each program evaluation. Appendices C through J contain the ex ante load impact tables
that must be included in this portfolio summary.

Overview of Demand Response Programs
4
2 Overview of Demand Response Programs
SCE's current programs can be assigned to one of five categories: emergency; price-
responsive; demand response aggregator-managed; SmartConnect®-enabled programs; and
non-event based programs. In general, emergency programs are called when operating
reserves are limited, either immediately prior to or during system emergencies. Price
responsive programs can be called based on market conditions defined by market prices,
generator heat rates, temperature or other indicators. Price responsive in this context does not
necessarily mean that customers in these programs face time-varying prices – it means that
these programs can be dispatched in response to economic conditions in the wholesale market.
In aggregator-managed programs, aggregators contract with commercial and industrial
customers and assist them in delivering load reductions. Each aggregator forms a portfolio of
individual customer accounts and nominates specific accounts for either an existing DR
program such as the Capacity Bidding Program or for meeting contractual load reduction
obligations. Non-event based programs are not dispatchable, but provide incentives for
customers to shift or reduce loads during peak periods through either time-varying prices or
explicit incentives. SmartConnect®-enabled programs refer to programs that are tied to SCE's
rollout of smart meters.
2.1 Emergency Programs
Emergency programs are called when operating reserves are limited, either immediately prior to
or during system emergencies.
2.1.1 Base Interruptible Program
Each of California’s three electric investor-owned utilities (IOUs), including SCE, offer the Base
Interruptible Program (BIP). BIP is a tariff-based, emergency-triggered demand response
program that CAISO can dispatch for system emergencies. The IOUs can also dispatch BIP for
local emergencies or on a test event basis to verify the program’s load reduction capability. The
program can be dispatched both for instances when electricity system demand approaches
installed generation capacity – a resource shortage – or in response to emergencies due to
transmission and generation outages. Customers enrolled in BIP receive incentive payments in
exchange for committing to reduce their electricity usage to a contractually-established level
referred to as the firm service level (FSL). Participants who fail to reduce load to the FSL are
subject to a financial penalty assessed on a kW per hour basis. BIP at SCE differentiates
payment levels based on the timing in which the customer responds to the dispatch notification
provided. Customers can commit to providing load reductions within 15 or 30 minutes of
notification. The load impacts for both options are summarized in this report.
2.1.2 Agricultural and Pumping Interruptible Program
The Agricultural and Pumping Interruptible (AP-I) program provides a monthly credit to eligible
agricultural and pumping customers for allowing SCE to temporarily interrupt electric service to
their pumping equipment during CAISO or other system emergencies. Agricultural and pumping
customers with a measured demand of 37 kW or greater, or with at least 50 horsepower of
connected load per service account, are eligible to participate in the AP-I program. Participating
customers must already be served under an agricultural and pumping rate schedule. When an

Overview of Demand Response Programs
5
interruption is deemed necessary and is allowed under the terms of the tariff, SCE sends a
signal to the load control device installed on a customer’s pumping equipment. The signal
automatically turns off the equipment for the entire duration of the interruption event. The
number of interruptions cannot exceed one per day, four per week, and 25 per calendar year.
The duration of an interruption cannot exceed 6 hours and the total hours of interruption cannot
exceed 40 per calendar month or 150 per calendar year. In exchange for allowing SCE to
interrupt pumping service during emergencies, AP-I customers receive a monthly credit. For
customers on time-of-use (TOU) rates, the credit is based on measured peak and mid-peak
electricity demand. For customers that are not on a TOU rate, the credit is based on
monthly usage.
2.2 Price-responsive Programs
The distinguishing feature of price-responsive programs is that they are dispatched based on
economic criteria rather than solely for emergency conditions. SCE has the option of
dispatching these programs when minimum conditions – defined by market prices, generation
heat rates, temperature and other market indicators – are met.
2.2.1 Summer Discount Plan – Commercial
The Summer Discount Plan – Commercial (SDP-C) is a central air conditioning (CAC) direct
load control program for commercial customers. SCE began to operate SDP-C as a price-
responsive program in 2013. During high system peak hours or emergency conditions, a signal
is sent to control devices that limit the operation of the CAC unit. Participants can elect the level
of load control – the cycling strategy. SDP-C has three plan options. The Maximum Comfort
plan allows SCE to control CAC units up to nine minutes of every half hour, for up to six hours a
day. The Good Value plan offers CAC control up to 15 minutes of every half hour, for up to six
hours a day. The Maximum Savings plan offers complete CAC curtailment for up to six hours a
day. The program is available year-round, can be called for up to six hours per day, and can be
dispatched up to 180 hours per year, per participant. The load impacts and enrollment forecasts
in this report are summarized across all options of the program for commercial customers.
2.2.2 Summer Discount Plan – Residential
The Summer Discount Plan – Residential (SDP-R) program is a CAC direct load control
program for residential customers. SCE began to operate SDP-R as a price-responsive
program in 2012. During high system peak hours or emergency conditions, a signal is sent to
control devices that limit the operation of the CAC unit. The program is available year-round
and for all hours of the day, but can only be called up to six hours per day and up to 180 hours a
year for each participant. As with the SDP-C program, participants choose a cycling strategy.
The Maximum Comfort plan offers CAC control up to 15 minutes of every half hour, for up to six
hours a day. The Maximum Savings plan offers complete CAC curtailment for up to six hours a
day. Both residential plans have an override option. In exchange for receiving a lower incentive,
customers can press a button on the load control device which allows the customer to override
up to five event days per calendar year. The override option is only available to customers who
have a CAC located on the ground. The load impacts and enrollment forecasts in this report are
summarized across all options of the program for residential customers.

Overview of Demand Response Programs
6
2.2.3 Critical Peak Pricing
Critical Peak Pricing (CPP) is a dynamic pricing program for customers on a time-of-use rate.
In 2010, SCE's large customers with demands over 200 kW were defaulted onto CPP. SCE will
default small and medium commercial customers with demands below 200 kW, in addition to
large pumping and agricultural customers, to CPP in 2017. Under this rate option, higher prices
on critical peak days are offset by a reduction in off-peak prices. SCE has a 2 to 6 PM event
window on CPP days and only calls events on non-holiday weekdays. SCE is committed to
dispatch 12 events each year. In 2014, mostly large customers with peak demands exceeding
200 kW received service under CPP except for some voluntary small and medium business
customers.
2.2.4 Demand Bidding Program
The Demand Bidding Program (DBP) is a voluntary demand reduction program that provides
enrolled customers with the opportunity to receive bill credits for load reductions on event days.
The program is designed to allow commercial and industrial facilities to provide load reduction
without firm commitments or participant risk. Because a firm commitment is not required,
participants can decide whether or not to bid in load reduction on an event-by-event basis and
even if they bid, there is no penalty for not providing the committed reduction. As such, the mix
of event participants (versus enrolled participants) and magnitude of load reduction varies from
event to event.
2.3 Demand Response Aggregator-managed Programs
Technically, aggregator-managed programs are also price-responsive resources, but they are
given a separate category because customers typically are not directly enrolled with the utility.
In aggregator-managed programs, aggregators contract with commercial and industrial
customers and assist them in delivering load reduction. Each aggregator forms a portfolio of
individual customer accounts and nominates specific accounts for either an existing demand
response program such as the Capacity Bidding Program (CBP) or for meeting contractual load
reduction obligations. The aggregator assumes responsibility for managing relationships with
individual customers, arranging for load reductions on event days, receiving incentive payments
and paying penalties (if warranted) to the utility. SCE currently has two aggregator managed
programs: CBP and Aggregator-managed Portfolio (AMP).
2.3.1 Capacity Bidding Program
CBP is a statewide program that provides aggregators with monthly capacity payments, paid on
a per kW basis, based on load reduction commitments for each month, plus additional energy
payments, paid on a per kWh basis, based on actual electricity demand reductions during
events. Each month, aggregators may adjust the nominated load reduction, the mix of
customers that provide load reduction and event options (e.g., day-ahead or day-of events, and
four-hour, six-hour, or eight-hour event lengths). CBP events may be called on non-holiday
weekdays, between the hours of 11 AM and 7 PM. CBP day-ahead (CBP-DA) and day-of
(CBP-DO) resources are summarized separately in this report.

Overview of Demand Response Programs
7
2.3.2 Aggregator-managed Portfolio
AMP is very similar to the CBP program. The primary difference is that the contracts are
individually negotiated and span a longer period of time over which load reduction resources
ramp up to contractual levels. Like CBP, aggregators contract with commercial and industrial
customers to act on their behalf with respect to all aspects of the program, including receiving
notices from the utility, arranging for load reductions on event days, receiving incentive
payments and paying penalties to the utility (if warranted). Each aggregator forms a portfolio of
individual customer accounts so that their aggregated load participates in the DR programs and
penalty risk is mitigated.
2.4 SmartConnect®-enabled Programs
This report also provides ex post and ex ante load impact estimates for one program in the
SmartConnect®-enabled category, which is a segment of demand response programs tied to
SCE's rollout of smart meters. Save Power Day (SPD) is a peak time rebate program for
residential customers. In 2012 and 2013, all SCE residential customers, regardless of whether
or not they had opted-in for alert notification, were eligible to receive SPD bill credits. In 2014,
SCE provided bill credits only to those accounts that opted-in for alert notification. The Save
Power Day program is a voluntary, behavior-based demand response program open to all SCE
residential customers with operating SmartConnect meters. It provides bill credits to customers
based on their specific load reduction on event days when high prices are anticipated. SPD
events occur on non-holiday weekdays between 2 to 6 PM and customers are notified of the
events on a day-ahead basis via email, text, or phone.
2.5 Non-event Based Programs
Non-event based programs are not dispatchable, but provide load reduction or load shifting on a
daily basis. They provide incentives for customers to shift or reduce loads during peak periods
through either time-varying prices or explicit incentives.
2.5.1 Real-time Pricing
RTP is a dynamic pricing tariff that charges participants for the electricity they consume based
on hourly prices that vary according to day type and temperature. It attempts to incorporate
time-varying components of energy costs and generation capacity costs. The RTP tariff
consists of nine hourly pricing profiles that vary by season, day type, and daily maximum
temperature as measured by the Los Angeles Civic Center weather station. The tariff is
available to commercial and agricultural customers. Because the rate schedules are linked to
variation in weather, participants experience higher prices on hotter days and a greater number
of high-price days during extreme weather years than in normal weather years.
2.5.2 SMB Non-residential Time-of-Use Pricing
SCE first transitioned small and medium business (SMB) customers to mandatory time-of-use
(TOU) pricing in January 2014. Agricultural customers were transitioned shortly thereafter in
February 2014. Approximately 393,000 service accounts were transitioned in 2014,
approximately 4,000 of which were agricultural customers. SCE expects to transition an
additional 209,000 service accounts to TOU rates in 2015 (12,000 of which are agricultural).

Overview of Demand Response Programs
8
The TOU rates were designed such that SCE expects more than 90 percent of the transitioned
customers to have TOU bill impacts of less than $100 and 5 percent of their bill per year prior to
any changes in usage levels or patterns in response to the new price signals.
SCE’s Schedule GS-1 is an energy-only rate that applies to the smallest non-residential
customers. Schedule GS-2 is a demand and energy rate that applies to customers with
maximum demand between 20 and 200 kW. The TOU versions of both tariffs, which apply to
customer accounts that have been transitioned to TOU, are seasonal three-tier rates. Their
energy prices differ by summer and non-summer, and by peak, mid-peak, and off-peak time
periods, and they have demand charges, some of which differ by peak and mid-peak periods.
That is, the demand charge that applies to delivery services applies to all hours, while the
demand charges that apply to generation services apply to the peak and mid-peak periods. The
rate structures of the TOU and Non-TOU versions of the agricultural (PA) tariffs have similar
features to the GS-1 and GS-2 tariffs.
2.5.3 Permanent Load Shifting
The Permanent Load Shifting (PLS) program provides a one-time incentive payment ($875/kW
shifted) to customers who install qualifying PLS-Thermal Energy Storage (TES) technology on
typical central air conditioning units or process cooling equipment. Incentives are determined
based on the designed load shift capability of the system and the project must undergo a
feasibility study prepared by a licensed engineer. The load shift is typically accomplished
through shifting of daytime chiller load to overnight hours. All electric customers on time-of-use
electricity rates are eligible for the program, including residential, commercial, industrial,
agricultural, direct access, and Community Choice Aggregation customers. To qualify for the
PLS program incentive payment, customers must go through the program application, approval,
and verification process. The total incentive amount is determined using a customer’s peak load
shift on their maximum cooling demand day (based on on-peak hours). The incentive payments
are intended to offset a portion of the cost of installation, thereby making the system more
attractive financially. Customers are required to shift load by running the TES system on
weekdays during summer months, but program participants are also encouraged to shift load
during non-summer months to maximize their energy bill savings.
2.6 Program Enrollment
Table 2-1 summarizes the SCE DR enrollment forecasts for 2015 through 2025 reported at the
portfolio level. Enrollment in the emergency, aggregator-managed, and non-event based
programs is projected to be flat through the forecast horizon, while enrollment in the price-
responsive programs is expected to rise by 15% by 2025. Within the price-responsive program
category, CPP enrollment is expected to grow from 2,560 participants in 2015 to nearly 130,000
participants in 2025 due to the default pricing option’s expansion to medium and small
customers. Enrollments in the CAC load control programs, SDP-C and SDP-R are expected to
decline by 36% and 26%, respectively. These declining SDP enrollments amount to a reduction
of 80,000 price-responsive program participants by 2025. Smart Connect-enabled program
enrollment is also forecast to fall by 5%, but this modest change is a composite of two large
enrollment changes forecasted to occur for SPD with enabling technology and SPD without
enabling technology. The technology-enabled SPD program is expected to dramatically
increase from about 4,000 participants in 2015 to over 80,000 participants in 2025. The SPD

Overview of Demand Response Programs
9
program segment with no enabling technology is expected to decline from about 288,000
participants in 2015 to around 197,000 participants in 2025. Overall, enrollment in SCE DR
programs is expected to rise by 4% from about 812,000 participants in 2015 to around 843,000
in 2025.

Overview of Demand Response Programs
10
Table 2-1: SCE DR Portfolio Projected Enrollments for 2015–2025 by Program (Values reflect expected enrollment in August)
Program Type Program Forecast Year
2015 2016 2017 2018 2019 2020 2021 2022 2023 2024 2025
Emergency
BIP-15 66 64 63 61 61 61 61 61 61 61 61
BIP-30 514 501 487 474 474 474 474 474 474 474 474
AP-I 1,232 1,258 1,284 1,278 1,278 1,278 1,278 1,278 1,278 1,278 1,278
Price-responsive
SDP-C 12,016 11,385 10,810 10,287 9,811 9,378 8,984 8,626 8,299 8,002 7,732
SDP-R 291,334 280,114 269,904 260,612 252,157 244,463 237,461 231,090 225,292 220,016 215,214
CPP-Large 2,560 2,574 2,657 2,742 2,831 2,922 3,016 3,113 3,213 3,317 3,424
CPP-Medium 0 0 34,795 13,918 14,366 14,829 15,306 15,799 16,308 16,833 17,375
CPP-Small 0 0 215,205 86,082 88,854 91,715 94,669 97,717 100,864 104,112 107,465
DBP 489 442 428 428 428 428 428 428 428 428 428
Demand Response
Aggregator-managed
CBP-DA 129 129 129 129 129 129 129 129 129 129 129
CBP-DO 1,162 1,162 1,162 1,162 1,162 1,162 1,162 1,162 1,162 1,162 1,162
AMP 1,057 1,057 1,057 1,057 1,057 1,057 1,057 1,057 1,057 1,057 1,057
SmartConnect®-enabled
SPD with Tech. 3,857 6,147 10,125 16,874 24,106 33,146 43,753 54,601 65,448 73,283 80,515
SPD without Tech. 288,412 268,070 256,527 246,138 236,788 228,373 220,800 213,983 207,849 202,327 197,359
Non-event Based
PLS 0 2 7 12 12 12 12 12 12 12 12
RTP 109 109 109 109 109 109 109 109 109 109 109
SMB Non-res. TOU 209,000 209,000 209,000 209,000 209,000 209,000 209,000 209,000 209,000 209,000 209,000
Portfolio Total 811,937 782,014 1,013,748 850,363 842,623 838,536 837,698 838,639 840,983 841,600 842,792

Methodology
11
3 Methodology
The 2014 evaluations address two main questions for DR programs: what demand reductions
were delivered when resources were dispatched in 2014; and, what is the load reduction
capability of each DR program?
Ex post impacts reflect the demand reductions attained during actual events, but do not
necessarily reflect the load reduction capability of the DR program. Historical ex post results
are tied to specific conditions that occurred for that given event, including weather conditions,
the number of participants who were dispatched, the mix of customers, and other factors such
as switch failure rates. Several programs are dispatched strategically to address congestion in
specific zones, test load response capabilities, or for economic reasons. Due to the absence of
extreme weather or system emergencies in 2014, emergency resources such as BIP were only
dispatched to test load reduction capabilities. In addition, the timing and duration of event
dispatch varied across event days for many programs. As a result, the impacts for individual
event days are not necessarily representative of the full program capability.
Ex ante impacts reflect the load reduction capability of a DR program for each month under
a weather conditions associated with standard 1-in-2 and 1-in-10 system peaking conditions.
They reflect the reduction that can be attained if all enrolled participants are dispatched under
the weather conditions that drive system planning. Whenever possible, ex ante load impacts
are grounded in analysis of historical load impact performance. These estimates are used in
assessing alternatives for meeting peak demand, cost-effectiveness comparisons, and long-
term planning.
Figure 3-1 shows the connection between ex post load impacts, ex ante impacts, cost-
effectiveness analysis, and resource planning. Analysis of historical program data is employed
to produce ex ante load impact estimates that are subsequently used for resource adequacy,
cost-effectiveness assessment and, by connection, resource planning.

Methodology
12
Figure 3-1: Summary of Ex Post and Ex Ante Analysis Process and Connections
3.1 Selection of Ex Ante Weather Conditions
The Protocols require that ex ante load impacts be estimated assuming weather conditions
associated with both normal and extreme utility operating conditions. Normal conditions are
defined as those that would be expected to occur once every two years (1-in-2 conditions) and
extreme conditions are those that would be expected to occur once every ten years (1-in-10
conditions). Since 2008, the SCE has based ex ante weather on system operating conditions
specific to their own system. However, ex ante weather conditions could alternatively reflect 1-
in-2 and 1-in-10 year operating conditions for the California Independent System Operator
(CAISO) rather than the operating conditions for SCE. While the Protocols are silent on this
issue, a letter from the CPUC Energy Division to the three California electric investor-owned
utilities dated October 21, 2014 directed them to provide impact estimates under two sets of
operating conditions starting with the April 1, 2015 filings: one reflecting operating conditions
for each utility and one reflecting operating conditions for the CAISO system.
In order to meet this new requirement, the utilities developed ex ante weather conditions based
on the peaking conditions for each utility and for the CAISO system. The previous ex ante
weather conditions for each utility were developed in 2009 and were updated along with the
development of the new CAISO-based conditions. Both sets of estimates used a common
methodology, which was documented in a report delivered to the utilities.3
3 See Statewide Demand Response Ex Ante Weather Conditions. Nexant, Inc. January 30, 2015.
-Event days
-Weather
-Participant
characteristics
Interval data
(sample or
population)
Statistical
Analysis of
historical data
Statistical
Analysis of
historical data
Evaluation
planning/ goals
Methodology
-Regression
-Day matching
- Other
Ex-post load
impacts
Ex-post load
impacts
Ex-ante
impact
estimates
Ex-ante
impact
estimates
Cost-
Effectiveness
Tests
Cost-
Effectiveness
Tests
DR costs
DR benefits
Comparison
with other
resources
Comparison
with other
resources
Generation
alternatives
Adjustments
DSM alternatives
Day Types1-in-2 weather year
1-in-10 weather year
Avg. weekday by month
Monthly system peak day
Weather
Participant characteristics
Other – e.g. switch failures
1-in-2 and 1-in-10
-Weather data
- System Load Data
- Day traits
Participation
Forecasts
Participation
ForecastsMeasurement
& Verification
Studies
Measurement
& Verification
Studies

Methodology
13
The extent to which utility-specific ex ante weather conditions differ from CAISO ex ante
weather conditions largely depends on the correlation between individual utility and CAISO peak
loads. Figure 3-2 shows the correlations between SCE peaks and CAISO system-wide daily
peaks. Because the focus is on peaking conditions, the graph includes the 25 days with the
highest CAISO loads in each year from 2006-2013 (25 days per year for 8 years, providing 200
observations per utility).
Figure 3-2: Relationship between CAISO and SCE Peak Loads CAISO Top 25 Peak Days per Year (2006-2013)
SCE peak loads are more closely related to CAISO peak loads than are PG&E or SDG&E peak
loads. Part of the explanation is simply that SCE constitutes a larger share of CAISO load than
do the other two utilities and therefore has more influence on the overall CAISO loads.
However, there are additional reasons for the differences. PG&E’s northern California service
territory experiences different weather systems and is more likely to peak earlier in the year than
the overall CAISO system. SDG&E weekday loads and weather patterns are also unique. A
larger share of SDG&E’s load is residential and less of it is industrial. Temperatures peak earlier
in the day than load does at SDG&E and the diurnal swing between overnight and peak
temperatures is smaller.
While IOU and CAISO loads do not peak at the same time all the time, the relationship between
CAISO loads and utility peaking conditions has been weakest when CAISO loads have been
below 45,000 MW. For example, CAISO loads often reach 43,000 MW when Southern
California loads are extreme but Northern California loads are moderate (or vice-versa).
However, whenever CAISO loads have exceeded 45,000 MW, loads typically have been
high across all three IOU’s.

Methodology
14
Table 3-1 shows the values for each weather scenario, weather year and month for a variable
equal to the average temperature from midnight to 5 PM (referred to as mean17) for each day
type. For the typical event day, the CAISO weather is hotter on average than the utility-specific
weather for SCE for 1-in-2 and is nearly equal under 1-in-10 year weather conditions.
Table 3-1: SCE Sales-weighted Ex Ante Weather Values (mean17) on Monthly Peak Days
3.2 Overview of Evaluation Methods
The methods used to estimate ex post and ex ante load impacts for each of the DR programs in
the SCE portfolio are conceptually similar. Nearly all of the 2014 evaluations relied, or partially
relied on, regression analysis to estimate a model reflecting the relationship between customer
whole-premise or end-use load and key determinants of the variation in energy use over time,
such as weather and time-of-day, day-of-week and seasonal patterns that reflect the normal
pattern of business or household operations. In some cases, a matched control group was
used to estimate reference load for the purpose of deriving load impacts. Here, load is not
modeled as a function of weather and time-of-day for the purpose of determining reference load;
reference load for the treatment group is simply the observed load of the control group, minus
the small difference between treatment and control loads observed on non-event days.
However, reference load models are still required even in this setting for the purpose of ex ante
load impact estimation. The exception in 2014 is the PLS evaluation, which had no installed
projects at the time of the evaluation. The PLS evaluation used building simulation modeling to
develop ex ante load impacts given further assumptions about the timing, geographic location,
project size, and budget for the program across the ex ante forecast horizon.
Regression models are based on historical hourly or sub-hourly electricity use data for
customers who have participated in the DR programs. Each model or set of models is used to
estimate the reference load for an average customer enrolled in a program, which represents
what customers would be expected to use in the absence of an event on days in which program
events either were called (for ex post impact estimation) or have a high probability of being
called (for ex ante impact estimation). For RTP, the methods were slightly different. RTP
Month
1-in-2 1-in-10
Utility-specific
CAISO Utility-specific
CAISO
5 69.4 68 77.7 76.3
6 71.8 72.7 76.3 76.9
7 75.5 78.8 79.8 79.1
8 79.2 78.4 81.5 80.8
9 75.5 77.9 82 82.5
10 74.2 70.6 76.7 76.9
Avg. (May-Oct) 74.3 74.4 79 78.7

Methodology
15
reference loads represent what the average customer would use on a specific day if they faced
the otherwise applicable tariff, TOU-8, rather than the RTP tariff.
In most instances, ex post load impacts were estimated by comparing the reference level
energy use in each hour with the estimated load with DR in the hour on each event day. For ex
ante estimation, predicted energy use in each hour was estimated under the assumption that an
event occurred and also under the assumption that it did not occur, while everything else (e.g.,
weather, day-of-week effects) was held constant at values representative of a typical event day
or monthly system peak day.
At a more technical level, three general approaches were used to estimate the
regression models:
Individual Customer Time Series Regressions: This method works well for event-based programs with numerous events and for programs with substantial variation in the drivers of load response or load shifting. This approach is also useful for programs with substantial differences in the magnitude and load patterns of customers, which is more typical among large customers. The coefficients vary at the customer level. While the regressions do not necessarily explain individual customer behavior perfectly, in aggregate, they explain most of the program level variation in loads. Importantly, individual customer regressions can be employed to describe the distribution of customer load reductions as well as the distribution of percent load reductions. They can also be used to describe impacts for segments of the participant population. The key limitation to individual customer regressions is their inability to make use of control groups.
Aggregate Time Series Regressions: Similar to the individual customer regression approach, but rather than estimating reference loads and load impacts for individual customers, estimates are made for groups of customers taken in aggregate.
Panel Regressions: This method is particularly suitable when control groups are available, or sample sizes are sufficient for the territory, but inadequate for smaller segments such as local capacity areas. A key strength of panel regressions is the ability to control for certain omitted or unobservable variables.4 While panel regressions can increase the accuracy of impact estimates for the average customer, they cannot be employed to describe the distribution of impacts among the participant population. Importantly, panel regressions cannot control for customer characteristics that interact with occupancy and or weather unless those variables are explicitly included.
The regression models used to predict the reference load were developed with the primary goal
of accurately predicting average customer load given the time of day, day of week, temperature,
and location of each customer and predicting load reductions under different temperature
conditions. The focus was on the accuracy of the prediction and the validity of load impact
4 Panel regressions can account for omitted variables that are unique to customers and relatively time invariant over the
analysis time frame (fixed effects) such as household income. Panel regressions can also account for omitted variables
that are common across the participant population but unique to specific time periods (time effects). They cannot,
however, account for omitted variables that vary both by participant and by time period or for household characteristics
(e.g., central air conditioning) that interact with variables that vary over time, such as weather and occupancy.

Methodology
16
estimates. The regression equations used to model load patterns and estimate load impacts for
each program are detailed in Appendix B.
3.3 Program Specific Analysis Methods
Table 3-1 summarizes the analysis methodology for each program. It describes the general
approach used for load impact estimation and details any key assumptions required in the
analysis. The specific methodology chosen for each program was based on the available data,
event dispatch patterns, and the strengths and weakness of each available analysis approach.

Methodology
17
Table 3-1: Summary of Analysis Methodologies by Program
Program Method Evaluation Description Key Assumptions
Base Interruptible Program (BIP-15 and BIP-30)
Regression models - individual customer
Ex post hourly load impacts were estimated using regression equations applied to customer-level hourly load
data. Ex ante impacts were estimated as the reference load under 1-in-2 and 1-in-10 system peak conditions minus the firm service level, with adjustments based on
historical over or under performance.
Customers will continue to perform
relative to their FSL in the future as they have in the past
Enrollment growth is expected to
slightly decline until 2018 and hold steady throughout the remainder of the forecast horizon.
Agricultural Pumping Interruptible Program (AP-
I)
Regression models - individual customer
Agricultural pump loads were modeled as a function of time of day, day of week,
temperature, and other factors. Estimates of switch activation success rates were
developed based on the 2013 test event and applied to reference loads in the ex
ante analysis
Pump loads are fully shut down when
switch activation is successful
Switch activation success rates are
assumed to improve through 2014 due to an effort to identify and fix communication
and switch failures
Small increases in enrollment are
expected across the forecast horizon
Summer Discount Plan - Commercial (SDP-C)
Regression models - individual customer
Ex post hourly load impacts were
estimated using regression equations applied to customer-level hourly load data of all SDP-C participants. Hourly ex ante load impacts (and snapback) are modeled
at the strata level as a function of weather conditions and the presence of a SPD
event.
Ex ante estimates assume that
participants' characteristics such as CAC tonnage and SEER rating do not change.
Changes in program enrollment will
reflect the current distribution of SDP customers
Enrollment is expected to decline by
more than 35% by 2025.

Methodology
18
Program Method Evaluation Description Key Assumptions
Summer Discount Plan - Residential (SDP-R)
Regression models - aggregate
Ex post hourly load impacts were
estimated at the strata level using a single regression applied to hourly load data from a stratified sample of the SDP-R
population. Hourly ex ante load impacts (and snapback) are modeled at the strata level as a function of weather conditions
and the presence of a SPD event.
Changes in program enrollment will
reflect the current distribution of SDP customers
Ex ante estimates assume that
participants' characteristics such as CAC tonnage and SEER rating do not change.
Enrollment is expected to decline by
more than 25% by 2025.
Critical Peak Pricing (CPP)
Regression models - fixed effects
panel regression
and individual customer
regression
Ex post load impacts are estimated using load data for CPP customers and a
statistically matched control group of non-CPP customers; individual customer regressions were used for certain
customer groups for whom the matched
control group approach was not possible. Ex ante load impacts were estimated by
modeling reference load and percentage load impacts a function of weather for
persistent CPP customers (customers who participated in CPP in both 2013 2014)
Future load impacts will observe a
similar relationship to weather as observed 2013 and 2014
CPP participation will grow by
approximately 33% by 2025
Demand Bidding Program (DBP)
Regression models - individual customer
Ex post hourly load impacts were estimated using regression equations applied to customer-level hourly load
data. Ex ante load impacts were estimated using percentage load impacts
directly calculated from 2012-2014 ex
post results (for each customer enrolled in the program at the end of the 2014 cycle) and applied to 1-in-2 and 1-in-10 weather
reference loads.
Future bidding behavior will be similar
to current bidding behavior; future load impacts for each customer will be similar
to historical performance in 2012, 2013, and 2014
Ex ante load impacts take into account
removal of non-performing participants in
2015
Enrollment is expected decrease
slightly through 2017 as SCE continues to remove non-performing participants from the program

Methodology
19
Program Method Evaluation Description Key Assumptions
Capacity Bidding Program (CBP-DA and CPB-DO)
Regression models
- individual customer
Ex post hourly load impacts were estimated using regression equations
applied to customer-level hourly load data. Ex ante load impacts were
estimated using percentage load impacts directly calculated from 2012-2014 ex
post results (for each customer enrolled in the program at the end of the 2014 cycle)
and applied to 1-in-2 and 1-in-10 weather reference loads.
Future load impacts for each customer
will be similar to historical performance in 2012, 2013, and 2014
Customer mix at SCE will be similar to
that of the 2014 participants
No enrollment growth over the forecast
horizon
Aggregator-managed Portfolios (AMP)
Regression models - individual customer
Ex post hourly load impacts were estimated using regression equations
applied to customer-level hourly load data for each nominated customer. Ex ante
load impacts were estimated using percentage load impacts directly
calculated from 2012-2014 ex post results (for each customer enrolled in the
program at the end of the 2014 cycle) and applied to 1-in-2 and 1-in-10 weather
reference loads.
Future load impacts for each customer
will be similar to historical performance in 2012, 2013, and 2014
Customer mix at SCE will be similar to
that of the 2014 participants
No enrollment growth over the forecast
horizon
Save Power Day (SPD) Regression models
- fixed effects panel regression
Ex post load impacts are estimated using load data for SPD customers and a
statistically matched control group of non-SPD customers; load impacts are
calculated using a difference-in-differences approach. Ex ante load impacts are
estimated by modeling 2014 load impacts as a function of weather, and using the estimated model to predict load impacts
for ex ante weather conditions.
SPD participants will continue to
respond to event notifications as they have in the past
SPD participants currently enrolled in
the program are representative of future participants on the program
SPD participants with enabling
technology will dramatically increase from about 4,000 to 110,000 customers in 2025, while participation without enabling
technology will fall from approximately 380,000 to approximately 260,000 participants

Methodology
20
Program Method Evaluation Description Key Assumptions
Real-time Pricing (RTP)
Regression models
- individual customer
Customer load was modeled as a function of time of day, day of week, weather (for
some customers) and hourly price schedules using 2014 hourly data. The
impacts were estimated as the difference between customer loads under RTP and
estimated hourly loads under the otherwise applicable tariff prices based on
individual customer price response.
Customers will continue to respond to
prices as they have in the past
Large customers who have been on the
program for three or more years are not projected to leave RTP during the forecast
horizon; customers who leave are expected to be relatively small compared to the average customer in the program
RTP is expected to experience a modest
decrease in enrollment over the next year before becoming stable in 2015
RTP will be available to TOU-8
customers and future RTP and TOU-8 rates will be similar to present rates
SMB Non-residential TOU Pricing
Regression models - fixed effects
panel regression
Ex post load impacts are estimated using load data for TOU customers and a
statistically matched control group of non-
TOU customers; load impacts are
calculated using a difference-in-differences approach. Ex ante load impacts are
estimated by modeling 2014 load impacts as a function of weather, and using the estimated model to predict load impacts
for ex ante weather conditions.
Ex ante estimates represent the
expected load impacts for the 209,000 non-residential customers expected to transition to TOU pricing in 2015; adjustments are included to account for the change in distribution of customers
across load capacity areas (LCAs)
No changes in enrollment are expected
for the forecast horizon

Methodology
21
Program Method Evaluation Description Key Assumptions
Permanent Load Shifting (PLS)
Building simulation
modeling combined with assumptions
regarding
unidentified projects
Ex ante impacts were forecast for two different types of projects—identified
(those for which customers have completed an application) and unidentified
(applications that are expected to be
submitted by the end of 2016). Load impacts for both types were developed
using building simulation models. Impacts
for identified projects were allocated to LCAs based on the expected project
installation date. The allocation of impacts
for unidentified projects were estimated based on key assumptions from the PLS
program manager and M&E staff.
The number of unidentified installations
assumes that 65% of the incentive budget
will be spent; unidentified projects are assumed to come online through 2018
Expected size of unidentified projects is
675 kW
It is assumed that 10% of projects that
reach the application stage will drop out of the program prior to project installation
PLS load impacts are projected to
degrade by 2.5% per annum after five years in service due to expected losses in system efficiency
Unidentified projects are distributed by
LCA, proportional to the distribution of the large C&I population across LCAs

Ex Post Load Impact Estimates
22
4 Ex Post Load Impact Estimates
This section summarizes the load impacts in 2014 for event-based programs. Ex post load
impacts are based on modeling electricity use patterns and load impacts over a historical
period. In the case of some programs, electricity usage data from control customers who do not
participate in the program is used in addition to electricity usage data from program participants
to estimate reference load for the hours prior to, during, and after DR events. In general, ex post
load impacts estimate what happened based on the conditions that were in effect during the
time of each event. While historical load patterns and impacts are critical for understanding the
magnitude of load reduction resources, they have limitations. Because historical performance is
tied to past conditions such as weather, price levels and dispatch strategy (e.g., localized
dispatches), ex post load impacts may not reflect the full option value of a DR resource. For
example, a test event for a highly weather sensitive program such as SDP-C may yield lower
impacts than what the program can provide because future events might occur at hotter
temperatures when air conditioning loads are higher. Likewise, resources such as CBP or AMP
may be dispatched partially – one product line is called – in which case ex post events may not
necessarily reflect the program load reduction capability.
4.1 Summary of 2014 Events
In 2014, SCE DR resources were dispatched based on program rules and need. The event
days and event hours differed across programs and, sometimes, within programs. Table 4-1
summarizes the events called in 2014 by date and program. RTP, SMB Non-residential TOU
pricing, and PLS no not appear in the table because they not event-based programs. SDP,
CBP, and CPP were dispatched most frequently of the event-based programs.
As noted earlier, several programs are dispatched strategically to address congestion in specific
zones, to test load response capabilities, or for economic reasons. For CBP and AMP, different
combinations of program products and/or aggregators (if applicable) were dispatched for each
individual event in 2014. As a result, the impacts for individual event days are not necessarily
representative of the resources available should SCE solicit demand reductions from all
aggregator resources at once.

Ex Post Load Impact Estimates
23
Table 4-1: Summary of 2014 SCE Demand Response Events by Date and Program
Date AMP AP-I BIP CBP-DO CBP-DA DBP CPP SDP-C SDP-R SPD
2/6/2014
11:00 AM - 5:00 PM / 5:00 PM - 7:00 PM / 5:00 PM - 9:00 PM
2:15 PM - 7:39 PM
2:15 PM - 7:14
PM
3:00 PM - 7:00 PM /
3:00 PM - 7:00
PM
6:00 PM - 7:00
PM
2:15 PM - 7:39
PM
2:15 PM - 7:39
PM
5/13/2014 5:00 PM - 6:00
PM
5/14/2014
2:00 PM - 3:00 PM / 3:00 PM -
6:00 PM
5/15/2014
1:00 PM - 5:00 PM / 5:00 PM -
6:00 PM
3:00 PM - 6:00
PM
5/29/2014 2:00 PM - 4:00
PM
6/10/2014
2:00 PM - 4:00 PM / 2:00 PM - 4:00 PM / 2:00 PM - 4:00 PM
6/26/2014 2:00 PM - 4:00
PM
6/30/2014 1:00 PM - 3:00
PM
7/3/2014
3:00 PM - 5:00
PM
7/7/2014
3:00 PM - 4:00
PM

Ex Post Load Impact Estimates
24
Date AMP AP-I BIP CBP-DO CBP-DA DBP CPP SDP-C SDP-R SPD
7/8/2014
2:00 PM - 6:00
PM
7/14/2014
3:00 PM - 7:00
PM
12:00 PM -
8:00 PM
2:00 PM - 6:00
PM
2:00 PM - 6:00
PM
7/15/2014
5:00 PM - 6:00
PM
7/25/2014 2:00 PM - 4:00
PM
7/30/2014
3:00 PM - 7:00 PM /
3:00 PM - 7:00
PM
2:00 PM - 6:00
PM
5:00 PM - 6:00
PM
5:00 PM - 6:00
PM
7/31/2014
2:00 PM - 7:00 PM /
3:00 PM - 7:00
PM
5:00 PM - 6:00
PM
4:00 PM - 6:00
PM
8/1/2014
5:00 PM - 6:00
PM
8/4/2014
2:00 PM - 6:00
PM
2:00 PM - 6:00
PM
8/11/2014 4:00 PM - 7:00
PM
2:00 PM - 6:00 PM /

Ex Post Load Impact Estimates
25
Date AMP AP-I BIP CBP-DO CBP-DA DBP CPP SDP-C SDP-R SPD
2:00 PM - 7:00
PM
8/14/2014
4:00 PM - 7:00 PM /
4:00 PM - 7:00
PM
8/22/2014
2:00 PM - 6:00
PM
8/27/2014
5:00 PM - 6:00
PM
8/28/2014
4:00 PM - 7:00 PM / 2:00 PM -
4:00 PM
3:00 PM - 7:00 PM /
3:00 PM - 7:00
PM
2:00 PM - 6:00
PM
5:00 PM - 6:00
PM
4:00 PM - 7:00
PM
9/2/2014
2:00 PM - 6:00
PM
9/8/2014
12:00 PM -
8:00 PM
2:00 PM - 6:00
PM
2:00 PM - 6:00
PM
9/10/2014
4:00 PM - 7:00 PM /
4:00 PM - 7:00
PM
12:00 PM -
8:00 PM

Ex Post Load Impact Estimates
26
Date AMP AP-I BIP CBP-DO CBP-DA DBP CPP SDP-C SDP-R SPD
9/11/2014 3:00 PM - 7:00
PM
2:00 PM - 7:00 PM /
3:00 PM - 7:00
PM
2:00 PM - 6:00
PM
5:00 PM - 8:00
PM
4:00 PM - 8:00
PM
2:00 PM - 6:00
PM
9/12/2014
12:00 PM -
6:00 PM / 1:00 PM -
5:00 PM
5:00 PM - 7:00
PM
4:00 PM - 8:00
PM
9/15/2014
3:00 PM - 7:00 PM /
3:00 PM - 7:00
PM
3:00 PM - 7:00 PM /
3:00 PM - 7:00
PM
12:00 PM -
8:00 PM
2:00 PM - 6:00
PM
4:00 PM - 4:45
PM
3:00 PM - 4:45
PM
2:00 PM - 6:00
PM
9/16/2014 2:00 PM - 7:00
PM
2:00 PM - 7:00 PM /
3:00 PM - 7:00
PM
3:00 PM - 7:00 PM /
3:00 PM - 7:00
PM
2:00 PM - 6:00
PM
4:00 PM - 6:00
PM
3:00 PM - 6:00
PM
9/17/2014
3:00 PM - 6:00 PM /
3:00 PM - 6:00
PM
12:00 PM -
8:00 PM
2:00 PM - 6:00
PM
9/22/2014
2:00 PM - 6:00
PM

Ex Post Load Impact Estimates
27
Date AMP AP-I BIP CBP-DO CBP-DA DBP CPP SDP-C SDP-R SPD
9/23/2014
2:00 PM - 6:00
PM
7:00 PM - 8:00
PM
9/24/2014
7:00 PM - 8:00
PM
5:00 PM - 8:00
PM
9/25/2014
3:00 PM - 6:00
PM
10/2/2014
12:00 PM -
8:00 PM
10/3/2014
5:00 PM - 7:00 PM /
5:00 PM - 7:00
PM
2:00 PM - 6:00
PM
10/6/2014
3:00 PM - 7:00 PM /
2:00 PM - 7:00
PM
4:00 PM - 7:00 PM /
4:00 PM - 7:00
PM
12:00 PM -
8:00 PM
5:00 PM - 8:00
PM
10/7/2014
3:00 PM - 7:00 PM /
2:00 PM - 7:00
PM
10/13/2014
5:00 PM - 7:00 PM /

Ex Post Load Impact Estimates
28
Date AMP AP-I BIP CBP-DO CBP-DA DBP CPP SDP-C SDP-R SPD
5:00 PM - 7:00
PM
10/27/2014
6:00 PM - 7:00
PM
10/29/2014
6:00 PM - 7:00
PM
11/4/2014
6:00 PM - 7:00
PM
11/5/2014
5:00 PM - 8:00 PM /
5:00 PM - 8:00
PM
5:00 PM - 7:00
PM
11/6/2014
5:00 PM - 7:00
PM
4:00 PM - 7:00 PM /
4:00 PM - 7:00
PM
5:00 PM - 6:00
PM
11/7/2014
5:00 PM - 7:00 PM /
5:00 PM - 7:00
PM
11/10/2014
5:00 PM - 7:00 PM /

Ex Post Load Impact Estimates
29
Date AMP AP-I BIP CBP-DO CBP-DA DBP CPP SDP-C SDP-R SPD
5:00 PM - 7:00
PM
11/13/2014
5:00 PM - 7:00 PM /
5:00 PM - 7:00
PM
11/20/2014
5:00 PM - 6:00
PM
12/2/2014
5:00 PM - 6:00
PM
12/3/2014
5:00 PM - 6:00
PM
12/5/2014
5:00 PM - 6:00
PM
12/8/2014
5:00 PM - 6:00
PM
12/29/2014
5:00 PM - 6:00
PM

30
Interpreting the average event impact across events can be difficult because multiple factors
can vary across event days, including temperature, the normal pattern of energy use,
enrollment, the number of customers called, dispatch strategy, and number of event hours. For
programs such as large customer DBP and CPP with stable participation, fixed event windows,
less weather sensitive customers and universal dispatch for all events, the average event
impacts can provide meaningful and insightful data about program performance. However, for
resources that do not have those characteristics, the average event impacts provide limited
insight and can be misleading. In short, ex post load impacts may not reflect the full option
value of a DR resource and should be interpreted with caution. In the case of CBP and AMP,
not only was a subset of customers called for each event, but the customers called for each
event were not necessarily representative of the overall program.
Table 4-2 summarizes the average event impacts across all events for each of SCE's programs
that had an event in 2014. A total row at the bottom is not provided because these are different
types of programs that were dispatched at different times in 2014, as shown in Table 4-1.
Table 4-2: 2014 Ex Post Load Impacts for the Average Event by Event-based Program
Program Reference
Load (kW)
Load with DR
(kW)
Load Impact
per Customer
(kW)
% Load Impact
Aggregate Impact (MW)
Accounts Called
Number of
Events
AP-I 28.6 7.2 21.4 75% 24 1,120 1
BIP 15-minute 2,206.4 242.4 1,964.0 89.0% 138 70 1
BIP 30-minute 1,092.0 207.7 884.3 81.0% 486 550 1
SDP-C 35.6 31.4 4.2 11.7% 50 11,975 11
SDP-R 2.5 1.7 0.7 29.6% 230 314,939 14
CPP-Large 222.6 211.5 11.1 5.0% 30 2,670 12
DBP 862.2 749.1 113.1 13.1% 107 944 7
CBP-DA 430.5 389.0 41.5 10.0% 10 231 14
CBP-DO 221.4 178.8 42.6 19.0% 53 1,236 14
AMP 331.0 232.8 98.2 30% 90.3 920 12
SPD without Tech. 1.8 1.7 0.1 4.4% 28 362,938 8
SPD with Tech. 2.3 1.6 0.6 26.9% 2 2,650 8

Ex Ante Load Impacts
31
5 Ex Ante Load Impacts
The portfolio ex ante load impact estimates summarize the load reduction that can be expected
from all of SCE’s DR programs if they are called simultaneously. They are based on a common
event window and the weather conditions underlying 1-in-2 and 1-in-10 monthly system peak
days. The weather conditions further vary according to whether or not the program is assumed
to be called on a SCE monthly system peak day or a CAISO monthly system peak day. The ex
ante estimates provide a projection of the resources available under conditions that are linked to
the need for investment in additional capacity. The load impact estimates for each program
align with the peak period used for resource adequacy planning, 1 to 6 PM in April through
October and 4 to 9 PM in November through March.
Portfolio-adjusted load reductions reflect the assignment of load impacts from dually enrolled
accounts to a single program in order to avoid double counting impacts. Dual participation is
allowed for many of SCE’s DR programs. The largest overlaps in the nonresidential programs
(which can exceed 30% or even 40% of program enrollment) occur among DBP participants
who dually-enroll in either BIP or AMP in addition to AMP customers who dually-enroll in CBP.
There is also significant amount of dual-enrollment between the residential programs, SPD and
SDP-R; more than 20% of SPD participants dually enroll in SDP-R. The load impacts of
customers enrolled in both an emergency program and a price-responsive program are
attributed to the emergency response program for portfolio-adjusted reporting.5
The remainder of this section summarizes the ex ante load impact estimates for SCE's portfolio
of DR programs. The discussion focuses on high level portfolio aggregate impacts by forecast
year, month, and program type and assume SCE-specific monthly peaking conditions. The
remainder of the portfolio-adjusted and program-specific estimates that are required to be
included in this executive summary by the Protocols can be found in Appendices C through J.
Appendices C through F present ex ante load impacts assuming SCE-specific peaking
conditions while Appendices G through J present ex ante load impacts assuming CAISO
peaking conditions.
5.1 Projected Change in Portfolio Load Impacts from 2015–2025
Figure 5-1 presents the portfolio-adjusted aggregate load impact estimates for the August
system peak day under 1-in-2 and 1-in-10 SCE-specific system conditions by forecast year.
The estimated aggregate load reduction is highest in 2015 and declines every year through the
end of the forecast horizon in 2025. Under 1-in-2 system conditions, SCE's DR portfolio is
projected to fall 8%, from 1,279 MW in 2015 to 1,179 MW in 2025. Under 1-in-10 system
conditions, SCE's DR portfolio is expected to deliver 1,339 MW for the 1-in-10 August system
peak day in 2015, declining 9% to 1,224 MW by 2025. The downward trend in DR load impacts
is predominantly due to a projected decrease in load impacts from the SDP program, which
accounts for 100 MW of reduced capability over the 11-year forecast horizon. As noted in
Section 2, August SDP enrollment is projected to fall by 27% or 80,000 participants by 2025.
SPD is projected to grow by 24 MW through 2025, but this growth is more than offset by
5 Note that for the purpose of estimating aggregate load impacts that apply to the cap on emergency DR programs, the
allocation rule is reversed in that the load impacts for dually enrolled customers are attributed to the price responsive
program.

Ex Ante Load Impacts
32
declining load impacts from BIP during this period, which are projected to fall from 661 MW in
2015 to 610 MW in 2025 due to lower enrollment.
Figure 5-1: Portfolio Aggregate Ex Ante Load Impact Estimates (MW) for the August System Peak Day by 1-in-2 and 1-in-10 SCE-specific System Conditions and Year
5.2 2015 Portfolio Aggregate Load Impacts by Month
Figure 5-2 shows how the 2015 portfolio load impacts vary by month under 1-in-2 and 1-in-10
SCE-specific system conditions. In 2015, SCE's DR portfolio is projected to be capable of
delivering up to 1,339 MW of load reduction during the August monthly system peak day under
1-in-10 system conditions. The July and September load impacts under 1-in-10 system
conditions are similar but slightly lower, 1,272 MW and 1,289 MW, respectively. The portfolio
load impacts during non-summer months are substantially lower due to the fact that SDP-C and
1,050
1,100
1,150
1,200
1,250
1,300
1,350
1,400
2015 2016 2017 2018 2019 2020 2021 2022 2023 2024 2025
Agg
rega
te L
oad
Imp
act
(MW
)
Forecast Year
1-in-2 System Conditions 1-in-10 System Conditions

Ex Ante Load Impacts
33
SDP-R only provide load impacts during the summer months when cooling loads are available
for curtailment.
Figure 5-2: 2015 Portfolio Aggregate Ex Ante Load Impact Estimates (MW) by 1-in-2 and 1-in-10 SCE-specific System Conditions and Monthly System Peak Day
5.3 Portfolio Load Impacts by Program Type
SCE has moved in recent years towards a more balanced DR portfolio by program type with
fewer emergency response resources. Figure 5-3 shows the distribution of portfolio aggregate
load impacts by program type in 2015. Load impacts from emergency response programs are
forecast to comprise 56% of SCE's DR portfolio during this period. Most of the remaining load
impacts are forecast to come from aggregator-managed programs (12%) and price-responsive
programs (29%). Figure 5-4 shows the distribution of portfolio aggregate load impacts by
program type for the year 2025. A greater percentage of load impacts are projected to come
from SmartConnect-enabled and emergency programs by 2025, with fewer share of load
impacts expected to be delivered by aggregator-managed and price-responsive programs.
0
200
400
600
800
1,000
1,200
1,400
Jan. Feb. Mar. Apr. May Jun. Jul. Aug. Sept. Oct. Nov. Dec.
Agg
rega
te L
oad
Imp
act
(MW
)
Forecast Year
1-in-2 System Conditions 1-in-10 System Conditions

Ex Ante Load Impacts
34
Figure 5-3: Distribution of Portfolio Aggregate Load Impacts by Program Type 2015 August System Peak Day under 1-in-2 SCE-specific System Conditions
Figure 5-4: Distribution of Portfolio Aggregate Load Impacts by Program Type 2025 August System Peak Day under 1-in-2 SCE-specific System Conditions
Emergency56%Price-responsive
29%
Demand Response
Aggregator-managed
12%
SmartConnect®-enabled
1%
Non-event Based2%
Forecast Year 20151,279 MW
Emergency57%Price-responsive
25%
Demand Response
Aggregator-managed
13%
SmartConnect®-enabled
3%
Non-event Based2%
Forecast Year 20251,179 MW

Ex Ante Load Impacts
35
5.4 Portfolio Load Impacts by Program
Table 5-1 summarizes the portfolio load impacts by program by month for 2015 through 2025
under 1-in-2 system peak conditions. As indicated in the above discussion of Figure 5-1, load
impacts from SCE’s DR portfolio is projected to fall by 8% from 2015 to 2025. The primary driver
of this decrease in portfolio load impacts over time are projected reductions in the number of
customers enrolled in SDP-C and SDP-R.
Tables 5-2 and 5-3 show the monthly variation in portfolio aggregate load impacts in 2015 for
1-in-2 and 1-in-10 SCE-specific system peaking conditions. Similar tables are presented in
Appendices C through F for each forecast year from 2015 through 2025, for 1-in-2 and 1-in-10
SCE-specific system conditions and for both portfolio-adjusted and program-specific
assumptions. Appendices G through J present the same tables but under 1-in-2 and 1-in-10
CAISO peaking conditions.

Ex Ante Load Impacts
36
Table 5-1: Portfolio Aggregate Load Impact Estimates (MW) for the August System Peak Day Under 1-in-2 SCE-specific System Conditions by Program and Forecast Year
Program Type Program Forecast Year
2015 2016 2017 2018 2019 2020 2021 2022 2023 2024 2025
Emergency
BIP-15 148 143 141 137 137 137 137 137 137 137 137
BIP-30 513 500 487 474 474 474 474 474 474 474 474
AP-I 60 63 66 66 66 66 66 66 66 66 66
SUB-TOTAL 721 707 693 676 676 676 676 676 676 676 676
Price-responsive
SDP-C 64 61 58 55 52 50 48 46 44 43 41
SDP-R 295 283 273 264 255 247 240 234 228 223 218
CPP-Large 12 12 12 13 13 14 14 14 15 15 16
CPP-Medium 0 0 13 5 5 6 6 6 6 6 7
CPP-Small 0 0 8 3 3 3 3 3 4 4 4
DBP 5 4 4 4 4 4 4 4 4 4 4
SUB-TOTAL 375 360 368 343 333 324 315 308 301 295 289
Demand Response Aggregator-
managed
CBP-DA 5 5 5 5 5 5 5 5 5 5 5
CBP-DO 49 49 49 49 49 49 49 49 49 49 49
AMP 93 93 93 93 93 93 93 93 93 93 93
SUB-TOTAL 147 147 147 147 147 147 147 147 147 147 147
SmartConnect®-enabled
SPD with Tech. 1 2 4 6 9 12 16 20 24 27 30
SPD without Tech. 14 13 13 12 12 11 11 11 10 10 10
SUB-TOTAL 16 15 16 18 21 24 27 31 35 37 40
Non-event Based
RTP -1 -1 -1 -1 -1 -1 -1 -1 -1 -1 -1
SMB Non-res. TOU 21 21 21 21 21 21 21 21 21 21 21
PLS 0 0* 5 8 8 8 8 8 7 7 7
SUB-TOTAL 20 20 25 28 28 28 28 28 27 27 27
PORTFOLIO TOTAL 1,279 1,250 1,249 1,212 1,204 1,198 1,193 1,189 1,186 1,182 1,179
*Load impacts are redacted to protect confidential customer information

Ex Ante Load Impacts
37
Table 5-2: 2015 Portfolio Aggregate Ex Ante Load Impact Estimates for SCE-specific 1-in-2 System Conditions
Program Type Program Monthly System Peak
Jan. Feb. Mar. Apr. May Jun. Jul. Aug. Sep. Oct. Nov. Dec.
Emergency
BIP-15 136 125 144 148 139 141 145 148 147 138 138 131
BIP-30 498 479 513 499 512 511 512 513 506 470 467 447
AP-I 33 30 40 56 60 65 64 60 50 48 32 26
SUB-TOTAL 667 634 698 703 711 717 721 721 702 657 637 605
Price-responsive
SDP-C 0 0 0 28 30 35 50 64 59 48 5 0
SDP-R 0 0 0 124 160 186 250 295 273 209 17 0
CPP-Large 8 8 8 9 14 14 13 12 13 12 9 8
CPP-Medium 0 0 0 0 0 0 0 0 0 0 0 0
CPP-Small 0 0 0 0 0 0 0 0 0 0 0 0
DBP 3 3 3 2 5 5 5 5 5 5 3 2
SUB-TOTAL 11 11 12 162 209 239 317 375 350 274 34 10
Demand Response
Aggregator-managed
CBP-DA 3 3 3 2 5 5 6 5 5 5 3 2
CBP-DO 21 23 24 10 45 47 49 49 47 42 26 21
AMP 35 37 38 21 86 88 95 93 89 86 42 32
SUB-TOTAL 59 63 65 32 136 140 149 147 141 133 71 56
SmartConnect®-enabled
SPD with Tech. 0 0 0 1 1 1 1 1 2 2 1 0
SPD without Tech. 5 5 7 14 14 14 14 14 14 14 7 5
SUB-TOTAL 5 5 8 14 15 15 15 16 16 15 8 5
Non-event Based
RTP 0 0 0 0 0 2 2 -1 2 0 0 0
SMB Non-res. TOU 14 15 14 19 20 21 22 21 22 20 17 14
PLS 0 0 0 0 0 0 0 0 0 0 0 0
SUB-TOTAL 14 14 14 19 20 23 24 20 24 20 16 14
PORTFOLIO TOTAL 756 728 797 930 1,091 1,134 1,227 1,279 1,232 1,099 767 689

Ex Ante Load Impacts
38
Table 5-3: 2015 Portfolio Aggregate Ex Ante Load Impact Estimates for SCE-specific 1-in-10 System Conditions
Program Type Program Monthly System Peak
Jan. Feb. Mar. Apr. May Jun. Jul. Aug. Sep. Oct. Nov. Dec.
Emergency
BIP-15 137 127 148 155 138 140 145 147 147 138 140 131
BIP-30 532 495 509 507 508 509 511 513 505 470 475 452
AP-I 33 30 43 59 62 65 62 60 51 51 35 26
SUB-TOTAL 702 652 700 720 709 714 719 720 702 658 649 610
Price-responsive
SDP-C 0 0 5 59 58 57 59 74 71 59 22 0
SDP-R 0 0 10 232 267 275 294 344 315 273 76 0
CPP-Large 8 8 9 8 12 13 11 11 11 12 8 8
CPP-Medium 0 0 0 0 0 0 0 0 0 0 0 0
CPP-Small 0 0 0 0 0 0 0 0 0 0 0 0
DBP 3 3 4 1 5 5 5 5 5 5 3 2
SUB-TOTAL 11 11 26 300 342 349 368 434 402 349 109 10
Demand Response
Aggregator-managed
CBP-DA 3 3 3 2 5 5 6 6 5 5 3 2
CBP-DO 21 23 26 11 47 48 50 50 47 43 28 21
AMP 34 37 41 21 89 90 95 94 90 87 43 32
SUB-TOTAL 58 62 70 33 140 143 151 149 143 135 74 56
SmartConnect®-enabled
SPD with Tech. 0 0 0 1 1 1 1 1 2 2 1 0
SPD without Tech. 5 5 7 14 14 14 14 14 14 14 7 5
SUB-TOTAL 5 5 8 15 15 15 16 16 16 15 8 5
Non-event Based
RTP 0 0 0 -2 0 2 -3 -1 6 -2 -2 0
SMB Non-res. TOU 14 15 17 19 21 21 21 22 20 21 22 15
PLS 0 0 0 0 0 0 0 0 0 0 0 0
SUB-TOTAL 14 15 17 17 21 22 19 21 25 19 20 14
PORTFOLIO TOTAL 790 745 821 1,086 1,227 1,245 1,272 1,339 1,289 1,176 860 695

Recommendations
39
6 Recommendations
The 2014 DR program evaluations contain recommendations for each program. The
recommendations provide steps to improve the measurement and evaluation of DR resources
and to improve program performance. This section summarizes the recommendations for each
program.
6.1 Emergency Programs
Overall, emergency programs are characterized by infrequent use, but substantial load
reductions are linked to both automated control technology and contractual agreements with
substantial penalties for non-performance. Their importance and infrequent dispatch make it
critical to understand the electricity use patterns of participants, call test events, and measure
the extent to which communications work well. The following summarizes the recommendations
for the emergency programs:
Market dual enrollment in other programs to BIP customers. Dually enrolled BIP
customers perform well when called for other programs and can provide substantial load
impacts on short notice.
Improve the AP-I switch success rate through the following steps:
1. Run tests or actual events during the summer, when pumps are on. Ideally, the test
event would occur during peak hours and last long enough to determine whether
pumps that were operating immediately before the event ramped down when the
event signal was sent to the switches. Calling events facilitates the ability to identify
pumps that are not providing load reduction and improve the switch success rates to
meet SCE’s goal of improving AP-I switch success rates from 88% to 93% by August
2017.
2. Analyze the 15-minute interval data to identify units that were on immediately prior to the event but were not activated. The criteria for determining activation must factor in that some pumps ramp down over five minutes and that additional loads not controlled by switches are measured by the same meter for a small fraction of participants.
3. Target the identified accounts for a switch activation inspection and repair, as appropriate.
6.2 Price-responsive Programs
Price responsive programs are dispatched more frequently based on economic criteria rather
than solely for emergency conditions. The following recommendations were made for price
response programs:
Improve accuracy in ex ante estimation for SDP by calling curtailment events that cover all hours of the ex ante estimation period (1 to 6 PM) and a greater diversity of months of the year.

Recommendations
40
Conduct an early test of default CPP for medium customers. Experimentation and test-and-learn strategies are at the very core of successful innovation. It is a way to learn what works and, more importantly, learn what doesn’t work. The basic idea is to conduct small scale tests as early as possible to avoid making more costly mistakes later in the process. Utilities should test default CPP with a smaller, random subset of SMB customers prior to full implementation. This would give utilities an opportunity to test and evaluate the effectiveness of the default process, reduce uncertainty about enrollment and demand reductions and make appropriate adjustments prior to full implementation. Currently, there is very little precedent for a shift to default dynamic rates among these types of customers. Most assumptions about how SMB customers will engage and respond are uncertain because they are mostly based on the implementation of default CPP for large customers.
Estimate the effect of CPP program changes through research design rather than after-the-fact analysis. The scheduled program changes at PG&E and SCE provide a unique opportunity to assess the effect, if any, of program changes on load impacts. Specifically, this can help answer two key research questions: Does providing customers with the ability to partially or fully insure their load against high CPP prices dampen participant demand reductions? Does changing the event window lead to lower demand reductions? The ideal approach to answering these questions is a phased rollout of program changes in combination with random assignment. Under this scenario, customers are randomly assigned to one of two groups. In the first year, the program change is implemented for one group, allowing a side-by-side comparison of impacts with and without the program change. By the second year, the program change is implemented across the full population.
The utilities should continue to encourage DBP dual-enrollment with customers in BIP
and the aggregator programs (AMP and CBP). They tend to be the most responsive
customers in DBP and provide a means for the utilities to increase the amount of
demand response that can be obtained on DBP-only event days.
6.3 Aggregator-managed Programs
The DRMEC should consider reporting CBP and AMP load impacts by sub-LAP (or other relevant location identifiers) in addition to local capacity areas (LCAs), given the move towards locational dispatch of aggregator events.
6.4 SmartConnect®-enabled Programs
Consider redesigning program hours for the SPD PCT program. The PCT program is
dispatched from 2 to 6 PM, whereas the resource adequacy peak hours are from 1 to 6
PM. The PCTs precool during the hour before the program event, the first hour of the RA
window, resulting in a significant negative load impact during the first hour of the RA
window calculation. The difference in the average hourly load impact between the
program event window and the RA window is 0.25 kW. This difference results in a 37%
lower average hourly impact for the RA window directly attributable to the timing of the
program event hours relative to the RA hours.

Recommendations
41
6.5 Non-event Based Programs
SCE should recruit more large customers to participate in RTP. Future aggregate load
impacts are closely tied to the size and price responsiveness of specific RTP
participants. If any of the large, price-responsive customers leave the program, the
resulting aggregate load reduction will be relatively lower. On the other hand, if SCE is
able to successfully market RTP and recruit more large customers, the resulting
aggregate load reduction will be relatively higher.
RTP would likely benefit from an analysis of how to further optimize price schedule
selection. The schedules are currently selected based on downtown LA daily maximum
temperatures on the previous day. The current rule is transparent and easy for
participants to understand and track, but may not always target load impacts to time
periods when they are most needed. Based on extensive analysis of system and
individual customer loads, the main difference between high and extreme system loads
is not daily maximum temperature, but rather overnight heat build-up. SCE should
consider assessing the incremental improvement of different pricing schedule selection
rules and the associated tradeoffs, including the effect on transparency and clarity.
SMB Non-residential TOU pricing load impact analyses would be improved if SCE could withhold a set of customers from the transition process that could serve as a control group. This may be impractical for a number of reasons (e.g., ensuring that control-group customers do not receive TOU messaging; or the potential for confusion and complaints that may arise when some customers are transitioned while other similarly situated customers are not). In the absence of a viable control group, the alternative methods for estimating TOU load impacts for newly transitioned customers include within-treatment comparisons of loads before and after TOU migration; or estimating how customers change their usage profile following the changes in TOU pricing seasons (e.g., by comparing April and May load profiles, which are exposed to different TOU prices). While we do not expect these methods to be as effective as a control-group-based methodology, they provide some means of estimating TOU load impacts.
A clear and detailed set of EM&V rules should be implemented for PLS to ensure that
the utilities know how much load drop they have received and can expect to receive in
the future.

Ex Ante Weather Proxy Days
42
Appendix A Ex Ante Weather Proxy Days
Table A-1 shows the proxy days selected for SCE-peaking conditions for monthly system peak days coincident with SCE’s monthly
system peaking conditions. Table A-2 presents the proxy days selected for CAISO-peaking conditions for monthly system peak days
coincident with CAISO’s monthly system peaking conditions.
Table A-1: SCE Proxy Days in Monthly System Peak Day Selection
Weather Year
Month
Jan. Feb. Mar. Apr. May Jun. Jul. Aug. Sep. Oct. Nov. Dec.
1-in-10
1/29/2002 2/8/2006 3/20/2006 4/30/1996 5/28/1997 6/5/2002 7/28/1995 8/5/1997 9/1/1998 10/7/1996 11/3/1997 12/18/2006
1/4/2005 2/27/2007 3/12/2007 4/26/2004 5/3/2004 6/28/2006 7/16/1998 8/29/1998 9/4/2007 10/1/2008 11/7/2006 12/18/2007
1/16/2007 2/4/2008 3/24/2008 4/28/2008 5/19/2008 6/20/2008 7/25/2006 8/31/2007 9/27/2010 10/13/2011 11/14/2007 12/17/2008
1/23/2008 2/9/2009 3/31/2011 4/21/2009 5/13/2013 6/28/2013 7/16/2010 8/10/2012 9/5/2013 10/1/2012 11/4/2010 12/9/2013
1-in-2
1/4/1995 2/19/1997 3/15/1999 4/21/1997 5/29/2002 6/23/1995 7/12/1999 8/11/2000 9/5/1995 10/8/1999 11/12/1996 12/21/1998
1/22/1996 2/23/2000 3/6/2000 4/27/2007 5/20/2005 6/26/2000 7/8/2002 8/10/2004 9/28/1999 10/1/2001 11/1/1999 12/10/2001
1/26/1999 2/21/2002 3/19/2001 4/1/2011 5/7/2009 6/21/2005 7/13/2005 8/27/2009 9/12/2000 10/7/2002 11/8/2001 12/29/2004
1/12/2009 2/15/2012 3/10/2005 4/20/2012 5/31/2012 6/29/2007 7/26/2007 8/30/2013 9/14/2012 10/24/2007 11/3/2009 12/19/2012
Table A-2: CAISO Proxy Days in Monthly System Peak Day Selection
Weather Year
Month
Jan. Feb. Mar. Apr. May Jun. Jul. Aug. Sep. Oct. Nov. Dec.
1-in-10
1/29/2002 2/26/1996 3/19/1997 4/30/1996 5/28/2003 6/22/2001 7/27/1995 8/5/1997 9/3/2007 10/1/2001 11/3/1997 12/18/2006
1/15/2007 2/21/2002 3/29/2004 4/26/2004 5/3/2004 6/29/2006 7/29/1996 8/31/2007 9/3/2009 10/1/2008 11/29/2006 12/17/2007
1/24/2008 2/27/2007 3/20/2006 4/28/2008 5/16/2008 6/20/2008 7/3/2001 8/25/2010 9/27/2010 10/1/2010 11/14/2007 12/17/2008
1/14/2013 2/4/2008 3/12/2007 4/21/2009 5/13/2013 6/28/2013 7/24/2006 8/13/2012 9/7/2011 10/1/2012 11/4/2010 12/8/2009
1-in-2
1/11/2001 2/9/1999 3/16/1999 4/24/1995 5/30/1995 6/30/1996 7/17/1998 8/25/1999 9/4/2003 10/7/1996 11/1/1999 12/12/2000
1/5/2004 2/23/2000 3/6/2000 4/21/1997 5/29/2002 6/29/1999 7/12/1999 8/14/2003 9/7/2004 10/16/1997 11/5/2001 12/18/2002
1/5/2009 2/2/2004 3/3/2009 4/21/1998 5/17/2006 6/5/2002 7/16/2003 8/26/2005 9/14/2012 10/7/2004 11/19/2002 12/1/2004
1/10/2011 2/28/2012 3/7/2013 4/29/2013 5/18/2009 6/29/2009 7/21/2005 8/28/2009 9/6/2013 10/13/2005 11/30/2011 12/13/2010

Regression Specifications
43
Appendix B Regression Specifications
B.1 Base Interruptible Program
Ex post:
𝑄𝑡 = 𝑎 + ∑ ∑(𝑏𝑖,𝐸𝑣𝑡𝐵𝐼𝑃 × ℎ𝑖,𝑡 × 𝐵𝐼𝑃𝑡) +
24
𝑖=1
𝐸
𝐸𝑣𝑡=1
∑(𝑏𝑖𝑀𝑜𝑟𝑛𝐿𝑜𝑎𝑑 × ℎ𝑖,𝑡 × 𝑀𝑜𝑟𝑛𝐿𝑜𝑎𝑑𝑖,𝑡)
24
𝑖=1
+ ∑ ∑(𝑏𝑖𝐷𝑅 × ℎ𝑖,𝑡 × 𝑂𝑡ℎ𝑒𝑟𝐸𝑣𝑡𝑖,𝑡
𝐷𝑅) + ∑(
24
𝑖=1
24
𝑖=1𝐷𝑅
𝑏𝑖𝑊𝑒𝑎𝑡ℎ𝑒𝑟 × ℎ𝑖,𝑡 × 𝑊𝑒𝑎𝑡ℎ𝑒𝑟𝑡)
+ ∑(𝑏𝑖𝑀𝑂𝑁 × ℎ𝑖,𝑡 × 𝑀𝑂𝑁𝑡)
24
𝑖=2
+ ∑(𝑏𝑖𝐹𝑅𝐼 × ℎ𝑖,𝑡 × 𝐹𝑅𝐼𝑡) + ∑(𝑏𝑖
𝑆𝑈𝑀𝑀𝐸𝑅 × ℎ𝑖,𝑡 × 𝑆𝑈𝑀𝑀𝐸𝑅𝑡) + ∑(𝑏𝑖ℎ ×
24
𝑖=2
ℎ𝑖,𝑡)
24
𝑖=2
24
𝑖=2
+ ∑(𝑏𝑖𝐷𝑇𝑌𝑃𝐸 ×
5
𝑖=2
𝐷𝑇𝑌𝑃𝐸𝑖,𝑡) + ∑(𝑏𝑖𝑀𝑂𝑁𝑇𝐻 ×
10
𝑖=5
𝑀𝑂𝑁𝑇𝐻𝑖,𝑡) + 𝑒𝑡

Regression Specifications
44
Variable Description
𝑄𝑡 demand in hour 𝑡 for a customer enrolled in BIP prior to the last event date
𝑎 estimated constant term
Various 𝑏 estimated parameters
ℎ𝑖,𝑡 dummy variable for hour 𝑖
𝐵𝐼𝑃𝑡 dummy variable for BIP event days
𝑊𝑒𝑎𝑡ℎ𝑒𝑟𝑡 weather variables selected using model screening process
𝐸 number of BIP event days that occurred during the program year
𝑀𝑜𝑟𝑛𝐿𝑜𝑎𝑑𝑖,𝑡 average of the day’s load during hours 1 through 10
𝑂𝑡ℎ𝑒𝑟𝐸𝑣𝑡𝑖,𝑡𝐷𝑅 dummy variable that equals one on the event days of other demand
response programs in which the customer is enrolled
𝑀𝑂𝑁𝑡 dummy variable that equals one on Mondays
𝐹𝑅𝐼𝑡 dummy variable that equals one on Fridays
𝑆𝑈𝑀𝑀𝐸𝑅𝑡 dummy variable that equals one during the summer pricing season – June through September
𝐷𝑇𝑌𝑃𝐸𝑖,𝑡 dummy variables for each day of the week
𝑀𝑂𝑁𝑇𝐻𝑖,𝑡 dummy variables for each month
𝑒𝑡 error term
The ex ante model specifications used for estimating summer loads are the same as the ex post
specifications, with the following exceptions:
The tiMornLoad ,term is not included in the ex ante model specification; and
A cooling degree hour (base 60 °F) variable is used in the ex ante model specification rather
than the tWeather term.
The ex ante model specification used for estimating non-summer loads follows, which uses the
same variable naming convention as in the ex post regression model specification:

Regression Specifications
45
t
i
ti
MONTH
i
i
ti
DTYPE
i
i
ti
h
i
i
tti
FRI
i
i
tti
MON
i
i
tti
CDH
i
i
tiDR
ti
DR
i
DRi
tti
BIP
Evti
E
Evt
t
eMONTHb
DTYPEbhbFRIhb
MONhbWeatherhb
OtherEvthbBIPhbaQ
)(
)()()(
)()(
)()(
1210,52
,
5
2
,
24
2
,
24
2
,
24
2
,
24
1
,
24
1
,,
24
1
,,
1

Regression Specifications
46
B.2 Agricultural and Pumping Interruptible Program
𝑘𝑊𝑡 = 𝐴 + ∑ ∑ 𝐵𝑖𝑗 × 𝐻𝑜𝑢𝑟𝑖 × 𝑀𝑜𝑛𝑡ℎ𝑗
12
𝑗=1
24
𝑖=1
+ ∑ ∑ 𝐶𝑖𝑗 × 𝐻𝑜𝑢𝑟𝑖 × 𝐷𝑎𝑦𝑇𝑦𝑝𝑒𝑗
3
𝑗=1
24
𝑖=1
+ ∑ 𝐷𝑖 × 𝐻𝑜𝑢𝑟𝑖 × 𝑇𝑜𝑡𝑎𝑙𝐶𝐷𝐻𝑡
24
𝑖=1
+ ∑ 𝐸𝑖 × 𝐻𝑜𝑢𝑟𝑖 × 𝑇𝑜𝑡𝑎𝑙𝐶𝐷𝐻𝑠𝑞𝑟𝑡
24
𝑖=1
+ ∑ 𝐹𝑖 × 𝐻𝑜𝑢𝑟𝑖 × 𝑇𝑜𝑡𝑎𝑙𝐻𝐷𝐻𝑡
24
𝑖=1
+ ∑ 𝐺𝑖 × 𝐻𝑜𝑢𝑟𝑖 × 𝑇𝑜𝑡𝑎𝑙𝐻𝐷𝐻𝑠𝑞𝑟𝑡
24
𝑖=1
+ ∑ 𝐻𝑖 × 𝐻𝑜𝑢𝑟𝑖 × 𝑂𝑡ℎ𝑒𝑟𝐷𝑅𝑡
24
𝑖=1
+ ∑ 𝐼𝑖 × 𝐻𝑜𝑢𝑟𝑖 × 𝐸𝑣𝑒𝑛𝑡𝐷𝑎𝑦
24
𝑖=1
+ 𝑒𝑡
Variable Definition
𝑘𝑊𝑡 average hourly demand (kW) for each time period
𝐴 estimated constant term
𝐵𝑖𝑗through 𝐼𝑖 regression model parameters
𝐻𝑜𝑢𝑟𝑖 series of binary variables for each hour, which account for the basic hourly load shape of the customer after other factors such as weather and prices are accounted for
𝐷𝑎𝑦𝑇𝑦𝑝𝑒𝑗 series of binary variables representing three different day types (Monday, Tuesday-Thursday, and Friday); weekends are excluded from the model
𝑀𝑜𝑛𝑡ℎ𝑗 series of binary variables for each month designed to reflect seasonality in loads
𝑇𝑜𝑡𝑎𝑙𝐶𝐷𝐻𝑡 sum of cooling degree hours (base 65) for the day
𝑇𝑜𝑡𝑎𝑙𝐶𝐷𝐻𝑠𝑞𝑟𝑡 𝑇𝑜𝑡𝑎𝑙𝐶𝐷𝐻𝑡squared
𝑇𝑜𝑡𝑎𝑙𝐻𝐷𝐻𝑡 sum of heating degree hours (base 65) for the day
𝑇𝑜𝑡𝑎𝑙𝐻𝐷𝐻𝑠𝑞𝑟 𝑇𝑜𝑡𝑎𝑙𝐻𝐷𝐻𝑡 squared
𝑒𝑡 error term

Regression Specifications
47
B.3 Summer Discount Plan – Commercial
Ex post:
𝑦𝑡 = 𝛼0 + ∑(𝛽𝑖ℎ × ℎ𝑖,𝑡)
24
𝑖=1
+ ∑ ∑(𝛽𝑖,𝑠𝑐 × ℎ𝑖,𝑡 × 𝑐𝑠,𝑡)
24
𝑖=1
𝑆=12
𝑠=1
+ ∑ ∑(𝛽𝑠,𝑟𝑆 × 𝑠𝑠,𝑟,𝑡)
𝑅=7
𝑖=1
𝑆=12
𝑠=1
+ ∑ ∑(𝛽𝑑𝐷𝑜𝑊 × ℎ𝑖,𝑡 × 𝐷𝑜𝑊𝑑,𝑡)
𝐷=5
𝑑=1
24
𝑖=1
+ ∑ ∑ (𝛽𝑚𝑀𝑜𝑛𝑡ℎ × ℎ𝑖,𝑡 × 𝑀𝑜𝑛𝑡ℎ𝑚,𝑡)
𝑀=10
𝑚=5
24
𝑖=1
+ ∑ ∑ (𝛽𝑚𝑀𝑜𝑛𝑡ℎ × ℎ𝑖,𝑡 × 𝑀𝑜𝑛𝑡ℎ𝑚,𝑡 × 𝐶𝐷𝐻65𝑡)
𝑀=10
𝑚=5
24
𝑖=1
+ ∑(𝛽𝑖𝐶𝐷𝐻 × ℎ𝑖,𝑡 × 𝐶𝐷𝐻65𝑡)
24
𝑖=1
+ (𝛽𝑀𝐴𝐶𝐷2 × 𝑀𝐴_𝐶𝐷𝐻65𝑡2) + ∑(𝛽𝑖
𝐻𝐷𝐻
24
𝑖=1
× ℎ𝑖,𝑡
× 𝐻𝐷𝐻65𝑡) + ∑(𝛽𝑖𝑅𝐻 × ℎ𝑖,𝑡 × 𝑅𝐻𝑡) +
24
𝑖=1
∑(𝛽𝑖𝑀𝐴𝐶𝐷 × ℎ𝑖,𝑡 × 𝑀𝐴_𝐶𝐷𝐻65𝑡) +
24
𝑖=1
𝜀𝑡
Variable Description
𝑦𝑡 average demand in hour 𝑡
ℎ𝑖,𝑡 dummy variable equal to one if 𝑖 is equal to the hour defined by 𝑡, zero otherwise
𝑐𝑠,𝑡 dummy variable equal to one if there is a curtailment event taking place in hour 𝑡 on event day 𝑠, zero otherwise
𝑠𝑠,𝑟,𝑡 dummy variable to capture snapback – the 𝑟th dummy is equal to one if hour 𝑡 is the
𝑟th hour following the end of a curtailment event and the event in hour 𝑡 corresponds
to event 𝑠, zero otherwise
𝑀𝑜𝑛𝑡ℎ𝑚,𝑡 dummy variable equal to one if hour 𝑡 falls in month 𝑚, zero otherwise
𝐷𝑜𝑊𝑑,𝑡 dummy variable equal to one if hour 𝑡 falls in the day of week indicated by subscript 𝑑. A value of 𝑑 of one indicates a Monday and a value of 𝑑 of five indicates a Friday; only non-holiday weekdays are included in the estimation sample.
𝐶𝐷𝐻65𝑡 cooling degree hours observed in hour 𝑡, base 65 °F
𝑀𝐴_𝐶𝐷𝐻65𝑡 24-hour moving average of cooling degree hours, base 65 °F, observed in hour 𝑡
𝐻𝐷𝐻65𝑡 heating degree hours observed in hour t, base 65 °F
𝑅𝐻𝑡 relative humidity observed in hour 𝑡
𝜀𝑡 error term

Regression Specifications
48
Ex ante:
𝑦𝑡 = 𝛼0 + ∑(𝛽𝑖ℎ × ℎ𝑖,𝑡)
24
𝑖=1
+ (𝛽𝑐 × 𝑐𝑡 × 𝐶𝐷𝐻65𝑡) + ∑(𝛽𝑟𝑆 × 𝑠𝑟,𝑡 × 𝐸𝑣𝑡𝐶𝐷𝐻𝑡)
𝑅=3
𝑖=1
+ ∑ ∑ (𝛽𝑚𝑀𝑜𝑛𝑡ℎ × 𝑀𝑜𝑛𝑡ℎ𝑚,𝑡 × ℎ𝑖,𝑡)
𝑀=10
𝑚=5
24
𝑖=1
+ ∑ ∑ (𝛽𝑚𝑀𝑜𝑛𝑡ℎ × 𝑀𝑜𝑛𝑡ℎ𝑚,𝑡 × ℎ𝑖,𝑡 × 𝐶𝐷𝐻65𝑡)
𝑀=10
𝑚=5
24
𝑖=1
+ ∑ ∑(𝛽𝑑𝐷𝑜𝑊 × ℎ𝑖,𝑡 × 𝐷𝑜𝑊𝑑,𝑡)
𝐷=5
𝑑=1
24
𝑖=1
+ ∑(𝛽𝑖𝐶𝐷𝐻 × ℎ𝑖,𝑡 × 𝐶𝐷𝐻65𝑡)
24
𝑖=1
+ ∑(𝛽𝑖𝐻𝐷𝐻 × ℎ𝑖,𝑡 × 𝐻𝐷𝐻65𝑡)
24
𝑖=1
+ ∑(𝛽𝑖𝑅𝐻 × ℎ𝑖,𝑡 × 𝑅𝐻𝑡) +
24
𝑖=1
∑(𝛽𝑖𝑀𝐴𝐶𝐷 × ℎ𝑖,𝑡 × 𝑀𝐴_𝐶𝐷𝐻65𝑡) + (𝛽𝑀𝐴𝐶𝐷2
24
𝑖=1
× 𝑀𝐴_𝐶𝐷𝐻65𝑡2) + 𝜀𝑡
Variable definitions are the same as in ex post with the exception of the following:
Variable Description
𝑐𝑡 dummy variable equal to one if hour 𝑡 is subject to a curtailment event, zero otherwise
𝐸𝑣𝑡𝐶𝐷𝐻𝑡 total cumulative number of cooling degree hours during the event hours of the event day in which hour 𝑡 falls, base 65 °F

Regression Specifications
49
B.4 Summer Discount Plan – Residential
Ex post:
𝑦𝑘,𝑡 = 𝛼𝑘 + ∑(𝛽𝑖ℎ × ℎ𝑖,𝑡)
24
𝑖=1
+ ∑ ∑(𝛽𝑖,𝑠𝑐 × ℎ𝑖,𝑡 × 𝑐𝑠,𝑡)
24
𝑖=1
𝑆=12
𝑠=1
+ ∑ ∑(𝛽𝑠,𝑟𝑆 × 𝑠𝑆,𝑟,𝑡)
𝑅=7
𝑟=1
𝑆=12
𝑠=1
+ ∑ ∑(𝛽𝑖,𝑞𝑝𝑡𝑟 × ℎ𝑖,𝑡 × 𝑝𝑡𝑟𝑘,𝑞,𝑡)
24
𝑖=1
𝑄=8
𝑞=1
+ ∑ ∑(𝛽𝑞,𝑟𝑝𝑡𝑟𝑆𝐵 × 𝑝𝑡𝑟𝑆𝐵𝑞,𝑟,𝑡)
𝑅=7
𝑟=1
𝑄=8
𝑞=1
+ ∑ ∑(𝛽𝑑𝐷𝑜𝑊 × ℎ𝑖,𝑡 × 𝐷𝑜𝑊𝑑,𝑡)
𝐷=5
𝑑=1
24
𝑖=1
+ ∑ ∑ (𝛽𝑚𝑀𝑜𝑛𝑡ℎ × ℎ𝑖,𝑡 × 𝑀𝑜𝑛𝑡ℎ𝑚,𝑡)
𝑀=10
𝑚=5
24
𝑖=1
+ ∑(𝛽𝑖𝐶𝐷𝐻 × ℎ𝑖,𝑡 × 𝐶𝐷𝐻65𝑘,𝑡)
24
𝑖=1
+ ∑(𝛽𝑖𝐻𝐷𝐻 × ℎ𝑖,𝑡 × 𝐻𝐷𝐻65𝑘,𝑡) + ∑(𝛽𝑖
𝑅𝐻 × ℎ𝑖,𝑡 × 𝑅𝐻𝑘,𝑡) +
24
𝑖=1
∑(𝛽𝑖𝑀𝐴𝐶𝐷
24
𝑖=1
× ℎ𝑖,𝑡
24
𝑖=1
× 𝑀𝐴_𝐶𝐷𝐻65𝑘,𝑡) + ∑ ∑ (𝛽𝑚𝑀𝑜𝑛𝑡ℎ × ℎ𝑖,𝑡 × 𝑀𝑜𝑛𝑡ℎ𝑚,𝑡 × 𝐶𝐷𝐻65𝑘,𝑡)
𝑀=10
𝑚=5
24
𝑖=1
+ (𝛽𝑀𝐴𝐶𝐷2 × 𝑀𝐴_𝐶𝐷𝐻65𝑘,𝑡2 ) + 𝜀𝑡

Regression Specifications
50
Variable Description
𝑦𝑘,𝑡 average demand of household 𝑘 in hour 𝑡
ℎ𝑖,𝑡 dummy variable equal to one if 𝑖 is equal to the hour defined by 𝑡, zero otherwise
𝑐𝑠,𝑡 dummy variable equal to one if there is a curtailment event taking place in hour 𝑡 on event day 𝑠, zero otherwise
𝑠𝑆,𝑟,𝑡 dummy variable to capture snapback – the 𝑟th dummy is equal to one if hour 𝑡 is the
𝑟th hour following the end of a curtailment event and the event in hour 𝑡 corresponds
to event 𝑠, zero otherwise
𝑀𝑜𝑛𝑡ℎ𝑚,𝑡 dummy variable equal to one if hour 𝑡 falls in month 𝑚, zero otherwise
𝑝𝑡𝑟𝑘,𝑞,𝑡 dummy variable equal to one if there is a PTR (Save Power Day) event taking place in hour 𝑡 on PTR event day 𝑞for household 𝑘
𝑝𝑡𝑟𝑆𝐵𝑞,𝑟,𝑡 dummy variable to capture PTR snapback – for household 𝑘, the 𝑟th dummy is equal
to one if hour 𝑡 is the 𝑟th hour following the end of a PTR event and the event in hour 𝑡
corresponds to event 𝑠, zero otherwise
𝐷𝑜𝑊𝑑,𝑡 dummy variable equal to one if hour 𝑡 falls in the day of week indicated by subscript 𝑑. A value of 𝑑 of one indicates a Monday and a value of 𝑑 of five indicates a Friday; only non-holiday weekdays are included in the estimation sample
𝐶𝐷𝐻65𝑡 cooling degree hours observed in hour 𝑡, base 65 °F
𝐻𝐷𝐻65𝑡 heating degree hours observed in hour t, base 65 °F
𝑀𝐴_𝐶𝐷𝐻65𝑡 24-hour moving average of cooling degree hours, base 65 °F, observed in hour 𝑡
𝑅𝐻𝑡 relative humidity observed in hour 𝑡
𝜀𝑡 error term

Regression Specifications
51
Ex ante:
𝑦𝑘,𝑡 = 𝛼𝑘 + ∑(𝛽𝑖ℎ × ℎ𝑖,𝑡)
24
𝑖=1
+ (𝛽𝑐 × 𝑐𝑡 × 𝐶𝐷𝐻65𝑘,𝑡) + ∑(𝛽𝑟𝑠 × 𝑠𝑟,𝑡 × 𝐸𝑣𝑡𝐶𝐷𝐻𝑘,𝑡)
𝑅=7
𝑟=1
+ ∑ ∑(𝛽𝑖,𝑞𝑝𝑡𝑟 × ℎ𝑖,𝑡 × 𝑝𝑡𝑟𝑘,𝑞,𝑡)
24
𝑖=1
𝑄=8
𝑞=1
+ ∑ ∑(𝛽𝑞,𝑟𝑝𝑡𝑟𝑆𝐵 × 𝑝𝑡𝑟𝑆𝐵𝑞,𝑟,𝑡)
𝑅=7
𝑟=1
𝑄=8
𝑞=1
+ ∑ ∑ (𝛽𝑚𝑀𝑜𝑛𝑡ℎ × 𝑀𝑜𝑛𝑡ℎ𝑚,𝑡 × ℎ𝑖,𝑡)
𝑀=10
𝑚=5
24
𝑖=1
+ ∑ ∑ (𝛽𝑚𝑀𝑜𝑛𝑡ℎ × ℎ𝑖,𝑡 × 𝑀𝑜𝑛𝑡ℎ𝑚,𝑡 × 𝐶𝐷𝐻65𝑘,𝑡)
𝑀=10
𝑚=5
24
𝑖=1
+ ∑ ∑(𝛽𝑑𝐷𝑜𝑊 × ℎ𝑖,𝑡 × 𝐷𝑜𝑊𝑑,𝑡)
𝐷=5
𝑑=1
24
𝑖=1
+ ∑(𝛽𝑖𝐶𝐷𝐻 × ℎ𝑖,𝑡 × 𝐶𝐷𝐻65𝑘,𝑡)
24
𝑖=1
+ (𝛽𝑀𝐶𝐴𝐷2 × 𝑀𝐴_𝐶𝐷𝐻65𝑘,𝑡2 )
+ ∑(𝛽𝑖𝐻𝐷𝐻 × ℎ𝑖,𝑡 × 𝐻𝐷𝐻65𝑘,𝑡)
24
𝑖=1
+ ∑(𝛽𝑖𝑅𝐻 × ℎ𝑖,𝑡 × 𝑅𝐻𝑘,𝑡) +
24
𝑖=1
∑(𝛽𝑖𝑀𝐴𝐶𝐷 × ℎ𝑖,𝑡 × 𝑀𝐴_𝐶𝐷𝐻65𝑘,𝑡) +
24
𝑖=1
𝜀𝑡
Variable definitions are the same as in ex post with the exception of the following:
Variable Description
𝑐𝑘,𝑡 dummy variable equal to one if household 𝑘 is subject to an event in hour 𝑡, zero otherwise
𝑠𝑟,𝑡 dummy variable to capture snapback – the 𝑟th dummy is equal to one if hour 𝑡 is the
𝑟th hour following the end of a curtailment event, zero otherwise
𝐸𝑣𝑡𝐶𝐷𝐻𝑘,𝑡 cumulative cooling degree hours observed by individual 𝑘 during the event hours of the event day on which hour 𝑡 falls, base 65 °F

Regression Specifications
52
B.5 Critical Peak Pricing
Ex post, average event:
𝑘𝑊𝑖,𝑡 = 𝑎 + 𝑏 ∙ 𝑇𝑟𝑒𝑎𝑡𝑚𝑒𝑛𝑡𝑖 + 𝑐 ∙ 𝐸𝑣𝑒𝑛𝑡𝑡 + 𝑑 ∙ (𝑇𝑟𝑒𝑎𝑡𝑚𝑒𝑛𝑡𝑖 ∙ 𝐸𝑣𝑒𝑛𝑡𝑡) + 𝑢𝑡 + 𝑣𝑖 + 𝜀𝑖,𝑡
Ex post, individual event:
𝑘𝑊𝑖,𝑡 = 𝑎 + 𝑏 ∙ 𝑇𝑟𝑒𝑎𝑡𝑚𝑒𝑛𝑡𝑖 + ∑ 𝑐𝑛 ∙ 𝐸𝑣𝑒𝑛𝑡𝑛
𝑚𝑎𝑥
𝑛=1
+ ∑ 𝑑𝑛 ∙ (𝑇𝑟𝑒𝑎𝑡𝑚𝑒𝑛𝑡𝑖 ∙ 𝐸𝑣𝑒𝑛𝑡𝑛)
𝑚𝑎𝑥
𝑛=1
+ 𝑢𝑡 + 𝑣𝑖 + 𝜀𝑖,𝑡
Variable Description
𝑖, 𝑡, 𝑛 indicates each individual 𝑖, date 𝑡, and event 𝑛, where the number of events is
denoted 𝑚𝑎𝑥
𝑎 model constant
𝑏 pre-existing difference between treatment and control customers
𝑐 difference between event and non-event days common to both CPP participants and control group members6
𝑑 net difference between CPP and control group customers during event days – this parameter represents the difference-in-differences
𝑢 time effects for each date controlling for unobserved factors that are common to all treatment and control customers but unique to time period
𝑣 customer fixed effects controlling for unobserved factors that are time-invariant and unique to each customer; fixed effects do not control for fixed characteristics such as air conditioning that interact with time-varying factors like weather
Treatment binary indicator of whether or not the customers is part of the treatment (CPP) or control group
Event binary indicator of whether an event occurred that day. Impacts are only observed if the customer is on CPP (Treatment = 1) and it was an event day
ε error for each individual 𝑖 and date 𝑡
Ex post, individual regressions:
Ten models were tested for each customer. The analysis dataset is at the individual, hour and
date level, and each individual has a separate model for every hour. Based on a simple cross-
validation, the best model for each customer was chosen and then applied in ex post analysis.
6 In practice, this term is absorbed by the time effects, but it is useful for representing the model logic.

Regression Specifications
53

Regression Specifications
54
Model
# Specification
1
𝑘𝑊𝑖ℎ𝑑 = 𝑎𝑖ℎ + ∑ 𝑏𝑖ℎ𝑗 ∗12𝑗=2 𝑚𝑜𝑛𝑡ℎ𝑖ℎ𝑑𝑗 + ∑ 𝑐𝑖ℎ𝑘 ∗5
𝑘=2 𝑑𝑜𝑤𝑖ℎ𝑑𝑘+𝑑𝑖ℎ ∗ 𝑐𝑑𝑑𝑖ℎ𝑑 + 𝑓𝑖ℎ ∗
𝑐𝑑𝑑𝑠𝑞𝑟𝑖ℎ𝑑 + ∑ 𝑔𝑖ℎ𝑙n𝑙=1 ∗ 𝑒𝑣𝑒𝑛𝑡𝑑𝑎𝑦𝑖ℎ𝑑𝑙 + 𝑒𝑖ℎ𝑑 , for 𝑖 ∈ {1, … , 𝑛𝑖}, ℎ ∈
{1, 2, 3 … 24} 𝑎𝑛𝑑 𝑑 ∈ {1, … , 𝑛𝑑}
2
𝑘𝑊𝑖ℎ𝑑 = 𝑎𝑖ℎ + ∑ 𝑏𝑖ℎ𝑗 ∗12𝑗=2 𝑚𝑜𝑛𝑡ℎ𝑖ℎ𝑑𝑗 + ∑ 𝑐𝑖ℎ𝑘 ∗5
𝑘=2 𝑑𝑜𝑤𝑖ℎ𝑑𝑘+𝑑𝑖ℎ ∗ 𝑐𝑑𝑑𝑖ℎ𝑑 + 𝑓𝑖ℎ ∗
𝑐𝑑ℎ𝑖ℎ𝑑 + ∑ 𝑔𝑖ℎ𝑙n𝑙=1 ∗ 𝑒𝑣𝑒𝑛𝑡𝑑𝑎𝑦𝑖ℎ𝑑𝑙 + 𝑒𝑖ℎ𝑑 , for 𝑖 ∈ {1, … , 𝑛𝑖}, ℎ ∈
{1, 2, 3 … 24} 𝑎𝑛𝑑 𝑑 ∈ {1, … , 𝑛𝑑}
3
𝑘𝑊𝑖ℎ𝑑 = 𝑎𝑖ℎ + ∑ 𝑏𝑖ℎ𝑗 ∗12𝑗=2 𝑚𝑜𝑛𝑡ℎ𝑖ℎ𝑑𝑗 + ∑ 𝑐𝑖ℎ𝑘 ∗5
𝑘=2 𝑑𝑜𝑤𝑖ℎ𝑑𝑘+𝑑𝑖ℎ ∗ 𝑐𝑑ℎ𝑖ℎ𝑑 + 𝑓𝑖ℎ ∗
𝑜𝑣𝑒𝑟𝑛𝑖𝑔ℎ𝑡𝑐𝑑ℎ𝑖ℎ𝑑 + ∑ 𝑔𝑖ℎ𝑙n𝑙=1 ∗ 𝑒𝑣𝑒𝑛𝑡𝑑𝑎𝑦𝑖ℎ𝑑𝑙 + 𝑒𝑖ℎ𝑑 , for 𝑖 ∈ {1, … , 𝑛𝑖}, ℎ ∈
{1, 2, 3 … 24} 𝑎𝑛𝑑 𝑑 ∈ {1, … , 𝑛𝑑}
4
𝑘𝑊𝑖ℎ𝑑 = 𝑎𝑖ℎ + ∑ 𝑏𝑖ℎ𝑗 ∗12𝑗=2 𝑚𝑜𝑛𝑡ℎ𝑖ℎ𝑑𝑗 + ∑ 𝑐𝑖ℎ𝑘 ∗5
𝑘=2 𝑑𝑜𝑤𝑖ℎ𝑑𝑘+𝑑𝑖ℎ ∗ 𝑐𝑑ℎ𝑖ℎ𝑑 + 𝑓𝑖ℎ ∗
𝑐𝑑ℎ𝑠𝑞𝑟𝑖ℎ𝑑 + ∑ 𝑔𝑖ℎ𝑙n𝑙=1 ∗ 𝑒𝑣𝑒𝑛𝑡𝑑𝑎𝑦𝑖ℎ𝑑𝑙 + 𝑒𝑖ℎ𝑑 , for 𝑖 ∈ {1, … , 𝑛𝑖}, ℎ ∈
{1, 2, 3 … 24} 𝑎𝑛𝑑 𝑑 ∈ {1, … , 𝑛𝑑}
5 𝑘𝑊𝑖ℎ𝑑 = 𝑎𝑖ℎ + ∑ 𝑏𝑖ℎ𝑗 ∗12
𝑗=2 𝑚𝑜𝑛𝑡ℎ𝑖ℎ𝑑𝑗 + ∑ 𝑐𝑖ℎ𝑘 ∗5𝑘=2 𝑑𝑜𝑤𝑖ℎ𝑑𝑘+ ∑ 𝑑𝑖ℎ𝑙
n𝑙=1 ∗
𝑒𝑣𝑒𝑛𝑡𝑑𝑎𝑦𝑖ℎ𝑙 + 𝑒𝑖ℎ𝑑 , for 𝑖 ∈ {1, … , 𝑛𝑖}, ℎ ∈ {1, 2, 3 … 24} 𝑎𝑛𝑑 𝑑 ∈ {1, … , 𝑛𝑑}
6 𝑘𝑊𝑖ℎ𝑑 = 𝑎𝑖ℎ + ∑ 𝑏𝑖ℎ𝑘 ∗5
𝑘=2 𝑑𝑜𝑤𝑖ℎ𝑑𝑘+𝑐𝑖ℎ ∗ 𝑐𝑑𝑑𝑖ℎ𝑑 + 𝑑𝑖ℎ ∗ 𝑐𝑑𝑑𝑠𝑞𝑟𝑖ℎ𝑑 + ∑ 𝑓𝑖ℎ𝑙n𝑙=1 ∗
𝑒𝑣𝑒𝑛𝑡𝑑𝑎𝑦𝑖ℎ𝑑𝑙 + 𝑒𝑖ℎ𝑑 , for 𝑖 ∈ {1, … , 𝑛𝑖}, ℎ ∈ {1, 2, 3 … 24} 𝑎𝑛𝑑 𝑑 ∈ {1, … , 𝑛𝑑}
7 𝑘𝑊𝑖ℎ𝑑 = 𝑎𝑖ℎ + ∑ 𝑏𝑖ℎ𝑘 ∗5
𝑘=2 𝑑𝑜𝑤𝑖ℎ𝑑𝑘+𝑐𝑖ℎ ∗ 𝑐𝑑𝑑𝑖ℎ𝑑 + 𝑑𝑖ℎ ∗ 𝑐𝑑ℎ𝑖ℎ𝑑 + ∑ 𝑓𝑖ℎ𝑙n𝑙=1 ∗
𝑒𝑣𝑒𝑛𝑡𝑑𝑎𝑦𝑖ℎ𝑑𝑙 + 𝑒𝑖ℎ𝑑 , for 𝑖 ∈ {1, … , 𝑛𝑖}, ℎ ∈ {1, 2, 3 … 24} 𝑎𝑛𝑑 𝑑 ∈ {1, … , 𝑛𝑑}
8
𝑘𝑊𝑖ℎ𝑑 = 𝑎𝑖ℎ + ∑ 𝑏𝑖ℎ𝑘 ∗5𝑘=2 𝑑𝑜𝑤𝑖ℎ𝑑𝑘+𝑐𝑖ℎ ∗ 𝑐𝑑ℎ𝑖ℎ𝑑 + 𝑑𝑖ℎ ∗ 𝑜𝑣𝑒𝑟𝑛𝑖𝑔ℎ𝑡𝑐𝑑ℎ𝑖ℎ𝑑 +
∑ 𝑓𝑖ℎ𝑙n𝑙=1 ∗ 𝑒𝑣𝑒𝑛𝑡𝑑𝑎𝑦𝑖ℎ𝑑𝑙 + 𝑒𝑖ℎ𝑑 , for 𝑖 ∈ {1, … , 𝑛𝑖}, ℎ ∈ {1, 2, 3 … 24} 𝑎𝑛𝑑 𝑑 ∈
{1, … , 𝑛𝑑}
9 𝑘𝑊𝑖ℎ𝑑 = 𝑎𝑖ℎ + ∑ 𝑏𝑖ℎ𝑘 ∗5
𝑘=2 𝑑𝑜𝑤𝑖ℎ𝑑𝑘+𝑐𝑖ℎ ∗ 𝑐𝑑ℎ𝑖ℎ𝑑 + 𝑑𝑖ℎ ∗ 𝑐𝑑ℎ𝑠𝑞𝑟𝑖ℎ𝑑 + ∑ 𝑓𝑖ℎ𝑙n𝑙=1 ∗
𝑒𝑣𝑒𝑛𝑡𝑑𝑎𝑦𝑖ℎ𝑑𝑙 + 𝑒𝑖ℎ𝑑 , for 𝑖 ∈ {1, … , 𝑛𝑖}, ℎ ∈ {1, 2, 3 … 24} 𝑎𝑛𝑑 𝑑 ∈ {1, … , 𝑛𝑑}
10 𝑘𝑊𝑖ℎ𝑑 = 𝑎𝑖ℎ + ∑ 𝑏𝑖ℎ𝑘 ∗5
𝑘=2 𝑑𝑜𝑤𝑖ℎ𝑑𝑘+ ∑ 𝑐𝑖ℎ𝑙n𝑙=1 ∗ 𝑒𝑣𝑒𝑛𝑡𝑑𝑎𝑦𝑖ℎ𝑙 + 𝑒𝑖ℎ𝑑 , for 𝑖 ∈
{1, … , 𝑛𝑖}, ℎ ∈ {1, 2, 3 … 24} 𝑎𝑛𝑑 𝑑 ∈ {1, … , 𝑛𝑑}

Regression Specifications
55
Variable Description
𝑖, ℎ, 𝑑 index for individual 𝑖, hour ℎ, and day 𝑑
𝑘𝑊 energy usage in each hourly interval ℎ = (1,2,3,…, 24) for each day, 𝑑
𝑚𝑜𝑛𝑡ℎ binary variable indicating the month of the hourly observation
𝑑𝑜𝑤 binary variable for the day type of the hourly observation
𝑐𝑑ℎ cooling degree hour - the maximum of zero and the hourly temperature value less a base value of 60 °F
𝑐𝑑ℎ𝑠𝑞𝑟 square of cooling degree hour
𝑐𝑑𝑑 cooling degree day - the maximum of zero and the mean temperature of the day of the hourly observation less a base value of 60 °F
𝑐𝑑𝑑𝑠𝑞𝑟 square of cooling degree day
𝑜𝑣𝑒𝑟𝑛𝑖𝑔ℎ𝑡𝑐𝑑ℎ average of cooling degree hour from 12 AM through 9 AM
𝑒𝑣𝑒𝑛𝑡𝑑𝑎𝑦 binary variables indicating each event day, 1, 2, 3, ... , n
𝑒 error for each for individual 𝑖, hour ℎ, and day 𝑑

Regression Specifications
56
B.6 Demand Bidding Program
Ex post:
t
i
ti
MONTH
i
i
ti
DTYPE
i
i
ti
h
i
i
tti
SUMMER
i
i
tti
FRI
i
i
tti
MON
i
i
tti
Weather
i
i
tiDR
ti
DR
i
DR
i i
titi
MornLoad
itti
DBP
Evti
E
Evt
t
eMONTHbDTYPEb
hbSUMMERhbFRIhb
MONhbWeatherhbOtherEvthb
MornLoadhbDBPhbaQ
)()(
)()()(
)()()(
)()(
10
6
,
5
2
,
24
2
,
24
2
,
24
2
,
24
2
,
24
1
,
24
1
,,
24
1
24
1
,,,,
1
Variable Description
Qt demand in hour t for a customer enrolled in DBP prior to the last event date
b's estimated parameters
hi,t dummy variable for hour 𝑖
DBPt indicator variable for program event days
Weathert weather variables selected in the model screening process
E number of event days that occurred during the program year
MornLoadt variable equal to the average of the day’s load in hours 1 through 10
𝑂𝑡ℎ𝑒𝑟𝐸𝑣𝑡𝑖,𝑡𝐷𝑅 equals one on the event days of other demand response programs in which the
customer is enrolled
MONt dummy variable for Monday
FRIt dummy variable for Friday
SUMMERt dummy variable for the summer pricing season7
DTYPEi,t series of dummy variables for each day of the week
MONTHi,t series of dummy variables for each month
et error term
The ex ante model specifications used for estimating summer loads are the same as the ex post
specifications, with the following exceptions:
The tiMornLoad ,term is not included in the ex ante model specification; and
A cooling degree hour (base 60 °F) variable is used in the ex ante model specification rather
than the tWeather term.
7 The SCE summer pricing season is June through September.

Regression Specifications
57
The ex ante model specification used for estimating non-summer loads follows, which uses the same variable naming convention as in the ex post regression model specification, with the addition of the HDHt variable, heating degree hours, base 50 °F.
t
i
ti
MONTH
i
i
ti
DTYPE
i
i
ti
h
i
i
tti
FRI
i
i
tti
MON
i
i
tti
HDH
i
i
tti
CDH
i
i
tiDR
ti
DR
i
DRi
tti
DBP
Evti
E
Evt
t
eMONTHb
DTYPEbhbFRIhb
MONhbHDHhbCDHhb
OtherEvthbDBPhbaQ
)(
)()()(
)()()(
)()(
1210,52
,
5
2
,
24
2
,
24
2
,
24
2
,
24
1
,
24
1
,
24
1
,,
24
1
,,
1

Regression Specifications
58
B.7 Capacity Bidding Program and Aggregator-managed Programs
Ex post:
dt
i
di
MONTH
i
i
di
DTYPE
i
i
ti
h
i
i
dti
SUMMER
i
i
dti
FRI
i
i
dti
MON
i
i
dtti
Weather
i
i
dti
OTH
i
i i
dti
MornLoad
idti
AGG
Evti
E
Evt
dt
eMONTHbDTYPEb
hbSUMMERhbFRIhb
MONhbWeatherhbOtherEvthb
MornLoadhbAGGhbaQ
,
10
6
,
5
2
,
24
2
,
24
2
,
24
2
,
24
2
,
24
1
,,
24
1
,
24
1
24
1
,,,
1
,
)()(
)()()(
)()()(
)()(
Variable Description
dtQ , demand in hour t on day d for a customer nominated to the aggregator program prior to the last event date
b ’s estimated parameters
tih , dummy variable for hour i
dtAGG , indicator variable for aggregator program event days
dtWeather , weather variables selected in the model screening process
E number of event days that occurred during the program year
dMornLoad average of the day’s load in hours 1 through 10
dOtherEvt equals one in the event hours of other demand response programs in which the customer is enrolled
dMON dummy variable for Monday
dFRI dummy variable for Friday
dSUMMER dummy variable for the summer pricing season8
diDTYPE , series of dummy variables for each day of the week
diMONTH , series of dummy variables for each month
dte , error term
The ex ante model specifications are the same as the ex post specifications, with the following
exceptions:
The dMornLoad term is not included in the ex ante model specification; and
8 The SCE summer pricing season is July through September.

Regression Specifications
59
A cooling degree hour (base 60 °F) variable is used in the ex ante model specification rather
than the dtWeather , term.
B.8 Save Power Day
Ex ante:
𝐼𝑚𝑝𝑎𝑐𝑡 = 𝑎 + 𝑏 ∙ 𝑚𝑒𝑎𝑛17 + 𝛆
Variable Description
𝐼𝑚𝑝𝑎𝑐𝑡 per customer ex post load impact (kW) for each event day, averaged over the event period
𝑎 estimated constant
𝑏 estimated parameter coefficient
𝑚𝑒𝑎𝑛17 average temperature from 12 AM to 5 PM
𝛆 error term, assumed to be mean zero and uncorrelated with any of the independent variables
B.9 Real-time Pricing
𝑘𝑊𝑡 = 𝐴 + ∑ 𝐵𝑖 × 𝐻𝑜𝑢𝑟𝑖 × 𝑃𝑟𝑖𝑐𝑒𝑡 + ∑ 𝐶𝑖 × 𝐻𝑜𝑢𝑟𝑖 × 𝑃𝑟𝑖𝑐𝑒𝑆𝑄𝑅𝑡
22
𝑖=13
22
𝑖=13
+ ∑ 𝐷𝑖 × 𝐻𝑜𝑢𝑟𝑖 × 𝑃𝑟𝑖𝑐𝑒𝑅𝑎𝑡𝑖𝑜𝑡
12
𝑖=1
+ ∑ 𝐸𝑖 × 𝐻𝑜𝑢𝑟𝑖 × 𝑃𝑟𝑖𝑐𝑒𝑅𝑎𝑡𝑖𝑜𝑡
24
𝑖=23
+ ∑ ∑ 𝐹𝑖𝑗 × 𝐻𝑜𝑢𝑟𝑖 × 𝐷𝑎𝑦𝑇𝑦𝑝𝑒𝑗
3
𝑗=1
24
𝑖=1
+ ∑ ∑ 𝐺𝑖𝑗 × 𝐻𝑜𝑢𝑟𝑖 × 𝑀𝑜𝑛𝑡ℎ𝑗
12
𝑗=1
24
𝑖=1
+ 𝑒𝑡

Regression Specifications
60
The following weather variables were also included in the models for weather-sensitive
customers:
+ ∑ 𝐻𝑖𝑗 × 𝐻𝑜𝑢𝑟𝑖 × 𝑇𝑜𝑡𝑎𝑙𝐶𝐷𝐻𝑡
24
𝑖=1
+ ∑ 𝐼𝑖𝑗 × 𝐻𝑜𝑢𝑟𝑖 × 𝑇𝑜𝑡𝑎𝑙𝐻𝐷𝐻𝑡
24
𝑖=1
Variable Description
𝐴 estimated constant
𝐵 − 𝐼 estimated parameter coefficients
𝐻𝑜𝑢𝑟 indicator variables representing the hours of the day, designed to estimate the effect of daily schedules on usage behavior and event impacts
𝑀𝑜𝑛𝑡ℎ indicator variable for the month
𝑃𝑟𝑖𝑐𝑒 RTP price in effect for each hour
𝑃𝑟𝑖𝑐𝑒𝑆𝑄𝑅 RTP price squared
𝑃𝑟𝑖𝑐𝑒𝑅𝑎𝑡𝑖𝑜 ratio between the RTP price in effect for each hour and the maximum price for the day, which captures load shifting to hours when prices are relatively low
𝐷𝑎𝑦𝑇𝑦𝑝𝑒 series of binary variables representing three different day types (Monday, Tuesday through Thursday, and Friday)
𝑇𝑜𝑡𝑎𝑙𝐶𝐷𝐻 total number of cooling degree hours (base 70) per day
𝑇𝑜𝑡𝑎𝑙𝐻𝐷𝐻 total number of heating degree hours (base 70) per day
𝑒𝑡 error term
B.10 SMB Non-residential Time-of-Use Pricing
Ex post, models estimated separately for summer (June through September) and non-summer:
ctc
i
ti
YRMONTH
i
i
ti
h
DTYPEi
ct
h
HDDct
h
CDDctt
h
TreatPostt
h
Post
h
ct
euYRMONTHbDTYPEb
HDDbCDDbTreatPostbPostbaQ
,,
_
,
,,,_,
)_()(
)(
Variable Description
h
ctQ , demand in hour h on date t for customer c
a estimated constant
b ’s estimated parameters
tPost dummy variable for post-transition time period
ctTreat , dummy variable for treatment (TOU) customers
ctCDD , cooling degree days on date t for customer c

Regression Specifications
61
Variable Description
ctHDD , heating degree days on date t for customer c
tiDTYPE , dummy variables for each day of the week
tiYRMONTH ,_ dummy variables for each month/year
cu fixed effect for customer c
cte , error term
Ex ante:
Load impactc,s = bcTOU + bc
TOU,CDD x CDDc,s + bcTOU,HDD x HDDc,s
Where CDDc,s and HDDc,s denote scenario-specific weather conditions.

Portfolio Aggregate Ex Ante Load Impact Estimates for 1-in-2 SCE-specific System Conditions by Month and Forecast Year
62
Appendix C Portfolio Aggregate Ex Ante Load Impact Estimates for 1-in-2 SCE-specific System Conditions by Month and Forecast Year
Table C-1: 2015 Portfolio Aggregate Ex Ante Load Impact Estimates for 1-in-2 SCE-specific System Conditions
Program Type Program Monthly System Peak
Jan. Feb. Mar. Apr. May Jun. Jul. Aug. Sep. Oct. Nov. Dec.
Emergency
BIP-15 136 125 144 148 139 141 145 148 147 138 138 131
BIP-30 498 479 513 499 512 511 512 513 506 470 467 447
AP-I 33 30 40 56 60 65 64 60 50 48 32 26
SUB-TOTAL 667 634 698 703 711 717 721 721 702 657 637 605
Price-responsive
SDP-C 0 0 0 28 30 35 50 64 59 48 5 0
SDP-R 0 0 0 124 160 186 250 295 273 209 17 0
CPP-Large 8 8 8 9 14 14 13 12 13 12 9 8
CPP-Medium 0 0 0 0 0 0 0 0 0 0 0 0
CPP-Small 0 0 0 0 0 0 0 0 0 0 0 0
DBP 3 3 3 2 5 5 5 5 5 5 3 2
SUB-TOTAL 11 11 12 162 209 239 317 375 350 274 34 10
Demand Response
Aggregator-managed
CBP-DA 3 3 3 2 5 5 6 5 5 5 3 2
CBP-DO 21 23 24 10 45 47 49 49 47 42 26 21
AMP 35 37 38 21 86 88 95 93 89 86 42 32
SUB-TOTAL 59 63 65 32 136 140 149 147 141 133 71 56
SmartConnect®-enabled
SPD with Tech. 0 0 0 1 1 1 1 1 2 2 1 0
SPD without Tech. 5 5 7 14 14 14 14 14 14 14 7 5
SUB-TOTAL 5 5 8 14 15 15 15 16 16 15 8 5
Non-event Based
RTP 0 0 0 0 0 2 2 -1 2 0 0 0
SMB Non-res. TOU 14 15 14 19 20 21 22 21 22 20 17 14
PLS 0 0 0 0 0 0 0 0 0 0 0 0
SUB-TOTAL 14 14 14 19 20 23 24 20 24 20 16 14
PORTFOLIO TOTAL 756 728 797 930 1,091 1,134 1,227 1,279 1,232 1,099 767 689

Portfolio Aggregate Ex Ante Load Impact Estimates for 1-in-2 SCE-specific System Conditions by Month and Forecast Year
63
Table C-2: 2016 Portfolio Aggregate Ex Ante Load Impact Estimates for 1-in-2 SCE-specific System Conditions
Program Type Program Monthly System Peak
Jan. Feb. Mar. Apr. May Jun. Jul. Aug. Sep. Oct. Nov. Dec.
Emergency
BIP-15 132 121 140 143 135 137 141 143 142 134 133 129
BIP-30 486 466 500 486 499 498 499 500 493 458 455 434
AP-I 34 32 42 58 62 68 66 63 52 51 34 28
SUB-TOTAL 652 619 682 688 696 702 706 707 687 643 623 592
Price-responsive
SDP-C 0 0 0 26 29 34 48 61 56 46 5 0
SDP-R 0 0 0 119 154 179 240 283 262 201 16 0
CPP-Large 8 8 9 9 14 14 13 12 13 12 9 8
CPP-Medium 0 0 0 0 0 0 0 0 0 0 0 0
CPP-Small 0 0 0 0 0 0 0 0 0 0 0 0
DBP 3 3 3 1 4 4 4 4 4 4 3 2
SUB-TOTAL 11 11 11 156 201 230 305 360 336 263 33 10
Demand Response Aggregator-
managed
CBP-DA 3 3 3 2 5 5 6 5 5 5 3 2
CBP-DO 21 23 24 10 45 47 49 49 47 42 26 21
AMP 35 37 38 21 86 88 95 93 89 86 42 32
SUB-TOTAL 59 63 65 32 136 140 149 147 141 133 71 56
SmartConnect®-enabled
SPD with Tech. 0 0 1 2 2 2 2 2 2 2 1 0
SPD without Tech. 5 5 7 13 13 13 13 13 13 13 7 4
SUB-TOTAL 5 5 8 15 15 15 15 15 15 15 8 5
Non-event Based
RTP 0 0 0 0 0 2 2 -1 2 0 0 0
SMB Non-res. TOU 14 15 14 19 20 21 22 21 22 20 17 14
PLS 0* 0* 0* 0* 0* 0* 0* 0* 0* 0* 0* 0*
SUB-TOTAL 14 14 14 19 20 23 24 20 24 20 16 14
PORTFOLIO TOTAL 740 712 781 909 1,068 1,110 1,199 1,250 1,203 1,075 751 676
*Load impacts are redacted to protect confidential customer information

Portfolio Aggregate Ex Ante Load Impact Estimates for 1-in-2 SCE-specific System Conditions by Month and Forecast Year
64
Table C-3: 2017 Portfolio Aggregate Ex Ante Load Impact Estimates for 1-in-2 SCE-specific System Conditions
Program Type Program Monthly System Peak
Jan. Feb. Mar. Apr. May Jun. Jul. Aug. Sep. Oct. Nov. Dec.
Emergency
BIP-15 130 119 138 141 132 134 138 141 140 132 131 125
BIP-30 472 453 486 473 485 484 485 487 479 446 443 423
AP-I 36 33 44 62 66 72 70 66 54 53 35 29
SUB-TOTAL 638 606 668 675 683 690 694 693 674 630 609 577
Price-responsive
SDP-C 0 0 0 25 27 32 45 58 54 43 5 0
SDP-R 0 0 0 115 148 172 232 273 253 194 15 0
CPP-Large 9 9 9 9 15 14 13 12 14 13 9 8
CPP-Medium 0 0 0 5 11 12 12 13 12 12 5 4
CPP-Small 0 0 0 3 6 7 7 8 7 6 3 2
DBP 2 2 3 1 4 4 4 4 4 4 3 2
SUB-TOTAL 11 11 11 158 211 240 313 368 343 272 39 17
Demand Response
Aggregator-managed
CBP-DA 3 3 3 2 5 5 6 5 5 5 3 2
CBP-DO 21 23 24 10 45 47 49 49 47 42 26 21
AMP 35 37 38 21 86 88 95 93 89 86 42 32
SUB-TOTAL 59 63 65 32 136 140 149 147 141 133 71 56
SmartConnect®-enabled
SPD with Tech. 0 0 2 2 3 3 3 4 4 4 2 0
SPD without Tech. 4 4 7 13 13 13 13 13 12 12 7 4
SUB-TOTAL 5 5 8 15 15 16 16 16 16 16 9 5
Non-event Based
RTP 0 0 0 0 0 2 2 -1 2 0 0 0
SMB Non-res. TOU 14 15 14 19 20 21 22 21 22 20 17 14
PLS 0 0 0 0 0 4 5 5 5 0 0 0
SUB-TOTAL 14 14 14 19 20 27 29 25 29 20 16 14
PORTFOLIO TOTAL 727 699 767 899 1,066 1,113 1,201 1,249 1,202 1,071 744 668

Portfolio Aggregate Ex Ante Load Impact Estimates for 1-in-2 SCE-specific System Conditions by Month and Forecast Year
65
Table C-4: 2018 Portfolio Aggregate Ex Ante Load Impact Estimates for 1-in-2 SCE-specific System Conditions
Program Type Program Monthly System Peak
Jan. Feb. Mar. Apr. May Jun. Jul. Aug. Sep. Oct. Nov. Dec.
Emergency
BIP-15 126 116 133 136 128 130 134 137 136 128 129 125
BIP-30 460 441 473 460 472 471 472 474 466 434 437 423
AP-I 37 34 45 62 67 72 70 66 54 52 35 29
SUB-TOTAL 623 591 651 659 667 673 676 676 656 614 601 577
Price-responsive
SDP-C 0 0 0 24 26 30 43 55 51 41 5 0
SDP-R 0 0 0 111 143 166 224 264 244 187 15 0
CPP-Large 9 9 9 9 15 15 13 13 14 13 9 9
CPP-Medium 4 4 4 2 4 5 5 5 5 5 2 2
CPP-Small 2 2 2 1 2 3 3 3 3 3 1 1
DBP 2 2 3 1 4 4 4 4 4 4 3 2
SUB-TOTAL 18 18 18 148 195 223 292 343 321 253 34 13
Demand Response
Aggregator-managed
CBP-DA 3 3 3 2 5 5 6 5 5 5 3 2
CBP-DO 21 23 24 10 45 47 49 49 47 42 26 21
AMP 35 37 38 21 86 88 95 93 89 86 42 32
SUB-TOTAL 59 63 65 32 136 140 149 147 141 133 71 56
SmartConnect®-enabled
SPD with Tech. 0 0 3 4 5 5 6 6 6 7 3 1
SPD without Tech. 4 4 6 12 12 12 12 12 12 12 6 4
SUB-TOTAL 5 5 9 16 17 17 18 18 18 18 10 5
Non-event Based
RTP 0 0 0 0 0 2 2 -1 2 0 0 0
SMB Non-res. TOU 14 15 14 19 20 21 22 21 22 20 17 14
PLS 0 0 0 0 0 7 8 8 7 0 0 0
SUB-TOTAL 14 14 14 19 20 30 31 28 31 20 16 14
PORTFOLIO TOTAL 718 691 758 874 1,035 1,082 1,167 1,212 1,167 1,038 733 664

Portfolio Aggregate Ex Ante Load Impact Estimates for 1-in-2 SCE-specific System Conditions by Month and Forecast Year
66
Table C-5: 2019 Portfolio Aggregate Ex Ante Load Impact Estimates for 1-in-2 SCE-specific System Conditions
Program Type Program Monthly System Peak
Jan. Feb. Mar. Apr. May Jun. Jul. Aug. Sep. Oct. Nov. Dec.
Emergency
BIP-15 126 116 133 136 128 130 134 137 136 128 129 125
BIP-30 460 441 473 460 472 471 472 474 466 434 437 423
AP-I 37 34 45 62 67 72 70 66 54 52 35 29
SUB-TOTAL 623 591 651 659 667 673 676 676 656 614 601 577
Price-responsive
SDP-C 0 0 0 23 25 29 41 52 49 39 4 0
SDP-R 0 0 0 107 138 161 216 255 236 181 14 0
CPP-Large 9 9 9 10 16 15 14 13 15 14 10 9
CPP-Medium 2 2 2 2 4 5 5 5 5 5 2 2
CPP-Small 1 1 1 1 2 3 3 3 3 3 1 1
DBP 2 2 3 1 4 4 4 4 4 4 3 2
SUB-TOTAL 14 14 15 144 190 216 283 333 311 245 34 14
Demand Response
Aggregator-managed
CBP-DA 3 3 3 2 5 5 6 5 5 5 3 2
CBP-DO 21 23 24 10 45 47 49 49 47 42 26 21
AMP 35 37 38 21 86 88 95 93 89 86 42 32
SUB-TOTAL 59 63 65 32 136 140 149 147 141 133 71 56
SmartConnect®-enabled
SPD with Tech. 1 1 4 6 7 7 8 9 9 9 5 1
SPD without Tech. 4 4 6 12 12 12 12 12 11 11 6 4
SUB-TOTAL 5 5 11 18 19 19 20 21 21 21 11 5
Non-event Based
RTP 0 0 0 0 0 2 2 -1 2 0 0 0
SMB Non-res. TOU 14 15 14 19 20 21 22 21 22 20 17 14
PLS 0 0 0 0 0 7 8 8 7 0 0 0
SUB-TOTAL 14 14 14 19 20 30 31 28 31 20 16 14
PORTFOLIO TOTAL 714 687 756 872 1,031 1,078 1,160 1,204 1,160 1,033 733 665

Portfolio Aggregate Ex Ante Load Impact Estimates for 1-in-2 SCE-specific System Conditions by Month and Forecast Year
67
Table C-6: 2020 Portfolio Aggregate Ex Ante Load Impact Estimates for 1-in-2 SCE-specific System Conditions
Program Type Program Monthly System Peak
Jan. Feb. Mar. Apr. May Jun. Jul. Aug. Sep. Oct. Nov. Dec.
Emergency
BIP-15 126 116 133 136 128 130 134 137 136 128 129 125
BIP-30 460 441 473 460 472 471 472 474 466 434 437 423
AP-I 37 34 45 62 67 72 70 66 54 52 35 29
SUB-TOTAL 623 591 651 659 667 673 676 676 656 614 601 577
Price-responsive
SDP-C 0 0 0 22 24 28 39 50 46 38 4 0
SDP-R 0 0 0 104 134 156 210 247 229 175 14 0
CPP-Large 9 9 10 10 16 16 14 14 15 14 10 9
CPP-Medium 2 2 2 2 5 5 5 6 5 5 2 2
CPP-Small 1 1 1 1 3 3 3 3 3 3 1 1
DBP 2 2 3 1 4 4 4 4 4 4 3 2
SUB-TOTAL 14 14 15 140 186 211 276 324 302 239 34 14
Demand Response
Aggregator-managed
CBP-DA 3 3 3 2 5 5 6 5 5 5 3 2
CBP-DO 21 23 24 10 45 47 49 49 47 42 26 21
AMP 35 37 38 21 86 88 95 93 89 86 42 32
SUB-TOTAL 59 63 65 32 136 140 149 147 141 133 71 56
SmartConnect®-enabled
SPD with Tech. 1 1 6 9 10 10 11 12 12 12 6 1
SPD without Tech. 4 4 6 11 11 11 11 11 11 11 6 4
SUB-TOTAL 5 5 12 20 21 22 22 24 24 24 12 5
Non-event Based
RTP 0 0 0 0 0 2 2 -1 2 0 0 0
SMB Non-res. TOU 14 15 14 19 20 21 22 21 22 20 17 14
PLS 0 0 0 0 0 7 8 8 7 0 0 0
SUB-TOTAL 14 14 14 19 20 30 31 28 31 20 16 14
PORTFOLIO TOTAL 715 688 758 870 1,029 1,075 1,155 1,198 1,154 1,029 735 665

Portfolio Aggregate Ex Ante Load Impact Estimates for 1-in-2 SCE-specific System Conditions by Month and Forecast Year
68
Table C-7: 2021 Portfolio Aggregate Ex Ante Load Impact Estimates for 1-in-2 SCE-specific System Conditions
Program Type Program Monthly System Peak
Jan. Feb. Mar. Apr. May Jun. Jul. Aug. Sep. Oct. Nov. Dec.
Emergency
BIP-15 126 116 133 136 128 130 134 137 136 128 129 125
BIP-30 460 441 473 460 472 471 472 474 466 434 437 423
AP-I 37 34 45 62 67 72 70 66 54 52 35 29
SUB-TOTAL 623 591 651 659 667 673 676 676 656 614 601 577
Price-responsive
SDP-C 0 0 0 21 23 27 38 48 44 36 4 0
SDP-R 0 0 0 101 130 151 204 240 222 170 13 0
CPP-Large 10 10 10 10 17 16 15 14 16 14 10 10
CPP-Medium 2 2 2 2 5 5 5 6 5 5 2 2
CPP-Small 1 1 1 1 3 3 3 3 3 3 1 1
DBP 2 2 3 1 4 4 4 4 4 4 3 2
SUB-TOTAL 15 15 15 137 181 206 269 315 295 233 34 14
Demand Response
Aggregator-managed
CBP-DA 3 3 3 2 5 5 6 5 5 5 3 2
CBP-DO 21 23 24 10 45 47 49 49 47 42 26 21
AMP 35 37 38 21 86 88 95 93 89 86 42 32
SUB-TOTAL 59 63 65 32 136 140 149 147 141 133 71 56
SmartConnect®-enabled
SPD with Tech. 1 1 8 12 13 14 15 16 16 16 8 1
SPD without Tech. 4 4 6 11 11 11 11 11 11 11 6 4
SUB-TOTAL 5 5 14 23 24 25 26 27 27 27 14 5
Non-event Based
RTP 0 0 0 0 0 2 2 -1 2 0 0 0
SMB Non-res. TOU 14 15 14 19 20 21 22 21 22 20 17 14
PLS 0 0 0 0 0 7 8 8 7 0 0 0
SUB-TOTAL 14 14 14 19 20 30 31 28 31 20 16 14
PORTFOLIO TOTAL 715 688 761 870 1,028 1,073 1,152 1,193 1,150 1,027 736 666

Portfolio Aggregate Ex Ante Load Impact Estimates for 1-in-2 SCE-specific System Conditions by Month and Forecast Year
69
Table C-8: 2022 Portfolio Aggregate Ex Ante Load Impact Estimates for 1-in-2 SCE-specific System Conditions
Program Type Program Monthly System Peak
Jan. Feb. Mar. Apr. May Jun. Jul. Aug. Sep. Oct. Nov. Dec.
Emergency
BIP-15 126 116 133 136 128 130 134 137 136 128 129 125
BIP-30 460 441 473 460 472 471 472 474 466 434 437 423
AP-I 37 34 45 62 67 72 70 66 54 52 35 29
SUB-TOTAL 623 591 651 659 667 673 676 676 656 614 601 577
Price-responsive
SDP-C 0 0 0 20 22 25 36 46 43 35 4 0
SDP-R 0 0 0 98 127 147 198 234 216 166 13 0
CPP-Large 10 10 10 11 17 17 15 14 16 15 11 10
CPP-Medium 2 2 2 2 5 5 6 6 6 5 2 2
CPP-Small 1 1 1 1 3 3 3 3 3 3 1 1
DBP 2 2 3 1 4 4 4 4 4 4 3 2
SUB-TOTAL 15 15 16 134 178 202 263 308 288 228 34 15
Demand Response
Aggregator-managed
CBP-DA 3 3 3 2 5 5 6 5 5 5 3 2
CBP-DO 21 23 24 10 45 47 49 49 47 42 26 21
AMP 35 37 38 21 86 88 95 93 89 86 42 32
SUB-TOTAL 59 63 65 32 136 140 149 147 141 133 71 56
SmartConnect®-enabled
SPD with Tech. 1 1 11 16 17 18 19 20 20 20 10 2
SPD without Tech. 4 4 6 11 11 10 11 11 10 10 6 4
SUB-TOTAL 5 5 17 26 27 28 29 31 31 31 16 5
Non-event Based
RTP 0 0 0 0 0 2 2 -1 2 0 0 0
SMB Non-res. TOU 14 15 14 19 20 21 22 21 22 20 17 14
PLS 0 0 0 0 0 7 8 8 7 0 0 0
SUB-TOTAL 14 14 14 19 20 30 31 28 31 20 16 14
PORTFOLIO TOTAL 716 689 763 870 1,028 1,072 1,149 1,189 1,146 1,025 738 667

Portfolio Aggregate Ex Ante Load Impact Estimates for 1-in-2 SCE-specific System Conditions by Month and Forecast Year
70
Table C-9: 2023 Portfolio Aggregate Ex Ante Load Impact Estimates for 1-in-2 SCE-specific System Conditions
Program Type Program Monthly System Peak
Jan. Feb. Mar. Apr. May Jun. Jul. Aug. Sep. Oct. Nov. Dec.
Emergency
BIP-15 126 116 133 136 128 130 134 137 136 128 129 125
BIP-30 460 441 473 460 472 471 472 474 466 434 437 423
AP-I 37 34 45 62 67 72 70 66 54 52 35 29
SUB-TOTAL 623 591 651 659 667 673 676 676 656 614 601 577
Price-responsive
SDP-C 0 0 0 19 21 24 35 44 41 33 4 0
SDP-R 0 0 0 96 124 144 193 228 211 162 13 0
CPP-Large 10 10 11 11 18 17 16 15 17 15 11 10
CPP-Medium 2 2 2 2 5 5 6 6 6 5 2 2
CPP-Small 1 1 1 1 3 3 3 4 3 3 1 1
DBP 2 2 3 1 4 4 4 4 4 4 3 2
SUB-TOTAL 16 16 16 131 175 198 257 301 281 223 34 15
Demand Response
Aggregator-managed
CBP-DA 3 3 3 2 5 5 6 5 5 5 3 2
CBP-DO 21 23 24 10 45 47 49 49 47 42 26 21
AMP 35 37 38 21 86 88 95 93 89 86 42 32
SUB-TOTAL 59 63 65 32 136 140 149 147 141 133 71 56
SmartConnect®-enabled
SPD with Tech. 2 2 14 19 20 21 23 24 24 24 12 2
SPD without Tech. 4 4 5 10 10 10 10 10 10 10 5 3
SUB-TOTAL 5 5 19 29 31 31 33 35 34 34 17 6
Non-event Based
RTP 0 0 0 0 0 2 2 -1 2 0 0 0
SMB Non-res. TOU 14 15 14 19 20 21 22 21 22 20 17 14
PLS 0 0 0 0 0 7 7 7 7 0 0 0
SUB-TOTAL 14 14 14 19 20 30 31 27 31 20 16 14
PORTFOLIO TOTAL 716 690 766 870 1,028 1,072 1,147 1,186 1,143 1,024 740 667

Portfolio Aggregate Ex Ante Load Impact Estimates for 1-in-2 SCE-specific System Conditions by Month and Forecast Year
71
Table C-10: 2024 Portfolio Aggregate Ex Ante Load Impact Estimates for 1-in-2 SCE-specific System Conditions
Program Type Program Monthly System Peak
Jan. Feb. Mar. Apr. May Jun. Jul. Aug. Sep. Oct. Nov. Dec.
Emergency
BIP-15 126 116 133 136 128 130 134 137 136 128 129 125
BIP-30 460 441 473 460 472 471 472 474 466 434 437 423
AP-I 37 34 45 62 67 72 70 66 54 52 35 29
SUB-TOTAL 623 591 651 659 667 673 676 676 656 614 601 577
Price-responsive
SDP-C 0 0 0 19 20 24 34 43 40 32 4 0
SDP-R 0 0 0 93 121 140 189 223 206 158 12 0
CPP-Large 11 11 11 11 19 18 16 15 17 16 11 11
CPP-Medium 2 2 2 2 5 6 6 6 6 6 2 2
CPP-Small 1 1 1 1 3 3 3 4 3 3 1 1
DBP 2 2 3 1 4 4 4 4 4 4 3 2
SUB-TOTAL 16 16 17 128 172 194 252 295 276 219 34 16
Demand Response
Aggregator-managed
CBP-DA 3 3 3 2 5 5 6 5 5 5 3 2
CBP-DO 21 23 24 10 45 47 49 49 47 42 26 21
AMP 35 37 38 21 86 88 95 93 89 86 42 32
SUB-TOTAL 59 63 65 32 136 140 149 147 141 133 71 56
SmartConnect®-enabled
SPD with Tech. 2 2 16 23 24 24 26 27 27 27 13 2
SPD without Tech. 3 3 5 10 10 10 10 10 10 10 5 3
SUB-TOTAL 6 6 21 33 34 34 36 37 37 37 19 6
Non-event Based
RTP 0 0 0 0 0 2 2 -1 2 0 0 0
SMB Non-res. TOU 14 15 14 19 20 21 22 21 22 20 17 14
PLS 0 0 0 0 0 7 7 7 7 0 0 0
SUB-TOTAL 14 14 14 19 20 29 31 27 31 20 16 14
PORTFOLIO TOTAL 717 690 769 871 1,028 1,071 1,144 1,182 1,140 1,022 741 668

Portfolio Aggregate Ex Ante Load Impact Estimates for 1-in-2 SCE-specific System Conditions by Month and Forecast Year
72
Table C-11: 2025 Portfolio Aggregate Ex Ante Load Impact Estimates for 1-in-2 SCE-specific System Conditions
Program Type Program Monthly System Peak
Jan. Feb. Mar. Apr. May Jun. Jul. Aug. Sep. Oct. Nov. Dec.
Emergency
BIP-15 126 116 133 136 128 130 134 137 136 128 129 125
BIP-30 460 441 473 460 472 471 472 474 466 434 437 423
AP-I 37 34 45 62 67 72 70 66 54 52 35 29
SUB-TOTAL 623 591 651 659 667 673 676 676 656 614 601 577
Price-responsive
SDP-C 0 0 0 18 20 23 32 41 38 31 4 0
SDP-R 0 0 0 91 118 137 185 218 201 154 12 0
CPP-Large 11 11 11 12 19 18 17 16 18 16 12 11
CPP-Medium 2 2 2 2 5 6 6 7 6 6 2 2
CPP-Small 1 1 1 1 3 3 4 4 3 3 1 1
DBP 2 2 3 1 4 4 4 4 4 4 3 2
SUB-TOTAL 16 17 17 126 169 191 248 289 271 215 34 16
Demand Response
Aggregator-managed
CBP-DA 3 3 3 2 5 5 6 5 5 5 3 2
CBP-DO 21 23 24 10 45 47 49 49 47 42 26 21
AMP 35 37 38 21 86 88 95 93 89 86 42 32
SUB-TOTAL 59 63 65 32 136 140 149 147 141 133 71 56
SmartConnect®-enabled
SPD with Tech. 2 2 18 25 26 27 28 30 29 29 15 3
SPD without Tech. 3 3 5 10 10 10 10 10 10 10 5 3
SUB-TOTAL 6 6 23 35 36 36 38 40 39 39 20 6
Non-event Based
RTP 0 0 0 0 0 2 2 -1 2 0 0 0
SMB Non-res. TOU 14 15 14 19 20 21 22 21 22 20 17 14
PLS 0 0 0 0 0 6 7 7 7 0 0 0
SUB-TOTAL 14 14 14 19 20 29 31 27 31 20 16 14
PORTFOLIO TOTAL 718 691 771 871 1,028 1,070 1,142 1,179 1,137 1,021 742 668

Portfolio Aggregate Ex Ante Load Impact Estimates for 1-in-10 SCE-specific System Conditions by Month and Forecast Year
73
Appendix D Portfolio Aggregate Ex Ante Load Impact Estimates for 1-in-10 SCE-specific System Conditions by Month and Forecast Year
Table D-1: 2015 Portfolio Aggregate Ex Ante Load Impact Estimates for 1-in-10 SCE-specific System Conditions
Program Type Program Monthly System Peak
Jan. Feb. Mar. Apr. May Jun. Jul. Aug. Sep. Oct. Nov. Dec.
Emergency
BIP-15 137 127 148 155 138 140 145 147 147 138 140 131
BIP-30 532 495 509 507 508 509 511 513 505 470 475 452
AP-I 33 30 43 59 62 65 62 60 51 51 35 26
SUB-TOTAL 702 652 700 720 709 714 719 720 702 658 649 610
Price-responsive
SDP-C 0 0 5 59 58 57 59 74 71 59 22 0
SDP-R 0 0 10 232 267 275 294 344 315 273 76 0
CPP-Large 8 8 9 8 12 13 11 11 11 12 8 8
CPP-Medium 0 0 0 0 0 0 0 0 0 0 0 0
CPP-Small 0 0 0 0 0 0 0 0 0 0 0 0
DBP 3 3 4 1 5 5 5 5 5 5 3 2
SUB-TOTAL 11 11 26 300 342 349 368 434 402 349 109 10
Demand Response
Aggregator-managed
CBP-DA 3 3 3 2 5 5 6 6 5 5 3 2
CBP-DO 21 23 26 11 47 48 50 50 47 43 28 21
AMP 34 37 41 21 89 90 95 94 90 87 43 32
SUB-TOTAL 58 62 70 33 140 143 151 149 143 135 74 56
SmartConnect®-enabled
SPD with Tech. 0 0 0 1 1 1 1 1 2 2 1 0
SPD without Tech. 5 5 7 14 14 14 14 14 14 14 7 5
SUB-TOTAL 5 5 8 15 15 15 16 16 16 15 8 5
Non-event Based
RTP 0 0 0 -2 0 2 -3 -1 6 -2 -2 0
SMB Non-res. TOU 14 15 17 19 21 21 21 22 20 21 22 15
PLS 0 0 0 0 0 0 0 0 0 0 0 0
SUB-TOTAL 14 15 17 17 21 22 19 21 25 19 20 14
PORTFOLIO TOTAL 790 745 821 1,086 1,227 1,245 1,272 1,339 1,289 1,176 860 695

Portfolio Aggregate Ex Ante Load Impact Estimates for 1-in-10 SCE-specific System Conditions by Month and Forecast Year
74
Table D-2: 2016 Portfolio Aggregate Ex Ante Load Impact Estimates for 1-in-10 SCE-specific System Conditions
Program Type Program Monthly System Peak
Jan. Feb. Mar. Apr. May Jun. Jul. Aug. Sep. Oct. Nov
. Dec
.
Emergency
BIP-15 133 123 144 150 134 136 140 143 142 133 135 129
BIP-30 519 482 496 494 495 496 498 500 492 458 463 439
AP-I 34 31 44 61 65 68 65 63 54 53 37 28
SUB-TOTAL 686 637 684 705 694 700 704 706 688 645 634 596
Price-responsive
SDP-C 0 0 4 56 55 54 56 70 68 56 21 0
SDP-R 0 0 9 223 256 265 282 331 303 262 73 0
CPP-Large 8 8 9 8 12 13 12 11 11 12 8 8
CPP-Medium 0 0 0 0 0 0 0 0 0 0 0 0
CPP-Small 0 0 0 0 0 0 0 0 0 0 0 0
DBP 2 3 3 1 4 4 4 4 4 4 3 2
SUB-TOTAL 11 11 26 288 328 336 354 416 386 335 104 10
Demand Response Aggregator-
managed
CBP-DA 3 3 3 2 5 5 6 6 5 5 3 2
CBP-DO 21 23 26 11 47 48 50 50 47 43 28 21
AMP 34 37 41 21 89 90 95 94 90 87 43 32
SUB-TOTAL 58 62 70 33 140 143 151 149 143 135 74 56
SmartConnect®-enabled
SPD with Tech. 0 0 1 2 2 2 2 2 3 2 1 0
SPD without Tech. 5 5 7 13 13 13 13 13 13 13 7 4
SUB-TOTAL 5 5 8 15 15 15 15 16 16 15 8 5
Non-event Based
RTP 0 0 0 -2 0 2 -3 -1 6 -2 -2 0
SMB Non-res. TOU 14 15 17 19 21 21 21 22 20 21 22 15
PLS 0* 0* 0* 0* 0* 0* 0* 0* 0* 0* 0* 0*
SUB-TOTAL 14 15 17 17 21 22 19 21 25 19 20 14
PORTFOLIO TOTAL 773 729 805 1,05
9 1,19
9 1,21
6 1,24
3 1,30
7 1,25
8 1,14
9 841 681
*Load impacts are redacted to protect confidential customer information

Portfolio Aggregate Ex Ante Load Impact Estimates for 1-in-10 SCE-specific System Conditions by Month and Forecast Year
75
Table D-3: 2017 Portfolio Aggregate Ex Ante Load Impact Estimates for 1-in-10 SCE-specific System Conditions
Program Type Program Monthly System Peak
Jan. Feb. Mar. Apr. May Jun. Jul. Aug. Sep. Oct. Nov. Dec.
Emergency
BIP-15 131 121 141 148 132 134 138 141 140 131 133 125
BIP-30 504 469 483 481 481 482 485 486 478 445 450 428
AP-I 36 33 47 64 68 72 69 66 56 56 38 29
SUB-TOTAL 671 623 671 692 682 688 691 692 674 632 621 582
Price-responsive
SDP-C 0 0 4 53 52 51 53 66 64 53 20 0
SDP-R 0 0 9 215 247 255 272 319 292 253 70 0
CPP-Large 9 9 9 8 13 13 12 12 12 12 8 8
CPP-Medium 0 0 0 5 12 13 13 14 13 12 5 4
CPP-Small 0 0 0 3 7 7 8 8 8 7 3 2
DBP 2 2 3 1 4 4 4 4 4 4 3 2
SUB-TOTAL 11 11 25 286 335 343 362 423 393 341 109 17
Demand Response
Aggregator-managed
CBP-DA 3 3 3 2 5 5 6 6 5 5 3 2
CBP-DO 21 23 26 11 47 48 50 50 47 43 28 21
AMP 34 37 41 21 89 90 95 94 90 87 43 32
SUB-TOTAL 58 62 70 33 140 143 151 149 143 135 74 56
SmartConnect®-enabled
SPD with Tech. 0 0 1 3 3 3 4 4 4 4 1 0
SPD without Tech. 4 4 7 13 13 13 13 13 13 12 7 4
SUB-TOTAL 5 5 8 15 16 16 16 17 17 16 8 5
Non-event Based
RTP 0 0 0 -2 0 2 -3 -1 6 -2 -2 0
SMB Non-res. TOU 14 15 17 19 21 21 21 22 20 21 22 15
PLS 0 0 0 0 0 5 5 5 5 0 0 0
SUB-TOTAL 14 15 17 17 21 27 24 26 30 19 20 14
PORTFOLIO TOTAL 759 715 791 1,044 1,194 1,217 1,244 1,306 1,258 1,144 832 673

Portfolio Aggregate Ex Ante Load Impact Estimates for 1-in-10 SCE-specific System Conditions by Month and Forecast Year
76
Table D-4: 2018 Portfolio Aggregate Ex Ante Load Impact Estimates for 1-in-10 SCE-specific System Conditions
Program Type Program Monthly System Peak
Jan. Feb. Mar. Apr. May Jun. Jul. Aug. Sep. Oct. Nov. Dec.
Emergency
BIP-15 127 117 137 143 128 129 134 136 135 127 131 125
BIP-30 491 456 470 468 469 469 472 473 465 433 444 428
AP-I 37 34 48 65 69 72 69 66 56 55 38 29
SUB-TOTAL 655 607 654 676 666 671 674 675 657 615 613 582
Price-responsive
SDP-C 0 0 4 51 50 49 50 63 61 51 19 0
SDP-R 0 0 9 207 238 246 263 308 282 244 68 0
CPP-Large 9 9 9 8 13 13 12 12 12 13 9 9
CPP-Medium 4 4 4 2 5 5 5 5 5 5 2 2
CPP-Small 2 2 2 1 3 3 3 3 3 3 1 1
DBP 2 2 3 1 4 4 4 4 4 4 3 2
SUB-TOTAL 18 18 32 271 313 321 338 396 368 319 101 13
Demand Response
Aggregator-managed
CBP-DA 3 3 3 2 5 5 6 6 5 5 3 2
CBP-DO 21 23 26 11 47 48 50 50 47 43 28 21
AMP 34 37 41 21 89 90 95 94 90 87 43 32
SUB-TOTAL 58 62 70 33 140 143 151 149 143 135 74 56
SmartConnect®-enabled
SPD with Tech. 0 0 2 4 5 5 6 6 7 7 2 1
SPD without Tech. 4 4 7 12 12 12 12 12 12 12 6 4
SUB-TOTAL 5 5 9 17 17 17 18 19 19 19 9 5
Non-event Based
RTP 0 0 0 -2 0 2 -3 -1 6 -2 -2 0
SMB Non-res. TOU 14 15 17 19 21 21 21 22 20 21 22 15
PLS 0 0 0 0 0 8 8 8 8 0 0 0
SUB-TOTAL 14 15 17 17 21 30 27 29 33 19 20 14
PORTFOLIO TOTAL 749 706 781 1,014 1,157 1,182 1,208 1,267 1,220 1,107 817 670

Portfolio Aggregate Ex Ante Load Impact Estimates for 1-in-10 SCE-specific System Conditions by Month and Forecast Year
77
Table D-5: 2019 Portfolio Aggregate Ex Ante Load Impact Estimates for 1-in-10 SCE-specific System Conditions
Program Type Program Monthly System Peak
Jan. Feb. Mar. Apr. May Jun. Jul. Aug. Sep. Oct. Nov. Dec.
Emergency
BIP-15 127 117 137 143 128 129 134 136 135 127 131 125
BIP-30 491 456 470 468 469 469 472 473 465 433 444 428
AP-I 37 34 48 65 69 72 69 66 56 55 38 29
SUB-TOTAL 655 607 654 676 666 671 674 675 657 615 613 582
Price-responsive
SDP-C 0 0 4 48 47 46 48 60 58 49 18 0
SDP-R 0 0 8 201 231 238 254 298 273 236 65 0
CPP-Large 9 9 10 9 13 14 13 13 12 13 9 9
CPP-Medium 2 2 2 2 5 5 5 6 6 5 2 2
CPP-Small 1 1 1 1 3 3 3 3 3 3 1 1
DBP 2 2 3 1 4 4 4 4 4 4 3 2
SUB-TOTAL 14 14 27 262 304 311 328 384 356 310 98 14
Demand Response
Aggregator-managed
CBP-DA 3 3 3 2 5 5 6 6 5 5 3 2
CBP-DO 21 23 26 11 47 48 50 50 47 43 28 21
AMP 34 37 41 21 89 90 95 94 90 87 43 32
SUB-TOTAL 58 62 70 33 140 143 151 149 143 135 74 56
SmartConnect®-enabled
SPD with Tech. 1 1 3 7 8 8 9 9 10 9 3 1
SPD without Tech. 4 4 6 12 12 12 12 12 12 12 6 4
SUB-TOTAL 5 5 10 19 19 20 20 21 21 21 9 5
Non-event Based
RTP 0 0 0 -2 0 2 -3 -1 6 -2 -2 0
SMB Non-res. TOU 14 15 17 19 21 21 21 22 20 21 22 15
PLS 0 0 0 0 0 8 8 8 8 0 0 0
SUB-TOTAL 14 15 17 17 21 30 27 29 33 19 20 14
PORTFOLIO TOTAL 745 703 778 1,008 1,150 1,175 1,200 1,257 1,211 1,100 815 670

Portfolio Aggregate Ex Ante Load Impact Estimates for 1-in-10 SCE-specific System Conditions by Month and Forecast Year
78
Table D-6: 2020 Portfolio Aggregate Ex Ante Load Impact Estimates for 1-in-10 SCE-specific System Conditions
Program Type Program Monthly System Peak
Jan. Feb. Mar. Apr. May Jun. Jul. Aug. Sep. Oct. Nov. Dec.
Emergency
BIP-15 127 117 137 143 128 129 134 136 135 127 131 125
BIP-30 491 456 470 468 469 469 472 473 465 433 444 428
AP-I 37 34 48 65 69 72 69 66 56 55 38 29
SUB-TOTAL 655 607 654 676 666 671 674 675 657 615 613 582
Price-responsive
SDP-C 0 0 4 46 45 44 46 58 56 46 17 0
SDP-R 0 0 8 194 224 231 246 289 264 229 63 0
CPP-Large 10 9 10 9 14 14 13 13 13 13 9 9
CPP-Medium 2 2 2 2 5 5 6 6 6 5 2 2
CPP-Small 1 1 1 1 3 3 3 3 3 3 1 1
DBP 2 2 3 1 4 4 4 4 4 4 3 2
SUB-TOTAL 14 14 27 254 295 302 318 373 346 301 96 14
Demand Response
Aggregator-managed
CBP-DA 3 3 3 2 5 5 6 6 5 5 3 2
CBP-DO 21 23 26 11 47 48 50 50 47 43 28 21
AMP 34 37 41 21 89 90 95 94 90 87 43 32
SUB-TOTAL 58 62 70 33 140 143 151 149 143 135 74 56
SmartConnect®-enabled
SPD with Tech. 1 1 5 10 11 11 12 13 13 13 4 1
SPD without Tech. 4 4 6 11 11 11 11 11 11 11 6 4
SUB-TOTAL 5 5 11 21 22 22 23 24 25 24 10 5
Non-event Based
RTP 0 0 0 -2 0 2 -3 -1 6 -2 -2 0
SMB Non-res. TOU 14 15 17 19 21 21 21 22 20 21 22 15
PLS 0 0 0 0 0 8 8 8 8 0 0 0
SUB-TOTAL 14 15 17 17 21 30 27 29 33 19 20 14
PORTFOLIO TOTAL 746 704 779 1,002 1,144 1,169 1,193 1,249 1,204 1,094 813 671

Portfolio Aggregate Ex Ante Load Impact Estimates for 1-in-10 SCE-specific System Conditions by Month and Forecast Year
79
Table D-7: 2021 Portfolio Aggregate Ex Ante Load Impact Estimates for 1-in-10 SCE-specific System Conditions
Program Type Program Monthly System Peak
Jan. Feb. Mar. Apr. May Jun. Jul. Aug. Sep. Oct. Nov. Dec.
Emergency
BIP-15 127 117 137 143 128 129 134 136 135 127 131 125
BIP-30 491 456 470 468 469 469 472 473 465 433 444 428
AP-I 37 34 48 65 69 72 69 66 56 55 38 29
SUB-TOTAL 655 607 654 676 666 671 674 675 657 615 613 582
Price-responsive
SDP-C 0 0 4 44 43 42 44 55 53 44 16 0
SDP-R 0 0 8 189 217 224 239 280 257 222 62 0
CPP-Large 10 10 10 9 14 15 14 13 13 14 10 10
CPP-Medium 2 2 2 2 5 6 6 6 6 5 2 2
CPP-Small 1 1 1 1 3 3 3 4 4 3 1 1
DBP 2 2 3 1 4 4 4 4 4 4 3 2
SUB-TOTAL 15 15 27 247 288 295 310 363 337 293 94 14
Demand Response
Aggregator-managed
CBP-DA 3 3 3 2 5 5 6 6 5 5 3 2
CBP-DO 21 23 26 11 47 48 50 50 47 43 28 21
AMP 34 37 41 21 89 90 95 94 90 87 43 32
SUB-TOTAL 58 62 70 33 140 143 151 149 143 135 74 56
SmartConnect®-enabled
SPD with Tech. 1 1 7 13 14 15 16 17 18 17 6 2
SPD without Tech. 4 4 6 11 11 11 11 11 11 11 6 4
SUB-TOTAL 5 5 12 24 25 25 27 28 28 28 12 5
Non-event Based
RTP 0 0 0 -2 0 2 -3 -1 6 -2 -2 0
SMB Non-res. TOU 14 15 17 19 21 21 21 22 20 21 22 15
PLS 0 0 0 0 0 7 8 8 8 0 0 0
SUB-TOTAL 14 15 17 17 21 30 27 29 33 19 20 14
PORTFOLIO TOTAL 746 704 781 998 1,140 1,164 1,189 1,242 1,198 1,090 812 671

Portfolio Aggregate Ex Ante Load Impact Estimates for 1-in-10 SCE-specific System Conditions by Month and Forecast Year
80
Table D-8: 2022 Portfolio Aggregate Ex Ante Load Impact Estimates for 1-in-10 SCE-specific System Conditions
Program Type Program Monthly System Peak
Jan. Feb. Mar. Apr. May Jun. Jul. Aug. Sep. Oct. Nov. Dec.
Emergency
BIP-15 127 117 137 143 128 129 134 136 135 127 131 125
BIP-30 491 456 470 468 469 469 472 473 465 433 444 428
AP-I 37 34 48 65 69 72 69 66 56 55 38 29
SUB-TOTAL 655 607 654 676 666 671 674 675 657 615 613 582
Price-responsive
SDP-C 0 0 3 43 42 41 42 53 51 43 16 0
SDP-R 0 0 8 184 211 218 233 273 250 216 60 0
CPP-Large 10 10 10 10 15 15 14 14 14 14 10 10
CPP-Medium 2 2 2 2 5 6 6 6 6 5 2 2
CPP-Small 1 1 1 1 3 3 4 4 4 3 1 1
DBP 2 2 3 1 4 4 4 4 4 4 3 2
SUB-TOTAL 15 15 27 241 281 288 303 354 329 286 92 15
Demand Response
Aggregator-managed
CBP-DA 3 3 3 2 5 5 6 6 5 5 3 2
CBP-DO 21 23 26 11 47 48 50 50 47 43 28 21
AMP 34 37 41 21 89 90 95 94 90 87 43 32
SUB-TOTAL 58 62 70 33 140 143 151 149 143 135 74 56
SmartConnect®-enabled
SPD with Tech. 2 2 9 17 18 18 20 21 22 21 7 2
SPD without Tech. 4 4 6 11 11 11 11 11 11 10 6 4
SUB-TOTAL 5 5 14 28 29 29 30 31 32 31 13 6
Non-event Based
RTP 0 0 0 -2 0 2 -3 -1 6 -2 -2 0
SMB Non-res. TOU 14 15 17 19 21 21 21 22 20 21 22 15
PLS 0 0 0 0 0 7 8 8 8 0 0 0
SUB-TOTAL 14 15 17 17 21 30 27 29 33 19 20 14
PORTFOLIO TOTAL 747 705 783 995 1,137 1,161 1,185 1,237 1,194 1,087 812 672

Portfolio Aggregate Ex Ante Load Impact Estimates for 1-in-10 SCE-specific System Conditions by Month and Forecast Year
81
Table D-9: 2023 Portfolio Aggregate Ex Ante Load Impact Estimates for 1-in-10 SCE-specific System Conditions
Program Type Program Monthly System Peak
Jan. Feb. Mar. Apr. May Jun. Jul. Aug. Sep. Oct. Nov. Dec.
Emergency
BIP-15 127 117 137 143 128 129 134 136 135 127 131 125
BIP-30 491 456 470 468 469 469 472 473 465 433 444 428
AP-I 37 34 48 65 69 72 69 66 56 55 38 29
SUB-TOTAL 655 607 654 676 666 671 674 675 657 615 613 582
Price-responsive
SDP-C 0 0 3 41 40 39 41 51 49 41 15 0
SDP-R 0 0 8 179 206 213 227 266 244 211 58 0
CPP-Large 11 10 11 10 15 16 14 14 14 15 10 10
CPP-Medium 2 2 2 2 6 6 6 6 6 6 2 2
CPP-Small 1 1 1 1 3 3 4 4 4 3 1 1
DBP 2 2 3 1 4 4 4 4 4 4 3 2
SUB-TOTAL 16 16 28 235 275 281 296 346 321 280 90 15
Demand Response
Aggregator-managed
CBP-DA 3 3 3 2 5 5 6 6 5 5 3 2
CBP-DO 21 23 26 11 47 48 50 50 47 43 28 21
AMP 34 37 41 21 89 90 95 94 90 87 43 32
SUB-TOTAL 58 62 70 33 140 143 151 149 143 135 74 56
SmartConnect®-enabled
SPD with Tech. 2 2 11 21 22 22 24 25 26 25 9 2
SPD without Tech. 4 4 5 10 10 10 10 10 10 10 5 3
SUB-TOTAL 6 6 16 31 33 33 34 35 36 35 14 6
Non-event Based
RTP 0 0 0 -2 0 2 -3 -1 6 -2 -2 0
SMB Non-res. TOU 14 15 17 19 21 21 21 22 20 21 22 15
PLS 0 0 0 0 0 7 8 8 8 0 0 0
SUB-TOTAL 14 15 17 17 21 30 26 29 33 19 20 14
PORTFOLIO TOTAL 748 705 785 993 1,134 1,158 1,182 1,233 1,190 1,084 811 673

Portfolio Aggregate Ex Ante Load Impact Estimates for 1-in-10 SCE-specific System Conditions by Month and Forecast Year
82
Table D-10: 2024 Portfolio Aggregate Ex Ante Load Impact Estimates for 1-in-10 SCE-specific System Conditions
Program Type Program Monthly System Peak
Jan. Feb. Mar. Apr. May Jun. Jul. Aug. Sep. Oct. Nov. Dec.
Emergency
BIP-15 127 117 137 143 128 129 134 136 135 127 131 125
BIP-30 491 456 470 468 469 469 472 473 465 433 444 428
AP-I 37 34 48 65 69 72 69 66 56 55 38 29
SUB-TOTAL 655 607 654 676 666 671 674 675 657 615 613 582
Price-responsive
SDP-C 0 0 3 39 39 38 39 49 47 40 15 0
SDP-R 0 0 7 175 201 208 222 260 238 206 57 0
CPP-Large 11 11 11 10 16 16 15 15 15 15 10 11
CPP-Medium 2 2 2 3 6 6 6 7 7 6 2 2
CPP-Small 1 1 1 1 3 4 4 4 4 3 1 1
DBP 2 2 3 1 4 4 4 4 4 4 3 2
SUB-TOTAL 16 16 28 230 269 276 290 338 314 274 89 16
Demand Response
Aggregator-managed
CBP-DA 3 3 3 2 5 5 6 6 5 5 3 2
CBP-DO 21 23 26 11 47 48 50 50 47 43 28 21
AMP 34 37 41 21 89 90 95 94 90 87 43 32
SUB-TOTAL 58 62 70 33 140 143 151 149 143 135 74 56
SmartConnect®-enabled
SPD with Tech. 2 2 13 25 26 26 27 28 29 27 10 3
SPD without Tech. 3 3 5 10 10 10 10 10 10 10 5 3
SUB-TOTAL 6 6 18 35 36 36 37 38 39 37 15 6
Non-event Based
RTP 0 0 0 -2 0 2 -3 -1 6 -2 -2 0
SMB Non-res. TOU 14 15 17 19 21 21 21 22 20 21 22 15
PLS 0 0 0 0 0 7 8 8 7 0 0 0
SUB-TOTAL 14 15 17 17 21 29 26 28 33 19 20 14
PORTFOLIO TOTAL 748 706 787 991 1,132 1,155 1,178 1,228 1,186 1,081 810 673

Portfolio Aggregate Ex Ante Load Impact Estimates for 1-in-10 SCE-specific System Conditions by Month and Forecast Year
83
Table D-11: 2025 Portfolio Aggregate Ex Ante Load Impact Estimates for 1-in-10 SCE-specific System Conditions
Program Type Program Monthly System Peak
Jan. Feb. Mar. Apr. May Jun. Jul. Aug. Sep. Oct. Nov. Dec.
Emergency
BIP-15 127 117 137 143 128 129 134 136 135 127 131 125
BIP-30 491 456 470 468 469 469 472 473 465 433 444 428
AP-I 37 34 48 65 69 72 69 66 56 55 38 29
SUB-TOTAL 655 607 654 676 666 671 674 675 657 615 613 582
Price-responsive
SDP-C 0 0 3 38 37 37 38 48 46 38 14 0
SDP-R 0 0 7 171 197 203 217 254 233 202 56 0
CPP-Large 11 11 12 11 16 17 15 15 15 16 11 11
CPP-Medium 2 2 2 3 6 6 7 7 7 6 3 2
CPP-Small 1 1 1 1 3 4 4 4 4 3 1 1
DBP 2 2 3 1 4 4 4 4 4 4 3 2
SUB-TOTAL 17 16 28 225 264 271 285 332 308 269 87 16
Demand Response
Aggregator-managed
CBP-DA 3 3 3 2 5 5 6 6 5 5 3 2
CBP-DO 21 23 26 11 47 48 50 50 47 43 28 21
AMP 34 37 41 21 89 90 95 94 90 87 43 32
SUB-TOTAL 58 62 70 33 140 143 151 149 143 135 74 56
SmartConnect®-enabled
SPD with Tech. 3 3 14 27 29 28 30 31 31 30 10 3
SPD without Tech. 3 3 5 10 10 10 10 10 10 10 5 3
SUB-TOTAL 6 6 19 37 38 38 40 41 41 40 16 6
Non-event Based
RTP 0 0 0 -2 0 2 -3 -1 6 -2 -2 0
SMB Non-res. TOU 14 15 17 19 21 21 21 22 20 21 22 15
PLS 0 0 0 0 0 7 7 7 7 0 0 0
SUB-TOTAL 14 15 17 17 21 29 26 28 33 19 20 14
PORTFOLIO TOTAL 749 707 788 989 1,130 1,152 1,175 1,224 1,182 1,078 810 674

Program-specific Aggregate Ex Ante Load Impact Estimates for 1-in-2 SCE-specific System Conditions by Month and Forecast Year
84
Appendix E Program-specific Aggregate Ex Ante Load Impact Estimates for 1-in-2 SCE-specific System Conditions by Month and Forecast Year
Table E-1: 2015 Program-specific Aggregate Ex Ante Load Impact Estimates for 1-in-2 SCE-specific System Conditions
Program Type Program Monthly System Peak
Jan. Feb. Mar. Apr. May Jun. Jul. Aug. Sep. Oct. Nov. Dec.
Emergency
BIP-15 136 125 144 148 139 141 145 148 147 138 138 131
BIP-30 498 479 513 499 512 511 512 513 506 470 467 447
AP-I 33 30 40 56 60 65 64 60 50 48 32 26
SUB-TOTAL 667 634 698 703 711 717 721 721 702 657 637 605
Price-responsive
SDP-C 0 0 0 28 30 35 50 64 59 48 5 0
SDP-R 0 0 0 124 160 186 250 295 273 209 17 0
CPP-Large 15 15 15 16 25 24 22 21 24 22 16 14
CPP-Medium 0 0 0 0 0 0 0 0 0 0 0 0
CPP-Small 0 0 0 0 0 0 0 0 0 0 0 0
DBP 94 89 102 68 99 109 110 110 111 96 99 87
SUB-TOTAL 108 104 118 235 315 354 433 490 467 375 137 101
Demand Response
Aggregator-managed
CBP-DA 3 3 3 2 5 5 6 5 5 5 3 2
CBP-DO 21 23 24 10 45 47 49 49 47 42 26 21
AMP 35 37 38 21 86 88 95 93 89 86 42 32
SUB-TOTAL 59 63 65 32 136 140 149 147 141 133 71 56
SmartConnect®-enabled
SPD with Tech. 0 0 0 1 1 1 2 2 2 2 1 0
SPD without Tech. 9 9 13 24 25 25 25 25 25 24 13 8
SUB-TOTAL 9 9 13 25 26 26 27 27 27 27 14 8
Non-event Based
RTP 0 0 0 0 0 -10 -10 3 -10 0 0 0
SMB Non-res. TOU 14 15 14 19 20 21 22 21 22 20 17 14
PLS 0 0 0 0 0 0 0 0 0 0 0 0
SUB-TOTAL 14 15 15 19 20 12 13 23 13 20 17 14
PORTFOLIO TOTAL 858 824 909 1,014 1,207 1,249 1,343 1,409 1,349 1,212 876 784

Program-specific Aggregate Ex Ante Load Impact Estimates for 1-in-2 SCE-specific System Conditions by Month and Forecast Year
85
Table E-2: 2016 Program-specific Aggregate Ex Ante Load Impact Estimates for 1-in-2 SCE-specific System Conditions
Program Type Program Monthly System Peak
Jan. Feb. Mar. Apr. May Jun. Jul. Aug. Sep. Oct. Nov. Dec.
Emergency
BIP-15 132 121 140 143 135 137 141 143 142 134 133 129
BIP-30 486 466 500 486 499 498 499 500 493 458 455 434
AP-I 34 32 42 58 62 68 66 63 52 51 34 28
SUB-TOTAL 652 619 682 688 696 702 706 707 687 643 623 592
Price-responsive
SDP-C 0 0 0 26 29 34 48 61 56 46 5 0
SDP-R 0 0 0 119 154 179 240 283 262 201 16 0
CPP-Large 15 15 15 16 26 24 23 21 24 22 16 15
CPP-Medium 0 0 0 0 0 0 0 0 0 0 0 0
CPP-Small 0 0 0 0 0 0 0 0 0 0 0 0
DBP 91 87 100 64 93 102 104 104 104 90 93 82
SUB-TOTAL 106 102 115 225 301 339 414 469 447 359 130 96
Demand Response Aggregator-
managed
CBP-DA 3 3 3 2 5 5 6 5 5 5 3 2
CBP-DO 21 23 24 10 45 47 49 49 47 42 26 21
AMP 35 37 38 21 86 88 95 93 89 86 42 32
SUB-TOTAL 59 63 65 32 136 140 149 147 141 133 71 56
SmartConnect®-enabled
SPD with Tech. 0 0 1 2 2 3 3 3 3 3 1 0
SPD without Tech. 8 8 13 24 24 23 23 23 23 23 12 8
SUB-TOTAL 8 8 14 25 26 26 26 27 26 26 14 8
Non-event Based
RTP 0 0 0 0 0 -10 -10 3 -10 0 0 0
SMB Non-res. TOU 14 15 14 19 20 21 22 21 22 20 17 14
PLS 0* 0* 0* 0* 0* 0* 0* 0* 0* 0* 0* 0*
SUB-TOTAL 14 15 15 19 20 12 13 23 13 20 17 14
PORTFOLIO TOTAL 839 807 891 989 1,178 1,218 1,309 1,373 1,314 1,181 854 766
*Load impacts are redacted to protect confidential customer information

Program-specific Aggregate Ex Ante Load Impact Estimates for 1-in-2 SCE-specific System Conditions by Month and Forecast Year
86
Table E-3: 2017 Program-specific Aggregate Ex Ante Load Impact Estimates for 1-in-2 SCE-specific System Conditions
Program Type Program Monthly System Peak
Jan. Feb. Mar. Apr. May Jun. Jul. Aug. Sep. Oct. Nov. Dec.
Emergency
BIP-15 130 119 138 141 132 134 138 141 140 132 131 125
BIP-30 472 453 486 473 485 484 485 487 479 446 443 423
AP-I 36 33 44 62 66 72 70 66 54 53 35 29
SUB-TOTAL 638 606 668 675 683 690 694 693 674 630 609 577
Price-responsive
SDP-C 0 0 0 25 27 32 45 58 54 43 5 0
SDP-R 0 0 0 115 148 172 232 273 253 194 15 0
CPP-Large 15 15 16 16 27 25 23 22 24 23 16 15
CPP-Medium 0 0 0 5 11 12 12 13 12 12 5 4
CPP-Small 0 0 0 3 6 7 7 8 7 6 3 2
DBP 85 81 94 62 91 100 102 102 102 89 91 80
SUB-TOTAL 101 97 110 226 310 348 421 475 452 366 135 102
Demand Response
Aggregator-managed
CBP-DA 3 3 3 2 5 5 6 5 5 5 3 2
CBP-DO 21 23 24 10 45 47 49 49 47 42 26 21
AMP 35 37 38 21 86 88 95 93 89 86 42 32
SUB-TOTAL 59 63 65 32 136 140 149 147 141 133 71 56
SmartConnect®-enabled
SPD with Tech. 0 0 1 3 3 4 5 6 6 5 2 0
SPD without Tech. 8 8 12 23 22 22 22 22 22 22 12 8
SUB-TOTAL 8 8 13 25 26 27 27 28 28 27 14 8
Non-event Based
RTP 0 0 0 0 0 -10 -10 3 -10 0 0 0
SMB Non-res. TOU 14 15 14 19 20 21 22 21 22 20 17 14
PLS 0 0 0 0 0 4 5 5 5 0 0 0
SUB-TOTAL 14 15 15 19 20 16 17 28 17 20 17 14
PORTFOLIO TOTAL 820 789 871 977 1,175 1,220 1,309 1,372 1,312 1,177 846 756

Program-specific Aggregate Ex Ante Load Impact Estimates for 1-in-2 SCE-specific System Conditions by Month and Forecast Year
87
Table E-4: 2018 Program-specific Aggregate Ex Ante Load Impact Estimates for 1-in-2 SCE-specific System Conditions
Program Type Program Monthly System Peak
Jan. Feb. Mar. Apr. May Jun. Jul. Aug. Sep. Oct. Nov. Dec.
Emergency
BIP-15 126 116 133 136 128 130 134 137 136 128 129 125
BIP-30 460 441 473 460 472 471 472 474 466 434 437 423
AP-I 37 34 45 62 67 72 70 66 54 52 35 29
SUB-TOTAL 623 591 651 659 667 673 676 676 656 614 601 577
Price-responsive
SDP-C 0 0 0 24 26 30 43 55 51 41 5 0
SDP-R 0 0 0 111 143 166 224 264 244 187 15 0
CPP-Large 16 16 16 17 27 26 24 23 25 23 17 16
CPP-Medium 4 4 4 2 4 5 5 5 5 5 2 2
CPP-Small 2 2 2 1 2 3 3 3 3 3 1 1
DBP 85 81 94 62 91 100 102 102 102 89 91 80
SUB-TOTAL 108 104 117 217 294 330 400 451 430 348 130 98
Demand Response
Aggregator-managed
CBP-DA 3 3 3 2 5 5 6 5 5 5 3 2
CBP-DO 21 23 24 10 45 47 49 49 47 42 26 21
AMP 35 37 38 21 86 88 95 93 89 86 42 32
SUB-TOTAL 59 63 65 32 136 140 149 147 141 133 71 56
SmartConnect®-enabled
SPD with Tech. 0 0 2 5 6 7 8 10 9 9 3 1
SPD without Tech. 8 8 12 22 22 22 22 22 21 21 11 7
SUB-TOTAL 8 8 14 26 27 28 30 31 31 30 14 8
Non-event Based
RTP 0 0 0 0 0 -10 -10 3 -10 0 0 0
SMB Non-res. TOU 14 15 14 19 20 21 22 21 22 20 17 14
PLS 0 0 0 0 0 7 8 8 7 0 0 0
SUB-TOTAL 14 15 15 19 20 19 20 31 20 20 17 14
PORTFOLIO TOTAL 812 781 862 953 1,144 1,190 1,276 1,336 1,278 1,144 834 753

Program-specific Aggregate Ex Ante Load Impact Estimates for 1-in-2 SCE-specific System Conditions by Month and Forecast Year
88
Table E-5: 2019 Program-specific Aggregate Ex Ante Load Impact Estimates for 1-in-2 SCE-specific System Conditions
Program Type Program Monthly System Peak
Jan. Feb. Mar. Apr. May Jun. Jul. Aug. Sep. Oct. Nov. Dec.
Emergency
BIP-15 126 116 133 136 128 130 134 137 136 128 129 125
BIP-30 460 441 473 460 472 471 472 474 466 434 437 423
AP-I 37 34 45 62 67 72 70 66 54 52 35 29
SUB-TOTAL 623 591 651 659 667 673 676 676 656 614 601 577
Price-responsive
SDP-C 0 0 0 23 25 29 41 52 49 39 4 0
SDP-R 0 0 0 107 138 161 216 255 236 181 14 0
CPP-Large 16 16 17 17 28 27 25 24 26 24 17 16
CPP-Medium 2 2 2 2 4 5 5 5 5 5 2 2
CPP-Small 1 1 1 1 2 3 3 3 3 3 1 1
DBP 85 81 94 62 91 100 102 102 102 89 91 80
SUB-TOTAL 104 100 114 213 289 324 392 441 421 341 130 99
Demand Response
Aggregator-managed
CBP-DA 3 3 3 2 5 5 6 5 5 5 3 2
CBP-DO 21 23 24 10 45 47 49 49 47 42 26 21
AMP 35 37 38 21 86 88 95 93 89 86 42 32
SUB-TOTAL 59 63 65 32 136 140 149 147 141 133 71 56
SmartConnect®-enabled
SPD with Tech. 1 1 3 8 9 10 12 14 13 12 4 1
SPD without Tech. 7 7 11 21 21 21 21 21 20 20 11 7
SUB-TOTAL 8 8 14 28 30 31 33 34 34 33 15 8
Non-event Based
RTP 0 0 0 0 0 -10 -10 3 -10 0 0 0
SMB Non-res. TOU 14 15 14 19 20 21 22 21 22 20 17 14
PLS 0 0 0 0 0 7 8 8 7 0 0 0
SUB-TOTAL 14 15 15 19 20 19 20 31 20 20 17 14
PORTFOLIO TOTAL 808 777 859 951 1,142 1,187 1,271 1,329 1,271 1,140 835 754

Program-specific Aggregate Ex Ante Load Impact Estimates for 1-in-2 SCE-specific System Conditions by Month and Forecast Year
89
Table E-6: 2020 Program-specific Aggregate Ex Ante Load Impact Estimates for 1-in-2 SCE-specific System Conditions
Program Type Program Monthly System Peak
Jan. Feb. Mar. Apr. May Jun. Jul. Aug. Sep. Oct. Nov. Dec.
Emergency
BIP-15 126 116 133 136 128 130 134 137 136 128 129 125
BIP-30 460 441 473 460 472 471 472 474 466 434 437 423
AP-I 37 34 45 62 67 72 70 66 54 52 35 29
SUB-TOTAL 623 591 651 659 667 673 676 676 656 614 601 577
Price-responsive
SDP-C 0 0 0 22 24 28 39 50 46 38 4 0
SDP-R 0 0 0 104 134 156 210 247 229 175 14 0
CPP-Large 17 17 17 18 29 28 26 24 27 25 18 17
CPP-Medium 2 2 2 2 5 5 5 6 5 5 2 2
CPP-Small 1 1 1 1 3 3 3 3 3 3 1 1
DBP 85 81 94 62 91 100 102 102 102 89 91 80
SUB-TOTAL 105 101 114 209 285 319 385 432 413 334 130 99
Demand Response
Aggregator-managed
CBP-DA 3 3 3 2 5 5 6 5 5 5 3 2
CBP-DO 21 23 24 10 45 47 49 49 47 42 26 21
AMP 35 37 38 21 86 88 95 93 89 86 42 32
SUB-TOTAL 59 63 65 32 136 140 149 147 141 133 71 56
SmartConnect®-enabled
SPD with Tech. 1 1 5 11 12 14 16 19 18 17 6 1
SPD without Tech. 7 7 11 20 20 20 20 20 20 20 11 7
SUB-TOTAL 8 8 15 31 32 34 36 39 38 36 16 8
Non-event Based
RTP 0 0 0 0 0 -10 -10 3 -10 0 0 0
SMB Non-res. TOU 14 15 14 19 20 21 22 21 22 20 17 14
PLS 0 0 0 0 0 7 8 8 7 0 0 0
SUB-TOTAL 14 15 15 19 20 19 20 31 20 20 17 14
PORTFOLIO TOTAL 809 778 861 950 1,140 1,185 1,267 1,324 1,267 1,137 836 754

Program-specific Aggregate Ex Ante Load Impact Estimates for 1-in-2 SCE-specific System Conditions by Month and Forecast Year
90
Table E-7: 2021 Program-specific Aggregate Ex Ante Load Impact Estimates for 1-in-2 SCE-specific System Conditions
Program Type Program Monthly System Peak
Jan. Feb. Mar. Apr. May Jun. Jul. Aug. Sep. Oct. Nov. Dec.
Emergency
BIP-15 126 116 133 136 128 130 134 137 136 128 129 125
BIP-30 460 441 473 460 472 471 472 474 466 434 437 423
AP-I 37 34 45 62 67 72 70 66 54 52 35 29
SUB-TOTAL 623 591 651 659 667 673 676 676 656 614 601 577
Price-responsive
SDP-C 0 0 0 21 23 27 38 48 44 36 4 0
SDP-R 0 0 0 101 130 151 204 240 222 170 13 0
CPP-Large 17 17 18 18 30 29 26 25 28 26 19 17
CPP-Medium 2 2 2 2 5 5 5 6 5 5 2 2
CPP-Small 1 1 1 1 3 3 3 3 3 3 1 1
DBP 85 81 94 62 91 100 102 102 102 89 91 80
SUB-TOTAL 106 102 115 206 282 315 378 424 405 329 131 100
Demand Response
Aggregator-managed
CBP-DA 3 3 3 2 5 5 6 5 5 5 3 2
CBP-DO 21 23 24 10 45 47 49 49 47 42 26 21
AMP 35 37 38 21 86 88 95 93 89 86 42 32
SUB-TOTAL 59 63 65 32 136 140 149 147 141 133 71 56
SmartConnect®-enabled
SPD with Tech. 1 1 6 15 17 19 22 25 24 22 8 1
SPD without Tech. 7 7 10 19 19 19 19 19 19 19 10 7
SUB-TOTAL 8 8 17 34 36 38 41 44 43 41 18 8
Non-event Based
RTP 0 0 0 0 0 -10 -10 3 -10 0 0 0
SMB Non-res. TOU 14 15 14 19 20 21 22 21 22 20 17 14
PLS 0 0 0 0 0 7 8 8 7 0 0 0
SUB-TOTAL 14 15 15 19 20 19 20 31 20 20 17 14
PORTFOLIO TOTAL 809 778 863 950 1,140 1,184 1,265 1,322 1,265 1,137 837 755

Program-specific Aggregate Ex Ante Load Impact Estimates for 1-in-2 SCE-specific System Conditions by Month and Forecast Year
91
Table E-8: 2022 Program-specific Aggregate Ex Ante Load Impact Estimates for 1-in-2 SCE-specific System Conditions
Program Type Program Monthly System Peak
Jan. Feb. Mar. Apr. May Jun. Jul. Aug. Sep. Oct. Nov. Dec.
Emergency
BIP-15 126 116 133 136 128 130 134 137 136 128 129 125
BIP-30 460 441 473 460 472 471 472 474 466 434 437 423
AP-I 37 34 45 62 67 72 70 66 54 52 35 29
SUB-TOTAL 623 591 651 659 667 673 676 676 656 614 601 577
Price-responsive
SDP-C 0 0 0 20 22 25 36 46 43 35 4 0
SDP-R 0 0 0 98 127 147 198 234 216 166 13 0
CPP-Large 18 18 18 19 31 30 27 26 29 27 19 18
CPP-Medium 2 2 2 2 5 5 6 6 6 5 2 2
CPP-Small 1 1 1 1 3 3 3 3 3 3 1 1
DBP 85 81 94 62 91 100 102 102 102 89 91 80
SUB-TOTAL 106 102 115 203 278 311 372 417 399 324 131 101
Demand Response
Aggregator-managed
CBP-DA 3 3 3 2 5 5 6 5 5 5 3 2
CBP-DO 21 23 24 10 45 47 49 49 47 42 26 21
AMP 35 37 38 21 86 88 95 93 89 86 42 32
SUB-TOTAL 59 63 65 32 136 140 149 147 141 133 71 56
SmartConnect®-enabled
SPD with Tech. 1 1 8 19 21 24 27 31 29 27 10 2
SPD without Tech. 7 7 10 19 19 19 19 19 19 18 10 6
SUB-TOTAL 8 8 18 38 40 43 46 50 48 46 19 8
Non-event Based
RTP 0 0 0 0 0 -10 -10 3 -10 0 0 0
SMB Non-res. TOU 14 15 14 19 20 21 22 21 22 20 17 14
PLS 0 0 0 0 0 7 8 8 7 0 0 0
SUB-TOTAL 14 15 15 19 20 19 20 31 20 20 17 14
PORTFOLIO TOTAL 810 779 865 951 1,141 1,185 1,264 1,320 1,263 1,136 839 756
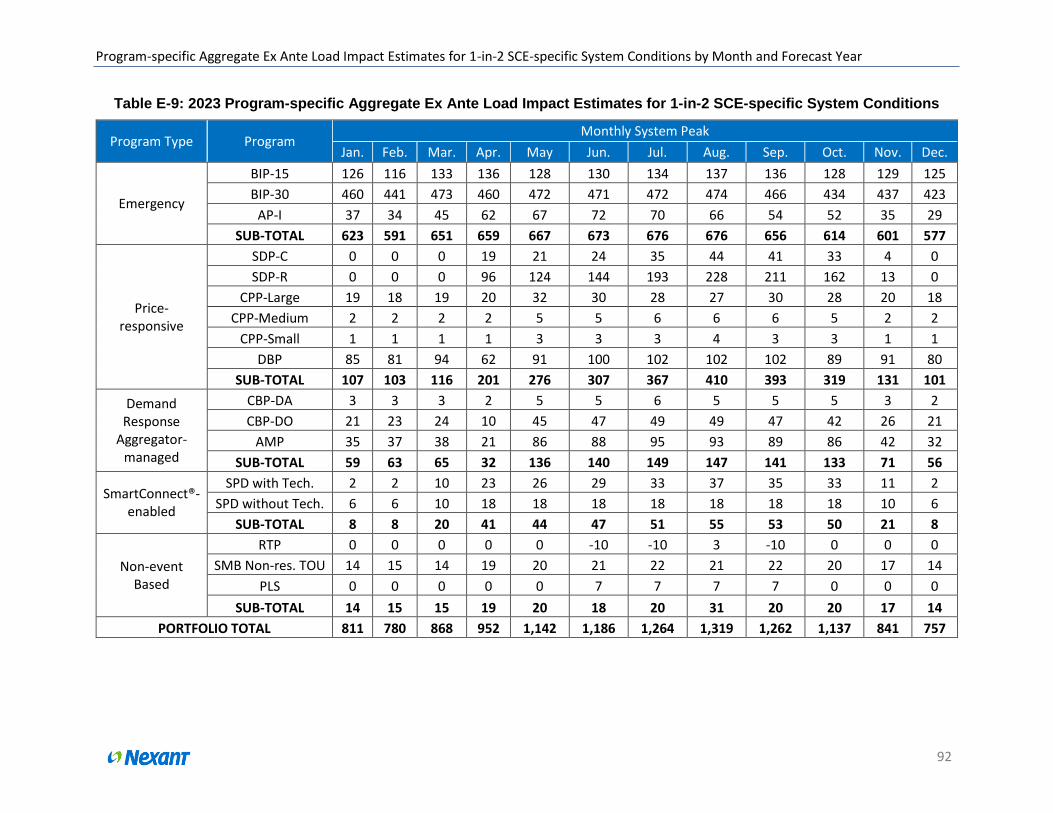
Program-specific Aggregate Ex Ante Load Impact Estimates for 1-in-2 SCE-specific System Conditions by Month and Forecast Year
92
Table E-9: 2023 Program-specific Aggregate Ex Ante Load Impact Estimates for 1-in-2 SCE-specific System Conditions
Program Type Program Monthly System Peak
Jan. Feb. Mar. Apr. May Jun. Jul. Aug. Sep. Oct. Nov. Dec.
Emergency
BIP-15 126 116 133 136 128 130 134 137 136 128 129 125
BIP-30 460 441 473 460 472 471 472 474 466 434 437 423
AP-I 37 34 45 62 67 72 70 66 54 52 35 29
SUB-TOTAL 623 591 651 659 667 673 676 676 656 614 601 577
Price-responsive
SDP-C 0 0 0 19 21 24 35 44 41 33 4 0
SDP-R 0 0 0 96 124 144 193 228 211 162 13 0
CPP-Large 19 18 19 20 32 30 28 27 30 28 20 18
CPP-Medium 2 2 2 2 5 5 6 6 6 5 2 2
CPP-Small 1 1 1 1 3 3 3 4 3 3 1 1
DBP 85 81 94 62 91 100 102 102 102 89 91 80
SUB-TOTAL 107 103 116 201 276 307 367 410 393 319 131 101
Demand Response
Aggregator-managed
CBP-DA 3 3 3 2 5 5 6 5 5 5 3 2
CBP-DO 21 23 24 10 45 47 49 49 47 42 26 21
AMP 35 37 38 21 86 88 95 93 89 86 42 32
SUB-TOTAL 59 63 65 32 136 140 149 147 141 133 71 56
SmartConnect®-enabled
SPD with Tech. 2 2 10 23 26 29 33 37 35 33 11 2
SPD without Tech. 6 6 10 18 18 18 18 18 18 18 10 6
SUB-TOTAL 8 8 20 41 44 47 51 55 53 50 21 8
Non-event Based
RTP 0 0 0 0 0 -10 -10 3 -10 0 0 0
SMB Non-res. TOU 14 15 14 19 20 21 22 21 22 20 17 14
PLS 0 0 0 0 0 7 7 7 7 0 0 0
SUB-TOTAL 14 15 15 19 20 18 20 31 20 20 17 14
PORTFOLIO TOTAL 811 780 868 952 1,142 1,186 1,264 1,319 1,262 1,137 841 757

Program-specific Aggregate Ex Ante Load Impact Estimates for 1-in-2 SCE-specific System Conditions by Month and Forecast Year
93
Table E-10: 2024 Program-specific Aggregate Ex Ante Load Impact Estimates for 1-in-2 SCE-specific System Conditions
Program Type Program Monthly System Peak
Jan. Feb. Mar. Apr. May Jun. Jul. Aug. Sep. Oct. Nov. Dec.
Emergency
BIP-15 126 116 133 136 128 130 134 137 136 128 129 125
BIP-30 460 441 473 460 472 471 472 474 466 434 437 423
AP-I 37 34 45 62 67 72 70 66 54 52 35 29
SUB-TOTAL 623 591 651 659 667 673 676 676 656 614 601 577
Price-responsive
SDP-C 0 0 0 19 20 24 34 43 40 32 4 0
SDP-R 0 0 0 93 121 140 189 223 206 158 12 0
CPP-Large 19 19 20 20 33 31 29 28 31 28 20 19
CPP-Medium 2 2 2 2 5 6 6 6 6 6 2 2
CPP-Small 1 1 1 1 3 3 3 4 3 3 1 1
DBP 85 81 94 62 91 100 102 102 102 89 91 80
SUB-TOTAL 108 104 117 198 273 304 363 404 388 316 131 102
Demand Response
Aggregator-managed
CBP-DA 3 3 3 2 5 5 6 5 5 5 3 2
CBP-DO 21 23 24 10 45 47 49 49 47 42 26 21
AMP 35 37 38 21 86 88 95 93 89 86 42 32
SUB-TOTAL 59 63 65 32 136 140 149 147 141 133 71 56
SmartConnect®-enabled
SPD with Tech. 2 2 12 27 30 33 37 41 38 36 13 2
SPD without Tech. 6 6 9 18 18 18 18 18 18 17 9 6
SUB-TOTAL 8 8 22 45 48 51 55 59 56 54 22 8
Non-event Based
RTP 0 0 0 0 0 -10 -10 3 -10 0 0 0
SMB Non-res. TOU 14 15 14 19 20 21 22 21 22 20 17 14
PLS 0 0 0 0 0 7 7 7 7 0 0 0
SUB-TOTAL 14 15 15 19 20 18 20 31 20 20 17 14
PORTFOLIO TOTAL 812 781 870 953 1,143 1,186 1,263 1,317 1,260 1,136 842 757

Program-specific Aggregate Ex Ante Load Impact Estimates for 1-in-2 SCE-specific System Conditions by Month and Forecast Year
94
Table E-11: 2025 Program-specific Aggregate Ex Ante Load Impact Estimates for 1-in-2 SCE-specific System Conditions
Program Type Program Monthly System Peak
Jan. Feb. Mar. Apr. May Jun. Jul. Aug. Sep. Oct. Nov. Dec.
Emergency
BIP-15 126 116 133 136 128 130 134 137 136 128 129 125
BIP-30 460 441 473 460 472 471 472 474 466 434 437 423
AP-I 37 34 45 62 67 72 70 66 54 52 35 29
SUB-TOTAL 623 591 651 659 667 673 676 676 656 614 601 577
Price-responsive
SDP-C 0 0 0 18 20 23 32 41 38 31 4 0
SDP-R 0 0 0 91 118 137 185 218 201 154 12 0
CPP-Large 20 20 20 21 34 32 30 28 32 29 21 19
CPP-Medium 2 2 2 2 5 6 6 7 6 6 2 2
CPP-Small 1 1 1 1 3 3 4 4 3 3 1 1
DBP 85 81 94 62 91 100 102 102 102 89 91 80
SUB-TOTAL 108 104 118 196 271 302 359 399 383 312 132 103
Demand Response
Aggregator-managed
CBP-DA 3 3 3 2 5 5 6 5 5 5 3 2
CBP-DO 21 23 24 10 45 47 49 49 47 42 26 21
AMP 35 37 38 21 86 88 95 93 89 86 42 32
SUB-TOTAL 59 63 65 32 136 140 149 147 141 133 71 56
SmartConnect®-enabled
SPD with Tech. 2 2 14 30 33 37 41 46 42 40 14 3
SPD without Tech. 6 6 9 17 17 17 17 17 17 17 9 6
SUB-TOTAL 8 8 23 47 50 54 58 63 59 57 23 8
Non-event Based
RTP 0 0 0 0 0 -10 -10 3 -10 0 0 0
SMB Non-res. TOU 14 15 14 19 20 21 22 21 22 20 17 14
PLS 0 0 0 0 0 6 7 7 7 0 0 0
SUB-TOTAL 14 15 15 19 20 18 19 30 19 20 17 14
PORTFOLIO TOTAL 813 782 872 954 1,144 1,187 1,262 1,315 1,259 1,136 844 758

Program-specific Ex Ante Load Impact Estimates for 1-in-10 SCE-specific System Conditions by Month and Forecast Year
95
Appendix F Program-specific Ex Ante Load Impact Estimates for 1-in-10 SCE-specific System Conditions by Month and Forecast Year
Table F-1: 2015 Program-specific Aggregate Ex Ante Load Impact Estimates for 1-in-10 SCE-specific System Conditions
Program Type Program Monthly System Peak
Jan. Feb. Mar. Apr. May Jun. Jul. Aug. Sep. Oct. Nov. Dec.
Emergency
BIP-15 137 127 148 155 138 140 145 147 147 138 140 131
BIP-30 532 495 509 507 508 509 511 513 505 470 475 452
AP-I 33 30 43 59 62 65 62 60 51 51 35 26
SUB-TOTAL 702 652 700 720 709 714 719 720 702 658 649 610
Price-responsive
SDP-C 0 0 5 59 58 57 59 74 71 59 22 0
SDP-R 0 0 10 232 267 275 294 344 315 273 76 0
CPP-Large 15 15 15 14 22 22 21 20 20 21 15 14
CPP-Medium 0 0 0 0 0 0 0 0 0 0 0 0
CPP-Small 0 0 0 0 0 0 0 0 0 0 0 0
DBP 93 89 102 69 98 108 111 110 111 96 100 88
SUB-TOTAL 108 103 131 374 444 463 483 549 518 450 212 102
Demand Response Aggregator-managed
CBP-DA 3 3 3 2 5 5 6 6 5 5 3 2
CBP-DO 21 23 26 11 47 48 50 50 47 43 28 21
AMP 34 37 41 21 89 90 95 94 90 87 43 32
SUB-TOTAL 58 62 70 33 140 143 151 149 143 135 74 56
SmartConnect®-enabled
SPD with Tech. 0 0 0 1 1 2 2 2 3 2 1 0
SPD without Tech. 9 9 13 25 25 25 26 25 25 25 13 8
SUB-TOTAL 9 9 14 26 26 27 28 28 28 27 14 9
Non-event Based
RTP 0 0 0 12 0 -10 23 3 29 12 8 0
SMB Non-res. TOU 14 15 17 19 21 21 21 22 20 21 22 15
PLS 0 0 0 0 0 0 0 0 0 0 0 0
SUB-TOTAL 15 16 17 31 21 11 44 24 49 32 30 15
PORTFOLIO TOTAL 891 841 932 1,185 1,341 1,359 1,425 1,469 1,440 1,302 979 791

Program-specific Ex Ante Load Impact Estimates for 1-in-10 SCE-specific System Conditions by Month and Forecast Year
96
Table F-2: 2016 Program-specific Aggregate Ex Ante Load Impact Estimates for 1-in-10 SCE-specific System Conditions
Program Type Program Monthly System Peak
Jan. Feb. Mar. Apr. May Jun. Jul. Aug. Sep. Oct. Nov
. Dec
.
Emergency
BIP-15 133 123 144 150 134 136 140 143 142 133 135 129
BIP-30 519 482 496 494 495 496 498 500 492 458 463 439
AP-I 34 31 44 61 65 68 65 63 54 53 37 28
SUB-TOTAL 686 637 684 705 694 700 704 706 688 645 634 596
Price-responsive
SDP-C 0 0 4 56 55 54 56 70 68 56 21 0
SDP-R 0 0 9 223 256 265 282 331 303 262 73 0
CPP-Large 15 15 15 14 22 23 21 20 20 21 15 15
CPP-Medium 0 0 0 0 0 0 0 0 0 0 0 0
CPP-Small 0 0 0 0 0 0 0 0 0 0 0 0
DBP 90 86 100 65 92 102 104 104 104 91 94 83
SUB-TOTAL 105 101 129 358 425 443 462 525 495 430 202 97
Demand Response Aggregator-
managed
CBP-DA 3 3 3 2 5 5 6 6 5 5 3 2
CBP-DO 21 23 26 11 47 48 50 50 47 43 28 21
AMP 34 37 41 21 89 90 95 94 90 87 43 32
SUB-TOTAL 58 62 70 33 140 143 151 149 143 135 74 56
SmartConnect®-enabled
SPD with Tech. 0 0 1 2 3 3 3 4 4 3 1 0
SPD without Tech. 8 8 13 24 24 24 24 24 23 23 13 8
SUB-TOTAL 9 9 14 26 27 27 27 27 27 27 14 8
Non-event Based
RTP 0 0 0 12 0 -10 23 3 29 12 8 0
SMB Non-res. TOU 14 15 17 19 21 21 21 22 20 21 22 15
PLS 0* 0* 0* 0* 0* 0* 0* 0* 0* 0* 0* 0*
SUB-TOTAL 15 16 17 31 21 11 44 24 49 32 30 15
PORTFOLIO TOTAL 872 823 914 1,15
4 1,30
7 1,32
4 1,38
9 1,43
1 1,40
3 1,26
9 954 772
*Load impacts are redacted to protect confidential customer information

Program-specific Ex Ante Load Impact Estimates for 1-in-10 SCE-specific System Conditions by Month and Forecast Year
97

Program-specific Ex Ante Load Impact Estimates for 1-in-10 SCE-specific System Conditions by Month and Forecast Year
98
Table F-3: 2017 Program-specific Aggregate Ex Ante Load Impact Estimates for 1-in-10 SCE-specific System Conditions
Program Type Program Monthly System Peak
Jan. Feb. Mar. Apr. May Jun. Jul. Aug. Sep. Oct. Nov. Dec.
Emergency
BIP-15 131 121 141 148 132 134 138 141 140 131 133 125
BIP-30 504 469 483 481 481 482 485 486 478 445 450 428
AP-I 36 33 47 64 68 72 69 66 56 56 38 29
SUB-TOTAL 671 623 671 692 682 688 691 692 674 632 621 582
Price-responsive
SDP-C 0 0 4 53 52 51 53 66 64 53 20 0
SDP-R 0 0 9 215 247 255 272 319 292 253 70 0
CPP-Large 16 15 16 15 23 23 21 21 21 22 15 15
CPP-Medium 0 0 0 5 12 13 13 14 13 12 5 4
CPP-Small 0 0 0 3 7 7 8 8 8 7 3 2
DBP 85 81 94 64 90 100 102 102 102 89 92 81
SUB-TOTAL 100 96 123 355 430 449 469 530 501 436 205 103
Demand Response
Aggregator-managed
CBP-DA 3 3 3 2 5 5 6 6 5 5 3 2
CBP-DO 21 23 26 11 47 48 50 50 47 43 28 21
AMP 34 37 41 21 89 90 95 94 90 87 43 32
SUB-TOTAL 58 62 70 33 140 143 151 149 143 135 74 56
SmartConnect®-enabled
SPD with Tech. 0 0 1 3 4 5 5 6 7 6 2 0
SPD without Tech. 8 8 12 23 23 23 23 23 22 22 12 8
SUB-TOTAL 8 8 13 26 27 27 28 29 29 28 14 8
Non-event Based
RTP 0 0 0 12 0 -10 23 3 29 12 8 0
SMB Non-res. TOU 14 15 17 19 21 21 21 22 20 21 22 15
PLS 0 0 0 0 0 5 5 5 5 0 0 0
SUB-TOTAL 15 16 17 31 21 16 50 29 54 32 30 15
PORTFOLIO TOTAL 852 805 894 1,138 1,301 1,323 1,389 1,429 1,401 1,263 943 763

Program-specific Ex Ante Load Impact Estimates for 1-in-10 SCE-specific System Conditions by Month and Forecast Year
99
Table F-4: 2018 Program-specific Aggregate Ex Ante Load Impact Estimates for 1-in-10 SCE-specific System Conditions
Program Type Program Monthly System Peak
Jan. Feb. Mar. Apr. May Jun. Jul. Aug. Sep. Oct. Nov. Dec.
Emergency
BIP-15 127 117 137 143 128 129 134 136 135 127 131 125
BIP-30 491 456 470 468 469 469 472 473 465 433 444 428
AP-I 37 34 48 65 69 72 69 66 56 55 38 29
SUB-TOTAL 655 607 654 676 666 671 674 675 657 615 613 582
Price-responsive
SDP-C 0 0 4 51 50 49 50 63 61 51 19 0
SDP-R 0 0 9 207 238 246 263 308 282 244 68 0
CPP-Large 16 16 16 15 23 24 22 22 22 22 15 16
CPP-Medium 4 4 4 2 5 5 5 5 5 5 2 2
CPP-Small 2 2 2 1 3 3 3 3 3 3 1 1
DBP 85 81 94 64 90 100 102 102 102 89 92 81
SUB-TOTAL 107 103 130 340 409 427 445 503 475 414 197 99
Demand Response
Aggregator-managed
CBP-DA 3 3 3 2 5 5 6 6 5 5 3 2
CBP-DO 21 23 26 11 47 48 50 50 47 43 28 21
AMP 34 37 41 21 89 90 95 94 90 87 43 32
SUB-TOTAL 58 62 70 33 140 143 151 149 143 135 74 56
SmartConnect®-enabled
SPD with Tech. 0 0 2 6 7 8 9 10 11 9 3 1
SPD without Tech. 8 8 12 22 22 22 22 22 22 21 12 7
SUB-TOTAL 8 8 14 28 29 29 31 32 32 31 14 8
Non-event Based
RTP 0 0 0 12 0 -10 23 3 29 12 8 0
SMB Non-res. TOU 14 15 17 19 21 21 21 22 20 21 22 15
PLS 0 0 0 0 0 8 8 8 8 0 0 0
SUB-TOTAL 15 16 17 31 21 19 53 32 57 32 30 15
PORTFOLIO TOTAL 842 796 885 1,108 1,265 1,289 1,354 1,390 1,365 1,227 928 759

Program-specific Ex Ante Load Impact Estimates for 1-in-10 SCE-specific System Conditions by Month and Forecast Year
100
Table F-5: 2019 Program-specific Aggregate Ex Ante Load Impact Estimates for 1-in-10 SCE-specific System Conditions
Program Type Program Monthly System Peak
Jan. Feb. Mar. Apr. May Jun. Jul. Aug. Sep. Oct. Nov. Dec.
Emergency
BIP-15 127 117 137 143 128 129 134 136 135 127 131 125
BIP-30 491 456 470 468 469 469 472 473 465 433 444 428
AP-I 37 34 48 65 69 72 69 66 56 55 38 29
SUB-TOTAL 655 607 654 676 666 671 674 675 657 615 613 582
Price-responsive
SDP-C 0 0 4 48 47 46 48 60 58 49 18 0
SDP-R 0 0 8 201 231 238 254 298 273 236 65 0
CPP-Large 17 16 17 16 24 25 23 22 22 23 16 16
CPP-Medium 2 2 2 2 5 5 5 6 6 5 2 2
CPP-Small 1 1 1 1 3 3 3 3 3 3 1 1
DBP 85 81 94 64 90 100 102 102 102 89 92 81
SUB-TOTAL 104 100 126 332 400 417 435 491 464 404 194 100
Demand Response
Aggregator-managed
CBP-DA 3 3 3 2 5 5 6 6 5 5 3 2
CBP-DO 21 23 26 11 47 48 50 50 47 43 28 21
AMP 34 37 41 21 89 90 95 94 90 87 43 32
SUB-TOTAL 58 62 70 33 140 143 151 149 143 135 74 56
SmartConnect®-enabled
SPD with Tech. 1 1 3 9 11 12 13 15 15 13 4 1
SPD without Tech. 7 7 11 21 21 21 21 21 21 20 11 7
SUB-TOTAL 8 8 14 30 32 33 34 35 36 34 15 8
Non-event Based
RTP 0 0 0 12 0 -10 23 3 29 12 8 0
SMB Non-res. TOU 14 15 17 19 21 21 21 22 20 21 22 15
PLS 0 0 0 0 0 8 8 8 8 0 0 0
SUB-TOTAL 15 16 17 31 21 19 53 32 57 32 30 15
PORTFOLIO TOTAL 839 793 881 1,102 1,259 1,283 1,347 1,382 1,357 1,221 926 760

Program-specific Ex Ante Load Impact Estimates for 1-in-10 SCE-specific System Conditions by Month and Forecast Year
101
Table F-6: 2020 Program-specific Aggregate Ex Ante Load Impact Estimates for 1-in-10 SCE-specific System Conditions
Program Type Program Monthly System Peak
Jan. Feb. Mar. Apr. May Jun. Jul. Aug. Sep. Oct. Nov. Dec.
Emergency
BIP-15 127 117 137 143 128 129 134 136 135 127 131 125
BIP-30 491 456 470 468 469 469 472 473 465 433 444 428
AP-I 37 34 48 65 69 72 69 66 56 55 38 29
SUB-TOTAL 655 607 654 676 666 671 674 675 657 615 613 582
Price-responsive
SDP-C 0 0 4 46 45 44 46 58 56 46 17 0
SDP-R 0 0 8 194 224 231 246 289 264 229 63 0
CPP-Large 17 17 18 16 25 26 23 23 23 24 16 17
CPP-Medium 2 2 2 2 5 5 6 6 6 5 2 2
CPP-Small 1 1 1 1 3 3 3 3 3 3 1 1
DBP 85 81 94 64 90 100 102 102 102 89 92 81
SUB-TOTAL 104 100 126 324 392 409 426 480 454 396 192 100
Demand Response
Aggregator-managed
CBP-DA 3 3 3 2 5 5 6 6 5 5 3 2
CBP-DO 21 23 26 11 47 48 50 50 47 43 28 21
AMP 34 37 41 21 89 90 95 94 90 87 43 32
SUB-TOTAL 58 62 70 33 140 143 151 149 143 135 74 56
SmartConnect®-enabled
SPD with Tech. 1 1 4 13 15 16 18 20 21 18 5 1
SPD without Tech. 7 7 11 20 20 20 20 20 20 20 11 7
SUB-TOTAL 8 8 15 33 35 36 38 40 41 38 16 8
Non-event Based
RTP 0 0 0 12 0 -10 23 3 29 12 8 0
SMB Non-res. TOU 14 15 17 19 21 21 21 22 20 21 22 15
PLS 0 0 0 0 0 8 8 8 8 0 0 0
SUB-TOTAL 15 16 17 31 21 19 53 32 57 32 30 15
PORTFOLIO TOTAL 839 793 882 1,097 1,254 1,278 1,343 1,376 1,352 1,217 925 761

Program-specific Ex Ante Load Impact Estimates for 1-in-10 SCE-specific System Conditions by Month and Forecast Year
102
Table F-7: 2021 Program-specific Aggregate Ex Ante Load Impact Estimates for 1-in-10 SCE-specific System Conditions
Program Type Program Monthly System Peak
Jan. Feb. Mar. Apr. May Jun. Jul. Aug. Sep. Oct. Nov. Dec.
Emergency
BIP-15 127 117 137 143 128 129 134 136 135 127 131 125
BIP-30 491 456 470 468 469 469 472 473 465 433 444 428
AP-I 37 34 48 65 69 72 69 66 56 55 38 29
SUB-TOTAL 655 607 654 676 666 671 674 675 657 615 613 582
Price-responsive
SDP-C 0 0 4 44 43 42 44 55 53 44 16 0
SDP-R 0 0 8 189 217 224 239 280 257 222 62 0
CPP-Large 18 17 18 17 26 26 24 24 24 25 17 17
CPP-Medium 2 2 2 2 5 6 6 6 6 5 2 2
CPP-Small 1 1 1 1 3 3 3 4 4 3 1 1
DBP 85 81 94 64 90 100 102 102 102 89 92 81
SUB-TOTAL 105 101 126 317 384 402 419 471 446 389 190 101
Demand Response
Aggregator-managed
CBP-DA 3 3 3 2 5 5 6 6 5 5 3 2
CBP-DO 21 23 26 11 47 48 50 50 47 43 28 21
AMP 34 37 41 21 89 90 95 94 90 87 43 32
SUB-TOTAL 58 62 70 33 140 143 151 149 143 135 74 56
SmartConnect®-enabled
SPD with Tech. 1 1 6 18 20 21 24 26 27 24 7 2
SPD without Tech. 7 7 11 20 20 19 19 19 19 19 10 7
SUB-TOTAL 8 8 16 37 40 41 44 46 47 43 17 9
Non-event Based
RTP 0 0 0 12 0 -10 23 3 29 12 8 0
SMB Non-res. TOU 14 15 17 19 21 21 21 22 20 21 22 15
PLS 0 0 0 0 0 7 8 8 8 0 0 0
SUB-TOTAL 15 16 17 31 21 19 52 32 57 32 30 15
PORTFOLIO TOTAL 840 794 884 1,095 1,251 1,276 1,340 1,372 1,349 1,214 924 762

Program-specific Ex Ante Load Impact Estimates for 1-in-10 SCE-specific System Conditions by Month and Forecast Year
103
Table F-8: 2022 Program-specific Aggregate Ex Ante Load Impact Estimates for 1-in-10 SCE-specific System Conditions
Program Type Program Monthly System Peak
Jan. Feb. Mar. Apr. May Jun. Jul. Aug. Sep. Oct. Nov. Dec.
Emergency
BIP-15 127 117 137 143 128 129 134 136 135 127 131 125
BIP-30 491 456 470 468 469 469 472 473 465 433 444 428
AP-I 37 34 48 65 69 72 69 66 56 55 38 29
SUB-TOTAL 655 607 654 676 666 671 674 675 657 615 613 582
Price-responsive
SDP-C 0 0 3 43 42 41 42 53 51 43 16 0
SDP-R 0 0 8 184 211 218 233 273 250 216 60 0
CPP-Large 18 18 19 17 26 27 25 25 25 25 18 18
CPP-Medium 2 2 2 2 5 6 6 6 6 5 2 2
CPP-Small 1 1 1 1 3 3 4 4 4 3 1 1
DBP 85 81 94 64 90 100 102 102 102 89 92 81
SUB-TOTAL 106 102 127 311 378 395 411 462 438 382 189 102
Demand Response
Aggregator-managed
CBP-DA 3 3 3 2 5 5 6 6 5 5 3 2
CBP-DO 21 23 26 11 47 48 50 50 47 43 28 21
AMP 34 37 41 21 89 90 95 94 90 87 43 32
SUB-TOTAL 58 62 70 33 140 143 151 149 143 135 74 56
SmartConnect®-enabled
SPD with Tech. 2 2 8 23 26 27 30 33 34 29 8 2
SPD without Tech. 7 7 10 19 19 19 19 19 19 19 10 6
SUB-TOTAL 9 9 18 42 45 46 49 52 53 48 18 9
Non-event Based
RTP 0 0 0 12 0 -10 23 3 29 12 8 0
SMB Non-res. TOU 14 15 17 19 21 21 21 22 20 21 22 15
PLS 0 0 0 0 0 7 8 8 8 0 0 0
SUB-TOTAL 15 16 17 31 21 19 52 32 57 32 30 15
PORTFOLIO TOTAL 841 795 886 1,093 1,250 1,274 1,338 1,369 1,347 1,213 924 762

Program-specific Ex Ante Load Impact Estimates for 1-in-10 SCE-specific System Conditions by Month and Forecast Year
104
Table F-9: 2023 Program-specific Aggregate Ex Ante Load Impact Estimates for 1-in-10 SCE-specific System Conditions
Program Type Program Monthly System Peak
Jan. Feb. Mar. Apr. May Jun. Jul. Aug. Sep. Oct. Nov. Dec.
Emergency
BIP-15 127 117 137 143 128 129 134 136 135 127 131 125
BIP-30 491 456 470 468 469 469 472 473 465 433 444 428
AP-I 37 34 48 65 69 72 69 66 56 55 38 29
SUB-TOTAL 655 607 654 676 666 671 674 675 657 615 613 582
Price-responsive
SDP-C 0 0 3 41 40 39 41 51 49 41 15 0
SDP-R 0 0 8 179 206 213 227 266 244 211 58 0
CPP-Large 19 18 19 18 27 28 26 26 25 26 18 18
CPP-Medium 2 2 2 2 6 6 6 6 6 6 2 2
CPP-Small 1 1 1 1 3 3 4 4 4 3 1 1
DBP 85 81 94 64 90 100 102 102 102 89 92 81
SUB-TOTAL 106 102 127 305 372 389 405 454 430 376 187 102
Demand Response
Aggregator-managed
CBP-DA 3 3 3 2 5 5 6 6 5 5 3 2
CBP-DO 21 23 26 11 47 48 50 50 47 43 28 21
AMP 34 37 41 21 89 90 95 94 90 87 43 32
SUB-TOTAL 58 62 70 33 140 143 151 149 143 135 74 56
SmartConnect®-enabled
SPD with Tech. 2 2 9 28 32 33 37 39 40 35 10 3
SPD without Tech. 6 6 10 18 18 18 18 18 18 18 10 6
SUB-TOTAL 9 9 19 46 50 51 55 58 59 53 20 9
Non-event Based
RTP 0 0 0 12 0 -10 23 3 29 12 8 0
SMB Non-res. TOU 14 15 17 19 21 21 21 22 20 21 22 15
PLS 0 0 0 0 0 7 8 8 8 0 0 0
SUB-TOTAL 15 16 17 31 21 18 52 32 57 32 30 15
PORTFOLIO TOTAL 842 796 888 1,092 1,250 1,273 1,338 1,367 1,346 1,212 924 763

Program-specific Ex Ante Load Impact Estimates for 1-in-10 SCE-specific System Conditions by Month and Forecast Year
105
Table F-10: 2024 Program-specific Aggregate Ex Ante Load Impact Estimates for 1-in-10 SCE-specific System Conditions
Program Type Program Monthly System Peak
Jan. Feb. Mar. Apr. May Jun. Jul. Aug. Sep. Oct. Nov. Dec.
Emergency
BIP-15 127 117 137 143 128 129 134 136 135 127 131 125
BIP-30 491 456 470 468 469 469 472 473 465 433 444 428
AP-I 37 34 48 65 69 72 69 66 56 55 38 29
SUB-TOTAL 655 607 654 676 666 671 674 675 657 615 613 582
Price-responsive
SDP-C 0 0 3 39 39 38 39 49 47 40 15 0
SDP-R 0 0 7 175 201 208 222 260 238 206 57 0
CPP-Large 20 19 20 18 28 29 27 26 26 27 19 19
CPP-Medium 2 2 2 3 6 6 6 7 7 6 2 2
CPP-Small 1 1 1 1 3 4 4 4 4 3 1 1
DBP 85 81 94 64 90 100 102 102 102 89 92 81
SUB-TOTAL 107 103 127 300 367 384 399 448 424 371 186 103
Demand Response
Aggregator-managed
CBP-DA 3 3 3 2 5 5 6 6 5 5 3 2
CBP-DO 21 23 26 11 47 48 50 50 47 43 28 21
AMP 34 37 41 21 89 90 95 94 90 87 43 32
SUB-TOTAL 58 62 70 33 140 143 151 149 143 135 74 56
SmartConnect®-enabled
SPD with Tech. 3 3 11 33 37 38 42 44 45 39 11 3
SPD without Tech. 6 6 10 18 18 18 18 18 18 18 10 6
SUB-TOTAL 9 9 21 51 55 56 59 62 62 56 20 9
Non-event Based
RTP 0 0 0 12 0 -10 23 3 29 12 8 0
SMB Non-res. TOU 14 15 17 19 21 21 21 22 20 21 22 15
PLS 0 0 0 0 0 7 8 8 7 0 0 0
SUB-TOTAL 15 16 17 31 21 18 52 32 57 32 30 15
PORTFOLIO TOTAL 843 797 890 1,091 1,249 1,272 1,336 1,364 1,343 1,210 923 764

Program-specific Ex Ante Load Impact Estimates for 1-in-10 SCE-specific System Conditions by Month and Forecast Year
106
Table F-11: 2025 Program-specific Aggregate Ex Ante Load Impact Estimates for 1-in-10 SCE-specific System Conditions
Program Type Program Monthly System Peak
Jan. Feb. Mar. Apr. May Jun. Jul. Aug. Sep. Oct. Nov. Dec.
Emergency
BIP-15 127 117 137 143 128 129 134 136 135 127 131 125
BIP-30 491 456 470 468 469 469 472 473 465 433 444 428
AP-I 37 34 48 65 69 72 69 66 56 55 38 29
SUB-TOTAL 655 607 654 676 666 671 674 675 657 615 613 582
Price-responsive
SDP-C 0 0 3 38 37 37 38 48 46 38 14 0
SDP-R 0 0 7 171 197 203 217 254 233 202 56 0
CPP-Large 20 20 21 19 29 30 27 27 27 28 19 19
CPP-Medium 2 2 2 3 6 6 7 7 7 6 3 2
CPP-Small 1 1 1 1 3 4 4 4 4 3 1 1
DBP 85 81 94 64 90 100 102 102 102 89 92 81
SUB-TOTAL 108 104 128 296 363 380 395 441 419 366 185 104
Demand Response
Aggregator-managed
CBP-DA 3 3 3 2 5 5 6 6 5 5 3 2
CBP-DO 21 23 26 11 47 48 50 50 47 43 28 21
AMP 34 37 41 21 89 90 95 94 90 87 43 32
SUB-TOTAL 58 62 70 33 140 143 151 149 143 135 74 56
SmartConnect®-enabled
SPD with Tech. 3 3 12 36 41 42 46 48 49 43 12 3
SPD without Tech. 6 6 9 17 17 17 17 17 17 17 9 6
SUB-TOTAL 9 9 22 54 58 59 63 66 66 60 21 9
Non-event Based
RTP 0 0 0 12 0 -10 23 3 29 12 8 0
SMB Non-res. TOU 14 15 17 19 21 21 21 22 20 21 22 15
PLS 0 0 0 0 0 7 7 7 7 0 0 0
SUB-TOTAL 15 16 17 31 21 18 52 31 57 32 30 15
PORTFOLIO TOTAL 844 798 891 1,090 1,248 1,271 1,335 1,362 1,341 1,209 923 765

Portfolio Aggregate Ex Ante Load Impact Estimates for 1-in-2 CAISO System Conditions by Month and Forecast Year
107
Appendix G Portfolio Aggregate Ex Ante Load Impact Estimates for 1-in-2 CAISO System Conditions by Month and Forecast Year
Table G-1: 2015 Portfolio Aggregate Ex Ante Load Impact Estimates for 1-in-2 CAISO System Conditions
Program Type Program Monthly System Peak
Jan. Feb. Mar. Apr. May Jun. Jul. Aug. Sep. Oct. Nov. Dec.
Emergency
BIP-15 137 129 146 143 139 140 145 148 147 138 138 130
BIP-30 525 519 552 498 514 511 511 514 506 471 462 423
AP-I 33 30 39 57 62 65 63 60 51 48 28 27
SUB-TOTAL 695 678 738 698 715 717 719 722 704 657 629 579
Price-responsive
SDP-C 0 0 0 21 26 41 54 62 62 42 1 0
SDP-R 0 0 0 94 128 210 269 294 284 195 0 0
CPP-Large 8 8 8 9 15 13 12 12 13 13 9 8
CPP-Medium 0 0 0 0 0 0 0 0 0 0 0 0
CPP-Small 0 0 0 0 0 0 0 0 0 0 0 0
DBP 3 3 3 2 5 5 5 5 5 5 3 2
SUB-TOTAL 11 11 11 125 173 269 340 373 363 255 13 10
Demand Response
Aggregator-managed
CBP-DA 3 3 3 1 5 5 6 5 5 5 3 3
CBP-DO 21 22 24 10 45 47 50 49 47 42 25 22
AMP 35 35 36 20 86 88 95 93 90 85 40 34
SUB-TOTAL 59 60 63 32 135 141 150 147 142 132 68 59
SmartConnect®-enabled
SPD with Tech. 0 0 0 1 1 1 1 1 2 1 1 0
SPD without Tech. 5 5 7 14 14 14 14 14 14 14 7 5
SUB-TOTAL 5 5 8 14 15 15 16 16 16 15 8 5
Non-event Based
RTP 0 0 0 0 0 2 -1 -3 -1 0 0 0
SMB Non-res. TOU 13 13 14 18 19 21 21 21 22 19 14 14
PLS 0 0 0 0 0 0 0 0 0 0 0 0
SUB-TOTAL 13 13 14 18 19 23 21 19 21 19 14 14
PORTFOLIO TOTAL 783 767 833 887 1,058 1,165 1,245 1,277 1,246 1,079 732 666

Portfolio Aggregate Ex Ante Load Impact Estimates for 1-in-2 CAISO System Conditions by Month and Forecast Year
108
Table G-2: 2016 Portfolio Aggregate Ex Ante Load Impact Estimates for 1-in-2 CAISO System Conditions
Program Type Program Monthly System Peak
Jan. Feb. Mar. Apr. May Jun. Jul. Aug. Sep. Oct. Nov. Dec.
Emergency
BIP-15 133 125 142 139 135 136 141 143 142 134 134 128
BIP-30 512 506 539 485 501 498 498 501 494 459 450 411
AP-I 34 31 40 59 65 68 65 63 54 51 30 28
SUB-TOTAL 679 662 721 683 700 702 704 708 690 644 615 567
Price-responsive
SDP-C 0 0 0 20 25 38 52 59 59 40 1 0
SDP-R 0 0 0 90 123 202 259 283 273 188 0 0
CPP-Large 8 8 9 9 15 14 12 12 13 13 9 8
CPP-Medium 0 0 0 0 0 0 0 0 0 0 0 0
CPP-Small 0 0 0 0 0 0 0 0 0 0 0 0
DBP 2 2 3 1 4 4 4 4 4 4 3 2
SUB-TOTAL 11 11 11 121 167 258 326 358 349 245 13 10
Demand Response Aggregator-
managed
CBP-DA 3 3 3 1 5 5 6 5 5 5 3 3
CBP-DO 21 22 24 10 45 47 50 49 47 42 25 22
AMP 35 35 36 20 86 88 95 93 90 85 40 34
SUB-TOTAL 59 60 63 32 135 141 150 147 142 132 68 59
SmartConnect®-enabled
SPD with Tech. 0 0 1 2 2 2 2 2 2 2 1 0
SPD without Tech. 5 5 7 13 13 13 13 13 13 13 7 4
SUB-TOTAL 5 5 8 15 15 15 15 15 15 15 8 5
Non-event Based
RTP 0 0 0 0 0 2 -1 -3 -1 0 0 0
SMB Non-res. TOU 13 13 14 18 19 21 21 21 22 19 14 14
PLS 0* 0* 0* 0* 0* 0* 0* 0* 0* 0* 0* 0*
SUB-TOTAL 13 13 14 18 19 23 21 19 21 19 14 14
PORTFOLIO TOTAL 766 751 816 868 1,036 1,140 1,216 1,247 1,217 1,055 718 654
*Load impacts are redacted to protect confidential customer information

Portfolio Aggregate Ex Ante Load Impact Estimates for 1-in-2 CAISO System Conditions by Month and Forecast Year
109
Table G-3: 2017 Portfolio Aggregate Ex Ante Load Impact Estimates for 1-in-2 CAISO System Conditions
Program Type Program Monthly System Peak
Jan. Feb. Mar. Apr. May Jun. Jul. Aug. Sep. Oct. Nov. Dec.
Emergency
BIP-15 131 123 140 137 133 134 138 141 140 132 132 123
BIP-30 497 492 523 472 487 484 484 487 480 446 438 400
AP-I 36 33 43 62 68 72 69 66 56 53 31 29
SUB-TOTAL 664 648 706 670 688 690 692 694 676 631 601 553
Price-responsive
SDP-C 0 0 0 19 23 37 49 56 56 38 1 0
SDP-R 0 0 0 87 118 195 249 273 263 181 0 0
CPP-Large 9 9 9 9 15 14 12 13 13 14 9 8
CPP-Medium 0 0 0 5 11 12 13 13 13 11 4 4
CPP-Small 0 0 0 3 6 7 8 8 7 6 3 2
DBP 2 2 2 1 4 4 4 4 4 4 3 2
SUB-TOTAL 11 11 11 124 178 268 335 366 356 253 20 17
Demand Response
Aggregator-managed
CBP-DA 3 3 3 1 5 5 6 5 5 5 3 3
CBP-DO 21 22 24 10 45 47 50 49 47 42 25 22
AMP 35 35 36 20 86 88 95 93 90 85 40 34
SUB-TOTAL 59 60 63 32 135 141 150 147 142 132 68 59
SmartConnect®-enabled
SPD with Tech. 0 0 2 2 3 3 3 4 4 4 2 0
SPD without Tech. 4 4 7 13 13 13 13 13 12 12 7 4
SUB-TOTAL 5 5 8 15 15 16 16 16 16 16 9 4
Non-event Based
RTP 0 0 0 0 0 2 -1 -3 -1 0 0 0
SMB Non-res. TOU 13 13 14 18 19 21 21 21 22 19 14 14
PLS 0 0 0 0 0 5 5 5 5 0 0 0
SUB-TOTAL 13 13 14 18 19 27 26 24 26 19 14 14
PORTFOLIO TOTAL 752 736 802 859 1,035 1,142 1,219 1,247 1,216 1,052 712 647

Portfolio Aggregate Ex Ante Load Impact Estimates for 1-in-2 CAISO System Conditions by Month and Forecast Year
110
Table G-4: 2018 Portfolio Aggregate Ex Ante Load Impact Estimates for 1-in-2 CAISO System Conditions
Program Type Program Monthly System Peak
Jan. Feb. Mar. Apr. May Jun. Jul. Aug. Sep. Oct. Nov. Dec.
Emergency
BIP-15 127 119 135 132 129 130 134 137 136 128 130 123
BIP-30 484 479 509 459 474 471 471 474 467 434 432 400
AP-I 37 34 43 63 69 72 69 66 56 52 31 29
SUB-TOTAL 648 631 688 654 671 673 674 677 658 614 593 553
Price-responsive
SDP-C 0 0 0 18 22 35 47 53 53 36 1 0
SDP-R 0 0 0 84 114 188 241 263 254 175 0 0
CPP-Large 9 9 9 9 16 14 13 13 13 14 9 9
CPP-Medium 4 4 4 2 4 5 5 5 5 4 2 2
CPP-Small 2 2 2 1 2 3 3 3 3 2 1 1
DBP 2 2 2 1 4 4 4 4 4 4 3 2
SUB-TOTAL 18 17 18 116 163 249 312 342 333 236 16 13
Demand Response
Aggregator-managed
CBP-DA 3 3 3 1 5 5 6 5 5 5 3 3
CBP-DO 21 22 24 10 45 47 50 49 47 42 25 22
AMP 35 35 36 20 86 88 95 93 90 85 40 34
SUB-TOTAL 59 60 63 32 135 141 150 147 142 132 68 59
SmartConnect®-enabled
SPD with Tech. 0 0 3 4 4 5 6 6 7 6 3 1
SPD without Tech. 4 4 6 12 12 12 12 12 12 12 6 4
SUB-TOTAL 4 4 9 16 17 17 18 18 19 18 10 5
Non-event Based
RTP 0 0 0 0 0 2 -1 -3 -1 0 0 0
SMB Non-res. TOU 13 13 14 18 19 21 21 21 22 19 14 14
PLS 0 0 0 0 0 7 8 7 8 0 0 0
SUB-TOTAL 13 13 14 18 19 30 29 26 29 19 14 14
PORTFOLIO TOTAL 742 727 792 836 1,005 1,110 1,183 1,210 1,180 1,019 701 643

Portfolio Aggregate Ex Ante Load Impact Estimates for 1-in-2 CAISO System Conditions by Month and Forecast Year
111
Table G-5: 2019 Portfolio Aggregate Ex Ante Load Impact Estimates for 1-in-2 CAISO System Conditions
Program Type Program Monthly System Peak
Jan. Feb. Mar. Apr. May Jun. Jul. Aug. Sep. Oct. Nov. Dec.
Emergency
BIP-15 127 119 135 132 129 130 134 137 136 128 130 123
BIP-30 484 479 509 459 474 471 471 474 467 434 432 400
AP-I 37 34 43 63 69 72 69 66 56 52 31 29
SUB-TOTAL 648 631 688 654 671 673 674 677 658 614 593 553
Price-responsive
SDP-C 0 0 0 17 21 33 44 51 51 34 1 0
SDP-R 0 0 0 81 111 182 233 255 245 169 0 0
CPP-Large 9 9 9 10 16 15 13 13 14 15 10 9
CPP-Medium 2 2 2 2 4 5 5 5 5 5 2 2
CPP-Small 1 1 1 1 2 3 3 3 3 2 1 1
DBP 2 2 2 1 4 4 4 4 4 4 3 2
SUB-TOTAL 14 14 14 113 159 242 303 331 323 229 16 14
Demand Response
Aggregator-managed
CBP-DA 3 3 3 1 5 5 6 5 5 5 3 3
CBP-DO 21 22 24 10 45 47 50 49 47 42 25 22
AMP 35 35 36 20 86 88 95 93 90 85 40 34
SUB-TOTAL 59 60 63 32 135 141 150 147 142 132 68 59
SmartConnect®-enabled
SPD with Tech. 1 1 5 6 7 8 8 9 9 9 5 1
SPD without Tech. 4 4 6 12 12 12 12 12 12 11 6 4
SUB-TOTAL 5 5 11 18 18 19 20 21 21 20 11 5
Non-event Based
RTP 0 0 0 0 0 2 -1 -3 -1 0 0 0
SMB Non-res. TOU 13 13 14 18 19 21 21 21 22 19 14 14
PLS 0 0 0 0 0 7 8 7 8 0 0 0
SUB-TOTAL 13 13 14 18 19 30 29 26 29 19 14 14
PORTFOLIO TOTAL 739 723 790 835 1,003 1,105 1,176 1,202 1,172 1,015 702 643

Portfolio Aggregate Ex Ante Load Impact Estimates for 1-in-2 CAISO System Conditions by Month and Forecast Year
112
Table G-6: 2020 Portfolio Aggregate Ex Ante Load Impact Estimates for 1-in-2 CAISO System Conditions
Program Type Program Monthly System Peak
Jan. Feb. Mar. Apr. May Jun. Jul. Aug. Sep. Oct. Nov. Dec.
Emergency
BIP-15 127 119 135 132 129 130 134 137 136 128 130 123
BIP-30 484 479 509 459 474 471 471 474 467 434 432 400
AP-I 37 34 43 63 69 72 69 66 56 52 31 29
SUB-TOTAL 648 631 688 654 671 673 674 677 658 614 593 553
Price-responsive
SDP-C 0 0 0 16 20 32 42 48 49 33 1 0
SDP-R 0 0 0 79 107 177 226 247 238 164 0 0
CPP-Large 10 9 10 10 17 15 13 14 14 15 10 9
CPP-Medium 2 2 2 2 5 5 6 6 5 5 2 2
CPP-Small 1 1 1 1 2 3 3 3 3 3 1 1
DBP 2 2 2 1 4 4 4 4 4 4 3 2
SUB-TOTAL 14 14 15 110 155 236 294 322 314 223 16 14
Demand Response
Aggregator-managed
CBP-DA 3 3 3 1 5 5 6 5 5 5 3 3
CBP-DO 21 22 24 10 45 47 50 49 47 42 25 22
AMP 35 35 36 20 86 88 95 93 90 85 40 34
SUB-TOTAL 59 60 63 32 135 141 150 147 142 132 68 59
SmartConnect®-enabled
SPD with Tech. 1 1 7 9 9 10 12 12 13 12 7 1
SPD without Tech. 4 4 6 11 11 11 11 11 11 11 6 4
SUB-TOTAL 5 5 13 20 21 22 23 23 24 23 13 5
Non-event Based
RTP 0 0 0 0 0 2 -1 -3 -1 0 0 0
SMB Non-res. TOU 13 13 14 18 19 21 21 21 22 19 14 14
PLS 0 0 0 0 0 7 8 7 8 0 0 0
SUB-TOTAL 13 13 14 18 19 30 29 26 29 19 14 14
PORTFOLIO TOTAL 739 724 792 834 1,002 1,101 1,171 1,195 1,166 1,011 704 644

Portfolio Aggregate Ex Ante Load Impact Estimates for 1-in-2 CAISO System Conditions by Month and Forecast Year
113
Table G-7: 2021 Portfolio Aggregate Ex Ante Load Impact Estimates for 1-in-2 CAISO System Conditions
Program Type Program Monthly System Peak
Jan. Feb. Mar. Apr. May Jun. Jul. Aug. Sep. Oct. Nov. Dec.
Emergency
BIP-15 127 119 135 132 129 130 134 137 136 128 130 123
BIP-30 484 479 509 459 474 471 471 474 467 434 432 400
AP-I 37 34 43 63 69 72 69 66 56 52 31 29
SUB-TOTAL 648 631 688 654 671 673 674 677 658 614 593 553
Price-responsive
SDP-C 0 0 0 16 19 30 41 46 47 31 1 0
SDP-R 0 0 0 77 104 171 219 240 231 159 0 0
CPP-Large 10 10 10 10 17 16 14 14 15 16 10 9
CPP-Medium 2 2 2 2 5 5 6 6 6 5 2 2
CPP-Small 1 1 1 1 3 3 3 3 3 3 1 1
DBP 2 2 2 1 4 4 4 4 4 4 3 2
SUB-TOTAL 15 15 15 107 152 230 287 314 305 218 17 14
Demand Response
Aggregator-managed
CBP-DA 3 3 3 1 5 5 6 5 5 5 3 3
CBP-DO 21 22 24 10 45 47 50 49 47 42 25 22
AMP 35 35 36 20 86 88 95 93 90 85 40 34
SUB-TOTAL 59 60 63 32 135 141 150 147 142 132 68 59
SmartConnect®-enabled
SPD with Tech. 1 1 9 12 13 14 16 16 17 16 9 1
SPD without Tech. 4 4 6 11 11 11 11 11 11 11 6 4
SUB-TOTAL 5 5 15 23 24 25 26 27 28 26 14 5
Non-event Based
RTP 0 0 0 0 0 2 -1 -3 -1 0 0 0
SMB Non-res. TOU 13 13 14 18 19 21 21 21 22 19 14 14
PLS 0 0 0 0 0 7 8 7 8 0 0 0
SUB-TOTAL 13 13 14 18 19 30 29 26 29 19 14 14
PORTFOLIO TOTAL 739 724 795 834 1,002 1,099 1,166 1,190 1,162 1,009 707 645

Portfolio Aggregate Ex Ante Load Impact Estimates for 1-in-2 CAISO System Conditions by Month and Forecast Year
114
Table G-8: 2022 Portfolio Aggregate Ex Ante Load Impact Estimates for 1-in-2 CAISO System Conditions
Program Type Program Monthly System Peak
Jan. Feb. Mar. Apr. May Jun. Jul. Aug. Sep. Oct. Nov. Dec.
Emergency
BIP-15 127 119 135 132 129 130 134 137 136 128 130 123
BIP-30 484 479 509 459 474 471 471 474 467 434 432 400
AP-I 37 34 43 63 69 72 69 66 56 52 31 29
SUB-TOTAL 648 631 688 654 671 673 674 677 658 614 593 553
Price-responsive
SDP-C 0 0 0 15 19 29 39 45 45 30 1 0
SDP-R 0 0 0 75 101 167 213 234 225 155 0 0
CPP-Large 10 10 10 11 18 16 14 15 15 16 11 10
CPP-Medium 2 2 2 2 5 5 6 6 6 5 2 2
CPP-Small 1 1 1 1 3 3 3 3 3 3 1 1
DBP 2 2 2 1 4 4 4 4 4 4 3 2
SUB-TOTAL 15 15 16 105 149 225 280 306 298 213 17 15
Demand Response
Aggregator-managed
CBP-DA 3 3 3 1 5 5 6 5 5 5 3 3
CBP-DO 21 22 24 10 45 47 50 49 47 42 25 22
AMP 35 35 36 20 86 88 95 93 90 85 40 34
SUB-TOTAL 59 60 63 32 135 141 150 147 142 132 68 59
SmartConnect®-enabled
SPD with Tech. 1 1 12 15 16 18 20 20 21 19 11 2
SPD without Tech. 4 4 6 11 10 11 11 11 10 10 5 3
SUB-TOTAL 5 5 18 26 27 28 30 31 31 30 16 5
Non-event Based
RTP 0 0 0 0 0 2 -1 -3 -1 0 0 0
SMB Non-res. TOU 13 13 14 18 19 21 21 21 22 19 14 14
PLS 0 0 0 0 0 7 8 7 7 0 0 0
SUB-TOTAL 13 13 14 18 19 30 29 26 29 19 14 14
PORTFOLIO TOTAL 740 725 798 835 1,002 1,097 1,163 1,187 1,158 1,008 709 645

Portfolio Aggregate Ex Ante Load Impact Estimates for 1-in-2 CAISO System Conditions by Month and Forecast Year
115
Table G-9: 2023 Portfolio Aggregate Ex Ante Load Impact Estimates for 1-in-2 CAISO System Conditions
Program Type Program Monthly System Peak
Jan. Feb. Mar. Apr. May Jun. Jul. Aug. Sep. Oct. Nov. Dec.
Emergency
BIP-15 127 119 135 132 129 130 134 137 136 128 130 123
BIP-30 484 479 509 459 474 471 471 474 467 434 432 400
AP-I 37 34 43 63 69 72 69 66 56 52 31 29
SUB-TOTAL 648 631 688 654 671 673 674 677 658 614 593 553
Price-responsive
SDP-C 0 0 0 15 18 28 38 43 43 29 1 0
SDP-R 0 0 0 73 99 163 208 228 219 151 0 0
CPP-Large 11 10 11 11 18 17 15 15 16 17 11 10
CPP-Medium 2 2 2 2 5 6 6 6 6 5 2 2
CPP-Small 1 1 1 1 3 3 4 4 3 3 1 1
DBP 2 2 2 1 4 4 4 4 4 4 3 2
SUB-TOTAL 16 16 16 103 147 220 274 299 292 209 18 15
Demand Response
Aggregator-managed
CBP-DA 3 3 3 1 5 5 6 5 5 5 3 3
CBP-DO 21 22 24 10 45 47 50 49 47 42 25 22
AMP 35 35 36 20 86 88 95 93 90 85 40 34
SUB-TOTAL 59 60 63 32 135 141 150 147 142 132 68 59
SmartConnect®-enabled
SPD with Tech. 2 2 15 19 20 21 24 24 25 23 13 2
SPD without Tech. 3 3 5 10 10 10 10 10 10 10 5 3
SUB-TOTAL 5 5 21 29 30 32 34 34 35 33 18 5
Non-event Based
RTP 0 0 0 0 0 2 -1 -3 -1 0 0 0
SMB Non-res. TOU 13 13 14 18 19 21 21 21 22 19 14 14
PLS 0 0 0 0 0 7 8 7 7 0 0 0
SUB-TOTAL 13 13 14 18 19 30 28 26 28 19 14 14
PORTFOLIO TOTAL 741 725 801 836 1,003 1,096 1,161 1,183 1,155 1,007 711 646

Portfolio Aggregate Ex Ante Load Impact Estimates for 1-in-2 CAISO System Conditions by Month and Forecast Year
116
Table G-10: 2024 Portfolio Aggregate Ex Ante Load Impact Estimates for 1-in-2 CAISO System Conditions
Program Type Program Monthly System Peak
Jan. Feb. Mar. Apr. May Jun. Jul. Aug. Sep. Oct. Nov. Dec.
Emergency
BIP-15 127 119 135 132 129 130 134 137 136 128 130 123
BIP-30 484 479 509 459 474 471 471 474 467 434 432 400
AP-I 37 34 43 63 69 72 69 66 56 52 31 29
SUB-TOTAL 648 631 688 654 671 673 674 677 658 614 593 553
Price-responsive
SDP-C 0 0 0 14 17 27 36 41 42 28 1 0
SDP-R 0 0 0 71 97 159 203 222 214 147 0 0
CPP-Large 11 11 11 11 19 17 15 16 16 17 11 10
CPP-Medium 2 2 2 2 5 6 6 6 6 5 2 2
CPP-Small 1 1 1 1 3 3 4 4 4 3 1 1
DBP 2 2 2 1 4 4 4 4 4 4 3 2
SUB-TOTAL 16 16 16 101 145 216 269 293 286 205 18 16
Demand Response
Aggregator-managed
CBP-DA 3 3 3 1 5 5 6 5 5 5 3 3
CBP-DO 21 22 24 10 45 47 50 49 47 42 25 22
AMP 35 35 36 20 86 88 95 93 90 85 40 34
SUB-TOTAL 59 60 63 32 135 141 150 147 142 132 68 59
SmartConnect®-enabled
SPD with Tech. 2 2 18 22 23 25 27 27 27 26 14 2
SPD without Tech. 3 3 5 10 10 10 10 10 10 10 5 3
SUB-TOTAL 5 5 23 32 33 34 37 37 37 35 20 5
Non-event Based
RTP 0 0 0 0 0 2 -1 -3 -1 0 0 0
SMB Non-res. TOU 13 13 14 18 19 21 21 21 22 19 14 14
PLS 0 0 0 0 0 7 8 7 7 0 0 0
SUB-TOTAL 13 13 14 18 19 29 28 26 28 19 14 14
PORTFOLIO TOTAL 741 726 804 838 1,004 1,095 1,158 1,180 1,151 1,006 713 646

Portfolio Aggregate Ex Ante Load Impact Estimates for 1-in-2 CAISO System Conditions by Month and Forecast Year
117
Table G-11: 2025 Portfolio Aggregate Ex Ante Load Impact Estimates for 1-in-2 CAISO System Conditions
Program Type Program Monthly System Peak
Jan. Feb. Mar. Apr. May Jun. Jul. Aug. Sep. Oct. Nov. Dec.
Emergency
BIP-15 127 119 135 132 129 130 134 137 136 128 130 123
BIP-30 484 479 509 459 474 471 471 474 467 434 432 400
AP-I 37 34 43 63 69 72 69 66 56 52 31 29
SUB-TOTAL 648 631 688 654 671 673 674 677 658 614 593 553
Price-responsive
SDP-C 0 0 0 14 17 26 35 40 40 27 1 0
SDP-R 0 0 0 70 94 155 199 218 210 144 0 0
CPP-Large 11 11 11 12 20 18 16 16 17 18 12 11
CPP-Medium 2 2 2 2 5 6 6 6 6 5 2 2
CPP-Small 1 1 1 1 3 3 4 4 4 3 1 1
DBP 2 2 2 1 4 4 4 4 4 4 3 2
SUB-TOTAL 17 16 17 100 143 213 264 288 280 201 18 16
Demand Response
Aggregator-managed
CBP-DA 3 3 3 1 5 5 6 5 5 5 3 3
CBP-DO 21 22 24 10 45 47 50 49 47 42 25 22
AMP 35 35 36 20 86 88 95 93 90 85 40 34
SUB-TOTAL 59 60 63 32 135 141 150 147 142 132 68 59
SmartConnect®-enabled
SPD with Tech. 2 2 20 25 26 27 29 30 30 28 16 2
SPD without Tech. 3 3 5 10 10 10 10 10 10 10 5 3
SUB-TOTAL 5 5 25 34 35 37 39 40 40 38 21 6
Non-event Based
RTP 0 0 0 0 0 2 -1 -3 -1 0 0 0
SMB Non-res. TOU 13 13 14 18 19 21 21 21 22 19 14 14
PLS 0 0 0 0 0 6 7 7 7 0 0 0
SUB-TOTAL 13 13 14 18 19 29 28 26 28 19 14 14
PORTFOLIO TOTAL 742 727 806 838 1,004 1,093 1,155 1,177 1,148 1,005 715 647

Portfolio Aggregate Ex Ante Load Impact Estimates for 1-in-10 CAISO System Conditions by Month and Forecast Year
118
Appendix H Portfolio Aggregate Ex Ante Load Impact Estimates for 1-in-10 CAISO System Conditions by Month and Forecast Year
Table H-1: 2015 Portfolio Aggregate Ex Ante Load Impact Estimates for 1-in-10 CAISO System Conditions
Program Type Program Monthly System Peak
Jan. Feb. Mar. Apr. May Jun. Jul. Aug. Sep. Oct. Nov. Dec.
Emergency
BIP-15 139 127 149 155 138 140 145 147 146 138 138 131
BIP-30 547 502 512 507 509 508 511 514 505 471 466 460
AP-I 34 30 44 59 62 65 62 59 52 52 30 26
SUB-TOTAL 720 659 706 720 709 714 719 720 703 660 635 617
Price-responsive
SDP-C 0 0 7 59 59 58 60 68 79 52 6 0
SDP-R 0 0 23 232 270 276 291 324 347 234 12 0
CPP-Large 9 8 9 8 13 12 12 12 11 12 9 8
CPP-Medium 0 0 0 0 0 0 0 0 0 0 0 0
CPP-Small 0 0 0 0 0 0 0 0 0 0 0 0
DBP 3 3 4 1 5 5 5 5 5 5 3 2
SUB-TOTAL 11 11 42 300 346 351 367 409 441 302 30 10
Demand Response
Aggregator-managed
CBP-DA 3 3 3 2 5 5 6 6 5 5 3 2
CBP-DO 21 23 27 11 47 48 50 49 48 43 26 21
AMP 34 37 42 21 89 90 96 93 91 86 41 32
SUB-TOTAL 57 62 71 33 141 143 151 148 144 134 69 55
SmartConnect®-enabled
SPD with Tech. 0 0 0 1 1 1 1 1 2 2 1 0
SPD without Tech. 5 5 7 14 14 14 14 14 14 14 7 5
SUB-TOTAL 5 5 8 15 15 15 16 16 16 15 8 5
Non-event Based
RTP 0 0 0 -2 0 -1 -1 -3 6 -2 0 0
SMB Non-res. TOU 14 15 16 19 21 20 22 23 20 21 18 14
PLS 0 0 0 0 0 0 0 0 0 0 0 0
SUB-TOTAL 14 15 16 17 21 20 21 20 26 19 18 14
PORTFOLIO TOTAL 807 751 843 1,086 1,232 1,243 1,273 1,313 1,329 1,130 759 702

Portfolio Aggregate Ex Ante Load Impact Estimates for 1-in-10 CAISO System Conditions by Month and Forecast Year
119
Table H-2: 2016 Portfolio Aggregate Ex Ante Load Impact Estimates for 1-in-10 CAISO System Conditions
Program Type Program Monthly System Peak
Jan. Feb. Mar. Apr. May Jun. Jul. Aug. Sep. Oct. Nov
. Dec
.
Emergency
BIP-15 135 123 145 150 134 136 141 143 142 134 134 129
BIP-30 533 489 499 494 496 496 498 501 492 459 454 447
AP-I 36 31 46 61 65 68 65 62 54 55 32 28
SUB-TOTAL 703 643 690 705 695 699 704 706 688 647 620 604
Price-responsive
SDP-C 0 0 7 56 56 55 57 65 74 49 5 0
SDP-R 0 0 22 223 259 265 280 312 333 225 12 0
CPP-Large 9 8 9 8 13 12 12 12 11 12 9 8
CPP-Medium 0 0 0 0 0 0 0 0 0 0 0 0
CPP-Small 0 0 0 0 0 0 0 0 0 0 0 0
DBP 2 3 3 1 4 4 4 4 4 4 3 2
SUB-TOTAL 11 11 41 288 332 337 353 392 423 290 29 10
Demand Response Aggregator-
managed
CBP-DA 3 3 3 2 5 5 6 6 5 5 3 2
CBP-DO 21 23 27 11 47 48 50 49 48 43 26 21
AMP 34 37 42 21 89 90 96 93 91 86 41 32
SUB-TOTAL 57 62 71 33 141 143 151 148 144 134 69 55
SmartConnect®-enabled
SPD with Tech. 0 0 1 2 2 2 2 2 3 2 1 0
SPD without Tech. 5 5 7 13 13 13 13 13 13 13 7 4
SUB-TOTAL 5 5 8 15 15 15 15 16 16 15 8 5
Non-event Based
RTP 0 0 0 -2 0 -1 -1 -3 6 -2 0 0
SMB Non-res. TOU 14 15 16 19 21 20 22 23 20 21 18 14
PLS 0* 0* 0* 0* 0* 0* 0* 0* 0* 0* 0* 0*
SUB-TOTAL 14 15 16 17 21 20 21 20 26 19 18 14
PORTFOLIO TOTAL 790 735 826 1,05
9 1,20
4 1,21
4 1,24
4 1,28
2 1,29
7 1,10
5 744 688
*Load impacts are redacted to protect confidential customer information

Portfolio Aggregate Ex Ante Load Impact Estimates for 1-in-10 CAISO System Conditions by Month and Forecast Year
120

Portfolio Aggregate Ex Ante Load Impact Estimates for 1-in-10 CAISO System Conditions by Month and Forecast Year
121
Table H-3: 2017 Portfolio Aggregate Ex Ante Load Impact Estimates for 1-in-10 CAISO System Conditions
Program Type Program Monthly System Peak
Jan. Feb. Mar. Apr. May Jun. Jul. Aug. Sep. Oct. Nov. Dec.
Emergency
BIP-15 133 121 142 148 132 134 138 141 140 132 132 125
BIP-30 518 475 485 481 482 482 484 487 478 446 441 435
AP-I 38 33 49 64 68 72 68 65 57 57 33 29
SUB-TOTAL 688 629 676 692 682 687 691 692 675 634 606 589
Price-responsive
SDP-C 0 0 7 53 53 52 54 61 71 46 5 0
SDP-R 0 0 21 215 250 256 270 300 321 217 11 0
CPP-Large 9 9 9 8 13 13 12 12 12 12 9 9
CPP-Medium 0 0 0 5 12 13 13 13 14 12 5 4
CPP-Small 0 0 0 3 7 7 8 8 8 7 3 2
DBP 2 2 3 1 4 4 4 4 4 4 3 2
SUB-TOTAL 11 11 40 286 339 344 361 399 429 298 35 17
Demand Response
Aggregator-managed
CBP-DA 3 3 3 2 5 5 6 6 5 5 3 2
CBP-DO 21 23 27 11 47 48 50 49 48 43 26 21
AMP 34 37 42 21 89 90 96 93 91 86 41 32
SUB-TOTAL 57 62 71 33 141 143 151 148 144 134 69 55
SmartConnect®-enabled
SPD with Tech. 0 0 1 3 3 3 4 4 4 4 2 0
SPD without Tech. 4 4 7 13 13 13 13 13 13 12 7 4
SUB-TOTAL 5 5 8 15 16 16 16 16 17 16 8 5
Non-event Based
RTP 0 0 0 -2 0 -1 -1 -3 6 -2 0 0
SMB Non-res. TOU 14 15 16 19 21 20 22 23 20 21 18 14
PLS 0 0 0 0 0 5 5 5 5 0 0 0
SUB-TOTAL 14 15 16 17 21 24 26 25 31 19 18 14
PORTFOLIO TOTAL 775 721 811 1,044 1,198 1,215 1,245 1,282 1,296 1,102 737 680

Portfolio Aggregate Ex Ante Load Impact Estimates for 1-in-10 CAISO System Conditions by Month and Forecast Year
122
Table H-4: 2018 Portfolio Aggregate Ex Ante Load Impact Estimates for 1-in-10 CAISO System Conditions
Program Type Program Monthly System Peak
Jan. Feb. Mar. Apr. May Jun. Jul. Aug. Sep. Oct. Nov. Dec.
Emergency
BIP-15 129 117 138 143 128 130 134 136 135 127 130 125
BIP-30 504 463 472 468 469 469 472 474 466 434 436 435
AP-I 39 34 50 65 69 72 68 64 56 56 33 29
SUB-TOTAL 672 614 660 676 666 670 674 675 657 617 598 589
Price-responsive
SDP-C 0 0 6 51 50 49 51 58 67 44 5 0
SDP-R 0 0 20 207 241 247 261 290 310 209 11 0
CPP-Large 9 9 9 8 13 13 12 12 12 13 10 9
CPP-Medium 4 4 5 2 5 5 5 5 5 5 2 2
CPP-Small 2 2 2 1 3 3 3 3 3 3 1 1
DBP 2 2 3 1 4 4 4 4 4 4 3 2
SUB-TOTAL 18 18 46 271 317 322 337 374 402 278 31 13
Demand Response
Aggregator-managed
CBP-DA 3 3 3 2 5 5 6 6 5 5 3 2
CBP-DO 21 23 27 11 47 48 50 49 48 43 26 21
AMP 34 37 42 21 89 90 96 93 91 86 41 32
SUB-TOTAL 57 62 71 33 141 143 151 148 144 134 69 55
SmartConnect®-enabled
SPD with Tech. 0 0 2 4 5 5 6 6 7 7 3 1
SPD without Tech. 4 4 7 12 12 12 12 12 12 12 6 4
SUB-TOTAL 5 5 9 17 17 17 18 19 19 19 9 5
Non-event Based
RTP 0 0 0 -2 0 -1 -1 -3 6 -2 0 0
SMB Non-res. TOU 14 15 16 19 21 20 22 23 20 21 18 14
PLS 0 0 0 0 0 7 8 8 8 0 0 0
SUB-TOTAL 14 15 16 17 21 27 29 28 33 19 18 14
PORTFOLIO TOTAL 765 712 801 1,014 1,162 1,180 1,209 1,243 1,256 1,067 726 676

Portfolio Aggregate Ex Ante Load Impact Estimates for 1-in-10 CAISO System Conditions by Month and Forecast Year
123
Table H-5: 2019 Portfolio Aggregate Ex Ante Load Impact Estimates for 1-in-10 CAISO System Conditions
Program Type Program Monthly System Peak
Jan. Feb. Mar. Apr. May Jun. Jul. Aug. Sep. Oct. Nov. Dec.
Emergency
BIP-15 129 117 138 143 128 130 134 136 135 127 130 125
BIP-30 504 463 472 468 469 469 472 474 466 434 436 435
AP-I 39 34 50 65 69 72 68 64 56 56 33 29
SUB-TOTAL 672 614 660 676 666 670 674 675 657 617 598 589
Price-responsive
SDP-C 0 0 6 48 48 47 49 56 64 42 5 0
SDP-R 0 0 20 201 233 239 252 281 300 203 11 0
CPP-Large 9 9 10 9 14 14 13 13 12 13 10 9
CPP-Medium 2 2 2 2 5 5 5 6 6 5 2 2
CPP-Small 1 1 1 1 3 3 3 3 3 3 1 1
DBP 2 2 3 1 4 4 4 4 4 4 3 2
SUB-TOTAL 14 14 41 262 308 312 326 362 390 270 31 14
Demand Response
Aggregator-managed
CBP-DA 3 3 3 2 5 5 6 6 5 5 3 2
CBP-DO 21 23 27 11 47 48 50 49 48 43 26 21
AMP 34 37 42 21 89 90 96 93 91 86 41 32
SUB-TOTAL 57 62 71 33 141 143 151 148 144 134 69 55
SmartConnect®-enabled
SPD with Tech. 1 1 3 7 8 8 9 9 10 9 4 1
SPD without Tech. 4 4 6 12 12 12 12 12 12 12 6 4
SUB-TOTAL 5 5 10 19 19 20 20 21 21 21 10 5
Non-event Based
RTP 0 0 0 -2 0 -1 -1 -3 6 -2 0 0
SMB Non-res. TOU 14 15 16 19 21 20 22 23 20 21 18 14
PLS 0 0 0 0 0 7 8 8 8 0 0 0
SUB-TOTAL 14 15 16 17 21 27 29 28 33 19 18 14
PORTFOLIO TOTAL 761 709 798 1,008 1,154 1,173 1,201 1,234 1,246 1,061 726 677

Portfolio Aggregate Ex Ante Load Impact Estimates for 1-in-10 CAISO System Conditions by Month and Forecast Year
124
Table H-6: 2020 Portfolio Aggregate Ex Ante Load Impact Estimates for 1-in-10 CAISO System Conditions
Program Type Program Monthly System Peak
Jan. Feb. Mar. Apr. May Jun. Jul. Aug. Sep. Oct. Nov. Dec.
Emergency
BIP-15 129 117 138 143 128 130 134 136 135 127 130 125
BIP-30 504 463 472 468 469 469 472 474 466 434 436 435
AP-I 39 34 50 65 69 72 68 64 56 56 33 29
SUB-TOTAL 672 614 660 676 666 670 674 675 657 617 598 589
Price-responsive
SDP-C 0 0 6 46 46 45 47 53 61 40 5 0
SDP-R 0 0 19 194 226 232 244 272 291 196 10 0
CPP-Large 10 9 10 9 14 14 13 13 13 13 10 9
CPP-Medium 2 2 2 2 5 5 6 6 6 5 2 2
CPP-Small 1 1 1 1 3 3 3 3 3 3 1 1
DBP 2 2 3 1 4 4 4 4 4 4 3 2
SUB-TOTAL 15 14 41 254 299 303 317 352 378 262 31 14
Demand Response
Aggregator-managed
CBP-DA 3 3 3 2 5 5 6 6 5 5 3 2
CBP-DO 21 23 27 11 47 48 50 49 48 43 26 21
AMP 34 37 42 21 89 90 96 93 91 86 41 32
SUB-TOTAL 57 62 71 33 141 143 151 148 144 134 69 55
SmartConnect®-enabled
SPD with Tech. 1 1 5 10 10 11 12 13 13 13 6 1
SPD without Tech. 4 4 6 11 11 11 11 11 11 11 6 4
SUB-TOTAL 5 5 11 21 22 22 23 24 25 24 12 5
Non-event Based
RTP 0 0 0 -2 0 -1 -1 -3 6 -2 0 0
SMB Non-res. TOU 14 15 16 19 21 20 22 23 20 21 18 14
PLS 0 0 0 0 0 7 8 8 8 0 0 0
SUB-TOTAL 14 15 16 17 21 27 29 28 33 19 18 14
PORTFOLIO TOTAL 762 709 798 1,002 1,148 1,166 1,194 1,227 1,238 1,056 728 678

Portfolio Aggregate Ex Ante Load Impact Estimates for 1-in-10 CAISO System Conditions by Month and Forecast Year
125
Table H-7: 2021 Portfolio Aggregate Ex Ante Load Impact Estimates for 1-in-10 CAISO System Conditions
Program Type Program Monthly System Peak
Jan. Feb. Mar. Apr. May Jun. Jul. Aug. Sep. Oct. Nov. Dec.
Emergency
BIP-15 129 117 138 143 128 130 134 136 135 127 130 125
BIP-30 504 463 472 468 469 469 472 474 466 434 436 435
AP-I 39 34 50 65 69 72 68 64 56 56 33 29
SUB-TOTAL 672 614 660 676 666 670 674 675 657 617 598 589
Price-responsive
SDP-C 0 0 5 44 44 43 45 51 59 39 4 0
SDP-R 0 0 19 189 220 225 237 264 283 191 10 0
CPP-Large 10 10 10 9 15 15 14 14 13 14 10 10
CPP-Medium 2 2 2 2 5 6 6 6 6 5 2 2
CPP-Small 1 1 1 1 3 3 3 4 4 3 1 1
DBP 2 2 3 1 4 4 4 4 4 4 3 2
SUB-TOTAL 15 15 40 247 291 296 309 343 368 256 30 14
Demand Response
Aggregator-managed
CBP-DA 3 3 3 2 5 5 6 6 5 5 3 2
CBP-DO 21 23 27 11 47 48 50 49 48 43 26 21
AMP 34 37 42 21 89 90 96 93 91 86 41 32
SUB-TOTAL 57 62 71 33 141 143 151 148 144 134 69 55
SmartConnect®-enabled
SPD with Tech. 1 1 6 13 14 15 16 17 18 17 8 2
SPD without Tech. 4 4 6 11 11 11 11 11 11 11 6 4
SUB-TOTAL 5 5 12 24 25 26 27 28 28 28 13 5
Non-event Based
RTP 0 0 0 -2 0 -1 -1 -3 6 -2 0 0
SMB Non-res. TOU 14 15 16 19 21 20 22 23 20 21 18 14
PLS 0 0 0 0 0 7 8 8 8 0 0 0
SUB-TOTAL 14 15 16 17 21 27 29 28 33 19 18 14
PORTFOLIO TOTAL 762 710 799 998 1,144 1,162 1,190 1,221 1,231 1,053 729 678

Portfolio Aggregate Ex Ante Load Impact Estimates for 1-in-10 CAISO System Conditions by Month and Forecast Year
126
Table H-8: 2022 Portfolio Aggregate Ex Ante Load Impact Estimates for 1-in-10 CAISO System Conditions
Program Type Program Monthly System Peak
Jan. Feb. Mar. Apr. May Jun. Jul. Aug. Sep. Oct. Nov. Dec.
Emergency
BIP-15 129 117 138 143 128 130 134 136 135 127 130 125
BIP-30 504 463 472 468 469 469 472 474 466 434 436 435
AP-I 39 34 50 65 69 72 68 64 56 56 33 29
SUB-TOTAL 672 614 660 676 666 670 674 675 657 617 598 589
Price-responsive
SDP-C 0 0 5 43 42 41 43 49 56 37 4 0
SDP-R 0 0 18 184 214 219 231 257 275 186 10 0
CPP-Large 10 10 11 10 15 15 14 14 14 14 11 10
CPP-Medium 2 2 2 2 5 6 6 6 6 5 2 2
CPP-Small 1 1 1 1 3 3 4 4 4 3 1 1
DBP 2 2 3 1 4 4 4 4 4 4 3 2
SUB-TOTAL 15 15 40 241 284 289 302 334 359 250 30 15
Demand Response
Aggregator-managed
CBP-DA 3 3 3 2 5 5 6 6 5 5 3 2
CBP-DO 21 23 27 11 47 48 50 49 48 43 26 21
AMP 34 37 42 21 89 90 96 93 91 86 41 32
SUB-TOTAL 57 62 71 33 141 143 151 148 144 134 69 55
SmartConnect®-enabled
SPD with Tech. 2 2 8 17 18 19 20 21 22 21 9 2
SPD without Tech. 4 4 6 11 11 11 11 11 11 10 6 4
SUB-TOTAL 5 5 14 28 29 29 30 31 32 31 15 6
Non-event Based
RTP 0 0 0 -2 0 -1 -1 -3 6 -2 0 0
SMB Non-res. TOU 14 15 16 19 21 20 22 23 20 21 18 14
PLS 0 0 0 0 0 7 8 8 8 0 0 0
SUB-TOTAL 14 15 16 17 21 27 29 28 33 19 18 14
PORTFOLIO TOTAL 763 711 801 995 1,140 1,158 1,186 1,216 1,226 1,051 731 679

Portfolio Aggregate Ex Ante Load Impact Estimates for 1-in-10 CAISO System Conditions by Month and Forecast Year
127
Table H-9: 2023 Portfolio Aggregate Ex Ante Load Impact Estimates for 1-in-10 CAISO System Conditions
Program Type Program Monthly System Peak
Jan. Feb. Mar. Apr. May Jun. Jul. Aug. Sep. Oct. Nov. Dec.
Emergency
BIP-15 129 117 138 143 128 130 134 136 135 127 130 125
BIP-30 504 463 472 468 469 469 472 474 466 434 436 435
AP-I 39 34 50 65 69 72 68 64 56 56 33 29
SUB-TOTAL 672 614 660 676 666 670 674 675 657 617 598 589
Price-responsive
SDP-C 0 0 5 41 41 40 41 47 54 36 4 0
SDP-R 0 0 18 179 209 213 225 251 268 181 9 0
CPP-Large 11 10 11 10 16 16 15 15 14 15 11 10
CPP-Medium 2 2 2 2 6 6 6 6 6 6 2 2
CPP-Small 1 1 1 1 3 3 4 4 4 3 1 1
DBP 2 2 3 1 4 4 4 4 4 4 3 2
SUB-TOTAL 16 16 40 235 278 282 295 327 351 244 31 15
Demand Response
Aggregator-managed
CBP-DA 3 3 3 2 5 5 6 6 5 5 3 2
CBP-DO 21 23 27 11 47 48 50 49 48 43 26 21
AMP 34 37 42 21 89 90 96 93 91 86 41 32
SUB-TOTAL 57 62 71 33 141 143 151 148 144 134 69 55
SmartConnect®-enabled
SPD with Tech. 2 2 10 21 22 22 24 25 26 25 11 3
SPD without Tech. 4 4 6 10 10 10 10 10 10 10 5 3
SUB-TOTAL 6 6 16 31 32 33 34 35 36 35 17 6
Non-event Based
RTP 0 0 0 -2 0 -1 -1 -3 6 -2 0 0
SMB Non-res. TOU 14 15 16 19 21 20 22 23 20 21 18 14
PLS 0 0 0 0 0 7 8 8 8 0 0 0
SUB-TOTAL 14 15 16 17 21 27 29 28 33 19 18 14
PORTFOLIO TOTAL 764 711 802 993 1,138 1,156 1,183 1,212 1,221 1,049 733 680

Portfolio Aggregate Ex Ante Load Impact Estimates for 1-in-10 CAISO System Conditions by Month and Forecast Year
128
Table H-10: 2024 Portfolio Aggregate Ex Ante Load Impact Estimates for 1-in-10 CAISO System Conditions
Program Type Program Monthly System Peak
Jan. Feb. Mar. Apr. May Jun. Jul. Aug. Sep. Oct. Nov. Dec.
Emergency
BIP-15 129 117 138 143 128 130 134 136 135 127 130 125
BIP-30 504 463 472 468 469 469 472 474 466 434 436 435
AP-I 39 34 50 65 69 72 68 64 56 56 33 29
SUB-TOTAL 672 614 660 676 666 670 674 675 657 617 598 589
Price-responsive
SDP-C 0 0 5 39 39 38 40 45 52 34 4 0
SDP-R 0 0 17 175 204 208 220 245 262 177 9 0
CPP-Large 11 11 11 10 16 16 15 15 14 15 12 11
CPP-Medium 2 2 2 3 6 6 6 7 7 6 2 2
CPP-Small 1 1 1 1 3 4 4 4 4 3 1 1
DBP 2 2 3 1 4 4 4 4 4 4 3 2
SUB-TOTAL 16 16 40 230 273 277 289 320 343 239 31 16
Demand Response
Aggregator-managed
CBP-DA 3 3 3 2 5 5 6 6 5 5 3 2
CBP-DO 21 23 27 11 47 48 50 49 48 43 26 21
AMP 34 37 42 21 89 90 96 93 91 86 41 32
SUB-TOTAL 57 62 71 33 141 143 151 148 144 134 69 55
SmartConnect®-enabled
SPD with Tech. 3 3 12 25 26 26 27 28 29 28 13 3
SPD without Tech. 3 3 5 10 10 10 10 10 10 10 5 3
SUB-TOTAL 6 6 17 35 36 36 37 38 39 37 18 6
Non-event Based
RTP 0 0 0 -2 0 -1 -1 -3 6 -2 0 0
SMB Non-res. TOU 14 15 16 19 21 20 22 23 20 21 18 14
PLS 0 0 0 0 0 7 8 7 7 0 0 0
SUB-TOTAL 14 15 16 17 21 27 28 28 33 19 18 14
PORTFOLIO TOTAL 765 712 804 991 1,136 1,153 1,179 1,208 1,216 1,047 734 680

Portfolio Aggregate Ex Ante Load Impact Estimates for 1-in-10 CAISO System Conditions by Month and Forecast Year
129
Table H-11: 2025 Portfolio Aggregate Ex Ante Load Impact Estimates for 1-in-10 CAISO System Conditions
Program Type Program Monthly System Peak
Jan. Feb. Mar. Apr. May Jun. Jul. Aug. Sep. Oct. Nov. Dec.
Emergency
BIP-15 129 117 138 143 128 130 134 136 135 127 130 125
BIP-30 504 463 472 468 469 469 472 474 466 434 436 435
AP-I 39 34 50 65 69 72 68 64 56 56 33 29
SUB-TOTAL 672 614 660 676 666 670 674 675 657 617 598 589
Price-responsive
SDP-C 0 0 5 38 38 37 38 44 51 33 4 0
SDP-R 0 0 17 171 199 204 215 240 256 173 9 0
CPP-Large 11 11 12 11 17 17 16 16 15 16 12 11
CPP-Medium 2 2 2 3 6 6 7 7 7 6 2 2
CPP-Small 1 1 1 1 3 4 4 4 4 3 1 1
DBP 2 2 3 1 4 4 4 4 4 4 3 2
SUB-TOTAL 17 16 39 225 268 272 284 314 337 235 31 16
Demand Response
Aggregator-managed
CBP-DA 3 3 3 2 5 5 6 6 5 5 3 2
CBP-DO 21 23 27 11 47 48 50 49 48 43 26 21
AMP 34 37 42 21 89 90 96 93 91 86 41 32
SUB-TOTAL 57 62 71 33 141 143 151 148 144 134 69 55
SmartConnect®-enabled
SPD with Tech. 3 3 13 27 28 28 30 31 32 30 14 3
SPD without Tech. 3 3 5 10 10 10 10 10 10 10 5 3
SUB-TOTAL 6 6 19 37 38 38 39 40 41 40 19 6
Non-event Based
RTP 0 0 0 -2 0 -1 -1 -3 6 -2 0 0
SMB Non-res. TOU 14 15 16 19 21 20 22 23 20 21 18 14
PLS 0 0 0 0 0 7 7 7 7 0 0 0
SUB-TOTAL 14 15 16 17 21 27 28 28 33 19 18 14
PORTFOLIO TOTAL 765 713 805 989 1,133 1,150 1,176 1,204 1,212 1,045 735 681

Program-specific Aggregate Ex Ante Load Impact Estimates for 1-in-2 CAISO System Conditions by Month and Forecast Year
130
Appendix I Program-specific Aggregate Ex Ante Load Impact Estimates for 1-in-2 CAISO System Conditions by Month and Forecast Year
Table I-1: 2015 Program-specific Aggregate Ex Ante Load Impact Estimates for 1-in-2 CAISO System Conditions
Program Type Program Monthly System Peak
Jan. Feb. Mar. Apr. May Jun. Jul. Aug. Sep. Oct. Nov. Dec.
Emergency
BIP-15 137 129 146 143 139 140 145 148 147 138 138 130
BIP-30 525 519 552 498 514 511 511 514 506 471 462 423
AP-I 33 30 39 57 62 65 63 60 51 48 28 27
SUB-TOTAL 695 678 738 698 715 717 719 722 704 657 629 579
Price-responsive
SDP-C 0 0 0 21 26 41 54 62 62 42 1 0
SDP-R 0 0 0 94 128 210 269 294 284 195 0 0
CPP-Large 15 15 15 16 26 24 21 22 22 24 16 14
CPP-Medium 0 0 0 0 0 0 0 0 0 0 0 0
CPP-Small 0 0 0 0 0 0 0 0 0 0 0 0
DBP 93 89 102 64 99 109 110 111 112 97 96 88
SUB-TOTAL 108 103 117 194 279 384 454 489 480 358 112 102
Demand Response
Aggregator-managed
CBP-DA 3 3 3 1 5 5 6 5 5 5 3 3
CBP-DO 21 22 24 10 45 47 50 49 47 42 25 22
AMP 35 35 36 20 86 88 95 93 90 85 40 34
SUB-TOTAL 59 60 63 32 135 141 150 147 142 132 68 59
SmartConnect®-enabled
SPD with Tech. 0 0 0 1 1 1 2 2 2 2 1 0
SPD without Tech. 9 9 13 24 25 25 26 25 25 24 13 8
SUB-TOTAL 9 9 13 25 26 27 27 27 27 26 14 8
Non-event Based
RTP 0 0 0 0 0 -10 3 23 3 0 0 0
SMB Non-res. TOU 13 13 14 18 19 21 21 21 22 19 14 14
PLS 0 0 0 0 0 0 0 0 0 0 0 0
SUB-TOTAL 14 14 14 18 19 12 24 45 24 19 15 14
PORTFOLIO TOTAL 884 864 945 967 1,174 1,280 1,375 1,430 1,378 1,192 838 762

Program-specific Aggregate Ex Ante Load Impact Estimates for 1-in-2 CAISO System Conditions by Month and Forecast Year
131
Table I-2: 2016 Program-specific Aggregate Ex Ante Load Impact Estimates for 1-in-2 CAISO System Conditions
Program Type Program Monthly System Peak
Jan. Feb. Mar. Apr. May Jun. Jul. Aug. Sep. Oct. Nov. Dec.
Emergency
BIP-15 133 125 142 139 135 136 141 143 142 134 134 128
BIP-30 512 506 539 485 501 498 498 501 494 459 450 411
AP-I 34 31 40 59 65 68 65 63 54 51 30 28
SUB-TOTAL 679 662 721 683 700 702 704 708 690 644 615 567
Price-responsive
SDP-C 0 0 0 20 25 38 52 59 59 40 1 0
SDP-R 0 0 0 90 123 202 259 283 273 188 0 0
CPP-Large 15 15 15 16 26 24 21 22 23 24 16 14
CPP-Medium 0 0 0 0 0 0 0 0 0 0 0 0
CPP-Small 0 0 0 0 0 0 0 0 0 0 0 0
DBP 91 86 100 60 93 102 103 104 105 91 90 83
SUB-TOTAL 106 101 115 186 267 367 435 468 459 342 107 97
Demand Response Aggregator-
managed
CBP-DA 3 3 3 1 5 5 6 5 5 5 3 3
CBP-DO 21 22 24 10 45 47 50 49 47 42 25 22
AMP 35 35 36 20 86 88 95 93 90 85 40 34
SUB-TOTAL 59 60 63 32 135 141 150 147 142 132 68 59
SmartConnect®-enabled
SPD with Tech. 0 0 1 2 2 3 3 3 4 3 1 0
SPD without Tech. 8 8 13 24 23 24 24 23 23 23 12 8
SUB-TOTAL 8 8 13 25 26 26 27 27 27 26 13 8
Non-event Based
RTP 0 0 0 0 0 -10 3 23 3 0 0 0
SMB Non-res. TOU 13 13 14 18 19 21 21 21 22 19 14 14
PLS 0* 0* 0* 0* 0* 0* 0* 0* 0* 0* 0* 0*
SUB-TOTAL 14 14 14 18 19 12 24 45 24 19 15 14
PORTFOLIO TOTAL 865 845 926 944 1,147 1,248 1,340 1,394 1,342 1,163 818 745
*Load impacts are redacted to protect confidential customer information

Program-specific Aggregate Ex Ante Load Impact Estimates for 1-in-2 CAISO System Conditions by Month and Forecast Year
132
Table I-3: 2017 Program-specific Aggregate Ex Ante Load Impact Estimates for 1-in-2 CAISO System Conditions
Program Type Program Monthly System Peak
Jan. Feb. Mar. Apr. May Jun. Jul. Aug. Sep. Oct. Nov. Dec.
Emergency
BIP-15 131 123 140 137 133 134 138 141 140 132 132 123
BIP-30 497 492 523 472 487 484 484 487 480 446 438 400
AP-I 36 33 43 62 68 72 69 66 56 53 31 29
SUB-TOTAL 664 648 706 670 688 690 692 694 676 631 601 553
Price-responsive
SDP-C 0 0 0 19 23 37 49 56 56 38 1 0
SDP-R 0 0 0 87 118 195 249 273 263 181 0 0
CPP-Large 16 15 16 16 27 25 22 23 23 24 16 15
CPP-Medium 0 0 0 5 11 12 13 13 13 11 4 4
CPP-Small 0 0 0 3 6 7 8 8 7 6 3 2
DBP 85 81 94 59 91 100 101 102 103 89 88 81
SUB-TOTAL 101 97 110 188 277 375 442 474 465 349 112 102
Demand Response
Aggregator-managed
CBP-DA 3 3 3 1 5 5 6 5 5 5 3 3
CBP-DO 21 22 24 10 45 47 50 49 47 42 25 22
AMP 35 35 36 20 86 88 95 93 90 85 40 34
SUB-TOTAL 59 60 63 32 135 141 150 147 142 132 68 59
SmartConnect®-enabled
SPD with Tech. 0 0 1 3 3 4 5 6 6 5 2 0
SPD without Tech. 8 8 12 22 22 23 23 22 22 22 12 7
SUB-TOTAL 8 8 13 25 26 27 28 28 28 27 14 8
Non-event Based
RTP 0 0 0 0 0 -10 3 23 3 0 0 0
SMB Non-res. TOU 13 13 14 18 19 21 21 21 22 19 14 14
PLS 0 0 0 0 0 5 5 5 5 0 0 0
SUB-TOTAL 14 14 14 18 19 16 29 49 29 19 15 14
PORTFOLIO TOTAL 845 826 905 933 1,145 1,249 1,341 1,392 1,340 1,158 810 736

Program-specific Aggregate Ex Ante Load Impact Estimates for 1-in-2 CAISO System Conditions by Month and Forecast Year
133
Table I-4: 2018 Program-specific Aggregate Ex Ante Load Impact Estimates for 1-in-2 CAISO System Conditions
Program Type Program Monthly System Peak
Jan. Feb. Mar. Apr. May Jun. Jul. Aug. Sep. Oct. Nov. Dec.
Emergency
BIP-15 127 119 135 132 129 130 134 137 136 128 130 123
BIP-30 484 479 509 459 474 471 471 474 467 434 432 400
AP-I 37 34 43 63 69 72 69 66 56 52 31 29
SUB-TOTAL 648 631 688 654 671 673 674 677 658 614 593 553
Price-responsive
SDP-C 0 0 0 18 22 35 47 53 53 36 1 0
SDP-R 0 0 0 84 114 188 241 263 254 175 0 0
CPP-Large 16 16 16 17 28 26 22 23 24 25 17 15
CPP-Medium 4 4 4 2 4 5 5 5 5 4 2 2
CPP-Small 2 2 2 1 2 3 3 3 3 2 1 1
DBP 85 81 94 59 91 100 101 102 103 89 88 81
SUB-TOTAL 108 103 116 180 263 356 419 450 442 332 109 99
Demand Response
Aggregator-managed
CBP-DA 3 3 3 1 5 5 6 5 5 5 3 3
CBP-DO 21 22 24 10 45 47 50 49 47 42 25 22
AMP 35 35 36 20 86 88 95 93 90 85 40 34
SUB-TOTAL 59 60 63 32 135 141 150 147 142 132 68 59
SmartConnect®-enabled
SPD with Tech. 0 0 2 5 5 7 9 9 10 8 3 0
SPD without Tech. 7 7 11 22 21 22 22 22 21 21 11 7
SUB-TOTAL 8 8 14 26 27 29 30 31 31 29 14 8
Non-event Based
RTP 0 0 0 0 0 -10 3 23 3 0 0 0
SMB Non-res. TOU 13 13 14 18 19 21 21 21 22 19 14 14
PLS 0 0 0 0 0 7 8 7 8 0 0 0
SUB-TOTAL 14 14 14 18 19 19 32 52 32 19 15 14
PORTFOLIO TOTAL 836 816 895 911 1,115 1,218 1,306 1,357 1,305 1,126 799 732

Program-specific Aggregate Ex Ante Load Impact Estimates for 1-in-2 CAISO System Conditions by Month and Forecast Year
134
Table I-5: 2019 Program-specific Aggregate Ex Ante Load Impact Estimates for 1-in-2 CAISO System Conditions
Program Type Program Monthly System Peak
Jan. Feb. Mar. Apr. May Jun. Jul. Aug. Sep. Oct. Nov. Dec.
Emergency
BIP-15 127 119 135 132 129 130 134 137 136 128 130 123
BIP-30 484 479 509 459 474 471 471 474 467 434 432 400
AP-I 37 34 43 63 69 72 69 66 56 52 31 29
SUB-TOTAL 648 631 688 654 671 673 674 677 658 614 593 553
Price-responsive
SDP-C 0 0 0 17 21 33 44 51 51 34 1 0
SDP-R 0 0 0 81 111 182 233 255 245 169 0 0
CPP-Large 17 16 17 17 29 27 23 24 25 26 17 16
CPP-Medium 2 2 2 2 4 5 5 5 5 5 2 2
CPP-Small 1 1 1 1 2 3 3 3 3 2 1 1
DBP 85 81 94 59 91 100 101 102 103 89 88 81
SUB-TOTAL 104 100 113 178 259 350 410 440 432 326 109 99
Demand Response
Aggregator-managed
CBP-DA 3 3 3 1 5 5 6 5 5 5 3 3
CBP-DO 21 22 24 10 45 47 50 49 47 42 25 22
AMP 35 35 36 20 86 88 95 93 90 85 40 34
SUB-TOTAL 59 60 63 32 135 141 150 147 142 132 68 59
SmartConnect®-enabled
SPD with Tech. 0 0 3 7 8 10 13 13 14 11 4 1
SPD without Tech. 7 7 11 21 21 21 21 21 21 20 11 7
SUB-TOTAL 8 8 14 28 29 31 34 34 34 31 15 8
Non-event Based
RTP 0 0 0 0 0 -10 3 23 3 0 0 0
SMB Non-res. TOU 13 13 14 18 19 21 21 21 22 19 14 14
PLS 0 0 0 0 0 7 8 7 8 0 0 0
SUB-TOTAL 14 14 14 18 19 19 32 52 32 19 15 14
PORTFOLIO TOTAL 832 813 892 910 1,114 1,214 1,301 1,350 1,299 1,122 800 733

Program-specific Aggregate Ex Ante Load Impact Estimates for 1-in-2 CAISO System Conditions by Month and Forecast Year
135
Table I-6: 2020 Program-specific Aggregate Ex Ante Load Impact Estimates for 1-in-2 CAISO System Conditions
Program Type Program Monthly System Peak
Jan. Feb. Mar. Apr. May Jun. Jul. Aug. Sep. Oct. Nov. Dec.
Emergency
BIP-15 127 119 135 132 129 130 134 137 136 128 130 123
BIP-30 484 479 509 459 474 471 471 474 467 434 432 400
AP-I 37 34 43 63 69 72 69 66 56 52 31 29
SUB-TOTAL 648 631 688 654 671 673 674 677 658 614 593 553
Price-responsive
SDP-C 0 0 0 16 20 32 42 48 49 33 1 0
SDP-R 0 0 0 79 107 177 226 247 238 164 0 0
CPP-Large 17 17 17 18 30 27 24 25 26 27 18 16
CPP-Medium 2 2 2 2 5 5 6 6 5 5 2 2
CPP-Small 1 1 1 1 2 3 3 3 3 3 1 1
DBP 85 81 94 59 91 100 101 102 103 89 88 81
SUB-TOTAL 105 101 114 175 256 344 402 431 424 320 110 100
Demand Response
Aggregator-managed
CBP-DA 3 3 3 1 5 5 6 5 5 5 3 3
CBP-DO 21 22 24 10 45 47 50 49 47 42 25 22
AMP 35 35 36 20 86 88 95 93 90 85 40 34
SUB-TOTAL 59 60 63 32 135 141 150 147 142 132 68 59
SmartConnect®-enabled
SPD with Tech. 1 1 5 10 12 14 18 19 19 15 6 1
SPD without Tech. 7 7 11 20 20 20 20 20 20 19 11 7
SUB-TOTAL 8 8 15 30 32 34 38 39 39 35 16 7
Non-event Based
RTP 0 0 0 0 0 -10 3 23 3 0 0 0
SMB Non-res. TOU 13 13 14 18 19 21 21 21 22 19 14 14
PLS 0 0 0 0 0 7 8 7 8 0 0 0
SUB-TOTAL 14 14 14 18 19 19 32 52 32 19 15 14
PORTFOLIO TOTAL 833 813 894 909 1,113 1,211 1,297 1,345 1,294 1,120 802 733

Program-specific Aggregate Ex Ante Load Impact Estimates for 1-in-2 CAISO System Conditions by Month and Forecast Year
136
Table I-7: 2021 Program-specific Aggregate Ex Ante Load Impact Estimates for 1-in-2 CAISO System Conditions
Program Type Program Monthly System Peak
Jan. Feb. Mar. Apr. May Jun. Jul. Aug. Sep. Oct. Nov. Dec.
Emergency
BIP-15 127 119 135 132 129 130 134 137 136 128 130 123
BIP-30 484 479 509 459 474 471 471 474 467 434 432 400
AP-I 37 34 43 63 69 72 69 66 56 52 31 29
SUB-TOTAL 648 631 688 654 671 673 674 677 658 614 593 553
Price-responsive
SDP-C 0 0 0 16 19 30 41 46 47 31 1 0
SDP-R 0 0 0 77 104 171 219 240 231 159 0 0
CPP-Large 18 17 18 18 31 28 25 26 26 28 18 17
CPP-Medium 2 2 2 2 5 5 6 6 6 5 2 2
CPP-Small 1 1 1 1 3 3 3 3 3 3 1 1
DBP 85 81 94 59 91 100 101 102 103 89 88 81
SUB-TOTAL 106 101 114 173 253 339 395 423 416 315 110 101
Demand Response
Aggregator-managed
CBP-DA 3 3 3 1 5 5 6 5 5 5 3 3
CBP-DO 21 22 24 10 45 47 50 49 47 42 25 22
AMP 35 35 36 20 86 88 95 93 90 85 40 34
SUB-TOTAL 59 60 63 32 135 141 150 147 142 132 68 59
SmartConnect®-enabled
SPD with Tech. 1 1 7 14 16 19 24 24 25 20 8 1
SPD without Tech. 7 7 10 19 19 19 19 19 19 19 10 6
SUB-TOTAL 7 7 17 33 35 39 43 44 44 39 18 8
Non-event Based
RTP 0 0 0 0 0 -10 3 23 3 0 0 0
SMB Non-res. TOU 13 13 14 18 19 21 21 21 22 19 14 14
PLS 0 0 0 0 0 7 8 7 8 0 0 0
SUB-TOTAL 14 14 14 18 19 19 32 52 32 19 15 14
PORTFOLIO TOTAL 833 814 896 910 1,114 1,210 1,295 1,342 1,292 1,119 804 734

Program-specific Aggregate Ex Ante Load Impact Estimates for 1-in-2 CAISO System Conditions by Month and Forecast Year
137
Table I-8: 2022 Program-specific Aggregate Ex Ante Load Impact Estimates for 1-in-2 CAISO System Conditions
Program Type Program Monthly System Peak
Jan. Feb. Mar. Apr. May Jun. Jul. Aug. Sep. Oct. Nov. Dec.
Emergency
BIP-15 127 119 135 132 129 130 134 137 136 128 130 123
BIP-30 484 479 509 459 474 471 471 474 467 434 432 400
AP-I 37 34 43 63 69 72 69 66 56 52 31 29
SUB-TOTAL 648 631 688 654 671 673 674 677 658 614 593 553
Price-responsive
SDP-C 0 0 0 15 19 29 39 45 45 30 1 0
SDP-R 0 0 0 75 101 167 213 234 225 155 0 0
CPP-Large 18 18 18 19 32 29 26 26 27 29 19 17
CPP-Medium 2 2 2 2 5 5 6 6 6 5 2 2
CPP-Small 1 1 1 1 3 3 3 3 3 3 1 1
DBP 85 81 94 59 91 100 101 102 103 89 88 81
SUB-TOTAL 106 102 115 171 251 334 389 416 409 311 111 101
Demand Response
Aggregator-managed
CBP-DA 3 3 3 1 5 5 6 5 5 5 3 3
CBP-DO 21 22 24 10 45 47 50 49 47 42 25 22
AMP 35 35 36 20 86 88 95 93 90 85 40 34
SUB-TOTAL 59 60 63 32 135 141 150 147 142 132 68 59
SmartConnect®-enabled
SPD with Tech. 1 1 9 18 20 25 30 31 31 25 10 1
SPD without Tech. 6 6 10 19 19 19 19 19 19 18 10 6
SUB-TOTAL 8 8 19 37 39 43 48 49 49 43 19 8
Non-event Based
RTP 0 0 0 0 0 -10 3 23 3 0 0 0
SMB Non-res. TOU 13 13 14 18 19 21 21 21 22 19 14 14
PLS 0 0 0 0 0 7 8 7 7 0 0 0
SUB-TOTAL 14 14 14 18 19 19 32 52 32 19 15 14
PORTFOLIO TOTAL 834 815 898 911 1,116 1,210 1,293 1,341 1,290 1,119 806 735

Program-specific Aggregate Ex Ante Load Impact Estimates for 1-in-2 CAISO System Conditions by Month and Forecast Year
138
Table I-9: 2023 Program-specific Aggregate Ex Ante Load Impact Estimates for 1-in-2 CAISO System Conditions
Program Type Program Monthly System Peak
Jan. Feb. Mar. Apr. May Jun. Jul. Aug. Sep. Oct. Nov. Dec.
Emergency
BIP-15 127 119 135 132 129 130 134 137 136 128 130 123
BIP-30 484 479 509 459 474 471 471 474 467 434 432 400
AP-I 37 34 43 63 69 72 69 66 56 52 31 29
SUB-TOTAL 648 631 688 654 671 673 674 677 658 614 593 553
Price-responsive
SDP-C 0 0 0 15 18 28 38 43 43 29 1 0
SDP-R 0 0 0 73 99 163 208 228 219 151 0 0
CPP-Large 19 19 19 20 33 30 26 27 28 30 20 18
CPP-Medium 2 2 2 2 5 6 6 6 6 5 2 2
CPP-Small 1 1 1 1 3 3 4 4 3 3 1 1
DBP 85 81 94 59 91 100 101 102 103 89 88 81
SUB-TOTAL 107 103 116 169 249 330 383 409 403 307 112 102
Demand Response
Aggregator-managed
CBP-DA 3 3 3 1 5 5 6 5 5 5 3 3
CBP-DO 21 22 24 10 45 47 50 49 47 42 25 22
AMP 35 35 36 20 86 88 95 93 90 85 40 34
SUB-TOTAL 59 60 63 32 135 141 150 147 142 132 68 59
SmartConnect®-enabled
SPD with Tech. 1 1 11 22 25 30 36 37 37 29 11 2
SPD without Tech. 6 6 10 18 18 18 18 18 18 18 10 6
SUB-TOTAL 8 8 20 40 43 48 54 55 55 47 21 8
Non-event Based
RTP 0 0 0 0 0 -10 3 23 3 0 0 0
SMB Non-res. TOU 13 13 14 18 19 21 21 21 22 19 14 14
PLS 0 0 0 0 0 7 8 7 7 0 0 0
SUB-TOTAL 14 14 14 18 19 19 32 52 32 19 15 14
PORTFOLIO TOTAL 835 815 901 913 1,117 1,211 1,293 1,339 1,289 1,119 809 735

Program-specific Aggregate Ex Ante Load Impact Estimates for 1-in-2 CAISO System Conditions by Month and Forecast Year
139
Table I-10: 2024 Program-specific Aggregate Ex Ante Load Impact Estimates for 1-in-2 CAISO System Conditions
Program Type Program Monthly System Peak
Jan. Feb. Mar. Apr. May Jun. Jul. Aug. Sep. Oct. Nov. Dec.
Emergency
BIP-15 127 119 135 132 129 130 134 137 136 128 130 123
BIP-30 484 479 509 459 474 471 471 474 467 434 432 400
AP-I 37 34 43 63 69 72 69 66 56 52 31 29
SUB-TOTAL 648 631 688 654 671 673 674 677 658 614 593 553
Price-responsive
SDP-C 0 0 0 14 17 27 36 41 42 28 1 0
SDP-R 0 0 0 71 97 159 203 222 214 147 0 0
CPP-Large 19 19 20 20 34 31 27 28 29 30 20 19
CPP-Medium 2 2 2 2 5 6 6 6 6 5 2 2
CPP-Small 1 1 1 1 3 3 4 4 4 3 1 1
DBP 85 81 94 59 91 100 101 102 103 89 88 81
SUB-TOTAL 108 103 116 167 247 326 378 404 397 303 112 103
Demand Response
Aggregator-managed
CBP-DA 3 3 3 1 5 5 6 5 5 5 3 3
CBP-DO 21 22 24 10 45 47 50 49 47 42 25 22
AMP 35 35 36 20 86 88 95 93 90 85 40 34
SUB-TOTAL 59 60 63 32 135 141 150 147 142 132 68 59
SmartConnect®-enabled
SPD with Tech. 2 2 13 26 29 34 40 41 41 33 13 2
SPD without Tech. 6 6 9 18 18 18 18 18 18 17 9 6
SUB-TOTAL 8 8 22 44 46 52 58 59 58 50 22 8
Non-event Based
RTP 0 0 0 0 0 -10 3 23 3 0 0 0
SMB Non-res. TOU 13 13 14 18 19 21 21 21 22 19 14 14
PLS 0 0 0 0 0 7 8 7 7 0 0 0
SUB-TOTAL 14 14 14 18 19 18 32 52 32 19 15 14
PORTFOLIO TOTAL 836 816 903 915 1,119 1,211 1,292 1,338 1,287 1,119 810 736

Program-specific Aggregate Ex Ante Load Impact Estimates for 1-in-2 CAISO System Conditions by Month and Forecast Year
140
Table I-11: 2025 Program-specific Aggregate Ex Ante Load Impact Estimates for 1-in-2 CAISO System Conditions
Program Type Program Monthly System Peak
Jan. Feb. Mar. Apr. May Jun. Jul. Aug. Sep. Oct. Nov. Dec.
Emergency
BIP-15 127 119 135 132 129 130 134 137 136 128 130 123
BIP-30 484 479 509 459 474 471 471 474 467 434 432 400
AP-I 37 34 43 63 69 72 69 66 56 52 31 29
SUB-TOTAL 648 631 688 654 671 673 674 677 658 614 593 553
Price-responsive
SDP-C 0 0 0 14 17 26 35 40 40 27 1 0
SDP-R 0 0 0 70 94 155 199 218 210 144 0 0
CPP-Large 20 20 20 21 35 32 28 29 30 31 21 19
CPP-Medium 2 2 2 2 5 6 6 6 6 5 2 2
CPP-Small 1 1 1 1 3 3 4 4 4 3 1 1
DBP 85 81 94 59 91 100 101 102 103 89 88 81
SUB-TOTAL 108 104 117 166 246 323 373 399 392 300 113 103
Demand Response
Aggregator-managed
CBP-DA 3 3 3 1 5 5 6 5 5 5 3 3
CBP-DO 21 22 24 10 45 47 50 49 47 42 25 22
AMP 35 35 36 20 86 88 95 93 90 85 40 34
SUB-TOTAL 59 60 63 32 135 141 150 147 142 132 68 59
SmartConnect®-enabled
SPD with Tech. 2 2 14 29 32 38 44 45 45 36 14 2
SPD without Tech. 6 6 9 17 17 17 17 17 17 17 9 6
SUB-TOTAL 8 8 23 46 49 55 62 62 62 53 23 8
Non-event Based
RTP 0 0 0 0 0 -10 3 23 3 0 0 0
SMB Non-res. TOU 13 13 14 18 19 21 21 21 22 19 14 14
PLS 0 0 0 0 0 6 7 7 7 0 0 0
SUB-TOTAL 14 14 14 18 19 18 31 51 31 19 15 14
PORTFOLIO TOTAL 836 817 905 916 1,121 1,211 1,291 1,336 1,285 1,119 812 737

Program-specific Ex Ante Load Impact Estimates for 1-in-10 CAISO System Conditions by Month and Forecast Year
141
Appendix J Program-specific Ex Ante Load Impact Estimates for 1-in-10 CAISO System Conditions by Month and Forecast Year
Table J-1: 2015 Program-specific Aggregate Ex Ante Load Impact Estimates for 1-in-10 CAISO System Conditions
Program Type Program Monthly System Peak
Jan. Feb. Mar. Apr. May Jun. Jul. Aug. Sep. Oct. Nov. Dec.
Emergency
BIP-15 139 127 149 155 138 140 145 147 146 138 138 131
BIP-30 547 502 512 507 509 508 511 514 505 471 466 460
AP-I 34 30 44 59 62 65 62 59 52 52 30 26
SUB-TOTAL 720 659 706 720 709 714 719 720 703 660 635 617
Price-responsive
SDP-C 0 0 7 59 59 58 60 68 79 52 6 0
SDP-R 0 0 23 232 270 276 291 324 347 234 12 0
CPP-Large 15 15 15 14 22 22 21 21 20 21 16 14
CPP-Medium 0 0 0 0 0 0 0 0 0 0 0 0
CPP-Small 0 0 0 0 0 0 0 0 0 0 0 0
DBP 95 88 101 69 98 108 110 111 111 97 95 87
SUB-TOTAL 110 103 147 374 449 464 482 524 557 403 129 102
Demand Response
Aggregator-managed
CBP-DA 3 3 3 2 5 5 6 6 5 5 3 2
CBP-DO 21 23 27 11 47 48 50 49 48 43 26 21
AMP 34 37 42 21 89 90 96 93 91 86 41 32
SUB-TOTAL 57 62 71 33 141 143 151 148 144 134 69 55
SmartConnect®-enabled
SPD with Tech. 0 0 0 1 1 2 2 2 3 2 1 0
SPD without Tech. 9 9 13 25 25 25 26 25 25 25 13 8
SUB-TOTAL 9 9 14 26 26 27 27 28 28 27 14 9
Non-event Based
RTP 0 0 0 12 0 3 3 23 29 12 0 0
SMB Non-res. TOU 14 15 16 19 21 20 22 23 20 21 18 14
PLS 0 0 0 0 0 0 0 0 0 0 0 0
SUB-TOTAL 14 15 17 31 21 23 24 46 49 32 18 14
PORTFOLIO TOTAL 910 847 954 1,185 1,346 1,371 1,403 1,466 1,481 1,256 865 798

Program-specific Ex Ante Load Impact Estimates for 1-in-10 CAISO System Conditions by Month and Forecast Year
142
Table J-2: 2016 Program-specific Aggregate Ex Ante Load Impact Estimates for 1-in-10 CAISO System Conditions
Program Type Program Monthly System Peak
Jan. Feb. Mar. Apr. May Jun. Jul. Aug. Sep. Oct. Nov
. Dec
.
Emergency
BIP-15 135 123 145 150 134 136 141 143 142 134 134 129
BIP-30 533 489 499 494 496 496 498 501 492 459 454 447
AP-I 36 31 46 61 65 68 65 62 54 55 32 28
SUB-TOTAL 703 643 690 705 695 699 704 706 688 647 620 604
Price-responsive
SDP-C 0 0 7 56 56 55 57 65 74 49 5 0
SDP-R 0 0 22 223 259 265 280 312 333 225 12 0
CPP-Large 15 15 16 14 23 22 21 21 20 21 16 15
CPP-Medium 0 0 0 0 0 0 0 0 0 0 0 0
CPP-Small 0 0 0 0 0 0 0 0 0 0 0 0
DBP 92 86 99 65 92 102 104 104 104 91 90 82
SUB-TOTAL 107 101 144 358 430 444 461 501 532 386 123 97
Demand Response Aggregator-
managed
CBP-DA 3 3 3 2 5 5 6 6 5 5 3 2
CBP-DO 21 23 27 11 47 48 50 49 48 43 26 21
AMP 34 37 42 21 89 90 96 93 91 86 41 32
SUB-TOTAL 57 62 71 33 141 143 151 148 144 134 69 55
SmartConnect®-enabled
SPD with Tech. 0 0 1 2 3 3 3 4 4 3 1 0
SPD without Tech. 8 8 13 24 24 24 24 24 23 23 12 8
SUB-TOTAL 9 9 14 26 26 27 27 27 27 27 13 8
Non-event Based
RTP 0 0 0 12 0 3 3 23 29 12 0 0
SMB Non-res. TOU 14 15 16 19 21 20 22 23 20 21 18 14
PLS 0* 0* 0* 0* 0* 0* 0* 0* 0* 0* 0* 0*
SUB-TOTAL 14 15 17 31 21 23 24 46 49 32 18 14
PORTFOLIO TOTAL 891 829 935 1,15
4 1,31
2 1,33
6 1,36
7 1,42
9 1,44
2 1,22
5 844 779
*Load impacts are redacted to protect confidential customer information

Program-specific Ex Ante Load Impact Estimates for 1-in-10 CAISO System Conditions by Month and Forecast Year
143

Program-specific Ex Ante Load Impact Estimates for 1-in-10 CAISO System Conditions by Month and Forecast Year
144
Table J-3: 2017 Program-specific Aggregate Ex Ante Load Impact Estimates for 1-in-10 CAISO System Conditions
Program Type Program Monthly System Peak
Jan. Feb. Mar. Apr. May Jun. Jul. Aug. Sep. Oct. Nov. Dec.
Emergency
BIP-15 133 121 142 148 132 134 138 141 140 132 132 125
BIP-30 518 475 485 481 482 482 484 487 478 446 441 435
AP-I 38 33 49 64 68 72 68 65 57 57 33 29
SUB-TOTAL 688 629 676 692 682 687 691 692 675 634 606 589
Price-responsive
SDP-C 0 0 7 53 53 52 54 61 71 46 5 0
SDP-R 0 0 21 215 250 256 270 300 321 217 11 0
CPP-Large 16 15 16 15 23 23 22 22 21 22 16 15
CPP-Medium 0 0 0 5 12 13 13 13 14 12 5 4
CPP-Small 0 0 0 3 7 7 8 8 8 7 3 2
DBP 86 80 93 64 90 100 102 102 102 89 88 81
SUB-TOTAL 102 96 137 355 435 450 468 507 537 393 128 102
Demand Response
Aggregator-managed
CBP-DA 3 3 3 2 5 5 6 6 5 5 3 2
CBP-DO 21 23 27 11 47 48 50 49 48 43 26 21
AMP 34 37 42 21 89 90 96 93 91 86 41 32
SUB-TOTAL 57 62 71 33 141 143 151 148 144 134 69 55
SmartConnect®-enabled
SPD with Tech. 0 0 1 3 4 5 5 6 7 6 2 0
SPD without Tech. 8 8 12 23 23 23 23 23 22 22 12 8
SUB-TOTAL 8 8 13 26 27 27 28 29 29 28 14 8
Non-event Based
RTP 0 0 0 12 0 3 3 23 29 12 0 0
SMB Non-res. TOU 14 15 16 19 21 20 22 23 20 21 18 14
PLS 0 0 0 0 0 5 5 5 5 0 0 0
SUB-TOTAL 14 15 17 31 21 28 29 51 54 32 18 14
PORTFOLIO TOTAL 870 810 914 1,138 1,306 1,336 1,367 1,427 1,439 1,221 835 769

Program-specific Ex Ante Load Impact Estimates for 1-in-10 CAISO System Conditions by Month and Forecast Year
145
Table J-4: 2018 Program-specific Aggregate Ex Ante Load Impact Estimates for 1-in-10 CAISO System Conditions
Program Type Program Monthly System Peak
Jan. Feb. Mar. Apr. May Jun. Jul. Aug. Sep. Oct. Nov. Dec.
Emergency
BIP-15 129 117 138 143 128 130 134 136 135 127 130 125
BIP-30 504 463 472 468 469 469 472 474 466 434 436 435
AP-I 39 34 50 65 69 72 68 64 56 56 33 29
SUB-TOTAL 672 614 660 676 666 670 674 675 657 617 598 589
Price-responsive
SDP-C 0 0 6 51 50 49 51 58 67 44 5 0
SDP-R 0 0 20 207 241 247 261 290 310 209 11 0
CPP-Large 16 16 17 15 24 24 22 22 21 22 17 16
CPP-Medium 4 4 5 2 5 5 5 5 5 5 2 2
CPP-Small 2 2 2 1 3 3 3 3 3 3 1 1
DBP 86 80 93 64 90 100 102 102 102 89 88 81
SUB-TOTAL 109 103 144 340 413 427 444 481 510 372 124 99
Demand Response
Aggregator-managed
CBP-DA 3 3 3 2 5 5 6 6 5 5 3 2
CBP-DO 21 23 27 11 47 48 50 49 48 43 26 21
AMP 34 37 42 21 89 90 96 93 91 86 41 32
SUB-TOTAL 57 62 71 33 141 143 151 148 144 134 69 55
SmartConnect®-enabled
SPD with Tech. 0 0 2 6 7 8 9 10 11 9 3 1
SPD without Tech. 8 8 12 22 22 22 22 22 22 21 11 7
SUB-TOTAL 8 8 14 28 29 30 31 32 33 31 14 8
Non-event Based
RTP 0 0 0 12 0 3 3 23 29 12 0 0
SMB Non-res. TOU 14 15 16 19 21 20 22 23 20 21 18 14
PLS 0 0 0 0 0 7 8 8 8 0 0 0
SUB-TOTAL 14 15 17 31 21 30 32 54 57 32 18 14
PORTFOLIO TOTAL 860 801 905 1,108 1,269 1,301 1,332 1,390 1,401 1,187 824 766

Program-specific Ex Ante Load Impact Estimates for 1-in-10 CAISO System Conditions by Month and Forecast Year
146
Table J-5: 2019 Program-specific Aggregate Ex Ante Load Impact Estimates for 1-in-10 CAISO System Conditions
Program Type Program Monthly System Peak
Jan. Feb. Mar. Apr. May Jun. Jul. Aug. Sep. Oct. Nov. Dec.
Emergency
BIP-15 129 117 138 143 128 130 134 136 135 127 130 125
BIP-30 504 463 472 468 469 469 472 474 466 434 436 435
AP-I 39 34 50 65 69 72 68 64 56 56 33 29
SUB-TOTAL 672 614 660 676 666 670 674 675 657 617 598 589
Price-responsive
SDP-C 0 0 6 48 48 47 49 56 64 42 5 0
SDP-R 0 0 20 201 233 239 252 281 300 203 11 0
CPP-Large 17 16 17 16 25 24 23 23 22 23 18 16
CPP-Medium 2 2 2 2 5 5 5 6 6 5 2 2
CPP-Small 1 1 1 1 3 3 3 3 3 3 1 1
DBP 86 80 93 64 90 100 102 102 102 89 88 81
SUB-TOTAL 106 99 139 332 404 418 434 470 498 365 124 99
Demand Response
Aggregator-managed
CBP-DA 3 3 3 2 5 5 6 6 5 5 3 2
CBP-DO 21 23 27 11 47 48 50 49 48 43 26 21
AMP 34 37 42 21 89 90 96 93 91 86 41 32
SUB-TOTAL 57 62 71 33 141 143 151 148 144 134 69 55
SmartConnect®-enabled
SPD with Tech. 1 1 3 9 11 12 13 14 15 13 4 1
SPD without Tech. 7 7 11 21 21 21 21 21 21 21 11 7
SUB-TOTAL 8 8 14 30 32 33 34 35 36 34 15 8
Non-event Based
RTP 0 0 0 12 0 3 3 23 29 12 0 0
SMB Non-res. TOU 14 15 16 19 21 20 22 23 20 21 18 14
PLS 0 0 0 0 0 7 8 8 8 0 0 0
SUB-TOTAL 14 15 17 31 21 30 32 54 57 32 18 14
PORTFOLIO TOTAL 857 798 901 1,102 1,263 1,295 1,325 1,382 1,392 1,182 825 767

Program-specific Ex Ante Load Impact Estimates for 1-in-10 CAISO System Conditions by Month and Forecast Year
147
Table J-6: 2020 Program-specific Aggregate Ex Ante Load Impact Estimates for 1-in-10 CAISO System Conditions
Program Type Program Monthly System Peak
Jan. Feb. Mar. Apr. May Jun. Jul. Aug. Sep. Oct. Nov. Dec.
Emergency
BIP-15 129 117 138 143 128 130 134 136 135 127 130 125
BIP-30 504 463 472 468 469 469 472 474 466 434 436 435
AP-I 39 34 50 65 69 72 68 64 56 56 33 29
SUB-TOTAL 672 614 660 676 666 670 674 675 657 617 598 589
Price-responsive
SDP-C 0 0 6 46 46 45 47 53 61 40 5 0
SDP-R 0 0 19 194 226 232 244 272 291 196 10 0
CPP-Large 17 17 18 16 26 25 24 24 23 24 18 17
CPP-Medium 2 2 2 2 5 5 6 6 6 5 2 2
CPP-Small 1 1 1 1 3 3 3 3 3 3 1 1
DBP 86 80 93 64 90 100 102 102 102 89 88 81
SUB-TOTAL 107 100 139 324 396 410 425 460 487 357 124 100
Demand Response
Aggregator-managed
CBP-DA 3 3 3 2 5 5 6 6 5 5 3 2
CBP-DO 21 23 27 11 47 48 50 49 48 43 26 21
AMP 34 37 42 21 89 90 96 93 91 86 41 32
SUB-TOTAL 57 62 71 33 141 143 151 148 144 134 69 55
SmartConnect®-enabled
SPD with Tech. 1 1 4 13 15 16 18 20 21 18 5 2
SPD without Tech. 7 7 11 20 20 20 20 20 20 20 11 7
SUB-TOTAL 8 8 15 33 35 36 38 40 41 38 16 8
Non-event Based
RTP 0 0 0 12 0 3 3 23 29 12 0 0
SMB Non-res. TOU 14 15 16 19 21 20 22 23 20 21 18 14
PLS 0 0 0 0 0 7 8 8 8 0 0 0
SUB-TOTAL 14 15 17 31 21 30 32 54 57 32 18 14
PORTFOLIO TOTAL 858 799 901 1,097 1,258 1,290 1,321 1,377 1,386 1,179 826 767

Program-specific Ex Ante Load Impact Estimates for 1-in-10 CAISO System Conditions by Month and Forecast Year
148
Table J-7: 2021 Program-specific Aggregate Ex Ante Load Impact Estimates for 1-in-10 CAISO System Conditions
Program Type Program Monthly System Peak
Jan. Feb. Mar. Apr. May Jun. Jul. Aug. Sep. Oct. Nov. Dec.
Emergency
BIP-15 129 117 138 143 128 130 134 136 135 127 130 125
BIP-30 504 463 472 468 469 469 472 474 466 434 436 435
AP-I 39 34 50 65 69 72 68 64 56 56 33 29
SUB-TOTAL 672 614 660 676 666 670 674 675 657 617 598 589
Price-responsive
SDP-C 0 0 5 44 44 43 45 51 59 39 4 0
SDP-R 0 0 19 189 220 225 237 264 283 191 10 0
CPP-Large 18 17 18 17 26 26 25 24 23 25 19 17
CPP-Medium 2 2 2 2 5 6 6 6 6 5 2 2
CPP-Small 1 1 1 1 3 3 3 4 4 3 1 1
DBP 86 80 93 64 90 100 102 102 102 89 88 81
SUB-TOTAL 107 101 139 317 389 402 417 451 477 351 124 101
Demand Response
Aggregator-managed
CBP-DA 3 3 3 2 5 5 6 6 5 5 3 2
CBP-DO 21 23 27 11 47 48 50 49 48 43 26 21
AMP 34 37 42 21 89 90 96 93 91 86 41 32
SUB-TOTAL 57 62 71 33 141 143 151 148 144 134 69 55
SmartConnect®-enabled
SPD with Tech. 2 2 6 18 20 22 24 26 28 24 7 2
SPD without Tech. 7 7 11 20 20 19 19 19 19 19 10 7
SUB-TOTAL 8 8 16 37 39 41 43 45 47 43 17 9
Non-event Based
RTP 0 0 0 12 0 3 3 23 29 12 0 0
SMB Non-res. TOU 14 15 16 19 21 20 22 23 20 21 18 14
PLS 0 0 0 0 0 7 8 8 8 0 0 0
SUB-TOTAL 14 15 17 31 21 30 32 54 57 32 18 14
PORTFOLIO TOTAL 858 799 902 1,095 1,255 1,288 1,318 1,373 1,382 1,178 827 768

Program-specific Ex Ante Load Impact Estimates for 1-in-10 CAISO System Conditions by Month and Forecast Year
149
Table J-8: 2022 Program-specific Aggregate Ex Ante Load Impact Estimates for 1-in-10 CAISO System Conditions
Program Type Program Monthly System Peak
Jan. Feb. Mar. Apr. May Jun. Jul. Aug. Sep. Oct. Nov. Dec.
Emergency
BIP-15 129 117 138 143 128 130 134 136 135 127 130 125
BIP-30 504 463 472 468 469 469 472 474 466 434 436 435
AP-I 39 34 50 65 69 72 68 64 56 56 33 29
SUB-TOTAL 672 614 660 676 666 670 674 675 657 617 598 589
Price-responsive
SDP-C 0 0 5 43 42 41 43 49 56 37 4 0
SDP-R 0 0 18 184 214 219 231 257 275 186 10 0
CPP-Large 19 18 19 17 27 27 25 25 24 25 19 18
CPP-Medium 2 2 2 2 5 6 6 6 6 5 2 2
CPP-Small 1 1 1 1 3 3 4 4 4 3 1 1
DBP 86 80 93 64 90 100 102 102 102 89 88 81
SUB-TOTAL 108 101 139 311 382 396 410 443 468 346 124 101
Demand Response
Aggregator-managed
CBP-DA 3 3 3 2 5 5 6 6 5 5 3 2
CBP-DO 21 23 27 11 47 48 50 49 48 43 26 21
AMP 34 37 42 21 89 90 96 93 91 86 41 32
SUB-TOTAL 57 62 71 33 141 143 151 148 144 134 69 55
SmartConnect®-enabled
SPD with Tech. 2 2 7 23 25 27 30 32 34 29 9 2
SPD without Tech. 7 7 10 19 19 19 19 19 19 19 10 6
SUB-TOTAL 9 9 18 42 44 46 49 51 53 48 19 9
Non-event Based
RTP 0 0 0 12 0 3 3 23 29 12 0 0
SMB Non-res. TOU 14 15 16 19 21 20 22 23 20 21 18 14
PLS 0 0 0 0 0 7 8 8 8 0 0 0
SUB-TOTAL 14 15 17 31 21 30 32 54 57 32 18 14
PORTFOLIO TOTAL 859 800 904 1,093 1,254 1,286 1,316 1,371 1,380 1,177 829 769

Program-specific Ex Ante Load Impact Estimates for 1-in-10 CAISO System Conditions by Month and Forecast Year
150
Table J-9: 2023 Program-specific Aggregate Ex Ante Load Impact Estimates for 1-in-10 CAISO System Conditions
Program Type Program Monthly System Peak
Jan. Feb. Mar. Apr. May Jun. Jul. Aug. Sep. Oct. Nov. Dec.
Emergency
BIP-15 129 117 138 143 128 130 134 136 135 127 130 125
BIP-30 504 463 472 468 469 469 472 474 466 434 436 435
AP-I 39 34 50 65 69 72 68 64 56 56 33 29
SUB-TOTAL 672 614 660 676 666 670 674 675 657 617 598 589
Price-responsive
SDP-C 0 0 5 41 41 40 41 47 54 36 4 0
SDP-R 0 0 18 179 209 213 225 251 268 181 9 0
CPP-Large 19 19 19 18 28 28 26 26 25 26 20 18
CPP-Medium 2 2 2 2 6 6 6 6 6 6 2 2
CPP-Small 1 1 1 1 3 3 4 4 4 3 1 1
DBP 86 80 93 64 90 100 102 102 102 89 88 81
SUB-TOTAL 109 102 139 305 376 390 404 436 460 341 125 102
Demand Response
Aggregator-managed
CBP-DA 3 3 3 2 5 5 6 6 5 5 3 2
CBP-DO 21 23 27 11 47 48 50 49 48 43 26 21
AMP 34 37 42 21 89 90 96 93 91 86 41 32
SUB-TOTAL 57 62 71 33 141 143 151 148 144 134 69 55
SmartConnect®-enabled
SPD with Tech. 2 2 9 28 31 33 36 39 41 35 11 3
SPD without Tech. 6 6 10 18 18 18 18 18 18 18 10 6
SUB-TOTAL 9 9 19 46 49 52 54 57 59 53 20 9
Non-event Based
RTP 0 0 0 12 0 3 3 23 29 12 0 0
SMB Non-res. TOU 14 15 16 19 21 20 22 23 20 21 18 14
PLS 0 0 0 0 0 7 8 8 8 0 0 0
SUB-TOTAL 14 15 17 31 21 30 32 54 57 32 18 14
PORTFOLIO TOTAL 860 801 905 1,092 1,253 1,285 1,315 1,369 1,377 1,177 831 770

Program-specific Ex Ante Load Impact Estimates for 1-in-10 CAISO System Conditions by Month and Forecast Year
151
Table J-10: 2024 Program-specific Aggregate Ex Ante Load Impact Estimates for 1-in-10 CAISO System Conditions
Program Type Program Monthly System Peak
Jan. Feb. Mar. Apr. May Jun. Jul. Aug. Sep. Oct. Nov. Dec.
Emergency
BIP-15 129 117 138 143 128 130 134 136 135 127 130 125
BIP-30 504 463 472 468 469 469 472 474 466 434 436 435
AP-I 39 34 50 65 69 72 68 64 56 56 33 29
SUB-TOTAL 672 614 660 676 666 670 674 675 657 617 598 589
Price-responsive
SDP-C 0 0 5 39 39 38 40 45 52 34 4 0
SDP-R 0 0 17 175 204 208 220 245 262 177 9 0
CPP-Large 20 19 20 18 29 29 27 27 26 27 21 19
CPP-Medium 2 2 2 3 6 6 6 7 7 6 2 2
CPP-Small 1 1 1 1 3 4 4 4 4 3 1 1
DBP 86 80 93 64 90 100 102 102 102 89 88 81
SUB-TOTAL 109 103 139 300 371 385 398 430 453 336 125 103
Demand Response
Aggregator-managed
CBP-DA 3 3 3 2 5 5 6 6 5 5 3 2
CBP-DO 21 23 27 11 47 48 50 49 48 43 26 21
AMP 34 37 42 21 89 90 96 93 91 86 41 32
SUB-TOTAL 57 62 71 33 141 143 151 148 144 134 69 55
SmartConnect®-enabled
SPD with Tech. 3 3 11 33 36 38 41 43 45 39 12 3
SPD without Tech. 6 6 10 18 18 18 18 18 18 18 9 6
SUB-TOTAL 9 9 21 51 54 56 59 61 63 56 21 9
Non-event Based
RTP 0 0 0 12 0 3 3 23 29 12 0 0
SMB Non-res. TOU 14 15 16 19 21 20 22 23 20 21 18 14
PLS 0 0 0 0 0 7 8 7 7 0 0 0
SUB-TOTAL 14 15 17 31 21 30 32 54 57 32 18 14
PORTFOLIO TOTAL 861 802 907 1,091 1,252 1,284 1,314 1,367 1,374 1,176 832 771

Program-specific Ex Ante Load Impact Estimates for 1-in-10 CAISO System Conditions by Month and Forecast Year
152
Table J-11: 2025 Program-specific Aggregate Ex Ante Load Impact Estimates for 1-in-10 CAISO System Conditions
Program Type Program Monthly System Peak
Jan. Feb. Mar. Apr. May Jun. Jul. Aug. Sep. Oct. Nov. Dec.
Emergency
BIP-15 129 117 138 143 128 130 134 136 135 127 130 125
BIP-30 504 463 472 468 469 469 472 474 466 434 436 435
AP-I 39 34 50 65 69 72 68 64 56 56 33 29
SUB-TOTAL 672 614 660 676 666 670 674 675 657 617 598 589
Price-responsive
SDP-C 0 0 5 38 38 37 38 44 51 33 4 0
SDP-R 0 0 17 171 199 204 215 240 256 173 9 0
CPP-Large 20 20 21 19 30 30 28 28 27 28 21 20
CPP-Medium 2 2 2 3 6 6 7 7 7 6 2 2
CPP-Small 1 1 1 1 3 4 4 4 4 3 1 1
DBP 86 80 93 64 90 100 102 102 102 89 88 81
SUB-TOTAL 110 103 139 296 367 380 394 424 447 332 125 103
Demand Response
Aggregator-managed
CBP-DA 3 3 3 2 5 5 6 6 5 5 3 2
CBP-DO 21 23 27 11 47 48 50 49 48 43 26 21
AMP 34 37 42 21 89 90 96 93 91 86 41 32
SUB-TOTAL 57 62 71 33 141 143 151 148 144 134 69 55
SmartConnect®-enabled
SPD with Tech. 3 3 12 36 40 42 45 48 50 43 13 4
SPD without Tech. 6 6 9 17 17 17 17 17 17 17 9 6
SUB-TOTAL 9 9 22 54 57 59 62 65 67 60 22 10
Non-event Based
RTP 0 0 0 12 0 3 3 23 29 12 0 0
SMB Non-res. TOU 14 15 16 19 21 20 22 23 20 21 18 14
PLS 0 0 0 0 0 7 7 7 7 0 0 0
SUB-TOTAL 14 15 17 31 21 30 32 53 57 32 18 14
PORTFOLIO TOTAL 862 803 908 1,090 1,251 1,283 1,313 1,365 1,372 1,176 833 772