report the missing pieces - ippr
TRANSCRIPT

Institute for Public Policy Research
Tony Dolphin and Izzy Hatfield
August 2015 © IPPR 2015
REPORT
THE MISSING PIECESSOLVING BRITAIN’S PRODUCTIVITY PUZZLE

IDEAS to CHANGE BRITAIN
ABOUT IPPRIPPR, the Institute for Public Policy Research, is the UK’s leading progressive thinktank. We are an independent charitable organisation with more than 40 staff members, paid interns and visiting fellows. Our main office is in London, with IPPR North, IPPR’s dedicated thinktank for the North of England, operating out of offices in Newcastle and Manchester.
The purpose of our work is to conduct and publish the results of research into and promote public education in the economic, social and political sciences, and in science and technology, including the effect of moral, social, political and scientific factors on public policy and on the living standards of all sections of the community.
IPPR 4th Floor 14 Buckingham Street London WC2N 6DF T: +44 (0)20 7470 6100 E: [email protected] www.ippr.org Registered charity no. 800065
This paper was first published in August 2015. © 2015 The contents and opinions in this paper are the authors’ only.

IPPR | The missing pieces: Solving Britain’s productivity puzzle1
CONTENTS
Summary ............................................................................................................3
1. Introduction ....................................................................................................5
2. The productivity gap .................................................................................... 10
3. The productivity puzzle: basic facts ............................................................ 14
4. The productivity puzzle: theories ................................................................. 19
4.1 Demand-side theories .................................................................................... 21
4.2 Supply-side theories ...................................................................................... 24
4.3 Long-term theories ........................................................................................ 25
5. The productivity puzzle: analysis ................................................................. 27
5.1 Data measurement issues .............................................................................. 27
5.2 Spare capacity ............................................................................................... 28
5.3 Real wage growth .......................................................................................... 30
5.4 Total factor productivity and the capital stock ................................................. 32
5.5 The composition of the workforce .................................................................. 33
5.6 The industrial composition of the workforce ................................................... 35
5.7 Firm-level analysis .......................................................................................... 43
5.8 Company failures ........................................................................................... 44
6. Conclusions and implications ...................................................................... 46
6.1 Analytical conclusions .................................................................................... 46
6.2 Implications ................................................................................................... 48
References ....................................................................................................... 50

IPPR | The missing pieces: Solving Britain’s productivity puzzle2
ABOUT THE AUTHORSTony Dolphin is senior economist and associate director for economic policy at IPPR.
Izzy Hatfield is a researcher at IPPR.
ACKNOWLEDGMENTSThe authors would like to thank their IPPR colleagues Nick Pearce, Josh Goodman and Sarah Mulley for their comments on an earlier draft of this report. Responsibility for any errors within it lies with the authors.
DownloadThis document is available to download as a free PDF and in other formats at: http://www.ippr.org/publications/the-missing-pieces-solving-the-uks-productivity-puzzle
CitationIf you are using this document in your own writing, our preferred citation is:
Dolphin T and Hatfield I (2015) The missing pieces: Solving Britain’s productivity puzzle, IPPR. http://www.ippr.org/publications/the-missing-pieces-solving-the-uks-productivity-puzzle
Permission to shareThis document is published under a creative commons licence: Attribution-NonCommercial-NoDerivs 2.0 UK http://creativecommons.org/licenses/by-nc-nd/2.0/uk/ For commercial use, please contact [email protected]

IPPR | The missing pieces: Solving Britain’s productivity puzzle3
SUMMARY
Two key statistics about the UK’s recent productivity performance are now common currency. First, there is a productivity gap of between 23 and 32 per cent between the UK and otherwise comparable countries: Germany, France, the Netherlands and Belgium. Second, there is a productivity gap of 17 per cent between the UK’s current level of productivity and what it would have been if it had continued to increase, at the average rate for the 25 years up to 2007, both during and after the 2007–2008 financial crash.
This report presents new evidence on both aspects of the UK’s productivity puzzle. We have used ‘shift-share’ analysis to decompose these productivity gaps into the part that is due to differences in productivity within sectors, and the part that is due to structural differences in the sectoral mix of the economy (plus a cross-effect), with the aim of arriving at a better understanding of why the UK’s productivity performance has been so poor.
This new analysis demonstrates that the productivity gap between the UK and the four European countries mentioned above is wholly the result of lower productivity within industries in the UK, and not the result of a bias in the industrial composition of the UK economy as a whole towards relatively low-productivity sectors. Specifically, the UK’s relatively poor productivity in manufacturing, wholesaling and retailing, and transport, accommodation and food services explains much of the aggregate gap. Manufacturing in the UK is 27 per cent less productive than in France, and 33 per cent less productive than in Germany; the comparable figures for wholesaling and retailing, transport, accommodation and food services are 25 per cent and 16 per cent respectively.1
Similar analysis shows that the productivity growth that the UK has ‘lost’ between 2008 and 2015 is wholly the result of developments within sectors. Falls in productivity in North Sea oil and gas production, and in parts of the financial sector – the former a long-term trend, the latter the result of the financial crash – are important, but only explain a small part of what has happened. Across almost all sectors of the economy (the main exceptions being the administrative and support services sector and automobile production), productivity growth since 2008 has been lower than it was prior to the crash.
However, based on our analysis of the historical and international records, we suggest that over the last seven years there were two distinct phases of productivity weakness which should be analysed separately, and which pose two distinct questions. First, why did employment not fall further during the recession, given how much output fell? Second, why did productivity not increase over the last three years, despite economic recovery becoming firmly established?
When we analyse these two periods separately, we find that poor performance in terms of productivity during the recession was wholly a within-sector phenomenon – the result of labour-hoarding and a shift in the capital–labour ratio facilitated by falls in real wages. However, while within-sector effects remained a drag on productivity between 2012 and 2014, around half of the weakness in productivity growth in this period was the result of an unfavourable shift in the structure of the economy. While jobs growth may have been strong during these three years of decent economic growth, it was disproportionately in low value-added – and low-paid – sectors of
1 See table 2.2 for definitions of the nine sectors examined in this part of our analysis.

IPPR | The missing pieces: Solving Britain’s productivity puzzle4
the economy. A larger proportion of the labour force now works in relatively low-productivity sectors – particularly the accommodation and food sector – and a smaller proportion works in high-productivity jobs in finance and manufacturing.
The key to restoring productivity growth is, therefore, to shift job-creation towards higher-productivity sectors, while encouraging firms to invest more in order to boost the productivity of their existing workforces.
An improvement in the UK’s productivity performance would enable average living standards to increase. It would also make it easier for the government to eliminate its budget deficit during the current parliament. Kick-starting Britain’s productivity engine should be an economic policy priority for the government.
In this respect, the government’s decision to increase the minimum wage – or ‘national living wage’ – to £9 by the end of the decade is to be welcomed. If unemployment remains low, there is a good chance that lifting the wages of low-paid workers will encourage firms to improve their productivity performance. However, this alone will not be sufficient. This report does not contain a detailed discussion of policy options, but its analysis indicates the need for the government to change its current focus.
At present, the government’s efforts are for the most part concentrated on support for high-end manufacturing industries, including the automobile and aerospace industries. There are, for example, nine catapult centres covering areas such as high-value manufacturing, digital, precision medicine and energy systems, but none for the domestic service sectors such as wholesaling and retailing, accommodation and food. Millions of people are employed in these sectors, and their share of the economy has been increasing in recent years. The country’s productivity gaps cannot be closed unless productivity in these areas is lifted. The government should do more to support them.
It should also think more carefully about the effects that its spending policies have productivity. Cuts to capital spending on infrastructure, further education and, in real terms, the science budget during the last parliament are likely to have contributed to the weakness of productivity by discouraging business investment. Similar cuts over the next few years risk holding back future productivity growth.
IPPR | The missing pieces: Solving Britain’s productivity puzzle5
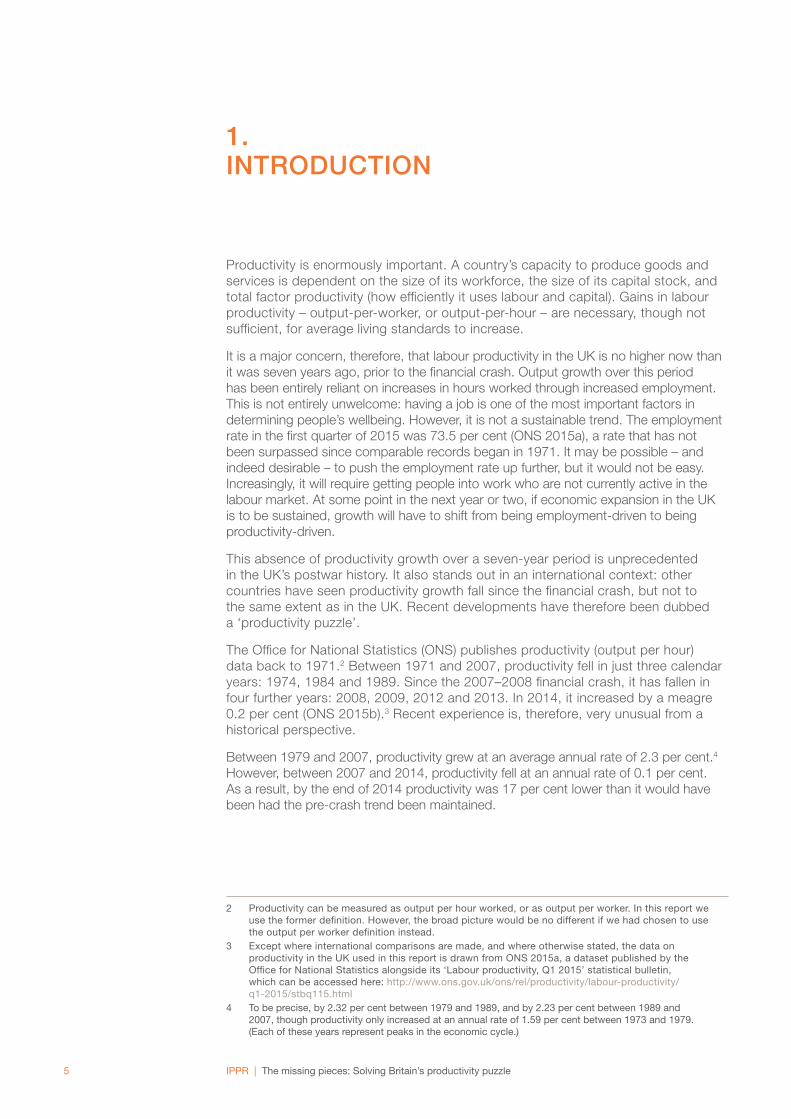
1. INTRODUCTION
Productivity is enormously important. A country’s capacity to produce goods and services is dependent on the size of its workforce, the size of its capital stock, and total factor productivity (how efficiently it uses labour and capital). Gains in labour productivity – output-per-worker, or output-per-hour – are necessary, though not sufficient, for average living standards to increase.
It is a major concern, therefore, that labour productivity in the UK is no higher now than it was seven years ago, prior to the financial crash. Output growth over this period has been entirely reliant on increases in hours worked through increased employment. This is not entirely unwelcome: having a job is one of the most important factors in determining people’s wellbeing. However, it is not a sustainable trend. The employment rate in the first quarter of 2015 was 73.5 per cent (ONS 2015a), a rate that has not been surpassed since comparable records began in 1971. It may be possible – and indeed desirable – to push the employment rate up further, but it would not be easy. Increasingly, it will require getting people into work who are not currently active in the labour market. At some point in the next year or two, if economic expansion in the UK is to be sustained, growth will have to shift from being employment-driven to being productivity-driven.
This absence of productivity growth over a seven-year period is unprecedented in the UK’s postwar history. It also stands out in an international context: other countries have seen productivity growth fall since the financial crash, but not to the same extent as in the UK. Recent developments have therefore been dubbed a ‘productivity puzzle’.
The Office for National Statistics (ONS) publishes productivity (output per hour) data back to 1971.2 Between 1971 and 2007, productivity fell in just three calendar years: 1974, 1984 and 1989. Since the 2007–2008 financial crash, it has fallen in four further years: 2008, 2009, 2012 and 2013. In 2014, it increased by a meagre 0.2 per cent (ONS 2015b).3 Recent experience is, therefore, very unusual from a historical perspective.
Between 1979 and 2007, productivity grew at an average annual rate of 2.3 per cent.4 However, between 2007 and 2014, productivity fell at an annual rate of 0.1 per cent. As a result, by the end of 2014 productivity was 17 per cent lower than it would have been had the pre-crash trend been maintained.
2 Productivity can be measured as output per hour worked, or as output per worker. In this report we use the former definition. However, the broad picture would be no different if we had chosen to use the output per worker definition instead.
3 Except where international comparisons are made, and where otherwise stated, the data on productivity in the UK used in this report is drawn from ONS 2015a, a dataset published by the Office for National Statistics alongside its ‘Labour productivity, Q1 2015’ statistical bulletin, which can be accessed here: http://www.ons.gov.uk/ons/rel/productivity/labour-productivity/q1-2015/stbq115.html
4 To be precise, by 2.32 per cent between 1979 and 1989, and by 2.23 per cent between 1989 and 2007, though productivity only increased at an annual rate of 1.59 per cent between 1973 and 1979. (Each of these years represent peaks in the economic cycle.)

IPPR | The missing pieces: Solving Britain’s productivity puzzle6
Figure 1.1Annual growth (%) in output, hours worked and output per hour, UK, 1972–2014
Output (GVA)Output per hour Hours
-8%
-6%
-4%
-2%
0%
2%
4%
6%
8%
2014
2012
2010
2008
2006
2004
2002
2000
1998
1996
1994
1992
1990
1988
1986
1984
1982
1980
1978
1976
1974
1972
Source: ONS 2015b
Figure 1.2Actual output per hour and 1971–2007 trend, UK, Q1 1971–Q1 2015 (2011 = 100)
40
50
60
70
80
90
100
110
120
130
Q1 201
3
Q1 201
0
Q1 200
7
Q1 200
4
Q1 200
1
Q1 199
8
Q1 199
5
Q1 199
2
Q1 198
9
Q1 198
6
Q1 198
3
Q1 198
0
Q1 197
7
Q1 197
4
Q1 197
1
Actual
Trend
Source: authors’ calculations based on ONS 2015a
Getting productivity back onto an upward trend is essential if we are to tackle the two problems widely identified as the UK’s main economic concerns: stagnant standards of living, and eliminating the government’s budget deficit.
Economic theory suggests that workers’ real wages will be closely linked to their value-added, and that their real wages will rise as they become more productive. Unsurprisingly, therefore, there is a close historical relationship at the aggregate
IPPR | The missing pieces: Solving Britain’s productivity puzzle7
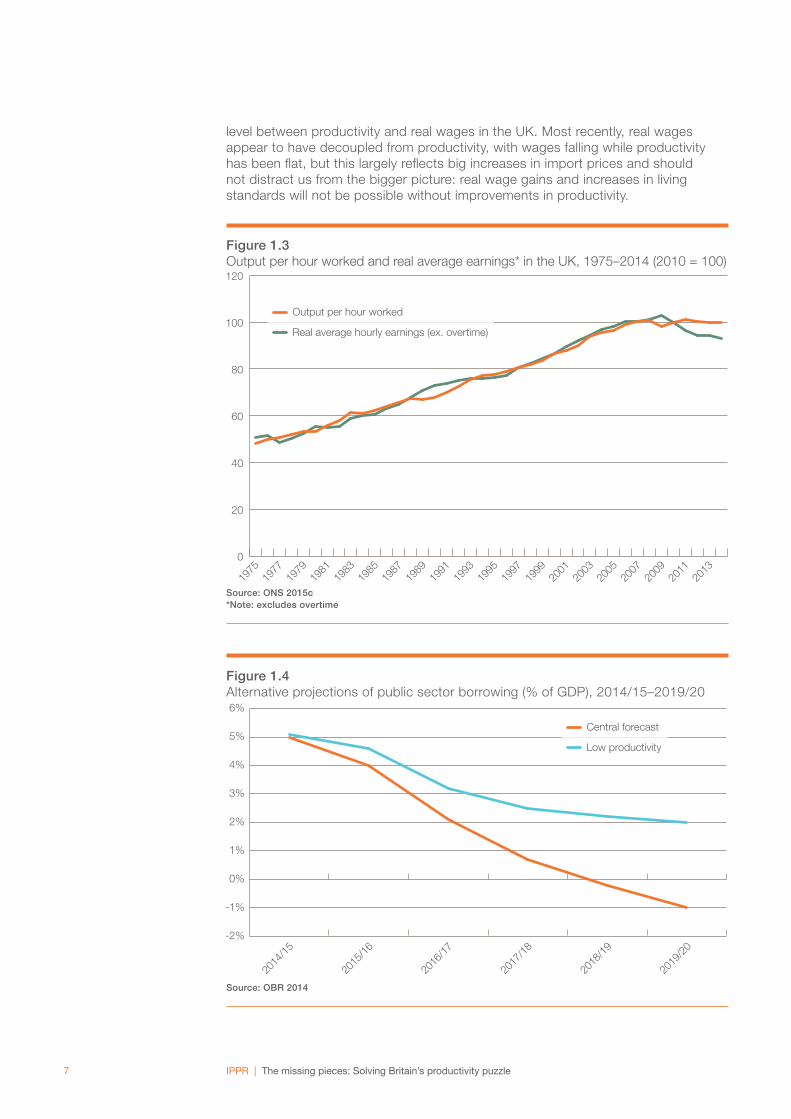
level between productivity and real wages in the UK. Most recently, real wages appear to have decoupled from productivity, with wages falling while productivity has been flat, but this largely reflects big increases in import prices and should not distract us from the bigger picture: real wage gains and increases in living standards will not be possible without improvements in productivity.
Figure 1.3Output per hour worked and real average earnings* in the UK, 1975–2014 (2010 = 100)
0
20
40
60
80
100
120
2013
2011
2009
2007
2005
2003
2001
1999
1997
1995
1993
1991
1989
1987
1985
1983
1981
1979
1977
1975
Output per hour worked
Real average hourly earnings (ex. overtime)
Source: ONS 2015c *Note: excludes overtime
Figure 1.4Alternative projections of public sector borrowing (% of GDP), 2014/15–2019/20
-2%
-1%
0%
1%
2%
3%
4%
5%
6%
Central forecast
Low productivity
2019
/20
2018
/19
2017
/18
2016
/17
2015
/16
2014
/15
Source: OBR 2014
IPPR | The missing pieces: Solving Britain’s productivity puzzle8
Increases in productivity are also essential if the budget deficit is to be eliminated during the current parliament. Projections from the Office for Budget Responsibility (OBR) published in December 2014, showed public sector net borrowing being eliminated by 2018/19 in the central forecast – but this incorporated a recovery in productivity growth. The OBR also produced a variant scenario in which productivity recovers to a lesser extent, and in which there would still be a deficit in 2018/19 equivalent to over 2 per cent of GDP (OBR 2014; see figure 1.4 above).5
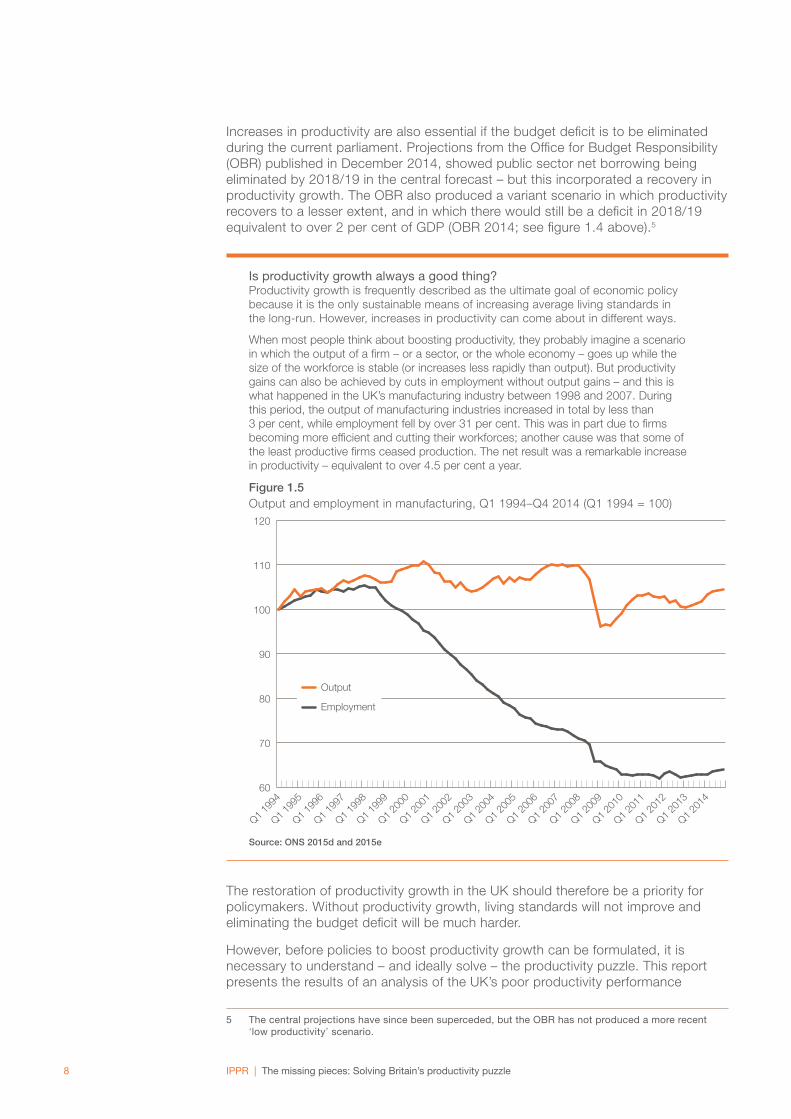
Is productivity growth always a good thing?Productivity growth is frequently described as the ultimate goal of economic policy because it is the only sustainable means of increasing average living standards in the long-run. However, increases in productivity can come about in different ways.
When most people think about boosting productivity, they probably imagine a scenario in which the output of a firm – or a sector, or the whole economy – goes up while the size of the workforce is stable (or increases less rapidly than output). But productivity gains can also be achieved by cuts in employment without output gains – and this is what happened in the UK’s manufacturing industry between 1998 and 2007. During this period, the output of manufacturing industries increased in total by less than 3 per cent, while employment fell by over 31 per cent. This was in part due to firms becoming more efficient and cutting their workforces; another cause was that some of the least productive firms ceased production. The net result was a remarkable increase in productivity – equivalent to over 4.5 per cent a year.
Figure 1.5Output and employment in manufacturing, Q1 1994–Q4 2014 (Q1 1994 = 100)
60
70
80
90
100
110
120
Q1 201
4
Q1 201
3
Q1 201
2
Q1 201
1
Q1 201
0
Q1 200
9
Q1 200
8
Q1 200
7
Q1 200
6
Q1 200
5
Q1 200
4
Q1 200
3
Q1 200
2
Q1 200
1
Q1 200
0
Q1 199
9
Q1 199
8
Q1 199
7
Q1 199
6
Q1 199
5
Q1 199
4
Output
Employment
Source: ONS 2015d and 2015e
The restoration of productivity growth in the UK should therefore be a priority for policymakers. Without productivity growth, living standards will not improve and eliminating the budget deficit will be much harder.
However, before policies to boost productivity growth can be formulated, it is necessary to understand – and ideally solve – the productivity puzzle. This report presents the results of an analysis of the UK’s poor productivity performance
5 The central projections have since been superceded, but the OBR has not produced a more recent ‘low productivity’ scenario.

IPPR | The missing pieces: Solving Britain’s productivity puzzle9
in recent years. It starts in chapter 2 by establishing the context of this poor performance, with a comparison of productivity levels in the UK with levels in other countries. This is followed by analysis of recent developments in the UK, from both historical and international perspectives. Economists have put forward a number of theories to explain the productivity puzzle, though few claim to have fully cracked the problem, and these are set out next in chapter 4. Chapter 5 presents new analysis that throws light on which of these theories are most likely to be right. Finally, while we do not claim to solve the productivity puzzle, in chapter 6 we draw some conclusions about what definitely does not explain it, and what might; we also suggest a number of implications that follow from these conclusions.
IPPR | The missing pieces: Solving Britain’s productivity puzzle10
2. THE PRODUCTIVITY GAP
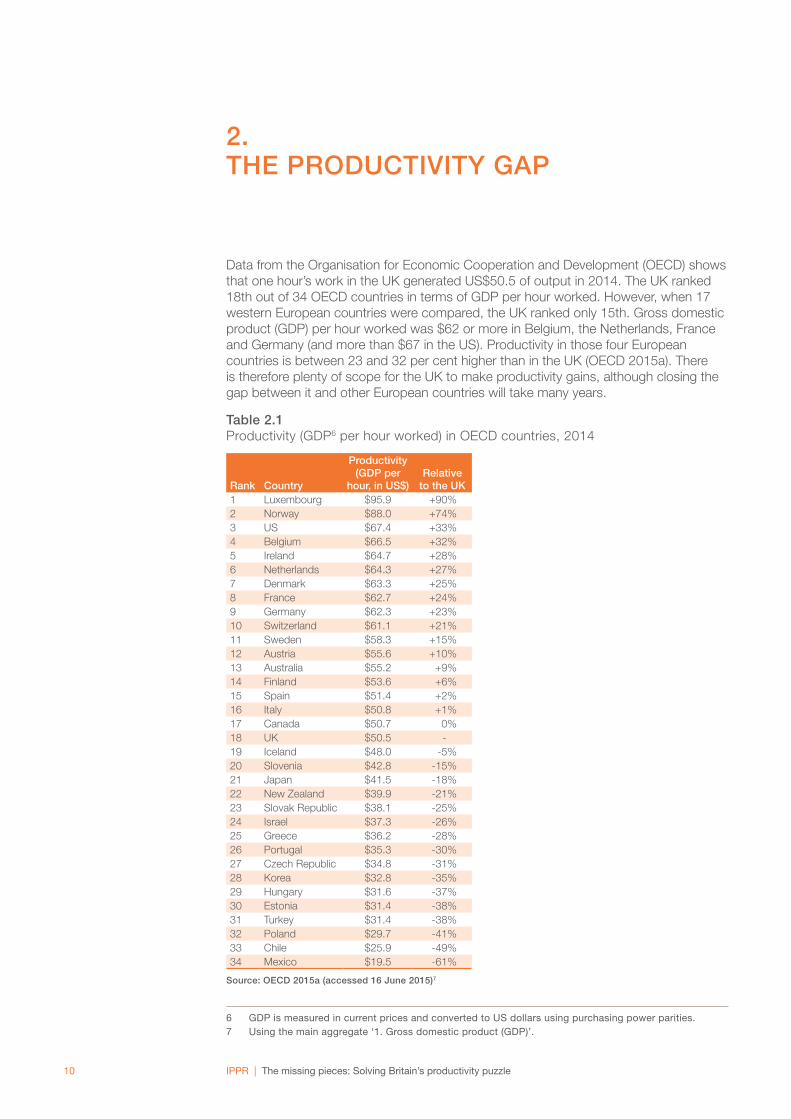
Data from the Organisation for Economic Cooperation and Development (OECD) shows that one hour’s work in the UK generated US$50.5 of output in 2014. The UK ranked 18th out of 34 OECD countries in terms of GDP per hour worked. However, when 17 western European countries were compared, the UK ranked only 15th. Gross domestic product (GDP) per hour worked was $62 or more in Belgium, the Netherlands, France and Germany (and more than $67 in the US). Productivity in those four European countries is between 23 and 32 per cent higher than in the UK (OECD 2015a). There is therefore plenty of scope for the UK to make productivity gains, although closing the gap between it and other European countries will take many years.
Table 2.1Productivity (GDP6 per hour worked) in OECD countries, 2014
Rank Country
Productivity (GDP per
hour, in US$)Relative
to the UK1 Luxembourg $95.9 +90%2 Norway $88.0 +74%3 US $67.4 +33%4 Belgium $66.5 +32%5 Ireland $64.7 +28%6 Netherlands $64.3 +27%7 Denmark $63.3 +25%8 France $62.7 +24%9 Germany $62.3 +23%10 Switzerland $61.1 +21%11 Sweden $58.3 +15%12 Austria $55.6 +10%13 Australia $55.2 +9%14 Finland $53.6 +6%15 Spain $51.4 +2%16 Italy $50.8 +1%17 Canada $50.7 0%18 UK $50.5 -19 Iceland $48.0 -5%20 Slovenia $42.8 -15%21 Japan $41.5 -18%22 New Zealand $39.9 -21%23 Slovak Republic $38.1 -25%24 Israel $37.3 -26%25 Greece $36.2 -28%26 Portugal $35.3 -30%27 Czech Republic $34.8 -31%28 Korea $32.8 -35%29 Hungary $31.6 -37%30 Estonia $31.4 -38%31 Turkey $31.4 -38%32 Poland $29.7 -41%33 Chile $25.9 -49%34 Mexico $19.5 -61%
Source: OECD 2015a (accessed 16 June 2015)7
6 GDP is measured in current prices and converted to US dollars using purchasing power parities.7 Using the main aggregate ‘1. Gross domestic product (GDP)’.

IPPR | The missing pieces: Solving Britain’s productivity puzzle11
Statistically, the UK’s productivity shortfall compared to Belgium, the Netherlands, Germany and France could be the result of the UK having lower productivity within some, or all, sectors of its economy; or of the industrial composition of the UK economy being biased towards low-productivity sectors, such as retailing and hospitality; or of some combination of the two.
The OECD also publishes productivity data at a sectoral level, though these are for gross value-added (GVA), rather than GDP, per hour worked.8 This data produces estimates of aggregate productivity gaps that are slightly different to those shown in table 2.1, but the overall pattern is the same: productivity in 2013 was more than 20 per cent higher in Belgium, the Netherlands, Germany and France than in the UK, and also higher in Sweden, Spain and Italy (OECD 2015a).
Figure 2.1GVA per hour worked in selected OECD countries, 2013 (UK = 100)
0
20
40
60
80
100
120
140
160
ItalySpainSwedenFranceGermanyNetherlandsBelgium
Source: OECD 2015a (accessed 16 June 2015)9
When the economy is disaggregated into nine broad sectors,10 and productivity in the UK is compared with productivity in the seven western European countries shown in figure 2.1 above, it becomes apparent that the UK’s productivity shortfall is due to lower productivity within sectors, rather than to the industrial composition of the UK economy. As well as having the lowest GVA per hour across the whole economy, the UK has the lowest productivity level in four of the nine sectors: agriculture, forestry and fishing; distributive trade, repairs, transport, accommodation and food services; information and communication; and public administration, compulsory social services, education and human health. It ranks seventh in three other sectors, and fifth in another. Only in ‘other service activities’, in which it has the second highest productivity level, does the UK do better.
8 GVA is equal to GDP less taxes plus subsidies.9 Using the main aggregates ‘1. Gross domestic product (GDP)’ and ‘3. Population and employment
by main activity’.10 A 10th sector – real estate activities – is excluded because the output of this sector largely reflects
imputed rents. Note that ‘manufacturing’ is a sub-sector of ‘industry, including energy’.
IPPR | The missing pieces: Solving Britain’s productivity puzzle12
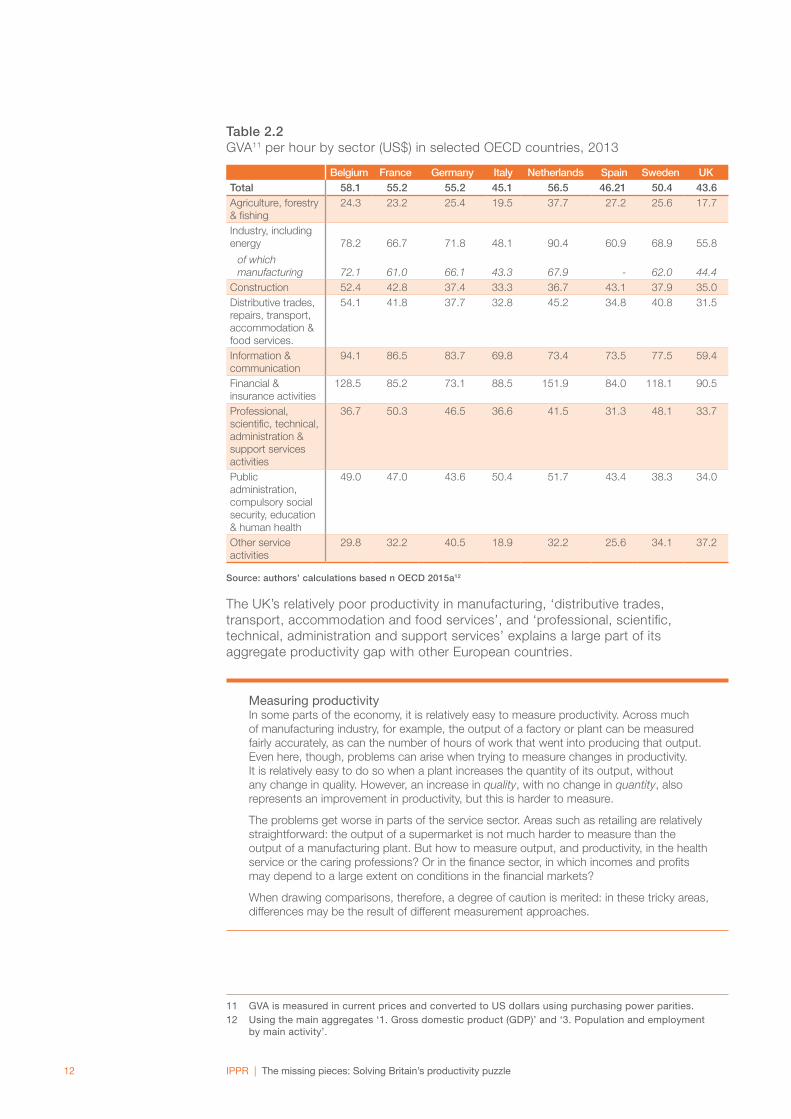
Table 2.2GVA11 per hour by sector (US$) in selected OECD countries, 2013
Belgium France Germany Italy Netherlands Spain Sweden UKTotal 58.1 55.2 55.2 45.1 56.5 46.21 50.4 43.6Agriculture, forestry & fishing
24.3 23.2 25.4 19.5 37.7 27.2 25.6 17.7
Industry, including energy
of which manufacturing
78.2
72.1
66.7
61.0
71.8
66.1
48.1
43.3
90.4
67.9
60.9
-
68.9
62.0
55.8
44.4Construction 52.4 42.8 37.4 33.3 36.7 43.1 37.9 35.0Distributive trades, repairs, transport, accommodation & food services.
54.1 41.8 37.7 32.8 45.2 34.8 40.8 31.5
Information & communication
94.1 86.5 83.7 69.8 73.4 73.5 77.5 59.4
Financial & insurance activities
128.5 85.2 73.1 88.5 151.9 84.0 118.1 90.5
Professional, scientific, technical, administration & support services activities
36.7 50.3 46.5 36.6 41.5 31.3 48.1 33.7
Public administration, compulsory social security, education & human health
49.0 47.0 43.6 50.4 51.7 43.4 38.3 34.0
Other service activities
29.8 32.2 40.5 18.9 32.2 25.6 34.1 37.2
Source: authors’ calculations based n OECD 2015a12
The UK’s relatively poor productivity in manufacturing, ‘distributive trades, transport, accommodation and food services’, and ‘professional, scientific, technical, administration and support services’ explains a large part of its aggregate productivity gap with other European countries.
Measuring productivityIn some parts of the economy, it is relatively easy to measure productivity. Across much of manufacturing industry, for example, the output of a factory or plant can be measured fairly accurately, as can the number of hours of work that went into producing that output. Even here, though, problems can arise when trying to measure changes in productivity. It is relatively easy to do so when a plant increases the quantity of its output, without any change in quality. However, an increase in quality, with no change in quantity, also represents an improvement in productivity, but this is harder to measure.
The problems get worse in parts of the service sector. Areas such as retailing are relatively straightforward: the output of a supermarket is not much harder to measure than the output of a manufacturing plant. But how to measure output, and productivity, in the health service or the caring professions? Or in the finance sector, in which incomes and profits may depend to a large extent on conditions in the financial markets?
When drawing comparisons, therefore, a degree of caution is merited: in these tricky areas, differences may be the result of different measurement approaches.
11 GVA is measured in current prices and converted to US dollars using purchasing power parities.12 Using the main aggregates ‘1. Gross domestic product (GDP)’ and ‘3. Population and employment
by main activity’.

IPPR | The missing pieces: Solving Britain’s productivity puzzle13
That the UK’s problem is lower productivity within sectors, rather than a sectoral mix biased towards low-productivity sectors, is confirmed by calculating what the UK’s overall productivity would be if it kept the same distribution of hours across industries, but had the same GVA per hour within each sector of its economy as other European countries do. If the UK had the same productivity within sectors as France, for example, but retained its current distribution of hours worked across those sectors, then aggregate productivity in the UK would be over 30 per cent higher, as figure 2.2 illustrates.
Figure 2.2Percentage increase in UK productivity, relative to current levels, that would result from it having the same GVA per hour in each sector of its economy as selected OECD countries
SpainItalySwedenGermanyFranceNetherlandsBelgium0%
10%
20%
30%
40%
50%
60%
70%
Source: authors’ calculations based on OECD 2015a
The productivity gap between the UK and these seven countries is therefore due to lower productivity within sectors of the economy, not to the mix of activity within the economy. If firms here can match the performance of firms in other countries, then there is scope for the UK to improve its overall productivity level. Matched-plant studies in the 1990s and 2000s found a big gap in productivity between plants in the UK and similar ones in continental Europe, which was attributed to firms in the UK having less efficient machinery and equipment, and to UK workers being less technically skilled.13 This was found to be true in the service sector, not just in manufacturing. Given the fact that the productivity gap remains so large, it is very likely that these conclusions still hold.
13 See for example Prais 1995
IPPR | The missing pieces: Solving Britain’s productivity puzzle14
3. THE PRODUCTIVITY PUZZLE: BASIC FACTS
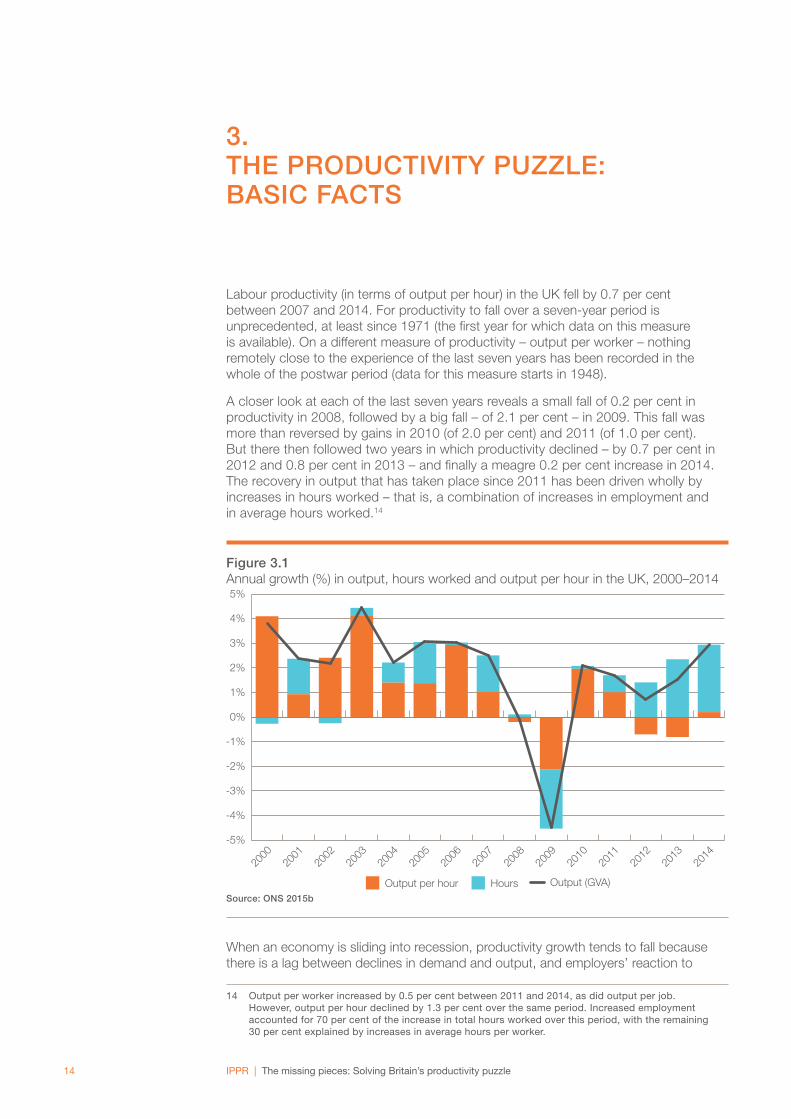
Labour productivity (in terms of output per hour) in the UK fell by 0.7 per cent between 2007 and 2014. For productivity to fall over a seven-year period is unprecedented, at least since 1971 (the first year for which data on this measure is available). On a different measure of productivity – output per worker – nothing remotely close to the experience of the last seven years has been recorded in the whole of the postwar period (data for this measure starts in 1948).
A closer look at each of the last seven years reveals a small fall of 0.2 per cent in productivity in 2008, followed by a big fall – of 2.1 per cent – in 2009. This fall was more than reversed by gains in 2010 (of 2.0 per cent) and 2011 (of 1.0 per cent). But there then followed two years in which productivity declined – by 0.7 per cent in 2012 and 0.8 per cent in 2013 – and finally a meagre 0.2 per cent increase in 2014. The recovery in output that has taken place since 2011 has been driven wholly by increases in hours worked – that is, a combination of increases in employment and in average hours worked.14
Figure 3.1Annual growth (%) in output, hours worked and output per hour in the UK, 2000–2014
Output (GVA)Output per hour Hours
-5%
-4%
-3%
-2%
-1%
0%
1%
2%
3%
4%
5%
2014
2013
2012
2011
2010
2009
2008
2007
2006
2005
2004
2003
2002
2001
2000
Source: ONS 2015b
When an economy is sliding into recession, productivity growth tends to fall because there is a lag between declines in demand and output, and employers’ reaction to
14 Output per worker increased by 0.5 per cent between 2011 and 2014, as did output per job. However, output per hour declined by 1.3 per cent over the same period. Increased employment accounted for 70 per cent of the increase in total hours worked over this period, with the remaining 30 per cent explained by increases in average hours per worker.
IPPR | The missing pieces: Solving Britain’s productivity puzzle15
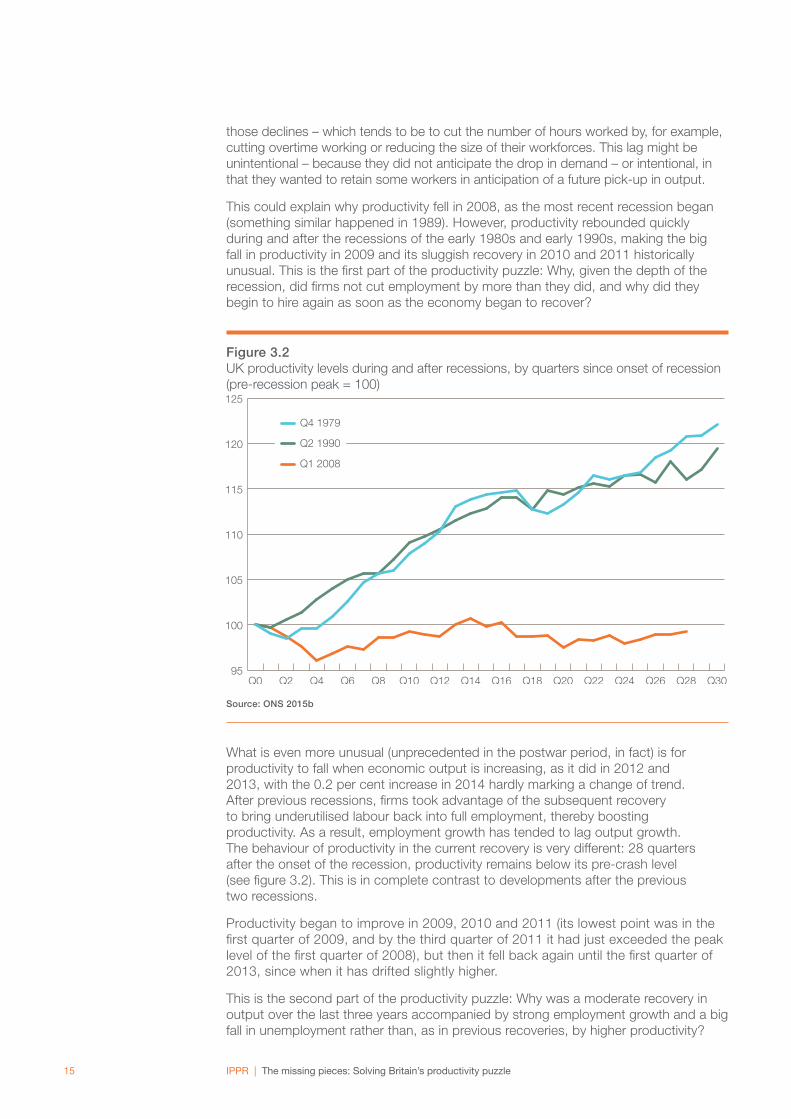
those declines – which tends to be to cut the number of hours worked by, for example, cutting overtime working or reducing the size of their workforces. This lag might be unintentional – because they did not anticipate the drop in demand – or intentional, in that they wanted to retain some workers in anticipation of a future pick-up in output.
This could explain why productivity fell in 2008, as the most recent recession began (something similar happened in 1989). However, productivity rebounded quickly during and after the recessions of the early 1980s and early 1990s, making the big fall in productivity in 2009 and its sluggish recovery in 2010 and 2011 historically unusual. This is the first part of the productivity puzzle: Why, given the depth of the recession, did firms not cut employment by more than they did, and why did they begin to hire again as soon as the economy began to recover?
Figure 3.2UK productivity levels during and after recessions, by quarters since onset of recession (pre-recession peak = 100)
95
100
105
110
115
120
125
Q30Q28Q26Q24Q22Q20Q18Q16Q14Q12Q10Q8Q6Q4Q2Q0
Q4 1979
Q2 1990
Q1 2008
Source: ONS 2015b
What is even more unusual (unprecedented in the postwar period, in fact) is for productivity to fall when economic output is increasing, as it did in 2012 and 2013, with the 0.2 per cent increase in 2014 hardly marking a change of trend. After previous recessions, firms took advantage of the subsequent recovery to bring underutilised labour back into full employment, thereby boosting productivity. As a result, employment growth has tended to lag output growth. The behaviour of productivity in the current recovery is very different: 28 quarters after the onset of the recession, productivity remains below its pre-crash level (see figure 3.2). This is in complete contrast to developments after the previous two recessions.
Productivity began to improve in 2009, 2010 and 2011 (its lowest point was in the first quarter of 2009, and by the third quarter of 2011 it had just exceeded the peak level of the first quarter of 2008), but then it fell back again until the first quarter of 2013, since when it has drifted slightly higher.
This is the second part of the productivity puzzle: Why was a moderate recovery in output over the last three years accompanied by strong employment growth and a big fall in unemployment rather than, as in previous recoveries, by higher productivity?

IPPR | The missing pieces: Solving Britain’s productivity puzzle16
Productivity growth in the UK averaged 2.3 per cent from 1979 to 2007. Since 2007 and the financial crash, productivity has fallen by 0.7 per cent. Consequently, the level of productivity in the UK is now 17 per cent below the level it would have been if it had followed the pre-crash trend.
Figure 3.3Actual output per hour and 1971–2007 trend, UK, Q1 2000–Q1 2015 (2011 = 100)
Actual
Trend
Q1 201
5
Q1 201
4
Q1 201
3
Q1 201
2
Q1 201
1
Q1 201
0
Q1 200
9
Q1 200
8
Q1 200
7
Q1 200
6
Q1 200
5
Q1 200
4
Q1 200
3
Q1 200
2
Q1 200
1
Q1 200
080
85
90
95
100
105
110
115
120
125
130
Source: authors’ calculations based on ONS 2015b Note: figure 1.2 illustrates the same data over a longer time-period (Q1 1971–Q1 2015)
The UK is not alone in seeing its productivity performance deteriorate since the financial crash. Across the G715 as a whole, productivity growth has halved relative to its pre-recession rate – and every country bar Canada has experienced a decline. However, the UK’s experience has been worse than those of other countries. Between 2008 and 2014, the UK’s relative productivity underperformed in two distinct stages. In 2009, in the depth of the recession, productivity in the UK and Italy fell more sharply than in the other five G7 countries. Then, after recovering in 2010 and 2011, productivity in the UK fell in 2012 while it continued to increase elsewhere, except in Italy (see figure 3.4 below). Once again, there appear to be two parts to the ‘productivity puzzle’: the recession and the 2012–2014 period.
The fall in productivity growth in the UK – comparing the pre-crash period of 1990–2007 with the post-crash period of 2008–2014 – has been far larger than in any other G7 country. In part, this is because the UK was doing so well prior to the crash – it topped the G7 productivity growth table in the 1990s, and again between 2000 and 2007. However, the fall also reflects the fact that the UK has slipped to second-to-bottom of the table since 2007. By 2014, productivity in the UK was 15 per cent below the level that would have been expected if pre-crash trends had been maintained; for the rest of the G7, that gap was only 5 per cent.
15 The G7 consists of the US, Japan, Germany, France, the UK, Italy and Canada

IPPR | The missing pieces: Solving Britain’s productivity puzzle17
Figure 3.4GDP per hour in the G7 countries, 2008–2014 (2008 = 100)
US Canada Japan France Germany UK Italy
96
98
100
102
104
106
108
2014201320122011201020092008
Source: OECD 2015b
Table 3.1Annual average growth (%) in GDP per hour worked in G7 countries (and G7 average)
1970–1980 1980–1990 1990–2000 2000–2007 2007–2014UK 2.9 2.1 2.5 2.2 0.1Canada 1.8 0.9 1.8 1.0 1.0France 4.0 3.0 2.1 1.4 0.4Germany 3.8 2.3 2.2 1.5 0.4Italy 4.1 1.8 1.6 0.1 -0.1Japan 4.3 4.1 2.1 1.6 0.7US 1.5 1.6 1.8 2.1 1.2G7 average 2.9 2.3 2.1 1.7 0.8
Source: OECD 2015b
The UK’s poor productivity performance between 2007 and 2014 was the result of a deep recession followed by a moderate economic recovery, accompanied by an increase in hours worked. Over this period, the UK’s GDP rose more than those of France, Italy and Japan. What stands out, however, is the increase in hours worked in the UK. The only other country where hours worked increased in this period is Canada, which also experienced the best GDP growth.
Table 3.2Annual average increases (%) in productivity, GDP and hours worked, 2007–2014
Productivity GDP HoursUK 0.1% 0.5% 0.4%Canada 1.0% 1.6% 0.6%France 0.4% 0.3% -0.1%Germany 0.4% 0.7% -0.2%Italy -0.1% -1.3% -1.2%Japan 0.7% 0.1% -0.6%US 1.2% 1.1% 0.0%
Source: OECD 2015b

IPPR | The missing pieces: Solving Britain’s productivity puzzle18
The fall in productivity growth in other countries suggests that the UK’s productivity puzzle might, in part, reflect factors that are international in nature and which affect all advanced economies. However, analysis of the international record highlights how much worse developments have been in the UK compared to other countries (with the partial exception of Italy, which has done just as badly as the UK in the last seven years, but which also performed poorly in the seven years previous to that). Either these international factors are having a much bigger impact on the UK than on other countries, or there are additional, UK-specific factors at work too.
The important point that emerges from the historical and international analyses is that there are two parts to the productivity puzzle. First, UK firms did not cut employment in the recession as much as might have been expected, given both past experience and what was happening in other countries. Second, UK output growth in the last three years has been driven wholly by a higher number of hours worked, with no productivity gain. This is unprecedented in the UK in the postwar period, and makes the UK unique among the G7 countries.

IPPR | The missing pieces: Solving Britain’s productivity puzzle19
4. THE PRODUCTIVITY PUZZLE: THEORIES
This section sets out how economists have tried to explain the stagnation of productivity in the UK over the last seven years. Productivity growth has declined across most advanced economies since the financial crash, which suggests that there may be common causes. However, the fact that productivity growth has declined most in the UK suggests that UK-specific forces are also in play.
Although some economists argue that the UK’s productivity slowdown commenced prior to 2008, most believe that it began after the financial crash. However, it was not inevitable that the crash would lead to a productivity slowdown. Oulton and Sebastiá-Barriel (2013) report on modelling work that examines the short-term effect of financial crises on the growth rate of productivity, and the long-term effect they have on productivity levels. They look at crises in 61 countries over the period 1955–2010, and find that crises have significant effects on both. However, the results are dominated by the experience of emerging economies. Analysing only advanced economies shows that banking crises have no significant effect on the level of productivity (ibid). Hughes and Saleheen (2012) reach a similar conclusion. Their analysis is confined to advanced economies, and shows that employment usually catches up quickly with developments in output, so that four years after a crisis the level of labour productivity is typically back to its pre-crisis trend. They reach this conclusion with only 13 cases to work with, but their analysis shows that the UK’s labour productivity performance since 2008 has been weaker than that of any advanced country in the wake of a previous financial crisis.
Broadly speaking, theories about the extraordinary decline in UK productivity growth can be divided into two groups: demand-side, or cyclical, explanations; and supply-side, or structural, ones. Demand-side explanations focus on the depth of the recession and the behaviour of employers and workers during and after the financial crash. They assume that, while actual productivity has stagnated, the potential productivity of the economy has continued to increase. They are therefore relatively optimistic, leaving open the possibility that actual productivity growth could be so strong in future that the level of productivity could eventually return to its pre-crash trend. Supply-side explanations are inherently more pessimistic, and most assume that the crash has led to a large, permanent one-off loss of productivity gains, but that the growth of productivity can return to its pre-crash rate.
Demand-side explanations, and most supply-side ones, assume that the UK’s productivity performance has been poor as a result – either directly or indirectly – of the financial crash and recession; however, they differ in that some believe that the crash led to a collapse of demand relative to supply, while others believe that it caused an inflection point in the path of supply. A third, very pessimistic, view – also supply-side based – is that the underlying growth rate of productivity had dropped even before the crash, but that this fall was being masked by cyclical strength resulting from an unsustainable financial bubble. Proponents of this view argue the growth rate of productivity will remain below its previous long-run rate
IPPR | The missing pieces: Solving Britain’s productivity puzzle20
of 2-per-cent-plus for the foreseeable future – and that the stagnation of the last seven years could even be representative of the new trend.
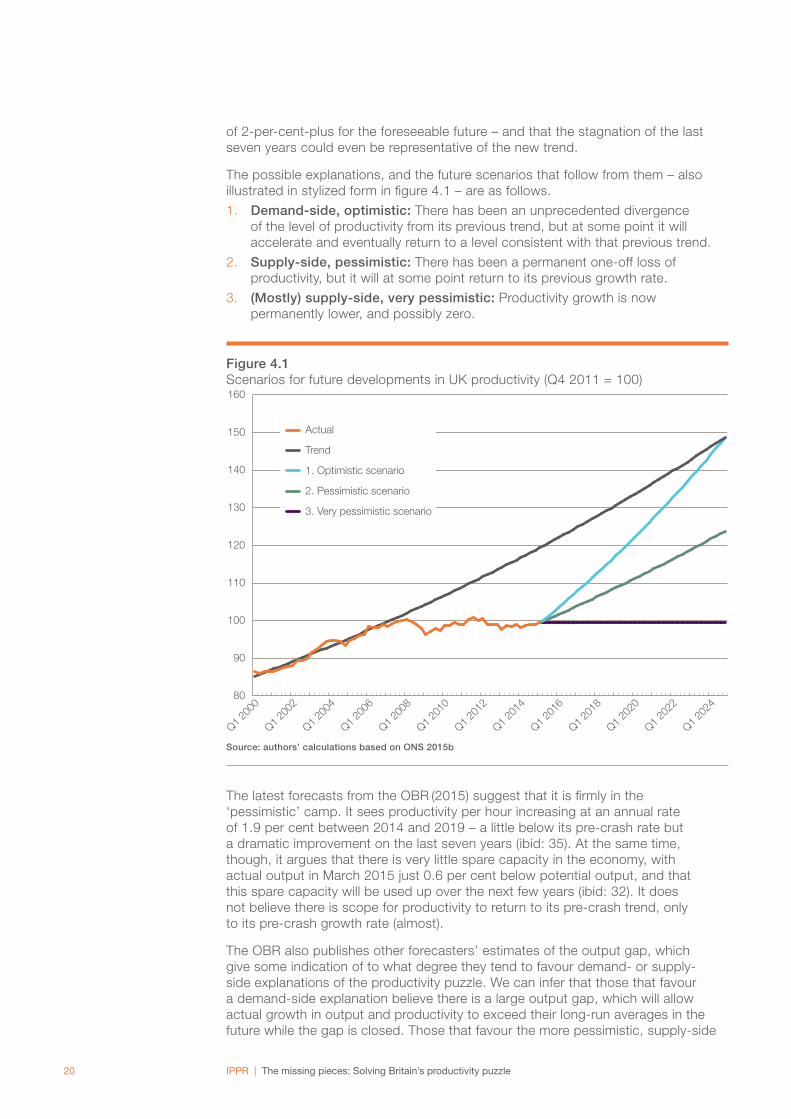
The possible explanations, and the future scenarios that follow from them – also illustrated in stylized form in figure 4.1 – are as follows.
1. Demand-side, optimistic: There has been an unprecedented divergence of the level of productivity from its previous trend, but at some point it will accelerate and eventually return to a level consistent with that previous trend.
2. Supply-side, pessimistic: There has been a permanent one-off loss of productivity, but it will at some point return to its previous growth rate.
3. (Mostly) supply-side, very pessimistic: Productivity growth is now permanently lower, and possibly zero.
Figure 4.1Scenarios for future developments in UK productivity (Q4 2011 = 100)
80
90
100
110
120
130
140
150
160
Q1 202
4
Q1 202
2
Q1 202
0
Q1 201
8
Q1 201
6
Q1 201
4
Q1 201
2
Q1 201
0
Q1 200
8
Q1 200
6
Q1 200
4
Q1 200
2
Q1 200
0
Actual
Trend
1. Optimistic scenario
2. Pessimistic scenario
3. Very pessimistic scenario
Source: authors’ calculations based on ONS 2015b
The latest forecasts from the OBR (2015) suggest that it is firmly in the ‘pessimistic’ camp. It sees productivity per hour increasing at an annual rate of 1.9 per cent between 2014 and 2019 – a little below its pre-crash rate but a dramatic improvement on the last seven years (ibid: 35). At the same time, though, it argues that there is very little spare capacity in the economy, with actual output in March 2015 just 0.6 per cent below potential output, and that this spare capacity will be used up over the next few years (ibid: 32). It does not believe there is scope for productivity to return to its pre-crash trend, only to its pre-crash growth rate (almost).
The OBR also publishes other forecasters’ estimates of the output gap, which give some indication of to what degree they tend to favour demand- or supply-side explanations of the productivity puzzle. We can infer that those that favour a demand-side explanation believe there is a large output gap, which will allow actual growth in output and productivity to exceed their long-run averages in the future while the gap is closed. Those that favour the more pessimistic, supply-side

IPPR | The missing pieces: Solving Britain’s productivity puzzle21
explanations must believe that there is little or no output gap now, and that the best that can happen to actual growth is that it falls into line with a renewed upward trend in potential growth. As figure 4.2 shows, of 17 forecasters – including the OBR – 11 believe that the output gap in 2015 is 1.0 per cent or less, with a further four putting it at between 1.0 and 1.5 per cent. Only Oxford Economics and Capital Economics, who estimate the output gap to be 2.8 per cent and 2.5 per cent respectively, could be said to have a toe in the demand-side camp; however, even their forecasts implicitly assume a massive loss of productive potential – around 14 per cent – compared with the pre-crash trend.
Figure 4.2Forecasters’ estimates of the output gap (%) in 2015
-3%
-2%
-1%
0%
1%
Scotia
bank
Daiwa C
apita
l
Nomur
aEC
Commerz
bank
Barclay
s Cap
ital
OECD
Santan
der G
BMOBR
Societ
e Gen
erale
BCC
Schro
ders
IMIMF
Fatho
m Con
sultin
g
Goldman
Sac
hs
Capita
l Eco
nomics
Oxford
Eco
nomics
Source: adapted from OBR 2015: 34
Economic forecasters are, therefore, firmly in the pessimistic, supply-side camp. However, this does not reflect the balance of the argument among those who have analysed the productivity puzzle. This is much more evenly split, and it is to their views we now turn, starting with the ‘demand-siders’.
4.1 Demand-side theoriesThe principal demand-side explanation for a fall in productivity during a recession is labour hoarding. This might be involuntary, if firms are taken by surprise by a fall in demand for their goods and services, or voluntary, if they decide not to cut their workforces in line with cuts in production. The recession of 2008 and 2009 might well have resulted in involuntary labour hoarding because of its severity – it was the deepest since the 1930s – and its sudden onset. Previous postwar recessions occurred after a tightening of policy – usually in the form of higher interest rates – and so could, to a certain extent, have been anticipated by firms. However, the most recent recession followed the unexpected bursting of an asset bubble, and it turned out to be far worse than economists predicted even once the financial crash had begun. It is possible that during the recession, employers were continually ‘behind’ in terms of their efforts to cut hours-worked in response to falls in output.

IPPR | The missing pieces: Solving Britain’s productivity puzzle22
However, involuntary labour hoarding only works as an explanation for what happened to productivity during the recession. If it were the sole explanation, firms would eventually have caught up with the reality of the depth of the recession and cut back the size of their workforces to the desired levels. To the extent that there was labour hoarding beyond the early part of the recession, it must have been voluntary. Economists have long understood that firms may not respond to what they see as a temporary drop in demand for their goods and services by cutting their workforces. A number of possible reasons for this, not all of which are mutually exclusive, have been put forward.
• First, firms may worry that in future they will not be able to recruit staff with the skills they need to replace those they lay off in a recession. Manufacturers, for example, are frequently quoted as saying that they fear there will be a shortage of skilled engineers in the UK in the future. If they really believe this is possible, it would be rational for them to hold on to the ones they have during any downturn in demand that is believed to be temporary.
• Second, if the costs of shedding and re-hiring labour are high, it could make financial sense to hold on to workers. This will be particularly true if a firm has paid to develop specific skills among existing staff, and would have to pay again to train new recruits.
• Third, there will always be a certain proportion of ‘fixed cost’ staff or ‘overhead labour’ that it makes sense to retain even if overall demand for a firm’s products has fallen (Martin and Rowthorn 2012). A small firm, for example, might keep its one human resources manager when demand falls and other staff are made redundant.
• Fourth, in some parts of the economy greater effort – and therefore more staff – may be needed in order to win business or to secure contracts. In a weak housing market, for example, estate agents will have to work harder to sell fewer houses, and may use additional resources to try to drum-up more business (Barnett, Broadbent et al 2014).
• Fifth, when the immediate demand for their goods and services falls, some firms can divert resources to activities that are beneficial in the long-term but do not produce any output in the short term – devoting more resources to research and development, for example. Goodridge et al (2013) argue that part of the productivity puzzle can be explained by firms retaining workers who are employed in creating intangible assets.
Moreover, when the economy went into recession in 2008, the government introduced a series of policies to hold employment up and in effect encourage labour hoarding. These included direct measures, such as employment subsidies, and indirect measures, such as the car scrappage scheme.
Evidence that the bulk of the decline in productivity in the UK up to 2011 reflected developments within firms, rather than a shift in the composition of the workforce, offers support for demand-side theories. Barnett, Chiu et al (2014) found that there was a doubling in the proportion of firms with falling output and unchanged employment between 2007 and 2011, which would seem to be clear evidence of labour hoarding. Riley et al (2014) also found that the majority of the decline in productivity between 2007 and 2011 was due to falls within firms. Crawford et al (2013) argue that labour productivity, as well as investment and firm profitability, fell on average within firms over the course of the recession, and that this was particularly true for small firms.
However, the data used in these studies ends in 2011. So, while they support the idea that labour hoarding explains the first part of the UK’s productivity puzzle, they do not cover the period of the second productivity puzzle: the failure of productivity to rise when output growth picked up between 2012 and 2014.

IPPR | The missing pieces: Solving Britain’s productivity puzzle23
It is far less likely that labour hoarding was taking place in this later period. In the last three years to the first quarter of 2015, employment in the UK has increased by 1.6 million, including an increase of over 1 million in the number of full-time employees (ONS 2015a). Furthermore, this strong labour market performance has been driven by flows into employment, rather than by a drop in flows into unemployment. While it is possible that some firms are still hoarding labour while others are taking on additional staff, the scale of these increases and the time that has elapsed since the recession make this very unlikely.
This does not, however, rule out demand-side effects as an explanation for the second part of the productivity puzzle, if they are combined with the possible effects of lower real wages.
Real wages and productivityTily (2015) argues that weak productivity growth is a direct consequence of austerity policies that have held back aggregate demand, and thus output growth, in the economy. In the past, these policies would have led to much higher unemployment, but in this economic cycle the effect has been different. Real wages have been squeezed instead, allowing employment to be higher and thus holding down productivity. This theory therefore turns conventional thinking – that productivity determines real wages – on its head.
Real wages in the UK declined throughout the recession and recovery up until the last few months of 2014 – and even then they only increased because of a collapse in global oil prices. Lower real wages could induce firms to take on more workers rather than investing in ways to make their existing workforces more productive – particularly if banks are reluctant to lend for capital investment. Pessoa and Van Reenen (2014) argue that the cost of capital for large firms increased from 6 to 8 per cent between the period just before the crash and 2012, with an even bigger increase for small firms. This, combined with falls in real wages, is likely to have caused the capital-to-labour ratio to fall. In other words, firms are using relatively more labour and relatively less capital to produce a given level of output. As a result, labour productivity has fallen, but capital productivity has increased, and total factor productivity will have developed in a fashion similar to that of previous recessions and recoveries. Pessoa and Van Reenen’s analysis suggests that this is indeed what has happened (ibid). Blundell et al (2013) back up this theory, finding significant real-wage reductions in recent years among individuals who have stayed in the same job year-on-year. This, they argue, indicates that the productivity of workers who have remained in the labour market, and in the same job, has fallen.
If lower real wages are the cause of stagnant productivity, then we need an explanation for the unusual behaviour of real wages over the last seven years. Ideally, this should also account for the fact that over this period real wages have not fallen in the US, which is widely seen as having a labour market that is as flexible as that of the UK. A number of explanations for this have been put forward. Over the long-term, the decline in trade union membership is likely to have played a role. A more short-term consideration is higher inflation in the UK, which meant nominal wage stickiness was less of an issue (a 2 per cent pay rise in the UK meant a fall in real wages, whereas in the US it did not). However, when thinking about productivity, the most pertinent explanation for the fall in real wages in the UK over the last seven years is that the supply of labour was much higher in this recession and recovery than in previous ones (Blundell et al 2013).
This is the result of several factors. There are more potential older workers because of increases in the age at which women receive the state pension, rules that make it harder for firms to force people to retire upon reaching the

IPPR | The missing pieces: Solving Britain’s productivity puzzle24
state pension age, and lower annuity rates which mean that people have to work longer to get the retirement income they might have hoped for. Immigration levels are higher than in past recessions and recovery phases. Flexible work contracts are more prevalent, and these appeal to some workers – students, for example – who could not or do not want to work full-time. But the most important factor could be different employment policies. From 2010 to 2015, the Coalition government pursued far more active – and punitive – policies towards those out of work, including tightening conditionality for benefit payments. This will have significantly lifted the labour supply.
Other things being equal, an increase in the supply of labour will put downward pressure on real wages, including for existing workers, making it less essential for firms to try to increase their productivity. Lower real wages allow firms to retain more staff than they otherwise would have done when experiencing falls in demand. In previous recessions, productivity has increased because firms have laid-off their least productive workers, with the result that the average productivity level of those remaining in work was higher. Lower real wages this time around may mean that this has not happened. Lower real wages are also likely to have allowed some of the least productive firms in the economy to continue to operate rather than go bust.
If the real-wage explanation is correct, there is potentially spare capacity in the economy, and scope for actual labour productivity to increase for a sustained period at a faster pace than its pre-crash rate. But this is only true if firms can be induced to increase their spending on capital while not laying off workers. If the capital-to-labour ratio returns to its pre-crash level in the coming years as a result of increased capital in the economy, rather than fewer workers, there could be strong gains in labour productivity (and in real wages) without an accompanying inflation threat.
4.2 Supply-side theoriesMany economists believe that the productivity puzzle has a supply-side explanation. As a result of the financial crash, they argue, the UK economy has permanently lost a good deal of potential output. Consequently, there is very little scope left for the UK economy to experience above-trend growth.
This does not mean that the workforce has become inherently less productive. The working-age population is better qualified now than it has ever been, and therefore potentially more productive too (Disney et al 2013). Furthermore, given that the employment rate is at its highest level since records began in 1971, it is implausible to argue there has been hysteresis (a permanent loss of skills among some workers, or a detachment from the labour market among others). An older, more highly qualified and more experienced workforce would ordinarily be associated with higher productivity. The fact that this has not followed suggests that some workers are accepting positions for which they are overqualified and/or over-experienced, and that firms are making less use of the skills available to them than they were before the financial crash. In other words, there has been a structural shift from high-productivity to low-productivity work.
Other shifts in the composition of the workforce since the financial crash may also have had a negative effect. In particular, a shift towards potentially lower productivity types of work – self-employment or part-time working – could have brought down the aggregate productivity of the economy. The UK has experienced a well-documented rise in self-employment and part-time working since the onset of the last recession: both now account for a larger proportion of the workforce than they did in 2007. Self-employed workers may be less productive than employees with otherwise similar characteristics because of, for example, increased bureaucracy and an inability to take advantage of economies of scale when working on one’s own account in a micro-business or a start-up. Part-time workers may also be less

IPPR | The missing pieces: Solving Britain’s productivity puzzle25
productive than a full-time employee if working part-time involves greater challenges in terms of communication and coordination, for example.
Proponents of supply-side explanations for the productivity puzzle point out that the performance of productivity is not the only thing that has been unusual about the most recent recession and recovery. While previous recessions were engineered by policymakers, generally through higher interest rates, in order to stop economic overheating and bring consumer price inflation back under control, this recession was caused by the bursting of asset price bubbles. Interest rates were relatively low when the recession commenced, and have subsequently fallen further – in the case of policy rates in the US, Europe and the UK, to close to zero. This meant that firms entered the recession in relatively good financial health, and so were less vulnerable and less likely to go out of business (Martin and Rowthorn 2012). Furthermore, very low interest rates and increased levels of forbearance – because banks did not want failed loans showing on their balance sheets – meant firms that might have come under pressure in a ‘normal’ recession were able to survive in the recent one. When a similar development occurred in Japan in the 1990s, such firms were dubbed ‘zombie companies’. They are likely to be among the least productive firms in the economy, so their survival is a drag on aggregate productivity levels. Furthermore, if their continued existence means that new – potentially more productive – firms find it harder to obtain capital, this would represent a further drag on the productivity of the economy as a whole.
More generally, some economists have argued that the productivity puzzle is the result of insufficient reallocation of resources within the economy. Their analysis assumes that most productivity growth occurs not as the result of productivity gains within firms, but due to the birth of new higher-productivity firms and the death of lower-productivity ones. This mechanism, they believe, has been impaired in the aftermath of the financial crash. There has been a wide variation in rates of return across sectors, implying a large incentive for capital and resources to be reallocated, but changes in capital levels across sectors have been unusually low (Barnett, Chiu et al 2014). Further evidence of this lack of capital reallocation is provided in the form of low rates of bankruptcies and liquidations (Pessoa and Van Reenen 2014). If this argument is right then eventually, when interest rates increase and the financial system is operating more normally, productivity growth will return to something like its pre-crash rate.
This is because there has not been a reversal in the factors that boosted productivity growth in the 1980s, 1990s and 2000s up to the financial crash. These include a higher proportion of young people successfully completing higher education, greater competition in product and labour markets, the adoption of information and communication technologies, and policies to boost innovation and the commercialisation of new ideas (Corry et al 2011, Valero and Roland 2015). The financial crash has produced a set of conditions that temporarily overrides these factors.
4.3 Long-term theoriesThere are some who think the above view might be too optimistic. Two of the leading proponents of this ‘super-pessimistic’ view, Tyler Cowen and Robert Gordon, argue that advanced economies have entered a period of much weaker output growth than has been the norm in the period since the second world war.16 In part, this is due to slower population growth, particularly in Japan and continental Europe, but it also reflects a
16 See for example Cowen T (2012) The Great Stagnation: How America ate all the low-hanging fruit of modern history, got sick and will (eventually) feel better, E P Dutton & Co Inc; and Gordon R (2012) ‘Is economic growth over? Faltering innovation confronts the six headwinds’, NBER working paper no. 18315, National Bureau of Economic Research.

IPPR | The missing pieces: Solving Britain’s productivity puzzle26
lack of new technologies. Their argument is that productivity will not increase because there are too few opportunities for firms to exploit. Critics have pointed out how difficult it is to believe that technological opportunities suddenly dried up across the whole economy in a way that caused productivity growth in the advanced economies to fall sharply almost overnight, and that this should have happened at exactly the same time as the financial crash is surely too much of a coincidence. However, Cowen and Gordon believe the pre-crash bubble was disguising a productivity slowdown, which would explain the coincidence.
Another group of economists have arrived at a similar, and similarly gloomy, conclusion about the medium-term outlook for productivity growth – but for a very different reason. They believe that recent falls in the ratio of investment-to-GDP in the UK and other countries – and the consequently lower productivity growth – are indicators of ‘secular stagnation’: a situation in which real interest rates cannot fall low enough to allow demand in the economy to increase as fast as its previous potential growth rate. Anticipating this possibility, firms cut back on their investment plans, so dragging down the economy’s potential growth rate, with the result that the economy has settled into a new equilibrium characterised by low growth in demand, output and productivity. A demand problem has thus morphed into a supply problem.
There are also optimistic long-term assessments of recent productivity developments, most notably by those who look for repeating patterns in history. Carlota Perez (2015), for example, argues that the advanced world is at a turning point between the ‘installation period’ and the ‘deployment period’ of the ICT revolution. Based on past economic and industrial revolutions, she suggests that this deployment period could be an economic ‘golden age’. If she is right, the stalling of productivity growth in the UK will prove temporary; growth will soon resume, perhaps at an even faster pace than before the recession. Unfortunately, however, until productivity growth does resume, it is not possible to judge analytically whether this theory is right or wrong.

IPPR | The missing pieces: Solving Britain’s productivity puzzle27
5. THE PRODUCTIVITY PUZZLE: ANALYSIS
The UK has experienced a significant economic shock. The failure of productivity to increase over a period of seven years is unprecedented in the last 70 years. But economists’ understanding of what drives productivity and what causes it to accelerate and decelerate is, in general, poor, and they have not yet worked out why it has stalled. In this section, we present the results of analysis designed to cast light on the nature of the productivity shock, and in particular to assess whether the demand-siders or supply-siders present the better explanations for the productivity puzzle.
5.1 Data measurement issuesOne possibility is that the productivity puzzle is the result of problems with the data: an under-recording of GDP or an over-recording of employment and hours worked.
It is very unlikely, however, that there is a problem with the measurement of employment levels and hours worked in the UK. The labour force survey, which is used to collect monthly data on the workforce, is one of the more reliable surveys conducted by the ONS. While it is true there have been shifts in the UK workforce over the last seven years – in particular, a big increase in the number of self-employed people – which could have made the ONS’s job harder, it is unlikely that these have led to a systematic over-recording of the number of people in work. It may be that some self-employed people are over-recording the number of hours they are working, but the effect of this on the productivity data will be small (see section 5.5 below).
There might, however, be a problem with the output (real GDP) data. Estimates of real GDP are frequently revised, and during the early quarters of an economic recovery these revisions can tend to be upwards – perhaps because the ONS has difficulties capturing and measuring activity in new firms. However, we are now well into the recovery, and the ONS points out that for the most part revisions can be up or down and they are relatively small (Walton and Brown 2012). If the level of real GDP on the current basis of calculation is being underestimated, it is probably only by 1 or 2 per cent at the most, and so can explain only a fraction of the productivity puzzle. A bigger problem might be that the current methodology is failing to capture some output. In the past, periodic reviews have led to changes in methodology that have boosted GDP – though any change is likely to affect output, and thus productivity, both before and after 2008.
In this context, it is interesting that around 40 per cent of the productivity puzzle is explained by weaker growth in productivity in the post-crash period, relative to the pre-crash period, in three sectors: professional services, finance and insurance, and information and telecommunications (see section 5.6 below). One characteristic shared by each of these sectors is that it is hard to measure their output, and it is not always clear what represents an increase in real activity and what is an increase in charges (that is, inflation). For example, if the fees earned by a fund manager are proportionate to the value of the funds he or she is managing, and these are in turn proportionate to the level of the stock market, does an increase in fee income brought about by an increase in the stock market represent an increase in output and productivity?
IPPR | The missing pieces: Solving Britain’s productivity puzzle28
Some of the productivity puzzle is accounted for if productivity growth in these sectors was never as strong as it appeared to be pre-crash, and has not been as weak as it appeared to be post-crash. However, this could only ever explain part of the productivity puzzle, which pertains to many other sectors. As Corry et al (2011) demonstrate, good productivity growth between 1997 and 2007 was not a mirage resulting from a financial bubble, but rather was evident across almost all sectors of the economy.
A small proportion of the productivity puzzle is probably the result of the way in which activity in finance and business services is recorded, which leads to an over-estimation of output and productivity growth in booms. As the economy recovers, some of this ‘activity’ will reappear in the GDP numbers, but increased regulation of the financial sector probably means that some will not.
5.2 Spare capacityEvidence that there is very little spare capacity in the economy would tend to favour supply-side explanations for the productivity puzzle. Proponents of these theories believe productive capacity has been permanently lost (or rather, new capacity has not been put in place) over the last seven years, and that as a result aggregate demand and supply in the economy are close to being in balance. Most assessments of the output gap centre on an estimate of around 1 per cent.
This view is broadly supported by surveys. The CBI’s industrial trends survey for January 2015 found only 44 per cent of firms reporting that they were operating below full capacity (CBI 2015). This compares to an average over time of 58 per cent, and is the lowest reading since January 1998 (ibid). However, surveys of capacity constraints are far from conclusive evidence: as Martin and Rowthorn (2012) point out, survey measures of capacity have proven to be misleading in the past. Firms appear to base their responses to such surveys on their ability to increase output in the very short term. The idea that the economy is operating at close to full capacity also does not square with the almost complete absence of inflation pressures within the economy. Even if the effects of the recent large fall in oil prices are excluded, consumer price inflation in the UK is currently well below its 2 per cent target.
Furthermore, according to the Bank of England, capacity constraints are now much lower than they were in 2007, immediately before the financial crash (see figure 5.1 below). The Bank’s agents file monthly reports on firms’ views on capacity constraints. In May 2015, firms in manufacturing and services reported capacity conditions that were very close to their average levels throughout the period from 1998, when records began (Bank of England 2015).
Wage inflation is also below its pre-crash level, which suggests that there is plenty of spare capacity in the labour market. Unemployment fell from a peak of 8.5 per cent in September–November 2011 to 5.5 per cent in the first quarter of 2015, but it reached a low-point of 4.7 per cent in the last cycle, so can presumably fall further. Moreover, there is evidence of a high level of underemployment in the economy – not least the more than 1.3 million people who are working part-time but say they would rather have a full-time job (ONS 2015a).

IPPR | The missing pieces: Solving Britain’s productivity puzzle29
Figure 5.1Capacity constraints in the manufacturing and service sectors, Bank of England agents’ scores,17 January 1998–May 2015
-4
-3
-2
-1
0
1
2
3
4
Jan 2
015
Jan 2
014
Jan 2
013
Jan 2
012
Jan 2
011
Jan 2
010
Jan 2
009
Jan 2
008
Jan 2
007
Jan 2
006
Jan 2
005
Jan 2
004
Jan 2
003
Jan 2
002
Jan 2
001
Jan 2
000
Jan 1
999
Jan 1
998
Manufacturing
Services
Source: Bank of England 2015
Although capacity utilisation appears to have been very high just prior to the financial crash, consumer and wage inflation pressures were also conspicuous by their absence in 2007. This is inconsistent with the idea that underlying productivity growth had already fallen prior to the financial crash. If it had done so, aggregate demand in the economy would have been well above aggregate supply, and inflation pressures – in product and labour markets – would have emerged. The fact they did not makes it likely that trend productivity – and productive capacity – were growing at a healthy pace up until 2007. This suggests that the idea there was a secular decline in productivity growth that commenced prior to the financial crash is wrong. The productivity slowdown is not the result of a longstanding decline in opportunities for firms to exploit, but rather is part of the fallout from the financial crash itself.
The absence of inflation pressures in the UK in the period just prior to the financial crash is a significant counter to the very pessimistic view that underlying or trend productivity growth was already falling for structural reasons before 2008. The productivity puzzle is more likely the result, directly or indirectly, of the financial crash and its aftermath.
The absence of inflation pressures in the UK now suggests there is more spare capacity in the economy than is consistent with a 100-per-cent supply-side explanation for the productivity puzzle, and implies some role for demand-side factors.
17 ‘This score refers to likely capacity constraints over the next six months, ignoring normal seasonal fluctuations.This score measures how capacity constraints are affecting companies: in particular, the degree of difficulty that contacts face in increasing their output. Primarily capacity constraints will reflect a lack (or surplus) of capital (machines) and labour (workers), although other factors can also play a role.Before January 2005, these scores were based on companies’ current situation, rather than being forward-looking.’ (Source: http://www.bankofengland.co.uk/publications/Documents/agentssummary/definitions.pdf)

IPPR | The missing pieces: Solving Britain’s productivity puzzle30
5.3 Real wage growthA key argument of economists who believe that the productivity slowdown is a demand-side phenomenon is that falls in real wages have encouraged firms to employ more labour and less capital, and that these falls in real wages are attributable to an increased supply of labour. Consistent with this argument, there has been an increase in the economic activity rate of 16-to-64-year-olds in the UK, up from 76.8 to 77.8 per cent between 2007 and 2014.18 In addition, the workforce has been swollen by a large increase in the number of people aged 65 and over choosing to remain in employment, and by high levels of net migration.
Focusing on the last three years alone, there was a 1.56 million (5.3 per cent) increase in employment between the last quarter of 2011 and the last quarter of 2014, and an increase in employment of 610,000 for those not born in the UK. At the same time, unemployment fell by 820,000 and economic inactivity by 364,000.19 When added up, the falls in unemployment and inactivity, plus the increase in the number of people in employment who were born overseas, do not equate to the total increase in employment for a number of reasons,20 but they are indicative of what has happened in the labour market over this period. Around half of the increase in employment is due to lower unemployment, and the rest due to an increase in labour supply.
Given that the UK has experienced a bigger fall in productivity growth than other advanced economies, it should also have seen a relatively large fall in real wages. This is indeed the case. Across OECD countries, the UK comes out near the bottom for growth in real wages (defined as labour compensation per hour deflated by consumer prices) between 2007 and 2014. Other countries that have seen a fall in real wages over this period include those countries worst-hit by the eurozone crisis: Greece, Portugal, Spain and Italy.
Figure 5.2Average growth in real wages (%) in OECD countries, 2007–2014
-3%
-2%
-1%
0%
1%
2%
3%
Gre
ece
Mex
ico
UK
Por
tuga
l
Cze
ch R
ep.
Hun
gary
Slo
veni
a
Italy
Spa
in
US
Japa
n
Net
herla
nds
Bel
gium
Den
mar
k
Aus
tria
Fran
ce
Finl
and
Irela
nd
Can
ada
Ger
man
y
Slo
vak
Rep
.
Sw
eden
Kor
ea
Est
onia
Lux.
Nor
way
Pol
and
Source: authors’ calculations based on OECD 2015c and 2015d
18 Calculated by the authors using the datasets released by the ONS alongside ONS 2015a.19 Calculated by the authors using the datasets released by the ONS alongside ONS 2015a.20 There will be double-counting if people born overseas and now in work were previously counted as
inactive or unemployed (being born overseas is not the same as being a recent migrant); those aged 65 and over are included in the employment but not the inactivity figures; and the size of the labour force changes every year as the population ages.

IPPR | The missing pieces: Solving Britain’s productivity puzzle31
However, this tells us nothing about the direction of causation. The UK might have had no productivity growth because it has had falling real wages as a result of an increase in labour supply, and because firms have tilted their capital-to-labour ratios in favour of labour as a result. Equally, real wages might have fallen because of an absence of productivity growth for other reasons.
One suggestion is that productivity in the UK has fallen over the last seven years because of a combination of falling real wages and weak aggregate demand – with the latter due, at least in part, to ‘austerity’ (the government cutting its deficit too rapidly). The fact that the countries worst affected by the eurozone crisis, which have implemented large reductions in their budget deficits, have also seen falling real wages appears to be consistent with this idea. As figure 5.3 illustrates, there is in fact a reasonably strong relationship across North American and European countries between the degree of fiscal consolidation (measured by the annual average change in the general government structural balance) and average real wage growth between 2009 and 2014. Generally speaking, the greater a country’s fiscal consolidation, the lower its real wage growth.
Figure 5.3Fiscal consolidation (% GDP) and real wage growth (%) in OECD countries, 2009–2014
-1.0% -0.5% 0.5% 1.0% 1.5%0.0%0.0%
-2.0%
-1.5%
-1.0%
-0.5%
0.5%
1.0%
1.5%
2.0%
2.5%
3.0%
0.0%
-2.0%
-1.5%
-1.0%
-0.5%
0.5%
1.0%
1.5%
2.0%
2.5%
3.0%
Fiscal consolidation
Rea
l wag
e gr
owth
Source: authors’ calculations based on IMF 2015, OECD 2015c and 2015d Note: Greece is not shown, but fits the general pattern, having experienced both a large fiscal consolidation and a large fall in real wages.
However, there does not appear to be any relationship between fiscal consolidation and productivity growth over the same period (see figure 5.4). Although simple two-factor charts like these can be misleading given the range of factors at play in an economy, this makes it harder to back the idea that austerity is behind the slowdown in productivity growth, either in the UK or across advanced economies.
Furthermore, the timing of austerity in the UK does not fit with the two phases of the productivity puzzle. During the recession, when productivity was weaker than might have been expected, the government actually eased fiscal policy a little. When productivity started to recover in 2010 and 2011, the government was making great efforts to cut its deficit. However, when the degree of austerity

IPPR | The missing pieces: Solving Britain’s productivity puzzle32
was eased around the middle of the last parliament, economic growth picked up in response, but productivity did not.
Figure 5.4Fiscal consolidation (% GDP) and productivity growth (%) in OECD countries, 2009–2014
-1.0% -0.5% 0.0% 0.5% 1.0% 1.5%0.0%
0.5%
1.0%
1.5%
2.0%
2.5%
3.0%
0.0%
0.5%
1.0%
1.5%
2.0%
2.5%
3.0%
Fiscal consolidation
Pro
duct
ivity
gro
wth
Source: authors’ calculations based on IMF 2015 and OECD 2015e
There is a clear link at an international level between productivity and real wage growth, but the direction of causality is hard to pin down. The international evidence offers only weak support for the idea that there is a direct link between austerity policies and falls in productivity growth. Furthermore, in the UK the timing of austerity and productivity weakness does match well.
5.4 Total factor productivity and the capital stockDemand-side explanations for the productivity puzzle suggest that firms, due to falling real wages and an increased cost of capital, have adjusted their capital-to-labour ratio in favour of labour. If this is the case then as labour productivity growth has fallen, so capital productivity growth should have picked up. As a result, the development of total factor productivity – that part of output growth that is due to greater efficiency in the use of inputs rather than any increase in labour or capital – might be expected to have been similar to previous cycles.
Proponents of this theory point to lower rates of investment spending, relative to GDP, in the period since the recession as being consistent with this view. Official statistics also show that the capital stock has increased at a slower rate since the recession, but the fall in the growth rate, even in net terms, does not appear to be large enough to explain why labour productivity should be fully 17 per cent lower than might have been expected on the basis of the pre-crash trend.
Table 5.1Annual average growth in the capital stock (%), volume measure, UK
1998–2007 2008–2009 2010–2013Gross stock 2.1% 1.5% 1.5%Net stock 1.9% 1.1% 1.1%
Source: Adapted from ONS 2014: table 1

IPPR | The missing pieces: Solving Britain’s productivity puzzle33
Furthermore, in recent years, total factor productivity has not developed in a similar way to how it did in previous economic cycles. It did so during the recession: total factor productivity fell in 2008 and 2009, and there were similar falls in each of the three previous recessions. However, total factor productivity barely increased in 2010 and 2011, and subsequently fell – along with labour productivity – in 2012 and 2013. This suggests that there has not been a big increase in capital productivity, as the historical record would have predicted.
Figure 5.5Contributions of multi-factor productivity and factor inputs to real gross value-added growth (%) in the UK, 1971–2013
Real GVA growthCombined production inputs Multi-factor productivity
-6%
-4%
-2%
0%
2%
4%
6%
8%
2013
2011
2009
2007
2005
2003
2001
1999
1997
1995
1993
1991
1989
1987
1985
1983
1981
1979
1977
1975
1973
1971
Source: Office for National Statistics21
Falls in total factor productivity in 2012 and 2013 are inconsistent with the idea that there has been a big shift in the capital-to-labour ratio as a result of falling real wages. This weakens the demand-side explanation for the productivity puzzle.
5.5 The composition of the workforceIf the aggregate productivity of the UK has fallen, some proportion of the workforce must be doing less productive work than it did previously. According to supply-side explanations of the productivity puzzle, this could be due to a permanent shift in the structure of the labour force.
Since the financial crash, there have been increases in the proportion of the workforce that are self-employed and the proportion that are working part-time. Self-employment has also increased more in the UK than in other countries (Hatfield 2015). If self-employed and part-time workers are less productive, in terms of output per hour, than full-time employees, then this shift in the composition of the workforce could help explain the productivity puzzle both in terms of the UK’s past historical record and in comparison to what has happened in other countries. And, if this shift is seen as irreversible, it would support those who argue that the
21 http://www.ons.gov.uk/ons/dcp171766_393934.pdf
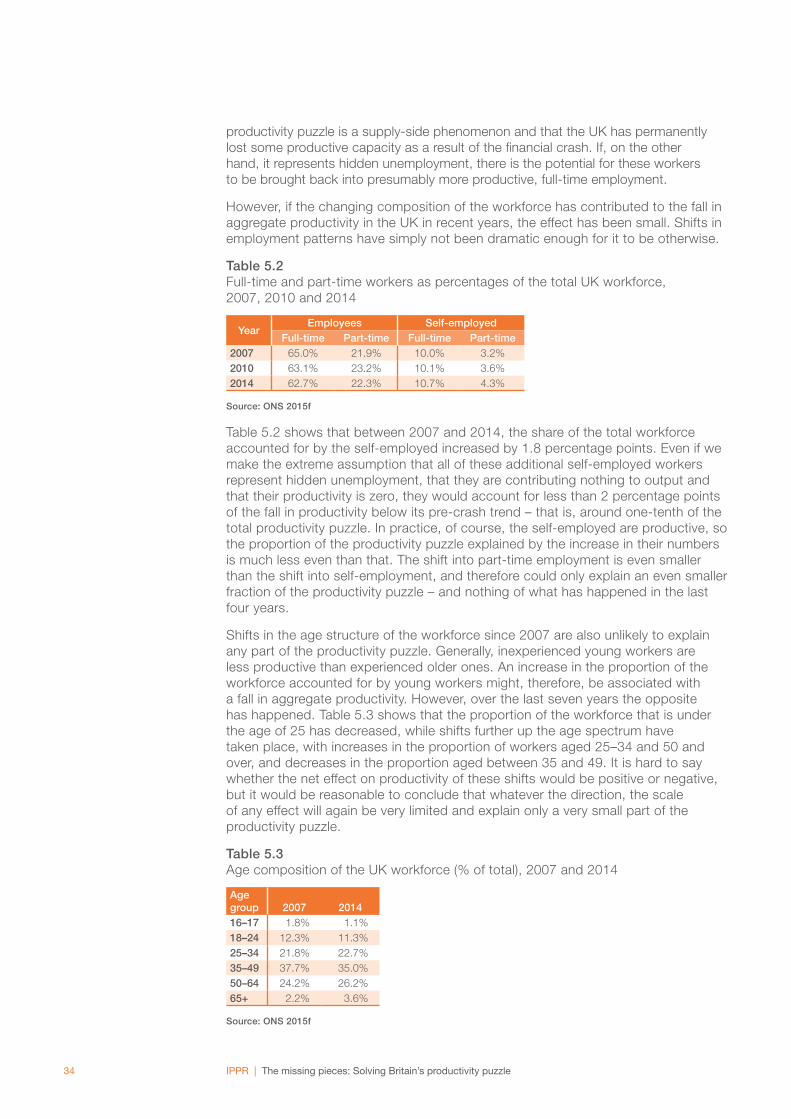
IPPR | The missing pieces: Solving Britain’s productivity puzzle34
productivity puzzle is a supply-side phenomenon and that the UK has permanently lost some productive capacity as a result of the financial crash. If, on the other hand, it represents hidden unemployment, there is the potential for these workers to be brought back into presumably more productive, full-time employment.
However, if the changing composition of the workforce has contributed to the fall in aggregate productivity in the UK in recent years, the effect has been small. Shifts in employment patterns have simply not been dramatic enough for it to be otherwise.
Table 5.2Full-time and part-time workers as percentages of the total UK workforce, 2007, 2010 and 2014
YearEmployees Self-employed
Full-time Part-time Full-time Part-time2007 65.0% 21.9% 10.0% 3.2%2010 63.1% 23.2% 10.1% 3.6%2014 62.7% 22.3% 10.7% 4.3%
Source: ONS 2015f
Table 5.2 shows that between 2007 and 2014, the share of the total workforce accounted for by the self-employed increased by 1.8 percentage points. Even if we make the extreme assumption that all of these additional self-employed workers represent hidden unemployment, that they are contributing nothing to output and that their productivity is zero, they would account for less than 2 percentage points of the fall in productivity below its pre-crash trend – that is, around one-tenth of the total productivity puzzle. In practice, of course, the self-employed are productive, so the proportion of the productivity puzzle explained by the increase in their numbers is much less even than that. The shift into part-time employment is even smaller than the shift into self-employment, and therefore could only explain an even smaller fraction of the productivity puzzle – and nothing of what has happened in the last four years.
Shifts in the age structure of the workforce since 2007 are also unlikely to explain any part of the productivity puzzle. Generally, inexperienced young workers are less productive than experienced older ones. An increase in the proportion of the workforce accounted for by young workers might, therefore, be associated with a fall in aggregate productivity. However, over the last seven years the opposite has happened. Table 5.3 shows that the proportion of the workforce that is under the age of 25 has decreased, while shifts further up the age spectrum have taken place, with increases in the proportion of workers aged 25–34 and 50 and over, and decreases in the proportion aged between 35 and 49. It is hard to say whether the net effect on productivity of these shifts would be positive or negative, but it would be reasonable to conclude that whatever the direction, the scale of any effect will again be very limited and explain only a very small part of the productivity puzzle.
Table 5.3Age composition of the UK workforce (% of total), 2007 and 2014
Age group 2007 201416–17 1.8% 1.1%18–24 12.3% 11.3%25–34 21.8% 22.7%35–49 37.7% 35.0%50–64 24.2% 26.2%65+ 2.2% 3.6%
Source: ONS 2015f

IPPR | The missing pieces: Solving Britain’s productivity puzzle35
Over the same period the UK workforce has become better qualified. Workers with higher qualification levels tend to be more highly skilled, and are therefore associated with higher levels of productivity. Between 2007 and 2014, the proportion of the workforce with at least a level 4 qualification (equivalent to an undergraduate degree) rose by more than 8 percentage points: over 40 per cent of workers are now educated to this level or higher. Similarly, there were increases in the proportion of workers with level 2 and level 3 qualifications (equivalent to GCSEs and A-levels respectively). Meanwhile, the proportion of the workforce with only lower-level qualifications or without qualifications fell. Changes in the aggregate level of skills in the workforce have not had a negative impact on UK productivity; on the contrary, we would expect the shift towards a more highly-qualified workforce to have had a positive impact.
Table 5.4UK workforce by highest level of qualification (% of total), 2007 and 2014
Qualification level 2007 2014NVQ level 4 and above 33.1% 41.6%NVQ level 3 only 15.8% 17.4%Trade apprenticeships 5.0% 3.8%NVQ level 2 only 15.5% 15.6%NVQ level 1 only 12.9% 10.4%Other qualifications (NVQ) 8.8% 6.1%No qualifications (NVQ) 9.0% 5.1%
Source: Nomis 2015
Shifts in the composition of the workforce, in terms of the moves towards greater self-employment and part-time working, can only explain a small fraction of the productivity puzzle. Meanwhile, the proportion of the workforce that is young and inexperienced has declined and workers have become better qualified, which should make them more, not less, productive. There is no support here for the supply-side theory that the productivity puzzle can be explained by a structural shift in the workforce.
5.6 The industrial composition of the workforceA change in the economy’s aggregate productivity level can come about as a result of a change in the industrial composition of the economy, of rises or falls in productivity levels within sectors, or of some combination of the two. If a shift in industrial composition is the primary cause of the gap between the current level of productivity and what it would have been if growth had been maintained at its pre-crash rate, this would tend to favour supply-side explanations of the productivity puzzle (in the absence of any reason to presume that there would be a reversal of the compositional shift).
Figure 5.6 illustrates the fact that by far the biggest fall in productivity in any sector of the UK economy since 2007 has been in the mining and utility sector, which is dominated by North Sea oil production. There has also been a big fall in productivity in the financial and insurance services sector. These have made significant contributions to the fall in productivity in the UK since the onset of the recession.
This reflects two unusual aspects of the UK economy: the extraction of oil and gas from the North Sea, and its large international investment banking industry. North Sea production is declining, and as the oil and gas become harder to extract it is inevitable that productivity in the sector will fall back. Within the financial and insurance services industries, it is likely that developments in investment banking are the main reason for the drop in productivity. In Germany, France and Italy, which do not have such large

IPPR | The missing pieces: Solving Britain’s productivity puzzle36
investment banking sectors, the finance and insurance sector has continued to record positive productivity growth in recent years.
Figure 5.6UK productivity by economic activity, 2007–2014 (2007 = 100)
Agriculture, forestry & fishing
Mining & utilities
Manufacturing
ConstructionWholesale retail tradeaccommodation food services,transportation & storageInformation & communication
Financial & insurance activities
Professional, scientific & technicalactivities, administrative &support service activities
50
60
70
80
90
100
110
120
20142013201220112010200920082007
Source: OECD 2015f
Figure 5.7Annual contribution to growth in business sector productivity of the financial and insurance sectors (percentage points) in France, Germany, Italy and the UK, 2005–2014
-1.0
-0.5
0.0
0.5
1.0
1.5
2014201320122011201020092008200720062005
France
Germany
Italy
UK
Source: OECD 2015f
IPPR | The missing pieces: Solving Britain’s productivity puzzle37
It would be wrong, however, to think that the productivity puzzle in the UK can be explained by developments in the North Sea and the finance industry alone. While these two sectors have experienced the biggest falls in productivity in recent years, and can explain statistically a lot of the aggregate fall in productivity, other important sectors have experienced falls too, including construction, accommodation and food services, government services22 and other services (see figure 5.11 below).
We have analysed the change in productivity in the UK between the first quarter of 2008 and the final quarter of 2014, breaking it down into three effects.23
1. The ‘within effect’ – the change in aggregate labour productivity due to changes in productivity within industries.
2. The ‘structural effect’ – the change in aggregate labour productivity due to changes in each industry’s share in total hours worked.
3. The ‘cross effect’ – the change in aggregate labour productivity due to the interaction between the first two effects.24
We found that the 3.0 per cent fall in productivity over this period was largely the result of a negative ‘within effect’, which accounted for 2.6 percentage points of the 3.0 per cent decline), with a smaller negative ‘cross effect’, and the aggregate ‘structural effect’ netting out to zero. The fall in the share of hours worked in finance and insurance and in manufacturing had a negative effect, but was offset by positive effects in several other sectors (a mix of below-average productivity sectors seeing their share of hours worked fall, and above average productivity sectors seeing their share increase). In other words, the shift in the distribution of hours worked within the economy had no net impact on aggregate productivity; its fall was due to big falls in productivity within industries. In particular, a lot of the fall in aggregate productivity is explained by falls in productivity within mining and quarrying, and government services.25
However, the productivity puzzle is not a question of how to account for the small fall in productivity over the last seven years; rather, it is one of why productivity failed to rise as rapidly as it had done prior to the financial crash. When looking to explain the change in the growth rate of productivity, the important consideration is not just what has been happening to productivity within sectors since the crash, but how this compares to what was happening before it. A sector in which productivity growth has slowed from very rapid to a snail’s pace might be more significant to the overall fall in productivity growth than one in which productivity was previously growing weakly and is now falling slightly.
Shifts in productivity within sectors were also the most important driver of aggregate productivity in the 10 years prior to the financial crash and recession. Aggregate productivity received particular boosts from gains in manufacturing, finance and insurance, information and communication, and wholesale and retail activities. Between the first quarters of 1998 and 2008, the net effect of shifts in hours worked between industries was close to zero.
22 It is somewhat surprising that productivity growth in government services has fallen. Given the cuts to public spending and claims of efficiency savings, an increase in public sector productivity would have been expected. This merits further investigation.
23 This type of decomposition is common practice. See for example Sepp and Verbane (2014), who use it in a very different context.
24 For example, the additional effect of higher productivity in a sector that has also increased its share of hours in the economy.
25 Authors’ calculations based on data supplied to IPPR by the ONS.

IPPR | The missing pieces: Solving Britain’s productivity puzzle38
Figure 5.8Contributions to the change in productivity (percentage points) by effect and sector, Q1 2008–Q4 2014
Within effect Between effect Cross effect
-3.0 -2.5 -2.0 -1.5 -1.0 -0.5 0.0 0.5 1.0 1.5
Total
Education
Public administration & defence;compulsory social security
Administrative & support service activities
Professional, scientific & technical activities
Financial & insurance activities
Information & communication
Accommodation & food service activities
Transportation & storage
Wholesale & retail trade; repair ofmotor vehicles & motorcycles
Construction
Water supply; sewerage, waste management& remediation activities
Electricity, gas, steam & air conditioning supply
Manufacturing
Mining & quarrying
Agriculture, forestry & fishing
Source: authors’ calculations based on data supplied to IPPR by the ONS
Figure 5.9Contributions to the change in productivity (percentage points) by effect and sector, Q1 1998–Q1 2008
Within effect Between effect Cross effect
-10 -5 0 5 10 15 20 25 30
Total
Education
Public administration and defence; compulsory social security
Administrative & support service activities
Professional, scientific & technical activities
Financial & insurance activities
Information & communication
Accommodation & food service activities
Transportation & storage
Wholesale & retail trade; repair ofmotor vehicles & motorcycles
Construction
Water supply; sewerage, waste management& remediation activities
Electricity, gas, steam & air conditioning supply
Manufacturing
Mining & quarrying
Agriculture, forestry & fishing
Source: authors’ calculations based on data supplied to IPPR by the ONS
Comparing the pre- and post-crash periods (see figures 5.9 and 5.8 respectively), there has been a substantial slackening in productivity growth in a number of sectors, including the accommodation and food services, information and communications,

IPPR | The missing pieces: Solving Britain’s productivity puzzle39
transport and storage, and professional services sectors and the manufacturing industry. Even in sectors in which productivity has continued to increase, it has mainly done so at a slower pace than in the pre-crash period (the notable exception being the administrative and support services sector).
After drifting sideways for a number of years in the mid-1990s, output per hour in manufacturing increased at an annual rate of 4.7 per cent between 1998 and 2007. Since 2007, productivity has only increased at an annual rate of 1.0 per cent, with falls in 2009 and again in 2012 and 2013. In 2014, however, productivity increased by 3.5 per cent, which may be a sign that something like the old trend is being restored. Within manufacturing, the transport equipment sub-sector is the only one that, since the financial crash, has seen productivity grow at rate similar to that of the pre-crash period. Other sub-sectors, including chemicals, computers, electricals and machinery have all seen a shift to lower productivity growth.
Figure 5.10Output per hour in UK manufacturing, Q1 1994–Q1 2015 (Q1 2014 = 100)
50
60
70
80
90
100
110
Q1 201
4
Q1 201
2
Q1 201
0
Q1 200
8
Q1 200
6
Q1 200
4
Q1 200
2
Q1 200
0
Q1 199
8
Q1 199
6
Q1 199
4
Source: ONS 2015b
Within the service sector, professional services and information and communication services were two rapidly growing sectors that helped to drive the UK economy’s relatively good aggregate productivity performance prior to 2008. Conversely, the failure of these sectors to re-establish strong productivity growth has contributed significantly to the economy’s poor overall performance in recent years. There has also been a levelling off of productivity in the transport and storage sector, and a sharp decline in the accommodation and food sectors. The one sector that has bucked the trend is the administrative and support services sector, in which productivity has gone up sharply in the last two years. And this has not been at the expense of jobs: employment in this sector has also increased significantly.

IPPR | The missing pieces: Solving Britain’s productivity puzzle40
Figure 5.11Output per hour worked in selected service sectors, Q1 2000–Q4 2014 (average of Q1–Q4 2011 = 100)
65
75
85
95
105
115
125
Q1
2014
Q1
2012
Q1
2010
Q1
2008
Q1
2006
Q1
2004
Q1
2002
Q1
2000
65
75
85
95
105
115
125
Q1
2014
Q1
2012
Q1
2010
Q1
2008
Q1
2006
Q1
2004
Q1
2002
Q1
2000
65
75
85
95
105
115
125
Q1
2014
Q1
2012
Q1
2010
Q1
2008
Q1
2006
Q1
2004
Q1
2002
Q1
2000
65
75
85
95
105
115
125
Q1
2014
Q1
2012
Q1
2010
Q1
2008
Q1
2006
Q1
2004
Q1
2002
Q1
2000
65
75
85
95
105
115
125
Q1
2014
Q1
2012
Q1
2010
Q1
2008
Q1
2006
Q1
2004
Q1
2002
Q1
2000
65
75
85
95
105
115
125
Q1
2014
Q1
2012
Q1
2010
Q1
2008
Q1
2006
Q1
2004
Q1
2002
Q1
2000
Professional services
Transport & storage
Wholesale & retail
Information & communication
Accommodation & food
Admin & support
Source: ONS 2015g

IPPR | The missing pieces: Solving Britain’s productivity puzzle41
The way to understand how important these shifts are to the productivity puzzle is to calculate the contribution of changes in productivity growth within sectors to the overall change in productivity growth. This depends on how much productivity growth has changed in each sector, and how much of the overall economy that sector accounts for. Doing so reveals that three-quarters of the productivity slowdown is the result of weaker productivity growth within five sectors: manufacturing; finance and insurance; information and communication; professional, scientific and technical activities; and government services. Around 40 per cent of the productivity puzzle is explained by weaker growth in productivity in the post-crash period, relative to the pre-crash period, in just three sectors: professional services, finance and insurance, and information and telecommunications.
Table 5.5Contributions to the productivity slowdown between the two periods Q1 1998–Q1 2008 and Q1 2008–Q4 2014 (annualised percentage points)
Within effect Between effect Cross effect TotalAgriculture, forestry & fishing
-0.07% 0.05% 0.01% -0.02%
Mining & quarrying -0.02% 0.08% -0.03% 0.03%Manufacturing -0.75% 0.33% 0.30% -0.12%Electricity, gas, steam & air conditioning supply
-0.11% 0.07% -0.01% -0.05%
Water supply; sewerage, waste management & remediation activities
-0.07% 0.04% -0.01% -0.04%
Construction -0.08% -0.16% 0.00% -0.25%Wholesale & retail trade; repair of motor vehicles and motorcycles
-0.16% -0.07% 0.00% -0.23%
Transportation & storage -0.13% -0.05% 0.00% -0.19%Accommodation & food service activities
-0.09% -0.01% -0.01% -0.10%
Information & communication
-0.33% 0.03% -0.03% -0.33%
Financial &insurance activities
-0.47% -0.12% 0.00% -0.59%
Professional, scientific & technical activities
-0.28% 0.04% -0.06% -0.31%
Administrative & support service activities
0.03% -0.09% -0.03% -0.08%
Public administration & defence; compulsory social security
-0.29% -0.10% -0.02% -0.41%
Education -0.04% -0.04% 0.00% -0.09%Total -2.88% 0.01% 0.11% -2.76%
Source: authors’ calculations based on data supplied to IPPR by the ONS
This type of analysis also reveals interesting differences between the first and second halves of the last seven years.
Between the first quarter of 2008 and the final quarter of 2011, the fall in productivity is largely accounted for by ‘within effects’ (there is also a much smaller negative ‘cross effect’). Shifts in the structure of the economy, in terms of hours worked, were actually positive for productivity growth.

IPPR | The missing pieces: Solving Britain’s productivity puzzle42
Figure 5.12Contributions to the change in productivity (percentage points) by effect and sector, Q1 2008–Q4 2011
Within effect Between effect Cross effect
-2.5 -2.0 -1.5 -1.0 -0.5 0.0 0.5 1.0 1.5
Total
Education
Public administration & defence;compulsory social security
Administrative & support service activities
Professional, scientific & technical activities
Financial & insurance activities
Information & communication
Accommodation & food service activities
Transportation & storage
Wholesale & retail trade; repair ofmotor vehicles & motorcycles
Construction
Water supply; sewerage, waste management& remediation activities
Electricity, gas, steam & air conditioning supply
Manufacturing
Mining & quarrying
Agriculture, forestry & fishing
Source: authors’ calculations based on data supplied to IPPR by the ONS
However, between the final quarters of 2011 and 2014 the ‘structural effect’ had just as large a negative impact on productivity as the ‘within effect’. During this period, the within effect was positive in wholesale and retail trade, administrative and support services and, to a much lesser extent, transport. It was negative in all other sectors. Structural effects were also mixed. The biggest positive contribution came from an increase in the proportion of hours worked in professional, scientific and technical activities. However, this was more than offset by the negative effects of falls in the proportion of hours worked in manufacturing and finance and insurance (both relatively high-productivity sectors), and by increases in the proportion accounted for by accommodation and food services (a relatively low-productivity sector).
Figure 5.13 Contributions to the change in productivity (percentage points) by effect and sector, Q4 2011–Q4 2014
Within effect Between effect Cross effect
-1.5 -1.0 -0.5 0.0 0.5 1.0 1.5
Total
Education
Public administration & defence;compulsory social security
Administrative & support service activities
Professional, scientific & technical activities
Financial & insurance activities
Information & communication
Accommodation & food service activities
Transportation & storage
Wholesale & retail trade; repair ofmotor vehicles & motorcycles
Construction
Water supply; sewerage, waste management& remediation activities
Electricity, gas, steam & air conditioning supply
Manufacturing
Mining & quarrying
Agriculture, forestry & fishing
Source: authors’ calculations based on data supplied to IPPR by the ONS

IPPR | The missing pieces: Solving Britain’s productivity puzzle43
This suggests that demand-side effects on productivity were more prominent in the recession and its immediate aftermath, but that supply-side effects have played a bigger part in holding back productivity growth during the recovery of the last three years.
There are three main conclusions to be drawn from this sectoral analysis.
• First, there have been substantial falls in productivity in the mining and finance sectors. These are peculiar to the UK, reflecting the rundown of North Sea oil production and a curtailment of activities by large international investment banks in the City. They offer a partial explanation for the slowdown in aggregate productivity growth in the UK since the financial crash (though, in the case of North Sea oil production, by an accident of timing), and for why the UK has experienced a bigger fall in productivity growth than other comparable countries. These productivity losses are unlikely to be reversed.
• Second, comparing the pre-crash period with the whole of the post-crash period, there has not been a net shift in the industrial composition of the workforce away from high-productivity industries and towards lower-productivity ones. The slowdown in productivity growth is the result of falls in productivity – or a slowdown in the pace of productivity growth – within a number of key sectors of the economy, including manufacturing, finance and insurance, information and communications, and professional, scientific and technical activities. This does not disprove the presence of supply-side effects, but it means that they cannot be said to have shifted the structure of the economy in a way that has negatively affected productivity growth.
• Third, however, a shift in the structure of the economy from relatively high-productivity sectors to relatively low-productivity ones has had a significant negative effect on productivity growth in the last three years, which suggests that supply-side effects may have been at work in this period.
5.7 Firm-level analysisAlthough the productivity slowdown up to 2011 occurred as a result of developments within sectors, rather than a shift in the composition of the workforce between sectors, those who favour a supply-side explanation of the productivity puzzle might argue that productivity was being held back by the misallocation of capital within sectors, meaning that high-productivity firms were not thriving, and low-productivity ones were not failing.
This hypothesis has been tested by economists at the Bank of England (Barnett, Chiu et al 2014). They went a step beyond analysis at a sector level to examine whether productivity growth has declined as a result of falls in productivity within firms, or due to slower reallocation of resources between firms. Their analysis shows that for the period 2007–2011 – the first part of the productivity puzzle – around two-thirds of the decline in productivity growth is explained by falls within firms, and only one-third by the slower reallocation of resources between firms (ibid). Bryson and Forth (2015), Riley et al (2014) and Blundell et al (2013) have also found lower productivity within firms to be the main reason for slower productivity growth in the economy as a whole during the recession.
Unfortunately, the firm-level data used to undertake this type of analysis are only available with a considerable lag, so it is not yet possible to analyse the second part of the productivity puzzle in this way.
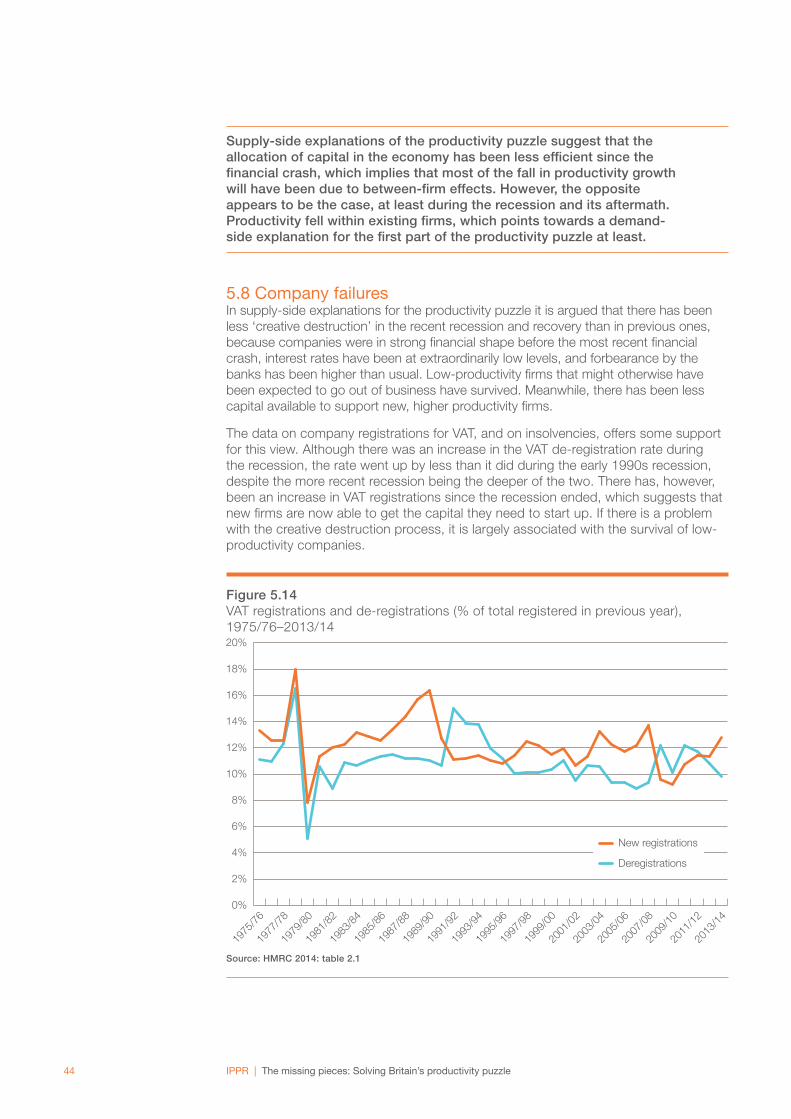
IPPR | The missing pieces: Solving Britain’s productivity puzzle44
Supply-side explanations of the productivity puzzle suggest that the allocation of capital in the economy has been less efficient since the financial crash, which implies that most of the fall in productivity growth will have been due to between-firm effects. However, the opposite appears to be the case, at least during the recession and its aftermath. Productivity fell within existing firms, which points towards a demand-side explanation for the first part of the productivity puzzle at least.
5.8 Company failuresIn supply-side explanations for the productivity puzzle it is argued that there has been less ‘creative destruction’ in the recent recession and recovery than in previous ones, because companies were in strong financial shape before the most recent financial crash, interest rates have been at extraordinarily low levels, and forbearance by the banks has been higher than usual. Low-productivity firms that might otherwise have been expected to go out of business have survived. Meanwhile, there has been less capital available to support new, higher productivity firms.
The data on company registrations for VAT, and on insolvencies, offers some support for this view. Although there was an increase in the VAT de-registration rate during the recession, the rate went up by less than it did during the early 1990s recession, despite the more recent recession being the deeper of the two. There has, however, been an increase in VAT registrations since the recession ended, which suggests that new firms are now able to get the capital they need to start up. If there is a problem with the creative destruction process, it is largely associated with the survival of low-productivity companies.
Figure 5.14VAT registrations and de-registrations (% of total registered in previous year), 1975/76–2013/14
0%
2%
4%
6%
8%
10%
12%
14%
16%
18%
20%
2013
/14
2011
/12
2009
/10
2007
/08
2005
/06
2003
/04
2001
/02
1999
/00
1997
/98
1995
/96
1993
/94
1991
/92
1989
/90
1987
/88
1985
/86
1983
/84
1981
/82
1979
/80
1977
/78
1975
/76
New registrations
Deregistrations
Source: HMRC 2014: table 2.1
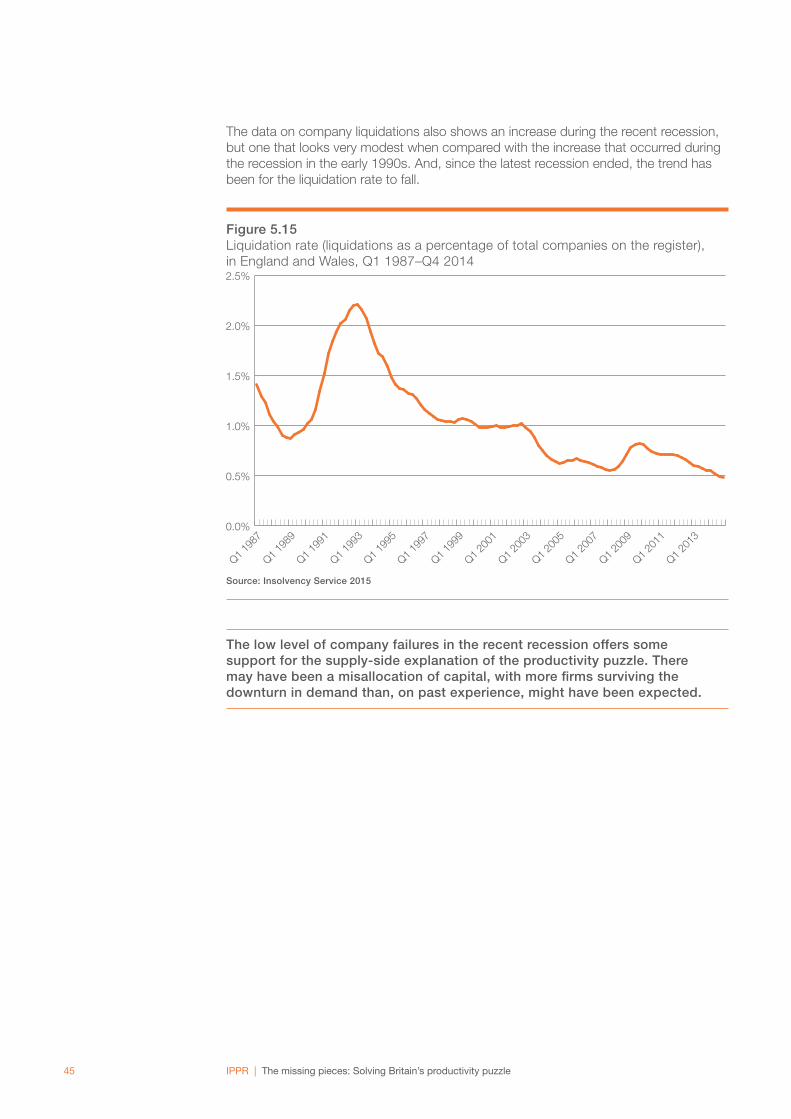
IPPR | The missing pieces: Solving Britain’s productivity puzzle45
The data on company liquidations also shows an increase during the recent recession, but one that looks very modest when compared with the increase that occurred during the recession in the early 1990s. And, since the latest recession ended, the trend has been for the liquidation rate to fall.
Figure 5.15Liquidation rate (liquidations as a percentage of total companies on the register), in England and Wales, Q1 1987–Q4 2014
0.0%
0.5%
1.0%
1.5%
2.0%
2.5%
Q1 201
3
Q1 201
1
Q1 200
9
Q1 200
7
Q1 200
5
Q1 200
3
Q1 200
1
Q1 199
9
Q1 199
7
Q1 199
5
Q1 199
3
Q1 199
1
Q1 198
9
Q1 198
7
Source: Insolvency Service 2015
The low level of company failures in the recent recession offers some support for the supply-side explanation of the productivity puzzle. There may have been a misallocation of capital, with more firms surviving the downturn in demand than, on past experience, might have been expected.

IPPR | The missing pieces: Solving Britain’s productivity puzzle46
6. CONCLUSIONS AND IMPLICATIONS
6.1 Analytical conclusionsEconomists have a poor understanding of productivity and what causes it to accelerate and decelerate – the UK’s productivity puzzle is not the first one to confound them. Those hoping for a definitive explanation as to why productivity has not increased in the UK for the last seven years, having increased at an annual rate of more than 2 per cent during the previous quarter-of-a-century – and why the UK has fared worse than other countries in this recent period – are likely to have a long wait.
The analysis we present in this report does not produce a knock-out blow in favour of any one theory about the slowdown in productivity. No single factor can explain its sheer scale – a 17 per cent shortfall relative to where it would have been on the pre-crash trend. Instead, we argue there are in fact two productivity puzzles – the extent to which it fell during the recession, and its failure to increase over the last three years while the economy expanded – and that different factors were at work in these two periods.
Data measurement issuesAround 40 per cent of the slowdown in productivity is accounted for by weaker productivity growth in the finance, professional services and information and communications sectors. It is possible that official statistics overestimated output and productivity growth in these sectors prior to the crash and, similarly, underestimated this growth after the crash. But productivity growth has fallen across almost every sector of the economy. Data measurement issues are only a small part of the explanation for the stalling of productivity.
A long-term decline in productivity growthIt is impossible to dismiss completely the idea that underlying or trend productivity growth has fallen on a long-term basis across advanced economies due to fewer technological opportunities being available to exploit. It is certainly the case that no country has escaped some slowdown in productivity growth. However, it is hard to square this theory with the lack of inflation pressures in the UK and elsewhere prior to the financial crash. Aggregate demand grew at a healthy pace up to 2007, and aggregate supply appears to have kept up with it. Although the pre-crash bubble may have disguised underlying trends to some extent, this theory also struggles to explain why the break in the upward trend in productivity was so abrupt. It seems more likely that the financial crash and recession produced reactions in the economy that led to weak productivity growth.
It is too early to judge whether this has caused the UK and other advanced economies to enter a period of secular stagnation. There has been a fall in the ratio of investment-to-GDP in the UK – and in many other advanced economies – since the financial crash, and the capital stock is growing at a slower pace, which is consistent with this idea. However, the capital stock is still growing in the UK, and output growth picked up in 2013 and 2014 (after the government eased the pace of fiscal tightening), which suggests that private sector demand is not structurally weak.
Similarly, it is impossible to say analytically whether advanced economies are on the brink of a productivity surge as firms seek to exploit the ICT revolution to the full. The historical record suggests that this is a possibility, perhaps even a probability. But until it begins to show up in the data, no one can be sure it will happen.

IPPR | The missing pieces: Solving Britain’s productivity puzzle47
Demand-side explanationsLabour hoarding is a large part of the explanation for why productivity fell during the recession – that is, for the first part of the productivity puzzle. The bulk of the decline in productivity growth up to 2011 was the result of developments within firms, not between them, which suggests that the problem was a reflection of the way in which firms chose to run their businesses.
The continued absence of inflation pressure in the UK suggests that there is still plenty of spare capacity in the economy, which again is more consistent with demand-side than with supply-side explanations of the productivity puzzle.
However, it is now over seven years since the UK economy went into recession, and it is not credible to argue that labour hoarding is still occurring, particularly in view of the reasonable growth in output and strong growth in employment seen in the last few years.
The idea that cuts to government spending are a direct cause of the productivity puzzle is also hard to sustain. They did hold back growth by taking demand out of the economy at a time when monetary policy could not compensate, and they probably had an indirect effect by discouraging investment through cuts to spending on infrastructure, further education and science. But when the economy recovered after austerity was eased in 2012, productivity did not recover with it. There is also no apparent relationship between fiscal tightening and productivity growth at an international level.
It is probable that the effects of falling real wages – the result of an increased supply of labour, which in turn was due mainly to welfare reform and a high level of net migration – help to explain why productivity failed to increase when the economy recovered after 2011. Although the capital stock has continued to grow, it is doing so at a slower pace than it did before the crash, and there has been some shift in the capital-to-labour ratio in favour of labour. But total factor productivity has also stalled in recent years, whereas it would have increased if the fall in labour productivity was mainly due to lower real wages and an increased labour supply.
Overall, it appears that demand-side factors go quite some way towards explaining why the UK’s productivity performance was so poor during the recession, but that they are less able to explain why productivity has not picked up alongside economic growth in the last three years.
Supply-side explanationsPart of the fall in aggregate productivity growth since the financial crash is due to declining growth in the mining (North Sea oil and gas) and finance industries. These are wholly structural in the case of mining, and partially so in the case of finance – and, to the extent that this is the case, they will not be reversed.
Shifts in the composition of the labour force have not made it inherently less productive. In fact, it has become older, more experienced and better qualified. If there is a problem, it is that firms are not fully utilising the skills available to them (particularly among certain groups such as migrants and mothers26). Increases in the shares of the workforce that are self-employed or working part-time can at most explain only a small fraction of the productivity puzzle.
26 See respectively: Stirling A (2015) Migrant employment outcomes in European labour markets, IPPR. http://www.ippr.org/publications/migrant-employment-outcomes-in-european-labour-markets; and Silim A and Stirling A (2014) Women and flexible working: Improving female employment outcomes in Europe, IPPR. http://www.ippr.org/publications/women-and-flexible-working-improving-female-employment-outcomes-in-europe

IPPR | The missing pieces: Solving Britain’s productivity puzzle48
There is some circumstantial evidence to back the supply-side view that capital allocation since the crash has become less efficient and that, as a result, there has been less ‘creative destruction’ than might have been expected. Fewer firms have failed during the last seven years than in previous recessions and recovery phases, despite the recent recession having been the deepest since the 1930s.
The new analysis undertaken for this report demonstrates that shifts in the sectoral composition of the economy were not a factor in the lower productivity growth that occurred during the recession, but also shows that they have been much more important since 2011. In the last three years, around half of the fall in productivity growth, compared to the pre-crash trend, has been due to structural effects – a change in the industrial composition of the workforce – rather than within-sector effects.
Overall, supply-side factors appear to have played little part in the fall in productivity during the recession, but they are in part behind its failure to recover along with the economy during the last three years.
6.2 ImplicationsThe new analysis we have presented in this report finds that labour hoarding, facilitated by lower real wages, may have been the dominant factor in causing productivity to fall during the recession, but that structural factors have played a bigger role in its unprecedented failure to increase over the last three years, at a time when the economy was growing at a reasonable pace. Part of the reason why productivity has not increased since 2011 – one that explains about half of the productivity puzzle in this period – is a tilt in the labour force towards jobs in relatively low-productivity sectors.
The key to restoring productivity growth is therefore to shift job-creation towards higher productivity sectors, while encouraging firms to invest more to boost the productivity of their existing workforces.
Government decisions in the last parliament probably contributed to the lack of increase in the UK’s productivity. Capital spending, particularly on infrastructure, was cut sharply, as was the budget for further education. And, although the science budget was spared cuts in nominal terms, this still amounted to a cut in the basic research funded by the government of around 10 per cent in real terms during the last parliament. Unsurprisingly, these cuts to infrastructure, skills provision and innovation reduced the incentive for firms to invest, as did reducing investment allowances in favour of cuts to corporation tax rates.
The government has learned its lesson on capital spending, which will be spared from the worst cuts in the current parliament, though it will still fall from 1.7 per cent of GDP in 2014/15 to 1.4 per cent in 2017/18 (OBR 2015). But spending on further education and the science budget looks to be in line for more big cuts.
If the government is determined to spend less in these areas, it should at least ensure that it gets the best possible return for taxpayers’ money in terms of boosting aggregate productivity in the economy. For example, instead of just promising more apprenticeships, it should also focus on improving their quality and making sure they provide young people with the skills that employers are demanding.
In the past, industrial policy has primarily focused on export sectors, generally in advanced manufacturing – industries like cars and aerospace. But firms in these industries are competing in global markets, and are already heavily incentivised to increase productivity levels in line with their competitors. If they do not do so, they lose business. The same pressure does not exist across large parts of the domestic service sector economy, in areas such as hospitality, accommodation,
IPPR | The missing pieces: Solving Britain’s productivity puzzle49
parts of retailing and the care industry, which employ millions more people than what is left of our manufacturing industry. The government should think more carefully about how its spending can help to boost productivity in these sectors of the economy.
Another reason for the stalling of productivity has been low real wages. An increase in the supply of potential workers – due to high unemployment, migration and government efforts to reduce inactivity rates through its welfare policies – has held down real wages. Firms have responded by taking on more workers, rather than investing to lift the productivity of their existing workforces.
As a result, there have been large increases in employment: the economy’s employment rate is at its highest level on record. This is good news, and further increases would also be welcome because they would necessarily mean more job opportunities for groups that are furthest from the labour market. But it will be much harder to push the employment rate up at the same pace over the next few years. Increases in childcare provision will help to further lift the employment rate of women with young children. But unemployment is almost back to its pre-crash rate; the government is determined to reduce net migration; and reducing inactivity will require large cuts in the number of people claiming employment and support allowance, cuts which have proved difficult to deliver in the past.
The government could have simply waited to see whether a tightening in the supply of workers led to a sustained increase in the growth rate of real wages, and whether this in turn led to higher productivity growth. Instead, it has taken action to make this happen by announcing a ‘national living wage’ of £9 an hour by 2020. Provided that it does not lead to rising prices, this welcome move will put pressure on firms to boost productivity in order to maintain their profit margins.
IPPR | The missing pieces: Solving Britain’s productivity puzzle50
REFERENCES
Bank of England [BoE] (2015) ‘Agents’ summary of business conditions: June 2015’. http://www.bankofengland.co.uk/publications/Documents/agentssummary/2015/Jun.pdf
Barnett A, Broadbent B, Chiu A, Franklin J and Miller H (2014) ‘Impaired capital reallocation and productivity’, National Institute Economic Review 228(1): R36–R48
Barnett A, Chiu A, Franklin J and Sebastiá-Barriel M (2014) ‘The UK productivity puzzle: a firm-level investigation into employment behaviour and resource allocation over the crisis’, working paper no. 495, Bank of England. http://www.bankofengland.co.uk/research/Pages/workingpapers/2014/wp495.aspx
Blundell R, Crawford C and Jin W (2013) ‘What can wages and employment tell us about the UK’s productivity puzzle?’, IFS working paper W13/11, Institute for Fiscal Studies. http://www.ifs.org.uk/wps/wp201311.pdf
Bryson A and Forth J (2015) ‘The UK’s productivity puzzle’, NIESR discussion paper no. 448, National Institute of Economic and Social Research. http://niesr.ac.uk/sites/default/files/publications/The%20UK%20Productivity%20Puzzle%20NIESR%20DP%20448_0.pdf
Confederation of British Industry [CBI] (2015) ‘CBI Industrial Trends Survey, January 2015’. http://fplreflib.findlay.co.uk/article-images/72674/CBI%20Quarterly%20Industrial%20Trends%20Survey_Jan.pdf
Corry D, Valero A and Van Reenen J (2011) ‘UK economic performance since 1997: Growth, productivity and jobs, Centre for Economic Performance’, special paper no. 24, Centre for Economic Performance, London School of Economics and Political Science. http://cep.lse.ac.uk/pubs/download/special/cepsp24.pdf
Crawford C, Jin W and Simpson H (2013) ‘Productivity, Investment and Profits during the Great Recession: Evidence from UK Firms and Workers’, Fiscal Studies 34(2): 153–177
Disney R, Jin W and Miller H (2013) ‘The productivity puzzles’, IFS Green Budget 2013. Institute for Fiscal Studies: 53–90. http://www.ifs.org.uk/docs/34598THZZ12.pdf
Goodridge P, Haskell J and Wallis G (2013) Can intangible investment explain the UK productivity puzzle?, Imperial College Business School. https://spiral.imperial.ac.uk/bitstream/10044/1/11140/4/Haskel%202013-02.pdf
Hatfield I (2015) Self-employment in Europe, IPPR. http://www.ippr.org/publications/self-employment-in-europe
HM Revenue and Customs [HMRC] (2014) ‘Value Added Tax (VAT) Factsheet 2013–14’, spreadsheet. https://www.uktradeinfo.com/Statistics/Pages/TaxAndDutybulletins.aspx
Insolvency Service (2015) ‘Insolvency Statistics 1984 to December 2014’, spreadsheet. https://www.gov.uk/government/statistics/insolvency-statistics-october-to-december-2014
International Monetary Fund [IMF] (2015) World Economic Outlook Database. http://www.imf.org/external/pubs/ft/weo/2015/01/weodata/index.aspx
IPPR | The missing pieces: Solving Britain’s productivity puzzle51
Martin B and Rowthorn R (2012) Is the British economy supply constrained II? A renewed critique of productivity pessimism, UK Innovation Research Centre. http://www.cbr.cam.ac.uk/fileadmin/user_upload/centre-for-business-research/downloads/special-reports/specialreport-britisheconomysupplycritique.pdf
Nomis (2015) Annual Population Survey, database. https://www.nomisweb.co.uk/query/select/getdatasetbytheme.asp?
Office for Budget Responsibility [OBR] (2014) ‘Table 5.7: Key economic and fiscal aggregates under alternative scenarios’, Economic and fiscal outlook: December 2014. http://budgetresponsibility.org.uk/economic-fiscal-outlook-december-2014/
Office for Budget Responsibility [OBR] (2015) ‘Economic and fiscal outlook: March 2015’. http://cdn.budgetresponsibility.independent.gov.uk/March2015eFO_18-03-webv1.pdf
Office for National Statistics [ONS] (2014) ‘Capital Stocks, Consumption of Fixed Capital, 2014’, statistical bulletin. http://www.ons.gov.uk/ons/dcp171778_385118.pdf
Office for National Statistics [ONS] (2015a) ‘UK Labour Market, May 2015’, statistical bulletin. http://www.ons.gov.uk/ons/rel/lms/labour-market-statistics/may-2015/statistical-bulletin.html
Office for National Statistics [ONS] (2015b) ‘LPROD01: Labour Productivity, Q1 2015: Tables 1-10 and R1’, spreadsheet. http://www.ons.gov.uk/ons/publications/re-reference-tables.html?edition=tcm%3A77-393176
Office for National Statistics [ONS] (2015c) ‘Output per hour and real median hourly earnings, 1975-2014, UK, Index, 2010=100’, ref. no. 004207, 1 June 2015, spreadsheet. http://www.ons.gov.uk/ons/about-ons/business-transparency/freedom-of-information/what-can-i-request/published-ad-hoc-data/labour/june-2015/index.html
Office for National Statistics [ONS] (2015d) ‘Annex A: Gross Value Added Components, Quarter 4 (Oct to Dec) 2014’, spreadsheet. http://www.ons.gov.uk/ons/publications/re-reference-tables.html?edition=tcm%3A77-355542
Office for National Statistics [ONS] (2015e) ‘EMP13: Employment by industry. Date of Publication:18 February 2015’, spreadsheet. http://www.ons.gov.uk/ons/publications/re-reference-tables.html?newquery=*&newoffset=25&pageSize=25&edition=tcm%3A77-357108
Office for National Statistics [ONS] (2015f) ‘UK Labour Market, April 2015’, statistical bulletin. http://www.ons.gov.uk/ons/dcp171778_399544.pdf
Office for National Statistics [ONS] (2015g) ‘DJS9, DJR5, DJQ7, DJR2, DJQ4, DJT7: Output per hour: Selected service sectors (SIC07: M,J,H,I,G,N): 2011=100, SA, UK’ series, ‘Labour Productivity, Q4 2014’ dataset. http://www.ons.gov.uk/ons/rel/productivity/labour-productivity/q4-2014/tsdq414.html
Organisation for Economic Cooperation and Development [OECD] (2015a) ‘National Accounts’ theme, OECD.stat database. http://stats.oecd.org/index.aspx
Organisation for Economic Cooperation and Development [OECD] (2015b) ‘GDP per hour worked’, indicator, OECD data (accessed 15 June 2015). https://data.oecd.org/lprdty/gdp-per-hour-worked.htm
Organisation for Economic Cooperation and Development [OECD] (2015c) ‘Labour compensation per hour worked’, indicator, OECD data (accessed 7 May 2015). https://data.oecd.org/lprdty/gdp-per-hour-worked.htm
Organisation for Economic Cooperation and Development [OECD] (2015d) ‘Inflation (CPI)’, indicator, OECD data (accessed 7 May 2015). https://data.oecd.org/lprdty/gdp-per-hour-worked.htm

IPPR | The missing pieces: Solving Britain’s productivity puzzle52
Organisation for Economic Cooperation and Development [OECD] (2015e) ‘Labour productivity forecast’, indicator, OECD data (accessed 7 May 2015). https://data.oecd.org/lprdty/gdp-per-hour-worked.htm
Organisation for Economic Cooperation and Development [OECD] (2015f) ‘Productivity and ULC by main economic activity (ISIC Rev.4)’ theme, OECD.stat database. http://stats.oecd.org/Index.aspx?QueryId=54569
Oulton N and Sebastiá-Barriel M (2013) ‘Long and short-term effects of the financial crisis on labour productivity, capital and output’, working paper no. 470, Bank of England. http://www.bankofengland.co.uk/research/Pages/workingpapers/2013/wp470.aspx
Perez C (2015) ‘A New Age of Technological Progress’, in Umunna C (ed) Owning the future: How Britain can make it in a fast-changing world, Policy Network and Rowman & Littlefield International: 19–31
Pessoa J P and Van Reenen J (2014) ‘The UK productivity and jobs puzzle: does the answer lie in wage flexibility?’, The Economic Journal 124(576): 433–452
Prais S (1995) Productivity, education and training: An international perspective, Cambridge University Press
Riley R, Rosazza Bondibene C and Young G (2014) ‘Productivity dynamics in the great stagnation: evidence from British businesses’, CFM discussion paper series CFM-DP2014-7, Centre for Macroeconomics
Sepp J and Verblane U (2014) ‘The decomposition of productivity gap between Estonia and Korea’, Discourse 2014 – 3, Discourses in Social Market Economy, Ordnungspolitisches Portal website. http://www.ordnungspolitisches-portal.com/Diskurse/Diskurse_2014-03.pdf
Tily G (2015) Productivity: no puzzle about it: How austerity has held back productivity and why growth is the only way to boost it, Trades Union Congress
Valero A and Roland I (2015) ‘Productivity and Business Policies’, paper EA021, Centre for Economic Performance, London School of Economics and Political Science
Walton A and Brown G (2012) ‘Updated Analysis of Revisions to Quarterly GDP’, Office for National Statistics. http://www.ons.gov.uk/ons/guide-method/method-quality/specific/economy/national-accounts/articles/updated-analysis-of-revisions-to-quarterly-gdp.pdf