report to check-up digital · analysis of check-up digital data also helps individual agencies to...
TRANSCRIPT

REPORT TO
THE NATIONAL ARCHIVES OF AUSTRALIA
CHECK-UP DIGITAL
ANALYSIS OF 2016 SURVEY DATA
FINAL REPORT

ACIL ALLEN CONSULTING PTY LTD
ABN 68 102 652 148
161 WAKEFIELD STREET
ADELAIDE SA 5000
AUSTRALIA
T +61 8 8122 4965
LEVEL FIFTEEN
127 CREEK STREET
BRISBANE QLD 4000
AUSTRALIA
T+61 7 3009 8700
F+61 7 3009 8799
LEVEL TWO
33 AINSLIE PLACE
CANBERRA ACT 2600
AUSTRALIA
T+61 2 6103 8200
F+61 2 6103 8233
LEVEL NINE
60 COLLINS STREET
MELBOURNE VIC 3000
AUSTRALIA
T+61 3 8650 6000
F+61 3 9654 6363
LEVEL ONE
50 PITT STREET
SYDNEY NSW 2000
AUSTRALIA
T+61 2 8272 5100
F+61 2 9247 2455
LEVEL TWELVE, BGC CENTRE
28 THE ESPLANADE
PERTH WA 6000
AUSTRALIA
T+61 8 9449 9600
F+61 8 9322 3955
ACILALLEN.COM.AU
SUGGESTED CITATION FOR THIS REPORT
ACIL ALLEN CONSULTING (2017), ANALYSIS OF 2016 CHECK-UP DIGITAL DATA, 23 MAY 2017
© ACIL ALLEN CONSULTING 2017

C O N T E N T S
EXECUTIVE SUMMARY I
1
Introduction 1 1.1 Context 1 1.2 Check-up Digital survey structure 1 1.3 This report 2
2
Cross capability analysis 3 2.1 Trends across capabilities 3 2.2 Trends in agency performance 12
3
Consistency checks 22 3.1 Methodology summary 23 3.2 Findings 24
4
Detailed capability analysis 28 4.1 Statement 1.1 My agency works digitally by default 29 4.2 Statement 1.2 My agency’s information governance framework is digital-ready 30 4.3 Statement 1.3 Senior management supports digital information management as a priority 31 4.4 Statement 1.4 My agency’s business decisions are informed and influenced by digital information management costs and benefits 32 4.5 Statement 1.5 Effective digital information management improves my agency’s business outcomes 33 4.6 Statement 2.1 Everyone meets their digital information management roles and responsibilities (Capability 1 — Employees) 34 4.7 Statement 2.1 Everyone meets their digital information management roles and responsibilities (Capability 2 — Specialists) 35 4.8 Statement 2.2 My agency sufficiently resources its digital information management program 36 4.9 Statement 2.3 My agency’s digital information is authentic, reliable and accurate 37 4.10 Statement 2.4 My agency manages the appropriate retention, migration or destruction of its digital information 38 4.11 Statement 2.5 My agency actively manages its digital information for as long as needed 39 4.12 Statement 2.6 Digital information in outsourced provider and third-party arrangements is managed 40 4.13 Statement 2.7 Digital information in collaborative spaces and social media is managed 41 4.14 Statement 3.1 Digital information in my agency’s business systems is managed (Capability 1 — Business systems) 42 4.15 Statement 3.1 Digital information in my agency’s business systems is managed (Capability 2 — Metadata) 43 4.16 Statement 3.2 Management of digital information is planned when acquiring or developing, upgrading, decommissioning and migrating
business systems 44 4.17 Statement 3.3 My agency is ready to migrate (transfer) ‘Retain as National Archives’ (RNA) digital information to the National Archives
(the Archives) 45 4.18 Statement 3.4 My agency's digital information is available for use and protected from unforeseen loss 46
5
Conclusions 47

CHECK-UP DIGITAL ANALYSIS OF 2016 SURVEY DATA i
E X E C U T I V E S U M M A R Y
About Check-up Digital
Check-up Digital is an online survey developed by the National Archives of Australia (Archives) and completed by Australian Government agencies as an annual self-assessment of their digital information capabilities. The findings of the self-assessments are used by the Archives to gauge the maturity of digital information capability development within Australian Government agencies. This, in turn, helps to inform policy development, improve accountability of agencies, and better target agency support services.
Check-up Digital surveys commenced in 2014 and support the Digital Continuity 2020 Policy. This Policy builds on the achievements of the 2011 Digital Transition Policy and encourages agencies to continue their progress towards improved digital information governance and management. The policy is founded on three principles:
— information is valued
— information is managed digitally
— information, systems and processes are interoperable.
It sets a number of targets for agencies to achieve by 2020 in the course of their normal business review, and ICT investment and maintenance cycles.
2016 submissions
The 2016 Check-up Digital survey was conducted between July and October 2016. Similar to previous Check-up Digital surveys from 2014 and 2015, the survey comprised 18 capability statements across three sections, namely:
— Section 1. Optimising business outcomes — five capabilities related to linking good digital information management with business outcomes and strategies for improving digital information management
— Section 2. Addressing risk — eight capabilities related to managing risk through appropriate resourcing and information quality
— Section 3. Managing business systems — five capabilities related to assessment of key aspects of managing digital information in business systems.
Under these sections, agencies self-rated each capability on a five-point maturity scale: initial (1), developing (2), defined (3), managed (4), and optimising (5), and supported these ratings with open text comments and uploads of evidentiary documentation.
The participation rate for 2016 was 100% (165 of 165 ‘in-scope’ agencies). This includes one agency which completed a manual submission but was excluded from analysis.

CHECK-UP DIGITAL ANALYSIS OF 2016 SURVEY DATA ii
Key findings
Over the three years of Check-up Digital, agencies have improved their capabilities, with the average rating reaching 3.0 in 2016, up from 2.8 in 2015, and 2.6 in 2014. Ratings at defined and above accounted for 72 per cent of all agency ratings, compared to 64 per cent in 2015, and 55 per cent in 2014. The improvement spanned all three Check-up sections, with Optimising business outcomes containing on average the most mature capabilities, as it has in previous years.
The improvement across agencies is demonstrated by the 112 out of 157 comparable agencies1 (71 per cent) that increased their average rating in 2016, compared to 2015. Compared to 2014 reporting, 100 out of 142 comparable agencies (70 per cent) increased their average rating to 2016.
Nearly all agencies have started work on their capabilities, with only 12 per cent of agency ratings at the initial level, compared to 23 per cent in 2014. However, 41 per cent of agencies still rated themselves at the initial level for at least one capability, and reducing this remains an area for improvement.
As in 2015, two notable achievements for 2016 were — senior management support [capability 1.3, average rating: 3.4], and protection and availability of data for use [capability 3.4, average rating: 3.5]. The largest improvement in 2016 was for resourcing digital information management programs [capability 2.2], with a rating of 3.2, up from 2.9 in 2015.
There are also some areas that may warrant further examination, such as the 26 comparable agencies (17 per cent) that reported decreased average ratings in 2016, compared to 2015. When compared to 2014 reporting, 22 agencies (16 per cent) reported decreased average ratings.
Capabilities related to the retention and migration of digital information (capabilities 3.3 and 2.4) continued to have the lowest average ratings of 2.5 and 2.8, respectively. This is concerning, as poor digital retention and migration capability can result in the inadvertent loss of valuable information.
As in previous years, the evidence for a sample of capabilities was checked for consistency with the ratings provided. These consistency checks found that a lower share of agency ratings (41 per cent) were highly consistent with evidence requirements than in either 2014 or 2015 (52 per cent in both years). Two factors that may have contributed to this result are adjustments to the evidence requirements for several capabilities, and the adoption of a different set of capabilities for checking. Notwithstanding this, comparisons of ratings between years have found that ratings for some agencies changed substantially from 2015, and so may require further or more specific review.
Overall maturity
There has been a steady increase in overall digital maturity reaching 3.0 (out of five), up from 2.8 in 2015 and 2.6 in 2014. This increase was achieved uniformly across each of the Check-up Digital sections, as shown in Table ES 1:
TABLE ES 1 AVERAGE RATINGS BY CHECK-UP DIGITAL SECTION — 2014, 2015, AND 2016
Agency group 2014 2015 2016 Change (2014-2016)
Optimising business outcomes 2.7 2.9 (+0.2) 3.1 (+0.2) +0.4
Addressing risk 2.6 2.8 (+0.2) 3.0 (+0.2) +0.4
Managing business systems 2.6 2.8 (+0.2) 3.0 (+0.2) +0.4
Note: Figures in parentheses show change in average rating from previous year
SOURCE: ACIL ALLEN CONSULTING ANALYSIS OF CHECK-UP DIGITAL DATA
1 Includes agencies in scope, and which did not have machinery of government changes between these years that may have affected their reporting.

CHECK-UP DIGITAL ANALYSIS OF 2016 SURVEY DATA iii
The proportion of agency ratings at the:
— initial (1) and developing (2) levels decreased from 35.8 per cent in 2015 to 28.0 per cent in 2016.
— defined (3) and managing (4) levels increased from 58.4 per cent in 2015 to 65.6 per cent in 2016.
— optimising (5) levels increased from 5.9 per cent in 2015 to 6.4 per cent in 2016.
Over the three years of Check-up Digital, ratings at the:
— initial (1) and developing (2) levels decreased by 17.3 per cent.
— defined (3) and managing (4) levels increased by 15.1 per cent.
— optimising (5) level increased by 2.3 per cent.
Figure ES 1 summarises ratings across all agencies and capabilities across all three years, and shows that there has been steady progress of agencies moving from ‘preparing’ (that is, initial or developing) to ‘achieving’ (that is, defined or above) their capabilities.
FIGURE ES 1 DISTRIBUTION OF CAPABILITY RATINGS ACROSS ALL AGENCIES FOR ALL CAPABILITIES — 2014, 2015, AND 2016
SOURCE: ACIL ALLEN CONSULTING ANALYSIS OF CHECK-UP DIGITAL DATA
Agencies generally broadened the capabilities they had developed in 2016, with 68 agencies (41 per cent) rating at least one capability at the initial level in 2016, down from 88 agencies (53 per cent) in 2015 and 105 agencies (63 per cent) in 2014. Despite this improvement, 15 agencies (nine per cent) had more than half their capabilities at the initial level, and three had all their capabilities at the initial level.
The number of agencies with high rated capabilities also increased in 2016. This includes four agencies with at least thirteen of their capabilities at the optimising level (the same number of agencies as did this in 2015). The most mature agency rated 17 of their capabilities at the optimising level, up from 16 capabilities in 2015.
Maturity across agencies
Analysis of Check-up Digital data also helps individual agencies to compare, monitor, and manage digital capability development, and understand best practice.
Average ratings by agency in 2016 (across all capabilities) ranged from 1 (all at the initial level) to 4.9. Agencies have been examined by grouping them into three groups (thirds) according to their ratings across all capabilities. Table ES 2 shows the average of all ratings for agencies in each third, across each of the three years of Check-up Digital.
22.6%
22.8%29.6%
20.9%
17.3%
18.5%
33.2%
25.2%
5.9%
Initial (1) (12.1%)
Developing (2) (16%)
Defined (3) (35.6%)
Managing (4) (30%)
Optimising (5) (6.4%)
2015
2014
2016

CHECK-UP DIGITAL ANALYSIS OF 2016 SURVEY DATA iv
TABLE ES 2 AVERAGE RATINGS BY AGENCY THIRD ACROSS ALL YEARS OF CHECK-UP DIGITAL
Agency group 2014 2015 2016 Change (2014-2016)
Lowest third 1.6 1.8 (+0.2) 2.1 (+0.3) +0.5
Middle third 2.7 3.0 (+0.3) 3.1 (+0.2) +0.5
Highest third 3.6 3.8 (+0.2) 3.9 (+0.1) +0.3
Note: Figures in parentheses show change in average rating from previous year
SOURCE: ACIL ALLEN CONSULTING ANALYSIS OF CHECK-UP DIGITAL DATA
Agencies in the lowest third represent those in the beginning stages of developing their digital information management capabilities. The average ratings for agencies in this group range from 1.0 (all at the initial level) through to 2.8, with the middle (median) agency in this group having an average rating of 2.2. Approximately 66 per cent of all ratings for these agencies were at the initial and developing levels. Improvement within this group was varied over the three years. For example, two of the agencies which were in the lowest third in 2014 were in the highest third by 2016. In contrast, three agencies viewed all of their capabilities at the initial level in 2016, and another agency was at the developing level for only one capability (and initial for the remainder).
Most of the agencies in the middle third have achieved several capabilities, with 86 per cent of all ratings for this group at the defined level or above. The average ratings for agencies in this group range from 2.8 through to 3.4, with the middle (median) agency in this group having an average rating of 3.1. While these agencies may be considered to have made good progress, some still have significant scope to further improve their capabilities, with 17 instances of agencies in this group rating capabilities at the initial level.
The highest third of agencies are of specific interest as potential sources of exemplar practice for other agencies. Average ratings for agencies in this group ranged between 3.5 and 4.9, with the middle (median) agency having an average rating of 3.8. The three highest performing agencies had average ratings above 4.8 and 14 agencies (nine per cent of all agencies) had an average rating above 4. Only 2.5 per cent of capability ratings by agencies in this group were at the initial or developing levels. These were for a range of capabilities, but Readiness to transfer digital information to the Archives [capability 3.3] was particularly common, with 12 agencies providing low ratings for that capability.
Figure ES 2 shows the average rating for each agency for 2016, and changes in the profile of average agency ratings from 2014 to 2016.

CHECK-UP DIGITAL ANALYSIS OF 2016 SURVEY DATA v
FIGURE ES 2 AVERAGE RATINGS FOR ALL AGENCIES, 2016, AND IMPROVEMENT IN OVERALL AGENCY RATINGS FROM 2014 TO 2016
Average ratings for all agencies
Average rating percentiles across agencies by year
SOURCE: ACIL ALLEN CONSULTING ANALYSIS OF CHECK-UP DIGITAL DATA
Maturity of individual capabilities
Strong achievements
Examination of ratings for each capability has identified several areas of achievement — where capabilities are either rated high or have improved markedly over time.
The most improved capability from 2015 to 2016 was My agency sufficiently resources its digital information management program [capability 2.2]. Ratings for this capability increased from 2.9 in 2015 to 3.2 in 2016 (+0.27). This suggests that agencies have increasingly understood the benefits in allocating appropriate resources to improve digital information maturity.
The most improved capability from 2014 to 2016 was Management of digital information in collaborative spaces and social media [capability 2.7]. Ratings for this capability increased from 2.4 in 2014 (one of the lowest rated capabilities), to 2.8 in 2015 (+0.36 points), and 3.1 in 2016 (+0.25
0
1
2
3
4
5
Avera
ge r
atin
g
Agencies by average rating
Highest third of agencies Middle third of agencies Lowest third of agencies
One third of agencies had an average score greater than 3.5
One third of agencies had an average score less than 2.8
0
1
2
3
4
5
100% 90% 80% 70% 60% 50% 40% 30% 20% 10%
Avera
ge r
ating
Percentile
2014 2015 2016
Most mature agencies
Leastmature agencies
Largest improvements for agencies between 1.5 and 2.5
Continued strong performanceby agencies between 3.5 and 4
Least mature agencies showedlittle progress
Highest third Middle third Lowest thirdFurther improvement difficult for agencies above 4.0

CHECK-UP DIGITAL ANALYSIS OF 2016 SURVEY DATA vi
points). While reasons are unclear from Check-up ratings, a likely contributing factor is increased awareness and use of these media over the past three years and of the need to manage this information as records.
Senior support of digital information management as well as broad digital system implementation continued to be the strongest achievements across the whole of government in 2016. This indicates sustained momentum for digital maturity across many agencies, and is illustrated by the following three capabilities, all of which have average ratings above 3.0:
— My agency's digital information is available for use and protected from unforeseen loss [capability 3.4] (average rating = 3.5, up from 3.3 in 2015, and 3.1 in 2014)
— Senior management supports digital information management as a priority [capability 1.3] (average rating = 3.4, up from 3.3 in 2015, and 3.1 in 2014)
— My agency works digitally by default [capability 1.1] (average rating = 3.3, up from 3.1 in 2015, and 2.8 in 2014)
Areas for attention
Examination of capabilities has also identified several areas that may warrant further examination — where capability ratings remain low relative to other capabilities. Across government, the primary areas with apparent scope for improvement relate to retention and migration of digital information, consideration of digital information management costs and benefits in business decision making, and management of metadata. Capabilities with the lowest average ratings were:
— My agency is ready to migrate (transfer) ‘Retain as National Archives’ (RNA) digital information to the National Archives [capability 3.3] (average rating = 2.5, up from 2.4 in 2015, and 2.2 in 2014)
— My agency’s business decisions are informed and influenced by digital information management costs and benefits [capability 1.4] (average rating = 2.8, up from 2.6 in 2015, and 2.3 in 2014)
— My agency manages the appropriate retention, migration or destruction of its digital information [capability 2.4] (average rating = 2.8, up from 2.6 in 2015, and 2.4 in 2014).
— Digital information in my agency’s business systems is managed (Metadata) [capability 3.1] (average rating = 2.8, up from 2.6 in 2015, and 2.4 in 2014).
These capabilities were also the lowest rated capabilities in 2014 and 2015. While rated low, capability 1.4 is however one of the five most improved capabilities since 2014.
Recommendations for agency support
The capability ratings for agencies differed markedly by overall level of maturity, so that individual agency contexts need to be taken into account in identifying any improvement strategies. The following trends and observations are provided as potential areas for focus:
Agencies with low overall levels of maturity need to continue to plan progression in all parts of Check-up Digital. As in 2015, the capabilities that were most mature across all agencies in this group for 2016 were Senior management support for digital information management [capability 1.3] and ensuring Digital information is available for use and protected from unforeseen loss [capability 3.4]. The track record of achievement among these agencies means that these remain possible ‘first steps’ for agencies that find it difficult to develop any capabilities.
Where such agencies have strong fundamental capabilities they may benefit from developing capabilities that moderately mature agencies have developed. These include Management of digital information when acquiring or developing, upgrading, decommissioning and migrating business systems [capability 3.2] and Managing metadata in business systems [capability 3.1].
For agencies with moderate levels of overall maturity, developing capabilities related to retention and migration of digital information [capabilities 3.3 and 2.4] may be important, as these capabilities had the lowest maturity among these agencies. These agencies may also benefit from further development of their information governance frameworks [capability 1.2] and informing business decisions by digital information management costs and benefits [capability 1.4].

CHECK-UP DIGITAL ANALYSIS OF 2016 SURVEY DATA vii
Agencies with high levels of overall maturity have developed most capabilities, and can therefore aim for continuous improvement of their capabilities across the entire Check-up Digital framework. Retention and migration of digital information [capabilities 3.3 and 2.4] remain the areas with the lowest maturity for these agencies.
Consistency and reliability
As in previous years, the evidence for a sample of capabilities was checked for consistency with the ratings provided. These consistency checks indicated a lower level of consistency than in previous years. Some factors to consider are that the checks were applied to responses for a different (but with some overlap) sample of 30 agencies and eight capabilities to 2015. The result should also be considered in light of adjusted response criteria in 2016, which typically increased evidence requirements from agencies.
Two additional factors appear largely responsible for the decrease in consistency — the changes in capabilities being assessed, and adjustments to the rating criteria in 2016. Accounting for these differences, it is possible that the evidence provided by all agencies (not just the sample) was as consistent with ratings as in previous years. However, there were also some clear cases of individual agencies providing less evidence to support their rating in 2016 than they did for previous years. The report contains more detailed analysis of the capabilities and agencies with decreased consistency in their ratings.
Response consistency was also examined through comparisons of ratings across years. This analysis found 26 agencies that reported lower average ratings in 2016 — more than the number found in 2015 (14 agencies). Only one agency, however, had a decrease of more than one rating level on average across all capabilities.
Comparisons also identified 21 agencies with substantial increases in their average ratings. Understanding of the factors that enabled such rapid improvements for these agencies may help to support other agencies to improve their digital maturity in the following years

CHECK-UP DIGITAL ANALYSIS OF 2016 SURVEY DATA 1
1 I N T R O D U C T I O N
1 Introduction
1.1 Context
Check-up Digital is an online survey developed by the Archives and completed by Australian Government agencies as an annual self-assessment of their digital information capabilities. Under the Archives Act 1983, the National Archives of Australia (the Archives) has the authority to undertake surveys of Commonwealth records. The Archives uses the findings of the self-assessments to gauge the maturity of digital information capability development within Australian Government agencies which, in turn, informs policy development, improves accountability of agencies, and helps to better target agency support services.
Check-up Digital supports the Digital Continuity 2020 Policy and encourages agencies to continue their progress towards improved digital information governance and management. The policy is based on three principles: information is valued; information is managed digitally; and information, systems and processes are interoperable. It sets a number of targets for agencies to achieve by 2020 in the course of their normal business review, and ICT investment and maintenance cycles.
1.2 Check-up Digital survey structure
The 2016 Check-up Digital survey repeated 2014 and 2015 surveys. The survey comprises three sections, collectively containing 18 capability statements. These three sections are:
— Section 1. Optimising business outcomes - five capabilities related to linking good digital information management with good business outcomes and strategies for improving digital information management
— Section 2. Addressing risk - eight capabilities related to managing risks through appropriate resourcing and information quality
— Section 3. Managing business systems - five capabilities related to assessment of key aspects of managing digital information in business systems.
Under these sections, agencies self-rated each capability on a five-point maturity scale: initial (1), developing (2), defined (3), managed (4), and optimising (5). They supported these ratings with open text comments and documentation uploads (which are mandatory for six capabilities). Agencies are encouraged to ensure that the documentation uploaded provides specific evidence for their capability ratings. The Archives provides agencies with guidance on what types of documentation and evidence to provide.
Each agency’s Check-up Digital submission requires sign-off by the head of the agency that the submission is an accurate assessment of their agency’s situation.
This process is aligned with best practice in capability maturity models.

CHECK-UP DIGITAL ANALYSIS OF 2016 SURVEY DATA 2
The participation rate for 2016 was 100% (165 of 165 ‘in-scope’ agencies). This includes one agency which completed a manual submission but was excluded from analysis, consistent with previous years.
1.3 This report
The National Archives of Australia (Archives) commissioned ACIL Allen to analyse, validate and report on Check-up Digital for data gathered in 2014, 2015, and 2016. This is the final of the three annual reports, each with the purpose to:
— report on the consistency of agency responses
— identify key findings from the data
— inform ministers, agencies, and the Archives about the state of information management across whole of government.
Key findings are the focus of this report. The report structure is as follows:
— Chapter 2 reports on process maturity across capabilities.
— Chapter 3 reports on high level results from the consistency checks.
— Chapter 4 describes maturity of individual capabilities.
— Chapter 5 contains conclusions from the analysis.

CHECK-UP DIGITAL ANALYSIS OF 2016 SURVEY DATA 3
2 C R O S S C A P A B I L I T Y A N A L Y S I S
2 Cross capabil ity analysis
This chapter compares ratings for all agencies between 2014, 2015, and 2016. Unless otherwise noted, the analysis includes all agencies that completed the survey in each year, meaning that the averages comparing agencies across years may reflect slightly different agencies in each of those years.
The chapter provides complementary views of agencies’ capability maturity. The first view in section 2.1 examines trends in ratings across all agencies by capability. The second view in section 2.2 examines trends in ratings across all capabilities by agency.
2.1 Trends across capabilities
This section examines trends in ratings by capability. The analysis groups ratings across all agencies to provide an overall view of the maturity of each capability. This analysis identifies which capabilities are the most or least mature across all agencies, the improvement of capabilities over time, and strategies to support overall capability development across the whole of government.

CHECK-UP DIGITAL ANALYSIS OF 2016 SURVEY DATA 4
BOX 2.1 KEY FINDINGS AND POSSIBLE ACTIONS – TRENDS ACROSS CAPABILITIES
Across all of Check-up Digital
Agency ratings increased on trend in 2016 with an average rating of 3.0 (out of five), up from 2.8 in 2015 and
2.6 in 2014. As to be expected, ratings at the initial and developing levels both decreased (28 per cent of
ratings, down from 36 per cent in 2015, and 45 per cent in 2014), and ratings at other levels increased.
Across Check-up Digital sections
Capabilities across each of the three sections of Check-up Digital have seen similar improvement, on average,
since 2014.
Capabilities related to Optimising business outcomes remained the highest rated overall, with an average
rating of 3.1 (up from 2.9 in 2015, and 2.7 in 2014). The average ratings across capabilities for Addressing risk
and Managing business systems both increased to 3.0 from 2.8 in 2015 and 2.6 in 2014.
Areas of achievement in 2016
The highest rated capabilities across whole of government were similar to those in 2015 and 2014. They are:
— My agency's digital information is available for use and protected from unforeseen loss [capability 3.4]
(average = 3.5)
— Senior management supports digital information management as a priority [capability 1.3] (average = 3.4)
Areas for attention in 2016
The four capabilities which had the lowest average ratings are:
— My agency is ready to migrate (transfer) ‘Retain as National Archives’ (RNA) digital information to the National
Archives (the Archives) [capability 3.3] (average rating = 2.5)
— My agency’s business decisions are informed and influenced by digital information management costs and
benefits [capability 1.4] (2.8)
— My agency manages the appropriate retention, migration or destruction of its digital information [capability 2.4]
(2.8)
— Digital information in my agency’s business systems is managed [capability 3.1 (Metadata)] (2.8)
Areas of improvement from 2015
Every capability improved from 2015, but the largest improvement was for My agency sufficiently resources its
digital information management program [capability 2.2] (average = 3.2, up from 2.9 in 2014).
Two other capabilities with further consolidated high ratings in 2016 are:
— My agency works digitally by default [capability 1.1] (average = 3.3, up from 3.1 in 2015)
— My agency’s digital information is authentic, reliable and accurate [capability 2.3] (average = 3.1, up from 2.9 in
2015)
Several capabilities with low ratings in 2015 showed only small improvements to 2016, with the smallest
improvement for low maturity capabilities being for My agency is ready to migrate (transfer) ‘Retain as National
Archives’ (RNA) digital information to the National Archives (the Archives) [capability 3.3] (average = 2.5,
improvement of +0.14). The smallest improvement across all three years was for My agency’s Information
governance frameworks is digital-ready [capability 1.2] (average of 2.9, improvement of +0.11).
Areas of improvement over 3 years
Management of digital information in collaborative spaces and social media [capability 2.7] was the most
improved capability from 2014 to 2016 (+0.61), and Sufficient resourcing of digital information management
programs [capability 2.2] showed a similar increase (+0.56).
Areas for attention over 3 years
Readiness to transfer information to the Archives [capability 3.3] remains the main area for future
improvement, having had consistent low ratings over 3 years (in 2014 average rating = 2.2, in 2015 average
rating = 2.3, and in 2016 average rating = 2.5).

CHECK-UP DIGITAL ANALYSIS OF 2016 SURVEY DATA 5
Overall, agency ratings improved on trend in 2016
FIGURE 2.1 CAPABILITY MATURITY RATINGS FOR ALL AGENCIES AND CAPABILITIES — ALL YEARS
SOURCE: ACIL ALLEN CONSULTING ANALYSIS OF CHECK-UP DIGITAL DATA
Figure 2.1 shows that there was a steady improvement in agency ratings from 2014 to 2016, with fewer ratings at the initial and developing levels, and more ratings at the defined, managing and optimising levels.
The average rating across all capabilities and agencies increased from 2.6 (out of five) in 2014, to 2.8 in 2015, and 3.0 in 2016.
The proportion of agency ratings at the:
— initial and developing levels decreased from 35.8 per cent in 2015 to 28.1 per cent in 2016
— defined and managing levels increased from 58.4 per cent in 2015 to 65.6 per cent in 2016
— optimising level increased from 5.9 per cent in 2015 to 6.4 per cent in 2016.
Over the three years of Check-up Digital, ratings at the:
— initial (1) and developing (2) levels decreased by 17.3 per cent.
— defined (3) and managing (4) levels increased by 15.1 per cent.
— optimising (5) level increased by 2.3 per cent.
In total, 68 agencies (41 per cent) had at least one rating at the initial level, but this is down from 88 (53 per cent) in 2015, and 105 (63 per cent) in 2014. Three agencies rated all capabilities at the initial level in 2016, which is the same number as 2015, and down from five agencies in 2014.
Additional agencies rated themselves as optimising their capabilities in 2016, with 61 agencies (37 per cent) rating at least one capability at the optimising level. This was up from 56 agencies (34 per cent) in 2015 and 49 agencies (30 per cent) in 2014.
The four highest rated agencies continued to rate themselves significantly higher than their peers, with at least 13 capabilities at the optimising level. These agencies were also the most mature in 2015, and contain three of the five most mature agencies from 2014. Subject to validation, they may be sources of exemplar practice for other agencies.
The three lowest rated agencies in 2016 all had average ratings of 1.0 (all ratings at the initial level), but rated themselves higher in previous years. Although the 10 lowest rated agencies included many agencies in the bottom 10 from previous years, they also included three agencies which were not in existence in 2014. Of the 10 lowest rated agencies in 2014, four were in the bottom 10 in 2016.
22.6%
17.3%
12.1%
22.8%
18.5%
16.0%
29.6%
33.2%
35.6%
20.9%
25.2%
30.0%
4.1%
5.9%
6.4%
0% 20% 40% 60% 80% 100%
2014
2015
2016
Proportion of ratings
Initial (1) Developing (2) Defined (3) Managing (4) Optimising (5)
2.6
2.8
Average rating
3.0

CHECK-UP DIGITAL ANALYSIS OF 2016 SURVEY DATA 6
Optimising business outcomes remains the most mature section of Check-up Digital in 2016
FIGURE 2.2 AGENCY RATINGS BY CHECK-UP DIGITAL SECTION — ALL YEARS
SOURCE: ACIL ALLEN CONSULTING ANALYSIS OF CHECK-UP DIGITAL DATA
Figure 2.2 shows that ratings across all three sections of Check-up Digital continued to improve in 2016.
Capabilities for Optimising business outcomes remained the most developed overall, with an average rating of 3.1. Capabilities related to Optimising business outcomes had the largest increase in ratings in 2016, with 30 per cent of ratings at the managing level within this section, up from 24 per cent in 2015.
In aggregate, capabilities for Addressing risk and for Managing business systems had similar average ratings (both 3.0). Ratings at the initial and developing levels for Addressing risk showed the largest decrease. These ratings decreased by 9.4 percentage points in 2016, compared to around six per cent for the other sections. Since 2014 these ratings have decreased more rapidly than for other sections (down by 20 percentage points, compared to 15 percentage points in other sections). This means that, while the Addressing risk section had more initial and developing ratings than Managing business systems in 2014, it had a lower proportion of ratings at these levels in 2016.
18.8%
14.7%
11.3%
19.9%
15.0%
12.0%
36.0%
39.3%
38.9%
21.4%
24.5%
30.5%
3.9%
6.5%
7.3%
24.0%
17.9%
11.7%
25.0%
20.3%
17.0%
26.7%
31.1%
35.8%
20.5%
25.8%
30.0%
3.8%
5.0%
5.5%
24.1%
18.9%
13.3%
22.2%
19.0%
18.4%
28.0%
30.5%
31.8%
21.0%
24.8%
29.6%
4.8%
6.7%
6.8%
0% 20% 40% 60% 80% 100%
2014
2015
2016
2014
2015
2016
2014
2015
2016
Optim
isin
g b
usin
ess
outc
om
es
Ad
dre
ssin
g r
isk
Managin
g b
usin
ess
syste
ms
Proportion of agencies
Initial (1) Developing (2) Defined (3) Managing (4) Optimising (5)
2.7
3.1
Averagerating
2.9
2.6
3.0
2.8
2.6
3.0
2.8

CHECK-UP DIGITAL ANALYSIS OF 2016 SURVEY DATA 7
Analysis by capability shows some capabilities were substantially more developed than others.
FIGURE 2.3 AGENCY RATINGS BY CHECK-UP DIGITAL CAPABILITY, 2016
SOURCE: ACIL ALLEN CONSULTING ANALYSIS OF CHECK-UP DIGITAL DATA
Figure 2.3 shows agency ratings by capability. The least and most mature capabilities (by average ratings and proportions at the initial through to optimising levels) are discussed further below under Figures 2.4 and 2.5 respectively.
3.3
2.9
3.4
2.8
3.1
2.9
3.0
3.2
3.1
2.8
2.9
3.0
3.1
3.0
2.8
3.1
2.5
3.5
0% 20% 40% 60% 80% 100%
1.1 My agency works digitally by default
1.2 My agency’s information governance framework is digital-ready
1.3 Senior management supports digital information management as apriority
1.4 My agency’s business decisions are informed and influenced by digital information management costs and benefits
1.5 Effective digital information management improves my agency’s business outcomes
2.1 (Employees) Everyone meets their digital information managementroles and responsibilities
2.1 (Specialists) Everyone meets their digital information managementroles and responsibilities
2.2 My agency sufficiently resources its digital information managementprogram
2.3 My agency’s digital information is authentic, reliable and accurate
2.4 My agency manages the appropriate retention, migration or destructionof its digital information
2.5 My agency actively manages its digital information for as long asneeded
2.6 Digital information in outsourced provider and third-party arrangementsis managed
2.7 Digital information in collaborative spaces and social media is managed
3.1 (business systems) Digital information in my agency’s business systems is managed
3.1 (metadata) Digital information in my agency’s business systems is managed
3.2 Management of digital information is planned when acquiring ordeveloping, upgrading, decommissioning and migrating business systems
3.3 My agency is ready to migrate (transfer) ‘Retain as National Archives’ (RNA) digital information to the National Archives (the Archives)
3.4 My agency's digital information is available for use and protected fromunforeseen loss
Proportion of agencies
Initial (1) Developing (2) Defined (3) Managing (4) Optimising (5)
Average rating
Optim
isin
g b
usin
ess o
utc
om
es
Addre
ssin
g r
isk
Managin
gbusin
ess s
yste
ms

CHECK-UP DIGITAL ANALYSIS OF 2016 SURVEY DATA 8
The main areas for attention spanned all three sections of Check-up Digital, with migrating RNA information to the Archives remaining the least mature capability
FIGURE 2.4 LOW RATING CAPABILITIES, 2016
SOURCE: ACIL ALLEN CONSULTING ANALYSIS OF CHECK-UP DIGITAL DATA
Figure 2.4 shows capabilities with low average ratings. As in previous years, the capability with the lowest average rating was My agency is ready to migrate (transfer) ‘Retain as National Archives’ (RNA) digital information to the National Archives (the Archives) [capability 3.3].(average rating = 2.5).
Three capabilities had average ratings of 2.8, and relate to each of the Check-up Digital sections. These capabilities are:
— My agency’s business decisions are informed and influenced by digital information management costs and benefits [capability 1.4]
— My agency manages the appropriate retention, migration or destruction of its digital information [capability 2.4]
— Digital information in my agency’s business systems is managed [capability 3.1 (Metadata)]
Capabilities 1.4 and 3.3 had the most ratings at the initial level (20 per cent each).
Two capabilities which had at least one third of agencies at initial or developing, and therefore may require additional attention are:
— Digital information in my agency’s business systems is managed [capability 3.1 (metadata)] (36 per cent at initial or developing)
— My agency’s information governance framework is digital-ready [capability 1.2] (34 per cent).
The reasons for low ratings in this set of capabilities remain unclear, however consultations with agencies which have low ratings or agencies that have recently improved these capabilities could help to identify barriers and enablers to developing these capabilities.
2.5
2.8
2.8
2.8
0% 20% 40% 60% 80% 100%
3.3 My agency is ready to migrate (transfer) ‘Retain as National Archives’ (RNA) digital information to the National Archives (the
Archives)
1.4 My agency’s business decisions are informed and influenced by digital information management costs and benefits
2.4 My agency manages the appropriate retention, migration ordestruction of its digital information
3.1 (metadata) Digital information in my agency’s business systems is managed
Proportion of agencies
Initial (1) Developing (2) Defined (3) Managing (4) Optimising (5)
Average rating
Areas for attention

CHECK-UP DIGITAL ANALYSIS OF 2016 SURVEY DATA 9
Areas of achievement included senior management support for digital information management, and implementation of digital systems.
FIGURE 2.5 HIGH RATING CAPABILITIES, 2016
SOURCE: ACIL ALLEN CONSULTING ANALYSIS OF CHECK-UP DIGITAL DATA
Capabilities with the highest average ratings across government are shown in Figure 2.5. These both indicate areas of broad achievement as well as areas to focus on for agencies with lower ratings.
The two capabilities that had the highest average ratings were:
— My agency's digital information is available for use and protected from unforeseen loss [capability 3.4] (average rating = 3.5)
— Senior management supports digital information management as a priority [capability 1.3] (average rating = 3.4).
Two additional (related) achievements are:
— My agency works digitally by default [capability 1.1] (average rating = 3.3)
— My agency sufficiently resources its digital information management program [capability 2.2] (average rating = 3.2).
Capabilities 1.1 and 3.4 had the most ratings at optimising (15 per cent and 11 per cent respectively). Capabilities 3.4 and 1.3 also had the most ratings at defined or above (88 per cent and 84 per cent respectively).
High ratings for these capabilities demonstrate that many agencies viewed themselves as adequately resourcing and implementing digital information systems and processes. These capabilities may be viewed as a prerequisite for other capability development, as they suggest that agencies are acting on a high level of senior management support.
The reliability of ratings for these high rated capabilities varies, with both digital by default [capability 1.1] and senior management support [capability 1.3] being checked for consistency in 2016. The evidence for capability 1.1 was highly consistent with the requirements, with 14 out of 25 responses at defined or above being highly consistent, and a further six responses being partially consistent. In contrast, only four of the 25 responses at defined or above were highly consistent with agency ratings for capability 1.3, suggesting further work is required to ensure ratings are more robust for this capability.
3.5
3.4
3.3
3.2
0% 20% 40% 60% 80% 100%
3.4 My agency's digital information is available for use and protected fromunforeseen loss
1.3 Senior management supports digital information management as apriority
1.1 My agency works digitally by default
2.2 My agency sufficiently resources its digital information managementprogram
Proportion of agencies
Initial (1) Developing (2) Defined (3) Managing (4) Optimising (5)
Average rating
Areas of achievement

CHECK-UP DIGITAL ANALYSIS OF 2016 SURVEY DATA 10
Every capability improved from 2015, but the largest improvements were in resourcing digital information management programs, and managing collaborative spaces.
FIGURE 2.6 CAPABILITIES BY 2015 AVERAGE RATING AND IMPROVEMENT IN AVERAGE RATING TO 2016
Note: Some capability labels are omitted for clarity. Refer to Appendix B for a chart which includes the remaining capability labels.
SOURCE: ACIL ALLEN CONSULTING ANALYSIS OF CHECK-UP DIGITAL DATA
Figure 2.6 shows the intersection of capability ratings in 2015 and improvement to 2016, to understand capability improvement in 2016 within the context of existing capability levels. Specifically, some capabilities with high ratings previously could be more difficult to develop further, and those which were previously rated lowly may have the potential for most growth. While this analysis does not establish a causal relationship between these two dimensions, it may identify areas for further exploration.
Of capabilities with below average ratings in 2015, Digital information in collaborative spaces and social media is managed [capability 2.7] had the largest increase, from 2.8 in 2015 to 3.1 in 2016. This capability was also the most improved capability in 2015, and this continued improvement demonstrates agency awareness of the need to manage information in these media.
The most improved capability in 2016 was My agency sufficiently resources its digital information management program [capability 2.2] – a robust result considering this capability had above average maturity in 2015. The average rating for this capability increased from 2.9 in 2015 to 3.2 in 2016. A review of the type of support offered for this capability in 2015 might inform future support for other capabilities.
Other capabilities considered ‘high raters’ included My agency’s digital information is authentic, reliable, and accurate [capability 2.3] and My agency works digital by default [capability 1.1].
Two capabilities related to Managing business systems demonstrated below average improvement in 2016. Agencies reported little improvement, relative to other capabilities, in Digital information in my agency’s business systems is managed [capability 3.1 (business systems)] and Management of digital information is planned when acquiring or developing, upgrading, decommissioning and migrating business systems [capability 3.2]. Although these capabilities are already reasonably mature, the slower rate of improvement may indicate continued emphasis on the benefits of these capabilities is required to encourage future improvement.
My agency’s information governance framework is digital ready [capability 1.2] was the least improved capability in 2016, despite having average maturity in 2015. The reasons for this are unclear, but could include changes due to the Digital Continuity 2020 requirement to have an information governance framework.
1.1
1.21.3
2.1 (employees)
2.2
2.3
2.4
2.7
3.1 (business systems)
3.23.3
3.4
2.3 2.5 2.7 2.9 3.1 3.3
Impro
vem
ent in
avera
ge r
atin
g to 2
016
2015 average rating
Average rating= 2.8
Average improvement = +0.19
More
im
pro
vem
ent
Less
impro
vem
ent
High improvers:Less mature in 2015. but more improvement
High raters:More mature in 2015.and large improvement
Hard to startLess mature in 2015 and small improvements
Hard to shiftMore mature in 2015.and small improvement
High improvers
Hard to shift
High raters

CHECK-UP DIGITAL ANALYSIS OF 2016 SURVEY DATA 11
Two additional high rated capabilities in 2015 were Senior management supports digital information management as a priority [capability 1.3] and My agency’s digital information is available for use and protected from unforeseen loss [capability 3.4]. However, while capability 3.4 improved on par with most other capabilities in 2016, capability 1.3 was one of the least improved capabilities.
The following capabilities were less mature in 2015 and had below average improvement in 2016:
— My agency is ready to migrate (transfer) ‘Retain as National Archives’ (RNA) digital information to the National Archives (the Archives) [capability 3.3] (from 2.4 in 2015 to 2.5 in 2016)
— Everyone meets their digital information management roles and responsibilities [capability 2.1 (employees)] (from 2.8 in 2015 to 2.9 in 2016)
— My agency manages the appropriate retention, migration or destruction of its digital information [capability 2.4] (from 2.6 in 2015 to 2.8 in 2016).
These capabilities may benefit from further consideration of the barriers to further improvement so that more significant gains can be made in future years.
Hard to start

CHECK-UP DIGITAL ANALYSIS OF 2016 SURVEY DATA 12
2.2 Trends in agency performance
This section considers trends in ratings by agency. This analysis groups ratings across all capabilities, to provide an overall view of the maturity of each agency. The analysis identifies which agencies are most or least mature, changes in agency ratings over time, and strategies to assist agencies with different levels of maturity to further develop their capabilities.
BOX 2.2 KEY FINDINGS AND POSSIBLE ACTIONS – TRENDS ACROSS CAPABILITIES
Average rating distribution
Average ratings by agency ranged from 1 (all ratings at the initial level) to 4.9 (almost all ratings at the
optimising level) in 2016. This is a similar range to previous years of analysis.
There was significant variation in ratings across agencies. As a group, the highest third of agencies had
average ratings of 3.9, compared to 2.0 for the lowest third. All agencies in the highest third had individual
average ratings above 3.5, while those in the lowest third had average ratings below 2.9. The highest third also
had 17.4 capabilities at defined or above on average, compared to 6.1 capabilities for the lowest third.
High rating agencies are of specific interest as potential sources of exemplar practice for other agencies, and
low rating agencies identify where further support or sharing of good practice may be beneficial.
Main achievements
There were three capabilities that were rated high by all three agency groups, relative to other capabilities.
These are:
— My agency works digitally by default [capability 1.1]
— Senior management supports digital information management as a priority [capability 1.3]
— My agency's digital information is available for use and protected from unforeseen loss [capability 3.4]
These capabilities (particularly capabilities 1.3 and 3.4) have been consistently rated high for all agency groups
in each year, which suggests that they are foundational or in some ways prerequisite for other capabilities.
In addition to these two capabilities, the highest third of agencies also rated My agency sufficiently resourcing
their digital information management programs [capability 2.2] and My agency’s digital information is authentic,
reliable and accurate [capability 2.3] significantly higher than other capabilities. Both capabilities had average
ratings of 4.1.
Areas for attention
Agencies in all three groups rated low on two capabilities related to migration of data.
— My agency is ready to migrate (transfer) ‘Retain as National Archives’ (RNA) digital information to the National
Archives (the Archives) [capability 3.3]
— My agency manages the appropriate retention, migration or destruction of its digital information [capability 2.4]
The low and middle agency thirds also indicated some areas to focus on for future improvement. The low third
rated particularly low for Digital information in my agency’s business systems is managed
[capability 3.1 (metadata)], while the middle third rated low for My agency’s business decisions are informed
and influenced by digital information management costs and benefits Influencing [capability 1.4], and My
agency’s information governance framework is digital ready [capability 1.2].
What worked for each agency third
The capabilities that improved the most over the three years differed by agency third.
The lowest agency third increased ratings most for My agency sufficiently resources its digital information
management program [capability 2.2] and Effective digital information management improves my agency’s
business outcomes [capability 1.5].
Agencies in the middle third had strong improvement across each section of Check-up, but a particular
achievement was Digital information in collaborative spaces and social media is managed [capability 2.7]. This
was also the most improved capability among the highest third of agencies in 2016, with this group also
improving My agency works digitally by default [capability 1.1] and My agency is ready to migrate
(transfer)‘Retain as National Archives’ digital information to the National Archives [capability 3.3]

CHECK-UP DIGITAL ANALYSIS OF 2016 SURVEY DATA 13
What didn’t work for each agency third
Capabilities that improved least also differed by agency third.
For the lowest third agencies did not tend to improve their readiness to migrate ‘Retain as National Archives’
digital information to the Archives [capability 3.3] or senior management support for digital information
management as a priority [capability 1.3], despite these being strong improvements for other agency thirds.
The middle third made the smallest improvements for My agency’s information governance framework is digital
ready [capability 1.2] and Effective digital information management improves my agency/s business outcomes
[capability 1.5].
The highest third had the smallest improvement in Managing digital information in outsourced provider and
third-party arrangements [capability 2.6].
Changes in agency ratings
Twenty six agencies (15 per cent) decreased their average ratings between 2015 and 2016. This is a larger
share than the agencies which decreased their average ratings in 2015 (eight per cent), and may relate to
changes to evidence requirements for several capabilities in 2016.
Possible actions
Further consultation with agencies to examine:
— the sequence in which agencies believe they can develop capabilities
— whether improved capabilities are translating to improved agency performance/outcomes
— whether there are other barriers that inhibit or enable development of particular capabilities
— the reasons for decreases in agency ratings (focussing on agencies that reported the most decreased ratings).

CHECK-UP DIGITAL ANALYSIS OF 2016 SURVEY DATA 14
Agencies displayed a wide range of overall maturity, with most agencies increasing their average ratings from 2014
FIGURE 2.7 DISTRIBUTION OF AGENCIES BY AVERAGE RATING, 2016
Note: Average rating is calculated as the mean rating across all 18 capabilities for the agency.
The lowest ‘third’ contains 54 agencies, the middle ‘third’ contains 55 agencies, and the highest ‘third’ contains 55 agencies.
SOURCE: ACIL ALLEN CONSULTING ANALYSIS OF CHECK-UP DIGITAL DATA
Figure 2.7 shows the average rating of each agency, across all capabilities, in 2016. Examination of these average ratings helps to identify agencies, or groups of agencies, that require further support, or which may be sources of exemplar practice for other agencies.
Most agencies in the lowest third were still beginning to develop their digital information management capabilities, with 66 per cent of ratings at the initial and developing levels, and average ratings below or equal to 2.8. Three of these agencies rated all of their capabilities at the initial level, while another agency rated one capability at the developing level and all others at the initial level.
Nevertheless, several agencies in the lowest third have demonstrated a good level of achievement in 2016 with 19 of the 55 agencies at defined or above for at least half of their capabilities. This compares to six agencies in the lowest third for 2015, and no agencies in the lowest third for 2014.
There were also three ratings at the optimising level in this group. While this could indicate narrow areas of excellence within these agencies, the relatively low ratings across the remainder of capabilities for these agencies suggest that further validation of responses could be beneficial.
Agencies in the middle third rated most capabilities at the defined level or above – which is considered to be a level of achievement. Ratings at these levels represented 86 per cent of ratings for this group. Despite this achievement, there were still 17 instances of agencies in this group rating capabilities at the initial level, with five of these related to My agency’s business decisions being informed and influenced by digital information management costs and benefits [capability 1.4]. Further examination of and support for these agencies may help to identify key barriers to progression for those capabilities.
The highest third includes several agencies which, subject to validation, are potential sources of exemplar practice for other agencies. The three highest performing agencies had average ratings between 4.8 and 5.0, and 14 agencies (9 per cent) had an average rating above four.
The next sections examine the areas of achievement and attention for each agency third, to help inform potential support strategies for these groups in 2016.
0
1
2
3
4
5
Avera
ge r
atin
g
Agencies by average rating
Highest third of agencies Middle third of agencies Lowest third of agencies
One third of agencies had an average score greater than 3.5 (3.3 in 2015, and 3.1 in 2014)
One third of agencies had an average score less than 2.8 (2.5 in 2015, and 2.2 in 2014)

CHECK-UP DIGITAL ANALYSIS OF 2016 SURVEY DATA 15
For most capabilities, the lowest agency third had the largest increases in agencies rating at defined or above
The arrows in Figure 2.8 show shifts in the proportions of agencies at defined and above, for each agency ‘third’ from 2014 to 2015, and from 2015 to 2016. The following analysis examines those capabilities that had strong achievement, and those that appeared to require further attention for each agency third. It also compares the largest and smallest improvements from 2014 to 2016.
FIGURE 2.8 IMPROVEMENT IN THE PROPORTION OF AGENCIES AT DEFINED AND ABOVE FOR DIFFERENT AGENCY THIRDS (GROUPS), FROM 2014 TO 2016
Note: Dotted lines refer to improvement from 2014 to 2015. Solid arrows refer to improvement from 2015 to 2016. Agencies in each third may change from year to year.
SOURCE: ACIL ALLEN CONSULTING ANALYSIS OF CHECK-UP DIGITAL DATA
0% 20% 40% 60% 80% 100%
1.1 My agency works digitally by default
1.2 My agency’s information governance framework is digital-ready
1.3 Senior management supports digital information management as apriority
1.4 My agency’s business decisions are informed and influenced by digital information management costs and benefits
1.5 Effective digital information management improves my agency’s business outcomes
2.1 (Employees) Everyone meets their digital information managementroles and responsibilities
2.1 (Specialists) Everyone meets their digital information managementroles and responsibilities
2.2 My agency sufficiently resources its digital information managementprogram
2.3 My agency’s digital information is authentic, reliable and accurate
2.4 My agency manages the appropriate retention, migration ordestruction of its digital information
2.5 My agency actively manages its digital information for as long asneeded
2.6 Digital information in outsourced provider and third-partyarrangements is managed
2.7 Digital information in collaborative spaces and social media ismanaged
3.1 (business systems) Digital information in my agency’s business systems is managed
3.1 (metadata) Digital information in my agency’s business systems is managed
3.2 Management of digital information is planned when acquiring ordeveloping, upgrading, decommissioning and migrating business systems
3.3 My agency is ready to migrate (transfer) ‘Retain as National Archives’ (RNA) digital information to the National Archives (the Archives)
3.4 My agency's digital information is available for use and protected fromunforeseen loss
Proportion of agencies at defined and above
Improvement in lowest third of agencies Improvement in middle third of agencies Improvement in highest third of agencies
Sectio
n 1
.O
ptim
isin
g b
usin
ess
Sectio
n 2
.A
ddre
ssin
g r
isk
Sectio
n 3
. M
anagin
gbusin
ess s
yste
ms

CHECK-UP DIGITAL ANALYSIS OF 2016 SURVEY DATA 16
Agency performance—highest third of agencies (54 agencies)
TABLE 2.1 KEY INFORMATION – HIGHEST THIRD OF AGENCIES, 2016
Information Capability Average
rating
Proportion at
defined or above a
Main achievements
(most mature)
1.1 My agency works digitally by default
1.3 Senior management supports digital information management as a
priority 2.2 My agency sufficiently resources its digital information management program
2.3 My agency’s digital information is authentic, reliable and accurate 3.4 My agency's digital information is available for use and protected from unforeseen loss
4.2
4.2
4.1
4.1
4.1
100%
100%
100%
100%
100%
Areas for attention
(least mature)
3.3 My agency is ready to migrate (transfer) ‘Retain as National Archives’
(RNA) digital information to the National Archives (the Archives) 2.4 My agency manages the appropriate retention, migration or destruction of its digital information
3.4
3.6
78%
94%
Most improved b, c 2.7 Digital information in collaborative spaces and social media is managed
1.1 My agency works digitally by default
3.3 My agency is ready to migrate (transfer) ‘Retain as National Archives’
(RNA) digital information to the National Archives (the Archives)
+0.4
+0.5
+0.5
+13%
+2%
+19%
Least improved 2.6 Digital information in outsourced provider and third-party arrangements
is managed
1.4 My agency’s business decisions are informed and influenced by digital
information management costs and benefits
+0.1
+0.1
+6%
Unchanged
Note: a Figures show the proportion of agency ratings at defined (3), managed (4), or optimising (5), which has been identified as a level of achievement by the Archives.
b Average rating and proportion at defined and above show changes from the highest third in 2014 to the highest third in 2016. Figures for improvements to the proportion at defined and above are
percentage point changes. The agencies in the top third may change from year to year.
c Error! Reference source not found. in Appendix Error! Reference source not found. contains the distribution of ratings for each capability by agency group in 2016.
SOURCE: ACIL ALLEN CONSULTING ANALYSIS OF CHECK-UP DIGITAL DATA
Agencies in the top third rated highly across most capabilities and may include many cases of exemplar practice for other agencies.
Some additional notable achievements for this group were:
— an average rating of 3.9—substantially above the average of 3.0 across whole of government
— approximately 17 capabilities at defined and above on average
— all agencies at defined or above for Effective digital information management improves my agency’s business outcomes [capability 1.5]
Two capabilities with the most agencies at the initial or developing levels are:
— My agency is ready to migrate (transfer) ‘Retain as National Archives’ (RNA) digital information to the National Archives (the Archives) [capability 3.3] (22 per cent at initial or developing)
— My agency manages the appropriate retention, migration or destruction of its digital information [capability 2.4] (six per cent at initial or developing)
Despite these capabilities being the lowest rated for these agencies, most of the agencies in the top third had achieved them, and so may provide the basis for sharing effective practices.
Similarly, the most improved capabilities may provide some insight into where agencies were most effective in their efforts to improve digital maturity. The capability showing greatest improvement among this group was Digital information in collaborative spaces and social media is managed [capability 2.7]. This builds on strong improvement in 2015, with an overall improvement of 0.4 over the three years of Check-up.
There are two capabilities which the top third of agencies improved more over the past three years. They are:
Other achievements
Primary areas for attention
What worked and what didn’t in Check-up Digital

CHECK-UP DIGITAL ANALYSIS OF 2016 SURVEY DATA 17
— My agency works digitally by default [capability 1.1] (+0.47)
— My agency is ready to migrate (transfer) ‘Retain as National Archives’ (RNA) digital information to the National Archives (the Archives) [capability 3.3] (+0.45)
In contrast, agencies in the top third appear to have only made incremental gains in ‘Digital information in outsourced provider and third-party arrangements is managed’ [capability 2.6], with only a 0.08 point increase from 2014 to 2016.
Agency performance—middle third of agencies (55 agencies)
TABLE 2.2 KEY INFORMATION – MIDDLE THIRD OF AGENCIES, 2016
Information Capability Average
rating
Proportion at
defined or above a
Main achievements
(most mature)
3.4 My agency's digital information is available for use and protected from
unforeseen loss
1.3 Senior management supports digital information management as a
priority
1.1 My agency works digitally by default
3.5
3.5
3.4
96%
100%
100%
Areas for attention
(least mature)
3.3 My agency is ready to migrate (transfer) ‘Retain as National Archives’
(RNA) digital information to the National Archives (the Archives)
2.4 My agency manages the appropriate retention, migration or destruction
of its digital information
1.4 My agency’s business decisions are informed and influenced by digital
information management costs and benefits
1.2 My agency’s information governance framework is digital-ready
2.6
2.8
2.8
2.9
56%
71%
78%
75%
Most improved b, c 2.7 Digital information in collaborative spaces and social media is managed
1.4 My agency’s business decisions are informed and influenced by digital
information management costs and benefits
2.6 Digital information in outsourced provider and third-party arrangements
is managed
+0.7
+0.6
+0.6
+35%
+31%
+35%
Least improved 1.2 My agency’s information governance framework is digital-ready
1.5 Effective digital information management improves my agency’s
business outcomes
3.4 My agency's digital information is available for use and protected from
unforeseen loss
+ 0.3
+ 0.3
+ 0.3
+18%
+15%
+9%
Note: a Figures show the proportion of agency ratings at defined (3), managed (4), or optimising (5), which has been identified as a level of achievement by the Archives.
b Average rating and proportion at defined and above show changes from the middle third in 2014 to the middle third in 2016. Figures for improvements to the proportion at defined and above are
percentage point changes. The agencies in the middle third may change from year to year.
c Error! Reference source not found. in Appendix Error! Reference source not found. contains the distribution of ratings for each capability by agency group in 2016.
SOURCE: ACIL ALLEN CONSULTING ANALYSIS OF CHECK-UP DIGITAL DATA
Agencies in the middle third typically achieved many capabilities but may have substantial scope for future improvements.
Some achievements for this group, aside from those noted in Table 2.2, were:
— an average rating of 3.1
— approximately 15 capabilities at defined and above on average
— a high proportion (above 90 per cent) of agencies at defined or above for:
― Effective digital information management improves my agency’s business outcomes [capability 1.5] ― My agency sufficiently resources its digital information management program [capability 2.2]
As in 2015, three capabilities with the lowest ratings related to governance frameworks [capability 1.2] and the retention and migration of digital information [capabilities 3.3 and 2.4]. The middle agencies also rated themselves as less mature in informing business decisions with digital information
Other achievements
Primary areas for attention

CHECK-UP DIGITAL ANALYSIS OF 2016 SURVEY DATA 18
management costs and benefits [capability 1.4]. Other capabilities are likely to be foundational to these capabilities, so the middle agencies may benefit from a ‘road map’ for capability development.
In addition to improvements noted above, the middle agencies showed improvements in 2016 for several capabilities that related to the management of digital information in collaborative spaces and social media, in business systems or in outsourced provider and third-party arrangements (capabilities 2.6, 2.7, 3.1, and 3.2). This indicated that these agencies have increasingly understood where their digital information is located, and taken steps to improve their maturity in these areas.
Across the three years of Check-up Digital, the largest improvements for middle agencies were for:
— Digital information in collaborative spaces and social media is managed [capability 2.7] (+0.73)
— My agency’s business decisions are informed and influenced by digital information management costs and benefits [capability 1.4] (+0.64).
In contrast, the smallest improvements for this group across all three years were for:
— My agency’s information governance framework is digital-ready [capability 1.2] (+0.25)
— Effective digital information management improves my agency’s business outcomes [capability 1.5] (+0.25)
Agency performance —lowest third of agencies (55 agencies)
TABLE 2.3 KEY INFORMATION – LOWEST THIRD OF AGENCIES, 2016
Information Capability Average
rating
Proportion at
defined or above a
Main
achievements
(most mature)
3.4 My agency's digital information is available for use and protected from
unforeseen loss
1.3 Senior management supports digital information management as a priority
2.8
2.5
67%
53%
Areas for attention
(least mature)
3.1 (metadata) Digital information in my agency’s business systems is managed
3.3 My agency is ready to migrate (transfer) ‘Retain as National Archives’ (RNA)
digital information to the National Archives (the Archives)
2.4 My agency manages the appropriate retention, migration or destruction of its
digital information
1.6
1.6
1.8
15%
9%
20%
Most improved b, c 1.5 Effective digital information management improves my agency’s business
outcomes
2.2 My agency sufficiently resources its digital information management
program
+0.7
+0.7
39%
33%
Least improved 3.3 My agency is ready to migrate (transfer) ‘Retain as National Archives’ (RNA)
digital information to the National Archives (the Archives)
1.3 Senior management supports digital information management as a priority
+0.0
+0.1
-1%
10%
Note: a Figures show the proportion of agency ratings at defined (3), managed (4), or optimising (5), which has been identified as a level of achievement by the Archives.
b Average rating and proportion at defined and above show changes from the lowest third in 2014 to the lowest third in 2016. Figures for improvements to the proportion at defined and above are
percentage point changes. The agencies in the lowest third may change from year to year.
c Error! Reference source not found. in Appendix Error! Reference source not found. contains the distribution of ratings for each capability by agency group in 2016.
SOURCE: ACIL ALLEN CONSULTING ANALYSIS OF CHECK-UP DIGITAL DATA
Agencies in the lowest third have achieved few capabilities compared to other agency thirds (albeit substantially more than in 2014), and as such they are most likely to need additional information and support.
Aside from those noted in Table 2.3, achievements within this group were limited, but include:
— two thirds of capabilities commenced (above the initial level), and an average rating of 2.1 in 2016, up from 1.8 in 2015 and 1.6 in 2014.
— Approximately 6 capabilities at defined and above on average, up from 3.7 in 2015 and 2.5 in 2014.
What worked and what didn’t in Check-up Digital
Other achievements

CHECK-UP DIGITAL ANALYSIS OF 2016 SURVEY DATA 19
— More than a quarter of agencies at the managed level for My agency’s digital information is available for use and protected from unforeseen loss [capability 3.4] and Senior management supports digital information management as a priority [capability 1.3].
As in previous years, attention should be given to all agencies within this group, with gains to be made across all capabilities in Check-up Digital. Developing foundational capabilities, such as 3.4 and 1.3 should remain a priority into the future.
Examining the differences between the lowest and middle third may help to identify pathways to higher overall maturity. The largest differences in capability ratings between the lowest and middle agency thirds related to managing digital information; specifically:
— Digital information in my agency’s business systems is managed [capability 3.1 (metadata)] (average rating for the middle third was +1.4 above the lowest third)
— Management of digital information is planned when acquiring or developing, upgrading, decommissioning and migrating business systems [capability 3.2] (+1.3).
Agencies in the lowest third increased their ratings across many parts of Check-up Digital in 2016. The two capabilities which improved the most over the three years of Check-up were:
— My agency sufficiently resources its digital information management program [capability 2.2] (+0.72)
— Effective digital information management improves my agency’s business outcomes [capability 1.5] (+0.71).
There were also two capabilities which showed little improvement among this group in 2016. My agency is ready to migrate (transfer) ‘Retain as National Archives’ (RNA) digital information to the National Archives [capability 3.3] had no net improvement, which may mean it remains beyond the scope of many agencies. Senior management supports digital information management as a priority [capability 1.3] had only minor improvement (+0.1), suggesting further work is required in these agencies.
Primary areas for attention
What worked and what didn’t in Check-up Digital

CHECK-UP DIGITAL ANALYSIS OF 2016 SURVEY DATA 20
While most agencies reported modest increases in ratings overall, some agencies showed large deviations in ratings from 2015.
FIGURE 2.9 CHANGE TO AVERAGE RATING BY AGENCY FROM 2015 TO 2016
Note: This analysis only considers agencies without significant machinery of Government changes. ‘Similar’ ratings are defined as where the average rating is
the same, or increases by less than 0.5.
SOURCE: ACIL ALLEN CONSULTING ANALYSIS OF CHECK-UP DIGITAL DATA
Figure 2.9 compares average ratings from 2015 to 2016 to identify where average ratings decreased, or significantly increased, between 2015 and 2016.
Of the 157 comparable agencies that participated in Check-up Digital in both 2015 and 2016:2
— 26 agencies (17 per cent) decreased their average rating
— 21 agencies (13 per cent) increased their average rating by more than 0.5
— 110 agencies (70 per cent) increased their average rating by less than 0.5.
The 26 agencies with decreased average ratings had a spread of characteristics, which included:
— agencies of most sizes, with the exception of ‘tiny’ agencies (fewer than 10 employees).
Among these 26 agencies, 11 decreased their rating for My agency’s digital information is authentic, reliable and accurate [capability 2.3], and 11 decreased their rating for Senior management supports digital information management as a priority [capability 1.3]. A possible explanation for decreases in capability 2.3 may be that the evidence requirements for this capability significantly changed in 2016, as well as there being an additional Digital Continuity 2020 component to the statements, which may have changed the respondents’ interpretation. In contrast, there was only a minor change to the description of capability 1.3, warranting further examination of the reasons that these agencies perceive less senior management support.
Of the 21 agencies with significantly increased average ratings (an increase of 0.5 or more):
— seventeen agencies had an average rating below 2.5 in 2015
The reason for significantly increased average ratings for some agencies remains unclear. Significant increases were more common among agencies that had low ratings in 2015, including one agency which increased their average rating by around 1.9.
2 and which were not identified as having experienced machinery of Government changes which involved a merge or consolidation with another agency
1
2
3
4
5
1 2 3 4 5
2016 A
vera
ge r
atin
g
2015 Average rating
Agencies with significantly increased ratings Agencies with similar ratings Agencies with lower ratings
Agencies with increased ratings
Agencies with decreased ratings

CHECK-UP DIGITAL ANALYSIS OF 2016 SURVEY DATA 21
Each capability has seen some agencies downgrade their ratings.
TABLE 2.4 CAPABILITIES WITH MANY DECREASED RATINGS FROM 2015 TO 2016
Capability Agencies
decreasing rating
by one level
Agencies decreasing
rating by two or more
levels
1.3 Senior management supports digital information
management as a priority
7 6
3.1 (business systems) Digital information in my
agency’s business systems is managed
8 3
SOURCE: ACIL ALLEN CONSULTING ANALYSIS OF CHECK-UP DIGITAL DATA
Among the 157 agencies that were comparable across years, 137 ratings in 2016 (five per cent) were lower than the corresponding 2015 Check-up Digital assessment. This varied by capability, with the most decreases for:
— Senior management supports digital information management as a priority [capability 1.3] rating— 13 agencies decreased their ratings
— Digital information in my agency’s business systems is managed [capability 3.1 (business systems)] — 11 agencies decreased their ratings.
In contrast, the smallest number of decreased ratings were for less mature capabilities, such as:
— My agency is ready to migrate (transfer) ‘Retain as National Archives’ (RNA) digital information to the National Archives (the Archives) [capability 3.3] — three agencies decreased their ratings
— Effective digital information management improves my agency’s business outcomes [capability 1.5] — four agencies decreased their ratings
— My agency manages the appropriate retention, migration or destruction of its digital information [capability 2.4] — four agencies decreased their ratings.
On average, 7.6 agencies decreased their rating for each capability3.
Thirteen agencies reported decreased ratings for more than three capabilities (including one which revised 11 capabilities).
Some decreased ratings are to be expected, given the self-evaluating nature of Check-up Digital (albeit with examples provided to encourage standardised responses). Decreases become an issue, however, when widespread or systemic, for example, when agencies decrease ratings across many capabilities (as shown previously in Figure 2.9), or many agencies decrease ratings for a capability (as shown and discussed above).
All capabilities had some agencies increase their ratings by two levels or more, with the highest increase for My agency’s digital information is authentic, reliable and accurate [capability 2.3], which had 12 agencies increase ratings by two or more levels. Management of digital information is planned when acquiring or developing, upgrading, decommissioning and migrating business systems [capability 3.2] is also notable for having three agencies improve by three levels.
Consultation with agencies would help to better understand the extent of improvement in underlying process maturity and any specific practices which have helped effect this change.
3 Among those agencies who completed Check-up Digital in 2015 and 2016, and were not identified as being affected by machinery of government changes

CHECK-UP DIGITAL ANALYSIS OF 2016 SURVEY DATA 22
3 C O N S I S T E N C Y C H E C K S
3 Consistency checks
This chapter summarises the checks conducted on the ratings provided by a sample of 30 agencies and eight capabilities, to gauge the consistency between ratings and the evidence provided by agencies.
BOX 3.1 KEY FINDINGS – CONSISTENCY CHECKS
Overall response consistency was lower in 2016 than in previous years, largely due to
— different capabilities being checked across years
— adjustments to the requirements for each capability in 2016, including to meet Digital Continuity 2020 targets.
Across all eight capabilities checked, there was:
— high consistency for 41 per cent of agency ratings
— partial consistency for 28 per cent of agency ratings
— low consistency for 31 per cent of agency ratings.
The consistency of ratings at the managed and optimising levels was substantially lower than in previous
years. This was partly due to changes in the agencies checked in 2016, compared to previous years. The
checks also showed that some agencies increased their ratings without providing the appropriate evidence for
the revised rating. As in previous years the reasons for low consistency differed by rating level.
Most capabilities had around 11 highly consistent ratings, although two high rated capabilities had substantially
more:
— My agency works digitally by default [capability 1.1] (18 highly consistent ratings)
— Digital information in my agency’s business systems is managed [capability 3.1 (business systems)] (16 highly
consistent ratings)
The lowest number of highly consistent ratings was for My agency manages the appropriate retention,
migration or destruction of its digital information [capability 2.4]. Only nine ratings were highly consistent for
this capability, with consistency issues around the definition of retention and disposal schedules, and the
extent of continued improvement and information feedback at higher rating levels.
Senior management supports digital information management as a priority [capability 1.3] had the second
fewest (10) high consistency ratings.
Compared to 2015, more agencies were highly consistent across all checked capabilities (four in 2016,
compared to one in 2015). However, more agencies had low or partial consistency across all checked
capabilities also (five in 2016, compared to none in 2015). Over half of agencies provided low or partially
consistent responses for at least five capabilities.
SOURCE: ACIL ALLEN CONSULTING ANALYSIS OF CHECK-UP DIGITAL DATA

CHECK-UP DIGITAL ANALYSIS OF 2016 SURVEY DATA 23
3.1 Methodology summary
Consistency checks in 2016 considered a sample of eight capabilities and 30 agencies.
As in previous years, these checks include the following four capabilities with mandatory documentation upload (for ratings at the developing level and higher):
— My agency works digitally by default [capability 1.1]
— My agency’s information governance framework is digital-ready [capability 1.2]
— Everyone meets their digital information management roles and responsibilities [capability 2.1 (employees)]
— Digital information in my agency’s business systems is managed [capability 3.1 (business systems)]
plus one additional capability with mandatory documentation upload;
— Senior management supports digital information management as a priority [capability 1.3]
and three capabilities for which documentation uploads were not mandatory (except for ratings at the optimising level, where documentation is mandatory across all capabilities):
— My agency manages the appropriate retention, migration or destruction of its digital information [capability 2.4]
— My agency actively manages its digital information for as long as needed [capability 2.5]
— Management of digital information is planned when acquiring or developing, upgrading, decommissioning and migrating business systems [capability 3.2]
The agency sample (30 agencies) was the same size as in 2015, but smaller than in 2014 (60 agencies). The sample included:
— four agencies which were checked in both 2014 and 2015
— six agencies checked in 2015, but not 2014
— ten agencies selected by the Archives for a range of qualitative reasons (including previously identified consistency issues, agency size and agency function)
— ten randomly selected agencies which were not checked in 2015.
As in previous years the random component of the sample was stratified to ensure the size, type and rating distribution of the sample broadly reflected whole of government characteristics.

CHECK-UP DIGITAL ANALYSIS OF 2016 SURVEY DATA 24
3.2 Findings
Overall consistency was lower in 2016, than in previous years, due to the checks being applied to different capabilities and agencies, and adjustments to criteria for several capabilities.
FIGURE 3.1 OVERALL RESPONSE CONSISTENCY – CHECKED AGENCIES IN ALL YEARS
Note: Different agencies and capabilities are considered in each year, which may contribute to variation in overall consistency levels between years.
SOURCE: ACIL ALLEN CONSULTING ANALYSIS OF CHECK-UP DIGITAL DATA
Across all eight capabilities, consistency checks found:
— high levels of consistency for 41 per cent of agency ratings
— partial consistency for 28 per cent of agency ratings
— low levels of consistency for 31 per cent of agency ratings.
The proportion of low consistency responses was higher than in previous years, and the proportion of high consistency responses was lower than in previous years. This was in part due to different capabilities being checked to previous years, and adjustments to the requirements for each capability in 2016. It is also possible that the different sample of agencies selected for this year’s checks had a tangible impact on the result, and that consistency across whole of government was similar to previous years.
17%
18%
31%
31%
30%
28%
52%
52%
41%
0% 20% 40% 60% 80% 100%
2014
2015
2016
Proportion of checked agencies
Low consistency Partial consistency High consistency

CHECK-UP DIGITAL ANALYSIS OF 2016 SURVEY DATA 25
Overall, responses at the managed and optimising levels had mainly partial or low consistency in 2016
FIGURE 3.2 RESPONSE CONSISTENCY BY RATING LEVEL — CHECKED AGENCIES
Note: Series labels indicate the number of agency responses at each level of consistency. Consistency was checked across eight capabilities for 30 agencies,
giving a total of 240 checked responses.
SOURCE: ACIL ALLEN CONSULTING ANALYSIS OF CHECK-UP DIGITAL DATA
Among ratings at the initial and developing levels, 75 per cent of checked ratings were highly consistent. In contrast, only 20 per cent of ratings at the managed and optimising levels were highly consistent.
This was partly due to the different composition of capabilities assessed in 2016. For example, My agency manages the appropriate retention, migration or destruction of its digital information [capability 2.4] and My agency actively manages its digital information for as long as needed [capability 2.5] had relatively low consistency compared to other capabilities.
There were also more low consistency, and partially consistent, ratings for Senior management supports digital information management as a priority [capability 1.3]. Reasons for this may have included the recent expectation for agencies to have information governance committees, and lack of evidence of regular reviews.
6 726 22 14
1
21
271719 23
37
155
0%
20%
40%
60%
80%
100%
Initial Developing Defined Managed Optimising
Pro
port
ion o
f checked r
esponses
Low consistency Partial consistency High consistency
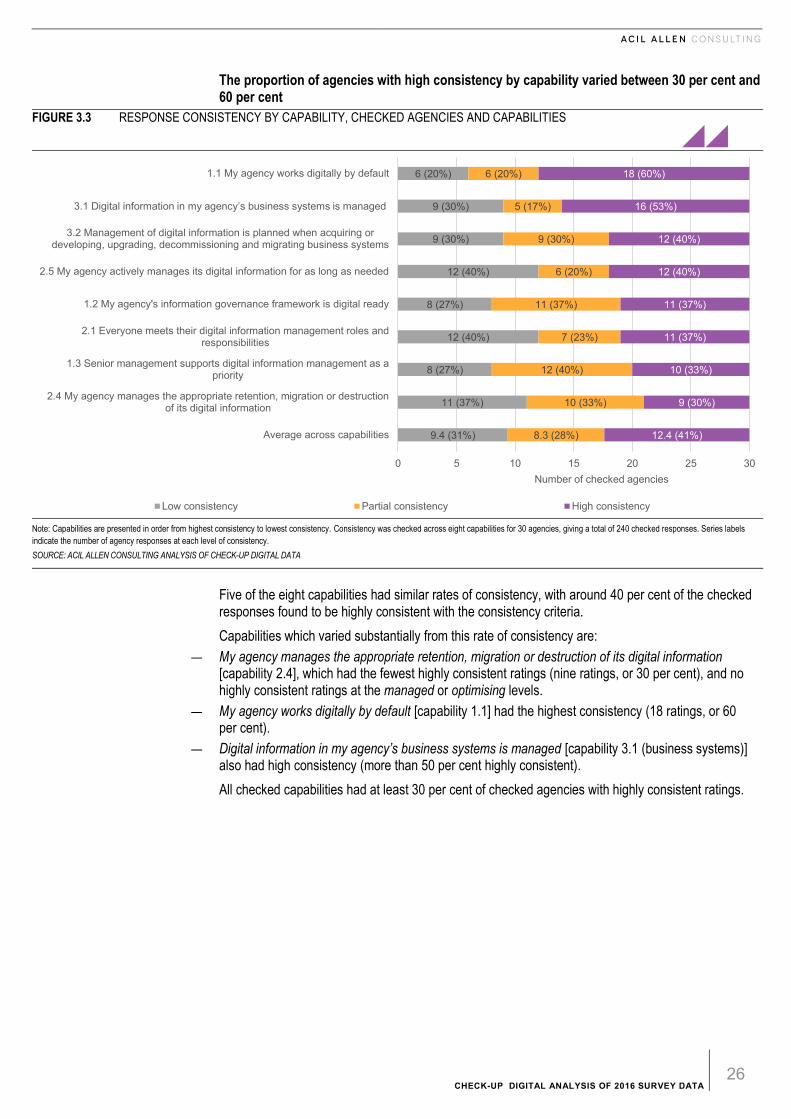
CHECK-UP DIGITAL ANALYSIS OF 2016 SURVEY DATA 26
The proportion of agencies with high consistency by capability varied between 30 per cent and 60 per cent
FIGURE 3.3 RESPONSE CONSISTENCY BY CAPABILITY, CHECKED AGENCIES AND CAPABILITIES
Note: Capabilities are presented in order from highest consistency to lowest consistency. Consistency was checked across eight capabilities for 30 agencies, giving a total of 240 checked responses. Series labels
indicate the number of agency responses at each level of consistency.
SOURCE: ACIL ALLEN CONSULTING ANALYSIS OF CHECK-UP DIGITAL DATA
Five of the eight capabilities had similar rates of consistency, with around 40 per cent of the checked responses found to be highly consistent with the consistency criteria.
Capabilities which varied substantially from this rate of consistency are:
— My agency manages the appropriate retention, migration or destruction of its digital information [capability 2.4], which had the fewest highly consistent ratings (nine ratings, or 30 per cent), and no highly consistent ratings at the managed or optimising levels.
— My agency works digitally by default [capability 1.1] had the highest consistency (18 ratings, or 60 per cent).
— Digital information in my agency’s business systems is managed [capability 3.1 (business systems)] also had high consistency (more than 50 per cent highly consistent).
All checked capabilities had at least 30 per cent of checked agencies with highly consistent ratings.
6 (20%)
9 (30%)
9 (30%)
12 (40%)
8 (27%)
12 (40%)
8 (27%)
11 (37%)
9.4 (31%)
6 (20%)
5 (17%)
9 (30%)
6 (20%)
11 (37%)
7 (23%)
12 (40%)
10 (33%)
8.3 (28%)
18 (60%)
16 (53%)
12 (40%)
12 (40%)
11 (37%)
11 (37%)
10 (33%)
9 (30%)
12.4 (41%)
0 5 10 15 20 25 30
1.1 My agency works digitally by default
3.1 Digital information in my agency’s business systems is managed
3.2 Management of digital information is planned when acquiring ordeveloping, upgrading, decommissioning and migrating business systems
2.5 My agency actively manages its digital information for as long as needed
1.2 My agency's information governance framework is digital ready
2.1 Everyone meets their digital information management roles andresponsibilities
1.3 Senior management supports digital information management as apriority
2.4 My agency manages the appropriate retention, migration or destructionof its digital information
Average across capabilities
Number of checked agencies
Low consistency Partial consistency High consistency

CHECK-UP DIGITAL ANALYSIS OF 2016 SURVEY DATA 27
Most agencies had at least one low consistency rating, and some agencies had no ratings with high consistency.
TABLE 3.1 NUMBER OF AGENCIES WITH LOW OR PARTIAL CONSISTENCY RATINGS
Number of ratings with: Low consistency Low or partial consistency
No ratings 8 (27%) 4 (13%)
One rating 6 (20%) 1 (3%)
Two to four ratings 9 (30%) 6 (20%)
Five to seven ratings 6 (20%) 14 (47%)
Eight ratings 1 (3%) 5 (17%)
Note: Figures show the number (proportions in parentheses) of agencies that had low consistency, or low or partial consistency, for the specified number of
checked responses
SOURCE: ACIL ALLEN CONSULTING ANALYSIS OF CHECK-UP DIGITAL DATA
Table 3.1 examines the extent to which consistency checks found low or partially consistent ratings in individual agencies, which may warrant further examination of those agencies.
Eight of the 30 agencies checked in 2016 had all partially or highly consistent ratings, and four of these had all highly consistent ratings. This is an improvement on the one agency with highly consistent ratings in 2015.
In contrast, five agencies checked in 2016 had low or partially consistent ratings for all checked capabilities. One of these agencies had low consistency for all eight ratings.
Over half of the agencies checked had low or partial consistency for over half of their ratings.

CHECK-UP DIGITAL ANALYSIS OF 2016 SURVEY DATA 28
4 D E T A I L E D C A P A B I L I T Y A N A L Y S I S
4 Detailed capability analys is
This chapter contains analysis summaries for each capability. Each rating summary examines ratings changes across years, and additional summary statistics for ratings across the whole of government.

CHECK-UP DIGITAL ANALYSIS OF 2016 SURVEY DATA 29
4.1 Statement 1.1 My agency works digitally by default
This capability statement identifies whether the agency works in a predominantly digital environment. The statement intends to account for processes throughout the agency including managing incoming data rather than the conversion of existing data to digital form.
Su
mm
ary
Analysis: Rating summary
This analysis summarises and compares ratings in 2016 with
2014 and 2015 to examine improvement over time.
Capability: 1.1 My agency works digitally by default
Scope: All agencies
Year: 2014, 2015, 2016
An
alys
is
Key
po
ints
Key changes in the capability’s ratings:
0%
10%
20%
30%
40%
50%
1Initial
2Developing
3Defined
4Managing
5Optimising
Pro
port
ion o
f ra
tings
Ratings in 2014 Ratings in 2015 Ratings in 2016
Average rating:
compared to 2015:
compared to 2014:
compared to all capabilities:
Largest increase is in: Managing +11%
Largest decrease is in: Developing -13%
Ratings at defined and above increased from 65% to 82%
+0.3
3.3
+0.2
+0.5

CHECK-UP DIGITAL ANALYSIS OF 2016 SURVEY DATA 30
4.2 Statement 1.2 My agency’s information governance framework is digital-ready
This capability statement identifies whether the agency has a governance framework that identifies digital information principles and requirements, is endorsed by senior management, and implemented successfully throughout the agency.
Su
mm
ary
Analysis: Rating summary
This analysis summarises and compares ratings in 2016 with
2014 and 2015 to examine improvement over time.
Capability: 1.2 My agency’s information governance
framework is digital-ready
Scope: All agencies
Year: 2014, 2015, 2016
An
alys
is
Key
po
ints
Key changes in the capability’s ratings:
0%
10%
20%
30%
40%
1Initial
2Developing
3Defined
4Managing
5Optimising
Pro
port
ion o
f ra
tings
Ratings in 2014 Ratings in 2015 Ratings in 2016
Average rating:
compared to 2015:
compared to 2014:
compared to all capabilities:
Largest increase is in: Managing +6%
Largest decrease is in: Initial -7%
Ratings at defined and above increased from 54% to 66%
-0.1
2.9
+0.1
+0.3

CHECK-UP DIGITAL ANALYSIS OF 2016 SURVEY DATA 31
4.3 Statement 1.3 Senior management supports digital information management as a priority
This statement identifies the extent to which senior management promotes and develops appropriate digital information management as a priority.
Su
mm
ary
Analysis: Rating summary
This analysis summarises and compares ratings in 2016 with
2014 and 2015 to examine improvement over time.
Capability: 1.3 Senior management supports digital
information management as a priority
Scope: All agencies
Year: 2014, 2015, 2016
An
alys
is
Key
po
ints
Key changes in the capability’s ratings:
0%
10%
20%
30%
40%
50%
1Initial
2Developing
3Defined
4Managing
5Optimising
Pro
port
ion o
f ra
tings
Ratings in 2014 Ratings in 2015 Ratings in 2016
Average rating:
compared to 2015:
compared to 2014:
compared to all capabilities:
Largest increase is in: Managing +11%
Largest decrease is in: Developing -12%
Ratings at defined and above increased from 75% to 84%
+0.4
3.4
+0.1
+0.3

CHECK-UP DIGITAL ANALYSIS OF 2016 SURVEY DATA 32
4.4 Statement 1.4 My agency’s business decisions are informed and influenced by digital information management costs and benefits
This statement considers the extent to which information management costs and benefits are measured and identified, and used to inform business decisions.
Su
mm
ary
Analysis: Rating summary
This analysis summarises and compares ratings in 2016 with
2014 and 2015 to examine improvement over time.
Capability: 1.4 My agency’s business decisions are
informed and influenced by digital
information management costs and
benefits
Scope: All agencies
Year: 2014, 2015, 2016
An
alys
is
Key
po
ints
Key changes in the capability’s ratings:
0%
10%
20%
30%
40%
50%
1Initial
2Developing
3Defined
4Managing
5Optimising
Pro
port
ion o
f ra
tings
Ratings in 2014 Ratings in 2015 Ratings in 2016
Average rating:
compared to 2015:
compared to 2014:
compared to all capabilities:
Largest increase is in: Defined +10%
Largest decrease is in: Initial -18%
Ratings at defined and above increased from 49% to 68%
-0.2
2.8
+0.2
+0.5

CHECK-UP DIGITAL ANALYSIS OF 2016 SURVEY DATA 33
4.5 Statement 1.5 Effective digital information management improves my agency’s business outcomes
This statement determines the extent to which agencies quantify the impact of digital information management on business outcomes, and use this information to better both digital information management and business outcomes.
Su
mm
ary
Analysis: Rating summary
This analysis summarises and compares ratings in 2016 with
2014 and 2015 to examine improvement over time.
Capability: 1.5 Effective digital information
management improves my agency’s
business outcomes
Scope: All agencies
Year: 2014, 2015, 2016
An
alys
is
Key
po
ints
Key changes in the capability’s ratings:
0%
10%
20%
30%
40%
50%
60%
1Initial
2Developing
3Defined
4Managing
5Optimising
Pro
port
ion o
f ra
tings
Ratings in 2014 Ratings in 2015 Ratings in 2016
Average rating:
compared to 2015:
compared to 2014:
compared to all capabilities:
Largest increase is in: Defined +10%
Largest decrease is in: Initial -11%
Ratings at defined and above increased from 63% to 82%
+0.1
3.1
+0.2
+0.4

CHECK-UP DIGITAL ANALYSIS OF 2016 SURVEY DATA 34
4.6 Statement 2.1 Everyone meets their digital information management roles and responsibilities (Capability 1 — Employees)
This statement identifies the extent to which information management responsibilities are clearly defined, communicated, and upheld by employees.
Su
mm
ary
Analysis: Rating summary
This analysis summarises and compares ratings in 2016 with
2014 and 2015 to examine improvement over time.
Capability: 2.1 (Employees) Everyone meets their
digital information management roles and
responsibilities
Scope: All agencies
Year: 2014, 2015, 2016
An
alys
is
Key
po
ints
Key changes in the capability’s ratings:
0%
10%
20%
30%
40%
50%
1Initial
2Developing
3Defined
4Managing
5Optimising
Pro
port
ion o
f ra
tings
Ratings in 2014 Ratings in 2015 Ratings in 2016
Average rating:
compared to 2015:
compared to 2014:
compared to all capabilities:
Largest increase is in: Managing +11%
Largest decrease is in: Developing -9%
Ratings at defined and above increased from 55% to 71%
-0.1
2.9
+0.2
+0.4

CHECK-UP DIGITAL ANALYSIS OF 2016 SURVEY DATA 35
4.7 Statement 2.1 Everyone meets their digital information management roles and responsibilities (Capability 2 — Specialists)
This statement identifies the extent to which information management responsibilities are clearly defined, communicated, and upheld by information management specialists.
Su
mm
ary
Analysis: Rating summary
This analysis summarises and compares ratings in 2016 with
2014 and 2015 to examine improvement over time.
Capability: 2.1 (Specialists) Everyone meets their
digital information management roles and
responsibilities
Scope: All agencies
Year: 2014, 2015, 2016
An
alys
is
Key
po
ints
Key changes in the capability’s ratings:
0%
10%
20%
30%
40%
1Initial
2Developing
3Defined
4Managing
5Optimising
Pro
port
ion o
f ra
tings
Ratings in 2014 Ratings in 2015 Ratings in 2016
Average rating:
compared to 2015:
compared to 2014:
compared to all capabilities:
Largest increase is in: Defined +9%
Largest decrease is in: Initial -16%
Ratings at defined and above increased from 53% to 73%
+0
3.0
+0.2
+0.5

CHECK-UP DIGITAL ANALYSIS OF 2016 SURVEY DATA 36
4.8 Statement 2.2 My agency sufficiently resources its digital information management program
This statement identifies the extent to which ongoing digital information management programs are resourced in a routine manner.
Su
mm
ary
Analysis: Rating summary
This analysis summarises and compares ratings in 2016 with
2014 and 2015 to examine improvement over time.
Capability: 2.2 My agency sufficiently resources its
digital information management program
Scope: All agencies
Year: 2014, 2015, 2016
An
alys
is
Key
po
ints
Key changes in the capability’s ratings:
0%
10%
20%
30%
40%
50%
1Initial
2Developing
3Defined
4Managing
5Optimising
Pro
port
ion o
f ra
tings
Ratings in 2014 Ratings in 2015 Ratings in 2016
Average rating:
compared to 2015:
compared to 2014:
compared to all capabilities:
Largest increase is in: Managing +17%
Largest decrease is in: Initial -14%
Ratings at defined and above increased from 54% to 79%
+0.2
3.2
+0.3
+0.6

CHECK-UP DIGITAL ANALYSIS OF 2016 SURVEY DATA 37
4.9 Statement 2.3 My agency’s digital information is authentic, reliable and accurate
This capability statement determines the extent to which digital information is monitored and found to be authentic, reliable and accurate.
Su
mm
ary
Analysis: Rating summary
This analysis summarises and compares ratings in 2016 with
2014 and 2015 to examine improvement over time.
Capability: 2.3 My agency’s digital information is
authentic, reliable and accurate
Scope: All agencies
Year: 2014, 2015, 2016
An
alys
is
Key
po
ints
Key changes in the capability’s ratings:
0%
10%
20%
30%
40%
1Initial
2Developing
3Defined
4Managing
5Optimising
Pro
port
ion o
f ra
tings
Ratings in 2014 Ratings in 2015 Ratings in 2016
Average rating:
compared to 2015:
compared to 2014:
compared to all capabilities:
Largest increase is in: Managing +9%
Largest decrease is in: Initial -14%
Ratings at defined and above increased from 52% to 71%
+0.1
3.1
+0.2
+0.4

CHECK-UP DIGITAL ANALYSIS OF 2016 SURVEY DATA 38
4.10 Statement 2.4 My agency manages the appropriate retention, migration or destruction of its digital information
This statement determines the extent to which agencies have a program to assess digital information and make decisions about which data to keep, destroy or transfer using a risk-based approach.
Su
mm
ary
Analysis: Rating summary
This analysis summarises and compares ratings in 2016 with
2014 and 2015 to examine improvement over time.
Capability: 2.4 My agency manages the appropriate
retention, migration or destruction of its
digital information
Scope: All agencies
Year: 2014, 2015, 2016
An
alys
is
Key
po
ints
Key changes in the capability’s ratings:
0%
10%
20%
30%
40%
1Initial
2Developing
3Defined
4Managing
5Optimising
Pro
port
ion o
f ra
tings
Ratings in 2014 Ratings in 2015 Ratings in 2016
Average rating:
compared to 2015:
compared to 2014:
compared to all capabilities:
Largest increase is in: Defined +10%
Largest decrease is in: Initial -11%
Ratings at defined and above increased from 43% to 62%
-0.3
2.8
+0.2
+0.4

CHECK-UP DIGITAL ANALYSIS OF 2016 SURVEY DATA 39
4.11 Statement 2.5 My agency actively manages its digital information for as long as needed
This statement determines the steps to manage all their digital information for as long as it is needed including short term information that must be kept only for a prescribed period, long-term (i.e. to be kept for 15 years or more) and high-risk digital information to ensure it is complete, available and usable for as long as needed.
Su
mm
ary
Analysis: Rating summary
This analysis summarises and compares ratings in 2016 with
2014 and 2015 to examine improvement over time.
Capability: 2.5 My agency actively manages its digital
information for as long as needed
Scope: All agencies
Year: 2014, 2015, 2016
An
alys
is
Key
po
ints
Key changes in the capability’s ratings:
0%
10%
20%
30%
40%
50%
1Initial
2Developing
3Defined
4Managing
5Optimising
Pro
port
ion o
f ra
tings
Ratings in 2014 Ratings in 2015 Ratings in 2016
Average rating:
compared to 2015:
compared to 2014:
compared to all capabilities:
Largest increase is in: Defined +13%
Largest decrease is in: Developing -14%
Ratings at defined and above increased from 49% to 70%
-0.1
2.9
+0.2
+0.4

CHECK-UP DIGITAL ANALYSIS OF 2016 SURVEY DATA 40
4.12 Statement 2.6 Digital information in outsourced provider and third-party arrangements is managed
This capability determines the extent to which agencies routinely include their digital information requirements in contracts, agreements and arrangements with outsourced providers and third parties and routinely monitor compliance with these requirements, taking appropriate action when necessary.
Su
mm
ary
Analysis: Rating summary
This analysis summarises and compares ratings in 2016 with
2014 and 2015 to examine improvement over time.
Capability: 2.6 Digital information in outsourced
provider and third-party arrangements is
managed
Scope: All agencies
Year: 2014, 2015, 2016
An
alys
is
Key
po
ints
Key changes in the capability’s ratings:
0%
10%
20%
30%
40%
50%
1Initial
2Developing
3Defined
4Managing
5Optimising
Pro
port
ion o
f ra
tings
Ratings in 2014 Ratings in 2015 Ratings in 2016
Average rating:
compared to 2015:
compared to 2014:
compared to all capabilities:
Largest increase is in: Defined +16%
Largest decrease is in: Initial -12%
Ratings at defined and above increased from 53% to 74%
+0
3.0
+0.2
+0.4

CHECK-UP DIGITAL ANALYSIS OF 2016 SURVEY DATA 41
4.13 Statement 2.7 Digital information in collaborative spaces and social media is managed
This capability determines the extent to which agencies have identified the collaborative spaces and social media in which they work and their management requirements for digital information. It also measures how well they systematically manage this digital information to ensure it is complete, available and usable for as long as needed.
Su
mm
ary
Analysis: Rating summary
This analysis summarises and compares ratings in 2016 with
2014 and 2015 to examine improvement over time.
Capability: 2.7 Digital information in collaborative
spaces and social media is managed
Scope: All agencies
Year: 2014, 2015, 2016
An
alys
is
Key
po
ints
Key changes in the capability’s ratings:
0%
10%
20%
30%
40%
1Initial
2Developing
3Defined
4Managing
5Optimising
Pro
port
ion o
f ra
tings
Ratings in 2014 Ratings in 2015 Ratings in 2016
Average rating:
compared to 2015:
compared to 2014:
compared to all capabilities:
Largest increase is in: Managing +11%
Largest decrease is in: Initial -17%
Ratings at defined and above increased from 48% to 70%
+0
3.1
+0.2
+0.6

CHECK-UP DIGITAL ANALYSIS OF 2016 SURVEY DATA 42
4.14 Statement 3.1 Digital information in my agency’s business systems is managed (Capability 1 — Business systems)
This capability determines the extent to which agencies identify, assess and document the digital information management capabilities of their business systems, and have identified and implemented strategies and enhancements to ensure appropriate digital information management in business systems.
Su
mm
ary
Analysis: Rating summary
This analysis summarises and compares ratings in 2016 with
2014 and 2015 to examine improvement over time.
Capability: 3.1 (business systems) Digital information
in my agency’s business systems is
managed
Scope: All agencies
Year: 2014, 2015, 2016
An
alys
is
Key
po
ints
Key changes in the capability’s ratings:
0%
10%
20%
30%
40%
50%
1Initial
2Developing
3Defined
4Managing
5Optimising
Pro
port
ion o
f ra
tings
Ratings in 2014 Ratings in 2015 Ratings in 2016
Average rating:
compared to 2015:
compared to 2014:
compared to all capabilities:
Largest increase is in: Defined +10%
Largest decrease is in: Initial -11%
Ratings at defined and above increased from 54% to 71%
-0
3.0
+0.1
+0.4

CHECK-UP DIGITAL ANALYSIS OF 2016 SURVEY DATA 43
4.15 Statement 3.1 Digital information in my agency’s business systems is managed (Capability 2 — Metadata)
This capability determines the extent to which agencies identify, assess and document the digital information management capabilities of their business systems, and the metadata used to manage digital information.
Su
mm
ary
Analysis: Rating summary
This analysis summarises and compares ratings in 2016 with
2014 and 2015 to examine improvement over time.
Capability: 3.1 (metadata) Digital information in my
agency’s business systems is managed
Scope: All agencies
Year: 2014, 2015, 2016
An
alys
is
Key
po
ints
Key changes in the capability’s ratings:
0%
10%
20%
30%
40%
1Initial
2Developing
3Defined
4Managing
5Optimising
Pro
port
ion o
f ra
tings
Ratings in 2014 Ratings in 2015 Ratings in 2016
Average rating:
compared to 2015:
compared to 2014:
compared to all capabilities:
Largest increase is in: Managing +8%
Largest decrease is in: Initial -14%
Ratings at defined and above increased from 49% to 64%
-0.2
2.8
+0.2
+0.4

CHECK-UP DIGITAL ANALYSIS OF 2016 SURVEY DATA 44
4.16 Statement 3.2 Management of digital information is planned when acquiring or developing, upgrading, decommissioning and migrating business systems
This capability determines the extent to which agencies routinely ensure that digital information management requirements are planned for, considered and met when acquiring or developing, upgrading, decommissioning and migrating business systems.
Su
mm
ary
Analysis: Rating summary
This analysis summarises and compares ratings in 2016 with
2014 and 2015 to examine improvement over time.
Capability: 3.2 Management of digital information is
planned when acquiring or developing,
upgrading, decommissioning and
migrating business systems
Scope: All agencies
Year: 2014, 2015, 2016
An
alys
is
Key
po
ints
Key changes in the capability’s ratings:
0%
10%
20%
30%
40%
50%
1Initial
2Developing
3Defined
4Managing
5Optimising
Pro
port
ion o
f ra
tings
Ratings in 2014 Ratings in 2015 Ratings in 2016
Average rating:
compared to 2015:
compared to 2014:
compared to all capabilities:
Largest increase is in: Managing +16%
Largest decrease is in: Initial -11%
Ratings at defined and above increased from 55% to 71%
+0.1
3.1
+0.2
+0.4

CHECK-UP DIGITAL ANALYSIS OF 2016 SURVEY DATA 45
4.17 Statement 3.3 My agency is ready to migrate (transfer) ‘Retain as National Archives’ (RNA) digital information to the National Archives (the Archives)
This capability determines the extent to which agencies have developed processes, systems and technologies to enable the regular migration (transfer) of archival digital information to the Archives and have prioritised legacy digital information for migration.
Su
mm
ary
Analysis: Rating summary
This analysis summarises and compares ratings in 2016 with
2014 and 2015 to examine improvement over time.
Capability: 3.3 My agency is ready to migrate
(transfer) ‘Retain as National Archives’
(RNA) digital information to the National
Archives (the Archives)
Scope: All agencies
Year: 2014, 2015, 2016
An
alys
is
Key
po
ints
Key changes in the capability’s ratings:
0%
10%
20%
30%
40%
1Initial
2Developing
3Defined
4Managing
5Optimising
Pro
port
ion o
f ra
tings
Ratings in 2014 Ratings in 2015 Ratings in 2016
Average rating:
compared to 2015:
compared to 2014:
compared to all capabilities:
Largest increase is in: Defined +7%
Largest decrease is in: Initial -11%
Ratings at defined and above increased from 33% to 48%
-0.5
2.5
+0.2
+0.3

CHECK-UP DIGITAL ANALYSIS OF 2016 SURVEY DATA 46
4.18 Statement 3.4 My agency's digital information is available for use and protected from unforeseen loss
This capability determines the extent to which agencies have developed processes, systems and technologies to ensure that all of its digital information is available and protected from unforeseen loss.
Su
mm
ary
Analysis: Rating summary
This analysis summarises and compares ratings in 2016 with
2014 and 2015 to examine improvement over time.
Capability: 3.4 My agency's digital information is
available for use and protected from
unforeseen loss
Scope: All agencies
Year: 2014, 2015, 2016
An
alys
is
Key
po
ints
Key changes in the capability’s ratings:
0%
10%
20%
30%
40%
50%
1Initial
2Developing
3Defined
4Managing
5Optimising
Pro
port
ion o
f ra
tings
Ratings in 2014 Ratings in 2015 Ratings in 2016
Average rating:
compared to 2015:
compared to 2014:
compared to all capabilities:
Largest increase is in: Managing +10%
Largest decrease is in: Initial -7%
Ratings at defined and above increased from 77% to 88%
+0.4
3.5
+0.2
+0.3

CHECK-UP DIGITAL ANALYSIS OF 2016 SURVEY DATA 47
5 C O N C L U S I O N S
5 Conclusions
This report is the last of three annual reports presenting analysis of Check-up Digital data. The analysis from the final year of Check-up Digital demonstrates significant improvements in capability maturity over the three years, as well as areas that may warrant further attention in the future.
Key findings
Highlights from the analysis of agency responses are summarised below.
In aggregate, agencies have steadily increased their capabilities over time
Over the three years of Check-up Digital, agencies have improved their capabilities, with the average rating reaching 3.0 in 2016, up from 2.8 in 2015, and 2.6 in 2014. Ratings at defined and above accounted for 72 per cent of all agency ratings, compared to 64 per cent in 2015, and 55 per cent in 2014. Ratings at the managed and optimising levels increased from 25 per cent in 2014, to 31 per cent in 2015, and 36 per cent in 2016, while ratings at the initial level reduced from 23 per cent in 2014, to 17 per cent in 2015, and 12 per cent in 2014.
The improvement spanned all three Check-up sections, with Optimising business outcomes containing on average the most mature capabilities, as it has in previous years.
Not all agencies demonstrated improvement, but most did
The improvement across agencies is demonstrated by 112 out of 157 comparable agencies4 (71 per cent) increasing their average rating in 2016 from 2015, and 100 out of 142 comparable agencies (70 per cent) increasing their average rating from 2014.
Nearly all agencies have started work on their capabilities, with only 12 per cent of agency ratings at the initial level, compared to 23 per cent in 2014. However, 41 per cent of agencies still rated themselves at the initial level for at least one capability in 2016.
Digital information in collaborative spaces and social media [capability 2.7] was the most improved capability
Ratings for this capability increased from 2.4 in 2014 (one of the lowest rated capabilities), to 2.8 in 2015 (+0.36 points), and 3.1 in 2016 (+0.25 points) — an overall increase of 0.61 points. While reasons cannot be ascertained from the Check-up responses themselves, a likely contributing factor is increased awareness, over the past three years, of the need to manage the business information in these media as records.
4 Includes agencies in scope, and which did not have machinery of government changes between these years that may have affected their reporting.

CHECK-UP DIGITAL ANALYSIS OF 2016 SURVEY DATA 48
The least improved capability was Senior management supports digital information management as a priority [capability 1.3]. This capability increased from 3.1 in 2014 (the second most mature capability) to 3.3 in 2015 (tied first, with an increase of +0.16), and 3.4 in 2016 (second, with an increase of +0.11). The low level of improvement might be expected, given the high initial maturity of this capability across agencies.
My agency’s digital information is available for use and protected from unforeseen loss [capability 3.4] has been the highest rated capability in all three years of Check-up Digital
The average ratings for this capability were 3.1 in 2014, 3.3 in 2015 (an increase of +0.15) and 3.5 in 2016 (+0.18). Just 12 per cent of agencies remain at the initial or developing levels for this capability in 2016.
Ratings for My agency works digitally by default [capability 1.1] have also improved substantially from 2014
The average ratings for this capability were 2.8 in 2014, 3.1 in 2015 (an increase of +0.26) and 3.3 in 2016 (an increase of +0.22). The proportion of agencies at the initial level reduced from 14 per cent in 2014 to nine per cent in 2016, while the proportion at defined and above increased from 65 per cent to 82 per cent.
Capabilities related to the retention and migration of digital information (capabilities 3.3 and 2.4) continued to have the lowest ratings on average
My agency is ready to migrate (transfer) ‘Retain as National Archives’ digital information to the National Archives [capability 3.3] was the lowest rated capability in all years, with average ratings of 2.2 in 2014, 2.4 in 2015 (+0.18), and 2.5 in 2016 (+0.15). Over two thirds (66.9 per cent) of agencies rated themselves at the initial or developing levels for this capability in 2014, and over half (52.4 per cent) did so in 2016.
My agency manages the appropriate retention, migration or destruction of digital information [capability 2.4] was also consistently rated low, being the third lowest rated capability in both 2014 and 2015, and the second lowest in 2016. Average ratings for this capability increased from 2.4 in 2014, to 2.6 in 2015 (+0.23) and 2.8 in 2016 (+0.17).
Agencies are, in general, providing ratings which are consistent with evidence uploaded to Check-up Digital
The evidence uploaded has been examined for a sample of agencies and capabilities in each year of Check-up, and assessed for consistency against the requirements of ratings at the specified level.
Over the three years almost 80 per cent of the checked ratings were either partially or highly consistent with the evidence provided. Only 70 per cent of ratings checked in 2016 were highly consistent, although there are several potential reasons for this, including changes to the capabilities being checked, and changes to the evidence requirements for some capabilities.
There are some agencies which have decreased their ratings from previous years
This includes 26 comparable agencies (17 per cent) that reported decreased average ratings in 2016, compared to 2015. When compared to 2014 reporting, 22 agencies (16 per cent) reported decreased average ratings.
Where to from here
The Check-up Digital survey process has compiled a rich source of data on the last three years of digital information management in Australian Government agencies, and identified specific areas that may assist agencies to improve their ongoing development of digital information management capabilities. As such, it has delivered a strong foundation from which to build on in any future data collection on digital information management transformation.