reportable disease trends in ontario, 2011 · public health ontario public health ontario is a...
TRANSCRIPT
Reportable Disease Trends in Ontario 2011
Technical Report January 2014
Public Health Ontario
Public Health Ontario is a Crown corporation dedicated to protecting and promoting the health of all Ontarians and
reducing inequities in health. Public Health Ontario links public health practitioners, frontline health workers and
researchers to the best scientific intelligence and knowledge from around the world.
Public Health Ontario provides expert scientific and technical support to government, local public health units and
health care providers relating to the following:
communicable and infectious diseases
infection prevention and control
environmental and occupational health
emergency preparedness
health promotion, chronic disease and injury prevention
public health laboratory services
Public Health Ontario's work also includes surveillance, epidemiology, research, professional development and
knowledge services. For more information, visit www.publichealthontario.ca.
How to cite this document:
Ontario Agency for Health Protection and Promotion (Public Health Ontario). Reportable disease trends in Ontario, 2011.
Toronto, ON: Queen's Printer for Ontario; 2014.
ISSN 2291-8981
Public Health Ontario acknowledges the financial support of the Ontario Government.
©Queen’s Printer for Ontario, 2014
Reportable Disease Trends in Ontario 2011

Reportable Disease Trends in Ontario, 2011 i
Contributing Authors
The production of the Reportable Diseases Trends in Ontario report was made possible by a
collaboration of highly skilled and dedicated staff of the Communicable Diseases Prevention and
Control Department. Production of the report was led by Surveillance Services with contributions
from the Immunization and Vaccine-Preventable Diseases Unit; the Enteric, Zoonotic and Vector-
borne Diseases Unit; and the Communicable Diseases Unit.
Acknowledgements
Surveillance Services wish to express their sincere appreciation for the effort and dedication
demonstrated by Ontario’s 36 Public Health Units (PHUs) in collecting and reporting data on
reportable diseases and the MOHLTC for enabling this process. We also thank our colleagues across
Public Health Ontario for their collaboration in the review and interpretation of the reportable
disease trends presented here. Special thanks to PHO Communications, Laboratory and Library
Services teams for their time and effort in helping to streamline the content and format of the
report.
December 2013
Disclaimer
This document was developed by Public Health Ontario (PHO). PHO provides scientific and technical advice to Ontario’s government, public health organizations and health care providers. PHO’s work is guided by the current best available evidence. PHO assumes no responsibility for the results of the use of this document by anyone. This document may be reproduced without permission for non-commercial purposes only and provided that appropriate credit is given to Public Health Ontario. No changes and/or modification may be made to this document without explicit written permission from Public Health Ontario.
Reportable Disease Trends in Ontario, 2011 ii
Contents
List of Figures .................................................... iv
List of Tables ................................................... viii
List of Maps ....................................................... xi
About this Report .............................................. 1
Glossary of terms .............................................. 2
Section 1 ........................................................... 3
Enterics and zoonotic diseases ................................. 3
Amebiasis .......................................................... 4
Anthrax ........................................................... 11
Botulism .......................................................... 12
Brucellosis ....................................................... 14
Campylobacteriosis ......................................... 16
Cholera ............................................................ 23
Cryptosporidiosis ............................................. 25
Cyclosporiasis .................................................. 32
Giardiasis ........................................................ 39
Hantavirus Pulmonary Syndrome ..................... 46
Hepatitis A ...................................................... 47
Listeriosis ........................................................ 54
Paratyphoid Fever ........................................... 61
Plague ............................................................. 68
Psittacosis/Ornithosis ...................................... 69
Q Fever............................................................ 70
Rabies ............................................................. 72
Salmonellosis .................................................. 73
Shigellosis ....................................................... 81
Trichinosis ....................................................... 88
Tularemia ........................................................ 89
Typhoid fever .................................................. 90
Verotoxin-producing E. coli .............................. 97
Yersiniosis ..................................................... 104
Section 2 ........................................................ 111
Respiratory diseases and diseases transmitted by
direct contact ......................................................... 111
Group A streptococcal disease, invasive ......... 112
Influenza ....................................................... 119
Legionellosis .................................................. 126
Severe Acute Respiratory Syndrome (SARS) ... 133
Smallpox ........................................................ 134
Tuberculosis .................................................. 135
Section 3 ........................................................ 143
Sexually transmitted and blood-borne infections . 143
Chancroid ...................................................... 144
Chlamydia ..................................................... 145
Cytomegalovirus Infection, Congenital ........... 152
Gonorrhea ..................................................... 153
Group B Streptococcal Disease, Neonatal ....... 160
Hepatitis B (Acute) ......................................... 165
Hepatitis C ..................................................... 172
Hepatitis D ..................................................... 179
Herpes, Neonatal ........................................... 180
HIV and AIDS ................................................. 181
Ophthalmia Neonatorum ............................... 192
Syphilis, Infectious ......................................... 193
Section 4 ........................................................ 200
Vaccine-Preventable Diseases ............................... 200
Diphtheria ..................................................... 201
Haemophilus influenzae type b disease, invasive
202
Measles ......................................................... 204
Meningococcal Disease, Invasive .................... 206
Reportable Disease Trends in Ontario, 2011 iii
Mumps ........................................................... 214
Pertussis ......................................................... 221
Invasive Pneumococcal Disease ...................... 228
Poliomyelitis, acute ........................................ 235
Rubella ........................................................... 236
Tetanus .......................................................... 239
Section 5 ........................................................ 241
Vector-borne Diseases .......................................... 241
Lyme Disease .................................................. 242
Malaria ........................................................... 249
West Nile Virus Illness .................................... 256
Yellow Fever ................................................... 264
Section 6 ........................................................ 265
Other Reportable Diseases ................................... 265
Hemorrhagic Fevers ........................................ 266
Lassa Fever .................................................... 267
Leprosy .......................................................... 268
Transmissible Spongiform Encephalopathies .. 269
References ..................................................... 270
Appendices .................................................... 277
Appendix 1 .................................................... 278
Technical notes ...................................................... 278
Appendix 2 .................................................... 286
Diseases Reportable in Ontario ............................. 286
Appendix 3 .................................................... 287
Reportable diseases and reportable classifications287
Appendix 4 .................................................... 289
PHU regions and short form .................................. 289
Appendix 5 .................................................... 290
Data tables ............................................................. 290
Reportable Disease Trends in Ontario, 2011 iv
List of Figures
Figure 1-1. Incidence of Amebiasis: Ontario and Canada, 2002-2011 ....................................................... 5
Figure 1-2. Incidence of Amebiasis by Age and Sex: Ontario, 2011 ................................................................ 6
Figure 1-3. Number of Amebiasis Cases by Month in Ontario in 2011 and Average Number of Cases from 2006-2010 ............................................................ 7
Figure 1-4. Incidence of Botulism: Ontario and Canada, 2002-2011 ..................................................... 13
Figure 1-5. Incidence of Brucellosis: Ontario and Canada, 2002-2011 ..................................................... 15
Figure 1-6. Incidence of Campylobacteriosis: Ontario and Canada, 2002-2011 ................................. 17
Figure 1-7. Incidence of Campylobacteriosis by Age and Sex: Ontario, 2011 ......................................... 18
Figure 1-8. Number of Campylobacteriosis Cases by Month in Ontario in 2011 and Average Number of Cases from 2006-2010 ............................................ 19
Figure 1-9. Incidence of Cholera: Ontario and Canada, 2002-2011 ..................................................... 24
Figure 1-10. Incidence of Cryptosporidiosis: Ontario and Canada, 2002-2011 ................................. 26
Figure 1-11. Incidence of Cryptosporidiosis by Age and Sex: Ontario, 2011 ................................................ 27
Figure 1-12. Number of Cryptosporidiosis Cases by Month in Ontario in 2011 and Average Number of Cases from 2006-2010 ................................................ 28
Figure 1-13. Incidence of Cyclosporiasis: Ontario and Canada, 2002-2011 .............................................. 33
Figure 1-14. Incidence of Cyclosporiasis by Age and Sex: Ontario, 2011 ................................................ 34
Figure 1-15. Number of Cyclosporiasis Cases by Month in Ontario in 2011 and Average Number of Cases from 2006-2010 ................................................ 35
Figure 1-16. Incidence of Giardiasis: Ontario and Canada, 2002-2011 ..................................................... 40
Figure 1-17. Incidence of Giardiasis by Age and Sex: Ontario, 2011 ....................................................... 41
Figure 1-18. Number of Giardiasis Cases by Month in Ontario in 2011 and Average Number of Cases from 2006-2010 ........................................................... 42
Figure 1-19. Incidence of Hepatitis A: Ontario and Canada, 2002-2011 ...................................................... 48
Figure 1-20. Incidence of Hepatitis A by Age and Sex: Ontario, 2011 ....................................................... 49
Figure 1-21. Number of C Hepatitis A Cases by Month in Ontario in 2011 and Average Number of Cases from 2006-2010 ................................................ 50
Figure 1-22. Incidence of Listeriosis: Ontario and Canada, 2002-2011 ...................................................... 55
Figure 1-23. Incidence of Listeriosis by Age and Sex: Ontario, 2011 ....................................................... 56
Figure 1-24. Number of Listeriosis Cases by Month in Ontario in 2011 and Average Number of Cases from 2006-2010 ........................................................... 57
Figure 1-25. Incidence of Paratyphoid Fever: Ontario and Canada, 2002-2011 .................................. 62
Figure 1-26. Incidence of Paratyphoid Fever by Age and Sex: Ontario, 2011 ......................................... 63
Figure 1-27. Number of Paratyphoid Fever Cases by Month in Ontario in 2011 and Average Number of Cases from 2006-2010 ............................................. 64
Figure 1-28. Incidence of Psittacosis/Ornithosis: Ontario and Canada, 2002-2011 .................................. 69
Figure 1-29. Incidence of Q Fever: Ontario and Canada, 2002-2011 ...................................................... 71
Figure 1-30. Incidence of Salmonellosis: Ontario and Canada, 2002-2011 ............................................... 74
Figure 1-31. Incidence of Salmonellosis by Age and Sex: Ontario, 2011 ....................................................... 76
Figure 1-32. Number of Salmonellosis Cases by Month in Ontario in 2011 and Average Number of Cases from 2006-2010 ................................................. 77
Figure 1-33. Incidence of Shigellosis: Ontario and Canada, 2002-2011 ...................................................... 82
Figure 1-34. Incidence of Shigellosis by Age and Sex: Ontario, 2011 ....................................................... 83

Reportable Disease Trends in Ontario, 2011 v
Figure 1-35. Number of Shigellosis Cases by Month in Ontario in 2011 and Average Number of Cases from 2006-2010 .......................................................... 84
Figure 1-36. Incidence of Trichinosis: Ontario and Canada, 2002-2011 ..................................................... 88
Figure 1-37. Incidence of Tularemia: Ontario and Canada, 2002-2011 ..................................................... 89
Figure 1-38. Incidence of Typhoid Fever: Ontario and Canada, 2002-2011 .............................................. 91
Figure 1-39. Incidence of Typhoid Fever by Age and Sex: Ontario, 2011 ................................................ 92
Figure 1-40. Number of Typhoid Fever Cases by Month in Ontario in 2011 and Average Number of Cases from 2006-2010 ................................................ 93
Figure 1-41. Incidence of VTEC: Ontario and Canada, 2002-2011 ..................................................... 98
Figure 1-42. Incidence of VTEC by Age and Sex: Ontario, 2011 .............................................................. 99
Figure 1-43. Number of VTEC Cases by Month in Ontario in 2011 and Average Number of Cases from 2006-2010 ........................................................ 100
Figure 1-44. Incidence of Yersiniosis: Ontario and Canada, 2002-2011 ................................................... 105
Figure 1-45. Incidence of Yersiniosis by Age and Sex: Ontario, 2011 ..................................................... 106
Figure 1-46. Number of Yersiniosis Cases by Month in Ontario in 2011 and Average Number of Cases from 2006-2010 ............................................ 107
Figure 2-1. Incidence of iGAS in Ontario and Canada: 2002-2011 ................................................... 113
Figure 2-2. Incidence of iGAS by Age and Sex: Ontario, 2011 ............................................................ 114
Figure 2-3. Number of iGAS Cases by Month in Ontario in 2011 and Average Number of Cases from 2006-2010 ........................................................ 115
Figure 2-4. Incidence of Influenza: Ontario and Canada, 2001/2002 to 2010/2011 ............................ 120
Figure 2-5. Incidence of Influenza by Age and Sex: Ontario, 2010/2011 .................................................. 121
Figure 2-6. Number of Influenza Cases by Month in Ontario in 2011 and Average Number of Cases from 2005/2006 to 2009/2010 ................................. 122
Figure 2-7. Incidence of Legionellosis in Ontario and Canada: 2002-2011 ............................................. 127
Figure 2-8.Incidence of Legionellosis by Age and Sex: Ontario, 2011 ..................................................... 128
Figure 2-9. Number of Legionellosis Cases by Month in Ontario in 2011 and Average Number of Cases from 2006-2010 ............................................... 129
Figure 2-10. Incidence of Tuberculosis: Ontario and Canada, 2002-2011 ............................................. 136
Figure 2-11. Incidence of Tuberculosis by Age and Sex: Ontario, 2011 ..................................................... 137
Figure 2-12. Number of Tuberculosis Cases by Month in Ontario in 2011 and Average Number of Cases from 2006-2010 ............................................... 138
Figure 3-1. Incidence of Chlamydia in Ontario and Canada: 2002-2011 .................................................... 146
Figure 3-2. Incidence of Chlamydia by Age and Sex: Ontario, 2011 ..................................................... 147
Figure 3-3. Number of Chlamydia Cases by Month in Ontario in 2011 and Average Number of Cases from 2006-2010 ......................................................... 148
Figure 3-4. Incidence of Congenital Cytomegalovirus: Ontario and Canada, 2002-2011 .................................................................. 152
Figure 3-5. Incidence of Gonorrhea in Ontario and Canada: 2002-2011 .................................................... 154
Figure 3-6. Incidence of Gonorrhea by Age and Sex: Ontario, 2011 ..................................................... 155
Figure 3-7. Number of Gonorrhea Cases by Month in Ontario in 2011 and Average Number of Cases from 2006-2010 ......................................................... 156
Figure 3-8. Incidence of Neonatal Group B Streptococcal Disease in Ontario and Canada: 2002-2011 .................................................................. 161
Figure 3-9. Number of Neonatal Group B Streptococcal Disease Cases by Month in Ontario in 2011 and Average Number of Cases from 2006-2010 ........................................................................... 162
Figure 3-10. Incidence of Hepatitis B in Ontario and Canada: 2002-2011 ............................................. 166
Figure 3-11. Incidence of Acute Hepatitis B by Age and Sex: Ontario, 2011 ............................................. 167
Reportable Disease Trends in Ontario, 2011 vi
Figure 3-12. Number of Acute Hepatitis B Cases by Month in Ontario in 2011 and Average Number of Cases from 2006-2010 .............................................. 168
Figure 3-13. Incidence of Hepatitis C in Ontario and Canada: 2002-2011 ............................................ 173
Figure 3-14. Incidence of Hepatitis C by Age and Sex: Ontario, 2011 ..................................................... 174
Figure 3-15. Number of Hepatitis C Cases by Month in Ontario in 2011 and Average Number of Cases from 2006-2010 .............................................. 175
Figure 3-16. Incidence of Hepatitis D: Ontario and Canada, 2002-2011 ................................................... 179
Figure 3-17. Incidence of Neonatal Herpes: Ontario and Canada, 2002-2011 ............................... 180
Figure 3-18. Incidence of HIV in Ontario and Canada: 2002-2011 ................................................... 182
Figure 3-19. Incidence of AIDS in Ontario and Canada: 2002-2011 ................................................... 183
Figure 3-20. Incidence of HIV by Age and Sex: Ontario, 2011 ............................................................ 184
Figure 3-21. Incidence of AIDS by Age and Sex: Ontario, 2011 ............................................................ 185
Figure 3-22. Number of HIV Cases by Month in Ontario in 2011 and Average Number of Cases from 2006-2010 ........................................................ 186
Figure 3-23. Number of AIDS Cases by Month in Ontario in 2011 and Average Number of Cases from 2006-2010 ........................................................ 186
Figure 3-24. Incidence of Ophthalmia Neonatorum: Ontario and Canada, 2002-2011 ........ 192
Figure 3-25. Incidence of Infectious Syphilis in Ontario and Canada: 2002-2011 ............................... 194
Figure 3-26. Incidence of Infectious Syphilis by Age and Sex: Ontario, 2011 .............................................. 195
Figure 3-27. Number of Infectious Syphilis Cases by Month in Ontario in 2011 and Average Number of Cases from 2006-2010 .......................................... 196
Figure 4-1. Incidence of invasive Haemophilus Influenzae type b Disease: Ontario and Canada, 2002-2011 ................................................................. 203
Figure 4-2. Incidence of Measles: Ontario and Canada, 2002-2011 ................................................... 205
Figure 4-3. Incidence of Invasive Meningococcal Disease: Ontario and Canada, 2002-2011 ................. 207
Figure 4-4. Incidence of Invasive Meningococcal Disease by Age and Sex: Ontario, 2011 ..................... 209
Figure 4-5. Number of Invasive Meningococcal Disease Cases by Month in Ontario in 2011 and Average Number of Cases from 2006-2010 .............. 210
Figure 4-6. Reported Exposures for Invasive Meningococcal Disease cases: Ontario, 2011 (n= 40) ........................................................................ 213
Figure 4-7. Reported cases and Incidence of Mumps: Ontario and Canada, 2002-2011 ................ 215
Figure 4-8. Incidence of Mumps by Age and Sex: Ontario, 2011 ............................................................. 216
Figure 4-9. Number of Mumps Cases by Month in Ontario in 2011 and Average Number of Cases from 2006-2010 ......................................................... 217
Figure 4-10. Reported Exposures for Mumps Cases: Ontario, 2011 (n=80) ...................................... 220
Figure 4-11. Incidence of Pertussis: Ontario and Canada, 2002-2011 .................................................... 222
Figure 4-12. Incidence of Pertussis by Age and Sex: Ontario, 2011 ............................................................. 223
Figure 4-13. Number of Pertussis Cases by Month in Ontario in 2011 and Average Number of Cases from 2006-2010 ......................................................... 224
Figure 4-14. Reported Exposure Settings for Pertussis Cases: Ontario, 2011 (n=262) ..................... 227
Figure 4-15. Incidence of Invasive Pneumococcal Disease: Ontario and Canada, 2003-2011 ................. 229
Figure 4-16. Incidence of Invasive Pneumococcal Disease by Age and Sex: Ontario, 2011 ..................... 231
Figure 4-17. Number of Invasive Pneumococcal Disease Cases by Month in Ontario in 2011 and Average Number of Cases from 2006-2010 .............. 232
Figure 4-18. Incidence of Rubella: Ontario and Canada, 2002-2011 .................................................... 237
Figure 4-19. Incidence of Congenital Rubella Syndrome: Ontario and Canada, 2002-2011 ............. 238
Figure 4-20. Incidence of Tetanus: Ontario and Canada, 2002-2011 .................................................... 240

Reportable Disease Trends in Ontario, 2011 vii
Figure 5-1. Incidence of Lyme Disease in Ontario and Canada: 2002-2011 ............................................ 243
Figure 5-2. Incidence of Lyme Disease by Age and Sex: Ontario, 2011 ..................................................... 244
Figure 5-3. Number of Lyme Disease Cases by Month in Ontario in 2011 and Average Number of Cases from 2006-2010 .............................................. 245
Figure 5-4. Incidence of Lyme Disease by Place of Exposure: Ontario, 2011 (n=127) .............................. 248
Figure 5-5. Incidence of Malaria in Ontario and Canada: 2002-2011 ................................................... 250
Figure 5-6. Incidence of Malaria by Age and Sex: Ontario, 2011 ............................................................ 251
Figure 5-7. Number of Malaria Cases by Month in Ontario in 2011 and Average Number of Cases from 2006-2010 ........................................................ 252
Figure 5-8. Incidence of WNV Illness in Ontario and Canada: 2002-2011 ............................................ 257
Figure 5-9. Incidence of WNV Illness by Age and Sex: Ontario, 2011 ..................................................... 258
Figure 5-10. Number of WNV Illness Cases by Month in Ontario in 2011 and Average Number of Cases from 2006-2010 .............................................. 260
Figure 6-1. Incidence of Leprosy: Ontario and Canada, 2002-2011 ................................................... 268
Reportable Disease Trends in Ontario, 2011 viii
List of Tables
Table 1-1. Incidence of Amebiasis by Age and Sex: Ontario, 2011 ................................................................ 6
Table 1-2. Incidence of Amebiasis by Health Unit of Residence: Ontario, 2011 ......................................... 9
Table 1-3. Reported Risk Factors for Amebiasis Cases: Ontario, 2011 (n=362) ...................................... 10
Table 1-4. Incidence of Campylobacteriosis by Age and Sex: Ontario, 2011 ................................................ 18
Table 1-5. Incidence of Campylobacteriosis by Health Unit of Residence: Ontario, 2011 .................... 21
Table 1-6. Reported Risk Factors for Campylobacteriosis Cases: Ontario, 2011 (n=2,076) ..................................................................... 22
Table 1-7. Incidence of Cryptosporidiosis by Age and Sex: Ontario, 2011 ................................................ 26
Table 1-8. Incidence of Cryptosporidiosis by Health Unit of Residence: Ontario, 2011 ................................ 30
Table 1-9. Reported Risk Factors for Cryptosporidiosis Cases: Ontario, 2011 (n=218) ......... 31
Table 1-10. Incidence of Cyclosporiasis by Age and Sex: Ontario, 2011 ....................................................... 34
Table 1-11. Incidence of Cyclosporiasis by Health Unit of Residence: Ontario, 2011 ................................ 37
Table 1-12. Reported Risk Factors for Cyclosporiasis Cases: Ontario, 2011 (n=71) ................ 38
Table 1-13. Incidence of Giardiasis by Age and Sex: Ontario, 2011 .............................................................. 41
Table 1-14. Incidence of Giardiasis by Health Unit of Residence: Ontario, 2011 ....................................... 44
Table 1-15. Reported Risk Factor for Giardiasis Cases: Ontario, 2011 (n=773) ...................................... 45
Table 1-16. Incidence of Hepatitis A by Age and Sex: Ontario, 2011 ....................................................... 48
Table 1-17. Incidence of Hepatitis A by Health Unit of Residence: Ontario, 2011 ....................................... 52
Table 1-18. Reported Risk Factors for Hepatitis A Cases: Ontario, 2011 (n=73) ........................................ 53
Table 1-19. Incidence of Listeriosis by Age and Sex: Ontario, 2011 .............................................................. 55
Table 1-20. Incidence of Listeriosis by Health Unit of Residence: Ontario, 2011 ........................................ 59
Table 1-21. Reported Risk Factors for Listeriosis Cases: Ontario, 2011 (n=35) ........................................ 60
Table 1-22. Paratyphoid Fever Cases by Serotype: Ontario, 2011 ............................................................... 61
Table 1-23. Incidence of Paratyphoid Fever by Age and Sex: Ontario, 2011 ................................................ 63
Table 1-24. Incidence of Paratyphoid Fever by Health Unit of Residence: Ontario, 2011 ..................... 66
Table 1-25. Paratyphoid Fever Cases by Country of Travel: Ontario, 2011 (n=51) ........................................ 67
Table 1-26. Salmonellosis Cases by Serotype: Ontario, 2011 ............................................................... 74
Table 1-27. Incidence of Salmonellosis by Age and Sex: Ontario, 2011 ....................................................... 75
Table 1-28. Incidence of Salmonellosis by Health Unit of Residence: Ontario, 2011 ................................ 79
Table 1-29. Reported Risk Factors for Salmonellosis Cases: Ontario, 2011 (n=1,699) ............ 80
Table 1-30. Shigella Cases by Species: Ontario, 2011 ............................................................................. 82
Table 1-31. Incidence of Shigellosis by Age and Sex: Ontario, 2011 ....................................................... 83
Table 1-32. Incidence of Shigellosis by Health Unit of Residence: Ontario, 2011 ........................................ 86
Table 1-33. Reported Risk Factors for Shigellosis Cases: Ontario, 2011 (n=184) ...................................... 87
Table 1-34. Incidence of Typhoid Fever by Age and Sex: Ontario, 2011 ....................................................... 92
Table 1-35. Incidence of Typhoid Fever by Health Unit of Residence: Ontario, 2011 ................................ 95
Table 1-36. Paratyphoid Fever Cases by Country of Travel: Ontario, 2011 (n=96) ........................................ 96
Table 1-37. Incidence of VTEC by Age and Sex: Ontario, 2011 ............................................................... 98
Table 1-38. Incidence of VTEC by Health Unit of Residence: Ontario, 2011 .......................................... 102

Reportable Disease Trends in Ontario, 2011 ix
Table 1-39. Reported Risk Factors for VTEC Cases: Ontario, 2011 (n=163) ............................................... 103
Table 1-40. Incidence of Yersiniosis by Age and Sex: Ontario, 2011 ..................................................... 105
Table 1-41. Incidence of Yersiniosis by Health Unit of Residence: Ontario, 2011 ..................................... 109
Table 1-42. Reported Risk Factors for Yersiniosis cases: Ontario, 2011 (n=131) .................................... 110
Table 2-1. Cases of iGAS cases by emm type: Ontario, 2011 ............................................................ 113
Table 2-2. Incidence of iGAS by Age and Sex: Ontario, 2011 ............................................................ 114
Table 2-3. Incidence of iGAS by Health Unit of Residence: Ontario, 2011 .......................................... 117
Table 2-4. Reported Risk Factors for iGAS cases: Ontario, 2011 (n=167) ............................................... 118
Table 2-5. Influenza by Cases Type: Ontario, 2010/2011 ................................................................. 120
Table 2-6. Incidence of Influenza by Age and Sex: Ontario, 2010/2011 .................................................. 121
Table 2-7. Incidence of Influenza by Health Unit of Residence: Ontario, 2010/2011 ................................ 124
Table 2-8. Reported Risk Factors for Influenza Cases: Ontario, 2010/2011 (n=3,980) ....................... 125
Table 2-9. Incidence of Legionellosis by Age and Sex: Ontario, 2011 ..................................................... 127
Table 2-10. Incidence of Legionellosis by Health Unit of Residence: Ontario, 2011 .............................. 131
Table 2-11. Reported Risk Factors for Legionellosis Cases: Ontario, 2011 (n=122) .................................... 132
Table 2-12. Incidence of Tuberculosis by Age and Sex: Ontario, 2011 ..................................................... 137
Table 2-13. Incidence of Tuberculosis by Health Unit of Residence: Ontario, 2011 .............................. 140
Table 2-14. Reported Risk Factors for Tuberculosis Cases: Ontario, 2011 (n=613) .................................... 141
Table 2-15. Tuberculosis Cases by Diagnosis Year and Country of Birth: Ontario, 2007-2011 ................ 142
Table 3-1. Incidence of Chlamydia by Age and Sex: Ontario, 2011 ............................................................ 146
Table 3-2. Incidence of Chlamydia by Health Unit of Residence: Ontario, 2011 ...................................... 150
Table 3-3. Reported Risk Factors for Chlamydia Cases: Ontario, 2011 .................................................. 151
Table 3-4. Incidence of Gonorrhea by Age and Sex: Ontario, 2011 ............................................................. 154
Table 3-5. Incidence of Gonorrhea by Health Unit of Residence: Ontario, 2011 ...................................... 158
Table 3-6. Reported Risk Factors for Gonorrhea Cases: Ontario, 2011 .................................................. 159
Table 3-7. Incidence of Neonatal Group B Streptococcal Disease by Health Unit of Residence: Ontario, 2011 .......................................... 164
Table 3-8. Incidence of Acute Hepatitis B by Age and Sex: Ontario, 2011 .............................................. 167
Table 3-9. Incidence of Acute Hepatitis B by Health Unit of Residence: Ontario, 2011 .............................. 170
Table 3-10. Reported Risk Factors for Acute Hepatitis B Cases: Ontario 2011 ................................ 171
Table 3-11. Incidence of Hepatitis C by Age and Sex: Ontario, 2011 ..................................................... 173
Table 3-12. Incidence of Hepatitis C by Health Unit of Residence: Ontario, 2011 ...................................... 177
Table 3-13. Reported Risk Factors for Hepatitis C: Ontario 2011 .............................................................. 178
Table 3-14. Incidence of HIV by Age and Sex: Ontario, 2011 ............................................................. 183
Table 3-15. Incidence of AIDS by Age and Sex: Ontario, 2011 ............................................................. 184
Table 3-16. Incidence of HIV by Health Unit of Residence: Ontario, 2011 .......................................... 189
Table 3-17. Incidence of AIDS by Health Unit of Residence: Ontario, 2011 .......................................... 190
Table 3-18. Reported Exposure for HIV Cases: Ontario 2011 .............................................................. 191
Table 3-19. Incidence of Infectious Syphilis by Age and Sex: Ontario, 2011 .............................................. 195
Table 3-20. Incidence of Infectious Syphilis by Public Health Unit of Residence: Ontario, 2011 ........ 198
Table 3-21. Reported Risk Factors for Infectious Syphilis Cases: Ontario 2011 ...................................... 199

Reportable Disease Trends in Ontario, 2011 x
Table 4-1. Invasive Meningococcal Disease by Serogroups: Ontario, 2011 ........................................ 207
Table 4-2. Incidence of Invasive Meningococcal Disease by Age and Sex: Ontario, 2011..................... 208
Table 4-3. Incidence of Invasive Meningococcal Disease by Health Unit of Residence: Ontario, 2011 .......................................................................... 212
Table 4-4. Incidence of Mumps by Age and Sex: Ontario, 2011 ............................................................ 216
Table 4-5. Incidence of Mumps by Health Unit of Residence: Ontario, 2011 .......................................... 219
Table 4-6. Incidence of Pertussis by Age and Sex: Ontario, 2011 ............................................................ 223
Table 4-7. Incidence of Pertussis by Health Unit of Residence: Ontario, 2011 .......................................... 226
Table 4-8. Invasive Pneumococcal Disease Cases by Vaccine Serotypes: Ontario, 2011 ........................ 229
Table 4-9. Incidence of Invasive Pneumococcal Disease by Age and Sex: Ontario, 2011..................... 230
Table 4-10. Incidence of Invasive Pneumococcal Disease by Health Unit of Residence: Ontario, 2011 .......................................................................... 234
Table 5-1. Incidence of Lyme Disease by Age and Sex: Ontario, 2011 ..................................................... 244
Table 5-2. Incidence of Lyme Disease by Health Unit of Residence: Ontario, 2011 .............................. 247
Table 5-3. Malaria Cases by Species: Ontario, 2011 .......................................................................... 250
Table 5-4. Incidence of Malaria by Age and Sex: Ontario, 2011 ............................................................ 251
Table 5-5. Incidence of Malaria by Health Unit: Ontario, 2011 ............................................................ 254
Table 5-6. Incidence of Malaria by Region of Travel: Ontario, 2011 ................................................ 255
Table 5-7. Incidence of WNV Illness by Age and Sex: Ontario, 2011 ..................................................... 258
Table 5-8. Incidence of WNV Illness by Public Health Unit of Residence: Ontario, 2011 .................. 262
Table 5-9. WNV Illness Cases by Severity of Illness: Ontario, 2011 ............................................................ 263
Table 5-10. Reported Risk Factors for WNV Cases: Ontario, 2011 (n=63) ................................................. 263
Reportable Disease Trends in Ontario, 2011 xi
List of Maps
Map 1-1. Incidence of Amebiasis by Health Unit of Residence: Ontario, 2011 .............................................. 8
Map 1-2. Incidence of Campylobacteriosis by Health Unit of Residence: Ontario, 2011 .................... 20
Map 1-3. Incidence of Cryptosporidiosis by Health Unit of Residence: Ontario, 2011 ................................ 29
Map 1-4. Incidence of Cyclosporiasis by Health Unit of Residence: Ontario, 2011 ................................ 36
Map 1-5. Incidence of Giardiasis by Health Unit of Residence: Ontario, 2011 ............................................ 43
Map 1-6. Incidence of Hepatitis A by Health Unit of Residence: Ontario, 2011 ....................................... 51
Map 1-7. Incidence of Listeriosis by Health Unit of Residence: Ontario, 2011 ............................................ 58
Map 1-8. Incidence of Paratyphoid Fever by Health Unit of Residence: Ontario, 2011 ................................ 65
Map 1-9. Incidence of Salmonellosis by Health Unit of Residence: Ontario of Residence, 2011 .......... 78
Map 1-10. Incidence of Shigellosis by Health Unit of Residence: Ontario, 2011 ....................................... 85
Map 1-11. Incidence of Typhoid Fever by Health Unit of Residence: Ontario, 2011 ................................ 94
Map 1-12. Incidence of VTEC by Health Unit of Residence: Ontario, 2011 .......................................... 101
Map 1-13. Incidence of Yersiniosis by Health Unit of Residence: Ontario, 2011 ..................................... 108
Map 2-1. Incidence of iGAS by Health Unit of Residence: Ontario, 2011 .......................................... 116
Map 2-2. Incidence of Influenza by Health Unit of Residence: Ontario, 2010/2011 ................................ 123
Map 2-3. Incidence of Legionellosis by Health Unit of Residence: Ontario, 2011 ..................................... 130
Map 2-4. Incidence of Tuberculosis by Health Unit of Residence: Ontario, 2011 ..................................... 139
Map 3-1. Incidence of Chlamydia by Health Unit of Residence: Ontario, 2011 .......................................... 149
Map 3-2. Incidence of Gonorrhea by Health Unit of Residence: Ontario, 2011 .......................................... 157
Map 3-3. Incidence of Neonatal Group B Streptococcal Disease by Health Unit of Residence: Ontario, 2011 .......................................... 163
Map 3-4. Incidence of Acute Hepatitis B by Health Unit of Residence: Ontario, 2011 .............................. 169
Map 3-5. Incidence of Hepatitis C by Health Unit of Residence: Ontario, 2011 .......................................... 176
Map 3-6. Incidence rates of HIV by Health Unit of Residence: Ontario, 2011 .......................................... 187
Map 3-7. Incidence rates of AIDS by Health Unit of Residence: Ontario, 2011 .......................................... 188
Map 3-8. Incidence of Infectious Syphilis by Health Unit of Residence: Ontario, 2011 .............................. 197
Map 4-1. Incidence of Invasive Meningococcal Disease by Health Unit of Residence: Ontario, 2011 ........................................................................... 211
Map 4-2. Incidence of Mumps by Health Unit of Residence: Ontario, 2011 .......................................... 218
Map 4-3. Incidence of Pertussis by Health Unit of Residence: Ontario, 2011 .......................................... 225
Map 4-4. Incidence of Invasive Pneumococcal Disease by Health Unit of Residence: Ontario, 2011 ........................................................................... 233
Map 5-1. Incidence of Lyme Disease by Health Unit of Exposure: Ontario, 2011 ................................ 246
Map 5-2. Incidence of Malaria by Health Unit of Residence: Ontario, 2011 .......................................... 253
Map 5-3. Incidence of WNV Illness by Health Unit of Residence: Ontario, 2011 ...................................... 261

Reportable Disease Trends in Ontario 2011 1
About this Report
Reportable Disease Trends in Ontario, 2011 is a
publication of Public Health Ontario (PHO). It is the first
annual reportable disease surveillance report produced
by Public Health Ontario (PHO) since the transfer of
related functions from the Ministry of Health and Long-
Term Care (MOHLTC) to PHO in July 2011. Similar
annual reports up to 2009 were produced by the
MOHLTC. Like its predecessor, the 2011 report is an
important component of the provincial infectious
diseases surveillance system, serving as an outlet for the
dissemination of information on reportable disease
trends in Ontario. The report provides a descriptive
analysis of ten year trends in reportable diseases in
Ontario and identifies diseases or disease-specific areas
where public health responses may be required to
anticipate and counter emerging trends. The
epidemiological analyses will be a key resource for
setting priorities for health practitioners and
researchers involved in the planning, implementation
and evaluation of public health policy and practice in
Ontario.
The scope of the report is limited to diseases designated
as reportable under the Ontario Health Protection and
Promotion Act, R.S.O. 1990, c. H.7 with a focus on data
reported in 2011. The core of the report is a brief
epidemiological analysis of these diseases, complete
with interpretations of trends and contextual data. The
report relies primarily on data extracted from the
integrated Public Health Information System (iPHIS),
except where otherwise noted. Comparative data at the
national level are also provided where available.
Recommendations to improve the quality of reportable
disease surveillance information in Ontario are not a
focus and will be addressed in future reports.
The data in this report are presented in five main
sections that align with either a specific mode of disease
transmission or a recognized measure of prevention:
Section 1: Enteric and Zoonotic Diseases
Section 2: Respiratory Diseases and Diseases
Transmitted through Direct Contact
Section 3: Sexually Transmitted and Blood-borne
Infections
Section 4: Vaccine-Preventable Diseases
Section 5: Vector-borne Diseases
Section 6: Other Reportable Diseases
Within these sections, individual reportable diseases are
presented as chapters with detailed analyses where
sufficient data as reported in 2011 are available to
enable meaningful analyses. The ten year trend is
presented for all diseases in order to assess the relative
burden (number of reported cases and incidence rate)
of reportable diseases in Ontario. Each disease chapter
is presented alphabetically and is comprised of a brief
description of the disease, and highlights for the ten
year period from 2002 to 2011. Canadian incidence
rates for the period from 2002 to 2008 are also
presented for comparison where available. Summary
tables, maps and figures for 2011 are presented for
diseases where sufficient data were reported. These
tables, maps and figures summarize the following data:
Distribution of reported cases per month for select diseases (seasonality),
Age and sex-specific counts and incidence rates,
Disease incidence by etiologic agent, serotypes or serogroups where applicable
Geographic distribution of reported cases,
Frequency distribution of risk factors, risk settings and exposure sources, where applicable, and
Other indicators of burden such as hospitalization and case fatality ratios, where applicable.
The report also comes with several quick reference data
tables and detailed Technical Notes found in the
Appendices. The Technical Notes outline the data
sources and methods used, as well as some limitations
and cautions for interpretation.
The 2011 report can be found online on PHO’s website
at www.publichealthontario.ca/en/Pages/default.aspx

Reportable Disease Trends in Ontario 2011 2
Glossary of terms
AIDS - Acquired Immunodeficiency Syndrome
CFR - case fatality ratio
CJD - Creutzfeldt-Jakob disease
CMV - cytomegalovirus
CRS - congenital rubella syndrome
HAART - Highly Active Anti-retroviral Therapy
HBsAg - hepatitis B virus surface antigen
HBV - hepatitis B virus
HCV - hepatitis C virus
Hib - haemophilus influenzae type B
HIV - Human Immunodeficiency Virus
HPPA - Health Protection and Promotion Act
HPS - Hantavirus Pulmonary Syndrome
HSV- herpes simplex virus
HUS - hemolytic uremic syndrome
IDU- injection drug use
iGAS - invasive group A streptococcal disease
IMD - invasive meningococcal disease
IPD - invasive pneumococcal disease
iPHIS - integrated Public Health Information System
IPV - inactivated polio vaccine
MMR - mumps, measles, rubella (vaccine)
MMRV - mumps, measles, rubella, varicella (vaccine)
MOHLTC - Ministry of Health and Long-Term care
MSM - men who have sex with men
NF - necrotizing fasciitis
PHAC - Public Health Agency of Canada
PHO - Public Health Ontario
PHU - public health units
RDIS - Reportable Diseases Information System
SARS - Severe Acute Respiratory Syndrome
STBBIs - sexually transmitted and blood-borne
infections
STI - sexually transmitted infections
STSS - streptococcal toxic shock syndrome
TB - tuberculosis
TSEs - transmissible spongiform encephalopathies
VPDs - vaccine-preventable diseases
VTEC - verotoxin-producing E. coli
WNV - West Nile virus
Reportable Disease Trends in Ontario 2011 3
Section 1
Enterics and zoonotic diseases
Overview
Enteric and zoonotic diseases accounted for 15% of all
reported cases of reportable diseases in Ontario in
2011. The top three enteric illnesses in 2011 were
campylobacteriosis, salmonellosis and giardiasis.
Incidence rates for most enteric diseases declined
during the period from 2002 to 2011, with the declines
occurring primarily among enteric diseases that are
considered endemic in Ontario (e.g. salmonellosis, E.
coli and listeriosis). Non-endemic diseases, such as
typhoid fever, paratyphoid fever and cyclosporiasis
were largely associated with international travel and
generally increased over the period.
Although enteric disease trends can be affected by
outbreaks, the impact of outbreaks on overall incidence
in 2011 was minimal, ranging from less than one
percent of cases for most enteric diseases to
approximately 15-20% of cases for shigellosis, E. coli and
cyclosporiasis.
In this report, diseases exclusively transmitted from
animal to person are referred to as zoonotic. For most
of these diseases, zero to one case was reported in
Ontario in 2011. In contrast, there was a notable
increase in the incidence of Q fever compared to
previous years owing to increased awareness and
testing for the disease among a group of highly
susceptible Ontarians taking part in a provincial study of
Q fever.
Several quick reference data tables on the enteric and zoonotic diseases covered in this report are included in Appendix 4.
Reportable Disease Trends in Ontario 2011 4
Amebiasis
Amebiasis is the fourth most commonly
reported enteric disease in Ontario.
Since 2009, males have accounted for a
disproportionate share of amebiasis cases
with higher annual incidence rates in almost
every age group.
Out of province travel and water-borne
exposures were the most commonly reported
risk factors among amebiasis cases reported in
Ontario in 2011.
Amebiasis is a common enteric disease caused by the
ubiquitous parasite Entamoeba histolytica.1 Humans are
the only reservoir for E. histolytica and transmission is
usually foodborne or water-borne via the fecal-oral
route or sexually via the oral-anal route.1-3
Only 10-20% of persons develop symptoms of amebiasis
after infection with E. histolytica.1 Symptoms
commonly appear two to four weeks after exposure but
can occur as early as a few days to several months after
exposure.1 In most cases, symptoms include mild
abdominal discomfort with bloody or mucoid diarrhea
that alternates with constipation. In severe cases,
amebic dysentery occurs and is characterized by fever,
chills and bloody or mucoid diarrhea.1
Although susceptibility to amebiasis is universal, it is
mostly a disease of young adults with infections rarely
occurring in children under the age of five years. The
risk of amebiasis is higher among travelers to tropical
regions with poor sanitary conditions, among persons
who live in institutions with poor sanitation, and among
men who have sex with men. Amebiasis can be
prevented through proper hand washing with soap and
running water after toileting or changing diapers, by
abstaining from sexual practices that permit fecal-oral
transmission, and by consuming only bottled water or
water that has been adequately treated while traveling
in areas with poor sanitary conditions.1
2011 IN FOCUS AND HISTORICAL HIGHLIGHTS
Amebiasis was the fourth most commonly reported
enteric disease in Ontario in 2011, accounting for eight
percent of all enteric and zoonotic diseases reported in
that year. In 2011, a total of 744 confirmed and
probable cases were reported, representing an
incidence rate of 5.56 cases per 100,000 population
(Figure 1-1).
Between 2002 and 2011, annual incidence rates of
amebiasis fluctuated, ranging from a low of 5.05 cases
per 100,000 population in 2006 to a high of 6.83 cases
per 100,000 population in 2002 (Figure 1-1). Compared
to 2008, the number of reported cases of amebiasis
remained elevated in 2009 and 2010 but has since
dropped to its lowest level since 2006. The
implementation of new provincial case definitions in
early 2009 did not contribute significantly to this initial
increase in incidence in 2009 and 2010. In the period
prior to the case definition change (2002 to 2008), the
cumulative incidence rate of amebiasis was 6.01 cases
per 100,000 population compared to 5.99 cases per
100,000 in the three years since the change (2009 to
2011). A more detailed discussion on the impact of the
case definition change is provided in the Technical
Notes in Appendix 1.
Amebiasis is not nationally notifiable, thus a comparison
between Ontario incidence rates and Canadian rates is
not provided.

Reportable Disease Trends in Ontario 2011 5
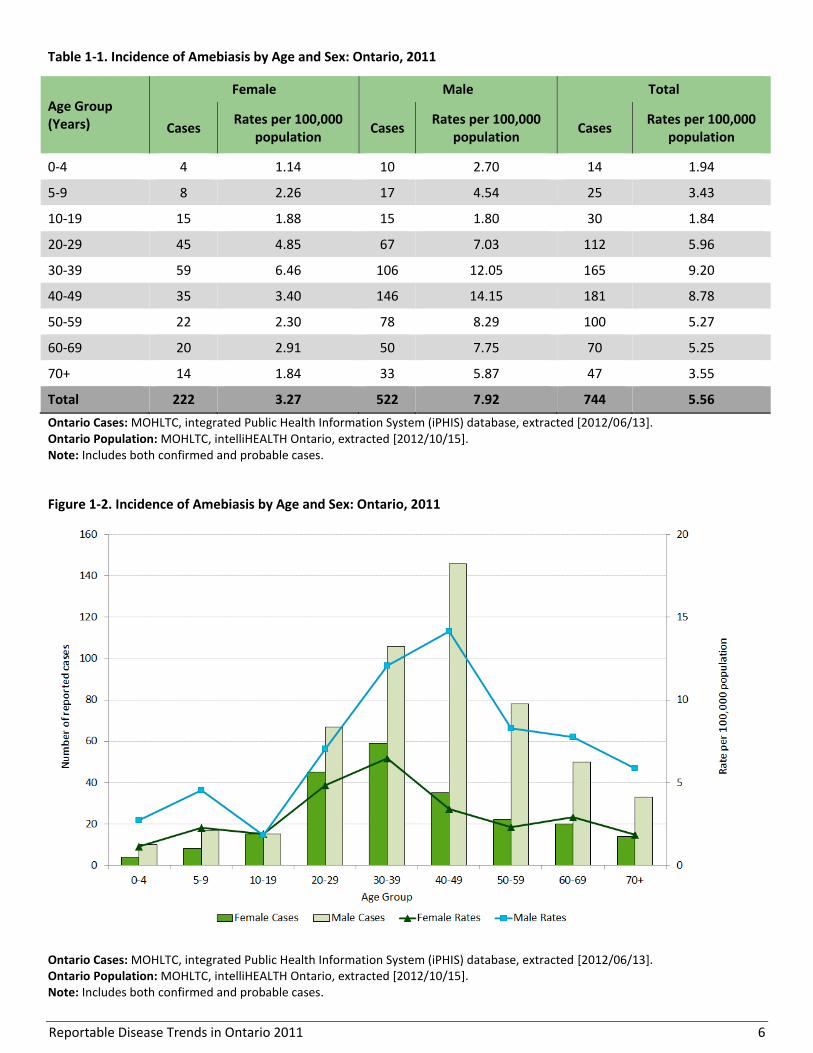
AGE AND SEX DISTRIBUTION
Amebiasis cases reported in 2011 ranged in age from
one to 92 years, with a median age of 41 years. Males
accounted for a disproportionately larger share of cases
with 522 cases or 70% of cases reported in 2011 (Table
1-1, Figure 1-2). Overall sex-specific incidence rates for
amebiasis in 2011 were also higher for males compared
to females in all age groups except the 10-19 year age
group. For males, rates were highest in the 30-39 and
40-49 age groups at 12.05 and 14.15 cases per 100,000
population, respectively. For females, incidence rates
were highest in the 20-29 and 30-39 age groups at 4.85
and 6.46 cases per 100,000 population, respectively.
From 2009 to 2011, males accounted for 70 to 72% of
amebiasis cases reported in Ontario. This trend of
higher incidence rates of amebiasis among males,
particularly those aged 30 to 49 years, may be reflective
of same-sex contact, which is an emerging risk factor for
enteric diseases such as amebiasis.2,3
Figure 1-1. Incidence of Amebiasis: Ontario and Canada, 2002-2011
Ontario Cases: MOHLTC, integrated Public Health Information System (iPHIS) database, extracted [2012/06/13]; probable cases included as of 2009. Ontario Population: MOHLTC, intelliHEALTH Ontario, extracted [2012/10/15]. Canadian Rates: Amebiasis is not nationally notifiable.
Reportable Disease Trends in Ontario 2011 6
Table 1-1. Incidence of Amebiasis by Age and Sex: Ontario, 2011
Age Group (Years)
Female Male Total
Cases Rates per 100,000
population Cases
Rates per 100,000 population
Cases Rates per 100,000
population
0-4 4 1.14 10 2.70 14 1.94
5-9 8 2.26 17 4.54 25 3.43
10-19 15 1.88 15 1.80 30 1.84
20-29 45 4.85 67 7.03 112 5.96
30-39 59 6.46 106 12.05 165 9.20
40-49 35 3.40 146 14.15 181 8.78
50-59 22 2.30 78 8.29 100 5.27
60-69 20 2.91 50 7.75 70 5.25
70+ 14 1.84 33 5.87 47 3.55
Total 222 3.27 522 7.92 744 5.56
Ontario Cases: MOHLTC, integrated Public Health Information System (iPHIS) database, extracted [2012/06/13]. Ontario Population: MOHLTC, intelliHEALTH Ontario, extracted [2012/10/15]. Note: Includes both confirmed and probable cases.
Figure 1-2. Incidence of Amebiasis by Age and Sex: Ontario, 2011
Ontario Cases: MOHLTC, integrated Public Health Information System (iPHIS) database, extracted [2012/06/13]. Ontario Population: MOHLTC, intelliHEALTH Ontario, extracted [2012/10/15]. Note: Includes both confirmed and probable cases.
Reportable Disease Trends in Ontario 2011 7
HOSPITALIZATIONS AND DEATHS
In 2011, two percent (16/744) of amebiasis cases were
hospitalized. No fatalities were reported among the
cases.
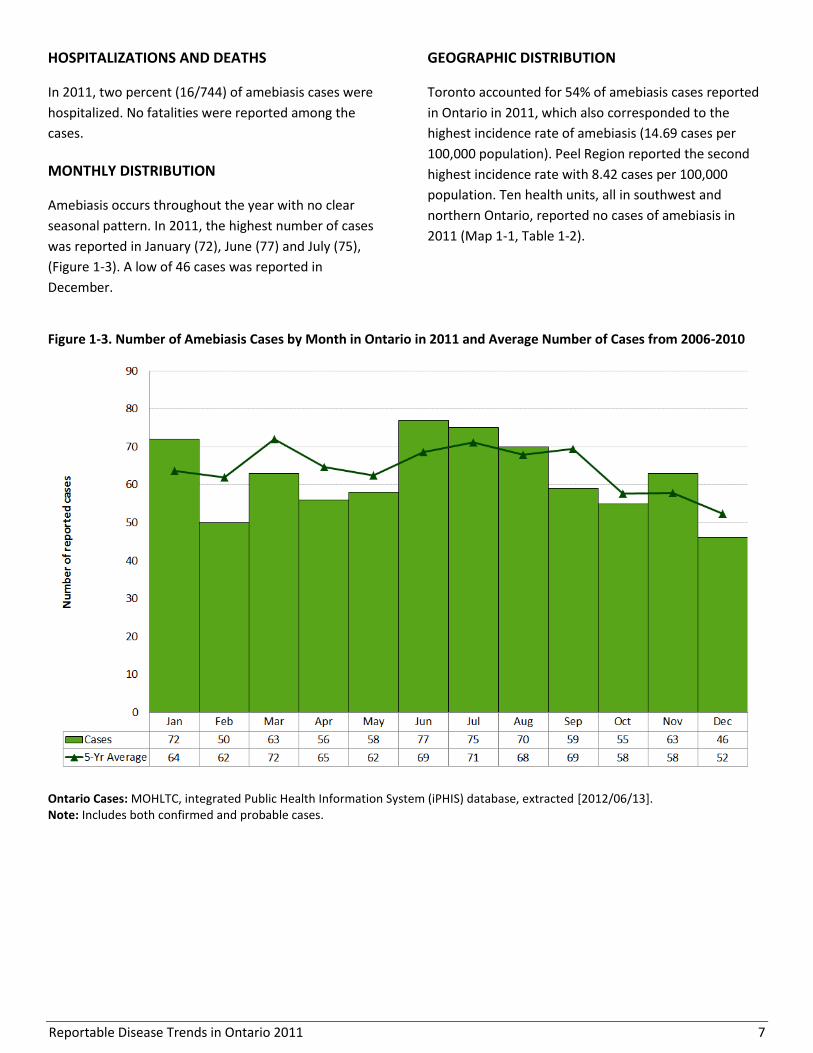
MONTHLY DISTRIBUTION
Amebiasis occurs throughout the year with no clear
seasonal pattern. In 2011, the highest number of cases
was reported in January (72), June (77) and July (75),
(Figure 1-3). A low of 46 cases was reported in
December.
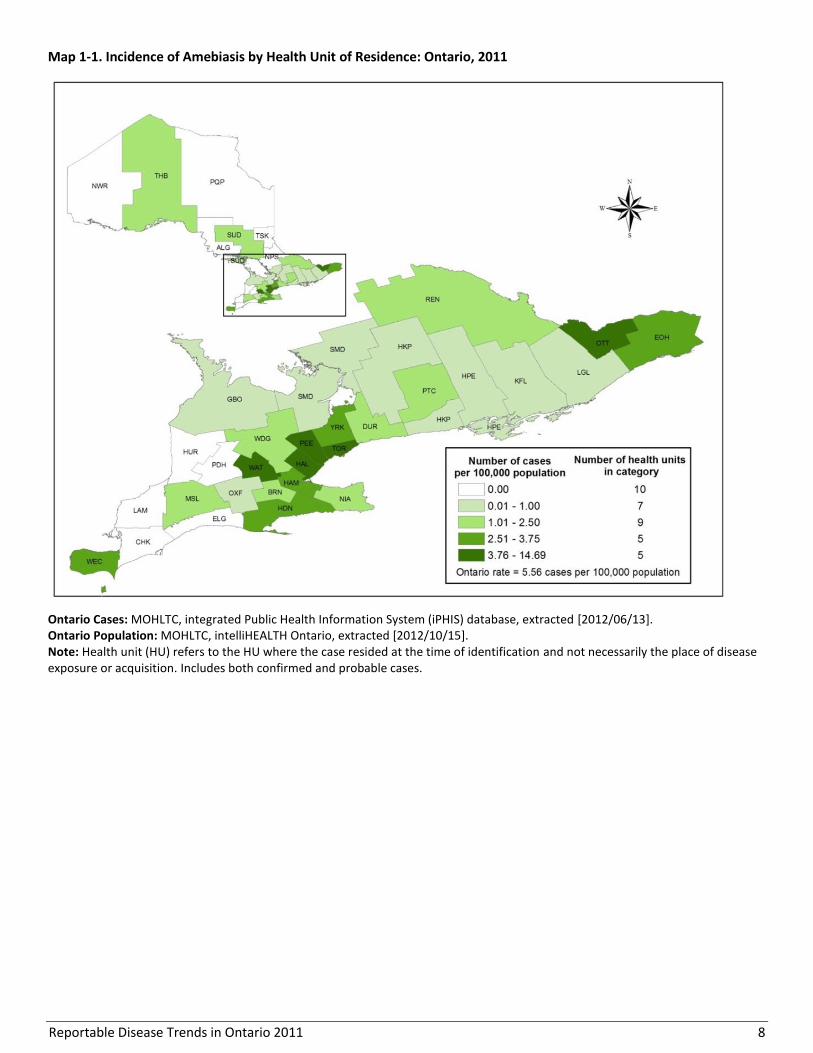
GEOGRAPHIC DISTRIBUTION
Toronto accounted for 54% of amebiasis cases reported
in Ontario in 2011, which also corresponded to the
highest incidence rate of amebiasis (14.69 cases per
100,000 population). Peel Region reported the second
highest incidence rate with 8.42 cases per 100,000
population. Ten health units, all in southwest and
northern Ontario, reported no cases of amebiasis in
2011 (Map 1-1, Table 1-2).
Figure 1-3. Number of Amebiasis Cases by Month in Ontario in 2011 and Average Number of Cases from 2006-2010
Ontario Cases: MOHLTC, integrated Public Health Information System (iPHIS) database, extracted [2012/06/13]. Note: Includes both confirmed and probable cases.
Reportable Disease Trends in Ontario 2011 8
Map 1-1. Incidence of Amebiasis by Health Unit of Residence: Ontario, 2011
Ontario Cases: MOHLTC, integrated Public Health Information System (iPHIS) database, extracted [2012/06/13]. Ontario Population: MOHLTC, intelliHEALTH Ontario, extracted [2012/10/15]. Note: Health unit (HU) refers to the HU where the case resided at the time of identification and not necessarily the place of disease exposure or acquisition. Includes both confirmed and probable cases.

Reportable Disease Trends in Ontario 2011 9
Table 1-2. Incidence of Amebiasis by Health Unit of Residence: Ontario, 2011
Public Health Unit Cases (n) Rates (per
100,000 Population)
Cases as Proportion of
Total Cases (%)
Proportion of Ontario
Population (%)
Algoma District 0 0.00 0.0% 0.9%
Brant County 2 1.42 0.3% 1.1%
Chatham-Kent 0 0.00 0.0% 0.8%
Durham Region 14 2.22 1.9% 4.7%
Eastern Ontario 6 2.98 0.8% 1.5%
Elgin-St. Thomas 0 0.00 0.0% 0.7%
Grey Bruce 1 0.61 0.1% 1.2%
Haldimand-Norfolk 4 3.61 0.5% 0.8%
Haliburton, Kawartha, Pine Ridge District 1 0.56 0.1% 1.3%
Halton Region 21 4.05 2.8% 3.9%
Hamilton, City of 19 3.52 2.6% 4.0%
Hastings & Prince Edward Counties 1 0.61 0.1% 1.2%
Huron County 0 0.00 0.0% 0.5%
Kingston-Frontenac & Lennox & Addington 1 0.51 0.1% 1.5%
Lambton County 0 0.00 0.0% 1.0%
Leeds, Grenville and Lanark District 1 0.59 0.1% 1.3%
Middlesex-London 10 2.17 1.3% 3.4%
Niagara Region 7 1.57 0.9% 3.3%
North Bay Parry Sound District 0 0.00 0.0% 1.0%
Northwestern 0 0.00 0.0% 0.6%
Ottawa, City of 45 4.95 6.0% 6.8%
Oxford County 1 0.92 0.1% 0.8%
Peel Region 115 8.42 15.5% 10.2%
Perth District 0 0.00 0.0% 0.6%
Peterborough County-City 2 1.42 0.3% 1.1%
Porcupine 0 0.00 0.0% 0.6%
Renfrew County & District 2 1.94 0.3% 0.8%
Simcoe Muskoka District 3 0.57 0.4% 3.9%
Sudbury & District 2 1.01 0.3% 1.5%
Thunder Bay District 2 1.28 0.3% 1.2%
Timiskaming 0 0.00 0.0% 0.3%
Toronto 403 14.69 54.2% 20.5%
Waterloo Region 21 3.96 2.8% 4.0%
Wellington-Dufferin-Guelph 6 2.15 0.8% 2.1%
Windsor-Essex County 15 3.72 2.0% 3.0%
York Region 39 3.65 5.2% 8.0%
Ontario 744 5.56 100.0% 100.0%
Ontario Cases: MOHLTC, integrated Public Health Information System (iPHIS) database, extracted [2012/06/13] Ontario Population: MOHLTC, intelliHEALTH Ontario, extracted [2012/10/15]. Note: Health unit (HU) refers to the HU where the case resided at the time of identification and not necessarily the place of disease exposure or acquisition. Includes both confirmed and probable cases.
Reportable Disease Trends in Ontario 2011 10
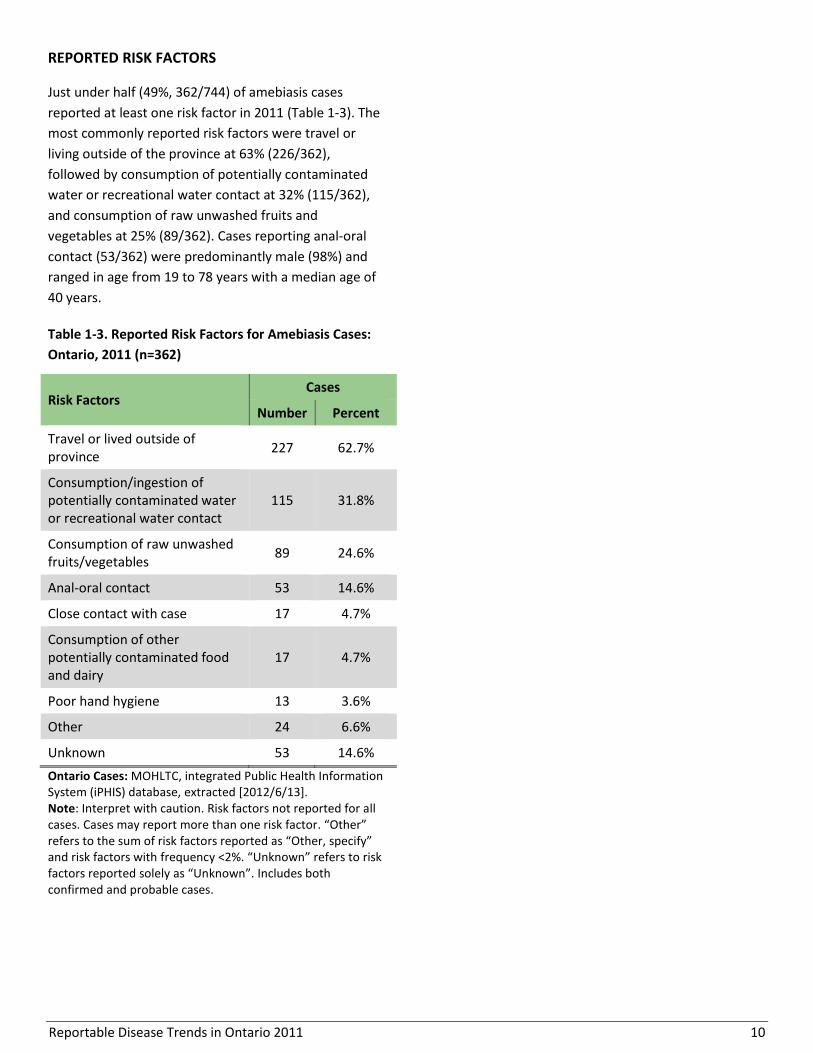
REPORTED RISK FACTORS
Just under half (49%, 362/744) of amebiasis cases
reported at least one risk factor in 2011 (Table 1-3). The
most commonly reported risk factors were travel or
living outside of the province at 63% (226/362),
followed by consumption of potentially contaminated
water or recreational water contact at 32% (115/362),
and consumption of raw unwashed fruits and
vegetables at 25% (89/362). Cases reporting anal-oral
contact (53/362) were predominantly male (98%) and
ranged in age from 19 to 78 years with a median age of
40 years.
Table 1-3. Reported Risk Factors for Amebiasis Cases:
Ontario, 2011 (n=362)
Risk Factors Cases
Number Percent
Travel or lived outside of province
227 62.7%
Consumption/ingestion of potentially contaminated water or recreational water contact
115 31.8%
Consumption of raw unwashed fruits/vegetables
89 24.6%
Anal-oral contact 53 14.6%
Close contact with case 17 4.7%
Consumption of other potentially contaminated food and dairy
17 4.7%
Poor hand hygiene 13 3.6%
Other 24 6.6%
Unknown 53 14.6%
Ontario Cases: MOHLTC, integrated Public Health Information System (iPHIS) database, extracted [2012/6/13]. Note: Interpret with caution. Risk factors not reported for all cases. Cases may report more than one risk factor. “Other” refers to the sum of risk factors reported as “Other, specify” and risk factors with frequency <2%. “Unknown” refers to risk factors reported solely as “Unknown”. Includes both confirmed and probable cases.
Reportable Disease Trends in Ontario 2011 11
Anthrax
Anthrax is an acute disease caused by the spores of the
bacterium Bacillus anthracis.1 Human infections are rare
and in industrialized countries, a single case is
considered an outbreak given the rarity and severity of
infections, and the potential for use as a bioterrorism
agent.1
There are three forms of anthrax, each defined by its
mode of transmission and presenting symptoms.
Cutaneous anthrax is transmitted through direct
inoculation of lesions with infected animal tissue or
contaminated soil. Gastrointestinal anthrax occurs
following ingestion of raw or undercooked meat from
infected animals, while inhalation anthrax occurs
following inhalation of anthrax spores aerosolized
during industrial and other processes.1
Symptoms of anthrax vary based on the route of
transmission and usually appear one to seven days after
exposure.1 Cutaneous anthrax is the most commonly
acquired human infection and is characterized by a
painless black ulcer.1 Gastrointestinal anthrax manifests
as bloody diarrhea, abdominal pain, acute vomiting and
fever.1 Inhalation anthrax is the most lethal form of
anthrax, resulting in cold or flu-like symptoms that can
progress to respiratory distress and shock with a case
fatality rate as high as 85%.1
Anthrax is mainly a disease of herbivores including
cattle and sheep. Therefore, prevention is primarily
based on safe disposal of anthrax infected carcasses,
vaccination of livestock and active treatment of animal
cases.1
2011 IN FOCUS AND HISTORICAL HIGHLIGHTS
No human cases of anthrax have been reported in
Ontario since electronic reporting began in 1991.
Reportable Disease Trends in Ontario 2011 12
Botulism
Botulism is a rare but serious infection caused by the
toxin producing spore of the bacterium Clostridium
botulinum. C. botulinum spores are found in soil and are
frequently detected in agricultural products and the
intestinal tracts of animals including fish.1
There are four forms of botulism.1 Foodborne botulism
is most common and occurs following the ingestion of
foods containing pre-formed C. botulinum toxins.
Improperly canned fruits and vegetables and fermented
fish and meat products have been associated with
illness. Infant botulism is associated with ingestion of
spores that later form toxins in the intestinal tract. It is
most often associated with the consumption of raw
honey,1 but have been implicated in illnesses associated
with exposure to environmental sources such as dust,
and with the consumption of contaminated infant
formula.4,5 Adult intestinal botulism occurs in the same
way as infant botulism, but is usually preceded by
intestinal surgery or altered bacterial gut flora due to
the use of antibiotics. Wound botulism is the rarest
form of botulism and results from contamination of
open wounds with soil containing spores that germinate
and release toxins directly into the wound.1 Injection
drug use is a primary risk factor for wound botulism.6
Symptoms of botulism in adults include blurred vision,
nausea and vomiting, difficulty swallowing, speaking
and breathing, fatigue, weakness and ultimately
paralysis.1 In infants, symptoms also include loss of
appetite and head control, constipation, altered cry and
limited movement of the limbs.1 Susceptibility to
botulism is general, but persons with intestinal
problems and children less than six months of age have
higher risk of illness following infection.1 The risk of
botulism can be reduced by preparing and canning
foods safely, eliminating unpasteurized honey and
peanut butter from the diets of infants, covering
wounds to avoid contamination with non-sterile
substances and soil and abstaining from injection drug
use.
2011 IN FOCUS AND HISTORICAL HIGHLIGHTS
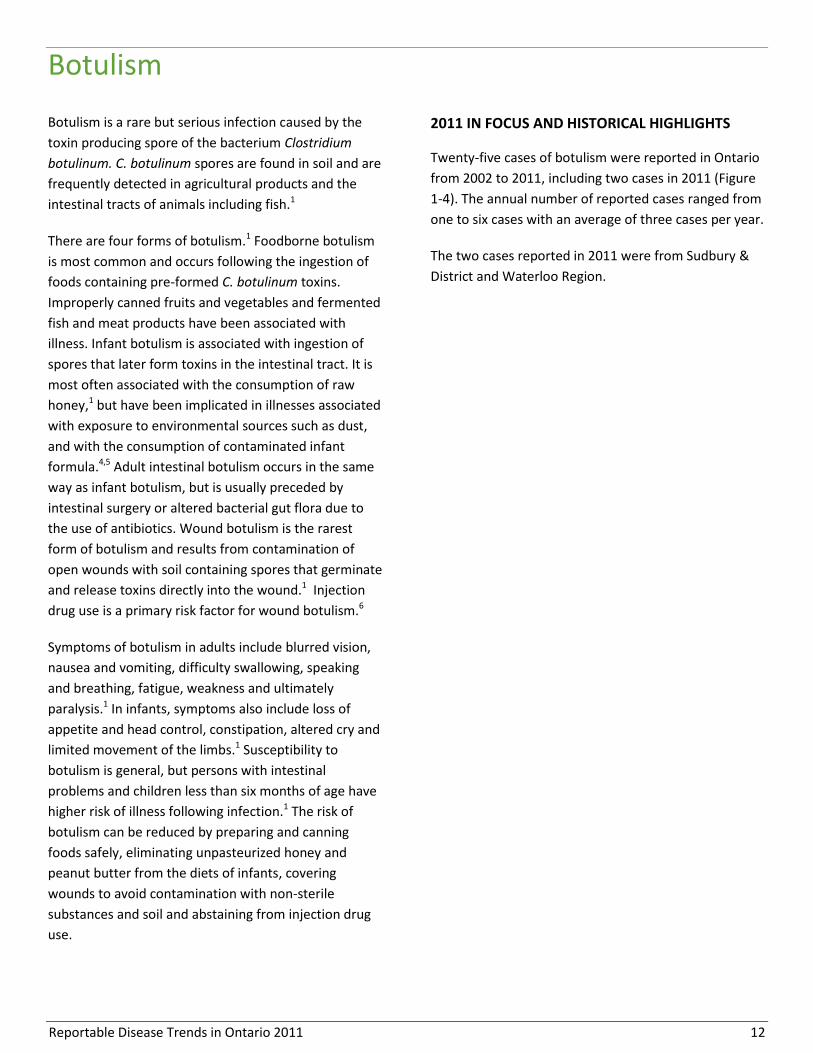
Twenty-five cases of botulism were reported in Ontario
from 2002 to 2011, including two cases in 2011 (Figure
1-4). The annual number of reported cases ranged from
one to six cases with an average of three cases per year.
The two cases reported in 2011 were from Sudbury &
District and Waterloo Region.
Reportable Disease Trends in Ontario 2011 13
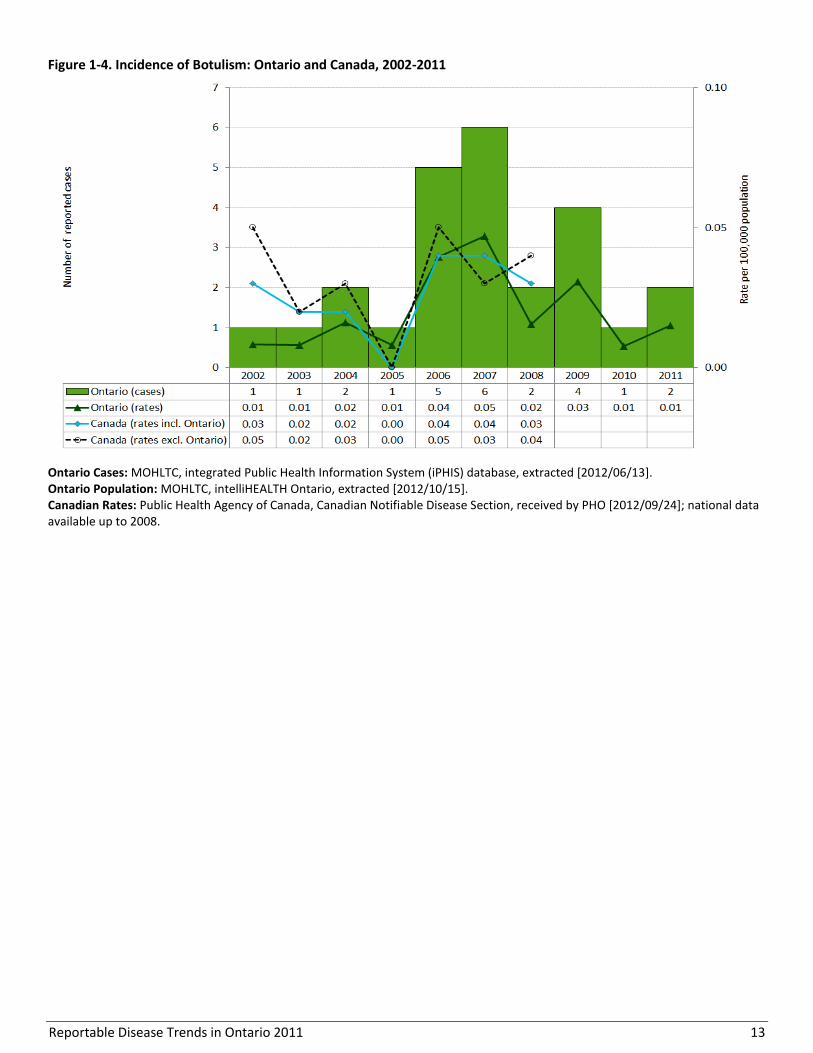
Figure 1-4. Incidence of Botulism: Ontario and Canada, 2002-2011
Ontario Cases: MOHLTC, integrated Public Health Information System (iPHIS) database, extracted [2012/06/13]. Ontario Population: MOHLTC, intelliHEALTH Ontario, extracted [2012/10/15]. Canadian Rates: Public Health Agency of Canada, Canadian Notifiable Disease Section, received by PHO [2012/09/24]; national data available up to 2008.
Reportable Disease Trends in Ontario 2011 14
Brucellosis
Brucellosis is an acute and systemic bacterial infection
that can be transmitted from animals to humans.
Livestock such as cattle and sheep are known reservoirs
of the disease.1 Ontario has a brucellosis free status for
cattle and thus most human cases are linked to travel
outside of Canada.7 Brucella bacteria are potential
bioterrorism agents.
Brucellosis occurs worldwide and is primarily an
occupational disease of hunters, farm workers, abattoir
workers, veterinarians and laboratory personnel.1
Foodborne transmission resulting from the
consumption of unpasteurized milk and milk products
(e.g. soft cheeses) and undercooked meat from infected
animals is the most common way in which people
become infected. Transmission can also occur through
direct contact between broken skin and infected animal
tissue and through inhalation of the bacteria in settings
such as abattoirs and laboratories.1
The onset of symptoms of brucellosis following
exposure ranges from five to sixty days and usually
include intermittent fever, headache, weakness, chills,
sweating, depression, weight loss, and generalized body
pain.1 Meningitis, inflammation of heart tissue and
arthritis are possible long-term complications of
brucellosis.1
Brucellosis can be prevented by consuming only milk
and milk products that have been pasteurized, eating
meat that has been thoroughly cooked, and by wearing
personal protective clothing when handling animal
tissue.
2011 IN FOCUS AND HISTORICAL HIGHLIGHTS
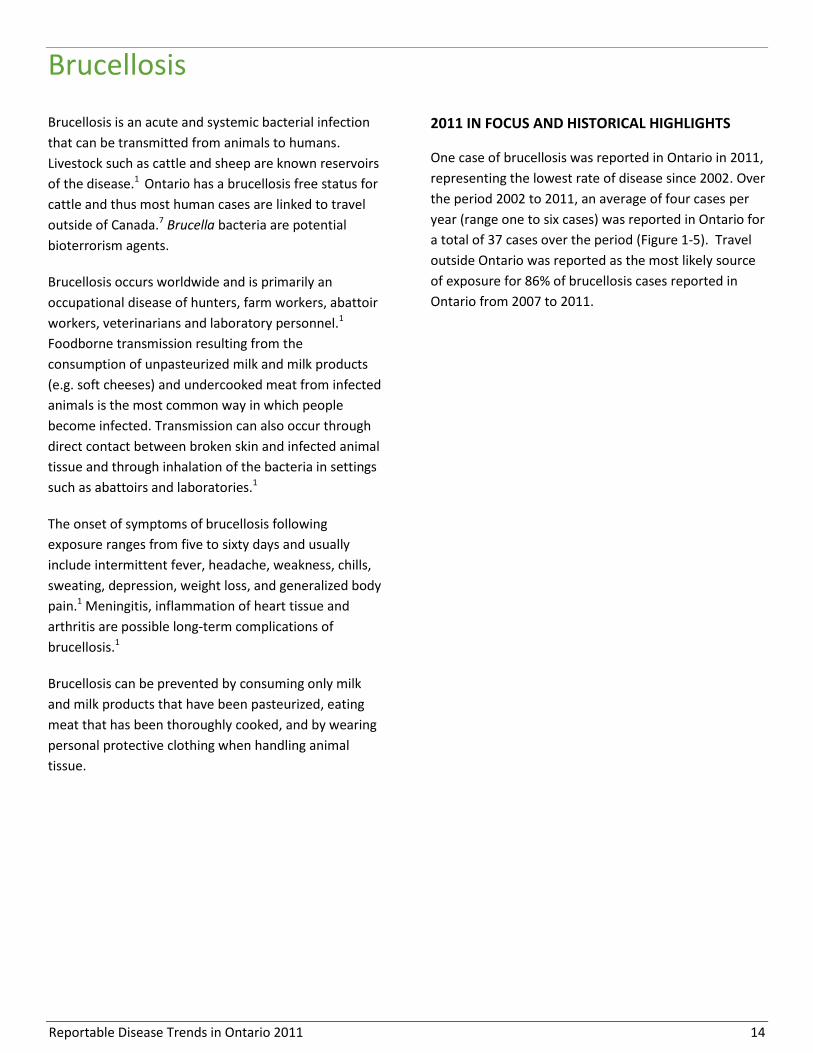
One case of brucellosis was reported in Ontario in 2011,
representing the lowest rate of disease since 2002. Over
the period 2002 to 2011, an average of four cases per
year (range one to six cases) was reported in Ontario for
a total of 37 cases over the period (Figure 1-5). Travel
outside Ontario was reported as the most likely source
of exposure for 86% of brucellosis cases reported in
Ontario from 2007 to 2011.

Reportable Disease Trends in Ontario 2011 15
Figure 1-5. Incidence of Brucellosis: Ontario and Canada, 2002-2011
Ontario Cases: MOHLTC, integrated Public Health Information System (iPHIS) database, extracted [2012/06/13]. Ontario Population: MOHLTC, intelliHEALTH Ontario, extracted [2012/10/15]. Canadian Rates: Public Health Agency of Canada, Canadian Notifiable Disease Section, received by PHO [2012/09/24]; national data available up to 2008.
Reportable Disease Trends in Ontario 2011 16
Campylobacteriosis
Campylobacteriosis continues to be the most
commonly reported enteric disease in Ontario
with 3,500 cases reported in 2011.
Children under the age of five years had the
highest incidence rate of campylobacteriosis in
2011.
The incidence of campylobacteriosis follows a
seasonal distribution with increased activity in
the summer, peaking in July and August.
Animal contact and travel were the most
commonly reported risk factors for
campylobacteriosis in 2011.
Campylobacteriosis is the most frequently reported
enteric disease in Ontario. Campylobacter jejuni and,
less commonly, C. coli bacteria are the usual causes of
campylobacteriosis.1 The disease is transmitted through
ingestion of the bacteria in undercooked meat and
poultry, contaminated food and water, or raw milk and
raw milk products. Contact with pets, farm animals and
infected infants also constitute important sources of
infection. Symptoms of campylobacteriosis generally
appear two to five days after exposure and may include
diarrhea, abdominal pain, malaise, fever, nausea and
vomiting that last for one to two weeks. In some cases,
infection with Campylobacter does not result in
clinically apparent signs and symptoms.1 Complications
can also arise where the illness mimics acute
appendicitis and post-infectious complications such as
Guillain-Barre syndrome can also occur. Convulsions
and reactive arthritis may also occur.1
In industrialized countries, at risk populations are
predominantly immunocompromised persons who are
also at greater risk of severe illness, children under the
age of five years, and young adults. Infection with
campylobacteriosis can be prevented by thoroughly
cooking all foods, especially meats and poultry;
consuming only pasteurized milk and milk products;
drinking water from a safe supply; and practicing good
hand hygiene.1
2011 IN FOCUS AND HISTORICAL HIGHLIGHTS
Campylobacteriosis continued to be the most frequently
reported enteric disease in Ontario, accounting for 37%
of enteric disease cases reported in 2011. There were
3,500 cases reported in 2011, which represents an
incidence rate of 26.17 cases per 100,000 population.
Similar to other endemic enteric diseases in Ontario, the
incidence of campylobacteriosis has been on the decline
since the early 2000s. Over the period 2002 to 2011, the
incidence rate of campylobacteriosis decreased by 31%
from a high of 38.14 cases per 100,000 population in
2002. During this period, the largest year over year
decline of 16% occurred between 2008 and 2009 (Figure
1-6). However, since 2010 the incidence of
campylobacteriosis has increased slightly.
Annual incidence rates of campylobacteriosis for
Canada were comparable to those of Ontario for the
period 2002 to 2008, with both Ontario and Canada
showing an overall pattern of decline. However,
throughout most of this period, the Ontario rates were
slightly higher than the national rates (Figure 1-6).

Reportable Disease Trends in Ontario 2011 17
AGE AND SEX DISTRIBUTION
Similar to past years, the incidence rate of
campylobacteriosis was highest among children under
five years of age. In 2011, the overall incidence rate for
this age group was 40.44 cases per 100,000 population
(Table 1-4, Figure 1-7). Young adults in the 20-29 year
age group had the second highest overall incidence rate
at 32.82 cases per 100,000 population. Incidence rates
were higher among males in all age categories. Overall,
males had an incidence rate of 29.68 cases per 100,000
population and accounted for 56% of all cases reported
in 2011. In contrast, females had a corresponding
incidence rate of 22.68 cases per 100,000 population.
These trends are comparable to the general age- and
sex-specific incidence patterns for campylobacteriosis in
other industrialized countries.1
Figure 1-6. Incidence of Campylobacteriosis: Ontario and Canada, 2002-2011
Ontario Cases: MOHLTC, integrated Public Health Information System (iPHIS) database, extracted [2012/06/13]. Ontario Population: MOHLTC, intelliHEALTH Ontario, extracted [2012/10/15]. Canadian Rates: Public Health Agency of Canada, Canadian Notifiable Disease Section, received by PHO [2012/09/24]; national data available up to 2008.

Reportable Disease Trends in Ontario 2011 18
Table 1-4. Incidence of Campylobacteriosis by Age and Sex: Ontario, 2011
Ontario Cases: MOHLTC, integrated Public Health Information System (iPHIS) database, extracted [2012/06/13]. Ontario Population: MOHLTC, intelliHEALTH Ontario, extracted [2012/10/15]. Note: Excludes five cases of unknown age and/or sex.
Figure 1-7. Incidence of Campylobacteriosis by Age and Sex: Ontario, 2011
Ontario Cases: MOHLTC, integrated Public Health Information System (iPHIS) database, extracted [2012/06/13]. Ontario Population: MOHLTC, intelliHEALTH Ontario, extracted [2012/10/15]. Note: Excludes five cases of unknown age and/or sex.
Age Group (Years)
Female Male Total
Cases Rates per 100,000
population Cases
Rates per 100,000 population
Cases Rates per 100,000
population
0-4 115 32.64 177 47.86 292 40.44
5-9 66 18.65 97 25.91 163 22.38
10-19 105 13.17 208 24.90 313 19.18
20-29 279 30.08 338 35.48 617 32.82
30-39 212 23.22 231 26.26 443 24.71
40-49 187 18.15 234 22.68 421 20.42
50-59 218 22.77 277 29.43 495 26.07
60-69 176 25.60 213 33.00 389 29.18
70+ 180 23.64 182 32.38 362 27.35
Total 1,538 22.68 1,957 29.68 3,495 26.13

Reportable Disease Trends in Ontario 2011 19
HOSPITALIZATIONS AND DEATHS
In 2011, approximately five percent (178/3,500 cases) of
campylobacteriosis cases were hospitalized, and no fatal
cases were reported.
MONTHLY DISTRIBUTION
Campylobacteriosis occurs throughout the year, but
tends to follow a seasonal pattern with increased
incidence in the warmer months (Figure 1-8). In 2011,
the incidence of campylobacteriosis peaked in July and
August, which together accounted for 28% (992/3,500)
of reported cases in 2011. Overall, monthly case counts
for campylobacteriosis in 2011 showed seasonality
similar to the average monthly case counts reported for
the period 2006 to 2010.
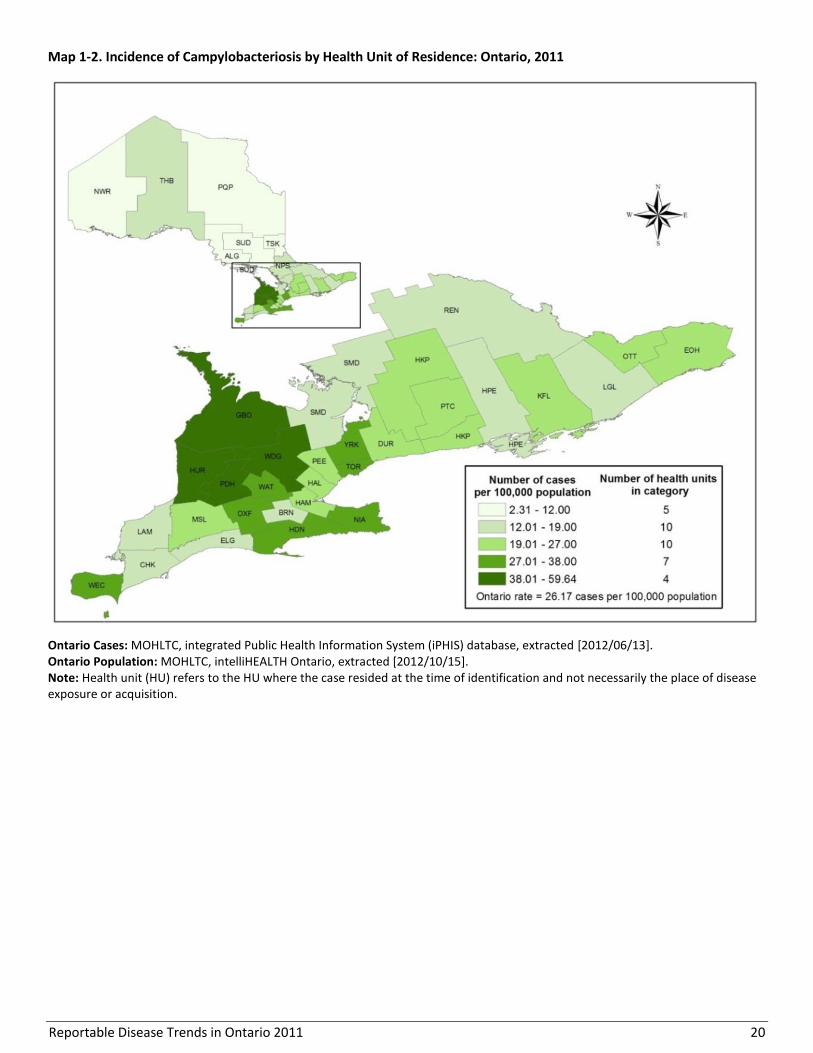
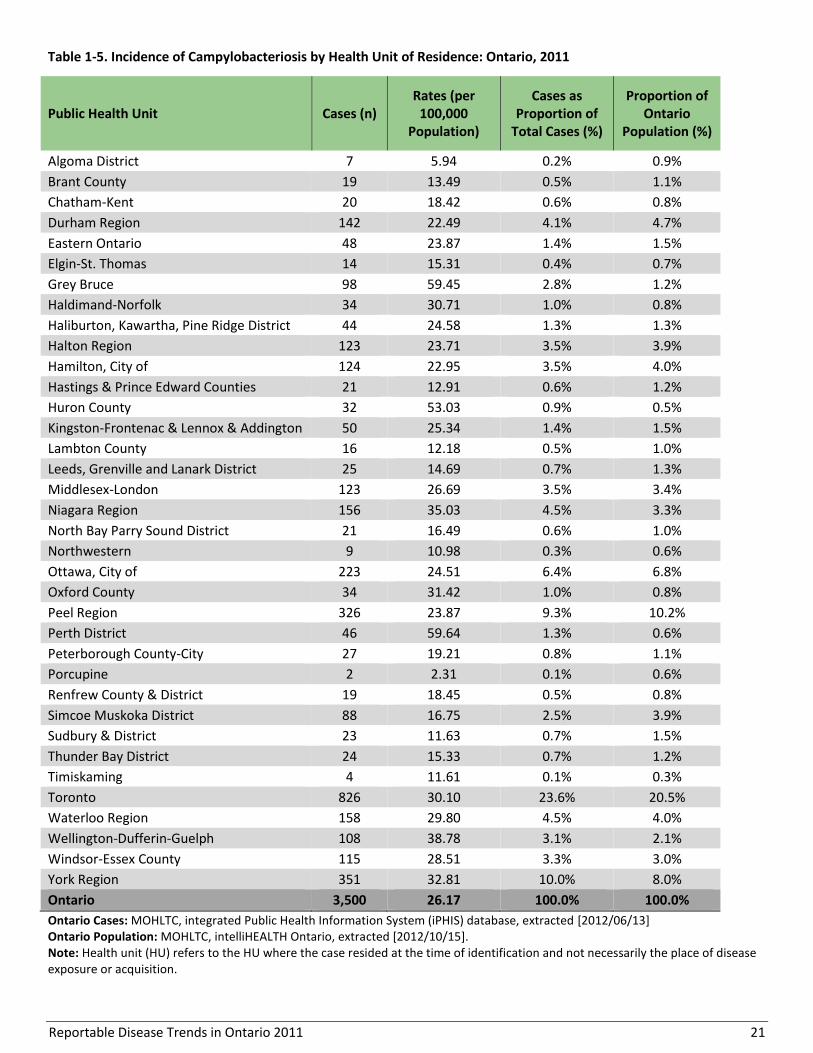
GEOGRAPHIC DISTRIBUTION
Campylobacteriosis cases were reported by all of
Ontario’s 36 health units in 2011 (Map 1-2, Table 1-5).
The highest number of cases was reported by Toronto
with 826 cases (24%). The second and third highest
number of campylobacteriosis cases in 2011 were
reported by York Region (351, 10%) and Peel Region
(326, 9%).
Twelve health units had incidence rates that were higher
than the 2011 overall provincial rate of 26.17 per
100,000 population. Perth District (59.64 cases per
100,000 population), Grey Bruce (59.44 cases per
100,000 population) and Huron County (53.03 cases per
100,000 population) reported the highest incidence
rates of campylobacteriosis in 2011. These health units
are considered rural farming communities where
contact with animals and their environment, a key route
of transmission for campylobacteriosis, is more likely.8
Figure 1-8. Number of Campylobacteriosis Cases by Month in Ontario in 2011 and Average Number of Cases from
2006-2010
Ontario Cases: MOHLTC, integrated Public Health Information System (iPHIS) database, extracted [2012/06/13].
Reportable Disease Trends in Ontario 2011 20
Map 1-2. Incidence of Campylobacteriosis by Health Unit of Residence: Ontario, 2011
Ontario Cases: MOHLTC, integrated Public Health Information System (iPHIS) database, extracted [2012/06/13]. Ontario Population: MOHLTC, intelliHEALTH Ontario, extracted [2012/10/15]. Note: Health unit (HU) refers to the HU where the case resided at the time of identification and not necessarily the place of disease exposure or acquisition.
Reportable Disease Trends in Ontario 2011 21
Table 1-5. Incidence of Campylobacteriosis by Health Unit of Residence: Ontario, 2011
Public Health Unit Cases (n) Rates (per
100,000 Population)
Cases as Proportion of
Total Cases (%)
Proportion of Ontario
Population (%)
Algoma District 7 5.94 0.2% 0.9%
Brant County 19 13.49 0.5% 1.1%
Chatham-Kent 20 18.42 0.6% 0.8%
Durham Region 142 22.49 4.1% 4.7%
Eastern Ontario 48 23.87 1.4% 1.5%
Elgin-St. Thomas 14 15.31 0.4% 0.7%
Grey Bruce 98 59.45 2.8% 1.2%
Haldimand-Norfolk 34 30.71 1.0% 0.8%
Haliburton, Kawartha, Pine Ridge District 44 24.58 1.3% 1.3%
Halton Region 123 23.71 3.5% 3.9%
Hamilton, City of 124 22.95 3.5% 4.0%
Hastings & Prince Edward Counties 21 12.91 0.6% 1.2%
Huron County 32 53.03 0.9% 0.5%
Kingston-Frontenac & Lennox & Addington 50 25.34 1.4% 1.5%
Lambton County 16 12.18 0.5% 1.0%
Leeds, Grenville and Lanark District 25 14.69 0.7% 1.3%
Middlesex-London 123 26.69 3.5% 3.4%
Niagara Region 156 35.03 4.5% 3.3%
North Bay Parry Sound District 21 16.49 0.6% 1.0%
Northwestern 9 10.98 0.3% 0.6%
Ottawa, City of 223 24.51 6.4% 6.8%
Oxford County 34 31.42 1.0% 0.8%
Peel Region 326 23.87 9.3% 10.2%
Perth District 46 59.64 1.3% 0.6%
Peterborough County-City 27 19.21 0.8% 1.1%
Porcupine 2 2.31 0.1% 0.6%
Renfrew County & District 19 18.45 0.5% 0.8%
Simcoe Muskoka District 88 16.75 2.5% 3.9%
Sudbury & District 23 11.63 0.7% 1.5%
Thunder Bay District 24 15.33 0.7% 1.2%
Timiskaming 4 11.61 0.1% 0.3%
Toronto 826 30.10 23.6% 20.5%
Waterloo Region 158 29.80 4.5% 4.0%
Wellington-Dufferin-Guelph 108 38.78 3.1% 2.1%
Windsor-Essex County 115 28.51 3.3% 3.0%
York Region 351 32.81 10.0% 8.0%
Ontario 3,500 26.17 100.0% 100.0%
Ontario Cases: MOHLTC, integrated Public Health Information System (iPHIS) database, extracted [2012/06/13] Ontario Population: MOHLTC, intelliHEALTH Ontario, extracted [2012/10/15]. Note: Health unit (HU) refers to the HU where the case resided at the time of identification and not necessarily the place of disease exposure or acquisition.
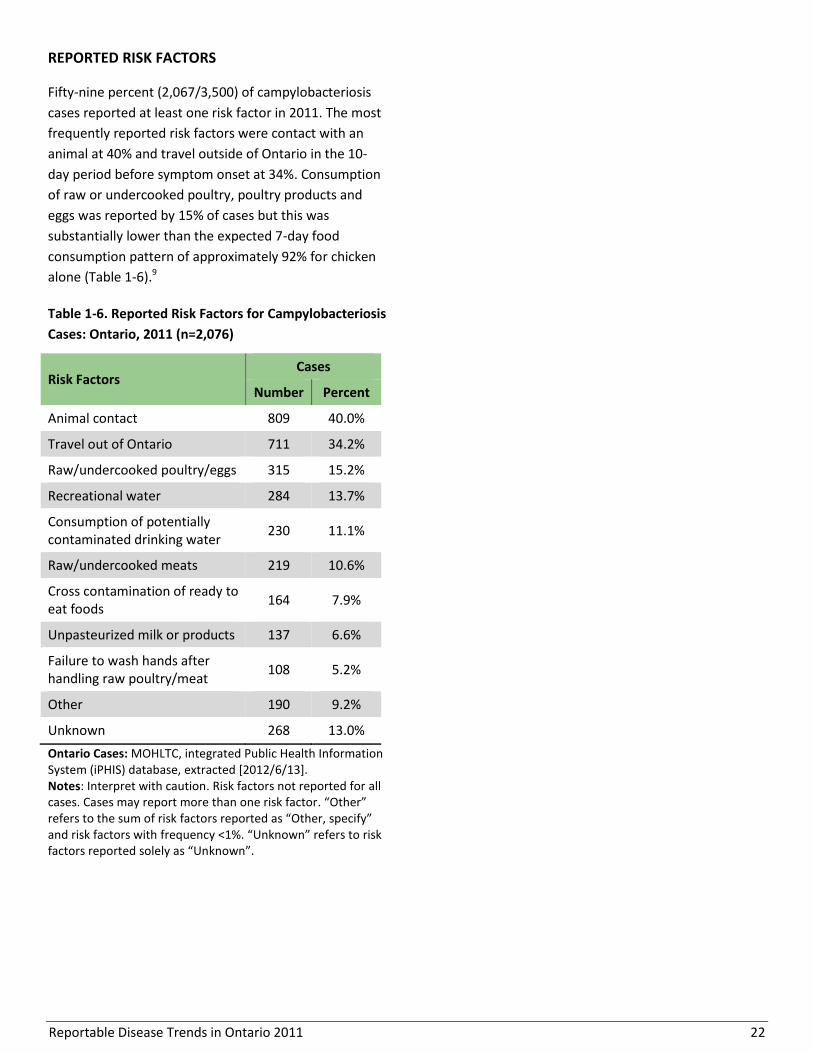
Reportable Disease Trends in Ontario 2011 22
REPORTED RISK FACTORS
Fifty-nine percent (2,067/3,500) of campylobacteriosis
cases reported at least one risk factor in 2011. The most
frequently reported risk factors were contact with an
animal at 40% and travel outside of Ontario in the 10-
day period before symptom onset at 34%. Consumption
of raw or undercooked poultry, poultry products and
eggs was reported by 15% of cases but this was
substantially lower than the expected 7-day food
consumption pattern of approximately 92% for chicken
alone (Table 1-6).9
Table 1-6. Reported Risk Factors for Campylobacteriosis
Cases: Ontario, 2011 (n=2,076)
Risk Factors Cases
Number Percent
Animal contact 809 40.0%
Travel out of Ontario 711 34.2%
Raw/undercooked poultry/eggs 315 15.2%
Recreational water 284 13.7%
Consumption of potentially contaminated drinking water
230 11.1%
Raw/undercooked meats 219 10.6%
Cross contamination of ready to eat foods
164 7.9%
Unpasteurized milk or products 137 6.6%
Failure to wash hands after handling raw poultry/meat
108 5.2%
Other 190 9.2%
Unknown 268 13.0%
Ontario Cases: MOHLTC, integrated Public Health Information System (iPHIS) database, extracted [2012/6/13]. Notes: Interpret with caution. Risk factors not reported for all cases. Cases may report more than one risk factor. “Other” refers to the sum of risk factors reported as “Other, specify” and risk factors with frequency <1%. “Unknown” refers to risk factors reported solely as “Unknown”.
Reportable Disease Trends in Ontario 2011 23
Cholera
Vibrio cholerae is the bacterium that causes cholera,
one of the world’s oldest epidemic diseases.1 Cholera is
commonly found in areas with drinking water supplies
that has been contaminated. The disease is not endemic
in Canada and cases in Ontario are directly or indirectly
associated with travel to endemic regions of the
world.10
Following infection, some people may become
symptom-free carriers of V. cholerae with the ability to
pass on the infection through the fecal-oral route.1
Transmission of cholera is usually through ingestion of
food or water contaminated by the feces of infected
persons and carriers. Raw or undercooked seafood,
especially those obtained from sewage contaminated
waters, and other foods and beverages prepared with
untreated water have been implicated as sources of
cholera.1
Painless watery diarrhea, nausea and vomiting are the
first symptoms of cholera, developing two to three days
after exposure. In severe cases, death can occur if
rehydration is not initiated. In industrialized countries,
travelers and their close personal contacts have the
highest risk of infection. However, susceptibility and
illness severity is higher among those who are
immunocompromised or have low stomach acid levels.1
Two oral cholera vaccines that provide significant
protection against cholera for several months are
available for travelers to endemic countries.1
2011 IN FOCUS AND HISTORICAL HIGHLIGHTS
No cases of cholera were reported in Ontario in 2010
and 2011 (Figure 1-9). Over the period 2002 to 2011,
ten cases of cholera were reported in Ontario for an
average of one case per year (range zero to three
cases). Nationally, incidence rates for cholera from 2002
to 2008 ranged from 0.01 to 0.02 cases per 100,000
population.

Reportable Disease Trends in Ontario 2011 24
Figure 1-9. Incidence of Cholera: Ontario and Canada, 2002-2011
Ontario Cases: MOHLTC, integrated Public Health Information System (iPHIS) database, extracted [2012/06/13]. Ontario Population: MOHLTC, intelliHEALTH Ontario, extracted [2012/10/15]. Canadian Rates: Public Health Agency of Canada, Canadian Notifiable Disease Section, received by PHO [2012/09/24]; national data available up to 2008.
Reportable Disease Trends in Ontario 2011 25
Cryptosporidiosis
Cryptosporidiosis is the fifth most frequently
reported enteric disease in Ontario.
Incidence rates of cryptosporidiosis in 2011
were highest among young children and
lowest among older people.
Incidence of cryptosporidiosis peaks in the
warmer months from July to September.
Animal contact and recreational water
exposures were the most commonly reported
risk factors for cryptosporidiosis in 2011.
Cryptosporidiosis is a parasitic infection which results in
gastroenteritis. Humans, cattle and other domesticated
and wild animals are the primary reservoirs of the
Cryptosporidium parasite.1 The parasite is shed in feces
and is transmitted through the fecal-oral route.
Transmission is usually through ingestion of food or
water that has been contaminated by the feces of
infected persons or animals, or through person-to-
person or animal-to-person contact.
Symptoms of cryptosporidiosis usually develop between
one and 12 days (average seven days) after exposure,
with the predominant symptoms being watery diarrhea
and abdominal pain. Other symptoms such as fever,
malaise, vomiting and nausea occur less often. The
Cryptosporidium oocyst can remain infective for up to
six months or longer in moist environments.1
Outbreaks of cryptosporidiosis are generally associated
with child care centres, recreational water and
contaminated drinking water sources.1 Children under
the age of two years, men who have sex with men,
travelers, animal handlers and close contacts of infected
persons have higher risk of infection. However, persons
with weakened immune systems are more likely to
develop serious and reoccurring illness upon infection.1
2011 IN FOCUS AND HISTORICAL HIGHLIGHTS
Cryptosporidiosis accounted for three percent of all
enteric disease cases reported in Ontario in 2011,
making it one of the top five most frequently reported
enteric diseases. A total of 301 cases were reported in
2011, which is equivalent to an incidence rate of 2.25
cases per 100,000 population (Figure 1-10).
Over the period 2002 to 2011, the incidence rate of
cryptosporidiosis fluctuated, with rates ranging from a
low of 1.91 cases per 100,000 population in 2002 to a
high of 3.17 cases per 100,000 in 2006 and 2007. Since
2008, a general declining trend has been observed, but
the annual number of reported cases is still higher than
the annual average for the period from 2002 to 2005.
From 2004 to 2008, annual provincial rates for
cryptosporidiosis exceeded the rates for the rest of
Canada by 14 to 63%. Comparisons to later years could
not be made because national rates were unavailable
after 2008.
AGE AND SEX DISTRIBUTION
The incidence rate of cryptosporidiosis decreased with
increasing age, with persons under the age of 40 years
accounting for more than 90% of cases reported in
2011. The highest incidence rates were reported for
children under the age of five years with 9.97 cases per
100,000 population, followed by persons in the 10-19
year age group with an incidence rate of 4.72 cases per
100,000 population (Table 1-7, Figure 1-11).
Males accounted for 53% (160/301) of cryptosporidiosis
cases and had a corresponding incidence rate of 2.43
cases per 100,000 per population. The incidence rate of
cryptosporidiosis among females was lower at 2.08
cases per 100,000 population.

Reportable Disease Trends in Ontario 2011 26
Figure 1-10. Incidence of Cryptosporidiosis: Ontario and Canada, 2002-2011
Ontario Cases: MOHLTC, integrated Public Health Information System (iPHIS) database, extracted [2012/06/13] Ontario Population: MOHLTC, intelliHEALTH Ontario, extracted [2012/10/15] Canadian Rates: Public Health Agency of Canada, Canadian Notifiable Disease Section, received by PHO [2012/09/24]; national data available up to 2008.
Table 1-7. Incidence of Cryptosporidiosis by Age and Sex: Ontario, 2011
Age Group (Years)
Female Male Total
Cases Rates per 100,000
population Cases
Rates per 100,000 population
Cases Rates per 100,000
population
0-4 32 9.08 40 10.82 72 9.97
5-9 10 2.83 12 3.21 22 3.02
10-19 34 4.27 43 5.15 77 4.72
20-29 32 3.45 33 3.46 65 3.46
30-39 24 2.63 16 1.82 40 2.23
40-49 5 0.49 5 0.48 10 0.48
50-59 1 0.10 6 0.64 7 0.37
60-69 2 0.29 4 0.62 6 0.45
70+ 1 0.13 1 0.18 2 0.15
Total 141 2.08 160 2.43 301 2.25
Ontario Cases: MOHLTC, integrated Public Health Information System (iPHIS) database, extracted [2012/06/13]. Ontario Population: MOHLTC, intelliHEALTH Ontario, extracted [2012/10/15].

Reportable Disease Trends in Ontario 2011 27
Figure 1-11. Incidence of Cryptosporidiosis by Age and Sex: Ontario, 2011
Ontario Cases: MOHLTC, integrated Public Health Information System (iPHIS) database, extracted [2012/06/13]. Ontario Population: MOHLTC, intelliHEALTH Ontario, extracted [2012/10/15].
HOSPITALIZATIONS AND DEATHS
In 2011, approximately four percent (13/301) of
cryptosporidiosis cases were hospitalized, and none of
the cases were fatal.
MONTHLY DISTRIBUTION
Cryptosporidiosis follows a seasonal pattern with
increased incidence towards the end of summer (Figure
1-12). In 2011, the incidence of cryptosporidiosis
peaked from July to September, which together
accounted for 56% (168/301) of reported cases (Figure
3). Compared to the five-year monthly averages for the
period 2006 to 2010, fewer cases were reported in most
months in 2011.
GEOGRAPHIC DISTRIBUTION
The three highest rates of cryptosporidiosis in 2011
were reported by health units in South West Region.
Huron County reported the highest incidence rate of
cryptosporidiosis, with 16.57 cases per 100,000,
followed by Perth District with 15.56 cases per 100,000
population and Grey Bruce with 10.31 cases per
100,000 population. Toronto reported the most cases in
2011 (40, 13.1%) (Map 1-3, Table 1-8).

Reportable Disease Trends in Ontario 2011 28
Figure 1-12. Number of Cryptosporidiosis Cases by Month in Ontario in 2011 and Average Number of Cases from 2006-
2010
Ontario Cases: MOHLTC, integrated Public Health Information System (iPHIS) database, extracted [2012/06/13].
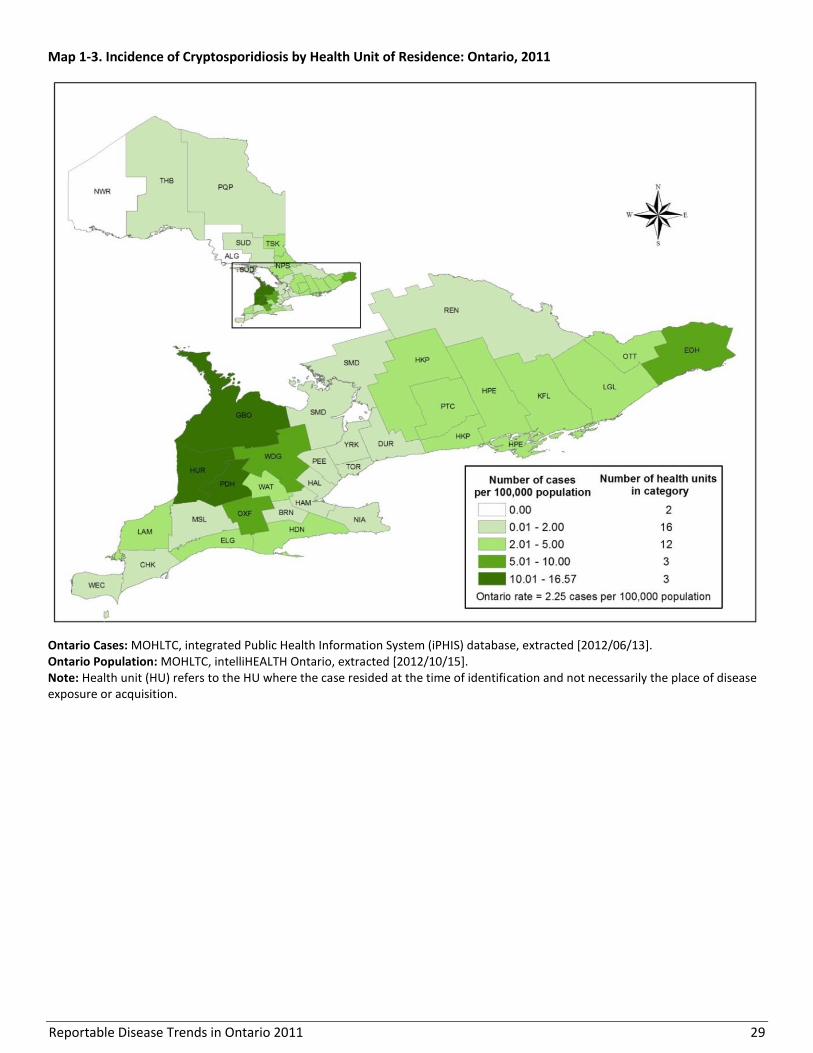
Reportable Disease Trends in Ontario 2011 29
Map 1-3. Incidence of Cryptosporidiosis by Health Unit of Residence: Ontario, 2011
Ontario Cases: MOHLTC, integrated Public Health Information System (iPHIS) database, extracted [2012/06/13]. Ontario Population: MOHLTC, intelliHEALTH Ontario, extracted [2012/10/15]. Note: Health unit (HU) refers to the HU where the case resided at the time of identification and not necessarily the place of disease exposure or acquisition.

Reportable Disease Trends in Ontario 2011 30
Table 1-8. Incidence of Cryptosporidiosis by Health Unit of Residence: Ontario, 2011
Public Health Unit Cases (n) Rates (per
100,000 Population)
Cases as Proportion of
Total Cases (%)
Proportion of Ontario
Population (%)
Algoma District 0 0.00 0.0% 0.9%
Brant County 1 0.71 0.3% 1.1%
Chatham-Kent 1 0.92 0.3% 0.8%
Durham Region 8 1.27 2.7% 4.7%
Eastern Ontario 13 6.46 4.3% 1.5%
Elgin-St. Thomas 2 2.19 0.7% 0.7%
Grey Bruce 17 10.31 5.6% 1.2%
Haldimand-Norfolk 4 3.61 1.3% 0.8%
Haliburton, Kawartha, Pine Ridge District 6 3.35 2.0% 1.3%
Halton Region 5 0.96 1.7% 3.9%
Hamilton, City of 6 1.11 2.0% 4.0%
Hastings & Prince Edward Counties 8 4.92 2.7% 1.2%
Huron County 10 16.57 3.3% 0.5%
Kingston-Frontenac & Lennox & Addington 7 3.55 2.3% 1.5%
Lambton County 3 2.28 1.0% 1.0%
Leeds, Grenville and Lanark District 5 2.94 1.7% 1.3%
Middlesex-London 8 1.74 2.7% 3.4%
Niagara Region 8 1.80 2.7% 3.3%
North Bay Parry Sound District 3 2.36 1.0% 1.0%
Northwestern 0 0.00 0.0% 0.6%
Ottawa, City of 26 2.86 8.6% 6.8%
Oxford County 7 6.47 2.3% 0.8%
Peel Region 21 1.54 7.0% 10.2%
Perth District 12 15.56 4.0% 0.6%
Peterborough County-City 3 2.13 1.0% 1.1%
Porcupine 1 1.15 0.3% 0.6%
Renfrew County & District 1 0.97 0.3% 0.8%
Simcoe Muskoka District 4 0.76 1.3% 3.9%
Sudbury & District 3 1.52 1.0% 1.5%
Thunder Bay District 3 1.92 1.0% 1.2%
Timiskaming 1 2.90 0.3% 0.3%
Toronto 40 1.46 13.3% 20.5%
Waterloo Region 20 3.77 6.6% 4.0%
Wellington-Dufferin-Guelph 20 7.18 6.6% 2.1%
Windsor-Essex County 7 1.74 2.3% 3.0%
York Region 17 1.59 5.6% 8.0%
Ontario 301 2.25 100.0% 100.0%
Ontario Cases: MOHLTC, integrated Public Health Information System (iPHIS) database, extracted [2012/06/13] Ontario Population: MOHLTC, intelliHEALTH Ontario, extracted [2012/10/15]. Note: Health unit (HU) refers to the HU where the case resided at the time of identification and not necessarily the place of disease exposure or acquisition.
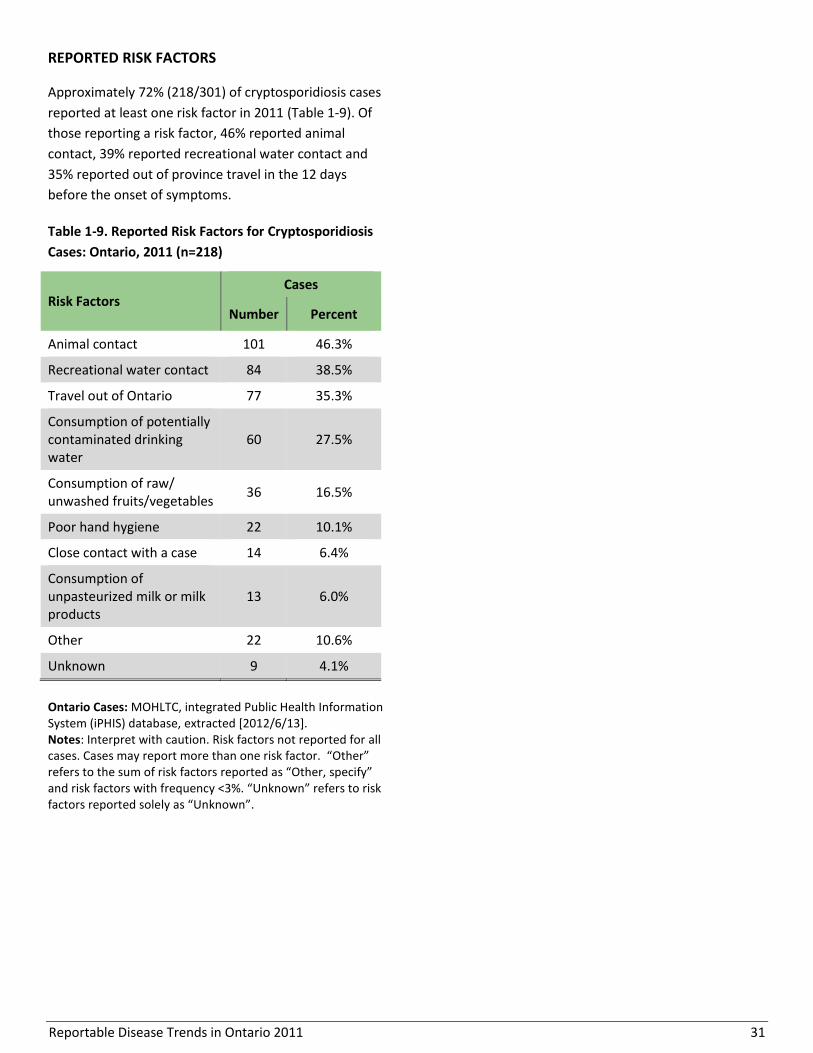
Reportable Disease Trends in Ontario 2011 31
REPORTED RISK FACTORS
Approximately 72% (218/301) of cryptosporidiosis cases
reported at least one risk factor in 2011 (Table 1-9). Of
those reporting a risk factor, 46% reported animal
contact, 39% reported recreational water contact and
35% reported out of province travel in the 12 days
before the onset of symptoms.
Table 1-9. Reported Risk Factors for Cryptosporidiosis
Cases: Ontario, 2011 (n=218)
Risk Factors Cases
Number Percent
Animal contact 101 46.3%
Recreational water contact 84 38.5%
Travel out of Ontario 77 35.3%
Consumption of potentially contaminated drinking water
60 27.5%
Consumption of raw/ unwashed fruits/vegetables
36 16.5%
Poor hand hygiene 22 10.1%
Close contact with a case 14 6.4%
Consumption of unpasteurized milk or milk products
13 6.0%
Other 22 10.6%
Unknown 9 4.1%
Ontario Cases: MOHLTC, integrated Public Health Information System (iPHIS) database, extracted [2012/6/13]. Notes: Interpret with caution. Risk factors not reported for all cases. Cases may report more than one risk factor. “Other” refers to the sum of risk factors reported as “Other, specify” and risk factors with frequency <3%. “Unknown” refers to risk factors reported solely as “Unknown”.
Reportable Disease Trends in Ontario 2011 32
Cyclosporiasis
Excluding years in which outbreaks occured,
the annual incidence rate of cyclosporiasis in
Ontario has remained relatively stable at
approximately 100 cases per year since 2004.
Incidence rates in 2011 were highest for males
and females aged 30-59 years.
The incidence of cyclosporiasis peaks during
the warmer months.
The most commonly reported risk factor
among cyclosporiasis cases in Ontario in 2011
was out of province travel.
Cyclosporiasis is not an endemic disease in Canada and
is frequently associated with travel to areas such as
Asia, the Caribbean and Latin America.1 It is transmitted
primarily through ingestion of food or water
contaminated by the feces of infected persons (fecal-
oral route). Contamination of food is usually due to
contact with infected workers or contaminated water
during cultivation, harvesting, packaging or
transportation.11 Fresh raspberries, basil and mesclun
lettuce have been implicated in outbreaks in the United
States and Canada.12 There is no evidence of person-to-
person transmission of cyclosporiasis.11
Not everyone infected with Cyclospora will develop
symptoms. Among symptomatic persons, symptoms
generally appear one to 14 days after exposure
(average seven days). The most common symptom is
watery and profuse diarrhea. Other symptoms such as
vomiting, nausea, anorexia, weight loss, abdominal
cramping or bloating and prolonged fatigue may also
occur.11 If left untreated, diarrhea can persist for several
weeks.
2011 IN FOCUS AND HISTORICAL HIGHLIGHTS
Cyclosporiasis accounted for one percent of enteric
infections reported in Ontario in 2011. A total of 105
cases were reported, representing an incidence rate of
0.79 cases per 100,000 population (Figure 1-13). This
also represented a decline of 38% compared to the
number of cases reported in 2010. Of cases reported in
2011, 21% (22/105) were linked to a province-wide
outbreak for which the source was not identified.
Cyclosporiasis became reportable in Ontario in 2001.
From 2002 to 2011, incidence rates fluctuated, ranging
from 0.32 to 1.27 cases per 100,000. Notable increases
in annual incidence rates in 2005, 2009 and 2010 were
attributed to local outbreaks. The increase in 2005 was
due to an outbreak linked to the consumption of fresh
basil, while the 2009 increase was attributed to a
restaurant outbreak. The 2010 increase was due to a
province-wide increase of unknown cause. In 2002 and
2003, the incidence of cyclosporiasis was relatively low,
a common phenomenon with diseases newly
designated as reportable. Excluding these years as well
as years in which outbreaks occurred (2005, 2009 and
2010), the number of reported cases of cyclosporiasis
has remained relatively stable at approximately 100
cases per year.
The annual incidence rates of cyclosporiasis in Canada
for the years 2002 to 2008 were consistently lower than
Ontario’s (Figure 1-13).
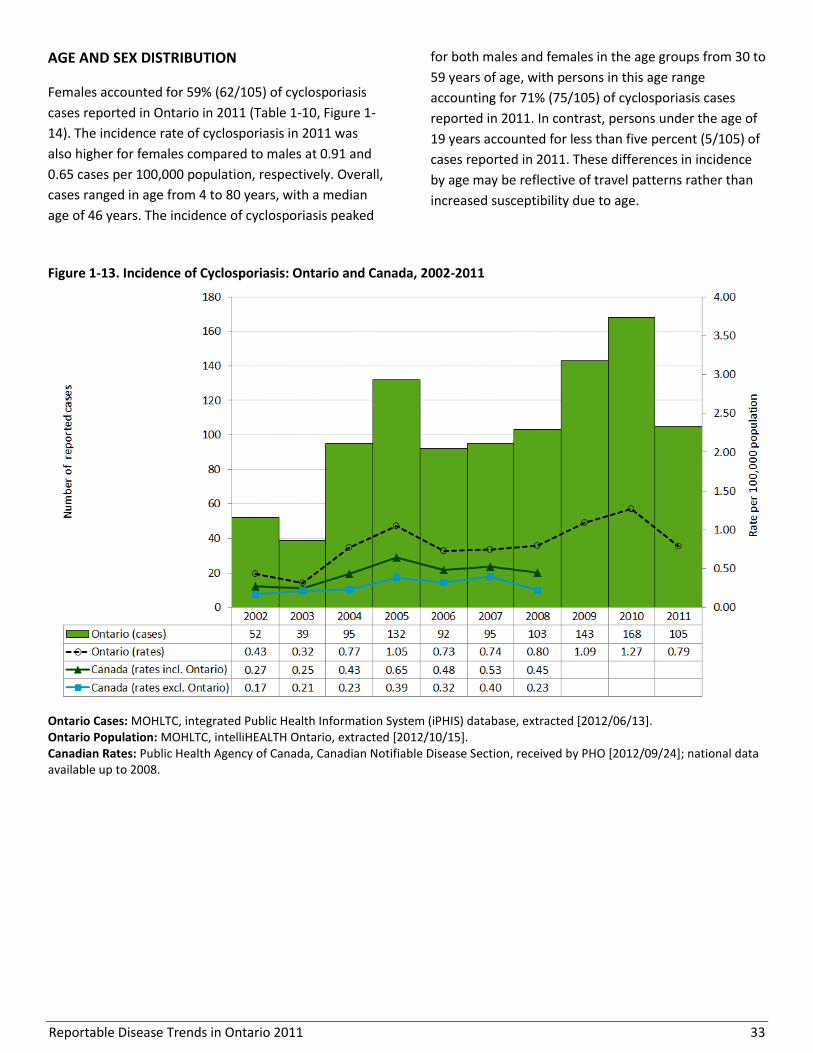
Reportable Disease Trends in Ontario 2011 33
AGE AND SEX DISTRIBUTION
Females accounted for 59% (62/105) of cyclosporiasis
cases reported in Ontario in 2011 (Table 1-10, Figure 1-
14). The incidence rate of cyclosporiasis in 2011 was
also higher for females compared to males at 0.91 and
0.65 cases per 100,000 population, respectively. Overall,
cases ranged in age from 4 to 80 years, with a median
age of 46 years. The incidence of cyclosporiasis peaked
for both males and females in the age groups from 30 to
59 years of age, with persons in this age range
accounting for 71% (75/105) of cyclosporiasis cases
reported in 2011. In contrast, persons under the age of
19 years accounted for less than five percent (5/105) of
cases reported in 2011. These differences in incidence
by age may be reflective of travel patterns rather than
increased susceptibility due to age.
Figure 1-13. Incidence of Cyclosporiasis: Ontario and Canada, 2002-2011
Ontario Cases: MOHLTC, integrated Public Health Information System (iPHIS) database, extracted [2012/06/13]. Ontario Population: MOHLTC, intelliHEALTH Ontario, extracted [2012/10/15]. Canadian Rates: Public Health Agency of Canada, Canadian Notifiable Disease Section, received by PHO [2012/09/24]; national data available up to 2008.

Reportable Disease Trends in Ontario 2011 34
Table 1-10. Incidence of Cyclosporiasis by Age and Sex: Ontario, 2011
Age Group (Years)
Female Male Total
Cases Rates per 100,000
population Cases
Rates per 100,000 population
Cases Rates per 100,000
population
0-4 0 0.00 1 0.27 1 0.14
5-9 0 0.00 0 0.00 0 0.00
10-19 3 0.38 1 0.12 4 0.25
20-29 5 0.54 5 0.52 10 0.53
30-39 15 1.64 7 0.80 22 1.23
40-49 18 1.75 11 1.07 29 1.41
50-59 11 1.15 13 1.38 24 1.26
60-69 7 1.02 4 0.62 11 0.83
70+ 3 0.39 1 0.18 4 0.30
Total 62 0.91 43 0.65 105 0.79
Ontario Cases: MOHLTC, integrated Public Health Information System (iPHIS) database, extracted [2012/06/13]. Ontario Population: MOHLTC, intelliHEALTH Ontario, extracted [2012/10/15].
Figure 1-14. Incidence of Cyclosporiasis by Age and Sex: Ontario, 2011
Ontario Cases: MOHLTC, integrated Public Health Information System (iPHIS) database, extracted [2012/06/13]. Ontario Population: MOHLTC, intelliHEALTH Ontario, extracted [2012/10/15].
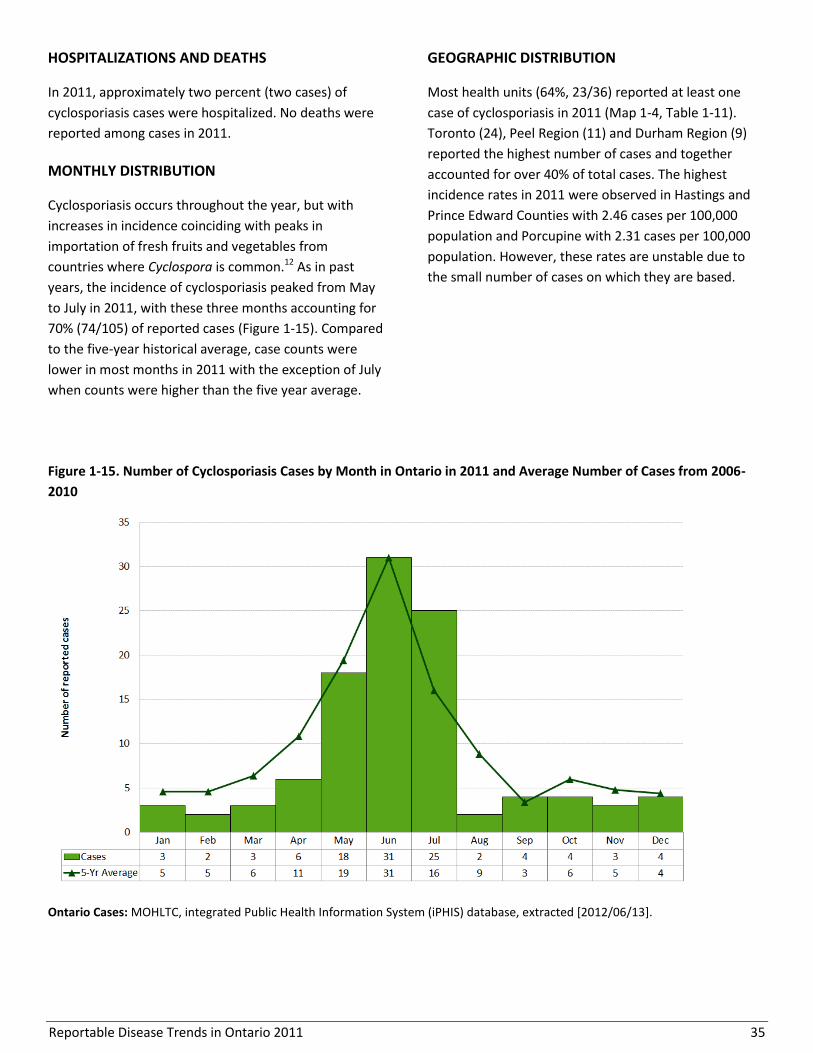
Reportable Disease Trends in Ontario 2011 35
HOSPITALIZATIONS AND DEATHS
In 2011, approximately two percent (two cases) of
cyclosporiasis cases were hospitalized. No deaths were
reported among cases in 2011.
MONTHLY DISTRIBUTION
Cyclosporiasis occurs throughout the year, but with
increases in incidence coinciding with peaks in
importation of fresh fruits and vegetables from
countries where Cyclospora is common.12 As in past
years, the incidence of cyclosporiasis peaked from May
to July in 2011, with these three months accounting for
70% (74/105) of reported cases (Figure 1-15). Compared
to the five-year historical average, case counts were
lower in most months in 2011 with the exception of July
when counts were higher than the five year average.
GEOGRAPHIC DISTRIBUTION
Most health units (64%, 23/36) reported at least one
case of cyclosporiasis in 2011 (Map 1-4, Table 1-11).
Toronto (24), Peel Region (11) and Durham Region (9)
reported the highest number of cases and together
accounted for over 40% of total cases. The highest
incidence rates in 2011 were observed in Hastings and
Prince Edward Counties with 2.46 cases per 100,000
population and Porcupine with 2.31 cases per 100,000
population. However, these rates are unstable due to
the small number of cases on which they are based.
Figure 1-15. Number of Cyclosporiasis Cases by Month in Ontario in 2011 and Average Number of Cases from 2006-
2010
Ontario Cases: MOHLTC, integrated Public Health Information System (iPHIS) database, extracted [2012/06/13].
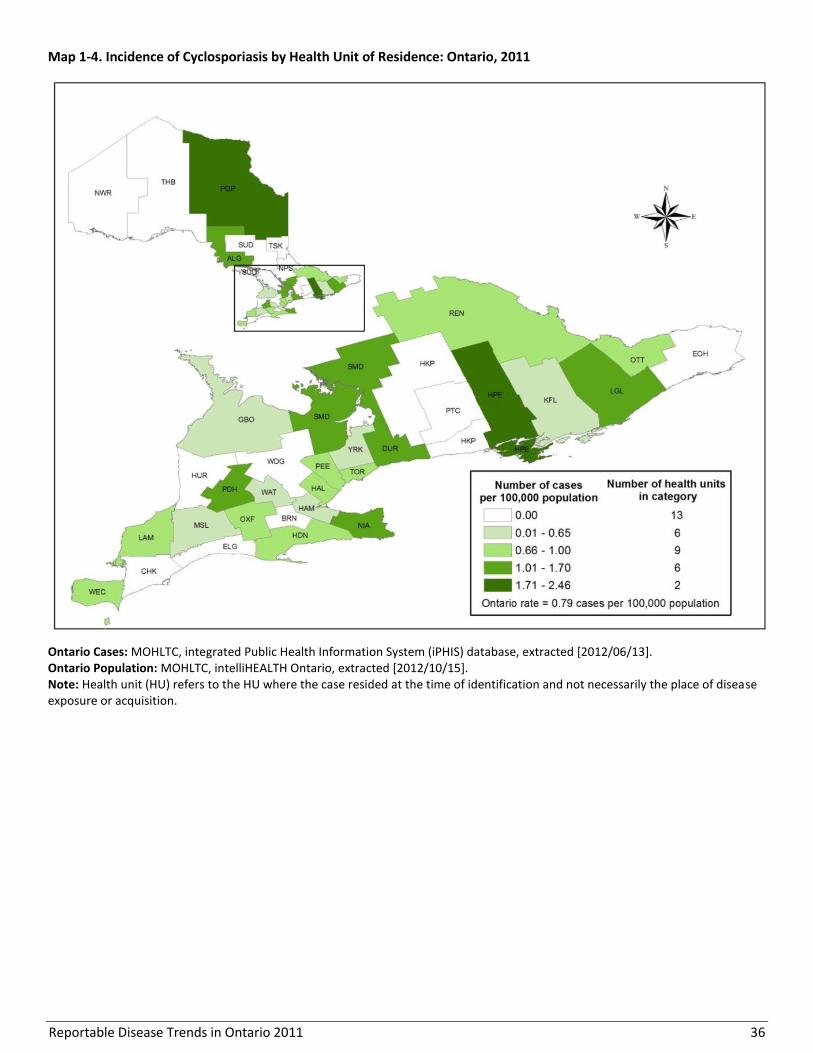
Reportable Disease Trends in Ontario 2011 36
Map 1-4. Incidence of Cyclosporiasis by Health Unit of Residence: Ontario, 2011
Ontario Cases: MOHLTC, integrated Public Health Information System (iPHIS) database, extracted [2012/06/13]. Ontario Population: MOHLTC, intelliHEALTH Ontario, extracted [2012/10/15]. Note: Health unit (HU) refers to the HU where the case resided at the time of identification and not necessarily the place of disease exposure or acquisition.
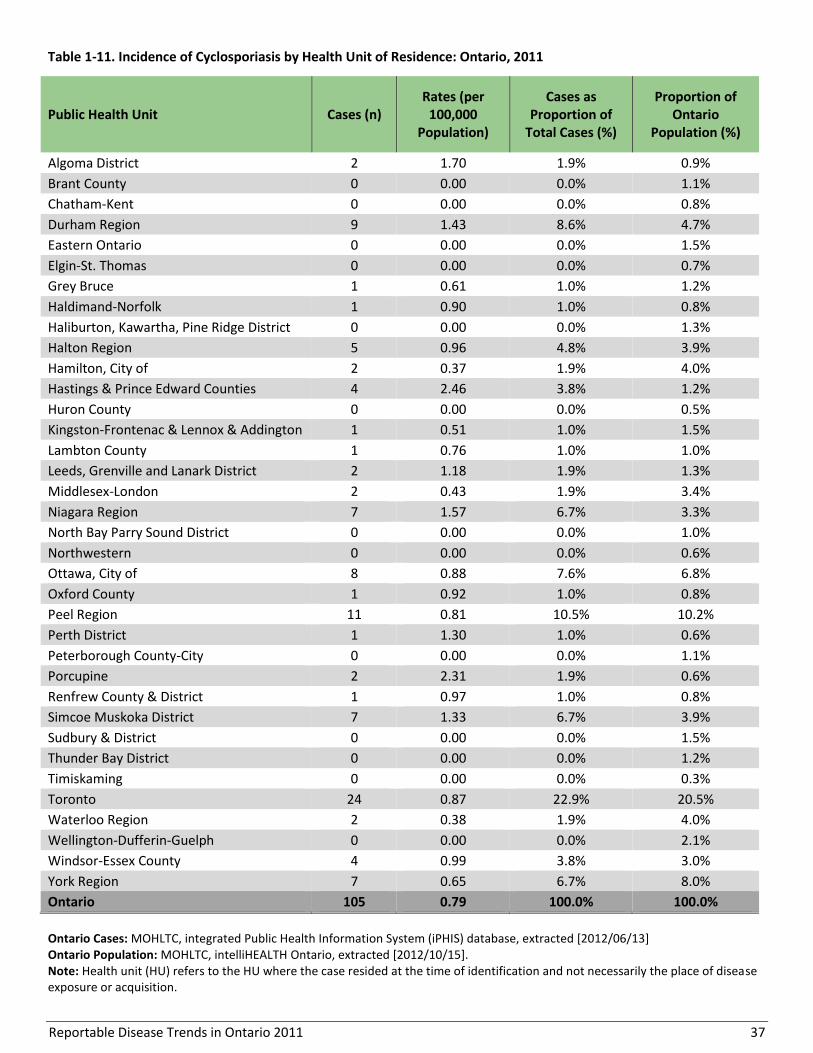
Reportable Disease Trends in Ontario 2011 37
Table 1-11. Incidence of Cyclosporiasis by Health Unit of Residence: Ontario, 2011
Public Health Unit Cases (n) Rates (per
100,000 Population)
Cases as Proportion of
Total Cases (%)
Proportion of Ontario
Population (%)
Algoma District 2 1.70 1.9% 0.9%
Brant County 0 0.00 0.0% 1.1%
Chatham-Kent 0 0.00 0.0% 0.8%
Durham Region 9 1.43 8.6% 4.7%
Eastern Ontario 0 0.00 0.0% 1.5%
Elgin-St. Thomas 0 0.00 0.0% 0.7%
Grey Bruce 1 0.61 1.0% 1.2%
Haldimand-Norfolk 1 0.90 1.0% 0.8%
Haliburton, Kawartha, Pine Ridge District 0 0.00 0.0% 1.3%
Halton Region 5 0.96 4.8% 3.9%
Hamilton, City of 2 0.37 1.9% 4.0%
Hastings & Prince Edward Counties 4 2.46 3.8% 1.2%
Huron County 0 0.00 0.0% 0.5%
Kingston-Frontenac & Lennox & Addington 1 0.51 1.0% 1.5%
Lambton County 1 0.76 1.0% 1.0%
Leeds, Grenville and Lanark District 2 1.18 1.9% 1.3%
Middlesex-London 2 0.43 1.9% 3.4%
Niagara Region 7 1.57 6.7% 3.3%
North Bay Parry Sound District 0 0.00 0.0% 1.0%
Northwestern 0 0.00 0.0% 0.6%
Ottawa, City of 8 0.88 7.6% 6.8%
Oxford County 1 0.92 1.0% 0.8%
Peel Region 11 0.81 10.5% 10.2%
Perth District 1 1.30 1.0% 0.6%
Peterborough County-City 0 0.00 0.0% 1.1%
Porcupine 2 2.31 1.9% 0.6%
Renfrew County & District 1 0.97 1.0% 0.8%
Simcoe Muskoka District 7 1.33 6.7% 3.9%
Sudbury & District 0 0.00 0.0% 1.5%
Thunder Bay District 0 0.00 0.0% 1.2%
Timiskaming 0 0.00 0.0% 0.3%
Toronto 24 0.87 22.9% 20.5%
Waterloo Region 2 0.38 1.9% 4.0%
Wellington-Dufferin-Guelph 0 0.00 0.0% 2.1%
Windsor-Essex County 4 0.99 3.8% 3.0%
York Region 7 0.65 6.7% 8.0%
Ontario 105 0.79 100.0% 100.0%
Ontario Cases: MOHLTC, integrated Public Health Information System (iPHIS) database, extracted [2012/06/13] Ontario Population: MOHLTC, intelliHEALTH Ontario, extracted [2012/10/15]. Note: Health unit (HU) refers to the HU where the case resided at the time of identification and not necessarily the place of disease exposure or acquisition.
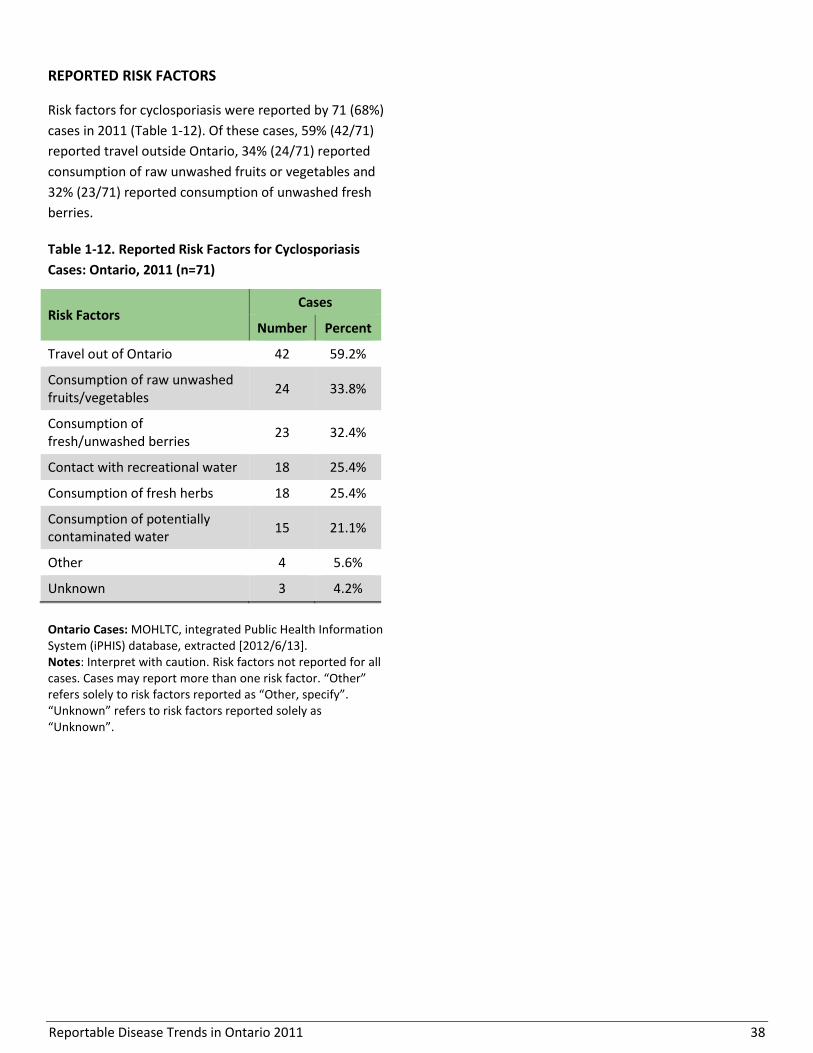
Reportable Disease Trends in Ontario 2011 38
REPORTED RISK FACTORS
Risk factors for cyclosporiasis were reported by 71 (68%)
cases in 2011 (Table 1-12). Of these cases, 59% (42/71)
reported travel outside Ontario, 34% (24/71) reported
consumption of raw unwashed fruits or vegetables and
32% (23/71) reported consumption of unwashed fresh
berries.
Table 1-12. Reported Risk Factors for Cyclosporiasis
Cases: Ontario, 2011 (n=71)
Risk Factors Cases
Number Percent
Travel out of Ontario 42 59.2%
Consumption of raw unwashed fruits/vegetables
24 33.8%
Consumption of fresh/unwashed berries
23 32.4%
Contact with recreational water 18 25.4%
Consumption of fresh herbs 18 25.4%
Consumption of potentially contaminated water
15 21.1%
Other 4 5.6%
Unknown 3 4.2%
Ontario Cases: MOHLTC, integrated Public Health Information System (iPHIS) database, extracted [2012/6/13]. Notes: Interpret with caution. Risk factors not reported for all cases. Cases may report more than one risk factor. “Other” refers solely to risk factors reported as “Other, specify”. “Unknown” refers to risk factors reported solely as “Unknown”.
Reportable Disease Trends in Ontario 2011 39
Giardiasis
The incidence rate of giardiasis in Ontario
declined steadily over the period from 2002 to
2011.
Young children and males between the ages of
20 and 49 years had the highest incidence
rates of giardiasis in 2011.
In Ontario, the incidence of giardiasis peaks
during the late summer and early fall.
Out of province travel, water-borne exposures
and animal contact were the most commonly
reported risk factors among giardiasis cases
reported in 2011.
Giardiasis is a diarrheal illness caused by the parasite
Giardia lamblia.13 It is the third most frequently
reported enteric disease in Ontario and the most
common intestinal parasitic infection of humans
globally.13 Giardiasis is transmitted through a variety of
routes, but most commonly through person-to-person
contact that results from hand-to-mouth transfer of
Giardia cysts contained in the feces of infected persons.
Transmission may also occur through the ingestion of
cysts in fecally contaminated food and drinking and
recreational water, as well as sexually through the anal-
oral route.1
Giardiasis infections are frequently self-limited,
primarily affecting the small intestine. Symptoms
generally appear three to 25 days after exposure
(median seven to ten days) and may include chronic
diarrhea, bloating and abdominal cramps, fatigue,
weight loss, dehydration and frequent loose pale greasy
stools. Prolonged infections can lead to arthritis and
damage to the intestinal tract.1 Many persons infected
with giardiasis do not show any symptoms of illness.1,14
In North America, endemic cases (locally acquired) tend
to occur in late summer with children under the age of
five years and adults aged 25 to 39 years having the
greatest risk of infection. Outbreaks of giardiasis have
been associated with childcare settings, recreational
water use (swimming and wading pools) and
consumption of unfiltered drinking water.1
2011 IN FOCUS AND HISTORICAL HIGHLIGHTS
In 2011, giardiasis accounted for 14% of enteric disease
cases reported in Ontario. A total of 1,295 cases were
reported for an annual incidence rate of 9.68 cases per
100,000 population (Figure 1-16). The number of
reported cases of giardiasis in 2011 represented a
decline of eight percent in comparison to the 2010 total
of 1,409 cases.
Over the ten-year period from 2002-2011, the incidence
rate of giardiasis declined by 39% from a high of 15.91
cases per 100,000 population in 2002 to a low of 9.68
cases per 100,000 population in 2011.
From 2002 to 2008, annual incidence rates for giardiasis
in Canada were comparable to those of Ontario (Figure
1-16).
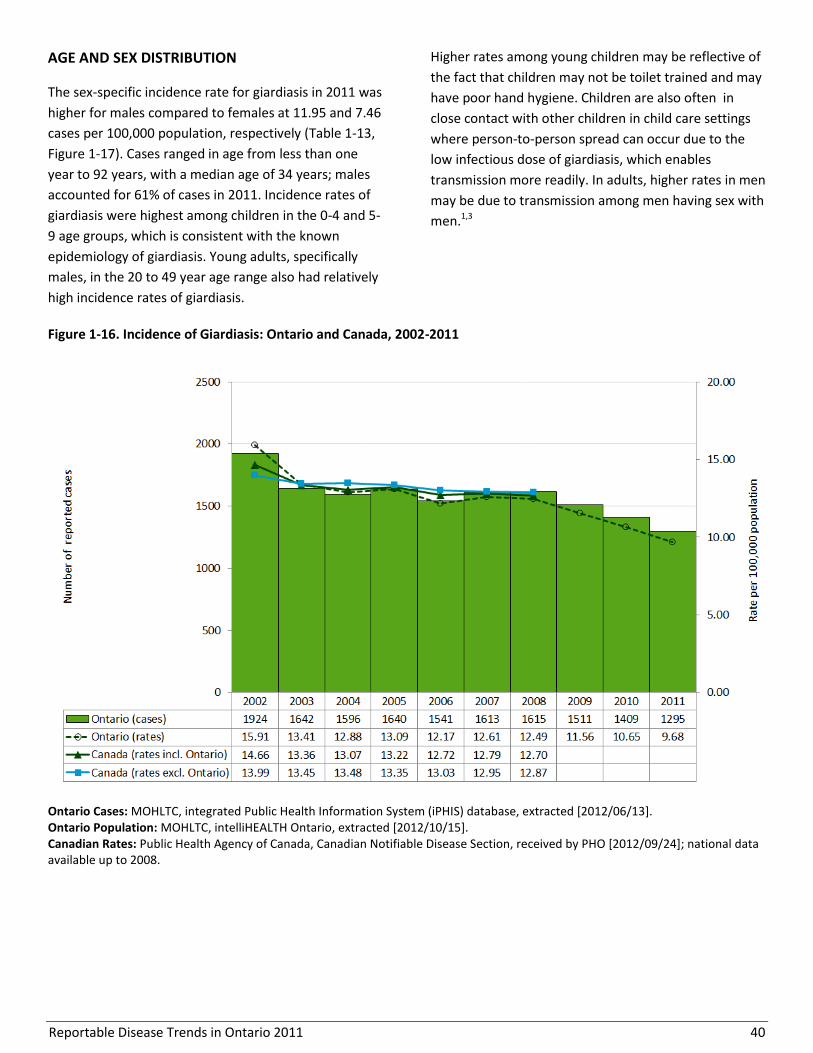
Reportable Disease Trends in Ontario 2011 40
AGE AND SEX DISTRIBUTION
The sex-specific incidence rate for giardiasis in 2011 was
higher for males compared to females at 11.95 and 7.46
cases per 100,000 population, respectively (Table 1-13,
Figure 1-17). Cases ranged in age from less than one
year to 92 years, with a median age of 34 years; males
accounted for 61% of cases in 2011. Incidence rates of
giardiasis were highest among children in the 0-4 and 5-
9 age groups, which is consistent with the known
epidemiology of giardiasis. Young adults, specifically
males, in the 20 to 49 year age range also had relatively
high incidence rates of giardiasis.
Higher rates among young children may be reflective of
the fact that children may not be toilet trained and may
have poor hand hygiene. Children are also often in
close contact with other children in child care settings
where person-to-person spread can occur due to the
low infectious dose of giardiasis, which enables
transmission more readily. In adults, higher rates in men
may be due to transmission among men having sex with
men.1,3
Figure 1-16. Incidence of Giardiasis: Ontario and Canada, 2002-2011
Ontario Cases: MOHLTC, integrated Public Health Information System (iPHIS) database, extracted [2012/06/13]. Ontario Population: MOHLTC, intelliHEALTH Ontario, extracted [2012/10/15]. Canadian Rates: Public Health Agency of Canada, Canadian Notifiable Disease Section, received by PHO [2012/09/24]; national data available up to 2008.
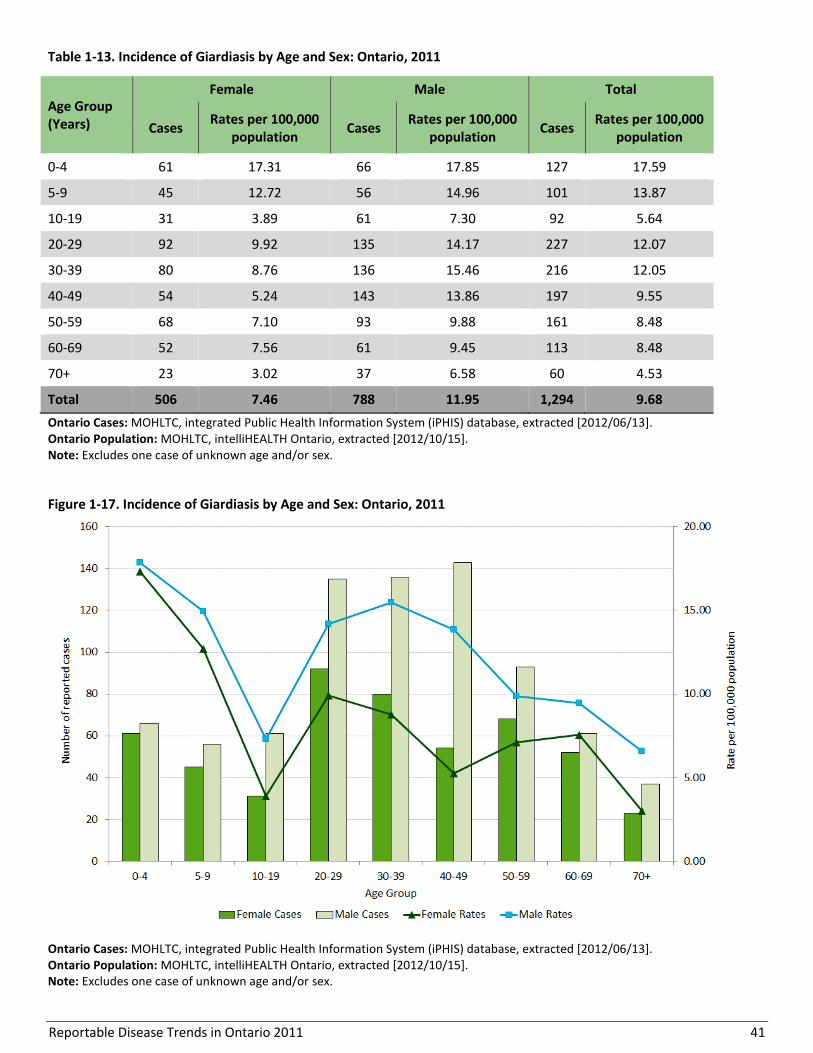
Reportable Disease Trends in Ontario 2011 41
Table 1-13. Incidence of Giardiasis by Age and Sex: Ontario, 2011
Age Group (Years)
Female Male Total
Cases Rates per 100,000
population Cases
Rates per 100,000 population
Cases Rates per 100,000
population
0-4 61 17.31 66 17.85 127 17.59
5-9 45 12.72 56 14.96 101 13.87
10-19 31 3.89 61 7.30 92 5.64
20-29 92 9.92 135 14.17 227 12.07
30-39 80 8.76 136 15.46 216 12.05
40-49 54 5.24 143 13.86 197 9.55
50-59 68 7.10 93 9.88 161 8.48
60-69 52 7.56 61 9.45 113 8.48
70+ 23 3.02 37 6.58 60 4.53
Total 506 7.46 788 11.95 1,294 9.68
Ontario Cases: MOHLTC, integrated Public Health Information System (iPHIS) database, extracted [2012/06/13]. Ontario Population: MOHLTC, intelliHEALTH Ontario, extracted [2012/10/15]. Note: Excludes one case of unknown age and/or sex.
Figure 1-17. Incidence of Giardiasis by Age and Sex: Ontario, 2011
Ontario Cases: MOHLTC, integrated Public Health Information System (iPHIS) database, extracted [2012/06/13]. Ontario Population: MOHLTC, intelliHEALTH Ontario, extracted [2012/10/15]. Note: Excludes one case of unknown age and/or sex.

Reportable Disease Trends in Ontario 2011 42
HOSPITALIZATIONS AND DEATHS
In 2011, approximately two percent (19/1,295) of
giardiasis cases were hospitalized. None of the cases
reported in 2011 were fatal.
MONTHLY DISTRIBUTION
Giardiasis occurs throughout the year, but tends to
follow a seasonal pattern with increased incidence
towards the end of summer and early fall (Figure 1-18).
In 2011, the incidence of giardiasis peaked in July and
August. Compared to the monthly five-year historical
averages, fewer cases of giardiasis were reported 2011.
GEOGRAPHIC DISTRIBUTION
The City of Ottawa reported the highest incidence rate
of giardiasis in Ontario in 2011, with 17.4 cases per
100,000. Toronto reported the highest number of cases
(368) in 2011 and the second highest incidence rate at
13.4 cases per 100,000 population (Map 1-5, Table 1-
14).
Figure 1-18. Number of Giardiasis Cases by Month in Ontario in 2011 and Average Number of Cases from 2006-2010
Ontario Cases: MOHLTC, integrated Public Health Information System (iPHIS) database, extracted [2012/06/13].
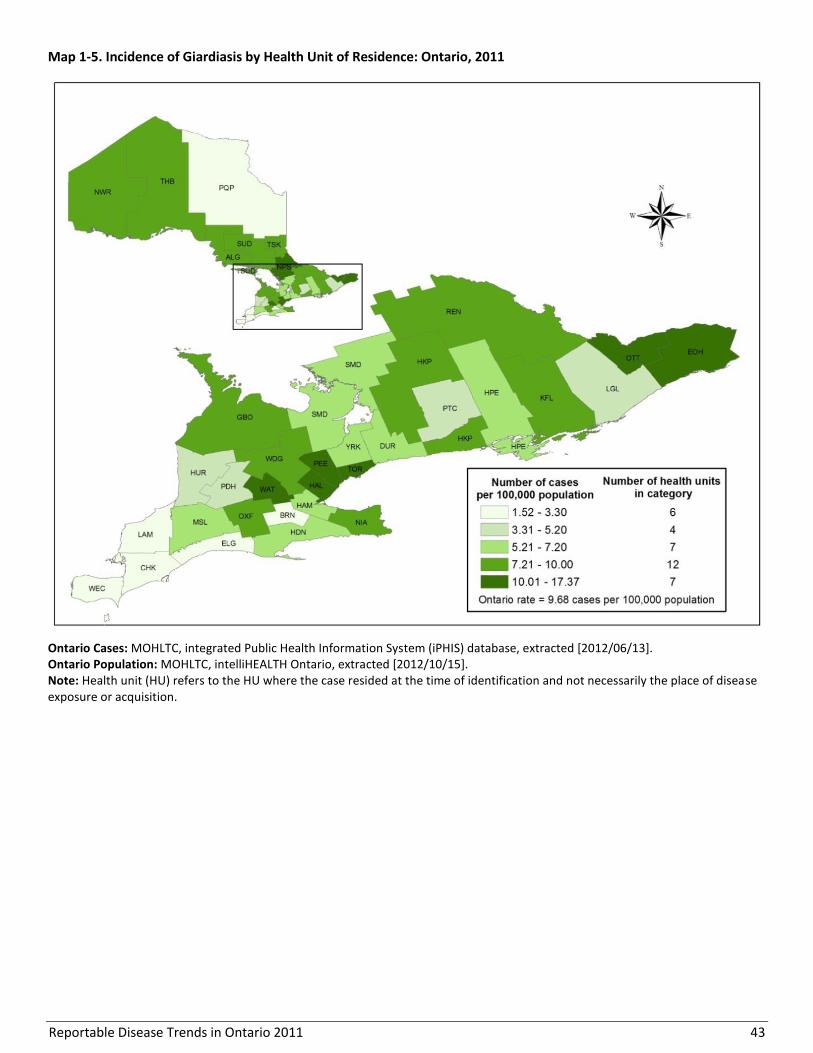
Reportable Disease Trends in Ontario 2011 43
Map 1-5. Incidence of Giardiasis by Health Unit of Residence: Ontario, 2011
Ontario Cases: MOHLTC, integrated Public Health Information System (iPHIS) database, extracted [2012/06/13]. Ontario Population: MOHLTC, intelliHEALTH Ontario, extracted [2012/10/15]. Note: Health unit (HU) refers to the HU where the case resided at the time of identification and not necessarily the place of disease exposure or acquisition.

Reportable Disease Trends in Ontario 2011 44
Table 1-14. Incidence of Giardiasis by Health Unit of Residence: Ontario, 2011
Public Health Unit Cases (n) Rates (per
100,000 Population)
Cases as Proportion of
Total Cases (%)
Proportion of Ontario
Population (%)
Algoma District 10 8.49 0.8% 0.9%
Brant County 3 2.13 0.2% 1.1%
Chatham-Kent 3 2.76 0.2% 0.8%
Durham Region 39 6.18 3.0% 4.7%
Eastern Ontario 21 10.44 1.6% 1.5%
Elgin-St. Thomas 3 3.28 0.2% 0.7%
Grey Bruce 15 9.10 1.2% 1.2%
Haldimand-Norfolk 7 6.32 0.5% 0.8%
Haliburton, Kawartha, Pine Ridge District 14 7.82 1.1% 1.3%
Halton Region 62 11.95 4.8% 3.9%
Hamilton, City of 35 6.48 2.7% 4.0%
Hastings & Prince Edward Counties 11 6.76 0.8% 1.2%
Huron County 2 3.31 0.2% 0.5%
Kingston-Frontenac & Lennox & Addington 17 8.61 1.3% 1.5%
Lambton County 2 1.52 0.2% 1.0%
Leeds, Grenville and Lanark District 8 4.70 0.6% 1.3%
Middlesex-London 32 6.94 2.5% 3.4%
Niagara Region 37 8.31 2.9% 3.3%
North Bay Parry Sound District 13 10.21 1.0% 1.0%
Northwestern 7 8.54 0.5% 0.6%
Ottawa, City of 158 17.37 12.2% 6.8%
Oxford County 9 8.32 0.7% 0.8%
Peel Region 160 11.71 12.4% 10.2%
Perth District 4 5.19 0.3% 0.6%
Peterborough County-City 6 4.27 0.5% 1.1%
Porcupine 2 2.31 0.2% 0.6%
Renfrew County & District 9 8.74 0.7% 0.8%
Simcoe Muskoka District 33 6.28 2.5% 3.9%
Sudbury & District 17 8.60 1.3% 1.5%
Thunder Bay District 13 8.30 1.0% 1.2%
Timiskaming 3 8.71 0.2% 0.3%
Toronto 368 13.41 28.4% 20.5%
Waterloo Region 60 11.32 4.6% 4.0%
Wellington-Dufferin-Guelph 22 7.90 1.7% 2.1%
Windsor-Essex County 13 3.22 1.0% 3.0%
York Region 77 7.20 5.9% 8.0%
Ontario 1,295 9.68 100.0% 100.0%
Ontario Cases: MOHLTC, integrated Public Health Information System (iPHIS) database, extracted [2012/06/13] Ontario Population: MOHLTC, intelliHEALTH Ontario, extracted [2012/10/15]. Note: Health unit (HU) refers to the HU where the case resided at the time of identification and not necessarily the place of disease exposure or acquisition.
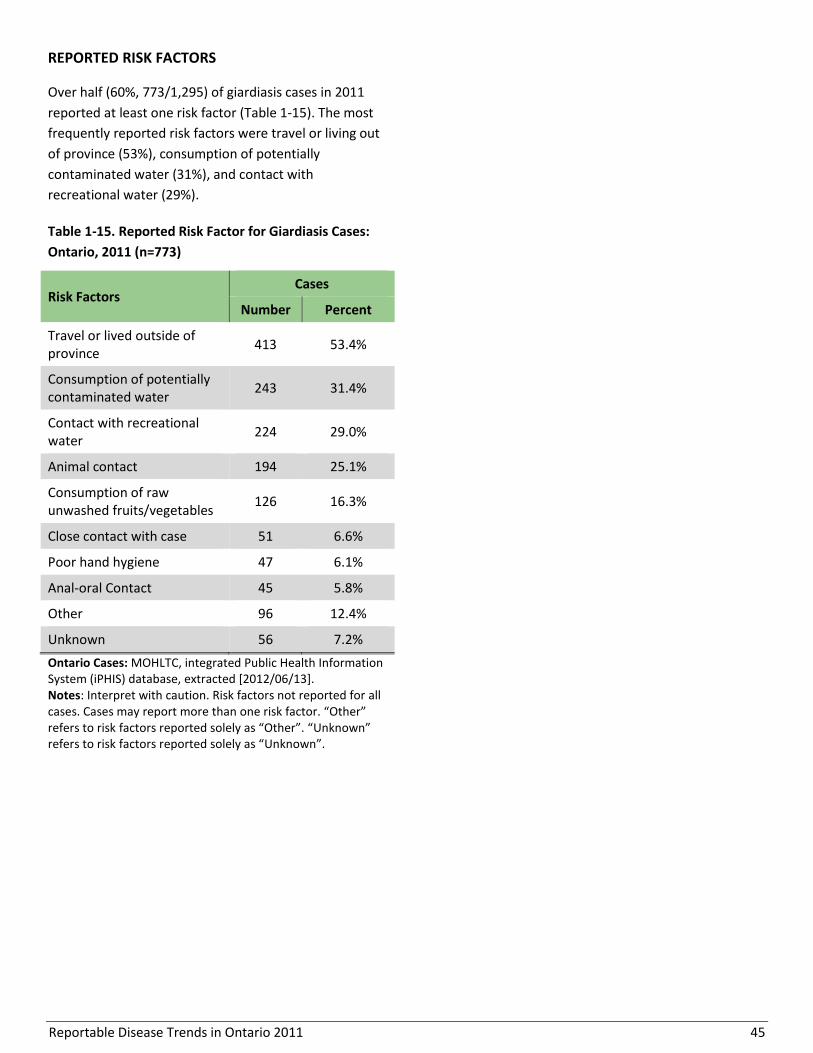
Reportable Disease Trends in Ontario 2011 45
REPORTED RISK FACTORS
Over half (60%, 773/1,295) of giardiasis cases in 2011
reported at least one risk factor (Table 1-15). The most
frequently reported risk factors were travel or living out
of province (53%), consumption of potentially
contaminated water (31%), and contact with
recreational water (29%).
Table 1-15. Reported Risk Factor for Giardiasis Cases:
Ontario, 2011 (n=773)
Risk Factors Cases
Number Percent
Travel or lived outside of province
413 53.4%
Consumption of potentially contaminated water
243 31.4%
Contact with recreational water
224 29.0%
Animal contact 194 25.1%
Consumption of raw unwashed fruits/vegetables
126 16.3%
Close contact with case 51 6.6%
Poor hand hygiene 47 6.1%
Anal-oral Contact 45 5.8%
Other 96 12.4%
Unknown 56 7.2%
Ontario Cases: MOHLTC, integrated Public Health Information System (iPHIS) database, extracted [2012/06/13]. Notes: Interpret with caution. Risk factors not reported for all cases. Cases may report more than one risk factor. “Other” refers to risk factors reported solely as “Other”. “Unknown” refers to risk factors reported solely as “Unknown”.
Reportable Disease Trends in Ontario 2011 46
Hantavirus Pulmonary Syndrome
Hantavirus pulmonary syndrome (HPS) is a rare but
serious viral infection.1 In North America, the main
reservoir of Hantavirus is the deer mouse, which is
often found in buildings and barns in rural areas.1
Transmission of HPS is primarily through inhalation of
aerosolized rodent saliva, droppings and/or urine that
contains live virus. Bites from infected rodents and
direct contact between broken skin and rodent excreta
are other routes by which HPS can be contracted.13
Onset of symptoms is usually two weeks after exposure
but can range from a few days and up to six weeks.
Symptoms of HPS initially present as a flu-like illness
with some gastrointestinal involvement that progresses
to respiratory tract symptoms after five days. The
respiratory stage of illness is characterized by
shortness of breath, fluid in the lungs and rapid
deterioration of cardiopulmonary functions.1,13 The
crude fatality rate following infection ranges from 30 to
40%.13
Rural dwellers, campers, cottagers and anyone that
comes into contact with the saliva, droppings and urine
of infected rodents are at risk for HPS. As a result,
rodent control in and around the home is the most
effective preventive strategy against hantavirus
infection.1 The use of face masks and gloves when
cleaning up rodent droppings also protects against
exposure to HPS.
2011 IN FOCUS AND HISTORICAL HIGHLIGHTS
No human cases of HPS have been reported in Ontario
since the disease became reportable in 2001. However,
HPS has been identified in mice and meadow voles in
Ontario.15 In Canada, human cases of HPS occur
infrequently with annual incidence rates for the years
2002 to 2008 ranging from 0.01 to 0.02 cases per
100,000 population.

Reportable Disease Trends in Ontario 2011 47
Hepatitis A
The incidence rate and number of reported
cases of Hepatitis A in Ontario in 2011 were at
their lowest for the period 2002 to 2011.
Children and young adults in the age groups
from five to 29 years accounted for the highest
incidence rates of Hepatitis A in 2011.
Out of province travel was the most
frequently reported risk factor among
Hepatitis A cases in Ontario in 2011.
Hepatitis A occurs worldwide but mostly in developing
countries with poor sanitary and hygienic conditions.1
The disease is caused by the Hepatitis A virus and is
mainly transmitted from person-to-person through the
fecal-oral route. Infections usually occur following
ingestion of food or water that has been contaminated
by the feces of infected persons. Shellfish that has been
harvested from contaminated water sources, produce
such as berries that has been irrigated with
contaminated water, and foods that have been handled
by infected food handlers are commonly identified
sources of Hepatitis A infections.1
On average, symptoms of Hepatitis A develop 28 to 30
days after exposure, but can occur from 15 to 50 days.
Fever, nausea, malaise, anorexia, abdominal discomfort
and loss of appetite are the usual symptoms of infection
with Hepatitis A. Jaundice may also occur after a few
days. Not everyone infected with Hepatitis A will have
symptoms. Among those that become ill, symptoms
range from mild to severe, depending on age and
overall health status.1 Complications following infection
are rare and death among cases is low, ranging from 0.1
to 0.3%.1 Travelers to endemic areas, men who have sex
with men, sexual contacts of cases, injection drug users
and children in daycare settings are at higher risk for
infection.1 A Hepatitis A vaccine is recommended for
travelers to endemic areas and other high risk
persons.16 It is also offered free of cost to Ontario
residents who have been exposed to the virus.
2011 IN FOCUS AND HISTORICAL HIGHLIGHTS
In 2011, a total of 103 cases of Hepatitis A were
reported in Ontario, representing an incidence rate of
0.77 cases per 100,000 population (Figure 1-19). This is
the lowest incidence rate and number of cases reported
since 2002 when 151 cases were reported for an
incidence rate of 1.25 cases per 100,000 population.
The incidence rate of Hepatitis A declined by 38% in
2011 compared to 2002. No outbreaks of Hepatitis A
were reported in 2011.
The incidence rates for Hepatitis A in Ontario fluctuated
over the period from 2002 to 2011 with rates ranging
from 0.77 cases per 100,000 population in 2011 to 1.63
cases per 100,000 population in 2006.
Annual incidence rates of Hepatitis A in Ontario were
comparable to those of Canada for the period 2002 to
2008 (Figure 1-19).
AGE AND SEX DISTRIBUTION
In 2011, males comprised more than half (57%, 57/103)
of all cases of Hepatitis A reported in Ontario (Table 1-
16, Figure 1-20). The sex-specific incidence rate for
Hepatitis A was also higher for males compared to
females at 0.86 and 0.68 cases per 100,000 population,
respectively. Hepatitis A cases ranged in age from less
than one year to 87 years. Children in the 5-9 and 10-19
age groups and young adults in the 20-29 age group
accounted for the highest incidence rates with rates
ranging from 1.44 to 1.65 cases per 100,000 population.
After age 29 years, the incidence of Hepatitis A
decreased sharply and rates ranged from 0.29 to 0.56
cases per 100,000 population. This trend of higher rates
among children and young adults is consistent with the
known age distribution of Hepatitis A in industrialized
countries such as Canada.1 There is also evidence of
higher rates of hepatitis A among men who have sex
with men which may partially explain the higher rates
among males compared to females.17

Reportable Disease Trends in Ontario 2011 48
Figure 1-19. Incidence of Hepatitis A: Ontario and Canada, 2002-2011
Ontario Cases: MOHLTC, integrated Public Health Information System (iPHIS) database, extracted [2012/06/13]. Ontario Population: MOHLTC, intelliHEALTH Ontario, extracted [2012/10/15]. Canadian Rates: Public Health Agency of Canada, Canadian Notifiable Disease Section, received by PHO [2012/09/24]; national data available up to 2008.
Table 1-16. Incidence of Hepatitis A by Age and Sex: Ontario, 2011
Age Group (Years)
Female Male Total
Cases Rates per 100,000
population Cases
Rates per 100,000 population
Cases Rates per 100,000
population
0-4 1 0.28 5 1.35 6 0.83
5-9 6 1.70 6 1.60 12 1.65
10-19 14 1.76 12 1.44 26 1.59
20-29 13 1.40 14 1.47 27 1.44
30-39 4 0.44 6 0.68 10 0.56
40-49 3 0.29 3 0.29 6 0.29
50-59 1 0.10 5 0.53 6 0.32
60-69 0 0.00 4 0.62 4 0.30
70+ 4 0.53 2 0.36 6 0.45
Total 46 0.68 57 0.86 103 0.77
Ontario Cases: MOHLTC, integrated Public Health Information System (iPHIS) database, extracted [2012/06/13]. Ontario Population: MOHLTC, intelliHEALTH Ontario, extracted [2012/10/15].
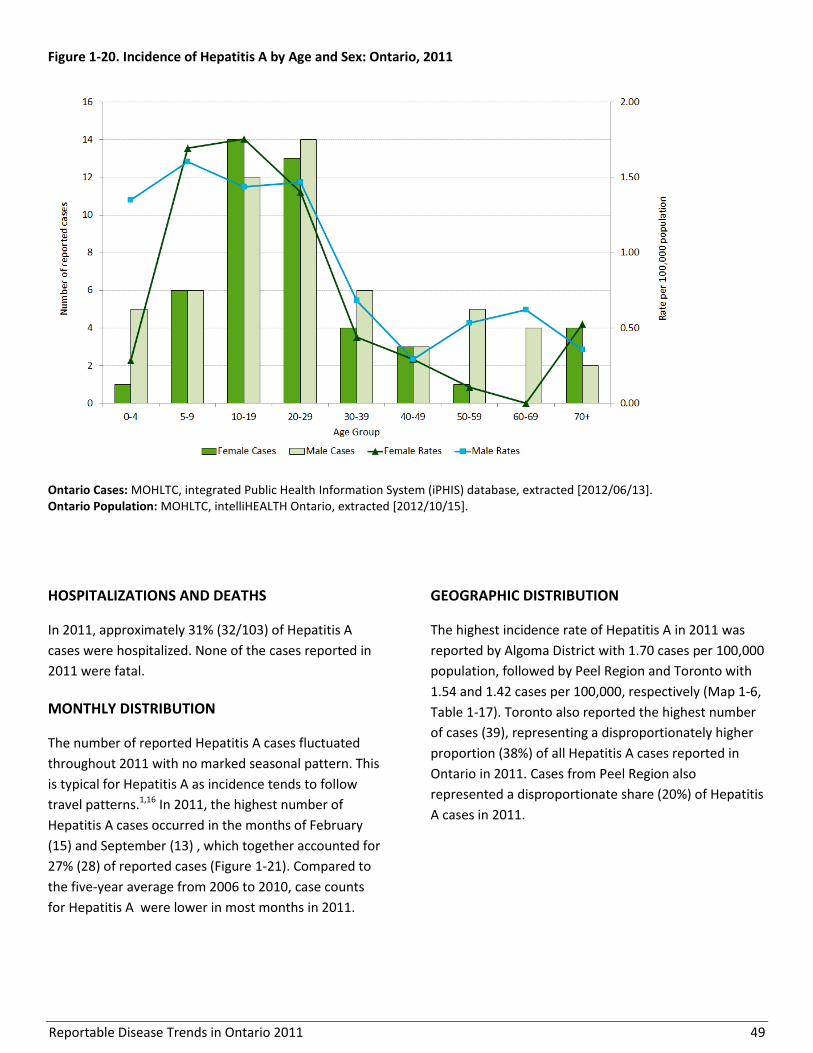
Reportable Disease Trends in Ontario 2011 49
Figure 1-20. Incidence of Hepatitis A by Age and Sex: Ontario, 2011
Ontario Cases: MOHLTC, integrated Public Health Information System (iPHIS) database, extracted [2012/06/13]. Ontario Population: MOHLTC, intelliHEALTH Ontario, extracted [2012/10/15].
HOSPITALIZATIONS AND DEATHS
In 2011, approximately 31% (32/103) of Hepatitis A
cases were hospitalized. None of the cases reported in
2011 were fatal.
MONTHLY DISTRIBUTION
The number of reported Hepatitis A cases fluctuated
throughout 2011 with no marked seasonal pattern. This
is typical for Hepatitis A as incidence tends to follow
travel patterns.1,16 In 2011, the highest number of
Hepatitis A cases occurred in the months of February
(15) and September (13) , which together accounted for
27% (28) of reported cases (Figure 1-21). Compared to
the five-year average from 2006 to 2010, case counts
for Hepatitis A were lower in most months in 2011.
GEOGRAPHIC DISTRIBUTION
The highest incidence rate of Hepatitis A in 2011 was
reported by Algoma District with 1.70 cases per 100,000
population, followed by Peel Region and Toronto with
1.54 and 1.42 cases per 100,000, respectively (Map 1-6,
Table 1-17). Toronto also reported the highest number
of cases (39), representing a disproportionately higher
proportion (38%) of all Hepatitis A cases reported in
Ontario in 2011. Cases from Peel Region also
represented a disproportionate share (20%) of Hepatitis
A cases in 2011.
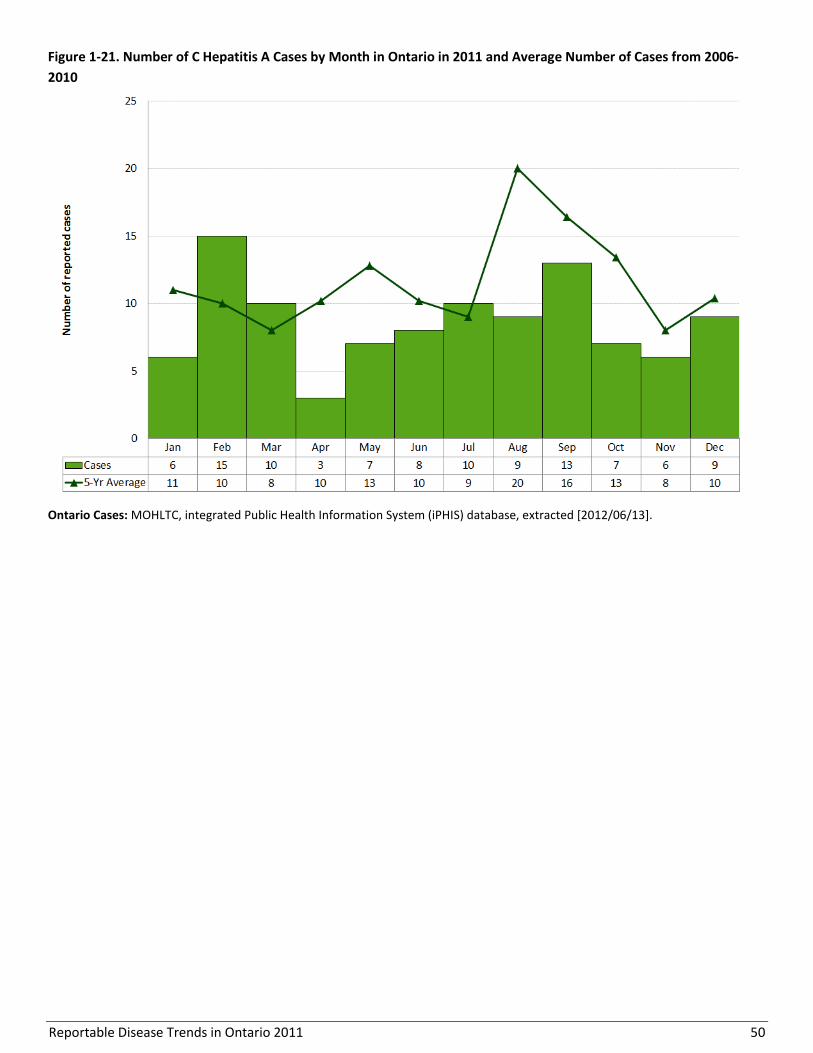
Reportable Disease Trends in Ontario 2011 50
Figure 1-21. Number of C Hepatitis A Cases by Month in Ontario in 2011 and Average Number of Cases from 2006-
2010
Ontario Cases: MOHLTC, integrated Public Health Information System (iPHIS) database, extracted [2012/06/13].
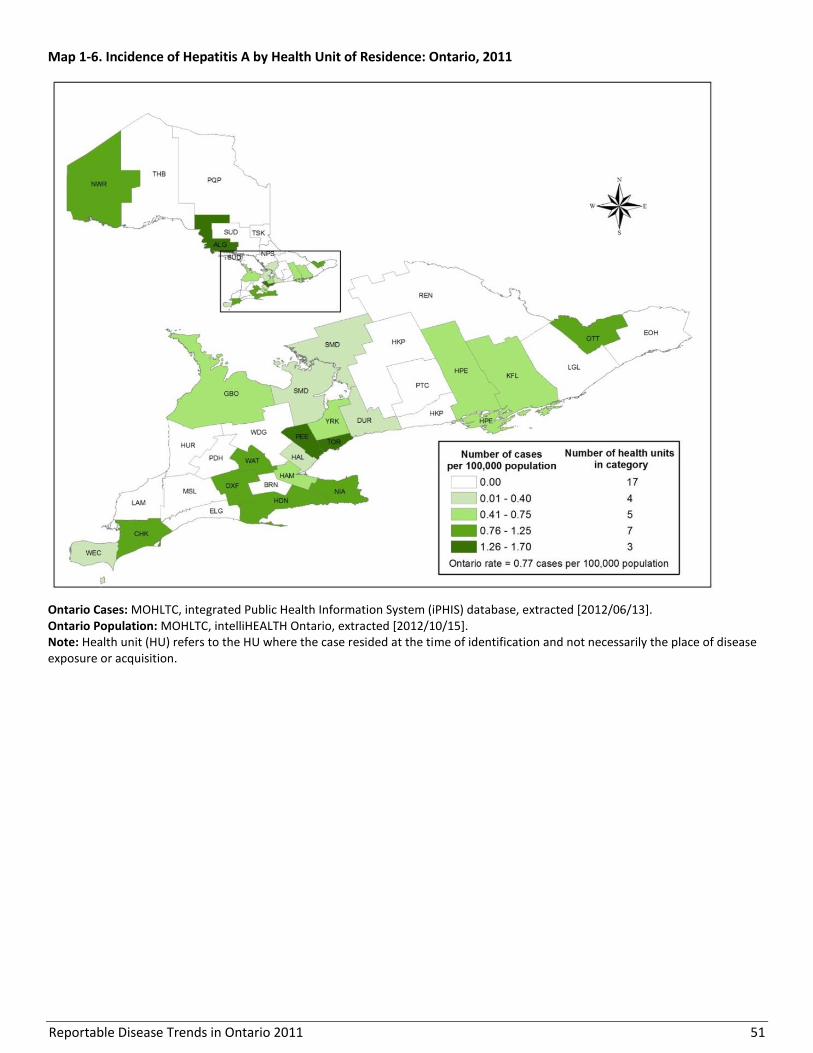
Reportable Disease Trends in Ontario 2011 51
Map 1-6. Incidence of Hepatitis A by Health Unit of Residence: Ontario, 2011
Ontario Cases: MOHLTC, integrated Public Health Information System (iPHIS) database, extracted [2012/06/13]. Ontario Population: MOHLTC, intelliHEALTH Ontario, extracted [2012/10/15]. Note: Health unit (HU) refers to the HU where the case resided at the time of identification and not necessarily the place of disease exposure or acquisition.

Reportable Disease Trends in Ontario 2011 52
Table 1-17. Incidence of Hepatitis A by Health Unit of Residence: Ontario, 2011
Public Health Unit Cases (n) Rates (per 100,000
Population)
Cases as Proportion of
Total Cases (%)
Proportion of Ontario
Population (%)
Algoma District 2 1.70 1.9% 0.9%
Brant County 0 0.00 0.0% 1.1%
Chatham-Kent 1 0.92 1.0% 0.8%
Durham Region 2 0.32 1.9% 4.7%
Eastern Ontario 0 0.00 0.0% 1.5%
Elgin-St. Thomas 0 0.00 0.0% 0.7%
Grey Bruce 1 0.61 1.0% 1.2%
Haldimand-Norfolk 1 0.90 1.0% 0.8%
Haliburton, Kawartha, Pine Ridge District 0 0.00 0.0% 1.3%
Halton Region 1 0.19 1.0% 3.9%
Hamilton, City of 4 0.74 3.9% 4.0%
Hastings & Prince Edward Counties 1 0.61 1.0% 1.2%
Huron County 0 0.00 0.0% 0.5%
Kingston-Frontenac & Lennox & Addington 1 0.51 1.0% 1.5%
Lambton County 0 0.00 0.0% 1.0%
Leeds, Grenville and Lanark District 0 0.00 0.0% 1.3%
Middlesex-London 0 0.00 0.0% 3.4%
Niagara Region 4 0.90 3.9% 3.3%
North Bay Parry Sound District 0 0.00 0.0% 1.0%
Northwestern 1 1.22 1.0% 0.6%
Ottawa, City of 9 0.99 8.7% 6.8%
Oxford County 1 0.92 1.0% 0.8%
Peel Region 21 1.54 20.4% 10.2%
Perth District 0 0.00 0.0% 0.6%
Peterborough County-City 0 0.00 0.0% 1.1%
Porcupine 0 0.00 0.0% 0.6%
Renfrew County & District 0 0.00 0.0% 0.8%
Simcoe Muskoka District 2 0.38 1.9% 3.9%
Sudbury & District 0 0.00 0.0% 1.5%
Thunder Bay District 0 0.00 0.0% 1.2%
Timiskaming 0 0.00 0.0% 0.3%
Toronto 39 1.42 37.9% 20.5%
Waterloo Region 5 0.94 4.9% 4.0%
Wellington-Dufferin-Guelph 0 0.00 0.0% 2.1%
Windsor-Essex County 1 0.25 1.0% 3.0%
York Region 6 0.56 5.8% 8.0%
Ontario 103 0.77 100.0% 100.0%
Ontario Cases: MOHLTC, integrated Public Health Information System (iPHIS) database, extracted [2012/06/13]. Ontario Population: MOHLTC, intelliHEALTH Ontario, extracted [2012/10/15]. Note: Health unit (HU) refers to the HU where the case resided at the time of identification and not necessarily the place of disease exposure or acquisition.
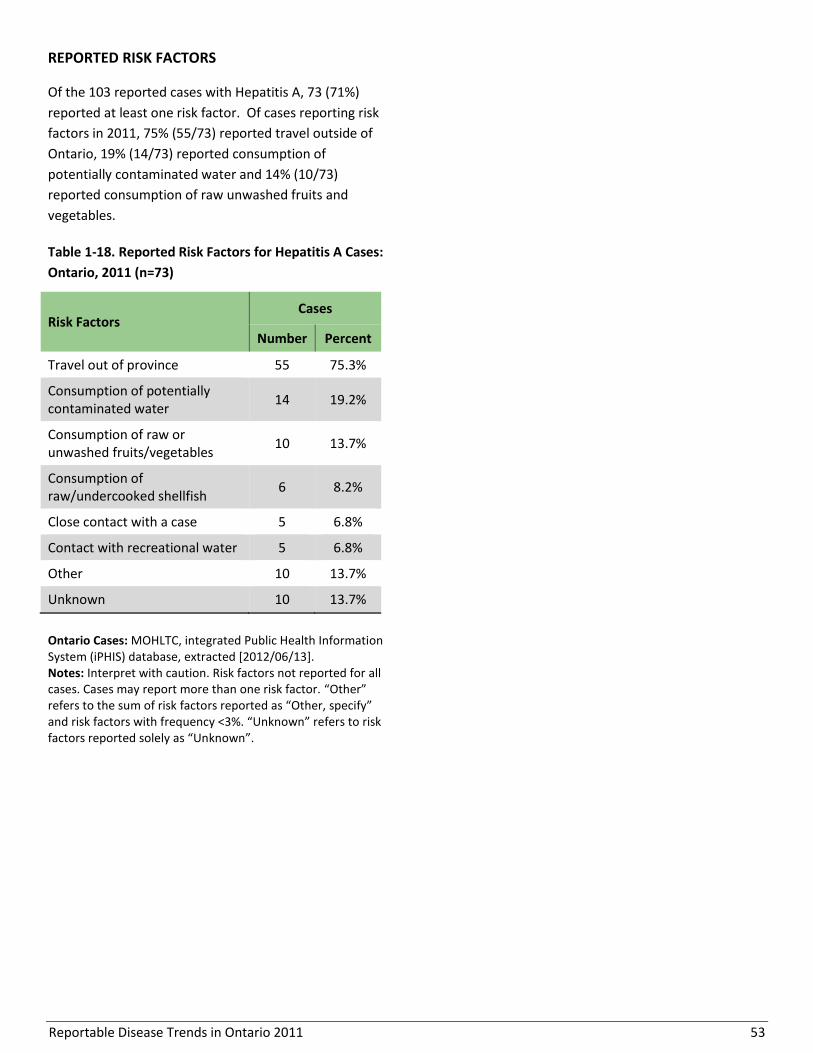
Reportable Disease Trends in Ontario 2011 53
REPORTED RISK FACTORS
Of the 103 reported cases with Hepatitis A, 73 (71%)
reported at least one risk factor. Of cases reporting risk
factors in 2011, 75% (55/73) reported travel outside of
Ontario, 19% (14/73) reported consumption of
potentially contaminated water and 14% (10/73)
reported consumption of raw unwashed fruits and
vegetables.
Table 1-18. Reported Risk Factors for Hepatitis A Cases:
Ontario, 2011 (n=73)
Risk Factors Cases
Number Percent
Travel out of province 55 75.3%
Consumption of potentially contaminated water
14 19.2%
Consumption of raw or unwashed fruits/vegetables
10 13.7%
Consumption of raw/undercooked shellfish
6 8.2%
Close contact with a case 5 6.8%
Contact with recreational water 5 6.8%
Other 10 13.7%
Unknown 10 13.7%
Ontario Cases: MOHLTC, integrated Public Health Information System (iPHIS) database, extracted [2012/06/13]. Notes: Interpret with caution. Risk factors not reported for all cases. Cases may report more than one risk factor. “Other” refers to the sum of risk factors reported as “Other, specify” and risk factors with frequency <3%. “Unknown” refers to risk factors reported solely as “Unknown”.

Reportable Disease Trends in Ontario 2011 54
Listeriosis
Since 2009, the incidence of listeriosis has
increased by approximately 50%.
Adults aged 60 years and older accounted for
75% of listeriosis cases reported in 2011.
Cases 60 years or older represented 76% of
hospitalized individuals in 2011 and 83% of
deaths reported in 2011.
Ninety-three percent of cases reported either
being immunocompromised or having a
chronic/underlying medical condition.
Listeriosis is a serious but rare infection caused by the
bacterium Listeria monocytogenes. Infections can be
asymptomatic (without symptoms), but can also be
invasive, affecting not just the intestinal tract.
Symptoms of listeriosis appear three to 70 days after
exposure (median of three weeks) and present as
muscle aches, fever, diarrhea, nausea and vomiting.
Complications such as meningitis and septicemia are
common in newborns, older adults and in persons with
other underlying health conditions. In pregnant women,
infection can lead to premature delivery, fetal infection,
stillbirth or spontaneous abortion.1 The case fatality
rate of listeriosis in adults is 30% but can be as high as
50% in newborns.1
Listeriosis is widespread in the environment. The main
route of transmission is foodborne- through the
ingestion of contaminated foods such as unpasteurized
milk, ready-to-eat meats, soft cheeses and vegetables.1
However, it can also be transmitted from mother to
child during pregnancy or birth. Infection can be
prevented by following safe food handling practices
such as avoiding soft cheeses, deli meats and
unpasteurized milk and milk products; washing fresh
produce using clean running water; and cooking meats
thoroughly. Frequent hand washing and proper
sanitizing of food contact surfaces also reduces the risk
of listeriosis.
2011 IN FOCUS AND HISTORICAL HIGHLIGHTS
Listeriosis accounted for less than one percent of
enteric disease cases reported in Ontario in 2011. In
2011, 57 cases were reported, representing an
incidence rate of 0.43 cases per 100,000 population
(Figure 1-22). The number of reported cases in 2011
also represented a five percent decline compared to the
2010 total of 60 cases. Overall, the incidence rate of
listeriosis increased by 19% from 0.36 cases per 100,000
population in 2002 to 0.43 cases per 100,000 population
in 2011. From 2002-2007, the incidence of listeriosis in
Ontario was relatively stable with an annual average of
40 cases. Following an outbreak in 2008, the incidence
of listeriosis remained elevated at approximately 60
cases per year. The 2008 outbreak was linked to ready-
to- eat deli meats and affected 56 persons in seven
provinces, 75% (42 cases) of which were in Ontario.18
Listeriosis became nationally notifiable in 2007, thus
trends in the annual incidence of listeriosis in Canada
are not defined in this report. National data are
available for 2007 and 2008 and show an increase over
this period which is due largely to the 2008 outbreak.
AGE AND SEX DISTRIBUTION
Males accounted for 42% (24) of listeriosis cases
reported in Ontario in 2011 and had a corresponding
incidence rate of 0.36 cases per 100,000 population.
Females accounted for 58% (33) of cases and had a
corresponding incidence rate of 0.49 cases per 100,000
population. Overall, listeriosis cases ranged in age from
<1 to 96 years, with a median age of 71 years.
Consistent with the epidemiology of listeriosis,1 the
incidence of listeriosis was relatively low in the age
groups under 60 years, with adults over 60 years
accounting for 75% of reported cases in 2011 (Table 1-
19, Figure 1-23).

Reportable Disease Trends in Ontario 2011 55
Figure 1-22. Incidence of Listeriosis: Ontario and Canada, 2002-2011
Ontario Cases: MOHLTC, integrated Public Health Information System (iPHIS) database, extracted [2012/06/13]. Ontario Population: MOHLTC, intelliHEALTH Ontario, extracted [2012/10/15]. Canadian Rates: Public Health Agency of Canada, Canadian Notifiable Disease Section, received by PHO [2012/09/24]; national data available from 2007 to 2008.
Table 1-19. Incidence of Listeriosis by Age and Sex: Ontario, 2011
Age Group (Years)
Female Male Total
Cases Rates per 100,000
population Cases
Rates per 100,000 population
Cases Rates per 100,000
population
0-4 1 0.28 1 0.27 2 0.28
5-9 0 0.00 0 0.00 0 0.00
10-19 1 0.13 0 0.00 1 0.06
20-29 4 0.43 0 0.00 4 0.21
30-39 0 0.00 1 0.11 1 0.06
40-49 2 0.19 2 0.19 4 0.19
50-59 0 0.00 2 0.21 2 0.11
60-69 7 1.02 4 0.62 11 0.83
70+ 18 2.36 14 2.49 32 2.42
Total 33 0.49 24 0.36 57 0.43
Ontario Cases: MOHLTC, integrated Public Health Information System (iPHIS) database, extracted [2012/06/13]. Ontario Population: MOHLTC, intelliHEALTH Ontario, extracted [2012/10/15].
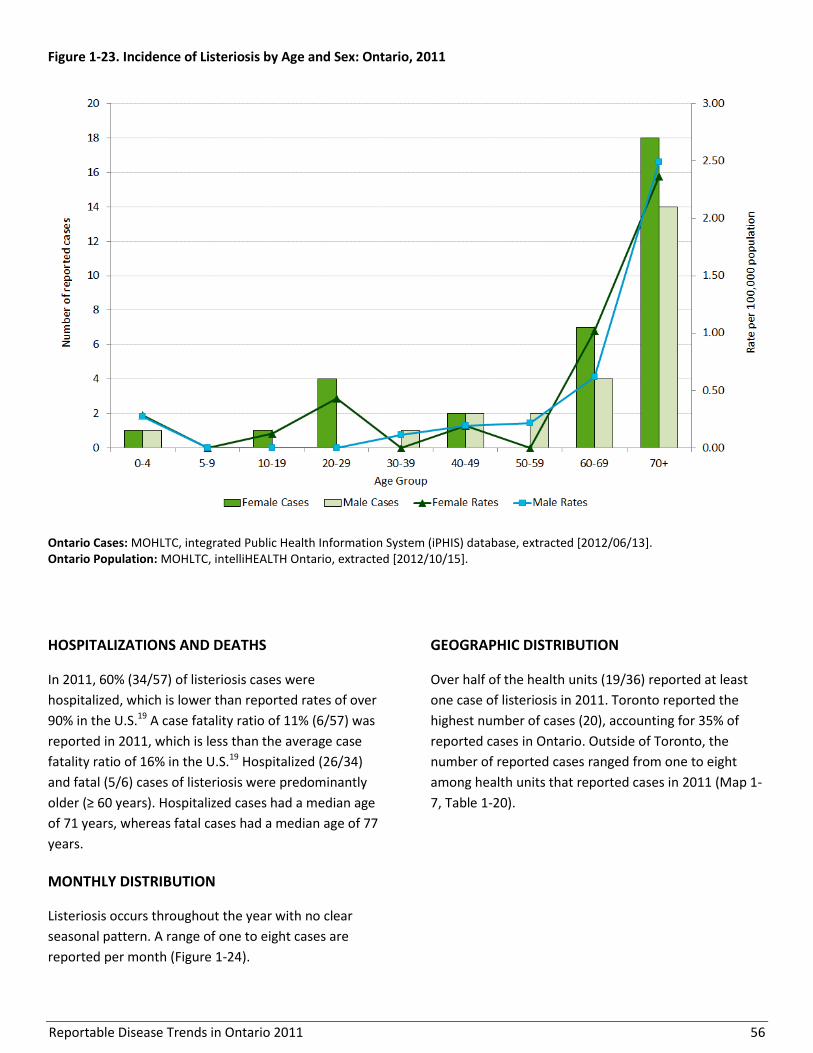
Reportable Disease Trends in Ontario 2011 56
Figure 1-23. Incidence of Listeriosis by Age and Sex: Ontario, 2011
Ontario Cases: MOHLTC, integrated Public Health Information System (iPHIS) database, extracted [2012/06/13]. Ontario Population: MOHLTC, intelliHEALTH Ontario, extracted [2012/10/15].
HOSPITALIZATIONS AND DEATHS
In 2011, 60% (34/57) of listeriosis cases were
hospitalized, which is lower than reported rates of over
90% in the U.S.19 A case fatality ratio of 11% (6/57) was
reported in 2011, which is less than the average case
fatality ratio of 16% in the U.S.19 Hospitalized (26/34)
and fatal (5/6) cases of listeriosis were predominantly
older (≥ 60 years). Hospitalized cases had a median age
of 71 years, whereas fatal cases had a median age of 77
years.
MONTHLY DISTRIBUTION
Listeriosis occurs throughout the year with no clear
seasonal pattern. A range of one to eight cases are
reported per month (Figure 1-24).
GEOGRAPHIC DISTRIBUTION
Over half of the health units (19/36) reported at least
one case of listeriosis in 2011. Toronto reported the
highest number of cases (20), accounting for 35% of
reported cases in Ontario. Outside of Toronto, the
number of reported cases ranged from one to eight
among health units that reported cases in 2011 (Map 1-
7, Table 1-20).
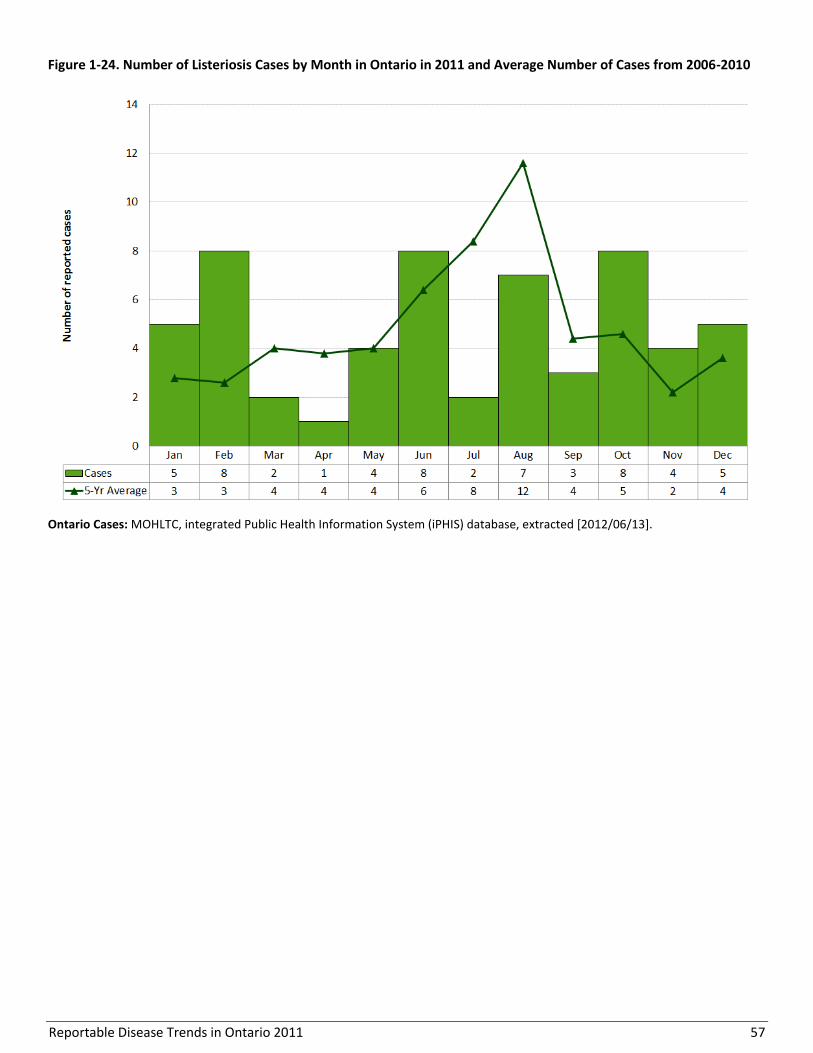
Reportable Disease Trends in Ontario 2011 57
Figure 1-24. Number of Listeriosis Cases by Month in Ontario in 2011 and Average Number of Cases from 2006-2010
Ontario Cases: MOHLTC, integrated Public Health Information System (iPHIS) database, extracted [2012/06/13].

Reportable Disease Trends in Ontario 2011 58
Map 1-7. Incidence of Listeriosis by Health Unit of Residence: Ontario, 2011
Ontario Cases: MOHLTC, integrated Public Health Information System (iPHIS) database, extracted [2012/06/13]. Ontario Population: MOHLTC, intelliHEALTH Ontario, extracted [2012/10/15]. Note: Health unit (HU) refers to the HU where the case resided at the time of identification and not necessarily the place of disease exposure or acquisition.

Reportable Disease Trends in Ontario 2011 59
Table 1-20. Incidence of Listeriosis by Health Unit of Residence: Ontario, 2011
Public Health Unit Cases (n) Rates (per 100,000
Population)
Cases as Proportion of
Total Cases (%)
Proportion of Ontario
Population (%)
Algoma District 0 0.00 0.0% 0.9%
Brant County 0 0.00 0.0% 1.1%
Chatham-Kent 0 0.00 0.0% 0.8%
Durham Region 4 0.63 7.0% 4.7%
Eastern Ontario 0 0.00 0.0% 1.5%
Elgin-St. Thomas 0 0.00 0.0% 0.7%
Grey Bruce 1 0.61 1.8% 1.2%
Haldimand-Norfolk 0 0.00 0.0% 0.8%
Haliburton, Kawartha, Pine Ridge District 0 0.00 0.0% 1.3%
Halton Region 2 0.39 3.5% 3.9%
Hamilton, City of 1 0.19 1.8% 4.0%
Hastings & Prince Edward Counties 0 0.00 0.0% 1.2%
Huron County 0 0.00 0.0% 0.5%
Kingston-Frontenac & Lennox & Addington 1 0.51 1.8% 1.5%
Lambton County 2 1.52 3.5% 1.0%
Leeds, Grenville and Lanark District 0 0.00 0.0% 1.3%
Middlesex-London 2 0.43 3.5% 3.4%
Niagara Region 1 0.22 1.8% 3.3%
North Bay Parry Sound District 0 0.00 0.0% 1.0%
Northwestern 0 0.00 0.0% 0.6%
Ottawa, City of 4 0.44 7.0% 6.8%
Oxford County 1 0.92 1.8% 0.8%
Peel Region 8 0.59 14.0% 10.2%
Perth District 0 0.00 0.0% 0.6%
Peterborough County-City 1 0.71 1.8% 1.1%
Porcupine 0 0.00 0.0% 0.6%
Renfrew County & District 1 0.97 1.8% 0.8%
Simcoe Muskoka District 3 0.57 5.3% 3.9%
Sudbury & District 0 0.00 0.0% 1.5%
Thunder Bay District 0 0.00 0.0% 1.2%
Timiskaming 0 0.00 0.0% 0.3%
Toronto 20 0.73 35.1% 20.5%
Waterloo Region 0 0.00 0.0% 4.0%
Wellington-Dufferin-Guelph 1 0.36 1.8% 2.1%
Windsor-Essex County 0 0.00 0.0% 3.0%
York Region 4 0.37 7.0% 8.0%
Ontario 57 0.43 100.0% 100.0%
Ontario Cases: MOHLTC, integrated Public Health Information System (iPHIS) database, extracted [2012/06/13] Ontario Population: MOHLTC, intelliHEALTH Ontario, extracted [2012/10/15]. Note: Health unit (HU) refers to the HU where the case resided at the time of identification and not necessarily the place of disease exposure or acquisition.
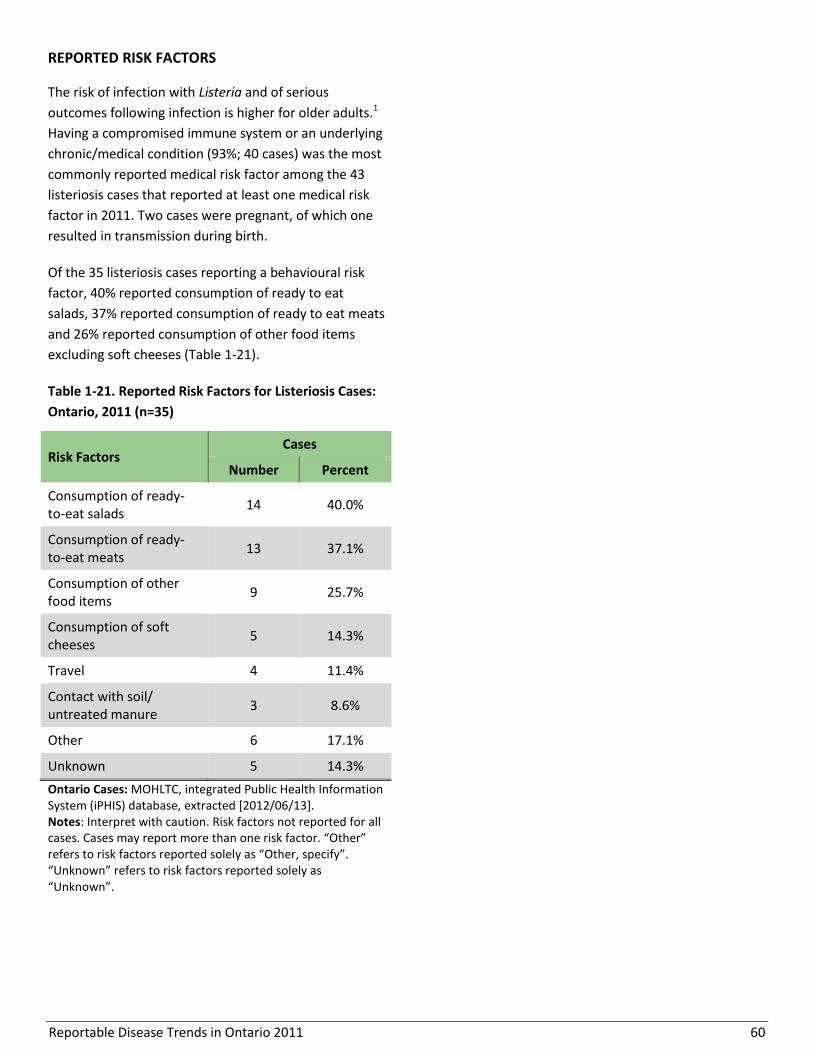
Reportable Disease Trends in Ontario 2011 60
REPORTED RISK FACTORS
The risk of infection with Listeria and of serious
outcomes following infection is higher for older adults.1
Having a compromised immune system or an underlying
chronic/medical condition (93%; 40 cases) was the most
commonly reported medical risk factor among the 43
listeriosis cases that reported at least one medical risk
factor in 2011. Two cases were pregnant, of which one
resulted in transmission during birth.
Of the 35 listeriosis cases reporting a behavioural risk
factor, 40% reported consumption of ready to eat
salads, 37% reported consumption of ready to eat meats
and 26% reported consumption of other food items
excluding soft cheeses (Table 1-21).
Table 1-21. Reported Risk Factors for Listeriosis Cases:
Ontario, 2011 (n=35)
Risk Factors Cases
Number Percent
Consumption of ready-to-eat salads
14 40.0%
Consumption of ready-to-eat meats
13 37.1%
Consumption of other food items
9 25.7%
Consumption of soft cheeses
5 14.3%
Travel 4 11.4%
Contact with soil/ untreated manure
3 8.6%
Other 6 17.1%
Unknown 5 14.3%
Ontario Cases: MOHLTC, integrated Public Health Information System (iPHIS) database, extracted [2012/06/13]. Notes: Interpret with caution. Risk factors not reported for all cases. Cases may report more than one risk factor. “Other” refers to risk factors reported solely as “Other, specify”. “Unknown” refers to risk factors reported solely as “Unknown”.
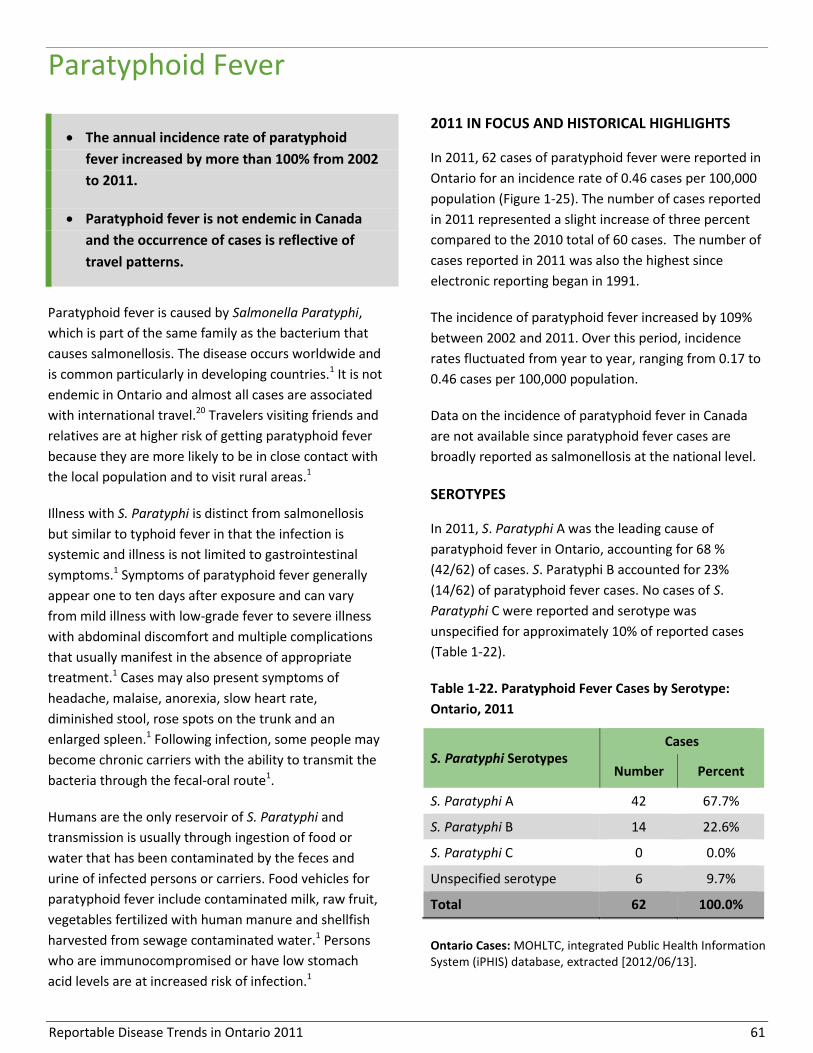
Reportable Disease Trends in Ontario 2011 61
Paratyphoid Fever
The annual incidence rate of paratyphoid
fever increased by more than 100% from 2002
to 2011.
Paratyphoid fever is not endemic in Canada
and the occurrence of cases is reflective of
travel patterns.
Paratyphoid fever is caused by Salmonella Paratyphi,
which is part of the same family as the bacterium that
causes salmonellosis. The disease occurs worldwide and
is common particularly in developing countries.1 It is not
endemic in Ontario and almost all cases are associated
with international travel.20 Travelers visiting friends and
relatives are at higher risk of getting paratyphoid fever
because they are more likely to be in close contact with
the local population and to visit rural areas.1
Illness with S. Paratyphi is distinct from salmonellosis
but similar to typhoid fever in that the infection is
systemic and illness is not limited to gastrointestinal
symptoms.1 Symptoms of paratyphoid fever generally
appear one to ten days after exposure and can vary
from mild illness with low-grade fever to severe illness
with abdominal discomfort and multiple complications
that usually manifest in the absence of appropriate
treatment.1 Cases may also present symptoms of
headache, malaise, anorexia, slow heart rate,
diminished stool, rose spots on the trunk and an
enlarged spleen.1 Following infection, some people may
become chronic carriers with the ability to transmit the
bacteria through the fecal-oral route1.
Humans are the only reservoir of S. Paratyphi and
transmission is usually through ingestion of food or
water that has been contaminated by the feces and
urine of infected persons or carriers. Food vehicles for
paratyphoid fever include contaminated milk, raw fruit,
vegetables fertilized with human manure and shellfish
harvested from sewage contaminated water.1 Persons
who are immunocompromised or have low stomach
acid levels are at increased risk of infection.1
2011 IN FOCUS AND HISTORICAL HIGHLIGHTS
In 2011, 62 cases of paratyphoid fever were reported in
Ontario for an incidence rate of 0.46 cases per 100,000
population (Figure 1-25). The number of cases reported
in 2011 represented a slight increase of three percent
compared to the 2010 total of 60 cases. The number of
cases reported in 2011 was also the highest since
electronic reporting began in 1991.
The incidence of paratyphoid fever increased by 109%
between 2002 and 2011. Over this period, incidence
rates fluctuated from year to year, ranging from 0.17 to
0.46 cases per 100,000 population.
Data on the incidence of paratyphoid fever in Canada
are not available since paratyphoid fever cases are
broadly reported as salmonellosis at the national level.
SEROTYPES
In 2011, S. Paratyphi A was the leading cause of
paratyphoid fever in Ontario, accounting for 68 %
(42/62) of cases. S. Paratyphi B accounted for 23%
(14/62) of paratyphoid fever cases. No cases of S.
Paratyphi C were reported and serotype was
unspecified for approximately 10% of reported cases
(Table 1-22).
Table 1-22. Paratyphoid Fever Cases by Serotype:
Ontario, 2011
S. Paratyphi Serotypes Cases
Number Percent
S. Paratyphi A 42 67.7%
S. Paratyphi B 14 22.6%
S. Paratyphi C 0 0.0%
Unspecified serotype 6 9.7%
Total 62 100.0%
Ontario Cases: MOHLTC, integrated Public Health Information System (iPHIS) database, extracted [2012/06/13].

Reportable Disease Trends in Ontario 2011 62
Figure 1-25. Incidence of Paratyphoid Fever: Ontario and Canada, 2002-2011
Ontario Cases: MOHLTC, integrated Public Health Information System (iPHIS) database, extracted [2012/06/13]. Ontario Population: MOHLTC, intelliHEALTH Ontario, extracted [2012/10/15]. Canadian Rates: Canadian data for paratyphoid fever are not available as paratyphoid fever is reported as salmonellosis at the national level.
AGE AND SEX DISTRIBUTION
The sex-specific incidence rate for paratyphoid fever in
2011 was slightly higher for males compared to females
at 0.53 and 0.40 cases per 100,000 population,
respectively (Table 1-23, Figure 1-26). Cases ranged in
age from less than one year to 82 years, with a median
age of 23 years. More than half of all cases reported in
2011 (37/62) occurred among the 10-19, 20-29 and 30-
39 age groups. However, children in the 0-4 age group
had the highest incidence rate of paratyphoid fever at
1.25 cases per 100,000 population.
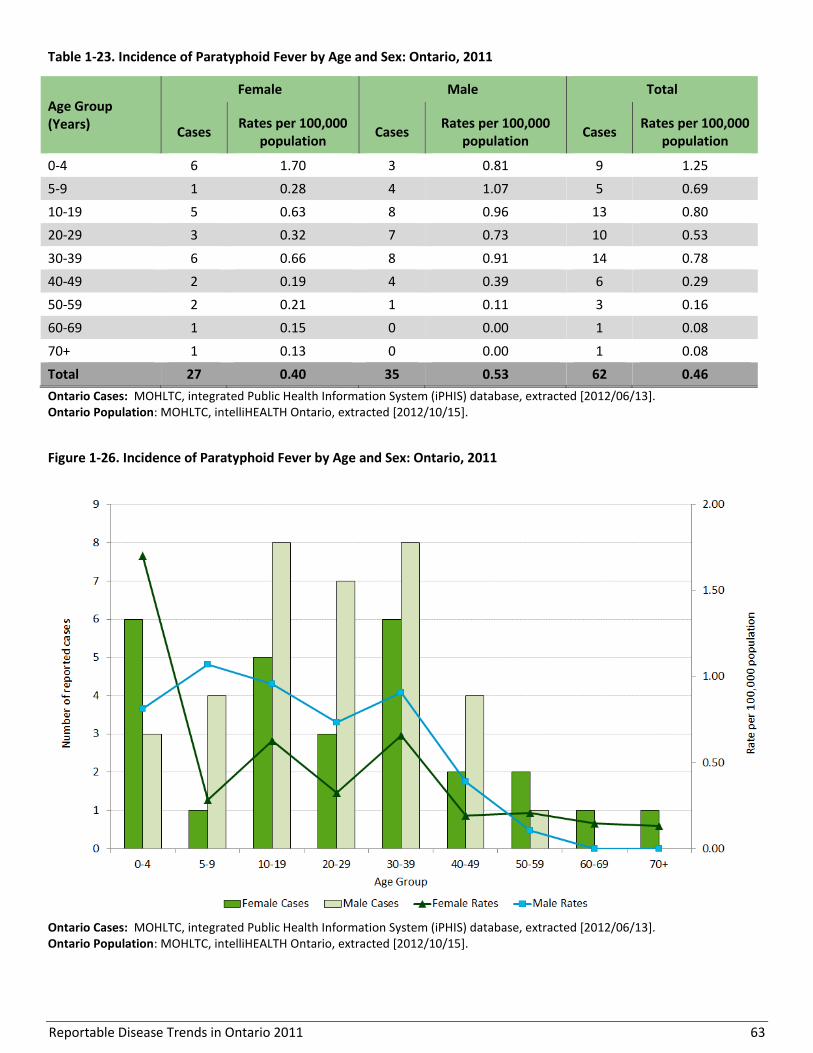
Reportable Disease Trends in Ontario 2011 63
Table 1-23. Incidence of Paratyphoid Fever by Age and Sex: Ontario, 2011
Age Group (Years)
Female Male Total
Cases Rates per 100,000
population Cases
Rates per 100,000 population
Cases Rates per 100,000
population
0-4 6 1.70 3 0.81 9 1.25
5-9 1 0.28 4 1.07 5 0.69
10-19 5 0.63 8 0.96 13 0.80
20-29 3 0.32 7 0.73 10 0.53
30-39 6 0.66 8 0.91 14 0.78
40-49 2 0.19 4 0.39 6 0.29
50-59 2 0.21 1 0.11 3 0.16
60-69 1 0.15 0 0.00 1 0.08
70+ 1 0.13 0 0.00 1 0.08
Total 27 0.40 35 0.53 62 0.46
Ontario Cases: MOHLTC, integrated Public Health Information System (iPHIS) database, extracted [2012/06/13]. Ontario Population: MOHLTC, intelliHEALTH Ontario, extracted [2012/10/15].
Figure 1-26. Incidence of Paratyphoid Fever by Age and Sex: Ontario, 2011
Ontario Cases: MOHLTC, integrated Public Health Information System (iPHIS) database, extracted [2012/06/13]. Ontario Population: MOHLTC, intelliHEALTH Ontario, extracted [2012/10/15].
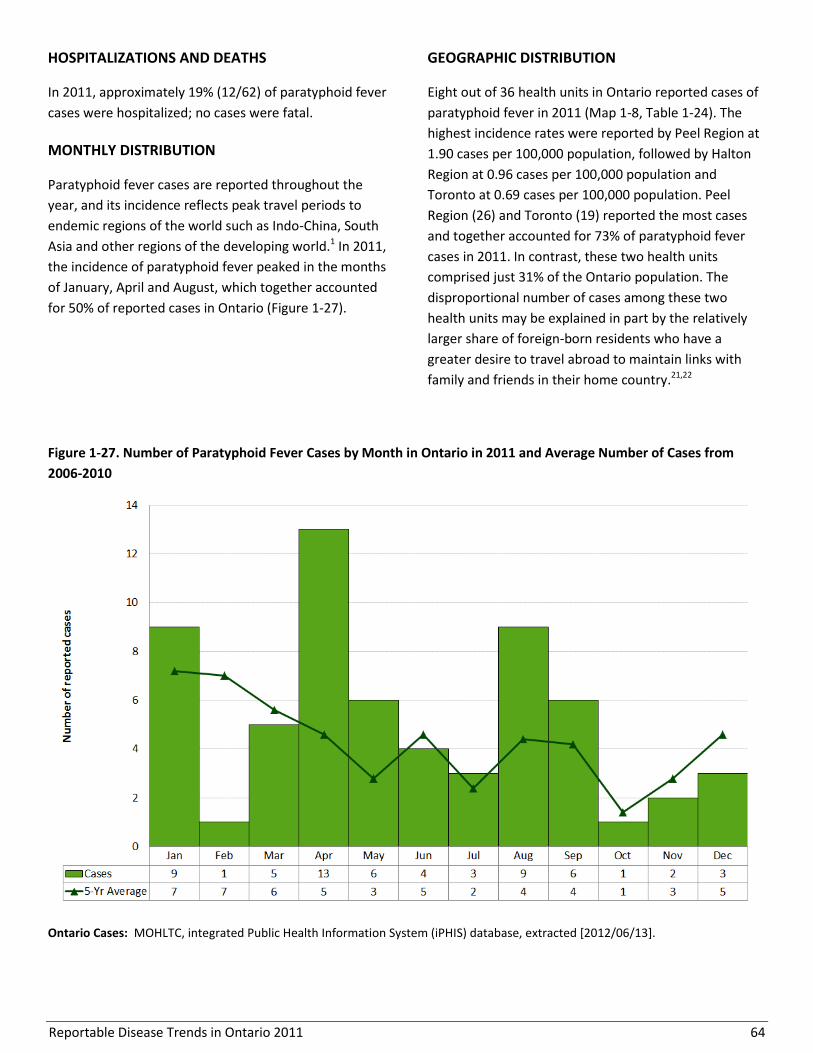
Reportable Disease Trends in Ontario 2011 64
HOSPITALIZATIONS AND DEATHS
In 2011, approximately 19% (12/62) of paratyphoid fever
cases were hospitalized; no cases were fatal.
MONTHLY DISTRIBUTION
Paratyphoid fever cases are reported throughout the
year, and its incidence reflects peak travel periods to
endemic regions of the world such as Indo-China, South
Asia and other regions of the developing world.1 In 2011,
the incidence of paratyphoid fever peaked in the months
of January, April and August, which together accounted
for 50% of reported cases in Ontario (Figure 1-27).
GEOGRAPHIC DISTRIBUTION
Eight out of 36 health units in Ontario reported cases of
paratyphoid fever in 2011 (Map 1-8, Table 1-24). The
highest incidence rates were reported by Peel Region at
1.90 cases per 100,000 population, followed by Halton
Region at 0.96 cases per 100,000 population and
Toronto at 0.69 cases per 100,000 population. Peel
Region (26) and Toronto (19) reported the most cases
and together accounted for 73% of paratyphoid fever
cases in 2011. In contrast, these two health units
comprised just 31% of the Ontario population. The
disproportional number of cases among these two
health units may be explained in part by the relatively
larger share of foreign-born residents who have a
greater desire to travel abroad to maintain links with
family and friends in their home country.21,22
Figure 1-27. Number of Paratyphoid Fever Cases by Month in Ontario in 2011 and Average Number of Cases from
2006-2010
Ontario Cases: MOHLTC, integrated Public Health Information System (iPHIS) database, extracted [2012/06/13].
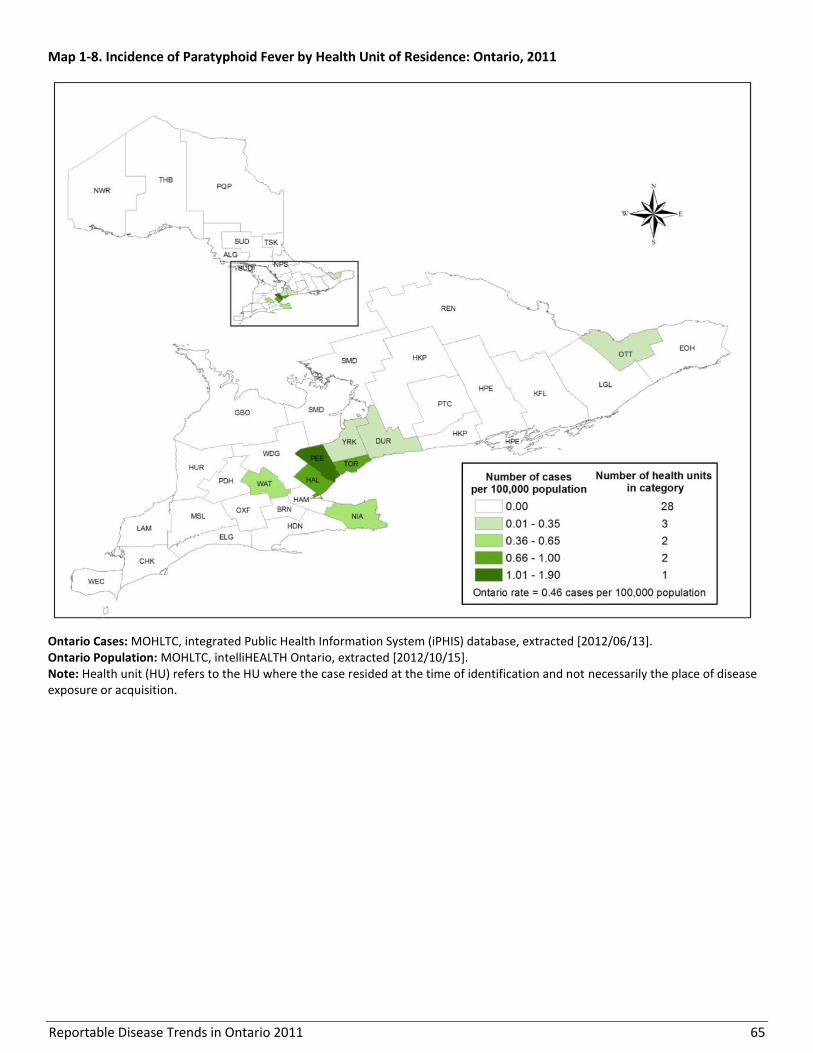
Reportable Disease Trends in Ontario 2011 65
Map 1-8. Incidence of Paratyphoid Fever by Health Unit of Residence: Ontario, 2011
Ontario Cases: MOHLTC, integrated Public Health Information System (iPHIS) database, extracted [2012/06/13]. Ontario Population: MOHLTC, intelliHEALTH Ontario, extracted [2012/10/15]. Note: Health unit (HU) refers to the HU where the case resided at the time of identification and not necessarily the place of disease exposure or acquisition.
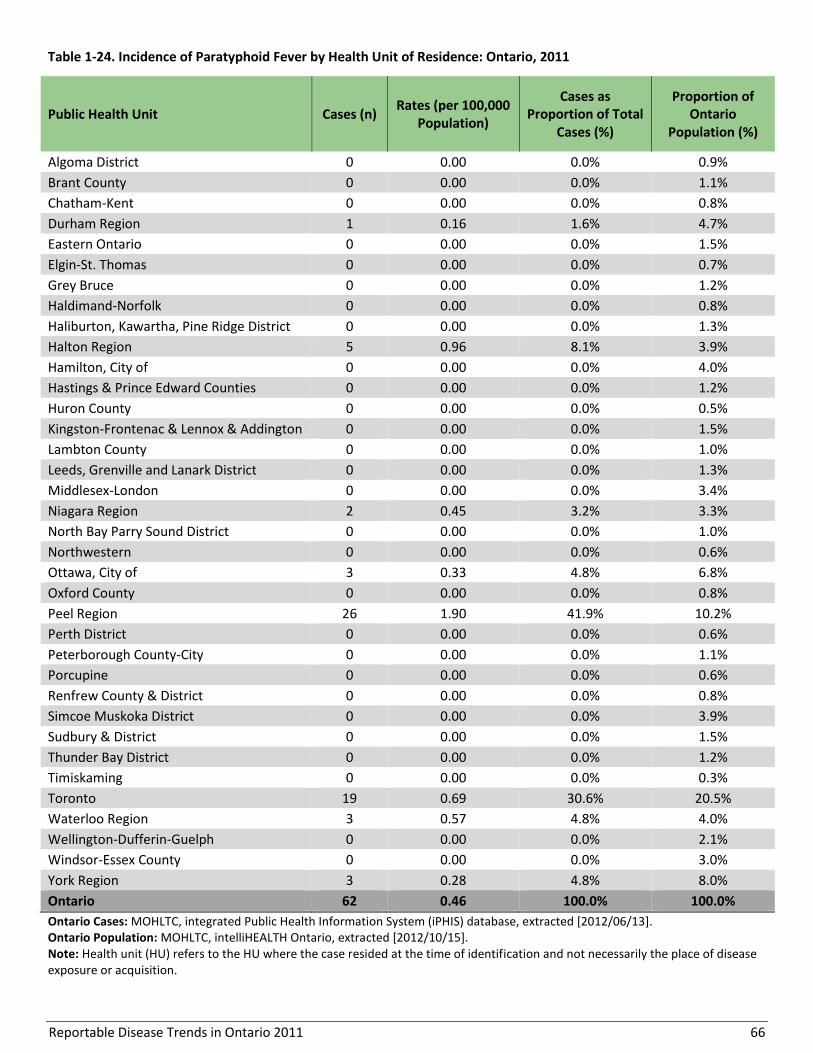
Reportable Disease Trends in Ontario 2011 66
Table 1-24. Incidence of Paratyphoid Fever by Health Unit of Residence: Ontario, 2011
Public Health Unit Cases (n) Rates (per 100,000
Population)
Cases as Proportion of Total
Cases (%)
Proportion of Ontario
Population (%)
Algoma District 0 0.00 0.0% 0.9%
Brant County 0 0.00 0.0% 1.1%
Chatham-Kent 0 0.00 0.0% 0.8%
Durham Region 1 0.16 1.6% 4.7%
Eastern Ontario 0 0.00 0.0% 1.5%
Elgin-St. Thomas 0 0.00 0.0% 0.7%
Grey Bruce 0 0.00 0.0% 1.2%
Haldimand-Norfolk 0 0.00 0.0% 0.8%
Haliburton, Kawartha, Pine Ridge District 0 0.00 0.0% 1.3%
Halton Region 5 0.96 8.1% 3.9%
Hamilton, City of 0 0.00 0.0% 4.0%
Hastings & Prince Edward Counties 0 0.00 0.0% 1.2%
Huron County 0 0.00 0.0% 0.5%
Kingston-Frontenac & Lennox & Addington 0 0.00 0.0% 1.5%
Lambton County 0 0.00 0.0% 1.0%
Leeds, Grenville and Lanark District 0 0.00 0.0% 1.3%
Middlesex-London 0 0.00 0.0% 3.4%
Niagara Region 2 0.45 3.2% 3.3%
North Bay Parry Sound District 0 0.00 0.0% 1.0%
Northwestern 0 0.00 0.0% 0.6%
Ottawa, City of 3 0.33 4.8% 6.8%
Oxford County 0 0.00 0.0% 0.8%
Peel Region 26 1.90 41.9% 10.2%
Perth District 0 0.00 0.0% 0.6%
Peterborough County-City 0 0.00 0.0% 1.1%
Porcupine 0 0.00 0.0% 0.6%
Renfrew County & District 0 0.00 0.0% 0.8%
Simcoe Muskoka District 0 0.00 0.0% 3.9%
Sudbury & District 0 0.00 0.0% 1.5%
Thunder Bay District 0 0.00 0.0% 1.2%
Timiskaming 0 0.00 0.0% 0.3%
Toronto 19 0.69 30.6% 20.5%
Waterloo Region 3 0.57 4.8% 4.0%
Wellington-Dufferin-Guelph 0 0.00 0.0% 2.1%
Windsor-Essex County 0 0.00 0.0% 3.0%
York Region 3 0.28 4.8% 8.0%
Ontario 62 0.46 100.0% 100.0%
Ontario Cases: MOHLTC, integrated Public Health Information System (iPHIS) database, extracted [2012/06/13]. Ontario Population: MOHLTC, intelliHEALTH Ontario, extracted [2012/10/15]. Note: Health unit (HU) refers to the HU where the case resided at the time of identification and not necessarily the place of disease exposure or acquisition.
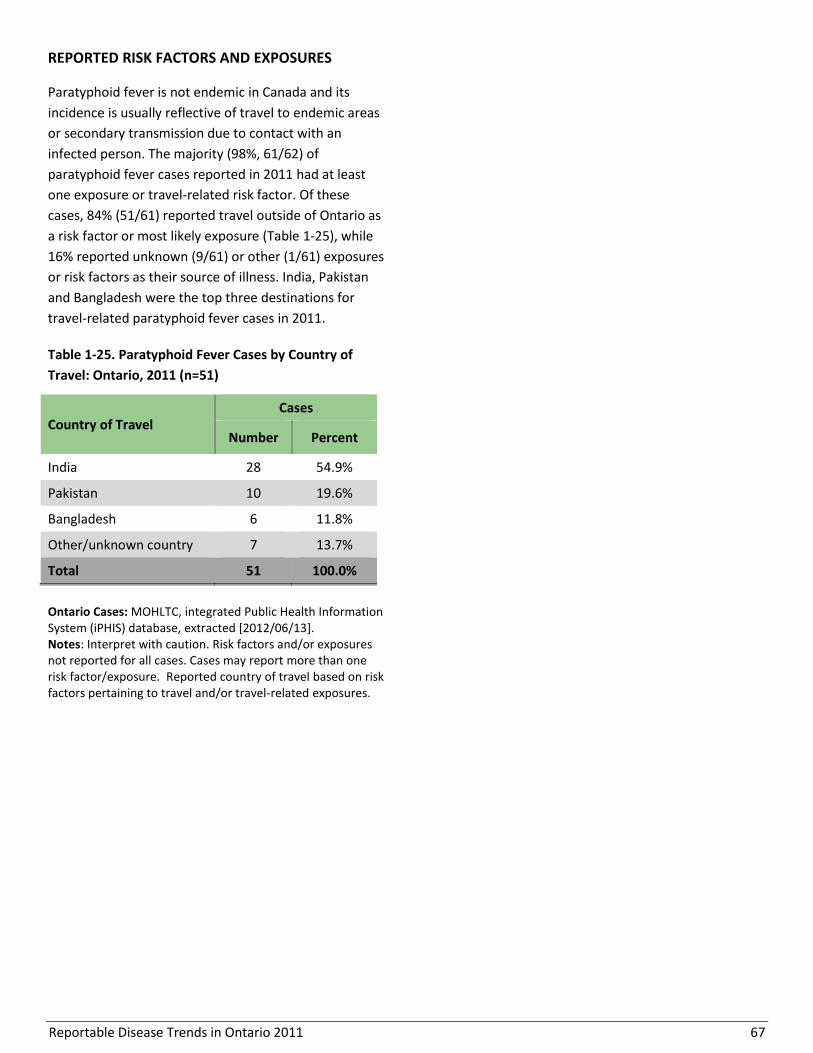
Reportable Disease Trends in Ontario 2011 67
REPORTED RISK FACTORS AND EXPOSURES
Paratyphoid fever is not endemic in Canada and its
incidence is usually reflective of travel to endemic areas
or secondary transmission due to contact with an
infected person. The majority (98%, 61/62) of
paratyphoid fever cases reported in 2011 had at least
one exposure or travel-related risk factor. Of these
cases, 84% (51/61) reported travel outside of Ontario as
a risk factor or most likely exposure (Table 1-25), while
16% reported unknown (9/61) or other (1/61) exposures
or risk factors as their source of illness. India, Pakistan
and Bangladesh were the top three destinations for
travel-related paratyphoid fever cases in 2011.
Table 1-25. Paratyphoid Fever Cases by Country of
Travel: Ontario, 2011 (n=51)
Country of Travel Cases
Number Percent
India 28 54.9%
Pakistan 10 19.6%
Bangladesh 6 11.8%
Other/unknown country 7 13.7%
Total 51 100.0%
Ontario Cases: MOHLTC, integrated Public Health Information System (iPHIS) database, extracted [2012/06/13]. Notes: Interpret with caution. Risk factors and/or exposures not reported for all cases. Cases may report more than one risk factor/exposure. Reported country of travel based on risk factors pertaining to travel and/or travel-related exposures.
Reportable Disease Trends in Ontario 2011 68
Plague
Plague is caused by the bacterium Yersinia pestis.1 Wild
rodents are the natural host of Y. pestis with fleas
serving as the transmission vector between infected
rodents and humans. Plague is commonly transmitted
to humans through the bite of an infected flea or
through direct contact with infected animal tissue.1
Inhalation of respiratory droplets from infected persons
and animals (especially cats) also results in infection.1
There are three main forms of plague. Plague most
commonly manifests as bubonic plague which is
characterized by sudden onset of fever, headache,
chills, weakness and painful and swollen lymph nodes
(buboes). Bubonic plague usually develops one to six
days after being bitten by an infected flea. Left
untreated, bubonic plague can progress to septicemic
plague wherein the bacteria multiplies in the
bloodstream or pneumonic plague wherein the lungs
become infected. Plague in its various forms can be
treated successfully with antibiotics. However, if left
untreated, it is almost invariably fatal for pneumonic
and septicemic plague, and fatal for 50 to 60% of
bubonic plague cases.1
Plague is endemic in South America, western USA, Asia,
and south-eastern Europe.1 Susceptibility to the disease
is general, requiring contact with infected fleas, animals
or persons. The most effective means of eliminating the
risk of infection is through the use of rodent control
strategies around the home and flea control strategies
for family pets.1
2011 IN FOCUS AND HISTORICAL HIGHLIGHTS
In Canada, plague is extremely rare with the last
reported human case occurring in 1939.23
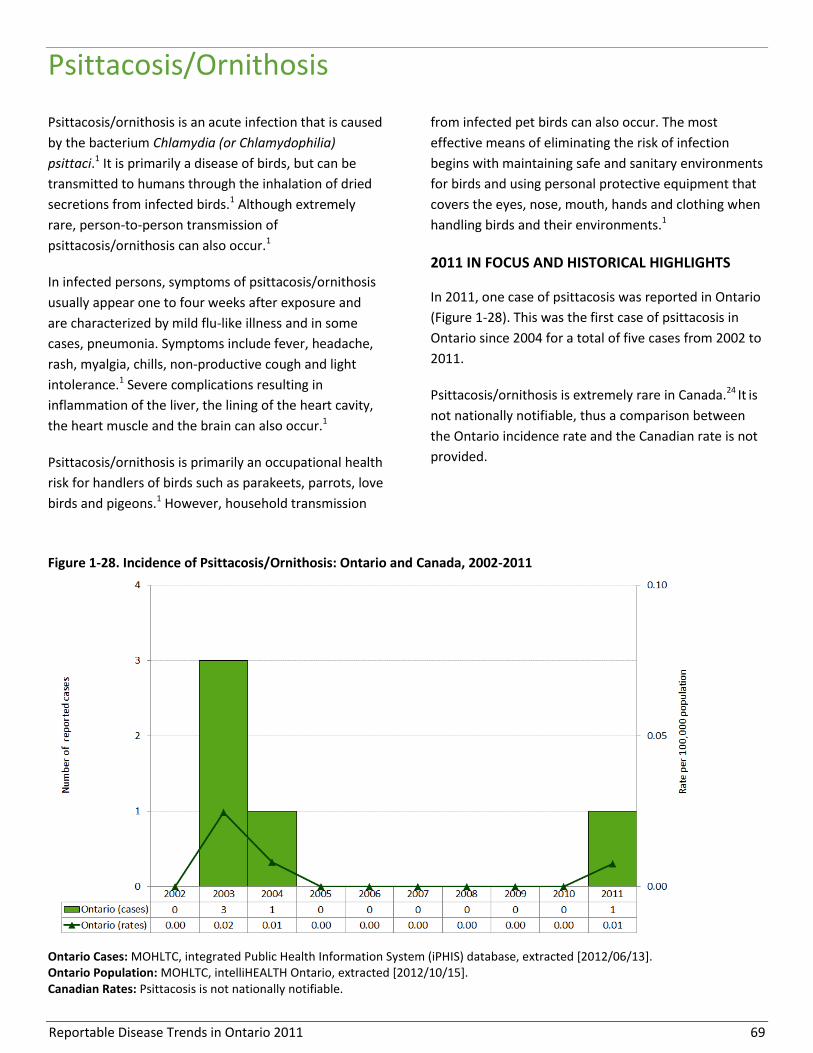
Reportable Disease Trends in Ontario 2011 69
Psittacosis/Ornithosis
Psittacosis/ornithosis is an acute infection that is caused
by the bacterium Chlamydia (or Chlamydophilia)
psittaci.1 It is primarily a disease of birds, but can be
transmitted to humans through the inhalation of dried
secretions from infected birds.1 Although extremely
rare, person-to-person transmission of
psittacosis/ornithosis can also occur.1
In infected persons, symptoms of psittacosis/ornithosis
usually appear one to four weeks after exposure and
are characterized by mild flu-like illness and in some
cases, pneumonia. Symptoms include fever, headache,
rash, myalgia, chills, non-productive cough and light
intolerance.1 Severe complications resulting in
inflammation of the liver, the lining of the heart cavity,
the heart muscle and the brain can also occur.1
Psittacosis/ornithosis is primarily an occupational health
risk for handlers of birds such as parakeets, parrots, love
birds and pigeons.1 However, household transmission
from infected pet birds can also occur. The most
effective means of eliminating the risk of infection
begins with maintaining safe and sanitary environments
for birds and using personal protective equipment that
covers the eyes, nose, mouth, hands and clothing when
handling birds and their environments.1
2011 IN FOCUS AND HISTORICAL HIGHLIGHTS
In 2011, one case of psittacosis was reported in Ontario
(Figure 1-28). This was the first case of psittacosis in
Ontario since 2004 for a total of five cases from 2002 to
2011.
Psittacosis/ornithosis is extremely rare in Canada.24 It is
not nationally notifiable, thus a comparison between
the Ontario incidence rate and the Canadian rate is not
provided.
Figure 1-28. Incidence of Psittacosis/Ornithosis: Ontario and Canada, 2002-2011
Ontario Cases: MOHLTC, integrated Public Health Information System (iPHIS) database, extracted [2012/06/13]. Ontario Population: MOHLTC, intelliHEALTH Ontario, extracted [2012/10/15]. Canadian Rates: Psittacosis is not nationally notifiable.

Reportable Disease Trends in Ontario 2011 70
Q Fever
Q fever is caused by the bacterium Coxiella burnetti.1
The disease is primarily transmitted to humans through
inhalation of aerosolized bacteria originating from the
urine, feces and birth tissues (i.e. placenta, uterus and
birth fluids) of infected cattle, sheep and goats.1 Q fever
can also be transmitted to humans through the
consumption of contaminated milk as well as through
contact between broken skin and infected animal
excreta or birth tissues.1 Although possible, person-to-
person transmission is rare.
Sixty percent of people with Q fever have no physical
signs of illness. For those with symptoms, illness may be
acute or chronic with acute illness developing two to
three weeks after exposure. Acute Q fever is
characterized by abrupt onset of fever, chills, sweats,
severe headache, nausea, vomiting, diarrhea,
abdominal pain, chest pain, malaise and cough that lasts
for up to four weeks.1 Chronic Q fever is usually more
severe with symptoms developing up to two years after
exposure.1 Inflammation of the lining of the heart cavity
(pericarditis) occurs in 60-70% of persons with chronic
Q fever, leading to death in 25 to 60% of untreated
persons. Liver inflammation (hepatitis) and infections of
the bone or reproductive organs are other
manifestations of chronic Q fever infections.1
2011 IN FOCUS AND HISTORICAL HIGHLIGHTS
In 2011, 20 cases of Q fever were reported in Ontario,
representing an incidence rate of 0.15 cases per
100,000 population (Figure 1-29). The 2011 count of
cases was a 186% increase compared to the 2010 total
of seven cases. From 2006 to 2010, an average of five
cases of Q fever was reported in Ontario. The higher
than expected number of cases in 2011 may be
associated with increased awareness about the disease
and associated testing among the susceptible farming
community in Ontario, some of whom are enrolled in an
Ontario Q Fever Study.25 The potential link between the
increase in 2011 and the Ontario Q Fever Study is
indicative of under-reporting of the true number of Q
fever cases in Ontario, at least in the years prior to
2011.
Q fever is not nationally notifiable, thus a comparison
between annual incidence rates for Ontario and Canada
is not provided.
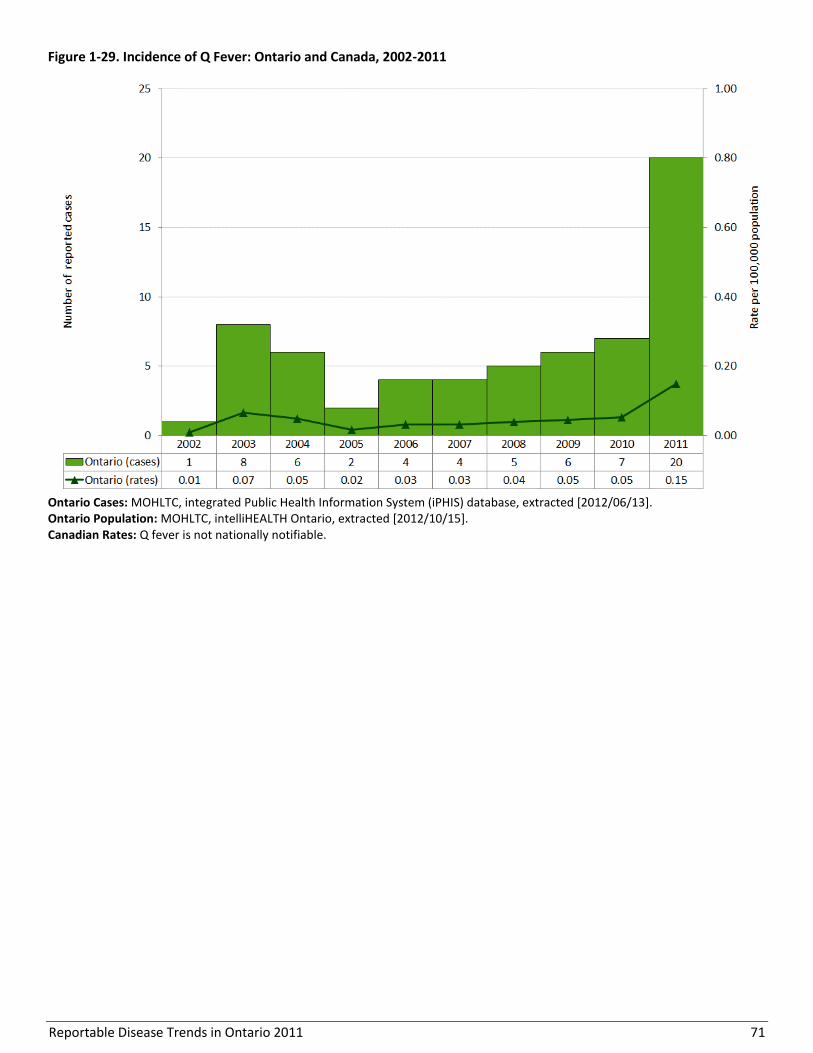
Reportable Disease Trends in Ontario 2011 71
Figure 1-29. Incidence of Q Fever: Ontario and Canada, 2002-2011
Ontario Cases: MOHLTC, integrated Public Health Information System (iPHIS) database, extracted [2012/06/13]. Ontario Population: MOHLTC, intelliHEALTH Ontario, extracted [2012/10/15]. Canadian Rates: Q fever is not nationally notifiable.
Reportable Disease Trends in Ontario 2011 72
Rabies
Rabies is an acute viral infection that only affects
mammals.1 It is commonly transmitted in saliva through
the bite of an infected animal, or through contact
between saliva and broken skin or mucous
membranes.1 Although possible, person-to-person
transmission rarely occurs. Rabies is transmissible to
humans and other animals when the virus is present in
saliva. This may occur prior to the onset of symptoms
and throughout the course of illness.1 The time from
exposure to the rabies virus and development of related
symptoms ranges from three to eight weeks, but can be
as short as nine days or as long as seven years.1,26
Early symptoms of rabies include fever, headache,
general weakness and pain at site of the exposure. As
the disease progresses, symptoms such as excitability,
apprehension, fear of water and air, delirium,
convulsions and hypersalivation occur.1 These classic
symptoms are observed in two-thirds of cases and are
collectively known as “furious rabies”.1,26 Rabies
infection may also manifest as “dumb rabies”, which is
characterized by paralysis of the limbs and respiratory
muscles.1,26 Death usually occurs within two weeks of
onset of central nervous system symptoms, with a case
fatality rate of almost 100%.1
In Canada, rabies is largely confined to wildlife, primarily
affecting bats, foxes, raccoons and skunks, and
occasionally in spill-over populations such as livestock,
pets and small rodents. Unvaccinated domestic animals,
mainly dogs and cats, are an important bridge for
infection between humans and rabid wild animals. In
Ontario and Canada, a combination of wildlife
vaccination programs and compulsory vaccination of
pets against rabies in most jurisdictions has resulted in a
significant decrease in transmission between terrestrial
animals and humans.27 Following an exposure, rabies
can be prevented by appropriate wound care and
prompt medical assessment to determine if rabies post-
exposure prophylaxis (PEP) is indicated. Where
indicated, appropriate PEP for previously unvaccinated
persons is comprised of rabies immune globulin and a
four-dose series of an approved rabies vaccine.28
2011 IN FOCUS AND HISTORICAL HIGHLIGHTS
Twenty-four human cases of rabies were reported in
Canada from 1924 to 2011, including six cases in
Ontario. The last case in Ontario during this period
occurred in 1967.26
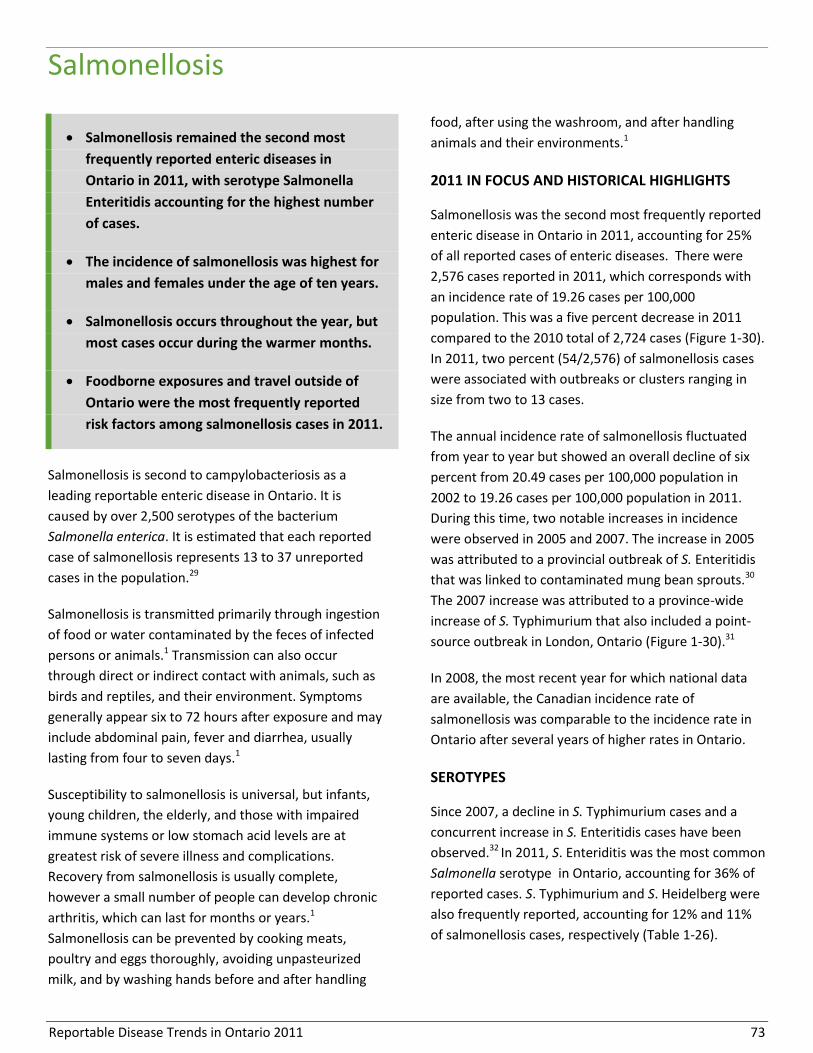
Reportable Disease Trends in Ontario 2011 73
Salmonellosis
Salmonellosis remained the second most
frequently reported enteric diseases in
Ontario in 2011, with serotype Salmonella
Enteritidis accounting for the highest number
of cases.
The incidence of salmonellosis was highest for
males and females under the age of ten years.
Salmonellosis occurs throughout the year, but
most cases occur during the warmer months.
Foodborne exposures and travel outside of
Ontario were the most frequently reported
risk factors among salmonellosis cases in 2011.
Salmonellosis is second to campylobacteriosis as a
leading reportable enteric disease in Ontario. It is
caused by over 2,500 serotypes of the bacterium
Salmonella enterica. It is estimated that each reported
case of salmonellosis represents 13 to 37 unreported
cases in the population.29
Salmonellosis is transmitted primarily through ingestion
of food or water contaminated by the feces of infected
persons or animals.1 Transmission can also occur
through direct or indirect contact with animals, such as
birds and reptiles, and their environment. Symptoms
generally appear six to 72 hours after exposure and may
include abdominal pain, fever and diarrhea, usually
lasting from four to seven days.1
Susceptibility to salmonellosis is universal, but infants,
young children, the elderly, and those with impaired
immune systems or low stomach acid levels are at
greatest risk of severe illness and complications.
Recovery from salmonellosis is usually complete,
however a small number of people can develop chronic
arthritis, which can last for months or years.1
Salmonellosis can be prevented by cooking meats,
poultry and eggs thoroughly, avoiding unpasteurized
milk, and by washing hands before and after handling
food, after using the washroom, and after handling
animals and their environments.1
2011 IN FOCUS AND HISTORICAL HIGHLIGHTS
Salmonellosis was the second most frequently reported
enteric disease in Ontario in 2011, accounting for 25%
of all reported cases of enteric diseases. There were
2,576 cases reported in 2011, which corresponds with
an incidence rate of 19.26 cases per 100,000
population. This was a five percent decrease in 2011
compared to the 2010 total of 2,724 cases (Figure 1-30).
In 2011, two percent (54/2,576) of salmonellosis cases
were associated with outbreaks or clusters ranging in
size from two to 13 cases.
The annual incidence rate of salmonellosis fluctuated
from year to year but showed an overall decline of six
percent from 20.49 cases per 100,000 population in
2002 to 19.26 cases per 100,000 population in 2011.
During this time, two notable increases in incidence
were observed in 2005 and 2007. The increase in 2005
was attributed to a provincial outbreak of S. Enteritidis
that was linked to contaminated mung bean sprouts.30
The 2007 increase was attributed to a province-wide
increase of S. Typhimurium that also included a point-
source outbreak in London, Ontario (Figure 1-30).31
In 2008, the most recent year for which national data
are available, the Canadian incidence rate of
salmonellosis was comparable to the incidence rate in
Ontario after several years of higher rates in Ontario.
SEROTYPES
Since 2007, a decline in S. Typhimurium cases and a
concurrent increase in S. Enteritidis cases have been
observed.32 In 2011, S. Enteriditis was the most common
Salmonella serotype in Ontario, accounting for 36% of
reported cases. S. Typhimurium and S. Heidelberg were
also frequently reported, accounting for 12% and 11%
of salmonellosis cases, respectively (Table 1-26).

Reportable Disease Trends in Ontario 2011 74
Table 1-26. Salmonellosis Cases by Serotype: Ontario,
2011
Salmonella Serotypes Cases
Number Percent
S. Enteritidis 933 36.2%
S. Typhimurium 302 11.7%
S. Heidelberg 278 10.8%
S. Newport 93 3.6%
S. Thompson 86 3.3%
S. Infantis 80 3.1%
Other 657 25.5%
Unspecified serotype 106 4.1%
Total 2,576 100.0%
Ontario Cases: MOHLTC, integrated Public Health Information System (iPHIS) database, extracted [2012/06/13].
Figure 1-30. Incidence of Salmonellosis: Ontario and Canada, 2002-2011
Ontario Cases: MOHLTC, integrated Public Health Information System (iPHIS) database, extracted [2012/06/13] Ontario Population: MOHLTC, intelliHEALTH Ontario, extracted [2012/10/15] Canadian Rates: Public Health Agency of Canada, Canadian Notifiable Disease Section, received by PHO [2012/09/24]; national data available up to 2008 and includes paratyphoid fever cases.
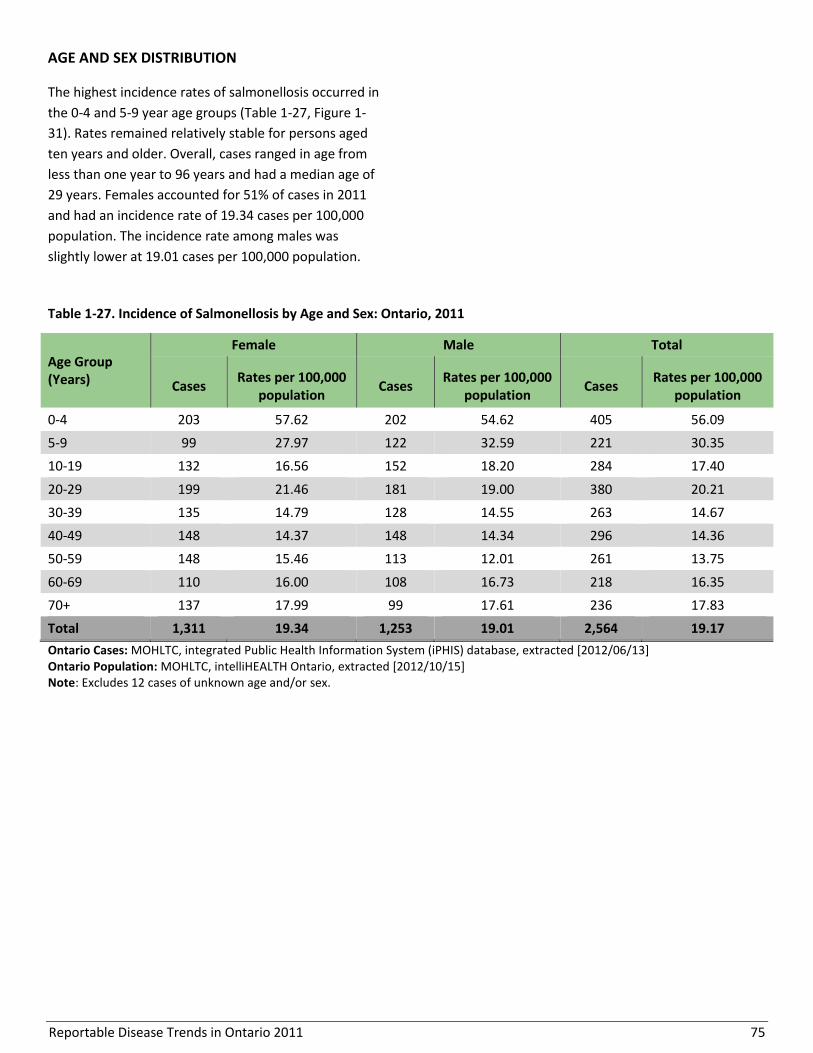
Reportable Disease Trends in Ontario 2011 75
AGE AND SEX DISTRIBUTION
The highest incidence rates of salmonellosis occurred in
the 0-4 and 5-9 year age groups (Table 1-27, Figure 1-
31). Rates remained relatively stable for persons aged
ten years and older. Overall, cases ranged in age from
less than one year to 96 years and had a median age of
29 years. Females accounted for 51% of cases in 2011
and had an incidence rate of 19.34 cases per 100,000
population. The incidence rate among males was
slightly lower at 19.01 cases per 100,000 population.
Table 1-27. Incidence of Salmonellosis by Age and Sex: Ontario, 2011
Age Group (Years)
Female Male Total
Cases Rates per 100,000
population Cases
Rates per 100,000 population
Cases Rates per 100,000
population
0-4 203 57.62 202 54.62 405 56.09
5-9 99 27.97 122 32.59 221 30.35
10-19 132 16.56 152 18.20 284 17.40
20-29 199 21.46 181 19.00 380 20.21
30-39 135 14.79 128 14.55 263 14.67
40-49 148 14.37 148 14.34 296 14.36
50-59 148 15.46 113 12.01 261 13.75
60-69 110 16.00 108 16.73 218 16.35
70+ 137 17.99 99 17.61 236 17.83
Total 1,311 19.34 1,253 19.01 2,564 19.17
Ontario Cases: MOHLTC, integrated Public Health Information System (iPHIS) database, extracted [2012/06/13] Ontario Population: MOHLTC, intelliHEALTH Ontario, extracted [2012/10/15] Note: Excludes 12 cases of unknown age and/or sex.
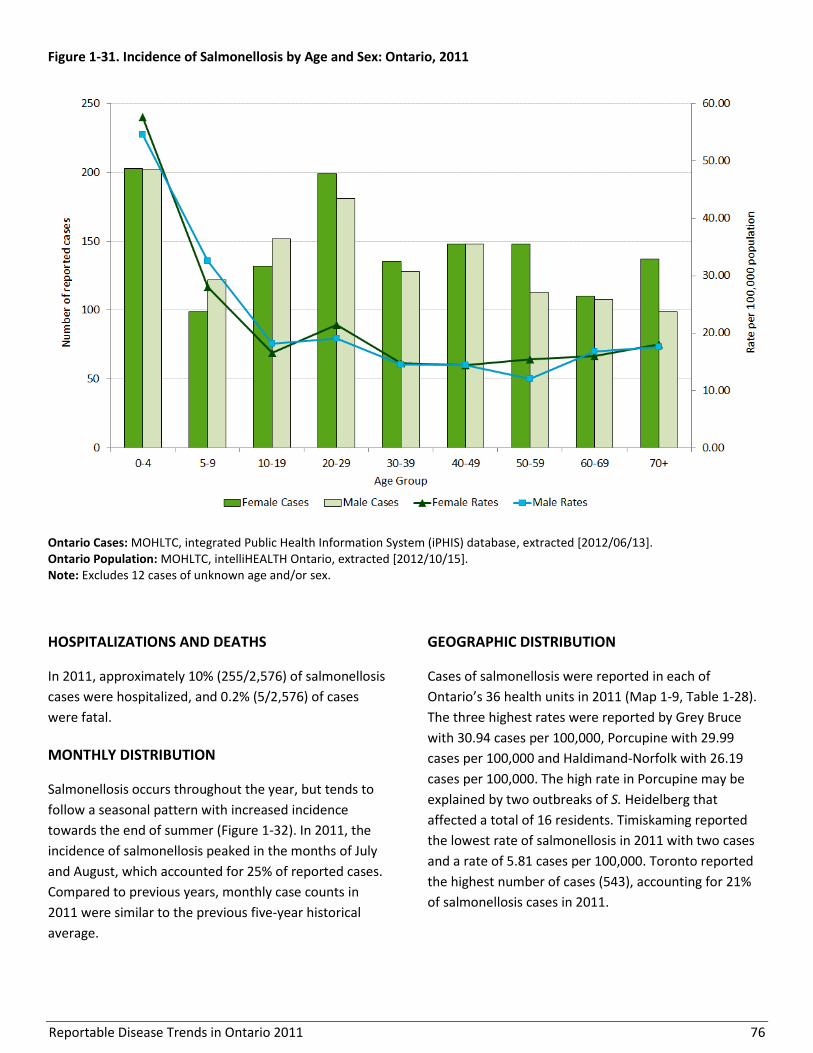
Reportable Disease Trends in Ontario 2011 76
Figure 1-31. Incidence of Salmonellosis by Age and Sex: Ontario, 2011
Ontario Cases: MOHLTC, integrated Public Health Information System (iPHIS) database, extracted [2012/06/13]. Ontario Population: MOHLTC, intelliHEALTH Ontario, extracted [2012/10/15]. Note: Excludes 12 cases of unknown age and/or sex.
HOSPITALIZATIONS AND DEATHS
In 2011, approximately 10% (255/2,576) of salmonellosis
cases were hospitalized, and 0.2% (5/2,576) of cases
were fatal.
MONTHLY DISTRIBUTION
Salmonellosis occurs throughout the year, but tends to
follow a seasonal pattern with increased incidence
towards the end of summer (Figure 1-32). In 2011, the
incidence of salmonellosis peaked in the months of July
and August, which accounted for 25% of reported cases.
Compared to previous years, monthly case counts in
2011 were similar to the previous five-year historical
average.
GEOGRAPHIC DISTRIBUTION
Cases of salmonellosis were reported in each of
Ontario’s 36 health units in 2011 (Map 1-9, Table 1-28).
The three highest rates were reported by Grey Bruce
with 30.94 cases per 100,000, Porcupine with 29.99
cases per 100,000 and Haldimand-Norfolk with 26.19
cases per 100,000. The high rate in Porcupine may be
explained by two outbreaks of S. Heidelberg that
affected a total of 16 residents. Timiskaming reported
the lowest rate of salmonellosis in 2011 with two cases
and a rate of 5.81 cases per 100,000. Toronto reported
the highest number of cases (543), accounting for 21%
of salmonellosis cases in 2011.
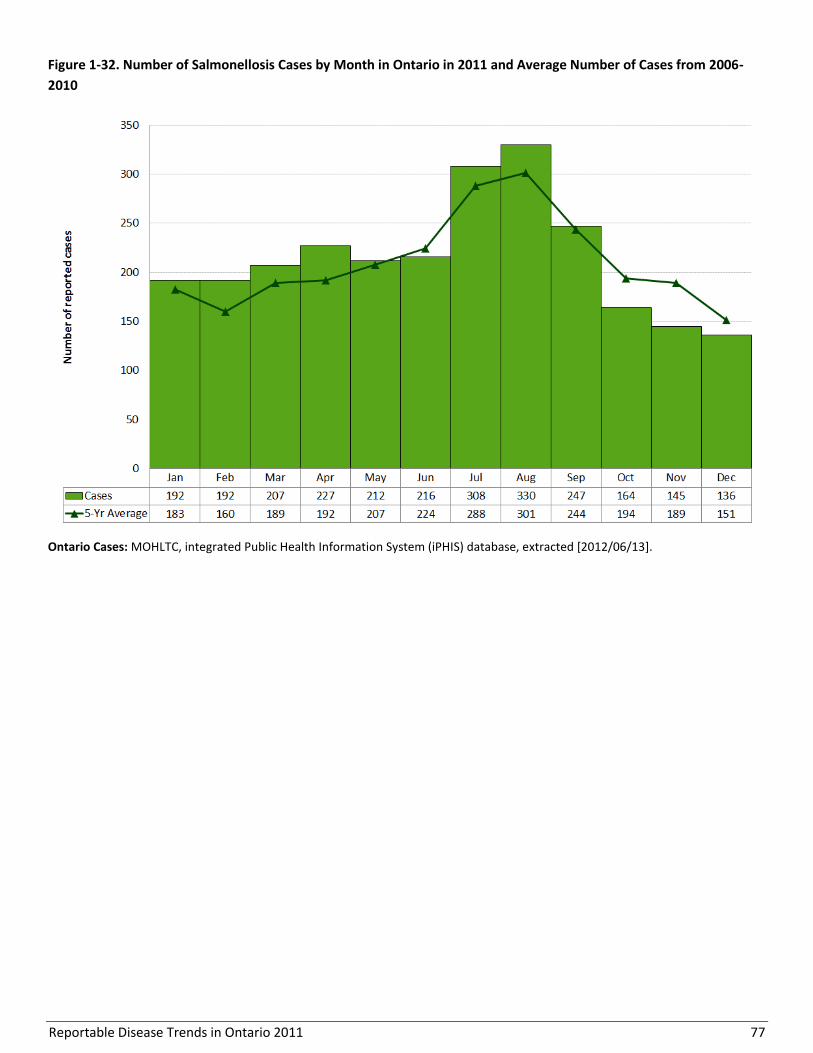
Reportable Disease Trends in Ontario 2011 77
Figure 1-32. Number of Salmonellosis Cases by Month in Ontario in 2011 and Average Number of Cases from 2006-
2010
Ontario Cases: MOHLTC, integrated Public Health Information System (iPHIS) database, extracted [2012/06/13].

Reportable Disease Trends in Ontario 2011 78
Map 1-9. Incidence of Salmonellosis by Health Unit of Residence: Ontario of Residence, 2011
Ontario Cases: MOHLTC, integrated Public Health Information System (iPHIS) database, extracted [2012/06/13]. Ontario Population: MOHLTC, intelliHEALTH Ontario, extracted [2012/10/15]. Note: Health unit (HU) refers to the HU where the case resided at the time of identification and not necessarily the place of disease exposure or acquisition.

Reportable Disease Trends in Ontario 2011 79
Table 1-28. Incidence of Salmonellosis by Health Unit of Residence: Ontario, 2011
Public Health Unit Cases
(n)
Rates (per 100,000
Population)
Cases as Proportion of Total
Cases (%)
Proportion of Ontario
Population (%)
Algoma District 19 16.13 0.7% 0.9%
Brant County 25 17.75 1.0% 1.1%
Chatham-Kent 14 12.89 0.5% 0.8%
Durham Region 135 21.39 5.2% 4.7%
Eastern Ontario 39 19.39 1.5% 1.5%
Elgin-St. Thomas 10 10.94 0.4% 0.7%
Grey Bruce 51 30.94 2.0% 1.2%
Haldimand-Norfolk 29 26.19 1.1% 0.8%
Haliburton, Kawartha, Pine Ridge District 39 21.79 1.5% 1.3%
Halton Region 92 17.74 3.6% 3.9%
Hamilton, City of 96 17.77 3.7% 4.0%
Hastings & Prince Edward Counties 30 18.44 1.2% 1.2%
Huron County 11 18.23 0.4% 0.5%
Kingston-Frontenac & Lennox & Addington 30 15.20 1.2% 1.5%
Lambton County 15 11.41 0.6% 1.0%
Leeds, Grenville and Lanark District 20 11.75 0.8% 1.3%
Middlesex-London 88 19.10 3.4% 3.4%
Niagara Region 95 21.33 3.7% 3.3%
North Bay Parry Sound District 29 22.78 1.1% 1.0%
Northwestern 18 21.97 0.7% 0.6%
Ottawa, City of 176 19.34 6.8% 6.8%
Oxford County 20 18.48 0.8% 0.8%
Peel Region 266 19.48 10.3% 10.2%
Perth District 17 22.04 0.7% 0.6%
Peterborough County-City 18 12.81 0.7% 1.1%
Porcupine 26 29.99 1.0% 0.6%
Renfrew County & District 21 20.40 0.8% 0.8%
Simcoe Muskoka District 104 19.79 4.0% 3.9%
Sudbury & District 24 12.14 0.9% 1.5%
Thunder Bay District 28 17.89 1.1% 1.2%
Timiskaming 2 5.81 0.1% 0.3%
Toronto 543 19.79 21.1% 20.5%
Waterloo Region 104 19.61 4.0% 4.0%
Wellington-Dufferin-Guelph 53 19.03 2.1% 2.1%
Windsor-Essex County 66 16.36 2.6% 3.0%
York Region 223 20.85 8.7% 8.0%
Ontario 2,576 19.26 100.0% 100.0%
Ontario Cases: MOHLTC, integrated Public Health Information System (iPHIS) database, extracted [2012/06/13] Ontario Population: MOHLTC, intelliHEALTH Ontario, extracted [2012/10/15]. Note: Health unit (HU) refers to the HU where the case resided at the time of identification and not necessarily the place of disease exposure or acquisition.
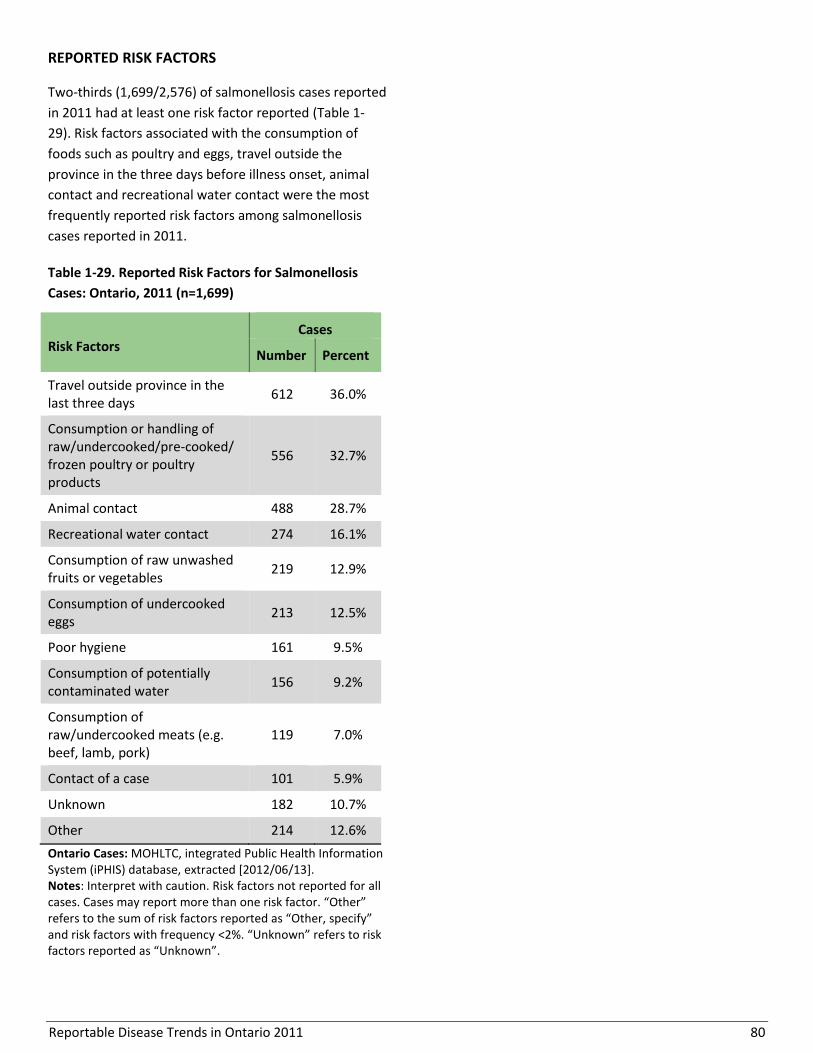
Reportable Disease Trends in Ontario 2011 80
REPORTED RISK FACTORS
Two-thirds (1,699/2,576) of salmonellosis cases reported
in 2011 had at least one risk factor reported (Table 1-
29). Risk factors associated with the consumption of
foods such as poultry and eggs, travel outside the
province in the three days before illness onset, animal
contact and recreational water contact were the most
frequently reported risk factors among salmonellosis
cases reported in 2011.
Table 1-29. Reported Risk Factors for Salmonellosis
Cases: Ontario, 2011 (n=1,699)
Risk Factors Cases
Number Percent
Travel outside province in the last three days
612 36.0%
Consumption or handling of raw/undercooked/pre-cooked/ frozen poultry or poultry products
556 32.7%
Animal contact 488 28.7%
Recreational water contact 274 16.1%
Consumption of raw unwashed fruits or vegetables
219 12.9%
Consumption of undercooked eggs
213 12.5%
Poor hygiene 161 9.5%
Consumption of potentially contaminated water
156 9.2%
Consumption of raw/undercooked meats (e.g. beef, lamb, pork)
119 7.0%
Contact of a case 101 5.9%
Unknown 182 10.7%
Other 214 12.6%
Ontario Cases: MOHLTC, integrated Public Health Information System (iPHIS) database, extracted [2012/06/13]. Notes: Interpret with caution. Risk factors not reported for all cases. Cases may report more than one risk factor. “Other” refers to the sum of risk factors reported as “Other, specify” and risk factors with frequency <2%. “Unknown” refers to risk factors reported as “Unknown”.

Reportable Disease Trends in Ontario 2011 81
Shigellosis
The incidence rate of shigellosis in Ontario
increased by 19% between 2006 and 2011.
S. flexneri was the leading cause of shigellosis
in Ontario in 2011.
Children under the age of ten years had the
highest rates of shigellosis in 2011.
Out of province travel was the most
frequently reported risk factor among
shigellosis cases in Ontario in 2011.
Shigellosis is an acute bacterial infection that causes
gastrointestinal illness.1 Humans are the primary
reservoir of Shigella, the bacterium that causes
shigellosis. There are four species of Shigella, of which
S. sonnei is the most common in developed countries.1
Shigella is easily transmitted from person-to-person,
with as few as ten to one hundred organisms causing
illness.1 Transmission is through direct or indirect
contact with feces.1 Direct transmission is often the
result of poor hand hygiene by ill persons or
asymptomatic (without symptoms) carriers of the
bacteria, but can also occur through anal-oral sexual
contact. Indirect transmission occurs through ingestion
of, or contact with contaminated food, water, or
inanimate objects.1 Following exposure to Shigella,
symptoms generally appear within one to three days
and may include diarrhea with or without mucus and
blood, fever, nausea, vomiting, and stomach cramps
that last from four to seven days.1
The risk of transmission of shigellosis is high in
institutions and in areas with poor sanitation and
overcrowding.1 Men who have sex with men, young
children who are not fully toilet trained, the elderly, and
disabled are also at higher risk of infection. Most cases
of shigellosis can be prevented by practicing frequent
and thorough hand washing following potential contact
with feces, by taking appropriate food safety measures,
and avoiding water that has not been treated.1
2011 IN FOCUS AND HISTORICAL HIGHLIGHTS
Shigellosis accounted for three percent (255) of enteric
disease cases reported in Ontario in 2011 (Figure 1-33).
The incidence rate in 2011 was 1.91 cases per 100,000
population, which was the same as 2010 (252 cases).
Over the period 2002 to 2011, the highest number of
shigellosis cases was reported in 2002. In that year, an
outbreak of over 600 cases linked to Greek-style pasta
salad occurred in Ontario.33 The incidence rate of
shigellosis increased by 19% between 2006 and 2011.
During this period, rates ranged from 1.61 to 1.94 cases
per 100,000 population.
Annual incidence rates of shigellosis for the rest of
Canada have generally been higher than in Ontario,
except for 2002 when the Greek-style pasta salad
outbreak occurred.
SEROTYPES
In 2011, S. flexneri was the leading cause of shigellosis
in Ontario, accounting for 47% (120/255) of cases,
followed by S. sonnei at 43% (109/255) and S. boydii at
six percent (Table 1-30). Other Shigella serogroups
accounted for less than two percent of reported cases
(4/255). The Shigella species was unspecified for two
percent of cases (4/255).
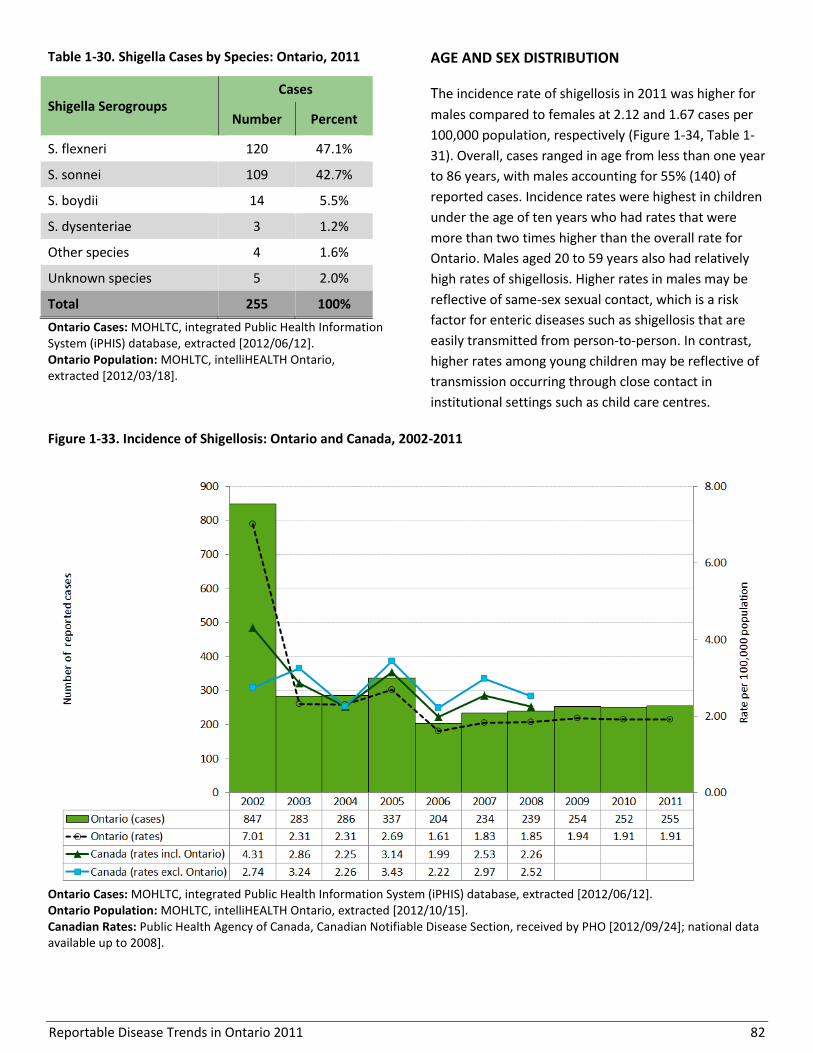
Reportable Disease Trends in Ontario 2011 82
Table 1-30. Shigella Cases by Species: Ontario, 2011
Shigella Serogroups Cases
Number Percent
S. flexneri 120 47.1%
S. sonnei 109 42.7%
S. boydii 14 5.5%
S. dysenteriae 3 1.2%
Other species 4 1.6%
Unknown species 5 2.0%
Total 255 100%
Ontario Cases: MOHLTC, integrated Public Health Information System (iPHIS) database, extracted [2012/06/12]. Ontario Population: MOHLTC, intelliHEALTH Ontario, extracted [2012/03/18].
AGE AND SEX DISTRIBUTION
The incidence rate of shigellosis in 2011 was higher for
males compared to females at 2.12 and 1.67 cases per
100,000 population, respectively (Figure 1-34, Table 1-
31). Overall, cases ranged in age from less than one year
to 86 years, with males accounting for 55% (140) of
reported cases. Incidence rates were highest in children
under the age of ten years who had rates that were
more than two times higher than the overall rate for
Ontario. Males aged 20 to 59 years also had relatively
high rates of shigellosis. Higher rates in males may be
reflective of same-sex sexual contact, which is a risk
factor for enteric diseases such as shigellosis that are
easily transmitted from person-to-person. In contrast,
higher rates among young children may be reflective of
transmission occurring through close contact in
institutional settings such as child care centres.
Figure 1-33. Incidence of Shigellosis: Ontario and Canada, 2002-2011
Ontario Cases: MOHLTC, integrated Public Health Information System (iPHIS) database, extracted [2012/06/12]. Ontario Population: MOHLTC, intelliHEALTH Ontario, extracted [2012/10/15]. Canadian Rates: Public Health Agency of Canada, Canadian Notifiable Disease Section, received by PHO [2012/09/24]; national data available up to 2008].

Reportable Disease Trends in Ontario 2011 83
Table 1-31. Incidence of Shigellosis by Age and Sex: Ontario, 2011
Age Group (Years)
Female Male Total
Cases Rates per 100,000
population Cases
Rates per 100,000 population
Cases Rates per 100,000
population
0-4 18 5.11 17 4.60 35 4.85
5-9 14 3.96 16 4.27 30 4.12
10-19 11 1.38 8 0.96 19 1.16
20-29 15 1.62 24 2.52 39 2.07
30-39 20 2.19 15 1.70 35 1.95
40-49 15 1.46 31 3.00 46 2.23
50-59 11 1.15 15 1.59 26 1.37
60-69 5 0.73 8 1.24 13 0.98
70+ 4 0.53 6 1.07 10 0.76
Total 113 1.67 140 2.12 253 1.89
Ontario Cases: MOHLTC, integrated Public Health Information System (iPHIS) database, extracted [2012/06/12]. Ontario Population: MOHLTC, intelliHEALTH Ontario, extracted [2012/10/15]. Note: Excludes two cases of unknown age and/or sex.
Figure 1-34. Incidence of Shigellosis by Age and Sex: Ontario, 2011
Ontario Cases: MOHLTC, integrated Public Health Information System (iPHIS) database, extracted [2012/06/12]. Ontario Population: MOHLTC, intelliHEALTH Ontario, extracted [2012/10/15]. Note: Excludes two cases of unknown age and/or sex.
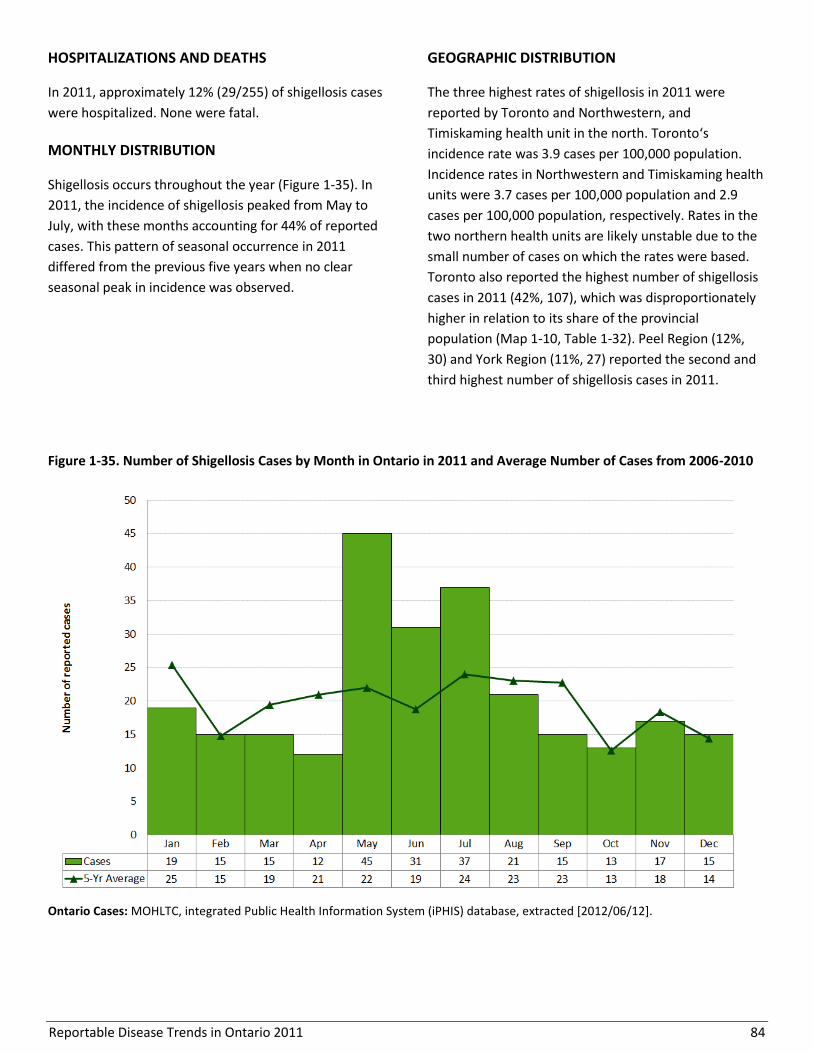
Reportable Disease Trends in Ontario 2011 84
HOSPITALIZATIONS AND DEATHS
In 2011, approximately 12% (29/255) of shigellosis cases
were hospitalized. None were fatal.
MONTHLY DISTRIBUTION
Shigellosis occurs throughout the year (Figure 1-35). In
2011, the incidence of shigellosis peaked from May to
July, with these months accounting for 44% of reported
cases. This pattern of seasonal occurrence in 2011
differed from the previous five years when no clear
seasonal peak in incidence was observed.
GEOGRAPHIC DISTRIBUTION
The three highest rates of shigellosis in 2011 were
reported by Toronto and Northwestern, and
Timiskaming health unit in the north. Toronto‘s
incidence rate was 3.9 cases per 100,000 population.
Incidence rates in Northwestern and Timiskaming health
units were 3.7 cases per 100,000 population and 2.9
cases per 100,000 population, respectively. Rates in the
two northern health units are likely unstable due to the
small number of cases on which the rates were based.
Toronto also reported the highest number of shigellosis
cases in 2011 (42%, 107), which was disproportionately
higher in relation to its share of the provincial
population (Map 1-10, Table 1-32). Peel Region (12%,
30) and York Region (11%, 27) reported the second and
third highest number of shigellosis cases in 2011.
Figure 1-35. Number of Shigellosis Cases by Month in Ontario in 2011 and Average Number of Cases from 2006-2010
Ontario Cases: MOHLTC, integrated Public Health Information System (iPHIS) database, extracted [2012/06/12].
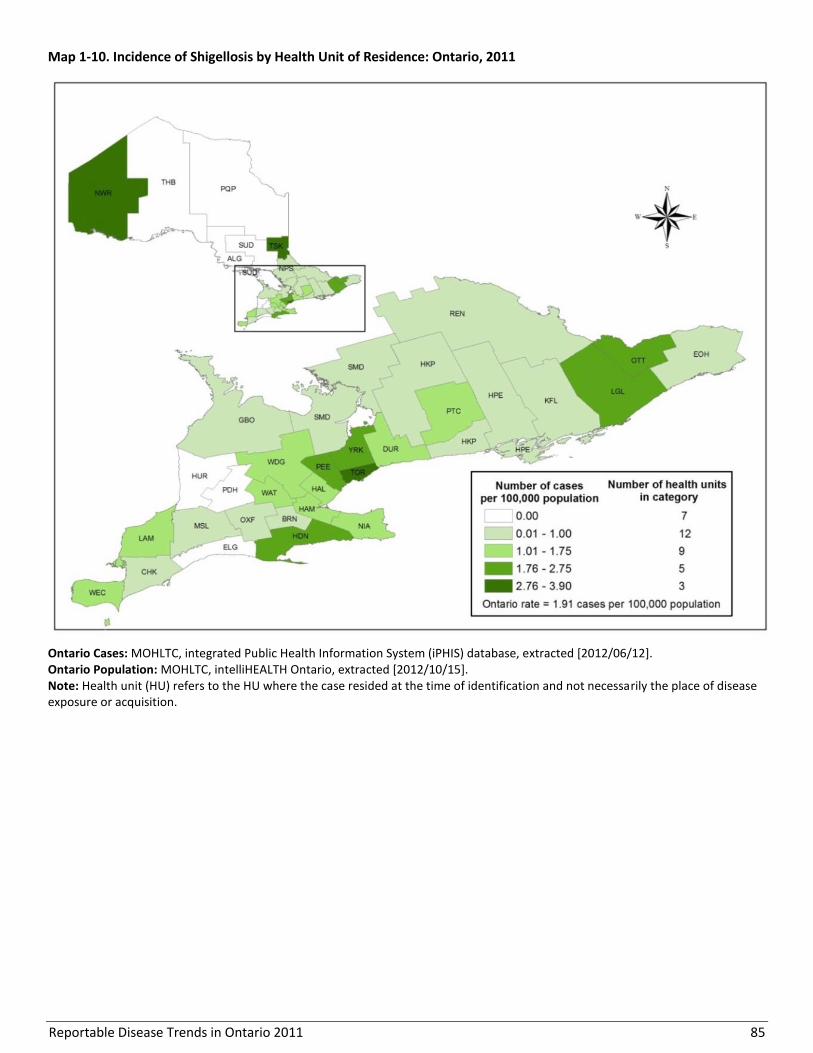
Reportable Disease Trends in Ontario 2011 85
Map 1-10. Incidence of Shigellosis by Health Unit of Residence: Ontario, 2011
Ontario Cases: MOHLTC, integrated Public Health Information System (iPHIS) database, extracted [2012/06/12]. Ontario Population: MOHLTC, intelliHEALTH Ontario, extracted [2012/10/15]. Note: Health unit (HU) refers to the HU where the case resided at the time of identification and not necessarily the place of disease exposure or acquisition.
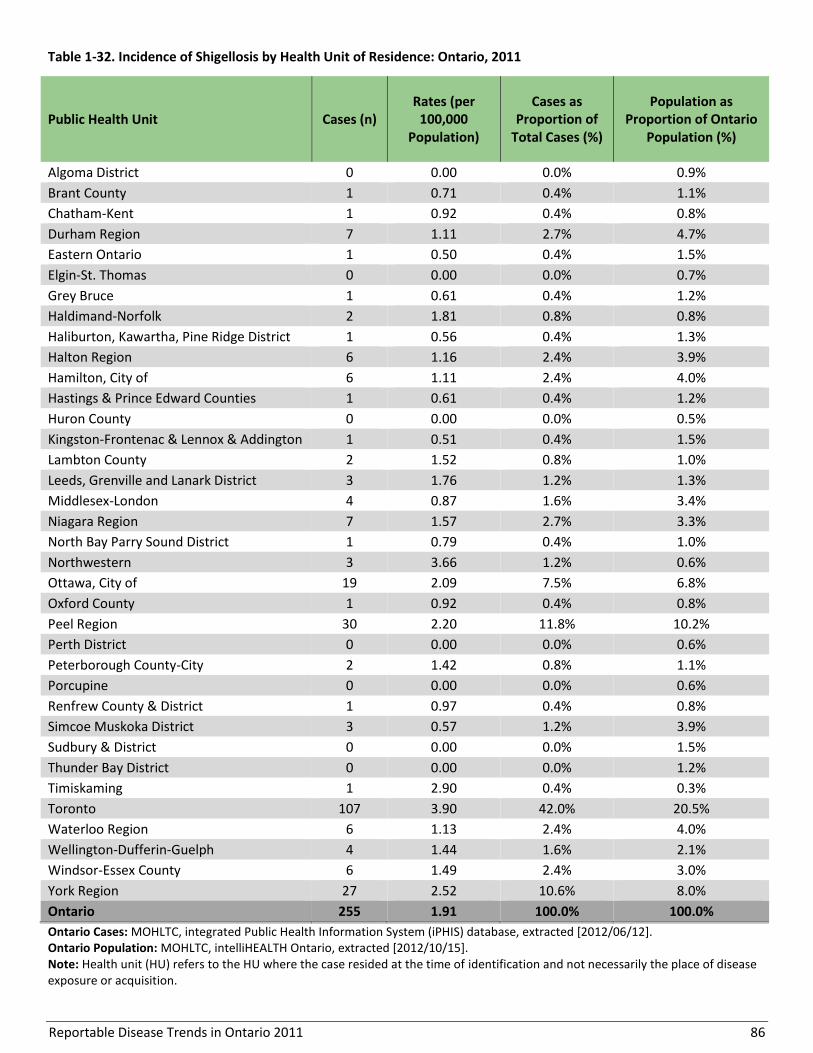
Reportable Disease Trends in Ontario 2011 86
Table 1-32. Incidence of Shigellosis by Health Unit of Residence: Ontario, 2011
Public Health Unit Cases (n) Rates (per
100,000 Population)
Cases as Proportion of
Total Cases (%)
Population as Proportion of Ontario
Population (%)
Algoma District 0 0.00 0.0% 0.9%
Brant County 1 0.71 0.4% 1.1%
Chatham-Kent 1 0.92 0.4% 0.8%
Durham Region 7 1.11 2.7% 4.7%
Eastern Ontario 1 0.50 0.4% 1.5%
Elgin-St. Thomas 0 0.00 0.0% 0.7%
Grey Bruce 1 0.61 0.4% 1.2%
Haldimand-Norfolk 2 1.81 0.8% 0.8%
Haliburton, Kawartha, Pine Ridge District 1 0.56 0.4% 1.3%
Halton Region 6 1.16 2.4% 3.9%
Hamilton, City of 6 1.11 2.4% 4.0%
Hastings & Prince Edward Counties 1 0.61 0.4% 1.2%
Huron County 0 0.00 0.0% 0.5%
Kingston-Frontenac & Lennox & Addington 1 0.51 0.4% 1.5%
Lambton County 2 1.52 0.8% 1.0%
Leeds, Grenville and Lanark District 3 1.76 1.2% 1.3%
Middlesex-London 4 0.87 1.6% 3.4%
Niagara Region 7 1.57 2.7% 3.3%
North Bay Parry Sound District 1 0.79 0.4% 1.0%
Northwestern 3 3.66 1.2% 0.6%
Ottawa, City of 19 2.09 7.5% 6.8%
Oxford County 1 0.92 0.4% 0.8%
Peel Region 30 2.20 11.8% 10.2%
Perth District 0 0.00 0.0% 0.6%
Peterborough County-City 2 1.42 0.8% 1.1%
Porcupine 0 0.00 0.0% 0.6%
Renfrew County & District 1 0.97 0.4% 0.8%
Simcoe Muskoka District 3 0.57 1.2% 3.9%
Sudbury & District 0 0.00 0.0% 1.5%
Thunder Bay District 0 0.00 0.0% 1.2%
Timiskaming 1 2.90 0.4% 0.3%
Toronto 107 3.90 42.0% 20.5%
Waterloo Region 6 1.13 2.4% 4.0%
Wellington-Dufferin-Guelph 4 1.44 1.6% 2.1%
Windsor-Essex County 6 1.49 2.4% 3.0%
York Region 27 2.52 10.6% 8.0%
Ontario 255 1.91 100.0% 100.0%
Ontario Cases: MOHLTC, integrated Public Health Information System (iPHIS) database, extracted [2012/06/12]. Ontario Population: MOHLTC, intelliHEALTH Ontario, extracted [2012/10/15]. Note: Health unit (HU) refers to the HU where the case resided at the time of identification and not necessarily the place of disease exposure or acquisition.

Reportable Disease Trends in Ontario 2011 87
REPORTED RISK FACTORS
Seventy-two percent (184/255) of shigellosis cases in
2011 reported at least one risk factor. Out of province
travel in the seven days before the onset of illness was
the most frequently reported risk factor at 53%. Anal-
oral contact (21%); consumption of or contact with
potentially contaminated water (17%); and consumption
of raw unwashed fruits, vegetables or unpasteurized
juices (15%) were also frequently reported by cases.
(Table 1-33).
Table 1-33. Reported Risk Factors for Shigellosis Cases:
Ontario, 2011 (n=184)
Risk Factors Cases
Number Percent
Travel outside Ontario 98 53.3%
Anal-oral contact 32 17.4%
Consumption of potentially contaminated water
32 16.8%
Recreational water contact 29 15.8%
Consumption of raw unwashed fruit or vegetable
28 15.2%
Consumption of ready-to-eat products
18 9.8%
Close contact with case 17 9.2%
Poor hand hygiene 11 6.0%
Other 33 17.9%
Unknown 20 10.9%
Ontario Cases: MOHLTC, integrated Public Health Information System (iPHIS) database, extracted [2012/06/12]. Notes: Interpret with caution. Risk factors not reported for all cases. Cases may report more than one risk factor. “Other” refers to the sum of risk factors reported as “Other, specify” and risk factors with frequency <4%. “Unknown” refers to risk factors reported solely as “Unknown”.
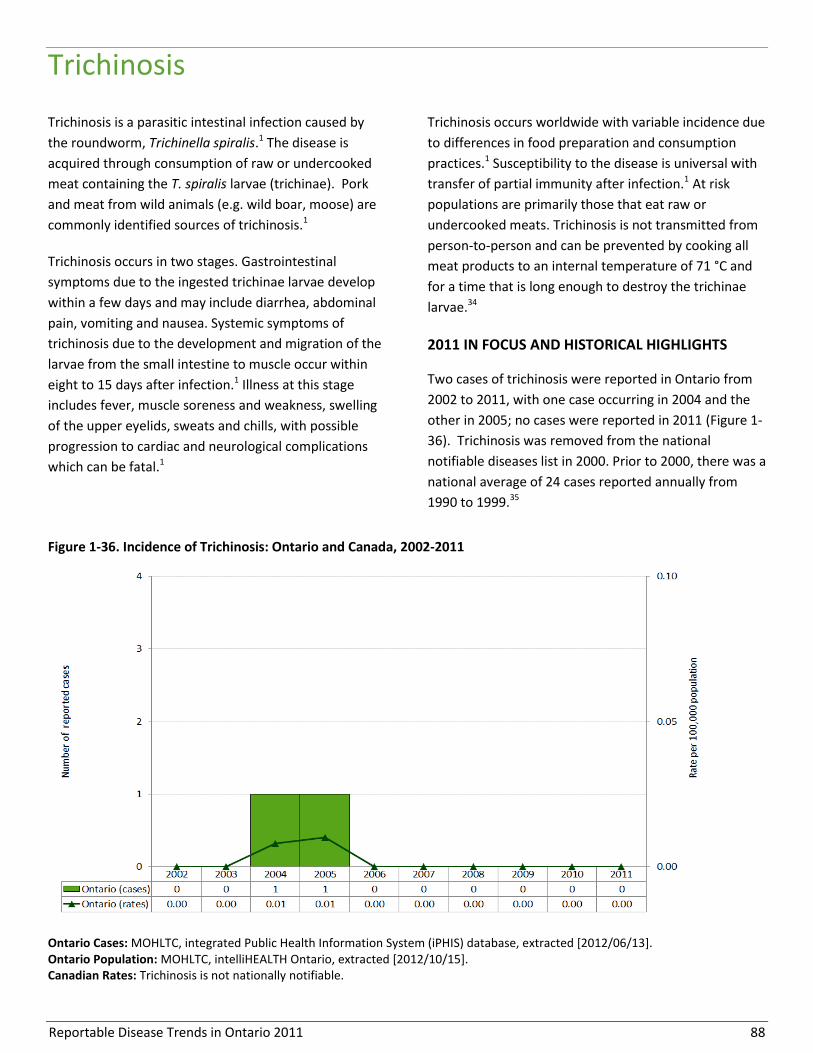
Reportable Disease Trends in Ontario 2011 88
Trichinosis
Trichinosis is a parasitic intestinal infection caused by
the roundworm, Trichinella spiralis.1 The disease is
acquired through consumption of raw or undercooked
meat containing the T. spiralis larvae (trichinae). Pork
and meat from wild animals (e.g. wild boar, moose) are
commonly identified sources of trichinosis.1
Trichinosis occurs in two stages. Gastrointestinal
symptoms due to the ingested trichinae larvae develop
within a few days and may include diarrhea, abdominal
pain, vomiting and nausea. Systemic symptoms of
trichinosis due to the development and migration of the
larvae from the small intestine to muscle occur within
eight to 15 days after infection.1 Illness at this stage
includes fever, muscle soreness and weakness, swelling
of the upper eyelids, sweats and chills, with possible
progression to cardiac and neurological complications
which can be fatal.1
Trichinosis occurs worldwide with variable incidence due
to differences in food preparation and consumption
practices.1 Susceptibility to the disease is universal with
transfer of partial immunity after infection.1 At risk
populations are primarily those that eat raw or
undercooked meats. Trichinosis is not transmitted from
person-to-person and can be prevented by cooking all
meat products to an internal temperature of 71 °C and
for a time that is long enough to destroy the trichinae
larvae.34
2011 IN FOCUS AND HISTORICAL HIGHLIGHTS
Two cases of trichinosis were reported in Ontario from
2002 to 2011, with one case occurring in 2004 and the
other in 2005; no cases were reported in 2011 (Figure 1-
36). Trichinosis was removed from the national
notifiable diseases list in 2000. Prior to 2000, there was a
national average of 24 cases reported annually from
1990 to 1999.35
Figure 1-36. Incidence of Trichinosis: Ontario and Canada, 2002-2011
Ontario Cases: MOHLTC, integrated Public Health Information System (iPHIS) database, extracted [2012/06/13]. Ontario Population: MOHLTC, intelliHEALTH Ontario, extracted [2012/10/15]. Canadian Rates: Trichinosis is not nationally notifiable.
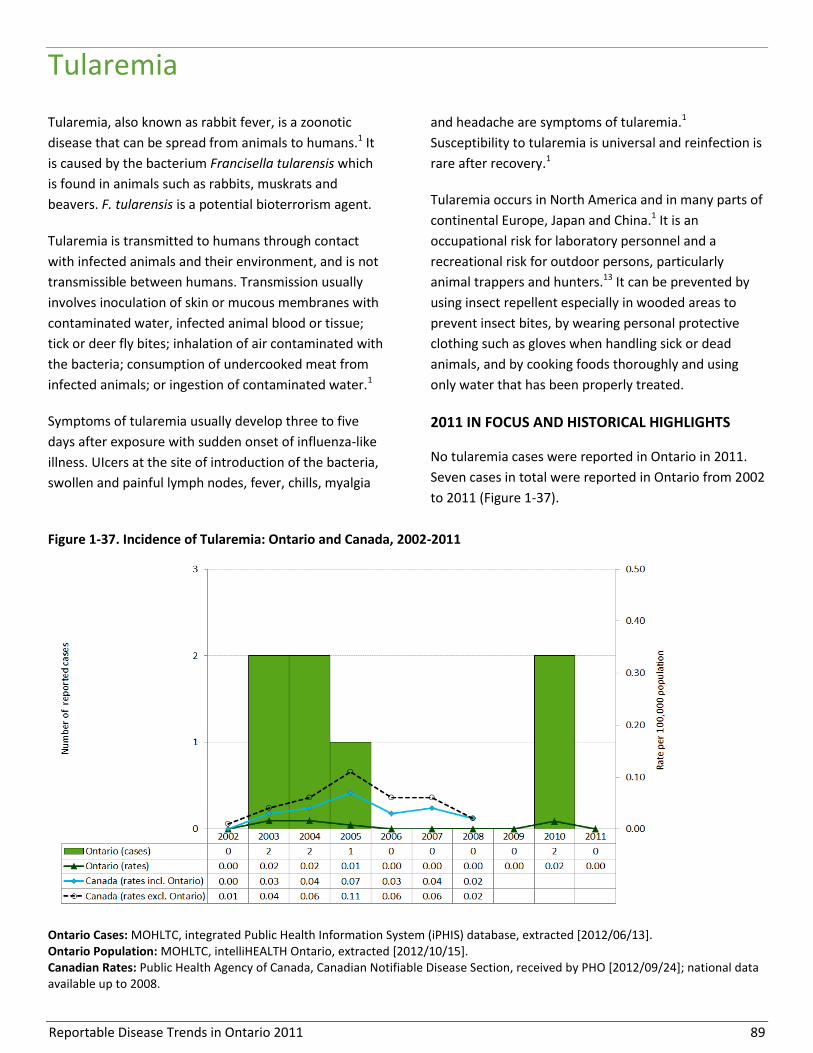
Reportable Disease Trends in Ontario 2011 89
Tularemia
Tularemia, also known as rabbit fever, is a zoonotic
disease that can be spread from animals to humans.1 It
is caused by the bacterium Francisella tularensis which
is found in animals such as rabbits, muskrats and
beavers. F. tularensis is a potential bioterrorism agent.
Tularemia is transmitted to humans through contact
with infected animals and their environment, and is not
transmissible between humans. Transmission usually
involves inoculation of skin or mucous membranes with
contaminated water, infected animal blood or tissue;
tick or deer fly bites; inhalation of air contaminated with
the bacteria; consumption of undercooked meat from
infected animals; or ingestion of contaminated water.1
Symptoms of tularemia usually develop three to five
days after exposure with sudden onset of influenza-like
illness. UIcers at the site of introduction of the bacteria,
swollen and painful lymph nodes, fever, chills, myalgia
and headache are symptoms of tularemia.1
Susceptibility to tularemia is universal and reinfection is
rare after recovery.1
Tularemia occurs in North America and in many parts of
continental Europe, Japan and China.1 It is an
occupational risk for laboratory personnel and a
recreational risk for outdoor persons, particularly
animal trappers and hunters.13 It can be prevented by
using insect repellent especially in wooded areas to
prevent insect bites, by wearing personal protective
clothing such as gloves when handling sick or dead
animals, and by cooking foods thoroughly and using
only water that has been properly treated.
2011 IN FOCUS AND HISTORICAL HIGHLIGHTS
No tularemia cases were reported in Ontario in 2011.
Seven cases in total were reported in Ontario from 2002
to 2011 (Figure 1-37).
Figure 1-37. Incidence of Tularemia: Ontario and Canada, 2002-2011
Ontario Cases: MOHLTC, integrated Public Health Information System (iPHIS) database, extracted [2012/06/13]. Ontario Population: MOHLTC, intelliHEALTH Ontario, extracted [2012/10/15]. Canadian Rates: Public Health Agency of Canada, Canadian Notifiable Disease Section, received by PHO [2012/09/24]; national data available up to 2008.

Reportable Disease Trends in Ontario 2011 90
Typhoid fever
The incidence of typhoid fever increased by
more than 50% between 2002 and 2011.
Persons under the age of 30 years had the
highest incidence rates of typhoid fever in
2011.
The majority of typhoid fever cases in 2011
were reported by Peel Region and Toronto.
Travel outside of Canada was the most
frequently reported exposure for typhoid
fever cases in 2011.
Typhoid fever occurs worldwide, commonly in countries
with poor sanitation. It is not endemic in Ontario, with
almost all cases associated with international travel.36
The disease is caused by Salmonella Typhi, for which
humans are the only reservoir. S. Typhi is part of the
same family of bacteria that causes salmonellosis, but
unlike salmonellosis, illness with typhoid fever results in
distinct systemic symptoms that are not limited to
gastrointestinal illness.1 Symptoms of typhoid fever
generally appear three to 60 days after exposure,
ranging from fever to severe systemic complications
such as intestinal damage, brain damage and delirium.1
However, in most cases, symptoms manifest as low-
grade fever, anorexia, headache, myalgia, malaise or
abdominal pain.1 Rose-coloured spots may also occur on
the trunk within the first week.1
Following infection, some people may become
symptom-free chronic carriers of S. Typhi with the
ability to transmit the bacteria through the fecal-oral
route.1 Typhoid fever is transmitted through ingestion
of food, water or beverages contaminated by the feces
of infected persons and carriers.1 Contaminated foods
such as milk, ice-cream, raw fruit and vegetables
fertilized with raw sewage, and shellfish harvested from
contaminated water have been implicated as sources of
typhoid fever. In Canada, travelers to endemic countries
have the highest risk of infection, but susceptibility and
illness severity is higher among those who are
immunocompromised or have low stomach acid
levels.36,1 A vaccine against typhoid fever is available for
travelers to endemic countries and certain other high
risk groups.37
2011 IN FOCUS AND HISTORICAL HIGHLIGHTS
Typhoid fever accounted for one percent of enteric
disease cases reported in Ontario in 2011, with 103
reported cases (Figure 1-38). Over the ten-year period
from 2002 to 2011, the incidence rate of typhoid fever
increased by 54%. In 2002, the incidence rate was 0.50
cases per 100,000 population compared to 0.77 cases
per 100,000 population in 2011.
Since 2006, the national trend in the incidence rate of
typhoid fever has followed a similar pattern of increase,
but with rates that have been consistently lower than
Ontario’s. In 2008, the most recent year for which
national data are available, the incidence rate for
typhoid fever for the rest of Canada was more than 50%
lower than that of Ontario. The incidence rate for
typhoid fever for the rest of Canada (i.e. excluding
Ontario) in 2008 was 0.39 cases per 100,000 population
compared to 0.74 cases per 100,000 population for
Ontario. Higher incidence rates in Ontario are likely
reflective of migration patterns that see a larger share
of newcomers from typhoid endemic countries settling
in the province.22
AGE AND SEX DISTRIBUTION
In 2011, the incidence of typhoid fever decreased with
increasing age, with the highest incidence rates
occurring in individuals under the age of 30 years.
Persons in this age range accounted for 69% of typhoid
fever cases reported in Ontario in 2011 (Table 1-34,
Figure 1-39). Overall, cases reported in 2011 ranged in
age from one to 69 years, with a median age of 23
years.
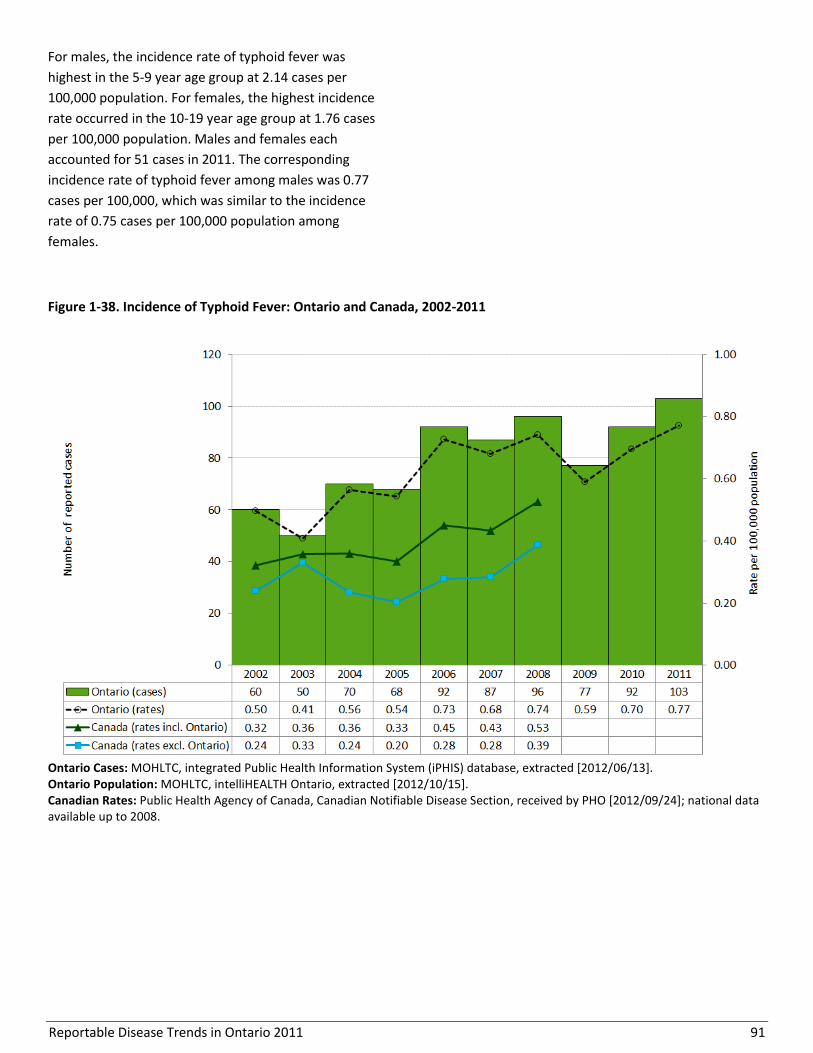
Reportable Disease Trends in Ontario 2011 91
For males, the incidence rate of typhoid fever was
highest in the 5-9 year age group at 2.14 cases per
100,000 population. For females, the highest incidence
rate occurred in the 10-19 year age group at 1.76 cases
per 100,000 population. Males and females each
accounted for 51 cases in 2011. The corresponding
incidence rate of typhoid fever among males was 0.77
cases per 100,000, which was similar to the incidence
rate of 0.75 cases per 100,000 population among
females.
Figure 1-38. Incidence of Typhoid Fever: Ontario and Canada, 2002-2011
Ontario Cases: MOHLTC, integrated Public Health Information System (iPHIS) database, extracted [2012/06/13]. Ontario Population: MOHLTC, intelliHEALTH Ontario, extracted [2012/10/15]. Canadian Rates: Public Health Agency of Canada, Canadian Notifiable Disease Section, received by PHO [2012/09/24]; national data available up to 2008.

Reportable Disease Trends in Ontario 2011 92
Table 1-34. Incidence of Typhoid Fever by Age and Sex: Ontario, 2011
Age Group (Years)
Female Male Total
Cases Rates per 100,000
population Cases
Rates per 100,000 population
Cases Rates per 100,000
population
0-4 5 1.42 7 1.89 12 1.66
5-9 5 1.41 8 2.14 13 1.79
10-19 14 1.76 6 0.72 20 1.23
20-29 13 1.40 13 1.36 26 1.38
30-39 6 0.66 5 0.57 11 0.61
40-49 5 0.49 6 0.58 11 0.53
50-59 2 0.21 3 0.32 5 0.26
60-69 1 0.15 3 0.46 4 0.30
70+ 0 0.00 0 0.00 0 0.00
Total 51 0.75 51 0.77 102 0.76
Ontario Cases: MOHLTC, integrated Public Health Information System (iPHIS) database, extracted [2012/06/13] Ontario Population: MOHLTC, intelliHEALTH Ontario, extracted [2012/10/15]. Note: Excludes one case of unknown age and sex.
Figure 1-39. Incidence of Typhoid Fever by Age and Sex: Ontario, 2011
Ontario Cases: MOHLTC, integrated Public Health Information System (iPHIS) database, extracted [2012/06/13]. Ontario Population: MOHLTC, intelliHEALTH Ontario, extracted [2012/10/15]. Note: Excludes one case of unknown age and/or sex.

Reportable Disease Trends in Ontario 2011 93
HOSPITALIZATIONS AND DEATHS
In 2011, approximately 31% (32/103) of typhoid fever
cases were hospitalized. No fatalities were reported
among cases in 2011.
MONTHLY DISTRIBUTION
Typhoid fever occurs throughout the year without any
clear seasonal trend (Figure 1-40). The distribution of
typhoid fever cases is reflective of travel patterns as
demonstrated by the high proportion of cases that are
associated with travel to endemic countries.
GEOGRAPHIC DISTRIBUTION
Thirteen (36%) health units reported cases of typhoid
fever in 2011 (Map 1-11, Table 1-35). Peel Region and
Toronto reported the highest number of cases. Toronto
reported 21 (25%) cases and Peel Region reported 51
(50%) cases. Peel Region and Toronto also had the
highest incidence rates of typhoid fever in 2011 with
3.73 and 0.95 cases per 100,000 population,
respectively. The higher incidence in these health units
compared to others may be attributed to more frequent
travel to areas where typhoid fever is endemic by
foreign-born residents who travel to their home
countries to maintain links with family and friends.21,22
Figure 1-40. Number of Typhoid Fever Cases by Month in Ontario in 2011 and Average Number of Cases from 2006-
2010
Ontario Cases: MOHLTC, integrated Public Health Information System (iPHIS) database, extracted [2012/06/13].

Reportable Disease Trends in Ontario 2011 94
Map 1-11. Incidence of Typhoid Fever by Health Unit of Residence: Ontario, 2011
Ontario Cases: MOHLTC, integrated Public Health Information System (iPHIS) database, extracted [2012/06/13]. Ontario Population: MOHLTC, intelliHEALTH Ontario, extracted [2012/10/15]. Note: Health unit (HU) refers to the HU where the case resided at the time of identification and not necessarily the place of disease exposure or acquisition.

Reportable Disease Trends in Ontario 2011 95
Table 1-35. Incidence of Typhoid Fever by Health Unit of Residence: Ontario, 2011
Public Health Unit Cases (n) Rates (per
100,000 Population)
Cases as Proportion of
Total Cases (%)
Proportion of Ontario
Population (%)
Algoma District 0 0.00 0.0% 0.9%
Brant County 0 0.00 0.0% 1.1%
Chatham-Kent 0 0.00 0.0% 0.8%
Durham Region 3 0.48 2.9% 4.7%
Eastern Ontario 0 0.00 0.0% 1.5%
Elgin-St. Thomas 0 0.00 0.0% 0.7%
Grey Bruce 0 0.00 0.0% 1.2%
Haldimand-Norfolk 0 0.00 0.0% 0.8%
Haliburton, Kawartha, Pine Ridge District 0 0.00 0.0% 1.3%
Halton Region 2 0.39 1.9% 3.9%
Hamilton, City of 2 0.37 1.9% 4.0%
Hastings & Prince Edward Counties 1 0.61 1.0% 1.2%
Huron County 0 0.00 0.0% 0.5%
Kingston-Frontenac & Lennox & Addington 0 0.00 0.0% 1.5%
Lambton County 0 0.00 0.0% 1.0%
Leeds, Grenville and Lanark District 0 0.00 0.0% 1.3%
Middlesex-London 1 0.22 1.0% 3.4%
Niagara Region 1 0.22 1.0% 3.3%
North Bay Parry Sound District 0 0.00 0.0% 1.0%
Northwestern 0 0.00 0.0% 0.6%
Ottawa, City of 4 0.44 3.9% 6.8%
Oxford County 0 0.00 0.0% 0.8%
Peel Region 51 3.73 49.5% 10.2%
Perth District 0 0.00 0.0% 0.6%
Peterborough County-City 0 0.00 0.0% 1.1%
Porcupine 0 0.00 0.0% 0.6%
Renfrew County & District 0 0.00 0.0% 0.8%
Simcoe Muskoka District 0 0.00 0.0% 3.9%
Sudbury & District 0 0.00 0.0% 1.5%
Thunder Bay District 0 0.00 0.0% 1.2%
Timiskaming 0 0.00 0.0% 0.3%
Toronto 26 0.95 25.2% 20.5%
Waterloo Region 2 0.38 1.9% 4.0%
Wellington-Dufferin-Guelph 2 0.72 1.9% 2.1%
Windsor-Essex County 2 0.50 1.9% 3.0%
York Region 6 0.56 5.8% 8.0%
Ontario 103 0.77 100.0% 100.0%
Ontario Cases: MOHLTC, integrated Public Health Information System (iPHIS) database, extracted [2012/06/13] Ontario Population: MOHLTC, intelliHEALTH Ontario, extracted [2012/10/15]. Note: Health unit (HU) refers to the HU where the case resided at the time of identification and not necessarily the place of disease exposure or acquisition.

Reportable Disease Trends in Ontario 2011 96
REPORTED RISK FACTORS AND EXPOSURES
Exposures and risk factors for typhoid fever were
reported by 101 of 103 typhoid fever cases reported in
Ontario in 2011. Of these cases, 95% (96/101) reported
travel outside of Canada as their most likely source of
exposure. The majority of these cases travelled to India,
Pakistan or Bangladesh (Table 1-36). Of the remaining
cases, one case had a workplace exposure to feces,
another was a close contact of a typhoid fever case and
three had unknown exposures or risks.
Table 1-36. Paratyphoid Fever Cases by Country of
Travel: Ontario, 2011 (n=96)
Country of Travel Cases
Number Percent
India 71 74.0%
Pakistan 11 11.5%
Bangladesh 5 5.2%
Other/unknown country 9 9.4%
Total 96 100.0%
Ontario Cases: MOHLTC, integrated Public Health Information System (iPHIS) database, extracted [2012/06/13]. Notes: Interpret with caution. Risk factors and/or exposures not reported for all cases. Cases may report more than one risk factor/exposure. Reported country of travel based on risk factors pertaining to travel and/or travel-related exposures.
Reportable Disease Trends in Ontario 2011 97
Verotoxin-producing E. coli
The annual incidence rate of Verotoxin-
producing Escherichia coli (VTEC) increased in
2011 after four years of consistent decline.
In 2011, the incidence rate of VTEC was
highest among persons under the age of ten
years.
VTEC cases occur throughout the year, but
most cases occur from May to October.
Verotoxin-producing Escherichia coli (VTEC) is the most
frequently identified strain of E. coli in North America
that causes diarrheal illness. It was first recognized in
1982 and is a part of a diverse group of bacteria that
live in the intestines of people and animals.1,13 However,
most strains of E. coli do not cause disease. Ruminants
such as cattle, sheep and goats are natural reservoirs of
E. coli bacteria.1
VTEC is transmitted through ingestion of food or water
that has been contaminated by the feces of infected
persons or animals.1 Contact with animals and their
surroundings and person-to-person contact where poor
hygiene practices occur are also important sources of
infection.1 Undercooked ground beef, fresh produce
such as lettuce, spinach and sprouts, unpasteurized milk
and fruit juices, and inadequately treated drinking
water have been implicated in large outbreaks of VTEC
in North America.1
Symptoms of VTEC usually occur three to four days after
exposure and may include bloody or non-bloody
diarrhea, vomiting and abdominal cramping lasting up
to five days. Susceptibility is universal, but children and
the elderly are more likely to develop severe illness and
complications including hemolytic uremic syndrome
(HUS). HUS occurs in up to 15% of infected children and
causes death in three to five percent of children.1,13
Proper personal hygiene and safe food handling
practices are key to preventing the spread of VTEC.1
2011 IN FOCUS AND HISTORICAL HIGHLIGHTS
VTEC accounted for two percent of all reported cases of
enteric diseases reported in Ontario in 2011. In that
year, 232 cases were reported for an incidence rate of
1.73 cases per 100,000 population (Figure 1-41). In
2011, the number of reported cases increased by 52% in
comparison to 2010 (153 cases), and by 40% in
comparison to 2009 (166 cases). Of VTEC cases reported
in 2011, 19% (44/234) were associated with clusters or
outbreaks ranging in size from three to thirteen cases.
The incidence rate of VTEC declined over the ten-year
period from 2002-2011. The incidence rate decreased
by 47%, down from 3.3 cases per 100,000 population in
2002 to 1.73 cases per 100,000 population in 2011. The
lowest number of cases and incidence rates during this
timeframe were in 2009 and 2010 (1.27 and 1.16 cases
per 100,000 population, respectively).
From 2002 to 2008, annual incidence rates of VTEC for
Canada were higher than Ontario’s with the exception
of 2003. Separate outbreaks in the City of Hamilton and
Halton Region in 2003 pushed Ontario’s incidence to its
highest in the ten-year period from 2002 to 2011.
AGE AND SEX DISTRIBUTION
The incidence rate for VTEC in 2011 was highest among
children and lowest among older adults for both males
and females. The highest rates occurred in the 0-4 and 5-
9 age groups (Table 1-37, Figure 1-42), which together
accounted for 28% of cases reported in 2011. Overall,
females accounted for 55% of cases in 2011 for an
incidence rate of 1.89 cases per 100,000 population. The
corresponding rate for males was 1.60 cases per 100,000
population. Overall, cases ranged in age from less than
one to 86 years, with a median age of 22 years.
The higher rates of VTEC observed among the younger
age groups may be reflective of children’s higher risk of
severe illness and complications such as HUS –
outcomes that are more likely to prompt parents and
guardians to seek medical attention.

Reportable Disease Trends in Ontario 2011 98
Figure 1-41. Incidence of VTEC: Ontario and Canada, 2002-2011
Ontario Cases: MOHLTC, integrated Public Health Information System (iPHIS) database, extracted [2012/06/13]. Ontario Population: MOHLTC, intelliHEALTH Ontario, extracted [2012/10/15]. Canadian Rates: Public Health Agency of Canada, Canadian Notifiable Disease Section, received by PHO [2012/09/24]; national data available up to 2008.
Table 1-37. Incidence of VTEC by Age and Sex: Ontario, 2011
Age Group (Years)
Female Male Total
Cases Rates per 100,000
population Cases
Rates per 100,000 population
Cases Rates per 100,000
population
0-4 22 6.24 16 4.33 38 5.26
5-9 11 3.11 15 4.01 26 3.57
10-19 19 2.38 15 1.80 34 2.08
20-29 24 2.59 23 2.41 47 2.50
30-39 13 1.42 5 0.57 18 1.00
40-49 8 0.78 5 0.48 13 0.63
50-59 12 1.25 9 0.96 21 1.11
60-69 8 1.16 7 1.08 15 1.13
70+ 11 1.44 9 1.60 20 1.51
Total 128 1.89 104 1.58 232 1.73
Ontario Cases: MOHLTC, integrated Public Health Information System (iPHIS) database, extracted [2012/06/13] Ontario Population: MOHLTC, intelliHEALTH Ontario, extracted [2012/10/15]
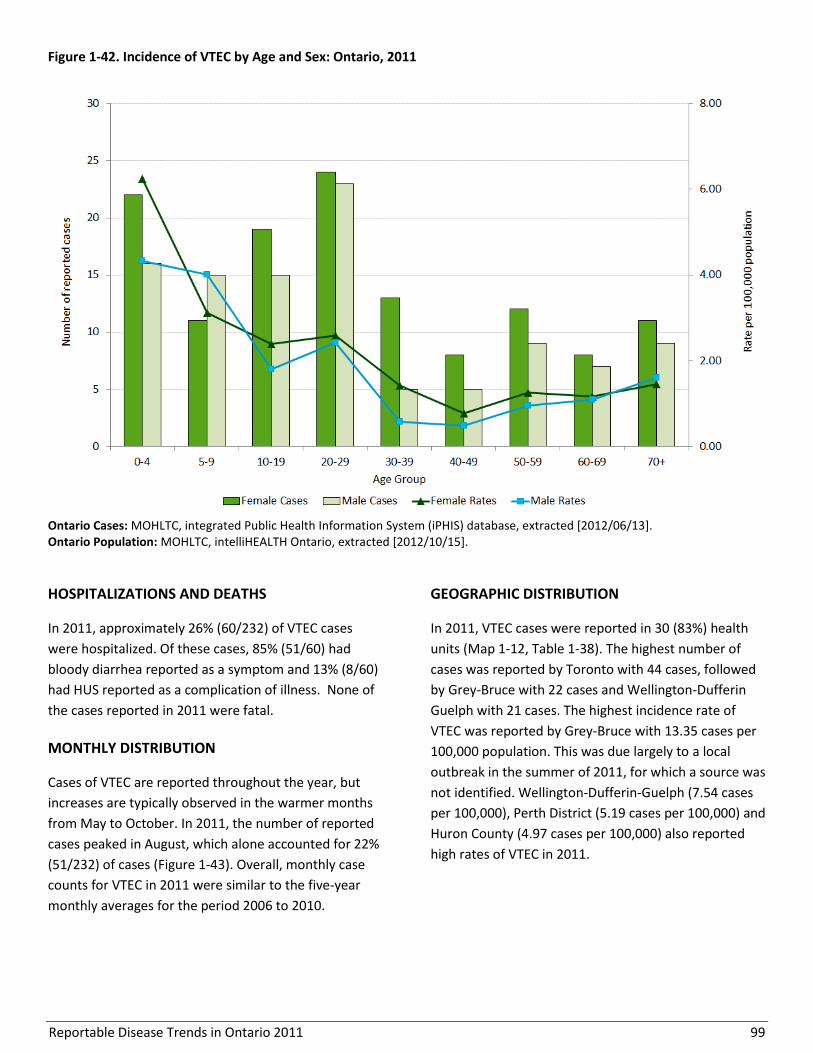
Reportable Disease Trends in Ontario 2011 99
Figure 1-42. Incidence of VTEC by Age and Sex: Ontario, 2011
Ontario Cases: MOHLTC, integrated Public Health Information System (iPHIS) database, extracted [2012/06/13]. Ontario Population: MOHLTC, intelliHEALTH Ontario, extracted [2012/10/15].
HOSPITALIZATIONS AND DEATHS
In 2011, approximately 26% (60/232) of VTEC cases
were hospitalized. Of these cases, 85% (51/60) had
bloody diarrhea reported as a symptom and 13% (8/60)
had HUS reported as a complication of illness. None of
the cases reported in 2011 were fatal.
MONTHLY DISTRIBUTION
Cases of VTEC are reported throughout the year, but
increases are typically observed in the warmer months
from May to October. In 2011, the number of reported
cases peaked in August, which alone accounted for 22%
(51/232) of cases (Figure 1-43). Overall, monthly case
counts for VTEC in 2011 were similar to the five-year
monthly averages for the period 2006 to 2010.
GEOGRAPHIC DISTRIBUTION
In 2011, VTEC cases were reported in 30 (83%) health
units (Map 1-12, Table 1-38). The highest number of
cases was reported by Toronto with 44 cases, followed
by Grey-Bruce with 22 cases and Wellington-Dufferin
Guelph with 21 cases. The highest incidence rate of
VTEC was reported by Grey-Bruce with 13.35 cases per
100,000 population. This was due largely to a local
outbreak in the summer of 2011, for which a source was
not identified. Wellington-Dufferin-Guelph (7.54 cases
per 100,000), Perth District (5.19 cases per 100,000) and
Huron County (4.97 cases per 100,000) also reported
high rates of VTEC in 2011.
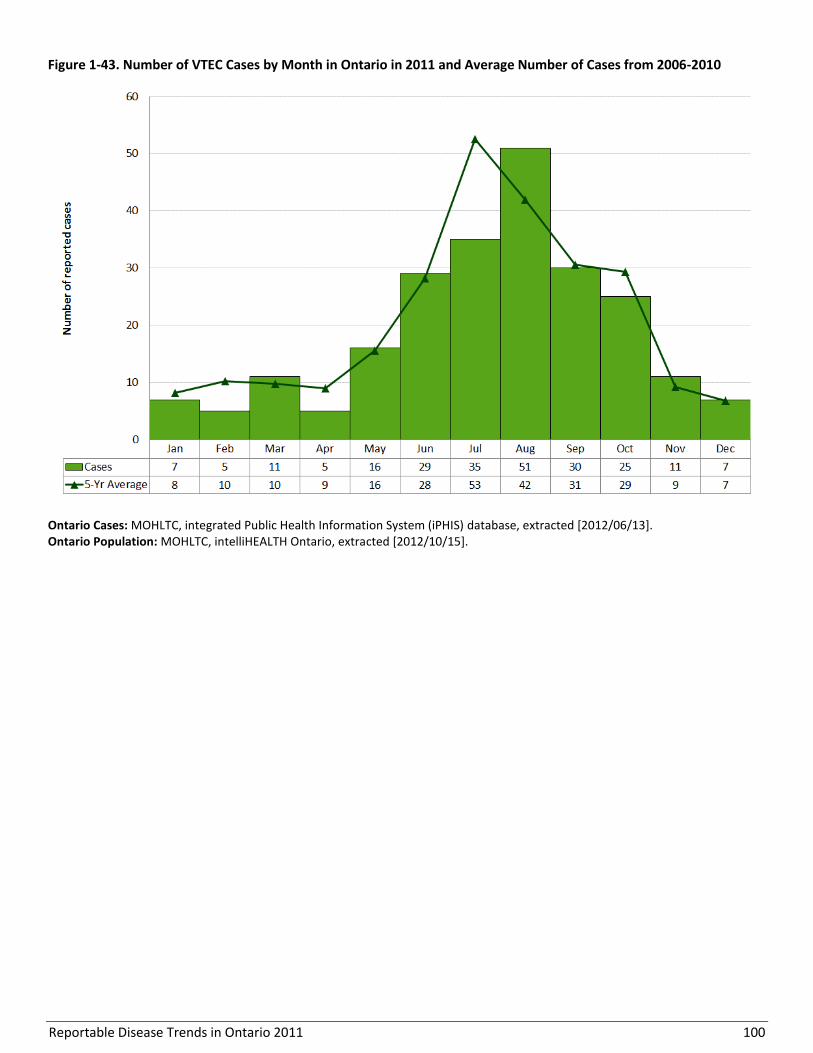
Reportable Disease Trends in Ontario 2011 100
Figure 1-43. Number of VTEC Cases by Month in Ontario in 2011 and Average Number of Cases from 2006-2010
Ontario Cases: MOHLTC, integrated Public Health Information System (iPHIS) database, extracted [2012/06/13]. Ontario Population: MOHLTC, intelliHEALTH Ontario, extracted [2012/10/15].

Reportable Disease Trends in Ontario 2011 101
Map 1-12. Incidence of VTEC by Health Unit of Residence: Ontario, 2011
Ontario Cases: MOHLTC, integrated Public Health Information System (iPHIS) database, extracted [2012/06/13]. Ontario Population: MOHLTC, intelliHEALTH Ontario, extracted [2012/10/15]. Note: Health unit (HU) refers to the HU where the case resided at the time of identification and not necessarily the place of disease exposure or acquisition.
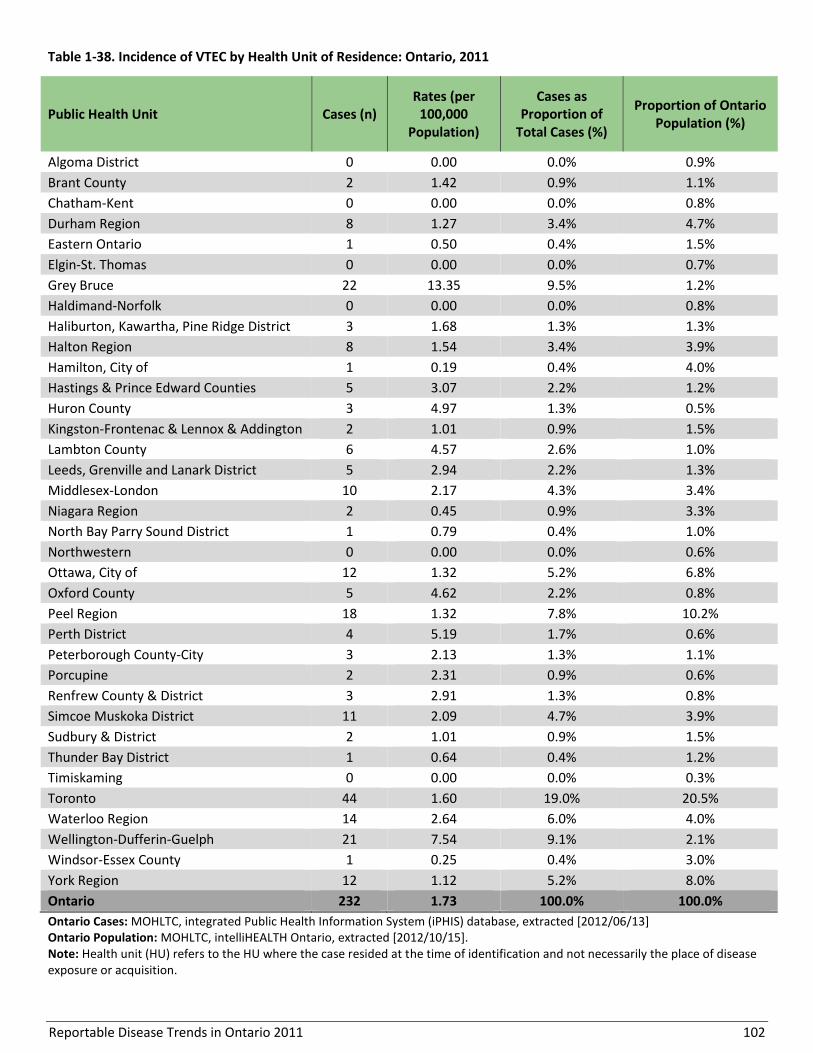
Reportable Disease Trends in Ontario 2011 102
Table 1-38. Incidence of VTEC by Health Unit of Residence: Ontario, 2011
Public Health Unit Cases (n) Rates (per
100,000 Population)
Cases as Proportion of
Total Cases (%)
Proportion of Ontario Population (%)
Algoma District 0 0.00 0.0% 0.9%
Brant County 2 1.42 0.9% 1.1%
Chatham-Kent 0 0.00 0.0% 0.8%
Durham Region 8 1.27 3.4% 4.7%
Eastern Ontario 1 0.50 0.4% 1.5%
Elgin-St. Thomas 0 0.00 0.0% 0.7%
Grey Bruce 22 13.35 9.5% 1.2%
Haldimand-Norfolk 0 0.00 0.0% 0.8%
Haliburton, Kawartha, Pine Ridge District 3 1.68 1.3% 1.3%
Halton Region 8 1.54 3.4% 3.9%
Hamilton, City of 1 0.19 0.4% 4.0%
Hastings & Prince Edward Counties 5 3.07 2.2% 1.2%
Huron County 3 4.97 1.3% 0.5%
Kingston-Frontenac & Lennox & Addington 2 1.01 0.9% 1.5%
Lambton County 6 4.57 2.6% 1.0%
Leeds, Grenville and Lanark District 5 2.94 2.2% 1.3%
Middlesex-London 10 2.17 4.3% 3.4%
Niagara Region 2 0.45 0.9% 3.3%
North Bay Parry Sound District 1 0.79 0.4% 1.0%
Northwestern 0 0.00 0.0% 0.6%
Ottawa, City of 12 1.32 5.2% 6.8%
Oxford County 5 4.62 2.2% 0.8%
Peel Region 18 1.32 7.8% 10.2%
Perth District 4 5.19 1.7% 0.6%
Peterborough County-City 3 2.13 1.3% 1.1%
Porcupine 2 2.31 0.9% 0.6%
Renfrew County & District 3 2.91 1.3% 0.8%
Simcoe Muskoka District 11 2.09 4.7% 3.9%
Sudbury & District 2 1.01 0.9% 1.5%
Thunder Bay District 1 0.64 0.4% 1.2%
Timiskaming 0 0.00 0.0% 0.3%
Toronto 44 1.60 19.0% 20.5%
Waterloo Region 14 2.64 6.0% 4.0%
Wellington-Dufferin-Guelph 21 7.54 9.1% 2.1%
Windsor-Essex County 1 0.25 0.4% 3.0%
York Region 12 1.12 5.2% 8.0%
Ontario 232 1.73 100.0% 100.0%
Ontario Cases: MOHLTC, integrated Public Health Information System (iPHIS) database, extracted [2012/06/13] Ontario Population: MOHLTC, intelliHEALTH Ontario, extracted [2012/10/15]. Note: Health unit (HU) refers to the HU where the case resided at the time of identification and not necessarily the place of disease exposure or acquisition.
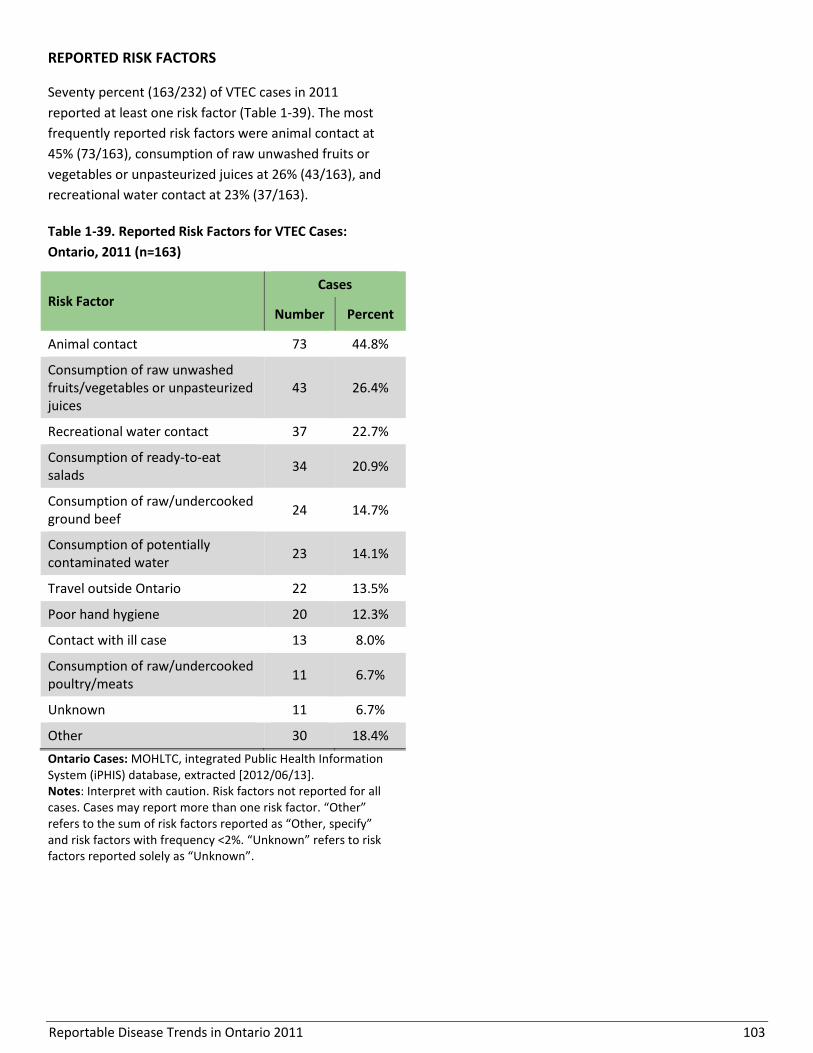
Reportable Disease Trends in Ontario 2011 103
REPORTED RISK FACTORS
Seventy percent (163/232) of VTEC cases in 2011
reported at least one risk factor (Table 1-39). The most
frequently reported risk factors were animal contact at
45% (73/163), consumption of raw unwashed fruits or
vegetables or unpasteurized juices at 26% (43/163), and
recreational water contact at 23% (37/163).
Table 1-39. Reported Risk Factors for VTEC Cases:
Ontario, 2011 (n=163)
Risk Factor Cases
Number Percent
Animal contact 73 44.8%
Consumption of raw unwashed fruits/vegetables or unpasteurized juices
43 26.4%
Recreational water contact 37 22.7%
Consumption of ready-to-eat salads
34 20.9%
Consumption of raw/undercooked ground beef
24 14.7%
Consumption of potentially contaminated water
23 14.1%
Travel outside Ontario 22 13.5%
Poor hand hygiene 20 12.3%
Contact with ill case 13 8.0%
Consumption of raw/undercooked poultry/meats
11 6.7%
Unknown 11 6.7%
Other 30 18.4%
Ontario Cases: MOHLTC, integrated Public Health Information System (iPHIS) database, extracted [2012/06/13]. Notes: Interpret with caution. Risk factors not reported for all cases. Cases may report more than one risk factor. “Other” refers to the sum of risk factors reported as “Other, specify” and risk factors with frequency <2%. “Unknown” refers to risk factors reported solely as “Unknown”.
Reportable Disease Trends in Ontario 2011 104
Yersiniosis
The incidence rate of yersiniosis in Ontario
declined by 50% from 2002 to 2011.
Children less than five years old had the
highest incidence rate of yersiniosis in 2011.
Out of province travel, animal contact and
consumption of pork and pork products were
the most commonly reported risk factors
among yersiniosis cases in Ontario in 2011.
Yersiniosis is caused by bacteria of the genus Yersinia.1
In North America, most cases in humans and animals
are due to Y. entercolitica.1 Animals, in particular pigs,
are the primary reservoir of yersiniosis.1 Transmission to
humans can occur through ingestion of contaminated
food or water, as well as through direct contact with the
feces of infected persons or animals. Raw and
undercooked pork and unpasteurized milk have been
identified as common food vehicles of infection.1
Following exposure, symptoms of yersiniosis occur
within three to seven days, and typically manifest as
diarrhea and fever with abdominal pain in young
children.1 In older children and adults, fever and
pseudo-appendicitis, which may be mistaken for
appendicitis, are the predominant symptoms. Globally,
approximately two-thirds of yersiniosis cases due to Y.
entercolitica occur among infants and children. While
susceptibility is universal, risk of severe illness is higher
in children due to dehydration resulting from diarrhea,
and in adolescents and older adults as a result of post-
infection arthritis.1 Persons with high levels of iron in
their blood are also more susceptible to infection and
have greater probability of septicemia (infection of the
blood stream).1
Yersiniosis can be prevented by avoiding consumption
of raw or undercooked pork products, unpasteurized
milk products, and untreated water, and by hand
washing with soap and running water before and after
handling food and after contact with animals and their
surroundings.1
2011 IN FOCUS AND HISTORICAL HIGHLIGHTS
Yersiniosis accounted for two percent of enteric disease
cases reported in Ontario in 2011. Two-hundred and
eleven cases were reported in that year, yielding a
provincial incidence rate of 1.58 cases per 100,000
population (Figure 1-44).
Over the ten-year period from 2002 to 2011, the
incidence rate of yersiniosis declined by 50% from 3.17
cases per 100,000 population in 2002 to 1.58 cases per
100,000 population in 2011.
Yersiniosis is not nationally notifiable, thus a
comparison between the Ontario and Canadian
incidence rates has not been provided.
AGE AND SEX DISTRIBUTION
Males (105) and females (106) each accounted for 50%
of yersiniosis cases reported in Ontario in 2011 (Table 1-
40, Figure 1-45). The corresponding incidence rates for
males and females were also similar at 1.59 and 1.56
cases per 100,000 population, respectively. Cases
ranged in age from less than one year to 94 years, with
a median age of 36 years. In 2011, the incidence of
yersiniosis decreased with increasing age for both males
and females, with children less than five years having
the highest incidence rate. Incidence in this age group
was 6.92 cases per 100,000 population, which was more
than four times higher than the overall rate for Ontario.
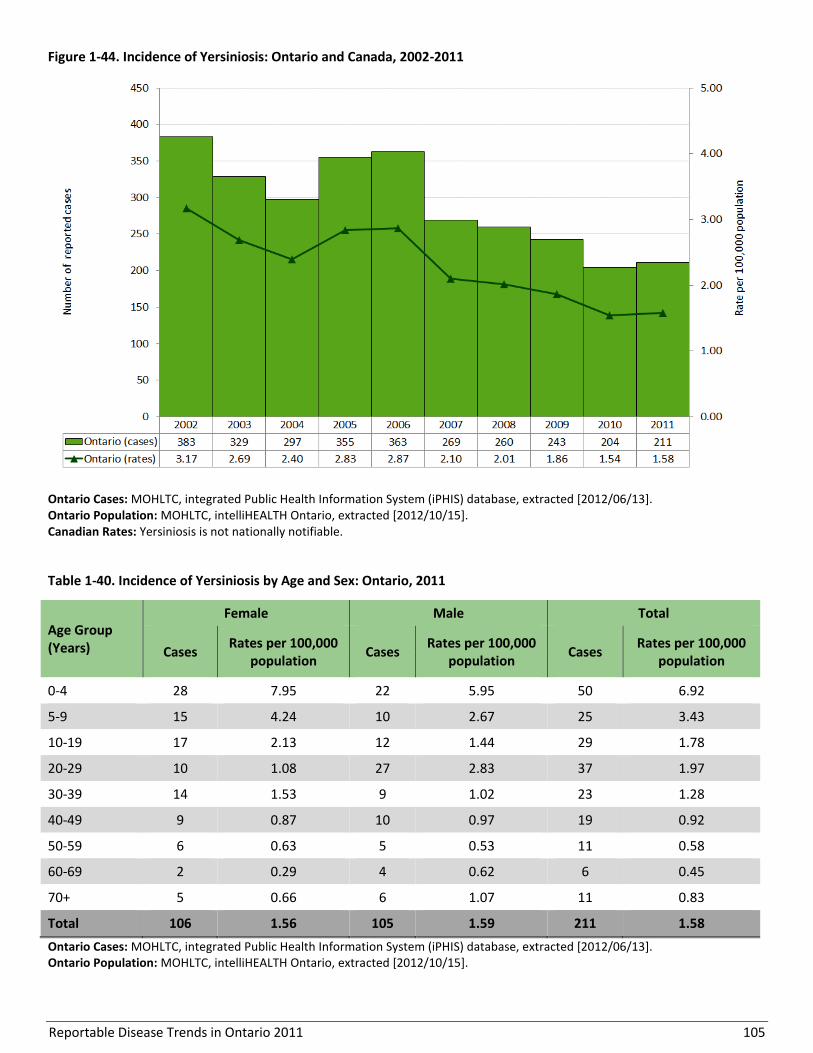
Reportable Disease Trends in Ontario 2011 105
Figure 1-44. Incidence of Yersiniosis: Ontario and Canada, 2002-2011
Ontario Cases: MOHLTC, integrated Public Health Information System (iPHIS) database, extracted [2012/06/13]. Ontario Population: MOHLTC, intelliHEALTH Ontario, extracted [2012/10/15]. Canadian Rates: Yersiniosis is not nationally notifiable.
Table 1-40. Incidence of Yersiniosis by Age and Sex: Ontario, 2011
Age Group (Years)
Female Male Total
Cases Rates per 100,000
population Cases
Rates per 100,000 population
Cases Rates per 100,000
population
0-4 28 7.95 22 5.95 50 6.92
5-9 15 4.24 10 2.67 25 3.43
10-19 17 2.13 12 1.44 29 1.78
20-29 10 1.08 27 2.83 37 1.97
30-39 14 1.53 9 1.02 23 1.28
40-49 9 0.87 10 0.97 19 0.92
50-59 6 0.63 5 0.53 11 0.58
60-69 2 0.29 4 0.62 6 0.45
70+ 5 0.66 6 1.07 11 0.83
Total 106 1.56 105 1.59 211 1.58
Ontario Cases: MOHLTC, integrated Public Health Information System (iPHIS) database, extracted [2012/06/13]. Ontario Population: MOHLTC, intelliHEALTH Ontario, extracted [2012/10/15].
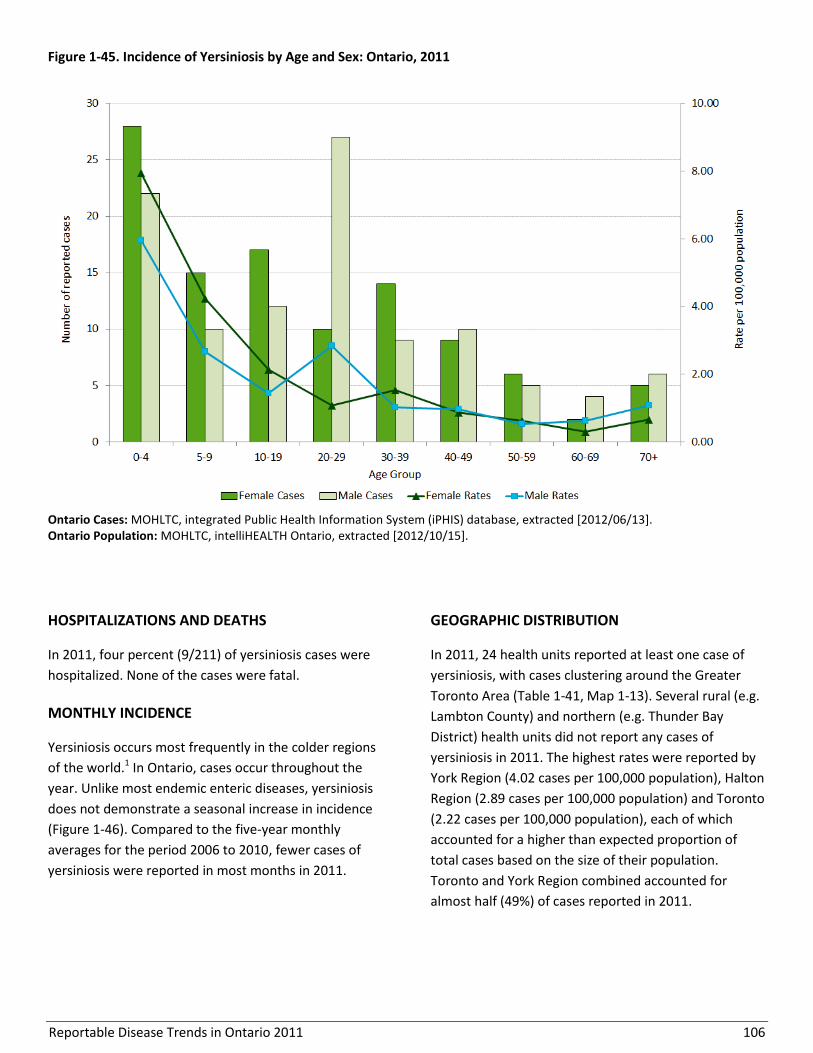
Reportable Disease Trends in Ontario 2011 106
Figure 1-45. Incidence of Yersiniosis by Age and Sex: Ontario, 2011
Ontario Cases: MOHLTC, integrated Public Health Information System (iPHIS) database, extracted [2012/06/13]. Ontario Population: MOHLTC, intelliHEALTH Ontario, extracted [2012/10/15].
HOSPITALIZATIONS AND DEATHS
In 2011, four percent (9/211) of yersiniosis cases were
hospitalized. None of the cases were fatal.
MONTHLY INCIDENCE
Yersiniosis occurs most frequently in the colder regions
of the world.1 In Ontario, cases occur throughout the
year. Unlike most endemic enteric diseases, yersiniosis
does not demonstrate a seasonal increase in incidence
(Figure 1-46). Compared to the five-year monthly
averages for the period 2006 to 2010, fewer cases of
yersiniosis were reported in most months in 2011.
GEOGRAPHIC DISTRIBUTION
In 2011, 24 health units reported at least one case of
yersiniosis, with cases clustering around the Greater
Toronto Area (Table 1-41, Map 1-13). Several rural (e.g.
Lambton County) and northern (e.g. Thunder Bay
District) health units did not report any cases of
yersiniosis in 2011. The highest rates were reported by
York Region (4.02 cases per 100,000 population), Halton
Region (2.89 cases per 100,000 population) and Toronto
(2.22 cases per 100,000 population), each of which
accounted for a higher than expected proportion of
total cases based on the size of their population.
Toronto and York Region combined accounted for
almost half (49%) of cases reported in 2011.

Reportable Disease Trends in Ontario 2011 107
Figure 1-46. Number of Yersiniosis Cases by Month in Ontario in 2011 and Average Number of Cases from 2006-2010
Ontario Cases: MOHLTC, integrated Public Health Information System (iPHIS) database, extracted [2012/06/13].

Reportable Disease Trends in Ontario 2011 108
Map 1-13. Incidence of Yersiniosis by Health Unit of Residence: Ontario, 2011
Ontario Cases: MOHLTC, integrated Public Health Information System (iPHIS) database, extracted [2012/06/13]. Ontario Population: MOHLTC, intelliHEALTH Ontario, extracted [2012/10/15]. Note: Health unit (HU) refers to the HU where the case resided at the time of identification and not necessarily the place of disease exposure or acquisition.

Reportable Disease Trends in Ontario 2011 109
Table 1-41. Incidence of Yersiniosis by Health Unit of Residence: Ontario, 2011
Public Health Unit Cases (n) Rates (per 100,000
Population)
Cases as Proportion of
Total Cases (%)
Proportion of Ontario
Population (%)
Algoma District 2 1.70 0.9% 0.9%
Brant County 1 0.71 0.5% 1.1%
Chatham-Kent 1 0.92 0.5% 0.8%
Durham Region 4 0.63 1.9% 4.7%
Eastern Ontario 0 0.00 0.0% 1.5%
Elgin-St. Thomas 0 0.00 0.0% 0.7%
Grey Bruce 2 1.21 0.9% 1.2%
Haldimand-Norfolk 2 1.81 0.9% 0.8%
Haliburton, Kawartha, Pine Ridge District 2 1.12 0.9% 1.3%
Halton Region 15 2.89 7.1% 3.9%
Hamilton, City of 4 0.74 1.9% 4.0%
Hastings & Prince Edward Counties 0 0.00 0.0% 1.2%
Huron County 0 0.00 0.0% 0.5%
Kingston-Frontenac & Lennox & Addington 2 1.01 0.9% 1.5%
Lambton County 0 0.00 0.0% 1.0%
Leeds, Grenville and Lanark District 3 1.76 1.4% 1.3%
Middlesex-London 5 1.08 2.4% 3.4%
Niagara Region 2 0.45 0.9% 3.3%
North Bay Parry Sound District 1 0.79 0.5% 1.0%
Northwestern 1 1.22 0.5% 0.6%
Ottawa, City of 6 0.66 2.8% 6.8%
Oxford County 0 0.00 0.0% 0.8%
Peel Region 29 2.12 13.7% 10.2%
Perth District 0 0.00 0.0% 0.6%
Peterborough County-City 0 0.00 0.0% 1.1%
Porcupine 0 0.00 0.0% 0.6%
Renfrew County & District 0 0.00 0.0% 0.8%
Simcoe Muskoka District 2 0.38 0.9% 3.9%
Sudbury & District 2 1.01 0.9% 1.5%
Thunder Bay District 0 0.00 0.0% 1.2%
Timiskaming 0 0.00 0.0% 0.3%
Toronto 61 2.22 28.9% 20.5%
Waterloo Region 9 1.70 4.3% 4.0%
Wellington-Dufferin-Guelph 6 2.15 2.8% 2.1%
Windsor-Essex County 6 1.49 2.8% 3.0%
York Region 43 4.02 20.4% 8.0%
Ontario 211 1.58 100.0% 100.0%
Ontario Cases: MOHLTC, integrated Public Health Information System (iPHIS) database, extracted [2012/06/13]. Ontario Population: MOHLTC, intelliHEALTH Ontario, extracted [2012/10/15]. Note: Health unit (HU) refers to the HU where the case resided at the time of identification and not necessarily the place of disease exposure or acquisition.
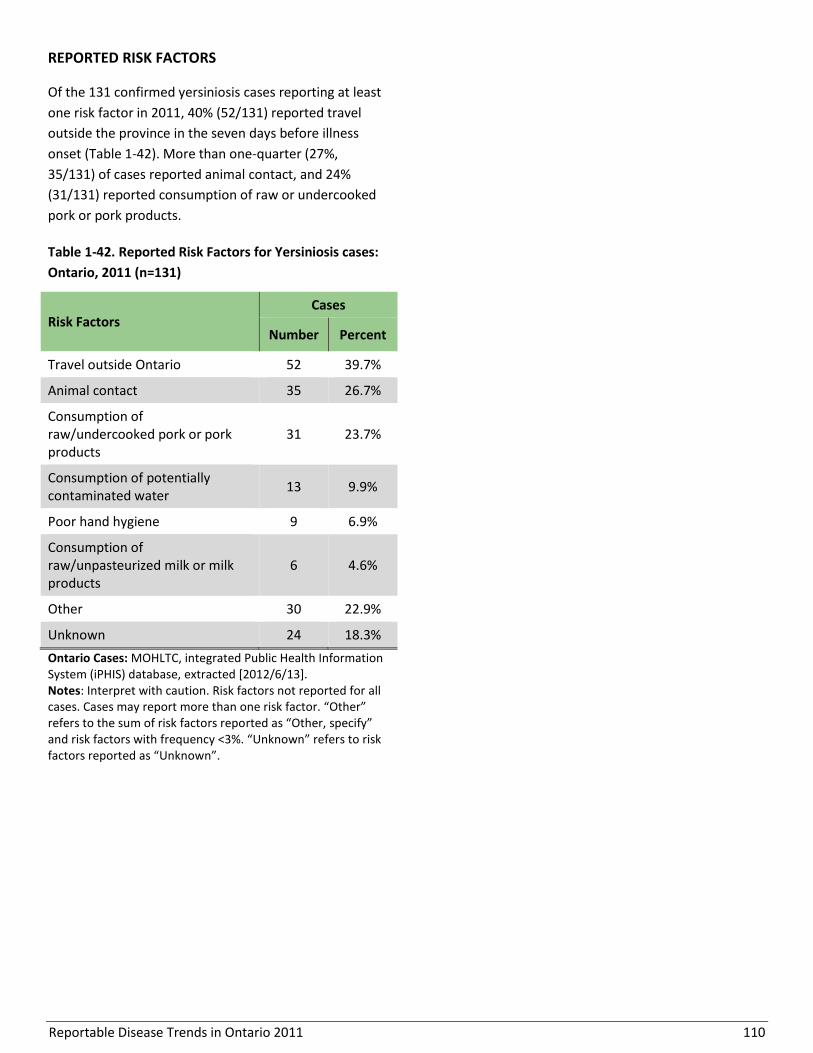
Reportable Disease Trends in Ontario 2011 110
REPORTED RISK FACTORS
Of the 131 confirmed yersiniosis cases reporting at least
one risk factor in 2011, 40% (52/131) reported travel
outside the province in the seven days before illness
onset (Table 1-42). More than one-quarter (27%,
35/131) of cases reported animal contact, and 24%
(31/131) reported consumption of raw or undercooked
pork or pork products.
Table 1-42. Reported Risk Factors for Yersiniosis cases:
Ontario, 2011 (n=131)
Risk Factors Cases
Number Percent
Travel outside Ontario 52 39.7%
Animal contact 35 26.7%
Consumption of raw/undercooked pork or pork products
31 23.7%
Consumption of potentially contaminated water
13 9.9%
Poor hand hygiene 9 6.9%
Consumption of raw/unpasteurized milk or milk products
6 4.6%
Other 30 22.9%
Unknown 24 18.3%
Ontario Cases: MOHLTC, integrated Public Health Information System (iPHIS) database, extracted [2012/6/13]. Notes: Interpret with caution. Risk factors not reported for all cases. Cases may report more than one risk factor. “Other” refers to the sum of risk factors reported as “Other, specify” and risk factors with frequency <3%. “Unknown” refers to risk factors reported as “Unknown”.
Reportable Disease Trends in Ontario 2011 111
Section 2
Respiratory diseases and diseases transmitted by direct contact
Overview
In Ontario, influenza, tuberculosis, invasive group A
streptococcal (iGAS) disease and legionellosis are the
most commonly reported diseases transmitted by direct
contact (not sexual) and respiratory routes. Although
these diseases affect individuals of all ages, they are
disproportionately reported among the elderly and also
result in relatively higher rates of hospitalization in this
population for influenza, iGAS and legionellosis. With
the exception of tuberculosis which has remained fairly
stable since 2007, the incidence of all other respiratory
diseases and diseases transmitted by direct contact has
increased since 2002.
Most cases of tuberculosis reported in Ontario occur
among foreign-born individuals who emigrated from
countries with relatively higher rates of tuberculosis
such as China, India and the Philippines.
The 2010/2011 influenza season was the first
surveillance season following the H1N1 pandemic. Case
counts were relatively high compared to pre-pandemic
seasons due in part to the established use of more
sensitive laboratory tests which started during the
pandemic.
No cases of severe acute respiratory syndrome (SARS)
have been reported in Ontario since the end of the
outbreak in 2003 when the disease first emerged.
Several quick reference data tables for the diseases covered in this section are included in Appendix 4.
Reportable Disease Trends in Ontario 2011 112
Group A streptococcal disease, invasive
The incidence rate of invasive group A
streptococcal disease (iGAS) in Ontario
increased over the ten-year period from 2002
to 2011.
Cases in the 70 year and older age group had
the highest incidence rate of iGAS, accounting
for 24% of cases that occurred in 2011.
Emm1, emm3, emm89 and emm12 were the
most commonly reported emm types among
iGAS cases that specified an emm type in
2011.
In 2011, approximately 67% of iGAS cases
were hospitalized; nine percent were fatal.
Group A Streptococcus pyogenes (GAS) causes a variety
of diseases that range in severity from mild illness such
as strep throat and impetigo to more serious diseases
that are invasive in nature. Invasive GAS (iGAS) disease
occurs when sterile body tissues such as blood or
cerebrospinal fluid become infected with GAS.38 Severe
invasive disease may manifest as septicemia or
bacteremia (bloodstream infections), pneumonia, and
less commonly as streptococcal toxic shock syndrome
(STSS), myositis and necrotizing fasciitis (NF) or flesh
eating disease.38,1 The mortality rate for myositis and NF
is about 20% compared to up to 81% for STSS.
GAS is commonly transmitted from person-to-person
through direct or indirect contact with1 secretions or
droplets from the nose or throat of infected persons or
healthy carriers of the bacterium.38 Symptoms of GAS
usually develop within one to three days of exposure.1
Healthy individuals can get iGAS disease, although this is
rare.38,1 However, chronic conditions such as cancer,
diabetes and lung disease; use of medications
containing steroids; injection drug use; alcohol abuse
and soft tissue damage all increase the risk of
developing iGAS disease.38 Hand washing, covering
coughs and sneezes and prompt treatment with
prophylactic antibiotics for close contacts of infected
persons are effective measures in preventing the spread
of GAS.38,39 Protecting broken skin from contamination
also reduces the risk of infection.39
2011 IN FOCUS AND HISTORICAL HIGHLIGHTS
In 2011, 678 cases of iGAS disease were reported in
Ontario, which corresponds to an incidence rate of 5.07
cases per 100,000 population and a 21% increase
compared to the 2010 total of 561 cases (Figure 2-1).
Over the ten year period from 2002 to 2011, the
incidence rate of iGAS showed a gradual increase of
59%, up from 3.18 cases per 100,000 population in 2002
to 5.07 cases per 100,000 population in 2011 (Figure 2-
1). The reason for the overall increase in iGAS in Ontario
over this period, and in 2010 and 2011, is not fully
understood. The increases in incidence of iGAS in 2007
and 2008 were attributed to an outbreak in Thunder
Bay District Health Unit that spanned both years. This
outbreak was due largely to the Emm59 type of iGAS.
National incidence rates for iGAS were comparable to
Ontario’s over the period from 2002 to 2008. In 2008,
the most recent year for which national data is
available, the Canadian incidence rate for iGAS was
higher than that of Ontario (Figure 2-1).
EMM TYPES
Emm1 (23%), emm3 (14%), emm89 (11%) and emm12
(9%) were the most commonly reported emm types
among iGAS cases that specified an emm type in 2011
(268/678). Less than two percent of iGAS cases in 2011
were due to emm59, which was the predominant emm
type in the 2007-08 outbreak in Thunder Bay (Table 2-
1).
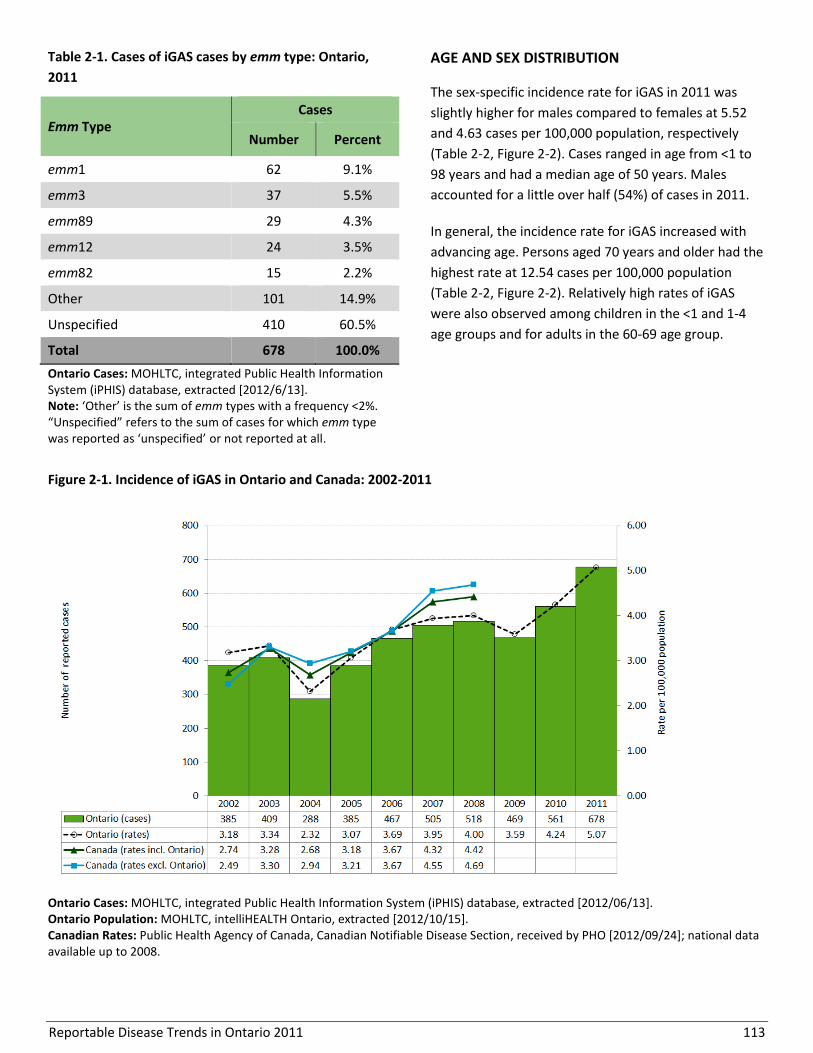
Reportable Disease Trends in Ontario 2011 113
Table 2-1. Cases of iGAS cases by emm type: Ontario,
2011
Emm Type Cases
Number Percent
emm1 62 9.1%
emm3 37 5.5%
emm89 29 4.3%
emm12 24 3.5%
emm82 15 2.2%
Other 101 14.9%
Unspecified 410 60.5%
Total 678 100.0%
Ontario Cases: MOHLTC, integrated Public Health Information System (iPHIS) database, extracted [2012/6/13]. Note: ‘Other’ is the sum of emm types with a frequency <2%. “Unspecified” refers to the sum of cases for which emm type was reported as ‘unspecified’ or not reported at all.
AGE AND SEX DISTRIBUTION
The sex-specific incidence rate for iGAS in 2011 was
slightly higher for males compared to females at 5.52
and 4.63 cases per 100,000 population, respectively
(Table 2-2, Figure 2-2). Cases ranged in age from <1 to
98 years and had a median age of 50 years. Males
accounted for a little over half (54%) of cases in 2011.
In general, the incidence rate for iGAS increased with
advancing age. Persons aged 70 years and older had the
highest rate at 12.54 cases per 100,000 population
(Table 2-2, Figure 2-2). Relatively high rates of iGAS
were also observed among children in the <1 and 1-4
age groups and for adults in the 60-69 age group.
Figure 2-1. Incidence of iGAS in Ontario and Canada: 2002-2011
Ontario Cases: MOHLTC, integrated Public Health Information System (iPHIS) database, extracted [2012/06/13]. Ontario Population: MOHLTC, intelliHEALTH Ontario, extracted [2012/10/15]. Canadian Rates: Public Health Agency of Canada, Canadian Notifiable Disease Section, received by PHO [2012/09/24]; national data available up to 2008.
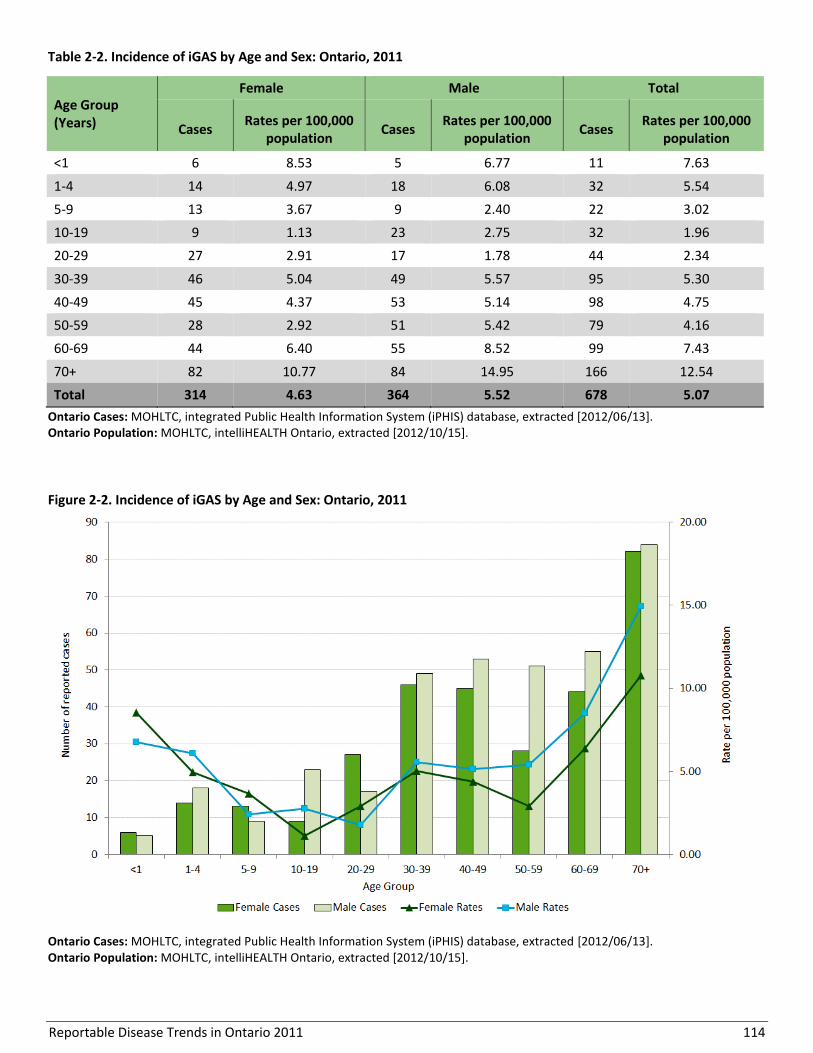
Reportable Disease Trends in Ontario 2011 114
Table 2-2. Incidence of iGAS by Age and Sex: Ontario, 2011
Ontario Cases: MOHLTC, integrated Public Health Information System (iPHIS) database, extracted [2012/06/13]. Ontario Population: MOHLTC, intelliHEALTH Ontario, extracted [2012/10/15].
Figure 2-2. Incidence of iGAS by Age and Sex: Ontario, 2011
Ontario Cases: MOHLTC, integrated Public Health Information System (iPHIS) database, extracted [2012/06/13]. Ontario Population: MOHLTC, intelliHEALTH Ontario, extracted [2012/10/15].
Age Group (Years)
Female Male Total
Cases Rates per 100,000
population Cases
Rates per 100,000 population
Cases Rates per 100,000
population
<1 6 8.53 5 6.77 11 7.63
1-4 14 4.97 18 6.08 32 5.54
5-9 13 3.67 9 2.40 22 3.02
10-19 9 1.13 23 2.75 32 1.96
20-29 27 2.91 17 1.78 44 2.34
30-39 46 5.04 49 5.57 95 5.30
40-49 45 4.37 53 5.14 98 4.75
50-59 28 2.92 51 5.42 79 4.16
60-69 44 6.40 55 8.52 99 7.43
70+ 82 10.77 84 14.95 166 12.54
Total 314 4.63 364 5.52 678 5.07
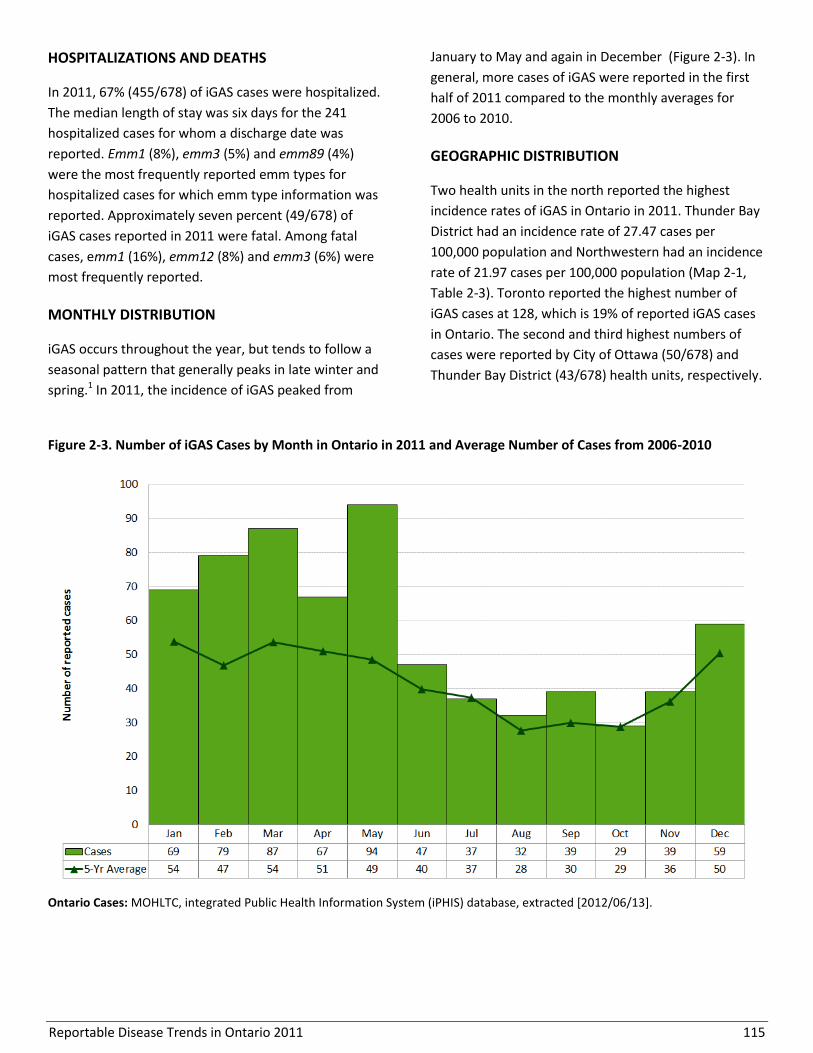
Reportable Disease Trends in Ontario 2011 115
HOSPITALIZATIONS AND DEATHS
In 2011, 67% (455/678) of iGAS cases were hospitalized.
The median length of stay was six days for the 241
hospitalized cases for whom a discharge date was
reported. Emm1 (8%), emm3 (5%) and emm89 (4%)
were the most frequently reported emm types for
hospitalized cases for which emm type information was
reported. Approximately seven percent (49/678) of
iGAS cases reported in 2011 were fatal. Among fatal
cases, emm1 (16%), emm12 (8%) and emm3 (6%) were
most frequently reported.
MONTHLY DISTRIBUTION
iGAS occurs throughout the year, but tends to follow a
seasonal pattern that generally peaks in late winter and
spring.1 In 2011, the incidence of iGAS peaked from
January to May and again in December (Figure 2-3). In
general, more cases of iGAS were reported in the first
half of 2011 compared to the monthly averages for
2006 to 2010.
GEOGRAPHIC DISTRIBUTION
Two health units in the north reported the highest
incidence rates of iGAS in Ontario in 2011. Thunder Bay
District had an incidence rate of 27.47 cases per
100,000 population and Northwestern had an incidence
rate of 21.97 cases per 100,000 population (Map 2-1,
Table 2-3). Toronto reported the highest number of
iGAS cases at 128, which is 19% of reported iGAS cases
in Ontario. The second and third highest numbers of
cases were reported by City of Ottawa (50/678) and
Thunder Bay District (43/678) health units, respectively.
Figure 2-3. Number of iGAS Cases by Month in Ontario in 2011 and Average Number of Cases from 2006-2010
Ontario Cases: MOHLTC, integrated Public Health Information System (iPHIS) database, extracted [2012/06/13].
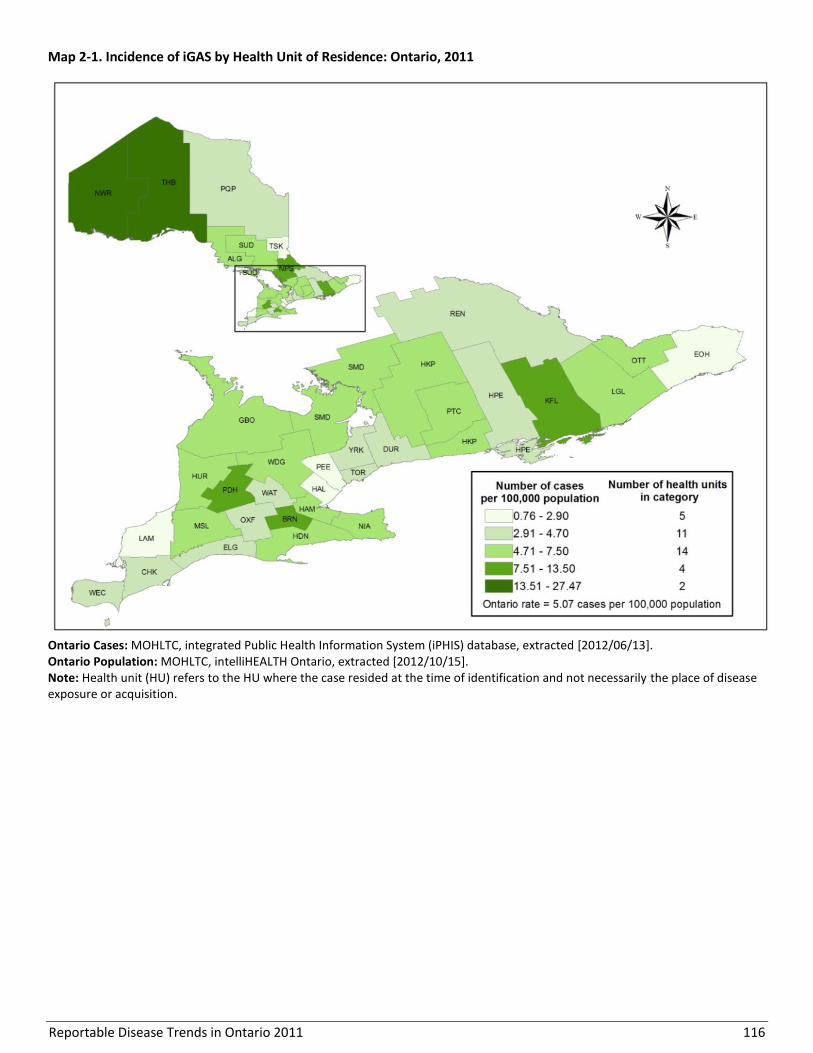
Reportable Disease Trends in Ontario 2011 116
Map 2-1. Incidence of iGAS by Health Unit of Residence: Ontario, 2011
Ontario Cases: MOHLTC, integrated Public Health Information System (iPHIS) database, extracted [2012/06/13]. Ontario Population: MOHLTC, intelliHEALTH Ontario, extracted [2012/10/15]. Note: Health unit (HU) refers to the HU where the case resided at the time of identification and not necessarily the place of disease exposure or acquisition.
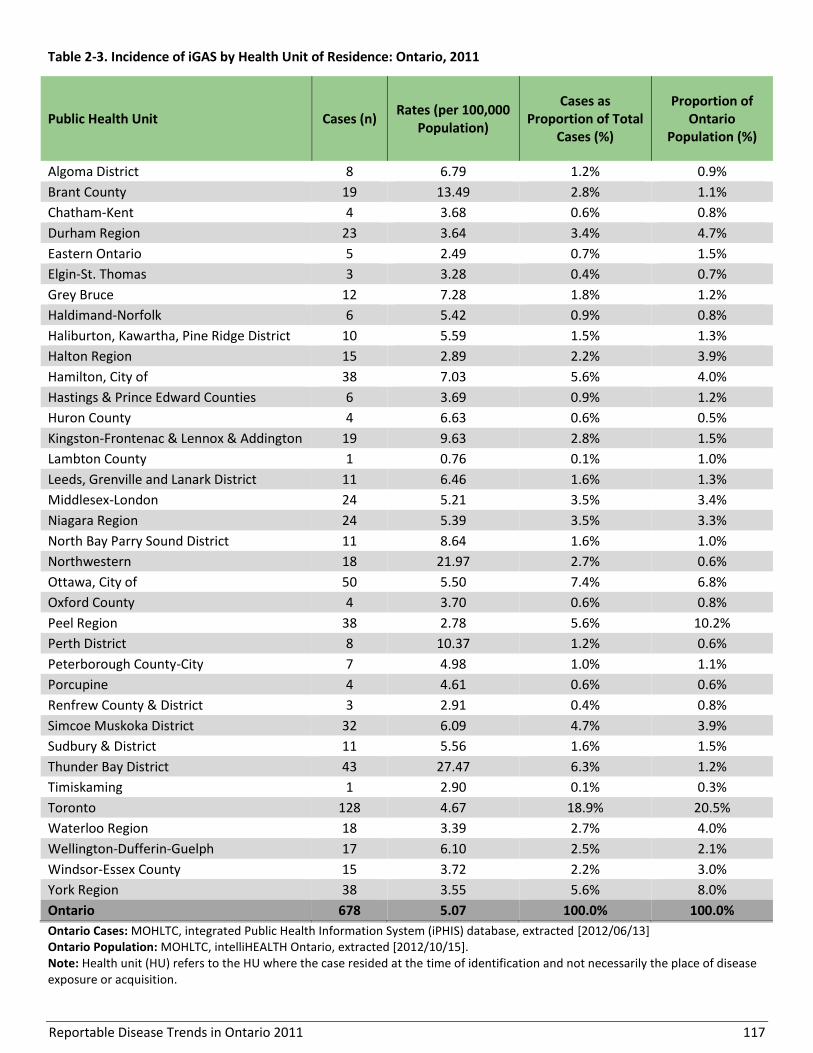
Reportable Disease Trends in Ontario 2011 117
Table 2-3. Incidence of iGAS by Health Unit of Residence: Ontario, 2011
Public Health Unit Cases (n) Rates (per 100,000
Population)
Cases as Proportion of Total
Cases (%)
Proportion of Ontario
Population (%)
Algoma District 8 6.79 1.2% 0.9%
Brant County 19 13.49 2.8% 1.1%
Chatham-Kent 4 3.68 0.6% 0.8%
Durham Region 23 3.64 3.4% 4.7%
Eastern Ontario 5 2.49 0.7% 1.5%
Elgin-St. Thomas 3 3.28 0.4% 0.7%
Grey Bruce 12 7.28 1.8% 1.2%
Haldimand-Norfolk 6 5.42 0.9% 0.8%
Haliburton, Kawartha, Pine Ridge District 10 5.59 1.5% 1.3%
Halton Region 15 2.89 2.2% 3.9%
Hamilton, City of 38 7.03 5.6% 4.0%
Hastings & Prince Edward Counties 6 3.69 0.9% 1.2%
Huron County 4 6.63 0.6% 0.5%
Kingston-Frontenac & Lennox & Addington 19 9.63 2.8% 1.5%
Lambton County 1 0.76 0.1% 1.0%
Leeds, Grenville and Lanark District 11 6.46 1.6% 1.3%
Middlesex-London 24 5.21 3.5% 3.4%
Niagara Region 24 5.39 3.5% 3.3%
North Bay Parry Sound District 11 8.64 1.6% 1.0%
Northwestern 18 21.97 2.7% 0.6%
Ottawa, City of 50 5.50 7.4% 6.8%
Oxford County 4 3.70 0.6% 0.8%
Peel Region 38 2.78 5.6% 10.2%
Perth District 8 10.37 1.2% 0.6%
Peterborough County-City 7 4.98 1.0% 1.1%
Porcupine 4 4.61 0.6% 0.6%
Renfrew County & District 3 2.91 0.4% 0.8%
Simcoe Muskoka District 32 6.09 4.7% 3.9%
Sudbury & District 11 5.56 1.6% 1.5%
Thunder Bay District 43 27.47 6.3% 1.2%
Timiskaming 1 2.90 0.1% 0.3%
Toronto 128 4.67 18.9% 20.5%
Waterloo Region 18 3.39 2.7% 4.0%
Wellington-Dufferin-Guelph 17 6.10 2.5% 2.1%
Windsor-Essex County 15 3.72 2.2% 3.0%
York Region 38 3.55 5.6% 8.0%
Ontario 678 5.07 100.0% 100.0%
Ontario Cases: MOHLTC, integrated Public Health Information System (iPHIS) database, extracted [2012/06/13] Ontario Population: MOHLTC, intelliHEALTH Ontario, extracted [2012/10/15]. Note: Health unit (HU) refers to the HU where the case resided at the time of identification and not necessarily the place of disease exposure or acquisition.

Reportable Disease Trends in Ontario 2011 118
REPORTED RISK FACTORS
Self-reported chronic/medical conditions (70%, 303
cases), compromised skin (33%, 141), compromised
immune system (19%, 84) or recent acute infections
(9%, 39) were the most commonly reported health
related risk factors among the 432 iGAS cases that
reported at least one medical risk factor in 2011.
Alcohol abuse (29%, 48) and injection drug use (16%, 27)
were most frequently reported among the other
reported risk factors (Table 2-4).
Table 2-4. Reported Risk Factors for iGAS cases:
Ontario, 2011 (n=167)
Risk Factors Cases
Number Percent
Alcohol abuse 48 28.7%
Injection drug use 27 16.2%
Under-housed/homeless 22 13.2%
Close contact with an iGAS case 16 9.6%
Unknown 35 21.0%
Other risk factors 45 26.9%
Ontario Cases: MOHLTC, integrated Public Health Information System (iPHIS) database, extracted [2012/6/13]. Notes: Interpret with caution. Risk factors not reported for all cases. Cases may report more than one risk factor. “Other” refers to risk factors reported solely as “Other, specify”. “Unknown” refers to risk factors reported solely as “Unknown”.

Reportable Disease Trends in Ontario 2011 119
Influenza
Influenza is the leading cause of reportable
respiratory illness in Ontario. In the 2010/2011
season there were 6,050 reported cases, most
of which were due to influenza A.
Children under the age of five years and adults
aged 70 years and older were most affected by
influenza in the 2010/2011 season.
Approximately 39% of influenza cases were
reported as hospitalized in the 2010/2011
season; two percent of cases were fatal.
Influenza is an acute respiratory infection caused by the
influenza virus.1 Transmission of the virus is mainly
through direct contact with respiratory droplets
expelled during coughs, sneezes or while talking. The
virus can also be transmitted indirectly through contact
with surfaces and objects that have been contaminated
with respiratory droplets. Symptoms of influenza
infection usually develop within two days of exposure
and can last from five to seven days. Influenza
infections are characterized by fever, chills, cough,
muscle or body aches, headache, runny nose, weakness
and sore throat.1 In children, gastrointestinal symptoms
such as nausea, vomiting and diarrhea can also occur,
whereas fever may not be present in the elderly.1
The severity of influenza infections depends on several
factors including circulating influenza strains and the
number of people that are immune either through
previous infection or immunization. In general, the risk
of serious illness or complications is greater for children
under the age of two years, adults aged 65 years and
older, persons with underlying medical conditions (e.g.
asthma, heart disease, and diabetes), persons living in
long-term care homes, and pregnant women.
Complications of influenza include pneumonia and
death.1
The most effective way to prevent influenza infection is
by getting immunized every fall.40 The influenza vaccine
provides up to 80% protection against influenza among
healthy adults.41 It also reduces the incidence of severe
illness, complications and fatalities by approximately
42-46% in long-term care settings.42 Primary preventive
measures such as hand washing and covering coughs
and sneezes are also key to preventing the spread of
infection.
2010/11 IN FOCUS AND HISTORICAL HIGHLIGHTS
A total of 6,050 cases were reported in Ontario during
the 2010/2011 influenza season, representing an
incidence rate of 45.24 cases per 100,000 population
(Figure 2-4). The 2010/2011 influenza season ran from
September 1, 2010 to August 31, 2011.
The incidence of influenza fluctuated during the period
covering the 2001/2002 to 2010/2011 seasons. The
highest rates were reported in the 2008/2009 and
2009/2010 seasons. The majority of cases in these
seasons were attributed to the first and second waves
of the H1N1 influenza pandemic. The H1N1 influenza
pandemic strain accounted for 49% of influenza cases in
the 2008/2009 season and 62% of influenza cases in the
2009/2010 season. Excluding pandemic seasons, the
highest incidence rate for influenza in a single season
was in 2004/2005. This increase was attributed to the
A/California influenza strain which was not contained in
the influenza vaccine for that season. Similarly high
rates of influenza were observed in 2010/2011, but this
increase may be attributed in part to the use of more
sensitive laboratory tests which started during the
pandemic seasons.
National incidence rates for influenza were comparable
to those of Ontario. They followed a similar pattern
during the seasons from 2001/2002 to 2007/2008
(Figure 2-4).
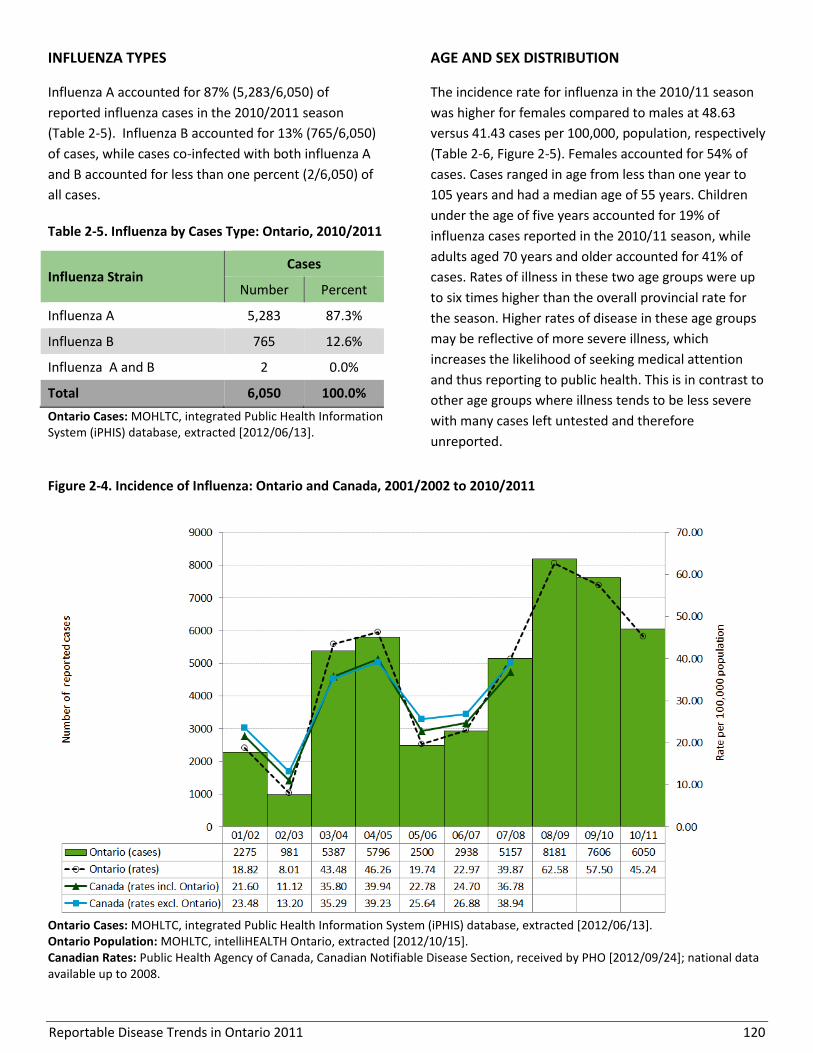
Reportable Disease Trends in Ontario 2011 120
INFLUENZA TYPES
Influenza A accounted for 87% (5,283/6,050) of
reported influenza cases in the 2010/2011 season
(Table 2-5). Influenza B accounted for 13% (765/6,050)
of cases, while cases co-infected with both influenza A
and B accounted for less than one percent (2/6,050) of
all cases.
Table 2-5. Influenza by Cases Type: Ontario, 2010/2011
Influenza Strain Cases
Number Percent
Influenza A 5,283 87.3%
Influenza B 765 12.6%
Influenza A and B 2 0.0%
Total 6,050 100.0%
Ontario Cases: MOHLTC, integrated Public Health Information System (iPHIS) database, extracted [2012/06/13].
AGE AND SEX DISTRIBUTION
The incidence rate for influenza in the 2010/11 season
was higher for females compared to males at 48.63
versus 41.43 cases per 100,000, population, respectively
(Table 2-6, Figure 2-5). Females accounted for 54% of
cases. Cases ranged in age from less than one year to
105 years and had a median age of 55 years. Children
under the age of five years accounted for 19% of
influenza cases reported in the 2010/11 season, while
adults aged 70 years and older accounted for 41% of
cases. Rates of illness in these two age groups were up
to six times higher than the overall provincial rate for
the season. Higher rates of disease in these age groups
may be reflective of more severe illness, which
increases the likelihood of seeking medical attention
and thus reporting to public health. This is in contrast to
other age groups where illness tends to be less severe
with many cases left untested and therefore
unreported.
Figure 2-4. Incidence of Influenza: Ontario and Canada, 2001/2002 to 2010/2011
Ontario Cases: MOHLTC, integrated Public Health Information System (iPHIS) database, extracted [2012/06/13]. Ontario Population: MOHLTC, intelliHEALTH Ontario, extracted [2012/10/15]. Canadian Rates: Public Health Agency of Canada, Canadian Notifiable Disease Section, received by PHO [2012/09/24]; national data available up to 2008.
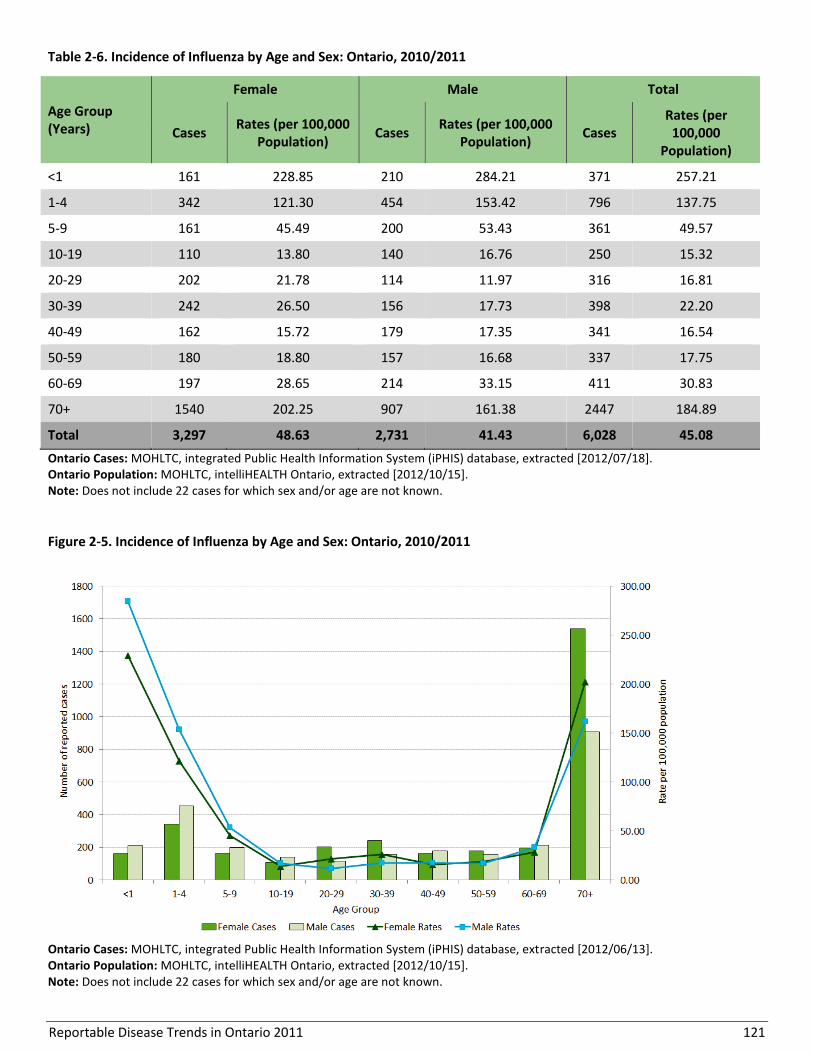
Reportable Disease Trends in Ontario 2011 121
Table 2-6. Incidence of Influenza by Age and Sex: Ontario, 2010/2011
Age Group (Years)
Female Male Total
Cases Rates (per 100,000
Population) Cases
Rates (per 100,000 Population)
Cases Rates (per
100,000 Population)
<1 161 228.85 210 284.21 371 257.21
1-4 342 121.30 454 153.42 796 137.75
5-9 161 45.49 200 53.43 361 49.57
10-19 110 13.80 140 16.76 250 15.32
20-29 202 21.78 114 11.97 316 16.81
30-39 242 26.50 156 17.73 398 22.20
40-49 162 15.72 179 17.35 341 16.54
50-59 180 18.80 157 16.68 337 17.75
60-69 197 28.65 214 33.15 411 30.83
70+ 1540 202.25 907 161.38 2447 184.89
Total 3,297 48.63 2,731 41.43 6,028 45.08
Ontario Cases: MOHLTC, integrated Public Health Information System (iPHIS) database, extracted [2012/07/18]. Ontario Population: MOHLTC, intelliHEALTH Ontario, extracted [2012/10/15]. Note: Does not include 22 cases for which sex and/or age are not known.
Figure 2-5. Incidence of Influenza by Age and Sex: Ontario, 2010/2011
Ontario Cases: MOHLTC, integrated Public Health Information System (iPHIS) database, extracted [2012/06/13]. Ontario Population: MOHLTC, intelliHEALTH Ontario, extracted [2012/10/15]. Note: Does not include 22 cases for which sex and/or age are not known.
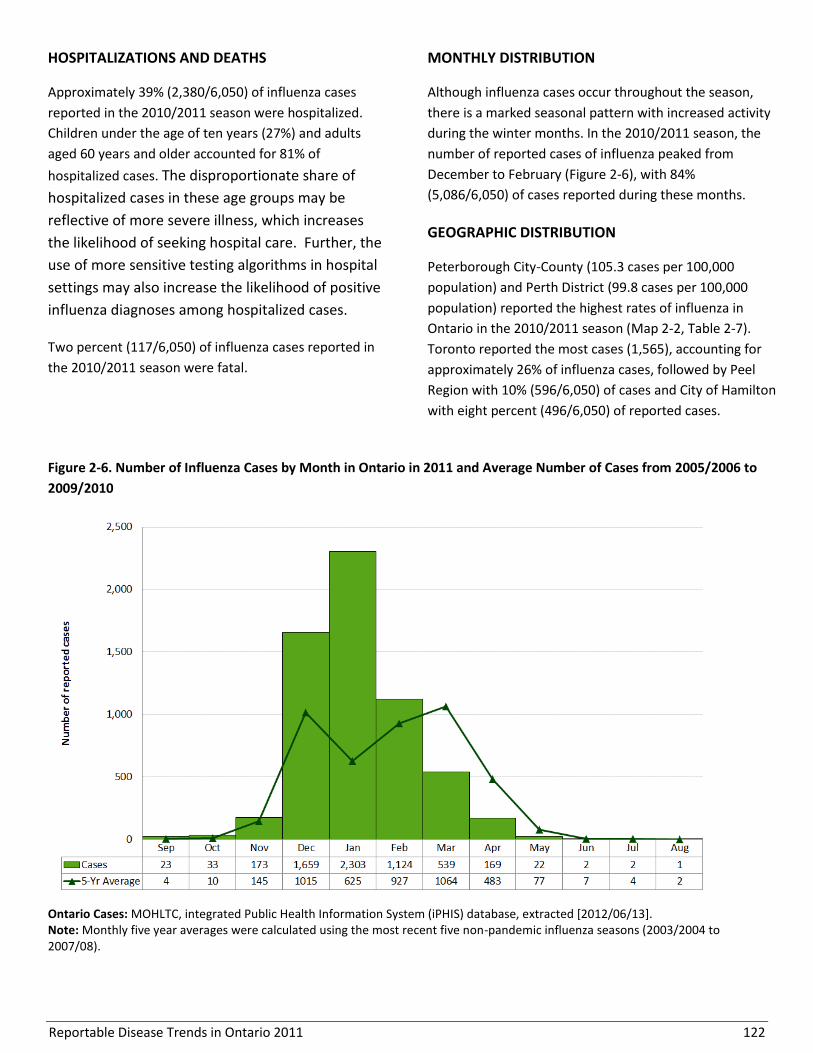
Reportable Disease Trends in Ontario 2011 122
HOSPITALIZATIONS AND DEATHS
Approximately 39% (2,380/6,050) of influenza cases
reported in the 2010/2011 season were hospitalized.
Children under the age of ten years (27%) and adults
aged 60 years and older accounted for 81% of
hospitalized cases. The disproportionate share of
hospitalized cases in these age groups may be
reflective of more severe illness, which increases
the likelihood of seeking hospital care. Further, the
use of more sensitive testing algorithms in hospital
settings may also increase the likelihood of positive
influenza diagnoses among hospitalized cases.
Two percent (117/6,050) of influenza cases reported in
the 2010/2011 season were fatal.
MONTHLY DISTRIBUTION
Although influenza cases occur throughout the season,
there is a marked seasonal pattern with increased activity
during the winter months. In the 2010/2011 season, the
number of reported cases of influenza peaked from
December to February (Figure 2-6), with 84%
(5,086/6,050) of cases reported during these months.
GEOGRAPHIC DISTRIBUTION
Peterborough City-County (105.3 cases per 100,000
population) and Perth District (99.8 cases per 100,000
population) reported the highest rates of influenza in
Ontario in the 2010/2011 season (Map 2-2, Table 2-7).
Toronto reported the most cases (1,565), accounting for
approximately 26% of influenza cases, followed by Peel
Region with 10% (596/6,050) of cases and City of Hamilton
with eight percent (496/6,050) of reported cases.
Figure 2-6. Number of Influenza Cases by Month in Ontario in 2011 and Average Number of Cases from 2005/2006 to
2009/2010
Ontario Cases: MOHLTC, integrated Public Health Information System (iPHIS) database, extracted [2012/06/13]. Note: Monthly five year averages were calculated using the most recent five non-pandemic influenza seasons (2003/2004 to 2007/08).

Reportable Disease Trends in Ontario 2011 123
Map 2-2. Incidence of Influenza by Health Unit of Residence: Ontario, 2010/2011
Ontario Cases: MOHLTC, integrated Public Health Information System (iPHIS) database, extracted [2012/06/13]. Ontario Population: MOHLTC, intelliHEALTH Ontario, extracted [2012/10/15]. Note: Health unit (HU) refers to the HU where the case resided at the time of identification and not necessarily the place of disease exposure or acquisition.
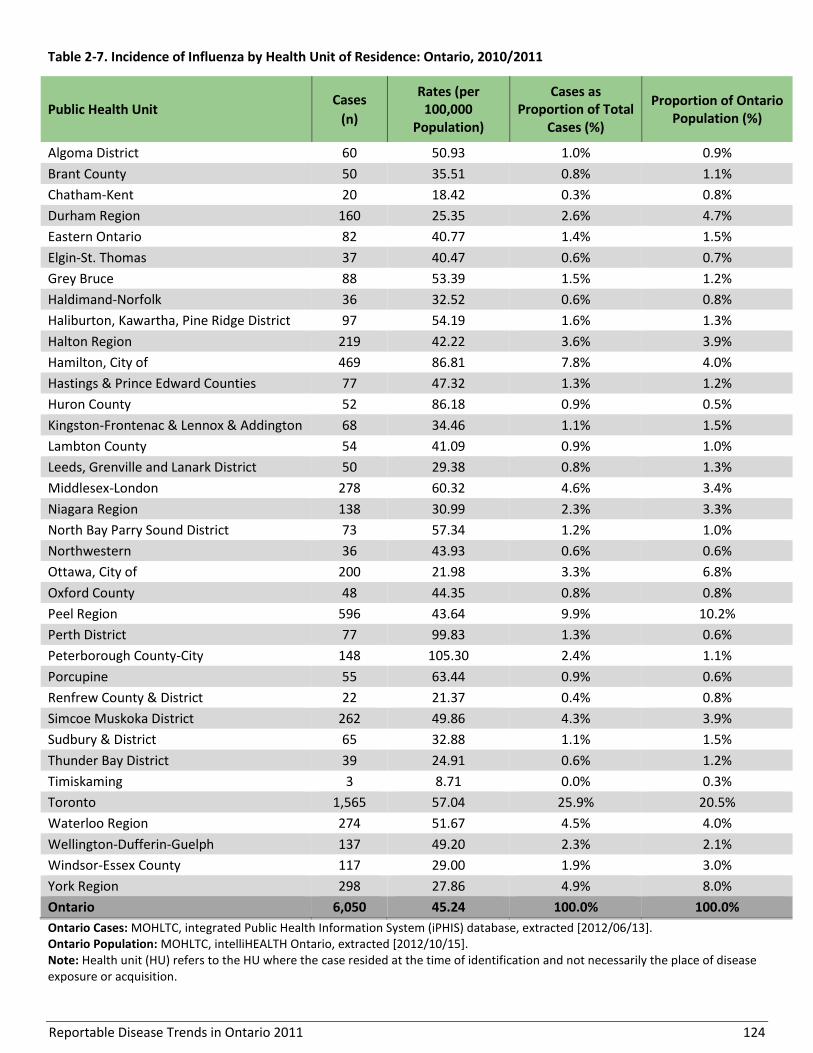
Reportable Disease Trends in Ontario 2011 124
Table 2-7. Incidence of Influenza by Health Unit of Residence: Ontario, 2010/2011
Public Health Unit Cases
(n)
Rates (per 100,000
Population)
Cases as Proportion of Total
Cases (%)
Proportion of Ontario Population (%)
Algoma District 60 50.93 1.0% 0.9%
Brant County 50 35.51 0.8% 1.1%
Chatham-Kent 20 18.42 0.3% 0.8%
Durham Region 160 25.35 2.6% 4.7%
Eastern Ontario 82 40.77 1.4% 1.5%
Elgin-St. Thomas 37 40.47 0.6% 0.7%
Grey Bruce 88 53.39 1.5% 1.2%
Haldimand-Norfolk 36 32.52 0.6% 0.8%
Haliburton, Kawartha, Pine Ridge District 97 54.19 1.6% 1.3%
Halton Region 219 42.22 3.6% 3.9%
Hamilton, City of 469 86.81 7.8% 4.0%
Hastings & Prince Edward Counties 77 47.32 1.3% 1.2%
Huron County 52 86.18 0.9% 0.5%
Kingston-Frontenac & Lennox & Addington 68 34.46 1.1% 1.5%
Lambton County 54 41.09 0.9% 1.0%
Leeds, Grenville and Lanark District 50 29.38 0.8% 1.3%
Middlesex-London 278 60.32 4.6% 3.4%
Niagara Region 138 30.99 2.3% 3.3%
North Bay Parry Sound District 73 57.34 1.2% 1.0%
Northwestern 36 43.93 0.6% 0.6%
Ottawa, City of 200 21.98 3.3% 6.8%
Oxford County 48 44.35 0.8% 0.8%
Peel Region 596 43.64 9.9% 10.2%
Perth District 77 99.83 1.3% 0.6%
Peterborough County-City 148 105.30 2.4% 1.1%
Porcupine 55 63.44 0.9% 0.6%
Renfrew County & District 22 21.37 0.4% 0.8%
Simcoe Muskoka District 262 49.86 4.3% 3.9%
Sudbury & District 65 32.88 1.1% 1.5%
Thunder Bay District 39 24.91 0.6% 1.2%
Timiskaming 3 8.71 0.0% 0.3%
Toronto 1,565 57.04 25.9% 20.5%
Waterloo Region 274 51.67 4.5% 4.0%
Wellington-Dufferin-Guelph 137 49.20 2.3% 2.1%
Windsor-Essex County 117 29.00 1.9% 3.0%
York Region 298 27.86 4.9% 8.0%
Ontario 6,050 45.24 100.0% 100.0%
Ontario Cases: MOHLTC, integrated Public Health Information System (iPHIS) database, extracted [2012/06/13]. Ontario Population: MOHLTC, intelliHEALTH Ontario, extracted [2012/10/15]. Note: Health unit (HU) refers to the HU where the case resided at the time of identification and not necessarily the place of disease exposure or acquisition.

Reportable Disease Trends in Ontario 2011 125
REPORTED RISK FACTORS
The presence of risk factors may predispose an
individual to influenza infection or complications
following infection. Two-thirds (3,980/6,050) of
influenza cases that occurred in the 2010/11 season
reported one or more risk factors for influenza. Among
cases reporting risk factors, 49% (1,960/3,980) were not
immunized, 46% (1,820/3,980) had at least one
underlying medical condition such as diabetes or
cardiovascular disease and 20% (778/3,980) had
respiratory conditions such as asthma and chronic
obstructive pulmonary disease (Table 2-8).
Table 2-8. Reported Risk Factors for Influenza Cases:
Ontario, 2010/2011 (n=3,980)
Risk Factors Cases
Number Percent
Not immunized against influenza 1,960 49.3%
Underlying or immuno-compromising medical condition (not respiratory)
1,820 45.7%
Respiratory conditions 778 19.6%
Other 897 22.5%
Unknown 474 11.9%
Ontario Cases: MOHLTC, integrated Public Health Information System (iPHIS) database, extracted [2012/6/13]. Notes: Interpret with caution. Risk factors not reported for all cases. Cases may report more than one risk factor. “Other” refers to the sum of risk factors reported as “Other, specify” and pregnant. “Unknown” refers to risk factors reported solely as “Unknown”. Risk factors reported as “Underlying medical conditions” may include some respiratory conditions.

Reportable Disease Trends in Ontario 2011 126
Legionellosis
The incidence rate of legionellosis in Ontario
increased in 2010 and 2011.
Cases aged 50 years and older had the highest
incidence rates of legionellosis and accounted
for 83% of reported cases in 2011.
In 2011, approximately 75% of legionellosis
cases were hospitalized, and 5% were fatal.
Legionellosis is an infectious disease caused by the
bacterium Legionella. Most human cases are attributed
to L. pneumophila, which is ubiquitous in the
environment.1 Legionellosis is not spread from person-
to-person; transmission typically occurs through
inhalation of aerosolized water droplets containing the
bacterium. Legionella bacteria are commonly found in
soil and water in the natural environment and in
contaminated aerosol generating devices such as
cooling towers, hot water tanks, decorative water
fountains, and shower heads.1
Legionellosis consists of two distinct clinical syndromes:
Pontiac fever and Legionnaires’ disease. Pontiac fever is
milder and self-limiting, with symptoms developing
within five to seventy-two hours after exposure. It is
characterized by anorexia, malaise, myalgia, headache,
fever, and commonly, abdominal pain and diarrhea.1
Legionnaires’ disease is the more severe form of
legionellosis. It is different from Pontiac fever because
of the presence of the defining complication of
pneumonia.1
Most healthy individuals do not develop legionellosis
following exposure. At risk populations include those
who are 50 years of age and older, males, smokers,
alcoholics, and individuals with compromised immune
systems or chronic conditions such as lung disease,
diabetes and cancer.1,43 The key to preventing
legionellosis is proper maintenance of aerosol
generating systems and devices in which Legionella
bacteria can grow.
2011 IN FOCUS AND HISTORICAL HIGHLIGHTS
In 2011, 162 cases of legionellosis were reported in
Ontario for an incidence rate of 1.21 cases per 100,000
population (Figure 2-7). The number of cases reported in
2011 represented a 40% increase compared to the 2010
total of 116 cases and an almost six-fold increase
compared to 2002.
Following a period of relatively low rates from 2002 to
2004, incidence rates of legionellosis increased in 2005 due
to a large outbreak in a Toronto long-term care facility.
Since then, annual incidence rates have remained elevated
province-wide with two other notable peaks in incidence in
2010 and 2011 (Figure 2-7). While the exact cause of the
increase in legionellosis in 2010 and 2011 has not been
conclusively determined, increases in legionellosis may
more generally be explained by several factors including
changes in local environmental conditions and increased
awareness, reporting, and testing for the disease.
Although annual incidence rates of legionellosis in
Canada have been lower than in Ontario, the national
rates have also shown a general increasing trend that
parallels the increase in incidence in Ontario.
AGE AND SEX DISTRIBUTION
The sex-specific incidence rate for legionellosis in 2011
was almost three times higher for males compared to
females. Incidence rates for legionellosis were 1.77 and
0.65 cases per 100,000 population for males and females,
respectively (Table 2-9, Figure 2-8). Males accounted for
72% of all legionellosis cases reported in 2011. Overall,
cases ranged in age from 28 to 91 years with a median age
of 61 years.
The majority of legionellosis cases were among persons
aged 50 years and older. Persons in this age range
accounted for 83% (133/162) of cases that were
reported in 2011. Age-specific incidence rates for both
males and females were also highest in this age range.
No cases were reported in persons under the age of 20
years and 17% of cases (28/162) occurred among those
in the age groups ranging from 20 to 49 years.
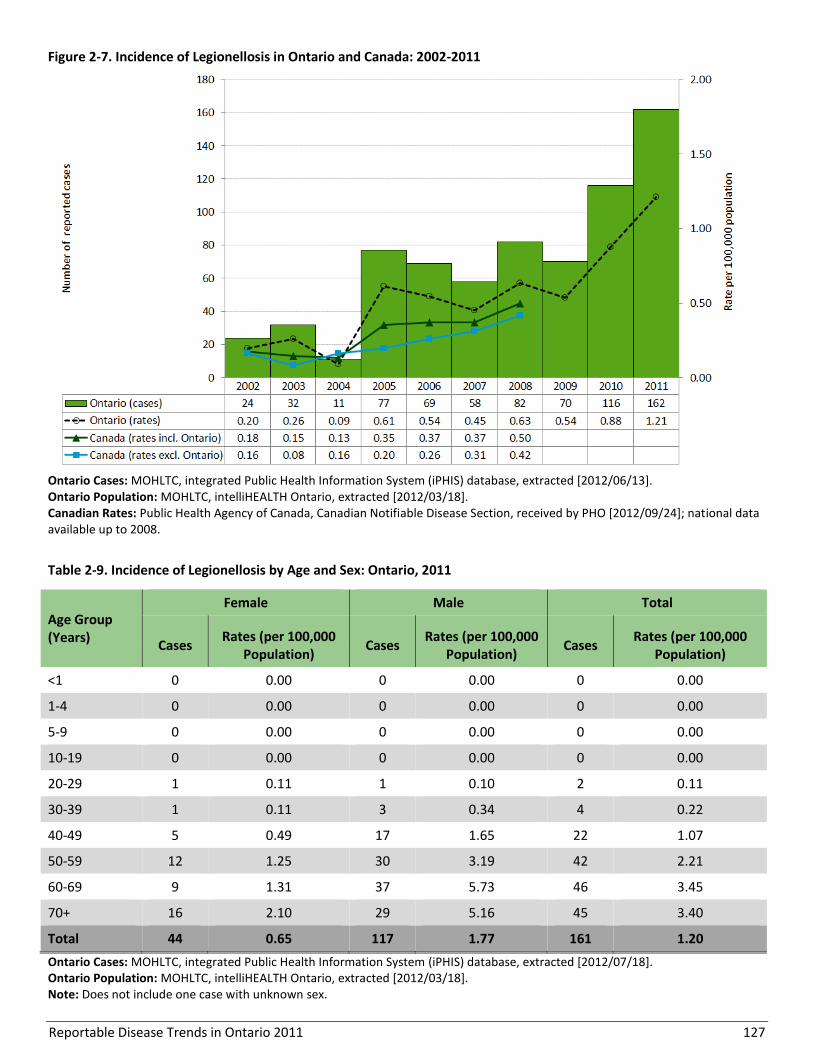
Reportable Disease Trends in Ontario 2011 127
Figure 2-7. Incidence of Legionellosis in Ontario and Canada: 2002-2011
Ontario Cases: MOHLTC, integrated Public Health Information System (iPHIS) database, extracted [2012/06/13]. Ontario Population: MOHLTC, intelliHEALTH Ontario, extracted [2012/03/18]. Canadian Rates: Public Health Agency of Canada, Canadian Notifiable Disease Section, received by PHO [2012/09/24]; national data available up to 2008.
Table 2-9. Incidence of Legionellosis by Age and Sex: Ontario, 2011
Age Group (Years)
Female Male Total
Cases Rates (per 100,000
Population) Cases
Rates (per 100,000 Population)
Cases Rates (per 100,000
Population)
<1 0 0.00 0 0.00 0 0.00
1-4 0 0.00 0 0.00 0 0.00
5-9 0 0.00 0 0.00 0 0.00
10-19 0 0.00 0 0.00 0 0.00
20-29 1 0.11 1 0.10 2 0.11
30-39 1 0.11 3 0.34 4 0.22
40-49 5 0.49 17 1.65 22 1.07
50-59 12 1.25 30 3.19 42 2.21
60-69 9 1.31 37 5.73 46 3.45
70+ 16 2.10 29 5.16 45 3.40
Total 44 0.65 117 1.77 161 1.20
Ontario Cases: MOHLTC, integrated Public Health Information System (iPHIS) database, extracted [2012/07/18]. Ontario Population: MOHLTC, intelliHEALTH Ontario, extracted [2012/03/18]. Note: Does not include one case with unknown sex.
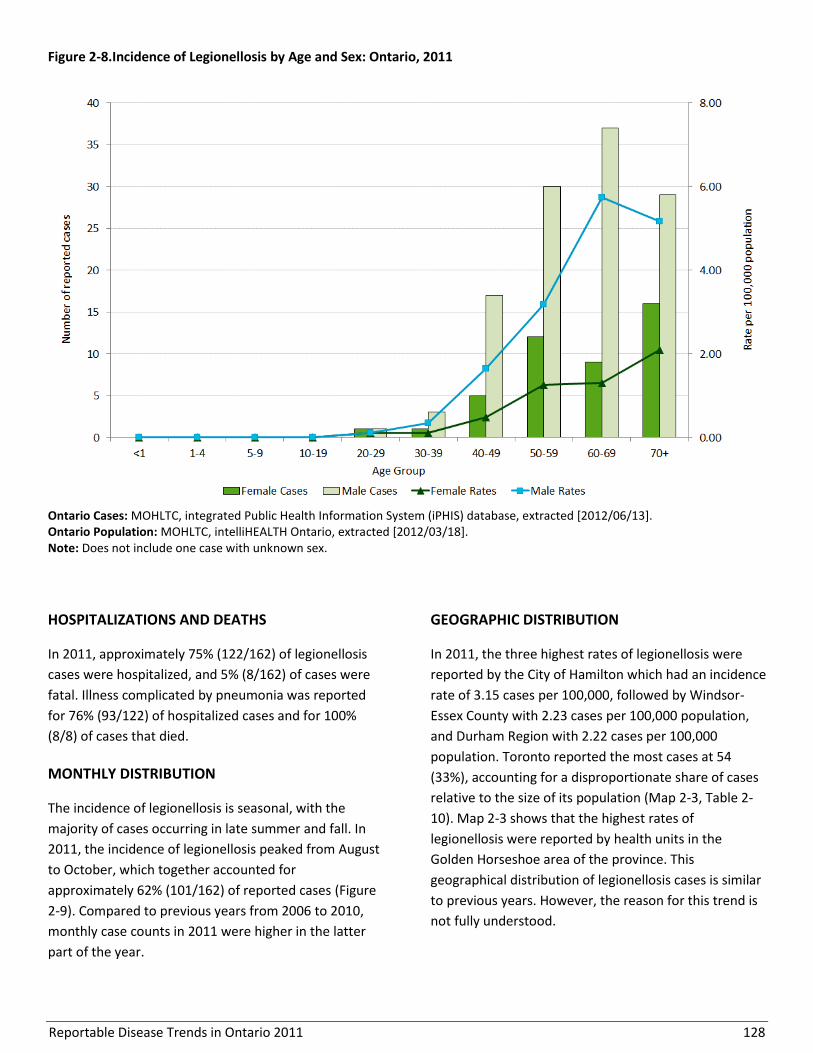
Reportable Disease Trends in Ontario 2011 128
Figure 2-8.Incidence of Legionellosis by Age and Sex: Ontario, 2011
Ontario Cases: MOHLTC, integrated Public Health Information System (iPHIS) database, extracted [2012/06/13]. Ontario Population: MOHLTC, intelliHEALTH Ontario, extracted [2012/03/18]. Note: Does not include one case with unknown sex.
HOSPITALIZATIONS AND DEATHS
In 2011, approximately 75% (122/162) of legionellosis
cases were hospitalized, and 5% (8/162) of cases were
fatal. Illness complicated by pneumonia was reported
for 76% (93/122) of hospitalized cases and for 100%
(8/8) of cases that died.
MONTHLY DISTRIBUTION
The incidence of legionellosis is seasonal, with the
majority of cases occurring in late summer and fall. In
2011, the incidence of legionellosis peaked from August
to October, which together accounted for
approximately 62% (101/162) of reported cases (Figure
2-9). Compared to previous years from 2006 to 2010,
monthly case counts in 2011 were higher in the latter
part of the year.
GEOGRAPHIC DISTRIBUTION
In 2011, the three highest rates of legionellosis were
reported by the City of Hamilton which had an incidence
rate of 3.15 cases per 100,000, followed by Windsor-
Essex County with 2.23 cases per 100,000 population,
and Durham Region with 2.22 cases per 100,000
population. Toronto reported the most cases at 54
(33%), accounting for a disproportionate share of cases
relative to the size of its population (Map 2-3, Table 2-
10). Map 2-3 shows that the highest rates of
legionellosis were reported by health units in the
Golden Horseshoe area of the province. This
geographical distribution of legionellosis cases is similar
to previous years. However, the reason for this trend is
not fully understood.
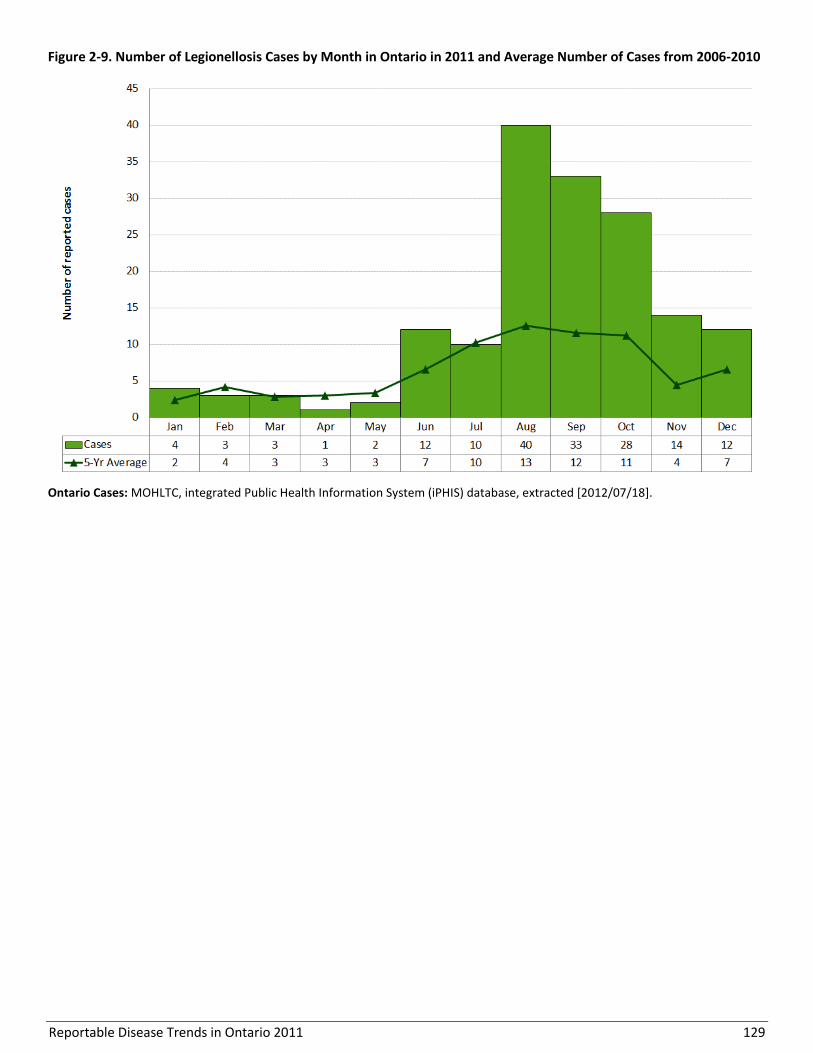
Reportable Disease Trends in Ontario 2011 129
Figure 2-9. Number of Legionellosis Cases by Month in Ontario in 2011 and Average Number of Cases from 2006-2010
Ontario Cases: MOHLTC, integrated Public Health Information System (iPHIS) database, extracted [2012/07/18].
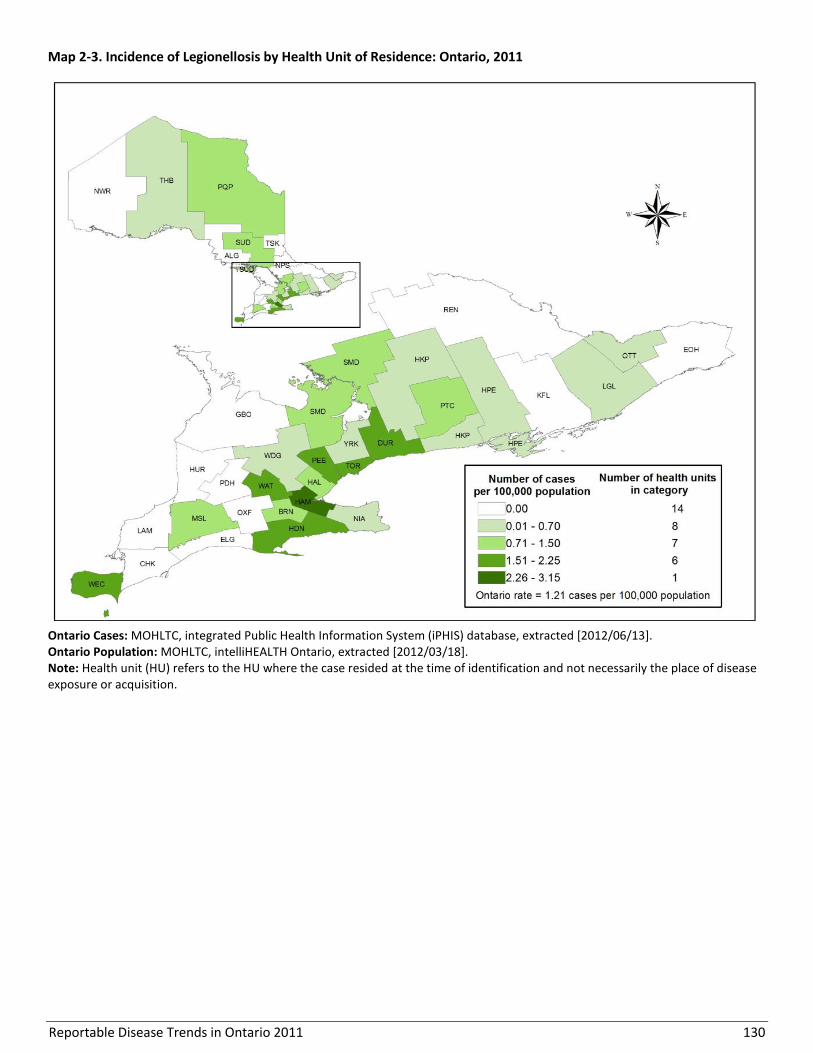
Reportable Disease Trends in Ontario 2011 130
Map 2-3. Incidence of Legionellosis by Health Unit of Residence: Ontario, 2011
Ontario Cases: MOHLTC, integrated Public Health Information System (iPHIS) database, extracted [2012/06/13]. Ontario Population: MOHLTC, intelliHEALTH Ontario, extracted [2012/03/18]. Note: Health unit (HU) refers to the HU where the case resided at the time of identification and not necessarily the place of disease exposure or acquisition.
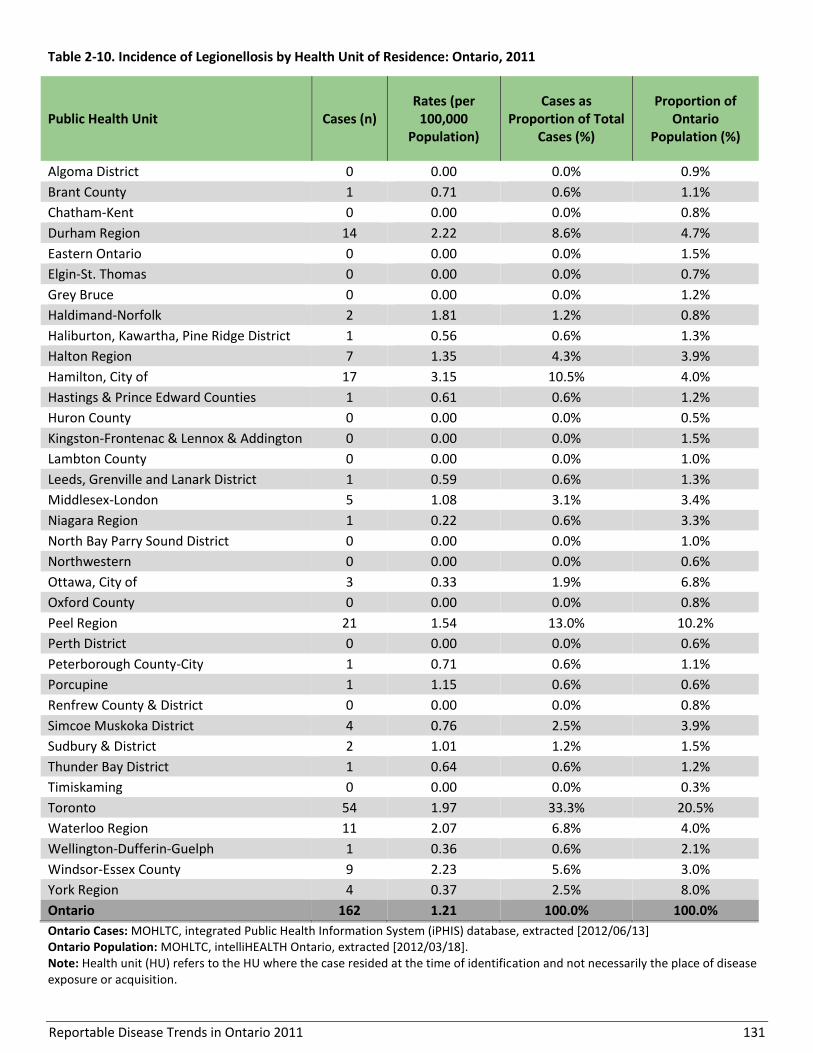
Reportable Disease Trends in Ontario 2011 131
Table 2-10. Incidence of Legionellosis by Health Unit of Residence: Ontario, 2011
Public Health Unit Cases (n) Rates (per
100,000 Population)
Cases as Proportion of Total
Cases (%)
Proportion of Ontario
Population (%)
Algoma District 0 0.00 0.0% 0.9%
Brant County 1 0.71 0.6% 1.1%
Chatham-Kent 0 0.00 0.0% 0.8%
Durham Region 14 2.22 8.6% 4.7%
Eastern Ontario 0 0.00 0.0% 1.5%
Elgin-St. Thomas 0 0.00 0.0% 0.7%
Grey Bruce 0 0.00 0.0% 1.2%
Haldimand-Norfolk 2 1.81 1.2% 0.8%
Haliburton, Kawartha, Pine Ridge District 1 0.56 0.6% 1.3%
Halton Region 7 1.35 4.3% 3.9%
Hamilton, City of 17 3.15 10.5% 4.0%
Hastings & Prince Edward Counties 1 0.61 0.6% 1.2%
Huron County 0 0.00 0.0% 0.5%
Kingston-Frontenac & Lennox & Addington 0 0.00 0.0% 1.5%
Lambton County 0 0.00 0.0% 1.0%
Leeds, Grenville and Lanark District 1 0.59 0.6% 1.3%
Middlesex-London 5 1.08 3.1% 3.4%
Niagara Region 1 0.22 0.6% 3.3%
North Bay Parry Sound District 0 0.00 0.0% 1.0%
Northwestern 0 0.00 0.0% 0.6%
Ottawa, City of 3 0.33 1.9% 6.8%
Oxford County 0 0.00 0.0% 0.8%
Peel Region 21 1.54 13.0% 10.2%
Perth District 0 0.00 0.0% 0.6%
Peterborough County-City 1 0.71 0.6% 1.1%
Porcupine 1 1.15 0.6% 0.6%
Renfrew County & District 0 0.00 0.0% 0.8%
Simcoe Muskoka District 4 0.76 2.5% 3.9%
Sudbury & District 2 1.01 1.2% 1.5%
Thunder Bay District 1 0.64 0.6% 1.2%
Timiskaming 0 0.00 0.0% 0.3%
Toronto 54 1.97 33.3% 20.5%
Waterloo Region 11 2.07 6.8% 4.0%
Wellington-Dufferin-Guelph 1 0.36 0.6% 2.1%
Windsor-Essex County 9 2.23 5.6% 3.0%
York Region 4 0.37 2.5% 8.0%
Ontario 162 1.21 100.0% 100.0%
Ontario Cases: MOHLTC, integrated Public Health Information System (iPHIS) database, extracted [2012/06/13] Ontario Population: MOHLTC, intelliHEALTH Ontario, extracted [2012/03/18]. Note: Health unit (HU) refers to the HU where the case resided at the time of identification and not necessarily the place of disease exposure or acquisition.
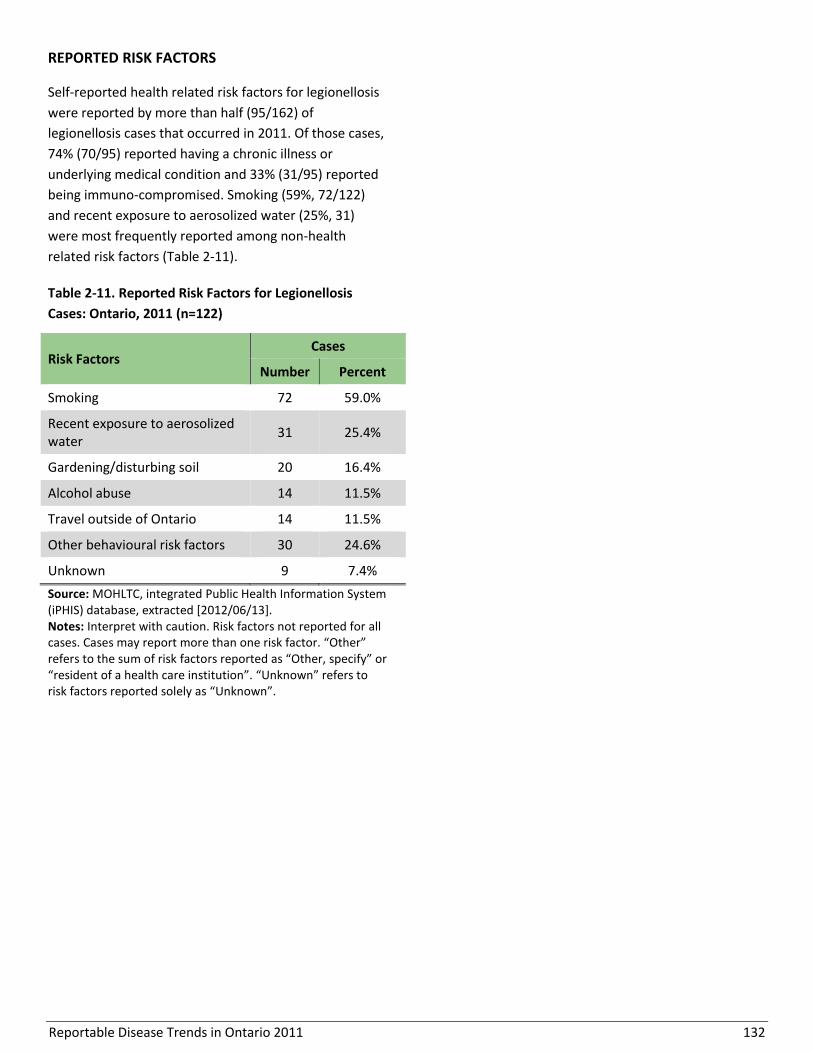
Reportable Disease Trends in Ontario 2011 132
REPORTED RISK FACTORS
Self-reported health related risk factors for legionellosis
were reported by more than half (95/162) of
legionellosis cases that occurred in 2011. Of those cases,
74% (70/95) reported having a chronic illness or
underlying medical condition and 33% (31/95) reported
being immuno-compromised. Smoking (59%, 72/122)
and recent exposure to aerosolized water (25%, 31)
were most frequently reported among non-health
related risk factors (Table 2-11).
Table 2-11. Reported Risk Factors for Legionellosis
Cases: Ontario, 2011 (n=122)
Risk Factors Cases
Number Percent
Smoking 72 59.0%
Recent exposure to aerosolized water
31 25.4%
Gardening/disturbing soil 20 16.4%
Alcohol abuse 14 11.5%
Travel outside of Ontario 14 11.5%
Other behavioural risk factors 30 24.6%
Unknown 9 7.4%
Source: MOHLTC, integrated Public Health Information System (iPHIS) database, extracted [2012/06/13]. Notes: Interpret with caution. Risk factors not reported for all cases. Cases may report more than one risk factor. “Other” refers to the sum of risk factors reported as “Other, specify” or “resident of a health care institution”. “Unknown” refers to risk factors reported solely as “Unknown”.
Reportable Disease Trends in Ontario 2011 133
Severe Acute Respiratory Syndrome (SARS)
Severe acute respiratory syndrome (SARS) is a viral
infection, first identified in 2003, belonging to the family
Coronaviridae.1,44 The SARS virus is transmitted from
person-to-person through either direct contact or close
contact with infectious aerosolized droplets (by
coughing or sneezing) or bodily fluids of a confirmed
case.1 Symptoms commonly develop between three to
ten days and are characterized by fever, myalgia and
malaise, swiftly followed by respiratory distress
including shortness of breath and coughing.1,44 As the
disease progresses, the development of acute
respiratory distress is likely.1
Much of the disease is still not completely understood.
SARS is diagnosed through a combination of clinical and
epidemiological evidence, along with laboratory testing.
While no vaccine is currently available, primary forms of
prevention include isolation of cases to avoid
transmission of the disease, and early recognition of
signs and symptoms of individuals presenting with
febrile respiratory illnesses.1
2011 IN FOCUS AND HISTORICAL HIGHLIGHTS
Since the 2003 SARS outbreak, there have been no
cases identified in Ontario or across the world.1

Reportable Disease Trends in Ontario 2011 134
Smallpox
Smallpox is a serious and sometimes fatal disease that is
caused by the varola virus, a member of the genus
Orthopoxvirus.1 The disease is characterized by sudden
onset of fever, head and body aches, malaise, weakness
and occasionally vomiting.1 These symptoms are
followed by a rash that progresses in stages, crusting
over after three to four weeks.1 There is no cure for
smallpox and the disease can be fatal in up to 30% of
infected persons.45
Vaccination campaigns across the world resulted in the
successful eradication of smallpox in 1979. However,
smallpox is a significant bioterrorism threat.46 Canada
has a National Smallpox Response Force which has a
mandate to respond to and contain any threats
resulting from the deliberate release of the smallpox
virus.
2011 IN FOCUS AND HISTORICAL HIGHLIGHTS
There have been no naturally acquired cases of
smallpox since 1977.47

Reportable Disease Trends in Ontario 2011 135
Tuberculosis
There has been no significant change in the
number of tuberculosis cases diagnosed in
Ontario from 2007 to 2011.
Adults in the 20-29, 30-39 and 70 years and
older age groups accounted for a
disproportionate share of diagnosed
tuberculosis cases in 2011.
The majority of tuberculosis cases diagnosed
in 2011 were from Toronto and Peel Region.
Persons born outside of Canada accounted for
the majority of tuberculosis cases diagnosed in
Ontario in 2011.
Tuberculosis (TB) is a major cause of disability and death
globally, especially in developing countries.1 Canada has
a relatively low incidence rate of TB with the majority of
cases attributed to activation of previously acquired
infections among foreign-born persons. TB is mainly
acquired through the inhalation of airborne droplets
produced by persons with active TB. An exposed person
may become infected and develop either a latent TB
infection (LTBI) or active TB disease.
About 90% of people infected with TB will have LTBI and
not develop active disease.1 LTBI occurs when the
bacteria that cause TB remain in a non-infectious
dormant stage without any outward signs and
symptoms of illness. The onset of active TB disease is
variable among people with LTBI. Approximately 90% of
people with LTBI never develop active TB disease.1
However, active TB disease may develop within the first
two years in approximately 5% of people, and at a later
date for another 5% of persons with newly acquired TB
infections. Active TB is infectious and occurs mostly in
the form of pulmonary TB (e.g. TB of the lungs). Signs of
active TB include cough with or without blood, fatigue,
night sweats, fever and weight loss.1 TB of body sites
other than the lungs can also occur and these infections
are referred to as extra-pulmonary TB.
Extra-pulmonary TB is usually non-infectious.1,48
Susceptibility to TB is universal. However, certain
people are at greater risk of developing active disease.
Children under the age of five years, the elderly, young
adults, and persons with compromised immune
response including those with HIV and other chronic
conditions are especially vulnerable.1 Prompt diagnosis
and treatment of LTBI is the most effective means of
preventing active TB in infected individuals.
2011 IN FOCUS AND HISTORICAL HIGHLIGHTS
A total of 655 active cases of tuberculosis were
diagnosed in Ontario in 2011, representing an incidence
rate of 4.90 cases per 100,000 population (Figure 2-10).
The number of cases diagnosed in 2011 was slightly
higher than the 646 cases diagnosed in 2010 (4.88 cases
per 100,000 population). Over the ten-year period from
2002 to 2011, the incidence rate of tuberculosis
declined. The incidence rate of TB in 2002 was 5.90
cases per 100,000 population, which is 17% higher than
the 2011 rate of 4.90 cases per 100,000 population.
With the exception of 2008, annual incidence rates for
tuberculosis for the rest of Canada were lower in
comparison to the corresponding rates for Ontario for
the period 2002 to 2008. Incidence rates at the national
level ranged from 4.79 cases per 100,000 population in
2007 to 5.31 cases per 100,000 population in 2002.
Higher incidence rates in Ontario are likely reflective of
migration patterns that see a larger share of newcomers
from TB endemic countries settling in the province.22

Reportable Disease Trends in Ontario 2011 136
Figure 2-10. Incidence of Tuberculosis: Ontario and Canada, 2002-2011
Ontario Cases: MOHLTC, integrated Public Health Information System (iPHIS) database, extracted [2012/06/13]. Ontario Population: MOHLTC, intelliHEALTH Ontario, extracted [2012/10/15]. Canadian Rates: Public Health Agency of Canada, Canadian Notifiable Disease Section, received by PHO [2012/09/24]; national data available up to 2008.
AGE AND SEX DISTRIBUTION
In 2011, the overall sex-specific incidence rates of
tuberculosis for males and females were approximately
equal at 4.93 and 4.87 cases per 100,000 population,
respectively (Table 2-12, Figure 2-11). Cases ranged in
age from one to 93 years, with a median age of 44
years; females (330) and males (325) accounted for a
similar proportion of cases at 50%. However, rates were
higher in females in the age groups from 20 to 39 years
and for males over the age of 50 years.
Young adults in the 20-29 and 30-39 age groups, and
older adults aged 70 years and older, accounted for a
disproportionate number of diagnosed TB cases in 2011
(Table 2-12, Figure 2-11). The corresponding incidence
rates were also highest in these age groups, with rates
ranging from 24% to 97% higher than the overall rate
for Ontario.

Reportable Disease Trends in Ontario 2011 137
Table 2-12. Incidence of Tuberculosis by Age and Sex: Ontario, 2011
Age Group (Years)
Female Male Total
Cases Rates per 100,000
population Cases
Rates per 100,000 population
Cases Rates per 100,000
population
0-4 5 1.42 6 1.62 11 1.52
5-9 3 0.85 3 0.80 6 0.82
10-19 17 2.13 18 2.15 35 2.14
20-29 70 7.55 48 5.04 118 6.28
30-39 59 6.46 50 5.68 109 6.08
40-49 50 4.85 47 4.56 97 4.70
50-59 33 3.45 42 4.46 75 3.95
60-69 35 5.09 41 6.35 76 5.70
70+ 58 7.62 70 12.46 128 9.67
Total 330 4.87 325 4.93 655 4.90
Ontario Cases: MOHLTC, integrated Public Health Information System (iPHIS) database, extracted [2012/07/18]. Ontario Population: MOHLTC, intelliHEALTH Ontario, extracted [2012/10/15].
Figure 2-11. Incidence of Tuberculosis by Age and Sex: Ontario, 2011
Ontario Cases: MOHLTC, integrated Public Health Information System (iPHIS) database, extracted [2012/06/13]. Ontario Population: MOHLTC, intelliHEALTH Ontario, extracted [2012/10/15].
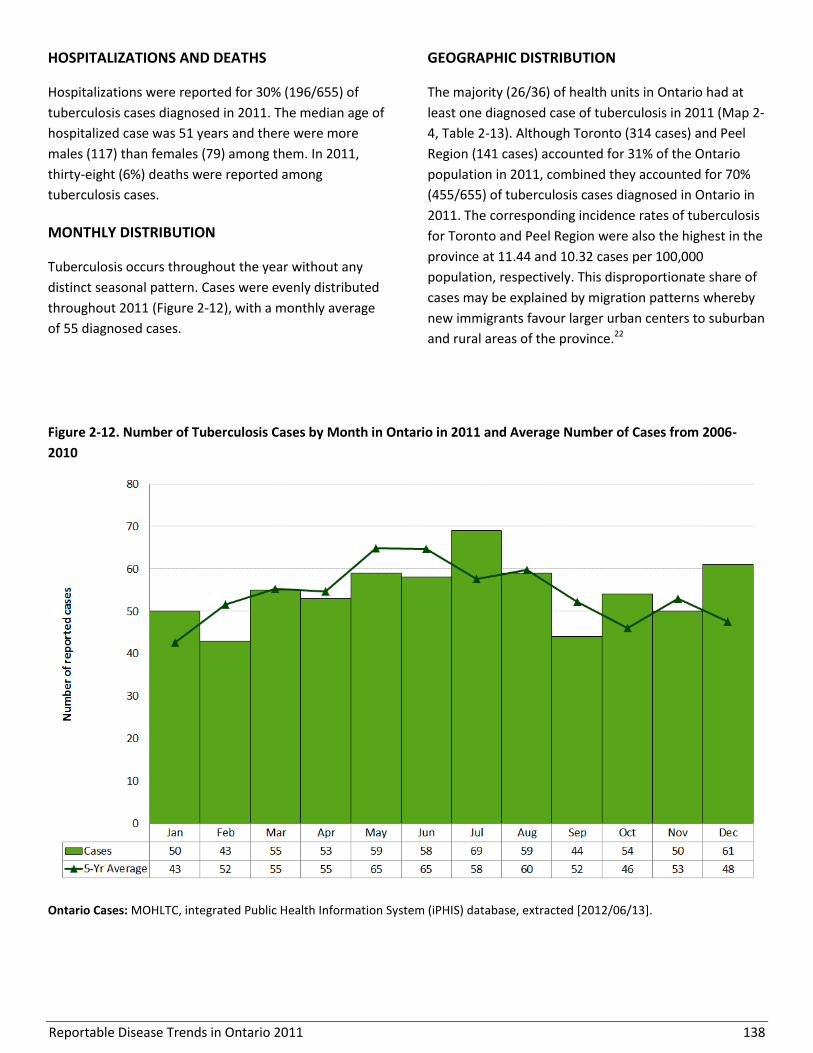
Reportable Disease Trends in Ontario 2011 138
HOSPITALIZATIONS AND DEATHS
Hospitalizations were reported for 30% (196/655) of
tuberculosis cases diagnosed in 2011. The median age of
hospitalized case was 51 years and there were more
males (117) than females (79) among them. In 2011,
thirty-eight (6%) deaths were reported among
tuberculosis cases.
MONTHLY DISTRIBUTION
Tuberculosis occurs throughout the year without any
distinct seasonal pattern. Cases were evenly distributed
throughout 2011 (Figure 2-12), with a monthly average
of 55 diagnosed cases.
GEOGRAPHIC DISTRIBUTION
The majority (26/36) of health units in Ontario had at
least one diagnosed case of tuberculosis in 2011 (Map 2-
4, Table 2-13). Although Toronto (314 cases) and Peel
Region (141 cases) accounted for 31% of the Ontario
population in 2011, combined they accounted for 70%
(455/655) of tuberculosis cases diagnosed in Ontario in
2011. The corresponding incidence rates of tuberculosis
for Toronto and Peel Region were also the highest in the
province at 11.44 and 10.32 cases per 100,000
population, respectively. This disproportionate share of
cases may be explained by migration patterns whereby
new immigrants favour larger urban centers to suburban
and rural areas of the province.22
Figure 2-12. Number of Tuberculosis Cases by Month in Ontario in 2011 and Average Number of Cases from 2006-
2010
Ontario Cases: MOHLTC, integrated Public Health Information System (iPHIS) database, extracted [2012/06/13].
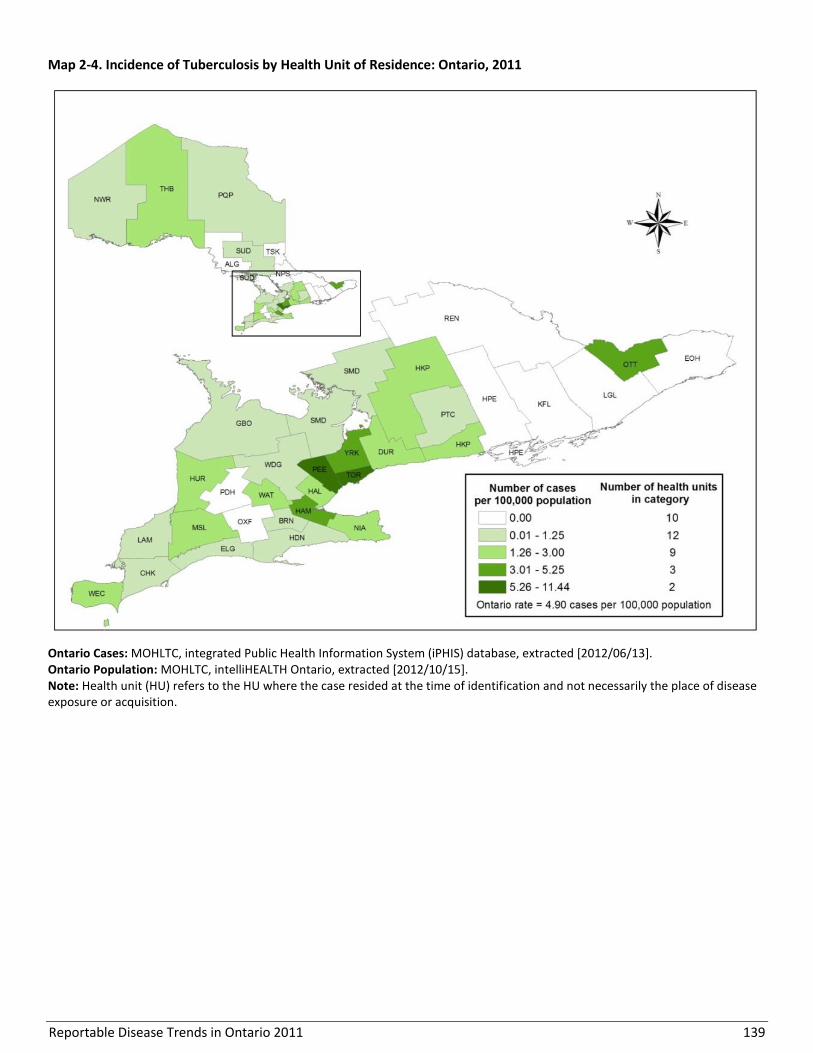
Reportable Disease Trends in Ontario 2011 139
Map 2-4. Incidence of Tuberculosis by Health Unit of Residence: Ontario, 2011
Ontario Cases: MOHLTC, integrated Public Health Information System (iPHIS) database, extracted [2012/06/13]. Ontario Population: MOHLTC, intelliHEALTH Ontario, extracted [2012/10/15]. Note: Health unit (HU) refers to the HU where the case resided at the time of identification and not necessarily the place of disease exposure or acquisition.

Reportable Disease Trends in Ontario 2011 140
Table 2-13. Incidence of Tuberculosis by Health Unit of Residence: Ontario, 2011
Public Health Unit Cases (n) Rates (per
100,000 Population)
Cases as Proportion of Total
Cases (%)
Proportion of Ontario
Population (%)
Algoma District 0 0.00 0.0% 0.9%
Brant County 1 0.71 0.2% 1.1%
Chatham-Kent 1 0.92 0.2% 0.8%
Durham Region 13 2.06 2.0% 4.7%
Eastern Ontario 0 0.00 0.0% 1.5%
Elgin-St. Thomas 1 1.09 0.2% 0.7%
Grey Bruce 1 0.61 0.2% 1.2%
Haldimand-Norfolk 1 0.90 0.2% 0.8%
Haliburton, Kawartha, Pine Ridge District 3 1.68 0.6% 1.3%
Halton Region 12 2.31 1.7% 3.9%
Hamilton, City of 18 3.33 2.6% 4.0%
Hastings & Prince Edward Counties 0 0.00 0.0% 1.2%
Huron County 1 1.66 0.2% 0.5%
Kingston-Frontenac & Lennox & Addington 0 0.00 0.0% 1.5%
Lambton County 1 0.76 0.2% 1.0%
Leeds, Grenville and Lanark District 0 0.00 0.0% 1.3%
Middlesex-London 7 1.52 0.9% 3.4%
Niagara Region 7 1.57 1.1% 3.3%
North Bay Parry Sound District 0 0.00 0.0% 1.0%
Northwestern 1 1.22 0.2% 0.6%
Ottawa, City of 47 5.17 7.3% 6.8%
Oxford County 0 0.00 0.0% 0.8%
Peel Region 141 10.32 21.8% 10.2%
Perth District 0 0.00 0.0% 0.6%
Peterborough County-City 1 0.71 0.2% 1.1%
Porcupine 1 1.15 0.2% 0.6%
Renfrew County & District 0 0.00 0.0% 0.8%
Simcoe Muskoka District 2 0.38 0.3% 3.9%
Sudbury & District 1 0.51 0.2% 1.5%
Thunder Bay District 3 1.92 0.5% 1.2%
Timiskaming 0 0.00 0.0% 0.3%
Toronto 314 11.44 47.5% 20.5%
Waterloo Region 12 2.26 2.0% 4.0%
Wellington-Dufferin-Guelph 2 0.72 0.3% 2.1%
Windsor-Essex County 10 2.48 1.5% 3.0%
York Region 53 4.95 8.2% 8.0%
Ontario 655 4.90 100.0% 100.0%
Ontario Cases: MOHLTC, integrated Public Health Information System (iPHIS) database, extracted [2012/06/13]. Ontario Population: MOHLTC, intelliHEALTH Ontario, extracted [2012/10/15]. Note: Health unit (HU) refers to the HU where the case resided at the time of identification and not necessarily the place of disease exposure or acquisition.
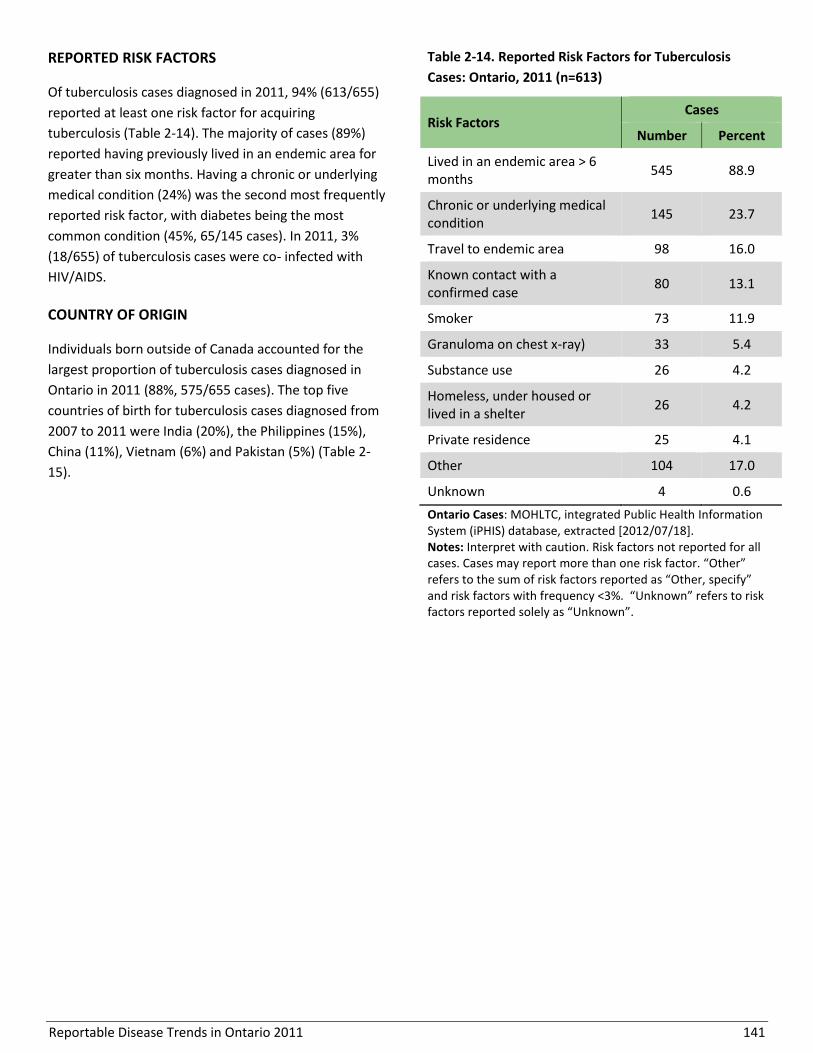
Reportable Disease Trends in Ontario 2011 141
REPORTED RISK FACTORS
Of tuberculosis cases diagnosed in 2011, 94% (613/655)
reported at least one risk factor for acquiring
tuberculosis (Table 2-14). The majority of cases (89%)
reported having previously lived in an endemic area for
greater than six months. Having a chronic or underlying
medical condition (24%) was the second most frequently
reported risk factor, with diabetes being the most
common condition (45%, 65/145 cases). In 2011, 3%
(18/655) of tuberculosis cases were co- infected with
HIV/AIDS.
COUNTRY OF ORIGIN
Individuals born outside of Canada accounted for the
largest proportion of tuberculosis cases diagnosed in
Ontario in 2011 (88%, 575/655 cases). The top five
countries of birth for tuberculosis cases diagnosed from
2007 to 2011 were India (20%), the Philippines (15%),
China (11%), Vietnam (6%) and Pakistan (5%) (Table 2-
15).
Table 2-14. Reported Risk Factors for Tuberculosis
Cases: Ontario, 2011 (n=613)
Risk Factors Cases
Number Percent
Lived in an endemic area > 6 months
545 88.9
Chronic or underlying medical condition
145 23.7
Travel to endemic area 98 16.0
Known contact with a confirmed case
80 13.1
Smoker 73 11.9
Granuloma on chest x-ray) 33 5.4
Substance use 26 4.2
Homeless, under housed or lived in a shelter
26 4.2
Private residence 25 4.1
Other 104 17.0
Unknown 4 0.6
Ontario Cases: MOHLTC, integrated Public Health Information System (iPHIS) database, extracted [2012/07/18]. Notes: Interpret with caution. Risk factors not reported for all cases. Cases may report more than one risk factor. “Other” refers to the sum of risk factors reported as “Other, specify” and risk factors with frequency <3%. “Unknown” refers to risk factors reported solely as “Unknown”.
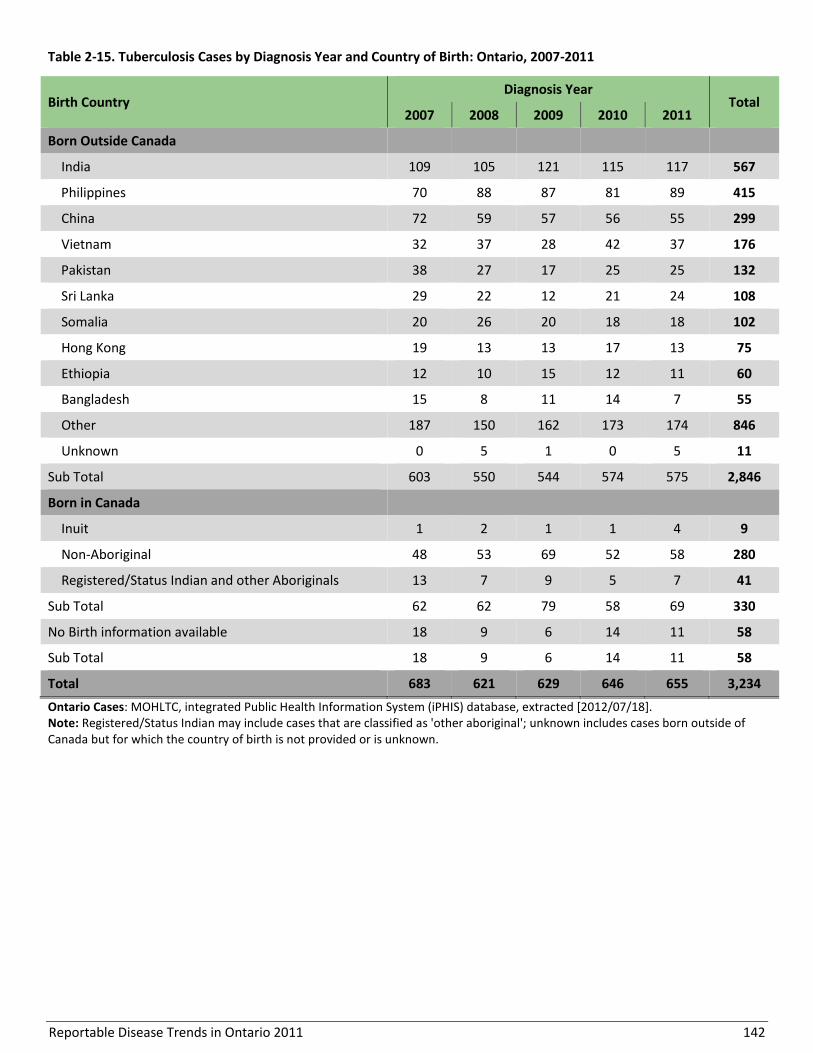
Reportable Disease Trends in Ontario 2011 142
Table 2-15. Tuberculosis Cases by Diagnosis Year and Country of Birth: Ontario, 2007-2011
Birth Country Diagnosis Year
Total 2007 2008 2009 2010 2011
Born Outside Canada
India 109 105 121 115 117 567
Philippines 70 88 87 81 89 415
China 72 59 57 56 55 299
Vietnam 32 37 28 42 37 176
Pakistan 38 27 17 25 25 132
Sri Lanka 29 22 12 21 24 108
Somalia 20 26 20 18 18 102
Hong Kong 19 13 13 17 13 75
Ethiopia 12 10 15 12 11 60
Bangladesh 15 8 11 14 7 55
Other 187 150 162 173 174 846
Unknown 0 5 1 0 5 11
Sub Total 603 550 544 574 575 2,846
Born in Canada
Inuit 1 2 1 1 4 9
Non-Aboriginal 48 53 69 52 58 280
Registered/Status Indian and other Aboriginals 13 7 9 5 7 41
Sub Total 62 62 79 58 69 330
No Birth information available 18 9 6 14 11 58
Sub Total 18 9 6 14 11 58
Total 683 621 629 646 655 3,234
Ontario Cases: MOHLTC, integrated Public Health Information System (iPHIS) database, extracted [2012/07/18]. Note: Registered/Status Indian may include cases that are classified as 'other aboriginal'; unknown includes cases born outside of Canada but for which the country of birth is not provided or is unknown.

Reportable Disease Trends in Ontario 2011 143
Section 3
Sexually transmitted and blood-borne infections
Overview
Sexually transmitted and blood-borne infections
(STBBIs) account for the greatest proportion of cases of
all reportable diseases in Ontario. In 2011, 71% of
reportable diseases were attributed to STBBIs, with
chlamydia accounting for almost 80% of these
infections. The incidence of the sexually transmitted
bacterial infections, chlamydia, gonorrhea and
infectious syphilis, increased over the ten year period
from 2002 to 2011. In comparison, the incidence of viral
blood-borne infections such as hepatitis B and C and
HIV/AIDS decreased over the same time period.
In Ontario, increased testing has contributed to the
reported increases in the incidence of chlamydia and
gonorrhea. Similar to other provinces in Canada,
elevated incidence rates of infectious syphilis have been
reported in Ontario since 2009, primarily due to an
outbreak among men who have sex with men (MSM).
The top reported risk factors for STBBIs, excluding
hepatitis C, are MSM, lack of condom use and/or having
new or multiple sex partners. For hepatitis C, injection
drug use is the most frequently reported risk factor.
Although less common, transmission of STBBIs from
mother to child has also been reported, with the
majority of these cases due to infection with group B
streptococcus.
Several quick reference data tables for the diseases covered in this section are included in Appendix 4.

Reportable Disease Trends in Ontario 2011 144
Chancroid
Chancroid is an acute sexually transmitted bacterial
infection that occurs very rarely in temperate regions.1
Symptoms commonly develop between three to five
days after sexual contact with an infected person, but
can appear after up to 14 days.1 The resulting infection
is localized to the genital area and presents as a single
or multiple painful ulcers with pus that may be
accompanied by painful and swollen lymph nodes.1
Chancroid can be prevented through consistent condom
use when engaging in sexual activity with partner(s)
unknown to be without infection.
2011 IN FOCUS AND HISTORICAL HIGHLIGHTS
Chancroid is very rare in Canada. Since 1997, no new
cases have been reported in Ontario.

Reportable Disease Trends in Ontario 2011 145
Chlamydia
The number of reported chlamydia cases, and
corresponding incidence rates, increased from
2002 to 2011 in Ontario.
Incidence rates of chlamydia in Ontario in
2011 were highest among females and among
those aged 15 to 24 years.
The most frequently reported risk factors were
lack of condom use, sex with the opposite sex
and new sexual contacts within the last two
months.
Chlamydia infections are caused by the bacterium
Chlamydia trachomatis.1 Transmission occurs primarily
through sexual contact, including oral, vaginal and anal
sex. In some cases, infected pregnant females can
transmit the bacteria to their child through birth.1
The development of symptoms usually occurs seven to
14 days after exposure to the bacteria. However
infected individuals are often asymptomatic, with up to
70% of females and up to 50% of males experiencing no
symptoms at all.1 When present, symptoms may include
unusual vaginal discharge or bleeding, urethral
bleeding, painful urination, and lower abdominal
pain.1,49 Left untreated, chlamydia infections can in
some instances lead to long-term complications such as
pelvic inflammatory disease, ectopic pregnancy and
infertility in females; and epididymitis, sterility and
Reiter syndrome in males. When transmitted from
mother to child during delivery, chlamydia can result in
eye infections (ophthalmia neonatorum) in neonates,
and pneumonia in infants less than six months of age.1
Data on the incidence of ophthalmia neonatorum in
Ontario are presented in a separate chapter.
Chlamydia can be treated and cured with antibiotics.
Condom use during sexual activity reduces the risk of
transmission of chlamydia, as well as early diagnosis and
treatment of infected persons.
2011 IN FOCUS AND HISTORICAL HIGHLIGHTS
Chlamydia is the most frequently reported sexually
transmitted infection (STI) and the most frequently
reported reportable disease in Ontario. In 2011, there
were 36,343 confirmed cases of chlamydia in Ontario,
which accounted for 85% of all reported sexually
transmitted and blood-borne infections. This represents
an incidence rate of 271.79 cases per 100,000
population, and an increase of seven percent compared
to the incidence rate in 2010 (Figure 3-1).
The incidence of chlamydia in Ontario has been steadily
increasing (Figure 3-1). From 2002 to 2011, the
incidence rate increased 79%, from 151.90 to 271.79
cases per 100,000 population. The increase may be
partly explained by changes in screening practices and
advances in testing methods which have led to
increased testing. Despite this observed increase,
chlamydia is still under-reported in large part due to the
occurrence of asymptomatic cases.
Between 2002 and 2011, annual incidence rates of
chlamydia in Canada were consistently higher than the
provincial rate, even when Ontario data are excluded
from the overall Canadian rate.
AGE AND SEX DISTRIBUTION
The incidence rate of chlamydia in 2011 was higher for
females compared to males at 346.20 versus 194.19
cases per 100,000 population, respectively. The highest
incidence rates for both males and females were
observed in the 20-24 year age group, which had an
overall rate of 1,443.54 cases per 100,000 population.
Incidence rates of chlamydia decreased with increasing
age for both males and females starting at age 25 years
(Table 3-1, Figure 3-2).
Females accounted for 65% of reported cases and had
an incidence rate that was 78% higher than males,
which may be a result of the greater likelihood of
chlamydia screening and detection in females during
routine medical care.

Reportable Disease Trends in Ontario 2011 146
Figure 3-1. Incidence of Chlamydia in Ontario and Canada: 2002-2011
Ontario cases: MOHLTC, integrated Public Health Information System (iPHIS) database, extracted [2012/07/18]. Ontario population: MOHLTC, intelliHEALTH Ontario, extracted [2012/10/15]. Canadian Rates: Public Health Agency of Canada, Canadian Notifiable Disease Section, received by PHO [2012/09/24]; national data available up to 2008.
Table 3-1. Incidence of Chlamydia by Age and Sex: Ontario, 2011
Age Group (Years)
Female Male Total
Cases Rates (per 100,000
Population) Cases
Rates (per 100,000 Population)
Cases Rates (per 100,000
Population)
<15 122 11.3 16 1.4 138 6.2
15-19 6,442 1,509.9 1,693 379.4 8,135 932.0
20-24 8,905 1,927.1 4,760 982.4 13,665 1,443.5
25-29 3,897 837.5 2,903 620.0 6,800 728.4
30-39 2,842 311.3 2,188 248.7 5,030 280.6
40-49 940 91.2 906 87.8 1,846 89.5
50-59 275 28.7 257 27.3 532 28.0
60-69 46 6.7 66 10.2 112 8.4
70+ 5 0.7 13 2.3 18 1.4
Total 23,474 346.2 12,802 194.2 36,276 271.3
Ontario cases: MOHLTC, integrated Public Health Information System (iPHIS) database, extracted [2012/07/18]. Ontario population: MOHLTC, intelliHEALTH Ontario, extracted [2012/10/15]. Note: Excludes 67 cases of unknown age and/or sex.
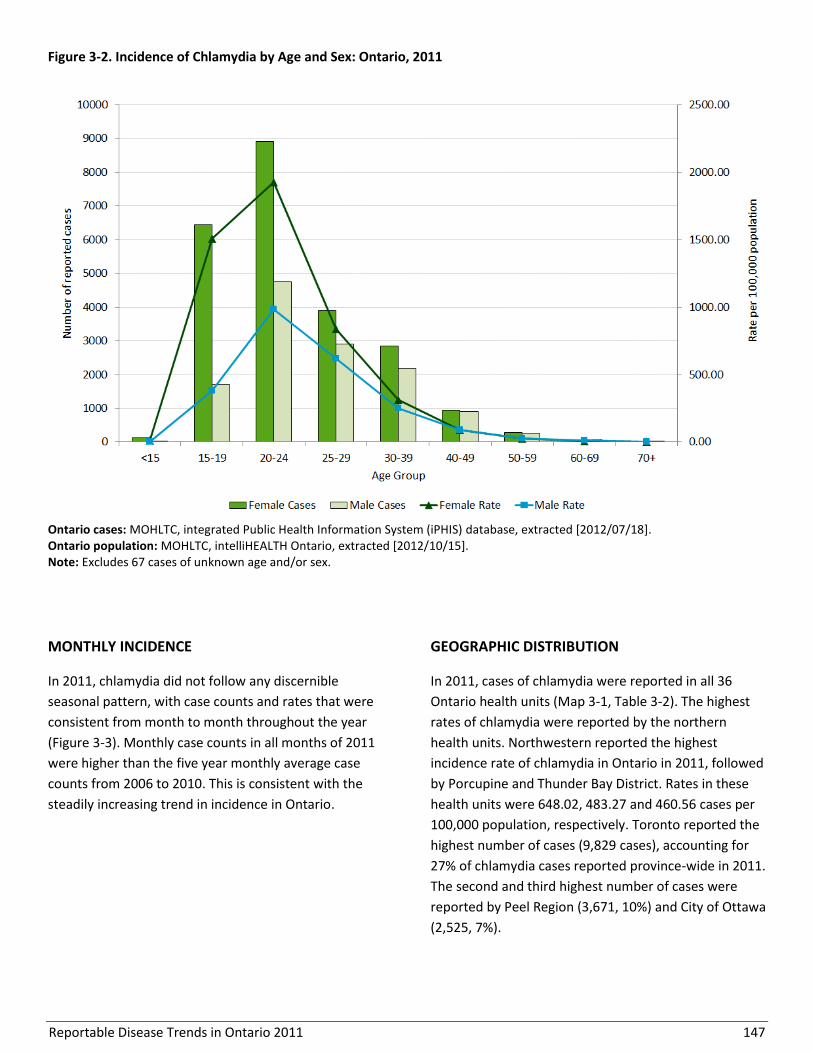
Reportable Disease Trends in Ontario 2011 147
Figure 3-2. Incidence of Chlamydia by Age and Sex: Ontario, 2011
Ontario cases: MOHLTC, integrated Public Health Information System (iPHIS) database, extracted [2012/07/18]. Ontario population: MOHLTC, intelliHEALTH Ontario, extracted [2012/10/15]. Note: Excludes 67 cases of unknown age and/or sex.
MONTHLY INCIDENCE
In 2011, chlamydia did not follow any discernible
seasonal pattern, with case counts and rates that were
consistent from month to month throughout the year
(Figure 3-3). Monthly case counts in all months of 2011
were higher than the five year monthly average case
counts from 2006 to 2010. This is consistent with the
steadily increasing trend in incidence in Ontario.
GEOGRAPHIC DISTRIBUTION
In 2011, cases of chlamydia were reported in all 36
Ontario health units (Map 3-1, Table 3-2). The highest
rates of chlamydia were reported by the northern
health units. Northwestern reported the highest
incidence rate of chlamydia in Ontario in 2011, followed
by Porcupine and Thunder Bay District. Rates in these
health units were 648.02, 483.27 and 460.56 cases per
100,000 population, respectively. Toronto reported the
highest number of cases (9,829 cases), accounting for
27% of chlamydia cases reported province-wide in 2011.
The second and third highest number of cases were
reported by Peel Region (3,671, 10%) and City of Ottawa
(2,525, 7%).
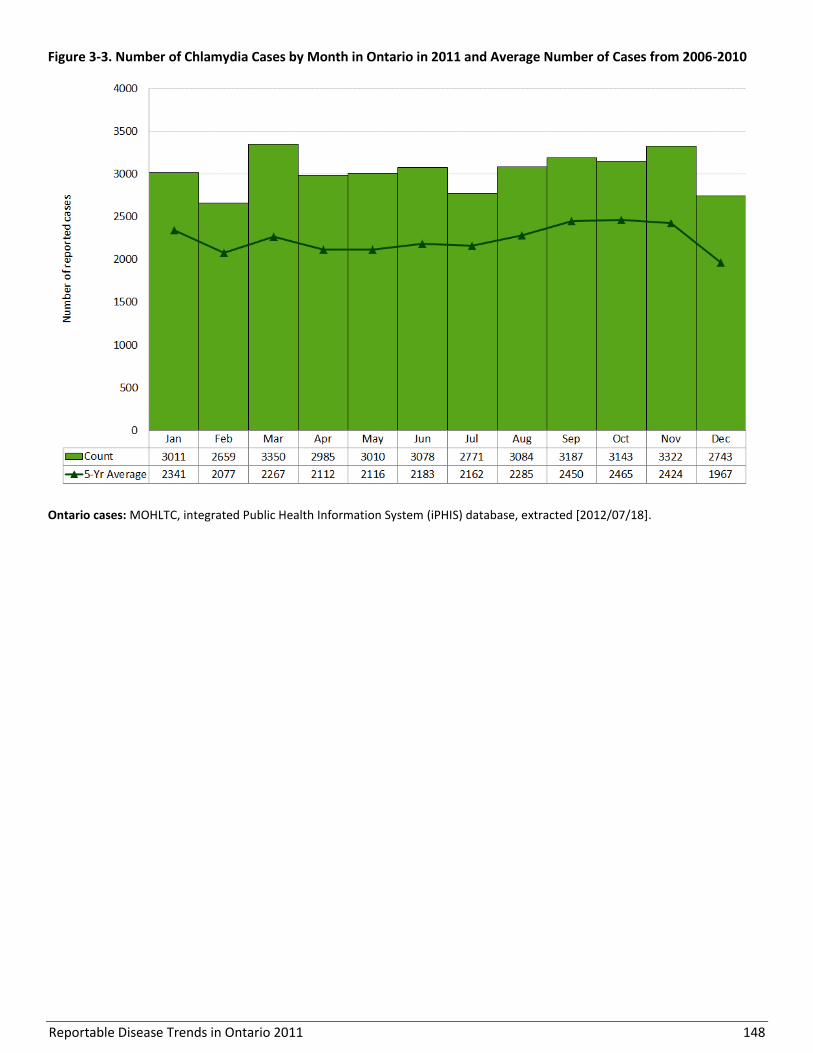
Reportable Disease Trends in Ontario 2011 148
Figure 3-3. Number of Chlamydia Cases by Month in Ontario in 2011 and Average Number of Cases from 2006-2010
Ontario cases: MOHLTC, integrated Public Health Information System (iPHIS) database, extracted [2012/07/18].
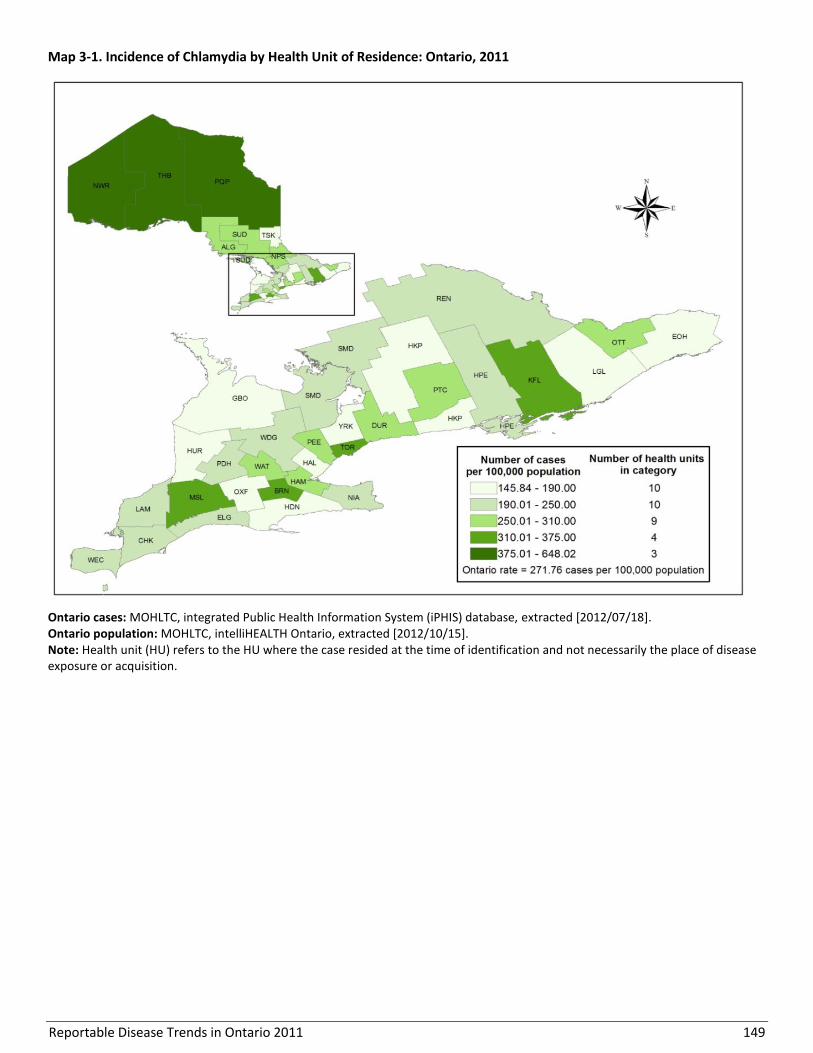
Reportable Disease Trends in Ontario 2011 149
Map 3-1. Incidence of Chlamydia by Health Unit of Residence: Ontario, 2011
Ontario cases: MOHLTC, integrated Public Health Information System (iPHIS) database, extracted [2012/07/18]. Ontario population: MOHLTC, intelliHEALTH Ontario, extracted [2012/10/15]. Note: Health unit (HU) refers to the HU where the case resided at the time of identification and not necessarily the place of disease exposure or acquisition.

Reportable Disease Trends in Ontario 2011 150
Table 3-2. Incidence of Chlamydia by Health Unit of Residence: Ontario, 2011
Public Health Unit Cases (n) Rates (per
100,000 Population)
Cases as Proportion of Total
Cases (%)
Proportion of Ontario
Population (%)
Algoma District 319 270.77 0.9% 0.9%
Brant County 522 370.70 1.4% 1.1%
Chatham-Kent 254 233.93 0.7% 0.8%
Durham Region 1,713 271.36 4.7% 4.7%
Eastern Ontario 340 169.05 0.9% 1.5%
Elgin-St. Thomas 185 202.37 0.5% 0.7%
Grey Bruce 262 158.94 0.7% 1.2%
Haldimand-Norfolk 195 176.14 0.5% 0.8%
Haliburton, Kawartha, Pine Ridge District 287 160.33 0.8% 1.3%
Halton Region 818 157.71 2.3% 3.9%
Hamilton, City of 1,640 303.57 4.5% 4.0%
Hastings & Prince Edward Counties 406 249.52 1.1% 1.2%
Huron County 88 145.84 0.2% 0.5%
Kingston-Frontenac & Lennox & Addington 680 344.59 1.9% 1.5%
Lambton County 274 208.50 0.8% 1.0%
Leeds, Grenville and Lanark District 301 176.89 0.8% 1.3%
Middlesex-London 1,487 322.66 4.1% 3.4%
Niagara Region 1,053 236.44 2.9% 3.3%
North Bay Parry Sound District 392 307.89 1.1% 1.0%
Northwestern 531 648.02 1.5% 0.6%
Ottawa, City of 2,525 277.51 6.9% 6.8%
Oxford County 189 174.63 0.5% 0.8%
Peel Region 3,671 268.77 10.1% 10.2%
Perth District 161 208.74 0.4% 0.6%
Peterborough County-City 401 285.32 1.1% 1.1%
Porcupine 419 483.27 1.2% 0.6%
Renfrew County & District 244 236.99 0.7% 0.8%
Simcoe Muskoka District 1,075 204.57 3.0% 3.9%
Sudbury & District 589 297.92 1.6% 1.5%
Thunder Bay District 721 460.56 2.0% 1.2%
Timiskaming 65 188.68 0.2% 0.3%
Toronto 9,829 358.23 27.0% 20.5%
Waterloo Region 1,375 259.31 3.8% 4.0%
Wellington-Dufferin-Guelph 626 224.81 1.7% 2.1%
Windsor-Essex County 877 217.40 2.4% 3.0%
York Region 1,829 170.97 5.0% 8.0%
Ontario 36,343 271.76 100.0% 100.0%
Ontario cases: MOHLTC, integrated Public Health Information System (iPHIS) database, extracted [2012/07/18]. Ontario population: MOHLTC, intelliHEALTH Ontario, extracted [2012/10/15]. Note: Health unit (HU) refers to the HU where the case resided at the time of identification and not necessarily the place of disease exposure or acquisition.
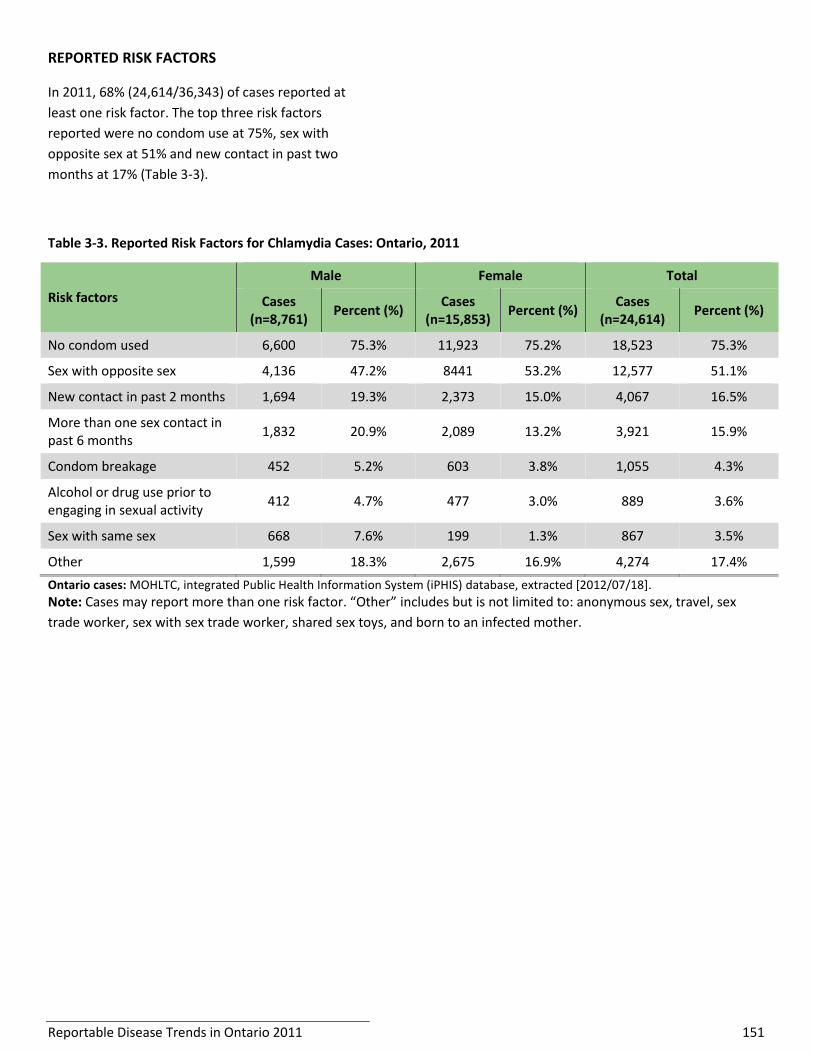
Reportable Disease Trends in Ontario 2011 151
REPORTED RISK FACTORS
In 2011, 68% (24,614/36,343) of cases reported at
least one risk factor. The top three risk factors
reported were no condom use at 75%, sex with
opposite sex at 51% and new contact in past two
months at 17% (Table 3-3).
Table 3-3. Reported Risk Factors for Chlamydia Cases: Ontario, 2011
Risk factors
Male Female Total
Cases (n=8,761)
Percent (%) Cases
(n=15,853) Percent (%)
Cases (n=24,614)
Percent (%)
No condom used 6,600 75.3% 11,923 75.2% 18,523 75.3%
Sex with opposite sex 4,136 47.2% 8441 53.2% 12,577 51.1%
New contact in past 2 months 1,694 19.3% 2,373 15.0% 4,067 16.5%
More than one sex contact in past 6 months
1,832 20.9% 2,089 13.2% 3,921 15.9%
Condom breakage 452 5.2% 603 3.8% 1,055 4.3%
Alcohol or drug use prior to engaging in sexual activity
412 4.7% 477 3.0% 889 3.6%
Sex with same sex 668 7.6% 199 1.3% 867 3.5%
Other 1,599 18.3% 2,675 16.9% 4,274 17.4%
Ontario cases: MOHLTC, integrated Public Health Information System (iPHIS) database, extracted [2012/07/18].
Note: Cases may report more than one risk factor. “Other” includes but is not limited to: anonymous sex, travel, sex
trade worker, sex with sex trade worker, shared sex toys, and born to an infected mother.

Reportable Disease Trends in Ontario 2011 152
Cytomegalovirus Infection, Congenital
Cytomegalovirus (CMV) is a common infection that can
affect people of all ages. During pregnancy, it may be
transmitted from mother to child. Although most
infections in infants (between 90% and 95%) do not
result in any health problems, up to 10% of infants can
develop a severe form of the disease known as
congenital CMV.1 In Ontario, only congenital cases of
CMV are reportable.
Manifestations of congenital CMV that may be present
at birth include enlarged liver and spleen, lung
problems, small size partly due to premature birth, and
seizures. Chronic problems due to CMV infection such
as hearing and vision loss, developmental disabilities,
lack of coordination and seizures can develop up to two
or more years after birth. The neonatal death rate is
high for severely affected infants.1
2011 IN FOCUS AND HISTORICAL HIGHLIGHTS
In 2011, ten cases of congenital CMV were reported in
Ontario, corresponding to an incidence rate of 7.15
cases per 100,000 live births (Figure 3-4). The number of
cases reported in 2011 also represented a 100%
increase over the 2010 total of five cases. From 2002 to
2011, 65 cases of congenital CMV were reported in
Ontario, with annual incidence rates ranging from 2.14
(2008) to 7.15 (2011) cases per 100,000 live births.
No comparable national data are available as congenital
CMV infections are not nationally notifiable.
Figure 3-4. Incidence of Congenital Cytomegalovirus: Ontario and Canada, 2002-2011
Ontario Cases: MOHLTC, integrated Public Health Information System (iPHIS) database, extracted [2012/06/13]. Ontario Population: MOHLTC, intelliHEALTH Ontario, extracted [2013/09/05]; rates are per/100,000 live births. Canadian Rates: Congenital CMV is not a nationally notifiable disease.

Reportable Disease Trends in Ontario 2011 153
Gonorrhea
From 2002 to 2011, annual incidence rates of
gonorrhea in Ontario increased by 23%.
Rates of gonorrhea were higher among males
and among those in the 20-24 years age group.
The highest incidence rates of gonorrhoea in
2011 were observed in the three most
northern health units and Toronto.
The most commonly reported risk factor for
gonorrhea infections in 2011 was no condom
use.
Gonorrhea is caused by Neisseria gonorrhoeae bacteria
that infect mucous membranes that line the vagina,
cervix, urethra, oropharynx, rectum and conjunctiva.1
Similar to chlamydia, transmission primarily occurs
through sexual activity, including vaginal, anal and oral
sex. Mother-to-child transmission may also occur during
childbirth.1
Symptoms of gonorrhea infection can appear up to 14
days after initial infection.1 Both males and females with
gonorrhea infection may be symptom free,50 though the
majority of males will have symptoms.1 The most
common symptoms among men include urethral
discharge, inflammation of the urethra, and pain or
discomfort during urination. The most common
symptoms among women are unusual vaginal discharge
or bleeding, painful urination, abdominal pain, and pain
during intercourse.1 Gonorrhea infections can be
transmitted even if an individual does not have any
symptoms.1 When transmitted from an infected mother
during childbirth, N. gonorrhoeae can cause ophthalmia
neonatorum, an acute infection of the eyes that can
lead to blindness in newborns.1 Data on the incidence
of ophthalmia neonatorum in Ontario are presented in
a separate chapter.
Individuals at higher risk of infection include sexually
active youth under the age of 25 years, those who have
sex with multiple partners, men who have sex with
men, and those previously diagnosed with a sexually
transmitted infection (STI).50 Gonorrhea is preventable
through condom use and can be treated with
antibiotics; however, resistance to certain antibiotics
has been observed resulting in recent changes to
treatment regimens.
2011 IN FOCUS AND HISTORICAL HIGHLIGHTS
Among provincially reportable diseases, gonorrhea is
the second most frequently reported STI in Ontario
(second to chlamydia). In 2011, there were 4,196
reported cases in Ontario (Figure 3-5), of which 1,408
(34%) were co-infected with chlamydia. The incidence
rate of gonorrhea in 2011 was 31.38 cases per 100,000
population, which was five percent higher than the rate
of 29.97 cases per 100,000 reported in 2010 (Figure 3-
5).
From 2002 to 2011, the incidence rate of gonorrhea
increased 23%, from 25.51 cases to 31.38 cases per
100,000 population, respectively.
Ontario incidence rates for gonorrhea were higher than
the overall Canadian rates from 2002 to 2004, but were
consistently lower than the national rates from 2005 to
2008 (Figure 3-5). In addition, annual rates of increase
at the national level were higher compared to Ontario
during the latter period.
AGE AND SEX DISTRIBUTION
In 2011, the incidence rate of gonorrhea was higher for
males compared to females, with 36.33 versus 26.46
cases per 100,000 population, respectively (Table 3-4,
Figure 3-6). Males and females in the 20-24 age group
had the highest rates of gonorrhea in 2011. The highest
incidence rates for males were observed among those
25 years and older, while the highest incidence rates for
females were observed among those under 25 years of
age. The higher incidence of gonorrhea among males
may be attributed in part to transmission among men
who have sex with men.
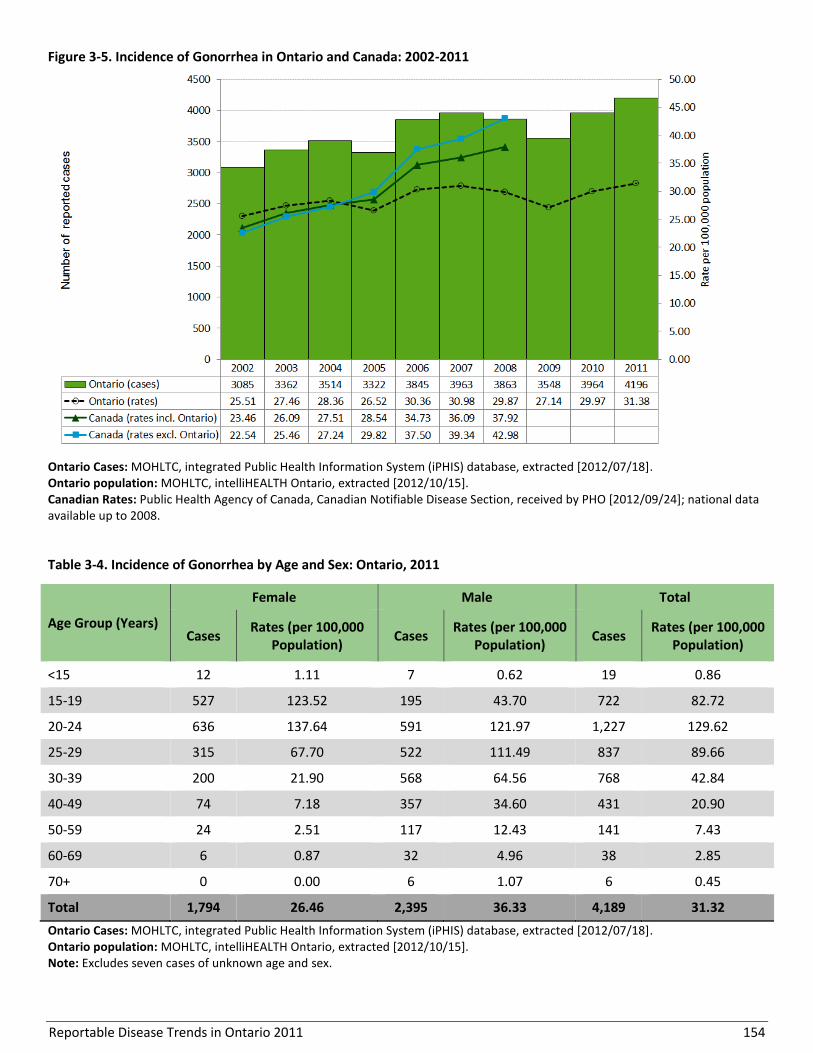
Reportable Disease Trends in Ontario 2011 154
Figure 3-5. Incidence of Gonorrhea in Ontario and Canada: 2002-2011
Ontario Cases: MOHLTC, integrated Public Health Information System (iPHIS) database, extracted [2012/07/18]. Ontario population: MOHLTC, intelliHEALTH Ontario, extracted [2012/10/15]. Canadian Rates: Public Health Agency of Canada, Canadian Notifiable Disease Section, received by PHO [2012/09/24]; national data available up to 2008.
Table 3-4. Incidence of Gonorrhea by Age and Sex: Ontario, 2011
Age Group (Years)
Female Male Total
Cases Rates (per 100,000
Population) Cases
Rates (per 100,000 Population)
Cases Rates (per 100,000
Population)
<15 12 1.11 7 0.62 19 0.86
15-19 527 123.52 195 43.70 722 82.72
20-24 636 137.64 591 121.97 1,227 129.62
25-29 315 67.70 522 111.49 837 89.66
30-39 200 21.90 568 64.56 768 42.84
40-49 74 7.18 357 34.60 431 20.90
50-59 24 2.51 117 12.43 141 7.43
60-69 6 0.87 32 4.96 38 2.85
70+ 0 0.00 6 1.07 6 0.45
Total 1,794 26.46 2,395 36.33 4,189 31.32
Ontario Cases: MOHLTC, integrated Public Health Information System (iPHIS) database, extracted [2012/07/18]. Ontario population: MOHLTC, intelliHEALTH Ontario, extracted [2012/10/15]. Note: Excludes seven cases of unknown age and sex.

Reportable Disease Trends in Ontario 2011 155
Figure 3-6. Incidence of Gonorrhea by Age and Sex: Ontario, 2011
Ontario Cases: MOHLTC, integrated Public Health Information System (iPHIS) database, extracted [2012/07/18]. Ontario population: MOHLTC, intelliHEALTH Ontario, extracted [2012/10/15]. Note: Excludes seven cases of unknown age and sex.
MONTHLY DISTRIBUTION
Gonorrhea does not follow a seasonal pattern and cases
are reported consistently throughout the year. In 2011,
the incidence rate exceeded the range of expected
values for five months of the year compared to the five-
year monthly average case counts from 2006 to 2010
(Figure 3-7).
GEOGRAPHIC DISTRIBUTION
In 2011, the three highest rates of gonorrhea were
reported by Northwestern, Porcupine and Toronto
health units. Northwestern reported an incidence rate
of 153.77 cases per 100,000, followed by Porcupine
with 80.74 cases per 100,000 population and Toronto
with 70.74 cases per 100,000 population. Toronto also
reported the highest number of cases (1,941),
accounting for 46% of gonorrhea cases in 2011 (Map 3-
2, Table 3-5). Peel Region reported the second highest
number of cases at 464 or 11% of all cases reported in
2011, while City of Ottawa accounted for 216 cases or
five percent of all cases reported in 2011.
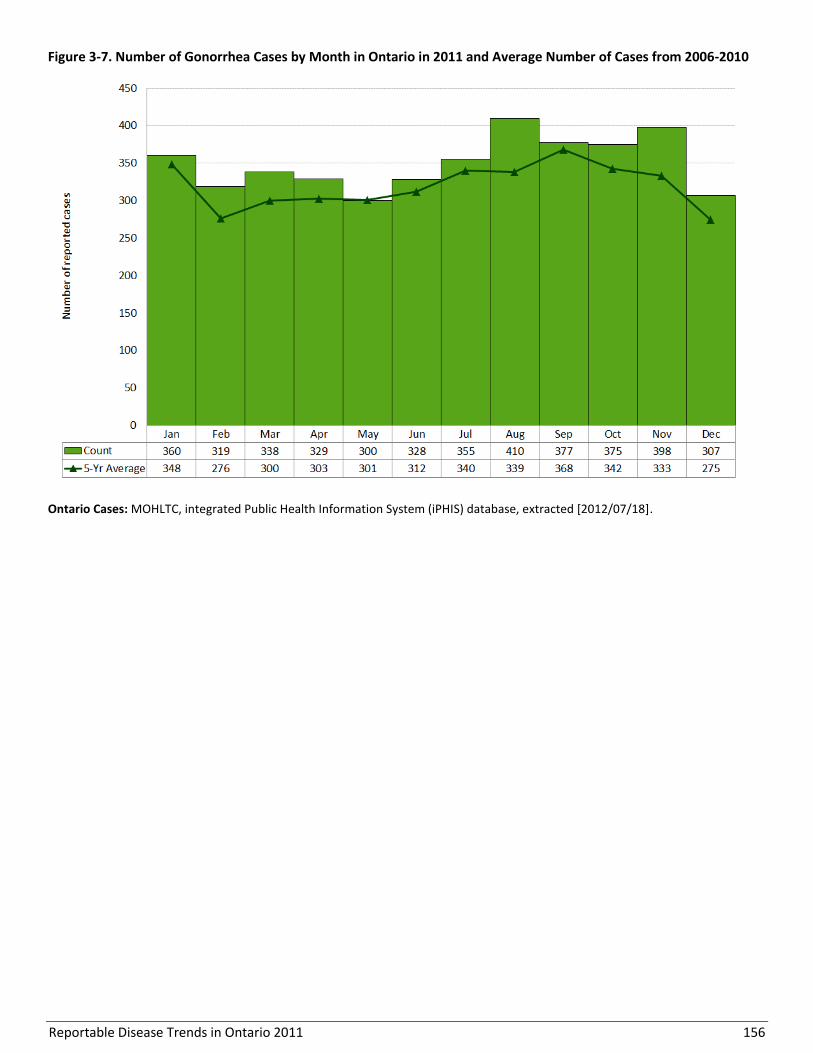
Reportable Disease Trends in Ontario 2011 156
Figure 3-7. Number of Gonorrhea Cases by Month in Ontario in 2011 and Average Number of Cases from 2006-2010
Ontario Cases: MOHLTC, integrated Public Health Information System (iPHIS) database, extracted [2012/07/18].

Reportable Disease Trends in Ontario 2011 157
Map 3-2. Incidence of Gonorrhea by Health Unit of Residence: Ontario, 2011
Ontario Cases: MOHLTC, integrated Public Health Information System (iPHIS) database, extracted [2012/07/18]. Ontario population: MOHLTC, intelliHEALTH Ontario, extracted [2012/10/15]. Note: Health unit (HU) refers to the HU where the case resided at the time of identification and not necessarily the place of disease exposure or acquisition.
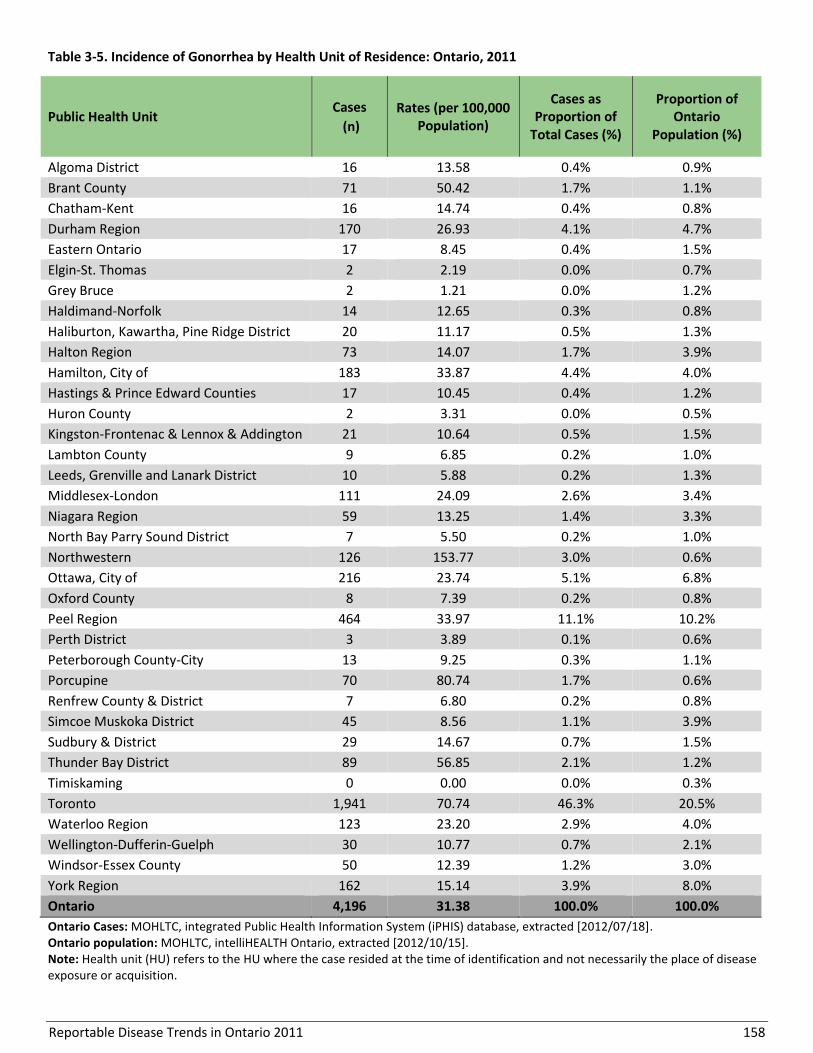
Reportable Disease Trends in Ontario 2011 158
Table 3-5. Incidence of Gonorrhea by Health Unit of Residence: Ontario, 2011
Public Health Unit Cases
(n)
Rates (per 100,000 Population)
Cases as Proportion of
Total Cases (%)
Proportion of Ontario
Population (%)
Algoma District 16 13.58 0.4% 0.9%
Brant County 71 50.42 1.7% 1.1%
Chatham-Kent 16 14.74 0.4% 0.8%
Durham Region 170 26.93 4.1% 4.7%
Eastern Ontario 17 8.45 0.4% 1.5%
Elgin-St. Thomas 2 2.19 0.0% 0.7%
Grey Bruce 2 1.21 0.0% 1.2%
Haldimand-Norfolk 14 12.65 0.3% 0.8%
Haliburton, Kawartha, Pine Ridge District 20 11.17 0.5% 1.3%
Halton Region 73 14.07 1.7% 3.9%
Hamilton, City of 183 33.87 4.4% 4.0%
Hastings & Prince Edward Counties 17 10.45 0.4% 1.2%
Huron County 2 3.31 0.0% 0.5%
Kingston-Frontenac & Lennox & Addington 21 10.64 0.5% 1.5%
Lambton County 9 6.85 0.2% 1.0%
Leeds, Grenville and Lanark District 10 5.88 0.2% 1.3%
Middlesex-London 111 24.09 2.6% 3.4%
Niagara Region 59 13.25 1.4% 3.3%
North Bay Parry Sound District 7 5.50 0.2% 1.0%
Northwestern 126 153.77 3.0% 0.6%
Ottawa, City of 216 23.74 5.1% 6.8%
Oxford County 8 7.39 0.2% 0.8%
Peel Region 464 33.97 11.1% 10.2%
Perth District 3 3.89 0.1% 0.6%
Peterborough County-City 13 9.25 0.3% 1.1%
Porcupine 70 80.74 1.7% 0.6%
Renfrew County & District 7 6.80 0.2% 0.8%
Simcoe Muskoka District 45 8.56 1.1% 3.9%
Sudbury & District 29 14.67 0.7% 1.5%
Thunder Bay District 89 56.85 2.1% 1.2%
Timiskaming 0 0.00 0.0% 0.3%
Toronto 1,941 70.74 46.3% 20.5%
Waterloo Region 123 23.20 2.9% 4.0%
Wellington-Dufferin-Guelph 30 10.77 0.7% 2.1%
Windsor-Essex County 50 12.39 1.2% 3.0%
York Region 162 15.14 3.9% 8.0%
Ontario 4,196 31.38 100.0% 100.0%
Ontario Cases: MOHLTC, integrated Public Health Information System (iPHIS) database, extracted [2012/07/18]. Ontario population: MOHLTC, intelliHEALTH Ontario, extracted [2012/10/15]. Note: Health unit (HU) refers to the HU where the case resided at the time of identification and not necessarily the place of disease exposure or acquisition.

Reportable Disease Trends in Ontario 2011 159
REPORTED RISK FACTORS
In 2011, 75% (3,127/4,196) of gonorrhea cases reported
at least one risk factor. The top three risk factors were
no condom use at 74%, sex with opposite sex at 37%
and having more than one sexual contact in past six
months at 25% (Table 3-6). Among males, sex with same
sex was the second most frequently reported risk factor
at 41%.
Table 3-6. Reported Risk Factors for Gonorrhea Cases: Ontario, 2011
Risk factors
Male Female Total
Cases (n=1,848)
Percent (%)
Cases (n=1,279)
Percent (%)
Cases (n=3,127)
Percent (%)
No condom used 1,395 75.5% 919 71.9% 2314 74.0%
Sex with opposite sex 493 26.7% 652 51.0% 1145 36.6%
More than one sex contact in past 6 months
589 31.9% 199 15.6% 788 25.2%
Sex with same sex 753 40.7% 16 1.3% 769 24.6%
New contact in past 2 months 343 18.6% 195 15.2% 538 17.2%
Anonymous sex 135 7.3% 30 2.3% 165 5.3%
Condom breakage 95 5.1% 63 4.9% 158 5.1%
Judgement impaired by alcohol or drugs
74 4.0% 44 3.4% 118 3.8%
Travel outside Ontario 57 3.1% 25 2.0% 82 2.6%
Other 362 19.5% 426 23.7% 788 18.8%
Ontario Cases: MOHLTC, integrated Public Health Information System (iPHIS) database, extracted [2012/07/18]. Note: Cases may report more than one risk factor. “Other” includes but is not limited to: sex trade worker, sex with sex trade worker, shared sex toys, and born to an infected mother.
Reportable Disease Trends in Ontario 2011 160
Group B Streptococcal Disease, Neonatal
The annual number of neonatal group B
streptococcal disease in Ontario has been
relatively stable since 2004.
In 2011, sixteen health units in Ontario
reported cases of neonatal group B
streptococcal disease.
Neonatal group B streptococcal disease is reportable in
newborns up to 28 days old in Ontario. It is caused by
infection with group B streptococci bacteria.1 Symptoms
of infection in newborns can present as early onset
disease that occur within seven days of birth. Late onset
disease typically occurs from seven days to months after
birth. In both early and late onset disease, sepsis, and in
some cases, meningitis (infection of the protective
membranes of the brain and spinal cord) or pneumonia
may occur.1,51
Group B streptococci bacteria are transmitted from
mother to child during birth or in utero, but
transmission can also occur through person-to-person
contact. Group B streptococci are present in the genital
tract in 10-30% of pregnant women, however only
about one percent of infants born to infected mothers
develop symptomatic infections.51 Although all
neonates are susceptible, premature babies are at
higher risk of infection.51
2011 IN FOCUS AND HISTORICAL HIGHLIGHTS
In 2011, there were 58 reported cases of neonatal
group B streptococcal disease in Ontario, representing
an incidence rate of 41.47 cases per 100,000 live births.
This was about 12% higher than the total of 52 cases
reported in 2010 (Figure 3-8).
The annual incidence rate of neonatal group B
streptococcal disease declined by 24% from 53.04 cases
per 100,000 live births in 2002 to 41.47 cases per
100,000 live births in 2011. Following an initial decrease
from 2002 to 2004, rates fluctuated, ranging from 33.30
to 41.47cases per 100,000 live births.
In comparison, annual incidence rates of neonatal group
B streptococcal disease for Canada were lower than the
incidence rates in Ontario from 2002 to 2008.
AGE AND SEX DISTRIBUTION
In 2011, there were more cases of neonatal group B
streptococcal disease reported among males (36) than
females (21). Males had an incidence rate of 50.21 cases
per 100,000 male live births, while females had an
incidence rate of 30.81 cases per 100 000 female live
births. Both age and sex were unknown for one
neonatal group B streptococcal case reported in 2011.
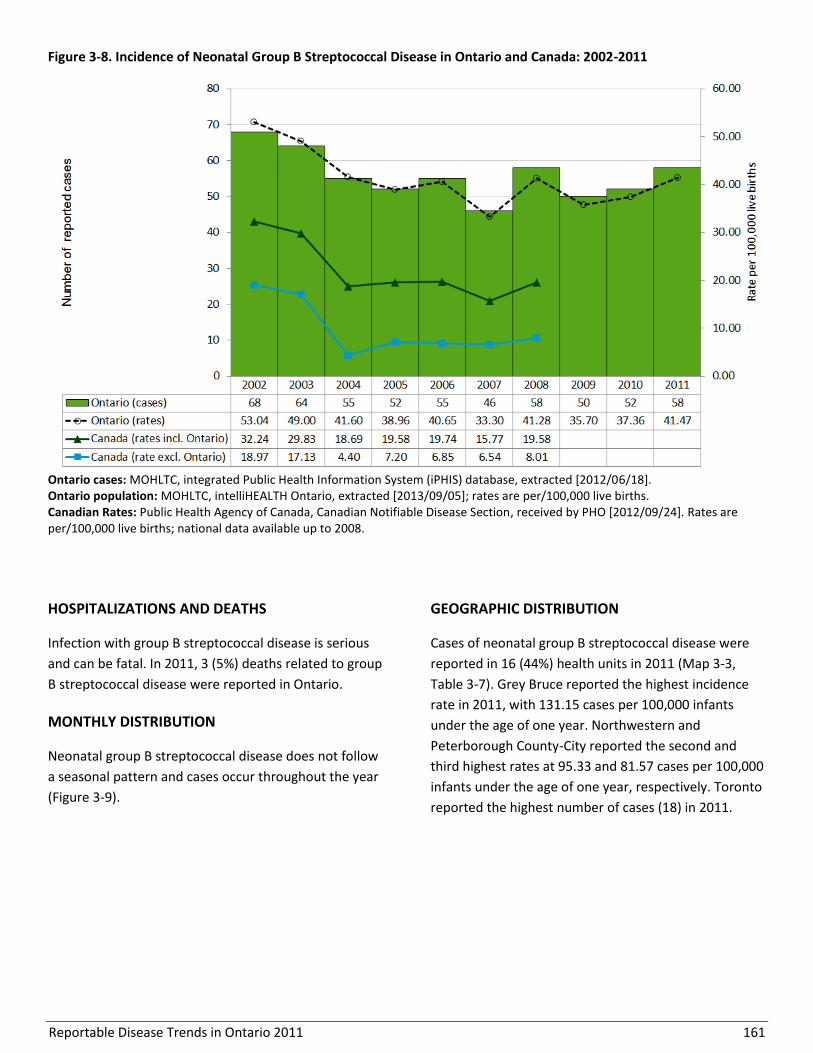
Reportable Disease Trends in Ontario 2011 161
Figure 3-8. Incidence of Neonatal Group B Streptococcal Disease in Ontario and Canada: 2002-2011
Ontario cases: MOHLTC, integrated Public Health Information System (iPHIS) database, extracted [2012/06/18]. Ontario population: MOHLTC, intelliHEALTH Ontario, extracted [2013/09/05]; rates are per/100,000 live births. Canadian Rates: Public Health Agency of Canada, Canadian Notifiable Disease Section, received by PHO [2012/09/24]. Rates are per/100,000 live births; national data available up to 2008.
HOSPITALIZATIONS AND DEATHS
Infection with group B streptococcal disease is serious
and can be fatal. In 2011, 3 (5%) deaths related to group
B streptococcal disease were reported in Ontario.
MONTHLY DISTRIBUTION
Neonatal group B streptococcal disease does not follow
a seasonal pattern and cases occur throughout the year
(Figure 3-9).
GEOGRAPHIC DISTRIBUTION
Cases of neonatal group B streptococcal disease were
reported in 16 (44%) health units in 2011 (Map 3-3,
Table 3-7). Grey Bruce reported the highest incidence
rate in 2011, with 131.15 cases per 100,000 infants
under the age of one year. Northwestern and
Peterborough County-City reported the second and
third highest rates at 95.33 and 81.57 cases per 100,000
infants under the age of one year, respectively. Toronto
reported the highest number of cases (18) in 2011.

Reportable Disease Trends in Ontario 2011 162
Figure 3-9. Number of Neonatal Group B Streptococcal Disease Cases by Month in Ontario in 2011 and Average
Number of Cases from 2006-2010
Ontario cases: MOHLTC, integrated Public Health Information System (iPHIS) database, extracted [2012/06/18].
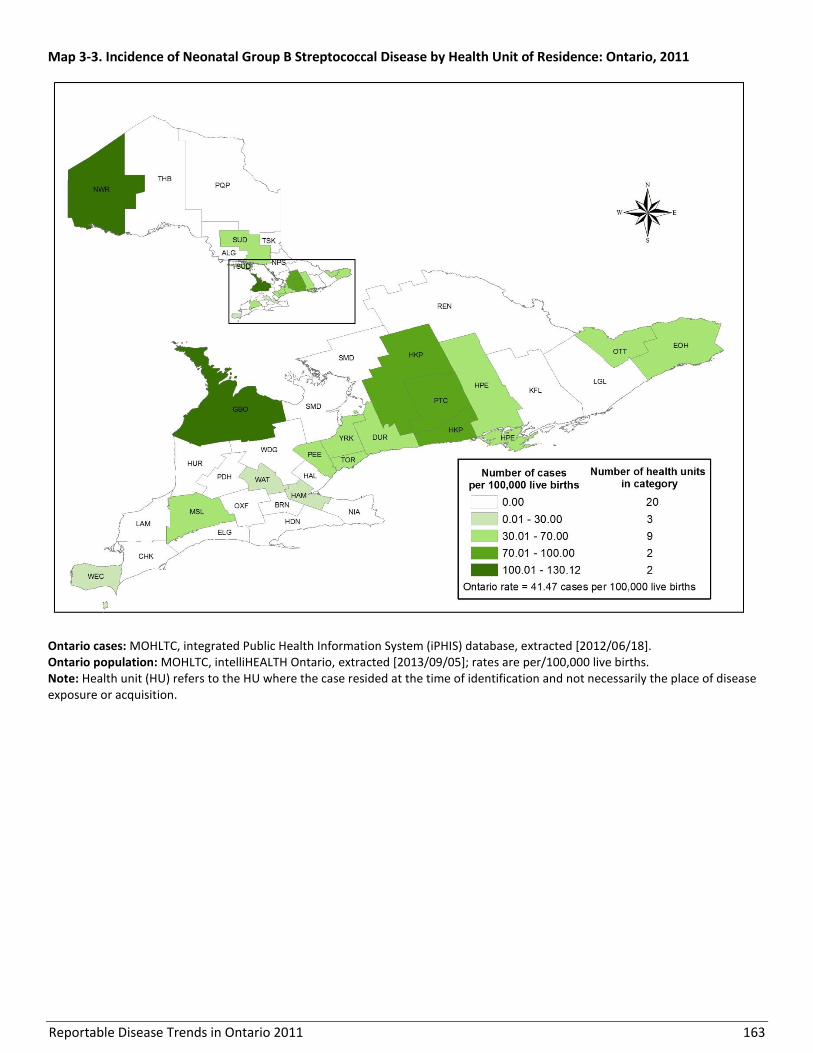
Reportable Disease Trends in Ontario 2011 163
Map 3-3. Incidence of Neonatal Group B Streptococcal Disease by Health Unit of Residence: Ontario, 2011
Ontario cases: MOHLTC, integrated Public Health Information System (iPHIS) database, extracted [2012/06/18]. Ontario population: MOHLTC, intelliHEALTH Ontario, extracted [2013/09/05]; rates are per/100,000 live births. Note: Health unit (HU) refers to the HU where the case resided at the time of identification and not necessarily the place of disease exposure or acquisition.
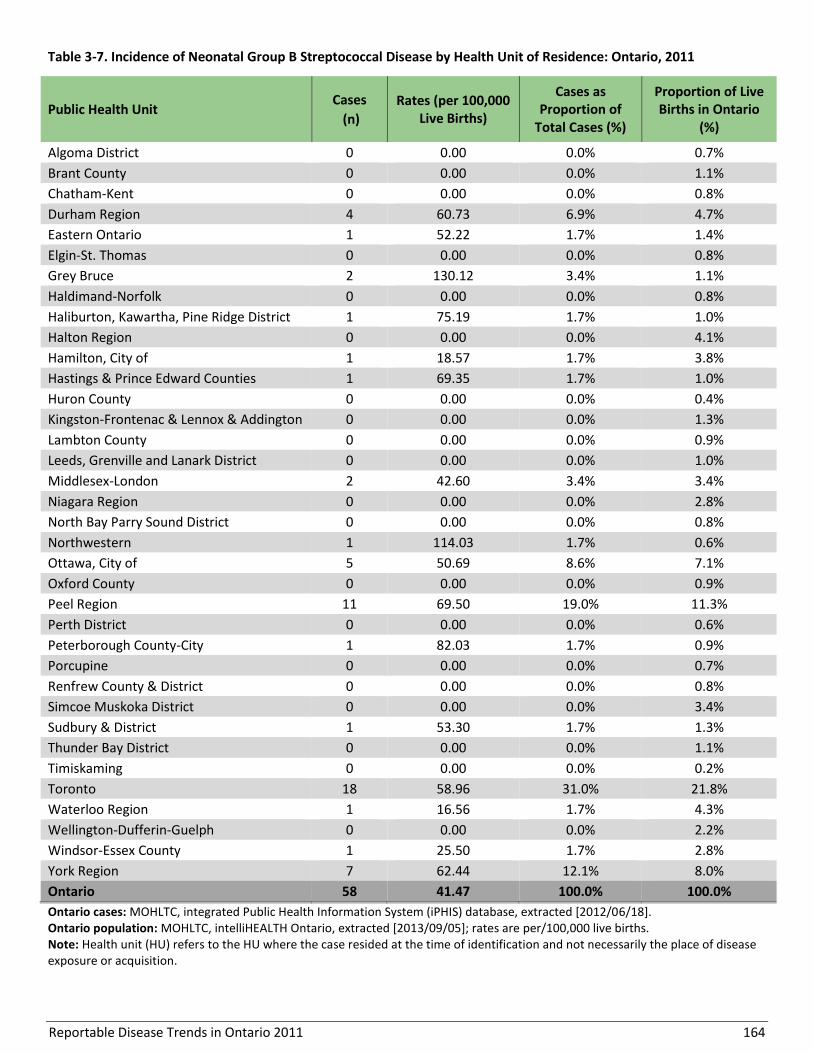
Reportable Disease Trends in Ontario 2011 164
Table 3-7. Incidence of Neonatal Group B Streptococcal Disease by Health Unit of Residence: Ontario, 2011
Public Health Unit Cases
(n)
Rates (per 100,000 Live Births)
Cases as Proportion of
Total Cases (%)
Proportion of Live Births in Ontario
(%)
Algoma District 0 0.00 0.0% 0.7%
Brant County 0 0.00 0.0% 1.1%
Chatham-Kent 0 0.00 0.0% 0.8%
Durham Region 4 60.73 6.9% 4.7%
Eastern Ontario 1 52.22 1.7% 1.4%
Elgin-St. Thomas 0 0.00 0.0% 0.8%
Grey Bruce 2 130.12 3.4% 1.1%
Haldimand-Norfolk 0 0.00 0.0% 0.8%
Haliburton, Kawartha, Pine Ridge District 1 75.19 1.7% 1.0%
Halton Region 0 0.00 0.0% 4.1%
Hamilton, City of 1 18.57 1.7% 3.8%
Hastings & Prince Edward Counties 1 69.35 1.7% 1.0%
Huron County 0 0.00 0.0% 0.4%
Kingston-Frontenac & Lennox & Addington 0 0.00 0.0% 1.3%
Lambton County 0 0.00 0.0% 0.9%
Leeds, Grenville and Lanark District 0 0.00 0.0% 1.0%
Middlesex-London 2 42.60 3.4% 3.4%
Niagara Region 0 0.00 0.0% 2.8%
North Bay Parry Sound District 0 0.00 0.0% 0.8%
Northwestern 1 114.03 1.7% 0.6%
Ottawa, City of 5 50.69 8.6% 7.1%
Oxford County 0 0.00 0.0% 0.9%
Peel Region 11 69.50 19.0% 11.3%
Perth District 0 0.00 0.0% 0.6%
Peterborough County-City 1 82.03 1.7% 0.9%
Porcupine 0 0.00 0.0% 0.7%
Renfrew County & District 0 0.00 0.0% 0.8%
Simcoe Muskoka District 0 0.00 0.0% 3.4%
Sudbury & District 1 53.30 1.7% 1.3%
Thunder Bay District 0 0.00 0.0% 1.1%
Timiskaming 0 0.00 0.0% 0.2%
Toronto 18 58.96 31.0% 21.8%
Waterloo Region 1 16.56 1.7% 4.3%
Wellington-Dufferin-Guelph 0 0.00 0.0% 2.2%
Windsor-Essex County 1 25.50 1.7% 2.8%
York Region 7 62.44 12.1% 8.0%
Ontario 58 41.47 100.0% 100.0%
Ontario cases: MOHLTC, integrated Public Health Information System (iPHIS) database, extracted [2012/06/18]. Ontario population: MOHLTC, intelliHEALTH Ontario, extracted [2013/09/05]; rates are per/100,000 live births. Note: Health unit (HU) refers to the HU where the case resided at the time of identification and not necessarily the place of disease exposure or acquisition.
Reportable Disease Trends in Ontario 2011 165
Hepatitis B (Acute)
The overall incidence rate of acute hepatitis B
in Ontario declined over the past ten years.
The highest incidence rates of acute hepatitis
B in 2011 were reported among 30-39 year
olds for both sexes.
The most commonly reported risk factor
among hepatitis B cases in Ontario in 2011
was exposure outside of Canada.
Acute hepatitis B is reportable in Ontario and is caused
by infection with the hepatitis B virus (HBV).1 The virus
affects and can permanently damage the liver. Hepatitis
B is transmitted through blood and other bodily fluids,
and as such, transmission can occur through a variety of
routes. Transmission commonly occurs through
injection drug use and sharing of drug use equipment,
sexually, through household contact with an infected
person, or vertically from mother to child during
birth.1,52
HBV surface antigens (HBsAg) appear in the blood
within two weeks and up to six months after infection
followed by antibodies to the core antigen (Anti-HBc).
Anti-HBc remains indefinitely in the blood and is
indicative of either a past or current infection. In
contrast, HBsAg in the blood is indicative of acute or
chronic infection that is transmissible to others even in
the absence of symptoms.52 Up to 70% of those infected
does not exhibit any symptoms. If present, symptoms
may include anorexia, fatigue, fever, abdominal
discomfort, joint pain and jaundice.1,52 Hepatitis B
infections may resolve, but in some cases, individuals
remain chronic carriers of the virus for life, with
younger persons having a greater likelihood of
becoming chronic carriers.1
Hepatitis B can be prevented through vaccination. In
Ontario the hepatitis B vaccine is publicly funded for
grade seven students and persons at high risk of
exposure such as contacts of acute cases and chronic
carriers of the virus, injection drug users, and persons
requiring blood products.53
2011 IN FOCUS AND HISTORICAL HIGHLIGHTS
In 2011, 122 cases of acute hepatitis B infections were
reported in Ontario, representing an incidence rate of
0.91 cases per 100,000 population (Figure 3-10). This
was slightly higher than the incidence rate of 0.88 cases
per 100,000 population reported in 2010.
Annual incidence rates of acute hepatitis B declined by
27% from 1.24 cases per 100,000 population in 2002 to
0.91 cases per 100,000 population in 2011.
National incidence rates of hepatitis B are not
presented in this report as they do not distinguish
between acute and chronic cases and are therefore not
directly comparable to acute case data for Ontario.
Chronic hepatitis B infections reported in Ontario are
not enumerated in this report.
AGE AND SEX DISTRIBUTION
The sex-specific incidence rate for acute hepatitis B in
2011 was higher for males compared to females at 1.06
and 0.74 cases per 100,000 population, respectively
(Table 3-8, Figure 3-11). Males accounted for 57% of
cases in 2011. The highest incidence rate among males
was observed in the 30-39 year age group, which had a
rate of 2.05 cases per 100,000 population. Among
females, the highest incidence rate was reported in the
25-29 year age group, at 1.93 cases per 100,000
population. For both sexes, the greatest number of
cases was reported in the 30-39 year age group (26% for
both sexes).

Reportable Disease Trends in Ontario 2011 166
Figure 3-10. Incidence of Acute Hepatitis B in Ontario: 2002-2011
Ontario cases: MOHLTC, integrated Public Health Information System (iPHIS) database, extracted [2012/06/18]. Ontario population: MOHLTC, intelliHEALTH Ontario, extracted [2012/10/15]. Canadian Rates: Canadian rates are not shown as they include acute, chronic and unspecified hepatitis B cases and are therefore not directly comparable to Ontario’s acute case counts and rates.

Reportable Disease Trends in Ontario 2011 167
Table 3-8. Incidence of Acute Hepatitis B by Age and Sex: Ontario, 2011
Age Group (Years)
Female Male Total
Cases Rates (per 100,000
Population) Cases
Rates (per 100,000 Population)
Cases Rates (per 100,000
Population)
<15 1 0.09 0 0.00 1 0.05
15-19 2 0.47 0 0.00 2 0.23
20-24 2 0.43 3 0.62 5 0.53
25-29 9 1.93 5 1.07 14 1.50
30-39 13 1.42 18 2.05 31 1.73
40-49 11 1.07 14 1.36 25 1.21
50-59 8 0.84 15 1.59 23 1.21
60-69 1 0.15 9 1.39 10 0.75
70+ 3 0.39 6 1.07 9 0.68
Total 50 0.74 70 1.06 120 0.90
Ontario cases: MOHLTC, integrated Public Health Information System (iPHIS) database, extracted [2012/06/18]. Ontario population: MOHLTC, intelliHEALTH Ontario, extracted [2012/10/15]. Note: Excludes two cases of unknown age and sex.
Figure 3-11. Incidence of Acute Hepatitis B by Age and Sex: Ontario, 2011
Ontario cases: MOHLTC, integrated Public Health Information System (iPHIS) database, extracted [2012/06/18]. Ontario population: MOHLTC, intelliHEALTH Ontario, extracted [2012/10/15]. Note: Excludes two cases of unknown age and sex.
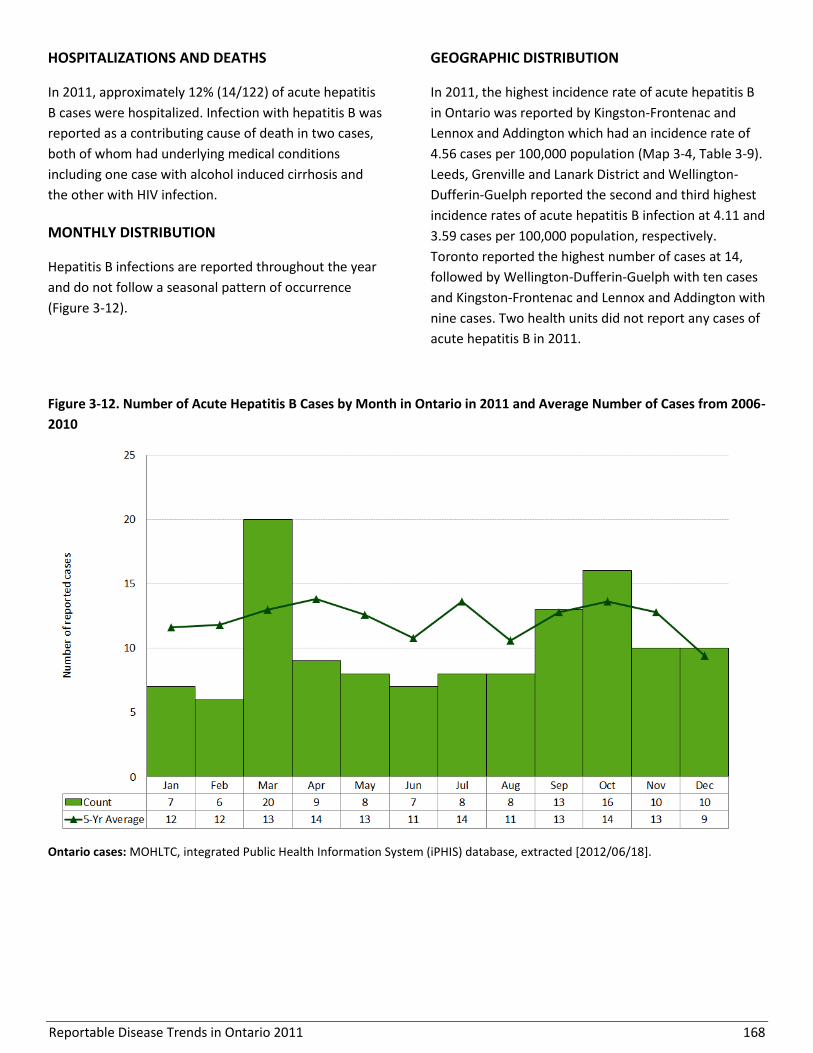
Reportable Disease Trends in Ontario 2011 168
HOSPITALIZATIONS AND DEATHS
In 2011, approximately 12% (14/122) of acute hepatitis
B cases were hospitalized. Infection with hepatitis B was
reported as a contributing cause of death in two cases,
both of whom had underlying medical conditions
including one case with alcohol induced cirrhosis and
the other with HIV infection.
MONTHLY DISTRIBUTION
Hepatitis B infections are reported throughout the year
and do not follow a seasonal pattern of occurrence
(Figure 3-12).
GEOGRAPHIC DISTRIBUTION
In 2011, the highest incidence rate of acute hepatitis B
in Ontario was reported by Kingston-Frontenac and
Lennox and Addington which had an incidence rate of
4.56 cases per 100,000 population (Map 3-4, Table 3-9).
Leeds, Grenville and Lanark District and Wellington-
Dufferin-Guelph reported the second and third highest
incidence rates of acute hepatitis B infection at 4.11 and
3.59 cases per 100,000 population, respectively.
Toronto reported the highest number of cases at 14,
followed by Wellington-Dufferin-Guelph with ten cases
and Kingston-Frontenac and Lennox and Addington with
nine cases. Two health units did not report any cases of
acute hepatitis B in 2011.
Figure 3-12. Number of Acute Hepatitis B Cases by Month in Ontario in 2011 and Average Number of Cases from 2006-
2010
Ontario cases: MOHLTC, integrated Public Health Information System (iPHIS) database, extracted [2012/06/18].
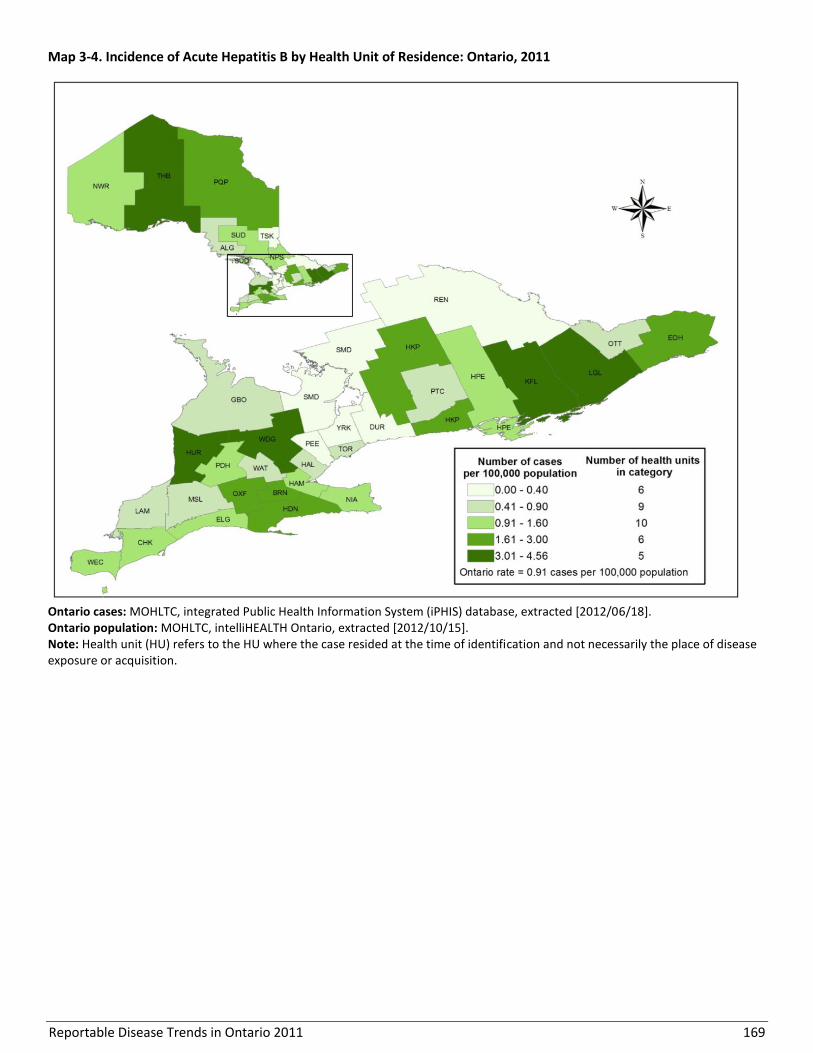
Reportable Disease Trends in Ontario 2011 169
Map 3-4. Incidence of Acute Hepatitis B by Health Unit of Residence: Ontario, 2011
Ontario cases: MOHLTC, integrated Public Health Information System (iPHIS) database, extracted [2012/06/18]. Ontario population: MOHLTC, intelliHEALTH Ontario, extracted [2012/10/15]. Note: Health unit (HU) refers to the HU where the case resided at the time of identification and not necessarily the place of disease exposure or acquisition.
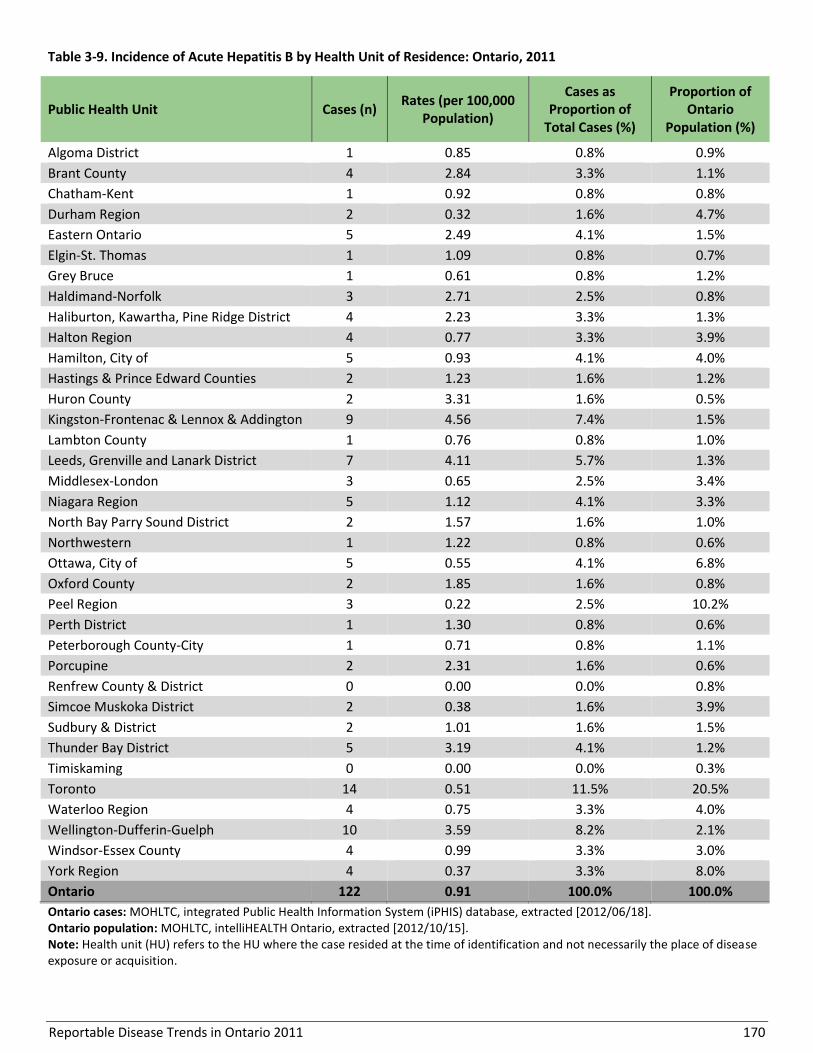
Reportable Disease Trends in Ontario 2011 170
Table 3-9. Incidence of Acute Hepatitis B by Health Unit of Residence: Ontario, 2011
Public Health Unit Cases (n) Rates (per 100,000
Population)
Cases as Proportion of
Total Cases (%)
Proportion of Ontario
Population (%)
Algoma District 1 0.85 0.8% 0.9%
Brant County 4 2.84 3.3% 1.1%
Chatham-Kent 1 0.92 0.8% 0.8%
Durham Region 2 0.32 1.6% 4.7%
Eastern Ontario 5 2.49 4.1% 1.5%
Elgin-St. Thomas 1 1.09 0.8% 0.7%
Grey Bruce 1 0.61 0.8% 1.2%
Haldimand-Norfolk 3 2.71 2.5% 0.8%
Haliburton, Kawartha, Pine Ridge District 4 2.23 3.3% 1.3%
Halton Region 4 0.77 3.3% 3.9%
Hamilton, City of 5 0.93 4.1% 4.0%
Hastings & Prince Edward Counties 2 1.23 1.6% 1.2%
Huron County 2 3.31 1.6% 0.5%
Kingston-Frontenac & Lennox & Addington 9 4.56 7.4% 1.5%
Lambton County 1 0.76 0.8% 1.0%
Leeds, Grenville and Lanark District 7 4.11 5.7% 1.3%
Middlesex-London 3 0.65 2.5% 3.4%
Niagara Region 5 1.12 4.1% 3.3%
North Bay Parry Sound District 2 1.57 1.6% 1.0%
Northwestern 1 1.22 0.8% 0.6%
Ottawa, City of 5 0.55 4.1% 6.8%
Oxford County 2 1.85 1.6% 0.8%
Peel Region 3 0.22 2.5% 10.2%
Perth District 1 1.30 0.8% 0.6%
Peterborough County-City 1 0.71 0.8% 1.1%
Porcupine 2 2.31 1.6% 0.6%
Renfrew County & District 0 0.00 0.0% 0.8%
Simcoe Muskoka District 2 0.38 1.6% 3.9%
Sudbury & District 2 1.01 1.6% 1.5%
Thunder Bay District 5 3.19 4.1% 1.2%
Timiskaming 0 0.00 0.0% 0.3%
Toronto 14 0.51 11.5% 20.5%
Waterloo Region 4 0.75 3.3% 4.0%
Wellington-Dufferin-Guelph 10 3.59 8.2% 2.1%
Windsor-Essex County 4 0.99 3.3% 3.0%
York Region 4 0.37 3.3% 8.0%
Ontario 122 0.91 100.0% 100.0%
Ontario cases: MOHLTC, integrated Public Health Information System (iPHIS) database, extracted [2012/06/18]. Ontario population: MOHLTC, intelliHEALTH Ontario, extracted [2012/10/15]. Note: Health unit (HU) refers to the HU where the case resided at the time of identification and not necessarily the place of disease exposure or acquisition.
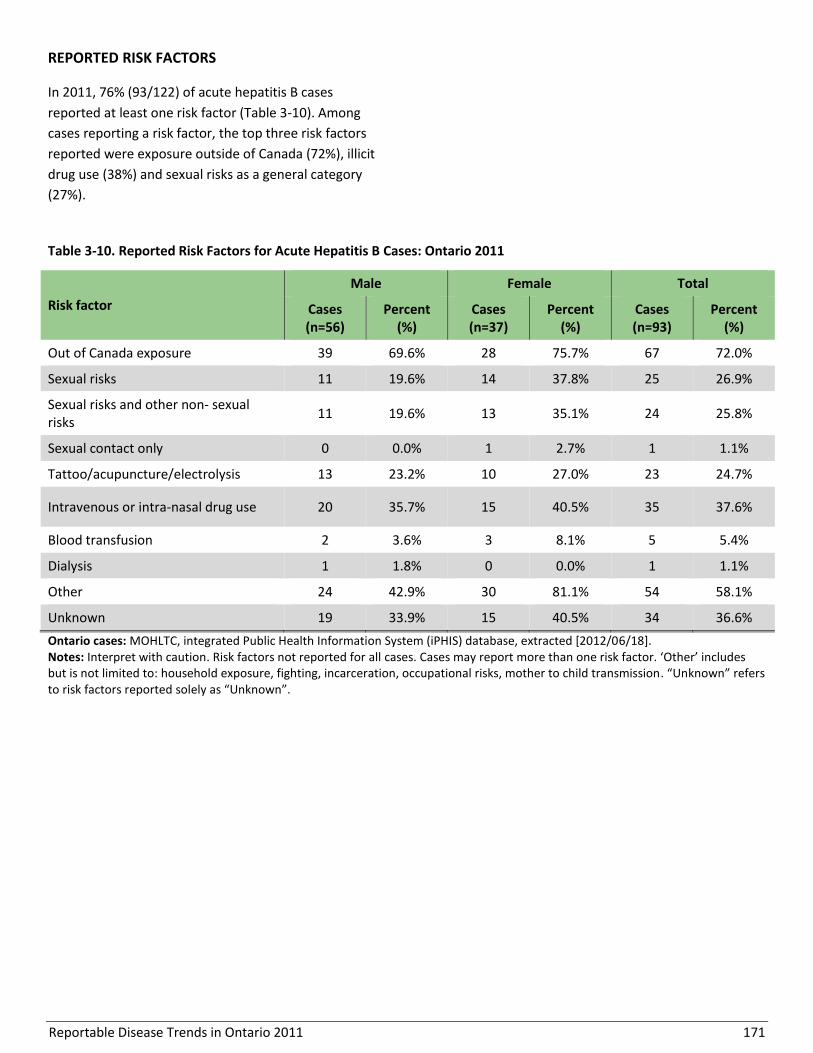
Reportable Disease Trends in Ontario 2011 171
REPORTED RISK FACTORS
In 2011, 76% (93/122) of acute hepatitis B cases
reported at least one risk factor (Table 3-10). Among
cases reporting a risk factor, the top three risk factors
reported were exposure outside of Canada (72%), illicit
drug use (38%) and sexual risks as a general category
(27%).
Table 3-10. Reported Risk Factors for Acute Hepatitis B Cases: Ontario 2011
Risk factor
Male Female Total
Cases (n=56)
Percent (%)
Cases (n=37)
Percent (%)
Cases (n=93)
Percent (%)
Out of Canada exposure 39 69.6% 28 75.7% 67 72.0%
Sexual risks 11 19.6% 14 37.8% 25 26.9%
Sexual risks and other non- sexual risks
11 19.6% 13 35.1% 24 25.8%
Sexual contact only 0 0.0% 1 2.7% 1 1.1%
Tattoo/acupuncture/electrolysis 13 23.2% 10 27.0% 23 24.7%
Intravenous or intra-nasal drug use 20 35.7% 15 40.5% 35 37.6%
Blood transfusion 2 3.6% 3 8.1% 5 5.4%
Dialysis 1 1.8% 0 0.0% 1 1.1%
Other 24 42.9% 30 81.1% 54 58.1%
Unknown 19 33.9% 15 40.5% 34 36.6%
Ontario cases: MOHLTC, integrated Public Health Information System (iPHIS) database, extracted [2012/06/18]. Notes: Interpret with caution. Risk factors not reported for all cases. Cases may report more than one risk factor. ‘Other’ includes but is not limited to: household exposure, fighting, incarceration, occupational risks, mother to child transmission. “Unknown” refers to risk factors reported solely as “Unknown”.
Reportable Disease Trends in Ontario 2011 172
Hepatitis C
The incidence of hepatitis C decreased over
the ten year period from 2002 to 2011.
The majority of hepatitis C cases were
reported among males, particularly between
the ages of 40 and 59 years.
The highest incidence rates of hepatitis C were
observed in Kingston-Frontenac and Lennox
and Addington and Thunder Bay District.
Over 50% of hepatitis C cases in 2011 reported
injection drug use as a risk factor.
Hepatitis C is highly prevalent worldwide.1 It is caused by
infection with the hepatitis C virus (HCV). Infection with
HCV leads to inflammation of the liver, with a high
percentage (50-80%) of those infected developing chronic
infections.1 HCV can be transmitted through intravenous
exposure to infected blood. This most commonly occurs
through the use of contaminated equipment for injection
drug use, as well as unsafe handling of multi-use
equipment in health care and personal service settings.
Even though most cases of hepatitis C do not have any
symptoms, transmission of the virus is possible and can
occur for years after becoming infected. Once an
individual is infected, symptoms can take from two weeks
to six months to develop, and years before more serious
complications such as cirrhosis (scarring of the liver) are
observed.1 Early symptoms of hepatitis C infection tend to
be mild and progress slowly with anorexia, abdominal
discomfort, fatigue and nausea being the most frequently
observed symptoms.54
Unlike hepatitis B, no vaccine is currently available for the
prevention of hepatitis C. The most effective means of
prevention include harm reduction measures for injection
drug users and regular screening of blood products.1 For
those who develop chronic HCV infection, intensive
treatment options are available based on the HCV
subtype.
2011 IN FOCUS AND HISTORICAL HIGHLIGHTS
In 2011, there were 4,143 cases of hepatitis C reported
in Ontario, representing an incidence rate of 30.98
cases per 100,000 population and a nine percent
decrease in incidence compared to the 2010 rate of
34.21 cases per 100,000 (Figure 3-13).
Over the ten-year period from 2002 to 2011, the
incidence rate of hepatitis C declined by 30% from 44.04
cases per 100,000 population in 2002 to 30.98 cases per
100,000 population in 2011. The decrease in incidence
from 2002 to 2006 was relatively faster and was
followed by a slight increase that lasted until 2008, after
which the provincial rate began to decrease (Figure 3-
13).
The Canadian incidence rate also demonstrated a
decreasing trend from 2002 to 2008, the years for which
national data were available. The provincial annual
incidence rates of hepatitis C were lower than the
corresponding national rates until 2006, after which
there were no substantial differences between the two
(Figure 3-13).
AGE AND SEX DISTRIBUTION
In 2011, almost two-thirds (61%) of hepatitis C cases in
Ontario were reported among males. The incidence rate
was higher for males at 38.15 cases per 100,000
population compared to 23.72 cases per 100,000
population for females (Table 3-11, Figure 3-14).
Females under 25 years of age had higher rates
compared to males, whereas males 25 years and older
had higher rates compared to females.
For both males and females and overall, the highest
incidence rate of hepatitis C occurred among the 50-59
year age group. The incidence rate among males
demonstrated an increasing trend with age up to 59
years. The trend for females was similar but not as
pronounced.

Reportable Disease Trends in Ontario 2011 173
Figure 3-13. Incidence of Hepatitis C in Ontario and Canada: 2002-2011
Ontario cases: MOHLTC, integrated Public Health Information System (iPHIS) database, extracted [2012/06/18]. Ontario population: MOHLTC, intelliHEALTH Ontario, extracted [2012/10/15]. Canadian Rates: Public Health Agency of Canada, Canadian Notifiable Disease Section, received by PHO [2012/09/24]; national data available up to 2008.
Table 3-11. Incidence of Hepatitis C by Age and Sex: Ontario, 2011
Age Group (Years)
Female Male Total
Cases Rates (per 100,000
Population) Cases
Rates (per 100,000 Population)
Cases Rates (per 100,000
Population)
<15 13 1.21 12 1.06 25 1.13
15-19 45 10.55 38 8.52 83 9.51
20-24 161 34.84 132 27.24 293 30.95
25-29 156 33.53 203 43.36 359 38.46
30-39 301 32.97 459 52.17 760 42.39
40-49 325 31.55 591 57.28 916 44.42
50-59 361 37.70 750 79.68 1,111 58.51
60-69 130 18.91 239 37.02 369 27.68
70+ 116 15.23 91 16.19 207 15.64
Total 1,608 23.72 2,515 38.15 4,123 30.83
Ontario cases: MOHLTC, integrated Public Health Information System (iPHIS) database, extracted [2012/06/18]. Ontario population: MOHLTC, intelliHEALTH Ontario, extracted [2012/10/15]. Note: Excludes 20 cases of unknown age and sex.
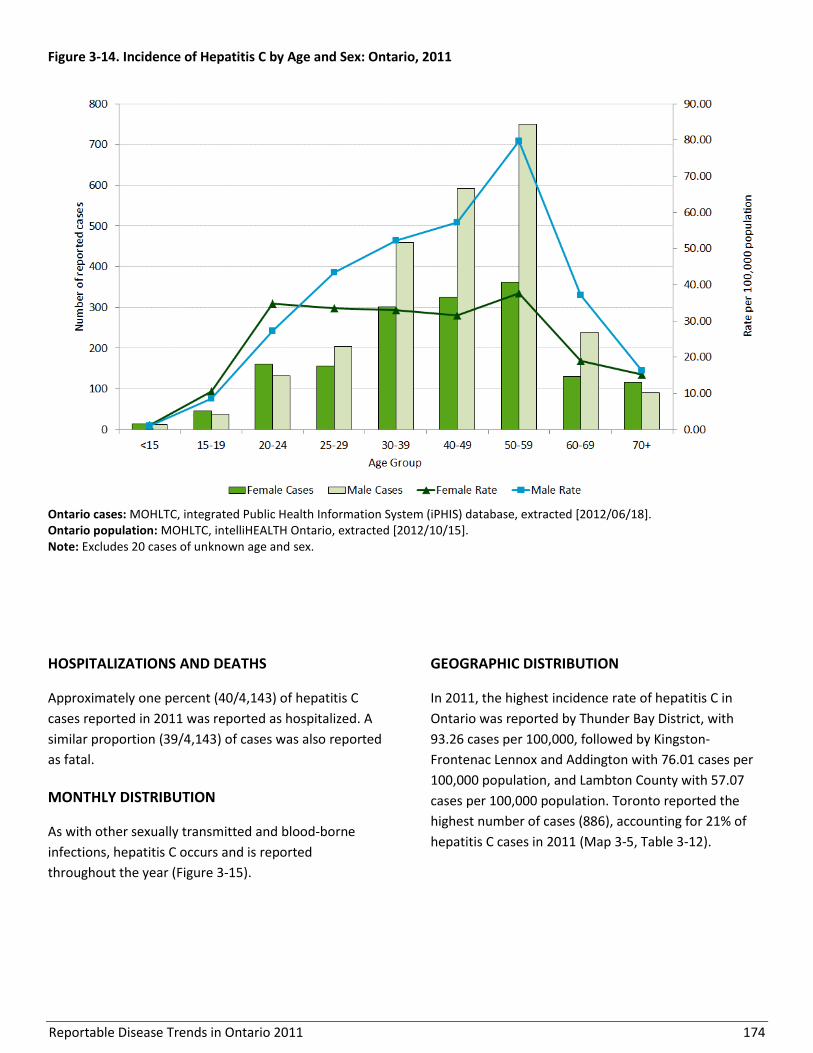
Reportable Disease Trends in Ontario 2011 174
Figure 3-14. Incidence of Hepatitis C by Age and Sex: Ontario, 2011
Ontario cases: MOHLTC, integrated Public Health Information System (iPHIS) database, extracted [2012/06/18]. Ontario population: MOHLTC, intelliHEALTH Ontario, extracted [2012/10/15]. Note: Excludes 20 cases of unknown age and sex.
HOSPITALIZATIONS AND DEATHS
Approximately one percent (40/4,143) of hepatitis C
cases reported in 2011 was reported as hospitalized. A
similar proportion (39/4,143) of cases was also reported
as fatal.
MONTHLY DISTRIBUTION
As with other sexually transmitted and blood-borne
infections, hepatitis C occurs and is reported
throughout the year (Figure 3-15).
GEOGRAPHIC DISTRIBUTION
In 2011, the highest incidence rate of hepatitis C in
Ontario was reported by Thunder Bay District, with
93.26 cases per 100,000, followed by Kingston-
Frontenac Lennox and Addington with 76.01 cases per
100,000 population, and Lambton County with 57.07
cases per 100,000 population. Toronto reported the
highest number of cases (886), accounting for 21% of
hepatitis C cases in 2011 (Map 3-5, Table 3-12).
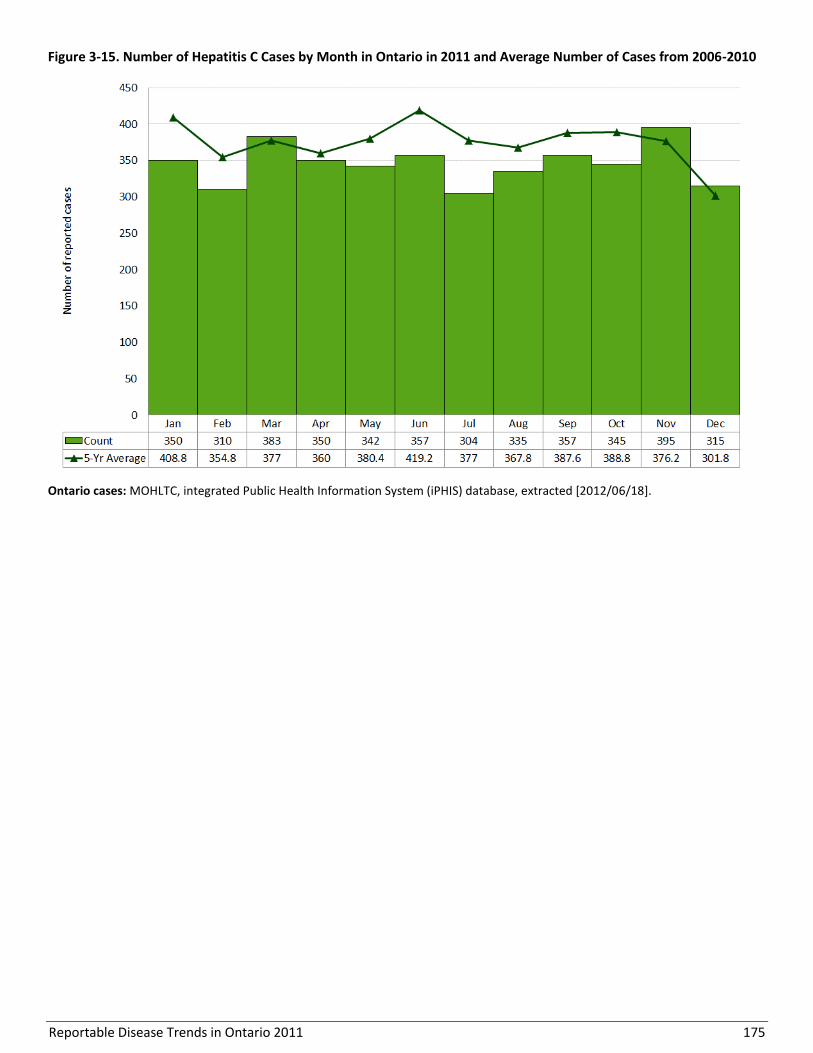
Reportable Disease Trends in Ontario 2011 175
Figure 3-15. Number of Hepatitis C Cases by Month in Ontario in 2011 and Average Number of Cases from 2006-2010
Ontario cases: MOHLTC, integrated Public Health Information System (iPHIS) database, extracted [2012/06/18].
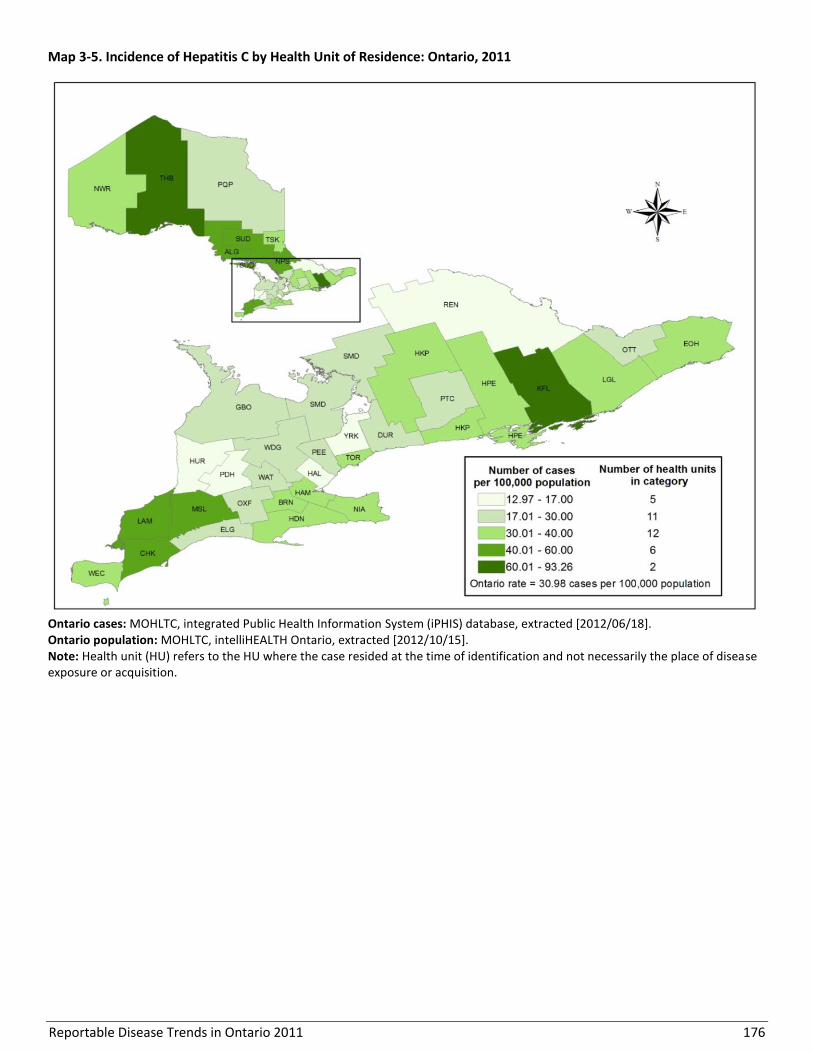
Reportable Disease Trends in Ontario 2011 176
Map 3-5. Incidence of Hepatitis C by Health Unit of Residence: Ontario, 2011
Ontario cases: MOHLTC, integrated Public Health Information System (iPHIS) database, extracted [2012/06/18]. Ontario population: MOHLTC, intelliHEALTH Ontario, extracted [2012/10/15]. Note: Health unit (HU) refers to the HU where the case resided at the time of identification and not necessarily the place of disease exposure or acquisition.
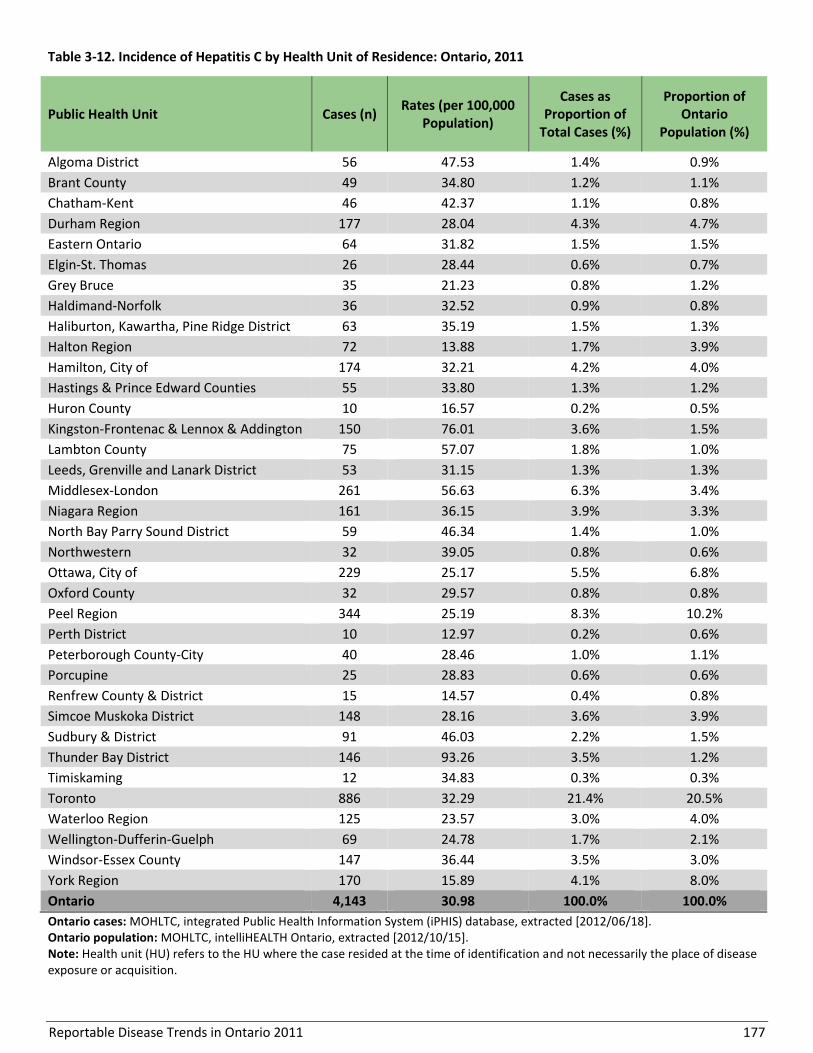
Reportable Disease Trends in Ontario 2011 177
Table 3-12. Incidence of Hepatitis C by Health Unit of Residence: Ontario, 2011
Public Health Unit Cases (n) Rates (per 100,000
Population)
Cases as Proportion of
Total Cases (%)
Proportion of Ontario
Population (%)
Algoma District 56 47.53 1.4% 0.9%
Brant County 49 34.80 1.2% 1.1%
Chatham-Kent 46 42.37 1.1% 0.8%
Durham Region 177 28.04 4.3% 4.7%
Eastern Ontario 64 31.82 1.5% 1.5%
Elgin-St. Thomas 26 28.44 0.6% 0.7%
Grey Bruce 35 21.23 0.8% 1.2%
Haldimand-Norfolk 36 32.52 0.9% 0.8%
Haliburton, Kawartha, Pine Ridge District 63 35.19 1.5% 1.3%
Halton Region 72 13.88 1.7% 3.9%
Hamilton, City of 174 32.21 4.2% 4.0%
Hastings & Prince Edward Counties 55 33.80 1.3% 1.2%
Huron County 10 16.57 0.2% 0.5%
Kingston-Frontenac & Lennox & Addington 150 76.01 3.6% 1.5%
Lambton County 75 57.07 1.8% 1.0%
Leeds, Grenville and Lanark District 53 31.15 1.3% 1.3%
Middlesex-London 261 56.63 6.3% 3.4%
Niagara Region 161 36.15 3.9% 3.3%
North Bay Parry Sound District 59 46.34 1.4% 1.0%
Northwestern 32 39.05 0.8% 0.6%
Ottawa, City of 229 25.17 5.5% 6.8%
Oxford County 32 29.57 0.8% 0.8%
Peel Region 344 25.19 8.3% 10.2%
Perth District 10 12.97 0.2% 0.6%
Peterborough County-City 40 28.46 1.0% 1.1%
Porcupine 25 28.83 0.6% 0.6%
Renfrew County & District 15 14.57 0.4% 0.8%
Simcoe Muskoka District 148 28.16 3.6% 3.9%
Sudbury & District 91 46.03 2.2% 1.5%
Thunder Bay District 146 93.26 3.5% 1.2%
Timiskaming 12 34.83 0.3% 0.3%
Toronto 886 32.29 21.4% 20.5%
Waterloo Region 125 23.57 3.0% 4.0%
Wellington-Dufferin-Guelph 69 24.78 1.7% 2.1%
Windsor-Essex County 147 36.44 3.5% 3.0%
York Region 170 15.89 4.1% 8.0%
Ontario 4,143 30.98 100.0% 100.0%
Ontario cases: MOHLTC, integrated Public Health Information System (iPHIS) database, extracted [2012/06/18]. Ontario population: MOHLTC, intelliHEALTH Ontario, extracted [2012/10/15]. Note: Health unit (HU) refers to the HU where the case resided at the time of identification and not necessarily the place of disease exposure or acquisition.

Reportable Disease Trends in Ontario 2011 178
RISK FACTORS
In 2011, 70% (2,889/4,143) of hepatitis C cases reported
at least one risk factor or exposure. The top risk factor
reported overall was injection drug use at 55% (Table 3-
13). There were 17 hepatitis C cases in 2011 where
mother to child transmission was reported as a risk
factor.
Table 3-13. Reported Risk Factors for Hepatitis C: Ontario 2011
Risk factor
Male Female Total
Cases (n=1,774)
Percent (%)
Cases (n=1,103)
Percent (%)
Cases (n=2,877)
Percent (%)
Injection drug use (IDU) 1,060 59.8% 535 48.5% 1,595 55.4%
Blood transfusion 58 3.3% 81 7.3% 139 4.8%
Mother to child 9 0.5% 8 0.7% 17 0.6%
High risk sexual 152 8.6% 140 12.7% 292 10.1%
Miscellaneous 779 43.9% 457 41.4% 1,236 43.0%
Other 1,310 73.8% 867 78.6% 2,177 75.7%
Ontario cases: MOHLTC, integrated Public Health Information System (iPHIS) database, extracted [2012/06/18]. Notes: Excludes 12 cases of unknown sex. ‘High risk sexual’ includes partner is HCV+ (includes spouse HCV+), sex trade worker or sex with sex trade worker, MSM. ‘Miscellaneous’ includes occupational, born in an HCV-endemic country, inhalation drug use, organ/tissue transplant, and dialysis. ‘Other’ includes but is not limited to other sexual risks (e.g. multiple partners), fighting/biting, homeless, tattoo/piercing/acupuncture/electrolysis, lived/travelled to endemic country, immunocompromised, invasive procedure (medical/dental/surgical), and shared personal items (e.g. razors), household contact.

Reportable Disease Trends in Ontario 2011 179
Hepatitis D
Hepatitis D, also known as delta hepatitis, is a viral
disease that causes inflammation of the liver. It occurs
concurrently with hepatitis B infection and is
characterized by abrupt onset of anorexia, fatigue,
abdominal discomfort, fever, joint pain and jaundice.
Similar to hepatitis B infection, infection with hepatitis
D can be transmitted through exposure to infected
blood and blood products, with spread occurring mostly
through shared needles and syringes and unprotected
sexual contact.1 Symptoms of hepatitis D develop
between two to four weeks after exposure.1,55
Hepatitis D is uncommon in North America. It is more
prevalent in African, South American and Eastern
European countries, where hepatitis B is endemic. Rates
of infection are highest among hemophiliacs, injection
drug users, men who have sex with men and residents
of institutions for the developmentally disabled.
Preventive measures for hepatitis D are the same as for
hepatitis B. Although there is no vaccine against
hepatitis D, vaccination against hepatitis B is an
effective prevention measure because hepatitis D
infections occur only as co-infections in persons with
existing hepatitis B infections.1
2011 IN FOCUS AND HISTORICAL HIGHLIGHTS
In 2011, three cases of hepatitis D were reported in
Ontario, representing an incidence rate of 0.02 cases
per 100,000 population. From 2002 to 2011, a total of
39 cases of hepatitis D were reported in Ontario with an
average of four cases per year. A high of nine cases was
reported in 2002 (Figure 3-16).
No comparable national data are available because
hepatitis D infections are not nationally notifiable.
Figure 3-16. Incidence of Hepatitis D: Ontario and Canada, 2002-2011
Ontario Cases: MOHLTC, integrated Public Health Information System (iPHIS) database, extracted [2012/06/13]. Ontario Population: MOHLTC, intelliHEALTH Ontario, extracted [2012/10/15]. Canadian Rates: Hepatitis D is not a nationally notifiable disease.
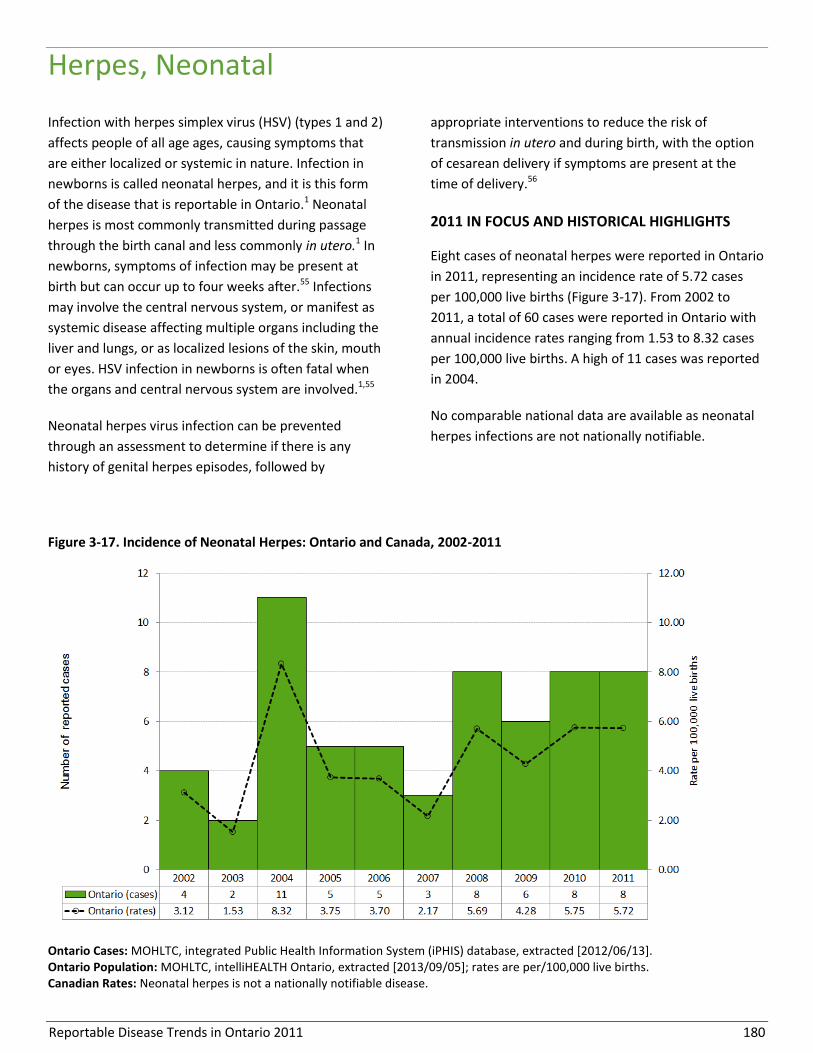
Reportable Disease Trends in Ontario 2011 180
Herpes, Neonatal
Infection with herpes simplex virus (HSV) (types 1 and 2)
affects people of all age ages, causing symptoms that
are either localized or systemic in nature. Infection in
newborns is called neonatal herpes, and it is this form
of the disease that is reportable in Ontario.1 Neonatal
herpes is most commonly transmitted during passage
through the birth canal and less commonly in utero.1 In
newborns, symptoms of infection may be present at
birth but can occur up to four weeks after.55 Infections
may involve the central nervous system, or manifest as
systemic disease affecting multiple organs including the
liver and lungs, or as localized lesions of the skin, mouth
or eyes. HSV infection in newborns is often fatal when
the organs and central nervous system are involved.1,55
Neonatal herpes virus infection can be prevented
through an assessment to determine if there is any
history of genital herpes episodes, followed by
appropriate interventions to reduce the risk of
transmission in utero and during birth, with the option
of cesarean delivery if symptoms are present at the
time of delivery.56
2011 IN FOCUS AND HISTORICAL HIGHLIGHTS
Eight cases of neonatal herpes were reported in Ontario
in 2011, representing an incidence rate of 5.72 cases
per 100,000 live births (Figure 3-17). From 2002 to
2011, a total of 60 cases were reported in Ontario with
annual incidence rates ranging from 1.53 to 8.32 cases
per 100,000 live births. A high of 11 cases was reported
in 2004.
No comparable national data are available as neonatal
herpes infections are not nationally notifiable.
Figure 3-17. Incidence of Neonatal Herpes: Ontario and Canada, 2002-2011
Ontario Cases: MOHLTC, integrated Public Health Information System (iPHIS) database, extracted [2012/06/13]. Ontario Population: MOHLTC, intelliHEALTH Ontario, extracted [2013/09/05]; rates are per/100,000 live births. Canadian Rates: Neonatal herpes is not a nationally notifiable disease.
Reportable Disease Trends in Ontario 2011 181
HIV and AIDS
The reported incidence of HIV was relatively
stable from 2002 to 2008, with lower rates
from 2009 to 2011.
The incidence of HIV is highest among males
25 to 49 years of age; the incidence of AIDS is
highest among males 30 to 59 years of age.
The most frequently reported risk factor in
2011 among male HIV cases was ‘sex with
same sex’.
Acquired Immunodeficiency Syndrome (AIDS) is an
advanced disease of the immune system caused by
infection with the human immunodeficiency virus (HIV).
It was first reported in 1981 and is considered endemic
in 71 countries worldwide.1 A diagnosis of AIDS occurs
when HIV weakens the immune system such that those
infected become susceptible to other opportunistic
infections and certain types of cancer.1
HIV is transmitted from person-to-person through
unprotected sexual intercourse; contact with certain
bodily fluids, such as semen, blood, and vaginal fluids;
exposure to cerebrospinal fluid; the use of
contaminated needles and/or other drug use
equipment; transfusion of infected blood or its
components; and transplants with infected organs or
tissues.1 Mother-to-child transmission can also occur
during childbirth and breast feeding.1 Symptoms of
acute HIV infection are non-specific and can include
fever, myalgia, swollen lymph nodes, and weight loss.
Antibodies for the detection of HIV can take from one to
three months to appear after infection. Transmission
can occur early after initial infection with HIV and
continues throughout life. The risk of transmission is
reduced with low amounts of virus in the blood
achieved through compliance with treatment regimens,
improved clinical status, and absence of other sexually
transmitted infections. Compliance with current
treatment regimens such as Highly Active
Anti-Retroviral Therapy (HAART) now allow people
infected with HIV to live longer and lead relatively
healthy lives. The time from HIV infection to diagnosis
of AIDS can be less than a year to over 15 years.1 In
Ontario, those at greatest risk for HIV include men who
have sex with men, injection drug users, those of
African and/or Caribbean descent, and Aboriginal
peoples.57,58
2011 IN FOCUS AND HISTORICAL HIGHLIGHTS
In 2011, there were 865 reported cases of HIV in
Ontario, representing an incidence rate of 6.47 cases
per 100,000 population (Figure 3-18). There were 100
newly diagnosed AIDS cases in 2011, resulting in an
incidence rate of 0.75 cases per 100,000 population
(Figure 3-19). The reported incidence rates of both HIV
and AIDS in 2011 were similar to the rates reported in
2010. Of newly diagnosed AIDS cases in 2011, 80%
(80/100) were reported for the first time as having HIV
in 2011, indicating late detection of the infection.
The reported incidence of HIV was relatively stable in
Ontario from 2002 to 2008, with an average annual
incidence rate of 7.78 cases per 100,000. The annual
average incidence rate of HIV from 2009 to 2011 was
17% lower at 6.49 cases per 100,000 population.
Starting in 2003, the reported incidence rate of AIDS in
Ontario decreased by 59%, from 1.81 cases per 100,000
population to 0.75 cases per 100,000 population in
2011. The decrease in AIDS diagnoses over the past
decade is likely due in large part to improved access and
treatment for HIV infection, which has slowed down the
progression to AIDS.58
From 2002 to 2008, annual incidence rates of HIV in
Ontario were similar to those of Canada. However, the
Ontario rates for AIDS were consistently higher than the
overall Canadian rates during this period (Figures 3-18
and 3-19).
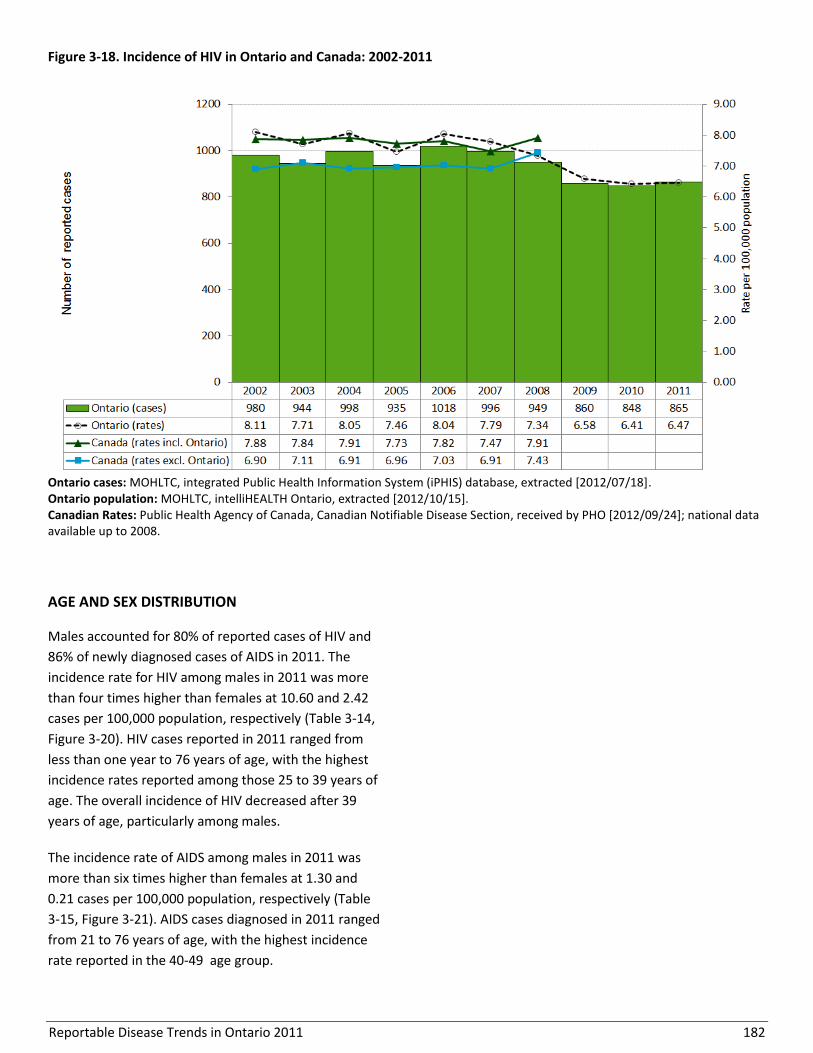
Reportable Disease Trends in Ontario 2011 182
Figure 3-18. Incidence of HIV in Ontario and Canada: 2002-2011
Ontario cases: MOHLTC, integrated Public Health Information System (iPHIS) database, extracted [2012/07/18]. Ontario population: MOHLTC, intelliHEALTH Ontario, extracted [2012/10/15]. Canadian Rates: Public Health Agency of Canada, Canadian Notifiable Disease Section, received by PHO [2012/09/24]; national data available up to 2008.
AGE AND SEX DISTRIBUTION
Males accounted for 80% of reported cases of HIV and
86% of newly diagnosed cases of AIDS in 2011. The
incidence rate for HIV among males in 2011 was more
than four times higher than females at 10.60 and 2.42
cases per 100,000 population, respectively (Table 3-14,
Figure 3-20). HIV cases reported in 2011 ranged from
less than one year to 76 years of age, with the highest
incidence rates reported among those 25 to 39 years of
age. The overall incidence of HIV decreased after 39
years of age, particularly among males.
The incidence rate of AIDS among males in 2011 was
more than six times higher than females at 1.30 and
0.21 cases per 100,000 population, respectively (Table
3-15, Figure 3-21). AIDS cases diagnosed in 2011 ranged
from 21 to 76 years of age, with the highest incidence
rate reported in the 40-49 age group.

Reportable Disease Trends in Ontario 2011 183
Figure 3-19. Incidence of AIDS in Ontario and Canada: 2002-2011
Ontario cases: MOHLTC, integrated Public Health Information System (iPHIS) database, extracted [2012/07/18]. Ontario population: MOHLTC, intelliHEALTH Ontario, extracted [2012/10/15]. Canadian Rates: Public Health Agency of Canada, Canadian Notifiable Disease Section, received by PHO [2012/09/24]; national data available up to 2008.
Table 3-14. Incidence of HIV by Age and Sex: Ontario, 2011
Age Group (Years)
Female Male Total
Cases Rates per 100,000
population Cases
Rates per 100,000 population
Cases Rates per 100,000
population
<15 3 0.28 1 0.09 4 0.18
15-19 2 0.47 6 1.34 8 0.92
20-24 22 4.76 81 16.72 103 10.88
25-29 15 3.22 116 24.78 131 14.03
30-39 65 7.12 193 21.94 258 14.39
40-49 37 3.59 188 18.22 225 10.91
50-59 14 1.46 83 8.82 97 5.11
60-69 6 0.87 23 3.56 29 2.18
70+ 0 0.00 8 1.42 8 0.60
Total 164 2.42 699 10.60 863 6.45
Ontario cases: MOHLTC, integrated Public Health Information System (iPHIS) database, extracted [2012/07/18]. Ontario population: MOHLTC, intelliHEALTH Ontario, extracted [2012/10/15]. Note: Excludes two cases of unknown age and sex.
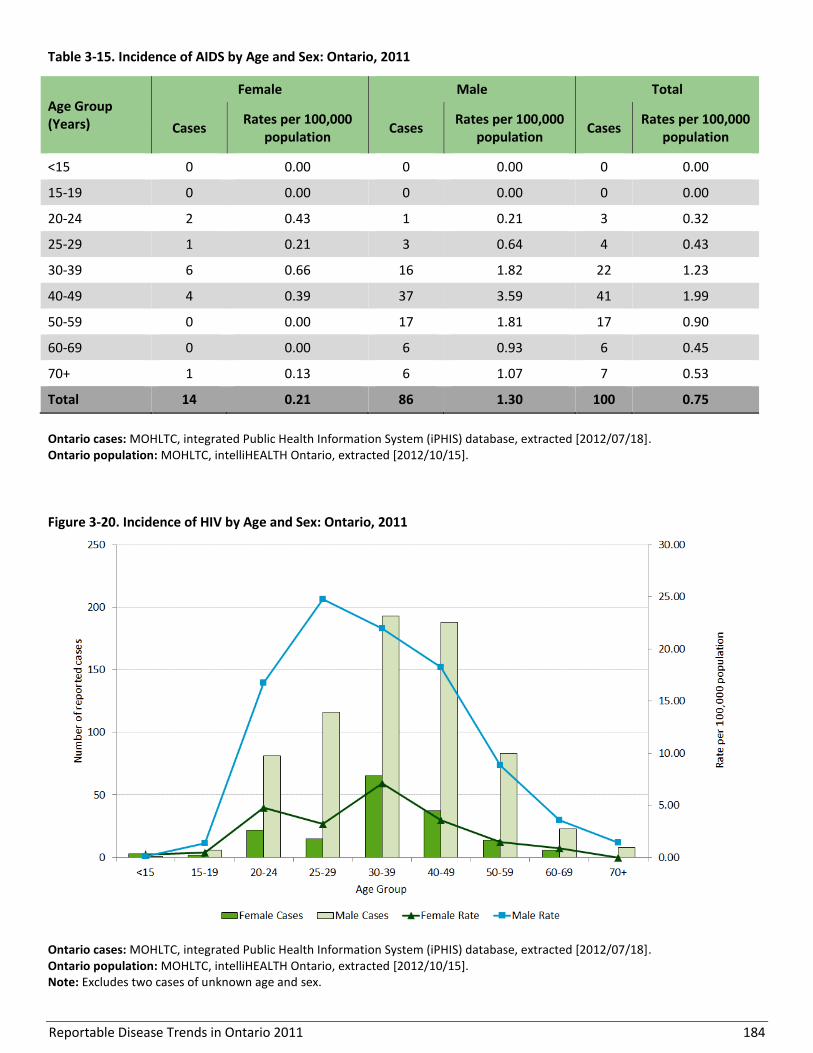
Reportable Disease Trends in Ontario 2011 184
Table 3-15. Incidence of AIDS by Age and Sex: Ontario, 2011
Age Group (Years)
Female Male Total
Cases Rates per 100,000
population Cases
Rates per 100,000 population
Cases Rates per 100,000
population
<15 0 0.00 0 0.00 0 0.00
15-19 0 0.00 0 0.00 0 0.00
20-24 2 0.43 1 0.21 3 0.32
25-29 1 0.21 3 0.64 4 0.43
30-39 6 0.66 16 1.82 22 1.23
40-49 4 0.39 37 3.59 41 1.99
50-59 0 0.00 17 1.81 17 0.90
60-69 0 0.00 6 0.93 6 0.45
70+ 1 0.13 6 1.07 7 0.53
Total 14 0.21 86 1.30 100 0.75
Ontario cases: MOHLTC, integrated Public Health Information System (iPHIS) database, extracted [2012/07/18]. Ontario population: MOHLTC, intelliHEALTH Ontario, extracted [2012/10/15].
Figure 3-20. Incidence of HIV by Age and Sex: Ontario, 2011
Ontario cases: MOHLTC, integrated Public Health Information System (iPHIS) database, extracted [2012/07/18]. Ontario population: MOHLTC, intelliHEALTH Ontario, extracted [2012/10/15]. Note: Excludes two cases of unknown age and sex.

Reportable Disease Trends in Ontario 2011 185
Figure 3-21. Incidence of AIDS by Age and Sex: Ontario, 2011
Ontario cases: MOHLTC, integrated Public Health Information System (iPHIS) database, extracted [2012/07/18]. Ontario population: MOHLTC, intelliHEALTH Ontario, extracted [2012/10/15].
HOSPITALIZATIONS AND DEATHS
Of AIDS cases diagnosed in 2011, 11% (11 cases) were
fatal. AIDS was reported as the underlying cause of
death for seven of these cases, and as a contributing
cause of death for two cases. The cause of death was
unknown for the remaining two cases.
MONTHLY DISTRIBUTION
There are no apparent monthly or seasonal trends
observed in the incidence of HIV and AIDS in Ontario
(Figures 3-22 and 3-23).
GEOGRAPHIC DISTRIBUTION
In 2011, 63% (544/865) of all HIV cases in Ontario were
reported from Toronto, which had the highest incidence
rate at 19.8 cases per 100,000 population (Map 3-6,
Table 3-16). This rate was more than double those in
Sudbury and District and City of Ottawa, which had the
next highest rates at 9.61 cases and 7.91 cases per
100,000 population, respectively.
Toronto reported the majority of AIDS cases (54%,
54/100) in Ontario in 2011 with an annual incidence rate
of 1.97 cases per 100,000 population (Map 3-7, Table 3-
17). However, the incidence rate of AIDS was higher in
Northwestern and Elgin-St. Thomas, with 3.66 and 2.19
cases per 100,000 population, respectively. Seventeen
health units reported no cases of AIDS in 2011.
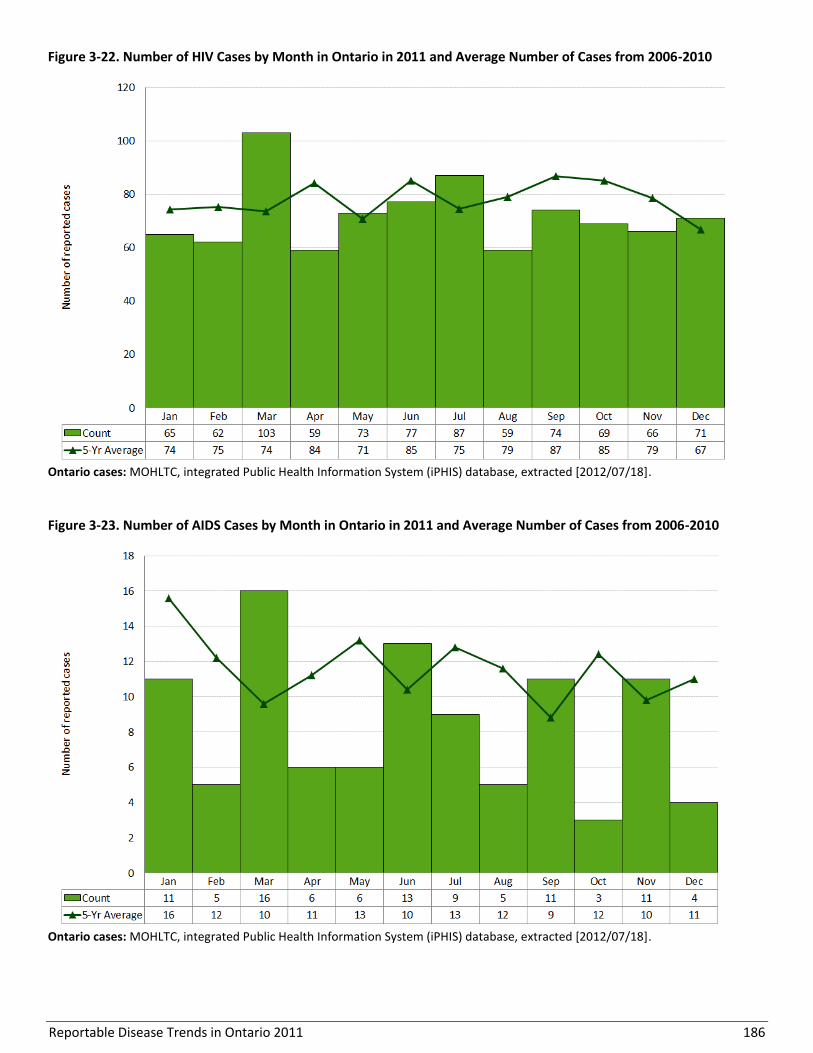
Reportable Disease Trends in Ontario 2011 186
Figure 3-22. Number of HIV Cases by Month in Ontario in 2011 and Average Number of Cases from 2006-2010
Ontario cases: MOHLTC, integrated Public Health Information System (iPHIS) database, extracted [2012/07/18].
Figure 3-23. Number of AIDS Cases by Month in Ontario in 2011 and Average Number of Cases from 2006-2010
Ontario cases: MOHLTC, integrated Public Health Information System (iPHIS) database, extracted [2012/07/18].

Reportable Disease Trends in Ontario 2011 187
Map 3-6. Incidence rates of HIV by Health Unit of Residence: Ontario, 2011
Ontario cases: MOHLTC, integrated Public Health Information System (iPHIS) database, extracted [2012/07/18]. Ontario population: MOHLTC, intelliHEALTH Ontario, extracted [2012/10/15]. Note: Health unit (HU) refers to the HU where the case resided at the time of identification and not necessarily the place of disease exposure or acquisition.

Reportable Disease Trends in Ontario 2011 188
Map 3-7. Incidence rates of AIDS by Health Unit of Residence: Ontario, 2011
Ontario cases: MOHLTC, integrated Public Health Information System (iPHIS) database, extracted [2012/07/18]. Ontario population: MOHLTC, intelliHEALTH Ontario, extracted [2012/10/15]. Note: Health unit (HU) refers to the HU where the case resided at the time of identification and not necessarily the place of disease exposure or acquisition.

Reportable Disease Trends in Ontario 2011 189
Table 3-16. Incidence of HIV by Health Unit of Residence: Ontario, 2011
Public Health Unit Cases
(n)
Rates (per 100,000 Population)
Cases as Proportion of
Total Cases (%)
Proportion of Ontario
Population (%)
Algoma District 2 1.70 0.2% 0.9%
Brant County 2 1.42 0.2% 1.1%
Chatham-Kent 1 0.92 0.1% 0.8%
Durham Region 8 1.27 0.9% 4.7%
Eastern Ontario 3 1.49 0.3% 1.5%
Elgin-St. Thomas 2 2.19 0.2% 0.7%
Grey Bruce 1 0.61 0.1% 1.2%
Haldimand-Norfolk 2 1.81 0.2% 0.8%
Haliburton, Kawartha, Pine Ridge District 0 0.00 0.0% 1.3%
Halton Region 6 1.16 0.7% 3.9%
Hamilton, City of 26 4.81 3.0% 4.0%
Hastings & Prince Edward Counties 2 1.23 0.2% 1.2%
Huron County 1 1.66 0.1% 0.5%
Kingston-Frontenac & Lennox & Addington 8 4.05 0.9% 1.5%
Lambton County 0 0.00 0.0% 1.0%
Leeds, Grenville and Lanark District 2 1.18 0.2% 1.3%
Middlesex-London 24 5.21 2.8% 3.4%
Niagara Region 10 2.25 1.2% 3.3%
North Bay Parry Sound District 3 2.36 0.3% 1.0%
Northwestern 3 3.66 0.3% 0.6%
Ottawa, City of 72 7.91 8.3% 6.8%
Oxford County 0 0.00 0.0% 0.8%
Peel Region 43 3.15 5.0% 10.2%
Perth District 1 1.30 0.1% 0.6%
Peterborough County-City 1 0.71 0.1% 1.1%
Porcupine 2 2.31 0.2% 0.6%
Renfrew County & District 1 0.97 0.1% 0.8%
Simcoe Muskoka District 14 2.66 1.6% 3.9%
Sudbury & District 19 9.61 2.2% 1.5%
Thunder Bay District 3 1.92 0.3% 1.2%
Timiskaming 0 0.00 0.0% 0.3%
Toronto 544 19.83 62.9% 20.5%
Waterloo Region 12 2.26 1.4% 4.0%
Wellington-Dufferin-Guelph 5 1.80 0.6% 2.1%
Windsor-Essex County 16 3.97 1.8% 3.0%
York Region 26 2.43 3.0% 8.0%
Ontario 865 6.47 100.0% 100.0%
Ontario cases: MOHLTC, integrated Public Health Information System (iPHIS) database, extracted [2012/07/18]. Ontario population: MOHLTC, intelliHEALTH Ontario, extracted [2012/10/15]. Note: Health unit (HU) refers to the HU where the case resided at the time of identification and not necessarily the place of disease exposure or acquisition.

Reportable Disease Trends in Ontario 2011 190
Table 3-17. Incidence of AIDS by Health Unit of Residence: Ontario, 2011
Public Health Unit Cases
(n)
Rates (per 100,000 Population)
Cases as Proportion of
Total Cases (%)
Proportion of Ontario
Population (%)
Algoma District 0 0.00 0.0% 0.9%
Brant County 0 0.00 0.0% 1.1%
Chatham-Kent 0 0.00 0.0% 0.8%
Durham Region 3 0.48 3.0% 4.7%
Eastern Ontario 2 0.99 2.0% 1.5%
Elgin-St. Thomas 2 2.19 2.0% 0.7%
Grey Bruce 1 0.61 1.0% 1.2%
Haldimand-Norfolk 2 1.81 2.0% 0.8%
Haliburton, Kawartha, Pine Ridge District 0 0.00 0.0% 1.3%
Halton Region 3 0.58 3.0% 3.9%
Hamilton, City of 4 0.74 4.0% 4.0%
Hastings & Prince Edward Counties 0 0.00 0.0% 1.2%
Huron County 1 1.66 1.0% 0.5%
Kingston-Frontenac & Lennox & Addington 0 0.00 0.0% 1.5%
Lambton County 0 0.00 0.0% 1.0%
Leeds, Grenville and Lanark District 1 0.59 1.0% 1.3%
Middlesex-London 1 0.22 1.0% 3.4%
Niagara Region 2 0.45 2.0% 3.3%
North Bay Parry Sound District 0 0.00 0.0% 1.0%
Northwestern 3 3.66 3.0% 0.6%
Ottawa, City of 7 0.77 7.0% 6.8%
Oxford County 0 0.00 0.0% 0.8%
Peel Region 4 0.29 4.0% 10.2%
Perth District 1 1.30 1.0% 0.6%
Peterborough County-City 0 0.00 0.0% 1.1%
Porcupine 0 0.00 0.0% 0.6%
Renfrew County & District 0 0.00 0.0% 0.8%
Simcoe Muskoka District 2 0.38 2.0% 3.9%
Sudbury & District 1 0.51 1.0% 1.5%
Thunder Bay District 1 0.64 1.0% 1.2%
Timiskaming 0 0.00 0.0% 0.3%
Toronto 54 1.97 54.0% 20.5%
Waterloo Region 1 0.19 1.0% 4.0%
Wellington-Dufferin-Guelph 0 0.00 0.0% 2.1%
Windsor-Essex County 0 0.00 0.0% 3.0%
York Region 4 0.37 4.0% 8.0%
Ontario 100 0.75 100.0% 100.0%
Ontario cases: MOHLTC, integrated Public Health Information System (iPHIS) database, extracted [2012/07/18]. Ontario population: MOHLTC, intelliHEALTH Ontario, extracted [2012/10/15]. Note: Health unit (HU) refers to the HU where the case resided at the time of identification and not necessarily the place of disease exposure or acquisition.
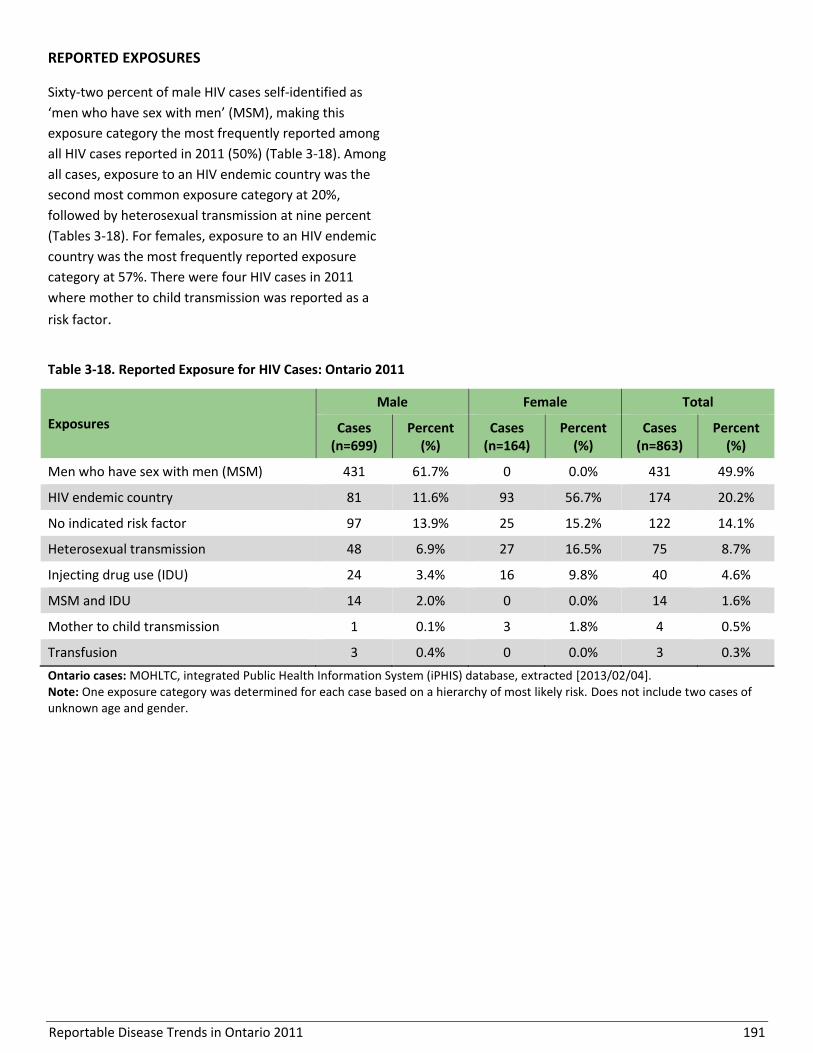
Reportable Disease Trends in Ontario 2011 191
REPORTED EXPOSURES
Sixty-two percent of male HIV cases self-identified as
‘men who have sex with men’ (MSM), making this
exposure category the most frequently reported among
all HIV cases reported in 2011 (50%) (Table 3-18). Among
all cases, exposure to an HIV endemic country was the
second most common exposure category at 20%,
followed by heterosexual transmission at nine percent
(Tables 3-18). For females, exposure to an HIV endemic
country was the most frequently reported exposure
category at 57%. There were four HIV cases in 2011
where mother to child transmission was reported as a
risk factor.
Table 3-18. Reported Exposure for HIV Cases: Ontario 2011
Exposures
Male Female Total
Cases (n=699)
Percent (%)
Cases (n=164)
Percent (%)
Cases (n=863)
Percent (%)
Men who have sex with men (MSM) 431 61.7% 0 0.0% 431 49.9%
HIV endemic country 81 11.6% 93 56.7% 174 20.2%
No indicated risk factor 97 13.9% 25 15.2% 122 14.1%
Heterosexual transmission 48 6.9% 27 16.5% 75 8.7%
Injecting drug use (IDU) 24 3.4% 16 9.8% 40 4.6%
MSM and IDU 14 2.0% 0 0.0% 14 1.6%
Mother to child transmission 1 0.1% 3 1.8% 4 0.5%
Transfusion 3 0.4% 0 0.0% 3 0.3%
Ontario cases: MOHLTC, integrated Public Health Information System (iPHIS) database, extracted [2013/02/04]. Note: One exposure category was determined for each case based on a hierarchy of most likely risk. Does not include two cases of unknown age and gender.

Reportable Disease Trends in Ontario 2011 192
Ophthalmia Neonatorum
Ophthalmia neonatorum is an acute infection of the
eyes of a newborn that occurs within the first three to
four weeks of life.1,55 The infection is acquired during
birth and occurs subsequent to maternal chlamydial or
gonorrheal infections.1 The most common symptoms of
ophthalmia neonatorum are red eyes and swollen
eyelids with a discharge.1 Gonorrheal ophthalmia
neonatorum is more serious but occurs less frequently
than chlamydial ophthalmia neonatorum.1,55 Data on
the incidence of chlamydia and gonorrhea in Ontario
are presented in separate chapters in this section.
The first line of defense against ophthalmia neonatorum
is maternal screening and treatment for chlamydia and
gonorrhea and prophylactic treatment of the eyes of all
newborns. In Ontario, as in most jurisdictions in Canada,
the eyes of every newborn are treated prophylactically
to reduce the risk of ophthalmia neonatorum and the
resultant scarring that can lead to blindness.1
2011 IN FOCUS AND HISTORICAL HIGHLIGHTS
One case of ophthalmia neonatorum due to Chlamydia
trachomatis was reported in Ontario in 2011,
representing an incidence rate of 0.71 cases per
100,000 live births (Figure 3-24). This was lower than
the five cases reported in 2010. Over the period 2002 to
2011, 35 cases of ophthalmia neonatorum were
reported in Ontario, with annual incidence rates ranging
from 0.71 to 4.54 cases per 100,000 live births.
No comparable national data are available because
ophthalmia neonatorum infections are not nationally
notifiable.
Figure 3-24. Incidence of Ophthalmia Neonatorum: Ontario and Canada, 2002-2011
Ontario Cases: MOHLTC, integrated Public Health Information System (iPHIS) database, extracted [2012/06/13]. Ontario Population: MOHLTC, intelliHEALTH Ontario, extracted [2012/10/15]; rates are per/100,000 live births. Canadian Rates: Ophthalmia neonatorum is not a nationally notifiable disease.
Reportable Disease Trends in Ontario 2011 193
Syphilis, Infectious
The incidence of infectious syphilis increased
from 2002 to 2011, with peaks in 2004 and
2009.
Males accounted for 96% of infectious syphilis
cases reported in Ontario in 2011.
The majority of infectious syphilis cases were
reported in Toronto and Ottawa.
‘Sex with same sex’ is the most commonly
reported risk factor among male cases for
infectious syphilis in Ontario.
Infectious syphilis is caused by infection with the
bacteria Treponema pallidum.1 Syphilis can result in
acute or chronic disease, with four possible stages of
infection: primary, secondary, latent, and tertiary.
Primary syphilis involves the appearance of a painless
ulcer or chancre and swollen lymph nodes. Secondary
stage syphilis occurs after resolution of the chancre and
often includes a rash on the palms and soles along with
swollen lymph nodes. Latent syphilis occurs after the
symptoms of secondary syphilis have resolved, and can
be classified as early latent infection (within the first
year of infection) or late latent infection (after the first
year of infection). Untreated latent syphilis can progress
after many years to tertiary syphilis, which affects the
skeletal, cardiovascular, and neurological systems (e.g.
neurosyphilis).1
Individuals infected with syphilis can transmit the
bacteria during primary, secondary, and early latent
infection; however, in some cases, neurosyphilis may
also be infectious. Syphilis is typically transmitted
through sexual contact, including vaginal, anal and oral
sex. It can also be passed from an infected mother to her
child before (i.e. across the placenta) or during birth,
resulting in congenital syphilis.1 Generally, the
appearance of symptoms can take anywhere from ten
days to three months to appear, but usually occurs in
about three weeks.
All cases of syphilis are reportable in Ontario, regardless
of stage of disease, however only stages considered
infectious are included in this report. Although
susceptibility is universal, syphilis has been more
prevalent in urban areas and among men who have sex
with men (MSM) in Ontario.59,60
2011 IN FOCUS AND HISTORICAL HIGHLIGHTS
In Ontario, there were 767 cases of infectious syphilis
reported in 2011, which includes primary, secondary and
early latent syphilis, as well as infectious neurosyphilis
(Figure 3-25). This yielded an incidence rate of 5.74
cases per 100,000 population in 2011, which was three
percent lower than the incidence rate of 5.9 cases per
100,000 population reported in 2010. There was one
case of congenital syphilis reported in 2011.
From 2002 to 2011, the annual incidence rate of
infectious syphilis in Ontario increased nearly three-
folds, from 2.0 cases per 100,000 population in 2002 to
5.7 cases per 100,000 population in 2011.
Two notable increases in the incidence of infectious
syphilis in Ontario were observed from 2002 to 2004,
and again from 2008 to 2009 (Figure 3-25). Both of these
increases are primarily attributable to outbreaks in
Toronto and Ottawa among MSM.59,60 Since 2009,
incidence rates have decreased only gradually.
Annual incidence rates of infectious syphilis in Ontario
were consistently lower than the Canadian rates from
2002 to 2011 (Figure 3-25). Both provincial and national
rates increased during this period; however, the increase
in Ontario was more gradual. There was also a decrease
in the incidence rate of infectious syphilis in Ontario
from 2005 to 2008, a period when the Canadian rate
was approaching its peak.
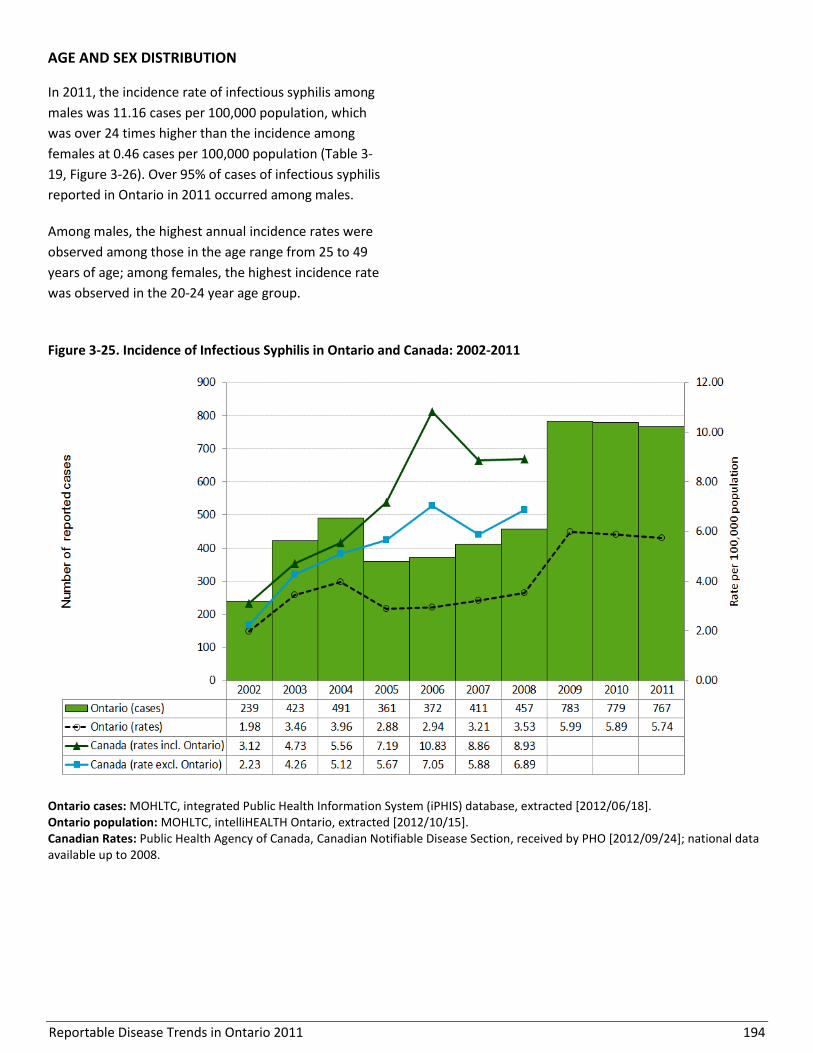
Reportable Disease Trends in Ontario 2011 194
AGE AND SEX DISTRIBUTION
In 2011, the incidence rate of infectious syphilis among
males was 11.16 cases per 100,000 population, which
was over 24 times higher than the incidence among
females at 0.46 cases per 100,000 population (Table 3-
19, Figure 3-26). Over 95% of cases of infectious syphilis
reported in Ontario in 2011 occurred among males.
Among males, the highest annual incidence rates were
observed among those in the age range from 25 to 49
years of age; among females, the highest incidence rate
was observed in the 20-24 year age group.
Figure 3-25. Incidence of Infectious Syphilis in Ontario and Canada: 2002-2011
Ontario cases: MOHLTC, integrated Public Health Information System (iPHIS) database, extracted [2012/06/18]. Ontario population: MOHLTC, intelliHEALTH Ontario, extracted [2012/10/15]. Canadian Rates: Public Health Agency of Canada, Canadian Notifiable Disease Section, received by PHO [2012/09/24]; national data available up to 2008.
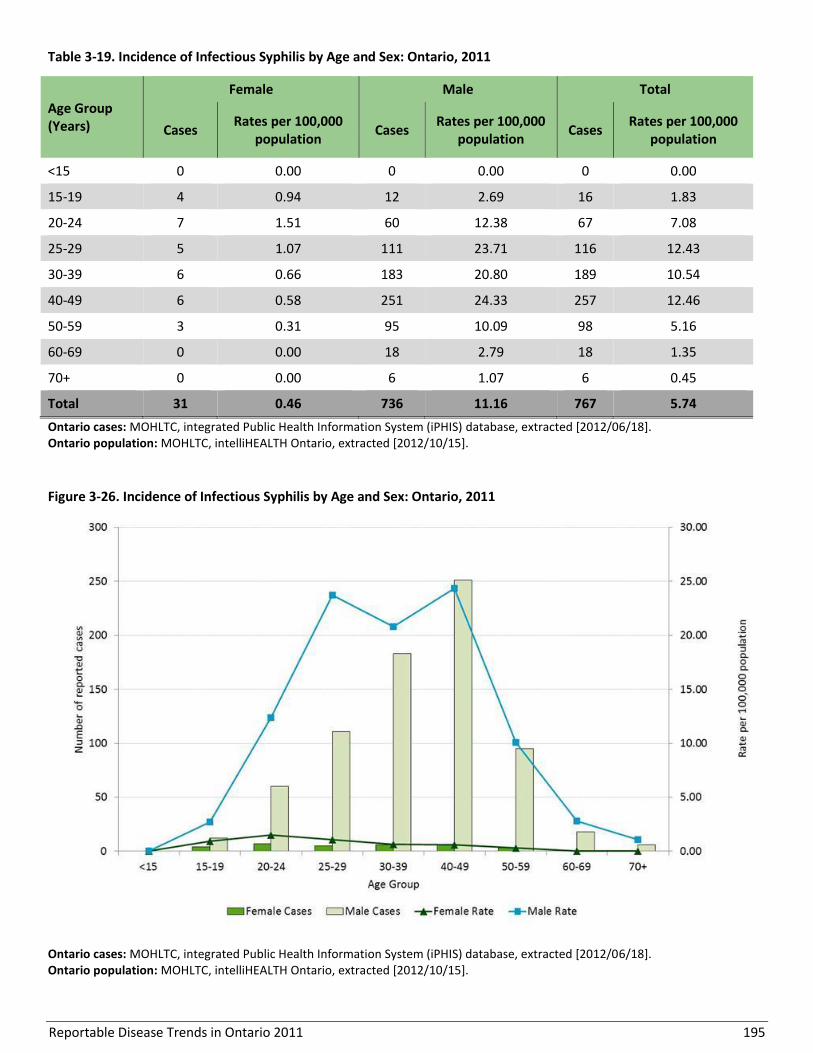
Reportable Disease Trends in Ontario 2011 195
Table 3-19. Incidence of Infectious Syphilis by Age and Sex: Ontario, 2011
Age Group (Years)
Female Male Total
Cases Rates per 100,000
population Cases
Rates per 100,000 population
Cases Rates per 100,000
population
<15 0 0.00 0 0.00 0 0.00
15-19 4 0.94 12 2.69 16 1.83
20-24 7 1.51 60 12.38 67 7.08
25-29 5 1.07 111 23.71 116 12.43
30-39 6 0.66 183 20.80 189 10.54
40-49 6 0.58 251 24.33 257 12.46
50-59 3 0.31 95 10.09 98 5.16
60-69 0 0.00 18 2.79 18 1.35
70+ 0 0.00 6 1.07 6 0.45
Total 31 0.46 736 11.16 767 5.74
Ontario cases: MOHLTC, integrated Public Health Information System (iPHIS) database, extracted [2012/06/18]. Ontario population: MOHLTC, intelliHEALTH Ontario, extracted [2012/10/15].
Figure 3-26. Incidence of Infectious Syphilis by Age and Sex: Ontario, 2011
Ontario cases: MOHLTC, integrated Public Health Information System (iPHIS) database, extracted [2012/06/18]. Ontario population: MOHLTC, intelliHEALTH Ontario, extracted [2012/10/15].
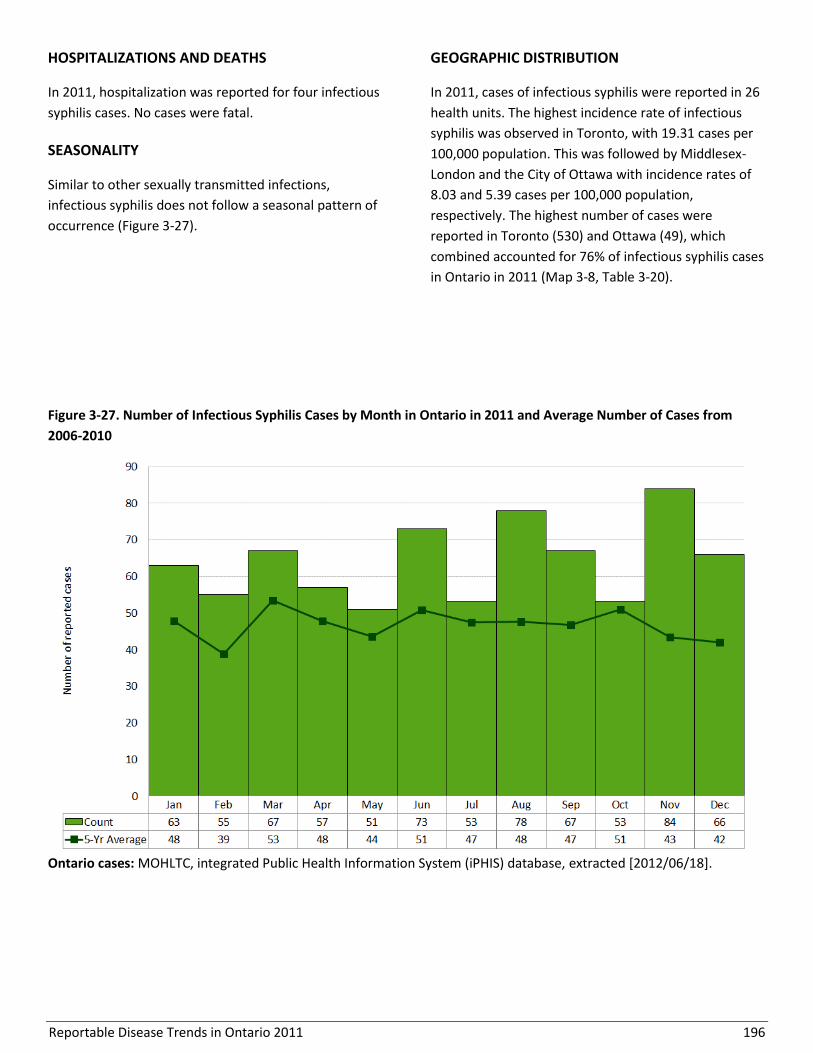
Reportable Disease Trends in Ontario 2011 196
HOSPITALIZATIONS AND DEATHS
In 2011, hospitalization was reported for four infectious
syphilis cases. No cases were fatal.
SEASONALITY
Similar to other sexually transmitted infections,
infectious syphilis does not follow a seasonal pattern of
occurrence (Figure 3-27).
GEOGRAPHIC DISTRIBUTION
In 2011, cases of infectious syphilis were reported in 26
health units. The highest incidence rate of infectious
syphilis was observed in Toronto, with 19.31 cases per
100,000 population. This was followed by Middlesex-
London and the City of Ottawa with incidence rates of
8.03 and 5.39 cases per 100,000 population,
respectively. The highest number of cases were
reported in Toronto (530) and Ottawa (49), which
combined accounted for 76% of infectious syphilis cases
in Ontario in 2011 (Map 3-8, Table 3-20).
Figure 3-27. Number of Infectious Syphilis Cases by Month in Ontario in 2011 and Average Number of Cases from
2006-2010
Ontario cases: MOHLTC, integrated Public Health Information System (iPHIS) database, extracted [2012/06/18].

Reportable Disease Trends in Ontario 2011 197
Map 3-8. Incidence of Infectious Syphilis by Health Unit of Residence: Ontario, 2011
Ontario cases: MOHLTC, integrated Public Health Information System (iPHIS) database, extracted [2012/06/18]. Ontario population: MOHLTC, intelliHEALTH Ontario, extracted [2012/10/15]. Note: Health unit (HU) refers to the HU where the case resided at the time of identification and not necessarily the place of disease exposure or acquisition.

Reportable Disease Trends in Ontario 2011 198
Table 3-20. Incidence of Infectious Syphilis by Public Health Unit of Residence: Ontario, 2011
Public Health Unit Cases
(n) Rates (per 100,000
Population)
Cases as Proportion of Total
Cases (%)
Proportion of Ontario Population
(%)
Algoma District 0 0.00 0.0% 0.9%
Brant County 0 0.00 0.0% 1.1%
Chatham-Kent 1 0.92 0.1% 0.8%
Durham Region 12 1.90 1.6% 4.7%
Eastern Ontario 3 1.49 0.4% 1.5%
Elgin-St. Thomas 2 2.19 0.3% 0.7%
Grey Bruce 4 2.43 0.5% 1.2%
Haldimand-Norfolk 0 0.00 0.0% 0.8%
Haliburton, Kawartha, Pine Ridge District 1 0.56 0.1% 1.3%
Halton Region 9 1.74 1.2% 3.9%
Hamilton, City of 17 3.15 2.2% 4.0%
Hastings & Prince Edward Counties 1 0.61 0.1% 1.2%
Huron County 1 1.66 0.1% 0.5%
Kingston-Frontenac & Lennox & Addington 2 1.01 0.3% 1.5%
Lambton County 1 0.76 0.1% 1.0%
Leeds, Grenville and Lanark District 0 0.00 0.0% 1.3%
Middlesex-London 37 8.03 4.8% 3.4%
Niagara Region 5 1.12 0.7% 3.3%
North Bay Parry Sound District 0 0.00 0.0% 1.0%
Northwestern 1 1.22 0.1% 0.6%
Ottawa, City of 49 5.39 6.4% 6.8%
Oxford County 1 0.92 0.1% 0.8%
Peel Region 30 2.20 3.9% 10.2%
Perth District 0 0.00 0.0% 0.6%
Peterborough County-City 1 0.71 0.1% 1.1%
Porcupine 0 0.00 0.0% 0.6%
Renfrew County & District 0 0.00 0.0% 0.8%
Simcoe Muskoka District 4 0.76 0.5% 3.9%
Sudbury & District 0 0.00 0.0% 1.5%
Thunder Bay District 2 1.28 0.3% 1.2%
Timiskaming 0 0.00 0.0% 0.3%
Toronto 530 19.32 69.1% 20.5%
Waterloo Region 10 1.89 1.3% 4.0%
Wellington-Dufferin-Guelph 9 3.23 1.2% 2.1%
Windsor-Essex County 5 1.24 0.7% 3.0%
York Region 29 2.71 3.8% 8.0%
Ontario 767 5.74 100.0% 100.0%
Ontario cases: MOHLTC, integrated Public Health Information System (iPHIS) database, extracted [2012/06/18]. Ontario population: MOHLTC, intelliHEALTH Ontario, extracted [2012/10/15]. Note: Health unit (HU) refers to the HU where the case resided at the time of identification and not necessarily the place of disease exposure or acquisition.
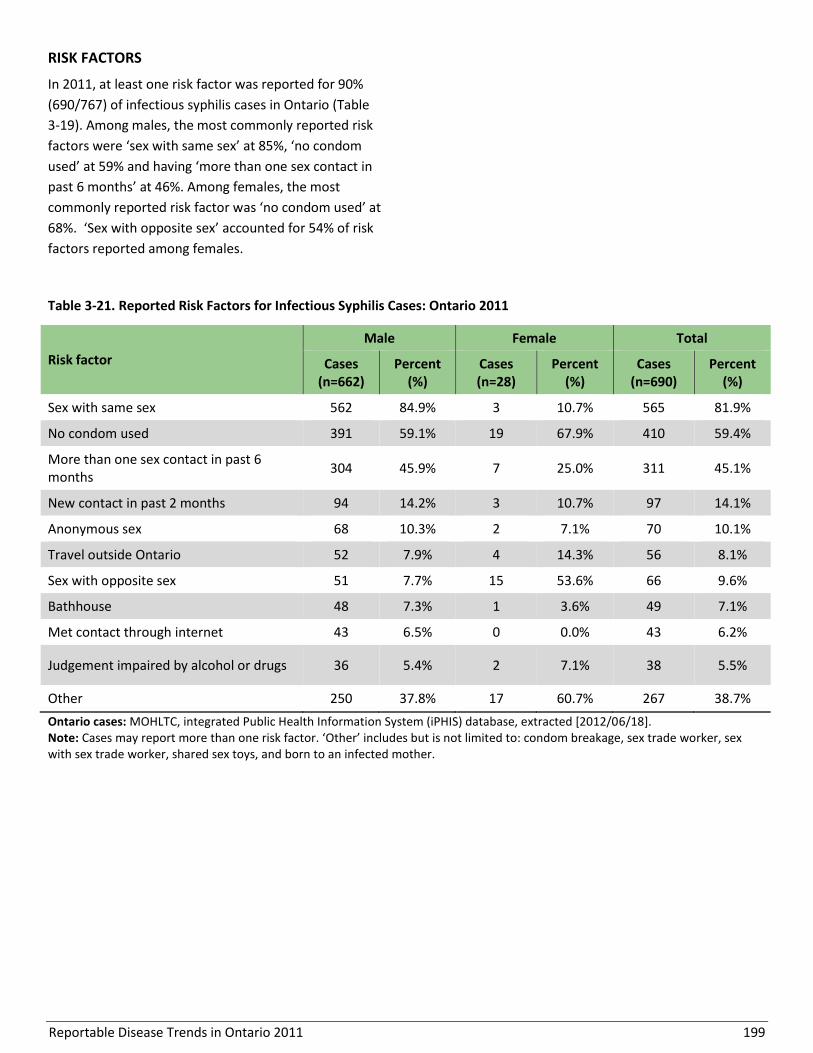
Reportable Disease Trends in Ontario 2011 199
RISK FACTORS
In 2011, at least one risk factor was reported for 90%
(690/767) of infectious syphilis cases in Ontario (Table
3-19). Among males, the most commonly reported risk
factors were ‘sex with same sex’ at 85%, ‘no condom
used’ at 59% and having ‘more than one sex contact in
past 6 months’ at 46%. Among females, the most
commonly reported risk factor was ‘no condom used’ at
68%. ‘Sex with opposite sex’ accounted for 54% of risk
factors reported among females.
Table 3-21. Reported Risk Factors for Infectious Syphilis Cases: Ontario 2011
Risk factor
Male Female Total
Cases (n=662)
Percent (%)
Cases (n=28)
Percent (%)
Cases (n=690)
Percent (%)
Sex with same sex 562 84.9% 3 10.7% 565 81.9%
No condom used 391 59.1% 19 67.9% 410 59.4%
More than one sex contact in past 6 months
304 45.9% 7 25.0% 311 45.1%
New contact in past 2 months 94 14.2% 3 10.7% 97 14.1%
Anonymous sex 68 10.3% 2 7.1% 70 10.1%
Travel outside Ontario 52 7.9% 4 14.3% 56 8.1%
Sex with opposite sex 51 7.7% 15 53.6% 66 9.6%
Bathhouse 48 7.3% 1 3.6% 49 7.1%
Met contact through internet 43 6.5% 0 0.0% 43 6.2%
Judgement impaired by alcohol or drugs 36 5.4% 2 7.1% 38 5.5%
Other 250 37.8% 17 60.7% 267 38.7%
Ontario cases: MOHLTC, integrated Public Health Information System (iPHIS) database, extracted [2012/06/18]. Note: Cases may report more than one risk factor. ‘Other’ includes but is not limited to: condom breakage, sex trade worker, sex with sex trade worker, shared sex toys, and born to an infected mother.
Reportable Disease Trends in Ontario 2011 200
Section 4
Vaccine-Preventable Diseases
Overview
Although several reportable diseases in Ontario are
vaccine-preventable, only those administered as part of
the routine publicly-funded schedule for Ontario are
reviewed in this section, with the exception of varicella,
hepatitis B and influenza. There are publicly-funded
rotavirus and human papillomavirus immunization
programs, however these diseases are not reportable
and are also not included. While trends in the incidence
of vaccine-preventable diseases (VPDs) are presented,
self-reported immunization data as reported in iPHIS
are not included in this report. In 2011, invasive
pneumococcal disease (IPD), pertussis and mumps
accounted for 96% of the VPDs described in this section.
The incidence of serogroup C meningococcal disease
and IPD decreased over the period from 2002 to 2011,
suggesting a positive impact of these publicly funded
childhood immunization programs. Notable fluctuations
in the incidence of pertussis and mumps were observed
over the same period, due to large provincial outbreaks
and the cyclical nature of the incidence of these
diseases.
No cases of diphtheria or poliomyelitis were reported in
Ontario in 2011, while tetanus and Haemophilus
influenzae type b were rarely reported. Measles and
rubella are currently undergoing documentation of
elimination in the Americas and remained low in
Ontario in 2011. No cases of rubella or congenital
rubella were reported. The eight reported cases of
measles were all directly or indirectly linked to travel
outside of Canada.
Several quick reference data tables for the diseases covered in this section are included in Appendix 4.

Reportable Disease Trends in Ontario 2011 201
Diphtheria
Diphtheria is a bacterial disease that produces a toxin
that affects the skin and mucous membranes of the
nose and throat. Humans are the only reservoir of these
bacteria, with transmission occurring mainly through
direct contact with respiratory droplets. Symptoms of
diphtheria commonly develop between two to five days
after exposure with the resulting disease primarily
affecting the upper respiratory system.1,61 The
characteristic lesion is a gray, thick membrane at the
back of the nose, mouth and/or throat. Complications
of diphtheria can include suffocation, paralysis, heart
failure, and coma.61 Even with treatment, the case-
fatality ratio ranges from five to ten percent in persons
with respiratory symptoms.1
Under the publicly funded immunization program in
Ontario, diphtheria toxoid containing vaccine is
routinely administered to infants in combination with
vaccines against tetanus, pertussis, polio and
Haemophilus influenzae type b. Diphtheria toxoid
containing vaccine is administered at two, four and six
months of age, with additional boosters at 18 months,
four to six years and 14 to 16 years. A booster dose is
recommended every ten years for adults. The vaccine
does not protect against infection but against serious
illness associated with the diphtheria toxin. In Ontario,
diphtheria antitoxin for the treatment of diphtheria
disease is provided through the federal Special Access
Program.
2011 IN FOCUS AND HISTORICAL HIGHLIGHTS
Diphtheria is a rare disease. No cases have been
reported in Ontario since 1995. Annual incidence rates
of diphtheria for the rest of Canada for the period 2002-
2008 remained below 0.02 cases per 100,000
population.
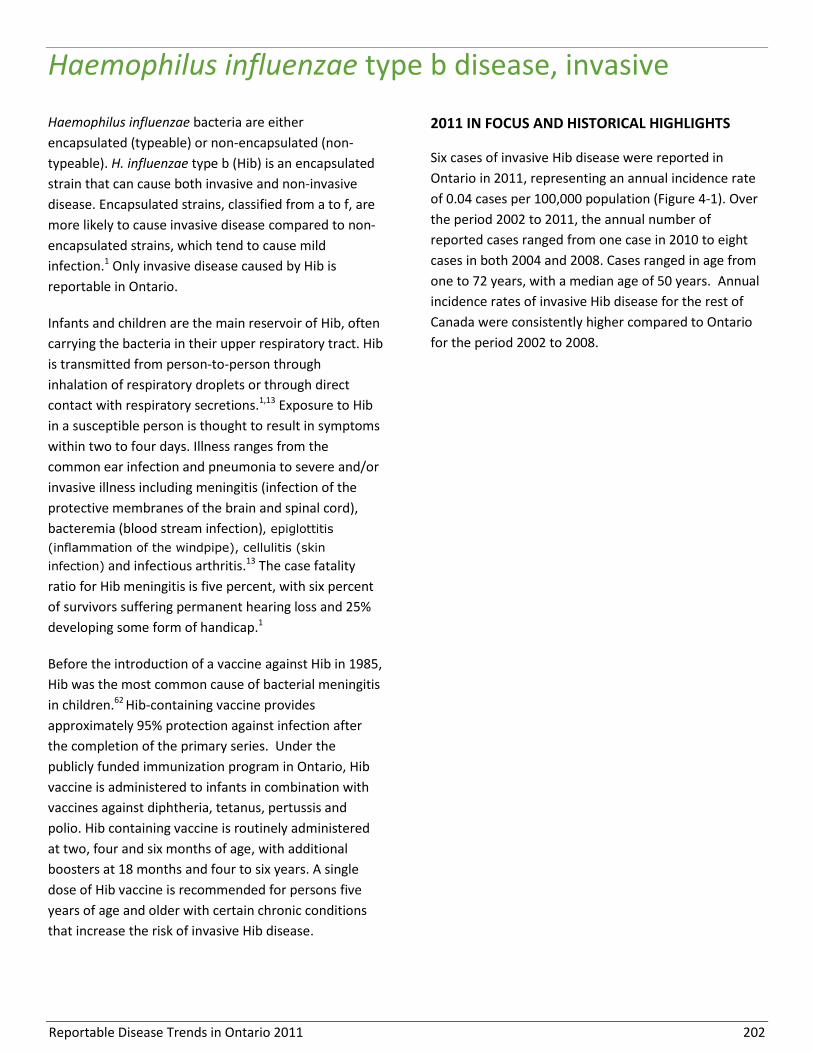
Reportable Disease Trends in Ontario 2011 202
Haemophilus influenzae type b disease, invasive
Haemophilus influenzae bacteria are either
encapsulated (typeable) or non-encapsulated (non-
typeable). H. influenzae type b (Hib) is an encapsulated
strain that can cause both invasive and non-invasive
disease. Encapsulated strains, classified from a to f, are
more likely to cause invasive disease compared to non-
encapsulated strains, which tend to cause mild
infection.1 Only invasive disease caused by Hib is
reportable in Ontario.
Infants and children are the main reservoir of Hib, often
carrying the bacteria in their upper respiratory tract. Hib
is transmitted from person-to-person through
inhalation of respiratory droplets or through direct
contact with respiratory secretions.1,13 Exposure to Hib
in a susceptible person is thought to result in symptoms
within two to four days. Illness ranges from the
common ear infection and pneumonia to severe and/or
invasive illness including meningitis (infection of the
protective membranes of the brain and spinal cord),
bacteremia (blood stream infection), epiglottitis
(inflammation of the windpipe), cellulitis (skin
infection) and infectious arthritis.13 The case fatality
ratio for Hib meningitis is five percent, with six percent
of survivors suffering permanent hearing loss and 25%
developing some form of handicap.1
Before the introduction of a vaccine against Hib in 1985,
Hib was the most common cause of bacterial meningitis
in children.62 Hib-containing vaccine provides
approximately 95% protection against infection after
the completion of the primary series. Under the
publicly funded immunization program in Ontario, Hib
vaccine is administered to infants in combination with
vaccines against diphtheria, tetanus, pertussis and
polio. Hib containing vaccine is routinely administered
at two, four and six months of age, with additional
boosters at 18 months and four to six years. A single
dose of Hib vaccine is recommended for persons five
years of age and older with certain chronic conditions
that increase the risk of invasive Hib disease.
2011 IN FOCUS AND HISTORICAL HIGHLIGHTS
Six cases of invasive Hib disease were reported in
Ontario in 2011, representing an annual incidence rate
of 0.04 cases per 100,000 population (Figure 4-1). Over
the period 2002 to 2011, the annual number of
reported cases ranged from one case in 2010 to eight
cases in both 2004 and 2008. Cases ranged in age from
one to 72 years, with a median age of 50 years. Annual
incidence rates of invasive Hib disease for the rest of
Canada were consistently higher compared to Ontario
for the period 2002 to 2008.
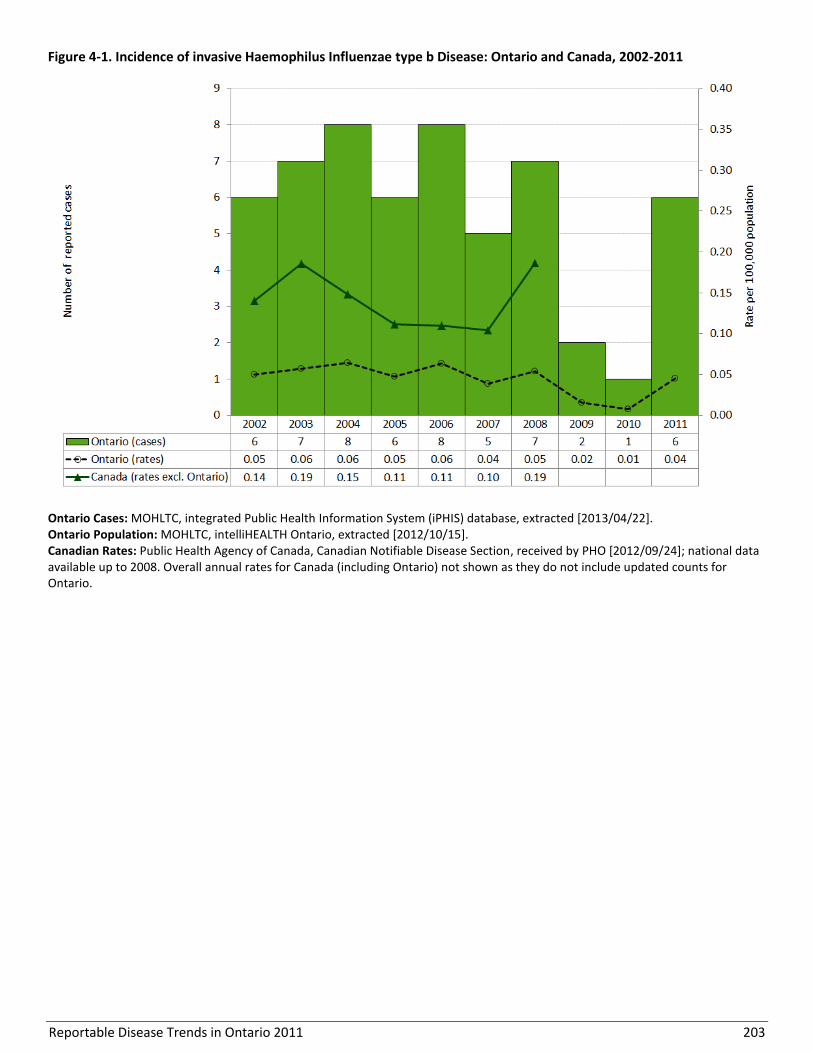
Reportable Disease Trends in Ontario 2011 203
Figure 4-1. Incidence of invasive Haemophilus Influenzae type b Disease: Ontario and Canada, 2002-2011
Ontario Cases: MOHLTC, integrated Public Health Information System (iPHIS) database, extracted [2013/04/22]. Ontario Population: MOHLTC, intelliHEALTH Ontario, extracted [2012/10/15]. Canadian Rates: Public Health Agency of Canada, Canadian Notifiable Disease Section, received by PHO [2012/09/24]; national data available up to 2008. Overall annual rates for Canada (including Ontario) not shown as they do not include updated counts for Ontario.
Reportable Disease Trends in Ontario 2011 204
Measles
Measles is one of the most highly communicable
infectious diseases. It is caused by a virus that is spread
predominantly through air by breathing, coughing or
sneezing or through contact with throat or nasal
discharges from an infected person.1 The symptoms of
measles usually develop approximately ten days after
exposure (range seven to 18 days) and include fever, a
red blotchy rash, red and watery eyes, runny nose,
cough, malaise and Koplik (white) spots in the mouth.1
An infected person can transmit the virus to others who
are not immune from about four days before and after
the appearance of the rash. Complications of measles
infection occur in 10% of cases and one to two out of
every 1,000 cases of measles are fatal.63
Immunization with two doses of a measles-containing
vaccine is the most effective method of preventing
disease. During outbreaks, the effectiveness of
vaccination with two doses of measles-containing
vaccine is estimated to be between 95% and 99.5%.64,65
In Ontario, measles vaccine is administered in
combination with vaccines for mumps and rubella
(MMR) or with vaccines for mumps, rubella and
varicella (MMRV). A two-dose program was introduced
in 1996 and a catch-up program using a vaccine just for
measles was offered to students four to 18 years of age.
In 2010/2011, 86% of seven years olds in Ontario
reported receiving two-doses of a measles-containing
vaccine.66
Indigenous measles has been eliminated from Canada;
the last endemic case of measles was reported in
1997.67 Under guidance of the Pan American Health
Organization, countries of the Americas are currently
documenting the elimination of measles and rubella.68
As the disease remains endemic in other parts of the
world, importation of cases continues to occur.
Therefore, to ensure Canada’s elimination status is
maintained, the assessment and documentation of
travel history for measles cases is vital.
2011 IN FOCUS AND HISTORICAL HIGHLIGHTS
In 2011, eight cases of measles were reported in
Ontario, representing an incidence rate of 0.06 cases
per 100,000 population (Figure 4-2). All eight cases
reported in 2011 were acquired during travel to
endemic countries or resulted from secondary spread
from an imported case.
Excluding 2008, between zero and 11 cases of measles
were reported annually in Ontario from 2002 to 2011. In
2008, an outbreak of 54 cases with links to the Ontario
Science Centre was suspected to be travel-related.
Other smaller outbreaks from 2009 to 2011 were
directly associated with travel to the United States,
Europe or South East Asia. For the rest of Canada,
annual incidence rates for measles were comparably
low, except in 2007 and 2011. Separate outbreaks in
2007 (96 cases)64 and in 2011 (776 cases)69 were
reported in Quebec.
Reportable Disease Trends in Ontario 2011 205
Figure 4-2. Incidence of Measles: Ontario and Canada, 2002-2011
Ontario Cases: MOHLTC, integrated Public Health Information System (iPHIS) database, extracted [2012/06/13]. Ontario Population: MOHLTC, intelliHEALTH Ontario, extracted [2012/10/15]. Canadian Rates: Public Health Agency of Canada, Canadian Notifiable Disease Section, received by PHO [2012/09/24]; national data available up to 2008.
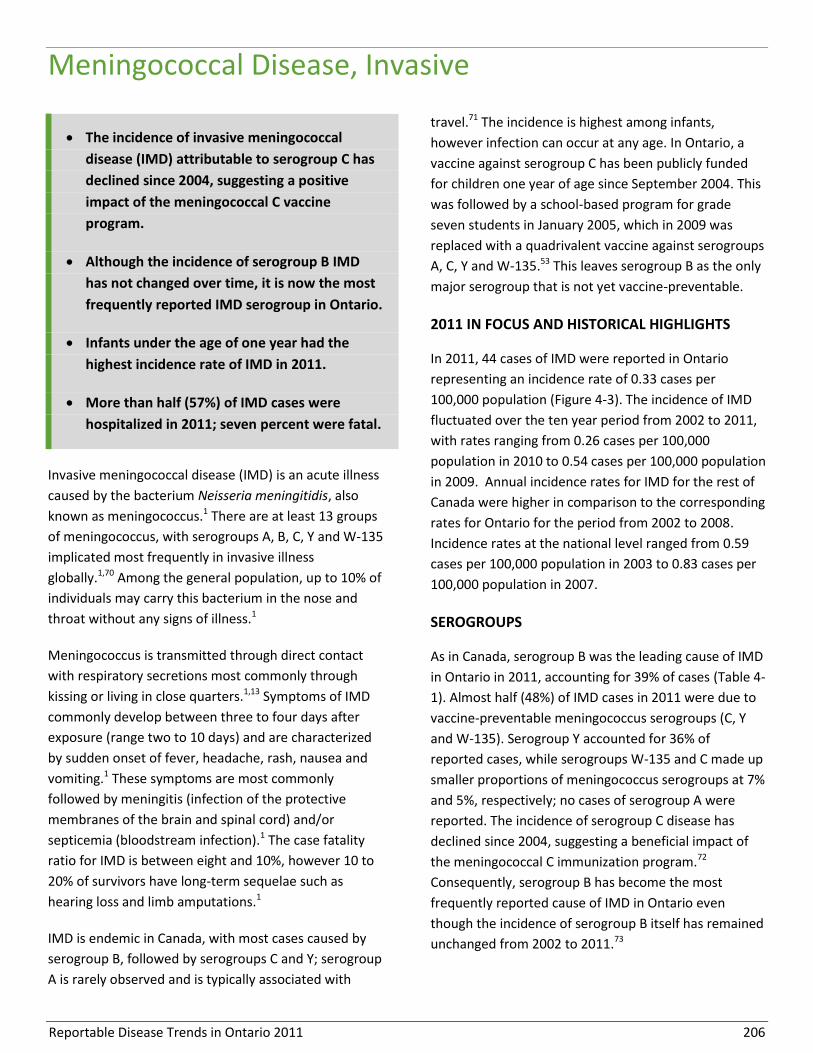
Reportable Disease Trends in Ontario 2011 206
Meningococcal Disease, Invasive
The incidence of invasive meningococcal
disease (IMD) attributable to serogroup C has
declined since 2004, suggesting a positive
impact of the meningococcal C vaccine
program.
Although the incidence of serogroup B IMD
has not changed over time, it is now the most
frequently reported IMD serogroup in Ontario.
Infants under the age of one year had the
highest incidence rate of IMD in 2011.
More than half (57%) of IMD cases were
hospitalized in 2011; seven percent were fatal.
Invasive meningococcal disease (IMD) is an acute illness
caused by the bacterium Neisseria meningitidis, also
known as meningococcus.1 There are at least 13 groups
of meningococcus, with serogroups A, B, C, Y and W-135
implicated most frequently in invasive illness
globally.1,70 Among the general population, up to 10% of
individuals may carry this bacterium in the nose and
throat without any signs of illness.1
Meningococcus is transmitted through direct contact
with respiratory secretions most commonly through
kissing or living in close quarters.1,13 Symptoms of IMD
commonly develop between three to four days after
exposure (range two to 10 days) and are characterized
by sudden onset of fever, headache, rash, nausea and
vomiting.1 These symptoms are most commonly
followed by meningitis (infection of the protective
membranes of the brain and spinal cord) and/or
septicemia (bloodstream infection).1 The case fatality
ratio for IMD is between eight and 10%, however 10 to
20% of survivors have long-term sequelae such as
hearing loss and limb amputations.1
IMD is endemic in Canada, with most cases caused by
serogroup B, followed by serogroups C and Y; serogroup
A is rarely observed and is typically associated with
travel.71 The incidence is highest among infants,
however infection can occur at any age. In Ontario, a
vaccine against serogroup C has been publicly funded
for children one year of age since September 2004. This
was followed by a school-based program for grade
seven students in January 2005, which in 2009 was
replaced with a quadrivalent vaccine against serogroups
A, C, Y and W-135.53 This leaves serogroup B as the only
major serogroup that is not yet vaccine-preventable.
2011 IN FOCUS AND HISTORICAL HIGHLIGHTS
In 2011, 44 cases of IMD were reported in Ontario
representing an incidence rate of 0.33 cases per
100,000 population (Figure 4-3). The incidence of IMD
fluctuated over the ten year period from 2002 to 2011,
with rates ranging from 0.26 cases per 100,000
population in 2010 to 0.54 cases per 100,000 population
in 2009. Annual incidence rates for IMD for the rest of
Canada were higher in comparison to the corresponding
rates for Ontario for the period from 2002 to 2008.
Incidence rates at the national level ranged from 0.59
cases per 100,000 population in 2003 to 0.83 cases per
100,000 population in 2007.
SEROGROUPS
As in Canada, serogroup B was the leading cause of IMD
in Ontario in 2011, accounting for 39% of cases (Table 4-
1). Almost half (48%) of IMD cases in 2011 were due to
vaccine-preventable meningococcus serogroups (C, Y
and W-135). Serogroup Y accounted for 36% of
reported cases, while serogroups W-135 and C made up
smaller proportions of meningococcus serogroups at 7%
and 5%, respectively; no cases of serogroup A were
reported. The incidence of serogroup C disease has
declined since 2004, suggesting a beneficial impact of
the meningococcal C immunization program.72
Consequently, serogroup B has become the most
frequently reported cause of IMD in Ontario even
though the incidence of serogroup B itself has remained
unchanged from 2002 to 2011.73
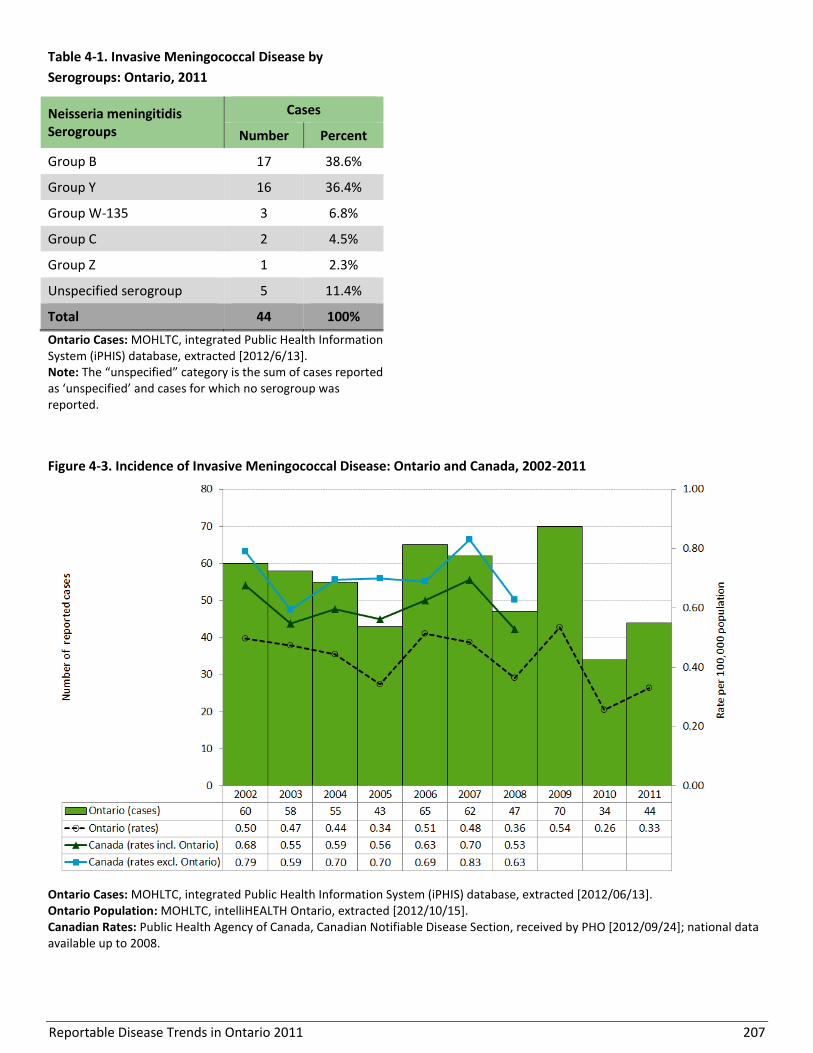
Reportable Disease Trends in Ontario 2011 207
Table 4-1. Invasive Meningococcal Disease by
Serogroups: Ontario, 2011
Neisseria meningitidis Serogroups
Cases
Number Percent
Group B 17 38.6%
Group Y 16 36.4%
Group W-135 3 6.8%
Group C 2 4.5%
Group Z 1 2.3%
Unspecified serogroup 5 11.4%
Total 44 100%
Ontario Cases: MOHLTC, integrated Public Health Information System (iPHIS) database, extracted [2012/6/13]. Note: The “unspecified” category is the sum of cases reported as ‘unspecified’ and cases for which no serogroup was reported.
Figure 4-3. Incidence of Invasive Meningococcal Disease: Ontario and Canada, 2002-2011
Ontario Cases: MOHLTC, integrated Public Health Information System (iPHIS) database, extracted [2012/06/13]. Ontario Population: MOHLTC, intelliHEALTH Ontario, extracted [2012/10/15]. Canadian Rates: Public Health Agency of Canada, Canadian Notifiable Disease Section, received by PHO [2012/09/24]; national data available up to 2008.
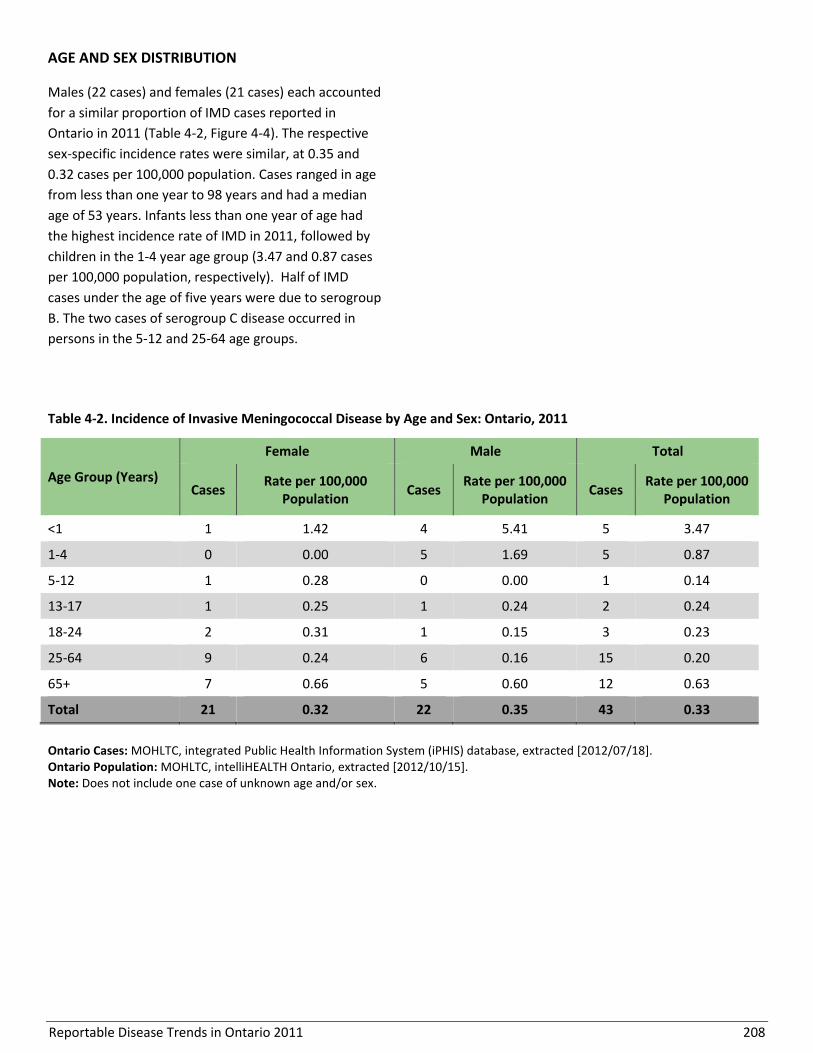
Reportable Disease Trends in Ontario 2011 208
AGE AND SEX DISTRIBUTION
Males (22 cases) and females (21 cases) each accounted
for a similar proportion of IMD cases reported in
Ontario in 2011 (Table 4-2, Figure 4-4). The respective
sex-specific incidence rates were similar, at 0.35 and
0.32 cases per 100,000 population. Cases ranged in age
from less than one year to 98 years and had a median
age of 53 years. Infants less than one year of age had
the highest incidence rate of IMD in 2011, followed by
children in the 1-4 year age group (3.47 and 0.87 cases
per 100,000 population, respectively). Half of IMD
cases under the age of five years were due to serogroup
B. The two cases of serogroup C disease occurred in
persons in the 5-12 and 25-64 age groups.
Table 4-2. Incidence of Invasive Meningococcal Disease by Age and Sex: Ontario, 2011
Age Group (Years)
Female Male Total
Cases Rate per 100,000
Population Cases
Rate per 100,000 Population
Cases Rate per 100,000
Population
<1 1 1.42 4 5.41 5 3.47
1-4 0 0.00 5 1.69 5 0.87
5-12 1 0.28 0 0.00 1 0.14
13-17 1 0.25 1 0.24 2 0.24
18-24 2 0.31 1 0.15 3 0.23
25-64 9 0.24 6 0.16 15 0.20
65+ 7 0.66 5 0.60 12 0.63
Total 21 0.32 22 0.35 43 0.33
Ontario Cases: MOHLTC, integrated Public Health Information System (iPHIS) database, extracted [2012/07/18]. Ontario Population: MOHLTC, intelliHEALTH Ontario, extracted [2012/10/15]. Note: Does not include one case of unknown age and/or sex.
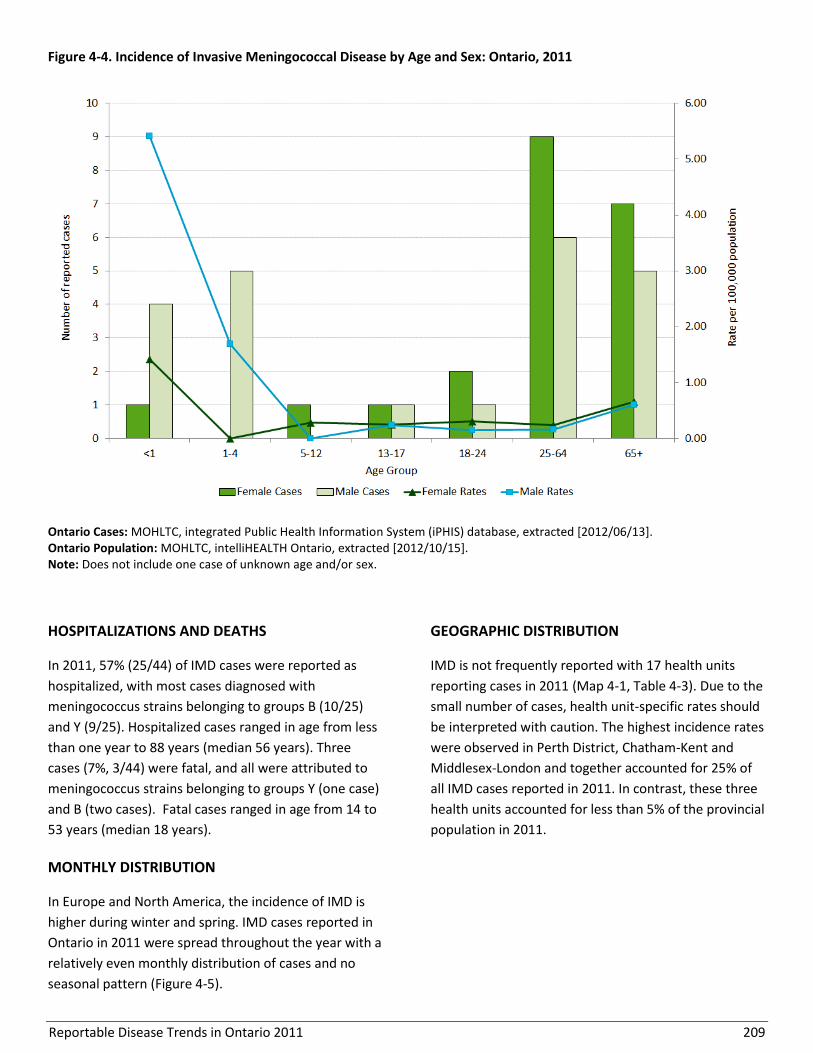
Reportable Disease Trends in Ontario 2011 209
Figure 4-4. Incidence of Invasive Meningococcal Disease by Age and Sex: Ontario, 2011
Ontario Cases: MOHLTC, integrated Public Health Information System (iPHIS) database, extracted [2012/06/13]. Ontario Population: MOHLTC, intelliHEALTH Ontario, extracted [2012/10/15]. Note: Does not include one case of unknown age and/or sex.
HOSPITALIZATIONS AND DEATHS
In 2011, 57% (25/44) of IMD cases were reported as
hospitalized, with most cases diagnosed with
meningococcus strains belonging to groups B (10/25)
and Y (9/25). Hospitalized cases ranged in age from less
than one year to 88 years (median 56 years). Three
cases (7%, 3/44) were fatal, and all were attributed to
meningococcus strains belonging to groups Y (one case)
and B (two cases). Fatal cases ranged in age from 14 to
53 years (median 18 years).
MONTHLY DISTRIBUTION
In Europe and North America, the incidence of IMD is
higher during winter and spring. IMD cases reported in
Ontario in 2011 were spread throughout the year with a
relatively even monthly distribution of cases and no
seasonal pattern (Figure 4-5).
GEOGRAPHIC DISTRIBUTION
IMD is not frequently reported with 17 health units
reporting cases in 2011 (Map 4-1, Table 4-3). Due to the
small number of cases, health unit-specific rates should
be interpreted with caution. The highest incidence rates
were observed in Perth District, Chatham-Kent and
Middlesex-London and together accounted for 25% of
all IMD cases reported in 2011. In contrast, these three
health units accounted for less than 5% of the provincial
population in 2011.
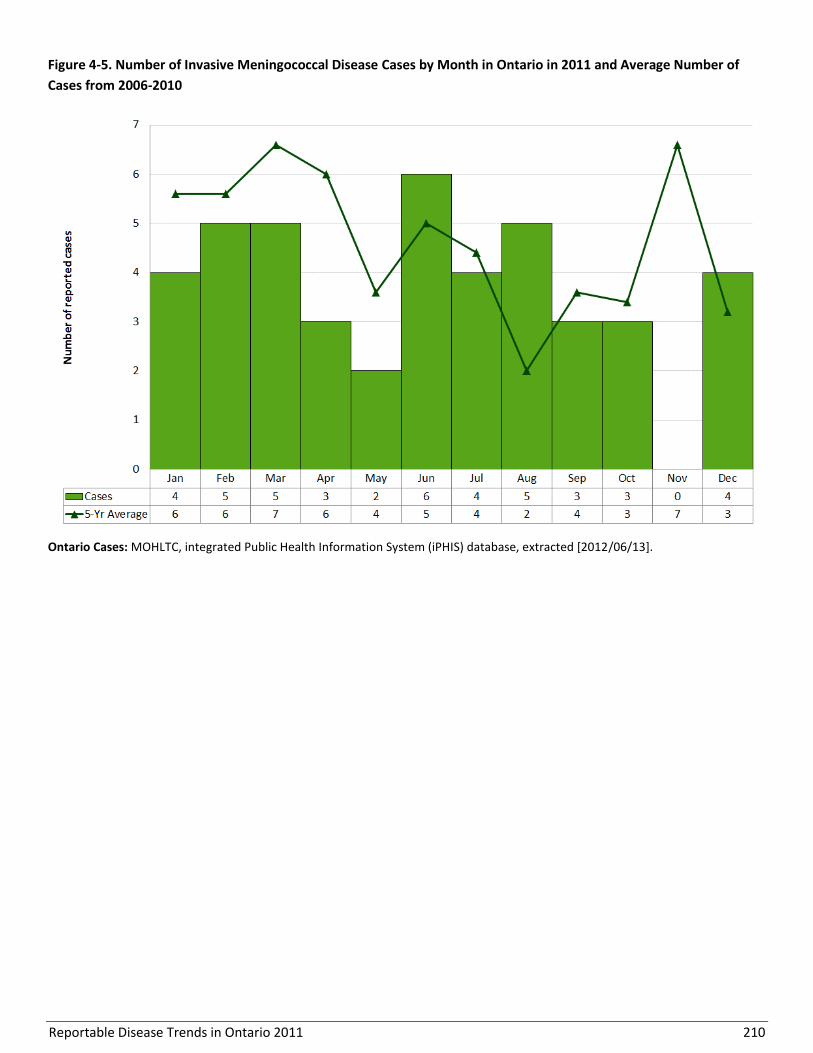
Reportable Disease Trends in Ontario 2011 210
Figure 4-5. Number of Invasive Meningococcal Disease Cases by Month in Ontario in 2011 and Average Number of
Cases from 2006-2010
Ontario Cases: MOHLTC, integrated Public Health Information System (iPHIS) database, extracted [2012/06/13].
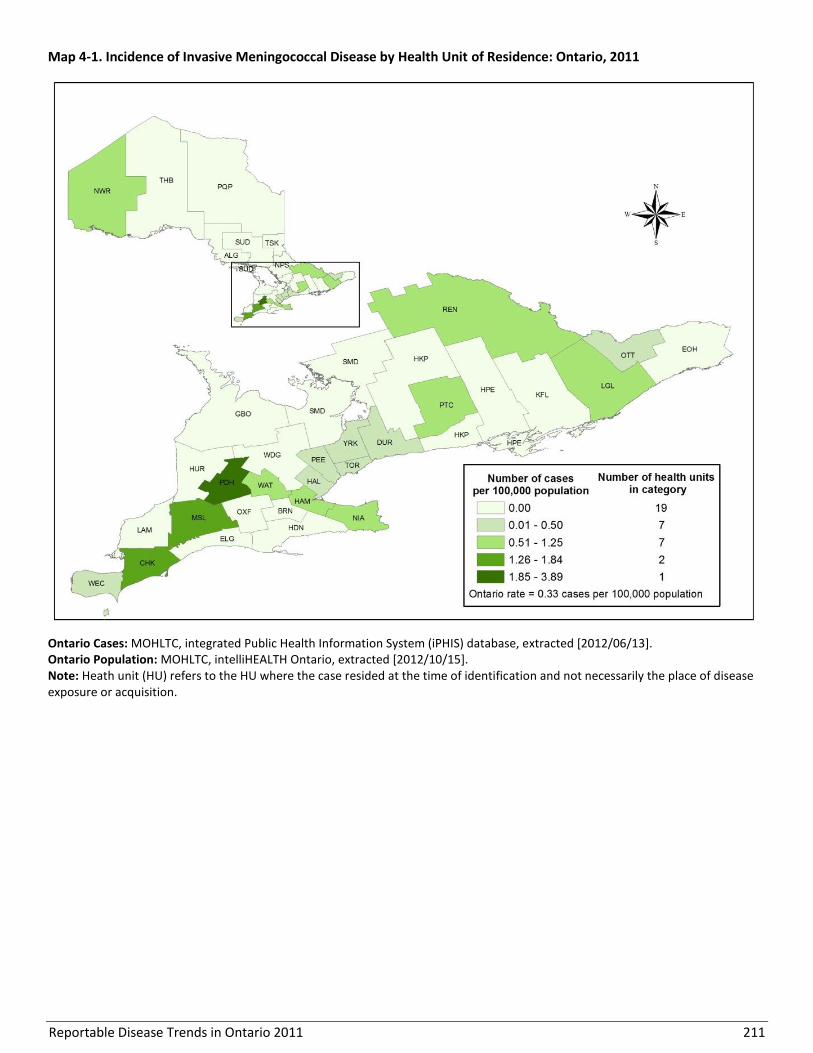
Reportable Disease Trends in Ontario 2011 211
Map 4-1. Incidence of Invasive Meningococcal Disease by Health Unit of Residence: Ontario, 2011
Ontario Cases: MOHLTC, integrated Public Health Information System (iPHIS) database, extracted [2012/06/13]. Ontario Population: MOHLTC, intelliHEALTH Ontario, extracted [2012/10/15]. Note: Heath unit (HU) refers to the HU where the case resided at the time of identification and not necessarily the place of disease exposure or acquisition.
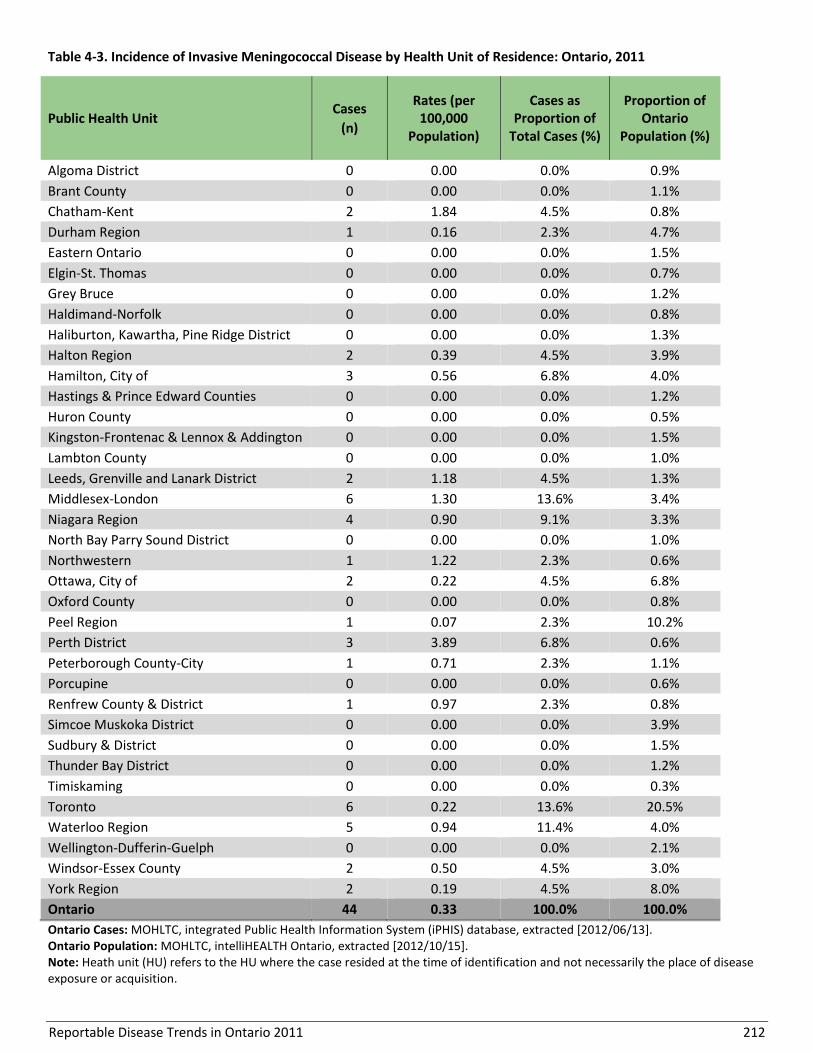
Reportable Disease Trends in Ontario 2011 212
Table 4-3. Incidence of Invasive Meningococcal Disease by Health Unit of Residence: Ontario, 2011
Public Health Unit Cases
(n)
Rates (per 100,000
Population)
Cases as Proportion of
Total Cases (%)
Proportion of Ontario
Population (%)
Algoma District 0 0.00 0.0% 0.9%
Brant County 0 0.00 0.0% 1.1%
Chatham-Kent 2 1.84 4.5% 0.8%
Durham Region 1 0.16 2.3% 4.7%
Eastern Ontario 0 0.00 0.0% 1.5%
Elgin-St. Thomas 0 0.00 0.0% 0.7%
Grey Bruce 0 0.00 0.0% 1.2%
Haldimand-Norfolk 0 0.00 0.0% 0.8%
Haliburton, Kawartha, Pine Ridge District 0 0.00 0.0% 1.3%
Halton Region 2 0.39 4.5% 3.9%
Hamilton, City of 3 0.56 6.8% 4.0%
Hastings & Prince Edward Counties 0 0.00 0.0% 1.2%
Huron County 0 0.00 0.0% 0.5%
Kingston-Frontenac & Lennox & Addington 0 0.00 0.0% 1.5%
Lambton County 0 0.00 0.0% 1.0%
Leeds, Grenville and Lanark District 2 1.18 4.5% 1.3%
Middlesex-London 6 1.30 13.6% 3.4%
Niagara Region 4 0.90 9.1% 3.3%
North Bay Parry Sound District 0 0.00 0.0% 1.0%
Northwestern 1 1.22 2.3% 0.6%
Ottawa, City of 2 0.22 4.5% 6.8%
Oxford County 0 0.00 0.0% 0.8%
Peel Region 1 0.07 2.3% 10.2%
Perth District 3 3.89 6.8% 0.6%
Peterborough County-City 1 0.71 2.3% 1.1%
Porcupine 0 0.00 0.0% 0.6%
Renfrew County & District 1 0.97 2.3% 0.8%
Simcoe Muskoka District 0 0.00 0.0% 3.9%
Sudbury & District 0 0.00 0.0% 1.5%
Thunder Bay District 0 0.00 0.0% 1.2%
Timiskaming 0 0.00 0.0% 0.3%
Toronto 6 0.22 13.6% 20.5%
Waterloo Region 5 0.94 11.4% 4.0%
Wellington-Dufferin-Guelph 0 0.00 0.0% 2.1%
Windsor-Essex County 2 0.50 4.5% 3.0%
York Region 2 0.19 4.5% 8.0%
Ontario 44 0.33 100.0% 100.0%
Ontario Cases: MOHLTC, integrated Public Health Information System (iPHIS) database, extracted [2012/06/13]. Ontario Population: MOHLTC, intelliHEALTH Ontario, extracted [2012/10/15]. Note: Heath unit (HU) refers to the HU where the case resided at the time of identification and not necessarily the place of disease exposure or acquisition.

Reportable Disease Trends in Ontario 2011 213
EXPOSURES
While 65% of IMD cases in 2011 reported an unknown
exposure, 30% reported an exposure source within their
home and 5% reported travel outside of Ontario (Figure
4-6). Reported in home exposures occurred in separate
households and were therefore not indicative of
clustering.
Figure 4-6. Reported Exposures for Invasive
Meningococcal Disease cases: Ontario, 2011 (n= 40)
Ontario Cases: MOHLTC, integrated Public Health Information System (iPHIS) database, extracted [2012/07/18]. Ontario Population: MOHLTC, intelliHEALTH Ontario, extracted [2012/10/15]. Notes: Interpret with caution. Exposures not reported for all cases. Exposure refers to the case’s most likely exposure based on self-reported exposures during the relevant incubation period.

Reportable Disease Trends in Ontario 2011 214
Mumps
The annual incidence of mumps in Ontario has
increased since 2006 with the increase mainly
driven by outbreaks.
Persons born in the susceptible cohort
between 1980 and 1992 accounted for 41% of
mumps cases reported in Ontario in 2011.
An outbreak of 39 cases of mumps occurred in
2011. The index case was traced back to an
outbreak in British Columbia.
The incidence of mumps was highest in the 20-
24 year age group in 2011, which is consistent
with the age groups most affected by the
outbreaks in Ontario.
Mumps is a viral disease that is transmitted from
person-to-person via respiratory droplets or through
direct contact with the saliva from an infected person.
The symptoms of mumps generally appear 16 to 18
days after exposure (range from 12 to 25 days) and
infected persons are most infectious from two days
before and up to five days after the onset of
symptoms.1,74,75 Infection with mumps is characterized
by fever and swelling or tenderness of one or more
salivary glands. Non-specific or primarily respiratory
symptoms occur in about 40% to 50% of those infected.
Immunity following infection is generally life-long1.
Vaccination with two doses of mumps-containing
vaccine is the most effective method of preventing
infection.74,75 In Canada, the incidence of mumps
declined following the introduction of the mumps
vaccine in 1969, with further reductions following the
1996 introduction of the two-dose vaccination
program.74 In countries with high vaccination coverage
such as Canada, sporadic cases of mumps occur
throughout the year with peaks in incidence attributed
to outbreaks. In general, people who have not had
mumps infection or who have not been vaccinated with
two doses of mumps containing vaccine are susceptible
to infection.74 In Ontario, this cohort includes persons
born between 1980 and approximately 1992 who
received only one dose of mumps-containing vaccine
and were less likely to be exposed to wild virus.76
2011 IN FOCUS AND HISTORICAL HIGHLIGHTS
In 2011, 83 confirmed and probable cases of mumps
were reported in Ontario, representing an incidence
rate of 0.62 cases per 100,000 population. From 2002 to
2006, the number of reported cases was relatively low,
with an average of 16 cases per year. Annual incidence
rates during this period ranged from 0.08 to 0.19 cases
per 100,000 population (Figure 4-7). From 2007 to 2011,
several large outbreaks occurred in Ontario, some of
which were linked to outbreaks in other Canadian
jurisdictions. This resulted in a substantial increase in
the provincial incidence rate between 2006 and 2011.
From 2007 to 2011, 84% of cases were associated with
outbreaks that occurred in either under-immunized,
religious communities, or other susceptible populations,
including students in the susceptible cohort with a
predominance of males, as well as individuals who
travelled outside of Ontario. In 2011, almost half (38
cases) of reported cases were linked to an outbreak, of
which 63% were male and the overall median age was
29 years. This outbreak was traced back to Vancouver,
British Columbia.
In Canada, between 2000 and 2006, an average of 81
cases were reported annually, ranging from 28 (2003) to
201 cases (2002). In 2007 there were over 1,000 cases
and in 2008 there were almost 750 reported cases,
mainly as a result of outbreaks in several provinces,
including Ontario.75

Reportable Disease Trends in Ontario 2011 215
AGE AND SEX DISTRIBUTION
In 2011, mumps cases ranged in age from less than one
to 61 years, with a median age of 29 years; males
accounted for 58% of all cases reported in 2011. The
incidence of mumps was also higher among males
compared to females at 0.73 and 0.52 cases per
100,000 population, respectively. The age-specific
incidence rate of mumps was highest in the 20-24 year
age group with 2.32 cases per 100,000 population
(Table 4-4, Figure 4-8).
Persons born in the susceptible cohort from 1980 to
1992 (i.e. aged 19 to 31 years) accounted for 41% (34
cases) of mumps cases reported in 2011, whereas
children under the age of 15 years accounted for 11%
(9) of cases in 2011. In comparison, these age cohorts
comprised 18% and 17% of the Ontario population in
2011, respectively. No cases were reported among
persons 65 years of age and older.
Figure 4-7. Reported cases and Incidence of Mumps: Ontario and Canada, 2002-2011
Ontario Cases: MOHLTC, integrated Public Health Information System (iPHIS) database, extracted [2012/06/13]; probable cases included as of 2009. Ontario Population: MOHLTC, intelliHEALTH Ontario, extracted [2012/10/15]. Canadian Rates: Public Health Agency of Canada, Canadian Notifiable Disease Section, received by PHO [2012/09/24]; national data available up to 2008 and include only confirmed cases.
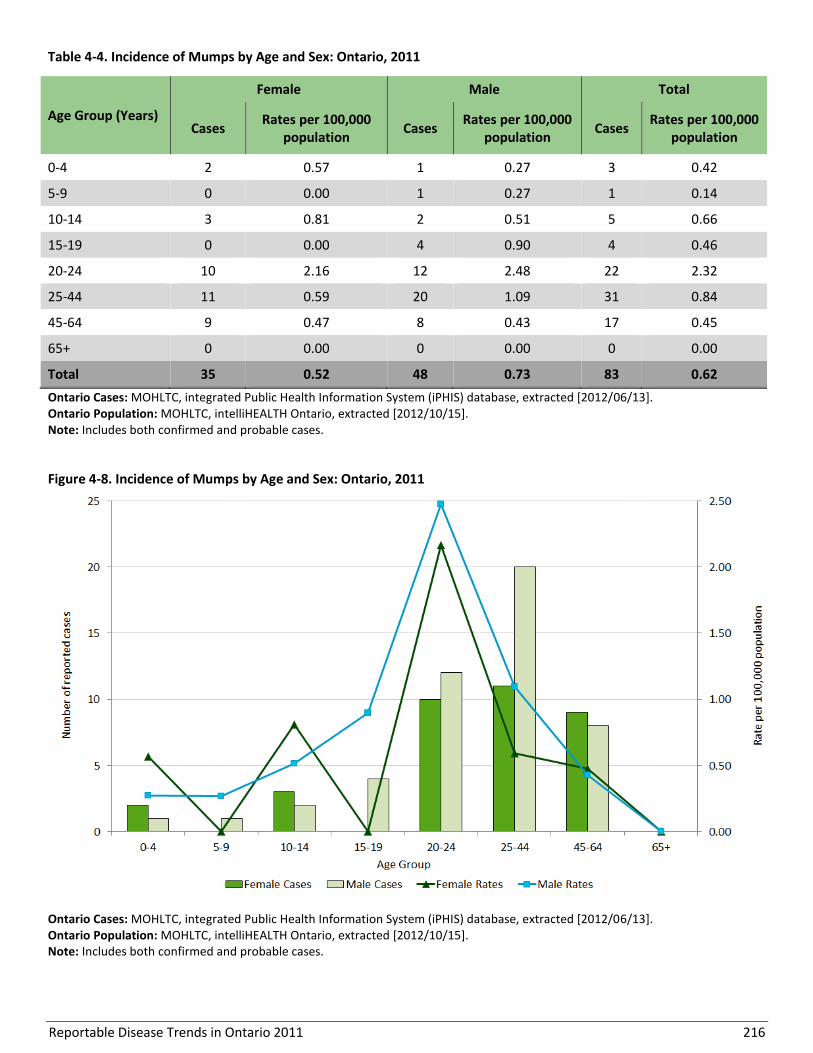
Reportable Disease Trends in Ontario 2011 216
Table 4-4. Incidence of Mumps by Age and Sex: Ontario, 2011
Age Group (Years)
Female Male Total
Cases Rates per 100,000
population Cases
Rates per 100,000 population
Cases Rates per 100,000
population
0-4 2 0.57 1 0.27 3 0.42
5-9 0 0.00 1 0.27 1 0.14
10-14 3 0.81 2 0.51 5 0.66
15-19 0 0.00 4 0.90 4 0.46
20-24 10 2.16 12 2.48 22 2.32
25-44 11 0.59 20 1.09 31 0.84
45-64 9 0.47 8 0.43 17 0.45
65+ 0 0.00 0 0.00 0 0.00
Total 35 0.52 48 0.73 83 0.62
Ontario Cases: MOHLTC, integrated Public Health Information System (iPHIS) database, extracted [2012/06/13]. Ontario Population: MOHLTC, intelliHEALTH Ontario, extracted [2012/10/15]. Note: Includes both confirmed and probable cases.
Figure 4-8. Incidence of Mumps by Age and Sex: Ontario, 2011
Ontario Cases: MOHLTC, integrated Public Health Information System (iPHIS) database, extracted [2012/06/13]. Ontario Population: MOHLTC, intelliHEALTH Ontario, extracted [2012/10/15]. Note: Includes both confirmed and probable cases.
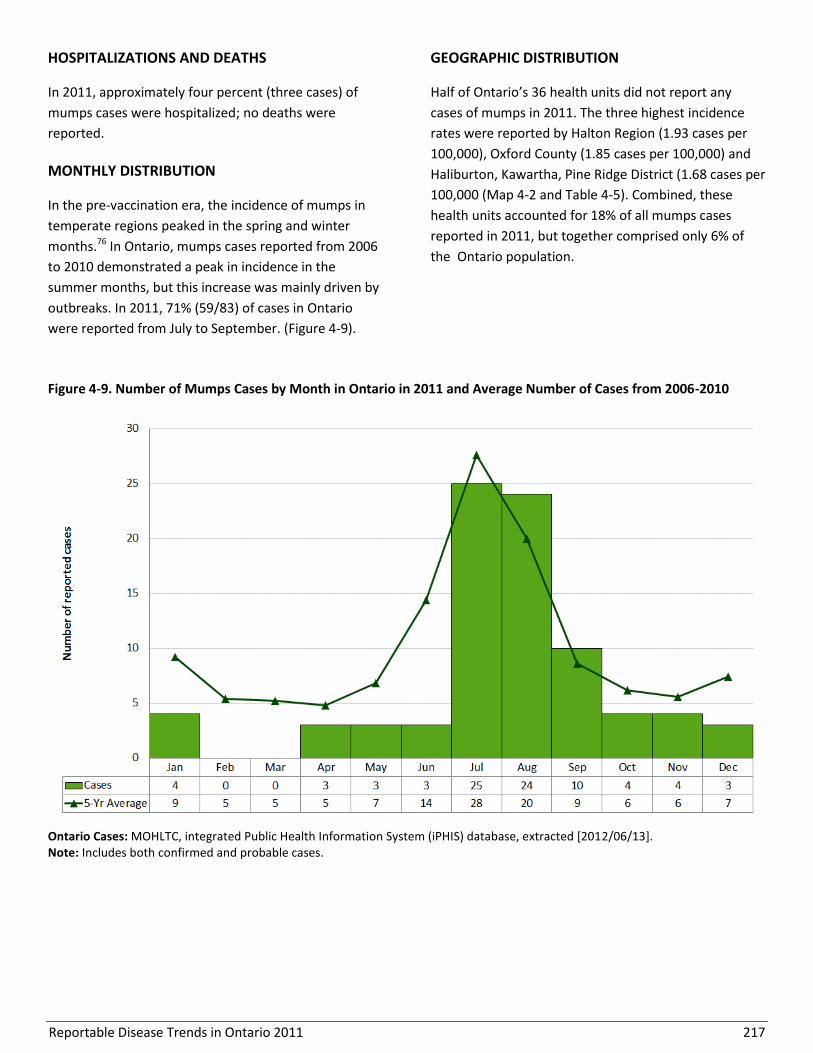
Reportable Disease Trends in Ontario 2011 217
HOSPITALIZATIONS AND DEATHS
In 2011, approximately four percent (three cases) of
mumps cases were hospitalized; no deaths were
reported.
MONTHLY DISTRIBUTION
In the pre-vaccination era, the incidence of mumps in
temperate regions peaked in the spring and winter
months.76 In Ontario, mumps cases reported from 2006
to 2010 demonstrated a peak in incidence in the
summer months, but this increase was mainly driven by
outbreaks. In 2011, 71% (59/83) of cases in Ontario
were reported from July to September. (Figure 4-9).
GEOGRAPHIC DISTRIBUTION
Half of Ontario’s 36 health units did not report any
cases of mumps in 2011. The three highest incidence
rates were reported by Halton Region (1.93 cases per
100,000), Oxford County (1.85 cases per 100,000) and
Haliburton, Kawartha, Pine Ridge District (1.68 cases per
100,000 (Map 4-2 and Table 4-5). Combined, these
health units accounted for 18% of all mumps cases
reported in 2011, but together comprised only 6% of
the Ontario population.
Figure 4-9. Number of Mumps Cases by Month in Ontario in 2011 and Average Number of Cases from 2006-2010
Ontario Cases: MOHLTC, integrated Public Health Information System (iPHIS) database, extracted [2012/06/13]. Note: Includes both confirmed and probable cases.

Reportable Disease Trends in Ontario 2011 218
Map 4-2. Incidence of Mumps by Health Unit of Residence: Ontario, 2011
Ontario Cases: MOHLTC, integrated Public Health Information System (iPHIS) database, extracted [2012/06/13]. Ontario Population: MOHLTC, intelliHEALTH Ontario, extracted [2012/10/15]. Note: Heath unit (HU) refers to the HU where the case resided at the time of identification and not necessarily the place of disease exposure or acquisition; includes both confirmed and probable cases.

Reportable Disease Trends in Ontario 2011 219
Table 4-5. Incidence of Mumps by Health Unit of Residence: Ontario, 2011
Public Health Unit Cases
(n)
Rate (per 100,000 Population)
Cases as Proportion of
Total Cases (%)
Proportion of Ontario
Population (%)
Algoma District 0 0.00 0.0% 0.9%
Brant County 2 1.42 2.4% 1.1%
Chatham-Kent 1 0.92 1.2% 0.8%
Durham Region 7 1.11 8.4% 4.7%
Eastern Ontario 1 0.50 1.2% 1.5%
Elgin-St. Thomas 0 0.00 0.0% 0.7%
Grey Bruce 0 0.00 0.0% 1.2%
Haldimand-Norfolk 1 0.90 1.2% 0.8%
Haliburton, Kawartha, Pine Ridge District 3 1.68 3.6% 1.3%
Halton Region 10 1.93 12.0% 3.9%
Hamilton, City of 3 0.56 3.6% 4.0%
Hastings & Prince Edward Counties 0 0.00 0.0% 1.2%
Huron County 0 0.00 0.0% 0.5%
Kingston-Frontenac & Lennox & Addington 0 0.00 0.0% 1.5%
Lambton County 0 0.00 0.0% 1.0%
Leeds, Grenville and Lanark District 0 0.00 0.0% 1.3%
Middlesex-London 5 1.08 6.0% 3.4%
Niagara Region 2 0.45 2.4% 3.3%
North Bay Parry Sound District 0 0.00 0.0% 1.0%
Northwestern 1 1.22 1.2% 0.6%
Ottawa, City of 4 0.44 4.8% 6.8%
Oxford County 2 1.85 2.4% 0.8%
Peel Region 9 0.66 10.8% 10.2%
Perth District 0 0.00 0.0% 0.6%
Peterborough County-City 0 0.00 0.0% 1.1%
Porcupine 0 0.00 0.0% 0.6%
Renfrew County & District 0 0.00 0.0% 0.8%
Simcoe Muskoka District 0 0.00 0.0% 3.9%
Sudbury & District 1 0.51 1.2% 1.5%
Thunder Bay District 0 0.00 0.0% 1.2%
Timiskaming 0 0.00 0.0% 0.3%
Toronto 24 0.87 28.9% 20.5%
Waterloo Region 4 0.75 4.8% 4.0%
Wellington-Dufferin-Guelph 0 0.00 0.0% 2.1%
Windsor-Essex County 0 0.00 0.0% 3.0%
York Region 3 0.28 3.6% 8.0%
Ontario 83 0.62 100.0% 100.0%
Ontario Cases: MOHLTC, integrated Public Health Information System (iPHIS) database, extracted [2012/06/13]. Ontario Population: MOHLTC, intelliHEALTH Ontario, extracted [2012/10/15]. Note: Heath unit (HU) refers to the HU where the case resided at the time of identification and not necessarily the place of disease exposure or acquisition; includes both confirmed and probable cases.
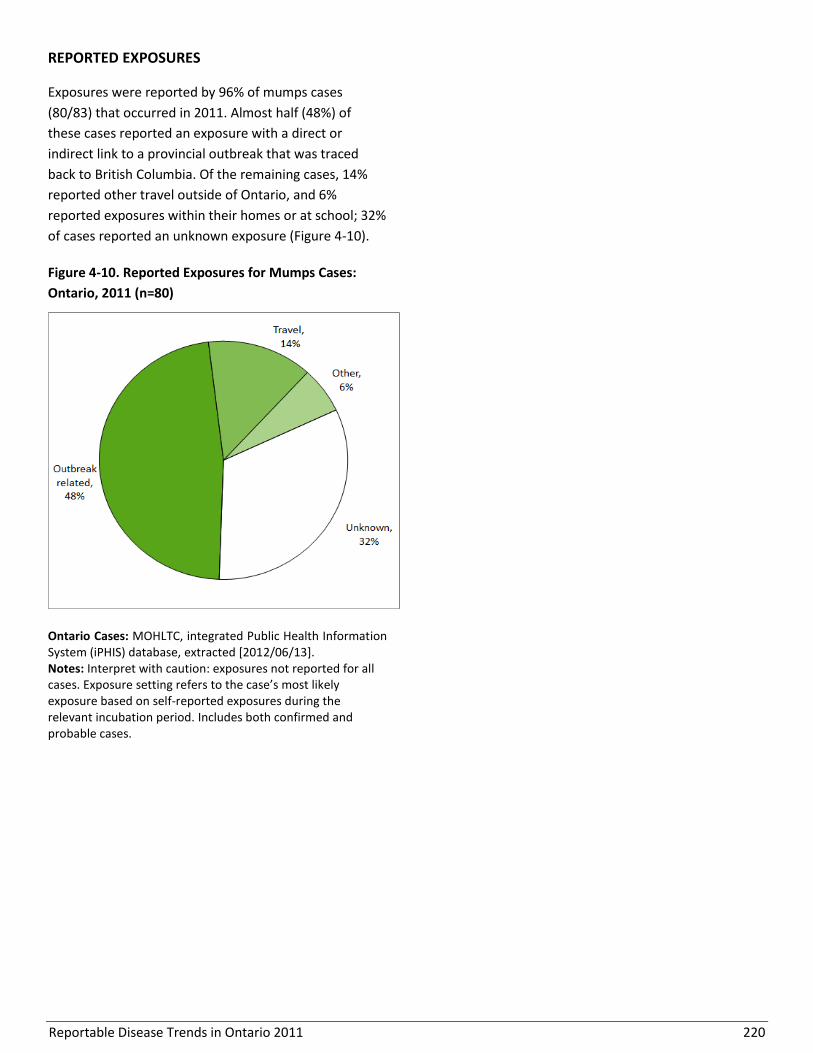
Reportable Disease Trends in Ontario 2011 220
REPORTED EXPOSURES
Exposures were reported by 96% of mumps cases
(80/83) that occurred in 2011. Almost half (48%) of
these cases reported an exposure with a direct or
indirect link to a provincial outbreak that was traced
back to British Columbia. Of the remaining cases, 14%
reported other travel outside of Ontario, and 6%
reported exposures within their homes or at school; 32%
of cases reported an unknown exposure (Figure 4-10).
Figure 4-10. Reported Exposures for Mumps Cases:
Ontario, 2011 (n=80)
Ontario Cases: MOHLTC, integrated Public Health Information System (iPHIS) database, extracted [2012/06/13]. Notes: Interpret with caution: exposures not reported for all cases. Exposure setting refers to the case’s most likely exposure based on self-reported exposures during the relevant incubation period. Includes both confirmed and probable cases.

Reportable Disease Trends in Ontario 2011 221
Pertussis
The incidence of pertussis in Ontario from
2002 to 2011 demonstrated a cyclical pattern
with a notable peak in incidence in 2006.
The incidence rate of pertussis was highest
among infants and children under the age of
five years.
In 2011 the incidence of pertussis peaked in
December due to an outbreak which began in
an under-immunized religious community.
Pertussis (whooping cough) is an acute infection of the
respiratory tract caused by the bacterium Bordetella
pertussis.1 Humans are the only reservoir for the
disease, with transmission occurring through direct
contact with respiratory droplets expelled during
coughs and sneezes.13 Symptoms of pertussis usually
begin within nine or ten days of exposure (range six to
20 days) as a mild respiratory illness that progresses to
prolonged cough episodes which can end with vomiting
and the characteristic whoop.1 Symptoms vary with age
and young infants, adolescents and adults are less likely
to have the classic symptoms of pertussis,1,13 which
often leads to under-diagnosis of the disease.77
Complications of pertussis, including pneumonia,
seizures and death, occur most frequently in infants too
young to have begun or completed their primary
immunization series.1
Susceptibility to pertussis is universal with vaccination
being the primary method of prevention. Under the
publicly funded immunization program in Ontario,
pertussis vaccine is administered in combination with
vaccines against diphtheria, tetanus, Haemophilus
influenzae type b and polio. These vaccines are
administered at two, four and six months of age, with
additional boosters at 18 months, four to six years and
14 to 16 years.53 In 2011, a booster dose was introduced
for adults under 65 years of age who did not receive an
adolescent dose of the vaccine.
2011 IN FOCUS AND HISTORICAL HIGHLIGHTS
In 2011, 276 confirmed and probable cases of pertussis
were reported in Ontario for an overall incidence rate of
2.06 cases per 100,000 population. The number of cases
reported in 2011 represented a 130% increase over the
2010 count of 120 cases (Figure 4-11). The increase in
2011 can be attributed in part to two provincial
outbreaks in south-western Ontario that mainly
affected the same under-immunized religious
community.
Pertussis occurs in cycles with peaks in incidence
occurring every four to five years.78 The incidence of
pertussis in Ontario over the ten-year period from 2002
to 2011 demonstrated this cyclical pattern with a
notable peak in incidence from 2006 to 2008. During
this period of increased incidence, annual rates of
pertussis ranged from 6.42 to 9.96 cases per 100,000
population. While the cyclical nature influences trends
in pertussis, changes related to the provincial
immunization program, laboratory techniques (e.g.
available diagnostic tests and interpretations) and
disease reporting practices may have also had an impact
on the incidence of pertussis.
Annual incidence rates for pertussis in Ontario were
substantially lower than the corresponding national
rates for the period from 2002 to 2005, which coincided
with a cyclical dip in cases in Ontario. On the other
hand, national rates for pertussis were lower during
Ontario’s period of increased incidence from 2006 to
2008.

Reportable Disease Trends in Ontario 2011 222
AGE AND SEX DISTRIBUTION
Although there is typically a slight female predominance
for pertussis79, cases were equally distributed among
males and females reported in Ontario in 2011. The sex-
specific incidence rates for males and females were 2.06
and 2.01 cases per 100,000 population, respectively
(Table 4-6, Figure 4-12). Cases ranged in age from less
than one year to 84 years and had a median age of six
years. Incidence rates for pertussis decreased sharply
with increasing age for both males and females. Infants
(less than one year) and young children in the 1-4 age
group experienced the highest rates of pertussis.
Combined, they accounted for 46% of pertussis cases
reported in 2011. Higher incidence rates in these age
groups, particularly among infants, are expected as
children in these age groups are too young to have
begun or completed their primary series of
immunizations against pertussis.
Figure 4-11. Incidence of Pertussis: Ontario and Canada, 2002-2011
Ontario Cases: MOHLTC, integrated Public Health Information System (iPHIS) database, extracted [2012/06/13]; probable cases included as of 2009. Ontario Population: MOHLTC, intelliHEALTH Ontario, extracted [2012/10/15]. Canadian Rates: Public Health Agency of Canada, Canadian Notifiable Disease Section, received by PHO [2012/09/24]; national data available up to 2008.
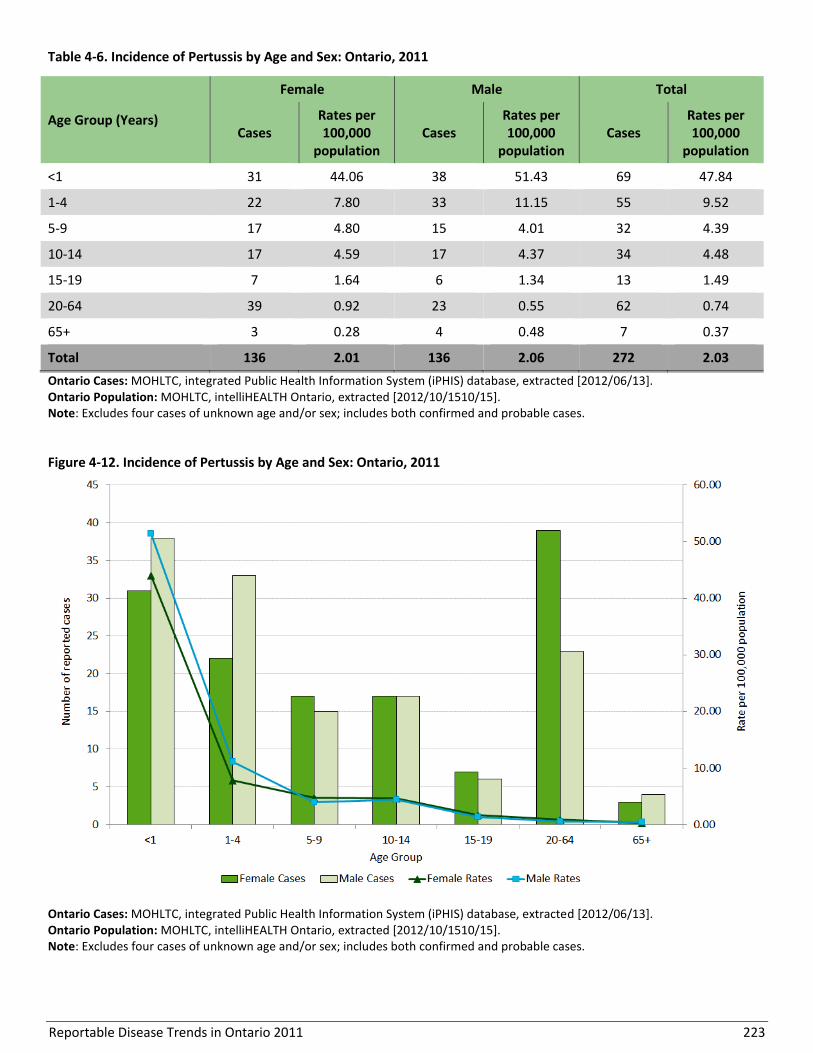
Reportable Disease Trends in Ontario 2011 223
Table 4-6. Incidence of Pertussis by Age and Sex: Ontario, 2011
Age Group (Years)
Female Male Total
Cases Rates per 100,000
population Cases
Rates per 100,000
population Cases
Rates per 100,000
population
<1 31 44.06 38 51.43 69 47.84
1-4 22 7.80 33 11.15 55 9.52
5-9 17 4.80 15 4.01 32 4.39
10-14 17 4.59 17 4.37 34 4.48
15-19 7 1.64 6 1.34 13 1.49
20-64 39 0.92 23 0.55 62 0.74
65+ 3 0.28 4 0.48 7 0.37
Total 136 2.01 136 2.06 272 2.03
Ontario Cases: MOHLTC, integrated Public Health Information System (iPHIS) database, extracted [2012/06/13]. Ontario Population: MOHLTC, intelliHEALTH Ontario, extracted [2012/10/1510/15]. Note: Excludes four cases of unknown age and/or sex; includes both confirmed and probable cases.
Figure 4-12. Incidence of Pertussis by Age and Sex: Ontario, 2011
Ontario Cases: MOHLTC, integrated Public Health Information System (iPHIS) database, extracted [2012/06/13]. Ontario Population: MOHLTC, intelliHEALTH Ontario, extracted [2012/10/1510/15]. Note: Excludes four cases of unknown age and/or sex; includes both confirmed and probable cases.
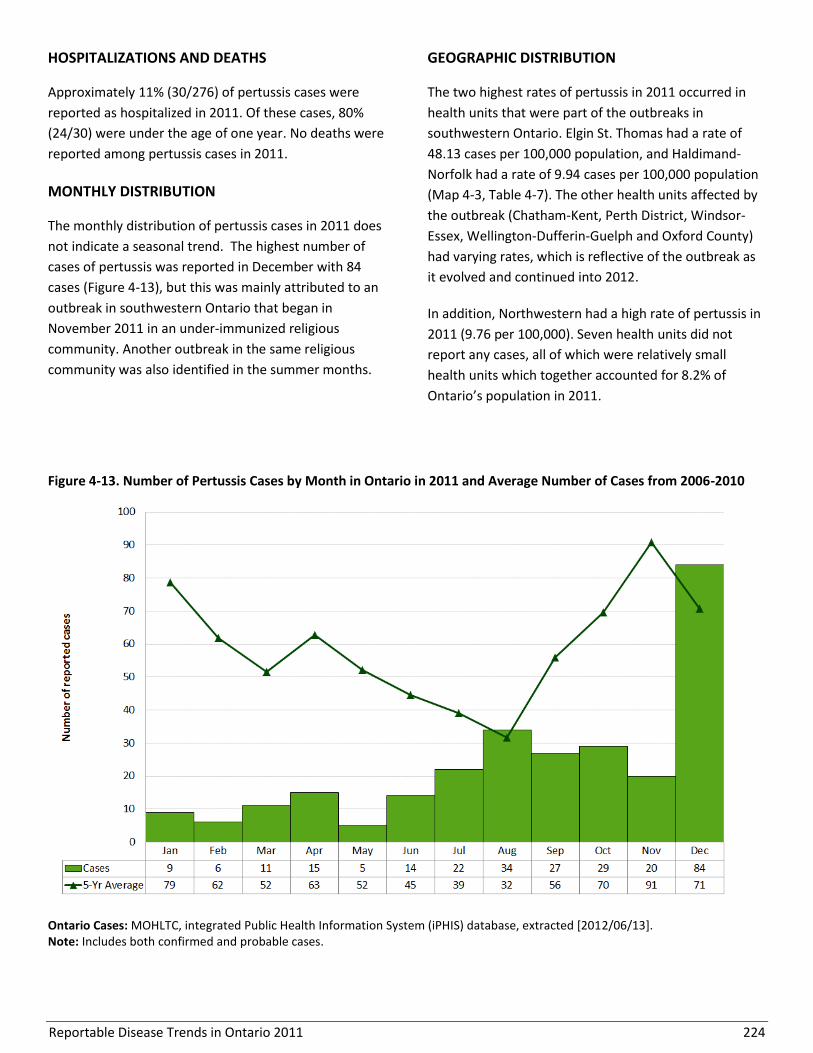
Reportable Disease Trends in Ontario 2011 224
HOSPITALIZATIONS AND DEATHS
Approximately 11% (30/276) of pertussis cases were
reported as hospitalized in 2011. Of these cases, 80%
(24/30) were under the age of one year. No deaths were
reported among pertussis cases in 2011.
MONTHLY DISTRIBUTION
The monthly distribution of pertussis cases in 2011 does
not indicate a seasonal trend. The highest number of
cases of pertussis was reported in December with 84
cases (Figure 4-13), but this was mainly attributed to an
outbreak in southwestern Ontario that began in
November 2011 in an under-immunized religious
community. Another outbreak in the same religious
community was also identified in the summer months.
GEOGRAPHIC DISTRIBUTION
The two highest rates of pertussis in 2011 occurred in
health units that were part of the outbreaks in
southwestern Ontario. Elgin St. Thomas had a rate of
48.13 cases per 100,000 population, and Haldimand-
Norfolk had a rate of 9.94 cases per 100,000 population
(Map 4-3, Table 4-7). The other health units affected by
the outbreak (Chatham-Kent, Perth District, Windsor-
Essex, Wellington-Dufferin-Guelph and Oxford County)
had varying rates, which is reflective of the outbreak as
it evolved and continued into 2012.
In addition, Northwestern had a high rate of pertussis in
2011 (9.76 per 100,000). Seven health units did not
report any cases, all of which were relatively small
health units which together accounted for 8.2% of
Ontario’s population in 2011.
Figure 4-13. Number of Pertussis Cases by Month in Ontario in 2011 and Average Number of Cases from 2006-2010
Ontario Cases: MOHLTC, integrated Public Health Information System (iPHIS) database, extracted [2012/06/13]. Note: Includes both confirmed and probable cases.

Reportable Disease Trends in Ontario 2011 225
Map 4-3. Incidence of Pertussis by Health Unit of Residence: Ontario, 2011
Ontario Cases: MOHLTC, integrated Public Health Information System (iPHIS) database, extracted [2012/06/13]. Ontario Population: MOHLTC, intelliHEALTH Ontario, extracted [2012/10/15]. Note: Heath unit (HU) refers to the HU where the case resided at the time of identification and not necessarily the place of disease exposure or acquisition; includes both confirmed and probable cases.
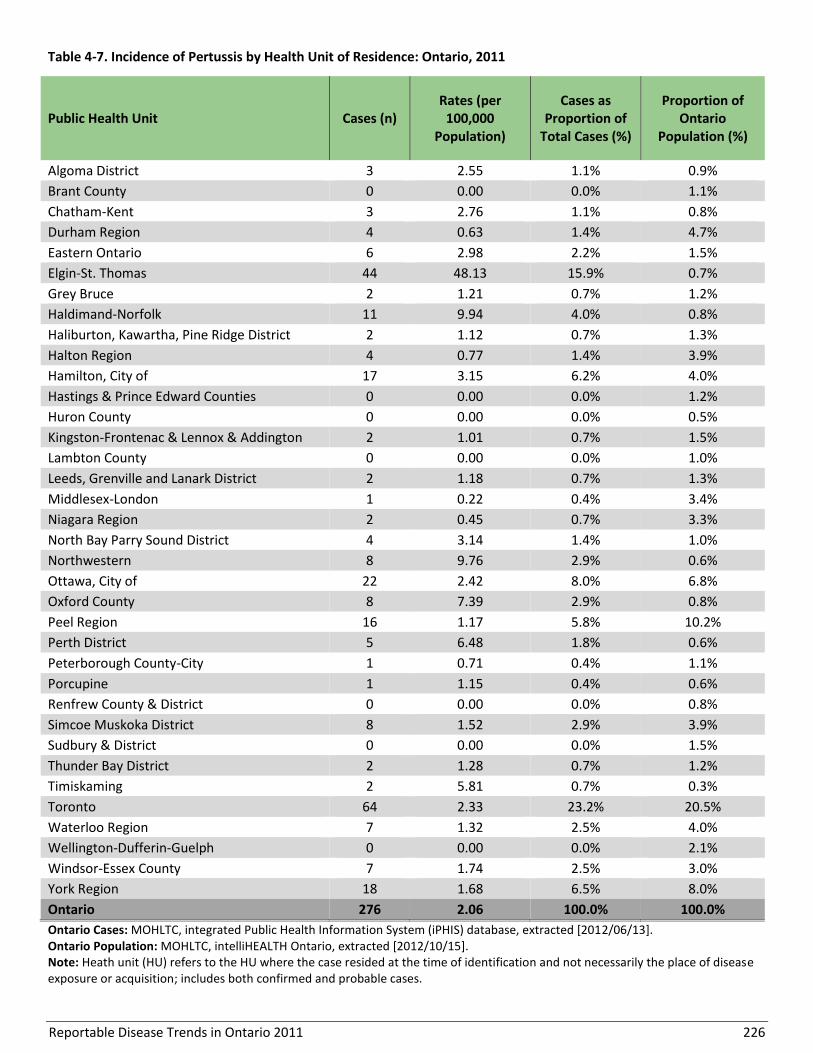
Reportable Disease Trends in Ontario 2011 226
Table 4-7. Incidence of Pertussis by Health Unit of Residence: Ontario, 2011
Public Health Unit Cases (n) Rates (per
100,000 Population)
Cases as Proportion of
Total Cases (%)
Proportion of Ontario
Population (%)
Algoma District 3 2.55 1.1% 0.9%
Brant County 0 0.00 0.0% 1.1%
Chatham-Kent 3 2.76 1.1% 0.8%
Durham Region 4 0.63 1.4% 4.7%
Eastern Ontario 6 2.98 2.2% 1.5%
Elgin-St. Thomas 44 48.13 15.9% 0.7%
Grey Bruce 2 1.21 0.7% 1.2%
Haldimand-Norfolk 11 9.94 4.0% 0.8%
Haliburton, Kawartha, Pine Ridge District 2 1.12 0.7% 1.3%
Halton Region 4 0.77 1.4% 3.9%
Hamilton, City of 17 3.15 6.2% 4.0%
Hastings & Prince Edward Counties 0 0.00 0.0% 1.2%
Huron County 0 0.00 0.0% 0.5%
Kingston-Frontenac & Lennox & Addington 2 1.01 0.7% 1.5%
Lambton County 0 0.00 0.0% 1.0%
Leeds, Grenville and Lanark District 2 1.18 0.7% 1.3%
Middlesex-London 1 0.22 0.4% 3.4%
Niagara Region 2 0.45 0.7% 3.3%
North Bay Parry Sound District 4 3.14 1.4% 1.0%
Northwestern 8 9.76 2.9% 0.6%
Ottawa, City of 22 2.42 8.0% 6.8%
Oxford County 8 7.39 2.9% 0.8%
Peel Region 16 1.17 5.8% 10.2%
Perth District 5 6.48 1.8% 0.6%
Peterborough County-City 1 0.71 0.4% 1.1%
Porcupine 1 1.15 0.4% 0.6%
Renfrew County & District 0 0.00 0.0% 0.8%
Simcoe Muskoka District 8 1.52 2.9% 3.9%
Sudbury & District 0 0.00 0.0% 1.5%
Thunder Bay District 2 1.28 0.7% 1.2%
Timiskaming 2 5.81 0.7% 0.3%
Toronto 64 2.33 23.2% 20.5%
Waterloo Region 7 1.32 2.5% 4.0%
Wellington-Dufferin-Guelph 0 0.00 0.0% 2.1%
Windsor-Essex County 7 1.74 2.5% 3.0%
York Region 18 1.68 6.5% 8.0%
Ontario 276 2.06 100.0% 100.0%
Ontario Cases: MOHLTC, integrated Public Health Information System (iPHIS) database, extracted [2012/06/13]. Ontario Population: MOHLTC, intelliHEALTH Ontario, extracted [2012/10/15]. Note: Heath unit (HU) refers to the HU where the case resided at the time of identification and not necessarily the place of disease exposure or acquisition; includes both confirmed and probable cases.
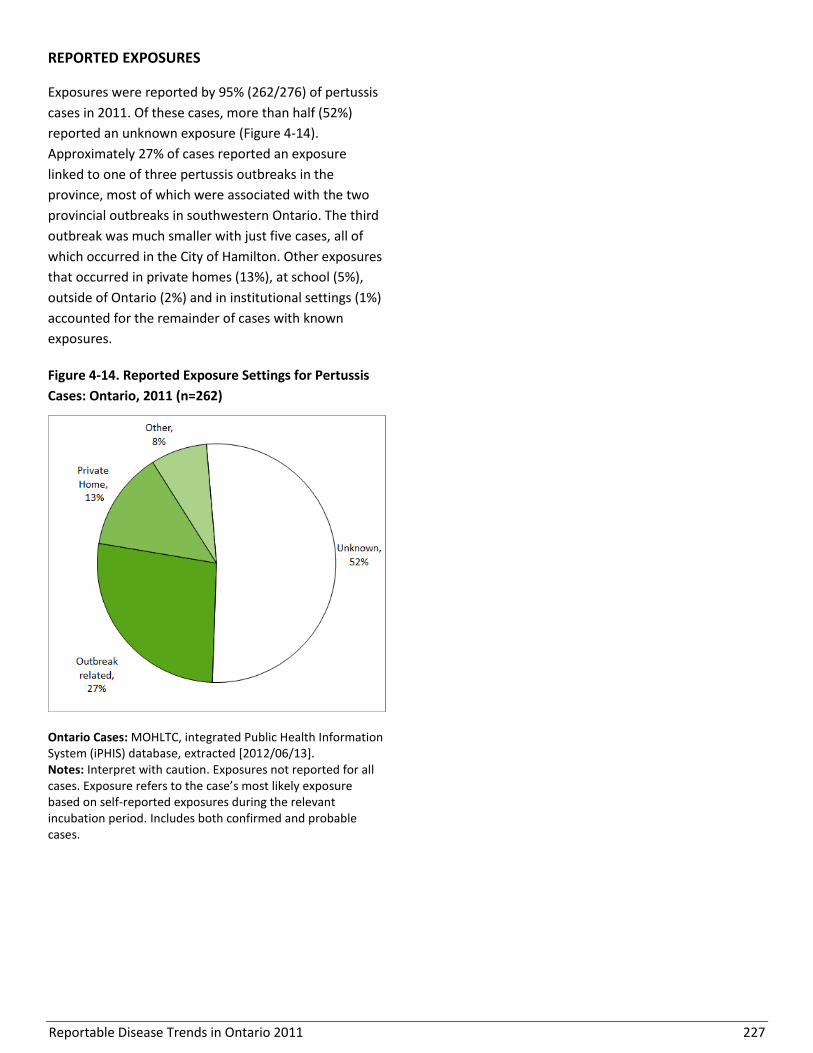
Reportable Disease Trends in Ontario 2011 227
REPORTED EXPOSURES
Exposures were reported by 95% (262/276) of pertussis
cases in 2011. Of these cases, more than half (52%)
reported an unknown exposure (Figure 4-14).
Approximately 27% of cases reported an exposure
linked to one of three pertussis outbreaks in the
province, most of which were associated with the two
provincial outbreaks in southwestern Ontario. The third
outbreak was much smaller with just five cases, all of
which occurred in the City of Hamilton. Other exposures
that occurred in private homes (13%), at school (5%),
outside of Ontario (2%) and in institutional settings (1%)
accounted for the remainder of cases with known
exposures.
Figure 4-14. Reported Exposure Settings for Pertussis
Cases: Ontario, 2011 (n=262)
Ontario Cases: MOHLTC, integrated Public Health Information System (iPHIS) database, extracted [2012/06/13]. Notes: Interpret with caution. Exposures not reported for all cases. Exposure refers to the case’s most likely exposure based on self-reported exposures during the relevant incubation period. Includes both confirmed and probable cases.

Reportable Disease Trends in Ontario 2011 228
Invasive Pneumococcal Disease
Invasive pneumococcal disease (IPD) is
relatively common in Ontario, with a non-
significant increase in overall incidence
between 2003 and 2011.
The highest incidence rates occurred in adults
65 years and older, followed by young children
under the age of five and adults aged 50-64
years.
Case fatality ratios increased with age in
adults, and was 7% among persons 65 years of
age and older.
Invasive pneumococcal disease (IPD) is a leading cause
of serious illness in children and adults worldwide. It is
caused by the bacterium Streptococcus pneumoniae,80,1
which has more than 90 serotypes, some of which are
vaccine-preventable. S. pneumoniae is transmitted
directly or indirectly through contact with respiratory
secretions from infected or colonized persons.80,1
Symptoms of IPD can manifest within one to three days
of exposure, although the incubation period is not well
defined.80 The spectrum of illness includes pneumonia
with bacteremia (bloodstream infection), bacteremia,
and/or meningitis (infection of the protective
membranes of the brain and spinal cord). Invasive
disease occurs most frequently in the very young, the
elderly and in persons with certain underlying health
conditions or risk factors.80 The case fatality ratio varies
widely from five to 35% depending on age and type of
illness, but can be especially high in young infants and
the elderly.80,1
In January 2005, a seven-valent conjugate vaccine
(serotypes 4, 6B, 9V, 14, 18C, 19F, 23F) for infants was
introduced in Ontario under the publicly funded
schedule. This was replaced by a ten-valent vaccine
(additional serotypes 1, 5, 7F) in October 2009, followed
by a 13-valent vaccine (additional serotypes 3, 6A and
19A) in November 2010. Since 1996, a 23-valent
pneumococcal polysaccharide vaccine has been
available for adults 65 years and older.81
2011 IN FOCUS AND HISTORICAL HIGHLIGHTS
In 2011, 1,238 cases of IPD were reported in Ontario,
representing an incidence rate of 9.26 cases per
100,000 population. The number of reported cases of
IPD in 2011 was slightly higher compared to the 2010
total of 1,205 cases (Figure 4-15). IPD became
reportable in Ontario in 2001 with rates becoming more
stable in 2003 as reporting became routine. As such,
yearly data from 2003 to 2011 are presented. An
increase in incidence of 11% was observed in 2011 in
comparison to 2003. This increase was driven in part by
increases occurring from 2008 to 2011 and followed a
2008 provincial directive for enhanced surveillance for
IPD. Since the incidence of IPD has been shown to
increase during severe influenza seasons,82 the increase
in 2009 and 2010 may also be attributed in part to the
H1N1 pandemic. Potential impacts of the H1N1
pandemic on national incidence rates for IPD could not
be determined as rates for Canada for this report were
provided up to 2008. However, the Canadian incidence
rates for IPD over the period from 2003 to 2008 were
higher than the corresponding rates for Ontario.
SEROTYPES
The reporting of serotype information in Ontario has
been more complete since 2007. Serotyping results
were available for 80% (985/1,238) of IPD cases
reported in 2011 (Table 4-8). Of these cases, 75%
(740/985) were due to the 24 serotypes covered by the
various pneumococcal vaccines available in Ontario.
However, as the vaccine programs target different age
groups, all of these cases would not have been
preventable under Ontario’s programs. Serotypes not
preventable through any vaccine accounted for 25% of
cases. From 2007 to 2011, the proportion of cases
accounted for by vaccine-preventable IPD serotypes
changed. The proportion of cases caused by serotypes
covered by the seven-valent vaccine decreased from
30% in 2007 to 5% in 2011.83
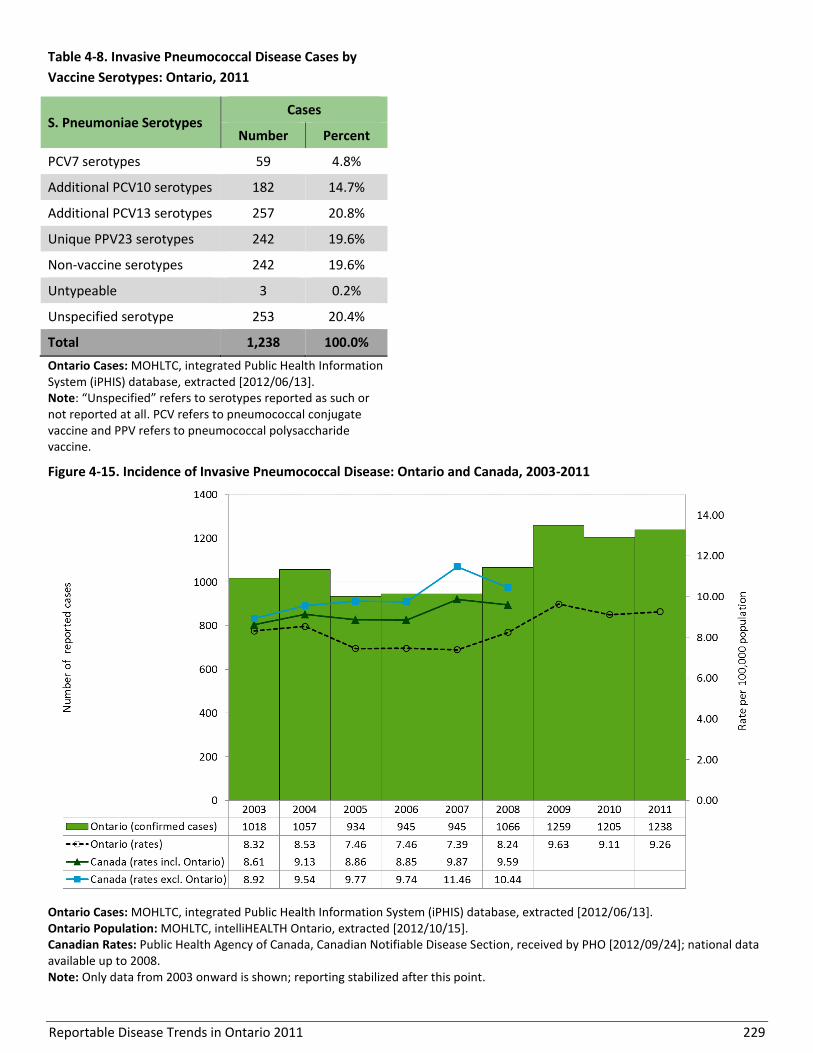
Reportable Disease Trends in Ontario 2011 229
Table 4-8. Invasive Pneumococcal Disease Cases by
Vaccine Serotypes: Ontario, 2011
S. Pneumoniae Serotypes Cases
Number Percent
PCV7 serotypes 59 4.8%
Additional PCV10 serotypes 182 14.7%
Additional PCV13 serotypes 257 20.8%
Unique PPV23 serotypes 242 19.6%
Non-vaccine serotypes 242 19.6%
Untypeable 3 0.2%
Unspecified serotype 253 20.4%
Total 1,238 100.0%
Ontario Cases: MOHLTC, integrated Public Health Information System (iPHIS) database, extracted [2012/06/13]. Note: “Unspecified” refers to serotypes reported as such or not reported at all. PCV refers to pneumococcal conjugate vaccine and PPV refers to pneumococcal polysaccharide vaccine.
Figure 4-15. Incidence of Invasive Pneumococcal Disease: Ontario and Canada, 2003-2011
Ontario Cases: MOHLTC, integrated Public Health Information System (iPHIS) database, extracted [2012/06/13]. Ontario Population: MOHLTC, intelliHEALTH Ontario, extracted [2012/10/15]. Canadian Rates: Public Health Agency of Canada, Canadian Notifiable Disease Section, received by PHO [2012/09/24]; national data available up to 2008. Note: Only data from 2003 onward is shown; reporting stabilized after this point.
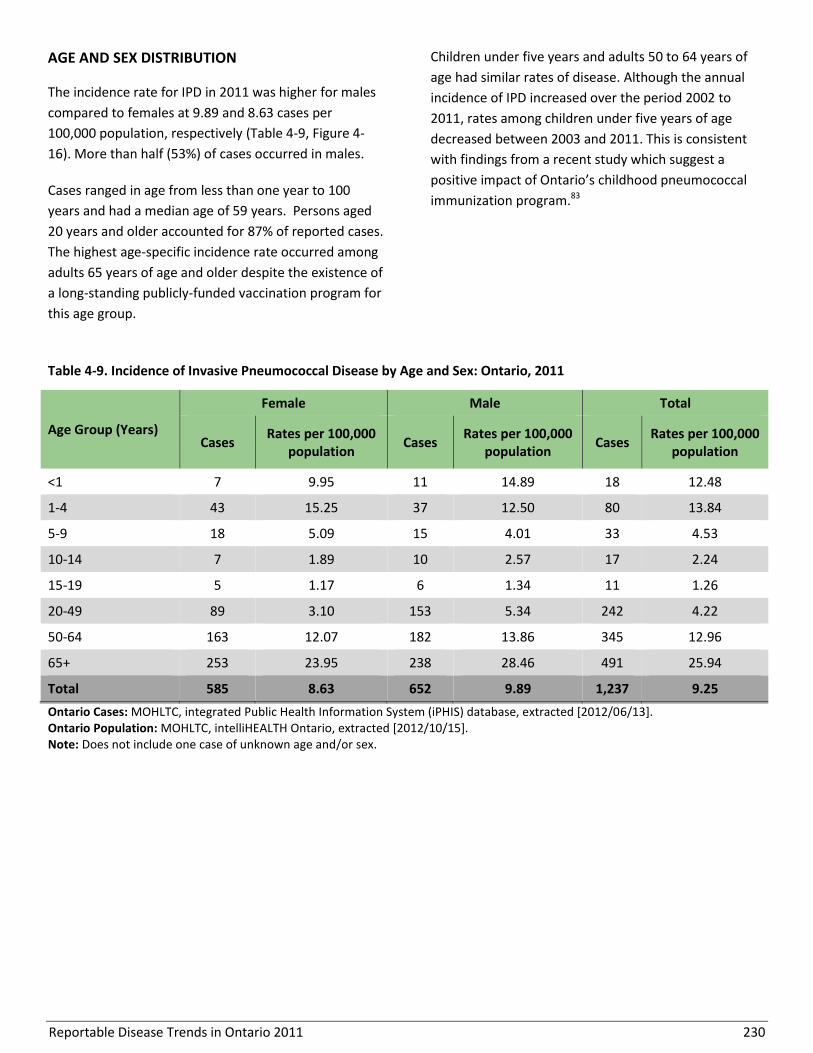
Reportable Disease Trends in Ontario 2011 230
AGE AND SEX DISTRIBUTION
The incidence rate for IPD in 2011 was higher for males
compared to females at 9.89 and 8.63 cases per
100,000 population, respectively (Table 4-9, Figure 4-
16). More than half (53%) of cases occurred in males.
Cases ranged in age from less than one year to 100
years and had a median age of 59 years. Persons aged
20 years and older accounted for 87% of reported cases.
The highest age-specific incidence rate occurred among
adults 65 years of age and older despite the existence of
a long-standing publicly-funded vaccination program for
this age group.
Children under five years and adults 50 to 64 years of
age had similar rates of disease. Although the annual
incidence of IPD increased over the period 2002 to
2011, rates among children under five years of age
decreased between 2003 and 2011. This is consistent
with findings from a recent study which suggest a
positive impact of Ontario’s childhood pneumococcal
immunization program.83
Table 4-9. Incidence of Invasive Pneumococcal Disease by Age and Sex: Ontario, 2011
Age Group (Years)
Female Male Total
Cases Rates per 100,000
population Cases
Rates per 100,000 population
Cases Rates per 100,000
population
<1 7 9.95 11 14.89 18 12.48
1-4 43 15.25 37 12.50 80 13.84
5-9 18 5.09 15 4.01 33 4.53
10-14 7 1.89 10 2.57 17 2.24
15-19 5 1.17 6 1.34 11 1.26
20-49 89 3.10 153 5.34 242 4.22
50-64 163 12.07 182 13.86 345 12.96
65+ 253 23.95 238 28.46 491 25.94
Total 585 8.63 652 9.89 1,237 9.25
Ontario Cases: MOHLTC, integrated Public Health Information System (iPHIS) database, extracted [2012/06/13]. Ontario Population: MOHLTC, intelliHEALTH Ontario, extracted [2012/10/15]. Note: Does not include one case of unknown age and/or sex.
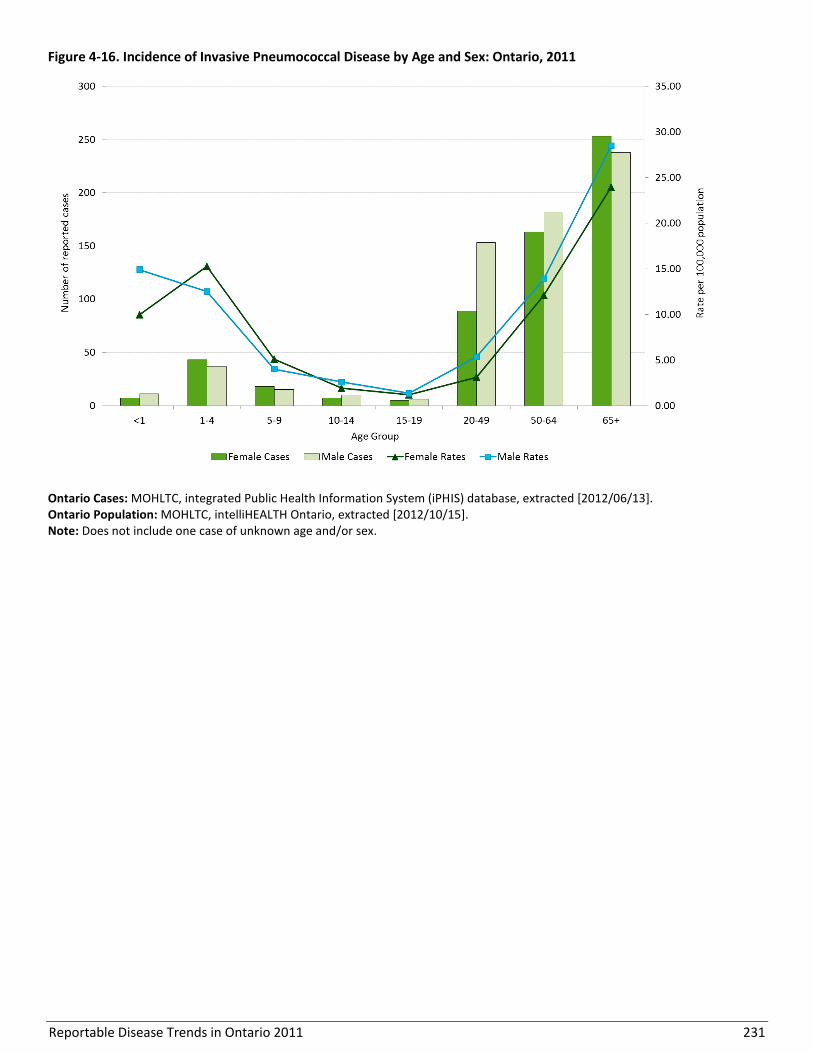
Reportable Disease Trends in Ontario 2011 231
Figure 4-16. Incidence of Invasive Pneumococcal Disease by Age and Sex: Ontario, 2011
Ontario Cases: MOHLTC, integrated Public Health Information System (iPHIS) database, extracted [2012/06/13]. Ontario Population: MOHLTC, intelliHEALTH Ontario, extracted [2012/10/15]. Note: Does not include one case of unknown age and/or sex.

Reportable Disease Trends in Ontario 2011 232
HOSPITALIZATIONS AND DEATHS
Hospitalizations were reported for 68% (841/1,238) of
IPD cases reported in Ontario in 2011. Hospitalized
cases ranged in age from less than one to 100 years,
with a median age of 60 years. There were 68 (6%)
reported deaths among IPD cases reported in 2011.
Case fatality ratios (CFR) among IPD cases increased
with increasing age among adults. The CFR was five
percent among those 20-49 years, six percent among
those aged 50-64 years and seven percent among cases
aged 65 years and older. No deaths were reported
among cases under the age of 32 years.
MONTHLY DISTRIBUTION
The incidence of IPD demonstrates a consistent
seasonal trend from year to year that aligns with the
influenza season, which usually peaks in the winter and
spring in temperate climates.80 In 2011, a clear seasonal
distribution was shown with cases peaking in the winter
months and with comparatively few cases occurring
during the summer months (Figure 4-17).
GEOGRAPHIC DISTRIBUTION
The incidence of IPD varied across the province (Map 4-
4, Table 4-10). The health unit-specific rates in 2011
ranged from 1.52 (Lambton County Health Unit) to
32.95 (Northwestern Health Unit) cases per 100,000
population. Three health units in the north
(Northwestern, Algoma District and Thunder Bay
District) reported the highest incidence rates of IPD in
2011. Lambton County, Halton Region and York Region
had the lowest disease rates in 2011.
REPORTED RISK FACTORS
Of the 876 IPD cases reporting a medical risk factor,
77% (678) reported having a chronic illness or an
underlying or immuno-suppressing medical condition.
Figure 4-17. Number of Invasive Pneumococcal Disease Cases by Month in Ontario in 2011 and Average Number of
Cases from 2006-2010
Ontario Cases: MOHLTC, integrated Public Health Information System (iPHIS) database, extracted [2012/06/13].
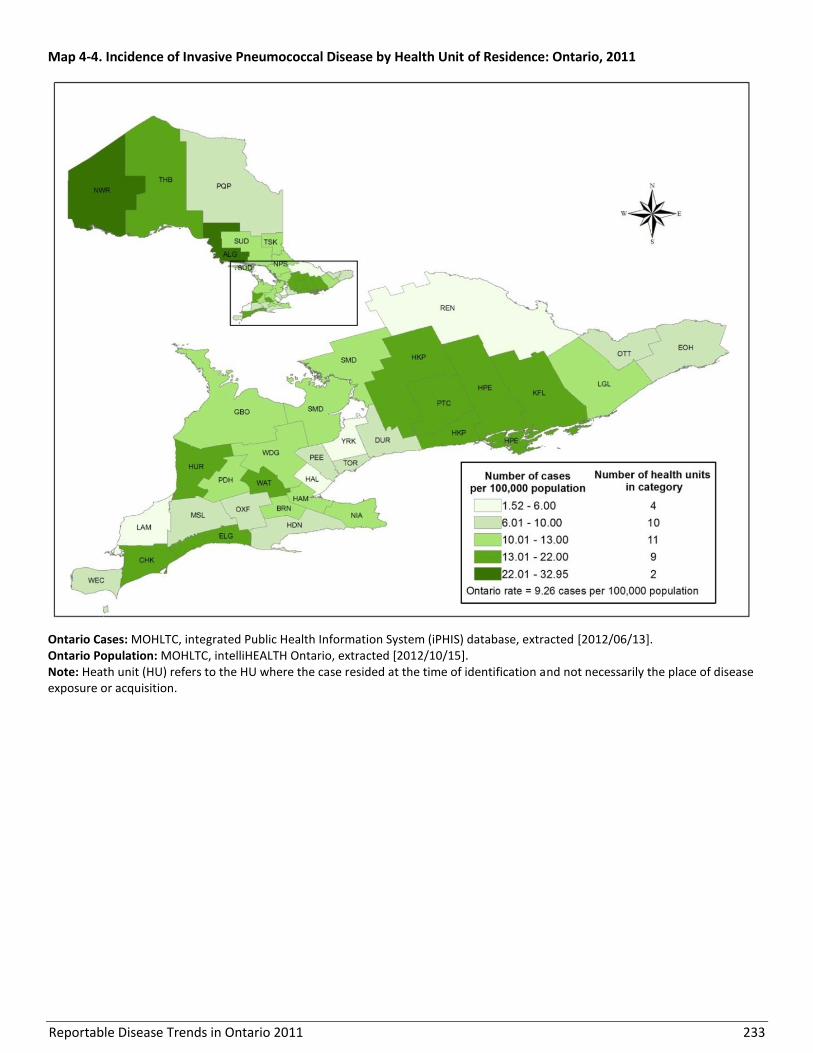
Reportable Disease Trends in Ontario 2011 233
Map 4-4. Incidence of Invasive Pneumococcal Disease by Health Unit of Residence: Ontario, 2011
Ontario Cases: MOHLTC, integrated Public Health Information System (iPHIS) database, extracted [2012/06/13]. Ontario Population: MOHLTC, intelliHEALTH Ontario, extracted [2012/10/15]. Note: Heath unit (HU) refers to the HU where the case resided at the time of identification and not necessarily the place of disease exposure or acquisition.
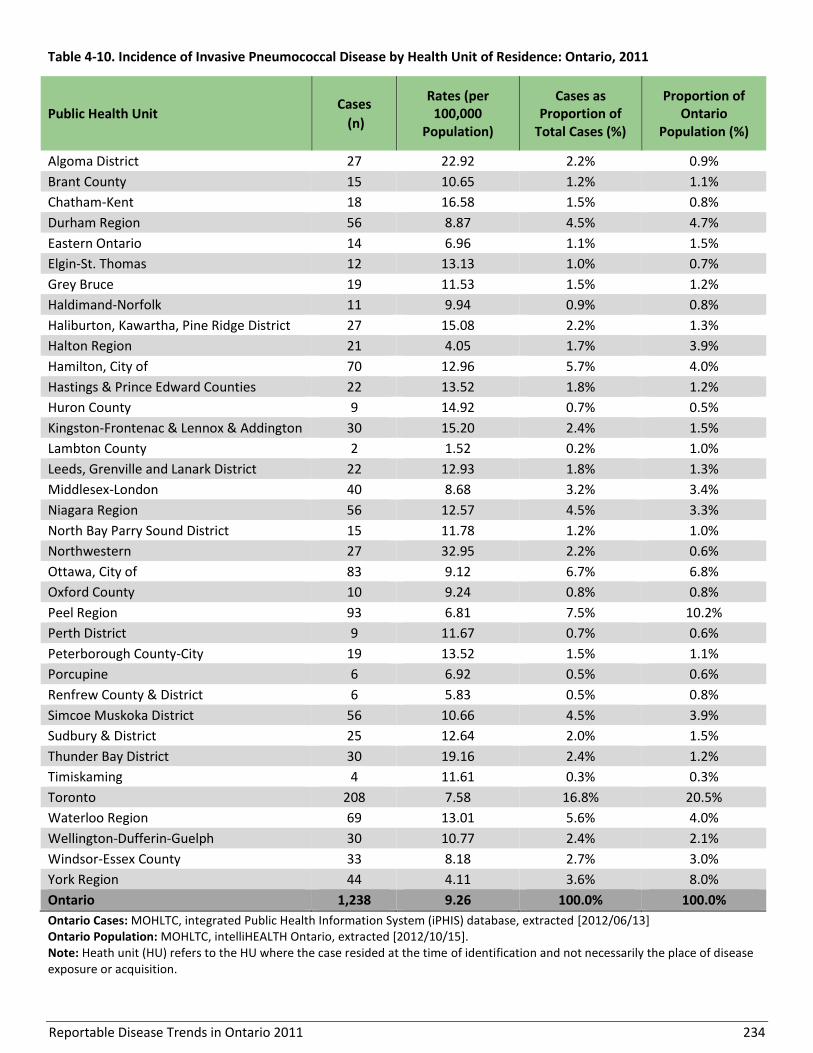
Reportable Disease Trends in Ontario 2011 234
Table 4-10. Incidence of Invasive Pneumococcal Disease by Health Unit of Residence: Ontario, 2011
Public Health Unit Cases
(n)
Rates (per 100,000
Population)
Cases as Proportion of
Total Cases (%)
Proportion of Ontario
Population (%)
Algoma District 27 22.92 2.2% 0.9%
Brant County 15 10.65 1.2% 1.1%
Chatham-Kent 18 16.58 1.5% 0.8%
Durham Region 56 8.87 4.5% 4.7%
Eastern Ontario 14 6.96 1.1% 1.5%
Elgin-St. Thomas 12 13.13 1.0% 0.7%
Grey Bruce 19 11.53 1.5% 1.2%
Haldimand-Norfolk 11 9.94 0.9% 0.8%
Haliburton, Kawartha, Pine Ridge District 27 15.08 2.2% 1.3%
Halton Region 21 4.05 1.7% 3.9%
Hamilton, City of 70 12.96 5.7% 4.0%
Hastings & Prince Edward Counties 22 13.52 1.8% 1.2%
Huron County 9 14.92 0.7% 0.5%
Kingston-Frontenac & Lennox & Addington 30 15.20 2.4% 1.5%
Lambton County 2 1.52 0.2% 1.0%
Leeds, Grenville and Lanark District 22 12.93 1.8% 1.3%
Middlesex-London 40 8.68 3.2% 3.4%
Niagara Region 56 12.57 4.5% 3.3%
North Bay Parry Sound District 15 11.78 1.2% 1.0%
Northwestern 27 32.95 2.2% 0.6%
Ottawa, City of 83 9.12 6.7% 6.8%
Oxford County 10 9.24 0.8% 0.8%
Peel Region 93 6.81 7.5% 10.2%
Perth District 9 11.67 0.7% 0.6%
Peterborough County-City 19 13.52 1.5% 1.1%
Porcupine 6 6.92 0.5% 0.6%
Renfrew County & District 6 5.83 0.5% 0.8%
Simcoe Muskoka District 56 10.66 4.5% 3.9%
Sudbury & District 25 12.64 2.0% 1.5%
Thunder Bay District 30 19.16 2.4% 1.2%
Timiskaming 4 11.61 0.3% 0.3%
Toronto 208 7.58 16.8% 20.5%
Waterloo Region 69 13.01 5.6% 4.0%
Wellington-Dufferin-Guelph 30 10.77 2.4% 2.1%
Windsor-Essex County 33 8.18 2.7% 3.0%
York Region 44 4.11 3.6% 8.0%
Ontario 1,238 9.26 100.0% 100.0%
Ontario Cases: MOHLTC, integrated Public Health Information System (iPHIS) database, extracted [2012/06/13] Ontario Population: MOHLTC, intelliHEALTH Ontario, extracted [2012/10/15]. Note: Heath unit (HU) refers to the HU where the case resided at the time of identification and not necessarily the place of disease exposure or acquisition.
Reportable Disease Trends in Ontario 2011 235
Poliomyelitis, acute
Poliomyelitis (polio) is caused by a virus which is
transmitted from person-to-person primarily through
the fecal-oral route.84,1 Most persons infected with polio
(90% to 95%) do not have any symptoms. Among the
remainder, symptoms usually manifest within seven to
14 days after exposure. Symptoms include fever,
fatigue, headache and vomiting. Persons with serious
illness may also develop severe muscle pain and
stiffness of the neck and back with or without paralysis.
Although paralysis is equated with polio infection, less
than one percent of cases result in paralysis. For cases
with paralytic polio, the case fatality ratio ranges from
two to five percent in children and from 15 to 30% in
adults.84
Polio is an endemic disease in only three countries of
the world – Afghanistan, Pakistan, and Nigeria.84 Canada
was declared polio-free in 1994 and has maintained its
status.84 Because polio has not been eradicated globally,
there is a small risk of importation into Canada from
countries where endemic transmission still occurs.
Under the publicly funded immunization program in
Ontario, inactivated polio vaccine (IPV) is administered
to infants in combination with vaccines against
diphtheria, tetanus, pertussis and Haemophilus
influenzae type b. Polio containing vaccine is routinely
administered at two, four and six months of age, with
additional boosters at 18 months and four to six years.
No additional booster doses of polio vaccine are
required after completion of the childhood series with
the exception of adults who are at increased risk of
exposure to polio (e.g., those travelling to, or planning
to work in areas that have wild polio or vaccine-derived
polio outbreaks). A single booster dose of IPV is
recommended for these adults.84 The vaccine provides
95% protection against infection after completion of the
primary series and almost 100% protection after the
booster dose.1
2011 IN FOCUS AND HISTORICAL HIGHLIGHTS
Canada was certified polio-free in 1994.84 No cases of
polio have been reported in Ontario since routine
reporting of cases began in 1991.

Reportable Disease Trends in Ontario 2011 236
Rubella
Rubella is a highly contagious viral disease that is spread
through contact with secretions expelled through the
cough or sneeze of an infected person.1 Infection is
characterized by mild illness including fever, rash,
headache, malaise, red eyes and runny nose, which
develops 14 to 21 days after exposure.85 Up to 50% of
infected persons do not show any signs of illness.
Congenital rubella syndrome (CRS) can occur as a result
of rubella infection during pregnancy. Up to 90% of
infants born to women infected during the first ten
weeks of pregnancy develop CRS, with risk diminishing
after the 20th week of pregnancy.1 Complications from
CRS can result in stillbirth, miscarriage and fetal defects
of major organ systems including deafness, cataracts,
congenital heart disease and impaired intellectual
development.1,85
In Canada, screening is recommended for all pregnant
women to determine susceptibility to rubella and to
facilitate post-partum immunization of susceptible
women.86, 87 Since 1970, a rubella-containing vaccine
has been administered as part of the Ontario publicly
funded immunization program. Presently, it is
administered in combination with vaccines for mumps
and measles (MMR) or with vaccines for mumps,
measles and varicella (MMRV). Although only one dose
is required to be considered immunized against
rubella,86 children in Ontario routinely recieve two
doses of rubella containing vaccine because the vaccine
is given in combination with other antigens as per the
recommended immunization schedule . In 2010/2011,
95% of seven year olds in Ontario reported receiving at
least one-dose of rubella-containing vaccine, and
between 2006 and 2010, approximately 90% of prenatal
women in Ontario were immune to rubella.88
As with measles, indigenous rubella has been
eliminated from Canada, with the last reported case
occurring in 2005. The same risk for importation of
rubella cases exists as with measles as it is also endemic
in other parts of the world. Again, documentation of
travel history is essential to ensure Canada's elimination
status to demonstrate enhanced surveillance for both of
these diseases.
Congenital rubella syndrome has also been eliminated
from Canada. There have been no cases of CRS due to
exposure to rubella in Canada since 2000.67 However,
sporadic cases continue to occur as a result of prenatal
infections acquired in endemic areas.
2011 IN FOCUS AND HISTORICAL HIGHLIGHTS
In 2011, no cases of rubella or CRS were reported in
Ontario. Excluding 2005, the number of reported cases
of rubella ranged from zero to ten per year, for a yearly
average of four cases for the period from 2002 to 2011
(Figure 4-18). Over the same period, a total of five cases
of CRS were reported in Ontario, with the last case
occurring in 2009 (Figure 4-19). Of rubella and CRS cases
reported from 2006 to 2011, 46% were directly or
indirectly related to travel.
In 2005, an outbreak of 309 cases of rubella occurred in
southwestern Ontario following importation from the
Netherlands. Cases in this outbreak were part of an
under-vaccinated community philosophically opposed
to immunization. Children between the ages of five and
14 years accounted for over 60% of cases, but no cases
of CRS were identified. The outbreak did not spread
outside the community due to high immunization rates
in the general Ontario population.
In Canada, reductions in the incidence of rubella have
also been achieved. From 2006 to 2011, an average of
less than five cases was reported annually.67 The highest
rate and number of cases nationally was in 2005, owing
to the outbreak in southwestern Ontario (Figure 4-18).
For CRS, annual incidence rates for Canada were
generally lower than the corresponding rates for
Ontario. From 1996 to 2011, less than three cases of
CRS were reported per year in Canada with the majority
of cases born to foreign-born women.89
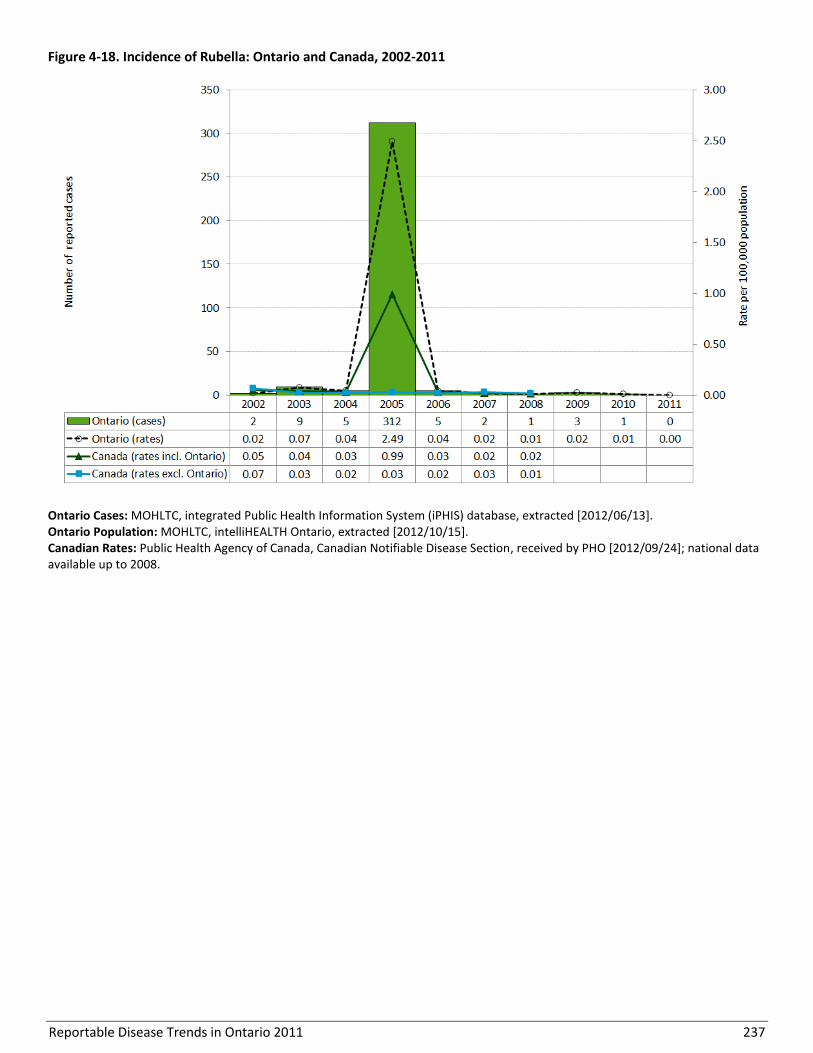
Reportable Disease Trends in Ontario 2011 237
Figure 4-18. Incidence of Rubella: Ontario and Canada, 2002-2011
Ontario Cases: MOHLTC, integrated Public Health Information System (iPHIS) database, extracted [2012/06/13]. Ontario Population: MOHLTC, intelliHEALTH Ontario, extracted [2012/10/15]. Canadian Rates: Public Health Agency of Canada, Canadian Notifiable Disease Section, received by PHO [2012/09/24]; national data available up to 2008.
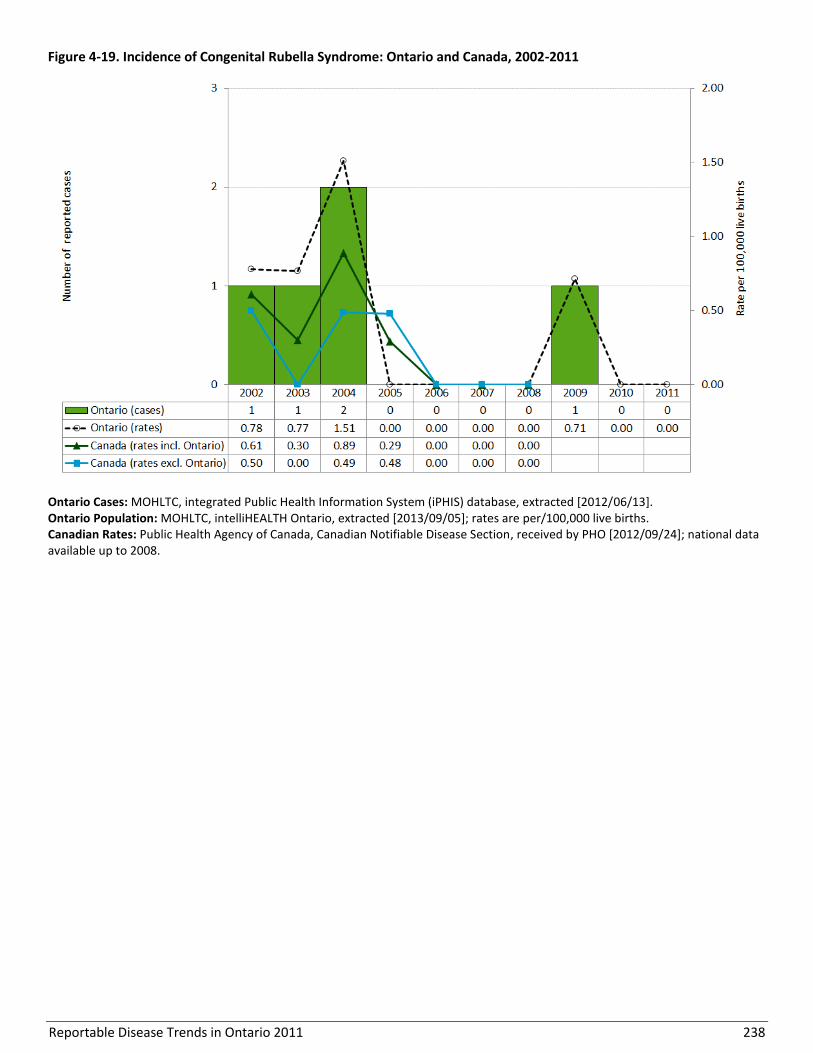
Reportable Disease Trends in Ontario 2011 238
Figure 4-19. Incidence of Congenital Rubella Syndrome: Ontario and Canada, 2002-2011
Ontario Cases: MOHLTC, integrated Public Health Information System (iPHIS) database, extracted [2012/06/13]. Ontario Population: MOHLTC, intelliHEALTH Ontario, extracted [2013/09/05]; rates are per/100,000 live births. Canadian Rates: Public Health Agency of Canada, Canadian Notifiable Disease Section, received by PHO [2012/09/24]; national data available up to 2008.

Reportable Disease Trends in Ontario 2011 239
Tetanus
Tetanus (lockjaw) is a serious disease caused by toxins
released by Clostridium tetani bacteria.1,13,90 These
bacteria are ubiquitous and are found in soil, dust and
manure.1 Tetanus manifests in four clinical forms with
the most common being generalized tetanus.90,91
Transmission usually occurs through a puncture wound
that has been contaminated with soil, dust or feces
(animal or human). Less commonly, transmission may
occur through contaminated needles or surgical
equipment.1 Symptoms of tetanus usually develop
between three and 21 days (average 14 days) after
exposure,1 with the characteristic presentation of
painful muscle contractions that can lead to “locking” of
the jaw.1 Case-fatality ratios (CFRs) range from 10% to
over 80% in unvaccinated persons, depending on the
quality of care received and age (i.e. the CFR is higher in
infants and the elderly).1,90,91
Under the publicly funded immunization program in
Ontario, tetanus toxoid containing vaccine is
administered to infants in combination with vaccines
against diphtheria, pertussis, polio and Haemophilus
influenzae type b infections. Tetanus toxoid containing
vaccine is routinely administered at two, four and six
months of age, with additional boosters at 18 months,
four to six years and 14 to 16 years. A booster dose is
recommended every ten years thereafter, however a
prophylactic dose of vaccine may be indicated at 5 years
for wound management.13 At risk populations are
individuals who have never been vaccinated or who are
not vaccinated in accordance with the recommended
vaccine schedule.
2011 IN FOCUS AND HISTORICAL HIGHLIGHTS
Tetanus is rare in Ontario. From 2002-2011, nine cases
of tetanus were reported in Ontario, including one case
in 2011 (Figure 4-20).
With the exception of 2007, annual incidence rates of
tetanus in Canada were comparable to the
corresponding rates for Ontario over the period 2002 to
2008.

Reportable Disease Trends in Ontario 2011 240
Figure 4-20. Incidence of Tetanus: Ontario and Canada, 2002-2011
Ontario Cases: MOHLTC, integrated Public Health Information System (iPHIS) database, extracted [2012/06/13]. Ontario Population: MOHLTC, intelliHEALTH Ontario, extracted [2012/10/15]. Canadian Rates: Public Health Agency of Canada, Canadian Notifiable Disease Section, received by PHO [2012/09/24]; national data available up to 2008.

Reportable Disease Trends in Ontario 2011 241
Section 5
Vector-borne Diseases
Overview
Lyme disease, West Nile Virus (WNV) illness and malaria
are the three vector-borne diseases of public health
significance in Ontario. Yellow fever is also reportable
in Ontario, but no cases have been reported since the
disease became reportable in 1991. Similar to yellow
fever, malaria is not endemic in Canada, and its
incidence reflects travel to or recent immigration from
malaria endemic countries. The annual incidence rate of
malaria remained relatively stable from 2004 to 2009
but increased substantially in 2010 and 2011 to its
highest levels since the 1990s.
Both Lyme disease and WNV illness are endemic in
Ontario where competent disease vectors and hosts can
be found. Lyme disease has become the most
important vector-borne disease that can be acquired
locally within Ontario. Its incidence increased steadily
over the ten-year period from 2002 to 2011, with the
increase attributed to several factors including greater
awareness among the public and an expansion in the
geographic range of Lyme disease positive ticks and
hence the risk of exposure. Annual incidence rates of
WNV illness were comparatively lower from 2003 to
2011 in comparison to 2002, the year in which the
disease was first reported in Ontario. Fluctuations in the
incidence of WNV illness are likely influenced by the
amount of rainfall and increasing temperatures, which
in turn affect the growth and development of the
mosquito vector.
Several quick reference data tables for the diseases covered in this section are included in Appendix 4.

Reportable Disease Trends in Ontario 2011 242
Lyme Disease
The annual incidence rate of Lyme disease in
Ontario increased steadily over the ten-year
period from 2002 to 2011.
The majority of Lyme disease cases occur in
the warmer months from May to September.
Seventy percent of Lyme diseases cases
reported in 2011 were acquired within
Ontario, a third of which were associated with
exposures in Lyme disease endemic areas.
Lyme disease is the most frequently reported of the
vector-borne diseases that are acquired locally within
Ontario. It is caused by Borrelia burgdorferi, a bacterium
that is transmitted to humans through the bite of an
infected tick.1 In Ontario, the blacklegged tick is the
main vector for Lyme disease. There are at least seven
endemic or established populations of these ticks in the
southern and eastern parts of the province.92 Infection
with Lyme disease generally occurs three to 32 days
after a tick bite (average seven to 10 days) and is
characterized by a “bull’s eye” rash (erythema migrans)
with other early symptoms such as fatigue, fever,
headache, muscle and joint aches and stiff neck.1
Susceptibility to Lyme disease is general. However,
persons that spend a lot of time outdoors or have
contact with animals that may carry ticks are at higher
risk of infection.1 Lyme disease is diagnosed through a
combination of symptoms, history of exposure to
infected ticks and/or validated laboratory test results.93
Avoidance of tick bites is the best way to prevent Lyme
disease. Tick bites can be prevented by using insect
repellent when outdoors, removing ticks from the body
as soon as possible after bites, and reducing tick
habitats around the home. Tick bites can also be
prevented by controlling ticks on companion animals
such as cat and dogs.93
2011 IN FOCUS AND HISTORICAL HIGHLIGHTS
The annual incidence rate of Lyme disease in Ontario
increased over the ten-year period from 2002 to 2011.
From 2008 to 2010, the number of reported cases
stabilized to approximately 100 cases per year (Figure 5-
1). In 2011, 134 confirmed and probable cases of Lyme
disease were reported for an overall incidence rate of
1.00 case per 100,000 population. 2011 represented a
35% increase in incidence compared to the period from
2008 to 2010, and a 335% increase compared to 2002
when 28 confirmed cases were reported. Greater
awareness among the public, particularly in Lyme
disease-endemic areas, has resulted in increased testing
for Lyme disease. From 2007 to 2011, the number of
tests for Lyme disease at Public Health Ontario
Laboratory increased by 50%, contributing in part to the
rise in Lyme disease cases in Ontario since 2007.
Lyme disease was not nationally notifiable until
December 2009. National data for 2009 to 2011 were
not available at the time of analysis.
AGE AND SEX DISTRIBUTION
In 2011, slightly more cases of Lyme disease were
reported among females compared to males. Females
accounted for 68 cases, representing a rate of 1.00 case
per 100,000 population, while males accounted for 62
cases, representing a rate of 0.94 cases per 100,000
population (Table 5-1, Figure 5-2).
The average age of female cases was 44 years, which
was higer than the average age of 38 years for males.
Females in the 50-59 and 60-69 year age groups had the
highest incidence rates of Lyme disease of all females.
Conversely, males in the 10-19, 20-29 and 60-69 year
age groups had the highest incidence rates of Lyme
disease of all males (Table 5-1, Figure 5-2).
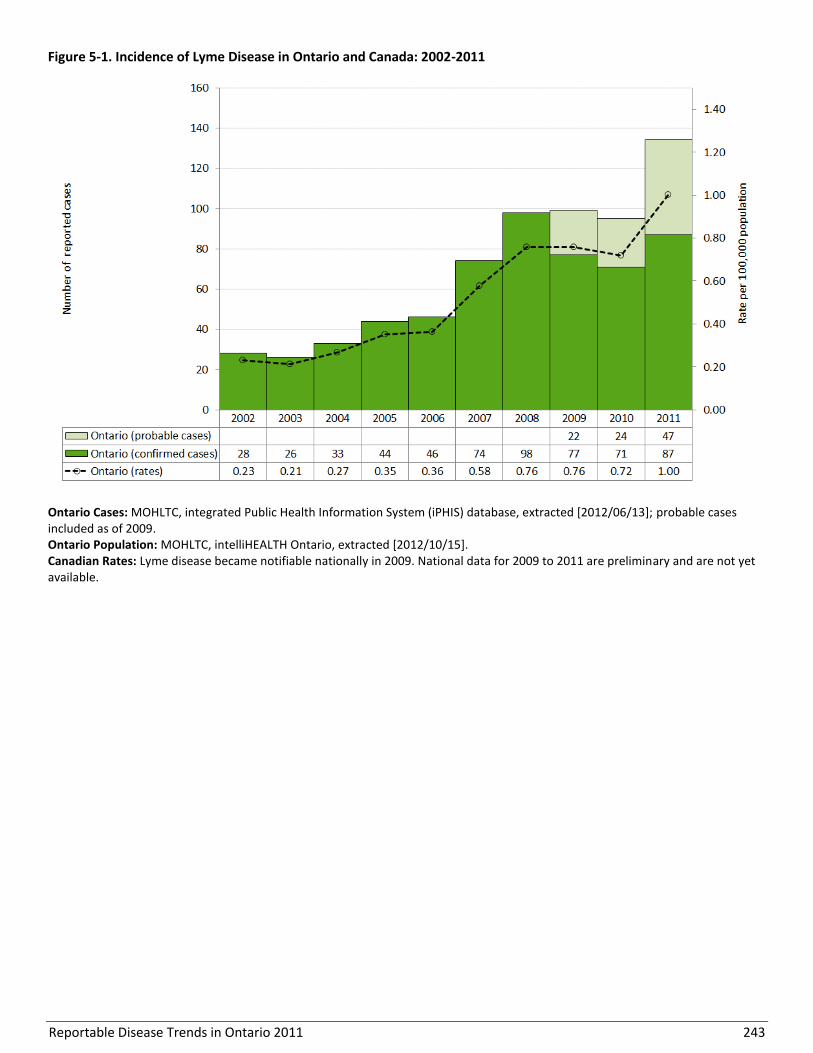
Reportable Disease Trends in Ontario 2011 243
Figure 5-1. Incidence of Lyme Disease in Ontario and Canada: 2002-2011
Ontario Cases: MOHLTC, integrated Public Health Information System (iPHIS) database, extracted [2012/06/13]; probable cases included as of 2009. Ontario Population: MOHLTC, intelliHEALTH Ontario, extracted [2012/10/15]. Canadian Rates: Lyme disease became notifiable nationally in 2009. National data for 2009 to 2011 are preliminary and are not yet available.
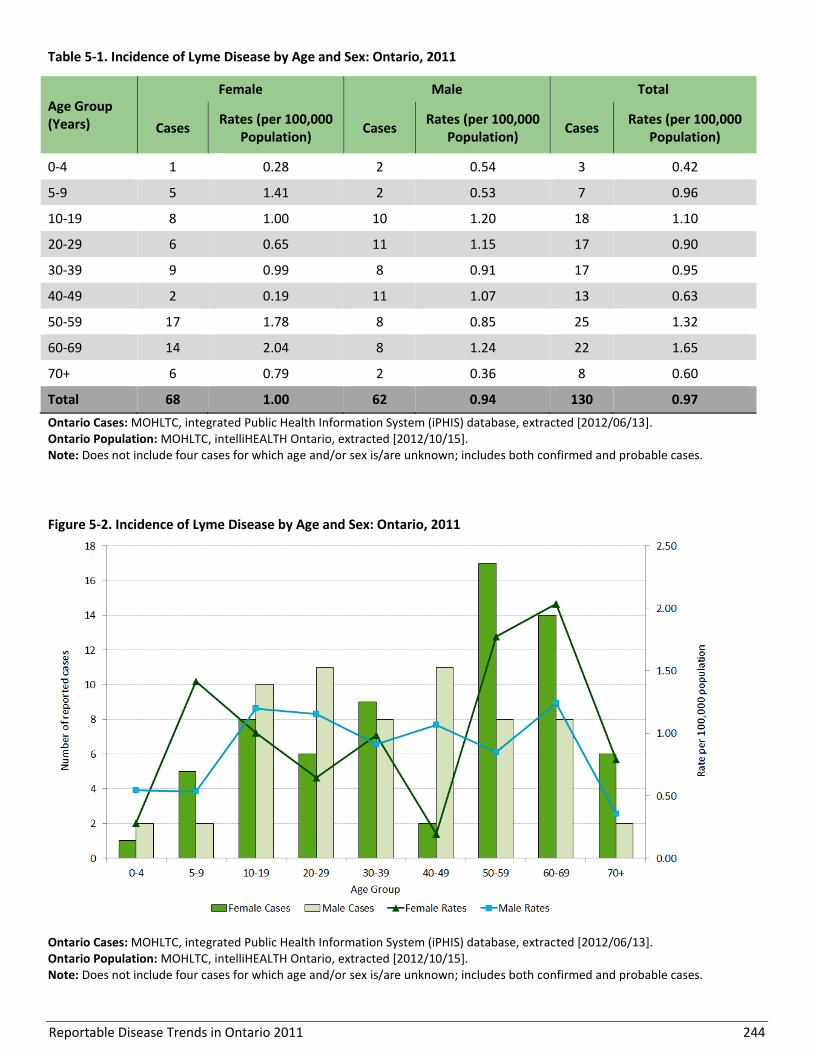
Reportable Disease Trends in Ontario 2011 244
Table 5-1. Incidence of Lyme Disease by Age and Sex: Ontario, 2011
Age Group (Years)
Female Male Total
Cases Rates (per 100,000
Population) Cases
Rates (per 100,000 Population)
Cases Rates (per 100,000
Population)
0-4 1 0.28 2 0.54 3 0.42
5-9 5 1.41 2 0.53 7 0.96
10-19 8 1.00 10 1.20 18 1.10
20-29 6 0.65 11 1.15 17 0.90
30-39 9 0.99 8 0.91 17 0.95
40-49 2 0.19 11 1.07 13 0.63
50-59 17 1.78 8 0.85 25 1.32
60-69 14 2.04 8 1.24 22 1.65
70+ 6 0.79 2 0.36 8 0.60
Total 68 1.00 62 0.94 130 0.97
Ontario Cases: MOHLTC, integrated Public Health Information System (iPHIS) database, extracted [2012/06/13]. Ontario Population: MOHLTC, intelliHEALTH Ontario, extracted [2012/10/15]. Note: Does not include four cases for which age and/or sex is/are unknown; includes both confirmed and probable cases.
Figure 5-2. Incidence of Lyme Disease by Age and Sex: Ontario, 2011
Ontario Cases: MOHLTC, integrated Public Health Information System (iPHIS) database, extracted [2012/06/13]. Ontario Population: MOHLTC, intelliHEALTH Ontario, extracted [2012/10/15]. Note: Does not include four cases for which age and/or sex is/are unknown; includes both confirmed and probable cases.
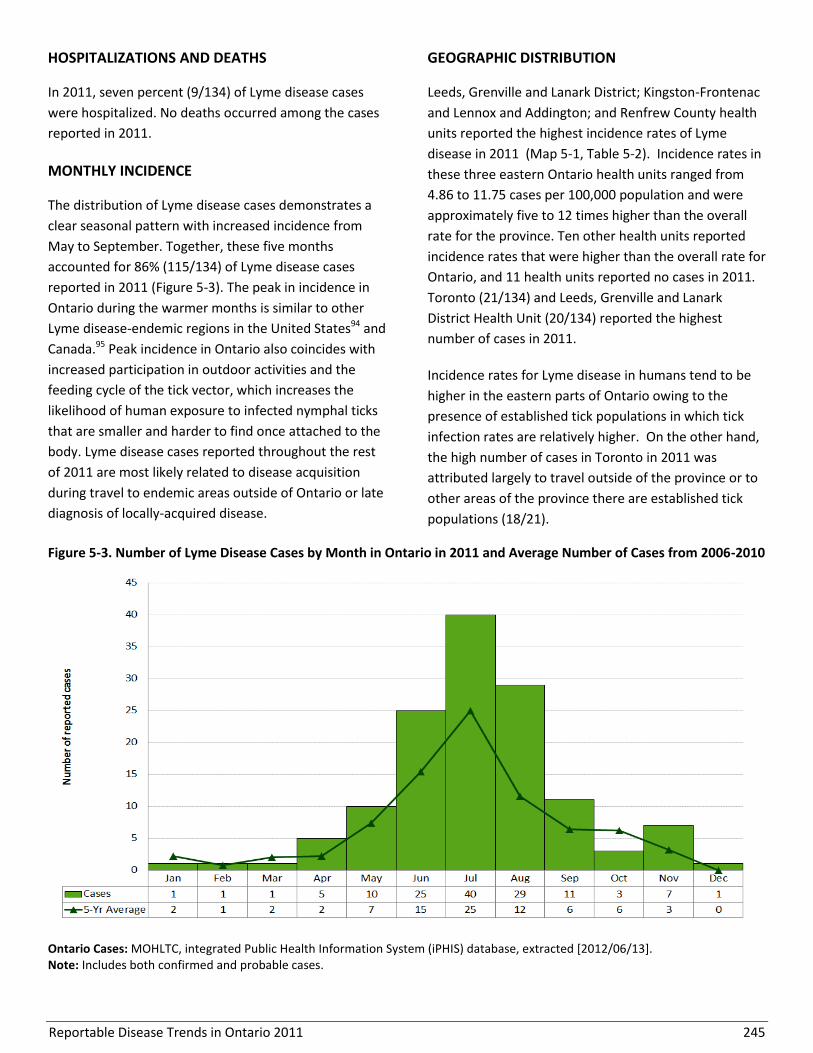
Reportable Disease Trends in Ontario 2011 245
HOSPITALIZATIONS AND DEATHS
In 2011, seven percent (9/134) of Lyme disease cases
were hospitalized. No deaths occurred among the cases
reported in 2011.
MONTHLY INCIDENCE
The distribution of Lyme disease cases demonstrates a
clear seasonal pattern with increased incidence from
May to September. Together, these five months
accounted for 86% (115/134) of Lyme disease cases
reported in 2011 (Figure 5-3). The peak in incidence in
Ontario during the warmer months is similar to other
Lyme disease-endemic regions in the United States94 and
Canada.95 Peak incidence in Ontario also coincides with
increased participation in outdoor activities and the
feeding cycle of the tick vector, which increases the
likelihood of human exposure to infected nymphal ticks
that are smaller and harder to find once attached to the
body. Lyme disease cases reported throughout the rest
of 2011 are most likely related to disease acquisition
during travel to endemic areas outside of Ontario or late
diagnosis of locally-acquired disease.
GEOGRAPHIC DISTRIBUTION
Leeds, Grenville and Lanark District; Kingston-Frontenac
and Lennox and Addington; and Renfrew County health
units reported the highest incidence rates of Lyme
disease in 2011 (Map 5-1, Table 5-2). Incidence rates in
these three eastern Ontario health units ranged from
4.86 to 11.75 cases per 100,000 population and were
approximately five to 12 times higher than the overall
rate for the province. Ten other health units reported
incidence rates that were higher than the overall rate for
Ontario, and 11 health units reported no cases in 2011.
Toronto (21/134) and Leeds, Grenville and Lanark
District Health Unit (20/134) reported the highest
number of cases in 2011.
Incidence rates for Lyme disease in humans tend to be
higher in the eastern parts of Ontario owing to the
presence of established tick populations in which tick
infection rates are relatively higher. On the other hand,
the high number of cases in Toronto in 2011 was
attributed largely to travel outside of the province or to
other areas of the province there are established tick
populations (18/21).
Figure 5-3. Number of Lyme Disease Cases by Month in Ontario in 2011 and Average Number of Cases from 2006-2010
Ontario Cases: MOHLTC, integrated Public Health Information System (iPHIS) database, extracted [2012/06/13]. Note: Includes both confirmed and probable cases.

Reportable Disease Trends in Ontario 2011 246
Map 5-1. Incidence of Lyme Disease by Health Unit of Exposure: Ontario, 2011
Ontario Cases: MOHLTC, integrated Public Health Information System (iPHIS) database, extracted [2012/06/13]. Ontario Population: MOHLTC, intelliHEALTH Ontario, extracted [2012/10/15]. Note: Health unit (HU) refers to the HU where the case was most likely exposed and is not necessarily the HU of residence at the time of identification; includes both confirmed and probable cases.

Reportable Disease Trends in Ontario 2011 247
Table 5-2. Incidence of Lyme Disease by Health Unit of Residence: Ontario, 2011
Public Health Unit Cases
(n)
Rates (per 100,000 Population)
Cases as Proportion of
Total Cases (%)
Proportion of Ontario
Population (%)
Algoma District 0 0.00 0.0% 0.9%
Brant County 0 0.00 0.0% 1.1%
Chatham-Kent 1 0.92 0.7% 0.8%
Durham Region 1 0.16 0.7% 4.7%
Eastern Ontario 1 0.50 0.7% 1.5%
Elgin-St. Thomas 0 0.00 0.0% 0.7%
Grey Bruce 1 0.61 0.7% 1.2%
Haldimand-Norfolk 4 3.61 3.0% 0.8%
Haliburton, Kawartha, Pine Ridge District 2 1.12 1.5% 1.3%
Halton Region 6 1.16 4.5% 3.9%
Hamilton, City of 2 0.37 1.5% 4.0%
Hastings & Prince Edward Counties 4 2.46 3.0% 1.2%
Huron County 0 0.00 0.0% 0.5%
Kingston-Frontenac & Lennox & Addington 17 8.61 12.7% 1.5%
Lambton County 0 0.00 0.0% 1.0%
Leeds, Grenville and Lanark District 20 11.75 14.9% 1.3%
Middlesex-London 2 0.43 1.5% 3.4%
Niagara Region 6 1.35 4.5% 3.3%
North Bay Parry Sound District 0 0.00 0.0% 1.0%
Northwestern 0 0.00 0.0% 0.6%
Ottawa, City of 11 1.21 8.2% 6.8%
Oxford County 4 3.70 3.0% 0.8%
Peel Region 7 0.51 5.2% 10.2%
Perth District 1 1.30 0.7% 0.6%
Peterborough County-City 3 2.13 2.2% 1.1%
Porcupine 0 0.00 0.0% 0.6%
Renfrew County & District 5 4.86 3.7% 0.8%
Simcoe Muskoka District 0 0.00 0.0% 3.9%
Sudbury & District 0 0.00 0.0% 1.5%
Thunder Bay District 1 0.64 0.7% 1.2%
Timiskaming 0 0.00 0.0% 0.3%
Toronto 21 0.77 15.7% 20.5%
Waterloo Region 4 0.75 3.0% 4.0%
Wellington-Dufferin-Guelph 3 1.08 2.2% 2.1%
Windsor-Essex County 3 0.74 2.2% 3.0%
York Region 4 0.37 3.0% 8.0%
Ontario 134 1.00 100.0% 100.0%
Ontario Cases: MOHLTC, integrated Public Health Information System (iPHIS) database, extracted [2012/06/13]. Ontario Population: MOHLTC, intelliHEALTH Ontario, extracted [2012/10/15]. Note: Health unit (HU) refers to the HU where the case resided at the time of identification and not necessarily the place of disease exposure or acquisition; includes both confirmed and probable cases.
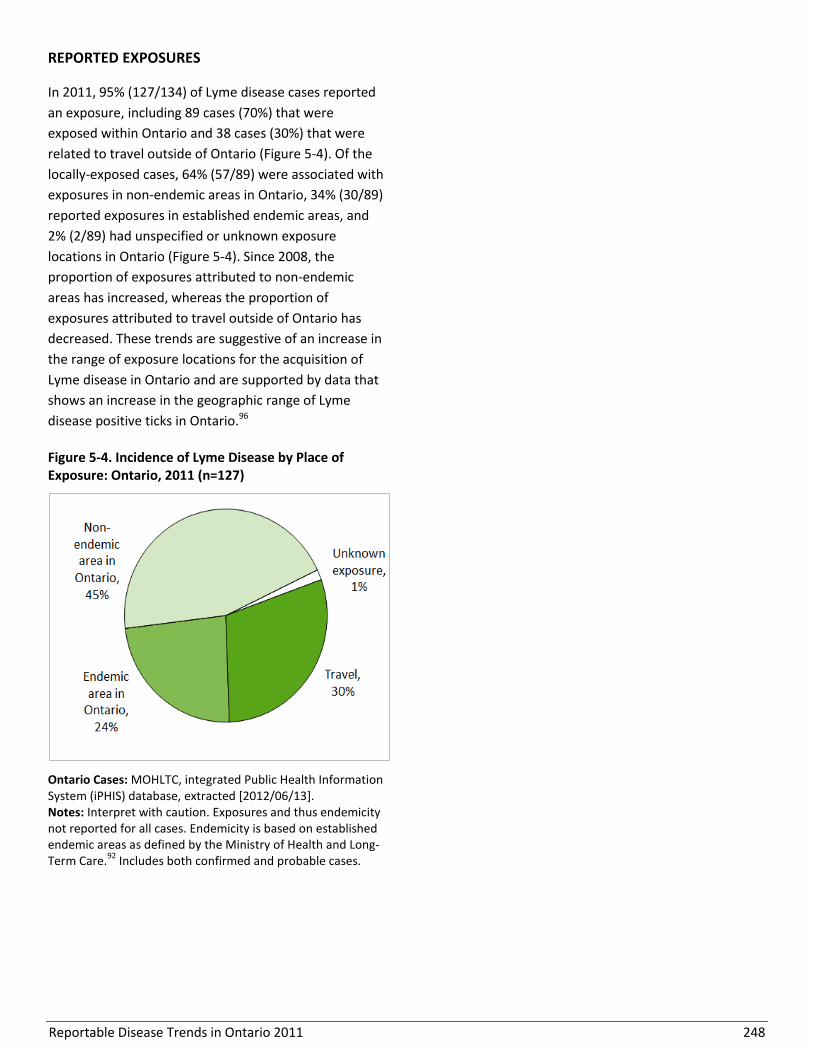
Reportable Disease Trends in Ontario 2011 248
REPORTED EXPOSURES
In 2011, 95% (127/134) of Lyme disease cases reported
an exposure, including 89 cases (70%) that were
exposed within Ontario and 38 cases (30%) that were
related to travel outside of Ontario (Figure 5-4). Of the
locally-exposed cases, 64% (57/89) were associated with
exposures in non-endemic areas in Ontario, 34% (30/89)
reported exposures in established endemic areas, and
2% (2/89) had unspecified or unknown exposure
locations in Ontario (Figure 5-4). Since 2008, the
proportion of exposures attributed to non-endemic
areas has increased, whereas the proportion of
exposures attributed to travel outside of Ontario has
decreased. These trends are suggestive of an increase in
the range of exposure locations for the acquisition of
Lyme disease in Ontario and are supported by data that
shows an increase in the geographic range of Lyme
disease positive ticks in Ontario.96
Figure 5-4. Incidence of Lyme Disease by Place of Exposure: Ontario, 2011 (n=127)
Ontario Cases: MOHLTC, integrated Public Health Information System (iPHIS) database, extracted [2012/06/13]. Notes: Interpret with caution. Exposures and thus endemicity not reported for all cases. Endemicity is based on established endemic areas as defined by the Ministry of Health and Long-Term Care.
92 Includes both confirmed and probable cases.
Reportable Disease Trends in Ontario 2011 249
Malaria
The incidence of malaria in Ontario increased
in 2010 and remained elevated in 2011 after
an eight year period of relative stability.
Incidence rates of malaria for males and
females were highest in the age range from 20
to 49 years.
Toronto and Peel Region accounted for 68% of
malaria cases reported in Ontario in 2011.
Malaria is not endemic in Ontario and its
incidence reflects travel to, or recent
immigration from, malaria endemic countries.
Malaria is a commonly reported and often fatal disease
in many tropical and sub-tropical countries. In 2010, an
estimated 219 million cases and 660,000 deaths were
reported worldwide.97 Malaria is caused by one of five
parasitic species of the genus Plasmodium: P.
falciparum, P. vivax, P. ovale, P. malariae and P.
knowlesi. Malaria is transmitted primarily through the
bite of an infected female Anopheles mosquito. The
time from exposure to the onset of symptoms of
malaria varies, ranging from nine to 40 days, depending
on the Plasmodium species. The severity of illness with
malaria also depends on the species, with P. falciparum
resulting in the most serious health outcomes.
Symptoms of malaria are mostly non-specific and
include fever, headache, nausea, vomiting, diarrhea,
muscle pain and malaise. Illness is often characterized
by alternating chills and fever and central nervous
system symptoms, especially with P. falciparum
infections.1
As malaria is not endemic in Canada, its incidence
reflects travel to, or recent immigration from, malaria
endemic countries. For Ontarians, the most effective
means of protection against malaria is pre-travel
prophylaxis (antimalarial drugs) in addition to the
application of other personal precautions (e.g. use of
mosquito repellent and bed nets) that safeguard against
mosquito bites during travel.
2011 IN FOCUS AND HISTORICAL HIGHLIGHTS
Malaria has the highest incidence of all reportable
vector-borne diseases in Ontario. In 2011, malaria
accounted for 52% of all vector-borne diseases reported
with 230 confirmed cases, representing an incidence
rate of 1.72 cases per 100,000 population. From 2002 to
2009, the number of reported cases of malaria
remained relatively stable, with an average of 180
reported cases per year or 1.40 cases per 100,000
population. In 2010, the incidence of malaria increased
by 40% compared to the average from 2002 to 2009,
and by 23% in comparison to 2011 (Figure 5-5).
From 2002 to 2008, the annual incidence of malaria in
Canada remained relatively stable and below the
corresponding annual rates for Ontario. National rates
over this period ranged from 1.02 to 1.19 cases per
100,000 population (Figure 5-5).
MALARIA SPECIES
In 2011, P. falciparum was the most commonly reported
malaria species among cases reported in Ontario,
accounting for 47% (107/230) of cases, followed by P.
vivax at 39% (89/230) and P. ovale at 4% (9/230) (Table
5-3). The species was unspecified for 11% of cases. P.
falciparum (82%) and P. ovale (100%) were most
frequently associated with travel to Africa, while P.
vivax (82%) was most frequently associated with travel
to the Asian sub-continent.

Reportable Disease Trends in Ontario 2011 250
Figure 5-5. Incidence of Malaria in Ontario and Canada: 2002-2011
Ontario Cases: MOHLTC, integrated Public Health Information System (iPHIS) database, extracted [2012/06/13]. Ontario Population: MOHLTC, intelliHEALTH Ontario, extracted [2012/10/15]. Canadian Rates: Public Health Agency of Canada, Canadian Notifiable Disease Section, received by PHO [2012/09/24]; national data available up to 2008.
AGE AND SEX DISTRIBUTION
Compared to females, males accounted for more cases
and higher rates of malaria in 2011. The proportion of
reported cases accounted for by males was 70% (161),
which represents an incidence rate of 2.44 cases per
100,000 population. Females accounted for 28% (64) of
malaria cases and had an incidence rate of 0.94 cases
per 100,000 population (Table 5-4, Figure 5-6). Sex was
unknown for five cases.
Incidence rates for both sexes were highest in the 20-
29, 30-39, and 40-49 year age groups. Males in these
age groups had incidence rates that were higher than
the overall rate for the province as a whole. In contrast,
females in these age groups had incidence rates that
were lower than the overall rate for Ontario. Higher
rates among the 20 to 49 year olds may be reflective of
travel patterns, and the higher rates among males
relative to females in these age groups may also be
reflective of sex-specific differences in the uptake of
personal protective measures during travel.
Table 5-3. Malaria Cases by Species: Ontario, 2011
Plasmodium Species Cases
Number Percent
P. falciparum 107 46.5%
P. vivax 89 38.7%
P. ovale 9 3.9%
Unspecified species 25 10.9%
Total 230 100%
Ontario Cases: MOHLTC, integrated Public Health Information System (iPHIS) database, extracted [2012/06/13].
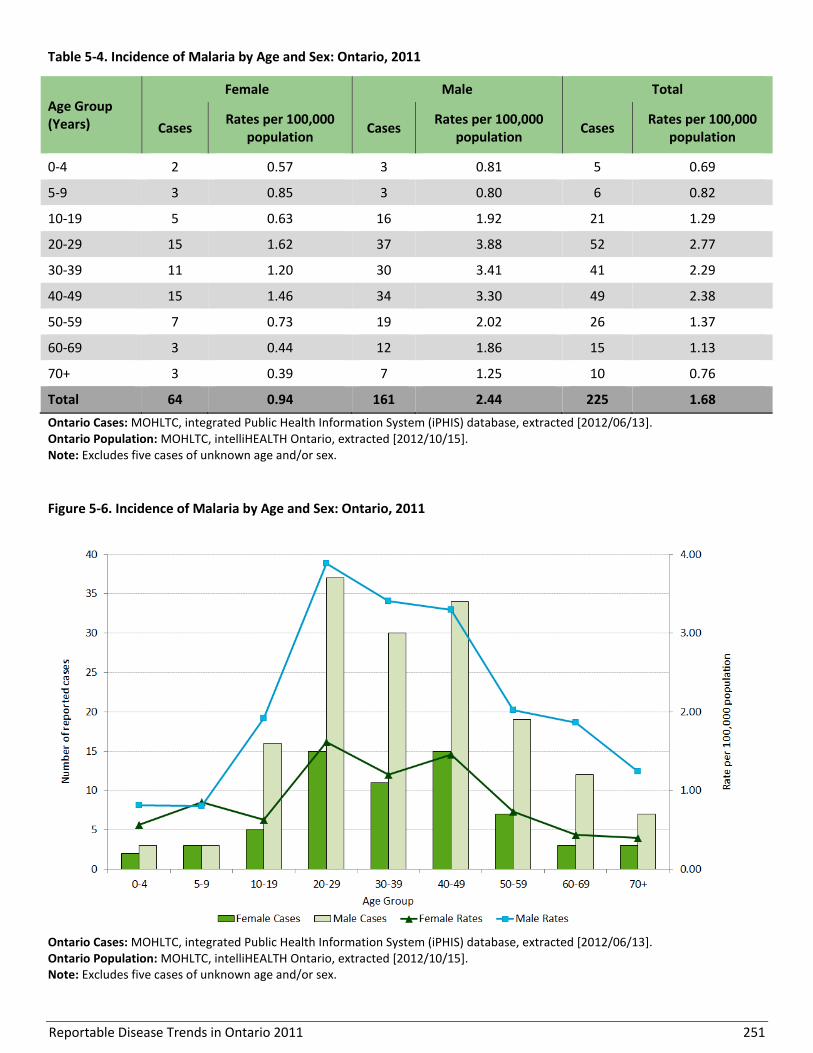
Reportable Disease Trends in Ontario 2011 251
Table 5-4. Incidence of Malaria by Age and Sex: Ontario, 2011
Age Group (Years)
Female Male Total
Cases Rates per 100,000
population Cases
Rates per 100,000 population
Cases Rates per 100,000
population
0-4 2 0.57 3 0.81 5 0.69
5-9 3 0.85 3 0.80 6 0.82
10-19 5 0.63 16 1.92 21 1.29
20-29 15 1.62 37 3.88 52 2.77
30-39 11 1.20 30 3.41 41 2.29
40-49 15 1.46 34 3.30 49 2.38
50-59 7 0.73 19 2.02 26 1.37
60-69 3 0.44 12 1.86 15 1.13
70+ 3 0.39 7 1.25 10 0.76
Total 64 0.94 161 2.44 225 1.68
Ontario Cases: MOHLTC, integrated Public Health Information System (iPHIS) database, extracted [2012/06/13]. Ontario Population: MOHLTC, intelliHEALTH Ontario, extracted [2012/10/15]. Note: Excludes five cases of unknown age and/or sex.
Figure 5-6. Incidence of Malaria by Age and Sex: Ontario, 2011
Ontario Cases: MOHLTC, integrated Public Health Information System (iPHIS) database, extracted [2012/06/13]. Ontario Population: MOHLTC, intelliHEALTH Ontario, extracted [2012/10/15]. Note: Excludes five cases of unknown age and/or sex.

Reportable Disease Trends in Ontario 2011 252
HOSPITALIZATIONS AND DEATHS
Almost 30% (65/230) of malaria cases reported in 2011
were hospitalized. Hospitalization rates among malaria
cases caused by P. falciparum, P. vivax and P. ovale
ranged from 29% to 33%, indicating that the three main
species were equally likely to result in hospitalization
among travelers returning to Ontario. No fatalities
related to malaria were reported in 2011.
MONTHLY DISTRIBUTION
Malaria cases are reported throughout the year in
Ontario with peak incidence occurring from May to
September, which is peak travel time for many
Ontarians. In 2011, these months accounted for 58%
(133/230) of reported malaria cases (Figure 5-7). Higher
incidence rates from May to September is closely
associated with the rainy season which is conducive to
the development of the mosquito vector for malaria,
The rainy season ocurrs from April to September in
travel destinations in West and East Africa commonly
reported by malaria cases.98,99
GEOGRAPHIC DISTRIBUTION
The geographical distribution of malaria cases in
Ontario mirrors settlement patterns of immigrant
populations and ties to their country of origin and most
frequent destinations of travel.100-102 Peel Region with
4.83 cases per 100,000 population, and Toronto with
3.28 cases per 100,000 population reported the highest
rates of malaria in 2011 (Map 5-2, Table 5-5). In 2011,
Peel Region and Toronto accounted for 31% of the
Ontario population, but reported 156 malaria cases,
which represents 68% of malaria cases reported in the
province in that year.
Figure 5-7. Number of Malaria Cases by Month in Ontario in 2011 and Average Number of Cases from 2006-2010
Ontario cases: MOHLTC, integrated Public Health Information System (iPHIS) database, extracted [2012/06/13].

Reportable Disease Trends in Ontario 2011 253
Map 5-2. Incidence of Malaria by Health Unit of Residence: Ontario, 2011
Ontario Cases: MOHLTC, integrated Public Health Information System (iPHIS) database, extracted [2012/06/13]. Ontario Population: MOHLTC, intelliHEALTH Ontario, extracted [2012/10/15]. Note: Heath unit (HU) refers to the HU where the case resided at the time of identification and not necessarily the place of disease exposure or acquisition.
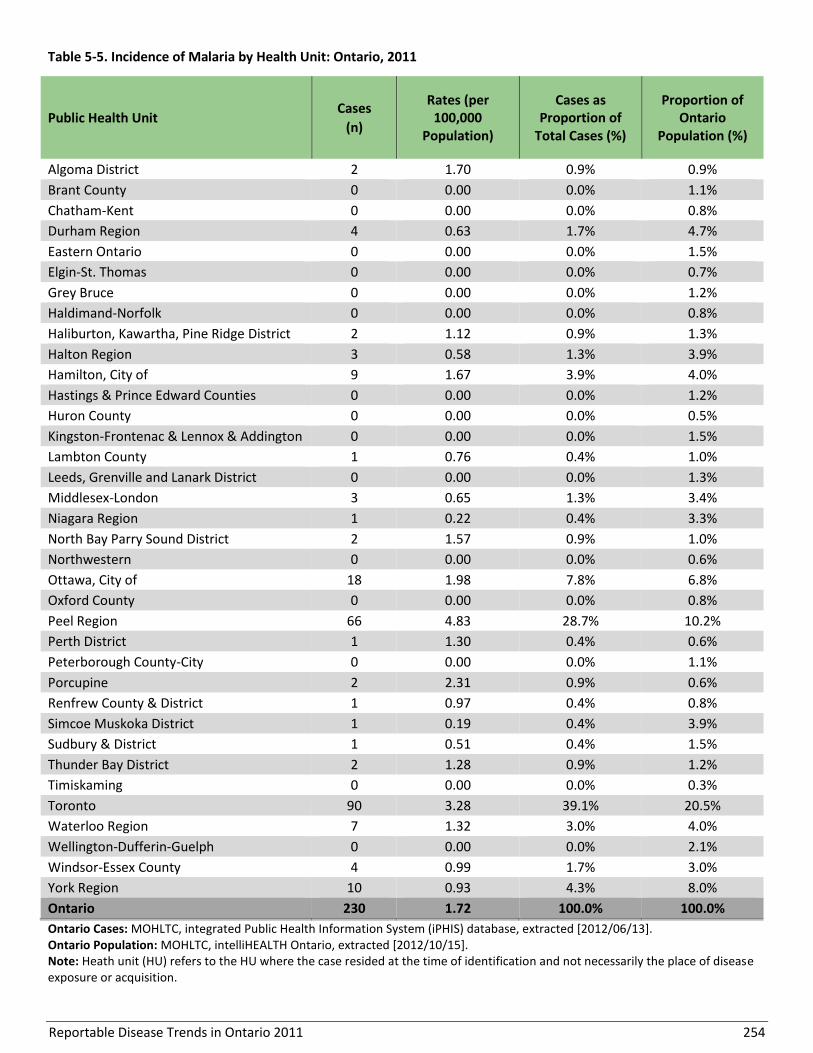
Reportable Disease Trends in Ontario 2011 254
Table 5-5. Incidence of Malaria by Health Unit: Ontario, 2011
Public Health Unit Cases
(n)
Rates (per 100,000
Population)
Cases as Proportion of
Total Cases (%)
Proportion of Ontario
Population (%)
Algoma District 2 1.70 0.9% 0.9%
Brant County 0 0.00 0.0% 1.1%
Chatham-Kent 0 0.00 0.0% 0.8%
Durham Region 4 0.63 1.7% 4.7%
Eastern Ontario 0 0.00 0.0% 1.5%
Elgin-St. Thomas 0 0.00 0.0% 0.7%
Grey Bruce 0 0.00 0.0% 1.2%
Haldimand-Norfolk 0 0.00 0.0% 0.8%
Haliburton, Kawartha, Pine Ridge District 2 1.12 0.9% 1.3%
Halton Region 3 0.58 1.3% 3.9%
Hamilton, City of 9 1.67 3.9% 4.0%
Hastings & Prince Edward Counties 0 0.00 0.0% 1.2%
Huron County 0 0.00 0.0% 0.5%
Kingston-Frontenac & Lennox & Addington 0 0.00 0.0% 1.5%
Lambton County 1 0.76 0.4% 1.0%
Leeds, Grenville and Lanark District 0 0.00 0.0% 1.3%
Middlesex-London 3 0.65 1.3% 3.4%
Niagara Region 1 0.22 0.4% 3.3%
North Bay Parry Sound District 2 1.57 0.9% 1.0%
Northwestern 0 0.00 0.0% 0.6%
Ottawa, City of 18 1.98 7.8% 6.8%
Oxford County 0 0.00 0.0% 0.8%
Peel Region 66 4.83 28.7% 10.2%
Perth District 1 1.30 0.4% 0.6%
Peterborough County-City 0 0.00 0.0% 1.1%
Porcupine 2 2.31 0.9% 0.6%
Renfrew County & District 1 0.97 0.4% 0.8%
Simcoe Muskoka District 1 0.19 0.4% 3.9%
Sudbury & District 1 0.51 0.4% 1.5%
Thunder Bay District 2 1.28 0.9% 1.2%
Timiskaming 0 0.00 0.0% 0.3%
Toronto 90 3.28 39.1% 20.5%
Waterloo Region 7 1.32 3.0% 4.0%
Wellington-Dufferin-Guelph 0 0.00 0.0% 2.1%
Windsor-Essex County 4 0.99 1.7% 3.0%
York Region 10 0.93 4.3% 8.0%
Ontario 230 1.72 100.0% 100.0%
Ontario Cases: MOHLTC, integrated Public Health Information System (iPHIS) database, extracted [2012/06/13]. Ontario Population: MOHLTC, intelliHEALTH Ontario, extracted [2012/10/15]. Note: Heath unit (HU) refers to the HU where the case resided at the time of identification and not necessarily the place of disease exposure or acquisition.
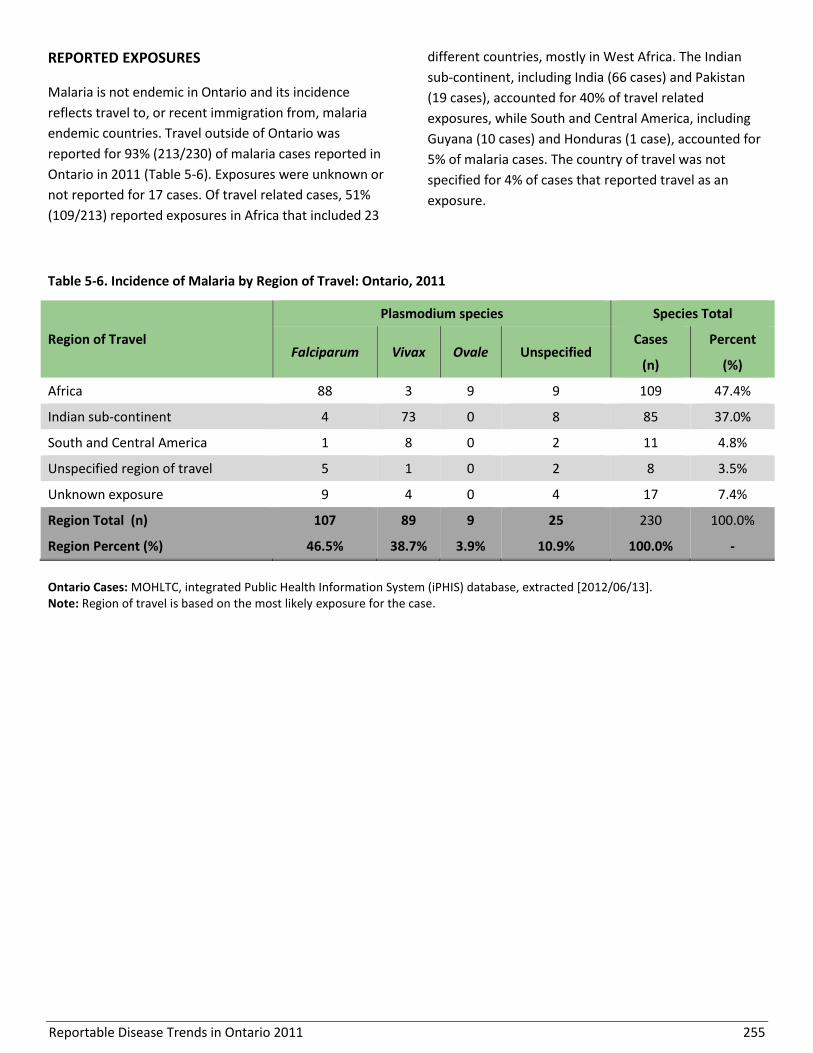
Reportable Disease Trends in Ontario 2011 255
REPORTED EXPOSURES
Malaria is not endemic in Ontario and its incidence
reflects travel to, or recent immigration from, malaria
endemic countries. Travel outside of Ontario was
reported for 93% (213/230) of malaria cases reported in
Ontario in 2011 (Table 5-6). Exposures were unknown or
not reported for 17 cases. Of travel related cases, 51%
(109/213) reported exposures in Africa that included 23
different countries, mostly in West Africa. The Indian
sub-continent, including India (66 cases) and Pakistan
(19 cases), accounted for 40% of travel related
exposures, while South and Central America, including
Guyana (10 cases) and Honduras (1 case), accounted for
5% of malaria cases. The country of travel was not
specified for 4% of cases that reported travel as an
exposure.
Table 5-6. Incidence of Malaria by Region of Travel: Ontario, 2011
Region of Travel
Plasmodium species Species Total
Falciparum Vivax Ovale Unspecified Cases Percent
(n) (%)
Africa 88 3 9 9 109 47.4%
Indian sub-continent 4 73 0 8 85 37.0%
South and Central America 1 8 0 2 11 4.8%
Unspecified region of travel 5 1 0 2 8 3.5%
Unknown exposure 9 4 0 4 17 7.4%
Region Total (n) 107 89 9 25 230 100.0%
Region Percent (%) 46.5% 38.7% 3.9% 10.9% 100.0% -
Ontario Cases: MOHLTC, integrated Public Health Information System (iPHIS) database, extracted [2012/06/13]. Note: Region of travel is based on the most likely exposure for the case.
Reportable Disease Trends in Ontario 2011 256
West Nile Virus Illness
The incidence of WNV illness in 2011 was
almost five times higher than the provincial
average for the period from 2006 to 2010.
Incidence rates of WNV illness were highest
among older adults, with the highest incidence
rates occurring in the 50-59 year age group for
both males and females.
WNV cases occurred from May to November,
with August and September accounting for
85% of cases reported in 2011.
West Nile Virus (WNV) illness is one of four vector-
borne diseases of public health importance in Ontario. It
is a mosquito-borne virus that belongs to the family
Flaviviridae.1 In Ontario, mosquitoes of the genus Culex
are the primary vectors. Infections in birds and
mosquitoes were confirmed for the first time in Ontario
in 2001 and in humans in 2002 following the emergence
of the disease in North America in 1999. The virus is
transmitted to humans through the bite of an infected
mosquito, and in rare instances through organ
transplants, blood transfusions and from mother to
child during pregnancy. Following exposures, symptoms
usually develop within two to 14 days.1 Approximately
80% of persons infected with WNV do not show any
symptoms at all, and of the 20% that do, most
experience mild illness including fever, headache, body
ache, fatigue, skin rash and occasionally vomiting and
nausea. Severe illness involving the central nervous
system occurs less frequently, affecting less than 1% of
persons infected with WNV.13
Susceptibility to WNV illness is general. However, the
risk of severe illness and/or serious outcome is greatest
among older adults, particularly those with weakened
immune systems and underlying medical conditions.1
The risk of exposure to WNV around the home can be
reduced by eliminating mosquito breeding sites,
including standing water in bird baths, eaves-troughs,
flower pots and discarded tires; by wearing protective
clothing; always using mosquito repellent when
outdoors at dawn and dusk; and by preventing
mosquito entry into the home.1
2011 IN FOCUS AND HISTORICAL HIGHLIGHTS
In 2011, 78 confirmed and probable cases of WNV
illness were reported in Ontario, representing an
incidence rate of 0.58 cases per 100,000 populations
(Figure 5-8). The incidence of WNV illness in 2011 was
higher than the annual incidence rates over the period
from 2006 to 2010 when an average of 16 cases were
reported annually. The higher incidence in 2011 was
likely influenced by a combination of a milder winter,
higher summer temperatures and lower rainfall that
resulted in favourable conditions for the development
of the mosquito vector and the virus itself.
Nationally, the overall trend in the annual incidence of
WNV illness from 2002 to 2011 was comparable to that
of Ontario, but with higher annual incidence rates for
Canada in 2003 and 2007 owing to outbreaks in western
Canada.103 In contrast, the highest number of cases in
Ontario was reported in 2002, the year in which human
cases were first identified in the province. This trend of
higher incidence in populations in which WNV is
emerging is consistent with incidence patterns in other
jurisdictions where the disease is new and susceptibility
is high.104
AGE AND SEX DISTRIBUTION
The sex distribution of WNV cases in 2011 was
approximately equal with females accounting for 46% of
total cases. For both sexes, the highest incidence rates
occurred among the 50-59, 60-69 and 70 years and
older age groups. Incidence rates were low for age
groups under 40 years (Table 5-7, Figure 5-9).
Among all cases, ages ranged from four to 89 years,
with a median age of 54 years. Cases aged 50 years and
older accounted for 68% of cases in 2011. This age
distribution is comparable to the corresponding
proportion of 55% in earlier years in Ontario from 2002
to 2010.
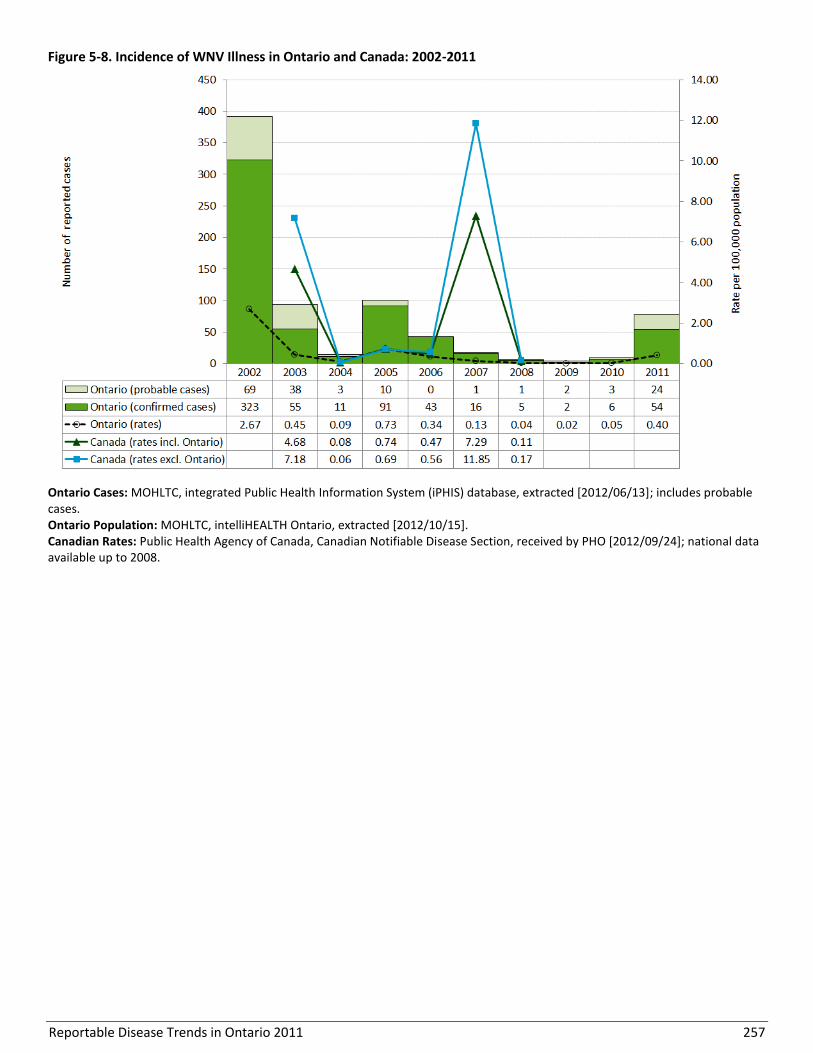
Reportable Disease Trends in Ontario 2011 257
Figure 5-8. Incidence of WNV Illness in Ontario and Canada: 2002-2011
Ontario Cases: MOHLTC, integrated Public Health Information System (iPHIS) database, extracted [2012/06/13]; includes probable cases. Ontario Population: MOHLTC, intelliHEALTH Ontario, extracted [2012/10/15]. Canadian Rates: Public Health Agency of Canada, Canadian Notifiable Disease Section, received by PHO [2012/09/24]; national data available up to 2008.
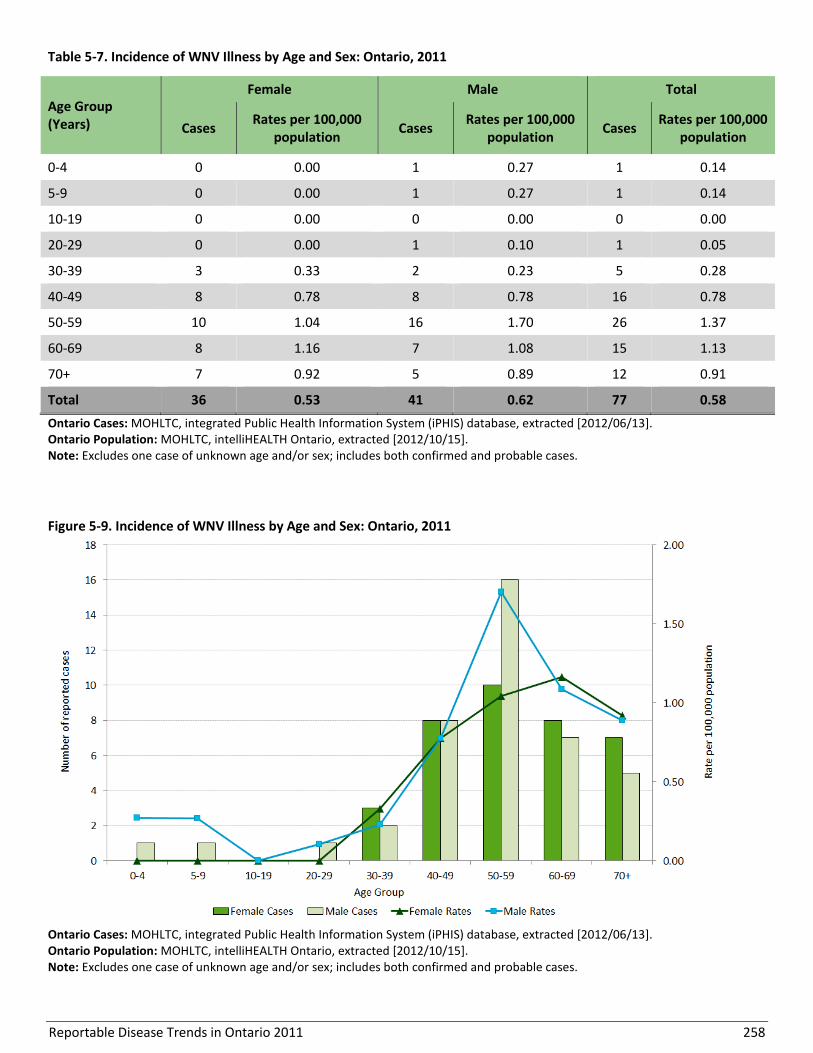
Reportable Disease Trends in Ontario 2011 258
Table 5-7. Incidence of WNV Illness by Age and Sex: Ontario, 2011
Age Group (Years)
Female Male Total
Cases Rates per 100,000
population Cases
Rates per 100,000 population
Cases Rates per 100,000
population
0-4 0 0.00 1 0.27 1 0.14
5-9 0 0.00 1 0.27 1 0.14
10-19 0 0.00 0 0.00 0 0.00
20-29 0 0.00 1 0.10 1 0.05
30-39 3 0.33 2 0.23 5 0.28
40-49 8 0.78 8 0.78 16 0.78
50-59 10 1.04 16 1.70 26 1.37
60-69 8 1.16 7 1.08 15 1.13
70+ 7 0.92 5 0.89 12 0.91
Total 36 0.53 41 0.62 77 0.58
Ontario Cases: MOHLTC, integrated Public Health Information System (iPHIS) database, extracted [2012/06/13]. Ontario Population: MOHLTC, intelliHEALTH Ontario, extracted [2012/10/15]. Note: Excludes one case of unknown age and/or sex; includes both confirmed and probable cases.
Figure 5-9. Incidence of WNV Illness by Age and Sex: Ontario, 2011
Ontario Cases: MOHLTC, integrated Public Health Information System (iPHIS) database, extracted [2012/06/13]. Ontario Population: MOHLTC, intelliHEALTH Ontario, extracted [2012/10/15]. Note: Excludes one case of unknown age and/or sex; includes both confirmed and probable cases.
Reportable Disease Trends in Ontario 2011 259
HOSPITALIZATIONS AND DEATHS
Hospitalizations were reported for 35% (27/78) of WNV
cases reported in 2011. Among hospitalized cases, 74%
(20/27) were classified as having severe illness involving
the neurological system. Fifteen percent (4/27) of cases
had milder illness and illness severity was not specified
for the remaining hospitalized cases (11%, 3/27). WNV
illness was reported as a contributing or underlying
cause of death for four percent (3/78) of cases reported
in 2011. All three deaths were classified as severe WNV
illness with neurological system involvement.
In comparison to cases with milder illness, cases with
severe illness involving the neurological system were
more likely to have a fatal outcome or to have been
hospitalized. However, this may be the result of
increased identification and reporting of cases with
more severe outcomes such as death and/or
hospitalization compared to cases with mild illness and
less severe outcomes.
SEASONALITY
The distribution of human WNV cases with respect to
the time and place of occurrence is reflective of the
seasonal distribution of the Culex mosquito vector. Culex
pipiens/restuans are most active in the warmer months
with the highest level of mosquito activity occurring
from June to August. In 2011, cases occurred from May
to November, with August (39 cases) and September (27
cases) accounting for 85% of WNV cases reported in that
year (Figure 5-10).
GEOGRAPHIC DISTRIBUTION
Exactly half (18/36) of Ontario health units did not
report any cases of WNV illness in 2011. Health units in
the south had the highest incidence rates of WNV illness
in 2011, with Brant County Health Unit having the
highest rate at 2.84 cases per 100,000 population (Map
5-3, Table 5-8). The highest number of cases was
reported in Toronto and in three other health units in
southern Ontario (Halton Region, Niagara Region and
Windsor-Essex County). Approximately 65% of WNV
cases (51/78) in 2011 were reported by these four
health units, which together accounted for 28% of the
Ontario population. The higher than expected number of
cases in these health units is reflective of the preferred
environment of the Culex pipiens/restuans mosquito
vector. These mosquito vectors are found mainly in
urban and built environments where water tends to
stand undisturbed, especially in catch basins.

Reportable Disease Trends in Ontario 2011 260
Figure 5-10. Number of WNV Illness Cases by Month in Ontario in 2011 and Average Number of Cases from 2006-2010
Ontario Cases: MOHLTC, integrated Public Health Information System (iPHIS) database, extracted [2012/06/13]. Note: Includes both confirmed and probable cases.

Reportable Disease Trends in Ontario 2011 261
Map 5-3. Incidence of WNV Illness by Health Unit of Residence: Ontario, 2011
Ontario Cases: MOHLTC, integrated Public Health Information System (iPHIS) database, extracted [2012/06/13]. Ontario Population: MOHLTC, intelliHEALTH Ontario, extracted [2012/10/15]. Note: Health unit (HU) refers to the HU where the case resided at the time of identification and not necessarily the place of disease exposure or acquisition; includes both confirmed and probable cases.

Reportable Disease Trends in Ontario 2011 262
Table 5-8. Incidence of WNV Illness by Public Health Unit of Residence: Ontario, 2011
Public Health Unit Cases
(n)
Rates (per 100,000
Population)
Cases as Proportion of
Total Cases (%)
Proportion of Ontario
Population (%)
Algoma District 0 0.00 0.0% 0.9%
Brant County 4 2.84 5.1% 1.1%
Chatham-Kent 1 0.92 1.3% 0.8%
Durham Region 2 0.32 2.6% 4.7%
Eastern Ontario 0 0.00 0.0% 1.5%
Elgin-St. Thomas 0 0.00 0.0% 0.7%
Grey Bruce 0 0.00 0.0% 1.2%
Haldimand-Norfolk 0 0.00 0.0% 0.8%
Haliburton, Kawartha, Pine Ridge District 0 0.00 0.0% 1.3%
Halton Region 9 1.74 11.5% 3.9%
Hamilton, City of 2 0.37 2.6% 4.0%
Hastings & Prince Edward Counties 1 0.61 1.3% 1.2%
Huron County 0 0.00 0.0% 0.5%
Kingston-Frontenac & Lennox & Addington 0 0.00 0.0% 1.5%
Lambton County 2 1.52 2.6% 1.0%
Leeds, Grenville and Lanark District 2 1.18 2.6% 1.3%
Middlesex-London 2 0.43 2.6% 3.4%
Niagara Region 8 1.80 10.3% 3.3%
North Bay Parry Sound District 0 0.00 0.0% 1.0%
Northwestern 0 0.00 0.0% 0.6%
Ottawa, City of 0 0.00 0.0% 6.8%
Oxford County 0 0.00 0.0% 0.8%
Peel Region 4 0.29 5.1% 10.2%
Perth District 0 0.00 0.0% 0.6%
Peterborough County-City 0 0.00 0.0% 1.1%
Porcupine 0 0.00 0.0% 0.6%
Renfrew County & District 0 0.00 0.0% 0.8%
Simcoe Muskoka District 2 0.38 2.6% 3.9%
Sudbury & District 1 0.51 1.3% 1.5%
Thunder Bay District 0 0.00 0.0% 1.2%
Timiskaming 0 0.00 0.0% 0.3%
Toronto 28 1.02 35.9% 20.5%
Waterloo Region 2 0.38 2.6% 4.0%
Wellington-Dufferin-Guelph 1 0.36 1.3% 2.1%
Windsor-Essex County 6 1.49 7.7% 3.0%
York Region 1 0.09 1.3% 8.0%
Ontario 78 0.58 100.0% 100.0%
Ontario Cases: MOHLTC, integrated Public Health Information System (iPHIS) database, extracted [2012/06/13]. Ontario Population: MOHLTC, intelliHEALTH Ontario, extracted [2012/10/15]. Note: Health unit (HU) refers to the HU where the case resided at the time of identification and not necessarily the place of disease exposure or acquisition; includes both confirmed and probable cases.
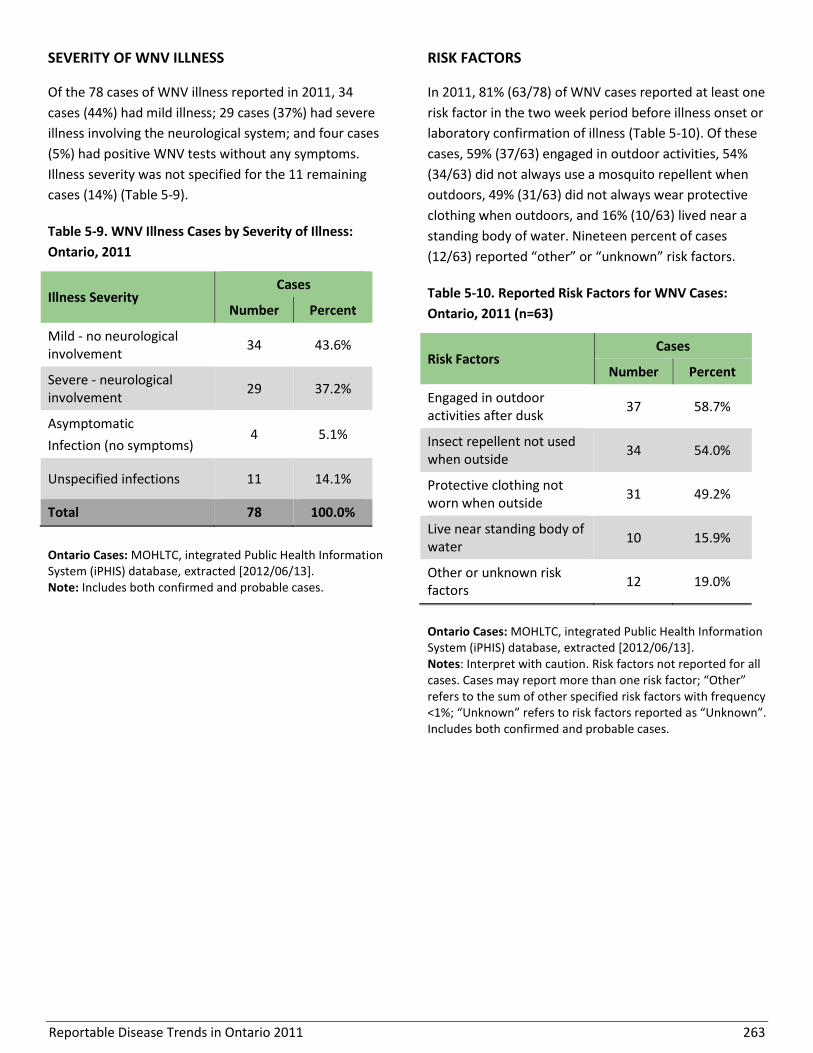
Reportable Disease Trends in Ontario 2011 263
SEVERITY OF WNV ILLNESS RISK FACTORS
Of the 78 cases of WNV illness reported in 2011, 34
cases (44%) had mild illness; 29 cases (37%) had severe
illness involving the neurological system; and four cases
(5%) had positive WNV tests without any symptoms.
Illness severity was not specified for the 11 remaining
cases (14%) (Table 5-9).
Table 5-9. WNV Illness Cases by Severity of Illness:
Ontario, 2011
Illness Severity Cases
Number Percent
Mild - no neurological involvement
34 43.6%
Severe - neurological involvement
29 37.2%
Asymptomatic
Infection (no symptoms) 4 5.1%
Unspecified infections 11 14.1%
Total 78 100.0%
Ontario Cases: MOHLTC, integrated Public Health Information System (iPHIS) database, extracted [2012/06/13]. Note: Includes both confirmed and probable cases.
In 2011, 81% (63/78) of WNV cases reported at least one
risk factor in the two week period before illness onset or
laboratory confirmation of illness (Table 5-10). Of these
cases, 59% (37/63) engaged in outdoor activities, 54%
(34/63) did not always use a mosquito repellent when
outdoors, 49% (31/63) did not always wear protective
clothing when outdoors, and 16% (10/63) lived near a
standing body of water. Nineteen percent of cases
(12/63) reported “other” or “unknown” risk factors.
Table 5-10. Reported Risk Factors for WNV Cases:
Ontario, 2011 (n=63)
Risk Factors Cases
Number Percent
Engaged in outdoor activities after dusk
37 58.7%
Insect repellent not used when outside
34 54.0%
Protective clothing not worn when outside
31 49.2%
Live near standing body of water
10 15.9%
Other or unknown risk factors
12 19.0%
Ontario Cases: MOHLTC, integrated Public Health Information System (iPHIS) database, extracted [2012/06/13]. Notes: Interpret with caution. Risk factors not reported for all cases. Cases may report more than one risk factor; “Other” refers to the sum of other specified risk factors with frequency <1%; “Unknown” refers to risk factors reported as “Unknown”. Includes both confirmed and probable cases.

Reportable Disease Trends in Ontario 2011 264
Yellow Fever
Yellow fever is a viral disease found in tropical and sub-
tropical South America and Africa.1 It is transmitted
through the bite of an infected mosquito with
symptoms developing within three to six days.1 The
disease is acute with a short duration. Symptoms range
from mild illness characterized by sudden onset of
fever, chills, body aches, weakness, nausea and
vomiting to severe liver disease with bleeding. The
overall case fatality rate of yellow fever is 20 to 50%.1
Yellow fever is not endemic in Canada. The risk of
acquiring the disease is low for most travellers. Risk can
be minimized during travel to endemic countries by
getting vaccinated prior to travel, using personal
protective measures against mosquito bites and limiting
outdoor activities, particularly in rural or jungle areas.105
2011 IN FOCUS AND HISTORICAL HIGHLIGHTS
No cases of yellow fever were reported in Ontario from
2002 to 2011 and no cases were reported in Canada
from 2002 to 2008.
Reportable Disease Trends in Ontario 2011 265
Section 6
Other Reportable Diseases
The reportable diseases covered in this section of the
report include hemorrhagic fevers, Lassa fever, leprosy
and transmissible spongiform encephalopathy (TSE).
With the exception of TSE, which is not always
infectious in etiology, these diseases are not endemic to
Canada. Transmission of these diseases varies with all
having more than one primary mode of transmission.
Overall, they are very rarely reported in Ontario. No
cases of hemorrhagic fevers, Lassa fever, and TSE were
reported in Ontario from 2002 to 2011. Over this
period, just 26 reported cases of leprosy were reported.
Several quick reference data tables for the diseases
covered in this section are included in Appendix 4.
Reportable Disease Trends in Ontario 2011 266
Hemorrhagic Fevers
Hemorrhagic fevers refer to a group of illnesses caused
mainly by viruses that belong to several distinct
families.106 Ebola, Marburg disease, dengue fever and
yellow fever are causes of viral hemorrhagic fevers. In
general, viral hemorrhagic fevers cause illness that
affects multiple systems of the body often with
hemorrhaging and other non-specific symptoms such as
high fever, headache, malaise, weakness, joint and
muscle pain and dizziness.106 Hemorrhaging may take
the form of bleeding under the skin, of internal organs
or from body orifices such as the mouth, eyes or ears.
Nervous system impairment, shock, coma, seizures and
delirium may also occur in severely ill persons.106 In the
case of dengue fever, only the hemorrhagic form of the
infection resulting in systemic illness is reportable in
Ontario.
While some viral hemorrhagic fevers cause mild illness,
the case fatality rate for others can be high, ranging
from 25 to 90% for Ebola, 25 to 80% for Marburg
disease and greater than 20% for hemorrhagic dengue
fever when supportive therapy is not provided.107-109
Viruses that cause hemorrhagic fevers are found in
animal hosts such as rodents, apes and mosquitoes.106
As a result, illness is often restricted to areas where
these animal hosts and vectors live, resulting in human
infections when human and host activities overlap.
However, once infected, humans may also serve as
sources of infection through direct or indirect (e.g.
vector-borne) contact with blood or other bodily
fluids.106
2011 IN FOCUS AND HISTORICAL HIGHLIGHTS
Most viral hemorrhagic fevers are not endemic to
Ontario and as of 2011, no cases of viral hemorrhagic
fevers have been reported in the province. No cases
were reported for the rest of Canada for the period
from 2002 to 2008.

Reportable Disease Trends in Ontario 2011 267
Lassa Fever
Lassa fever is an acute viral disease that occurs
predominantly in West Africa. It is transmitted through
direct contact with or inhalation of excreta (urine or
feces) from infected rodents and through person-to-
person contact with blood and other bodily fluids.1
About 80% of persons with Lassa fever have mild illness
or no symptoms at all, with the remaining 20%
developing severe illness that affects multiple systems.1
The symptoms of Lassa fever are non-specific and
develop between one to three weeks after exposure to
the virus. They include fever, malaise, headache,
myalgia, abdominal and chest pain, sore throat, cough,
nausea, vomiting, conjunctivitis, facial swelling and
bleeding of the mucous membranes.1 The most
frequently reported complications of Lassa fever are
deafness and fetal loss which occurs in more than 80%
of pregnant women. The overall fatality rate is one
percent but can be as high as 15% in severely ill persons
that have been hospitalized.1 The maternal death rate is
also high.
2011 IN FOCUS AND HISTORICAL HIGHLIGHTS
Lassa fever is not endemic to Ontario. As such, the risk
to Ontarians is restricted to travellers to endemic
countries that have had contact with infected rodents
and their environment. As of 2011, no cases of Lassa
fever have been reported in Ontario. The disease is not
nationally notifiable, and as such, no Canadian data are
available.
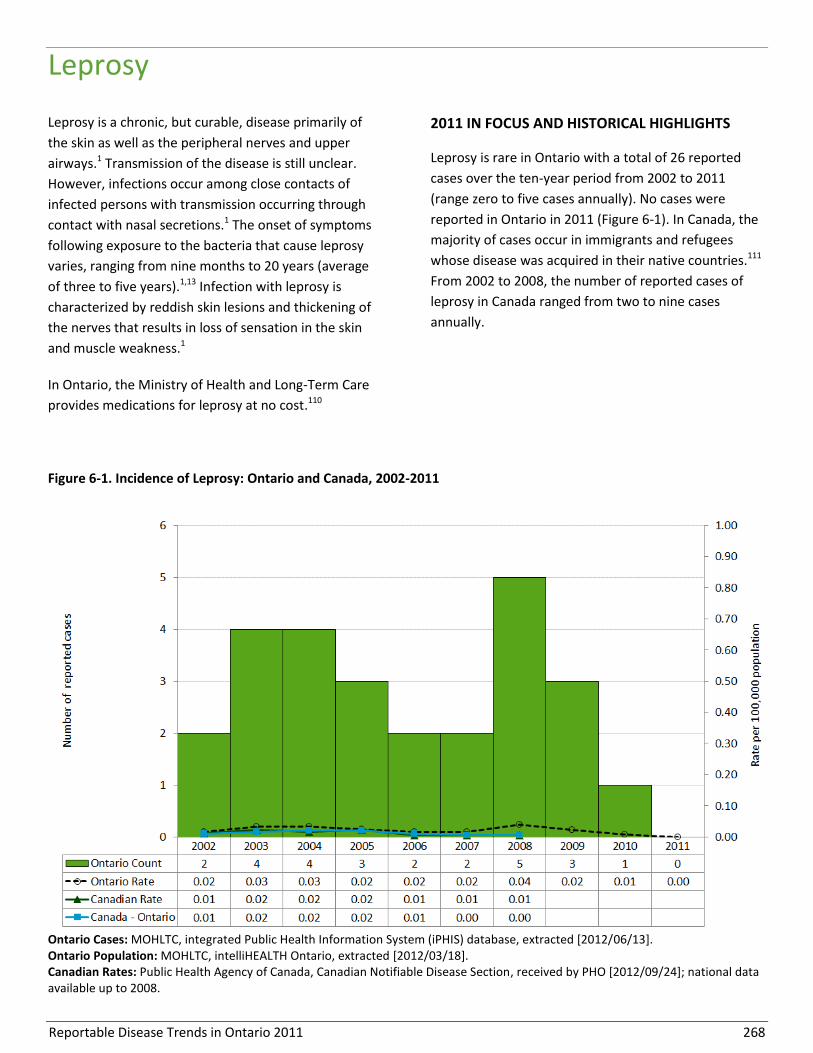
Reportable Disease Trends in Ontario 2011 268
Leprosy
Leprosy is a chronic, but curable, disease primarily of
the skin as well as the peripheral nerves and upper
airways.1 Transmission of the disease is still unclear.
However, infections occur among close contacts of
infected persons with transmission occurring through
contact with nasal secretions.1 The onset of symptoms
following exposure to the bacteria that cause leprosy
varies, ranging from nine months to 20 years (average
of three to five years).1,13 Infection with leprosy is
characterized by reddish skin lesions and thickening of
the nerves that results in loss of sensation in the skin
and muscle weakness.1
In Ontario, the Ministry of Health and Long-Term Care
provides medications for leprosy at no cost.110
2011 IN FOCUS AND HISTORICAL HIGHLIGHTS
Leprosy is rare in Ontario with a total of 26 reported
cases over the ten-year period from 2002 to 2011
(range zero to five cases annually). No cases were
reported in Ontario in 2011 (Figure 6-1). In Canada, the
majority of cases occur in immigrants and refugees
whose disease was acquired in their native countries.111
From 2002 to 2008, the number of reported cases of
leprosy in Canada ranged from two to nine cases
annually.
Figure 6-1. Incidence of Leprosy: Ontario and Canada, 2002-2011
Ontario Cases: MOHLTC, integrated Public Health Information System (iPHIS) database, extracted [2012/06/13]. Ontario Population: MOHLTC, intelliHEALTH Ontario, extracted [2012/03/18]. Canadian Rates: Public Health Agency of Canada, Canadian Notifiable Disease Section, received by PHO [2012/09/24]; national data available up to 2008.
Reportable Disease Trends in Ontario 2011 269
Transmissible Spongiform Encephalopathies
Transmissible spongiform encephalopathies (TSEs), also
known as prion diseases, are a rare group of fatal
diseases that destroy the central nervous system of
humans and certain animals.13,1 Prion diseases that
affect humans include Gerstmann-Straussler-Scheinker
syndrome, kuru, fatal familial insomnia and Creutzfeldt-
Jakob disease (CJD). CJD is the most common of the
human prion diseases.1,13 The average worldwide
incidence of prion diseases is one case per million
population per year.112
The development of prion diseases can be spontaneous,
genetic or acquired. Acquisition by humans usually
occurs through consumption of infectious prions in
contaminated meat, transplantation of contaminated
tissues and organs, or through the use of contaminated
surgical instruments. Infections may be acquired early in
life but illness may not develop for years depending on
the exposure.1 In humans, prion diseases manifest as a
dementing illness with symptoms of confusion,
cognitive and behavioural abnormalities, memory loss,
loss of coordination and speech impediments.13 These
symptoms are accompanied by the characteristic
sponge-like lesions in the brain, most often diagnosed
at autopsy.13
2011 IN FOCUS AND HISTORICAL HIGHLIGHTS
CJD is the only prion disease that is nationally notifiable.
Confirmation of cases is done at the federal laboratory
and therefore national CJD data are more complete.
Ontario data are less complete and are not presented in
this report. From 2002 to 2008, deaths from CJD in
Canada ranged from 0.92 per 100,000 population in
2003 to 1.47 per 100,000 population in 2008.112
Reportable Disease Trends in Ontario 2011 270
References
1. Heymann DL, editor. Control of communicable diseases manual. 19th
ed. Washington, DC: American Public Health Association; 2008.
2. Shelton AA. Sexually transmitted parasitic diseases. Clin Colon Rectal Surg. 2004 [cited 2013 Aug 7];17(4):231-4. Availablefrom: http://www.ncbi.nlm.nih.gov/pmc/articles/PMC2780057/pdf/ccrs17231.pdf.
3. Keystone JS, Keystone DL, Proctor EM. Intestinal parasitic infections in homosexual men: prevalence, symptoms and factors in transmission. Can Med Assoc J. 1980 [cited 2013 Aug 7];123(6):512-4.Availablefrom: http://www.ncbi.nlm.nih.gov/pmc/articles/PMC1704818/pdf/canmedaj01466-0054.pdf.
4. Nevas M, Lindstro M, Virtanen A, Hielm S, Kuusi M, Arnon SS, et al. Infant botulism acquired from household dust presenting as sudden infant death syndrome. J Clin Microbiol. 2005 [cited 2013 Aug 7];43(1):511-3. Available from: http://www.ncbi.nlm.nih.gov/pmc/articles/PMC540168/pdf/1297-04.pdf.
5. Johnson EA, Tepp WH, Bradshaw M, Gilbert RJ, Cook PE, David E, et al. Characterization of Clostridium botulinum strains associated with an infant botulism case in the United Kingdom. J Clin Microbial. 2005 [cited 2013 Aug 7];43(6):2602-7. Available from: http://www.ncbi.nlm.nih.gov/pmc/articles/PMC1151885/pdf/1310-04.pdf.
6. Passaro DJ, Werner SB, McGee J, Mac Kenzie WR, Vugia DJ. Wound botulism associated with black tar heroin among injecting drug users. JAMA. 1998 [cited 2013 Sept 26];279(11):859-63. Available from: http://jama.jamanetwork.com/article.aspx?articleid=187346.
7. Ontario. Ministry of Health and Long-Term Care. Infectious diseases protocol, 2009. Appendix A: disease specific chapters. Chapter: Brucellosis. Toronto, ON: Queen’s Printer for Ontario; 2009 [cited 2013 Jan 30]. Available from: http://www.health.gov.on.ca/en/pro/programs/publichealth/oph_standards/docs/brucellosis_chapter.pdf
8. Hale CR, Scallan E, Cronquist AB, Dunn J, Smith K, et al. Estimates of enteric illness attributable to contact with animals and their environments in the United States. Clin Infect Dis. 2012;54 Suppl 5:S472-9.
9. Nesbitt AS. Food consumption patterns, home food safety practices and gastrointestinal health in a Canadian community [master’s thesis]. Guelph, ON: University of Guelph; 2006.
10. Ontario. Ministry of Health and Long-Term Care. Infectious diseases protocol, 2009. Appendix A: disease specific chapters. Chapter: Cholera. Toronto, ON: Queen’s Printer for Ontario; 2009 [cited 2013 Jan 30]. Available from: http://www.health.gov.on.ca/en/pro/programs/publichealth/oph_standards/docs/cholera_chapter.pdf.
11. Ontario. Ministry of Health and Long-Term Care. Infectious diseases protocol, 2009. Appendix A: disease specific Chapters. Chapter: Cyclosporiasis. Toronto, ON: Queen’s Printer for Ontario; 2009 [cited 2013 Jan 17]. Available from: http://www.health.gov.on.ca/en/pro/programs/publichealth/oph_standards/docs/cyclosporiasis_chapter.pdf.
12. Health Canada. Cyclospora (Parasites). Ottawa, ON: Her Majesty the Queen in Right of Canada; 2011 [cited 2013 May 21]. Available from: http://web.archive.org/web/20130530021523/http://www.hc-sc.gc.ca/fn-an/securit/ill-intox/cyclo-eng.php.
13. Pickering LK, Baker CJ, Kimberlin DW, Long SS, editors. Red book: 2012 report of the Committee on Infectious Diseases. 29th
ed. Elk Grove Village, IL: American Academy of Pediatrics; 2012.
14. Veenemans J, Mank T, Ottenhof M, Baidjoe A, et al. Protection against diarrhea associated with Giardia intestinalis is lost with multi-nutrient supplementation: a study in Tanzanian children. PLoS Negl Trop Dis. 2011 [cited 2013 Aug 7];5(6):e1158. Available from: http://www.ncbi.nlm.nih.gov/pmc/articles/PMC3110167/pdf/pntd.0001158.pdf.
15. Drebot MA, Artsob H, Werker D. Hantavirus pulmonary syndrome in Canada, 1989-1999. Can Commun Dis Rep. 2000;26(8):65-9.
16. National Advisory Committee on Immunization; Public Health Agency of Canada. Canadian immunization guide. Part 4 active vaccines: Hepatitis A vaccines. Ottawa, ON: Her Majesty the Queen in Right of Canada; 2006 [cited 2013 May 21]. Available from: http://www.phac-aspc.gc.ca/publicat/cig-gci/p04-hepa-eng.php.
Reportable Disease Trends in Ontario 2011 271
17. Corey L, Holmes KK. Sexual transmission of hepatitis A in homosexual men: incidence and mechanism. N Engl J Med. 1980;302(8):435-8.
18. Public Health Agency of Canada. Lessons learned: Public Health Agency of Canada’s response to the 2008 Listeriosis outbreak. Ottawa, ON: Her Majesty the Queen in Right of Canada; 2008 [cited 2013 Mar 3]. Available from: http://www.phac-aspc.gc.ca/fs-sa/listeria/2008-lessons-lecons-eng.php#bc.
19. Scallan E, Hoekstra RM, Angulo FJ, Tauxe RV, Widdowson M-A, Roy RL, et al. Foodborne illness acquired in the United States—major pathogens. Emerg Infect Dis. 2011 [cited 2013 Aug 7];17(1):7–15. Available from: http://www.ncbi.nlm.nih.gov/pmc/articles/PMC3375761/pdf/09-1101p1_finalR.pdf.
20. Ontario. Ministry of Health and Long-Term Care. Infectious diseases protocol, 2009. Appendix A: Disease specific chapters. Chapter: Paratyphoid fever. Toronto, ON: Queen’s Printer for Ontario; 2009 [cited 2013 Jan 23]. Available from: http://www.health.gov.on.ca/en/pro/programs/publichealth/oph_standards/docs/paratyphoid_fever_chapter.pdf.
21. Ontario. Ministry of Tourism, Culture and Sport. Ontario’s immigrant travel market and its impact on domestic travel. Toronto, ON: Queen’s Printer for Ontario; 2007 [cited 2013 Sept 26]. Available from: http://www.mtc.gov.on.ca/en/research/travel_activities/TAMS_2006_Canadian_Immigrants_Report.pdf.
22. Statistics Canada. Immigration and ethnocultural diversity in Canada - national household survey, 2011. Statistics Canada Catalogue no. 99-010-X2011001. Ottawa, ON: Minister of Industry; 2013 [cited 2013 May 13]. Available from: http://www12.statcan.gc.ca/nhs-enm/2011/as-sa/99-010-x/99-010-x2011001-eng.pdf.
23. Public Health Agency of Canada (homepage on the Internet). Ottawa, ON: Her Majesty the Queen in Right of Canada; 2010. The plague. 2010 Aug 13 [cited 2013 Mar 27]. Available from: http://www.phac-aspc.gc.ca/ep-mu/plague-eng.php.
24. Canadian Centre for Occupational Health and Safety (homepage on the Internet). Hamilton, ON: Canadian Centre for Occupational Health and Safety; c2009.Psittacosis. 2009 Feb 2 [cited 2013 Mar 27]. Available from: http://www.ccohs.ca/oshanswers/diseases/psittacosis.html.
25. Ontario Agency for Health Protection and Promotion (Public Health Ontario). Monthly infectious diseases surveillance report. 1(7). Toronto, ON: Queen's Printer for Ontario; 2012 [cited 2013 Jan 30]. Available from: http://www.publichealthontario.ca/en/DataAndAnalytics/Documents/2012_June_PHO_Monthly_Report.pdf.
26. Ontario Agency for Health Protection and Promotion (Public Health Ontario). Monthly infectious diseases surveillance report. 1(10). Toronto, ON: Queen’s Printer for Ontario; 2012 [cited 2012 Jan 30]. Available from: http://www.publichealthontario.ca/en/DataAndAnalytics/Documents/2012_September_PHO_Monthly_Report.pdf.
27. MacInnes CD, Smith SM, Tinline RR, Ayers NR, Bachmann P, Ball DGA, et al. Elimination of rabies from red foxes in eastern Ontario. J Wildl Dis. 2001;37(1):119-32.
28. National Advisory Committee on Immunization; Public Health Agency of Canada. Canadian immunization guide. Part 4 active vaccines: rabies vaccine. Ottawa, ON: Her Majesty the Queen in Right of Canada; 2006 [cited 2013 May 13]. Available from: http://www.phac-aspc.gc.ca/publicat/cig-gci/p04-rabi-rage-eng.php#sched.
29. Thomas MK, Majowicz SE, Pollari F, Sockett PN. Burden of acute gastrointestinal illness in Canada, 1997-2007: interim summary of NSAGI activities. Can Commun Dis Rep. 2008;34(5):8-15.
30. Ahmed R, Anderson M, Ellis A, Fleury M, Landry L, MacDonald D, et al. Outbreak of Salmonella Enteritidis Phage Type 13 associated with mung bean sprouts in Ontario, 2005. Outbreak investigation; 2006 [cited 2013 May 21]. Available from: http://www.sproutnet.com/pdfs/Toronto-Mung-2005.pdf.
31. Middlesex-London Health Unit. Salmonella outbreak at the University of Western Ontario. London, ON: Middlesex-London Health Unit; 2008 [cited 2013 May 21]. Available from: https://www.healthunit.com/uploads/mlhu-salmonella-outbreak-uwo.pdf.
32. Ontario Agency for Health Protection and Promotion (Public Health Ontario). Monthly infectious diseases surveillance report. 1(6). Toronto, ON: Queen’s Printer for Ontario; 2012 [cited 2013 Aug 7]. http://www.publichealthontario.ca/en/DataAndAnalytics/Documents/2012_May_PHO_Monthly_Report.pdf.
Reportable Disease Trends in Ontario 2011 272
33. Public Health Agency of Canada. Supplement: Canadian integrated surveillance report: Salmonella, campylobacter, verotoxigenic E. coli and shigella, from 2000 to 2004. Can Commun Dis Rep. 2009 [cited 2013 Sept 26];35S3. Available from: http://www.phac-aspc.gc.ca/publicat/ccdr-rmtc/09vol35/35s3/index-eng.php#toc.
34. Public Health Agency of Canada (homepage on the Internet). Ottawa, ON: Her Majesty the Queen in Right of Canada; 2011.Trichinella pathogen safety data sheet – infectious substances. 2011 Apr 19 [cited 2013 May 13]. Available from: http://www.phac-aspc.gc.ca/lab-bio/res/psds-ftss/trichinella-eng.php#cont.
35. Public Health Agency of Canada. Notifiable diseases on-line: national notifiable diseases: Trichinosis. Toronto, ON: Queen's Printer for Ontario; 2006 [cited 2013 Mar 28]. Available from: http://web.archive.org/web/20120722145614/http://dsol-smed.phac-aspc.gc.ca/dsol-smed/ndis/disease2/tric-eng.php.
36. Ontario. Ministry of Health and Long-Term Care. Infectious diseases protocol, 2009. Appendix A: disease specific chapters. Chapter: Typhoid fever. Toronto, ON: Queen’s Printer for Ontario; 2009 [cited 2013 Jan 24]. Available from: http://www.health.gov.on.ca/en/pro/programs/publichealth/oph_standards/docs/typhoid_fever_chapter.pdf.
37. National Advisory Committee on Immunization; Public Health Agency of Canada. Canadian immunization guide. Part 4 active vaccines: Typhoid vaccine. Ottawa, ON: Her Majesty the Queen in Right of Canada; 2006 [cited 2013 May 15]. Available from: http://www.phac-aspc.gc.ca/publicat/cig-gci/p04-typh-eng.php.
38. Public Health Agency of Canada. Supplement: guidelines for the prevention and control of invasive group A streptococcal disease. Can Commun Dis Rep. 2006 [cited 2012 Dec 10];32S2.Available from: http://www.phac-aspc.gc.ca/publicat/ccdr-rmtc/06vol32/32s2/index-eng.php.
39. Centers for Disease Control and Prevention, Department of Health and Human Services (homepage on the Internet). Atlanta, GA: Centers for Diseas Control and Prevention; 2008. Group A Streptococcal (GAS) Disease. 2008 Apr 3 [cited 2013 Jul 22]. Available from: http://www.cdc.gov/ncidod/dbmd/diseaseinfo/groupastreptococcal_g.htm.
40. Conway JM, Tuite AR, Fisman DN, Hupert N, Meza R, Davoudi B, et al. Vaccination against 2009 pandemic H1N1 in a population dynamical model of Vancouver, Canada: timing is everything. BMC Pubic Health. 2011 [cited 2013 Aug 7];11:932. Available from: http://www.ncbi.nlm.nih.gov/pmc/articles/PMC3280345/pdf/1471-2458-11-932.pdf.
41. Jefferson T, Di Pietrantonj C, Rivetti A, Bawazeer GA, Al-Ansary LA, Ferroni E. Vaccines for preventing influenza in healthy adults. Cochrane Database Syst Rev. 2010;7:CD001269.
42. Rivetti D, Jefferson T, Thomas R, Rudin M, Rivetti A, Pietrantonj C, et al. Vaccines for preventing influenza in the elderly. Cochrane Database Syst Rev. 2006;3:CD004876.
43. Ng V, Tang P, Jamieson F, Guyard C, Low DE, Fisman DN. Laboratory-based evaluation of legionellosis epidemiology in Ontario, Canada, 1978 to 2006. BMC Infect Dis. 2009 [cited 2013 Aug 7];9:68. Available from: http://www.ncbi.nlm.nih.gov/pmc/articles/PMC2695468/pdf/1471-2334-9-68.pdf.
44. Ontario. Ministry of Health and Long-Term Care. Infectious diseases protocol, 2009. Appendix A: disease specific chapters. Chapter: Severe Acute Respiratory Syndrome (SARS). Toronto, ON: Queen’s Printer for Ontario; 2009 [cited 2013 Feb 8]. Available from: http://www.health.gov.on.ca/en/pro/programs/publichealth/oph_standards/docs/sars_chapter.pdf.
45. Public Health Agency of Canada. Health issues. Interim: emergency response to an outbreak of smallpox. Ottawa, ON: Her Majesty the Queen in Right of Canada; 2004 [cited 2013 Feb 8]. Available from: http://www.phac-aspc.gc.ca/media/issues/smallpox-eng.php.
46. Ontario. Ministry of Health and Long-Term Care. Infectious diseases protocol, 2009. Appendix A: disease specific chapters. Chapter: Smallpox. Toronto, ON: Queen’s Printer for Ontario; 2009 [cited 2013 Feb 8]. Availabe from:. http://www.health.gov.on.ca/en/pro/programs/publichealth/oph_standards/docs/smallpox_chapter.pdf.
47. Public Health Agency of Canada (homepage on the Internet). Ottawa, ON: Her Majesty the Queen in Right of Canada; 2004. Smallpox. 2004 Jul 23 [cited 2013 Feb 8]. Available from: http://www.phac-aspc.gc.ca/ep-mu/smallpox-eng.php#s12.
48. Conde MB, Loivos AC, Rezende VM et , Soares SL, Mello FC, Reingold AL, et al. Yield of sputum induction in the diagnosis of pleural tuberculosis. Am J Respir Crit Care Med. 2003;167(5):723-5.

Reportable Disease Trends in Ontario 2011 273
49. Ontario. Ministry of Health and Long-Term Care. Infectious diseases protocol, 2009. Appendix A: disease-specific chapters. Chapter: Chlamydia trachomatis infections. Toronto, ON: Queen’s Printer for Ontario; 2009 [cited 2013 Mar 1]. Available from: http://www.health.gov.on.ca/en/pro/programs/publichealth/oph_standards/docs/chlamydia_chapter.pdf.
50. Expert Working Group on the Canadian guidelines on sexually transmitted infections. Revised version of the Canadian STI guidelines - 2006 ed. Ottawa, ON: Her Majesty the Queen in Right of Canada; 2008. Available from: http://www.phac-aspc.gc.ca/std-mts/sti_2006/pdf/Guidelines_Eng_complete_06-26-08.pdf.
51. Ontario. Ministry of Health and Long-Term Care. Infectious diseases protocol, 2009. Appendix A: disease-specific chapters. Chapter: Group B streptococcal disease, neonatal. Toronto, ON: Queen’s Printer for Ontario; 2009 [cited 2013 Mar 1]. Available from: http://www.health.gov.on.ca/en/pro/programs/publichealth/oph_standards/docs/group_b_strep_chapter.pdf.
52. Ontario. Ministry of Health and Long-Term Care. Infectious diseases protocol, 2009. Appendix A: disease-specific chapters. Chapter: Hepatitis B. Toronto, ON: Queen’s Printer for Ontario; 2009 [cited 2013 Mar 1]. Available from: http://www.health.gov.on.ca/en/pro/programs/publichealth/oph_standards/docs/hep_b_chapter.pdf.
53. Ontario. Ministry of Health and Long-Term Care. Publicly funded immunization schedules for Ontario – August 2011. Toronto, ON: Queen’s Printer for Ontario; 2011 [cited 2013 Mar 1]. Available from: http://www.health.gov.on.ca/en/public/programs/immunization/docs/schedule.pdf.
54. Ontario. Ministry of Health and Long-Term Care. Infectious diseases protocol, 2009. Appendix A: disease-specific chapters. Chapter: Hepatitis C. Toronto, ON: Queen’s Printer for Ontario; 2009 [cited 2013 Mar 1]. Available from: http://www.health.gov.on.ca/en/pro/programs/publichealth/oph_standards/docs/hep_c_chapter.pdf.
55. Pickering LK, Baker CJ, Kimberlin DW, Long SS, editors. Red book: 2006 report of the Committee on Infectious Diseases. 27th
ed. Elk Grove Village, IL: American Academy of Pediatrics; 2006.
56. SOGC Clinical Practice Guideline. Guideline for the management of Herpes Simplex virus in pregnancy. Ottawa, ON: Society of Obstetricians and Gynacologists of Canada; 2008 [cited 2013 Apr 12]. Available from: http://www.sogc.org/guidelines/documents/gui208CPg0806.pdf.
57. Ontario. Ministry of Health and Long-Term Care. Infectious diseases protocol, 2009. Appendix A: disease-specific chapters. Chapter: Acquired Immunodeficiency Syndrome (AIDS). Toronto, ON: Queen’s Printer for Ontario; 2009 [cited 2013 Mar 1]. Available from: http://www.health.gov.on.ca/en/pro/programs/publichealth/oph_standards/docs/aids_chapter.pdf.
58. Ontario Advisory Committee on HIV/AIDS (OACHA). A proposed HIV/AIDS strategy for Ontario to 2008. Toronto, Ontario: Queen's Printer for Ontario; 2002 [cited 2013 Apr 30]. Available from: http://www.ohtn.on.ca/Documents/Publications/hivaids_strategy_ontario_2008.pdf.
59. McKay, Alexander. Strategies To Reduce The Incidence Of Infectious Syphilis Among Men Who Have Sex With Men: A Literature Review And Analysis .Toronto, ON: Sex Information and Education Council of Canada (SIECCAN); 2010.
60. Leber A, MacPherson P, Lee BC. Epidemiology of infectious syphilis in Ottawa. Recurring themes revisited.Can J Public Health. 2008 Sep-Oct;99(5):401-5.
61. Public Health Agency of Canada (homepage on the Internet). Ottawa, ON: Her Majesty the Queen in Right of Canada; 2012. Immunization & vaccines: vaccine-preventable diseases: Diphtheria. 2012 Jul 20 [cited 2013 Feb 26]. Available from: http://www.phac-aspc.gc.ca/im/vpd-mev/diphtheria-eng.php.
62. Public Health Agency of Canada (homepage on the Internet). Ottawa, ON: Her Majesty the Queen in Right of Canada; 2012. Immunization & vaccines: vaccine-preventable diseases: Invasive Haemophilus Influenzae Disease. 2012 Jul 16 [cited 2013 Feb 26]. Available from: http://www.phac-aspc.gc.ca/im/vpd-mev/hib-eng.php.
63. National Advisory Committee on Immunization; Public Health Agency of Canada. Canadian immunization guide. Part 4 active vaccines: measles vaccine. Ottawa, ON: Her Majesty the Queen in Right of Canada; 2006 [cited 2013 Feb 22]. Available from: http://www.phac-aspc.gc.ca/publicat/cig-gci/p04-meas-roug-eng.php.
64. Dallaire F, De Serres G, Tremblay FW, Markowski F, Tipples G. Long-lasting measles outbreak affecting several unrelated networks of unvaccinated persons. J Infect Dis. 2009 [cited 2014 Jan 8];200(10):1602-5. Available from: http://jid.oxfordjournals.org/content/200/10/1602.long.
Reportable Disease Trends in Ontario 2011 274
65. Hutchins SS, Dezavas A, Le Blond K, Heath J, Bellini W, Audet S, et al. Evaluation of an early two-dose measles vaccination schedule. Am J Epidemiol. 2001;154(11):1064-71.
66. Ontario Agency for Health Protection and Promotion (Public Health Ontario). Monthly infectious diseases surveillance report. 1(12). Toronto, ON: Queen’s Printer for Ontario; 2012 [cited 2013 May 15]. Available from: http://osd.oahpp.ca/en/DataAndAnalytics/Documents/2012_November_PHO_Monthly_Report.pdf.
67. Public Health Agency of Canada. Elimination of measles, rubella and congenital rubella syndrome in Canada: documentation and verification report. Executive Summary. Ottawa, ON: Her Majesty the Queen in Right of Canada; 2011 [2013 May 15]. Available from: http://www.phac-aspc.gc.ca/im/vpd-mev/measles-rougeole-mrer-eng.php.
68. Pan American Health Organization, Regional Office of the World Health Organization. Plan of action for the documentation and verification of measles, rubella, and congenital rubella syndrome elimination in the region of the Americas. Washington, DC: Pan American Health Organization; 2011. Available from: http://www.paho.org/hq/index.php?option=com_docman&task=doc_download&gid=16739&Itemid=&lang=en.
69. Santé et Services Sociaux Québec. Final report on the provincial outbreak of measles in 2011. Québec, QC: Gouvernement du Québec; 2013 [cited 2013 Jul 16]. Available from: http://www.msss.gouv.qc.ca/en/sujets/prob_sante/measles/portrait2011.php.
70. National Advisory Committee on Immunization; Public Health Agency of Canada. Canadian immunization guide. Part 4 active vaccines: meningococcal vaccine. Ottawa, ON: Her Majesty the Queen in Right of Canada; 2006 [cited 2013 Feb 20]. Available from: http://www.phac-aspc.gc.ca/publicat/cig-gci/p04-meni-eng.php.
71. Enhanced surveillance of invasive meningococcal disease in Canada: 1 January, 2004, through 31 Dec, 2005. Can Commun Dis Rep. 2007;33(10):1-15
72. Wormsbecker A, Jamieson F, Crowcroft NS, Tsang RSW, Rawte P, Lim GH, et al. Meningococcal and haemophilus influenza epidemiology. Poster abstract session presented at: Serogroup C invasive meningococcal disease (IMD) in Ontario, Canada, 2000 – 2011: vaccine impact assessment. 2012 Oct 17-21; San Diego, CA. Available from: https://idsa.confex.com/idsa/2012/webprogram/Paper35801.html.
73. Dang V, Jamieson FB, Wilson S, Rawte P, Crowcroft NS, Johnson K, et al. Epidemiology of serogroup B invasive meningococcal disease in Ontario, Canada, 2000 to 2010. BMC Infect Dis. 2012 [cited 2013 Aug 7];12:202. Available from: http://www.ncbi.nlm.nih.gov/pmc/articles/PMC3472197/pdf/1471-2334-12-202.pdf.
74. Public Health Agency of Canada. Supplement: guidelines for the prevention and control of mumps outbreaks in Canada. Can Commun Di Rep. 2010;36(S1). Available from: http://www.phac-aspc.gc.ca/publicat/ccdr-rmtc/10vol36/36s1/.
75. National Advisory Committee on Immunization; Public Health Agency of Canada. Canadian immunization guide. Part 4 active vaccines: mumps vaccine. Ottawa, ON: Her Majesty the Queen in Right of Canada; 2006 [cited 2013 Jan 29]. Available from: http://www.phac-aspc.gc.ca/publicat/cig-gci/p04-mump-orei-eng.php.
76. Deeks SL, Lim GH, Simpson MA, Gagne L, Gubbay J, Kristjanson E, et al. An assessment of mumps vaccine effectiveness by dose during an outbreak in Canada. CMAJ. 2011 [cited 2013 Feb 7];183(9):1014:1020. Available from: http://www.cmaj.ca/content/183/9/1014.full.
77. Deeks S, De Serres G, Boulianne N, Duval B, Rochette L, Dery P, et al. Failure of physicians to consider the diagnosis of pertussis in children. Clin Inf Dis. 1999;28(4):840-6.
78. Final report of outcomes from the National Consensus Conference for Vaccine-Preventable Diseases in Canada, June 12-14, 2005 - Quebec city, Quebec. CCDR. 2008;34(Suppl 2):1-56.
79. Skrowronski DM, De Serres G, MacDonald D, Wu W, Shaw C, Macnabb J, et al. The changing age and seasonal profile of pertussis in Canada. J Infect Dis. 2002;185(10):1448-53.
80. National Advisory Committee on Immunization; Public Health Agency of Canada. Canadian immunization guide. Part 4 active vaccines: Pneumococcal vaccine. Ottawa, ON: Her Majesty the Queen in Right of Canada; 2006 [cited 2013 Aug 7]. Available from http://www.phac-aspc.gc.ca/publicat/cig-gci/p04-pneu-eng.php.
Reportable Disease Trends in Ontario 2011 275
81. Ontario. Ministry of Health and Long-Term Care. Publicly funded immunization schedules for Ontario – January 2009. Toronto, ON: Queen's Printer for Ontario; 2009 [cited 2013 Feb 19]. Available from: http://www.health.gov.on.ca/english/providers/program/immun/pdf/schedule.pdf.
82. Kuster SP, Tuite AR, Kwong JC, McGeer A; Toronto Invasive Bacterial Diseases Network Investigators; Fisman DN. Evaluation of co-seasonality of influenza and invasive pneumococcal disease: results from prospective surveillance. PLoS Med. 2011;8(6):1-9.
83. Lim GH, Wormsbecker AE, McGeer A, Pillai DR, Gubbay JB, Rudnick W, et al. Have changing pneumococcal vaccination programs impacted disease in Ontario? Vaccine.2013;31(24):2680-5.
84. National Advisory Committee on Immunization; Public Health Agency of Canada. Canadian immunization guide. Part 4 active vaccines: Poliomyelitis vaccine. Ottawa, ON: Her Majesty the Queen in Right of Canada; 2006 [cited 2013 Feb 25]. Available from: http://www.phac-aspc.gc.ca/publicat/cig-gci/p04-poli-eng.php.
85. Ontario. Ministry of Health and Long-Term Care. Infectious diseases protocol, revised January 2013. Appendix A: disease specific chapters. Chapter: Rubella.Toronto, ON: Queen’s Printer for Ontario; 2013 [cited 2013 Feb 22]. Available from: http://www.health.gov.on.ca/en/pro/programs/publichealth/oph_standards/docs/rubella_chapter.pdf.
86. National Advisory Committee on Immunization; Public Health Agency of Canada. Canadian immunization guide. Part 4 active vaccines: Rubella vaccine. Ottawa, ON: Her Majesty the Queen in Right of Canada; 2006 [cited 2013 Feb 22]. Available from: http://www.phac-aspc.gc.ca/publicat/cig-gci/p04-rube-eng.php.
87. Dontigny L, Arsenault M-Y, Martel M-J, Biringer A, Cormier J; Society of Obstetricians and Gyneacologists of Canada, et al. Rubella in pregnancy. JOGC. 2008 [cited 2013 Aug 7];30(2):152:158. Available from: http://www.sogc.org/guidelines/documents/guiJOGC203CPG0802.pdf.
88. McIntyre MA, Lim GH, Wormsbecker AE, Scott T, Fediurek J. Immunization coverage in Ontario: estimates and reported challenges. Paper presented at: Canadian Immunization Conference. 2012 Dec; Vancouver, BC.
89. Public Health Agency of Canada (homepage on the Internet). Ottawa, ON: Her Majesty the Queen in Right of Canada; 2012. Immunization & vaccines: vaccine-preventable diseases: Rubella. 2012 Jul 23 [cited 2013 Feb 22]. Available from: http://www.phac-aspc.gc.ca/im/vpd-mev/rubella-eng.php.
90. National Advisory Committee on Immunization; Public Health Agency of Canada. Canadian immunization guide. Part 4 active vaccines: Tetanus toxoid. Ottawa, ON: Her Majesty the Queen in Right of Canada; 2006 [cited 2013 Feb 22]. Available from: http://www.phac-aspc.gc.ca/publicat/cig-gci/p04-tet-eng.php.
91. Centers for Disease Control and Prevention. Epidemiology and prevention of vaccine-preventable diseases: Tetanus. In: Atkinson W, Hamborsky J, Wolfe S, eds. The pink book: course textbook - 12th edition second printing (May 2012). Washington, DC: Public Health Foundation; 2012. Available from http://www.cdc.gov/vaccines/pubs/pinkbook/tetanus.html.
92. Ontario Agency for Health Protection and Promotion (Public Health Ontario). Technical report: update on lyme disease prevention and control. Toronto, ON: Queen's Printer for Ontario; 2012 [cited 2013 Jan 18]. Available from: http://www.publichealthontario.ca/en/eRepository/PHO%20Technical%20Report%20-%20Update%20on%20Lyme%20Disease%20Prevention%20and%20Control%20Final%20030212.pdf.
93. Centers for Disease Control and Prevention (homepage on the Internet). Atlanta, GA: Centers for Disease Control and Prevention; 2013. Lyme disease. 2013 Jun 14 [cited 2013 Jan 25]. Available from: http://www.cdc.gov/lyme/.
94. Centers for Disease Control and Prevention (homepage on the Internet). Atlanta, GA: Centers for Disease Control and Prevention; 2012. Lyme disease: confirmed Lyme disease cases by month of disease onset--United States, 2001-2010. 2012 Apr 12 [cited 2013 Jan 18]. Available from: http://www.cdc.gov/lyme/stats/chartstables/casesbymonth.html.
95. Ogden NH, Artsob H, Lindsay LR, Sockett PN. Lyme disease: a zoonotic disease of increasing importance to Canadians. Can Fam Physician. 2008 [cited 2013 Aug 7];54(10):1381-4. Available from: http://www.ncbi.nlm.nih.gov/pmc/articles/PMC2567255/pdf/0541381.pdf.
96. Ogden NH, Lindsay LR, Morshed M, Sockett PN, Artsob H. The rising challenge of Lyme borreliosis in Canada. Can Commun Dis Rep. 2008 [cited 2013 Jan 18];34(1):1-19. Available from: http://www.phac-aspc.gc.ca/publicat/ccdr-rmtc/08vol34/dr-rm3401a-eng.php.
Reportable Disease Trends in Ontario 2011 276
97. World Health Organization. World malaria report 2012. Geneva, Switzerland: WHO; 2012 [cited 2013 Jan 29]. Available from: http://www.who.int/malaria/publications/world_malaria_report_2012/wmr2012_no_profiles.pdf.
98. Encyclopaedia Britannica. West African monsoon. Chicago, IL: Encyclopaedia Britannica;2013 [cited 2013 May 10]. Available from: http://www.britannica.com/EBchecked/topic/640047/West-African-monsoon.
99. National Geographic Education (homepage on the Internet). National Geographic Society; c1996-2013. Monsoon. 2013 [cited 2013 May 10]. Available from: http://education.nationalgeographic.com/education/encyclopedia/monsoon/?ar_a=1.
100. Statistics Canada. 2006 Census of population: immigrant population by place of birth, by province and territory (New Brunswick, Quebec, Ontario). Ottawa, ON: Statistics Canada; 2007 [cited 201 Aug 28]. Available from: http://www.statcan.gc.ca/tables-tableaux/sum-som/l01/cst01/demo34b-eng.htm.
101. Ontario. Ministry of Health and Long-Term Care. Canadian community health survey (2005 & 2007-08): health outcomes, risk factors, demographic indicators and preventive care for immigrants and non-immigrants. Toronto, ON: Queen’s Printer for Ontario; 2012.
102. Smith A, Bradley D, Smith V, Behrens R, Chiodini P, Whitty C. Imported malaria and high risk groups: observational study using UK surveillance data 1987-2006. BMJ. 2008;337:a120.
103. Public Health Agency of Canada (homepage on the Internet). Ottawa, ON: Her Majesty the Queen in Right of Canada; 2013. West Nile virus Monitor – Human Surveillance 2002-2008. 2013 Jul 09 [cited 2013 May 9]. Available from: http://www.phac-aspc.gc.ca/wnv-vwn/mon-hmnsurv-archive-eng.php#a2002_07.
104. Marberg K, Goldblum N, Sterk VV, Jasinska-Klingberg W, Klingberg MA. The natural history of West Nile fever. I. Clinical observations during an epidemic in Israel. Am J Hyg.1956;64(3):259-69.
105. National Advisory Committee on Immunization; Public Health Agency of Canada. Canadian immunization guide. Part 4 active vaccines: Yellow fever vaccine. Ottawa, ON: Her Majesty the Queen in Right of Canada; 2006 [cited 2013 May 29]. Available from: http://www.phac-aspc.gc.ca/publicat/cig-gci/p04-yfev-fiej-eng.php.
106. Centers for Disease Control and Prevention. Viral hemorrhagic fevers: fact sheet. Atlanta, GA: Centers for Disease Control and Prevention; n.d [cited 2013 May 29]. Available from: http://www.cdc.gov/ncidod/dvrd/spb/mnpages/dispages/Fact_Sheets/Viral_Hemorrhagic_Fevers_Fact_Sheet.pdf.
107. World Health Organization. Ebola haemorrhagic fever: fact sheet No. 103. Geneva, Switzerland: WHO; 2012 [cited 2913 May 29]. Available from: http://www.who.int/mediacentre/factsheets/fs103/en/.
108. World Health Organization. Global Alert and Response (GAR): Marburg haemorrhagic fever. Geneva, Switzerland: WHO; 2013 [cited 2013 May 29]. Available from: http://www.who.int/csr/disease/marburg/en/.
109. Office of Minority Health & Health Disparities (OMHD). Dengue/dengue hemorrhagic fever. Atlanta, GA: Centers for Disease Control and Prevention; 2007 [cited 2013 May 29]. Available from: http://www.cdc.gov/omhd/populations/HL/HHP/Dengue.htm.
110. Ontario. Ministry of Health and Long-Term Care. Infectious diseases protocol, 2009. Appendix A: disease specific chapters. Chapter: Leprosy. Toronto, ON: Queen’s Printer for Ontario; 2009 [cited 2013 Mar 20]. Available from: http://www.health.gov.on.ca/en/pro/programs/publichealth/oph_standards/docs/leprosy_chapter.pdf.
111. Public Health Agency of Canada. Notifiable diseases on-line: Leprosy. Ottawa, ON: Her Majesty the Queen in Right of Canada; 2003 [cited 2013 May 29]. Available from: http://web.archive.org/web/20100609060557/http://dsol-smed.phac-aspc.gc.ca/dsol-smed/ndis/diseases/lepr-eng.php.
112. Public Health Agency of Canada. Creutzfeldt-Jakob disease: CJF surveillance system. Ottawa, ON: Her Majesty the Queen in Right of Canada; 2013 [cited 2013 Apr 22]. Available from: http://www.phac-aspc.gc.ca/hcai-iamss/cjd-mcj/cjdss-ssmcj/stats-eng.php#canada.

Reportable Disease Trends in Ontario 2011 277
Appendices
Reportable Disease Trends in Ontario 2011 278
Appendix 1
Technical notes
Data Sources
Ontario reportable disease data: The main source for reportable diseases data (counts
and calculated incidence rates) in this report is the
integrated Public Health Information System (iPHIS), the
electronic reporting system for reportable diseases in
Ontario. iPHIS replaced the Reportable Diseases
Information System (RDIS) and was implemented in
phases throughout 2005 starting on April 1, with full
implementation by all 36 local public health units by the
end of the year.
In Ontario, over 70 diseases have been specified as
reportable under Regulation 559/91 pursuant to the
Health Protection and Promotion Act (HPPA), R.S.O
1990. Disease reporting through iPHIS is passive and as
such, PHO is only aware of cases and related data
elements reported by the local public health units in
accordance with the HPPA, Ontario Regulation 569, the
Ontario Public Health Standards, and the Infectious
Diseases Protocol. Laboratory confirmation of
reportable disease cases most frequently occurs at
public health laboratories operated by PHO. For some
diseases such as influenza, laboratory confirmation
takes place in hospitals. In other instances, reference
services and specialized testing of clinical specimens
takes place at reference laboratories across Canada.
Except where noted, the 2011 data for this report were
extracted from iPHIS in June 2012. The exact dates of
extraction are cited below the figures and tables
throughout the report. In the case of invasive
Haemophilus influenzae type B disease (Hib) and
invasive meningococcal disease (IMD), linked iPHIS and
Public Health Ontario Laboratory data identified
additional confirmed cases of disease and helped to rule
out cases that were incorrectly classified. Final case
counts for Hib following this data linkage process were
reconciled in iPHIS and extracted for the period 2002 to
2011. For IMD, the final case count from the data
linkage process for 2011 was reconciled in iPHIS and
extracted for analysis. Case counts for the years 2002-
2010 for all other diseases were extracted from iPHIS in
October 2012.
Population data: intelliHEALTH ONTARIO is a repository of health related
data that describes the population and delivery of
healthcare services in Ontario. Population counts for
Ontario, originally sourced from Statistics Canada, were
obtained from intelliHEALTH for this report. Population
data for Ontario were extracted by PHO from
intelliHEALTH Ontario in October 2012. These data,
stratified by age, sex and health unit, were used as
denominators to calculate overall, age-, sex- and
geographic-specific crude incidence rates.
Comparator data: Comparator incidence rates for Canada are provided in
the report whenever available. These data were
obtained directly from the Public Health Agency of
Canada, Notifiable Diseases and Field Surveillance
Section website. Comparator incidence rates for Canada
as a whole and for Canada excluding Ontario were
provided for the years 2002 to 2008. However,
depending on the disease and when it became
nationally notifiable, national incidence rates may not
be available for all or a part of this period. As a result,
comparisons between trends in provincial and national
incidence rates are made only for years for which
national incidence rates are provided. Incidence rates
for Canada presented in this report may differ from
reports published by the Public Health Agency of
Canada. Where such discrepancies exist, incidence rates
published in national reports supersede those in this
report. A list of diseases that are nationally notifiable
can be found online at: http://www.phac-
aspc.gc.ca/bid-bmi/dsd-dsm/duns-eng.php.
Reportable Disease Trends in Ontario 2011 279
Descriptive Measures
The descriptive measures used throughout the report to
characterize the epidemiology of reportable infectious
diseases in Ontario are listed below.
Number of reported cases: This measure refers to the total count of reported cases
of a disease in a calendar year and within a select group
or sub-group that were reported as confirmed and/or
probable as applicable according to the provincial case
definitions. Appendix 3 provides a list of reportable
diseases covered in this report and the case
classifications included in the count of reported cases.
The case definition section of these technical notes also
provides additional information on the rationale for
including probable cases for specific diseases and the
years in which probable cases are included. The
provincial case definitions can be accessed online.
For influenza, cases are counted in the influenza season
within which they occurred, rather than by calendar
year. Influenza seasons run from September 1 of one
year to August 31 of the following year. For example,
the 2010/2011 influenza season started on September
1, 2010 and ended on August 31, 2011.
For tuberculosis (TB), only active cases are included in
the reporting of confirmed cases (i.e. latent TB
infections are not included); for syphilis, only infectious
cases (primary, secondary, early latent and infectious
neurosyphilis) are included in the reporting of
confirmed cases; and for hepatitis B, only acute cases
are included in the reporting of confirmed cases.
Crude incidence rates (reported as rates per 100,000 population per year): Incidence rates (crude) are calculated by dividing the
total number of reported cases in a year by the total
number of people at risk of acquiring the disease in that
year. In this report, rates are presented per 100,000
population. The formulas for calculating overall and
population-specific rates used throughout the report
are noted below.
Overall: Number of all new cases over a specified time period divided by the Ontario population for that time period, multiplied by 100,000.
Group-specific: Number of new cases in a sub-group (e.g. age group, sex or health unit) over a specified time period divided by the Ontario population for that sub-group for that time period, multiplied by 100,000.
Neonatal: Number of new congenital or neonatal cases of a disease over a specified time period divided by the total number of live births for that time period, multiplied by 100,000. Live births were used to calculate incidence rates for neonatal diseases because the neonatal population count (up to 28 days old) could not be determined from available vital statistics data.
Throughout the report, the term “incidence rate” is
used interchangeably with the term “incidence” to refer
to an annualized rate (the number of cases observed for
every 100,000 Ontarians per year). In general,
incidence refers to new cases of disease. HIV and
hepatitis C are exceptions. These two diseases often
remain undiagnosed for extended periods and their
detection by public health is generally not indicative of
the actual time of acquisition. Therefore, some cases of
TB, HIV and hepatitis C that are included in this report
may be attributed to individuals who acquired their
infections in earlier years, and the figures represent a
new diagnosis rate rather than a rate of new infection.
Reported incidence for hepatitis C includes acute cases,
chronic cases and possibly resolved infections since all
individuals over 18 months of age that test positive for
hepatitis C antibodies are reported as confirmed in
accordance with the provincial case definition. In
addition, some cases of HIV may also be coincident with
an AIDS diagnosis in the same year, and as such may be
included in counts for both diseases in a given year.
Health unit distribution: This measure refers to the number of new cases
reported by each health unit in 2011. Incidence rates
are also provided for each health unit, and are
calculated as per the group-specific incidence rate
Reportable Disease Trends in Ontario 2011 280
formula described above. Except where noted (Lyme
disease map is by place of exposure), health unit refers
to the health unit where a case resided at the time of
identification which is not necessarily the place of
disease exposure or acquisition.
To compare relative distributions, the number of cases
in the health unit as a proportion of total cases and the
population of the health unit as a proportion of the
total Ontario population are provided in this report.
Incidence rates by health unit are presented in maps
that use natural breaks to group rates into categories
for mapping. Natural breaks produce variable class
widths for data that are not evenly distributed. This
allows the groupings of data to minimize differences
between data values in the same class and maximize
differences between classes.
Age distribution: Age was described using the median to account for the
non-normal age distribution of cases. Age groups for
most diseases were based on standard five and ten-year
age groupings. For vaccine-preventable diseases, age
groups were constructed with consideration of both the
age at which funded vaccines are recommended for
administration as part of the Ontario publicly funded
immunization schedule and the implementation dates
of these programs.
Monthly incidence: The number of cases that occurred during each month
in 2011 was compared to the monthly averages for the
previous five years (2006 to 2010). For influenza, the
five-year monthly averages for comparison excluded the
two seasons immediately preceding the 2010/2011
season. The influenza A(H1N1)pdm09 pandemic
occurred during the 2008/2009 and 2009/2010 seasons,
resulting in influenza counts that were significantly
higher than non-pandemic seasons. Exclusion of these
seasons allowed for the determination of baseline
monthly averages that were more in line with expected
trends for non-pandemic seasons.
Risk factors and/or exposures: The proportion of cases reporting specific risk factors,
exposures, or a combination thereof is presented where
applicable. The risk factor categories used are those
available in iPHIS and do not necessarily denote a causal
relationship with illness. Standardized risk factors
within iPHIS were developed and made available for use
in 2011. As a result, historical data on risk factors are
not as reliable as those reported for cases since 2011.
Hospitalization: This measure refers to the proportion of reported cases
of a reportable disease that has been hospitalized. In
this report, a case is considered hospitalized if at least
one hospital admission date was recorded for the case
of interest.
Case fatality ratio: The proportion of reported cases of a reportable
disease that is fatal within a specified period. In this
report, a case is counted as fatal if the reportable
disease was recorded as an underlying or contributing
cause of death.
Subtype/Serotype/Serogroup: Where applicable, the number and proportion of cases
that represents distinct variations of a specific species,
subtype, serotype or serogroup of a pathogen that
causes a reportable disease.
Statistical Analyses
Data analysis and presentation for this report were
completed using IBM SPSS Statistics 19 and Microsoft
Excel with the PowerPivot add-in. Identified differences
in rates and counts from one period to another,
between Ontario and Canada, and between population
sub-groups are absolute and do not imply statistical
significance.
Reportable Disease Trends in Ontario 2011 281
Data Management:
Reference Period: The majority of information in this report reflects the
number of incident cases of reportable diseases
reported in Ontario through iPHIS with episode dates
from January 1 to December 31, 2011. Historical data
for trend analyses cover the period from 2002 to 2010
or shorter periods over this time range for specific
analyses. Passive surveillance systems such as iPHIS
generally accommodate the entry of several dates to
estimate the symptom onset date when it is not
available. In some situations, this results in the capture
of episode dates that are later than the date of
symptom onset (e.g. reported date). The episode date is
determined using the following hierarchy:
1. Symptom onset date 2. Specimen collection date 3. Lab test date (date laboratory testing was
performed) 4. Reported date (date the case was reported to
the health unit)
During data extraction, the earliest date available at
each stage in the hierarchy was selected as the episode
date for each case. For example, if an onset date had
been entered, it was selected with priority as the
episode instead of the specimen collection date and so
on. With the exception of HIV, AIDS and TB, the number
of incident cases in this report is based on the
hierarchal episode dates within the reference period.
For HIV, incident case count is based on the encounter
date, defined as the date a case became known to
public health. AIDS and TB incident case counts are
based on the diagnosis date, which is the date of a
case’s diagnosis for AIDS and TB, respectively.
Case Ascertainment Criteria: This report includes all confirmed and/or probable
reports of reportable diseases made through iPHIS with
an episode date in 2011, with the following exceptions:
1. Cases who were not residents of Ontario at the time of diagnosis.
2. Cases reported with a disposition status of ‘Does not meet’, ‘entered in error’ or ‘duplicate’.
3. Cases who did not meet the provincial surveillance case definition. Appendix 3 provides a list of reportable diseases covered in this report and the case classifications included in the count of included cases.
4. Diseases for which aggregate case counts rather than individual case reports are reported, i.e. chickenpox, Clostridium difficile and institutional outbreaks of gastroenteritis and respiratory illness. The only exception is influenza, for which aggregate reporting was used to report influenza A(H1N1)pdm09 cases during the pandemic of 2009/2010.
5. Cases reported as encephalitis, meningitis or food poisoning.
6. Events reported as adverse events following immunization (AEFI) and related data are published in a separate report.
7. Transmissible spongiform encephalopathy cases including Creutzfeldt-Jakob disease (CJD) due to the large proportion of cases for which case ascertainment is not complete.
Re-infections and co-infections: For the majority of reportable diseases, immunity is not
conferred following infection or wanes over time,
resulting in continued susceptibility and potential for re-
infection. It is assumed that cases that represent an
instance of re-infection or relapse are assessed by local
health units before entry into iPHIS based on several
factors including the incubation period for the disease
in question. As a result, data in this report are assumed
to be representations of true re-infections or new
episodes of a disease. Thus a single person with more
than one episode of the same disease in a single year
may contribute more than one case of particular
disease to the total provincial count for that year. Co-
infections with more than one infectious agent at the
same time (e.g. Mycobacterium tuberculosis complex
and HIV) or with different strains of an infectious agent
(e.g. Salmonella Typhimurium and Salmonella Hadar)
are reported as separate episodes of the resulting
infections.

Reportable Disease Trends in Ontario 2011 282
Exposure determination - Vector-borne diseases: The most likely exposure was selected for vector-borne
disease cases who reported more than one exposure.
Most likely exposures cannot be definitively attributed
to illness, but are assumed to be possible sources of
illness. Selection of the most likely exposure was based
on the following hierarchy:
1. Travel-associated exposure - at least one travel destination reported for the case. The determination of travel-associated exposures was based on exposure information entered into iPHIS and was assessed using the “exposure setting”, “exposure setting type”, “exposure name”, “exposure location” and “exposure comments” fields. It is assumed that the recording of travel as an exposure or a risk factor in iPHIS is assessed against the incubation period for the disease among other factors related to the disease. Notwithstanding, disease acquisition cannot be definitively attributed to travel or any other reported exposure. Instead, reported exposures are assumed to be possible sources of acquisition and therefore do not necessarily denote a causal relationship with illness.
2. Other specified exposure - at least one exposure is reported for the case that is not travel-related or “unknown”. The following factors influenced the selection of the most likely exposure source when multiple exposures are reported: the exposure has been previously associated with illness or outbreaks, consistency within the reported exposure fields and plausibility of the recorded mode of transmission and identified sources.
3. Unknown exposure - an “unknown” exposure is the only exposure reported for the case.
4. Not reported by health unit (missing) - no exposure information is reported for the case.
Cases with no reported exposure information (missing)
are excluded from the denominator when calculating
exposure proportions. Exposures reported as
“unknown” were included in the denominator as it is
assumed that case follow-up occurred but without
determination of a specific exposure.
Exposure determination – Vaccine-preventable diseases: For vaccine-preventable diseases, exposures were
based on the outbreak status of cases as the source of
illness in some cases can be directly or indirectly linked
to a common source (i.e. person or place). For
remaining cases not linked to an outbreak, exposures
were categorized based on exposure fields as reported
in iPHIS using the hierarchy described under Exposure
determination - Vector-borne diseases (above). For
measles and rubella, exposures (and in particular travel
histories) were determined through a review of
information entered in the exposures, risk factors, case
notes and comments fields of iPHIS.
Exposure determination - HIV: Exposure or risk factor categories for HIV cases were
determined using a mutually exclusive hierarchy that
assigned HIV cases to a single exposure category that
best represents the true source of infection for the case
when more than one risk factor or exposure was
reported. Detailed information about the exposure
hierarchy is available in appendices C1-3 of the
Guidelines for the Surveillance of AIDS in Canada.1 For
hepatitis C, cases were similarly assigned to mutually
exclusive categories based on most likely risk.
Risk Factor Determination (other diseases): Risk factors are available in iPHIS for selection during
case reporting and management. A selected risk factor
indicates that the case in question was exposed to the
risk factor during the relevant incubation period. In this
report, reporting of these risk factors in no way
indicates attribution or establishment of the risk factor
in question as a universal disease risk. This report
presents risk factors for enteric diseases, tuberculosis
(TB) and sexually transmitted and blood-borne
infections (STI/BBI), excluding HIV and hepatitis C.
Multiple risk factors may be recorded for cases of these
diseases; therefore, the total number of risk factors
reported may be greater than the total number of
reported cases or the total number of cases reporting at
least one risk factor. For hepatitis B, and for non-
endemic enteric diseases such as paratyphoid fever, risk
was determined using a combination of reported risk
factors and exposures. Risk factors no longer in use
(marked as “inactive [I]” in iPHIS) were excluded from
Reportable Disease Trends in Ontario 2011 283
both the numerator and denominator when calculating
the proportion of cases reporting specific risk factors.
Where noted, risk factors were combined to form new
categories. In some instances, cases reporting the risk
factors to be combined are counted once because the
combined risk factors are considered sufficiently similar
such that they measure the same risk. In contrast, risk
factors included in the ‘Other’ category measure
different risks and as such each recorded risk factor
contributes to the count for the ‘Other’ risk factor
category.
Definitions
Travel-associated case – Travel-associated cases are
cases for which travel was reported as an exposure or
as a risk factor in iPHIS. It is assumed that the recording
of travel as an exposure or a risk factor is assessed
against the incubation period for the disease among
other factors related to the disease or case prior to
entry into iPHIS. This report includes all travel-
associated cases and only excludes them from analyses
that attempt to enumerate exposure sources or
transmissions that occurred within Ontario. Reported
travel proportions should be interpreted with caution as
the selection of travel exposures for this report uses a
best guess approach when multiple exposures are
reported.
Diagnosing health unit – The health unit where the case
resided most of the time at time of diagnosis. iPHIS
Bulletin 13 provides additional detail on scenarios in
which a health unit is considered the diagnosing health
unit.
Case Definitions
Confirmed and probable cases are defined in Appendix
B (Provincial Case Definitions) of the Infectious Diseases
Protocol. The Infectious Diseases Protocol and case
definitions are available online at:
http://www.health.gov.on.ca/en/pro/programs/publich
ealth/oph_standards/infdispro.aspx. From 1990 to
2009, the provincial case definitions remained virtually
unchanged with exception of the addition of new
definitions for diseases that were newly designated as
reportable (e.g. West Nile Virus (WNV) illness, SARS).
Case counts in this report are based on the surveillance
case definitions published in the Reportable Disease
Information System (RDIS) manual up to 2005, and in
the iPHIS manual from 2005 to 2008. In 2009, the
Ministry of Health and Long-Term Care (MOHLTC)
implemented revised surveillance case definitions for all
reportable diseases and these definitions were used for
cases from 2009 to 2011.
The 2009 revisions reflected the changing epidemiology
of infectious diseases and the use of more current
laboratory diagnostic practices and technology. The
revised case definitions came into effect on April 28,
2009. These updates impacted the classification of
several diseases with the main changes being the
addition of a probable case classification for all enteric
and vaccine-preventable diseases and the requirement
of laboratory confirmation for most sexually
transmitted diseases. These changes should be
considered to ensure valid comparisons of historical
trends in incidence. Detailed assessment of the major
changes to the provincial case definitions and the
expected and observed impacts are documented in the
2009 Ontario Annual Infectious Diseases Epidemiology
Report published by the MOHLTC:
(http://www.health.gov.on.ca/en/common/ministry/pu
blications/reports/epi_reports/epi_report_2009.aspx).
Case Classifications
Unless otherwise stated, case counts include only the
confirmed case classification. Probable cases are
included in the total counts presented in this report for
Lyme disease, mumps, pertussis, amebiasis and WNV
illness. Appendix 2 provides a list of reportable diseases
covered in this report and the case classifications that
are reportable in Ontario.
With the changes to the case definitions in 2009, cases
that previously met the confirmed case definition are
now required to be reported as probable for some
diseases. For Lyme disease, mumps and pertussis, the
impact of this change was substantial, such that
probable cases after 2009 constituted a significant
proportion of total case counts. As a result, probable
case counts are included in total counts in order to
ensure valid comparisons over time for these diseases.
Reportable Disease Trends in Ontario 2011 284
For the vast majority of diseases similarly impacted by
the case definition changes, the impact on overall count
was negligible, and as such probable cases for these
diseases are not included in this report.
Probable cases are now included in counts for amebiasis
owing to the change in interpretation of laboratory test
results that previously reported the causative agent as
Entamoeba histolytica/E. dispar with no distinction
between the two. Cases with test results that do not
differentiate between the non-pathogenic E. dispar and
the pathogenic E. Histolytica are now counted as
probable, whereas they were previously counted as
confirmed. The impact of this change was significant
and as a result, probable case counts are included in
total counts to ensure valid comparisons over time for
amebiasis.
WNV illness is relatively new in Ontario and both
confirmed and probable cases were enumerated when
the disease first became reportable in order to obtain
data on the burden of the disease at the population
level. This method of enumerating cases has continued
over time and is also consistent with the national
process wherein no distinction is made between
confirmed and probable case counts.
Data Limitations:
Accuracy of Data: iPHIS is a dynamic disease reporting system which
allows ongoing updates to data previously entered. As a
result, data extracted from iPHIS represent a snap shot
at the time of extraction and may differ from previous
or subsequent reports. Discrepancies in disease counts
and rates provided in this report and previously
published data may exist due to:
enhanced data cleaning for this report prior to analysis including the linkage of iPHIS and laboratory data and subsequent reconciliation in iPHIS
late reporting
local and/or provincial-led data clean up initiatives, and
differences in data extraction dates.
Where such variability exists, data provided in the most
current version of this report, other PHO surveillance
products such as the Monthly Infectious Diseases
Surveillance Report or published research are
considered definitive so long as the listed data caveats
are comparable and/or relevant to the intended use of
the data.
Small counts: For some diseases, the observed variability in
population-specific incidence rates should be
interpreted with caution owing to small counts, which
may be exacerbated by small denominators
(population). For this reason, population-specific rates
are not routinely calculated and presented for diseases
with small overall counts. Instead, counts over time are
combined into larger totals to provide more stable point
estimates of burden (e.g. ten-year average or ten-year
total or overall rate).
Under-reporting: Passive surveillance systems such as iPHIS that rely on
physician and laboratory reports of illness are
characterized by under-reporting of the true burden of
illness. As a result, known case counts only represent
cases reported to public health units and recorded in
iPHIS. The resulting degree of under-reporting varies
from disease to disease.2,3
Besides non-reporting of cases, other forms of under-
reporting also occur. Hospitalization and death data in
iPHIS are under-reported with the degree of under-
reporting influenced by the severity of illness and
associated outcomes. Under-reporting of other data
such as exposures and serotypes also occurs frequently.
In general, the degree of under-reporting is influenced
by a combination of factors including incomplete
follow-up of cases (e.g. case is not reachable),
incomplete or late entry of data in iPHIS and the
occurrence of deaths after follow up has been
completed.
Duplicates: The possibility of duplicates exists because duplicate
sets were not identified and excluded unless they were
resolved prior to data extraction either at the local or
provincial level.
Reportable Disease Trends in Ontario 2011 285
Missing data (data not reported by health units) A high proportion of missing or incomplete data may
result in conclusions or interpretations that are not
representative of trends pertaining to risk factors or
demographic characteristics. In this report, missing
data are handled in one of four ways as specified in
relevant sections of the report:
1. Reporting the proportion or number of cases with missing data to provide perspective (e.g. age, sex, exposures and risk factors).
2. Suppressing the data altogether.
3. Excluding missing counts from the denominator when determining proportions.
4. Merging data from more than one data fields to create new data fields that are more complete. For example, risk factors and exposures are merged to improve completeness for hepatitis C and various exposure fields (e.g. exposure comments, exposure setting, exposure source and exposure name) are considered in the determination of the most likely exposure for cases of vector-borne diseases.
Cases may also not be reported to health units, or
reported but not entered into iPHIS. While these
processes results in under-reporting, under-reporting
was not accounted for in the analyses completed for
this report.
References
1. Remis RS. Guidelines for the surveillance of AIDS in Canada. Ottawa, ON: Health Canada; 1995.
2. Thomas MK, Majowicz SE, Sockett PN, Fazil A, Pollari F, Doré K, et al. Estimated numbers of community cases of illness due to Salmonella, Campylobacter and Verotoxigenic Escherichia Coli: pathogen-specific community rates. Can J Infect Dis Med Microbiol. 2006;17(4): 229–234.
3. Thomas, MK, Majowicz, SE, Pollari, F. Sockett, P. Burden of acute gastrointestinal illness in Canada, 1999-2007: Interim summary of NSAGI activities. CCDR. 2008;34(5):8-15.

Reportable Disease Trends in Ontario 2011 286
Appendix 2
Diseases Reportable in Ontario
Reportable Diseases as specified under Ontario Regulation 559/91 and amendments under the Health Protection and
Promotion Act.
Acquired immunodeficiency syndrome (HIV/AIDS) Amebiasis Anthrax Botulism Brucellosis Campylobacter enteritis Chancroid Chickenpox (Varicella)* Chlamydia Cholera Clostridium difficile associated disease* Cryptosporidiosis Cyclosporiasis Cytomegalovirus infection, congenital Diphtheria Encephalitis
Primary, viral*
Post-infectious*
Vaccine-related*
Subacute sclerosing panencephalitis*
Unspecified* Food poisoning, all causes* Gastroenteritis, institutional outbreaks* Giardiasis Gonorrhea Group A Streptococcal infections, invasive Group B Streptococcal infections, neonatal Haemophilus influenzae b disease, invasive Hantavirus pulmonary syndrome Hemorrhagic fevers
Ebola virus disease
Marburg virus disease
Other viral causes Hepatitis A Hepatitis B Hepatitis C Hepatitis D (Delta hepatitis) Herpes, neonatal Influenza Lassa fever Legionellosis Leprosy Listeriosis
Lyme disease Malaria Measles Meningitis, acute
Bacterial*
Viral*
Other* Meningococcal disease, invasive Mumps Ophthalmia neonatorum Paratyphoid fever Pertussis (whooping cough) Plague Pneumococcal disease, invasive Poliomyelitis, acute Psittacosis/ornithosis Q fever Rabies Respiratory infection outbreaks in institutions* Rubella Rubella, congenital syndrome Salmonellosis Severe acute respiratory syndrome (SARS) Shigellosis Smallpox Syphilis Tetanus Transmissible spongiform encephalopathy
Creutzfeldt-Jakob disease, all types
Gerstmann-Sträussler-Scheinker syndrome
Fatal Familial Insomnia
Kuru Trichinosis Tuberculosis Tularemia Typhoid fever Verotoxin-producing E. coli including hemolytic uremic syndrome West Nile virus illness Yellow fever Yersiniosis * Reportable diseases not included in this report
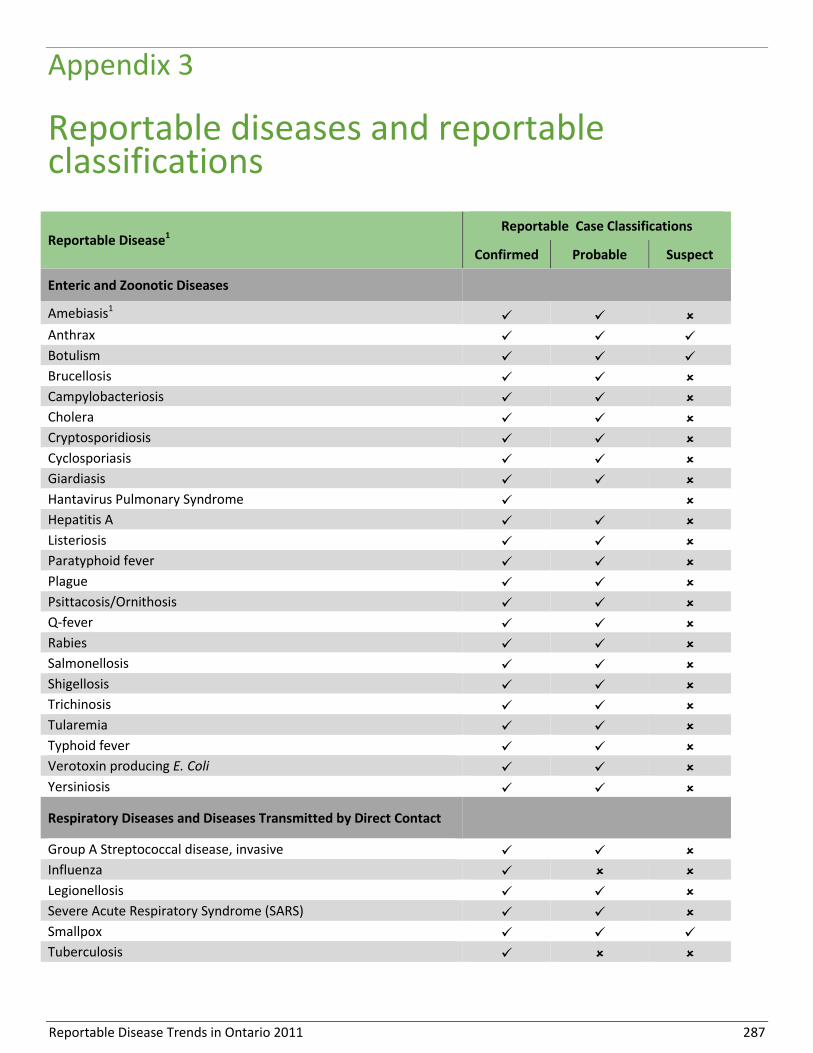
Reportable Disease Trends in Ontario 2011 287
Appendix 3
Reportable diseases and reportable classifications
Reportable Disease1 Reportable Case Classifications
Confirmed Probable Suspect
Enteric and Zoonotic Diseases
Amebiasis1
Anthrax
Botulism
Brucellosis
Campylobacteriosis
Cholera
Cryptosporidiosis
Cyclosporiasis
Giardiasis
Hantavirus Pulmonary Syndrome
Hepatitis A
Listeriosis
Paratyphoid fever
Plague
Psittacosis/Ornithosis
Q-fever
Rabies
Salmonellosis
Shigellosis
Trichinosis
Tularemia
Typhoid fever
Verotoxin producing E. Coli
Yersiniosis
Respiratory Diseases and Diseases Transmitted by Direct Contact
Group A Streptococcal disease, invasive
Influenza
Legionellosis
Severe Acute Respiratory Syndrome (SARS)
Smallpox
Tuberculosis

Reportable Disease Trends in Ontario 2011 288
Reportable Disease1 Reportable Case Classifications
Confirmed Probable Suspect
Sexually Transmitted and Blood-borne Infections
Chancroid
Chlamydial infections
Cytomegalovirus infection, congenital
Gonorrhoea, all types
Group B Streptococcal disease, neonatal
Hepatitis B
Hepatitis C
Hepatitis D
Herpes, neonatal
HIV/AIDS
Syphilis, infections
Ophthalmia Neonatorum
Vaccine-Preventable Diseases
Diphtheria
Haemophilus Influenzae B disease, invasive
Measles
Meningococcal disease, invasive
Mumps1
Pertussis (whooping cough)1
Pneumococcal Disease, invasive
Poliomyelitis, acute
Rubella
Rubella, congenital syndrome
Tetanus
Vector-borne Diseases
Lyme disease1
Malaria
West Nile Virus illness1
Yellow Fever
Other Reportable Diseases
Creutzfeldt-Jakob disease, all types
Hemorrhagic Fevers
Lassa Fever
Leprosy
Transmissible Spongiform Encephalopathies
Source: Ontario Ministry of Health and Long-Term Care. Infectious diseases protocol, 2009. Appendix B: Provincial Case Definitions. 1: Routine reporting of case counts at the provincial level includes both confirmed and probable cases; confirmed cases only are for the other reportable diseases. Reportable classification. - Reportable classifications; - Non-reportable classifications.
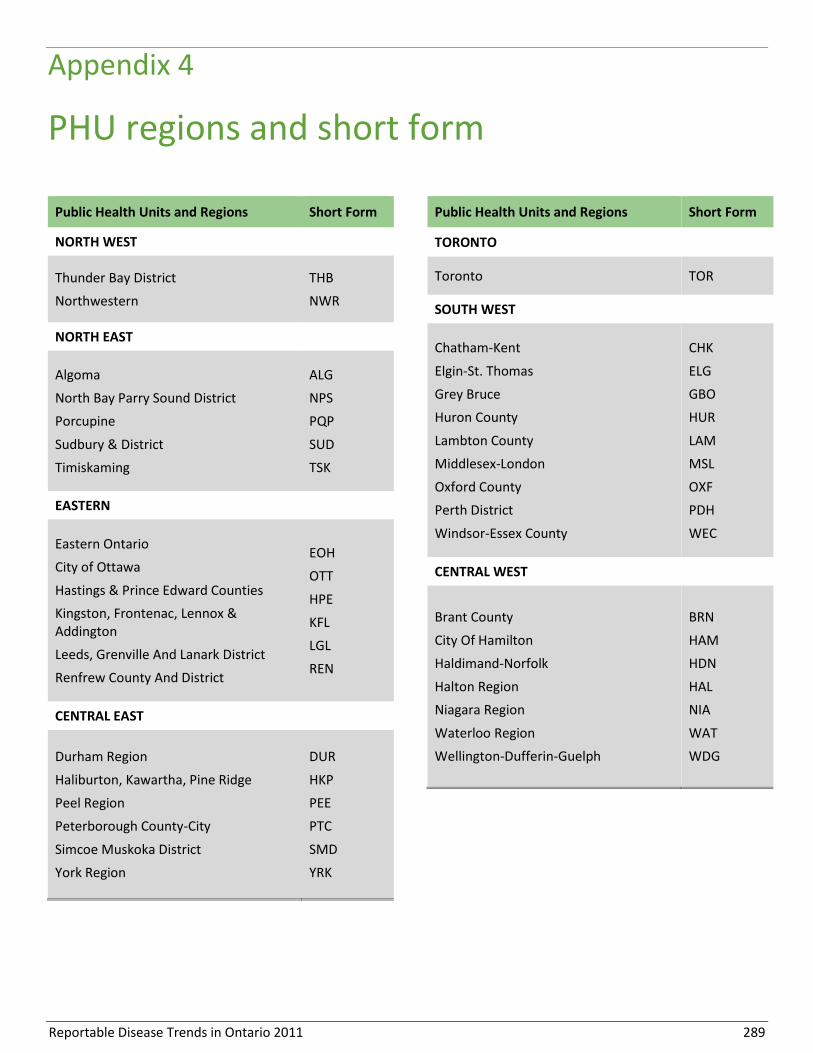
Reportable Disease Trends in Ontario 2011 289
Appendix 4
PHU regions and short form
Public Health Units and Regions Short Form
NORTH WEST
Thunder Bay District
Northwestern
THB
NWR
NORTH EAST
Algoma
North Bay Parry Sound District
Porcupine
Sudbury & District
Timiskaming
ALG
NPS
PQP
SUD
TSK
EASTERN
Eastern Ontario
City of Ottawa
Hastings & Prince Edward Counties
Kingston, Frontenac, Lennox & Addington
Leeds, Grenville And Lanark District
Renfrew County And District
EOH
OTT
HPE
KFL
LGL
REN
CENTRAL EAST
Durham Region
Haliburton, Kawartha, Pine Ridge
Peel Region
Peterborough County-City
Simcoe Muskoka District
York Region
DUR
HKP
PEE
PTC
SMD
YRK
Public Health Units and Regions Short Form
TORONTO
Toronto TOR
SOUTH WEST
Chatham-Kent
Elgin-St. Thomas
Grey Bruce
Huron County
Lambton County
Middlesex-London
Oxford County
Perth District
Windsor-Essex County
CHK
ELG
GBO
HUR
LAM
MSL
OXF
PDH
WEC
CENTRAL WEST
Brant County
City Of Hamilton
Haldimand-Norfolk
Halton Region
Niagara Region
Waterloo Region
Wellington-Dufferin-Guelph
BRN
HAM
HDN
HAL
NIA
WAT
WDG

Reportable Disease Trends in Ontario 2011 290
Appendix 5
Data tables
Data Table 1-A. Number and Incidence Rates of Enterics and Zoonotic Diseases: Ontario, 2002-2011
Reportable Diseases1 2002 2003 2004 2005 2006 2007 2008 2009 2010 2011
Number, Rate2
Amebiasis1 826, 6.8 772, 6.3 680, 5.5 778, 6.2 639, 5.1 815, 6.4 761, 5.9 823, 6.3 810, 6.1 744, 5.6
Anthrax 0, 0.0 0, 0.0 0, 0.0 0, 0.0 0, 0.0 0, 0.0 0, 0.0 0, 0.0 0, 0.0 0, 0.0
Botulism 1, 0.0 1, 0.0 2, 0.0 1, 0.0 5, 0.0 6, 0.1 2, 0.0 4, 0.0 1, 0.0 2, 0.0
Brucellosis 5, 0.0 4, 0.0 3, 0.0 6, 0.1 2, 0.0 5, 0.0 5, 0.0 4, 0.0 2, 0.0 1, 0.0
Campylobacteriosis 4611, 38.1 4132, 33.8 3995, 32.2 3812, 30.4 3869, 30.6 3886, 30.4 3800, 29.4 3245, 24.8 3358, 25.4 3500, 26.2
Cholera 1, 0.0 2, 0.0 0, 0.0 1, 0.0 1, 0.0 1, 0.0 3, 0.0 1, 0.0 0, 0.0 0, 0.0
Cryptosporidiosis 231, 1.9 277, 2.3 305, 2.5 267, 2.1 401, 3.2 406, 3.2 337, 2.6 306, 2.3 338, 2.6 301, 2.3
Cyclosporiasis 52, 0.4 39, 0.3 95, 0.8 132, 1.1 92, 0.7 95, 0.7 103, 0.8 143, 1.1 168, 1.3 105, 0.8
Giardiasis 1924, 15.9 1642, 13.4 1596, 12.9 1640, 13.1 1541, 12.2 1613, 12.6 1615, 12.5 1511, 11.6 1409, 10.7 1295, 9.7
HPS 0, 0.0 0, 0.0 0, 0.0 0, 0.0 0, 0.0 0, 0.0 0, 0.0 0, 0.0 0, 0.0 0, 0.0
Hepatitis A 151, 1.3 143, 1.2 184, 1.5 150, 1.2 206, 1.6 120, 0.9 114, 0.9 121, 0.9 136, 1.0 103, 0.8
Listeriosis 43, 0.4 43, 0.4 42, 0.3 36, 0.3 43, 0.3 39, 0.3 95, 0.7 55, 0.4 60, 0.5 57, 0.4
Paratyphoid fever 27, 0.2 21, 0.2 47, 0.4 55, 0.4 51, 0.4 46, 0.4 59, 0.5 42, 0.3 60, 0.5 62, 0.5
Plague 0, 0.0 0, 0.0 0, 0.0 0, 0.0 0, 0.0 0, 0.0 0, 0.0 0, 0.0 0, 0.0 0, 0.0
Psittacosis/Ornithosis 0, 0.0 3, 0.0 1, 0.0 0, 0.0 0, 0.0 0, 0.0 0, 0.0 0, 0.0 0, 0.0 1, 0.0
Q fever 1, 0.0 8, 0.1 6, 0.1 2, 0.0 4, 0.0 4, 0.0 5, 0.0 6, 0.1 7, 0.1 20, 0.2
Rabies 0, 0.0 0, 0.0 0, 0.0 0, 0.0 0, 0.0 0, 0.0 0, 0.0 0, 0.0 0, 0.0 0, 0.0
Salmonellosis 2478, 20.5 2009, 16.4 2121, 17.1 2972, 23.7 2366, 18.7 2820, 22.0 2387, 18.5 2314, 17.7 2724, 20.6 2576, 19.3
Shigellosis 847, 7.0 283, 2.3 286, 2.3 337, 2.7 204, 1.6 234, 1.8 239, 1.9 254, 1.9 252, 1.9 255, 1.9
Trichinosis 0, 0.0 0, 0.0 1, 0.0 1, 0.0 0, 0.0 0, 0.0 0, 0.0 0, 0.0 0, 0.0 0, 0.0
Tularemia 0, 0.0 2, 0.0 2, 0.0 1, 0.0 0, 0.0 0, 0.0 0, 0.0 0, 0.0 2, 0.0 0, 0.0
Typhoid fever 60, 0.5 50, 0.4 70, 0.6 68, 0.5 92, 0.7 87, 0.7 96, 0.7 77, 0.6 92, 0.7 103, 0.8
Verotoxin-producing E. coli 393, 3.3 462, 3.8 320, 2.6 269, 2.2 343, 2.7 318, 2.5 278, 2.2 166, 1.3 153, 1.2 232, 1.7
Yersiniosis 383, 3.2 329, 2.7 297, 2.4 355, 2.8 363, 2.9 269, 2.1 260, 2.0 243, 1.9 204, 1.5 211, 1.6
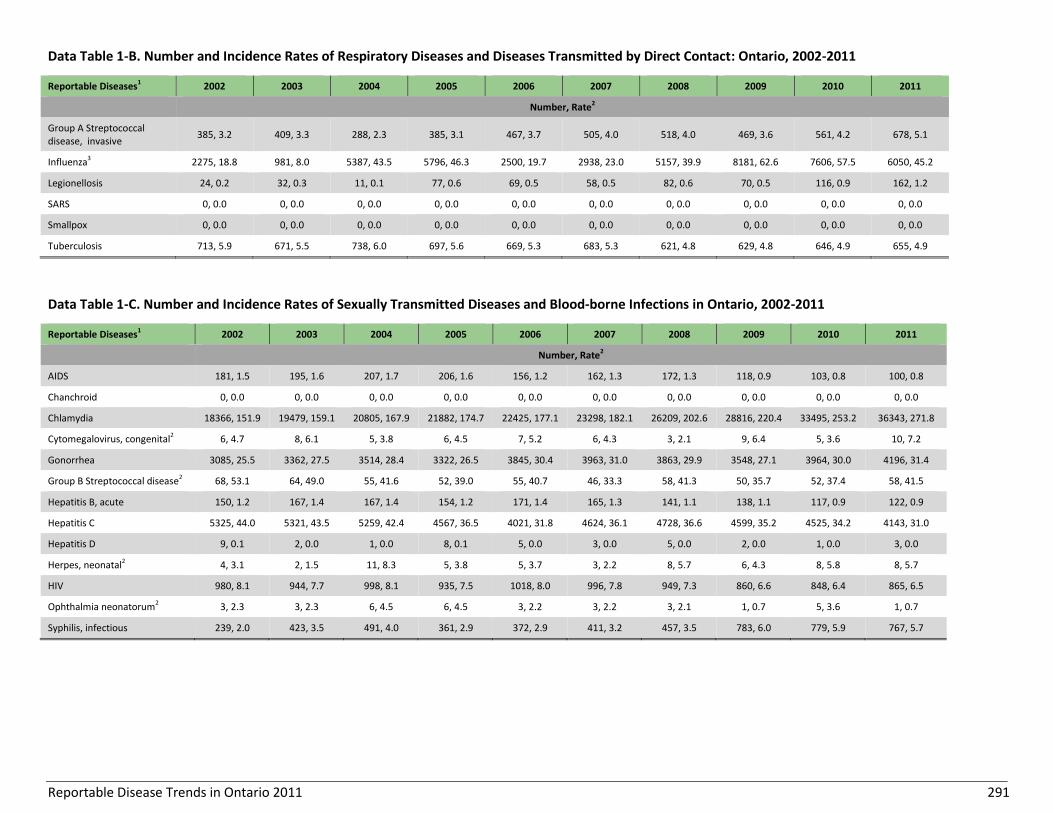
Reportable Disease Trends in Ontario 2011 291
Data Table 1-B. Number and Incidence Rates of Respiratory Diseases and Diseases Transmitted by Direct Contact: Ontario, 2002-2011
Reportable Diseases1 2002 2003 2004 2005 2006 2007 2008 2009 2010 2011
Number, Rate2
Group A Streptococcal disease, invasive
385, 3.2 409, 3.3 288, 2.3 385, 3.1 467, 3.7 505, 4.0 518, 4.0 469, 3.6 561, 4.2 678, 5.1
Influenza3 2275, 18.8 981, 8.0 5387, 43.5 5796, 46.3 2500, 19.7 2938, 23.0 5157, 39.9 8181, 62.6 7606, 57.5 6050, 45.2
Legionellosis 24, 0.2 32, 0.3 11, 0.1 77, 0.6 69, 0.5 58, 0.5 82, 0.6 70, 0.5 116, 0.9 162, 1.2
SARS 0, 0.0 0, 0.0 0, 0.0 0, 0.0 0, 0.0 0, 0.0 0, 0.0 0, 0.0 0, 0.0 0, 0.0
Smallpox 0, 0.0 0, 0.0 0, 0.0 0, 0.0 0, 0.0 0, 0.0 0, 0.0 0, 0.0 0, 0.0 0, 0.0
Tuberculosis 713, 5.9 671, 5.5 738, 6.0 697, 5.6 669, 5.3 683, 5.3 621, 4.8 629, 4.8 646, 4.9 655, 4.9
Data Table 1-C. Number and Incidence Rates of Sexually Transmitted Diseases and Blood-borne Infections in Ontario, 2002-2011
Reportable Diseases1 2002 2003 2004 2005 2006 2007 2008 2009 2010 2011
Number, Rate2
AIDS 181, 1.5 195, 1.6 207, 1.7 206, 1.6 156, 1.2 162, 1.3 172, 1.3 118, 0.9 103, 0.8 100, 0.8
Chanchroid 0, 0.0 0, 0.0 0, 0.0 0, 0.0 0, 0.0 0, 0.0 0, 0.0 0, 0.0 0, 0.0 0, 0.0
Chlamydia 18366, 151.9 19479, 159.1 20805, 167.9 21882, 174.7 22425, 177.1 23298, 182.1 26209, 202.6 28816, 220.4 33495, 253.2 36343, 271.8
Cytomegalovirus, congenital2 6, 4.7 8, 6.1 5, 3.8 6, 4.5 7, 5.2 6, 4.3 3, 2.1 9, 6.4 5, 3.6 10, 7.2
Gonorrhea 3085, 25.5 3362, 27.5 3514, 28.4 3322, 26.5 3845, 30.4 3963, 31.0 3863, 29.9 3548, 27.1 3964, 30.0 4196, 31.4
Group B Streptococcal disease2 68, 53.1 64, 49.0 55, 41.6 52, 39.0 55, 40.7 46, 33.3 58, 41.3 50, 35.7 52, 37.4 58, 41.5
Hepatitis B, acute 150, 1.2 167, 1.4 167, 1.4 154, 1.2 171, 1.4 165, 1.3 141, 1.1 138, 1.1 117, 0.9 122, 0.9
Hepatitis C 5325, 44.0 5321, 43.5 5259, 42.4 4567, 36.5 4021, 31.8 4624, 36.1 4728, 36.6 4599, 35.2 4525, 34.2 4143, 31.0
Hepatitis D 9, 0.1 2, 0.0 1, 0.0 8, 0.1 5, 0.0 3, 0.0 5, 0.0 2, 0.0 1, 0.0 3, 0.0
Herpes, neonatal2 4, 3.1 2, 1.5 11, 8.3 5, 3.8 5, 3.7 3, 2.2 8, 5.7 6, 4.3 8, 5.8 8, 5.7
HIV 980, 8.1 944, 7.7 998, 8.1 935, 7.5 1018, 8.0 996, 7.8 949, 7.3 860, 6.6 848, 6.4 865, 6.5
Ophthalmia neonatorum2 3, 2.3 3, 2.3 6, 4.5 6, 4.5 3, 2.2 3, 2.2 3, 2.1 1, 0.7 5, 3.6 1, 0.7
Syphilis, infectious 239, 2.0 423, 3.5 491, 4.0 361, 2.9 372, 2.9 411, 3.2 457, 3.5 783, 6.0 779, 5.9 767, 5.7

Reportable Disease Trends in Ontario 2011 292
Data Table 1-D. Number and Incidence Rates of Vaccine-Preventable Diseases: Ontario, 2002-2011
Reportable Diseases1 2002 2003 2004 2005 2006 2007 2008 2009 2010 2011
Number, Rate2
Diphtheria 0, 0.0 0, 0.0 0, 0.0 0, 0.0 0, 0.0 0, 0.0 0, 0.0 0, 0.0 0, 0.0 0, 0.0
Haemophilus influenzae b 6, 0.1 7, 0.1 8, 0.1 6, 0.1 8, 0.1 5, 0.0 7, 0.1 2, 0.0 1, 0.0 6, 0.0
Measles 1, 0.0 11, 0.1 6, 0.1 4, 0.0 5, 0.0 0, 0.0 58, 0.5 7, 0.1 9, 0.1 8, 0.1
Meningococcal disease, invasive 60, 0.5 58, 0.5 55, 0.4 43, 0.3 65, 0.5 62, 0.5 47, 0.4 70, 0.5 34, 0.3 44, 0.3
Mumps1 14, 0.1 13, 0.1 23, 0.2 17, 0.1 10, 0.1 53, 0.4 336, 2.6 107, 0.8 100, 0.8 83, 0.6
Pertussis1 531, 4.4 351, 2.9 633, 5.1 644, 5.1 1262, 10.0 929, 7.3 831, 6.4 405, 3.1 120, 0.9 276, 2.1
Pneumococcal disease, invasive 662, 5.5 1018, 8.3 1057, 8.5 934, 7.5 945, 7.5 945, 7.4 1066, 8.3 1259, 9.6 1205, 9.1 1238, 9.3
Poliomyelitis 0, 0.0 0, 0.0 0, 0.0 0, 0.0 0, 0.0 0, 0.0 0, 0.0 0, 0.0 0, 0.0 0, 0.0
Rubella 2, 0.0 9, 0.1 5, 0.0 312, 2.5 5, 0.0 2, 0.0 1, 0.0 3, 0.0 1, 0.0 0, 0.0
Rubella, congenital syndrome2 1, 0.8 1, 0.8 2, 1.5 0, 0.0 0, 0.0 0, 0.0 0, 0.0 1, 0.7 0, 0.0 0, 0.0
Tetanus 2, 0.0 0, 0.0 0, 0.0 1, 0.0 1, 0.0 1, 0.0 0, 0.0 2, 0.0 1, 0.0 1, 0.0
Data Table 1-E. Number and Incidence Rates of Vector-borne Diseases: Ontario, 2002-2011
Reportable Diseases1 2002 2003 2004 2005 2006 2007 2008 2009 2010 2011
Number, Rate2
Lyme Disease1 28, 0.2 26, 0.2 33, 0.3 44, 0.4 46, 0.4 74, 0.6 98, 0.8 99, 0.8 95, 0.7 134, 1.0
Malaria 154, 1.3 167, 1.4 181, 1.5 187, 1.5 188, 1.5 177, 1.4 181, 1.4 180, 1.4 259, 2.0 230, 1.7
West Nile Virus1 392, 3.2 93, 0.8 14, 0.1 101, 0.8 43, 0.3 17, 0.1 6, 0.1 4, 0.0 9, 0.1 78, 0.6
Yellow fever 0, 0.0 0, 0.0 0, 0.0 0, 0.0 0, 0.0 0, 0.0 0, 0.0 0, 0.0 0, 0.0 0, 0.0
Data Table 1-F. Number and Incidence Rates of Other Reportable Diseases: Ontario, 2002-2011
Reportable Diseases1 2002 2003 2004 2005 2006 2007 2008 2009 2010 2011
Number, Rate2
Hemorrhagic fevers 0, 0.0 0, 0.0 0, 0.0 0, 0.0 0, 0.0 0, 0.0 0, 0.0 0, 0.0 0, 0.0 0, 0.0
Lassa fever 0, 0.0 0, 0.0 0, 0.0 0, 0.0 0, 0.0 0, 0.0 0, 0.0 0, 0.0 0, 0.0 0, 0.0
Leprosy 2, 0.0 4, 0.0 4, 0.0 3, 0.0 2, 0.0 2, 0.0 5, 0.0 3, 0.0 1, 0.0 0, 0.0
TSE 0, 0.0 0, 0.0 0, 0.0 0, 0.0 0, 0.0 0, 0.0 0, 0.0 0, 0.0 0, 0.0 0, 0.0

Reportable Disease Trends in Ontario 2011 293
Data tables 1 A- F Ontario Cases: MOHLTC, integrated Public Health Information System (iPHIS) database, extracted [2012/06/13] for all diseases and [2013/04/22] for Haemophilus influenzae b. Ontario Population: MOHLTC, intelliHEALTH Ontario, extracted [2012/10/15]. 1: Includes only confirmed cases with the following exceptions: both probable and confirmed cases as of 2009 for pertussis, mumps, amebiasis and Lyme disease; and both probable and confirmed West Nile Virus cases for all years. 2: Incidence rates are per 100,000 population. Rates are per 100,000 live births for group B streptococcal disease, neonatal herpes, ophthalmia neonatorum, congenital cytomegalovirus and congenital rubella syndrome. 3: Influenza data are reported by seasons. 2002 = 2001/2002, 2003 = 2002/2003, etc. The 2008/2009 and 2009/2010 seasons include pandemic H1N1 influenza cases that were reported in aggregate.

Reportable Disease Trends in Ontario 2011 294
Data Table 2-A. Enteric Diseases by Health Unit of Residence: Ontario, 20111,2
Health Units
Am
eb
iasi
s2
Bo
tulis
m
Cam
pyl
ob
acte
rio
sis
Ch
ole
ra
Cry
pto
spo
rid
iosi
s
Cyc
losp
ori
asis
Gia
rdia
sis
He
pat
itis
A
List
eri
osi
s
Par
atyp
ho
id F
eve
r
Salm
on
ello
sis
Shig
ello
sis
Typ
ho
id F
eve
r
VTE
C
Ye
rsin
iosi
s
Number, Rate1
ALG 0, 0.0 0, 0.0 7, 5.9 0, 0.0 0, 0.0 2, 1.7 10, 8.5 2, 1.7 0, 0.0 0, 0.0 19, 16.1 0, 0.0 0, 0.0 0, 0.0 2, 1.7
BRN 2, 1.4 0, 0.0 19, 13.5 0, 0.0 1, 0.7 0, 0.0 3, 2.1 0, 0.0 0, 0.0 0, 0.0 25, 17.8 1, 0.7 0, 0.0 2, 1.4 1, 0.7
CHK 0, 0.0 0, 0.0 20, 18.4 0, 0.0 1, 0.9 0, 0.0 3, 2.8 1, 0.9 0, 0.0 0, 0.0 14, 12.9 1, 0.9 0, 0.0 0, 0.0 1, 0.9
DUR 14, 2.2 0, 0.0 142, 22.5 0, 0.0 8, 1.3 9, 1.4 39, 6.2 2, 0.3 4, 0.6 1, 0.2 135, 21.4 7, 1.1 3, 0.5 8, 1.3 4, 0.6
EOH 6, 3.0 0, 0.0 48, 23.9 0, 0.0 13, 6.5 0, 0.0 21, 10.4 0, 0.0 0, 0.0 0, 0.0 39, 19.4 1, 0.5 0, 0.0 1, 0.5 0, 0.0
ELG 0, 0.0 0, 0.0 14, 15.3 0, 0.0 2, 2.2 0, 0.0 3, 3.3 0, 0.0 0, 0.0 0, 0.0 10, 10.9 0, 0.0 0, 0.0 0, 0.0 0, 0.0
GBO 1, 0.6 0, 0.0 98, 59.5 0, 0.0 17, 10.3 1, 0.6 15, 9.1 1, 0.6 1, 0.6 0, 0.0 51, 30.9 1, 0.6 0, 0.0 22, 13.4 2, 1.2
HDN 4, 3.6 0, 0.0 34, 30.7 0, 0.0 4, 3.6 1, 0.9 7, 6.3 1, 0.9 0, 0.0 0, 0.0 29, 26.2 2, 1.8 0, 0.0 0, 0.0 2, 1.8
HKP 1, 0.6 0, 0.0 44, 24.6 0, 0.0 6, 3.4 0, 0.0 14, 7.8 0, 0.0 0, 0.0 0, 0.0 39, 21.8 1, 0.6 0, 0.0 3, 1.7 2, 1.1
HAL 21, 4.1 0, 0.0 123, 23.7 0, 0.0 5, 1.0 5, 1.0 62, 12.0 1, 0.2 2, 0.4 5, 1.0 92, 17.7 6, 1.2 2, 0.4 8, 1.5 15, 2.9
HAM 19, 3.5 0, 0.0 124, 23.0 0, 0.0 6, 1.1 2, 0.4 35, 6.5 4, 0.7 1, 0.2 0, 0.0 96, 17.8 6, 1.1 2, 0.4 1, 0.2 4, 0.7
HPE 1, 0.6 0, 0.0 21, 12.9 0, 0.0 8, 4.9 4, 2.5 11, 6.8 1, 0.6 0, 0.0 0, 0.0 30, 18.4 1, 0.6 1, 0.6 5, 3.1 0, 0.0
HUR 0, 0.0 0, 0.0 32, 53.0 0, 0.0 10, 16.6 0, 0.0 2, 3.3 0, 0.0 0, 0.0 0, 0.0 11, 18.2 0, 0.0 0, 0.0 3, 5.0 0, 0.0
KFL 1, 0.5 0, 0.0 50, 25.3 0, 0.0 7, 3.6 1, 0.5 17, 8.6 1, 0.5 1, 0.5 0, 0.0 30, 15.2 1, 0.5 0, 0.0 2, 1.0 2, 1.0
LAM 0, 0.0 0, 0.0 16, 12.2 0, 0.0 3, 2.3 1, 0.8 2, 1.5 0, 0.0 2, 1.5 0, 0.0 15, 11.4 2, 1.5 0, 0.0 6, 4.6 0, 0.0
LGL 1, 0.6 0, 0.0 25, 14.7 0, 0.0 5, 2.9 2, 1.2 8, 4.7 0, 0.0 0, 0.0 0, 0.0 20, 11.8 3, 1.8 0, 0.0 5, 2.9 3, 1.8
MSL 10, 2.2 0, 0.0 123, 26.7 0, 0.0 8, 1.7 2, 0.4 32, 6.9 0, 0.0 2, 0.4 0, 0.0 88, 19.1 4, 0.9 1, 0.2 10, 2.2 5, 1.1
NIA 7, 1.6 0, 0.0 156, 35.0 0, 0.0 8, 1.8 7, 1.6 37, 8.3 4, 0.9 1, 0.2 2, 0.5 95, 21.3 7, 1.6 1, 0.2 2, 0.5 2, 0.5
NPS 0, 0.0 0, 0.0 21, 16.5 0, 0.0 3, 2.4 0, 0.0 13, 10.2 0, 0.0 0, 0.0 0, 0.0 29, 22.8 1, 0.8 0, 0.0 1, 0.8 1, 0.8
NWR 0, 0.0 0, 0.0 9, 11.0 0, 0.0 0, 0.0 0, 0.0 7, 8.5 1, 1.2 0, 0.0 0, 0.0 18, 22.0 3, 3.7 0, 0.0 0, 0.0 1, 1.2
OTT 45, 5.0 0, 0.0 223, 24.5 0, 0.0 26, 2.9 8, 0.9 158, 17.4 9, 1.0 4, 0.4 3, 0.3 176, 19.3 19, 2.1 4, 0.4 12, 1.3 6, 0.7
OXF 1, 0.9 0, 0.0 34, 31.4 0, 0.0 7, 6.5 1, 0.9 9, 8.3 1, 0.9 1, 0.9 0, 0.0 20, 18.5 1, 0.9 0, 0.0 5, 4.6 0, 0.0
PEE 115, 8.4 0, 0.0 326, 23.9 0, 0.0 21, 1.5 11, 0.8 160, 11.7 21, 1.5 8, 0.6 26, 1.9 266, 19.5 30, 2.2 51, 3.7 18, 1.3 29, 2.1
PDH 0, 0.0 0, 0.0 46, 59.6 0, 0.0 12, 15.6 1, 1.3 4, 5.2 0, 0.0 0, 0.0 0, 0.0 17, 22.0 0, 0.0 0, 0.0 4, 5.2 0, 0.0
PTC 2, 1.4 0, 0.0 27, 19.2 0, 0.0 3, 2.1 0, 0.0 6, 4.3 0, 0.0 1, 0.7 0, 0.0 18, 12.8 2, 1.4 0, 0.0 3, 2.1 0, 0.0
PQP 0, 0.0 0, 0.0 2, 2.3 0, 0.0 1, 1.2 2, 2.3 2, 2.3 0, 0.0 0, 0.0 0, 0.0 26, 30.0 0, 0.0 0, 0.0 2, 2.3 0, 0.0
REN 2, 1.9 0, 0.0 19, 18.5 0, 0.0 1, 1.0 1, 1.0 9, 8.7 0, 0.0 1, 1.0 0, 0.0 21, 20.4 1, 1.0 0, 0.0 3, 2.9 0, 0.0
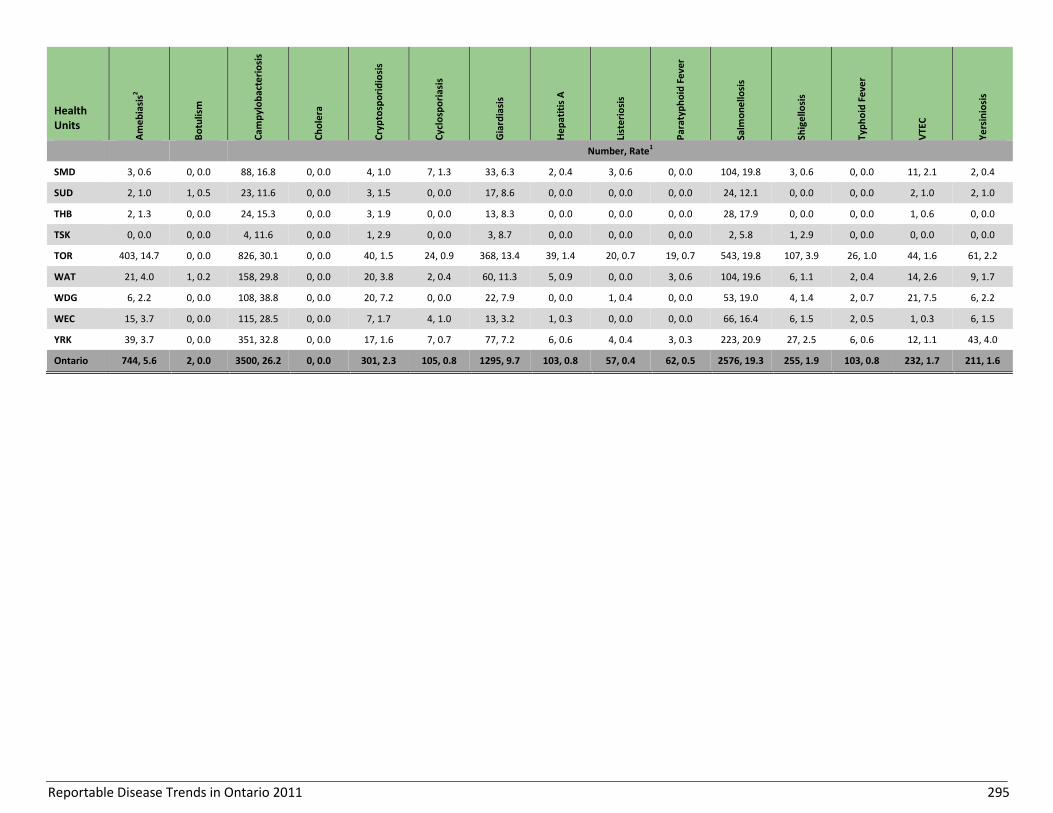
Reportable Disease Trends in Ontario 2011 295
Health Units
Am
eb
iasi
s2
Bo
tulis
m
Cam
pyl
ob
acte
rio
sis
Ch
ole
ra
Cry
pto
spo
rid
iosi
s
Cyc
losp
ori
asis
Gia
rdia
sis
He
pat
itis
A
List
eri
osi
s
Par
atyp
ho
id F
eve
r
Salm
on
ello
sis
Shig
ello
sis
Typ
ho
id F
eve
r
VTE
C
Ye
rsin
iosi
s
Number, Rate1
SMD 3, 0.6 0, 0.0 88, 16.8 0, 0.0 4, 1.0 7, 1.3 33, 6.3 2, 0.4 3, 0.6 0, 0.0 104, 19.8 3, 0.6 0, 0.0 11, 2.1 2, 0.4
SUD 2, 1.0 1, 0.5 23, 11.6 0, 0.0 3, 1.5 0, 0.0 17, 8.6 0, 0.0 0, 0.0 0, 0.0 24, 12.1 0, 0.0 0, 0.0 2, 1.0 2, 1.0
THB 2, 1.3 0, 0.0 24, 15.3 0, 0.0 3, 1.9 0, 0.0 13, 8.3 0, 0.0 0, 0.0 0, 0.0 28, 17.9 0, 0.0 0, 0.0 1, 0.6 0, 0.0
TSK 0, 0.0 0, 0.0 4, 11.6 0, 0.0 1, 2.9 0, 0.0 3, 8.7 0, 0.0 0, 0.0 0, 0.0 2, 5.8 1, 2.9 0, 0.0 0, 0.0 0, 0.0
TOR 403, 14.7 0, 0.0 826, 30.1 0, 0.0 40, 1.5 24, 0.9 368, 13.4 39, 1.4 20, 0.7 19, 0.7 543, 19.8 107, 3.9 26, 1.0 44, 1.6 61, 2.2
WAT 21, 4.0 1, 0.2 158, 29.8 0, 0.0 20, 3.8 2, 0.4 60, 11.3 5, 0.9 0, 0.0 3, 0.6 104, 19.6 6, 1.1 2, 0.4 14, 2.6 9, 1.7
WDG 6, 2.2 0, 0.0 108, 38.8 0, 0.0 20, 7.2 0, 0.0 22, 7.9 0, 0.0 1, 0.4 0, 0.0 53, 19.0 4, 1.4 2, 0.7 21, 7.5 6, 2.2
WEC 15, 3.7 0, 0.0 115, 28.5 0, 0.0 7, 1.7 4, 1.0 13, 3.2 1, 0.3 0, 0.0 0, 0.0 66, 16.4 6, 1.5 2, 0.5 1, 0.3 6, 1.5
YRK 39, 3.7 0, 0.0 351, 32.8 0, 0.0 17, 1.6 7, 0.7 77, 7.2 6, 0.6 4, 0.4 3, 0.3 223, 20.9 27, 2.5 6, 0.6 12, 1.1 43, 4.0
Ontario 744, 5.6 2, 0.0 3500, 26.2 0, 0.0 301, 2.3 105, 0.8 1295, 9.7 103, 0.8 57, 0.4 62, 0.5 2576, 19.3 255, 1.9 103, 0.8 232, 1.7 211, 1.6

Reportable Disease Trends in Ontario 2011 296
Data Table 2-B. Other Zoonotic and Vector-borne Diseases by Health Unit: Ontario, 20111,2
Health Units Anthrax Brucellosis HPS
Lyme disease2 Malaria Plague
Psittacosis/ Ornithosis Q fever Rabies Trichinosis Tularemia WNV2
Yellow Fever
ALG 0, 0.0 0, 0.0 0, 0.0 0, 0.0 2, 1.7 0, 0.0 0, 0.0 0, 0.0 0, 0.0 0, 0.0 0, 0.0 0, 0.0 0, 0.0
BRN 0, 0.0 0, 0.0 0, 0.0 0, 0.0 0, 0.0 0, 0.0 0, 0.0 0, 0.0 0, 0.0 0, 0.0 0, 0.0 4, 2.8 0, 0.0
CHK 0, 0.0 0, 0.0 0, 0.0 1, 0.9 0, 0.0 0, 0.0 0, 0.0 0, 0.0 0, 0.0 0, 0.0 0, 0.0 1, 0.9 0, 0.0
DUR 0, 0.0 0, 0.0 0, 0.0 1, 0.2 4, 0.6 0, 0.0 0, 0.0 1, 0.2 0, 0.0 0, 0.0 0, 0.0 2, 0.3 0, 0.0
EOH 0, 0.0 0, 0.0 0, 0.0 1, 0.5 0, 0.0 0, 0.0 0, 0.0 1, 0.5 0, 0.0 0, 0.0 0, 0.0 0, 0.0 0, 0.0
ELG 0, 0.0 0, 0.0 0, 0.0 0, 0.0 0, 0.0 0, 0.0 0, 0.0 1, 1.1 0, 0.0 0, 0.0 0, 0.0 0, 0.0 0, 0.0
GBO 0, 0.0 0, 0.0 0, 0.0 1, 0.6 0, 0.0 0, 0.0 0, 0.0 0, 0.0 0, 0.0 0, 0.0 0, 0.0 0, 0.0 0, 0.0
HDN 0, 0.0 0, 0.0 0, 0.0 4, 3.6 0, 0.0 0, 0.0 0, 0.0 2, 1.8 0, 0.0 0, 0.0 0, 0.0 0, 0.0 0, 0.0
HKP 0, 0.0 0, 0.0 0, 0.0 2, 1.1 2, 1.1 0, 0.0 0, 0.0 1, 0.6 0, 0.0 0, 0.0 0, 0.0 0, 0.0 0, 0.0
HAL 0, 0.0 0, 0.0 0, 0.0 6, 1.2 3, 0.6 0, 0.0 0, 0.0 1, 0.2 0, 0.0 0, 0.0 0, 0.0 9, 1.7 0, 0.0
HAM 0, 0.0 0, 0.0 0, 0.0 2, 0.4 9, 1.7 0, 0.0 0, 0.0 0, 0.0 0, 0.0 0, 0.0 0, 0.0 2, 0.4 0, 0.0
HPE 0, 0.0 0, 0.0 0, 0.0 4, 2.5 0, 0.0 0, 0.0 0, 0.0 0, 0.0 0, 0.0 0, 0.0 0, 0.0 1, 0.6 0, 0.0
HUR 0, 0.0 0, 0.0 0, 0.0 0, 0.0 0, 0.0 0, 0.0 0, 0.0 1, 1.7 0, 0.0 0, 0.0 0, 0.0 0, 0.0 0, 0.0
KFL 0, 0.0 0, 0.0 0, 0.0 17, 8.6 0, 0.0 0, 0.0 0, 0.0 0, 0.0 0, 0.0 0, 0.0 0, 0.0 0, 0.0 0, 0.0
LAM 0, 0.0 0, 0.0 0, 0.0 0, 0.0 1, 0.8 0, 0.0 0, 0.0 0, 0.0 0, 0.0 0, 0.0 0, 0.0 2, 1.5 0, 0.0
LGL 0, 0.0 0, 0.0 0, 0.0 20, 11.8 0, 0.0 0, 0.0 0, 0.0 0, 0.0 0, 0.0 0, 0.0 0, 0.0 2, 1.2 0, 0.0
MSL 0, 0.0 1, 0.2 0, 0.0 2, 0.4 3, 0.7 0, 0.0 0, 0.0 5, 1.1 0, 0.0 0, 0.0 0, 0.0 2, 0.4 0, 0.0
NIA 0, 0.0 0, 0.0 0, 0.0 6, 1.4 1, 0.2 0, 0.0 0, 0.0 0, 0.0 0, 0.0 0, 0.0 0, 0.0 8, 1.8 0, 0.0
NPS 0, 0.0 0, 0.0 0, 0.0 0, 0.0 2, 1.6 0, 0.0 0, 0.0 0, 0.0 0, 0.0 0, 0.0 0, 0.0 0, 0.0 0, 0.0
NWR 0, 0.0 0, 0.0 0, 0.0 0, 0.0 0, 0.0 0, 0.0 0, 0.0 0, 0.0 0, 0.0 0, 0.0 0, 0.0 0, 0.0 0, 0.0
OTT 0, 0.0 0, 0.0 0, 0.0 11, 1.2 18, 2.0 0, 0.0 0, 0.0 2, 0.2 0, 0.0 0, 0.0 0, 0.0 0, 0.0 0, 0.0
OXF 0, 0.0 0, 0.0 0, 0.0 4, 3.7 0, 0.0 0, 0.0 0, 0.0 0, 0.0 0, 0.0 0, 0.0 0, 0.0 0, 0.0 0, 0.0
PEE 0, 0.0 0, 0.0 0, 0.0 7, 0.5 66, 4.8 0, 0.0 0, 0.0 0, 0.0 0, 0.0 0, 0.0 0, 0.0 4, 0.3 0, 0.0
PDH 0, 0.0 0, 0.0 0, 0.0 1, 1.3 1, 1.3 0, 0.0 0, 0.0 1, 13 0, 0.0 0, 0.0 0, 0.0 0, 0.0 0, 0.0
PTC 0, 0.0 0, 0.0 0, 0.0 3, 2.1 0, 0.0 0, 0.0 0, 0.0 1, 0.7 0, 0.0 0, 0.0 0, 0.0 0, 0.0 0, 0.0
PQP 0, 0.0 0, 0.0 0, 0.0 0, 0.0 2, 2.3 0, 0.0 0, 0.0 0, 0.0 0, 0.0 0, 0.0 0, 0.0 0, 0.0 0, 0.0
REN 0, 0.0 0, 0.0 0, 1.0 5, 4.9 1, 1.0 0, 0.0 1, 1.0 0, 0.0 0, 0.0 0, 0.0 0, 0.0 0, 0.0 0, 0.0
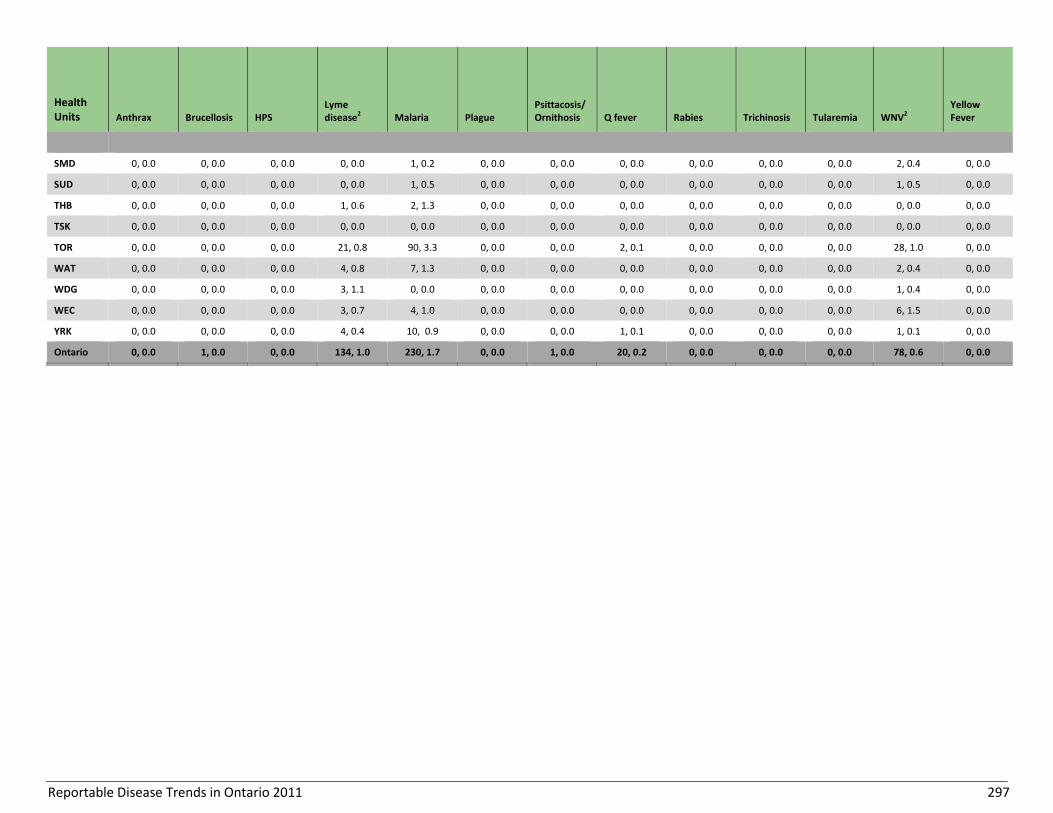
Reportable Disease Trends in Ontario 2011 297
Health Units Anthrax Brucellosis HPS
Lyme disease2 Malaria Plague
Psittacosis/ Ornithosis Q fever Rabies Trichinosis Tularemia WNV2
Yellow Fever
SMD 0, 0.0 0, 0.0 0, 0.0 0, 0.0 1, 0.2 0, 0.0 0, 0.0 0, 0.0 0, 0.0 0, 0.0 0, 0.0 2, 0.4 0, 0.0
SUD 0, 0.0 0, 0.0 0, 0.0 0, 0.0 1, 0.5 0, 0.0 0, 0.0 0, 0.0 0, 0.0 0, 0.0 0, 0.0 1, 0.5 0, 0.0
THB 0, 0.0 0, 0.0 0, 0.0 1, 0.6 2, 1.3 0, 0.0 0, 0.0 0, 0.0 0, 0.0 0, 0.0 0, 0.0 0, 0.0 0, 0.0
TSK 0, 0.0 0, 0.0 0, 0.0 0, 0.0 0, 0.0 0, 0.0 0, 0.0 0, 0.0 0, 0.0 0, 0.0 0, 0.0 0, 0.0 0, 0.0
TOR 0, 0.0 0, 0.0 0, 0.0 21, 0.8 90, 3.3 0, 0.0 0, 0.0 2, 0.1 0, 0.0 0, 0.0 0, 0.0 28, 1.0 0, 0.0
WAT 0, 0.0 0, 0.0 0, 0.0 4, 0.8 7, 1.3 0, 0.0 0, 0.0 0, 0.0 0, 0.0 0, 0.0 0, 0.0 2, 0.4 0, 0.0
WDG 0, 0.0 0, 0.0 0, 0.0 3, 1.1 0, 0.0 0, 0.0 0, 0.0 0, 0.0 0, 0.0 0, 0.0 0, 0.0 1, 0.4 0, 0.0
WEC 0, 0.0 0, 0.0 0, 0.0 3, 0.7 4, 1.0 0, 0.0 0, 0.0 0, 0.0 0, 0.0 0, 0.0 0, 0.0 6, 1.5 0, 0.0
YRK 0, 0.0 0, 0.0 0, 0.0 4, 0.4 10, 0.9 0, 0.0 0, 0.0 1, 0.1 0, 0.0 0, 0.0 0, 0.0 1, 0.1 0, 0.0
Ontario 0, 0.0 1, 0.0 0, 0.0 134, 1.0 230, 1.7 0, 0.0 1, 0.0 20, 0.2 0, 0.0 0, 0.0 0, 0.0 78, 0.6 0, 0.0

Reportable Disease Trends in Ontario 2011 298
Data Table 2-C. Diseases Transmitted by Respiratory Routes and Direct Contact by Health Unit: Ontario, 20111,2
Health Units iGAS Influenza
3 Legionellosis SARS Smallpox Tuberculosis
Number, Rate1
ALG 8, 6.8 60, 50.9 0, 0.0 0, 0.0 0, 0.0 0, 0.0
BRN 19, 13.5 50, 35.5 1, 0.7 0, 0.0 0, 0.0 1, 0.7
CHK 4, 3.7 20, 18.4 0, 0.0 0, 0.0 0, 0.0 1, 0.9
DUR 23, 3.6 160, 25.4 14, 2.2 0, 0.0 0, 0.0 13, 2.1
EOH 5, 2.5 82, 40.8 0, 0.0 0, 0.0 0, 0.0 0, 0.0
ELG 3, 3.3 37, 40.5 0, 0.0 0, 0.0 0, 0.0 1, 1.1
GBO 12, 7.3 88, 53.4 0, 0.0 0, 0.0 0, 0.0 1, 0.6
HDN 6, 5.4 36, 32.5 2, 1.8 0, 0.0 0, 0.0 1, 0.9
HKP 10, 5.6 97, 54.2 1, 0.6 0, 0.0 0, 0.0 3, 1.7
HAL 15, 2.9 219, 42.2 7, 1.4 0, 0.0 0, 0.0 12, 2.3
HAM 38, 7.0 469, 86.8 17, 3.2 0, 0.0 0, 0.0 18, 3.3
HPE 6, 3.7 77, 47.3 1, 0.6 0, 0.0 0, 0.0 0, 0.0
HUR 4, 6.6 52, 86.2 0, 0.0 0, 0.0 0, 0.0 1, 1.7
KFL 19, 9.6 68, 34.5 0, 0.0 0, 0.0 0, 0.0 0, 0.0
LAM 1, 0.8 54, 41.1 0, 0.0 0, 0.0 0, 0.0 1, 0.8
LGL 11, 6.5 50, 29.4 1, 0.6 0, 0.0 0, 0.0 0, 0.0
MSL 24, 5.2 278, 60.3 5, 1.1 0, 0.0 0, 0.0 7, 1.5
NIA 24, 5.4 138, 31.0 1, 0.2 0, 0.0 0, 0.0 7, 1.6
NPS 11, 8.6 73, 57.3 0, 0.0 0, 0.0 0, 0.0 0, 0.0
NWR 18, 22.0 36, 43.9 0, 0.0 0, 0.0 0, 0.0 1, 1.2
OTT 50, 5.5 200, 22.0 3, 0.3 0, 0.0 0, 0.0 47, 5.2
OXF 4, 3.7 48, 44.4 0, 0.0 0, 0.0 0, 0.0 0, 0.0
PEE 38, 2.8 596, 43.6 21, 1.5 0, 0.0 0, 0.0 141, 10.3
PDH 8, 10.4 77, 99.8 0, 0.0 0, 0.0 0, 0.0 0, 0.0
PTC 7, 5.0 148, 105.3 1, 0.7 0, 0.0 0, 0.0 1, 0.7
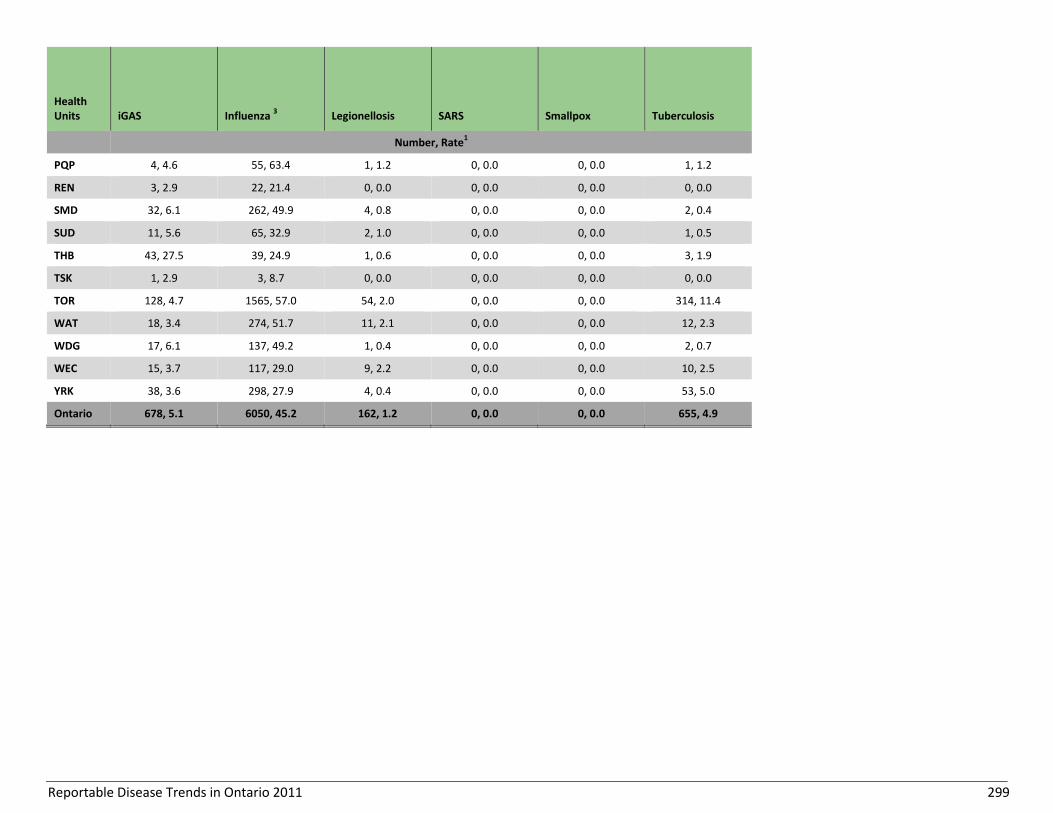
Reportable Disease Trends in Ontario 2011 299
Health Units iGAS Influenza
3 Legionellosis SARS Smallpox Tuberculosis
Number, Rate1
PQP 4, 4.6 55, 63.4 1, 1.2 0, 0.0 0, 0.0 1, 1.2
REN 3, 2.9 22, 21.4 0, 0.0 0, 0.0 0, 0.0 0, 0.0
SMD 32, 6.1 262, 49.9 4, 0.8 0, 0.0 0, 0.0 2, 0.4
SUD 11, 5.6 65, 32.9 2, 1.0 0, 0.0 0, 0.0 1, 0.5
THB 43, 27.5 39, 24.9 1, 0.6 0, 0.0 0, 0.0 3, 1.9
TSK 1, 2.9 3, 8.7 0, 0.0 0, 0.0 0, 0.0 0, 0.0
TOR 128, 4.7 1565, 57.0 54, 2.0 0, 0.0 0, 0.0 314, 11.4
WAT 18, 3.4 274, 51.7 11, 2.1 0, 0.0 0, 0.0 12, 2.3
WDG 17, 6.1 137, 49.2 1, 0.4 0, 0.0 0, 0.0 2, 0.7
WEC 15, 3.7 117, 29.0 9, 2.2 0, 0.0 0, 0.0 10, 2.5
YRK 38, 3.6 298, 27.9 4, 0.4 0, 0.0 0, 0.0 53, 5.0
Ontario 678, 5.1 6050, 45.2 162, 1.2 0, 0.0 0, 0.0 655, 4.9
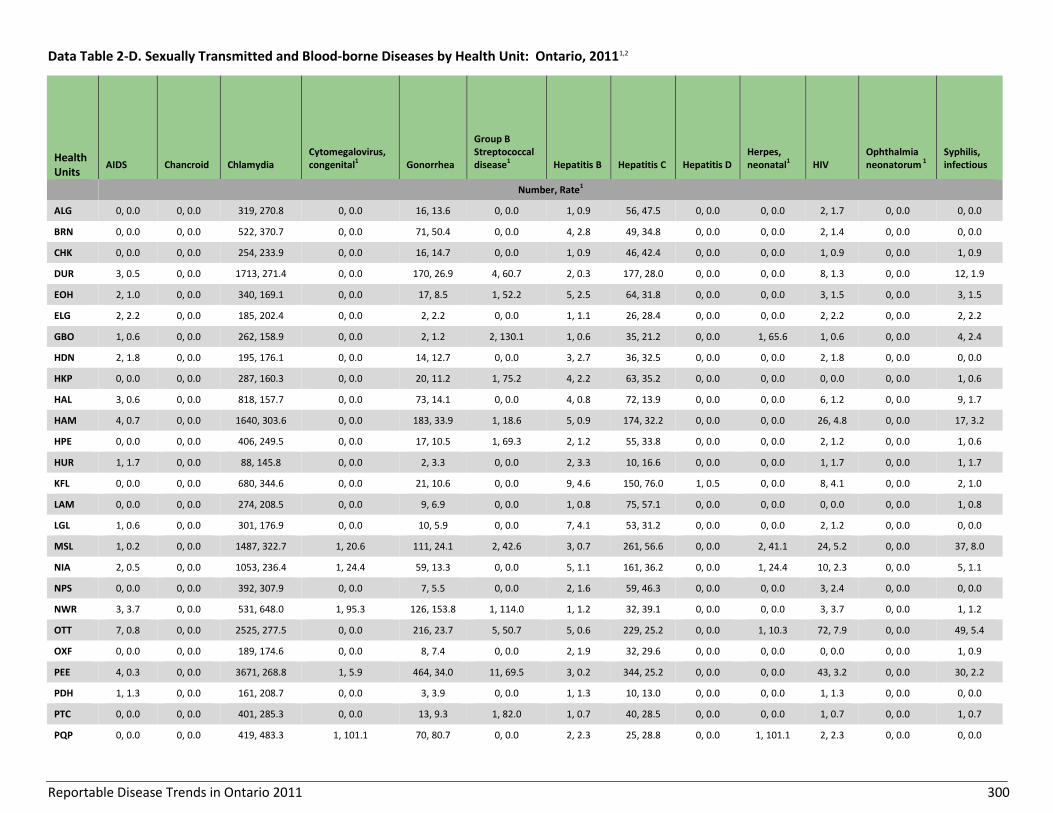
Reportable Disease Trends in Ontario 2011 300
Data Table 2-D. Sexually Transmitted and Blood-borne Diseases by Health Unit: Ontario, 20111,2
Health Units
AIDS Chancroid Chlamydia Cytomegalovirus, congenital1 Gonorrhea
Group B Streptococcal disease1 Hepatitis B Hepatitis C Hepatitis D
Herpes, neonatal1 HIV
Ophthalmia neonatorum 1
Syphilis, infectious
Number, Rate1
ALG 0, 0.0 0, 0.0 319, 270.8 0, 0.0 16, 13.6 0, 0.0 1, 0.9 56, 47.5 0, 0.0 0, 0.0 2, 1.7 0, 0.0 0, 0.0
BRN 0, 0.0 0, 0.0 522, 370.7 0, 0.0 71, 50.4 0, 0.0 4, 2.8 49, 34.8 0, 0.0 0, 0.0 2, 1.4 0, 0.0 0, 0.0
CHK 0, 0.0 0, 0.0 254, 233.9 0, 0.0 16, 14.7 0, 0.0 1, 0.9 46, 42.4 0, 0.0 0, 0.0 1, 0.9 0, 0.0 1, 0.9
DUR 3, 0.5 0, 0.0 1713, 271.4 0, 0.0 170, 26.9 4, 60.7 2, 0.3 177, 28.0 0, 0.0 0, 0.0 8, 1.3 0, 0.0 12, 1.9
EOH 2, 1.0 0, 0.0 340, 169.1 0, 0.0 17, 8.5 1, 52.2 5, 2.5 64, 31.8 0, 0.0 0, 0.0 3, 1.5 0, 0.0 3, 1.5
ELG 2, 2.2 0, 0.0 185, 202.4 0, 0.0 2, 2.2 0, 0.0 1, 1.1 26, 28.4 0, 0.0 0, 0.0 2, 2.2 0, 0.0 2, 2.2
GBO 1, 0.6 0, 0.0 262, 158.9 0, 0.0 2, 1.2 2, 130.1 1, 0.6 35, 21.2 0, 0.0 1, 65.6 1, 0.6 0, 0.0 4, 2.4
HDN 2, 1.8 0, 0.0 195, 176.1 0, 0.0 14, 12.7 0, 0.0 3, 2.7 36, 32.5 0, 0.0 0, 0.0 2, 1.8 0, 0.0 0, 0.0
HKP 0, 0.0 0, 0.0 287, 160.3 0, 0.0 20, 11.2 1, 75.2 4, 2.2 63, 35.2 0, 0.0 0, 0.0 0, 0.0 0, 0.0 1, 0.6
HAL 3, 0.6 0, 0.0 818, 157.7 0, 0.0 73, 14.1 0, 0.0 4, 0.8 72, 13.9 0, 0.0 0, 0.0 6, 1.2 0, 0.0 9, 1.7
HAM 4, 0.7 0, 0.0 1640, 303.6 0, 0.0 183, 33.9 1, 18.6 5, 0.9 174, 32.2 0, 0.0 0, 0.0 26, 4.8 0, 0.0 17, 3.2
HPE 0, 0.0 0, 0.0 406, 249.5 0, 0.0 17, 10.5 1, 69.3 2, 1.2 55, 33.8 0, 0.0 0, 0.0 2, 1.2 0, 0.0 1, 0.6
HUR 1, 1.7 0, 0.0 88, 145.8 0, 0.0 2, 3.3 0, 0.0 2, 3.3 10, 16.6 0, 0.0 0, 0.0 1, 1.7 0, 0.0 1, 1.7
KFL 0, 0.0 0, 0.0 680, 344.6 0, 0.0 21, 10.6 0, 0.0 9, 4.6 150, 76.0 1, 0.5 0, 0.0 8, 4.1 0, 0.0 2, 1.0
LAM 0, 0.0 0, 0.0 274, 208.5 0, 0.0 9, 6.9 0, 0.0 1, 0.8 75, 57.1 0, 0.0 0, 0.0 0, 0.0 0, 0.0 1, 0.8
LGL 1, 0.6 0, 0.0 301, 176.9 0, 0.0 10, 5.9 0, 0.0 7, 4.1 53, 31.2 0, 0.0 0, 0.0 2, 1.2 0, 0.0 0, 0.0
MSL 1, 0.2 0, 0.0 1487, 322.7 1, 20.6 111, 24.1 2, 42.6 3, 0.7 261, 56.6 0, 0.0 2, 41.1 24, 5.2 0, 0.0 37, 8.0
NIA 2, 0.5 0, 0.0 1053, 236.4 1, 24.4 59, 13.3 0, 0.0 5, 1.1 161, 36.2 0, 0.0 1, 24.4 10, 2.3 0, 0.0 5, 1.1
NPS 0, 0.0 0, 0.0 392, 307.9 0, 0.0 7, 5.5 0, 0.0 2, 1.6 59, 46.3 0, 0.0 0, 0.0 3, 2.4 0, 0.0 0, 0.0
NWR 3, 3.7 0, 0.0 531, 648.0 1, 95.3 126, 153.8 1, 114.0 1, 1.2 32, 39.1 0, 0.0 0, 0.0 3, 3.7 0, 0.0 1, 1.2
OTT 7, 0.8 0, 0.0 2525, 277.5 0, 0.0 216, 23.7 5, 50.7 5, 0.6 229, 25.2 0, 0.0 1, 10.3 72, 7.9 0, 0.0 49, 5.4
OXF 0, 0.0 0, 0.0 189, 174.6 0, 0.0 8, 7.4 0, 0.0 2, 1.9 32, 29.6 0, 0.0 0, 0.0 0, 0.0 0, 0.0 1, 0.9
PEE 4, 0.3 0, 0.0 3671, 268.8 1, 5.9 464, 34.0 11, 69.5 3, 0.2 344, 25.2 0, 0.0 0, 0.0 43, 3.2 0, 0.0 30, 2.2
PDH 1, 1.3 0, 0.0 161, 208.7 0, 0.0 3, 3.9 0, 0.0 1, 1.3 10, 13.0 0, 0.0 0, 0.0 1, 1.3 0, 0.0 0, 0.0
PTC 0, 0.0 0, 0.0 401, 285.3 0, 0.0 13, 9.3 1, 82.0 1, 0.7 40, 28.5 0, 0.0 0, 0.0 1, 0.7 0, 0.0 1, 0.7
PQP 0, 0.0 0, 0.0 419, 483.3 1, 101.1 70, 80.7 0, 0.0 2, 2.3 25, 28.8 0, 0.0 1, 101.1 2, 2.3 0, 0.0 0, 0.0
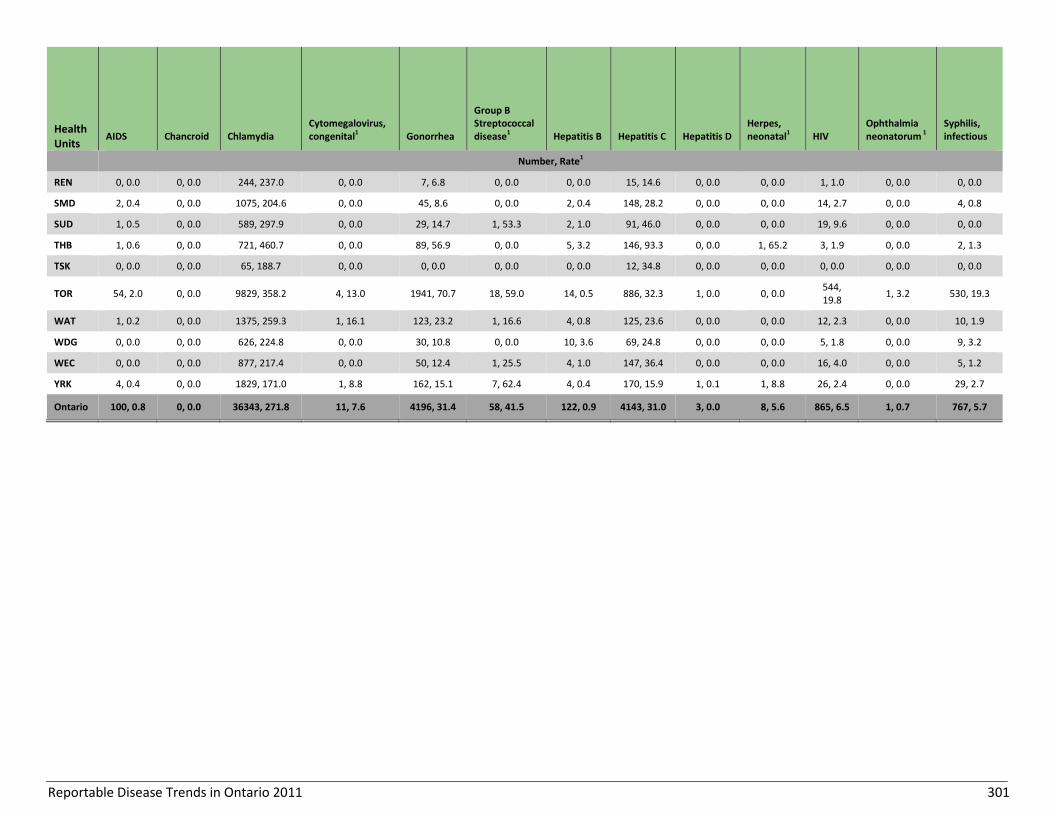
Reportable Disease Trends in Ontario 2011 301
Health Units
AIDS Chancroid Chlamydia Cytomegalovirus, congenital1 Gonorrhea
Group B Streptococcal disease1 Hepatitis B Hepatitis C Hepatitis D
Herpes, neonatal1 HIV
Ophthalmia neonatorum 1
Syphilis, infectious
Number, Rate1
REN 0, 0.0 0, 0.0 244, 237.0 0, 0.0 7, 6.8 0, 0.0 0, 0.0 15, 14.6 0, 0.0 0, 0.0 1, 1.0 0, 0.0 0, 0.0
SMD 2, 0.4 0, 0.0 1075, 204.6 0, 0.0 45, 8.6 0, 0.0 2, 0.4 148, 28.2 0, 0.0 0, 0.0 14, 2.7 0, 0.0 4, 0.8
SUD 1, 0.5 0, 0.0 589, 297.9 0, 0.0 29, 14.7 1, 53.3 2, 1.0 91, 46.0 0, 0.0 0, 0.0 19, 9.6 0, 0.0 0, 0.0
THB 1, 0.6 0, 0.0 721, 460.7 0, 0.0 89, 56.9 0, 0.0 5, 3.2 146, 93.3 0, 0.0 1, 65.2 3, 1.9 0, 0.0 2, 1.3
TSK 0, 0.0 0, 0.0 65, 188.7 0, 0.0 0, 0.0 0, 0.0 0, 0.0 12, 34.8 0, 0.0 0, 0.0 0, 0.0 0, 0.0 0, 0.0
TOR 54, 2.0 0, 0.0 9829, 358.2 4, 13.0 1941, 70.7 18, 59.0 14, 0.5 886, 32.3 1, 0.0 0, 0.0 544, 19.8
1, 3.2 530, 19.3
WAT 1, 0.2 0, 0.0 1375, 259.3 1, 16.1 123, 23.2 1, 16.6 4, 0.8 125, 23.6 0, 0.0 0, 0.0 12, 2.3 0, 0.0 10, 1.9
WDG 0, 0.0 0, 0.0 626, 224.8 0, 0.0 30, 10.8 0, 0.0 10, 3.6 69, 24.8 0, 0.0 0, 0.0 5, 1.8 0, 0.0 9, 3.2
WEC 0, 0.0 0, 0.0 877, 217.4 0, 0.0 50, 12.4 1, 25.5 4, 1.0 147, 36.4 0, 0.0 0, 0.0 16, 4.0 0, 0.0 5, 1.2
YRK 4, 0.4 0, 0.0 1829, 171.0 1, 8.8 162, 15.1 7, 62.4 4, 0.4 170, 15.9 1, 0.1 1, 8.8 26, 2.4 0, 0.0 29, 2.7
Ontario 100, 0.8 0, 0.0 36343, 271.8 11, 7.6 4196, 31.4 58, 41.5 122, 0.9 4143, 31.0 3, 0.0 8, 5.6 865, 6.5 1, 0.7 767, 5.7
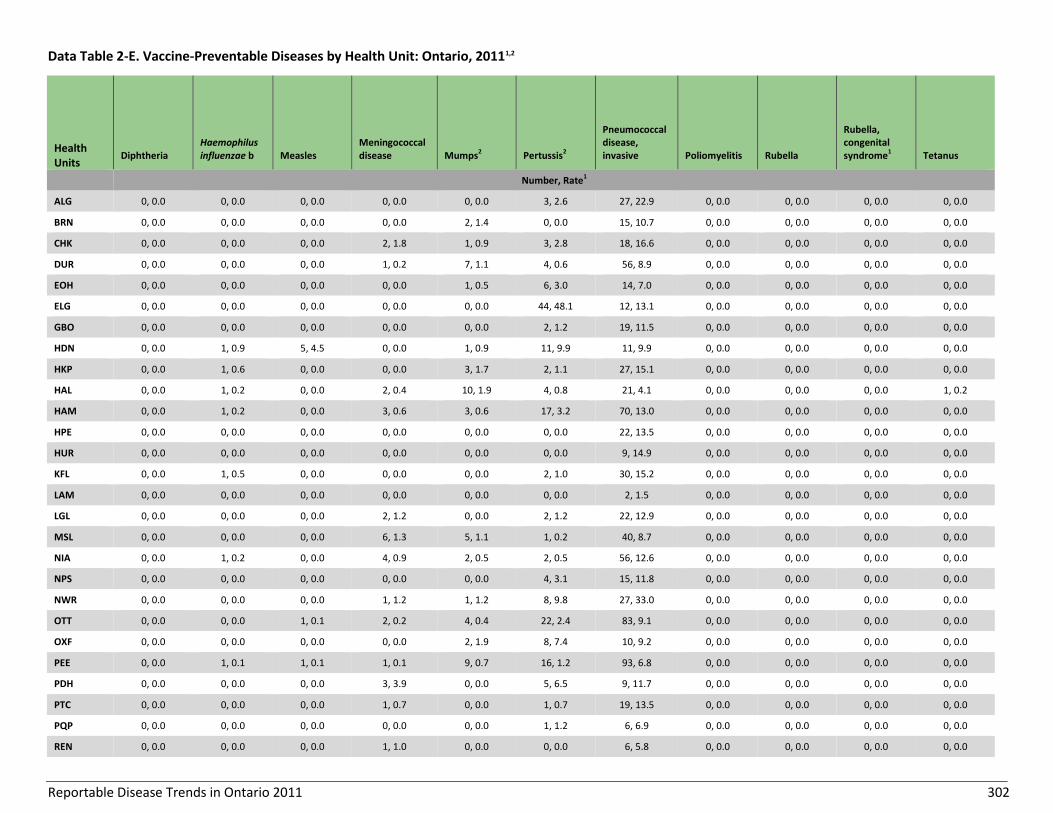
Reportable Disease Trends in Ontario 2011 302
Data Table 2-E. Vaccine-Preventable Diseases by Health Unit: Ontario, 20111,2
Health Units
Diphtheria Haemophilus influenzae b Measles
Meningococcal disease Mumps2 Pertussis2
Pneumococcal disease, invasive Poliomyelitis Rubella
Rubella, congenital syndrome1 Tetanus
Number, Rate1
ALG 0, 0.0 0, 0.0 0, 0.0 0, 0.0 0, 0.0 3, 2.6 27, 22.9 0, 0.0 0, 0.0 0, 0.0 0, 0.0
BRN 0, 0.0 0, 0.0 0, 0.0 0, 0.0 2, 1.4 0, 0.0 15, 10.7 0, 0.0 0, 0.0 0, 0.0 0, 0.0
CHK 0, 0.0 0, 0.0 0, 0.0 2, 1.8 1, 0.9 3, 2.8 18, 16.6 0, 0.0 0, 0.0 0, 0.0 0, 0.0
DUR 0, 0.0 0, 0.0 0, 0.0 1, 0.2 7, 1.1 4, 0.6 56, 8.9 0, 0.0 0, 0.0 0, 0.0 0, 0.0
EOH 0, 0.0 0, 0.0 0, 0.0 0, 0.0 1, 0.5 6, 3.0 14, 7.0 0, 0.0 0, 0.0 0, 0.0 0, 0.0
ELG 0, 0.0 0, 0.0 0, 0.0 0, 0.0 0, 0.0 44, 48.1 12, 13.1 0, 0.0 0, 0.0 0, 0.0 0, 0.0
GBO 0, 0.0 0, 0.0 0, 0.0 0, 0.0 0, 0.0 2, 1.2 19, 11.5 0, 0.0 0, 0.0 0, 0.0 0, 0.0
HDN 0, 0.0 1, 0.9 5, 4.5 0, 0.0 1, 0.9 11, 9.9 11, 9.9 0, 0.0 0, 0.0 0, 0.0 0, 0.0
HKP 0, 0.0 1, 0.6 0, 0.0 0, 0.0 3, 1.7 2, 1.1 27, 15.1 0, 0.0 0, 0.0 0, 0.0 0, 0.0
HAL 0, 0.0 1, 0.2 0, 0.0 2, 0.4 10, 1.9 4, 0.8 21, 4.1 0, 0.0 0, 0.0 0, 0.0 1, 0.2
HAM 0, 0.0 1, 0.2 0, 0.0 3, 0.6 3, 0.6 17, 3.2 70, 13.0 0, 0.0 0, 0.0 0, 0.0 0, 0.0
HPE 0, 0.0 0, 0.0 0, 0.0 0, 0.0 0, 0.0 0, 0.0 22, 13.5 0, 0.0 0, 0.0 0, 0.0 0, 0.0
HUR 0, 0.0 0, 0.0 0, 0.0 0, 0.0 0, 0.0 0, 0.0 9, 14.9 0, 0.0 0, 0.0 0, 0.0 0, 0.0
KFL 0, 0.0 1, 0.5 0, 0.0 0, 0.0 0, 0.0 2, 1.0 30, 15.2 0, 0.0 0, 0.0 0, 0.0 0, 0.0
LAM 0, 0.0 0, 0.0 0, 0.0 0, 0.0 0, 0.0 0, 0.0 2, 1.5 0, 0.0 0, 0.0 0, 0.0 0, 0.0
LGL 0, 0.0 0, 0.0 0, 0.0 2, 1.2 0, 0.0 2, 1.2 22, 12.9 0, 0.0 0, 0.0 0, 0.0 0, 0.0
MSL 0, 0.0 0, 0.0 0, 0.0 6, 1.3 5, 1.1 1, 0.2 40, 8.7 0, 0.0 0, 0.0 0, 0.0 0, 0.0
NIA 0, 0.0 1, 0.2 0, 0.0 4, 0.9 2, 0.5 2, 0.5 56, 12.6 0, 0.0 0, 0.0 0, 0.0 0, 0.0
NPS 0, 0.0 0, 0.0 0, 0.0 0, 0.0 0, 0.0 4, 3.1 15, 11.8 0, 0.0 0, 0.0 0, 0.0 0, 0.0
NWR 0, 0.0 0, 0.0 0, 0.0 1, 1.2 1, 1.2 8, 9.8 27, 33.0 0, 0.0 0, 0.0 0, 0.0 0, 0.0
OTT 0, 0.0 0, 0.0 1, 0.1 2, 0.2 4, 0.4 22, 2.4 83, 9.1 0, 0.0 0, 0.0 0, 0.0 0, 0.0
OXF 0, 0.0 0, 0.0 0, 0.0 0, 0.0 2, 1.9 8, 7.4 10, 9.2 0, 0.0 0, 0.0 0, 0.0 0, 0.0
PEE 0, 0.0 1, 0.1 1, 0.1 1, 0.1 9, 0.7 16, 1.2 93, 6.8 0, 0.0 0, 0.0 0, 0.0 0, 0.0
PDH 0, 0.0 0, 0.0 0, 0.0 3, 3.9 0, 0.0 5, 6.5 9, 11.7 0, 0.0 0, 0.0 0, 0.0 0, 0.0
PTC 0, 0.0 0, 0.0 0, 0.0 1, 0.7 0, 0.0 1, 0.7 19, 13.5 0, 0.0 0, 0.0 0, 0.0 0, 0.0
PQP 0, 0.0 0, 0.0 0, 0.0 0, 0.0 0, 0.0 1, 1.2 6, 6.9 0, 0.0 0, 0.0 0, 0.0 0, 0.0
REN 0, 0.0 0, 0.0 0, 0.0 1, 1.0 0, 0.0 0, 0.0 6, 5.8 0, 0.0 0, 0.0 0, 0.0 0, 0.0
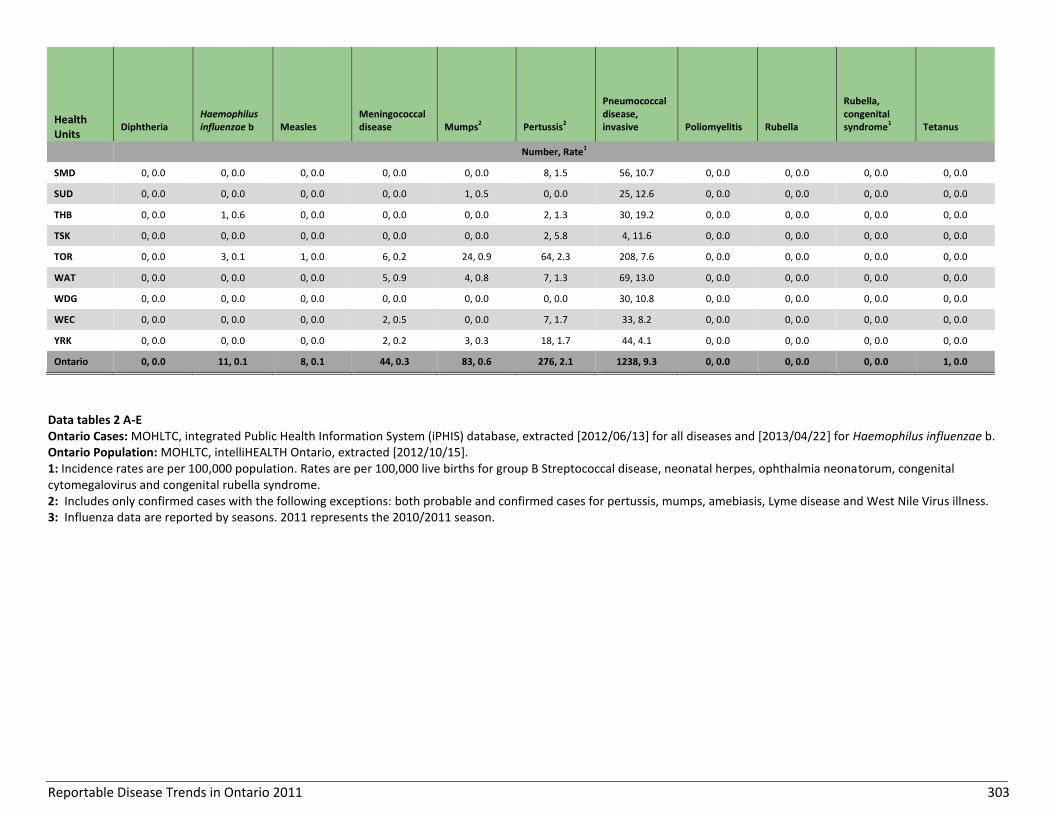
Reportable Disease Trends in Ontario 2011 303
Health Units
Diphtheria Haemophilus influenzae b Measles
Meningococcal disease Mumps2 Pertussis2
Pneumococcal disease, invasive Poliomyelitis Rubella
Rubella, congenital syndrome1 Tetanus
Number, Rate1
SMD 0, 0.0 0, 0.0 0, 0.0 0, 0.0 0, 0.0 8, 1.5 56, 10.7 0, 0.0 0, 0.0 0, 0.0 0, 0.0
SUD 0, 0.0 0, 0.0 0, 0.0 0, 0.0 1, 0.5 0, 0.0 25, 12.6 0, 0.0 0, 0.0 0, 0.0 0, 0.0
THB 0, 0.0 1, 0.6 0, 0.0 0, 0.0 0, 0.0 2, 1.3 30, 19.2 0, 0.0 0, 0.0 0, 0.0 0, 0.0
TSK 0, 0.0 0, 0.0 0, 0.0 0, 0.0 0, 0.0 2, 5.8 4, 11.6 0, 0.0 0, 0.0 0, 0.0 0, 0.0
TOR 0, 0.0 3, 0.1 1, 0.0 6, 0.2 24, 0.9 64, 2.3 208, 7.6 0, 0.0 0, 0.0 0, 0.0 0, 0.0
WAT 0, 0.0 0, 0.0 0, 0.0 5, 0.9 4, 0.8 7, 1.3 69, 13.0 0, 0.0 0, 0.0 0, 0.0 0, 0.0
WDG 0, 0.0 0, 0.0 0, 0.0 0, 0.0 0, 0.0 0, 0.0 30, 10.8 0, 0.0 0, 0.0 0, 0.0 0, 0.0
WEC 0, 0.0 0, 0.0 0, 0.0 2, 0.5 0, 0.0 7, 1.7 33, 8.2 0, 0.0 0, 0.0 0, 0.0 0, 0.0
YRK 0, 0.0 0, 0.0 0, 0.0 2, 0.2 3, 0.3 18, 1.7 44, 4.1 0, 0.0 0, 0.0 0, 0.0 0, 0.0
Ontario 0, 0.0 11, 0.1 8, 0.1 44, 0.3 83, 0.6 276, 2.1 1238, 9.3 0, 0.0 0, 0.0 0, 0.0 1, 0.0
Data tables 2 A-E Ontario Cases: MOHLTC, integrated Public Health Information System (iPHIS) database, extracted [2012/06/13] for all diseases and [2013/04/22] for Haemophilus influenzae b. Ontario Population: MOHLTC, intelliHEALTH Ontario, extracted [2012/10/15]. 1: Incidence rates are per 100,000 population. Rates are per 100,000 live births for group B Streptococcal disease, neonatal herpes, ophthalmia neonatorum, congenital cytomegalovirus and congenital rubella syndrome. 2: Includes only confirmed cases with the following exceptions: both probable and confirmed cases for pertussis, mumps, amebiasis, Lyme disease and West Nile Virus illness. 3: Influenza data are reported by seasons. 2011 represents the 2010/2011 season.
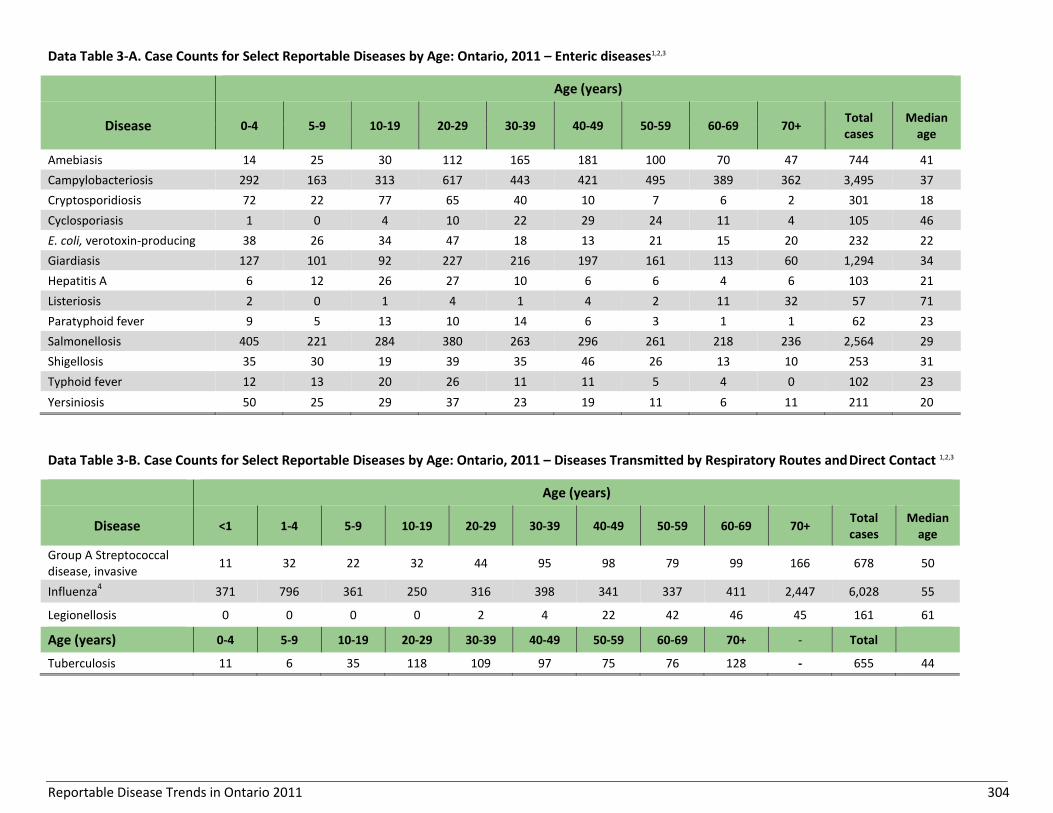
Reportable Disease Trends in Ontario 2011 304
Data Table 3-A. Case Counts for Select Reportable Diseases by Age: Ontario, 2011 – Enteric diseases1,2,3
Age (years)
Disease 0-4 5-9 10-19 20-29 30-39 40-49 50-59 60-69 70+ Total cases
Median age
Amebiasis 14 25 30 112 165 181 100 70 47 744 41
Campylobacteriosis 292 163 313 617 443 421 495 389 362 3,495 37
Cryptosporidiosis 72 22 77 65 40 10 7 6 2 301 18
Cyclosporiasis 1 0 4 10 22 29 24 11 4 105 46
E. coli, verotoxin-producing 38 26 34 47 18 13 21 15 20 232 22
Giardiasis 127 101 92 227 216 197 161 113 60 1,294 34
Hepatitis A 6 12 26 27 10 6 6 4 6 103 21
Listeriosis 2 0 1 4 1 4 2 11 32 57 71
Paratyphoid fever 9 5 13 10 14 6 3 1 1 62 23
Salmonellosis 405 221 284 380 263 296 261 218 236 2,564 29
Shigellosis 35 30 19 39 35 46 26 13 10 253 31
Typhoid fever 12 13 20 26 11 11 5 4 0 102 23
Yersiniosis 50 25 29 37 23 19 11 6 11 211 20
Data Table 3-B. Case Counts for Select Reportable Diseases by Age: Ontario, 2011 – Diseases Transmitted by Respiratory Routes and Direct Contact 1,2,3
Age (years)
Disease <1 1-4 5-9 10-19 20-29 30-39 40-49 50-59 60-69 70+ Total cases
Median age
Group A Streptococcal disease, invasive
11 32 22 32 44 95 98 79 99 166 678 50
Influenza4 371 796 361 250 316 398 341 337 411 2,447 6,028 55
Legionellosis 0 0 0 0 2 4 22 42 46 45 161 61
Age (years) 0-4 5-9 10-19 20-29 30-39 40-49 50-59 60-69 70+ - Total
Tuberculosis 11 6 35 118 109 97 75 76 128 - 655 44
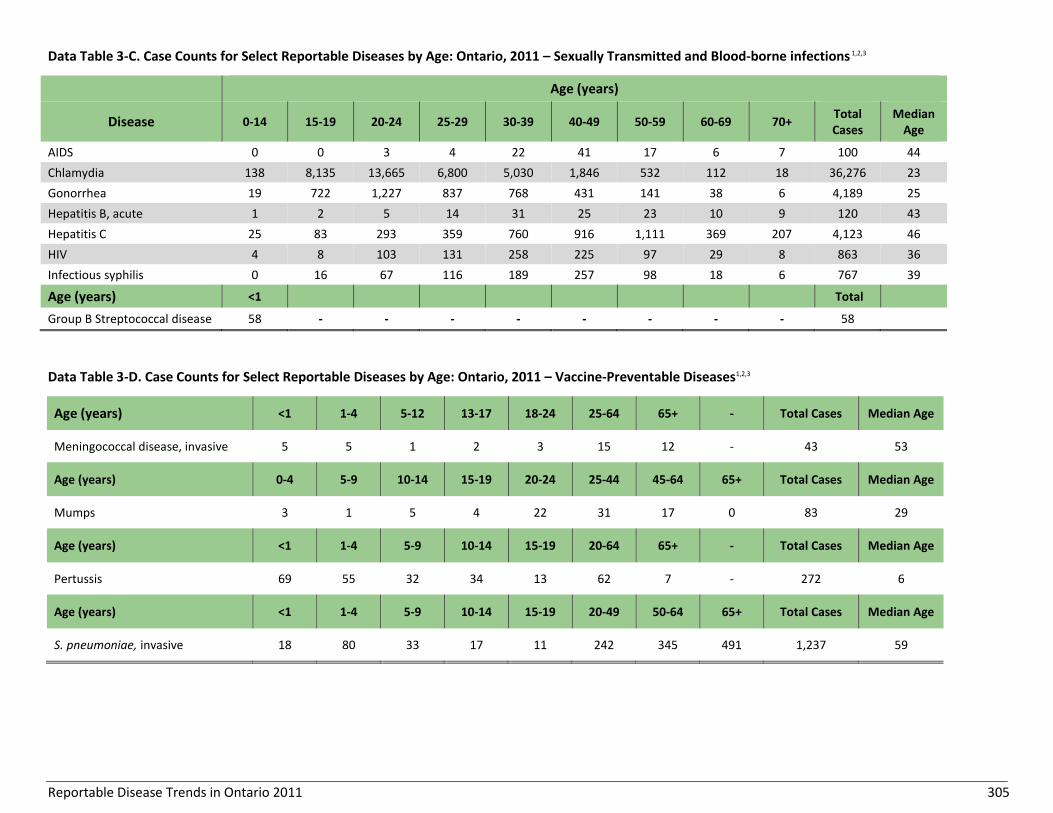
Reportable Disease Trends in Ontario 2011 305
Data Table 3-C. Case Counts for Select Reportable Diseases by Age: Ontario, 2011 – Sexually Transmitted and Blood-borne infections 1,2,3
Age (years)
Disease 0-14 15-19 20-24 25-29 30-39 40-49 50-59 60-69 70+ Total Cases
Median Age
AIDS 0 0 3 4 22 41 17 6 7 100 44
Chlamydia 138 8,135 13,665 6,800 5,030 1,846 532 112 18 36,276 23
Gonorrhea 19 722 1,227 837 768 431 141 38 6 4,189 25
Hepatitis B, acute 1 2 5 14 31 25 23 10 9 120 43
Hepatitis C 25 83 293 359 760 916 1,111 369 207 4,123 46
HIV 4 8 103 131 258 225 97 29 8 863 36
Infectious syphilis 0 16 67 116 189 257 98 18 6 767 39
Age (years) <1 Total
Group B Streptococcal disease 58 - - - - - - - - 58
Data Table 3-D. Case Counts for Select Reportable Diseases by Age: Ontario, 2011 – Vaccine-Preventable Diseases1,2,3
Age (years) <1 1-4 5-12 13-17 18-24 25-64 65+ - Total Cases Median Age
Meningococcal disease, invasive 5 5 1 2 3 15 12 - 43 53
Age (years) 0-4 5-9 10-14 15-19 20-24 25-44 45-64 65+ Total Cases Median Age
Mumps 3 1 5 4 22 31 17 0 83 29
Age (years) <1 1-4 5-9 10-14 15-19 20-64 65+ - Total Cases Median Age
Pertussis 69 55 32 34 13 62 7 - 272 6
Age (years) <1 1-4 5-9 10-14 15-19 20-49 50-64 65+ Total Cases Median Age
S. pneumoniae, invasive 18 80 33 17 11 242 345 491 1,237 59

Reportable Disease Trends in Ontario 2011 306
Data Table 3-E. Case Counts for Select Reportable Diseases by Age: Ontario, 2011 – Vector-borne Diseases 1,2,3
Age (years)
Disease 0-4 5-9 10-19 20-29 30-39 40-49 50-59 60-69 70+ Total cases Median age
Lyme Disease 3 7 18 17 17 13 25 22 8 130 44
Malaria 5 6 21 52 41 49 26 15 10 225 36
West Nile Virus illness 1 1 0 1 5 16 26 15 12 77 55
Data tables 3 A-E Ontario Cases: MOHLTC, integrated Public Health Information System (iPHIS) database, extracted [2012/06/13] for all diseases and [2013/04/22] for Haemophilus influenzae b. Ontario Population: MOHLTC, intelliHEALTH Ontario, extracted [2012/10/15]. 1: Does not include diseases for which no cases were reported in 2011 or diseases with too few cases to stratify by age. 2: Incidence rates are per 100,000 population. Rates are per 100,000 live births for group B Streptococcus disease. 3: Includes only confirmed cases with the following exceptions: both probable and confirmed cases for pertussis, mumps, amebiasis, Lyme disease and West Nile Virus illness. 4: Influenza data are reported by seasons. 2011 represents the 2010/2011 season.

Reportable Disease Trends in Ontario 2011 307
Data Table 4. Incidence, Case Counts and Outcomes for Select Reportable Diseases: Ontario, 2011
Reportable Diseases1 Cases Hospitalizations Deaths
# Rate/100,0002 # % # CFR (%)5
Enteric and Zoonotic Diseases
Amebiasis3 744 5.6 16 2.2 0 0.0
Campylobacteriosis 3,500 26.2 178 5.1 0 0.0
Cryptosporidiosis 301 2.3 13 4.3 0 0.0
Cyclosporiasis 105 0.8 2 1.9 0 0.0
E. coli, verotoxin-producing 232 1.7 60 25.9 0 0.0
Giardiasis 1,295 9.7 19 1.5 0 0.0
Hepatitis A 103 0.8 32 31.1 0 0.0
Listeriosis 57 0.4 34 59.6 6 10.5
Paratyphoid fever 62 0.5 12 19.4 0 0.0
Salmonellosis 2,576 19.3 255 9.9 5 0.2
Shigellosis 255 1.9 29 11.4 0 0.0
Typhoid fever 103 0.8 32 31.1 0 0.0
Yersiniosis 211 1.6 9 4.3 0 0.0
Vaccine-Preventable Diseases
Meningococcal disease 44 0.3 25 56.8 3 6.8
Mumps3 83 0.6 3 3.6 0 0.0
Pertussis3 276 2.1 30 10.9 0 0.0
S. pneumoniae 1,238 9.3 841 67.9 68 5.5
Respiratory Diseases and Diseases Transmitted by Direct Contact
Group A Streptococcal disease, invasive 678 5.1 455 67.1 49 7.2
Influenza4 6,050 45.2 2380 39.3 117 1.9
Legionellosis 162 1.2 122 75.3 8 4.9
Tuberculosis 655 4.9 196 29.9 38 5.8

Reportable Disease Trends in Ontario 2011 308
Reportable Diseases1 Cases Hospitalizations Deaths
# Rate/100,0002 # % # CFR (%)5
Vector-borne Diseases
Lyme Disease3 134 1.0 9 6.7 0 0.0
Malaria 230 1.7 65 28.3 0 0.0
West Nile Virus3 78 0.6 27 34.6 3 3.8
Data table 4 Ontario Cases: MOHLTC, integrated Public Health Information System (iPHIS) database, extracted [2012/06/13]. Ontario Population: MOHLTC, intelliHEALTH Ontario, extracted [2012/10/15]. 1: Includes only diseases for which hospitalization and mortality data were reported and where the relevant proportions were presented in this report. 2: Incidence rates are per 100,000 population. Rates are per 100,000 live births for group B Streptococcus disease. 3: Includes only confirmed cases with the following exceptions: both probable and confirmed cases for pertussis, mumps, amebiasis, Lyme disease and West Nile Virus illness. 4: Influenza data are reported by seasons. 2011 represents the 2010/2011 season. 5: CFR - case fatality ratio.

Public Health Ontario
480 University Avenue, Suite 300,
Toronto, Ontario
M5G 1V2
647.260.7100
www.publichealthontario.ca