reported property crime and arrests 200520062007200820092010201120122013 reported property crime...
TRANSCRIPT

Milwaukee Community Justice Council
Trends in Wisconsin Criminal Justice Data
Most of the contents of this PowerPoint werecreated by the Outcomes, Trends, and Indicators (OTIs)Subcommittee of the Wisconsin Statewide Criminal Justice Coordinating Council
January 28, 2015
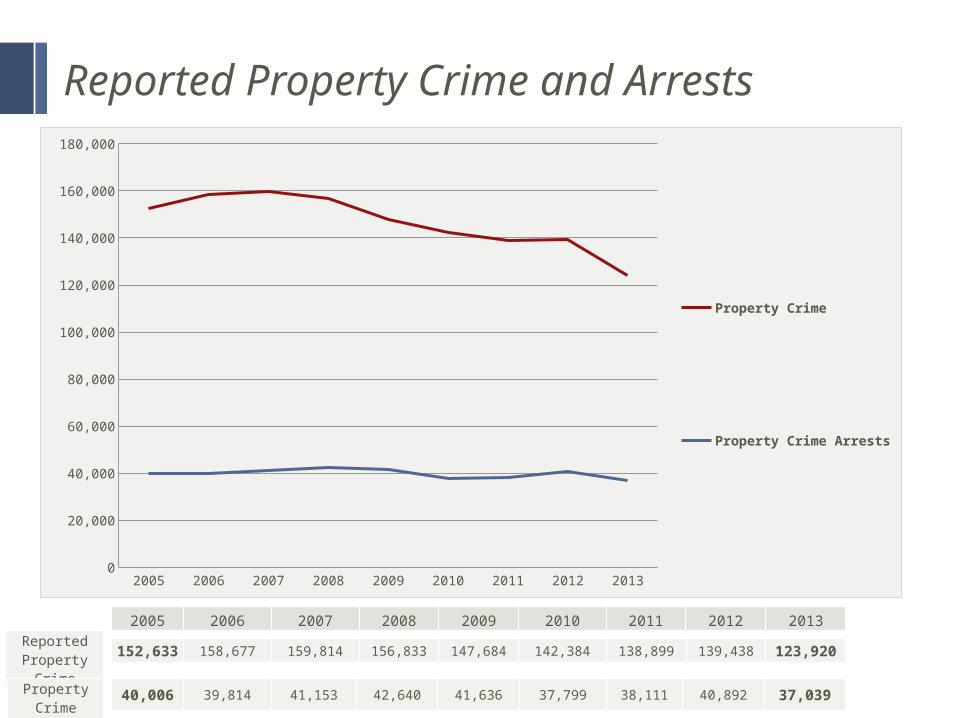
Reported Property Crime and Arrests
2005 2006 2007 2008 2009 2010 2011 2012 2013Reported Property Crime
2005 2006 2007 2008 2009 2010 2011 2012 20130
20,000
40,000
60,000
80,000
100,000
120,000
140,000
160,000
180,000
Property Crime
Property Crime Arrests
152,633 158,677 159,814 156,833 147,684 142,384 138,899 139,438 123,920
Property Crime Arrests
40,006 39,814 41,153 42,640 41,636 37,799 38,111 40,892 37,039
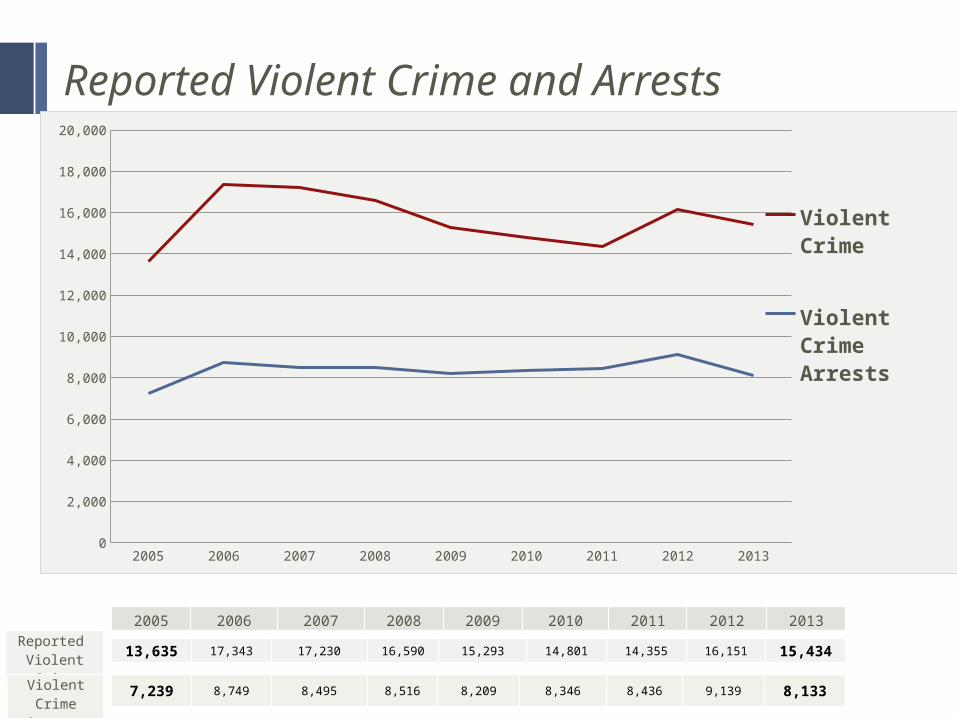
Reported Violent Crime and Arrests
2005 2006 2007 2008 2009 2010 2011 2012 2013Reported
Violent Crime 13,635 17,343 17,230 16,590 15,293 14,801 14,355 16,151 15,434
Violent Crime Arrests
7,239 8,749 8,495 8,516 8,209 8,346 8,436 9,139 8,133
2005 2006 2007 2008 2009 2010 2011 2012 20130
2,000
4,000
6,000
8,000
10,000
12,000
14,000
16,000
18,000
20,000
Violent Crime
Violent Crime Arrests
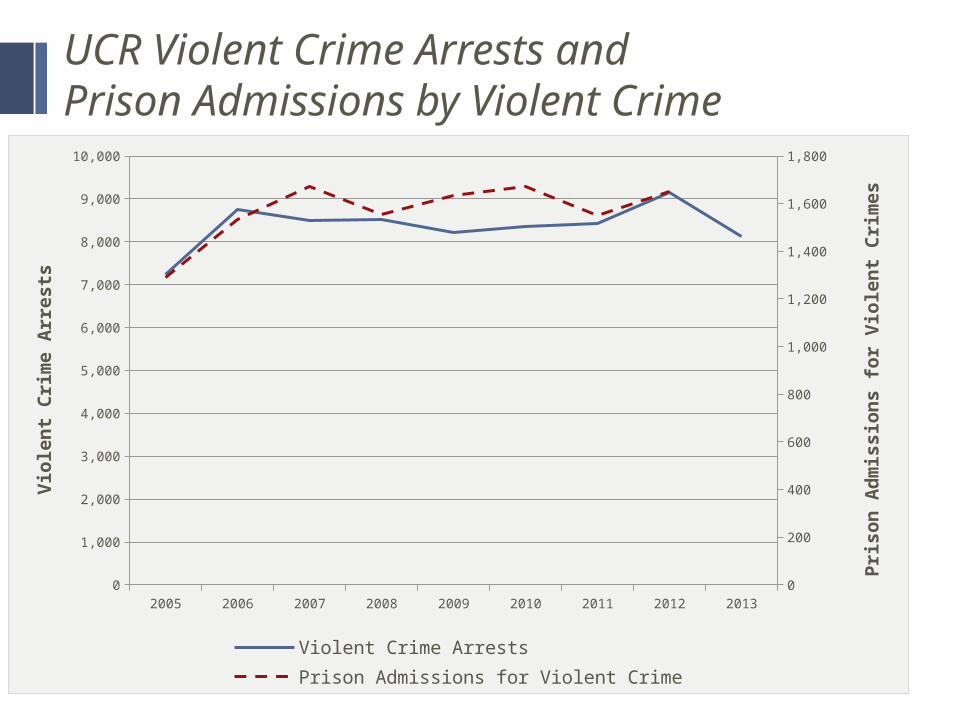
UCR Violent Crime Arrests and Prison Admissions by Violent Crime
2005 2006 2007 2008 2009 2010 2011 2012 20130
1,000
2,000
3,000
4,000
5,000
6,000
7,000
8,000
9,000
10,000
0
200
400
600
800
1,000
1,200
1,400
1,600
1,800
Violent Crime Arrests Prison Admissions for Violent Crime
Vio
len
t C
rim
e A
rre
sts
Pri
so
n A
dm
issio
ns f
or
Vio
len
t C
rim
es
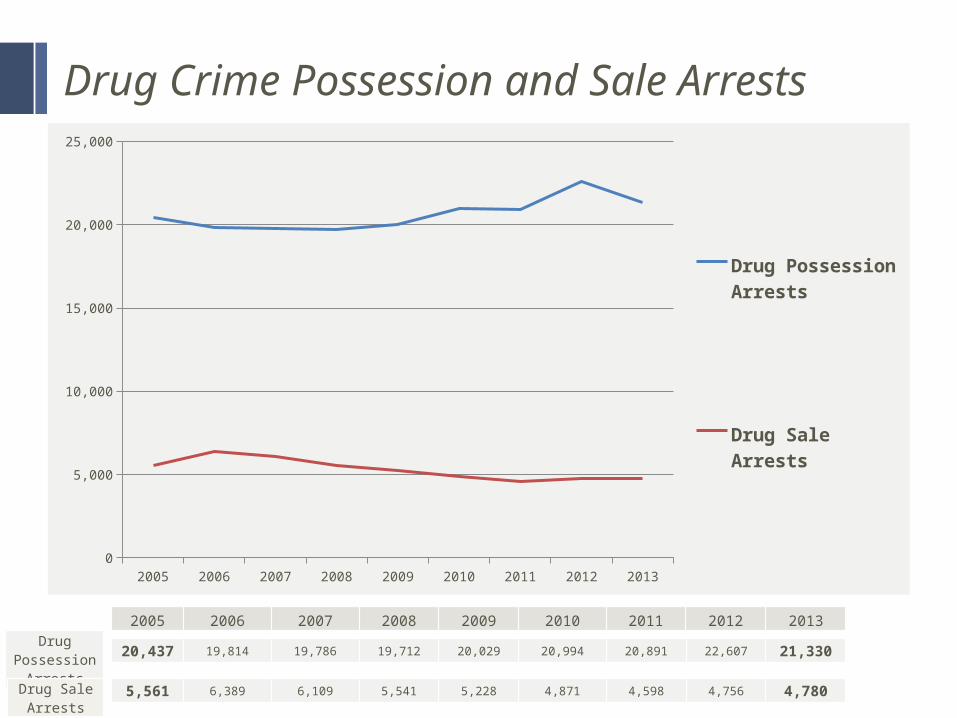
Drug Crime Possession and Sale Arrests
2005 2006 2007 2008 2009 2010 2011 2012 2013Drug
Possession Arrests
20,437 19,814 19,786 19,712 20,029 20,994 20,891 22,607 21,330
Drug Sale Arrests
5,561 6,389 6,109 5,541 5,228 4,871 4,598 4,756 4,780
2005 2006 2007 2008 2009 2010 2011 2012 20130
5,000
10,000
15,000
20,000
25,000
Drug Pos-session Ar-rests
Drug Sale Arrests
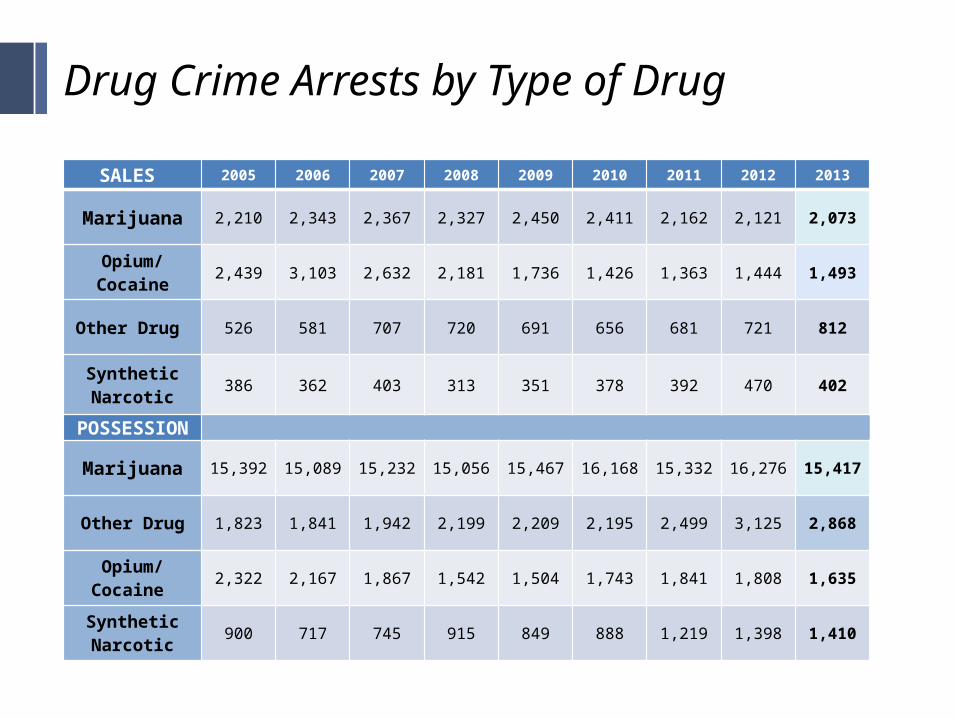
Drug Crime Arrests by Type of Drug
SALES 2005 2006 2007 2008 2009 2010 2011 2012 2013
Marijuana 2,210 2,343 2,367 2,327 2,450 2,411 2,162 2,121 2,073
Opium/Cocaine
2,439 3,103 2,632 2,181 1,736 1,426 1,363 1,444 1,493
Other Drug 526 581 707 720 691 656 681 721 812
Synthetic Narcotic
386 362 403 313 351 378 392 470 402
POSSESSION
Marijuana 15,392 15,089 15,232 15,056 15,467 16,168 15,332 16,27615,41
7
Other Drug 1,823 1,841 1,942 2,199 2,209 2,195 2,499 3,125 2,868
Opium/Cocaine
2,322 2,167 1,867 1,542 1,504 1,743 1,841 1,808 1,635
Synthetic Narcotic
900 717 745 915 849 888 1,219 1,398 1,410
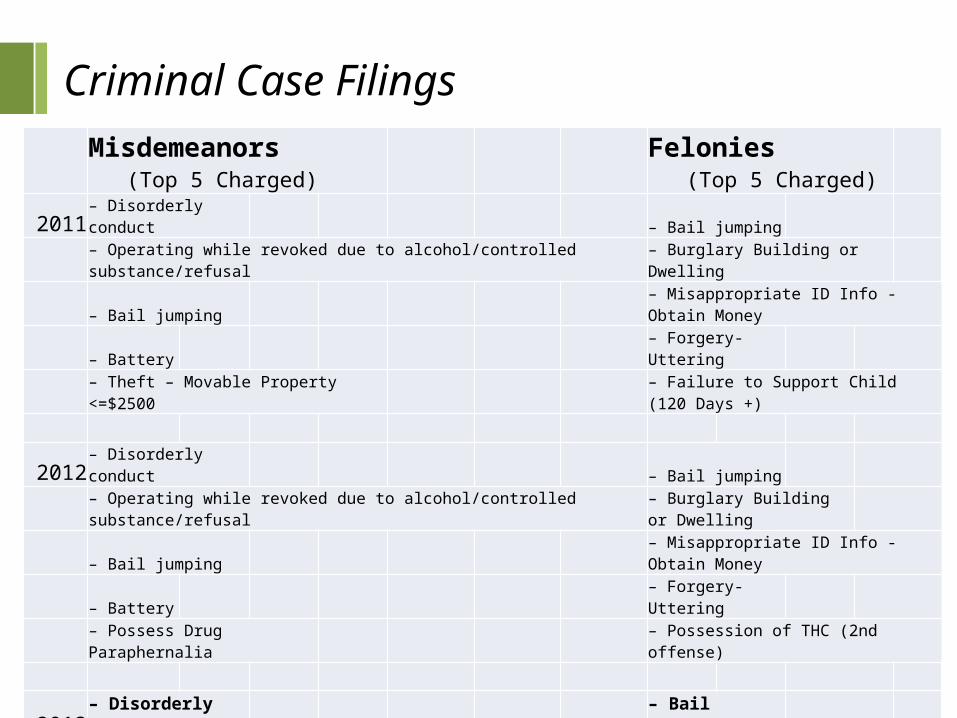
Criminal Case FilingsMisdemeanors (Top 5 Charged)
Felonies
(Top 5 Charged)
2011– Disorderly conduct – Bail jumping – Operating while revoked due to alcohol/controlled substance/refusal
– Burglary Building or Dwelling
– Bail jumping– Misappropriate ID Info - Obtain Money
– Battery– Forgery-Uttering
– Theft – Movable Property <=$2500– Failure to Support Child (120 Days +)
2012– Disorderly conduct – Bail jumping – Operating while revoked due to alcohol/controlled substance/refusal
– Burglary Building or Dwelling
– Bail jumping– Misappropriate ID Info - Obtain Money
– Battery– Forgery-Uttering
– Possess Drug Paraphernalia – Possession of THC (2nd offense)
2013– Disorderly conduct – Bail jumping
– Bail jumping– Burglary Building or Dwelling
– Operating while revoked due to alcohol/controlled substance
– Possession of THC (2nd offense)
– Battery– Forgery-Uttering
– Possess Drug Paraphernalia
– Misappropriate ID Info - Obtain Money
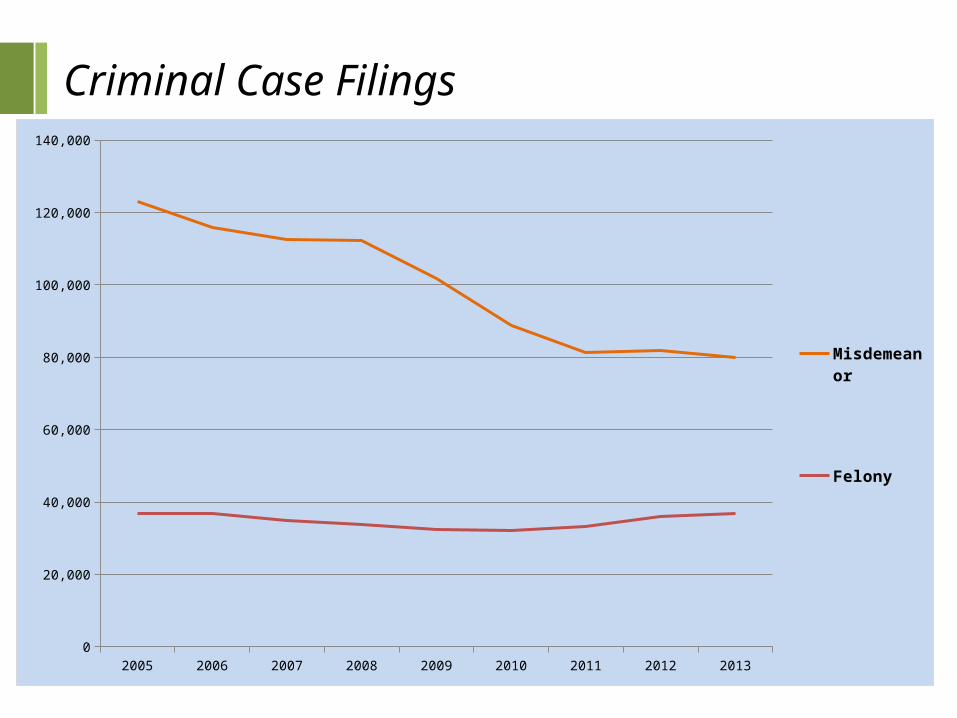
Criminal Case Filings
2005 2006 2007 2008 2009 2010 2011 2012 2013
Misdemeanor 122957 116003 112559 112178 101772 88910 81234 81965 79968
Felony 36881 36804 34863 33833 32334 32238 33266 36022 36884
10,000
30,000
50,000
70,000
90,000
110,000
130,000
Mis-de-meanor
Felony
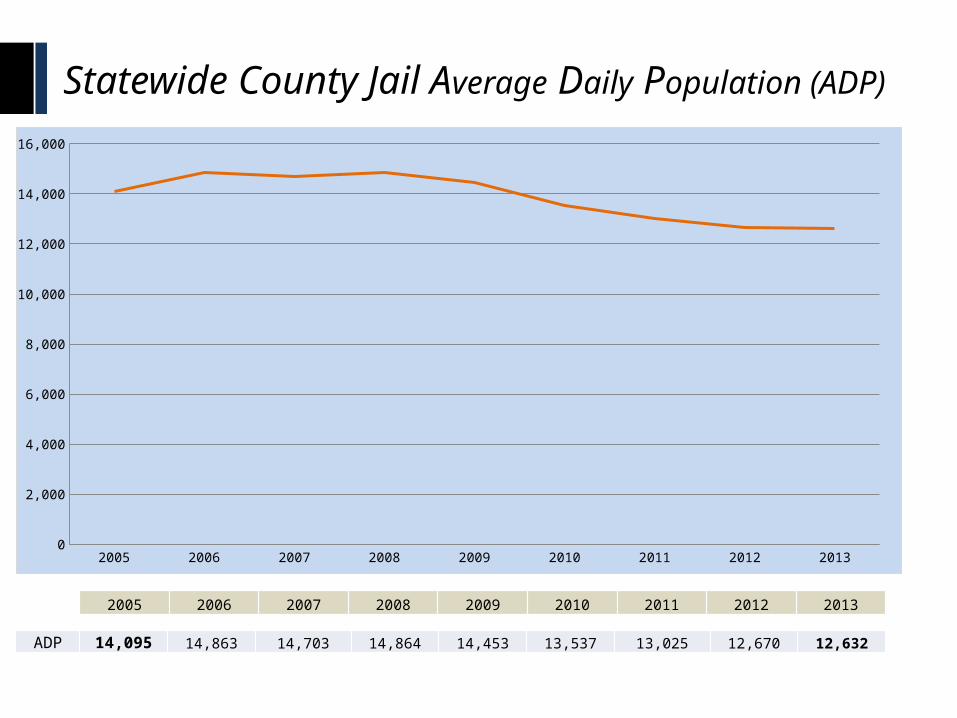
Statewide County Jail Average Daily Population (ADP)
2005 2006 2007 2008 2009 2010 2011 2012 20130
2,000
4,000
6,000
8,000
10,000
12,000
14,000
16,000
2005 2006 2007 2008 2009 2010 2011 2012 2013
ADP 14,095 14,863 14,703 14,864 14,453 13,537 13,025 12,670 12,632
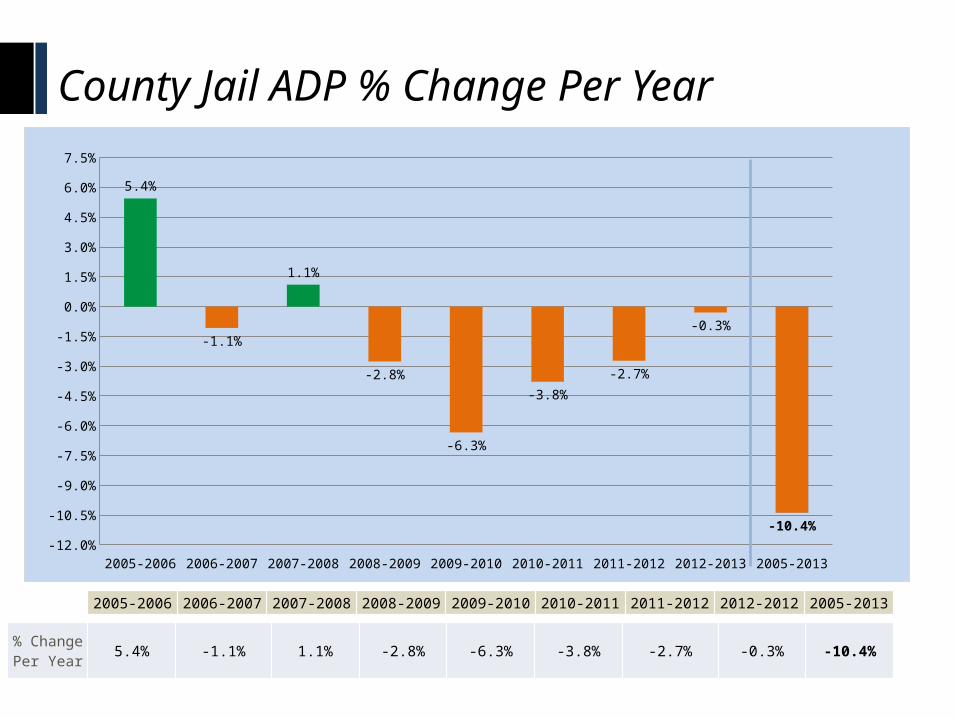
County Jail ADP % Change Per Year
2005-2006 2006-2007 2007-2008 2008-2009 2009-2010 2010-2011 2011-2012 2012-2012 2005-2013
2005-2006 2006-2007 2007-2008 2008-2009 2009-2010 2010-2011 2011-2012 2012-2013 2005-2013-12.0%
-10.5%
-9.0%
-7.5%
-6.0%
-4.5%
-3.0%
-1.5%
0.0%
1.5%
3.0%
4.5%
6.0%
7.5%
5.4%
-1.1%
1.1%
-2.8%
-6.3%
-3.8%
-2.7%
-0.3%
-10.4%
% Change Per Year
5.4% -1.1% 1.1% -2.8% -6.3% -3.8% -2.7% -0.3% -10.4%
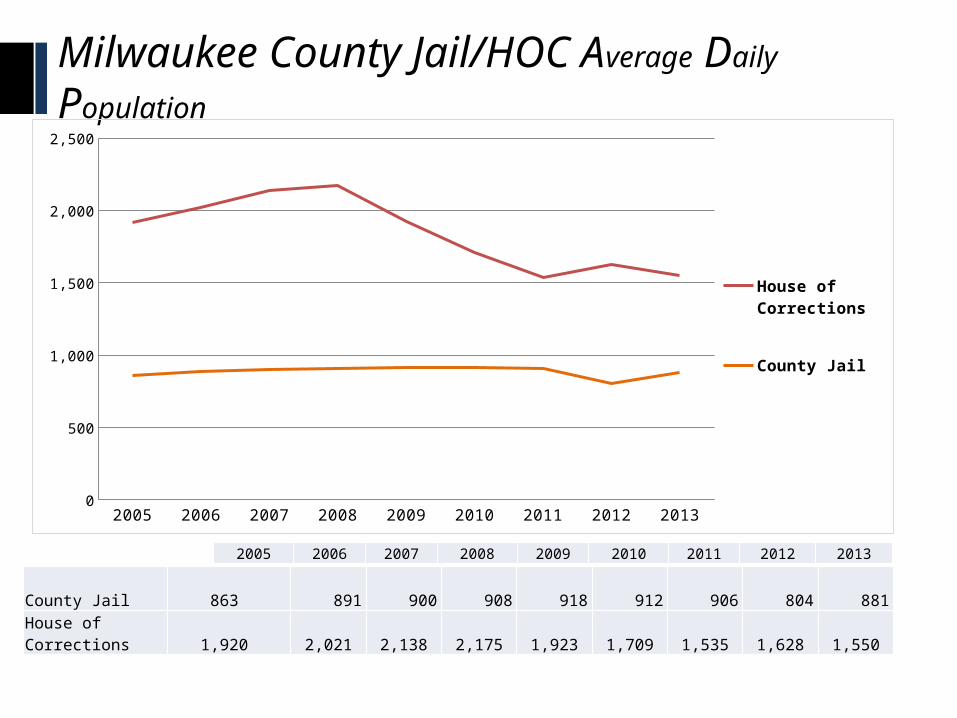
Milwaukee County Jail/HOC Average Daily
Population
2005 2006 2007 2008 2009 2010 2011 2012 20130
500
1,000
1,500
2,000
2,500
House of Corrections
County Jail
County Jail 863
891
900
908
918
912
906
804
881 House of Corrections 1,920
2,021
2,138
2,175
1,923
1,709
1,535
1,628
1,550
2005 2006 2007 2008 2009 2010 2011 2012 2013
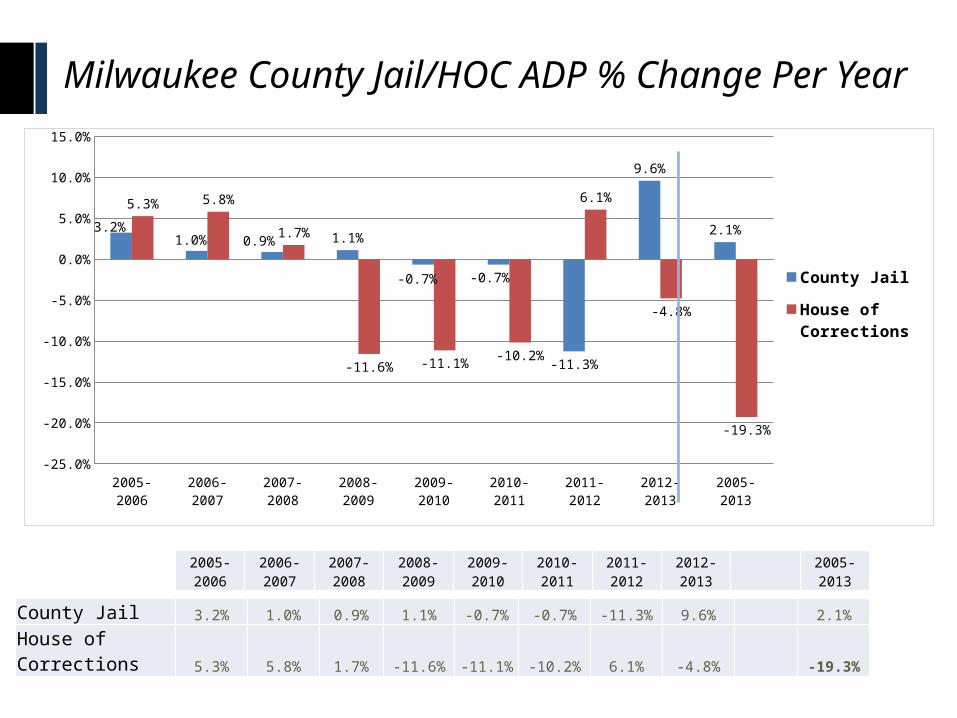
Milwaukee County Jail/HOC ADP % Change Per Year
County Jail 3.2% 1.0% 0.9% 1.1% -0.7% -0.7% -11.3% 9.6% 2.1%
House of Corrections 5.3% 5.8% 1.7% -11.6% -11.1% -10.2% 6.1% -4.8% -19.3%
2005-2006
2006-2007
2007-2008
2008-2009
2009-2010
2010-2011
2011-2012
2012-2013
2005-2013
2005-2006 2006-2007 2007-2008 2008-2009 2009-2010 2010-2011 2011-2012 2012-2013 2005-2013-25.0%
-20.0%
-15.0%
-10.0%
-5.0%
0.0%
5.0%
10.0%
15.0%
3.2%1.0% 0.9% 1.1%
-0.7% -0.7%
-11.3%
9.6%
2.1%
5.3% 5.8%
1.7%
-11.6% -11.1%-10.2%
6.1%
-4.8%
-19.3%
County Jail
House of Corrections
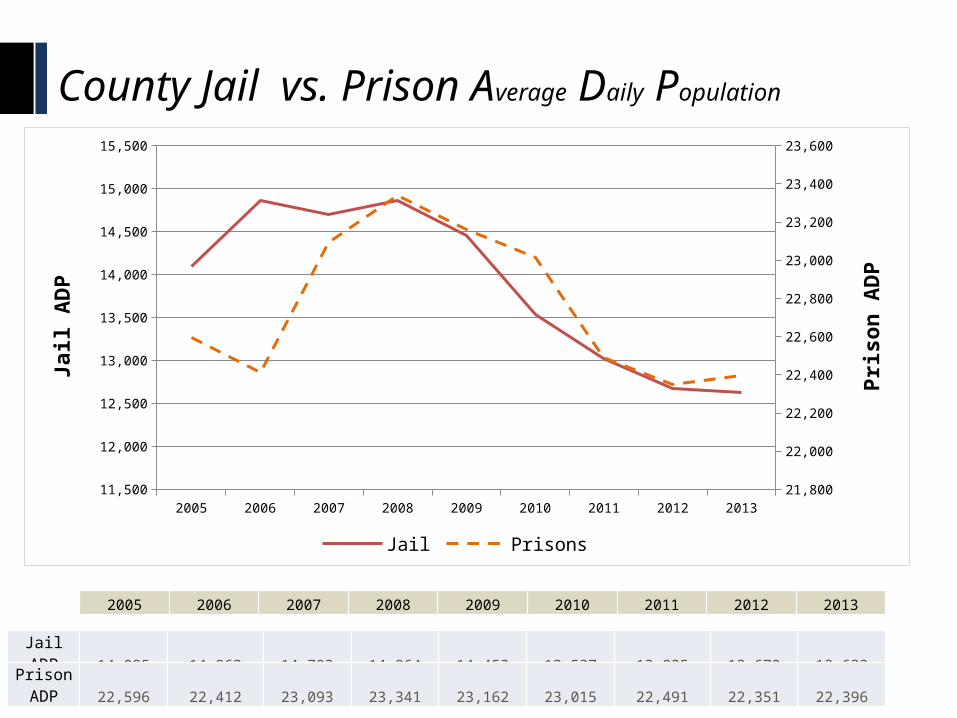
County Jail vs. Prison Average Daily Population
2005 2006 2007 2008 2009 2010 2011 2012 2013
Jail ADP 14,095 14,863 14,703 14,864 14,453 13,537 13,025 12,670 12,632
Prison ADP 22,596 22,412 23,093 23,341 23,162 23,015 22,491 22,351 22,396
2005 2006 2007 2008 2009 2010 2011 2012 201311,500
12,000
12,500
13,000
13,500
14,000
14,500
15,000
15,500
21,800
22,000
22,200
22,400
22,600
22,800
23,000
23,200
23,400
23,600
Jail Prisons
Jail A
DP
Pri
son
AD
P
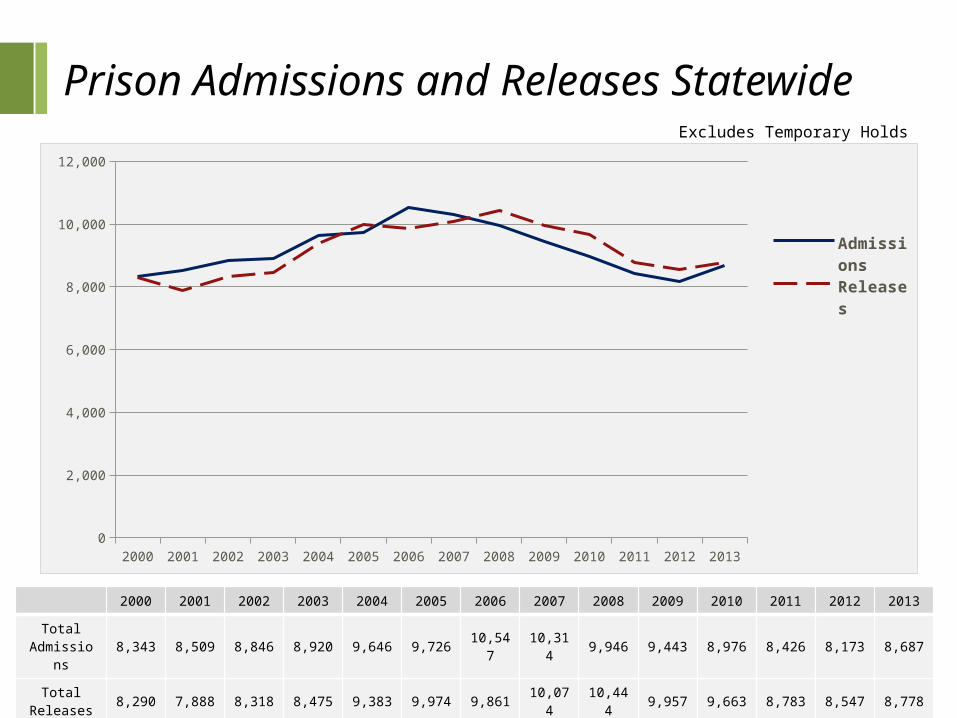
Prison Admissions and Releases Statewide
2000 2001 2002 2003 2004 2005 2006 2007 2008 2009 2010 2011 2012 2013
Total Admission
s8,343 8,509 8,846 8,920 9,646 9,726 10,54
710,31
49,946 9,443 8,976 8,426 8,173 8,687
Total Releases 8,290 7,888 8,318 8,475 9,383 9,974 9,861
10,074
10,444 9,957 9,663 8,783 8,547 8,778
Excludes Temporary Holds
2000 2001 2002 2003 2004 2005 2006 2007 2008 2009 2010 2011 2012 20130
2,000
4,000
6,000
8,000
10,000
12,000
Ad-mis-sionsRe-leases
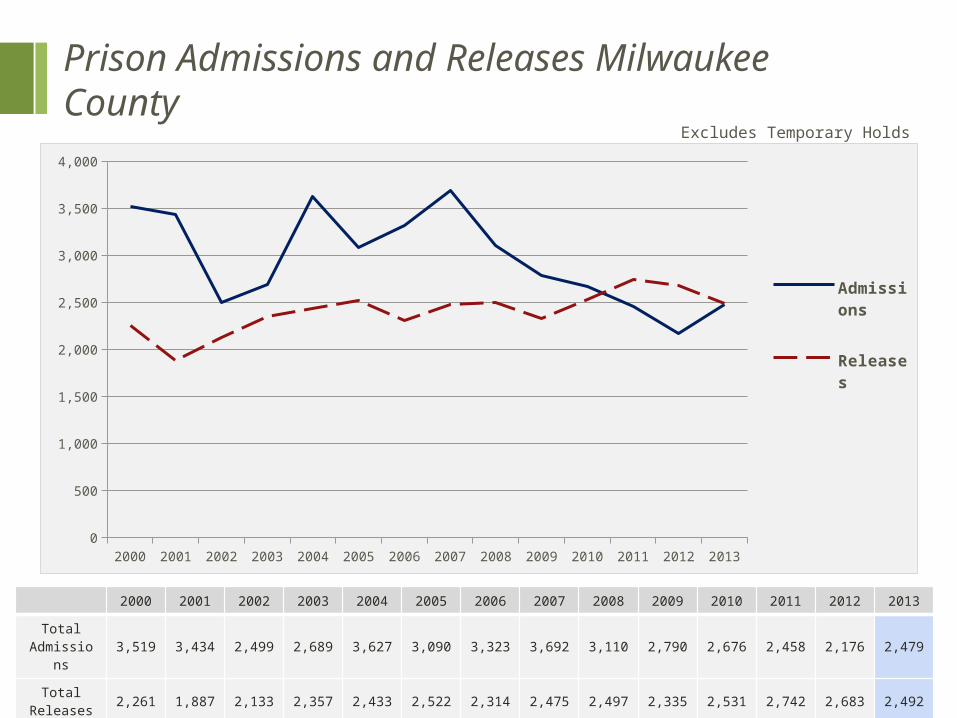
Prison Admissions and Releases Milwaukee County
2000 2001 2002 2003 2004 2005 2006 2007 2008 2009 2010 2011 2012 2013
Total Admission
s3,519 3,434 2,499 2,689 3,627 3,090 3,323 3,692 3,110 2,790 2,676 2,458 2,176 2,479
Total Releases 2,261 1,887 2,133 2,357 2,433 2,522 2,314 2,475 2,497 2,335 2,531 2,742 2,683 2,492
Excludes Temporary Holds
2000 2001 2002 2003 2004 2005 2006 2007 2008 2009 2010 2011 2012 20130
500
1,000
1,500
2,000
2,500
3,000
3,500
4,000
Ad-mis-sions
Re-leases

Prison Admissions by County of Conviction
2007 2013
# Rate per 1.000 Adults # Rate per 1,000
Adults
Milwaukee 3,692 5.1 2,479 3.4
Dane 764 2.0 556 1.4
Racine 614 4.1 544 3.7
Kenosha 588 4.8 357 2.8
Waukesha 460 1.6 468 1.5
Brown 405 2.2 467 2.4
Rock 298 2.5 298 2.4
Outagamie 221 1.7 198 1.5
Winnebago 205 1.6 198 1.5
Walworth 170 2.2 191 2.4
Marathon 158 1.6 234 2.3
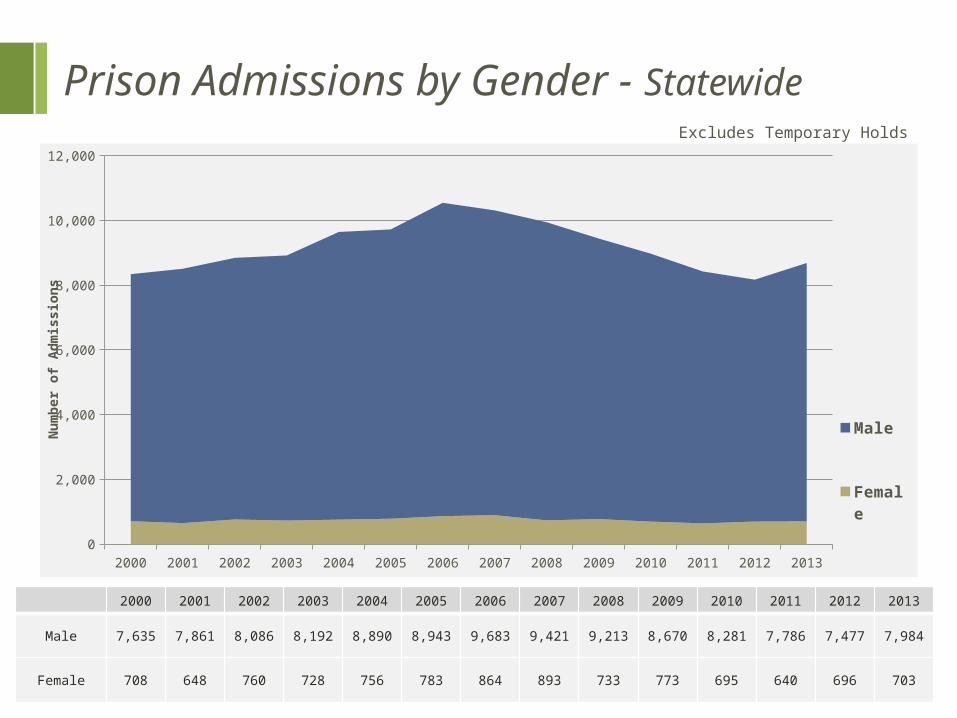
Prison Admissions by Gender - Statewide
Excludes Temporary Holds
2000 2001 2002 2003 2004 2005 2006 2007 2008 2009 2010 2011 2012 20130
2,000
4,000
6,000
8,000
10,000
12,000
Male
Fe-male
Num
ber
of
Adm
issio
ns
2000 2001 2002 2003 2004 2005 2006 2007 2008 2009 2010 2011 2012 2013
Male 7,635 7,861 8,086 8,192 8,890 8,943 9,683 9,421 9,213 8,670 8,281 7,786 7,477 7,984
Female 708 648 760 728 756 783 864 893 733 773 695 640 696 703
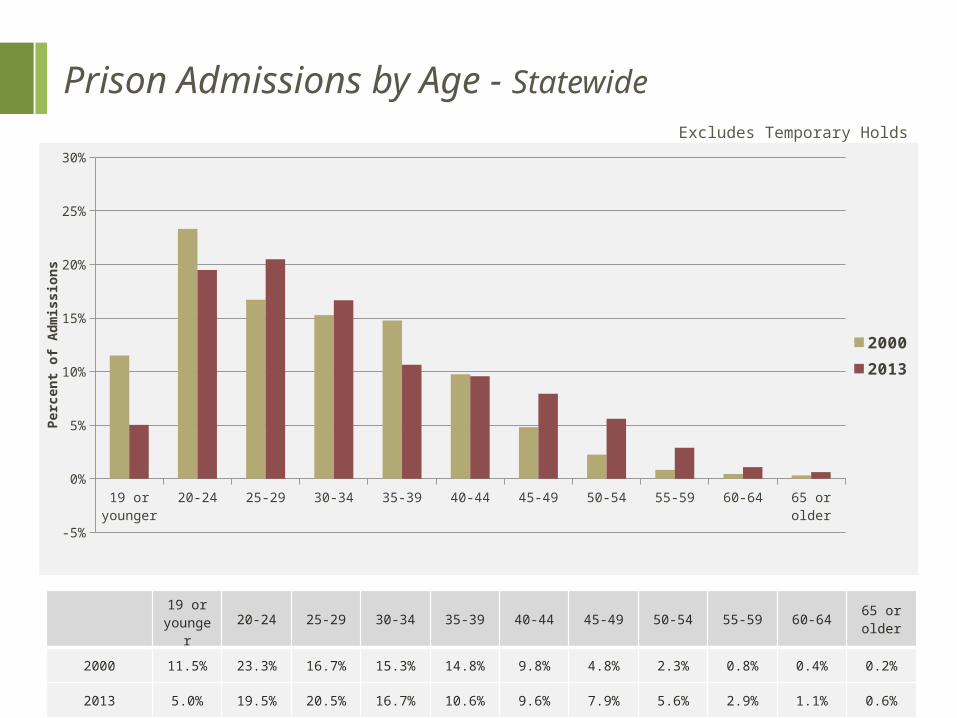
Prison Admissions by Age - StatewideExcludes Temporary Holds
19 or younger
20-24 25-29 30-34 35-39 40-44 45-49 50-54 55-59 60-64 65 or older
-5%
0%
5%
10%
15%
20%
25%
30%
2000
2013
Perc
ent
of
Adm
issio
ns
19 or younge
r20-24 25-29 30-34 35-39 40-44 45-49 50-54 55-59 60-64 65 or
older
2000 11.5% 23.3% 16.7% 15.3% 14.8% 9.8% 4.8% 2.3% 0.8% 0.4% 0.2%
2013 5.0% 19.5% 20.5% 16.7% 10.6% 9.6% 7.9% 5.6% 2.9% 1.1% 0.6%
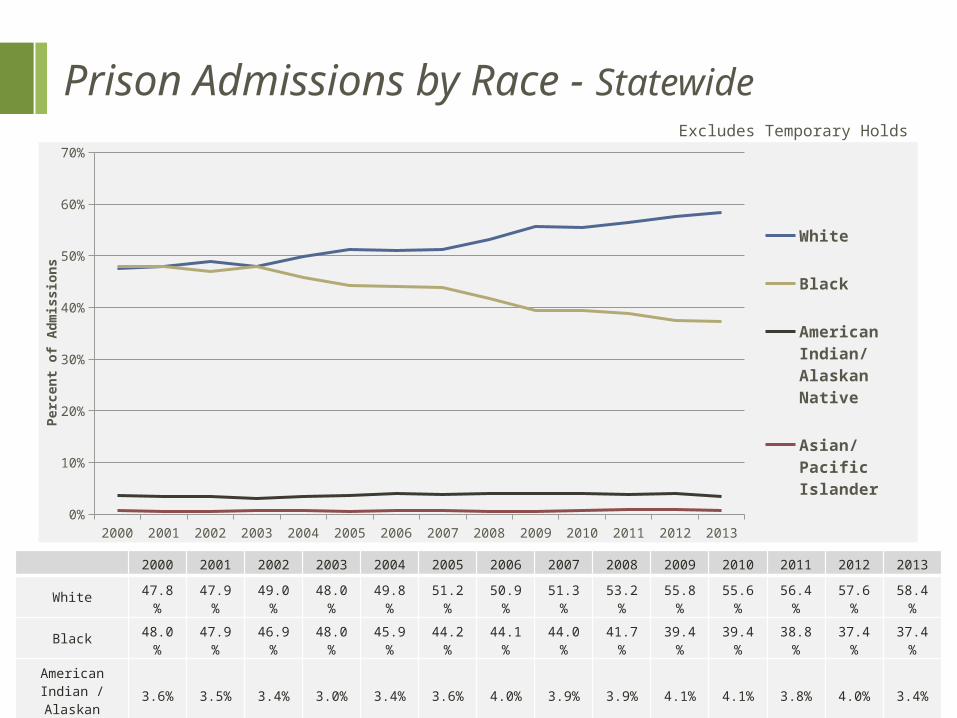
Prison Admissions by Race - Statewide
Excludes Temporary Holds
2000 2001 2002 2003 2004 2005 2006 2007 2008 2009 2010 2011 2012 20130%
10%
20%
30%
40%
50%
60%
70%
White
Black
American Indian/Alaskan Na-tive
Asian/Pacific Islander
Perc
ent
of
Adm
issio
ns
2000 2001 2002 2003 2004 2005 2006 2007 2008 2009 2010 2011 2012 2013
White47.8
%47.9
%49.0
%48.0
%49.8
%51.2
%50.9
%51.3
%53.2
%55.8
%55.6
%56.4
%57.6
%58.4
%
Black48.0
%47.9
%46.9
%48.0
%45.9
%44.2
%44.1
%44.0
%41.7
%39.4
%39.4
%38.8
%37.4
%37.4
%
American Indian / Alaskan Native
3.6% 3.5% 3.4% 3.0% 3.4% 3.6% 4.0% 3.9% 3.9% 4.1% 4.1% 3.8% 4.0% 3.4%
Asian / Pacific Islander 0.6% 0.6% 0.6% 0.7% 0.7% 0.6% 0.7% 0.7% 0.6% 0.6% 0.7% 1.0% 0.9% 0.8%
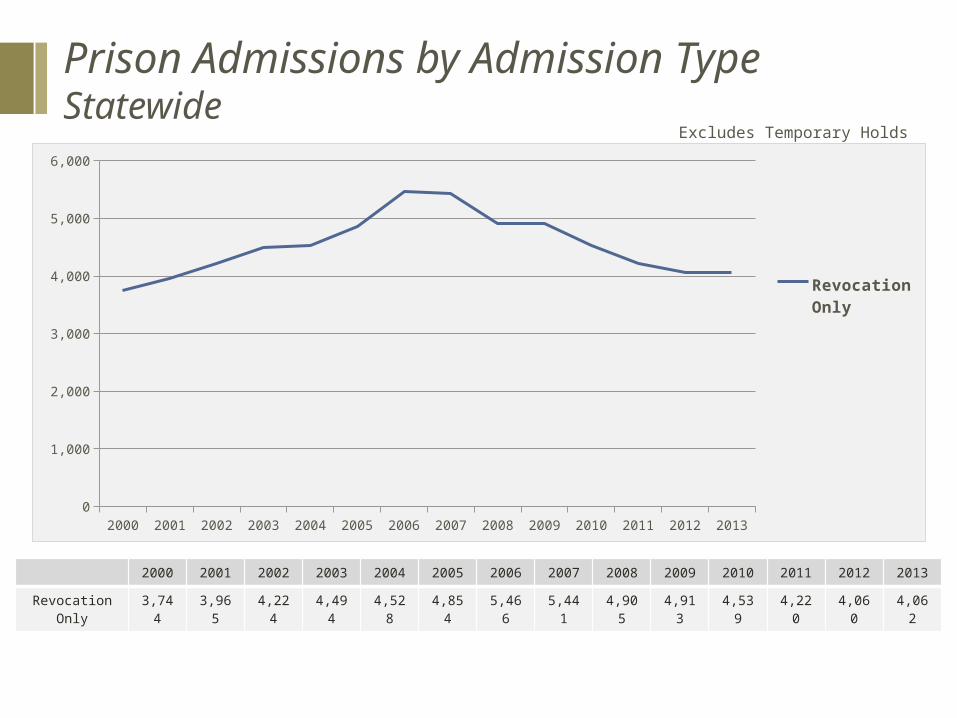
Prison Admissions by Admission Type Statewide
2000 2001 2002 2003 2004 2005 2006 2007 2008 2009 2010 2011 2012 20130
1,000
2,000
3,000
4,000
5,000
6,000
Revocation Only
2000 2001 2002 2003 2004 2005 2006 2007 2008 2009 2010 2011 2012 2013
Revocation Only 3,744 3,965 4,224 4,494 4,528 4,854 5,466 5,441 4,905 4,913 4,539 4,220 4,060 4,062
Excludes Temporary Holds
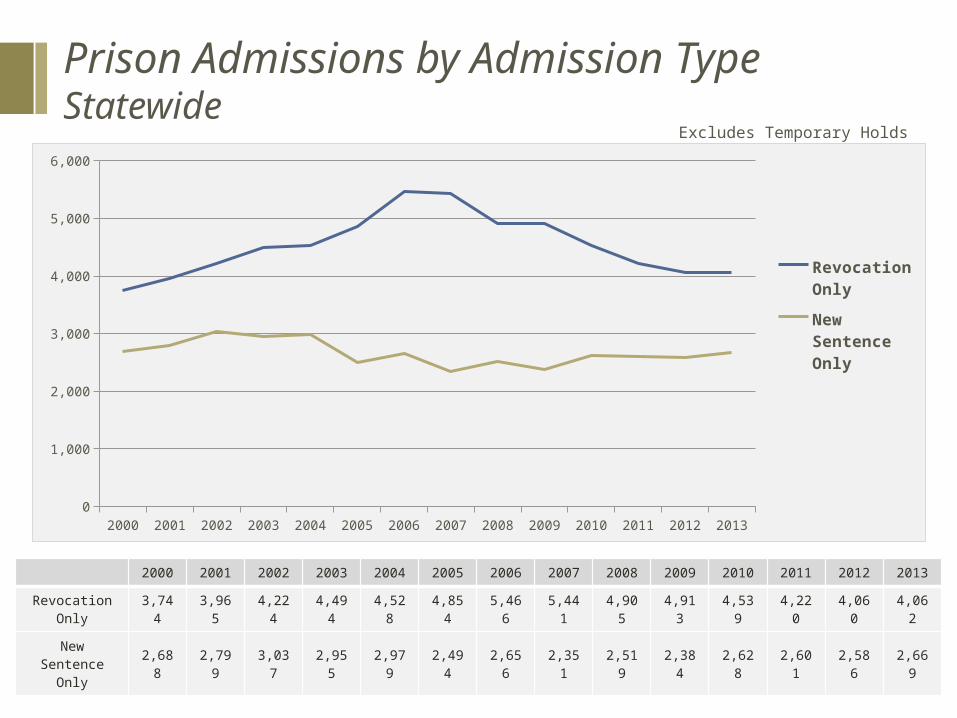
Prison Admissions by Admission TypeStatewide
2000 2001 2002 2003 2004 2005 2006 2007 2008 2009 2010 2011 2012 20130
1,000
2,000
3,000
4,000
5,000
6,000
Revocation Only
New Sen-tence Only
2000 2001 2002 2003 2004 2005 2006 2007 2008 2009 2010 2011 2012 2013
Revocation Only 3,744 3,965 4,224 4,494 4,528 4,854 5,466 5,441 4,905 4,913 4,539 4,220 4,060 4,062
New Sentence
Only2,688 2,799 3,037 2,955 2,979 2,494 2,656 2,351 2,519 2,384 2,628 2,601 2,586 2,669
Excludes Temporary Holds
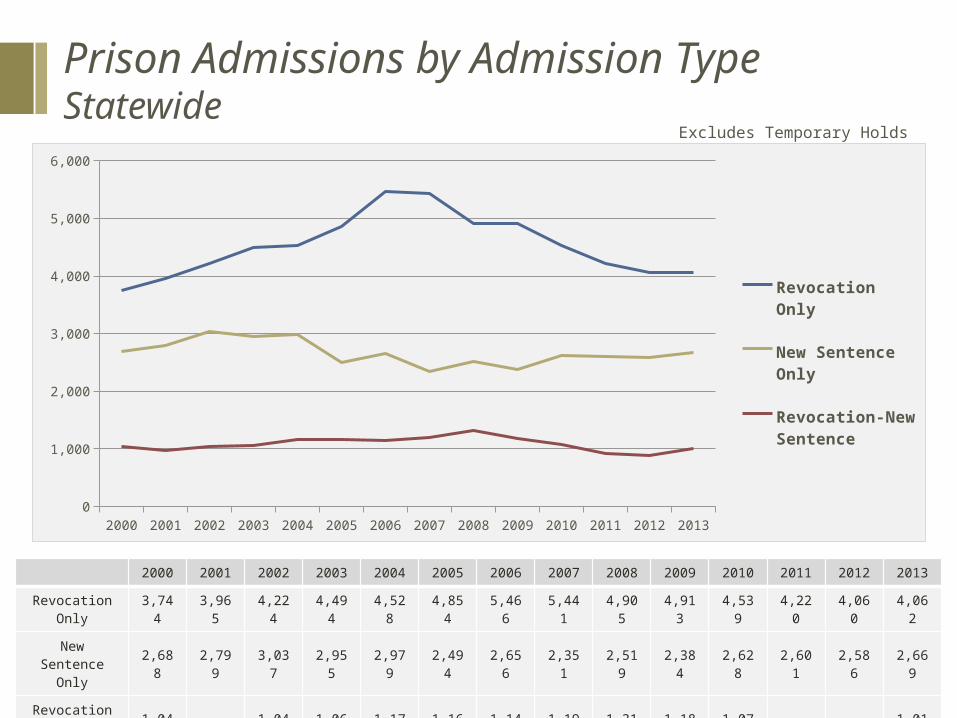
Prison Admissions by Admission TypeStatewide
2000 2001 2002 2003 2004 2005 2006 2007 2008 2009 2010 2011 2012 20130
1,000
2,000
3,000
4,000
5,000
6,000
Revocation Only
New Sentence Only
Revocation-New Sentence
2000 2001 2002 2003 2004 2005 2006 2007 2008 2009 2010 2011 2012 2013
Revocation Only 3,744 3,965 4,224 4,494 4,528 4,854 5,466 5,441 4,905 4,913 4,539 4,220 4,060 4,062
New Sentence
Only2,688 2,799 3,037 2,955 2,979 2,494 2,656 2,351 2,519 2,384 2,628 2,601 2,586 2,669
Revocation – New
Sentence1,047 979 1,046 1,063 1,172 1,161 1,145 1,192 1,314 1,185 1,071 924 894 1,012
Excludes Temporary Holds
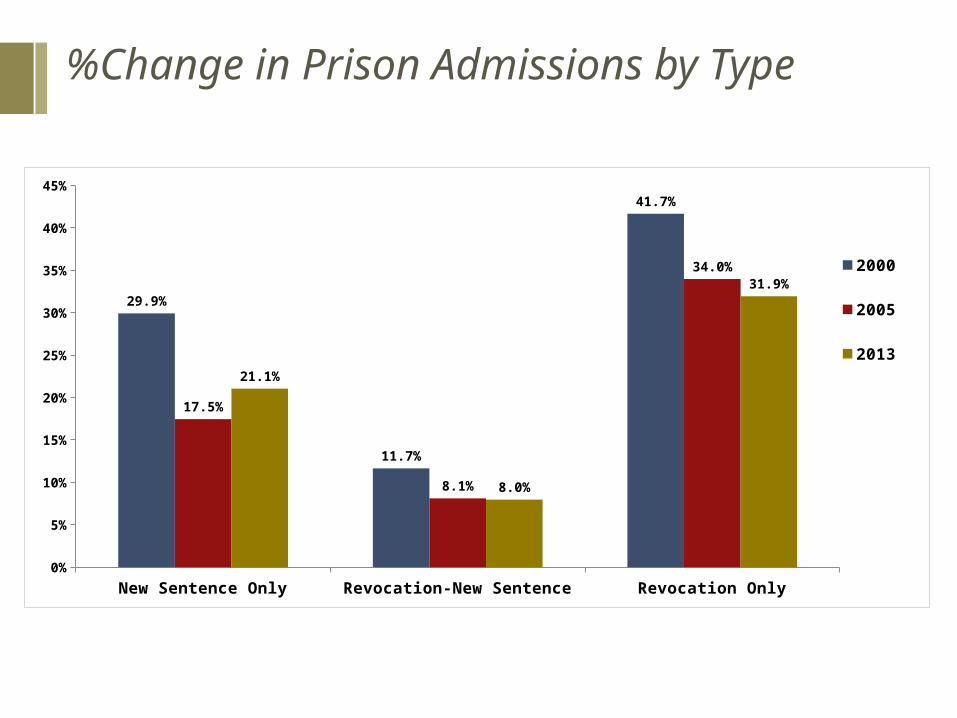
%Change in Prison Admissions by Type
New Sentence Only Revocation-New Sentence Revocation Only0%
5%
10%
15%
20%
25%
30%
35%
40%
45%
29.9%
11.7%
41.7%
17.5%
8.1%
34.0%
21.1%
8.0%
31.9%2000
2005
2013

Probation and Parole Population and Revocation Only Prison Admissions
1/13
/200
0
7/13
/200
0
1/13
/200
1
7/13
/200
1
1/13
/200
2
7/13
/200
2
1/13
/200
3
7/13
/200
3
1/13
/200
4
7/13
/200
4
1/13
/200
5
7/13
/200
5
1/13
/200
6
7/13
/200
6
1/13
/200
7
7/13
/200
7
1/13
/200
8
7/13
/200
8
1/13
/200
9
7/13
/200
9
1/13
/201
0
7/13
/201
0
1/13
/201
1
7/13
/201
1
1/13
/201
2
7/13
/201
2
1/13
/201
3
7/13
/201
358,000
60,000
62,000
64,000
66,000
68,000
70,000
72,000
74,000
76,000
0
1,000
2,000
3,000
4,000
5,000
6,000
Total Probation and Parole Population Revocation Admissions
Tota
l P
robati
on a
nd P
aro
le
Popula
tion
Revoca
tion A
dm
issio
ns
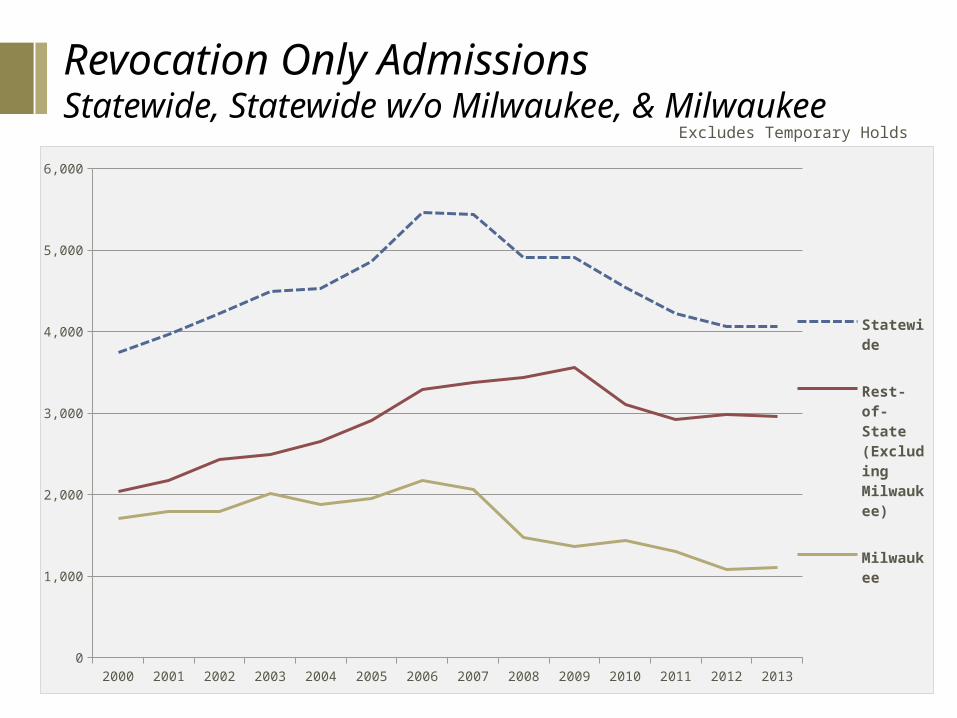
Revocation Only Admissions Statewide, Statewide w/o Milwaukee, & Milwaukee Excludes Temporary Holds
2000 2001 2002 2003 2004 2005 2006 2007 2008 2009 2010 2011 2012 20130
1,000
2,000
3,000
4,000
5,000
6,000
Statewide
Rest-of-State (Ex-cluding Mil-wau-kee)
Mil-waukee
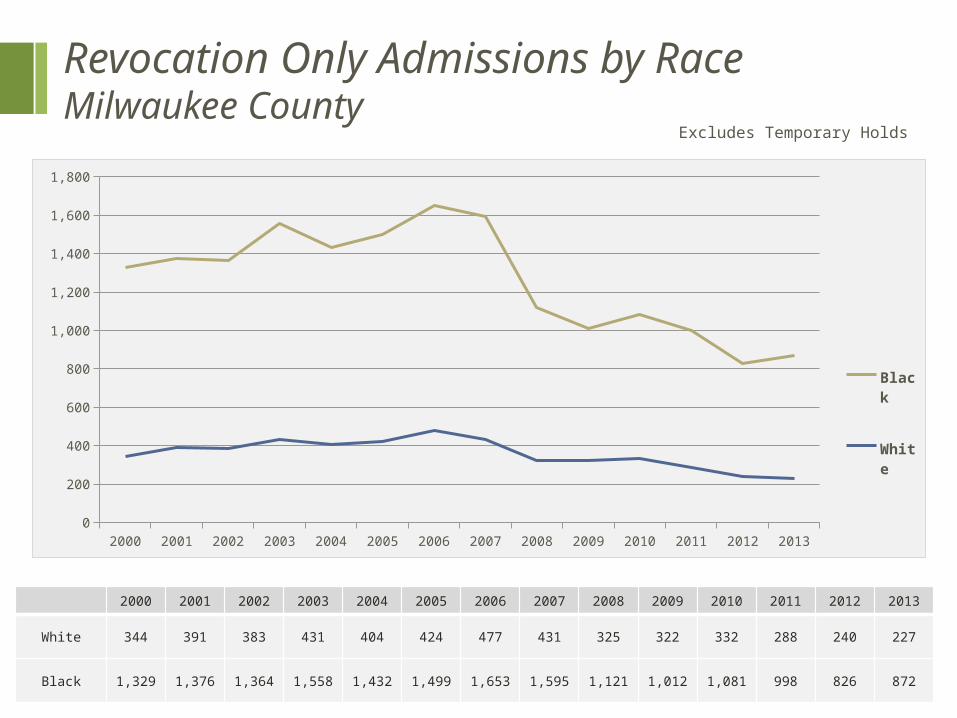
Revocation Only Admissions by Race
Milwaukee County
2000 2001 2002 2003 2004 2005 2006 2007 2008 2009 2010 2011 2012 2013
White 344 391 383 431 404 424 477 431 325 322 332 288 240 227
Black 1,329 1,376 1,364 1,558 1,432 1,499 1,653 1,595 1,121 1,012 1,081 998 826 872
Excludes Temporary Holds
2000 2001 2002 2003 2004 2005 2006 2007 2008 2009 2010 2011 2012 20130
200
400
600
800
1,000
1,200
1,400
1,600
1,800
Black
White
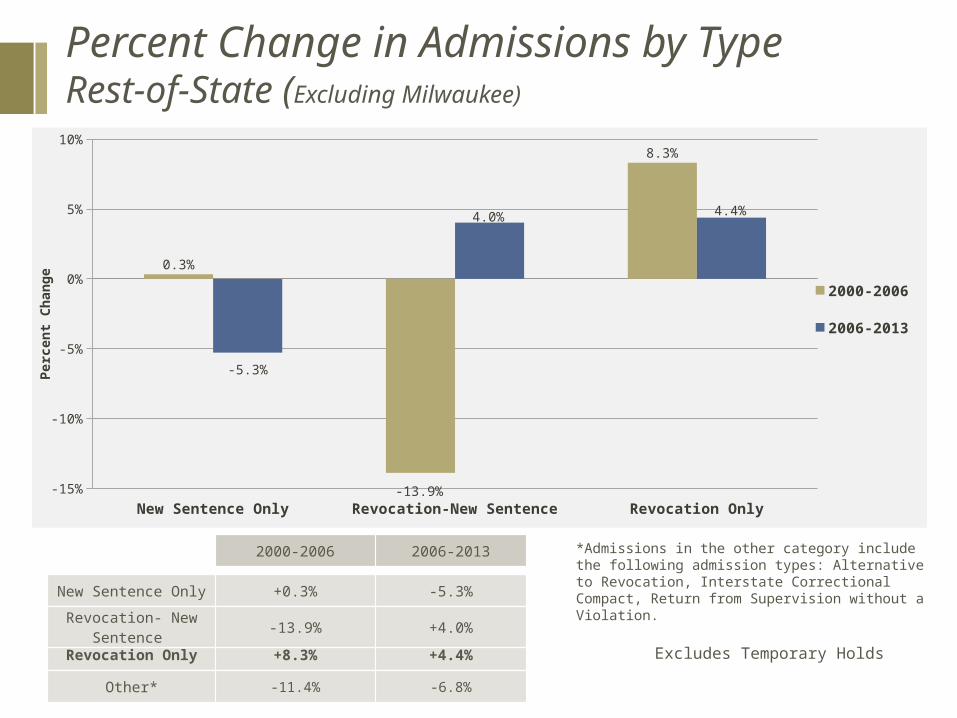
Percent Change in Admissions by TypeRest-of-State (Excluding Milwaukee)
2000-2006 2006-2013
Revocation Only +8.3% +4.4%
New Sentence Only +0.3% -5.3%
Revocation- New Sentence
-13.9% +4.0%
Other* -11.4% -6.8%
*Admissions in the other category include the following admission types: Alternative to Revocation, Interstate Correctional Compact, Return from Supervision without a Violation.
New Sentence Only Revocation-New Sentence Revocation Only-15%
-10%
-5%
0%
5%
10%
0.3%
-13.9%
8.3%
-5.3%
4.0% 4.4%
2000-2006
2006-2013
Perc
ent
Change
Excludes Temporary Holds
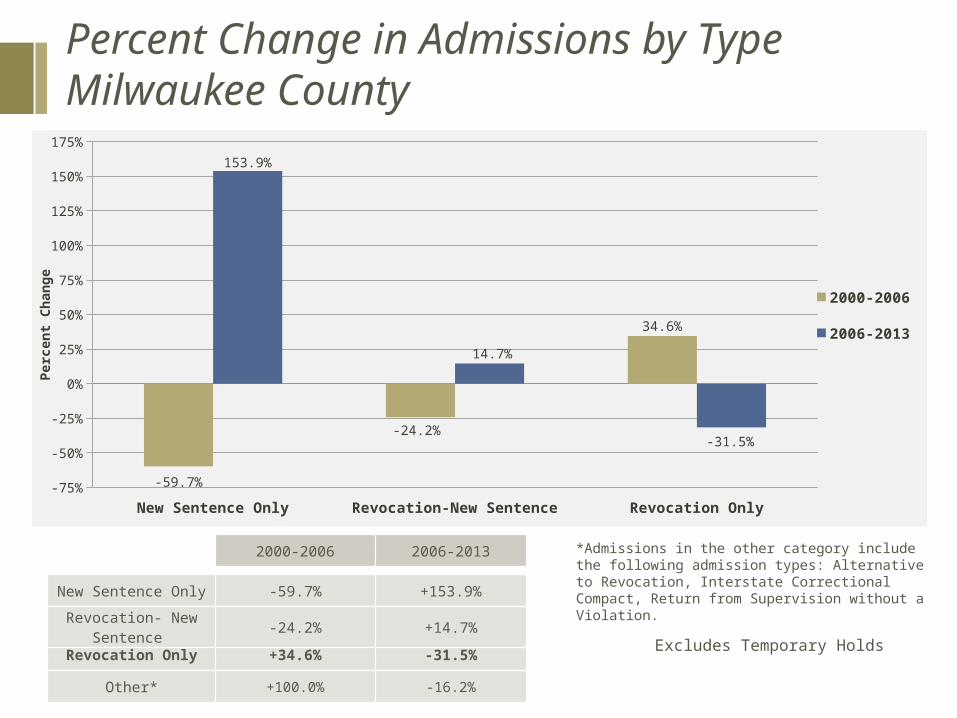
Percent Change in Admissions by TypeMilwaukee County
2000-2006 2006-2013
Revocation Only +34.6% -31.5%
New Sentence Only -59.7% +153.9%
Revocation- New Sentence
-24.2% +14.7%
Other* +100.0% -16.2%
*Admissions in the other category include the following admission types: Alternative to Revocation, Interstate Correctional Compact, Return from Supervision without a Violation.
New Sentence Only Revocation-New Sentence Revocation Only-75%
-50%
-25%
0%
25%
50%
75%
100%
125%
150%
175%
-59.7%
-24.2%
34.6%
153.9%
14.7%
-31.5%
2000-2006
2006-2013
Perc
ent
Change
Excludes Temporary Holds

Most Serious Offense (Point-in-Time -- Statewide)1990
1991
1992
1993
1994
1995
1996
1997
1998
1999
2000
2001
2002
2003
2004
2005
2006
2007
2008
2009
2010
2011
2012
2013
0%
10%
20%
30%
40%
50%
60%
70%
80%
90%
100%
Violent Offense
Excludes Temporary Holds
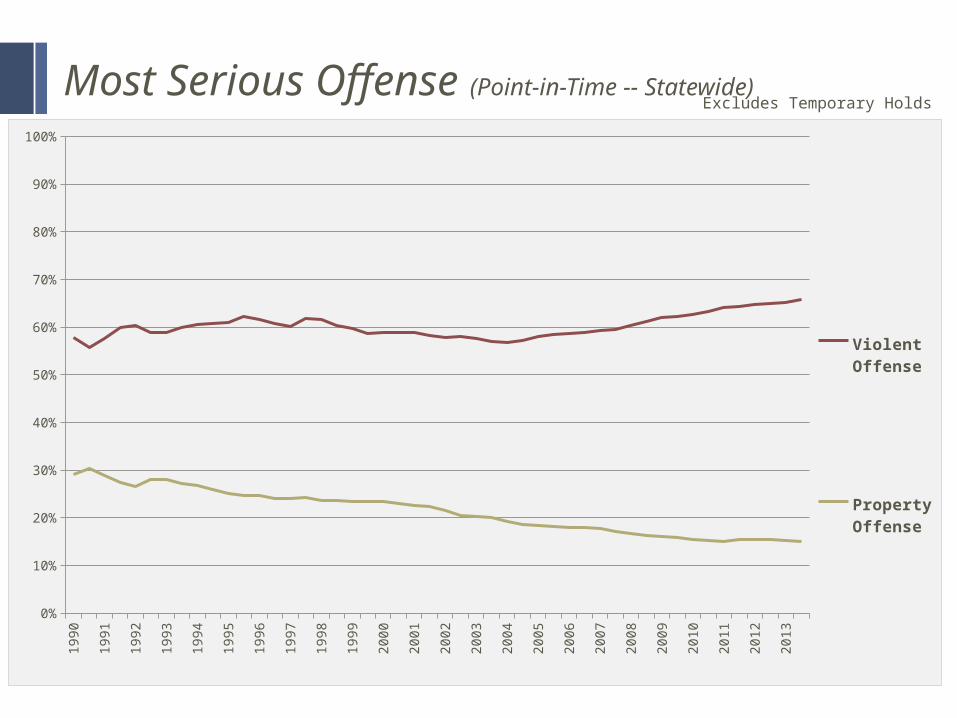
Most Serious Offense (Point-in-Time -- Statewide)1990
1991
1992
1993
1994
1995
1996
1997
1998
1999
2000
2001
2002
2003
2004
2005
2006
2007
2008
2009
2010
2011
2012
2013
0%
10%
20%
30%
40%
50%
60%
70%
80%
90%
100%
Violent Offense
Property Offense
Excludes Temporary Holds
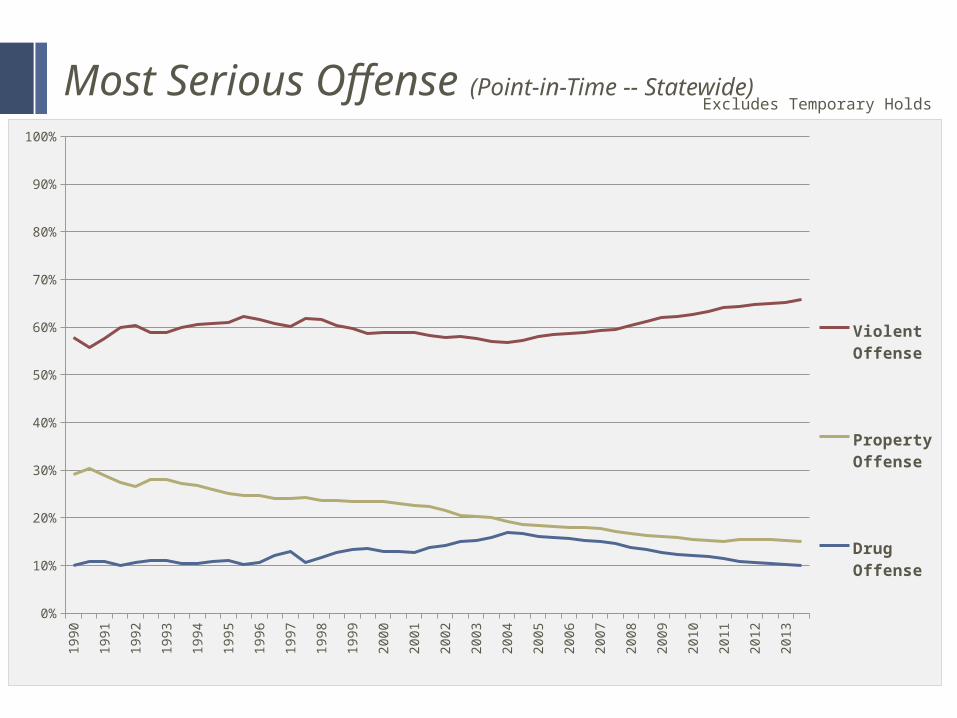
Most Serious Offense (Point-in-Time -- Statewide)1990
1991
1992
1993
1994
1995
1996
1997
1998
1999
2000
2001
2002
2003
2004
2005
2006
2007
2008
2009
2010
2011
2012
2013
0%
10%
20%
30%
40%
50%
60%
70%
80%
90%
100%
Violent Offense
Property Offense
Drug Of-fense
Excludes Temporary Holds
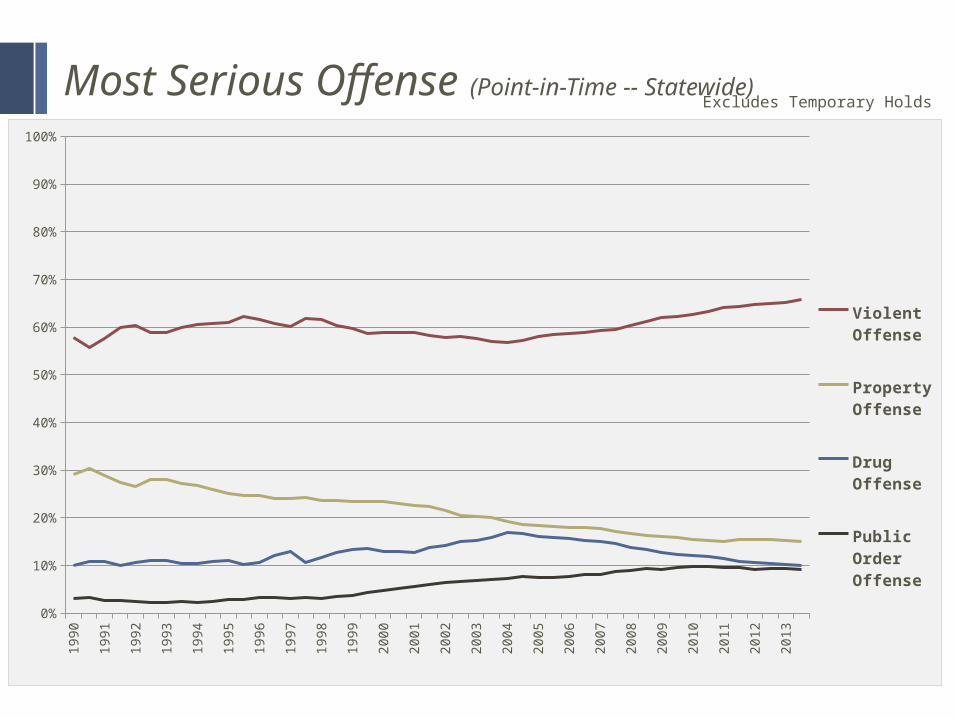
Most Serious Offense (Point-in-Time -- Statewide)1990
1991
1992
1993
1994
1995
1996
1997
1998
1999
2000
2001
2002
2003
2004
2005
2006
2007
2008
2009
2010
2011
2012
2013
0%
10%
20%
30%
40%
50%
60%
70%
80%
90%
100%
Violent Offense
Property Offense
Drug Of-fense
Public Order Of-fense
Excludes Temporary Holds

Most Common Offense by Offense Category
Public Order Offense
Property Offense Violent Offense Drug Offense
Statute Description N Statute Description N Statute Description N Statute Description N
Operating while Under the Influence
999Burglary-
Building or Dwelling
1,556First Degree Intentional Homicide
1,791
Manufacture/Deliver Heroin
(<3g)181
Possession of Firearm by Felon
261Theft- Moveable
Property <=$2500
421 Armed Robbery1,72
5Possession of Narcotic Drugs
134
Possession of Child
Pornography138
Misappropriate ID Info – Obtain
Money161
Second Degree Sexual Assault of
Child
1,425
Possession of THC (2nd+ Offense)
132
Operating with PAC
95 Forgery- Uttering 152First Degree
Sexual Assault of Child
896Manufacture/Deliver
Cocaine (<=1g)125
Failure to Support Child (120 Days+)
88Take and Drive
Vehicle w/o Consent
123Robbery with use of Force
516Manufacture/Deliver
Cocaine (>1-5g)119
Top Five Most Common Offenses in Each Category on December 31, 2013
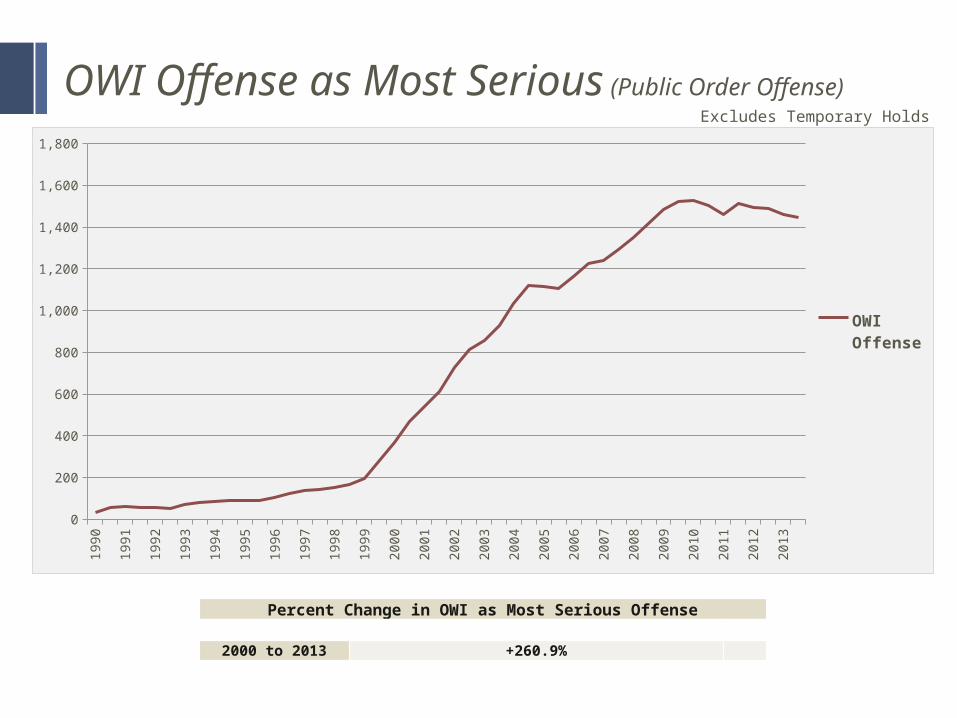
OWI Offense as Most Serious (Public Order Offense)
1990
1991
1992
1993
1994
1995
1996
1997
1998
1999
2000
2001
2002
2003
2004
2005
2006
2007
2008
2009
2010
2011
2012
2013
0
200
400
600
800
1,000
1,200
1,400
1,600
1,800
OWI Of-fense
Percent Change in OWI as Most Serious Offense
2000 to 2013 +260.9%
Excludes Temporary Holds
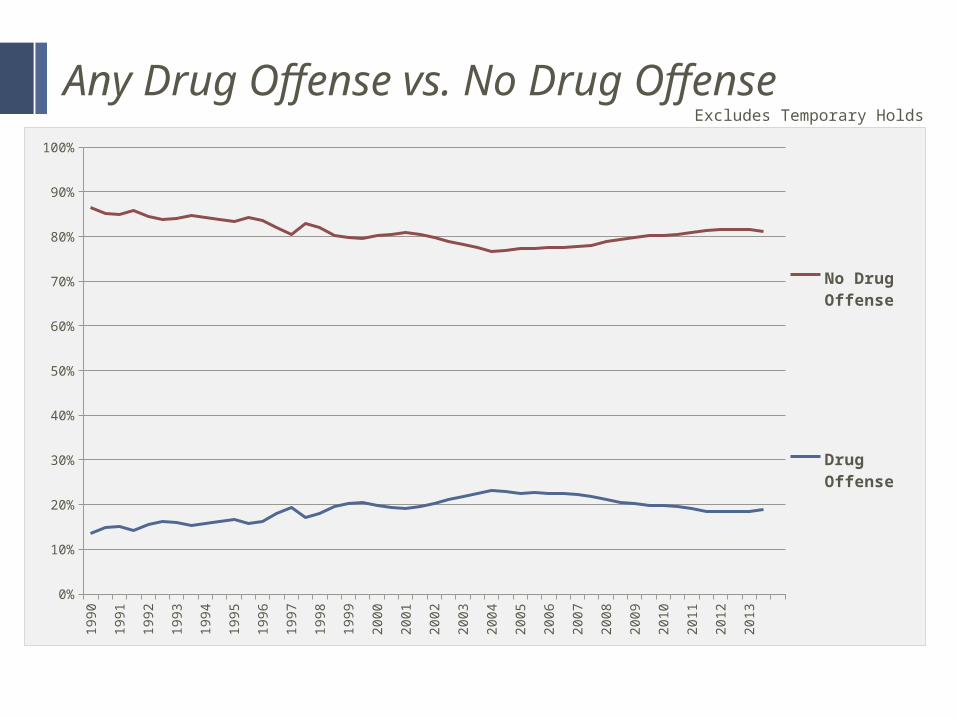
Any Drug Offense vs. No Drug Offense
1990
1991
1992
1993
1994
1995
1996
1997
1998
1999
2000
2001
2002
2003
2004
2005
2006
2007
2008
2009
2010
2011
2012
2013
0%
10%
20%
30%
40%
50%
60%
70%
80%
90%
100%
No Drug Of-fense
Drug Of-fense
Excludes Temporary Holds
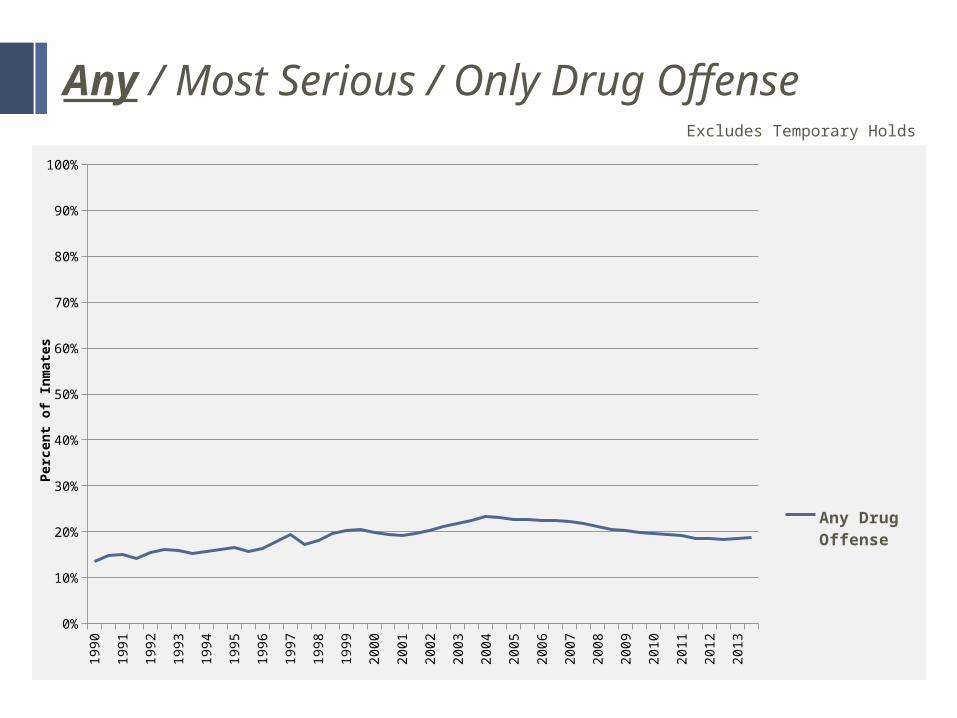
Any / Most Serious / Only Drug Offense
1990
1991
1992
1993
1994
1995
1996
1997
1998
1999
2000
2001
2002
2003
2004
2005
2006
2007
2008
2009
2010
2011
2012
2013
0%
10%
20%
30%
40%
50%
60%
70%
80%
90%
100%
Any Drug Of-fense
Perc
ent
of
Inm
ate
s
Excludes Temporary Holds
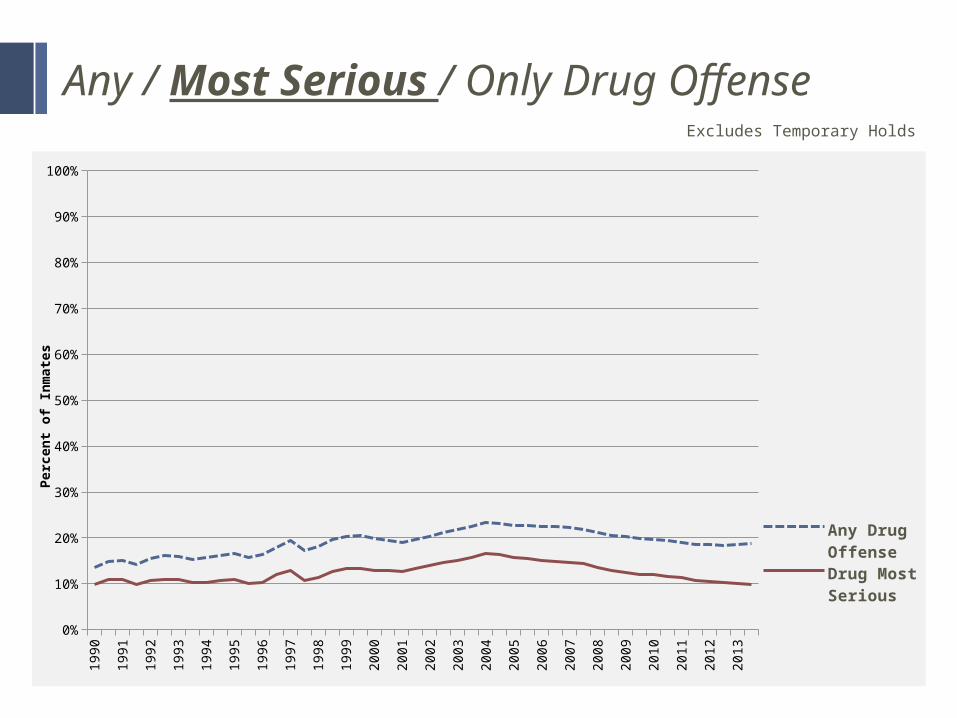
Any / Most Serious / Only Drug Offense
1990
1991
1992
1993
1994
1995
1996
1997
1998
1999
2000
2001
2002
2003
2004
2005
2006
2007
2008
2009
2010
2011
2012
2013
0%
10%
20%
30%
40%
50%
60%
70%
80%
90%
100%
Any Drug OffenseDrug Most Serious
Perc
ent
of
Inm
ate
s
Excludes Temporary Holds

Any / Most Serious / Only Drug Offense
1990
1991
1992
1993
1994
1995
1996
1997
1998
1999
2000
2001
2002
2003
2004
2005
2006
2007
2008
2009
2010
2011
2012
2013
0%
10%
20%
30%
40%
50%
60%
70%
80%
90%
100%
Any Drug OffenseDrug Most Serious
Perc
ent
of
Inm
ate
s
Excludes Temporary Holds
AODA Tx Need~74%
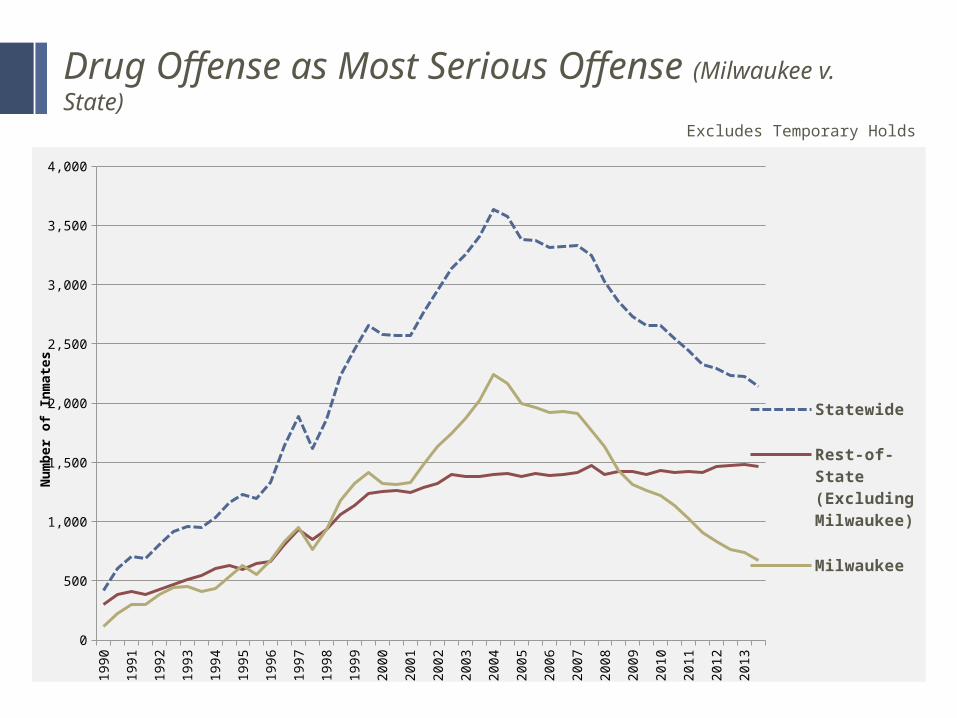
Drug Offense as Most Serious Offense (Milwaukee v. State)
Excludes Temporary Holds
1990
1991
1992
1993
1994
1995
1996
1997
1998
1999
2000
2001
2002
2003
2004
2005
2006
2007
2008
2009
2010
2011
2012
2013
0
500
1,000
1,500
2,000
2,500
3,000
3,500
4,000
Statewide
Rest-of-State (Excluding Milwau-kee)
Milwaukee
Num
ber
of
Inm
ate
s
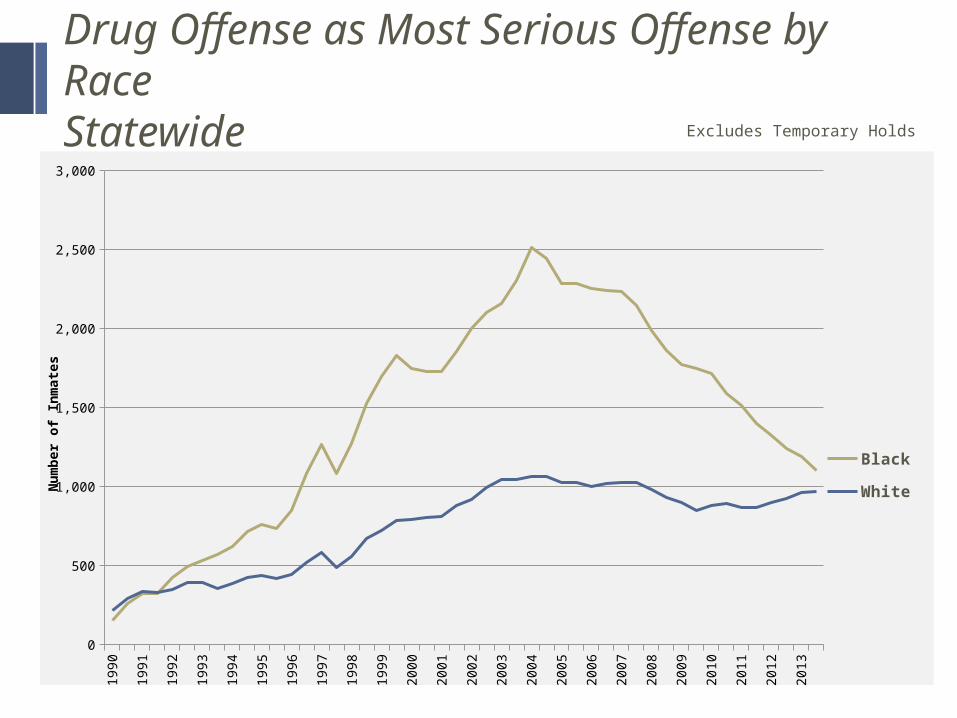
Drug Offense as Most Serious Offense by RaceStatewide
1990
1991
1992
1993
1994
1995
1996
1997
1998
1999
2000
2001
2002
2003
2004
2005
2006
2007
2008
2009
2010
2011
2012
2013
0
500
1,000
1,500
2,000
2,500
3,000
Black
WhiteNum
ber
of
Inm
ate
s
Excludes Temporary Holds
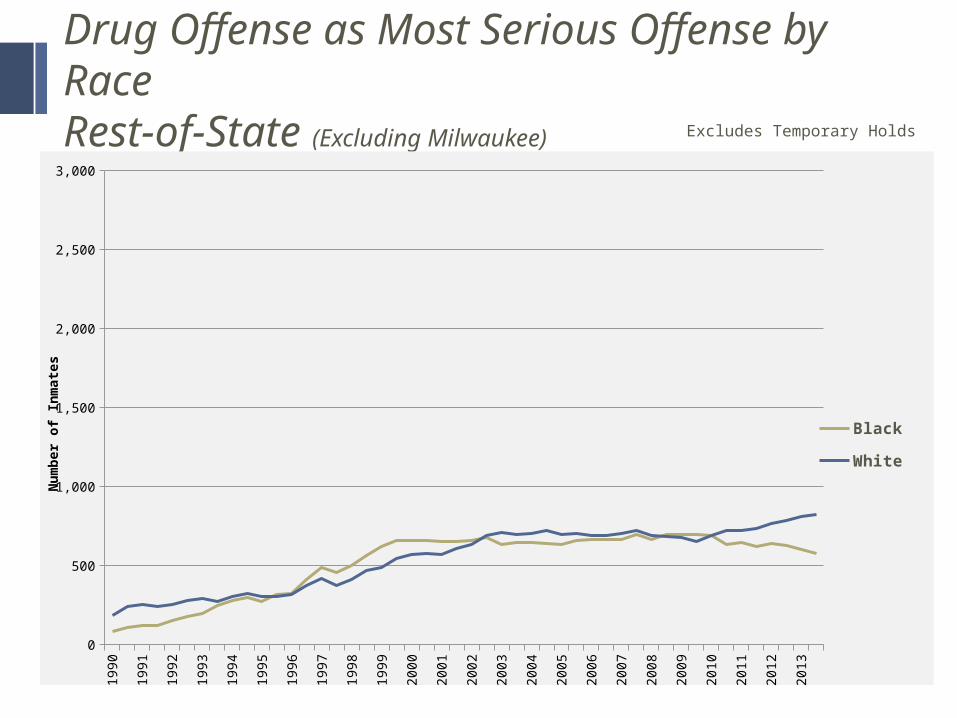
Drug Offense as Most Serious Offense by RaceRest-of-State (Excluding Milwaukee)
1990
1991
1992
1993
1994
1995
1996
1997
1998
1999
2000
2001
2002
2003
2004
2005
2006
2007
2008
2009
2010
2011
2012
2013
0
500
1,000
1,500
2,000
2,500
3,000
Black
White
Num
ber
of
Inm
ate
s
Excludes Temporary Holds
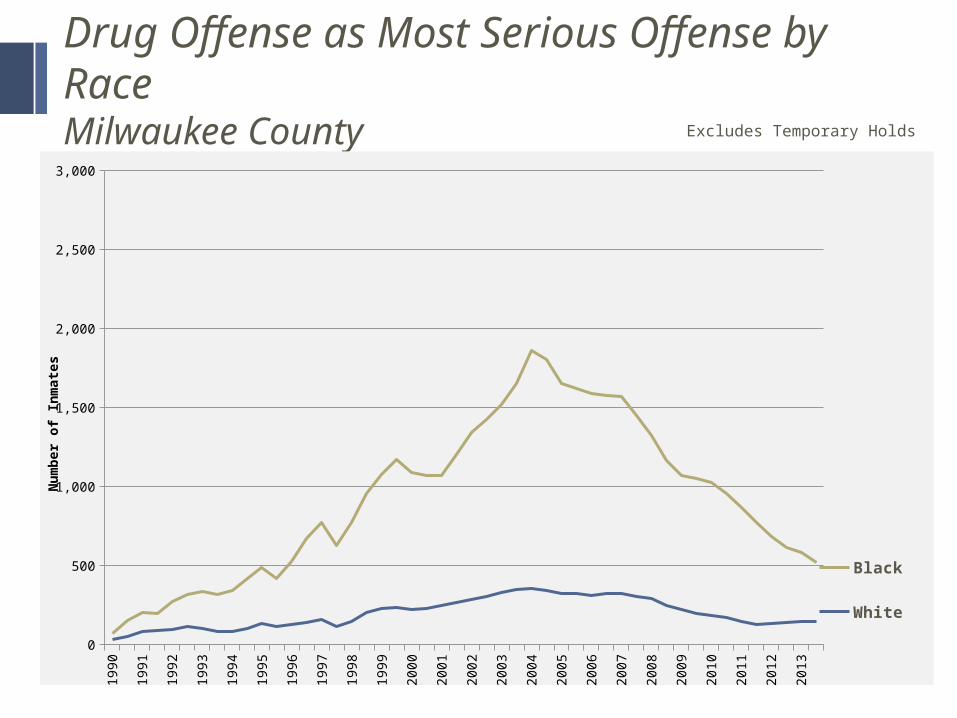
Drug Offense as Most Serious Offense by RaceMilwaukee County
1990
1991
1992
1993
1994
1995
1996
1997
1998
1999
2000
2001
2002
2003
2004
2005
2006
2007
2008
2009
2010
2011
2012
2013
0
500
1,000
1,500
2,000
2,500
3,000
Black
White
Num
ber
of
Inm
ate
s
Excludes Temporary Holds
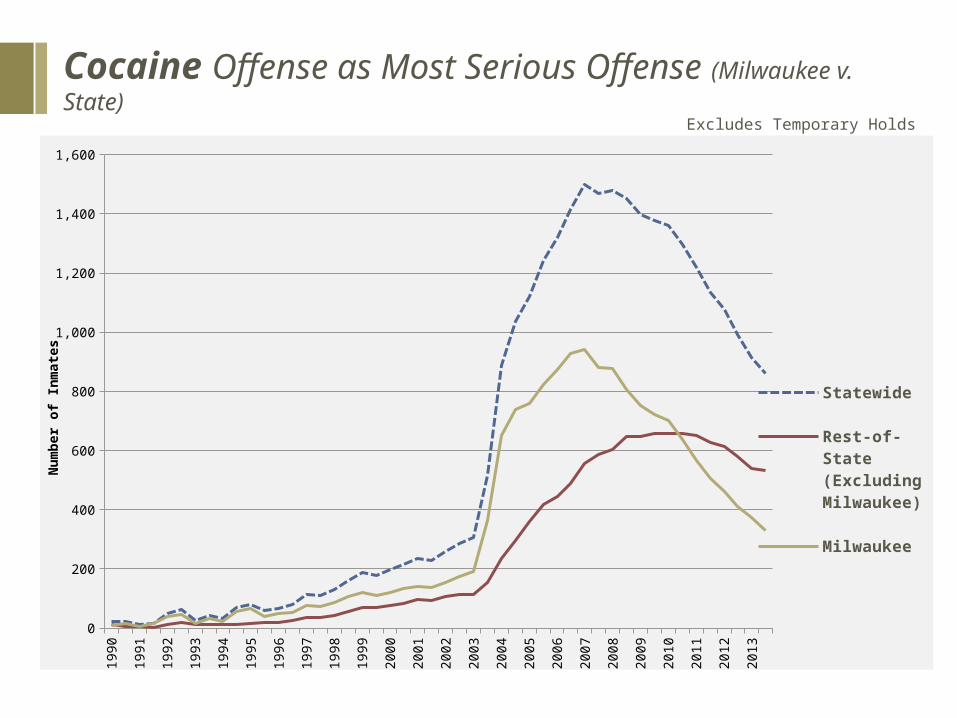
Cocaine Offense as Most Serious Offense (Milwaukee v. State)
1990
1991
1992
1993
1994
1995
1996
1997
1998
1999
2000
2001
2002
2003
2004
2005
2006
2007
2008
2009
2010
2011
2012
2013
0
200
400
600
800
1,000
1,200
1,400
1,600
Statewide
Rest-of-State (Excluding Milwau-kee)
Milwaukee
Num
ber
of
Inm
ate
s
Excludes Temporary Holds
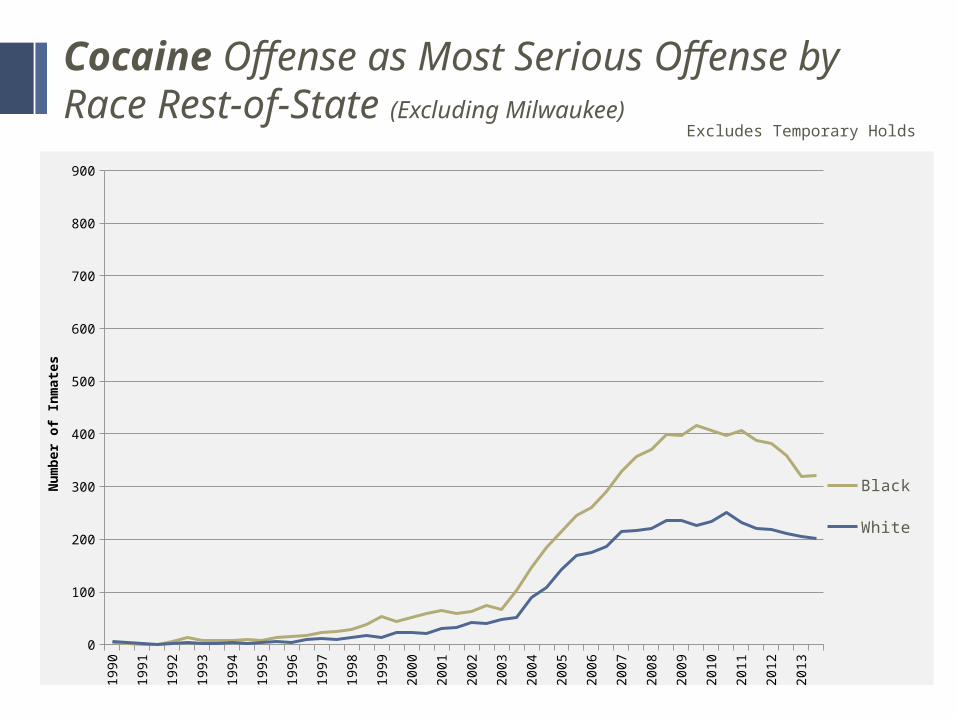
Cocaine Offense as Most Serious Offense by Race Rest-of-State (Excluding Milwaukee)
1990
1991
1992
1993
1994
1995
1996
1997
1998
1999
2000
2001
2002
2003
2004
2005
2006
2007
2008
2009
2010
2011
2012
2013
0
100
200
300
400
500
600
700
800
900
Black
White
Num
ber
of
Inm
ate
s
Excludes Temporary Holds
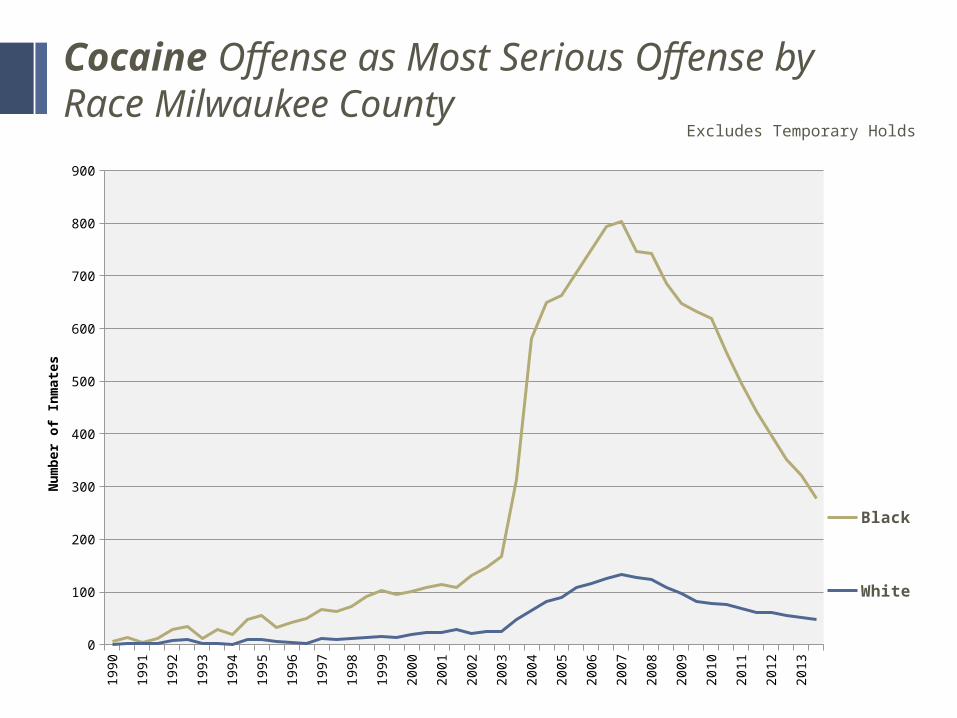
Cocaine Offense as Most Serious Offense by Race Milwaukee County
1990
1991
1992
1993
1994
1995
1996
1997
1998
1999
2000
2001
2002
2003
2004
2005
2006
2007
2008
2009
2010
2011
2012
2013
0
100
200
300
400
500
600
700
800
900
Black
White
Num
ber
of
Inm
ate
s
Excludes Temporary Holds
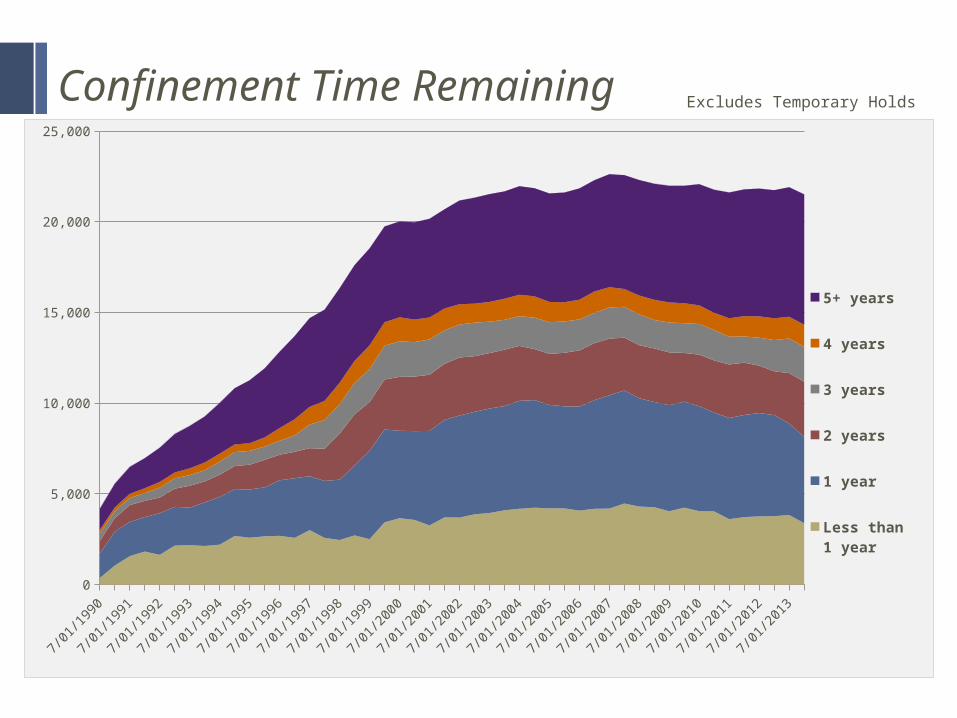
Confinement Time Remaining
7/01
/199
0
7/01
/199
1
7/01
/199
2
7/01
/199
3
7/01
/199
4
7/01
/199
5
7/01
/199
6
7/01
/199
7
7/01
/199
8
7/01
/199
9
7/01
/200
0
7/01
/200
1
7/01
/200
2
7/01
/200
3
7/01
/200
4
7/01
/200
5
7/01
/200
6
7/01
/200
7
7/01
/200
8
7/01
/200
9
7/01
/201
0
7/01
/201
1
7/01
/201
2
7/01
/201
30
5,000
10,000
15,000
20,000
25,000
5+ years
4 years
3 years
2 years
1 year
Less than 1 year
Excludes Temporary Holds
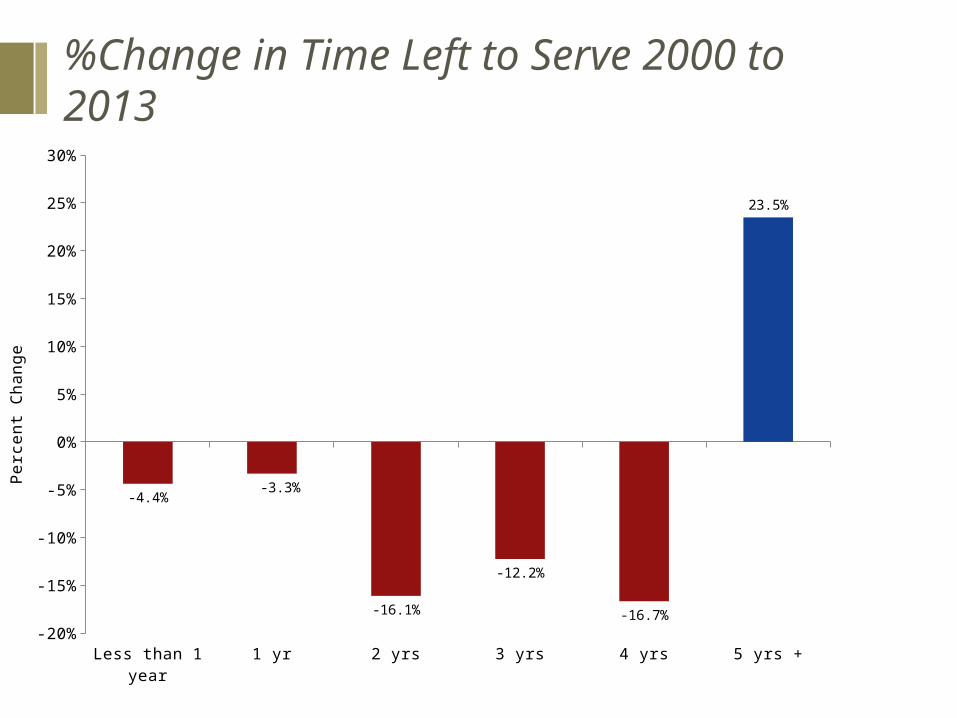
%Change in Time Left to Serve 2000 to 2013
Less than 1 year
1 yr 2 yrs 3 yrs 4 yrs 5 yrs +-20%
-15%
-10%
-5%
0%
5%
10%
15%
20%
25%
30%
-4.4%-3.3%
-16.1%
-12.2%
-16.7%
23.5%
Perc
ent
Change
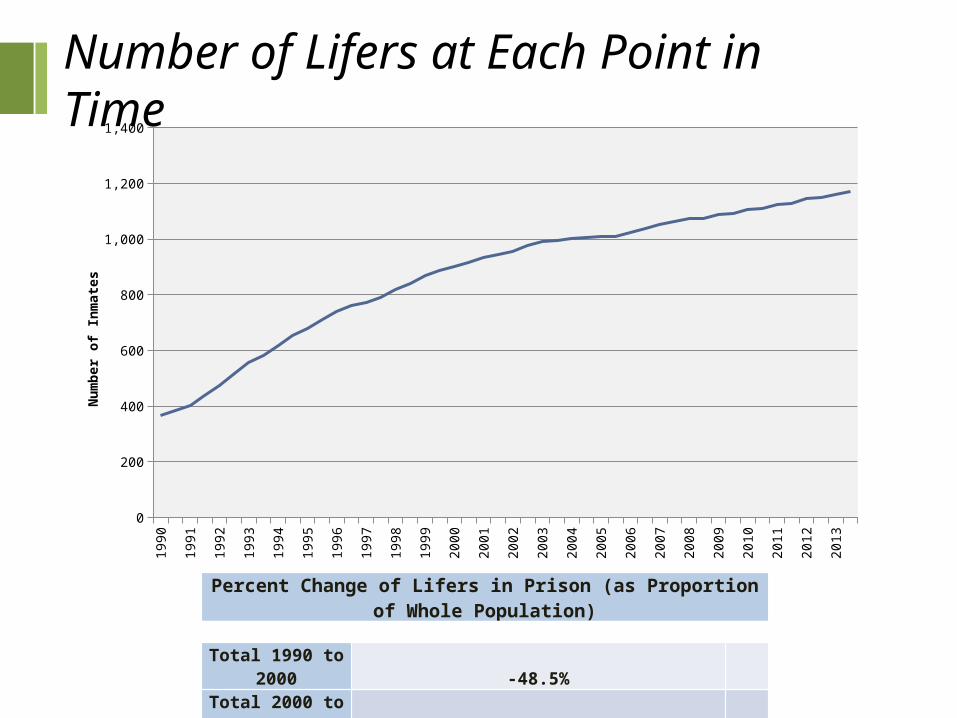
Number of Lifers at Each Point in Time
Percent Change of Lifers in Prison (as Proportion of Whole Population)
Total 1990 to
2000 -48.5%Total 2000 to
2013 +20.0%
1990
1991
1992
1993
1994
1995
1996
1997
1998
1999
2000
2001
2002
2003
2004
2005
2006
2007
2008
2009
2010
2011
2012
2013
0
200
400
600
800
1,000
1,200
1,400
Num
ber
of
Inm
ate
s

Thank you.
Contact Information:
Tony Streveler, Director of Research & PolicyWisconsin Department of Corrections [email protected] Phone: 608-240-5801
Follow Reports and Data from the WIDOC @
http://doc.wi.gov/about/data-and-research
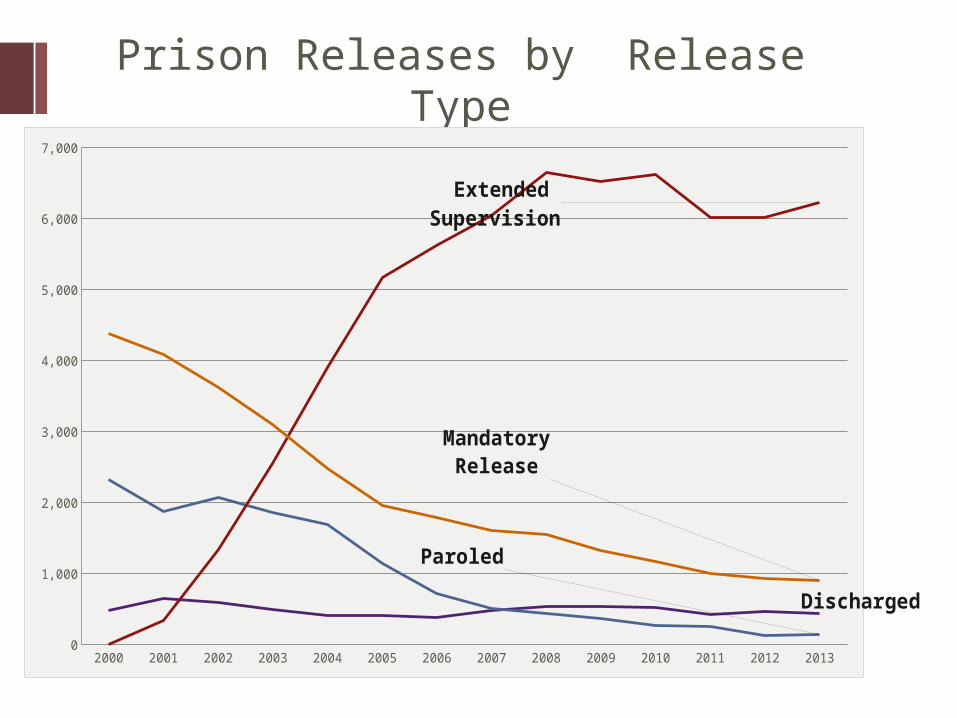
Prison Releases by Release Type
2000 2001 2002 2003 2004 2005 2006 2007 2008 2009 2010 2011 2012 20130
1,000
2,000
3,000
4,000
5,000
6,000
7,000
Discharged
Paroled
Extended Supervision
Mandatory Re-lease
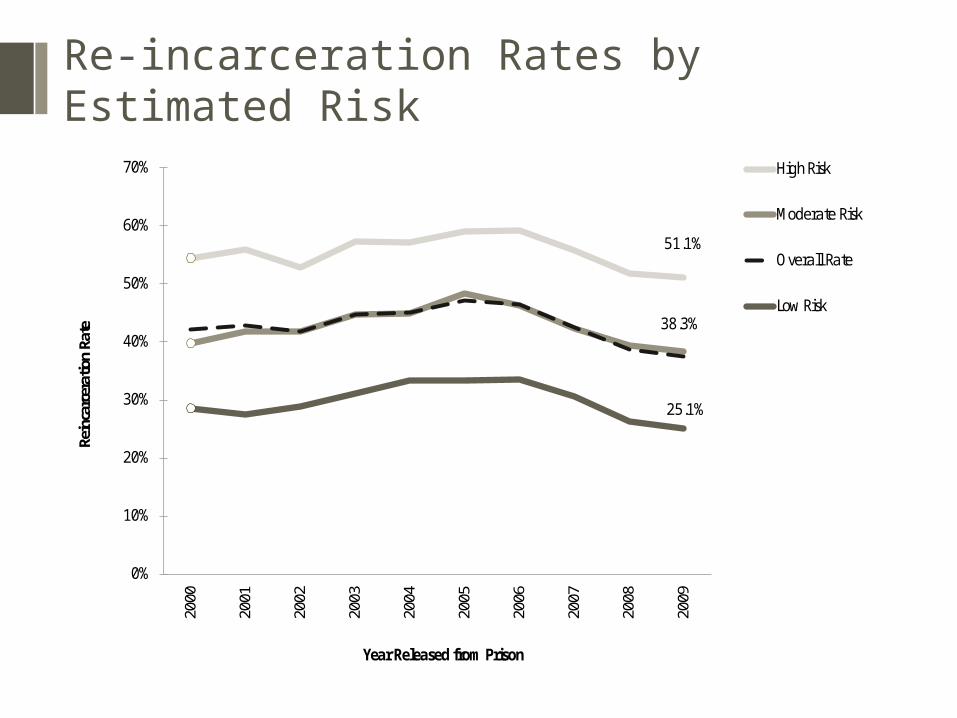
Re-incarceration Rates by Estimated Risk
51.1%
38.3%
25.1%
0%
10%
20%
30%
40%
50%
60%
70%20
00
2001
2002
2003
2004
2005
2006
2007
2008
2009
Rein
carc
erat
ion
Rate
Year Released from Prison
High Risk
Moderate Risk
Overall Rate
Low Risk
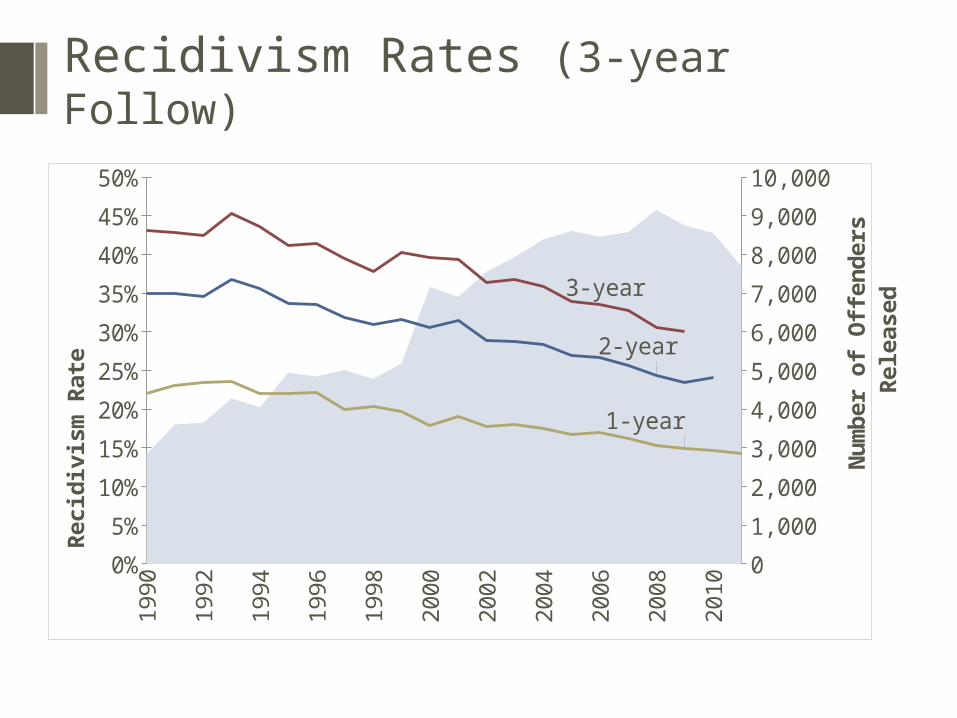
Recidivism Rates (3-year Follow)1990
1991
1992
1993
1994
1995
1996
1997
1998
1999
2000
2001
2002
2003
2004
2005
2006
2007
2008
2009
2010
20110%
5%
10%
15%
20%
25%
30%
35%
40%
45%
50%
0
1,000
2,000
3,000
4,000
5,000
6,000
7,000
8,000
9,000
10,000
1-year
2-year
3-year
Reci
div
ism
Rate
Nu
mb
er
of
Off
en
ders
Re
-le
ase
d
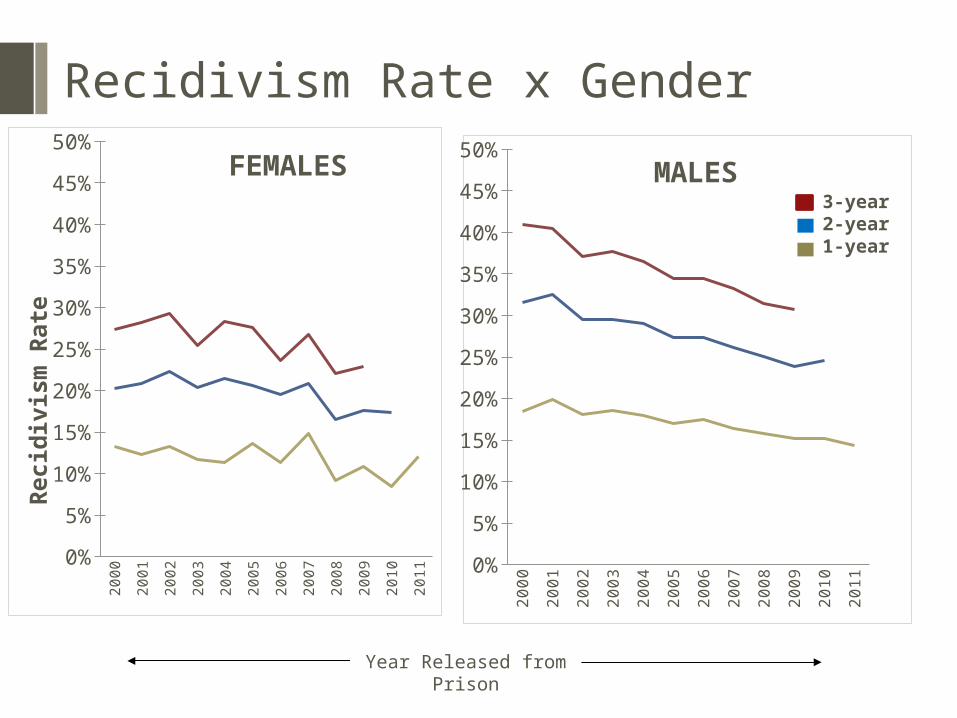
Recidivism Rate x Gender
Year Released from Prison
2000
2001
2002
2003
2004
2005
2006
2007
2008
2009
2010
20110%
5%
10%
15%
20%
25%
30%
35%
40%
45%
50%MALES
20
00
20
01
20
02
20
03
20
04
20
05
20
06
20
07
20
08
20
09
20
10
20
110%
5%
10%
15%
20%
25%
30%
35%
40%
45%
50%FEMALES
Recid
ivis
m R
ate
3-year2-year1-year
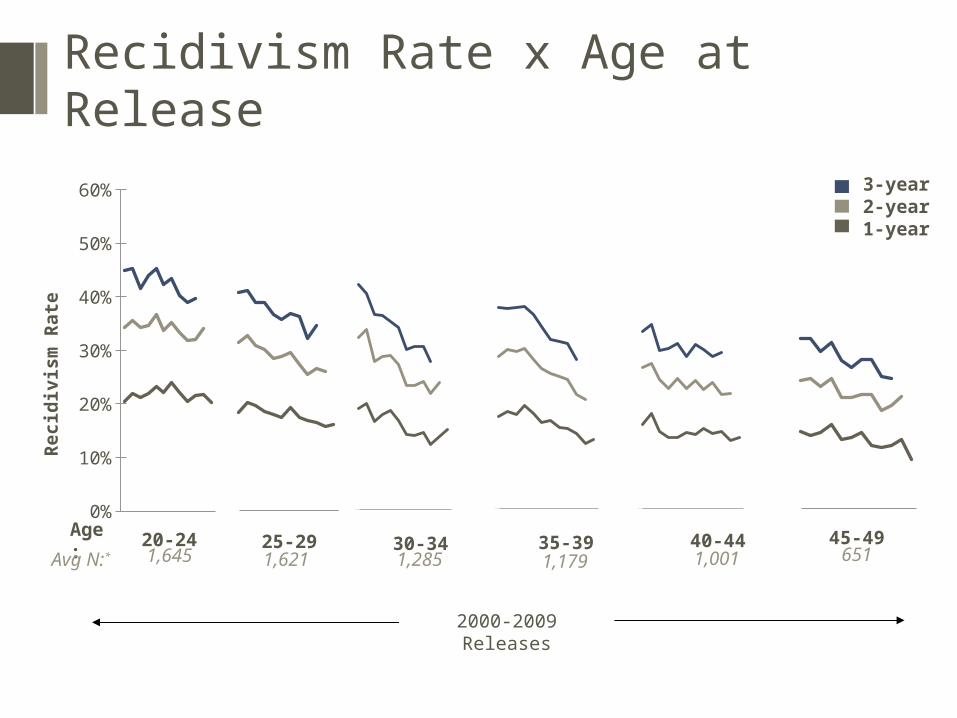
Recidivism Rate x Age at Release
0%
10%
20%
30%
40%
50%
60%
0%
10%
20%
30%
40%
50%
60%
0%
10%
20%
30%
40%
50%
60%
0%
10%
20%
30%
40%
50%
60%
0%
10%
20%
30%
40%
50%
60%
0%
10%
20%
30%
40%
50%
60%
Recid
ivis
m R
ate
Age:Avg
N:*
20-241,645
25-291,621
30-341,285
35-391,179
40-441,001
45-49651
3-year2-year1-year
2000-2009 Releases
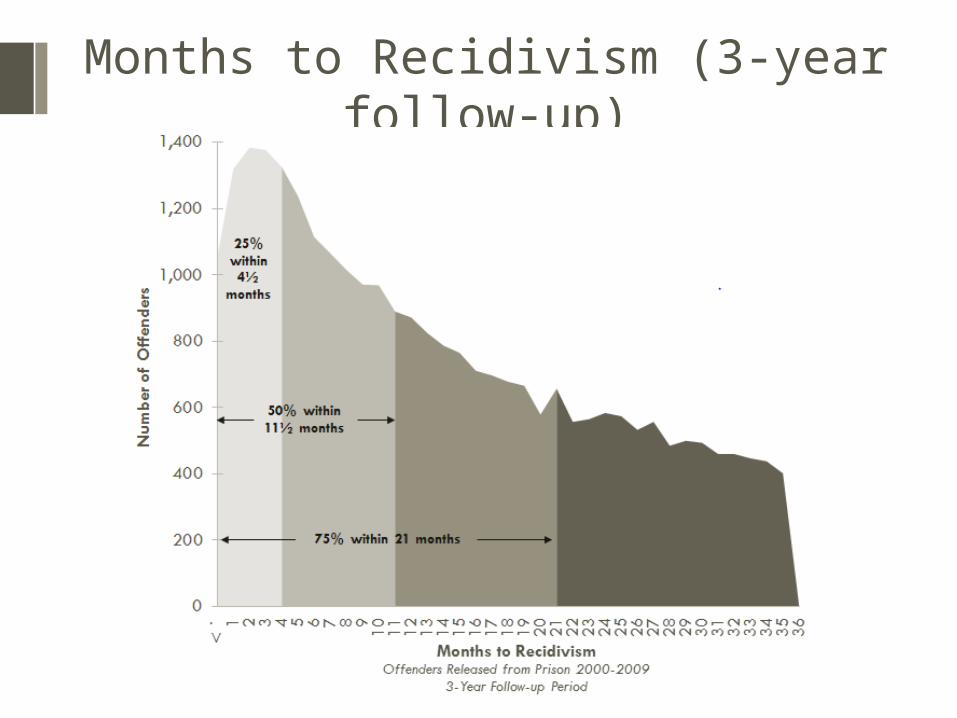
Months to Recidivism (3-year follow-up)
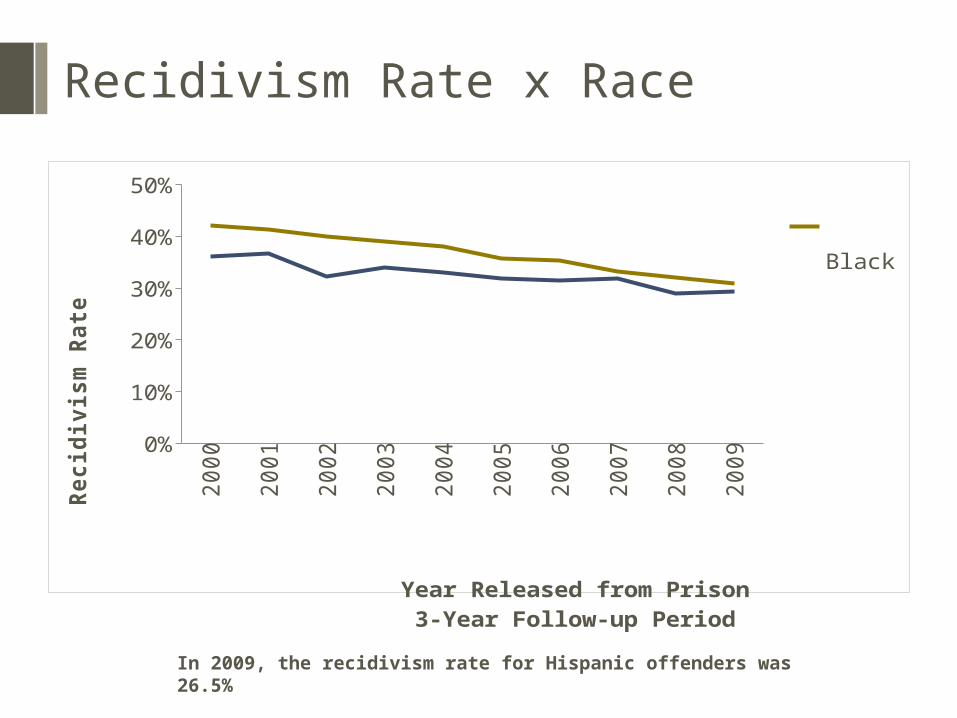
Recidivism Rate x Race
2000
2001
2002
2003
2004
2005
2006
2007
2008
20090%
10%
20%
30%
40%
50% Black White
Year Released from Prison3-Year Follow-up Period
Recid
ivis
m R
ate
In 2009, the recidivism rate for Hispanic offenders was 26.5%
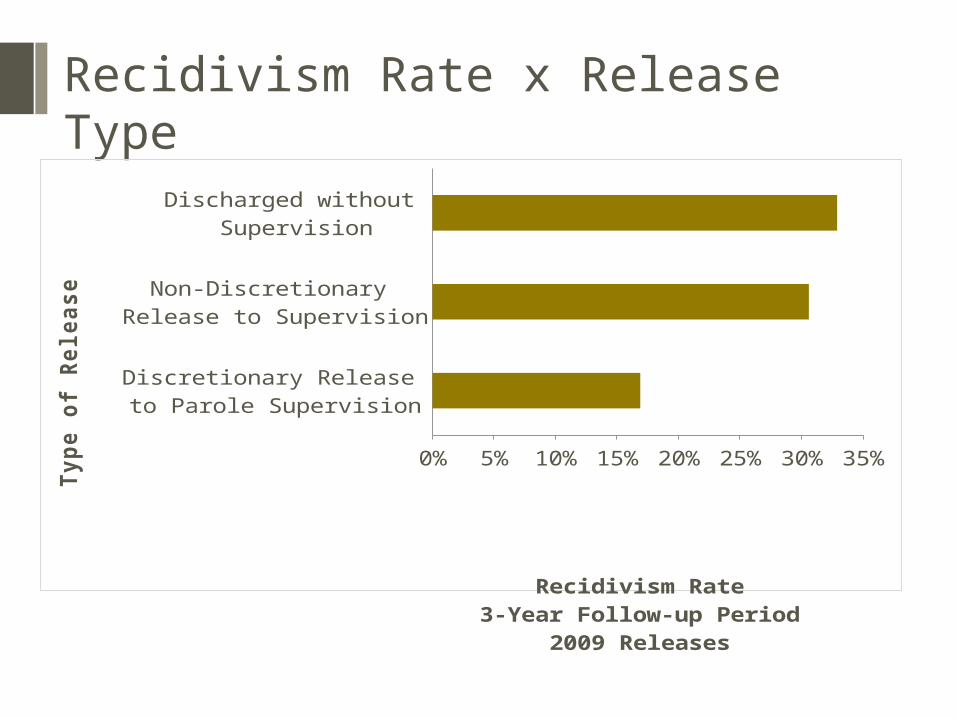
Recidivism Rate x Release Type
Discretionary Release to Parole Supervision
Non-Discretionary Release to Supervision
Discharged without Supervision
0% 5% 10% 15% 20% 25% 30% 35%
Recidivism Rate3-Year Follow-up Period
2009 Releases
Typ
e o
f R
ele
ase
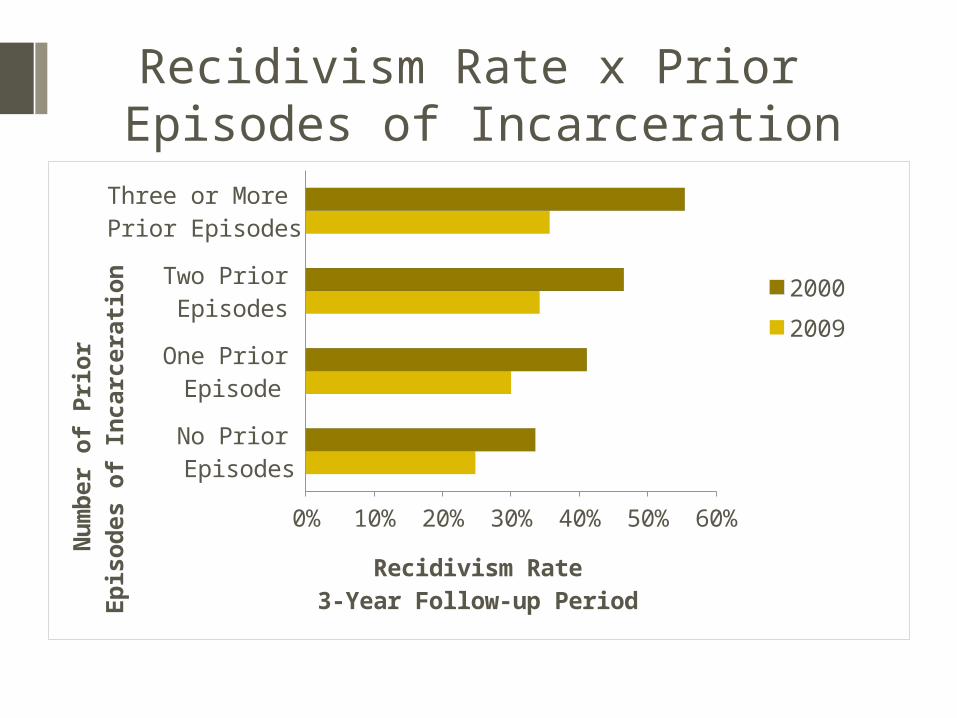
Recidivism Rate x Prior Episodes of Incarceration
No Prior Episodes
One Prior Episode
Two Prior Episodes
Three or More Prior Episodes
0% 10% 20% 30% 40% 50% 60%
2000
2009
Recidivism Rate3-Year Follow-up Period
Nu
mb
er
of
Pri
or
Ep
isod
es o
f In
carc
era
tion
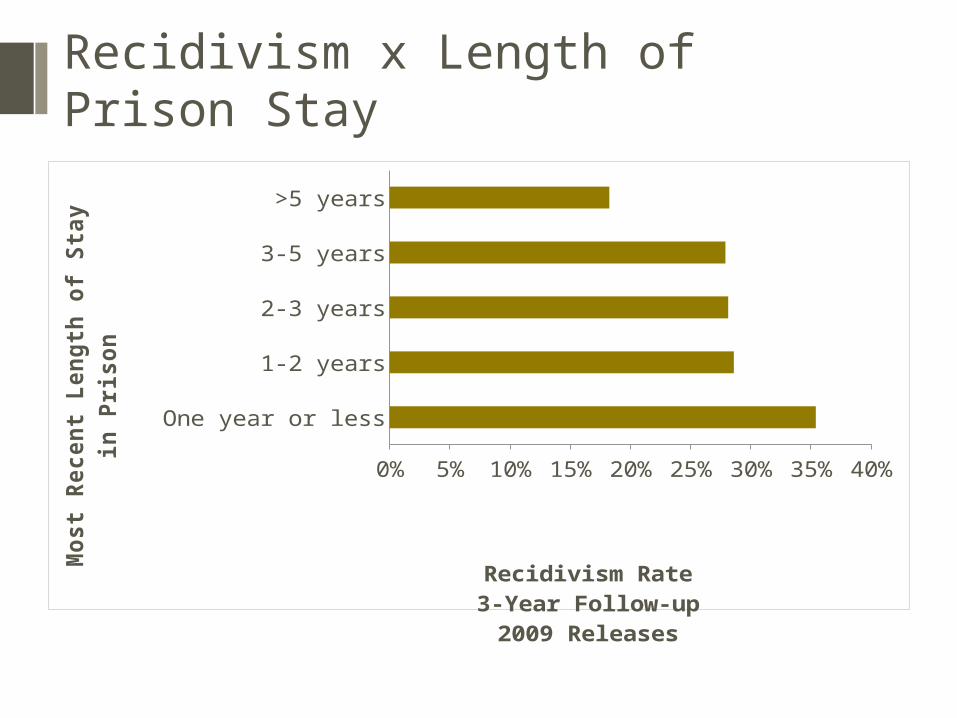
Recidivism x Length of Prison Stay
One year or less
1-2 years
2-3 years
3-5 years
>5 years
0% 5% 10% 15% 20% 25% 30% 35% 40%
Recidivism Rate3-Year Follow-up2009 Releases
Most
Recen
t Len
gth
of
Sta
y
in P
rison

Recidivism x Sentence and Offense Type
Other Public Order/Other Crime
Property Crime Violent Crime Drug Crime0
100
200
300
400
500
600
700
800
900
1,000
Pro-bation
Nu
mb
er
of
Re
cid
ivis
ts
Offense Type3-Year Follow-up
Period2009 Releases

Future: Mock-up Data Dashboards
ADMISSIONS / RELEASES FROM PRISON
RECIDIVISM