reporting 3a
TRANSCRIPT

7/31/2019 Reporting 3a
http://slidepdf.com/reader/full/reporting-3a 1/15
PROBABILITY IN
HYDROLOGY:
A BASIS FOR PLANNING

7/31/2019 Reporting 3a
http://slidepdf.com/reader/full/reporting-3a 2/15
GOAL :
Not to eliminate all floods but to
reduce the frequency of flooding and,hence, the resulting damages.

7/31/2019 Reporting 3a
http://slidepdf.com/reader/full/reporting-3a 3/15
Does a flood have anything to dowith earthquakes and tsunamis ?
Yes, because those things causefloods.
Some other causes are soil erosion
and too much precipitation (snow andrain).
7/31/2019 Reporting 3a
http://slidepdf.com/reader/full/reporting-3a 4/15
Is flood water fresh water or salt water?
If you guessed fresh water you aremostly right.Floods usually come from a body of freshwater caused by precipitationIf you guessed salt water you were
right in one caseFloods caused by tsunamis are salt
7/31/2019 Reporting 3a
http://slidepdf.com/reader/full/reporting-3a 5/15
FLOOD PROBABILITY
SELECTION OF DATA
PLOTTING POSITIONS
THEORETICAL
DISTRIBUTION OF FLOODS

7/31/2019 Reporting 3a
http://slidepdf.com/reader/full/reporting-3a 6/15
SELECTION OF DATA
RELEVANCEImplies that the data must deal with the problem.
ADEQUACY
refers primarily to length of record.
ACCURACY
refers primarily to the problem of homogeneity.

7/31/2019 Reporting 3a
http://slidepdf.com/reader/full/reporting-3a 7/15
)( E Return Period
Random variable:
Threshold level:
Extreme event occurs if:
Recurrence interval:Return Period:
Average recurrence interval between events
equaling or exceeding a threshold
If p is the probability of occurrence of an extremeevent, then
or
Return Period
X
T x
T x X
T
x X of ocurrencesbetweenTime
)( E
pT E 1
)(
T
x X P T
1)(
7/31/2019 Reporting 3a
http://slidepdf.com/reader/full/reporting-3a 8/15
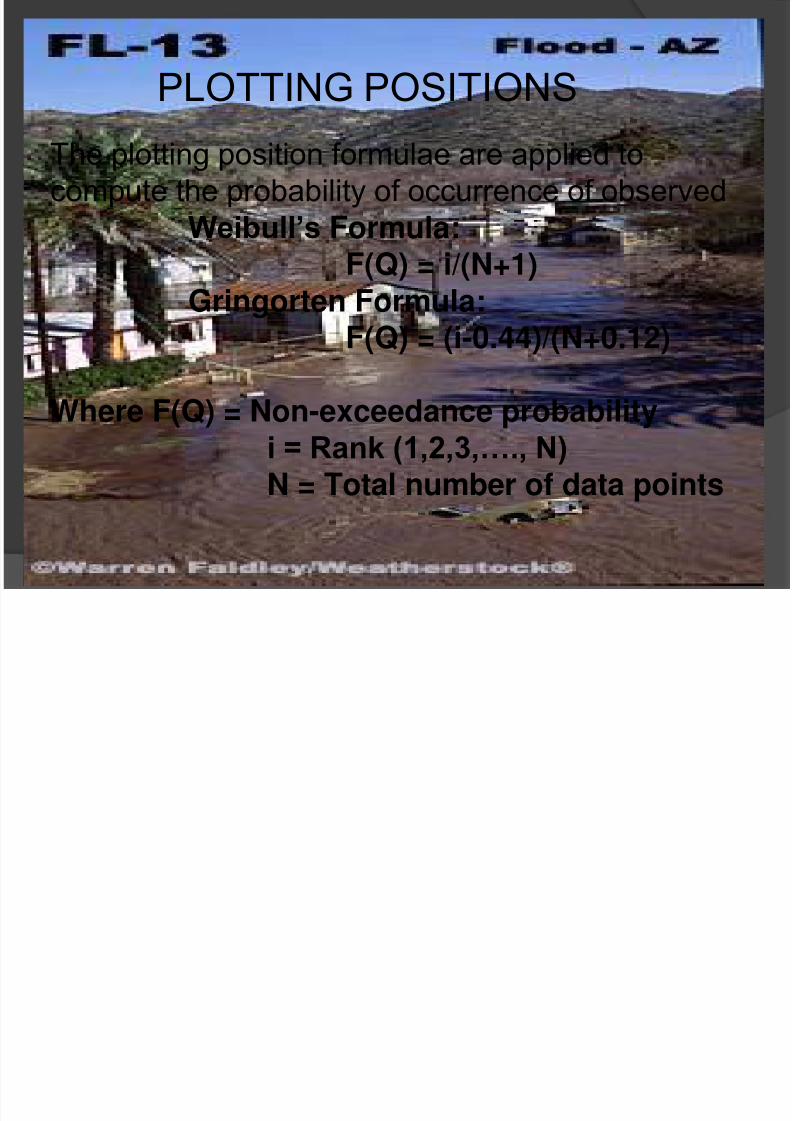
PLOTTING POSITIONS
The plotting position formulae are applied to
compute the probability of occurrence of observed
Weibull’s Formula:
F(Q) = i/(N+1)Gringorten Formula:F(Q) = (i-0.44)/(N+0.12)
Where F(Q) = Non-exceedance probabilityi = Rank (1,2,3,…., N) N = Total number of data points
7/31/2019 Reporting 3a
http://slidepdf.com/reader/full/reporting-3a 9/15
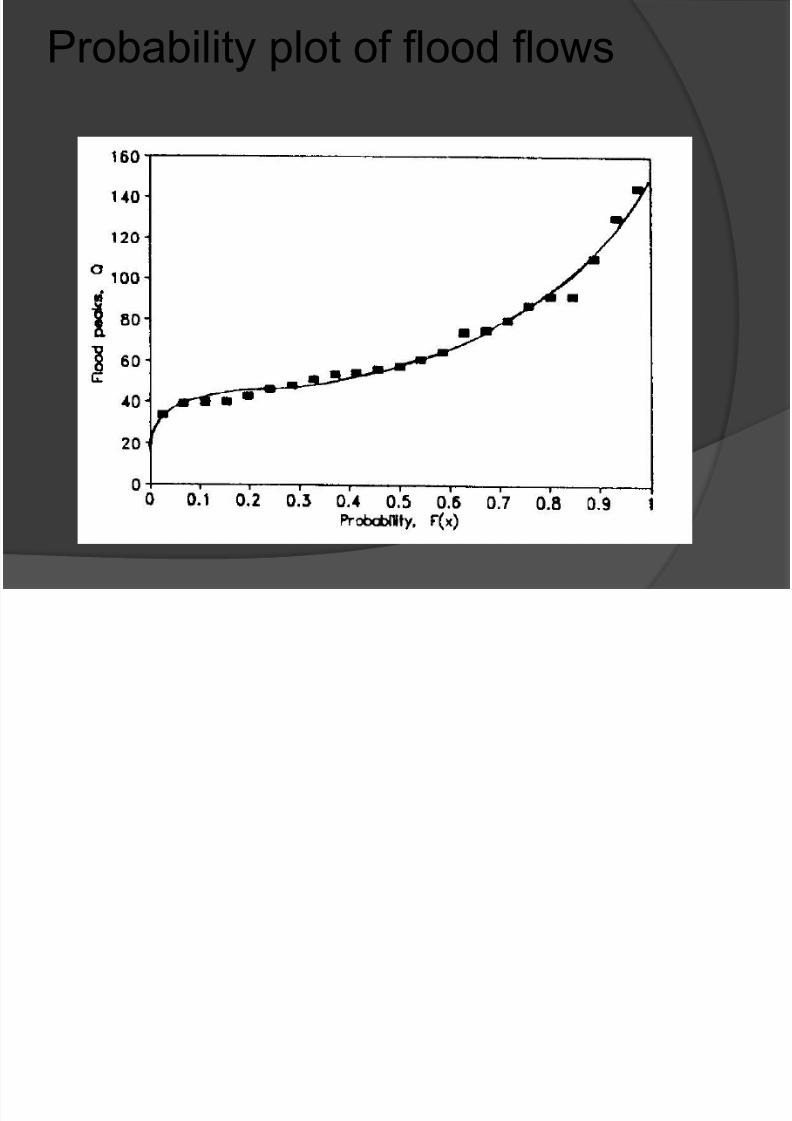
Probability plot of flood flows
7/31/2019 Reporting 3a
http://slidepdf.com/reader/full/reporting-3a 10/15
Goal: to determine design
discharges
• Flood economic studies require flooddischarge estimates for a range of returnperiods
– 2, 5, 10, 25, 50, 100, 200, 500 years• Flood mapping studies use a smaller
number of return periods – 10, 50, 100, 500 years
• 100 year flood is that discharge which isequaled or exceeded, on average, onceper 100 years.

7/31/2019 Reporting 3a
http://slidepdf.com/reader/full/reporting-3a 11/15
x
f X ( x)
sK T
x
T x
T x X P T
1)(
Frequency Factors
Chow proposed using:
Where:
sK x x T T
deviationstandardSample
meanSampleperiodReturn
factorFrequency
magnitudeeventEstimated
s
xT
K
x
T
T
x
f X ( x)
sK T
x
T x
T x X PT
1)(

7/31/2019 Reporting 3a
http://slidepdf.com/reader/full/reporting-3a 12/15
More on return period
If p is probability of success, then (1-
p) is the probability of failure
Find probability that (X ≥ xT) at least
once in N years.
N
N
T
T T
T
T
T
p years N inonceleast at x X P
years N all x X P years N inonceleast at x X P p x X P
x X P p
111)1(1)(
)(1)()1()(
)(
7/31/2019 Reporting 3a
http://slidepdf.com/reader/full/reporting-3a 13/15
0
100
200
300
400
500
600
1905 1908 1918 1927 1938 1948 19 58 1 968 197 8 198 8 1998
Year
A n n u a l M a x F l o w ( 1
0 3 c
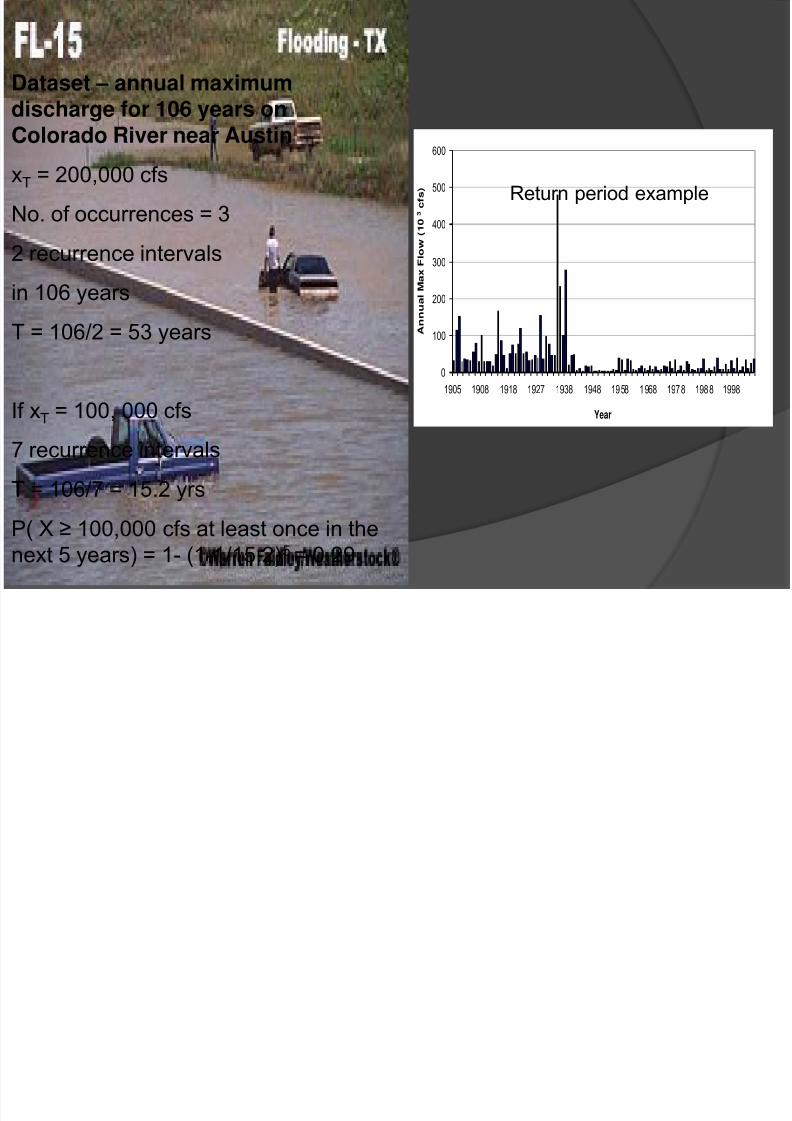
f s ) Return period example
Dataset – annual maximumdischarge for 106 years on
Colorado River near AustinxT = 200,000 cfs
No. of occurrences = 3
2 recurrence intervals
in 106 years
T = 106/2 = 53 years
If xT = 100, 000 cfs7 recurrence intervals
T = 106/7 = 15.2 yrs
P( X ≥ 100,000 cfs at least once in the
next 5 years) = 1- (1-1/15.2)5 = 0.29

7/31/2019 Reporting 3a
http://slidepdf.com/reader/full/reporting-3a 14/15
Frequency curve plotted on
Gumbel probability paper

7/31/2019 Reporting 3a
http://slidepdf.com/reader/full/reporting-3a 15/15