reporting and communicating - european commission · pdf fileealth and food afety health...
TRANSCRIPT

Health andFood Safety
Health system performance assessment
Reporting and Communicating
Practical guide for policy makers
HSPA Policy Paper

The information contained in this publication does not necessarily reflect the opinion or the position of the European Commission.
Neither the European Commission nor any person acting on its behalf is responsible for any use that might be made of the following information.
Europe Direct is a service to help you find answers to your questions about the European Union
Freephone number (*):00 800 6 7 8 9 10 11
(*) Certain mobile telephone operators do not allow access to 00 800 numbers or these calls may be billed.
More information on the European Union is available on the Internet (http://europa.eu).
Cataloguing data can be found at the end of this publication.
Luxembourg: Publications Office of the European Union, 2017
Electronic version:ISBN 978-92-79-66110-5doi:10.2875/388510Catalogue number: EW-04-17-187-EN-N
Paper version:ISBN 978-92-79-66111-2doi:10.2875/196866Catalogue number: EW-04-17-187-EN-C
© European Union, 2017Reproduction of the texts of this report is authorised provided the source is acknowledged. For reproduction or use of the artistic material contained therein and identified as being the property of a third-party copyright holder, permission must be sought directly from the copyright holder.
© Photos: http://www.istockphoto.com/, Health and Food Safety Directorate-General

1
Corresponding author: Federico Paoli, European Commission, Directorate-General for Health and Food Safety; [email protected]
This paper benefits from the contributions of several members of the Expert Group on Health Systems Performance Assessment, who commented a draft version and greatly improved it with their remarks. Tom de Smedt, from DG SANTE's Communication Unit, also provided useful comments and corrected some inaccuracies.
However, the views expressed in this paper are those of the author and do not necessarily correspond to positions of the Expert Group on Health Systems Performance Assessment, the Directorate-General for Health and Food Safety or the European Commission.
Brussels, September 2017

2
Summary This paper is addressed to policy makers who are assessing the performance of their health system. It provides them with practical tips and advices to effectively report and communicate the findings of their assessment. It was developed to respond to a request from the EU Expert Group on Health Systems Performance Assessment (HSPA), and benefitted from the discussion in the group.
For an effective communication of findings, four main steps are identified; the first is the definition of the goal of the HSPA exercise; whilst the overall goal of every HSPA exercise is to improve the performance of the health systems, and ultimately to improve the health of the population it serves, there may be several reasons to carry out an assessment; here we present the main ones.
The second step is the identification of the target audience we want to reach with our information and the analysis of the stakeholders that are active in the field.
The third step is the actual reporting and communicating the findings of the analysis, which represents the core of this paper and is further analysed according to its main dimensions: the format of the report itself, the information included in the report, the way the information is displayed (how to reconcile complex analyses with simple presentations), and how the report’s findings are disseminated.
The fourth and final step is the design and implementation of monitoring and evaluation actions to provide effective feedbacks and regularly fine-tuning targets and communication activities. For each step and sub-step, few examples are provided to give some initial hints, but without any ambition to be exhaustive.

3
Contents 1. Background and introduction . . . . . . . . . . . . . . . . . . . . . . . . . . . . . . . . . . . . . . . . . . . . . . 5
2. Defining the goals of HSPA . . . . . . . . . . . . . . . . . . . . . . . . . . . . . . . . . . . . . . . . . . . . . . . . 6
3. Identifying the target audience for HSPA . . . . . . . . . . . . . . . . . . . . . . . . . . . . . . . . . . . . 7
4. Reporting . . . . . . . . . . . . . . . . . . . . . . . . . . . . . . . . . . . . . . . . . . . . . . . . . . . . . . . . . . . . . . 9
4.1. Type of information provided . . . . . . . . . . . . . . . . . . . . . . . . . . . . . . . . . . . . . . . 9
4.2. Complexity of the analysis versus simplicity of the presentation . . . . . . . . . . 12
4.3. Format of reporting . . . . . . . . . . . . . . . . . . . . . . . . . . . . . . . . . . . . . . . . . . . . . . . 15
4.4. Dissemination channels . . . . . . . . . . . . . . . . . . . . . . . . . . . . . . . . . . . . . . . . . . . 16
5. Monitoring and evaluation . . . . . . . . . . . . . . . . . . . . . . . . . . . . . . . . . . . . . . . . . . . . . . . 17
References . . . . . . . . . . . . . . . . . . . . . . . . . . . . . . . . . . . . . . . . . . . . . . . . . . . . . . . . . . . . . . 19
Reference websites . . . . . . . . . . . . . . . . . . . . . . . . . . . . . . . . . . . . . . . . . . . . . . . . . . . . . . . 20
4
Health system performance assessment
Reporting and Communicating
Practical guide for policy makers
HSPA Policy Paper

5
1.
Background and introduction This paper is addressed to policy makers who are engaged with health systems performance assessment (HSPA). It presents practical tips and advices to effectively report and communicate the findings of their assessment.
During the meetings of the EU expert group on HSPA, several experts expressed their interest to look at specific practical topics that could be of interest to policy makers, e.g. how to present HSPA findings, simplicity of the communication vis-à-vis complexity of the analysis, etc.
Responding to this suggestion, we briefly present here the principal phases that lead to the production of an assessment report and the dissemination of its findings.
HSPA is a complex combination of activities that range from the involvement of stakeholders, the building of a political supportive environment, the definition of indicators, and the collection of reliable and comparable data – just to name few of them.
In this paper we focus on a single component of HSPA: its presentation is deliberately limited to the aspects that have a direct influence on the reporting and communication of results.
For the purposes of this analysis, the process that leads to the production of an assessment report and the dissemination
of its findings can be summarised in few steps.
Figure 1: Main steps in reporting and communication of HSPA findings
The first step is the definition of the goal of the assessment: why are we producing an HSPA report? Reasons can be diverse and lead to different choices with regard to reporting and communication.
Linked to the definition of the goal is the identification of the target audience: the groups of stakeholders to whom the report is addressed. This is the second step in our simplified process.
The third step is the very activity of reporting, which can be further analysed according to its main dimensions: the format of the report itself (a book, a web-based interactive tool, etc.), the information included in the report (its ‘content’), the way the information is displayed (how to reconcile complex analyses with simple presentations), and

6
how the report’s findings are disseminated.
Finally, the communication cycle is closed by monitoring and evaluation activities. They feedback into all other steps and help fine-tune the communication actions along the process, gauge the impact at the end of the campaign, and define the targets and ambitions for a next cycle.
Each step – goal definition, target audience identification, reporting, monitoring and evaluation – is presented in a dedicated chapter.
This paper highly benefits from the discussions that took place during the meetings of the HSPA expert group on the 23rd of September and on the 14th of December, 2016, where group members had the occasion to comment draft versions and greatly improve them with their remarks.
2. Defining the goals of HSPA The overall goal of every HSPA exercise is to improve the performance of the health systems, and ultimately to improve the health of the population it serves.
However, beyond these overarching objectives, there is not always a unique reason to set up an HSPA system. In fact, assessing the performance of a health system is a means that could serve different goals.1,2,3 Some of them are listed below; it is clear that these goals are
not in contradiction with one another. On the contrary, they are often complementary and even mutually reinforcing.
Figure 2: Goals of HSPA
Policy-making – Knowing how the system works is the necessary precondition to improve it. Any sound policy action is based on a proper assessment of the existing situation and a reliable forecast of the introduced measures – this information can be provided by an effective HSPA system. HSPA can also be set as the standard instrument to monitor and evaluate the impact of the reforms that are put in place; in this case, targets are usually presented in the assessment framework.
Quality assurance and improvement – Performance assessment, and in particular quality measurement, can be used to pursue quality assurance and improvement. Knowing what is the level of quality that a provider delivers – both in absolute terms and in comparison with
7
peers and benchmarks – is by itself a major driver of improvement. The very fact of being measured provides a simple emulation and self-improvement stimulus; in addition, quality measurement can be coupled with support measures such as technical assistance and tailored coaching or advice.
Management / financial incentives – HSPA can be used as a management tool to define financial incentives or foster organisational change. Health system performance indicators can contribute to design career pathways of healthcare managers, healthcare providers, or other individual health professionals. They can also be applied to define the level of funding of different providers, or different sectors of care.
Accountability – Assessing the performance of the health system can be a way for the system manager to be answerable and liable to stakeholders. Furthermore, since the majority of healthcare in Europe is financed by public funds, HSPA contributes to show how efficiently and properly taxpayers’ money is used. Finally, HSPA is a means to provide citizens with the information of what they can and should expect from the health system.
Patient empowerment – Most experts do not see patient empowerment as a goal for HSPA. However, when information is released, citizens use it. Policy-makers are responsible to provide citizens with the tools for using this information in the best possible way. The collection and dissemination of information on the functioning of the health system can be a key element allowing patients to use
broader knowledge for more educated choices.
Finally, we shall stress that the goal of the HSPA exercise is not to be confused with the goal of the communication strategy. The latest could be, for instance, informing stakeholders, involve them, provoke reactions, etc.
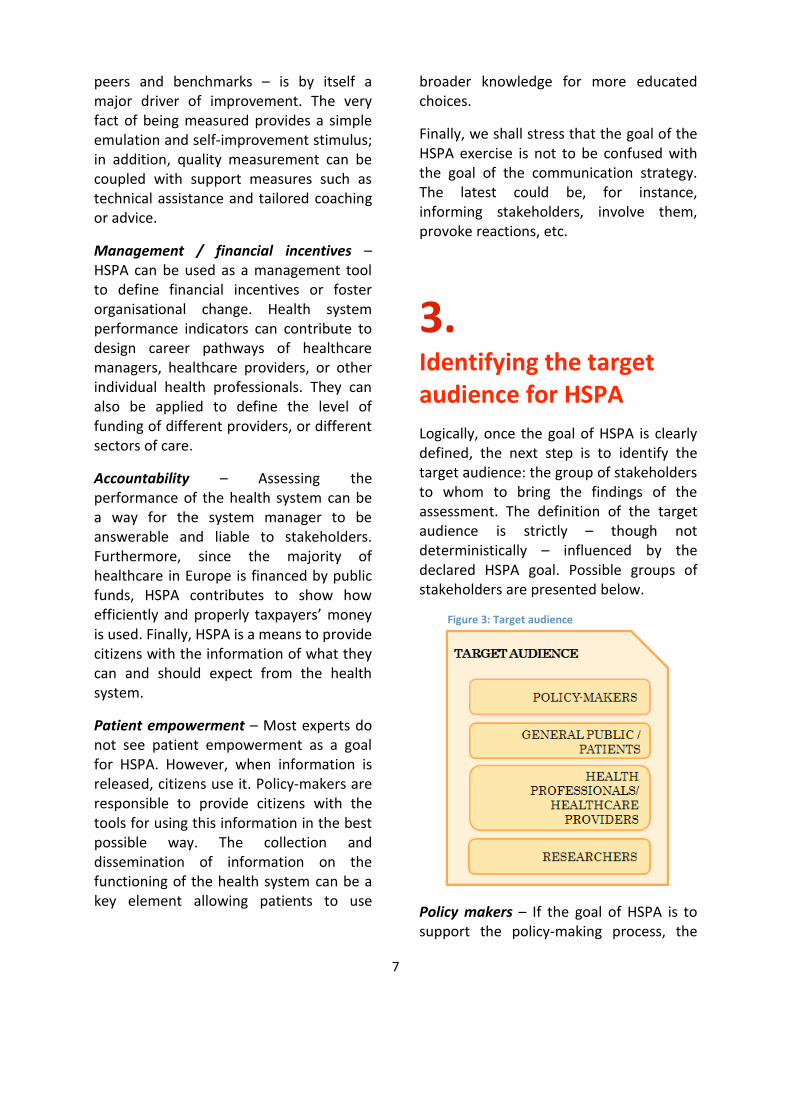
3. Identifying the target audience for HSPA Logically, once the goal of HSPA is clearly defined, the next step is to identify the target audience: the group of stakeholders to whom to bring the findings of the assessment. The definition of the target audience is strictly – though not deterministically – influenced by the declared HSPA goal. Possible groups of stakeholders are presented below.
Figure 3: Target audience
Policy makers – If the goal of HSPA is to support the policy-making process, the

8
most relevant audience is obviously composed of policy makers. This definition is however quite broad and ranges from politicians to technocrats. It can include representatives from industry, civil societies and social actors.
Patients / broader public – The information collected in assessing the performance of the health system can be addressed to the general public. This may be the result of an accountability exercise, or can be instrumental to empower patients and enable them to make better informed choices about the healthcare providers and the treatments they may ask for. However, in most situations it would be unrealistic to reach directly the general public; instead it is usually more feasible and effective to address 'information multipliers' – such as patient associations, NGOs, or media – which can indirectly convey the message to the general public.
Professionals / healthcare providers – HSPA findings can be addressed (exclusively, primarily, or partially) to healthcare providers. In this context, the definition includes individual health professionals such as general practitioners or nurses, as well as institutions such as hospitals, ambulatories and health centres. Performance data on health providers can be disclosed to the whole audience in a transparent way; alternatively each provider may be made aware of her/his performance level alone (possibly in comparison with averages or anonymised benchmarks).
Researchers – Data and information produced by HSPA can be addressed to the research community. The involvement of researchers can help improve the
methodology of analysis and the reliability and comparability of indicators. Considering this audience is usually a means to consider state-of-the-art tools and methodologies in one’s own HSPA exercise. Researchers need access to more detailed and more complex information than other categories. HSPA reports addressed to researchers should provide the possibility to look at these details.
In general, differences among target audiences exist but should not be over-estimated: HSPA reports are by their nature a tool for communication and information; they are nor clinical manuals neither scientific essays and should be accessible to the broadest audience.
Anyway, to fine tune the communication, all relevant stakeholders should be mapped, to find out whom they represent, which position they take in the political debate, which reaction should we expect from them, how they could contribute to communicate the findings of the assessment, etc. Figure 4: Stakeholders mapping
Adapted from Jipping, Masterclass EUPRIO 2012
Finally, the target audience of HSPA reports is always an active player in the
9
health system, being it a policy maker, a service provider, or a patient. Every communication should therefore be intended as a two-way communication, where feed-backs from the audience are fundamental in redesigning, customising and fine tuning the reports.
4. Reporting Allowing for some level of simplification, the next steps after having defined the goal of the HSPA exercise and its target audience are to collect information, analyse it and report to the target audience.4,5 As anticipated, in this section we do not enter in the technical aspects of collecting and analysing information, but focus on reporting and on the different questions one should answer so as to define the most effective ways of communicating HSPA findings.
These questions can be meaningfully clustered into four main groups, which cover the type of information provided, the trade-off between complexity of analysis and simplicity of communication, the format of reporting, and the ways of dissemination.
For each group we present few examples from national and international experiences. To make them more easily recognisable, examples are distinguished by a grey background. Examples are by definition not exhaustive: they only intend to provide some quick hint to better explain the content of the preceding paragraphs.
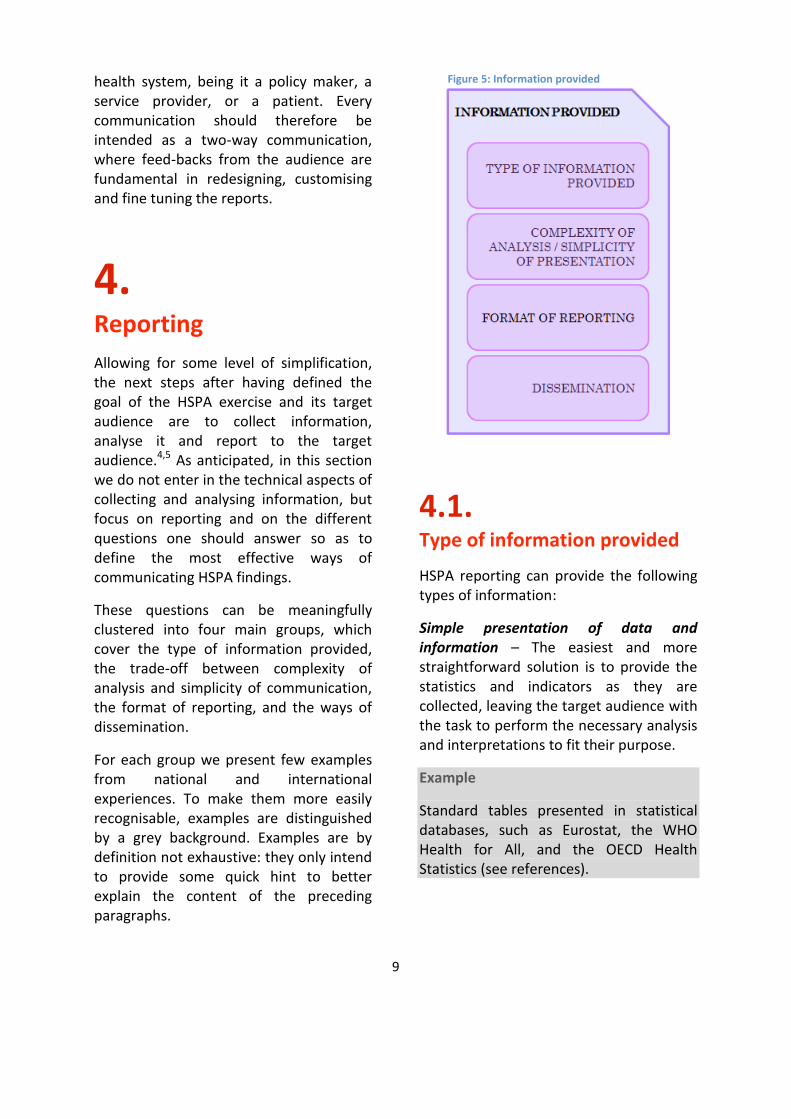
Figure 5: Information provided
4.1. Type of information provided
HSPA reporting can provide the following types of information:
Simple presentation of data and information – The easiest and more straightforward solution is to provide the statistics and indicators as they are collected, leaving the target audience with the task to perform the necessary analysis and interpretations to fit their purpose.
Example
Standard tables presented in statistical databases, such as Eurostat, the WHO Health for All, and the OECD Health Statistics (see references).
10
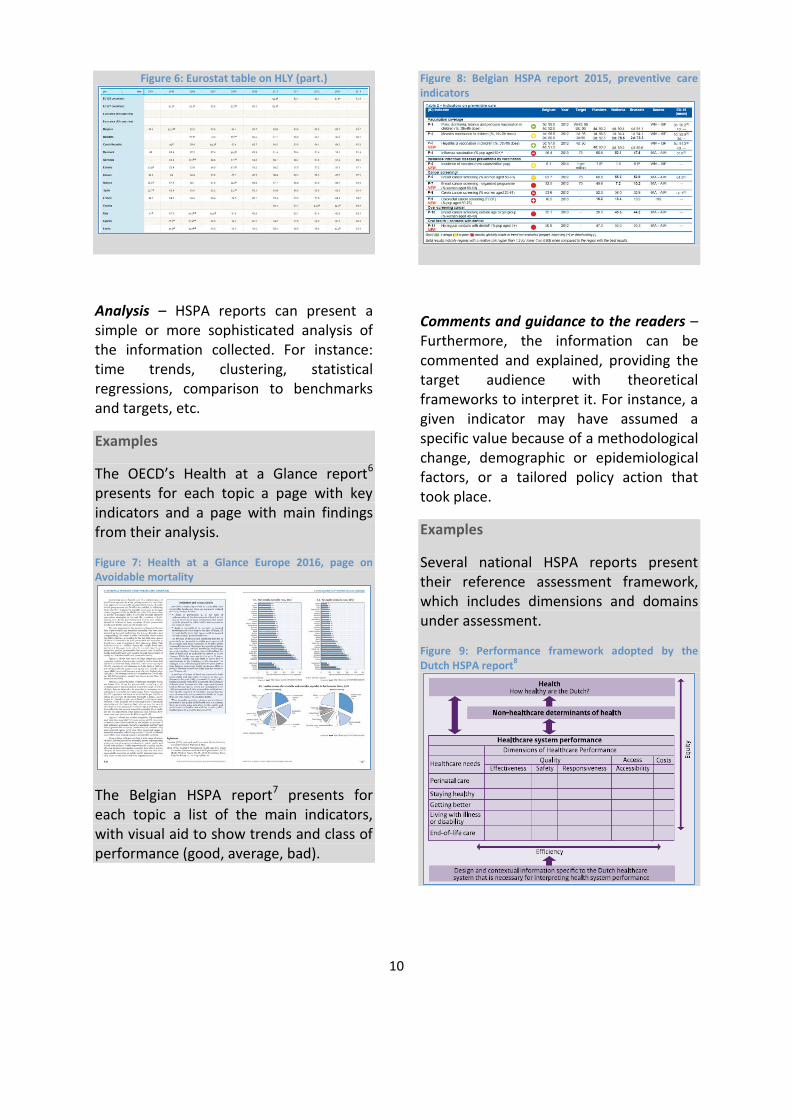
Figure 6: Eurostat table on HLY (part.)
Analysis – HSPA reports can present a simple or more sophisticated analysis of the information collected. For instance: time trends, clustering, statistical regressions, comparison to benchmarks and targets, etc.
Examples
The OECD’s Health at a Glance report6 presents for each topic a page with key indicators and a page with main findings from their analysis.
Figure 7: Health at a Glance Europe 2016, page on Avoidable mortality
The Belgian HSPA report7 presents for each topic a list of the main indicators, with visual aid to show trends and class of performance (good, average, bad).
Figure 8: Belgian HSPA report 2015, preventive care indicators
Comments and guidance to the readers – Furthermore, the information can be commented and explained, providing the target audience with theoretical frameworks to interpret it. For instance, a given indicator may have assumed a specific value because of a methodological change, demographic or epidemiological factors, or a tailored policy action that took place.
Examples
Several national HSPA reports present their reference assessment framework, which includes dimensions and domains under assessment.
Figure 9: Performance framework adopted by the Dutch HSPA report8
11
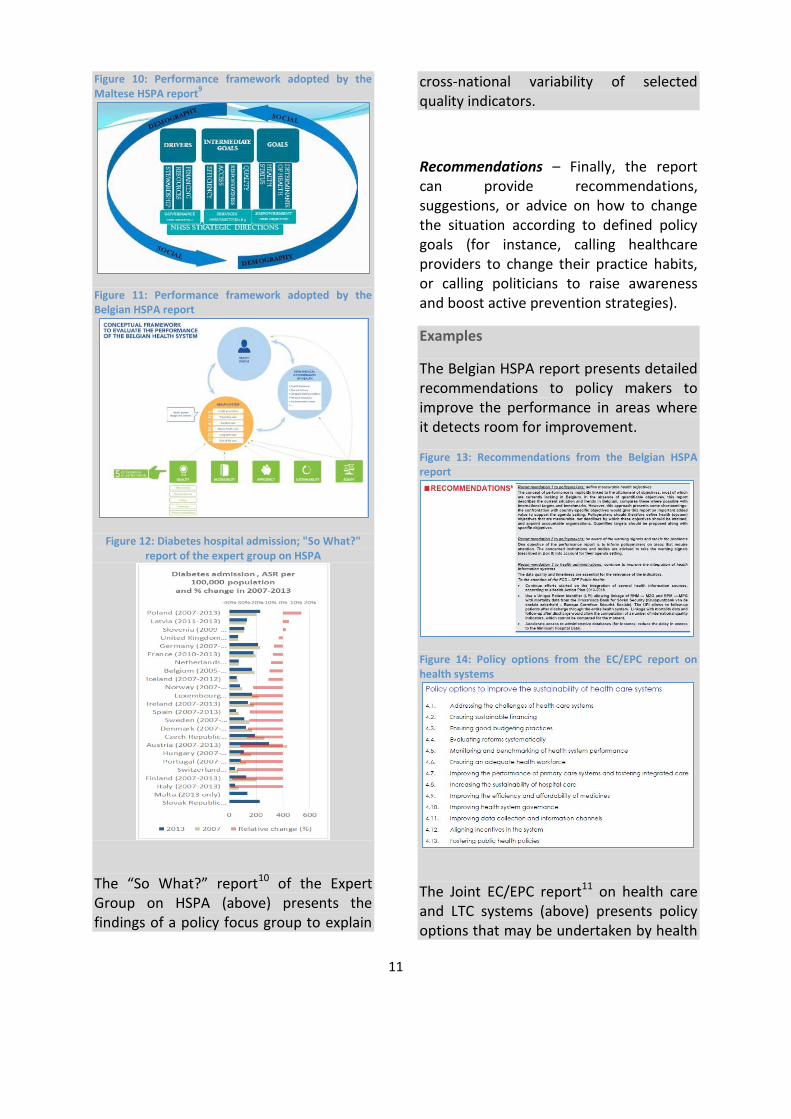
Figure 10: Performance framework adopted by the Maltese HSPA report9
Figure 11: Performance framework adopted by the Belgian HSPA report
Figure 12: Diabetes hospital admission; "So What?"
report of the expert group on HSPA
The “So What?” report10 of the Expert Group on HSPA (above) presents the findings of a policy focus group to explain
cross-national variability of selected quality indicators.
Recommendations – Finally, the report can provide recommendations, suggestions, or advice on how to change the situation according to defined policy goals (for instance, calling healthcare providers to change their practice habits, or calling politicians to raise awareness and boost active prevention strategies).
Examples
The Belgian HSPA report presents detailed recommendations to policy makers to improve the performance in areas where it detects room for improvement.
Figure 13: Recommendations from the Belgian HSPA report
Figure 14: Policy options from the EC/EPC report on health systems
The Joint EC/EPC report11 on health care and LTC systems (above) presents policy options that may be undertaken by health
12
systems in the EU to improve their sustainability.
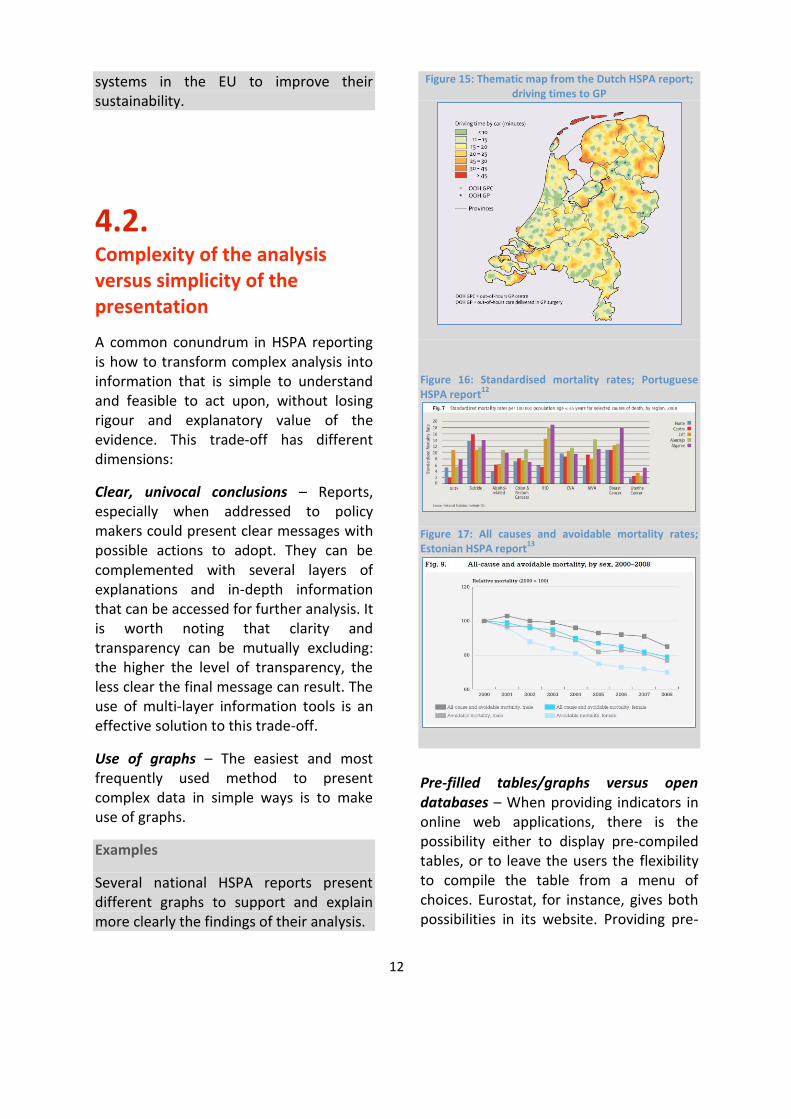
4.2. Complexity of the analysis versus simplicity of the presentation
A common conundrum in HSPA reporting is how to transform complex analysis into information that is simple to understand and feasible to act upon, without losing rigour and explanatory value of the evidence. This trade-off has different dimensions:
Clear, univocal conclusions – Reports, especially when addressed to policy makers could present clear messages with possible actions to adopt. They can be complemented with several layers of explanations and in-depth information that can be accessed for further analysis. It is worth noting that clarity and transparency can be mutually excluding: the higher the level of transparency, the less clear the final message can result. The use of multi-layer information tools is an effective solution to this trade-off.
Use of graphs – The easiest and most frequently used method to present complex data in simple ways is to make use of graphs.
Examples
Several national HSPA reports present different graphs to support and explain more clearly the findings of their analysis.
Figure 15: Thematic map from the Dutch HSPA report; driving times to GP
Figure 16: Standardised mortality rates; Portuguese HSPA report12
Figure 17: All causes and avoidable mortality rates; Estonian HSPA report13
Pre-filled tables/graphs versus open databases – When providing indicators in online web applications, there is the possibility either to display pre-compiled tables, or to leave the users the flexibility to compile the table from a menu of choices. Eurostat, for instance, gives both possibilities in its website. Providing pre-

13
filled tables makes things easier both for producers and users of data, but reduces the richness of information that can be made available.
Example
Figure 18: Structure of the Eurostat Database
The Eurostat database presents a double option in its opening page: for each topic where data are collected, users can browse the database by themes and build their own customised table, or alternatively go for prefilled standard tables.
Composite indicators/index versus dashboards – Complex and multidimensional phenomena can be displayed with dashboards of indicators, or with composite, synthetic indices that summarise a larger amount of information. The latter are much easier to communicate, but hide the complexity of
the underlying situation while making reliable interpretations and decision taking more difficult.
Examples
Sets of indicators can be represented in radar plots, spider plots or similar graphics. Recently, innovative graphic solutions have been tested, as the spie chart and the dartboard.
Figure 19: Spie charts, radar plots, target plots; Stafoggia et al. 2011 (14)
Figure 20: Dartboard on health status, access to care and quality of care for Austria; OECD Health at a Glance
Ordering, benchmarking and ranking – Indicators can be presented neutrally (for instance, with subjects of analysis listed alphabetically) or ordered according to their value; they can also be compared to

14
benchmarks or reference values, or to defined targets. A numbered ranking is also a possibility, which can be semi-transparent, with a subject seeing its own position but not anyone else’s. Comparing single indicators is a more transparent procedure and allows effective decision-making. On the other hand, comparing systems’ performance implies adoption of composite indicators, with decisions on their elements and the weights they should have, and lead to less transparent and less actionable results.
Example
The OECD regularly orders its figures on every individual indicator (but no ranking on aggregate indexes).
Figure 21: Overall volume of antibiotics prescribed; Health at a Glance Europe
Use of international comparably data –National or regional reports can make use of international data to allow cross-country benchmarking. International benchmarking is to be considered as a first step in performance assessment: as shown in the HSPA policy focus groups, international variation should be explained with reference to the local context. International benchmarks may be particularly useful when internal targets are not defined or not available.
Reporting on sub-dimensions of HSPA –A way of reducing complexity in the communication is to break down the
analysis in individual sub-dimensions of performance.15 Overall HSPA reports can be accompanied or alternated by thematic reports on specific dimensions (e.g. quality of care) or areas of care delivery (e.g. primary care).
Example
Belgium issued a specific report on the assessment of the performance of general medicine.16
Figure 22: Belgian report on performance of general medicine
4.3. Format of reporting
HSPA reports often take the form of written documents, which can be published both electronically and in hardcopy. However, they may also – fully or partially – take the form of interactive repositories and displays of information. A

15
few of these formatting options are listed below.
Web / online applications – Virtually every report is published on the web in electronic version. This can be done in a static way (e.g. in PDF format) or in interactive mode (such as open databases, customisable graphs, etc.). Electronic formats can also be tailored to specific devices: desktops and laptops, tablets, and smartphones. Electronic reports allow the use of interactive interfaces to present clear highlights and then give the possibility to access deeper information at user’s request.
Paper hardcopies – The traditional way to present and circulate reports is to print them and distribute hardcopies. Today, hardcopies are often chosen in complementarity to electronic versions: they can be stored, displayed, easily consulted (even in non-connected environments), and customised with personal notes.
Leaflets – The actual report (regardless of its format) can be accompanied by supporting information material such as leaflets, booklets and infographics. Electronic versions can also be distributed in customised USB sticks, often with a clearly recognisable visual identity.
Example
The recent launch of the State of Health in the EU cycle was accompanied by several graphic materials, including leaflets (see references).
Figure 23: Leaflet of the State of Health in the EU cycle
4.4. Dissemination channels
With the target audience in mind, HSPA reports can be disseminated through different channels and in several ways. Some of the main issues that one should take into consideration when disseminating a report are listed below.
Launch of the report – To give more visibility to the publication of the report, one may organise a launch event; this can be a press conference, a workshop, a thematic conference, stands at relevant expositions, etc. If the report is directed to several groups of stakeholders, they may be addressed with different tailored launch events (e.g. associations of doctors, nurses, physiotherapists, etc.).
Use of media for a broader communication – Findings of the reports can be brought more effectively to their

16
target audience via "classic" media (press and television) as well as social media (e.g. Facebook, Twitter, etc.). Conversely, one may deliberately decide to reduce the visibility of controversial findings by limiting media coverage. Media coverage usually last few days and has no permanent impact on patient behaviour.
Periodicity and predictability of the report – An element that may help the effective dissemination of a report is the degree to which it is expected by its audience, and therefore its readiness to act upon it.
Two-way communication – When feasible, one should put in place feedback loops and methods to receive reactions and comments from the target audience, and to take them on board to fine-tune and improve the communication strategy.
Example
NHS England developed the 'NHS belong to us all' guide to help clinical commissioning groups (CCGs) and other commissioners of health and care services to involve patients and carers in decisions relating to care and treatment, and the public in commissioning processes and decisions.17
Figure 24: NHS England; the NHS belongs to us all
5. Monitoring and evaluation Monitoring and evaluation is an essential part of the communication cycle. It helps fine-tune the communication actions along the process, gauge the impact at the end of the campaign, and define the targets and ambitions for a next cycle.
Monitoring can only be done when clear and measurable ("SMART") targets are set at the start of the process. Often this goes together with a (formal or informal) analysis of the current situation: how do we perform in terms of awareness, notoriety, reputation or interaction with the target audiences, and to what level do we wish to improve this.

17
Monitoring the results of a communication action can and should be done at several levels.
Figure 25: Monitoring and evaluation levels
Mapping the inputs will show what efforts have been done to reach a certain communication ambition; e.g. how many publications were made, how many social media posts were published, etc. This information can be collected through activity reports, log files, budget and staff overviews.
Monitoring the outputs shows the reach of those activities at the recipients' side: how many clicks or retweets did we get online, how many participants attended a conference, etc. Possible sources of information are web statistics, publication reports, press clippings.
Measuring the outcomes of communications is often harder, and may require some market research or stakeholder analysis: did we increase the awareness and understanding for a certain issue, to what extent did the opinions of our audience change, etc. User surveys, stakeholder discussions are effective tools to collect this evidence.
The final step is the evaluation of the impact, which can be done through long-term, strategic analyses. Impact evaluation describes the long-term or indirect effects of your outcomes and should help understand if the communication action contributed to reaching your strategic ambitions.

18
References
1. PC Smith, E Mossialos, I Papanicolas, S Leatherman. Performance Measurement of Health System Improvement: Experiences, Challenges and Prospects. Cambridge: Cambridge University Press, 2009.
2. I Papanicolas, PC Smith. Health System Performance Comparison: An agenda for policy, information and research. Maidenhead: Open University Press, 2013.
3. European Commission’s Directorate General for Employment, Social Affairs and Inclusion. Short report: Peer Review on Health Systems Performance Assessment. Brussels: EU, 2014. Available at: http://ec.europa.eu/social/main.jsp?catId=1024&langId=en&newsId=1890&furtherNews=yes
4. MJ van den Berg, DS Kringos, LS Marks, NS Klazinga. The Dutch health care performance report: seven years of health care performance assessment in the Netherlands. Health Research Policy and Systems, 2014, 12:1.
5. I Forde, D Morgan, NS Klazinga. Resolving the challenges in the international comparison of health systems: The must do’s and the trade-offs. Health Policy, 2013, 112: 4-8.
6. OECD/EU. Health at a Glance: Europe 2016 – State of Health in the EU Cycle. Paris: OECD Publishing, 2016. Available at: http://dx.doi.org/10.1787/9789264265592-en
7. F Vrijens, F Renard, C Camberlin, A Desomer, C Dubois, P Jonckheer, K van den Heede, C van de Voorde, D Walckiers, C Léonard, P Meeus. Performance of the Belgian Health System - Report 2015. Brussels: Health Care Knowledge Centre (KCE), 2016. Available at: https://kce.fgov.be/sites/default/files/page_documents/KCE_259C_performancereport2015.pdf
8. MJ van den Berg, D de Boer, R Gijsen, R Heijink, LCM Limburg, SLN Zwakhals. Dutch Health Care Performance Report 2014. Bilthoven: National Institute for Public Health and the Environment (RIVM), 2015. Available at: http://www.rivm.nl/dsresource?objectid=9979ba63-b86d-4e21-9a64-7749012c05ff&type=org&disposition=inline
9. K Grech, M Podesta, A Calleja, N Calleja. Report on the Performance of the Maltese Health System, 2015. Valletta: Ministry for Energy and Health Parliamentary, Secretary for Health, 2015. Available at: https://health.gov.mt/en/dhir/Documents/HSPA%20-%20Malta%20Report%20-%20Final%20050416.pdf
10. EU Expert Group on HSPA. So What? Strategies across Europe to assess quality of care. Brussels: European Union, 2016. Available at: http://ec.europa.eu/health/sites/health/files/systems_performance_assessment/docs/sowhat_en.pdf
11. European Commission's Directorate-General for Economic and Financial Affairs, Economic Policy Committee. Joint Report on Health Care and Long-Term Care Systems & Fiscal Sustainability. Brussels: EU, 2016. Available at:

19
http://ec.europa.eu/economy_finance/publications/eeip/ip037_en.htm
12. WHO Regional Office for Europe, Ministerio da Saude du Portugal, Alto Commissariado da Saude. Portugal Health System Performance Assessment. Copenhagen: WHO Euro, 2010. Available at: http://www.euro.who.int/__data/assets/pdf_file/0006/131766/E94518.pdf
13. WHO Regional Office for Europe, Sotsiaal Ministeerium. Estonia Health System Performance Assessment: 2009 snapshot. Copenhagen: WHO Euro, 2010. Available at: http://www.euro.who.int/__data/assets/pdf_file/0015/115260/E93979.pdf?ua=1
14. M Strafoggia, A Lallo, D Fusco, AP Barone, M D’Ovidio, C Sorge CA Perucci. Spie charts, target plots, and radar plots for displaying comparative outcomes of health care. Journal of Clinical Epidemiology, July 2011, 64(7): 770-8.
15. EU Expert Panel on Effective Ways of Investing in Health. Definition and Endorsement of Criteria to identify Priority Areas when Assessing the Performance of Health Systems. Brussels: European Union, 2014. Available at: http://ec.europa.eu/health/expert_panel/sites/expertpanel/files/002_criteriaperformancehealthsystems_en.pdf
16. P Meeus, X Van Aubel. Performance of general medicine in Belgium: A check-up. Brussels, National Institute for Health and Disease Insurance (INAMI), 2013. Available at: http://www.inami.fgov.be/fr/publications/Pages/performance.aspx
17. NHS England. Transforming participation in health and care; 'The NHS belongs to us all'. NHS England, September 2013. Available at: https://www.england.nhs.uk/wp-content/uploads/2013/09/trans-part-hc-guid1.pdf

20
Reference websites
Eurostat database: http://ec.europa.eu/eurostat/data/database
ECHI data tool: http://ec.europa.eu/health/indicators/indicators_en
EU Expert Panel on Effective Ways of Investing in Health: http://ec.europa.eu/health/expert_panel/home_en
European Observatory on Health Systems and Policies, publications: http://www.euro.who.int/en/about-us/partners/observatory/publications
HSPA expert group webpage: http://ec.europa.eu/health/systems_performance_assessment/policy/expert_group_en
OECD Health Statistics: http://www.oecd.org/els/health-systems/health-statistics.htm
WHO health for all database: http://data.euro.who.int/hfadb/

Free publications:• via EU Bookshop (http://bookshop.europa.eu);• at the European Union’s representations or delegations.• You can obtain their contact details on the Internet (http://ec.europa.eu)
or by sending a fax to +352 2929-42758.
Priced publications:• via EU Bookshop (http://bookshop.europa.eu).
Priced subscriptions:• via one of the sales agents of the Publications Office of the European Union(http://publications.euopa.eu/others/agents/index_en.htm).
HOW TO OBTAIN EU PUBLICATIONS

EW
-04-
17-1
87-E
N-C