reporting under ifrss
TRANSCRIPT

Reporting under IFRSsExample consolidated financial statements 2013 and guidance notes

Important Disclaimer:This document has been developed as an information resource. It is intended as a guideonly and the application of its contents to specific situations will depend on the particularcircumstances involved. While every care has been taken in its presentation, personnelwho use this document to assist in evaluating compliance with International FinancialReporting Standards should have sufficient training and experience to do so. No personshould act specifically on the basis of the material contained herein without consideringand taking professional advice. “Grant Thornton” refers to the brand under which theGrant Thornton member firms provide assurance, tax and advisory services to theirclients and/or refers to one or more member firms, as the context requires. GrantThornton International Ltd (GTIL) and the member firms are not a worldwide partnership.GTIL and each member firm is a separate legal entity. Services are delivered by themember firms. GTIL does not provide services to clients. GTIL and its member firms arenot agents of, and do not obligate, one another and are not liable for one another’s actsor omissions. Neither Grant Thornton International Ltd, nor any of its personnel nor any ofits member firms or their partners or employees, accept any responsibility for any errorsthis document might contain, whether caused by negligence or otherwise, or any loss,howsoever caused, incurred by any person as a result of utilising or otherwise placing anyreliance upon it.

Example Consolidated Financial Statements 2013 i
Example Consolidated Financial Statements 2013The preparation of financial statements inaccordance with International Financial ReportingStandards (IFRSs) is challenging. The challengeshave increased as a result of applying new Standards and Amendments published by theInternational Accounting Standards Board (IASB) that significantly impact both thepresentation of the primary statements and theaccompanying disclosures.
The member firms within Grant ThorntonInternational Ltd (GTIL) – one of the world’sleading organisations of independent assurance, taxand advisory firms – have extensive expertise in theapplication of IFRSs. Grant Thornton InternationalLtd, through its IFRS team, develops generalguidance that supports its member firms’commitment to high quality, consistent applicationof IFRSs and is therefore pleased to share theseinsights by publishing ‘Reporting under IFRSs –Example Consolidated Financial Statements 2013’(the ‘Example Consolidated Financial Statements2013’, the Publication).
‘Example Consolidated Financial Statements2013’ is based on the activities and results ofIllustrative Corporation and subsidiaries (theGroup) – a fictional consulting, service and retailentity that has been preparing IFRS financialstatements for several years. The form and contentof IFRS financial statements depend on theactivities and transactions of each reporting entity.
Our objective in preparing ‘Example ConsolidatedFinancial Statements 2013’ is to illustrate onepossible approach to financial reporting by anentity engaging in transactions that are typicalacross a range of non-specialist sectors. However, aswith any example, this illustration does not envisageevery possible transaction and cannot therefore beregarded as comprehensive. Management isresponsible for the fair presentation of financialstatements and therefore may find other approachesmore appropriate for its specific circumstances.
The Publication has been reviewed and updatedto reflect changes in IFRSs that are effective for theyear ending 31 December 2013. In particular, thePublication reflects the application of IFRS 10‘Consolidated Financial Statements’, IFRS 11 ‘Joint Arrangements’, IFRS 12 ‘Disclosure ofInterests in Other Entities’, IFRS 13 ‘Fair ValueMeasurement’ and the revised version of IAS 19‘Employee Benefits’.
The Publication does not reflect the earlyadoption of any other changes in IFRSs that havebeen issued but are not yet effective. Additionally,no account has been taken of any newdevelopments published after 31 July 2013.
Introduction

ii Example Consolidated Financial Statements 2013
Using the PublicationIn some areas, alternative presentation is alsoillustrated in the Appendices. For further guidanceon the Standards and Interpretations applied,reference is made to IFRS sources throughout thePublication on the left hand side of each page.
The Publication does not address anyjurisdictional or regulatory requirements in areassuch as management commentary, remunerationreporting or audit reporting. Most importantly, theuse of the Publication is not a substitute for the useof a comprehensive and up to date disclosurechecklist to ensure completeness of the disclosuresin IFRS financial statements.
Grant Thornton International LtdAugust 2013
The Publication has been reviewed and updated to reflect
changes effective for the year ending 31 December 2013. In particular, thePublication reflects application of
IFRS 10, IFRS 11, IFRS 12, IFRS 13 and the revised
version of IAS 19.

Example Consolidated FinancialStatements: International FinancialReporting Standards (IFRSs) Illustrative Corporation Group 31 December 2013

Consolidated statement of financial position 1Consolidated statement of profit or loss for the year ended 31 December 3Consolidated statement of comprehensive income for the year ended 31 December 4Consolidated statement of changes in equity for the year ended 31 December 5Consolidated statement of cash flows for the year ended 31 December 6Notes to the consolidated financial statements 71 Nature of operations 72 General information and statement of compliance with IFRSs 73 Changes in accounting policies 84 Summary of accounting policies 115 Acquisitions and disposals 246 Interests in subsidiaries 277 Investments accounted for using the equity method 298 Segment reporting 319 Goodwill 3310 Other intangible assets 3511 Property, plant and equipment 3712 Leases 3813 Investment property 3914 Financial assets and liabilities 4015 Deferred tax assets and liabilities 4416 Inventories 4517 Trade and other receivables 4518 Cash and cash equivalents 4619 Disposal groups classified as held for sale and discontinued operations 4720 Equity 4821 Employee remuneration 5022 Provisions 5623 Trade and other payables 5624 Other liabilities 5725 Finance costs and finance income 5826 Other financial items 5827 Tax expense 5928 Earnings per share and dividends 5929 Non-cash flow adjustments and changes in working capital 6030 Related party transactions 6131 Contingent liabilities 6232 Financial instruments risk 6233 Fair value measurement 6734 Capital management policies and procedures 7135 Post-reporting date events 7236 Authorisation of financial statements 72Appendix A: Organising the statement of profit or loss by function of expenses 74Appendix B: Statement of comprehensive income presented in single statement 76
Contents

Example Consolidated Financial Statements 2013 1
IAS 1.51(c) Notes 31 Dec 31 Dec 1 Jan2013 2012 2012
(Restated) (Restated)IAS 1.51(d-e) CU’000 CU’000 CU’000
AssetsIAS 1.60/66 Non-currentIAS 1.57 Goodwill 9 5,041 3,537 1,234
IAS 1.54(c) Other intangible assets 10 17,424 13,841 10,664
IAS 1.54(a) Property, plant and equipment 11 22,199 20,397 20,746
IAS 1.54(e),
IAS 28.38 Investments accounted for using the equity method 7 860 467 104
IAS 1.54(b) Investment property 13 12,662 12,277 12,102
IAS 1.54(d) Other long-term financial assets 14 3,765 3,880 4,327
IAS 1.54(o),
IAS 1.56 Deferred tax assets 15 – 901 852
IAS 1.60 Non-current assets 61,951 55,300 50,029
IAS 1.60/66 CurrentIAS 1.54(g) Inventories 16 18,298 17,226 18,571
IAS 1.54(h) Trade and other receivables 17 33,629 25,406 20,719
IAS 1.54(d)/55 Derivative financial instruments 14 582 212 490
IAS 1.54(d) Other short-term financial assets 14 655 649 631
IAS 1.54(n) Current tax assets – 337 –
IAS 1.54(i) Cash and cash equivalents 18 34,729 11,197 9,987
IAS 1.60 Current assets 87,893 55,027 50,398
IFRS 5.38, Assets included in disposal group classified as held 19 103 3,908 –
IAS 1.54(j) for sale
IAS 1.55 Total assets 149,947 114,235 100,427
Consolidated statement of financial position
Guidance note: Consolidated statement of financial position The ‘Example Consolidated Financial Statements 2013’use the terminology in IAS 1 ‘Presentation of FinancialStatements’ (IAS 1). However an entity may use othertitles (eg ‘balance sheet’ instead of ‘statement of financialposition’) for the primary financial statements (IAS 1.10).IFRS requires an entity to present, at a minimum, twostatements of financial position (the current period andprior period).
IAS 1.10(f) and IAS 1.40A require an entity to presenta statement of financial position as at the beginning ofthe preceding period (eg a third statement of financialposition) if (i) it applies an accounting policyretrospectively, makes a retrospective restatement ofitems in its financial statements or reclassifies items inthe financial statements and (ii) the retrospectiveapplication, retrospective restatement or thereclassification has a material effect on the information inthe statement of financial position at the beginning of thepreceding period.
IAS 1.40C states that an entity that presents a thirdstatement of financial position at the beginning of thepreceding period need not present related notes for thatstatement.
Even when a third statement of financial position isnot required, an entity may still elect to include such astatement. This approach allows an entity to maintain amore consistent format and layout from one year to the next and may therefore save on design and printing costs.
The ‘Example Consolidated Financial Statements2013’ include a third statement of financial position as of1 January 2012 (the beginning of the preceding period)since the retrospective application of the new andrevised IFRSs in 2013 has a material effect on thatstatement. See Notes 2 and 3. The amendments to IAS1 made as part of ‘Annual Improvements to IFRSs 2009-11 Cycle’ clarified that a third statement of financialposition is required only if retrospective changes have amaterial effect on that statement and also that notes tothe third statement are not required.
The statement of financial position reflects theseparate classification of current and non-current assetsand liabilities. When presentation based on liquidity isreliable and more relevant, the entity instead presentsassets and liabilities in order of liquidity (IAS 1.60).Whichever method is used, however, the entity shalldisclose the amount expected to be recovered or settledafter more than twelve months for each asset and liabilityline items that combine amounts expected to berecovered or settled within and after more than 12months (IAS 1.61).

2 Example Consolidated Financial Statements 2013
IAS 1.51(c) Notes 31 Dec 31 Dec 1 Jan2013 2012 2012
(Restated) (Restated)IAS 1.51(d-e) CU’000 CU’000 CU’000
Equity and liabilitiesIAS 1.57 Equity
Equity attributable to owners of the parent:IAS 1.54(r) Share capital 20 13,770 12,000 12,000
IAS 1.78(e) Share premium 20 19,645 3,050 3,050
IAS 1.78(e) Other components of equity 20 2,440 (657) 2,505
IAS 1.54(r) Retained earnings 51,674 39,024 25,428
Equity attributable to owners of the parent 87,529 53,417 42,983IAS 1.54(q) Non-controlling interest 713 592 476
IAS 1.55 Total equity 88,242 54,009 43,459
LiabilitiesIAS 1.60/69 Non-currentIAS 1.55 Pension and other employee obligations 21 10,386 13,642 8,932
IAS 1.54(m) Borrowings 14 21,000 21,265 21,405
IAS 1.54(k) Trade and other payables 23 4,060 4,459 4,765
IAS 1.54(o)/56 Deferred tax liabilities 15 1,907 – –
IAS 1.55 Other liabilities 24 2,020 1,500 1,600
IAS 1.60 Non-current liabilities 39,373 40,866 36,702
IAS 1.60/69 CurrentIAS 1.54(l) Provisions 22 1,215 3,345 4,400
IAS 1.55 Pension and other employee obligations 21 1,467 1,496 1,336
IAS 1.54(m) Borrowings 14 4,815 3,379 3,818
IAS 1.54(k) Trade and other payables 23 9,009 7,056 7,672
IAS 1.54(n) Current tax liabilities 3,068 – 208
IAS 1.54(m) Derivative financial instruments 14 – 160 –
IAS 1.55 Other liabilities 24 2,758 3,475 2,832
IAS 1.60 Current liabilities 22,332 18,911 20,266
IFRS 5.38, Liabilities included in disposal group classified as 19 – 449 –
IAS 1.54(p) held for sale
IAS 1.55 Total liabilities 61,705 60,226 56,968 IAS 1.55 Total equity and liabilities 149,947 114,235 100,427
Consolidated statement of financial position
Example Consolidated Financial Statements 2013 3
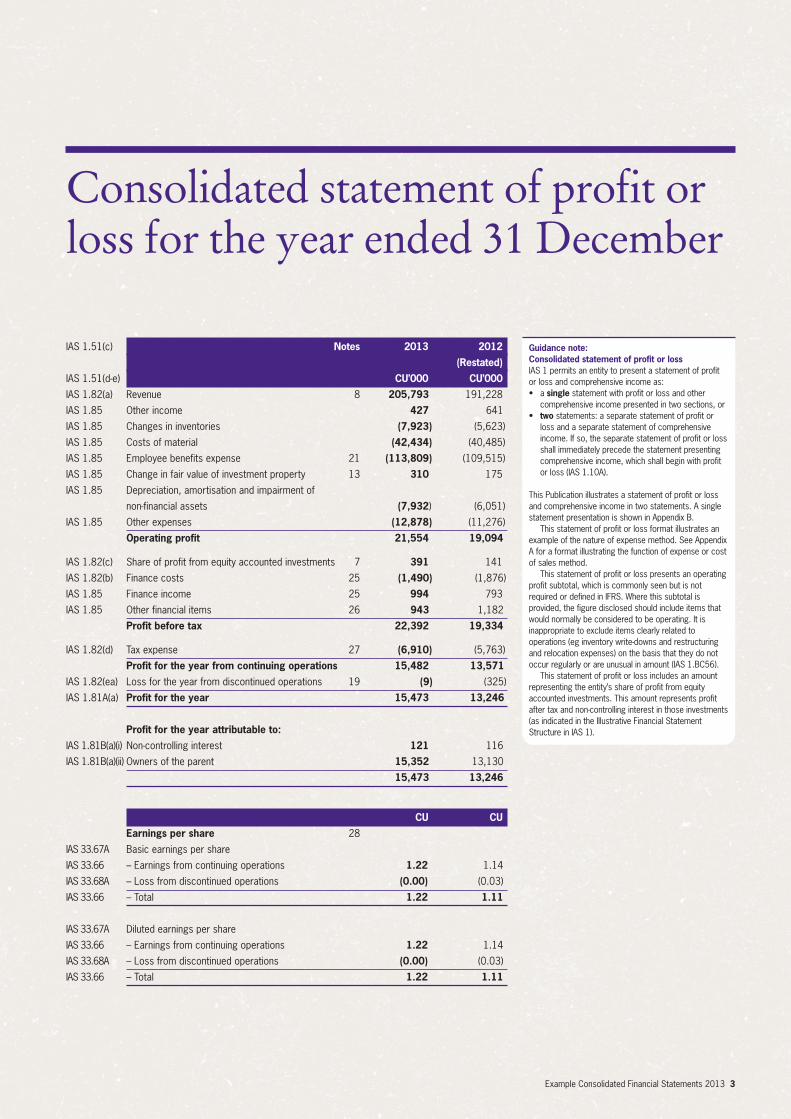
IAS 1.51(c) Notes 2013 2012(Restated)
IAS 1.51(d-e) CU’000 CU’000IAS 1.82(a) Revenue 8 205,793 191,228
IAS 1.85 Other income 427 641
IAS 1.85 Changes in inventories (7,923) (5,623)
IAS 1.85 Costs of material (42,434) (40,485)
IAS 1.85 Employee benefits expense 21 (113,809) (109,515)
IAS 1.85 Change in fair value of investment property 13 310 175
IAS 1.85 Depreciation, amortisation and impairment of
non-financial assets (7,932) (6,051)
IAS 1.85 Other expenses (12,878) (11,276)
Operating profit 21,554 19,094
IAS 1.82(c) Share of profit from equity accounted investments 7 391 141
IAS 1.82(b) Finance costs 25 (1,490) (1,876)
IAS 1.85 Finance income 25 994 793
IAS 1.85 Other financial items 26 ,943 1,182
Profit before tax 22,392 19,334
IAS 1.82(d) Tax expense 27 (6,910) (5,763)
Profit for the year from continuing operations 15,482 13,571IAS 1.82(ea) Loss for the year from discontinued operations 19 (9) (325)
IAS 1.81A(a) Profit for the year 15,473 13,246
Profit for the year attributable to:IAS 1.81B(a)(i) Non-controlling interest 121 116
IAS 1.81B(a)(ii) Owners of the parent 15,352 13,130
15,473 13,246
CU CUEarnings per share 28
IAS 33.67A Basic earnings per share
IAS 33.66 – Earnings from continuing operations 1.22 1.14
IAS 33.68A – Loss from discontinued operations (0.00) (0.03)
IAS 33.66 – Total 1.22 1.11
IAS 33.67A Diluted earnings per share
IAS 33.66 – Earnings from continuing operations 1.22 1.14
IAS 33.68A – Loss from discontinued operations (0.00) (0.03)
IAS 33.66 – Total 1.22 1.11
Consolidated statement of profit orloss for the year ended 31 December
Guidance note: Consolidated statement of profit or loss IAS 1 permits an entity to present a statement of profitor loss and comprehensive income as: • a single statement with profit or loss and other
comprehensive income presented in two sections, or • two statements: a separate statement of profit or
loss and a separate statement of comprehensiveincome. If so, the separate statement of profit or lossshall immediately precede the statement presentingcomprehensive income, which shall begin with profitor loss (IAS 1.10A).
This Publication illustrates a statement of profit or lossand comprehensive income in two statements. A singlestatement presentation is shown in Appendix B.
This statement of profit or loss format illustrates anexample of the nature of expense method. See AppendixA for a format illustrating the function of expense or costof sales method.
This statement of profit or loss presents an operatingprofit subtotal, which is commonly seen but is notrequired or defined in IFRS. Where this subtotal isprovided, the figure disclosed should include items thatwould normally be considered to be operating. It isinappropriate to exclude items clearly related tooperations (eg inventory write-downs and restructuringand relocation expenses) on the basis that they do notoccur regularly or are unusual in amount (IAS 1.BC56).
This statement of profit or loss includes an amountrepresenting the entity’s share of profit from equityaccounted investments. This amount represents profitafter tax and non-controlling interest in those investments(as indicated in the Illustrative Financial StatementStructure in IAS 1).

4 Example Consolidated Financial Statements 2013
IAS 1.51(c) Notes 2013 2012(Restated)
IAS 1.51(d-e) CU’000 CU’000IAS 1.81A Profit for the year 15,473 13,246
Other comprehensive income:IAS 1.82A(a) Items that will not be reclassified subsequently to profit or loss IAS 16.77(f) Revaluation of land 11 303 –
IAS 19.120(c) Remeasurement of net defined benefit liability 21 3,830 (3,541)
IAS 1.90/91(b) Income tax relating to items not reclassified 15 (1,240) 1,062
IAS 1.82A(b) Items that will be reclassified subsequently to profit or loss Cash flow hedging 14
IFRS 7.23(c-d) – current year gains (losses) 367 (47)
IAS 1.92 – reclassification to profit or loss 260 (425)
Available-for-sale financial assets 14
IFRS 7.20(a)(ii) – current year gains 113 35
IAS 1.92 – reclassification to profit or loss (50) –
IAS 21.52(b) Exchange differences on translating foreign operations (664) (341)
IAS 1.82A Share of other comprehensive income of equity
accounted investments 7 5 –
IAS 1.92 – reclassification to profit or loss (3) –
IAS 1.90/91(b) Income tax relating to items that will be reclassified 15 176 95
IAS 1.81A Other comprehensive income for the year, net of tax 3,097 (3,162)
IAS 1.81A Total comprehensive income for the year 18,570 10,084
Total comprehensive income for the year attributable to:IAS 1.81B(b)(i) Non-controlling interest 121 116
IAS 1.81B(b)(ii) Owners of the parent 18,449 9,968
18,570 10,084
Consolidated statement ofcomprehensive income for the year ended 31 December
Guidance note: Consolidated statement of comprehensive incomeIAS 1 requires the entity to disclose reclassificationadjustments and related tax effects relating tocomponents of other comprehensive income. In thisexample, the entity presents reclassification adjustmentsand current year gains and losses relating to othercomprehensive income on the face of the statement ofcomprehensive income (IAS 1.92). An entity may insteadpresent reclassification adjustments in the notes, inwhich case the components of other comprehensiveincome are presented after any related reclassificationadjustments (IAS 1.94).
IAS 1.82A requires items to be grouped into thosethat will not be reclassified subsequently to profit or lossand those that will be reclassified subsequently to profitor loss when specific conditions are met.
IAS 1.90 permits a choice for disclosure of theamount of income tax relating to each component ofother comprehensive income. In this example the entitypresents components of other comprehensive incomebefore tax with one amount shown for the aggregateamount of income tax relating to all components of othercomprehensive income (IAS 1.91(b)). When an entityselects alternative (b) of IAS 1.91, it shall allocate the taxbetween the items that might be reclassifiedsubsequently to the profit or loss section and those thatwill not be reclassified subsequently to the profit or losssection (IAS 1.91).
Alternatively, the entity may present each componentof other comprehensive income net of related taxeffects, IAS 1.91(a).
If the tax effect of each component of othercomprehensive income is not presented on the face of the statement, it is presented in the notes (see Note 20.3).

Example Consolidated Financial Statements 2013 5
Notes Share Share Other Retained Total Non- Totalcapital premium components earnings attributable controlling equity
of equity to owners interestof parent
IAS 1.51(d-e) CU’000 CU’000 CU’000 CU’000 CU’000 CU’000 CU’000IAS 1.106(d) Balance at 1 January 2013 12,000 3,050 (657) 39,024 53,417 592 54,009
Dividends – – – (3,000) (3,000) – (3,000)
Issue of share capital under share-based payment 20 270 1,415 – – 1,685 – 1,685
Employee share-based payment options 21 – – – 298 298 – 298
Issue of share capital 20 1,500 15,180 – – 16,680 – 16,680
IAS 1.106(d)(iii) Transactions with owners 1,770 16,595 – (2,702) 15,663 – 15,663
IAS 1.106(d)(i) Profit for the year – – – 15,352 15,352 121 15,473
IAS 1.106(d)(ii),
IAS 1.106A Other comprehensive income 20 – – 3,097 – 3,097 – 3,097
IAS 1.106(a) Total comprehensive income for the year – – 3,097 15,352 18,449 121 18,570
IAS 1.106(d) Balance at 31 December 2013 13,770 19,645 2,440 51,674 87,529 713 88,242
IAS 1.106(d) Balance at 1 January 2012 12,000 3,050 888 26,128 42,066 476 42,542 IAS 1.106(b) Effect of IAS 19 – – 1,617 (700) 917 – 917
IAS 1.106(d) Balance at 1 January 2012 (Restated) 12,000 3,050 2,505 25,428 42,983 476 43,459 Employee share-based payment options 21 – – – 466 466 – 466
IAS 1.106(d)(iii) Transactions with owners – – – 466 466 – 466
IAS 1.106(d)(i) Profit for the year – – – 13,130 13,130 116 13,246
IAS 1.106(d)(ii),
IAS 1.106A Other comprehensive income 20 – – (3,162) – (3,162) – (3,162)
IAS 1.106(a) Total comprehensive income for the year – – (3,162) 13,130 9,968 116 10,084
IAS 1.106(d) Balance at 31 December 2012 (Restated) 12,000 3,050 (657) 39,024 53,417 592 54,009
Consolidated statement of changes in equity for the year ended 31 December
Guidance note: Consolidated statement of changes in equityIAS 1.106 provides a list of items to be presented on the face of thestatement of changes in equity. Entities may present the requiredreconciliations for each component of other comprehensive incomeeither (1) in the statement of changes in equity or (2) in the notes to thefinancial statements (IAS 1.106(d)(ii) and IAS 1.106A).
The Publication presents the reconciliations for each component ofother comprehensive income in the notes to the financial statements (seeNote 20.3). This reduces duplicated disclosures and presents moreclearly the overall changes in equity.
IFRS 2 ‘Share-based Payment’ requires an entity to recognise equity-settled share-based payment transactions as changes in equity but doesnot specify how this is presented, eg in a separate reserve within equityor within retained earnings. In our view, either approach is allowed underIFRSs (although this may be subject to local regulations in somejurisdictions). In the Publication, the changes in equity are credited toretained earnings.

6 Example Consolidated Financial Statements 2013
IAS 1.51(c) Notes 2013 2012(Restated)
IAS 1.51(d-e) CU’000 CU’000IAS 7.10 Operating activities
Profit before tax 22,392 19,334
Non-cash flow adjustments 29 8,818 9,104
Contributions to defined benefit plans (1,186) (1,273)
Net changes in working capital 29 (2,018) (2,094)
Settling of derivative financial instruments (33) 716
Acquisition costs, expensed to profit or loss 5 (223) (76)
IAS 7.35 Taxes paid (1,761) (5,568)
Net cash from continuing operations 25,989 20,143
IFRS 5.33(c) Net cash from (used in) discontinued operations 19 (22) 811
Net cash from operating activities 25,967 20,954
IAS 7.10 Investing activitiesPurchase of property, plant and equipment (76) (3,281)
Proceeds from disposals of property, plant and equipment 86 –
Purchase of other intangible assets (3,666) (3,235)
Proceeds from disposals of other intangible assets 924 –
IAS 7.39 Acquisition of subsidiaries, net of cash 5 (15,491) (12,075)
IAS 7.39 Proceeds from sale of subsidiaries, net of cash 3,117 –
Proceeds from disposals and redemptions of
non-derivative financial assets 228 132
IAS 7.31 Interest received 25 752 447
IAS 7.31 Dividends received 25 62 21
IAS 7.35 Taxes paid (467) (140)
Net cash used in investing activities (14,531) (18,131)
IAS 7.10 Financing activitiesProceeds from borrowings 1,441 –
Repayment of borrowings (3,778) (649)
Proceeds from issue of share capital 18,365 –
IAS 7.31 Interest paid 25 (1,015) (985)
IAS 7.31 Dividends paid 28 (3,000) –Net cash from (used in) financing activities 12,013 (1,634)
IAS 7.45 Net change in cash and cash equivalents 23,449 1,189
Cash and cash equivalents, beginning of year 11,219 9,987
IAS 7.28 Exchange differences on cash and cash equivalents 61 43
34,729 11,219– included in disposal group 19 – (22)
IAS 7.45 Cash and cash equivalents, end of year 18 34,729 11,19 7
Consolidated statement of cash flows for the year ended 31 December
Guidance note: Consolidated statement of cash flowsThis format illustrates the indirect method of determiningoperating cash flows (IAS 7.18(b)). An entity may alsodetermine the operating cash flows using the directmethod (IAS 7.18(a)).

Example Consolidated Financial Statements 2013 7
1. Nature of operationsIAS 1.51(a) The principal activities of Illustrative Corporation and subsidiaries (the Group) include IAS 1.138(b) consulting on, servicing and sale of customised IT and telecommunications systems. These
activities are grouped into the following service lines:• consulting – focused on the design and sale of phone and intranet based in-house
applications; customisation and integration of IT and telecommunication systems• service – provides after-sale service and maintenance of IT and telecommunication systems• retail – involved in the on-line sales of hardware and software products of the Group’s
business partners.
2. General information and statement of compliance with IFRSsIAS 1.138(a) Illustrative Corporation Ltd (Illustrative Corporation), the Group’s ultimate parent company,IAS 1.138(c) is a limited liability company incorporated and domiciled in Euroland. Its registered office and
principal place of business is 149 Great Place, 40237 Greatville, Euroland. IllustrativeCorporation’s shares are listed on the Greatstocks Stock Exchange.
IAS 1.16 The consolidated financial statements of the Group have been prepared in accordance withIAS 1.51(b) International Financial Reporting Standards (IFRSs) as issued by the International Accounting
Standards Board (IASB). IAS 1.51(c) The consolidated financial statements for the year ended 31 December 2013 (includingIAS 10.17 comparatives) were approved and authorised for issue by the board of directors on 8 March
2014 (see Note 36). Under the Security Regulations Act of Euroland, amendments to thefinancial statements are not permitted after approval.
IAS 1.10(f) requires an entity to present additional statement of financial position as at thebeginning of the preceding period when an entity: • applies an accounting policy retrospectively, makes a retrospective restatement of items in
its financial statements or when it reclassifies items in its financial statements, and • the retrospective application, retrospective restatement or the reclassification has a material
effect on the information in the statement of financial position at the beginning of the preceding period.
Related notes to the additional statement of financial position are not required. The retrospective application of certain new and revised IFRSs (see Note 3 below) in 2013
has a material effect on the consolidated statement of financial position as at 1 January 2012.Therefore, the Group presents a third statement of financial position as at 1 January 2012without related notes except for the disclosures required by IAS 8 ‘Accounting Policies,Changes in Accounting Estimates and Errors’.
Notes to the consolidated financialstatements
Guidance note: Notes to theconsolidated financialstatementsThe example notes tothe Example financialstatements only includedisclosures that arerelevant to the fictitiousentity – IllustrativeCorporation andsubsidiaries. IFRS mayrequire additionaldisclosures in othersituations. Thedisclosures should betailored in all cases toreflect the entity’sspecific facts andcircumstances, basedon a comprehensiveand up to datedisclosure checklist.

8 Example Consolidated Financial Statements 2013
3. Changes in accounting policies 3.1 New and revised standards that are effective for annual periods beginning on orafter 1 January 2013
IAS 8.28(a)-(d) A number of new and revised standards are effective for annual periods beginning on or after 1 January 2013. Information on these new standards is presented below.
IFRS 10 ‘Consolidated Financial Statemen ts’ (IFRS 10)IFRS 10 supersedes IAS 27 ‘Consolidated and Separate Financial Statements’ (IAS 27) and SIC12 ‘Consolidation-Special Purpose Entities’. IFRS 10 revises the definition of control andprovides extensive new guidance on its application. These new requirements have the potentialto affect which of the Group’s investees are considered to be subsidiaries and therefore tochange the scope of consolidation. The requirements on consolidation procedures, accountingfor changes in non-controlling interests and accounting for loss of control of a subsidiary are unchanged.
Management has reviewed its control assessments in accordance with IFRS 10 and hasconcluded that there is no effect on the classification (as subsidiaries or otherwise) of any of the Group’s investees held during the period or comparative periods covered by these financial statements.
IFRS 11 ‘Joint Arrangements’ (IFRS 11)IFRS 11 supersedes IAS 31 ‘Interests in Joint Ventures’ (IAS 31) and SIC 13 ‘Jointly ControlledEntities- Non-Monetary-Contributions by Venturers’. IFRS 11 revises the categories of jointarrangement, and the criteria for classification into the categories, with the objective of moreclosely aligning the accounting with the investor’s rights and obligations relating to thearrangement. In addition, IAS 31’s option of using proportionate consolidation forarrangements classified as jointly controlled entities under that Standard has been eliminated.IFRS 11 now requires the use of the equity method for arrangements classified as joint ventures(as for investments in associates).
The Group’s only joint arrangement within the scope of IFRS 11 is its 50% investment inHalftime Ltd (Halftime), which was accounted for using the proportionate consolidationmethod under IAS 31.
Management has reviewed the classification of Halftime in accordance with IFRS 11 and has concluded that it is a joint venture. IFRS 11 requires the use of equity accounting forjoint ventures.
IFRS 11 has been applied retrospectively in accordance with the transitional provisions setout in IFRS 11. Consequently, the investment in Halftime has been restated by aggregating thecarrying amounts of the assets and the liabilities that the Group had previously proportionatelyconsolidated with effect from 1 January 2012. The Group has assessed the carrying amount ofthe investment for impairment as at 1 January 2012 and has concluded that no impairment lossis required.
The effects on the statements of financial position at 1 January 2012 and 31 December 2012 are:
IAS 8.28(f) 31 Dec 2012 1 Jan 2012IFRS 11.C1B CU’000 CU’000
Increase in investments accounted for using the equity method 222 93
Increase in:Current tax assets 29 –
Decrease in:Property, plant and equipment (250) (260)
Inventories (150) (100)
Cash and cash equivalents (40) (20)
Trade and other payables 40 30
Trade and other payables – non-current 149 237
Current tax liabilities – 20
Change in net assets – –
Guidance note: Changes inaccounting policiesThe discussion of theinitial application ofIFRSs needs to bedisclosed only in thefirst financial statementsafter the new or revisedstandards have beenadopted by the entity.

Example Consolidated Financial Statements 2013 9
The effects on the statement of comprehensive income for the year ended 31 December 2012:
Year to 31 Dec 2012CU’000
Increase in share of profit from equity accounted investments 129
Decrease in:Revenue (365)
Changes in inventories (50)
Costs of material 140
Employee benefits expense 74
Depreciation, amortisation and impairment of non-financial assets 10
Other expenses 33
Tax expense 29
Change in profit for the year –
The application of IFRS 11 did not have a material impact on the statement of cash flows andon the earnings per share for the year ended 31 December 2012.
IFRS 12 ‘Disclosure of Interests in Other Entities’ (IFRS 12)IFRS 12 integrates and makes consistent the disclosure requirements for various types ofinvestments, including unconsolidated structured entities. It introduces new disclosurerequirements about the risks to which an entity is exposed from its involvement withstructured entities. Notes 6 and 7 illustrate the application of IFRS 12 in the current year.
Consequential amendments to IAS 27 ‘Separate Financial Statements’ (IAS 27) and IAS28 ‘Investments in Associates and Joint Ventures’ (IAS 28)IAS 27 now only addresses separate financial statements. IAS 28 brings investments in jointventures into its scope. However, IAS 28’s equity accounting methodology remains unchanged.
IFRS 13 ‘Fair Value Measurement’ (IFRS 13)IFRS 13 clarifies the definition of fair value and provides related guidance and enhanceddisclosures about fair value measurements. It does not affect which items are required to befair-valued. The scope of IFRS 13 is broad and it applies for both financial and non-financialitems for which other IFRSs require or permit fair value measurements or disclosures about fairvalue measurements except in certain circumstances.
IFRS 13 applies prospectively for annual periods beginning on or after 1 January 2013. Itsdisclosure requirements need not be applied to comparative information in the first year ofapplication. The Group has however included as comparative information the IFRS 13disclosures that were required previously by IFRS 7 ‘Financial Instruments: Disclosures’.
The Group has applied IFRS 13 for the first time in the current year, see Notes 14 and 33.
Amendments to IAS 19 ‘Employee Benefits’ (IAS 19)The 2011 amendments to IAS 19 made a number of changes to the accounting for employeebenefits, the most significant relating to defined benefit plans. The amendments:• eliminate the ‘corridor method’ and requires the recognition of remeasurements (including
actuarial gains and losses) arising in the reporting period in other comprehensive income• change the measurement and presentation of certain components of the defined benefit
cost. The net amount in profit or loss is affected by the removal of the expected return onplan assets and interest cost components and their replacement by a net interest expense orincome based on the net defined benefit asset or liability
• enhance disclosures, including more information about the characteristics of definedbenefit plans and related risks.
IAS 19 has been applied retrospectively in accordance with its transitional provisions.Consequently, the Group has restated its reported results throughout the comparative periods presented and reported the cumulative effect as at 1 January 2012 as an adjustment to opening equity.

10 Example Consolidated Financial Statements 2013
The effects of the application of IAS 19 on the statements of financial position at 1 January2012 and 31 December 2012 are:
I AS 8.28(f) Pension and other Deferred Equityemployee obligations tax assets
CU’000 CU’000 CU’000Balance as reported at 1 January 2012 (11,298) 1,245 42,542
Effect of IAS 19 1,310 (393) 917
Restated balance at 1 January 2012 (9,988) 852 43,459
Pension and other Deferred Equityemployee obligations tax assets
CU’000 CU’000 CU’000Balance as reported at 31 December 2012 (12,005) 52 55,990
Effect of IAS 19:
– brought forward 1,310 (393) 917
– total comprehensive income for the year (4,140) 1,242 (2,898)
Restated balance at 31 December 2012 (14,835) 901 54,009
The effects of the application of IAS 19 on the statement of financial position at 31 December2013 are:
31 Dec 2013CU’000
Decrease in pension and other employee obligations 3,668
Increase in deferred tax liability (1,100)
Increase in equity 2,568
The effects of the application of IAS 19 on the statement of comprehensive income for the yearended 31 December 2012 and 31 December 2013 are:
Year to Year to31 Dec 2013 31 Dec 2012
CU’000 CU’000Decrease in employee benefits expense 300 600
Decrease in finance costs 1,983 1,218
Decrease in other financial items (2,445) (2,417)
Decrease in tax expense 49 180
Decrease in profit for the year (113) (419)
Decrease in profit for the year attributable to: Non-controlling interest – –
Owners of the parent (113) (419)
(113) (419)
Decrease in profit for the year (113) (419)
Other comprehensive income:Increase (decrease) in gain on remeasurement of net defined benefit liability 3,830 (3,541)
Decrease (increase) in income tax relating to items not reclassified (1,149) 1,062
Increase (decrease) in other comprehensive income 2,681 (2,479)Increase (decrease) in total comprehensive income 2,568 (2,898)
Increase (decrease) in total comprehensive income for the year attributable to: Non-controlling interest – –
Owners of the parent 2,568 (2,898)
2,568 (2,898)

Example Consolidated Financial Statements 2013 11
The application of IAS 19 did not have a material impact on the statement of cash flows and onthe earnings per share for the year ended 31 December 2012 and 31 December 2013.
3.2 Standards, amendments and interpretations to existing standards that are not yeteffective and have not been adopted early by the Group
IAS 8.30 At the date of authorisation of these financial statements, certain new standards, amendmentsIAS 8.31 and interpretations to existing standards have been published by the IASB but are not yet
effective, and have not been adopted early by the Group.Management anticipates that all of the relevant pronouncements will be adopted in the
Group’s accounting policies for the first period beginning after the effective date of thepronouncement. Information on new standards, amendments and interpretations that areexpected to be relevant to the Group’s financial statements is provided below. Certain othernew standards and interpretations have been issued but are not expected to have a materialimpact on the Group’s financial statements.
IFRS 9 ‘Financial Instruments’ (IFRS 9)The IASB aims to replace IAS 39 ‘Financial Instruments: Recognition and Measurement’ (IAS39) in its entirety with IFRS 9. To date, the chapters dealing with recognition, classification,measurement and derecognition of financial assets and liabilities have been issued. Thesechapters are effective for annual periods beginning on or after 1 January 2015. Chapters dealingwith impairment methodology and hedge accounting are still being developed. Further, inNovember 2011, the IASB tentatively decided to consider making limited modifications toIFRS 9’s financial asset classification model to address application issues. The Group’smanagement have yet to assess the impact of this new standard on the Group’s consolidatedfinancial statements. Management does not expect to implement IFRS 9 until it has beencompleted and its overall impact can be assessed.
‘Investment Entities – Amendments to IFRS 10, IFRS 12 and IAS 27’The Amendments define the term ‘investment entity’, provide supporting guidance and requireinvestment entities to measure investments in the form of controlling interests in another entityat fair value through profit or loss.
Management does not anticipate a material impact on the Group’s consolidated financialstatements.
4 Summary of accounting policiesIAS 1.114(b) 4.1 Overall considerationsIAS 1.117 The consolidated financial statements have been prepared using the significant accounting
policies and measurement bases summarised below.
4.2 Basis of consolidation IAS 1.117(a) The Group financial statements consolidate those of the parent company and all of its IAS 1.117(b) subsidiaries as of 31 December 2013. The parent controls a subsidiary if it is exposed, or has IFRS 10.6 rights, to variable returns from its involvement with the subsidiary and has the ability to IFRS 10.B92 affect those returns through its power over the subsidiary. All subsidiaries have a reportingIAS 1.51(c) date of 31 December. IFRS 10.B86 All transactions and balances between Group companies are eliminated on consolidation,(c) including unrealised gains and losses on transactions between Group companies. Where
unrealised losses on intra-group asset sales are reversed on consolidation, the underlyingasset is also tested for impairment from a group perspective. Amounts reported in the financialstatements of subsidiaries have been adjusted where necessary to ensure consistency with theaccounting policies adopted by the Group.
IFRS 10.B88 Profit or loss and other comprehensive income of subsidiaries acquired or disposed ofduring the year are recognised from the effective date of acquisition, or up to the effective dateof disposal, as applicable.

12 Example Consolidated Financial Statements 2013
IFRS 10.22 Non-controlling interests, presented as part of equity, represent the portion of a IFRS 10.B94 subsidiary’s profit or loss and net assets that is not held by the Group. The Group attributes
total comprehensive income or loss of subsidiaries between the owners of the parent and thenon-controlling interests based on their respective ownership interests.
4.3 Business combinationsIAS 1.117(a) The Group applies the acquisition method in accounting for business combinations. The IAS 1.117(b) consideration transferred by the Group to obtain control of a subsidiary is calculated as the
sum of the acquisition-date fair values of assets transferred, liabilities incurred and the equityinterests issued by the Group, which includes the fair value of any asset or liability arising froma contingent consideration arrangement. Acquisition costs are expensed as incurred.
The Group recognises identifiable assets acquired and liabilities assumed in a businesscombination regardless of whether they have been previously recognised in the acquiree’sfinancial statements prior to the acquisition. Assets acquired and liabilities assumed aregenerally measured at their acquisition-date fair values.
Goodwill is stated after separate recognition of identifiable intangible assets. It is calculatedas the excess of the sum of a) fair value of consideration transferred, b) the recognised amountof any non-controlling interest in the acquiree and c) acquisition-date fair value of any existingequity interest in the acquiree, over the acquisition-date fair values of identifiable net assets. Ifthe fair values of identifiable net assets exceed the sum calculated above, the excess amount (iegain on a bargain purchase) is recognised in profit or loss immediately.
4.4 Investments in associates and joint venturesIAS 28.3 Associates are those entities over which the Group is able to exert significant influence but
which are not subsidiaries. IFRS 11.16 A joint venture is an arrangement that the Group controls jointly with one or more other
investors, and over which the Group has rights to a share of the arrangement’s net assets ratherthan direct rights to underlying assets and obligations for underlying liabilities.
IAS 28.10 Investments in associates and joint ventures are accounted for using the equity method. IFRS 11.24 Any goodwill or fair value adjustment attributable to the Group’s share in the associate
or joint venture is not recognised separately and is included in the amount recognised as investment.
The carrying amount of the investment in associates and joint ventures is increased ordecreased to recognise the Group’s share of the profit or loss and other comprehensive incomeof the associate and joint venture, adjusted where necessary to ensure consistency with theaccounting policies of the Group.
Unrealised gains and losses on transactions between the Group and its associates and jointventures are eliminated to the extent of the Group’s interest in those entities. Where unrealisedlosses are eliminated, the underlying asset is also tested for impairment.
4.5 Foreign currency translationFunctional and presentation currency
IAS 21.53 The consolidated financial statements are presented in currency CU, which is also the IAS 1.51(d) functional currency of the parent company.
Foreign currency transactions and balancesIAS 1.117(a) Foreign currency transactions are translated into the functional currency of the respectiveIAS 1.117(b) Group entity, using the exchange rates prevailing at the dates of the transactions (spot exchange
rate). Foreign exchange gains and losses resulting from the settlement of such transactions andfrom the remeasurement of monetary items denominated in foreign currency at year-endexchange rates are recognised in profit or loss.
Non-monetary items are not retranslated at year-end and are measured at historical cost(translated using the exchange rates at the transaction date), except for non-monetary itemsmeasured at fair value which are translated using the exchange rates at the date when fair valuewas determined.

Example Consolidated Financial Statements 2013 13
Foreign operationsIAS 21.47 In the Group’s financial statements, all assets, liabilities and transactions of Group entities withIAS 21.48 a functional currency other than the CU are translated into CU upon consolidation. The
functional currency of the entities in the Group has remained unchanged during the reporting period.
On consolidation, assets and liabilities have been translated into CU at the closing rate atthe reporting date. Goodwill and fair value adjustments arising on the acquisition of a foreignentity have been treated as assets and liabilities of the foreign entity and translated into CU atthe closing rate. Income and expenses have been translated into CU at the average rate over thereporting period. Exchange differences are charged or credited to other comprehensive incomeand recognised in the currency translation reserve in equity. On disposal of a foreign operation,the related cumulative translation differences recognised in equity are reclassified to profit orloss and are recognised as part of the gain or loss on disposal.
4.6 Segment reportingIFRS 8.22(a) The Group has three operating segments: consulting, service and retail segments. In identifyingIFRS 8.22(b) these operating segments, management generally follows the Group’s service lines representing
its main products and services (see Note 1). IFRS 8.27(a) Each of these operating segments is managed separately as each requires different
technologies, marketing approaches and other resources. All inter-segment transfers are carriedout at arm’s length prices.
IFRS 8.27(b-d) For management purposes, the Group uses the same measurement policies as those used inits financial statements, except for certain items not included in determining the operatingprofit of the operating segments, as follows:• post-employment benefit expenses• share-based payment expenses• research costs relating to new business activities• revenue, costs and fair value gains from investment property.
In addition, corporate assets which are not directly attributable to the business activities of anyoperating segment are not allocated to a segment. This primarily applies to the Group’sheadquarters and the Illustrative Research Lab in Greatville.
4.7 RevenueIAS 18.35(a) Revenue arises from the sale of goods and the rendering of services. It is measured at the fair
value of consideration received or receivable, excluding sales taxes, rebates, and trade discounts. The Group often enters into sales transactions involving a range of the Group’s products
and services, for example for the delivery of hardware, software and related after-sales service.The Group applies the revenue recognition criteria set out below to each separately identifiablecomponent of the sales transaction. The consideration received from these multiple-componenttransactions is allocated to each separately identifiable component in proportion to its relativefair value.
IAS 1.117(b) Sale of goods (hardware or software)Sale of goods is recognised when the Group has transferred to the buyer the significant risksand rewards of ownership, generally when the customer has taken undisputed delivery of the goods.
Revenue from the sale of goods with no significant service obligation is recognised ondelivery. Where significant tailoring, modification or integration is required, revenue isrecognised in the same way as construction contracts for telecommunication systems described below.
When goods are sold together with customer loyalty incentives, the considerationreceivable is allocated between the sale of goods and sale of incentives based on their fair values.Revenue from sale of incentives is recognised when they are redeemed by customers inexchange for products supplied by the Group.
Guidance note: Foreign operationsNote that the use ofaverage rates isappropriate only if ratesdo not fluctuatesignificantly (IAS 21.40).

14 Example Consolidated Financial Statements 2013
IAS 1.117(b) Rendering of servicesThe Group generates revenues from after-sales service and maintenance, consulting andconstruction contracts for telecommunication systems. Consideration received for theseservices is initially deferred, included in other liabilities and is recognised as revenue in theperiod when the service is performed.
In recognising after-sales service and maintenance revenues, the Group considers the natureof the services and the customer’s use of the related products, based on historical experience.Revenue from consulting services is recognised when the services are provided by reference tothe contract’s stage of completion at the reporting date in the same way as constructioncontracts for telecommunication systems described below.
The Group also earns rental income from operating leases of its investment properties (seeNote 13). Rental income is recognised on a straight-line basis over the term of the lease.
IAS 1.117(b) Construction contracts for telecommunication systemsConstruction contracts for telecommunication systems specify a fixed price for thedevelopment and installation of IT and telecommunication systems.
IAS 11.39(b) When the outcome can be assessed reliably, contract revenue and associated costs areIAS 18.35(a) recognised by reference to the stage of completion of the contract activity at the reporting
date. Revenue is measured at the fair value of consideration received or receivable in relation tothat activity.
When the Group cannot measure the outcome of a contract reliably, revenue is recognisedonly to the extent of contract costs that have been incurred and are recoverable. Contract costsare recognised in the period in which they are incurred.
In either situation, when it is probable that total contract costs will exceed total contractrevenue, the expected loss is recognised immediately in profit or loss.
IAS 1.117(a) A construction contract’s stage of completion is assessed by management based onIAS 11.39(c) milestones (usually defined in the contract) for the activities to be carried out under theIAS 1.122 contract and other available relevant information at the reporting date. The maximum amount
of revenue recognised for each milestone is determined by estimating relative contract fairvalues of each contract phase, ie by comparing the Group’s overall contract revenue with the expected profit for each corresponding milestone. Progress and related contract revenue in-between milestones is determined by comparing costs incurred to date with the total costs estimated for that particular milestone (a procedure sometimes referred to as the cost-to-cost method).
The gross amount due from customers for contract work is presented within trade andother receivables for all contracts in progress for which costs incurred plus recognised profits(less recognised losses) exceeds progress billings. The gross amount due to customers forcontract work is presented within other liabilities for all contracts in progress for whichprogress billings exceed costs incurred plus recognised profits (less recognised losses).
IAS 18.30 Interest and dividends Interest income and expenses are reported on an accrual basis using the effective interestmethod. Dividends, other than those from investments in associates and joint ventures, arerecognised at the time the right to receive payment is established.
4.8 Operating expensesIAS 1.117(b) Operating expenses are recognised in profit or loss upon utilisation of the service or as
incurred. Expenditure for warranties is recognised when the Group incurs an obligation, whichis typically when the related goods are sold or services provided.
4.9 Borrowing costsIAS 1.117(b) Borrowing costs directly attributable to the acquisition, construction or production of a
qualifying asset are capitalised during the period of time that is necessary to complete andprepare the asset for its intended use or sale. Other borrowing costs are expensed in the periodin which they are incurred and reported in finance costs (see Note 25).

Example Consolidated Financial Statements 2013 15
4.10 Profit or loss from discontinued operationsIAS 1.117(b) A discontinued operation is a component of the Group that either has been disposed of, or isIFRS 5.32 classified as held for sale, and:
• represents a separate major line of business or geographical area of operations• is part of a single co-ordinated plan to dispose of a separate major line of business or
geographical area of operations or• is a subsidiary acquired exclusively with a view to resale.
IFRS 5.33 Profit or loss from discontinued operations, including prior year components of profit or loss,is presented in a single amount in the statement of profit or loss. This amount, which comprisesthe post-tax profit or loss of discontinued operations and the post-tax gain or loss resultingfrom the measurement and disposal of assets classified as held for sale (see also Note 4.21), isfurther analysed in Note 19.
IFRS 5.34 The disclosures for discontinued operations in the prior year relate to all operations thathave been discontinued by the reporting date of the latest period presented.
4.11 GoodwillIAS 1.117(a) Goodwill represents the future economic benefits arising from a business combination that are
not individually identified and separately recognised. See Note 4.3 for information on howgoodwill is initially determined. Goodwill is carried at cost less accumulated impairment losses.Refer to Note 4.15 for a description of impairment testing procedures.
4.12 Other intangible assets IAS 1.117(b) Recognition of other intangible assets
Acquired softwareAcquired computer software licences are capitalised on the basis of the costs incurred toacquire and install the specific software. Brand names and customer lists acquired in a businesscombination that qualify for separate recognition are recognised as intangible assets at their fairvalues (see Note 4.3).
Internally developed softwareIAS 1.117(b) Expenditure on the research phase of projects to develop new customised software for IT and
telecommunication systems is recognised as an expense as incurred.IAS 38.57 Costs that are directly attributable to a project’s development phase are recognised as
intangible assets, provided they meet the following recognition requirements:• the development costs can be measured reliably• the project is technically and commercially feasible• the Group intends to and has sufficient resources to complete the project• the Group has the ability to use or sell the software• the software will generate probable future economic benefits.
Development costs not meeting these criteria for capitalisation are expensed as incurred.Directly attributable costs include employee costs incurred on software development along
with an appropriate portion of relevant overheads and borrowing costs.
Subsequent measurementIAS 38.118(a) All intangible assets, including capitalised internally developed software, are accounted forIAS 38.118(b) using the cost model whereby capitalised costs are amortised on a straight-line basis over their
estimated useful lives, as these assets are considered finite. Residual values and useful lives arereviewed at each reporting date. In addition, they are subject to impairment testing as describedin Note 4.15. The following useful lives are applied:• software: 3-5 years• brand names: 15-20 years• customer lists: 4-6 years.

16 Example Consolidated Financial Statements 2013
Any capitalised internally developed software that is not yet complete is not amortised but issubject to impairment testing as described in Note 4.15.
IAS 38.118(d) Amortisation has been included within depreciation, amortisation and impairment of non-financial assets.
IAS 1.117(b) Subsequent expenditures on the maintenance of computer software and brand names areexpensed as incurred.
When an intangible asset is disposed of, the gain or loss on disposal is determined as thedifference between the proceeds and the carrying amount of the asset, and is recognised inprofit or loss within other income or other expenses.
4.13 Property, plant and equipmentLand
IAS 16.73(a) Land held for use in production stated at revalued amounts. Revalued amounts are fair valuesIAS 16.73(c) based on appraisals prepared by external professional valuers once every two years or moreIAS 1.117(a) frequently if market factors indicate a material change in fair value (see Note 33.2). AnyIAS 1.117(b) revaluation surplus is recognised in other comprehensive income and credited to the
revaluation reserve in equity. To the extent that any revaluation decrease or impairment loss(see Note 4.15) has previously been recognised in profit or loss, a revaluation increase iscredited to profit or loss with the remaining part of the increase recognised in othercomprehensive income. Downward revaluations of land are recognised upon appraisal orimpairment testing, with the decrease being charged to other comprehensive income to theextent of any revaluation surplus in equity relating to this asset and any remaining decreaserecognised in profit or loss. Any revaluation surplus remaining in equity on disposal of theasset is transferred to retained earnings.
IAS 16.73(b) As no finite useful life for land can be determined, related carrying amounts are not depreciated.
Buildings, IT equipment and other equipmentIAS 16.73(a) Buildings, IT equipment and other equipment (comprising fittings and furniture) are initiallyIAS 1.117(a) recognised at acquisition cost or manufacturing cost, including any costs directly attributable to
bringing the assets to the location and condition necessary for it to be capable of operating inthe manner intended by the Group’s management. Buildings and IT equipment also includeleasehold property held under a finance lease (see Note 4.14). Buildings, IT equipment andother equipment are subsequently measured using the cost model, cost less accumulateddepreciation and impairment losses.
IAS 16.73(b) Depreciation is recognised on a straight-line basis to write down the cost less estimatedIAS 16.73(c) residual value of buildings, IT equipment and other equipment. The following useful lives
are applied:• buildings: 25-50 years• IT equipment: 2-5 years• other equipment: 3-12 years.
In the case of leasehold property, expected useful lives are determined by reference tocomparable owned assets or over the term of the lease, if shorter.
Material residual value estimates and estimates of useful life are updated as required, but atleast annually.
Gains or losses arising on the disposal of property, plant and equipment are determined asthe difference between the disposal proceeds and the carrying amount of the assets and arerecognised in profit or loss within other income or other expenses.

Example Consolidated Financial Statements 2013 17
4.14 Leased assetsFinance leases
IAS 1.117(a) The economic ownership of a leased asset is transferred to the lessee if the lessee bearsIAS 1.117(b) substantially all the risks and rewards of ownership of the leased asset. Where the Group is a
lessee in this type of arrangement, the related asset is recognised at the inception of the lease atthe fair value of the leased asset or, if lower, the present value of the lease payments plusincidental payments, if any. A corresponding amount is recognised as a finance lease liability.Leases of land and buildings are classified separately and are split into a land and a buildingelement, in accordance with the relative fair values of the leasehold interests at the date the assetis recognised initially.
See Note 4.13 for the depreciation methods and useful lives for assets held under financeleases. The corresponding finance lease liability is reduced by lease payments net of financecharges. The interest element of lease payments represents a constant proportion of theoutstanding capital balance and is charged to profit or loss, as finance costs over the period ofthe lease.
Operating leasesAll other leases are treated as operating leases. Where the Group is a lessee, payments onoperating lease agreements are recognised as an expense on a straight-line basis over the leaseterm. Associated costs, such as maintenance and insurance, are expensed as incurred.
4.15 Impairment testing of goodwill, other intangible assets and property, plant andequipment
IAS 1.117(b) For impairment assessment purposes, assets are grouped at the lowest levels for which there arelargely independent cash inflows (cash-generating units). As a result, some assets are testedindividually for impairment and some are tested at cash-generating unit level. Goodwill isallocated to those cash-generating units that are expected to benefit from synergies of therelated business combination and represent the lowest level within the Group at whichmanagement monitors goodwill.
Cash-generating units to which goodwill has been allocated (determined by the Group’smanagement as equivalent to its operating segments) are tested for impairment at least annually.All other individual assets or cash-generating units are tested for impairment whenever eventsor changes in circumstances indicate that the carrying amount may not be recoverable.
IAS 1.122 An impairment loss is recognised for the amount by which the asset’s or cash-generatingIAS 1.117(a) unit’s carrying amount exceeds its recoverable amount, which is the higher of fair value less
costs of disposal and value-in-use. To determine the value-in-use, management estimatesexpected future cash flows from each cash-generating unit and determines a suitable interestrate in order to calculate the present value of those cash flows. The data used for impairmenttesting procedures are directly linked to the Group’s latest approved budget, adjusted asnecessary to exclude the effects of future reorganisations and asset enhancements. Discountfactors are determined individually for each cash-generating unit and reflect management’sassessment of respective risk profiles, such as market and asset-specific risks factors.
Impairment losses for cash-generating units reduce first the carrying amount of anygoodwill allocated to that cash-generating unit. Any remaining impairment loss is charged prorata to the other assets in the cash-generating unit. With the exception of goodwill, all assets aresubsequently reassessed for indications that an impairment loss previously recognised may nolonger exist. An impairment loss is reversed if the asset’s or cash-generating unit’s recoverableamount exceeds its carrying amount.
4.16 Investment property IAS 40.75(a) Investment properties are properties held to earn rentals and/or for capital appreciation, and are
accounted for using the fair value model.IAS 40.75(e) Investment properties are revalued annually and are included in the statement of financial
position at their fair values. See Note 33.2.IAS 1.117(b) Any gain or loss resulting from either a change in the fair value or the sale of an
investment property is immediately recognised in profit or loss within change in fair value ofinvestment property.

18 Example Consolidated Financial Statements 2013
Rental income and operating expenses from investment property are reported withinrevenue and other expenses respectively, and are recognised as described in Notes 4.7 and 4.8, respectively.
4.17 Financial instrumentsRecognition, initial measurement and derecognition
IFRS 7.21 Financial assets and financial liabilities are recognised when the Group becomes a party to theIAS 1.117(a) contractual provisions of the financial instrument and are measured initially at fair valueIAS 1.117(b) adjusted for transaction costs, except for those carried at fair value through profit or loss which
are measured initially at fair value. Subsequent measurement of financial assets and financialliabilities is described below.
IAS 1.117(b) Financial assets are derecognised when the contractual rights to the cash flows from thefinancial asset expire, or when the financial asset and all substantial risks and rewards aretransferred. A financial liability is derecognised when it is extinguished, discharged, cancelled or expires.
IAS 1.117(a) Classification and subsequent measurement of financial assetsFor the purpose of subsequent measurement financial assets, other than those designated andeffective as hedging instruments, are classified into the following categories upon initialrecognition: • loans and receivables• financial assets at fair value through profit or loss (FVTPL)• held-to-maturity (HTM) investments • available-for-sale (AFS) financial assets.
IFRS 7.B5(f) All financial assets except for those at FVTPL are reviewed for impairment at least at eachreporting date to identify whether there is any objective evidence that a financial asset or agroup of financial assets is impaired. Different criteria to determine impairment are applied foreach category of financial assets, which are described below.
All income and expenses relating to financial assets that are recognised in profit or loss arepresented within finance costs, finance income or other financial items, except for impairmentof trade receivables which is presented within other expenses.
IAS 1.117(a) Loans and receivablesIAS 1.117(b) Loans and receivables are non-derivative financial assets with fixed or determinable payments
that are not quoted in an active market. After initial recognition, these are measured atamortised cost using the effective interest method, less provision for impairment. Discountingis omitted where the effect of discounting is immaterial. The Group’s cash and cash equivalents,trade and most other receivables fall into this category of financial instruments.
IFRS 7.B5(f) Individually significant receivables are considered for impairment when they are past dueor when other objective evidence is received that a specific counterparty will default.Receivables that are not considered to be individually impaired are reviewed for impairment ingroups, which are determined by reference to the industry and region of the counterparty andother shared credit risk characteristics. The impairment loss estimate is then based on recenthistorical counterparty default rates for each identified group.
IAS 1.117(a) Financial assets at FVTPLIAS 1.117(b) Financial assets at FVTPL include financial assets that are either classified as held for trading orIFRS 7.B5(a) that meet certain conditions and are designated at FVTPL upon initial recognition. All
derivative financial instruments fall into this category, except for those designated and effectiveas hedging instruments, for which the hedge accounting requirements apply (see below).
IFRS 7.B5(e) Assets in this category are measured at fair value with gains or losses recognised in profit orloss. The fair values of financial assets in this category are determined by reference to activemarket transactions or using a valuation technique where no active market exists.
Example Consolidated Financial Statements 2013 19
IAS 1.117(a) HTM investmentsIAS 1.117(b) HTM investments are non-derivative financial assets with fixed or determinable payments and
fixed maturity other than loans and receivables. Investments are classified as HTM if the Grouphas the intention and ability to hold them until maturity. The Group currently holds listedbonds designated into this category.
IFRS 7.B5(f) HTM investments are measured subsequently at amortised cost using the effective interestmethod. If there is objective evidence that the investment is impaired, determined by referenceto external credit ratings, the financial asset is measured at the present value of estimated futurecash flows. Any changes in the carrying amount of the investment, including impairmentlosses, are recognised in profit or loss.
IAS 1.117(a) AFS financial assetsIAS 1.117(b) AFS financial assets are non-derivative financial assets that are either designated to this categoryIFRS 7.B5(b) or do not qualify for inclusion in any of the other categories of financial assets. The Group’s
AFS financial assets include listed securities and debentures, and the equity investment in XY Ltd.
The equity investment in XY Ltd is measured at cost less any impairment charges, as its fair value cannot currently be estimated reliably. Impairment charges are recognised in profit or loss.
IAS 1.117(a) All other AFS financial assets are measured at fair value. Gains and losses are recognisedIAS 1.117(b) in other comprehensive income and reported within the AFS reserve within equity, except for
interest and dividend income, impairment losses and foreign exchange differences on monetaryassets, which are recognised in profit or loss. When the asset is disposed of or is determined tobe impaired, the cumulative gain or loss recognised in other comprehensive income isreclassified from the equity reserve to profit or loss. Interest calculated using the effectiveinterest method and dividends are recognised in profit or loss within finance income (see Note 4.7).
Reversals of impairment losses for AFS debt securities are recognised in profit or loss if thereversal can be objectively related to an event occurring after the impairment loss wasrecognised. For AFS equity investments impairment reversals are not recognised in profit lossand any subsequent increase in fair value is recognised in other comprehensive income.
IAS 1.117(b) Classification and subsequent measurement of financial liabilitiesThe Group’s financial liabilities include borrowings, trade and other payables and derivativefinancial instruments.
IAS 1.117(a) Financial liabilities are measured subsequently at amortised cost using the effective interestmethod, except for financial liabilities held for trading or designated at FVTPL, that are carriedsubsequently at fair value with gains or losses recognised in profit or loss. All derivativefinancial instruments that are not designated and effective as hedging instruments are accountedfor at FVTPL.
IAS 1.117(a) The Group has designated some financial liabilities at FVTPL to reduce significant IFRS 7.B5(a) measurement inconsistencies between investment properties in the United States and related
US-dollar bank loans with fixed interest rates. These investment properties are measured usingthe fair value model (see Note 4.16), where changes in the fair value of these assets arerecognised in profit or loss. The fair value of loans used to finance these assets correlatessignificantly with the valuation of the investment properties held by the Group, because bothmeasures are highly reactive to the market interest rate for 30-year government bonds. Theloans are managed and evaluated on a fair value basis through a quarterly management reviewin comparison with the investment property valuations. Therefore, the Group designates suchfixed interest rate loans as at FVTPL if they are secured by specific investment property assetsthat are held by the Group. This accounting policy reduces significantly what would otherwisebe an accounting mismatch.
IAS 1.117(b) All interest-related charges and, if applicable, changes in an instrument’s fair value that arereported in profit or loss are included within finance costs or finance income.

20 Example Consolidated Financial Statements 2013
Derivative financial instruments and hedge accountingIAS 1.117(b) Derivative financial instruments are accounted for at FVTPL except for derivatives designated
as hedging instruments in cash flow hedge relationships, which require a specific accountingtreatment. To qualify for hedge accounting, the hedging relationship must meet several strictconditions with respect to documentation, probability of occurrence of the hedged transactionand hedge effectiveness.
IFRS 7.22(a) For the reporting periods under review, the Group has designated certain forward currencyIFRS 7.22(c) contracts as hedging instruments in cash flow hedge relationships. These arrangements have
been entered into to mitigate currency exchange risk arising from certain legally binding salesand purchase orders denominated in foreign currency.
IAS 1.117(a) All derivative financial instruments used for hedge accounting are recognised initially at fairvalue and reported subsequently at fair value in the statement of financial position.
IAS 1.117(b) To the extent that the hedge is effective, changes in the fair value of derivatives designated ashedging instruments in cash flow hedges are recognised in other comprehensive income andincluded within the cash flow hedge reserve in equity. Any ineffectiveness in the hedgerelationship is recognised immediately in profit or loss.
At the time the hedged item affects profit or loss, any gain or loss previously recognised inother comprehensive income is reclassified from equity to profit or loss and presented as areclassification adjustment within other comprehensive income. However, if a non-financialasset or liability is recognised as a result of the hedged transaction, the gains and lossespreviously recognised in other comprehensive income are included in the initial measurementof the hedged item.
If a forecast transaction is no longer expected to occur any related gain or loss recognised inother comprehensive income is transferred immediately to profit or loss. If the hedgingrelationship ceases to meet the effectiveness conditions, hedge accounting is discontinued andthe related gain or loss is held in the equity reserve until the forecast transaction occurs.
4.18 InventoriesIAS 2.36(a) Inventories are stated at the lower of cost and net realisable value. Cost includes all expensesIAS 1.117(a) directly attributable to the manufacturing process as well as suitable portions of related
production overheads, based on normal operating capacity. Costs of ordinarily interchangeableitems are assigned using the first in, first out cost formula. Net realisable value is the estimatedselling price in the ordinary course of business less any applicable selling expenses.
4.19 Income taxesIAS 1.117(a) Tax expense recognised in profit or loss comprises the sum of deferred tax and current tax notIAS 1.117(b) recognised in other comprehensive income or directly in equity.
Current income tax assets and/or liabilities comprise those obligations to, or claims from,fiscal authorities relating to the current or prior reporting periods, that are unpaid at thereporting date. Current tax is payable on taxable profit, which differs from profit or loss in thefinancial statements. Calculation of current tax is based on tax rates and tax laws that have beenenacted or substantively enacted by the end of the reporting period.
Deferred income taxes are calculated using the liability method on temporary differencesbetween the carrying amounts of assets and liabilities and their tax bases. However, deferred taxis not provided on the initial recognition of goodwill, or on the initial recognition of an asset orliability unless the related transaction is a business combination or affects tax or accountingprofit. Deferred tax on temporary differences associated with investments in subsidiaries,associates and joint ventures is not provided if reversal of these temporary differences can becontrolled by the Group and it is probable that reversal will not occur in the foreseeable future.
Deferred tax assets and liabilities are calculated, without discounting, at tax rates that areexpected to apply to their respective period of realisation, provided those rates are enacted orsubstantively enacted by the end of the reporting period.
IAS 1.117(a) Deferred tax assets are recognised to the extent that it is probable that the underlying taxIAS 1.122 loss or deductible temporary difference will be utilised against future taxable income. This is
assessed based on the Group’s forecast of future operating results, adjusted for significant non-taxable income and expenses and specific limits on the use of any unused tax loss or credit.Deferred tax liabilities are always provided for in full.

Example Consolidated Financial Statements 2013 21
Deferred tax assets and liabilities are offset only when the Group has a right and intentionto set off current tax assets and liabilities from the same taxation authority.
IAS 1.117(b) Changes in deferred tax assets or liabilities are recognised as a component of tax income orexpense in profit or loss, except where they relate to items that are recognised in othercomprehensive income (such as the revaluation of land) or directly in equity, in which case therelated deferred tax is also recognised in other comprehensive income or equity, respectively.
4.20 Cash and cash equivalentsIAS 7.46 Cash and cash equivalents comprise cash on hand and demand deposits, together with other
short-term, highly liquid investments that are readily convertible into known amounts of cashand which are subject to an insignificant risk of changes in value.
4.21 Non-current assets and liabilities classified as held for sale and discontinuedoperations
IAS 1.117(a) When the Group intends to sell a non-current asset or a group of assets (a disposal group), andif sale within 12 months is highly probable, the asset or disposal group is classified as held forsale and presented separately in the statement of financial position. Liabilities are classified asheld for sale and presented as such in the statement of financial position if they are directlyassociated with a disposal group.
IAS 1.117(b) Assets classified as held for sale are measured at the lower of their carrying amountsimmediately prior to their classification as held for sale and their fair value less costs to sell.However, some held for sale assets such as financial assets or deferred tax assets, continue to bemeasured in accordance with the Group’s relevant accounting policy for those assets. Onceclassified as held for sale, the assets are not subject to depreciation or amortisation.
Any profit or loss arising from the sale or remeasurement of discontinued operations is presented as part of a single line item, profit or loss from discontinued operations (see Note 4.10).
4.22 Equity, reserves and dividend paymentsIAS 1.79(b) Share capital represents the nominal value of shares that have been issued.
Share premium includes any premiums received on issue of share capital. Any transactioncosts associated with the issuing of shares are deducted from share premium, net of any relatedincome tax benefits.
Other components of equity include the following:• revaluation reserve – comprises gains and losses from the revaluation of land (see Note 4.13)• remeasurement of net defined benefit liability – comprises the actuarial losses from changes
in demographic and financial assumptions and the return on plan assets (see Note 4.23)• translation reserve – comprises foreign currency translation differences arising from the
translation of financial statements of the Group’s foreign entities into CU (see Note 4.5)• reserves for AFS financial assets and cash flow hedges – comprises gains and losses relating
to these types of financial instruments (see Note 4.17).
Retained earnings includes all current and prior period retained profits and share-basedemployee remuneration (see Note 4.24).
All transactions with owners of the parent are recorded separately within equity.Dividend distributions payable to equity shareholders are included in other liabilities when
the dividends have been approved in a general meeting prior to the reporting date.
4.23 Post-employment benefits and short-term employee benefitsPost-employment benefit plans
IAS 1.117(b) The Group provides post-employment benefits through various defined contribution anddefined benefit plans

22 Example Consolidated Financial Statements 2013
Defined contribution plansThe Group pays fixed contributions into independent entities in relation to several state plansand insurances for individual employees. The Group has no legal or constructive obligations topay contributions in addition to its fixed contributions, which are recognised as an expense inthe period that relevant employee services are received.
Defined benefit plansUnder the Group’s defined benefit plans, the amount of pension benefit that an employee willreceive on retirement is defined by reference to the employee’s length of service and final salary.The legal obligation for any benefits remains with the Group, even if plan assets for funding thedefined benefit plan have been set aside. Plan assets may include assets specifically designated toa long-term benefit fund as well as qualifying insurance policies.
The liability recognised in the statement of financial position for defined benefit plans is thepresent value of the defined benefit obligation (DBO) at the reporting date less the fair value ofplan assets.
IAS 1.117(a) Management estimates the DBO annually with the assistance of independent actuaries.This is based on standard rates of inflation, salary growth rate and mortality. Discount factorsare determined close to each year-end by reference to high quality corporate bonds that aredenominated in the currency in which the benefits will be paid and that have terms to maturityapproximating to the terms of the related pension liability.
IAS 19.120 Service cost on the net defined benefit liability is included in employee benefits expense.Net interest expense on the net defined benefit liability is included in finance costs.
Short-term employee benefitsShort-term employee benefits, including holiday entitlement, are current liabilities included inpension and other employee obligations, measured at the undiscounted amount that the Groupexpects to pay as a result of the unused entitlement.
4.24 Share-based employee remunerationIAS 1.117(b) The Group operates equity-settled share-based remuneration plans for its employees. None of
the Group’s plans are cash-settled.IAS 1.117(a) All goods and services received in exchange for the grant of any share-based payment are
measured at their fair values. Where employees are rewarded using share-based payments, thefair value of employees’ services is determined indirectly by reference to the fair value of theequity instruments granted. This fair value is appraised at the grant date and excludes theimpact of non-market vesting conditions (for example profitability and sales growth targets andperformance conditions).
All share-based remuneration is ultimately recognised as an expense in profit or loss with acorresponding credit to retained earnings . If vesting periods or other vesting conditions apply,the expense is allocated over the vesting period, based on the best available estimate of thenumber of share options expected to vest.
Non-market vesting conditions are included in assumptions about the number of optionsthat are expected to become exercisable. Estimates are subsequently revised if there is anyindication that the number of share options expected to vest differs from previous estimates.Any cumulative adjustment prior to vesting is recognised in the current period. No adjustmentis made to any expense recognised in prior periods if share options ultimately exercised aredifferent to that estimated on vesting.
Upon exercise of share options, the proceeds received net of any directly attributabletransaction costs up to the nominal value of the shares issued are allocated to share capital withany excess being recorded as share premium.
4.25 Provisions, contingent assets and contingent liabilitiesIAS 1.117(b) Provisions for product warranties, legal disputes, onerous contracts or other claims are
recognised when the Group has a present legal or constructive obligation as a result of a pastevent, it is probable that an outflow of economic resources will be required from the Groupand amounts can be estimated reliably. Timing or amount of the outflow may still be uncertain.
Guidance note: Share-basedemployeeremunerationIFRS 2 ‘Share-basedPayment’ does notstipulate where in equitythe credit entry in anequity-settled share-based paymenttransaction should berecognised. It isacceptable for thecredit to be taken toretained earnings,however, this is subjectto national law.Alternatively, it could betaken to a separateequity reserve. Theaccounting uponexercise of the shareoptions may alsodepend on applicablenational law relating toshare capital.

Example Consolidated Financial Statements 2013 23
Restructuring provisions are recognised only if a detailed formal plan for the restructuringexists and management has either communicated the plan’s main features to those affected orstarted implementation. Provisions are not recognised for future operating losses.
IAS 1.117(a) Provisions are measured at the estimated expenditure required to settle the presentobligation, based on the most reliable evidence available at the reporting date, including therisks and uncertainties associated with the present obligation. Where there are a number ofsimilar obligations, the likelihood that an outflow will be required in settlement is determinedby considering the class of obligations as a whole. Provisions are discounted to their presentvalues, where the time value of money is material.
Any reimbursement that the Group can be virtually certain to collect from a third partywith respect to the obligation is recognised as a separate asset. However, this asset may notexceed the amount of the related provision.
IAS 1.117(a) No liability is recognised if an outflow of economic resources as a result of presentobligations is not probable. Such situations are disclosed as contingent liabilities unless theoutflow of resources is remote.
4.26 Significant management judgement in applying accounting policies and estimation uncertainty
IAS 1.122 When preparing the financial statements, management makes a number of judgements,estimates and assumptions about the recognition and measurement of assets, liabilities, incomeand expenses.
Significant management judgementThe following are significant management judgements in applying the accounting policies ofthe Group that have the most significant effect on the financial statements.
Recognition of service and construction contract revenuesDetermining when to recognise revenues from after-sales services requires an understanding ofthe customer’s use of the related products, historical experience and knowledge of the market.Recognising construction contract revenue also requires significant judgment in determiningmilestones, actual work performed and the estimated costs to complete the work (see Note 4.7).
Capitalisation of internally developed softwareDistinguishing the research and development phases of a new customised software project anddetermining whether the recognition requirements for the capitalisation of development costsare met requires judgement. After capitalisation, management monitors whether therecognition requirements continue to be met and whether there are any indicators thatcapitalised costs may be impaired (see Note 4.12).
Recognition of deferred tax assetsThe extent to which deferred tax assets can be recognised is based on an assessment of theprobability of the Group’s future taxable income against which the deductible temporarydifferences can be utilised. In addition, significant judgement is required in assessing the impactof any legal or economic limits or uncertainties in various tax jurisdictions (see Note 4.19).
Control assessmentSee Note 6.1.
IAS 1.125 Estimation uncertaintyInformation about estimates and assumptions that have the most significant effect onrecognition and measurement of assets, liabilities, income and expenses is provided below.Actual results may be substantially different.

24 Example Consolidated Financial Statements 2013
Impairment of non-financial assets and goodwillIn assessing impairment, management estimates the recoverable amount of each asset or cash-generating units based on expected future cash flows and uses an interest rate to discount them.Estimation uncertainty relates to assumptions about future operating results and thedetermination of a suitable discount rate (see Note 4.15). In 2013, the Group recognised animpairment loss on goodwill (see Note 9) and internally generated software (see Note 10).
Useful lives of depreciable assetsManagement reviews its estimate of the useful lives of depreciable assets at each reporting date,based on the expected utility of the assets. Uncertainties in these estimates relate to technicalobsolescence that may change the utility of certain software and IT equipment.
InventoriesManagement estimates the net realisable values of inventories, taking into account the mostreliable evidence available at each reporting date. The future realisation of these inventories maybe affected by future technology or other market-driven changes that may reduce future sellingprices.
Business combinationsManagement uses valuation techniques in determining the fair values of the various elements ofa business combination (see Note 4.3). Particularly, the fair value of contingent consideration isdependent on the outcome of many variables including the acquirees’ future profitability (seeNote 5.1).
Construction contract revenueRecognised amounts of construction contract revenues and related receivables reflectmanagement’s best estimate of each contract’s outcome and stage of completion. For morecomplex contracts in particular, costs to complete and contract profitability are subject tosignificant estimation uncertainty (see Note 4.7).
Defined benefit obligation (DBO)Management’s estimate of the DBO is based on a number of critical underlying assumptionssuch as standard rates of inflation, mortality, discount rate and anticipation of future salaryincreases. Variation in these assumptions may significantly impact the DBO amount and theannual defined benefit expenses (as analysed in Note 21.3).
Fair value measurementManagement uses valuation techniques to determine the fair value of financial instruments(where active market quotes are not available) and non-financial assets. This involvesdeveloping estimates and assumptions consistent with how market participants would price theinstrument. Management bases its assumptions on observable data as far as possible but this isnot always available. In that case management uses the best information available. Estimatedfair values may vary from the actual prices that would be achieved in an arm’s lengthtransaction at the reporting date (see Note 33).
5. Acquisitions and disposals5.1 Acquisition of Goodtech GmbH in 2013
IFRS 3.B64(a-d)On 31 March 2013, the Group acquired 100% of the equity instruments of Goodtech GmbH(Goodtech), a Hamburg (Euroland) based business, thereby obtaining control. The acquisitionwas made to enhance the Group’s position in the on-line retail market for computer andtelecommunications hardware in Euroland. Goodtech is a significant business in Euroland inthe Group’s targeted market.

Example Consolidated Financial Statements 2013 25
The details of the business combination are as follows:
CU’000IFRS 3.B64(f) Fair value of consideration transferredIFRS 3.B64(f)(i) Amount settled in cash 16,058
IFRS 3.B64(f)(iii) Fair value of contingent consideration 600
IAS 7.40(a) Total 16,658
IFRS 3.B64(i) Recognised amounts of identifiable net assetsIAS 7.40(d) Property, plant and equipment 4,622
Intangible assets 5,255
Investments accounted for using the equity method 345
Investment property 75
Total non-current assets 10,297
Inventories 8,995
Trade and other receivables 7,792
Cash and cash equivalents 567
Total current assets 17,354
Borrowings (3,478)
Deferred tax liabilities (632)
Total non-current liabilities (4,110)
Provisions (1,320)
Other liabilities (2,312)
Trade and other payables (5,689)
Total current liabilities (9,321)
Identifiable net assets 14,220
Goodwill on acquisition 2,438
IAS 7.40(b) Consideration transferred settled in cash 16,058
IAS 7.40(c) Cash and cash equivalents acquired (567)
IAS 7.42 Net cash outflow on acquisition 15,491Acquisition costs charged to expenses 223
Net cash paid relating to the acquisition 15,714
Consideration transferredIFRS 3.B64(f)(i) The acquisition of Goodtech was settled in cash amounting to CU 16,058,000. IFRS 3.B64 The purchase agreement included an additional consideration of CU 1,310,000, payable(g)(i-iii) only if the average profits of Goodtech for 2013 and 2014 exceed a target level agreed by both
parties. The additional consideration will be paid on 1 April 2015. The CU 600,000 fair value ofthe contingent consideration liability initially recognised represents the present value of theGroup’s probability-weighted estimate of the cash outflow. It reflects management’s estimate of a 50% probability that the targets will be achieved and is discounted using an interest rate of 4.4%.
IFRS 3.B67 As at 31 December 2013, there have been no changes in the estimate of the probable cash (b)(i-iii) outflow but the liability has increased to CU 620,000 due to the unwinding of the discount.IFRS 3.B64(m) Acquisition-related costs amounting to CU 223,000 are not included as part of
consideration transferred and have been recognised as an expense in the consolidated statementof profit or loss, as part of other expenses.
IFRS 3.B64 Identifiable net assets(h)(i-iii) The fair value of the trade and other receivables acquired as part of the business combination
amounted to CU 7,792,000, with a gross contractual amount of CU 7,867,000. As of theacquisition date, the Group’s best estimate of the contractual cash flow not expected to becollected amounted to CU 75,000.
Guidance note: Fair value ofcontingentconsiderationThe determination of theacquisition-date fairvalue of the contingentconsideration shouldconsider the expectedoutcome of thecontingency. Thisexample illustrates onepossible approach inestimating the fair valueof contingentconsideration.

26 Example Consolidated Financial Statements 2013
GoodwillIFRS 3.64(e) Goodwill of CU 2,438,000 is primarily related to growth expectations, expected futureIAS 36.133 profitability, the substantial skill and expertise of Goodtech’s workforce and expected costIFRS 3.B64(k) synergies. Goodwill has been allocated to the retail segment and is not expected to be
deductible for tax purposes.
Goodtech’s contribution to the Group resultsIFRS 3.B64 Goodtech incurred a loss of CU 20,000 for the 9 months from 31 March 2013 to the reporting(q)(i-ii) date, primarily due to integration costs.
If Goodtech had been acquired on 1 January 2013, revenue of the Group for 2013 wouldhave been CU 212 million, and profit for the year would have increased by CU 350,000.
5.2 Acquisition of Good Buy Inc. in 2012IFRS 3.B64 On 30 June 2012, the Group acquired 100% of the equity instruments of Good Buy Inc.(a-d) (Good Buy), a Delaware (USA) based business, thereby obtaining control. The acquisition of
Good Buy was made to enhance the Group’s position as an on-line retailer for computer andtelecommunications hardware in the US market.
The details of the business combination are as follows:
CU’000IFRS 3.B64(f) Fair value of consideration transferredIFRS 3.B64(f)(i) Amount settled in cash 12,420
IAS 7.40(a/d) Recognised amounts of identifiable net assetsIFRS 3.B64(i) Property, plant and equipment 3,148
IAS 7.40(d) Intangible assets 3,005
Total non-current assets 6,153
Inventories 5,469
Trade and other receivables 5,200
Cash and cash equivalents 345
Total current assets 11,014
Deferred tax liabilities (435)
Non-current liabilities (435)
Provisions (1,234)
Other liabilities (657)
Trade and other payables (4,990)
Total current liabilities (6,881)
Identifiable net assets 9,851
Goodwill on acquisition 2,569
IAS 7.40(b) Consideration transferred settled in cash 12,420
IAS 7.40(c) Cash and cash equivalents acquired (345)
IAS 7.42 Net cash outflow on acquisition 12,075Acquisition costs charged to expenses 76
Net cash paid relating to the acquisition 12,151
Consideration transferredIFRS 3.B64(f)(i) The acquisition of Good Buy was settled in cash amounting to CU 12,420,000.IFRS 3.B64(m) Acquisition-related costs amounting to CU 76,000 are not included as part of consideration
transferred and have been recognised as an expense in the consolidated statement of profit orloss, as part of other expenses.

Example Consolidated Financial Statements 2013 27
Identifiable net assetsIFRS 3.B64 The fair value of the trade and other receivables acquired as part of the business combination(h)(i-iii) amounted to CU 5,200,000, with a gross contractual amount of CU 5,350,000. As of the
acquisition date, the Group’s best estimate of the contractual cash flow not expected to becollected amounted to CU 150,000.
GoodwillIFRS 3.B64(e) Goodwill of CU 2,569,000 is primarily related to the sales force and the sales know-how of key IAS 36.133 personnel of Good Buy. Goodwill has been allocated to the retail segment and is not expectedIFRS 3.B64(k) to be deductible for tax purposes.
Good Buy’s contribution to the Group resultsIFRS 3.B64 Good Buy contributed CU 400,000 to the consolidated profit for the 6 months from 1 July(q)(i-ii) 2012 to 31 December 2012. If Good Buy had been acquired on 1 January 2012, revenue of the
Group for 2012 would have been CU 196,000,000. However, due to lack of IFRS-specific dataprior to the acquisition of Good Buy, pro-forma profit or loss of the combined entity for thecomplete 2012 reporting period cannot be determined reliably.
5.3 Disposal of Highstreet Ltd in 2013See Note 6.3 below.
6. Interests in subsidiaries6.1 Composition of the Group
IFRS 12.10(a)(i) Set out below details of the subsidiaries held directly by the Group:IFRS 12.12
Name of the Country of Principal activity Proportion of ownershipSubsidiary incorporation interests held by the Group
and principal place of business 31 Dec 2013 31 Dec 2012
Goodtech GmbH Euroland On-line retailer of computer and 100% –
telecommunications hardware
Good Buy Inc. USA On-line retailer of computer and 100% 100%
telecommunications hardware
Tech Squad Ltd Euroland Design and sale of phone and 80% 80%
intranet applications
Data Corp UK On-line sales of hardware and 100% 100%
software products
Highstreet Ltd UK Design and sale of phone and – 100%
intranet applications
Significant judgements and assumptionsIFRS 12.9 The Group holds 45% of the ordinary shares and voting rights in Equipe Consultants S.A.
(Equipe). Two other investors each hold 15%. The remaining 25% is held by several otherunrelated investors, none of whom own more than 2% individually. There are no arrangementsfor the other shareholders to consult one another or act collectively and past experienceindicates that few of the other owners actually exercise their voting rights at all. The Group hasappointed four of Equipe’s Board of Directors out of a total of eleven.
IFRS 10.B41 Management has reassessed its involvement in Equipe in accordance with IFRS 10’s revised-B46 control definition and guidance. It has concluded that it has significant influence but not
outright control. In making its judgement, management considered the Group’s voting rights,the relative size and dispersion of the voting rights held by other shareholders and the extent ofrecent participation by those shareholders in general meetings. Recent experience demonstratesthat sufficient of the smaller shareholders participate such that they, along with the two othermain shareholders, prevent the Group from having the practical ability to direct the relevantactivities of Equipe unilaterally.

28 Example Consolidated Financial Statements 2013
6.2 Subsidiary with material non-controlling interestsIFRS 12.12 The Group includes one subsidiary, Tech Squad Ltd, with material non-controlling
interests (NCI):
Name Proportion of ownership Profit allocated to NCI Accumulated NCIinterests and voting rights held by the NCI31 Dec 31 Dec 31 Dec 31 Dec 31 Dec 31 Dec2013 2012 2013 2012 2013 2012
CU’000 CU’000 CU’000 CU’000Tech Squad Ltd 20% 20% 121 116 713 592
IFRS 12.B10(a) No dividends were paid to the NCI during the years 2013 and 2012. IFRS 12.12(g) Summarised financial information for Tech Squad Ltd, before intragroup eliminations,IFRS 12.B10(b) is set out below:
2013 2012CU’000 CU’000
Non-current assets 5,019 5,182
Current assets 3,924 3,452
Total assets 8,943 8,634
Non-current liabilities (3,806) (3,402)
Current liabilities (1,561) (2,268)
Total liabilities (5,367) (5,670)
Equity attributable to owners of the parent 2,863 2,372
Non-controlling interests 713 592
2013 2012CU’000 CU’000
Revenue 7,658 7,116
Profit for the year attributable to owners of the parent 479 464
Profit for the year attributable to NCI 121 116
Profit for the year 600 580
Other comprehensive income for the year (all attributable to owners of the parent) 6 4
Total comprehensive income for the year attributable to owners of the parent 485 468
Total comprehensive income for the year attributable to NCI 121 116
Total comprehensive income for the year 606 584
2013 2012CU’000 CU’000
Net cash from operating activities 957 779
Net cash used in investing activities (531) (673)
Net cash from (used in) financing activities 446 (61)
Net cash inflow 872 45
6.3 Losing control over a subsidiary during the reporting period IAS 7.40(b) On 30 September 2013, the Group disposed of its 100% equity interest in its subsidiary,IAS 7.40(d) Highstreet Ltd (Highstreet). The subsidiary was classified as held for sale in the 2012 financial
statements (see Note 19).
Guidance note: Subsidiary withmaterial non-controlling interestsFor the purpose of thisPublication it isassumed that the NCIare material to theGroup.
Guidance note: Summarised financialinformationThe summarisedfinancial informationdisclosed should besufficient to enableusers to understand theinterests that NCI havein the Group’s activitiesand cash flows. Thismight include but is notlimited to thedisclosures providedhere (IFRS 12.B10(b)).

Example Consolidated Financial Statements 2013 29
The consideration was received in 2013. At the date of disposal, the carrying amounts ofHighstreet’s net assets were as follows:
CU’000Property, plant and equipment 2,475
Total non-current assets 2,475
Inventories 1,121
IAS 7.40(c) Cash and cash equivalents –
Total current assets 1,121
Provisions (232)
Borrowings (8)
Trade and other payables (210)
Total current liabilities (450)
Total net assets 3,146
IAS 7.40(a) Total consideration received in cash 3,117
Cash and cash equivalents disposed of –
IAS 7.42 Net cash received 3,117
IFRS 10.25 Loss on disposal (29)
IFRS 12.19(b) The loss on disposal is included in the loss for the year from discontinued operations in theconsolidated statement of profit or loss. See Note 19.
6.4 Interests in unconsolidated structured entities IFRS 12.24 The Group has no interests in unconsolidated structured entities.
7. Investments accounted for using the equity method7.1 Investment in joint venture
IFRS 12.21(a) The Group has one material joint venture, Halftime Ltd (Halftime):
Name of the Country of Principal activity Proportion of ownershipjoint venture incorporation interests held by the Group
and principal place of business 31 Dec 2013 31 Dec 2012
Halftime Ltd UK On-line sales of hardware and 50% 50%
software products
IFRS 12.21(b)(i) The investment in Halftime is accounted for using the equity method in accordance with IAS 28.IFRS 12.21(b)(ii) Summarised financial information for Halftime is set out below:IFRS 12.B12-B13
2013 2012CU’000 CU’000
Non-current assets 838 500
Current assets (a) 528 380
Total assets 1,366 880
Non-current liabilities (b) (240) (298)
Current liabilities (c) (160) (138)
Total liabilities (400) (436)
(a) Includes cash and cash equivalents 60 80
(b) Includes financial liabilities (excluding trade and other payables and provisions) (100) –
(c) Includes financial liabilities (excluding trade and other payables and provisions) (80) –

30 Example Consolidated Financial Statements 2013
2013 2012CU’000 CU’000
Revenue 1,200 730
Profit for the year 522 258
Other comprehensive income for the year – –
Total comprehensive income for the year 522 258
Depreciation and amortisation 30 20
Interest income 1 –
Interest expenses 4 –
Tax expense 68 58
IFRS 12.B14 A reconciliation of the above summarised financial information to the carrying amount of theinvestment in Halftime is set out below:
2013 2012CU’000 CU’000
Total net assets of Halftime 966 444
Proportion of ownership interests held by the Group 50% 50%
Carrying amount of the investment in Halftime 483 222
IFRS 12.B12(a) No dividends were received from Halftime during the years 2013 and 2012.IFRS 12.21 Halftime is a private company, therefore no quoted market prices are available for its shares.(b)(iii)
7.2 Investments in associatesIFRS 12.21(c) The Group has a 45% equity interest in Equipe and a 30% equity interest in Shopmore IFRS 12.B16 GmbH. Neither associate is individually material to the Group.
Summarised aggregated financial information of the Group’s share in these associates:
2013 2012CU’000 CU’000
Profit from continuing operations 130 12
Other comprehensive income 2 –
Total comprehensive income 132 12
Aggregate carrying amount of the Group’s interests in these associates 377 245

Example Consolidated Financial Statements 2013 31
8. Segment reportingIFRS 8.22(a) Management currently identifies the Group’s three service lines as its operating segments (see
Note 4.6). These operating segments are monitored by the Group’s chief operating decisionmaker and strategic decisions are made on the basis of adjusted segment operating results.
IFRS 8.16 In addition, two minor operating segments are combined below under other segments. Themain sources of revenue for this segment is the sale and disposal of used IT equipment that theGroup collects from its customers.
Segment information for the reporting period is as follows:
Consulting Service Retail Other Total2013 2013 2013 2013 2013
CU’000 CU’000 CU’000 CU’000 CU’000Revenue
IFRS 8.23(a) From external customers 110,810 18,140 72,098 4,079 205,127
Discontinued operations – – 9,803 – 9,803
IFRS 8.23(b) From other segments 231 – – – 231
Segment revenues 111,041 18,140 81,901 4,079 215,161
Changes in inventories (4,794) – (3,129) – (7,923)
IFRS 8.23(f) Costs of material (17,368) (5,442) (22,040) (1,397) (46,247)
Employee benefits expense (54,224) (10,863) (46,359) (2,447) (113,893)
IFRS 8.23(e) Depreciation and amortisation of non-financial assets (3,388) (555) (2,205) (125) (6,273)
IAS 36.129(a) Impairment of non-financial assets (1,669) – – – (1,669)
Other expenses (9,446) (30) (1,333) (10) (10,819)
IFRS 8.23 Segment operating profit 20,152 1,250 6,835 100 28,337
IFRS 8.23 Segment assets 68,103 11,149 44,311 2,507 126,070
Consulting Service Retail Other Total2012 2012 2012 2012 2012
(Restated)CU’000 CU’000 CU’000 CU’000 CU’000
RevenueIFRS 8.23(a) From external customers 109,302 17,832 59,310 4,121 190,565
Discontinued operations – – 11,015 – 11,015
IFRS 8.23(b) From other segments 110 – – – 110
Segment revenues 109,412 17,832 70,325 4,121 201,690
Changes in inventories (3,394) – (2,229) – (5,623)
IFRS 8.23(f) Costs of material (18,466) (5,350) (19,197) (1,319) (44,332)
Employee benefits expense (56,277) (10,498) (38,997) (2,473) (108,245)
IFRS 8.23(e) Depreciation and amortisation of non-financial assets (3,585) (587) (2,332) (132) (6,636)
IAS 36.129(a) Impairment of non-financial assets (190) – – – (190)
Other expenses (9,203) (100) (1,761) (20) (11,084)
IFRS 8.23 Segment operating profit 18,297 1,297 5,809 177 25,580
IFRS 8.23 Segment assets 51,615 8,450 33,583 1,900 95,548
The Group’s revenues from external customers and its non-current assets (other than financialinstruments, investments accounted for using the equity method, deferred tax assets and post-employment benefit assets) are divided into the following geographical areas:
Guidance note: Segment reportingIFRS 8 requires theamount of eachoperating segment itemto be disclosed usingthe measures reportedto the chief operatingdecision maker (iebased on internalmanagementinformation). Thedisclosures in theExample financialstatements aretherefore based onsubstantial assumptions(eg there is no measureof segment liabilitiesregularly reported to thechief operating decisionmaker), and so cannotbe viewed as the onlyacceptable way ofproviding segmentdisclosures. It istherefore important toemphasise thatsegment reportingshould be tailored onthe basis of the entity’sinternal managementreporting.

32 Example Consolidated Financial Statements 2013
2013 2012(Restated)
CU’000 CU’000IFRS 8.33(a) Revenue Non- Revenue Non-
current currentassets assets
IFRS 8.33(b) Euroland (domicile) 164,102 46,053 152,452 40,242
United Kingdom 20,513 5,757 19,057 5,030
USA 18,461 5,181 17,151 4,527
Other countries 1,651 575 1,540 503
Total 204,727 57,566 190,200 50,302
IFRS 8.33(a) Revenues from external customers in the Group’s domicile, Euroland, as well as its majormarkets, the United Kingdom and the USA, have been identified on the basis of the customer’sgeographical location. Non-current assets are allocated based on their physical location. Theabove table does not include discontinued operations (disposal groups), for which revenue andassets can be attributed to Euroland.
IFRS 8.34 During 2013, CU 24,744,000 or 12% (2012: CU 21,076,000 or 11%) of the Group’srevenues depended on a single customer in the consulting segment.
The totals presented for the Group’s operating segments reconcile to the key financialfigures as presented in its financial statements as follows:
2013 2012(Restated)
CU’000 CU’000IFRS 8.28(a) Revenues
Total reportable segment revenues 211,082 197,569
Other segment revenues 3,679 3,756
Rental income from investment property 1,066 1,028
Discontinued operations (9,803) (11,015)
Elimination of intersegment revenues (231) (110)
Group revenues 205,793 191,228
IFRS 8.28(b) Profit or lossTotal reportable segment operating profit 28,237 25,403
Other segment profit 100 177
Rental income from investment property 1,066 1,028
Change in fair value of investment property 310 175
Share-based payment expenses (298) (466)
Post-employment benefit expenses (6,099) (6,373)
Research and development costs (1,690) (1,015)
Other income not allocated 427 483
Other expenses not allocated (368) (185)
Operating profit of discontinued operations (73) (106)
Elimination of intersegment profits (58) (27)
Group operating profit 21,554 19,094
Share of profits from equity accounted investments 391 141
Finance costs (1,490) (1,876)
Finance income 994 793
Other financial items 943 1,182
Group profit before tax 22,392 19,334

Example Consolidated Financial Statements 2013 33
2013 2012(Restated)
CU’000 CU’000IFRS 8.28(c) Assets
Total reportable segment assets 123,563 93,648
Other segment assets 2,507 1,900
Group headquarters 3,967 2,073
Investment property 12,662 12,277
Illustrative Research Lab 5,101 2,665
Other assets 3,281 2,264
Consolidation (1,134) (592)
Group assets 149,947 114,235
IFRS 8.28 Unallocated operating income and expense mainly consist of research expenditure as well as post-employment benefits expenses. The Group’s corporate assets, consisting of itsheadquarters, investment properties and research facility, are not allocated to any segment’s assets.
IFRS 8.32 An analysis of the Group’s revenue for each major product and service category (excludingIAS 18.35(b) revenue from discontinued operations) is as follows:
2013 2012(Restated)
CU’000 CU’000IFRS 8.32 Sale of hardware 47,585 39,145
Sale of software 24,513 20,165
Other 3,679 3,756
IAS 18.35(b)(i) Sale of goods 75,777 63,066
After-sales service and maintenance 18,140 17,832
Consulting 59,837 60,116
IAS 11.39(a) Construction contracts for telecommunication systems 50,973 49,186
IAS 40.75(f) Rental income 1,066 1,028
IAS 18.35(b)(ii) Rendering of services 130,016 128,162
Group revenue 205,793 191,228
9. GoodwillIFRS 3.B67(d) The movements in the net carrying amount of goodwill are as follows:
2013 2012CU’000 CU’000
IFRS 3.B67(d) Gross carrying amountIFRS 3.B67(d)(i) Balance 1 January 3,727 1,234
IFRS 3.B67(d)(ii) Acquired through business combination 2,438 2,569
IFRS 3.B67
(d)(vi) Net exchange difference (135) (76)
IFRS 3.B67
(d)(viii) Balance 31 December 6,030 3,727
Accumulated impairmentIFRS 3.B67(d)(i) Balance 1 January (190) –
IFRS 3.B67 Impairment loss recognised
(d)(v) (799) (190)
IFRS 3.B67 Net exchange difference – –
(d)(vi)
IFRS 3.B67
(d)(viii) Balance 31 December (989) (190)
Carrying amount at 31 December 5,041 3,537

34 Example Consolidated Financial Statements 2013
Impairment testingIAS 36.134 For the purpose of annual impairment testing, goodwill is allocated to the operating segments
expected to benefit from the synergies of the business combinations in which the goodwillarises, as follows:
2013 2012CU’000 CU’000
I AS 36.134(a) Retail 4,796 2,493
Consulting 245 1,044
Goodwill at 31 December 5,041 3,537
IAS 36.134 The recoverable amount of each segment was determined based on value-in-use calculations,(c)-(d) covering a detailed three-year forecast, followed by an extrapolation of expected cash flows for IAS 36.130(e) the remaining useful lives using growth rates determined by management. The recoverable
amount of each operating segment is set out below:
2013 2012CU’000 CU’000
Retail 41,835 30,679
Consulting 62,562 48,354
The present value of the expected cash flows of each segment is determined by applying asuitable discount rate.
IAS 36.134 Growth rates Discount rates(d)(iv-v) 2013 2012 2013 2012
Retail 3.0% 3.0% 9.3% 9.5%
Consulting 0.1% 0.5% 10.9% 10.1%
Growth ratesThe growth rates reflect the long-term average growth rates for the product lines and industriesof the segments (all publicly available). The growth rate for online retailing exceeds the overalllong-term average growth rates for Euroland because this sector is expected to continue togrow at above-average rates for the foreseeable future.
Discount ratesThe discount rates reflect appropriate adjustments relating to market risk and specific riskfactors of each segment.
Cash flow assumptionsRetail segment
IAS 36.134(d)(i)Management’s key assumptions include stable profit margins, based on past experience in thisIAS 36.134(d)(ii)market. The Group’s management believes that this is the best available input for forecasting
this mature market. Cash flow projections reflect stable profit margins achieved immediatelybefore the budget period. No expected efficiency improvements have been taken into accountand prices and wages reflect publicly available forecasts of inflation for the industry.
Consulting segmentIAS 36.130(a) The forecast was adjusted in 2012 for the decline in consulting services related to conventional IAS 36.130(d) telecommunication solutions. The market shifted considerably towards inter- and intranetIAS 36.134(d)(i) based solutions during 2012 and continued in 2013. As a result, management expects lowerIAS 36.134(d)(ii)growth and moderately declining profit margins for this segment.
Impairment testing, taking into account these latest developments, resulted in the furtherreduction of goodwill in 2013 to its recoverable amount. See Note 10 for the related impairmentof other intangible assets.

Example Consolidated Financial Statements 2013 35
IAS 36.126(a) The related goodwill impairment loss of CU 799,000 in 2013 (2012: CU 190,000) was IAS 36.129(a) included within depreciation, amortisation and impairment of non-financial assets.IAS 36.130(b)/ Apart from the considerations in determining the value-in-use of the segments described(d)(ii) above, management is not currently aware of any other probable changes that would IAS 36.134(f) necessitate changes in its key estimates. However, the estimate of recoverable amount for theIAS 1.125 consulting segment is particularly sensitive to the discount rate. If the discount rate used is
increased by 1%, a further impairment loss of CU 300,000 would have to be recognised, ofwhich CU 245,000 would be written off against goodwill and CU 55,000 against property,plant and equipment.
10. Other intangible assetsDetails of the Group’s other intangible assets and their carrying amounts are as follows:
Acquired Internally Brand Customer Total software developed names listslicences software CU’000 CU’000 CU’000 CU’000 CU’000
IAS 38.118 Gross carrying amountBalance at 1 January 2013 13,608 14,794 760 374 29,536
IAS 38.118(e)(i) Addition, separately acquired 440 – – – 440
Addition, internally developed – 3,306 – – 3,306
Acquisition through business combination 3,653 – 215 1,387 5,255
IAS 38.118
(e)(ii) Disposals (1,159) – – – (1,159)
IAS 38.118
(e)(vii) Net exchange differences (73) (54) – – (127)
Balance at 31 December 2013 16,469 18,046 975 1,761 37,251
Amortisation and impairmentBalance at 1 January 2013 (6,063) (9,381) (162) (89) (15,695)
IAS 38.118
(e)(vi) Amortisation (1,978) (1,315) (125) (110) (3,528)
IAS 38.118
(e)(iv) Impairment losses – (870) – – (870)
IAS 38.118
(e)(ii) Disposals 350 – – – 350
IAS 38.118
(e)(vii) Net exchange differences (48) (36) – – (84)
Balance at 31 December 2013 (7,739) (11,602) (287) (199) (19,827)
Carrying amount 31 December 2013 8,730 6,444 688 1,562 17,424

36 Example Consolidated Financial Statements 2013
Acquired Internally Brand Customer Total software developed names listslicences software CU’000 CU’000 CU’000 CU’000 CU’000
IAS 38.118 Gross carrying amountBalance at 1 January 2012 8,672 14,600 – – 23,272
IAS 38.118(e)(i) Addition, separately acquired 3,097 – – – 3,097
Addition, internally developed – 216 – – 216
Acquisition through business combination 1,859 – 768 378 3,005
IAS 38.118
(e)(vii) Net exchange differences (20) (22) (8) (4) (54)
Balance at 31 December 2012 13,608 14,794 760 374 29,536
Amortisation and impairmentBalance at 1 January 2012 (4,442) (8,166) – – (12,608)
IAS 38.118
(e)(vi) Amortisation (1,607) (1,201) (156) (87) (3,051)
IAS 38.118
(e)(vii) Net exchange differences (14) (14) (6) (2) (36)
Balance at 31 December 2012 (6,063) (9,381) (162) (89) (15,695)
Carrying amount 31 December 2012 7,545 5,413 598 285 13,841
IAS 38.126 Additions to internally developed software include capitalised borrowing costs of CU 80,000(2012: CU 78,000). In addition, research and development costs of CU 1,690,000 (2012: CU1,015,000) were recognised as other expenses.
IAS 36.130(b) An impairment loss of CU 870,000 (2012: Nil) was recognised for internally developedIAS 36.130(c)(i) software used to provide certain after-sales and maintenance services within the consultingIAS 36.130(c)(ii)segment (see Note 8). The recoverable amount of the asset is its value-in-use, determined basedIAS 36.130(a) on management’s expectation that the market will shift considerably towards other alternativeIAS 36.130(e) software products and will significantly reduce future revenues and profits in the next twoIAS 36.130(g) to three years (see Note 9 for the growth and discount rates used). Should the shift in the
market to other software products occur more rapidly, the carrying amount of the software ofCU 100,000 (2012: CU 970,000) would be reduced to CU Nil.
IAS 38.118(d) All amortisation and impairment charges are included within depreciation, amortisationIAS 36.126(a) and impairment of non-financial assets.IAS 38.122(e) During the year, the Group entered into an agreement to acquire enterprise resource
planning software, to support the planning and administration of the Group’s operations.Minimum contractual commitments resulting from this agreement are CU 97,000 payableduring 2014. No other material contractual commitments at 31 December 2013 (2012: None).

Example Consolidated Financial Statements 2013 37
11. Property, plant and equipmentDetails of the Group’s property, plant and equipment and their carrying amounts are as follows:
Land Buildings IT Other Total equipment equipment
CU’000 CU’000 CU’000 CU’000 CU’000Gross carrying amount
IAS 16.73(d) Balance 1 January 2013 7,697 19,362 5,579 2,334 34,972
IAS 16.73(e)(i) Additions – 76 – – 76
IAS 16.73(e)(iii) Acquisition through business combination 730 1,221 2,306 365 4,622
IAS 16.73(e)(ii) Disposals – (401) – – (401)
IAS 16.73(e)(iv) Revaluation increase 303 – – – 303
IAS 16.73
(e)(viii) Net exchange differences (21) (81) (79) (54) (235)
IAS 16.73(d) Balance 31 December 2013 8,709 20,177 7,806 2,645 39,337
Depreciation and impairmentIAS 16.73(d) Balance 1 January 2013 – (12,159) (1,503) (913) (14,575)
IAS 16.73(e)(ii) Disposals – 315 – – 315
IAS 16.73
(e)(viii) Net exchange differences – (54) (53) (36) (143)
IAS 16.73(e)(vii) Depreciation – (1,315) (890) (530) (2,735)
IAS 16.73(d) Balance 31 December 2013 – (13,213) (2,446) (1,479) (17,138)
Carrying amount 31 December 2013 8,709 6,964 5,360 1,166 22,199
Land Buildings IT Other Total equipment equipment(Restated)
CU’000 CU’000 CU’000 CU’000 CU’000Gross carrying amount
IAS 16.73(d) Balance 1 January 2012 7,697 23,067 4,316 966 36,046
IAS 16.73(e)(i) Additions – 1,001 1,390 890 3,281
IAS 16.73(e)(iii) Acquisition through business combination – – 2,310 838 3,148
IAS 16.73(e)(ii) Held for sale or included in disposal group – (4,598) (2,422) (348) (7,368)
IAS 16.73
(e)(viii) Net exchange differences – (108) (15) (12) (135)
IAS 16.73(d) Balance 31 December 2012 7,697 19,362 5,579 2,334 34,972
Depreciation and impairmentIAS 16.73(d) Balance 1 January 2012 – (12,944) (1,805) (551) (15,300)
IAS 16.73
(e)(viii) Net exchange differences – (72) (10) (8) (90)
IAS 16.73(e)(ii) Held for sale or included in disposal group – 3,200 990 200 4,390
IAS 16.73(e)(vii) Depreciation – (2,343) (678) (554) (3,575)
IAS 16.73(d) Balance 31 December 2012 – (12,159) (1,503) (913) (14,575)
Carrying amount 31 December 2012 7,697 7,203 4,076 1,421 20,397
IAS 36.126(a) All depreciation and impairment charges are included within depreciation, amortisation and IAS 36.126(b) impairment of non-financial assets. IAS 16.74(a) Land and buildings have been pledged as security for the Group’s other bank borrowings
(see Note 14.6).IAS 16.74(c) The Group has a contractual commitment to acquire IT equipment of CU 1,304,000
payable in 2014. There were no other material contractual commitments to acquire property,plant and equipment at 31 December 2013 (2012: None).

38 Example Consolidated Financial Statements 2013
IAS 16.77(e) If the cost model had been used, the carrying amounts of the revalued land, including theIAS 16.77(f) fair value adjustment upon acquisition of Goodtech, would be CU 7,421,000 (2012:
CU 6,712,000). The revalued amounts include a revaluation surplus of CU 1,288,000 before tax (2012: CU 985,000), which is not available for distribution to the shareholders ofIllustrative Corporation.
Fair value measurement of the landIFRS 13.91(a) See Note 33.2. IFRS 13.93(d)
12. Leases12.1 Finance leases as lessee
IAS 17.31(a) The Group’s main warehouse and related facilities and certain IT equipment are held underfinance lease arrangements. As of 31 December 2013, the net carrying amount of the warehouseand related facilities is CU 3,362,000 (2012: CU 3,723,000), included as part of buildings and ofthe IT equipment is CU 231,000 (2012: CU 480,000), included as part of IT equipment (seeNote 11).
Finance lease liabilities (see Note 23) are secured by the related assets held under financeleases. Future minimum finance lease payments at 31 December were as follows:
Minimum lease payments duewithin 1 1 to 5 after 5 Total
year years yearsCU’000 CU’000 CU’000 CU’000
31 December 2013IAS 17.31(b) Lease payments 727 1,415 3,539 5,681
Finance charges (215) (330) (528) (1,073)
Net present values 512 1,085 3,011 4,608
31 December 2012IAS 17.31(b) Lease payments 726 1,432 4,072 6,230
Finance charges (220) (336) (560) (1,116)
Net present values 506 1,096 3,512 5,114
IAS 17.31(e) The lease agreement for the main warehouse includes fixed lease payments and a purchaseoption at the end of the 10 year lease term. The agreement is non-cancellable and does notcontain any further restrictions.
12.2 Operating leases as lesseeThe Group leases an office and production building under an operating lease. The futureminimum lease payments are as follows:
Minimum lease payments duewithin 1 1 to 5 after 5 Total
year years yearsCU’000 CU’000 CU’000 CU’000
IAS 17.35(a) 31 December 2013 4,211 12,567 25,678 42,456
31 December 2012 3,431 12,100 24,342 39,873
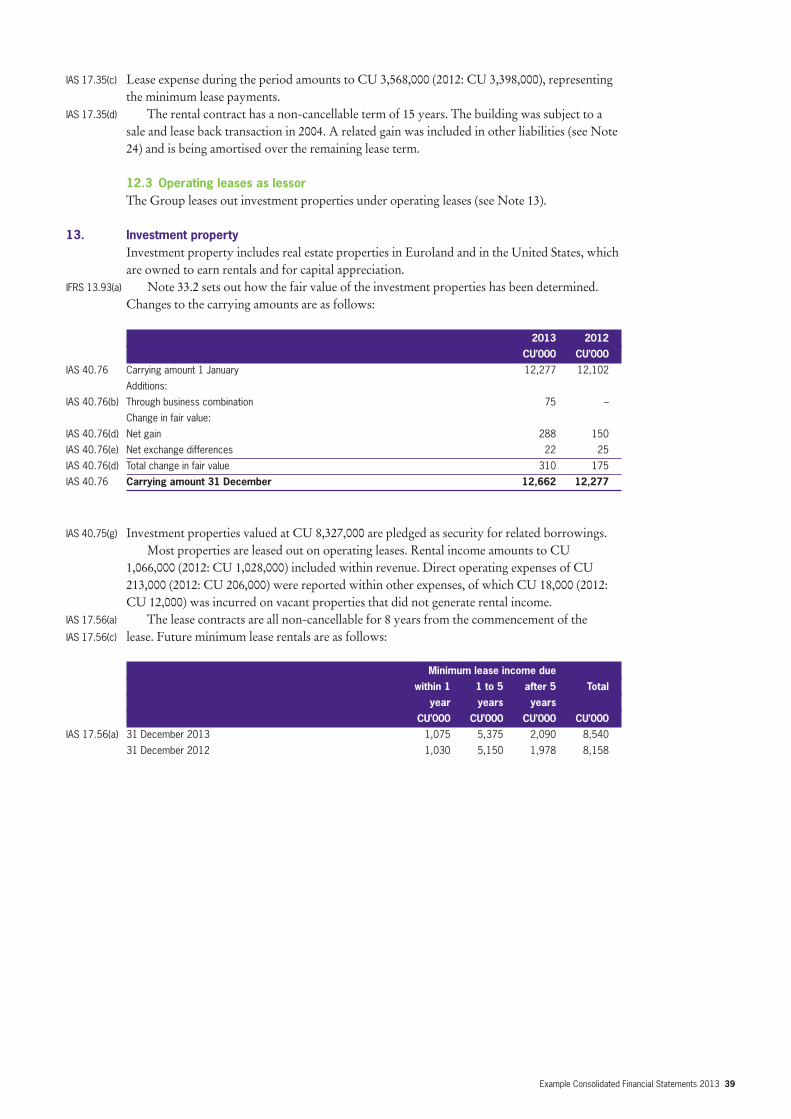
Example Consolidated Financial Statements 2013 39
IAS 17.35(c) Lease expense during the period amounts to CU 3,568,000 (2012: CU 3,398,000), representingthe minimum lease payments.
IAS 17.35(d) The rental contract has a non-cancellable term of 15 years. The building was subject to asale and lease back transaction in 2004. A related gain was included in other liabilities (see Note24) and is being amortised over the remaining lease term.
12.3 Operating leases as lessorThe Group leases out investment properties under operating leases (see Note 13).
13. Investment propertyInvestment property includes real estate properties in Euroland and in the United States, whichare owned to earn rentals and for capital appreciation.
IFRS 13.93(a) Note 33.2 sets out how the fair value of the investment properties has been determined.Changes to the carrying amounts are as follows:
2013 2012CU’000 CU’000
IAS 40.76 Carrying amount 1 January 12,277 12,102
Additions:
IAS 40.76(b) Through business combination 75 –
Change in fair value:
IAS 40.76(d) Net gain 288 150
IAS 40.76(e) Net exchange differences 22 25
IAS 40.76(d) Total change in fair value 310 175
IAS 40.76 Carrying amount 31 December 12,662 12,277
IAS 40.75(g) Investment properties valued at CU 8,327,000 are pledged as security for related borrowings.Most properties are leased out on operating leases. Rental income amounts to CU
1,066,000 (2012: CU 1,028,000) included within revenue. Direct operating expenses of CU213,000 (2012: CU 206,000) were reported within other expenses, of which CU 18,000 (2012:CU 12,000) was incurred on vacant properties that did not generate rental income.
IAS 17.56(a) The lease contracts are all non-cancellable for 8 years from the commencement of theIAS 17.56(c) lease. Future minimum lease rentals are as follows:
Minimum lease income duewithin 1 1 to 5 after 5 Total
year years yearsCU’000 CU’000 CU’000 CU’000
IAS 17.56(a) 31 December 2013 1,075 5,375 2,090 8,540
31 December 2012 1,030 5,150 1,978 8,158

40 Example Consolidated Financial Statements 2013
14. Financial assets and liabilities14.1 Categories of financial assets and financial liabilities
IFRS 7.25 Note 4.17 provides a description of each category of financial assets and financial liabilities andthe related accounting policies. The carrying amounts of financial assets and financial liabilitiesin each category are as follows:
Note AFS Held for Derivatives HTM Loans and Totaltrading used for receivables(FVTPL) hedging
(carried at fair value) (carried at
amortised cost)
CU’000 CU’000 CU’000 CU’000 CU’000 CU’00031 December 2013Financial assets
IFRS 7.8(b) Bonds 14.2 – – – 2,814 – 2,814
IFRS 7.8(d) Other investments (a) 14.3 951 – – – – 951
Other long-term financial assets 951 – – 2,814 – 3,765
IFRS 7.8(a)(ii) Other short-term financial assets 14.4 – 655 – – – 655
IFRS 7.8(a)(ii) Derivative financial instruments 14.5 – 115 467 – – 582
IFRS 7.8(c) Trade and other receivables (b) 17 – – – – 30,945 30,945
IFRS 7.8(c) Cash and cash equivalents 18 – – – – 34,729 34,729
951 770 467 2,814 65,674 70,676
Note Derivatives Designated Other Other Totalused for at FVTPL liabilities liabilitieshedging at FVTPL (carried at
(carried at fair value) amortised
cost)
CU’000 CU’000 CU’000 CU’000 CU’000Financial liabilities
IFRS 7.8(e)(i) Non-current borrowings 14.6 – 7,700 – 13,300 21,000
IFRS 7.8(e)(i),
IFRS 7.8(f) Current borrowings 14.6 – 250 – 4,565 4,815
IFRS 7.8(f) Trade and other payables 23 – – – 13,069 13,069
IFRS 7.7 Derivative financial instruments 14.5 – – – – –
IFRS 7.8(e)(ii) Contingent consideration 24 – – 620 – 620
– 7,950 620 30,934 39,504
Note AFS Held for Derivatives HTM Loans and Totaltrading used for receivables(FVTPL) hedging
(carried at fair value) (carried at
amortised cost)
(Restated)CU’000 CU’000 CU’000 CU’000 CU’000 CU’000
31 December 2012Financial assets
IFRS 7.8(b) Bonds 14.2 – – – 2,992 – 2,992
IFRS 7.8(d) Other investments (a) 14.3 888 – – – – 888
Other long-term financial assets 888 – – 2,992 – 3,880
IFRS 7.8(a)(ii) Other short-term financial assets 14.4 – 649 – – – 649
IFRS 7.8(a)(ii) Derivative financial instruments 14.5 – 212 – – – 212
IFRS 7.8(c) Trade and other receivables (b) 17 – – – – 23,441 23,441
IFRS 7.8(c) Cash and cash equivalents 18 – – – – 11,197 11,197
888 861 – 2,992 34,638 39,379

Example Consolidated Financial Statements 2013 41
Note Derivatives Designated Other Totalused for hedging at FVTPL liabilities
(carried at fair value) (carried at
amortised cost)
(Restated)CU’000 CU’000 CU’000 CU’000
Financial liabilitiesIFRS 7.8(e)(i) Non-current borrowings 14.6 – 7,965 13,300 21,265
IFRS 7.8(e)(i),
IFRS 7.8(f) Current borrowings 14.6 – 255 3,124 3,379
IFRS 7.8(f) Trade and other payables 23 – – 11,515 11,515
IFRS 7.7 Derivative financial instruments 14.5 160 – – 160
160 8,220 27,939 36,319
(a) includes an equity investment carried at cost less impairment charges because fair value cannot be determined reliably.
See Note 14.3.
(b) these amounts only represent trade receivables that are financial assets. See Note 17.
IFRS 7.33 A description of the Group’s financial instrument risks, including risk management objectivesand policies is given in Note 32.
The methods used to measure financial assets and liabilities reported at fair value aredescribed in Note 33.1.
14.2 HTM investmentsIFRS 7.7 HTM investments comprise public traded zero coupon and US straight bonds with fixed
interest rates between 5.5% and 6.2%. They mature in 2015 and 2016. The carrying amounts(measured at amortised cost) and fair values of these bonds are as follows:
2013 2012CU’000 CU’000
Carrying amount at amortised cost:Zero coupon bonds 1,110 1,189
US straight bonds 1,704 1,803
IFRS 7.8(b) 2,814 2,992
Fair value:IFRS 7.25 Zero coupon bonds 1,190 1,186
US straight bonds 1,705 1,809
2,895 2,995
IFRS 13.97 Fair values of these bonds have been estimated by reference to quoted bid prices in activemarkets at the reporting date and are categorised within Level 1 of the fair value hierarchy. Thefair value of the US straight bonds also reflects the US-dollar spot rate as at the reporting date.

42 Example Consolidated Financial Statements 2013
14.3 AFS financial assetsThe details and carrying amounts of AFS financial assets are as follows:
2013 2012CU’000 CU’000
IFRS 7.25 Listed equity securities 421 343
IFRS 7.25 Listed debentures 97 112
Total AFS financial assets at fair value 518 455 Investment in XY Ltd 433 433
IFRS 7.8(d) 951 888
The equity securities and debentures are denominated in CU and are publicly traded inEuroland.
IFRS 7.30(a)-(d) The investment in XY Ltd represents a 15% equity interest in an unlisted company, one ofthe Group’s suppliers. XY Ltd has been undertaking a major restructuring process since 2012,which has triggered possible litigation by third parties. Due to these uncertainties, the fair valueof the Group’s investment in this entity cannot be reliably measured. Therefore, it has beenstated at cost less impairment charges. In 2012, an impairment charge of CU 350,000 wasrecognised within finance cost. The Group plans to continue to hold its investment in XY Ltdwhile it secures other supply lines.
14.4 Financial assets held for tradingIFRS 7.B5(a)(i) Financial assets held for trading consists of various investments in money market funds
(presented as other short-term financial assets) that are held by the Group for short-termtrading and certain derivative financial investments (see Note 14.5). All of these money marketfunds are publicly traded on stock exchanges in Euroland.
14.5 Derivative financial instrumentsThe Group’s derivative financial instruments are measured at fair value and are summarisedbelow:
2013 2012CU’000 CU’000
IFRS 7.22(b) US-dollar forward contracts – cash flow hedge 467 –
Other forward exchange contracts – held-for-trading 115 212
Derivative financial assets 582 212
IFRS 7.22(b) US-dollar forward contracts – cash flow hedge – (160)
Derivative financial liabilities – (160)582 52
IFRS 7.22(a) The Group uses forward foreign exchange contracts to mitigate exchange rate exposure arisingIFRS 7.22(b) from forecast sales in US dollars and other currencies. All US-dollar forward exchangeIFRS 7.22(c) contracts have been designated as hedging instruments in cash flow hedges in accordance
with IAS 39. Other forward exchange contracts are considered by management to be part of economic
hedge arrangements but have not been formally designated. IFRS 7.23(a) The Group’s US-dollar forward contracts relate to cash flows that have been forecastedIFRS 7.23(b) for October – December 2014. All forecast transactions for which hedge accounting has been
used are expected to occur.IFRS 7.23(c) During 2013 a gain of CU 367,000 (2012: loss of CU 47,000) was recognised in other
comprehensive income. The cumulative gain recorded in equity is CU 467,000 (2012:cumulative loss of CU 160,000).
IFRS 7.23(d) During 2013, a loss of CU 260,000 (2012: net gain of CU 425,000) was reclassified fromIFRS 7.23(e) equity into profit or loss within revenue.

Example Consolidated Financial Statements 2013 43
14.6 BorrowingsBorrowings include the following financial liabilities:
Current Non-current2013 2012 2013 2012
CU’000 CU’000 CU’000 CU’000IFRS 7.8(e)(i) Designated at FVTPL:
US-dollar loans 250 255 7,700 7,965
IFRS 7.8(f) Carrying amount at amortised cost:
Other bank borrowings 4,565 3,124 – –
Non-convertible bond – – 8,300 8,300
Subordinated shareholder loan – – 5,000 5,000
4,565 3,124 13,300 13,300
IFRS 7.8(f) Fair value:
Other bank borrowings 4,565 3,124 – –
Non-convertible bond – – 8,259 8,383
Subordinated shareholder loan – – 4,975 5,050
4,565 3,124 13,234 13,433
IFRS 7.25 Other than the US-dollar loans, all borrowings are denominated in CU.
US-dollar loans at FVTPLUS-dollar loans are designated at FVTPL to significantly reduce measurement inconsistencies(see Note 4.17). The interest rate is fixed at 4%. Movements in the carrying amount of theseUS-dollar loans are presented below:
2013 2012CU’000 CU’000
Carrying amount 1 January 8,220 8,380
Repayments (300) (230)
Change in fair values:
IFRS 7.10(a) – changes in credit risk – –
– other market factors 30 70
IFRS 7.25 Carrying amount 31 December 7,950 8,220
IFRS 7.10(a) The cumulative changes since the designation of these borrowings at FVTPL attributable toIFRS 7.11(a) changes in credit risk are CU Nil (2012: Nil). The Group estimates the credit-risk related
change in fair value on a residual basis, as the difference between fair value changes specificallyattributable to the appropriate benchmark interest rates and the total change in fair value. Atyear-end the estimate shows an insignificant change attributable to credit risk.
IFRS 7.10(b) The total undiscounted amount repayable at maturity in respect of the loan, converted atyear-end exchange rates is CU 7,755,000 (2012: CU 8,055,000), equivalent to a differencebetween the carrying amount and the amount repayable of CU 195,000 (2012: CU 165,000).
The fair value of the loans is measured as described in Note 33.1.
Borrowings at amortised cost:IAS 16.74(a) Other bank borrowings are secured by land and buildings owned by the Group (see Note 11).IFRS 7.29 Current interest rates are variable and average 4.0% (2012: 4.1%). The carrying amountIFRS 7.31 of the other bank borrowings is considered to be a reasonable approximation of the fair value. IFRS 13.93(d) The Group’s non-convertible bond with a fixed interest rate of 5.0% matures on 20 May IFRS 13.97 2016 and is therefore classified as non-current. The estimated fair value of the non-convertible
bond is categorised within Level 2 of the fair value hierarchy. The fair value estimate has beendetermined from the perspective of a market participant, that holds these non-convertiblebonds as assets at 31 December 2013. The CU 8,259 is estimated using a present valuetechnique, by discounting the contractual cash flows using implied yields of non-convertiblebonds of an entity with a similar standing and marketability.

44 Example Consolidated Financial Statements 2013
The most significant input being the discount rate that reflects the credit risk of counterparties.
IAS 24.17 The subordinated shareholder loan was provided by Illustrative Corporation’s main IFRS 13.93(d) shareholder, LOM Investment Trust, in 2010. It is perpetual and carries a fixed coupon of IFRS 13.97 4.0%. It is repayable only upon liquidation of Illustrative Corporation. The estimated fair value
of the subordinated shareholder loan is categorised within Level 3 of the fair value hierarchy.The fair value estimate has been determined using a present value technique. The CU 4,975 isestimated by discounting the contractual cash flows at 4.1%. The discount rate has beendetermined using the interest rate that the entity would pay to unrelated party, at the reportingdate, adjusted to reflect the subordination feature.
The most significant input is the discount rate of 4.1%.
14.7 Other financial instrumentsIFRS 7.29 The carrying amount of the following financial assets and liabilities is considered a reasonable
approximation of fair value: • trade and other receivables• cash and cash equivalents• trade and other payables.
15. Deferred tax assets and liabilitiesDeferred taxes arising from temporary differences and unused tax losses are summarised as follows:
IAS 12.81(g) Deferred tax liabilities(assets) 1 January Recognised Recognised Recognised 312013 in other in business in profit December
comprehensive combination or loss 2013income
CU’000 CU’000 CU’000 CU’000 CU’000Non-current assets
– Other intangible assets 847 (63) 444 30 1,258
– Property, plant and equipment 2,130 (22) 188 406 2,702
– Other long-term financial assets (95) – – 19 (76)
– Investment property 1,914 – – 93 2,007
Current assets
– Trade and other receivables (168) – – 38 (130)
Current liabilities
– Provisions (1,003) – – 639 (364)
– Pension and other employee obligations (4,451) 1,149 – (188) (3,490)
Unused tax losses (75) – – 75 –
(901) 1,064 632 1,112 1,907
IAS 12.81(g) Deferred tax liabilities(assets) 1 January Recognised Included in Recognised Recognised 312012 in other disposal in business in profit December
comprehensive group combination or loss 2012income
(Restated)CU’000 CU’000 CU’000 CU’000 CU’000 CU’000
Non-current assets
– Other intangible assets 409 (27) – 210 255 847
– Property, plant and equipment 1,528 (68) – 225 445 2,130
– Other long-term financial assets – – – – (95) (95)
– Investment property 1,861 – – – 53 1,914
Current assets
– Trade and other receivables (34) – – – (134) (168)
Current liabilities
– Provisions (1,320) – 74 – 243 (1,003)
– Pension and other employee obligations (2,996) (1,062) – – (393) (4,451)
Unused tax losses (300) – – – 225 (75)
(852) (1,157) 74 435 599 (901)

Example Consolidated Financial Statements 2013 45
The amounts recognised in other comprehensive income relate to revaluation of land, exchangedifferences on translating foreign operations and the remeasurement of net defined benefitliability. See Note 20.3 for the amount of the income tax relating to these components of othercomprehensive income.
IAS 12.81(f) A deferred tax liability of CU 1,000 (2012: CU 2,000) associated with an investment in adomestic subsidiary has not been recognised, as the Group controls the timing of the reversaland it is probable that the temporary difference will not reverse in the foreseeable future. Thetax value is equivalent to a temporary difference of CU 3,000 (2012: CU 7,000).
IAS 12.81(e) All deferred tax assets (including tax losses and other tax credits) have been recognised inthe statement of financial position.
16. InventoriesInventories consist of the following:
IAS 1.77 2013 2012IAS 1.78(c) (Restated)
CU’000 CU’000IAS 2.36(b) Raw materials and consumables 7,737 7,907
Merchandise 10,561 9,319
18,298 17,226
IAS 2.36(d) In 2013, a total of CU 35,265,000 (2012: CU 32,907,000) of inventories was included in profitIAS 2.36(e) or loss as an expense. This includes an amount of CU 361,000 (2012: CU 389,000) resulting
from write down of inventories.
17. Trade and other receivablesTrade and other receivables consist of the following:
IAS 1.77 2013 2012IAS 1.78(b) CU’000 CU’000
Trade receivables, gross 31,265 23,889
Allowance for credit losses (432) (560)
Trade receivables 30,833 23,329 Receivable due from ABC Ltd 112 112
Financial assets 30,945 23,441
Social security and other taxes 1,012 676
Construction contracts for telecommunication systems 1,374 974
Prepayments 298 315
Non-financial assets 2,684 1,965 33,629 25,406
IFRS 7.25 All amounts are short-term. The net carrying value of trade receivables is considered aIFRS 7.29 reasonable approximation of fair value.
The receivable due from ABC Ltd relates to the remaining consideration due on the sale ofa former subsidiary in 2011. The carrying amount of the receivable is considered a reasonableapproximation of fair value as this financial asset (which is measured at amortised cost) isexpected to be paid within six months, such that the time value of money is not significant.
IFRS 7.37(b) All of the Group’s trade and other receivables have been reviewed for indicators ofimpairment. Certain trade receivables were found to be impaired and an allowance for creditlosses of CU 72,000 (2012: CU 514,000) has been recorded accordingly within other expenses.The impaired trade receivables are mostly due from customers in the business-to-businessmarket that are experiencing financial difficulties.

46 Example Consolidated Financial Statements 2013
IFRS 7.16 The movements in the allowance for credit losses is presented below:
2013 2012CU’000 CU’000
IFRS 7.16 Balance 1 January 560 112
Amounts written off (uncollectable) (200) (66)
Impairment loss 72 514
Balance 31 December 432 560
IFRS 7.20(e) An analysis of unimpaired trade receivables that are past due is given in Note 32.2.
17.1 Construction contractsIAS 11.39(a) Revenue of CU 50,973,000 (2012: CU 49,186,000) relating to construction contracts for
telecommunication systems has been included in revenue for the current reporting period.IAS 11.39 The amounts recognised in the statement of financial position relate to construction(b)-(c) contracts in progress at the end of the reporting period. The amounts are calculated as the net
amounts of costs incurred plus recognised profits, less recognised losses and progress billings.The carrying amounts of assets and liabilities are analysed as follows:
2013 2012CU’000 CU’000
IAS 11.40(a) Aggregate amount of costs incurred and recognised 3,421 3,121
profits and losses for all contracts in progress
Less, progress billings (2,335) (2,354)
1,086 767 Recognised as:
IAS 11.42(a) Due from customers for construction contract work, 1,374 974 recognised in trade and other receivables
IAS 11.42(b) Due to customers for construction contract work, 288 207recognised in other liabilities
IAS 11.40(b) Advances paid from customers for construction contracts related to work not yet performed have been recognised in other liabilities (see Note 24) and amount to CU 225,000(2012: CU 220,000).
IAS 11.40(c) Retentions on construction contracts amount to CU 10,000 (2012: CU Nil) and areincluded within trade and other receivables. Retentions will be received upon acceptance by thecustomer of the work performed.
18. Cash and cash equivalentsIAS 7.45 Cash and cash equivalents consist of the following:
2013 2012(Restated)
CU’000 CU’000Cash at bank and in hand:
– CU 24,292 7,827
– GBP 2,087 674
– USD 1,392 449
Short-term deposits (CU) 6,958 2,247
34,729 11,197
IAS 7.48 Following the acquisition of Goodtech, some bank deposits of the acquiree were temporarilyIAS 10.19 not available for general use by the Group because of legal restrictions. The amount of cash and
cash equivalents inaccessible to the Group as at 31 December 2013 amounts to CU 500,000(2012: CU Nil). All the restrictions on bank deposits were removed by the time of the approvalof the consolidated financial statements on 8 March 2014.

Example Consolidated Financial Statements 2013 47
19. Disposal groups classified as held for sale and discontinued operationsIFRS 5.41 At the end of 2012, management decided to discontinue in-store sale of IT and(a)-(d) telecommunications hardware in line with the Group’s strategy to focus on its on-line retail
business. Consequently, assets and liabilities allocable to Highstreet (included in the retailsegment) were classified as a disposal group. Revenue and expenses, gains and losses relating tothe discontinuation of this subgroup have been eliminated from profit or loss from the Group’scontinuing operations and are shown as a single line item on the face of the statement of profitor loss (see loss for the year from discontinued operations).
IAS 7.40(a) On 30 September 2013, Highstreet was sold for a total of CU 3,117,000 in cash resulting ina loss of CU 29,000 before tax primarily due to related selling costs (see Note 6.3). Operatingprofit of Highstreet until the date of disposal and the profit or loss from re-measurement anddisposal of assets and liabilities classified as held for sale are summarised as follows:
2013 2012CU’000 CU’000
IFRS 5.33(b)(i) Revenue 9,803 11,015
Costs of material (3,540) (3,633)
Employee benefits expense (6,100) (6,411)
Depreciation and amortisation – (765)
Other expenses (90) (100)
Operating profit 73 106
Finance costs (56) (60)
Profit from discontinued operations before tax 17 46
IFRS 5.33(b)(ii) Tax income (5) (14)
IAS 12.81(h)
Profit for year 12 32 Loss on remeasurement and disposal
IFRS 5.33(b)(iii) Loss before tax on measurement to fair value less costs to sell – (510)
Loss before tax on disposal (29) –
IFRS 5.33(b)(ii) Tax income 8 153
IAS 12.81(h)
Total loss (21) (357)
Loss for the year from discontinued operations (9) (325)
IFRS 5.41(b) Most of the assets and all of the liabilities have been disposed of in this transaction, however,the Group continues to own some former Highstreet storage facilities. Management expects tosell these remaining assets during 2014.
IFRS 5.38 The carrying amounts of assets and liabilities in this disposal group are summarised as follows:
2013 2012CU’000 CU’000
Non-current assets
– Property, plant and equipment 103 2,578
– Deferred tax – 227
Current assets
– Inventories – 1,081
– Cash and cash equivalents – 22
Assets classified as held for sale 103 3,908 Current liabilities
– Provisions – (245)
– Trade and other payables – (190)
– Current tax liabilities – (14)
Liabilities classified as held for sale – (449)

48 Example Consolidated Financial Statements 2013
IFRS 5.33(c) Cash flows generated by Highstreet for the reporting periods under review until its disposal areas follows:
2013 2012CU’000 CU’000
Operating activities (22) 811
Investing activities 3,117 –
Cash flows from discontinued operations 3,095 811
Cash flows from investing activities relate solely to the proceeds from the sale of Highstreet.
20. Equity 20.1 Share capital
IAS 1.79(a)(iii) The share capital of Illustrative Corporation consists only of fully paid ordinary shares with aIAS 1.79(a)(v) nominal value of CU 1. All shares are equally eligible to receive dividends and the repayment of
capital and represent one vote at the shareholders’ meeting of Illustrative Corporation.
2013 2012IAS 1.79(a)(iv) Shares issued and fully paid:
Beginning of the year 12,000,000 12,000,000
Issued under share-based payments 270,000 –
Share issue 1,500,000 –
IAS 1.79(a)(ii) Shares issued and fully paid 13,770,000 12,000,000 Shares authorised for share based payments 600,000 600,000
IAS 1.79(a)(i) Total shares authorised at 31 December 14,370,000 12,600,000
Additional shares were issued during 2013 relating to share-based payments (see Note 21.2 fordetails on the Group’s share-based employee remuneration programmes).
The Group issued 1,500,000 shares on 30 October 2013, corresponding to 12.5% of totalshares issued. Each share has the same right to receive dividend and the repayment of capitaland represents one vote at the shareholders’ meeting of Illustrative Corporation.
IAS 1.79(a)(vii) The authorised shares that have not yet been issued have been authorised solely for use inthe Group’s share-based remuneration programmes (see Note 21.2).
20.2 Share premiumProceeds received in addition to the nominal value of the shares issued during the year havebeen included in share premium, less registration and other regulatory fees and net of relatedtax benefits. Costs of new shares charged to equity amounted to CU 70,000 (2012: CU Nil).
Share premium has also been recorded in respect of the issue of share capital related toemployee share-based payment (see Note 21.2).

Example Consolidated Financial Statements 2013 49
20.3 Other components of equityIAS 1.106(d)(ii) The details of other components of equity are as follows:IAS 1.106A
Translation Revaluation AFS Cash-flow Net defined Totalreserve reserve financial hedges benefit
assets liabilityIAS 1.106(d) CU’000 CU’000 CU’000 CU’000 CU’000 CU’000
Balance at 1 January 2013 (359) 689 35 (160) (862) (657)
Other comprehensive income for the year (all attributable to owners of the parent):
IAS 19.120(c) Remeasurement of net – – – – 3,830 3,830
defined benefit liability
Cash flow hedges
IFRS 7.23(c)-(d) – current year gains – – – 367 – 367
IAS 1.92 – reclassification to profit or loss – – – 260 – 260
IFRS 7.20(a)(ii) AFS financial assets –
– current year gains – – 113 – – 113
IAS 1.92 – reclassification to profit or loss – – (50) – – (50)
IAS 16.77(f) Revaluation of land – 303 – – – 303
IAS 21.52(b) Exchange differences on
translating foreign operations (664) – – – – (664)
Equity accounted investments – – – 5 – 5
IAS 1.92 – reclassification to profit or loss – – – (3) – (3)
IAS 1.91(b) Before tax (664) 303 63 629 3,830 4,161 IAS 12.81(a),
IAS 1.90 Tax benefit (expense) 176 (91) – – (1,149) (1,064)
Net of tax (488) 212 63 629 2,681 3,097
IAS 1.106(d) Balance at 31 December 2013 (847) 901 98 469 1,819 2,440
Translation Revaluation AFS Cash-flow Net defined Totalreserve reserve financial hedges benefit
assets liability(Restated)
IAS 1.106(d) CU’000 CU’000 CU’000 CU’000 CU’000 CU’000Balance at 1 January 2012 (113) 689 – 312 1,617 2,505
Other comprehensive income for the year (all attributable to owners of the parent):
IAS 19.120(c) Remeasurement of net – – – – (3,541) (3,541)
defined benefit liability
Cash flow hedges
IFRS 7.23(c)-(d) – current year losses – – – (47) – (47)
IAS 1.92 – reclassification to profit or loss – – – (425) – (425)
IFRS 7.20(a)(ii) AFS financial assets –
– current year gains – – 35 – – 35
IAS 21.52(b) Exchange differences on
translating foreign operations (341) – – – – (341)
IAS 1.91(b) Before tax (341) – 35 (472) (3,541) (4,319)IAS 12.81(a),
IAS 1.90 Tax benefit 95 – – – 1,062 1,157
Net of tax (246) – 35 (472) (2,479) (3,162)
IAS 1.106(d) Balance at 31 December 2012 (359) 689 35 (160) (862) (657)
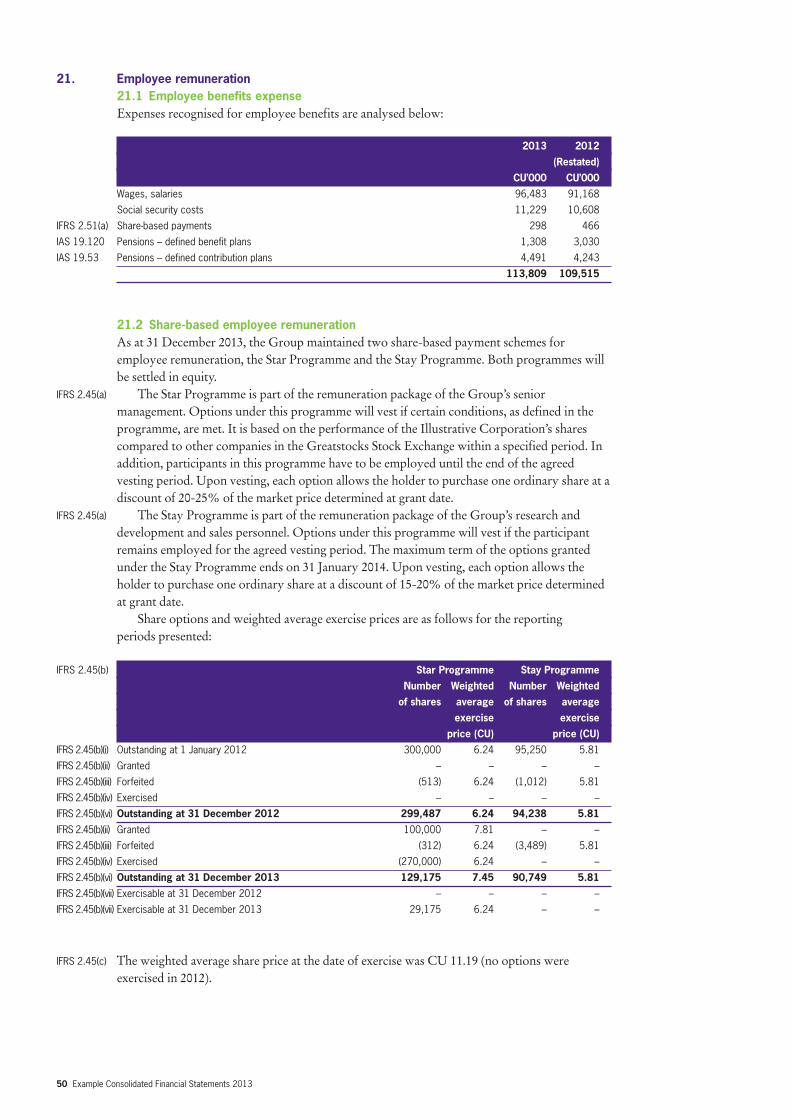
50 Example Consolidated Financial Statements 2013
21. Employee remuneration21.1 Employee benefits expenseExpenses recognised for employee benefits are analysed below:
2013 2012(Restated)
CU’000 CU’000Wages, salaries 96,483 91,168
Social security costs 11,229 10,608
IFRS 2.51(a) Share-based payments 298 466
IAS 19.120 Pensions – defined benefit plans 1,308 3,030
IAS 19.53 Pensions – defined contribution plans 4,491 4,243
113,809 109,515
21.2 Share-based employee remunerationAs at 31 December 2013, the Group maintained two share-based payment schemes foremployee remuneration, the Star Programme and the Stay Programme. Both programmes willbe settled in equity.
IFRS 2.45(a) The Star Programme is part of the remuneration package of the Group’s seniormanagement. Options under this programme will vest if certain conditions, as defined in theprogramme, are met. It is based on the performance of the Illustrative Corporation’s sharescompared to other companies in the Greatstocks Stock Exchange within a specified period. Inaddition, participants in this programme have to be employed until the end of the agreedvesting period. Upon vesting, each option allows the holder to purchase one ordinary share at adiscount of 20-25% of the market price determined at grant date.
IFRS 2.45(a) The Stay Programme is part of the remuneration package of the Group’s research anddevelopment and sales personnel. Options under this programme will vest if the participantremains employed for the agreed vesting period. The maximum term of the options grantedunder the Stay Programme ends on 31 January 2014. Upon vesting, each option allows theholder to purchase one ordinary share at a discount of 15-20% of the market price determinedat grant date.
Share options and weighted average exercise prices are as follows for the reporting periods presented:
IFRS 2.45(b) Star Programme Stay ProgrammeNumber Weighted Number Weighted of shares average of shares average
exercise exercise price (CU) price (CU)
IFRS 2.45(b)(i) Outstanding at 1 January 2012 300,000 6.24 95,250 5.81
IFRS 2.45(b)(ii) Granted – – – –
IFRS 2.45(b)(iii) Forfeited (513) 6.24 (1,012) 5.81
IFRS 2.45(b)(iv) Exercised – – – –
IFRS 2.45(b)(vi) Outstanding at 31 December 2012 299,487 6.24 94,238 5.81 IFRS 2.45(b)(ii) Granted 100,000 7.81 – –
IFRS 2.45(b)(iii) Forfeited (312) 6.24 (3,489) 5.81
IFRS 2.45(b)(iv) Exercised (270,000) 6.24 – –
IFRS 2.45(b)(vi) Outstanding at 31 December 2013 129,175 7.45 90,749 5.81 IFRS 2.45(b)(vii) Exercisable at 31 December 2012 – – – –
IFRS 2.45(b)(vii) Exercisable at 31 December 2013 29,175 6.24 – –
IFRS 2.45(c) The weighted average share price at the date of exercise was CU 11.19 (no options wereexercised in 2012).

Example Consolidated Financial Statements 2013 51
IFRS 2.47(a)(i) The fair values of options granted were determined using a variation of the binomial optionpricing model that takes into account factors specific to the share incentive plans, such as thevesting period. The performance condition related to the Star Programme, being a marketcondition, has been incorporated into the measurement by means of actuarial modelling. Thefollowing principal assumptions were used in the valuation:
The Star Programme The Stay Programme
IFRS 2.47(a)(i) Grant date 1 Jan 2010 1 Feb 2013 5 Jan 2009
Vesting period ends 31 Dec 2012 31 Jan 2016 31 Jan 2014
Share price at date of grant (CU) 8.00 10.01 7.00
Volatility 50% 50% 50%
Option life 5 years 5 years 7 years
Dividend yield 1% 1% 1%
Risk-free investment rate 4% 4% 4%
Fair value at grant date (CU) 4.00 6.70 5.30
Exercise price at date of grant (CU) 6.08 7.61 5.81
Exercisable from/to 1 Jan 2013/ 1 Feb 2016/ 1 Feb 2014/
31 Dec 2014 31 Dec 2018 4 Jan 2016
IFRS 2.45(d) Weighted average remaining contractual life 1.0 years 4.1 years 2.0 years
IFRS 2.47(a)(ii) The underlying expected volatility was determined by reference to historical data of the IFRS 2.47(a)(iii) Company’s shares over a period of time since its flotation on the Greatstocks Stock Exchange.
No special features inherent to the options granted were incorporated into measurement of fair value.
IFRS 2.51(a) In total, CU 298,000 (2012: CU 466,000) of employee remuneration expense (all of whichrelated to equity-settled share-based payment transactions) has been included in profit or lossand credited to retained earnings.
21.3 Pensions and other employee obligationsThe liabilities recognised for pensions and other employee remuneration consist of thefollowing amounts:
2013 2012(Restated)
CU’000 CU’000Non-current:
Defined benefit liability (net) 10,386 13,642
Current:
Defined benefit liability 1,246 1,193
Other short term employee obligations 221 303
1,467 1,496
IAS 1.69 The current portion of these liabilities represents the Group’s obligations to its current andformer employees that are expected to be settled during 2014. Other short-term employeeobligations arise mainly from accrued holiday entitlement at the reporting date and expectedpension payments in the next 12 months (without deduction of plan assets). As none of theemployees are eligible for early settlement of pension arrangements, the remaining part ofpension obligations for defined benefit plans is considered non-current. The non-currentportion of the defined benefit liability is presented net of plan assets.
Defined benefit planIAS 19.139(a) The Group has set up a partly funded pension scheme for mid to senior management, mainly in
Euroland, the UK and the US. The scheme is available to certain senior workers aftercompleting five years’ service.
Guidance note: Pensions and otheremployee obligationsIn the statement offinancial position, thecurrent and non-currentportion of the definedbenefit obligation arepresented separately tocomply with IAS 1.60.However, paragraph133 of IAS 19‘Employee Benefits’does not specifywhether thisdisaggregation isneeded. Therefore, anentity is also allowed topresent the obligationas non-current in itsentirety.

52 Example Consolidated Financial Statements 2013
According to the plan, a certain percentage of the current salary is converted into a pensioncomponent each year until retirement. Pensions under this scheme are paid out when abeneficiary has reached the age of 65. The pensionable salary is limited to CU 100,000 for ayear. Eligible employees are required to contribute a stated percentage of pensionable salary.
In Euroland and the UK, the pension payments are linked to the consumer price index(CPI), although certain limitations apply.
IAS 19.139(a) The plan assets are managed by a pension fund that is legally separated from the Group.The board of trustees of the pension fund is required by its articles of association to act in thebest interest of the fund and it is responsible for setting the investment policies. The Group hasno representation on the board of the fund.
IAS 19.139(b) The plan exposes the Group to actuarial risks such as interest rate risk, investment risk,longevity risk and inflation risk.
Interest rate riskThe present value of the defined benefit liability is calculated using a discount rate determinedby reference to market yields of high quality corporate bonds. The estimated term of the bondsis consistent with the estimated term of the defined benefit obligation and it is denominated inCU. A decrease in market yield on high quality corporate bonds will increase the Group’sdefined benefit liability, although it is expected that this would be offset partially by an increasein the fair value of certain of the plan assets.
Investment riskThe plan assets at 31 December 2013 are predominantly real estate, equity and debtinstruments. The fair value of the plan assets is exposed to the real estate market (in Eurolandand the US). The equity instruments are significantly weighted towards the finance andpharmaceuticals sectors in Euroland.
Longevity riskThe Group is required to provide benefits for life for the members of the defined benefitliability. Increase in the life expectancy of the members, particularly in Euroland and in the UKwhere the pension payments are linked to CPI, will increase the defined benefit liability.
Inflation riskA significant proportion of the defined benefit liability is linked to inflation. An increase in theinflation rate will increase the Group’s liability. A portion of the plan assets are inflation-linkeddebt securities which will mitigate some of the effects of inflation.
A reconciliation of the Group’s defined benefit obligation (DBO) and plan assets to theamounts presented in the statement of financial position for each of the reporting periods ispresented below:
2013 2012(Restated)
CU’000 CU’000IAS 19.140 Defined benefit obligation 53,874 47,410
Fair value of plan assets (42,242) (32,575)
11,632 14,835
Classified as:
Non-current liability 10,386 13,642Current liability 1,246 1,193

Example Consolidated Financial Statements 2013 53
Defined benefit obligationThe details of the Group’s DBO are as follows:
2013 2012(Restated)
CU’000 CU’000IAS 19.140(a)(ii) Defined benefit obligation 1 January 47,410 38,889
IAS 19.141(a) Current service cost 1,308 1,530
IAS 19.141(b) Interest expense 2,488 2,267
IAS 19.141(f) Contributions by plan participants 658 650
IAS 19.141 Remeasurement – actuarial losses from changes in demographic assumptions 916 1,091
(c)(ii)
IAS 19.141 Remeasurement – actuarial losses from changes in financial assumptions 2,345 2,670
(c)(iii)
IAS 19.141(g) Benefits paid (1,251) (1,187)
IAS 19.141(d) Past service cost – 1,500
IAS 19.140(a)(ii) Defined benefit obligation 31 December 53,874 47,410
IAS 19.138(e) Thereof
Unfunded – –
Partly or wholly funded 53,874 47,410
Plan assetsThe reconciliation of the balance of the assets held for the Group’s defined benefit plan ispresented below:
2013 2012(Restated)
CU’000 CU’000IAS 19.140(a)(i) Fair value of plan assets 1 January 32,575 29,901
IAS 19.141(b) Interest income 1,983 1,718
IAS 19.141(c)(i) Return on plan assets (excluding amounts included in net interest) 7,091 220
IAS 19.141(f) Contributions by the Group 1,186 1,273
IAS 19.141(f) Contributions by beneficiaries 658 650
IAS 19.141(g) Benefits paid (1,251) (1,187)
IAS 19.140(a)(i) Fair value of plan assets 31 December 42,242 32,575
The actual return on plan assets was CU 9,074 in 2013 (2012: CU 1,938).IAS 19.143 Plan assets do not comprise any of the Group’s own financial instruments or any assets used
by Group companies. Plan assets can be broken down into the following categories of investments:
Total plan assets2013 2012
CU’000 CU’000IAS 19.142(a) Cash and cash equivalents 3,442 2,075IAS 19.142(b) Equity instruments:
– Financial institutions 9,800 7,600
– Pharmaceuticals 8,100 4,300
– Oil and gas industry 1,600 1,700
– Manufacturing industry 1,500 1,200
Total 21,000 14,800
IAS 19.142(c) Debt instruments:
– Euroland government bonds 4,800 5,800
– Corporate bonds (rated AA and above) 3,100 5,600
Total 7,900 11,400
IAS 19.142(d) Real estate:
– in Euroland 6,700 2,500
– in the US 3,200 1,800
Total 9,900 4,300 Total 42,242 32,575

54 Example Consolidated Financial Statements 2013
IAS 19.142 All equity and debt instruments have quoted prices in active markets (Level 1). Fair values ofreal estate investments do not have quoted prices and have been determined based onprofessional appraisals that would be classified as Level 3 of the fair value hierarchy as definedin IFRS 13 ‘Fair Value Measurement’.
IAS 19.138(a) The defined benefit obligation and plan assets are composed by geographical locations asfollows:
Euroland UK US Others Total2013 2013 2013 2013 2013
CU’000 CU’000 CU’000 CU’000 CU’000Defined benefit obligation 24,482 17,321 11,529 542 53,874
Fair value of plan assets (18,586) (13,057) (10,427) (172) (42,242)
5,896 4,264 1,102 370 11,632
Euroland UK US Others Total2012 2012 2012 2012 2012
CU’000 CU’000 CU’000 CU’000 CU’000Defined benefit obligation 21,594 15,063 10,256 497 47,410
Fair value of plan assets (14,123) (9,748) (8,553) (151) (32,575)
7,471 5,315 1,703 346 14,835
IAS 19.144 The significant actuarial assumptions used for the valuation are as follows:
2013 2012Discount rate at 31 December 5.3% 5.5%
Salary growth rate 3% 3.2%
Average life expectancies:
– Male, 45 years of age at reporting date 84.5 84.5
– Female, 45 years of age at reporting date 87.5 87.5
– Male, 65 years of age at reporting date 82.5 82.5
– Female, 65 years of age at reporting date 84.5 84.5
IAS 1.125(a) These assumptions were developed by management with the assistance of independentactuaries. Discount factors are determined close to each year-end by reference to market yieldsof high quality corporate bonds that are denominated in the currency in which the benefits willbe paid and that have terms to maturity approximating to the terms of the related pensionobligation. Other assumptions are based on current actuarial benchmarks and management’shistorical experience.
IAS 19.67 The present value of the DBO were measured using the projected unit credit method.
Defined benefit plan expensesIAS 19.120 Amounts recognised in profit or loss related to the Group’s defined benefit plans are as follows:
2013 2012(Restated)
CU’000 CU’000IAS 19.120(a) Current service cost 1,308 1,530
IAS 19.120(a) Past service cost – 1,500
IAS 19.120(b) Net interest expense 505 549
Total expenses recognised in profit or loss 1,813 3,579
IAS 19.134 The current service cost and the past service cost are included in employee benefits expense.The net interest expense is included in finance costs.
Guidance note: Significant actuarialassumptionsFor the purposes ofthese Example financialstatements, it isassumed that thesignificant actuarialassumptions for thedifferent geographicallocations are the same.In practice, it is likelythat there will bedifferences in thesignificant actuarialassumptions in differentgeographical locations,which will require theirdisclosure.

Example Consolidated Financial Statements 2013 55
IAS 19.120 Amounts recognised in other comprehensive income related to the Group’s defined benefitplans are as follows:
2013 2012(Restated)
CU’000 CU’000IAS 19.127(a) Actuarial losses from changes in demographic assumptions (916) (1,091)
IAS 19.127(a) Actuarial losses from changes in financial assumptions (2,345) (2,670)
IAS 19.127(b) Return on plan assets (excluding amounts included in net interest) 7,091 220
Total income (expenses) recognised in other comprehensive income 3,830 (3,541)
IAS 19.122 All the expenses summarised above were included within items that will not be reclassifiedsubsequently to profit or loss in the statement of other comprehensive income.
Other defined benefit plan informationIAS 19.147(a) Employees of the Group are required to contribute a fixed 5% of the pensionable salary.
The remaining contribution is partly funded by the Group’s subsidiaries. The fundingrequirements are based on the pension fund’s actuarial measurement framework as set out inthe funding policies.
IAS 19.147(b) Based on historical data, the Group expects contributions of CU 2,500,000 to be paidfor 2014.
IAS 19.147(c) The weighted average duration of the defined benefit obligation at 31 December 2013 is23.3 years (2012: 23.2 years).
IAS 19.144 The significant actuarial assumptions for the determination of the defined benefit IAS 19.173(b) obligation are the discount rate, the salary growth rate and the average life expectancy. The
calculation of the net defined benefit liability is sensitive to these assumptions. The followingtable summarises the effects of changes in these actuarial assumptions on the defined benefitliability at 31 December 2013:
IAS 19.145(a) Changes in the significant actuarial assumptionsDiscount rate Increase to Decrease to
6.3% 4.3%Increase (decrease) in the defined benefit liability (2,000) 2,100
Salary growth rate Increase to Decrease to4% 2%
Increase (decrease) in the defined benefit liability 950 (780)
Average life expectancies of males Increase of Decrease ofone year one year
Increase (decrease) in the defined benefit liability 1,140 (930)
Average life expectancies of females Increase of Decrease ofone year one year
Increase (decrease) in the defined benefit liability 1,280 (1,090)
IAS 19.145(b) The present value of the defined benefit obligation calculated with the same method (projectunit credit) as the defined benefit obligation recognised in the statement of financial position.The sensitivity analyses are based on a change in one assumption while not changing all otherassumptions. This analysis may not be representative of the actual change in the defined benefitobligation as it is unlikely that the change in the assumptions would occur in isolation of oneanother as some of the assumptions may be correlated.

56 Example Consolidated Financial Statements 2013
22. ProvisionsIAS 1.69 All provisions are considered current. The carrying amounts and the movements in the
provision account are as follows:
Restructuring Other TotalCU’000 CU’000 CU’000
IAS 37.84(a) Carrying amount 1 January 2013 2,110 1,235 3,345
IAS 37.84(b) Additional provisions – 1,570 1,570
IAS 37.84(c) Amount utilised (876) (2,211) (3,087)
IAS 37.84(d) Reversals (510) (103) (613)
IAS 37.84(a) Carrying amount 31 December 2013 724 491 1,215IAS 1.125(b)
Provisions recognised at acquisition date in a business combination are included in additions(see Note 5.1). Provisions classified as held for sale are included within amount utilised (seeNote 19).
IAS 37.85(a) The provision for restructuring relates to the Phoenix programme, which was initiated inIAS 37.85(b) late 2011 and carried out predominantly in 2012 and 2013. The Group’s management expectsIAS 37.85(c) to settle the remaining termination remuneration for former employees and legal fees relating
to the restructuring programme in 2014. The Group is not eligible for any reimbursement bythird parties in this regard.
IAS 1.125(a) The restructuring provision as at 31 December 2013 was reduced due to the outcome ofseveral lawsuits brought against the Group during 2013 by former employees. Out of courtsettlements based on the outcome of earlier settlements are expected for most of the remaining claims.
IAS 37.85(a) Other provisions relate to various legal and other claims by customers, such as warrantiesfor which customers are covered for the cost of repairs.
IAS 37.85(b) Usually, these claims are settled between 3 and 18 months from initiation, depending onIAS 1.61/69 the procedures used for negotiating the claims. As the timing of settlement of these claims is to
a large extent dependent on the pace of negotiation with various counterparties and legalauthorities, the Group cannot reliably estimate the amounts that will eventually be paid insettlement after more than 12 months from the reporting date. Therefore, the amount isclassified as current.
IAS 1.125 The majority of the other provisions recognised at 31 December 2012 related to claimsIAS 37.92 initiated in 2012 that were settled during 2013. Management, on the advice of counsel, does not
expect that the outcome of any of the remaining cases will give rise to any significant lossbeyond the amounts recognised at 31 December 2013. None of the provisions will be discussedhere in further detail so as to not seriously prejudice the Group’s position in the related disputes.
23. Trade and other payablesTrade and other payables consist of the following:
2013 2012(Restated)
CU’000 CU’000Current
Trade payables 7,843 6,472
Short-term bank overdrafts 654 78
Finance lease liabilities 512 506
9,009 7,056
Non-current
Finance lease liabilities 4,060 4,459
13,069 11,515

Example Consolidated Financial Statements 2013 57
IFRS 7.25 With the exception of the non-current part of finance lease liabilities, all amounts are IFRS 7.29 short-term. The carrying values of trade payables and short-term bank overdrafts are
considered to be a reasonable approximation of fair value. The fair value of the Group’s finance lease liabilities has been estimated at CU 4,608,000
(2012: CU 5,114,000). This amount reflects present value and takes into account interest ratesavailable on secured bank borrowings on similar terms. See Note 12.1 for further information.
24. Other liabilitiesOther liabilities consist of the following:
2013 2012(Restated)
CU’000 CU’000Due to customers for construction contract work 288 207
Advances received for construction contract work 225 220
Deferred service income 2,123 2,291
Other 22 657
Deferred gain 100 100
Other liabilities – current 2,758 3,475
Contingent consideration for the acquisition of Goodtech 620 –
Deferred gain 1,400 1,500
Other liabilities – non-current 2,020 1,500
The deferred gain relates to a sale and leaseback of an office and production building in 2005.The excess of proceeds received over fair value was deferred and is being amortised over thelease term of 15 years. In 2013, deferred income of CU 100,000 (2012: CU 100,000) wasrecognised in profit or loss relating to this transaction. The subsequent leasing agreement istreated as an operating lease (see Note 12.2). The non-current part of the deferred gain will beamortised between 2015 and the end of the lease term.
IAS 1.69 All amounts recognised relating to deferred service income are considered current as theIAS 1.61 timing of service commitments is not at the discretion of the Group. Assuming an average
remaining term of service on service contracts at 31 December 2013 of 32 months (2012: 38months) and constant service activity over the remaining term, the Group expects to amortiseCU 796,000 of deferred service income during 2014 (2013: CU 723,000; 2012: CU 772,000), andCU 1,327,000 after that time (2013: CU 1,568,000; 2012: CU 1,781,000).
The amounts recognised in respect of construction contracts will generally be utilisedwithin the next reporting period (see Note 17.1).

58 Example Consolidated Financial Statements 2013
25. Finance costs and finance incomeFinance costs for the reporting periods consist of the following:
2013 2012(Restated)
CU’000 CU’000IFRS 7.20(b) Interest expenses for borrowings at amortised cost:
– Subordinated shareholder loan 200 200
– Other borrowings at amortised cost 595 555
795 755Interest expenses for finance lease arrangements 220 230
IFRS 7.20(b) Total interest expenses for financial liabilities not at FVTPL 1,015 985IAS 23.26(a) Less: interest expenses capitalised into intangible assets (80) (78)
935 907
IAS 19.141(b) Net interest expense on defined benefit liability 505 549
Unwinding of discount relating to contingent consideration liability 20 –
IFRS 7.20(a)(i) Loss on foreign currency financial liabilities designated at FVTPL 30 70
IFRS 7.20(e) Impairment of investment in XY Ltd (AFS) – 350
1,490 1,876
IAS 23.26(b) Interest expense capitalised into intangible assets were capitalised at a rate of 4.4% per annum(2012: 4.5%).
IFRS 7.B5(e) The loss on foreign currency financial liabilities designated at FVTPL takes account ofinterest payments on these loans.
IFRS 7.20(e) An impairment loss was recognised in 2012 for the investment in XY Ltd, which is carriedat cost less impairment charges as its fair value cannot be measured reliably (see Note 14.3).Finance income for the reporting periods consists of the following:
2013 2012(Restated)
CU’000 CU’000Interest income from cash and cash equivalents 583 266
IFRS 7.20(b) Interest income on financial assets carried at amortised
cost and AFS financial assets 169 181
IFRS 7.20(b) Total interest income for financial assets not at FVTPL 752 447 IAS 18.35(b)(v) Dividend income from XY Ltd (AFS) 40 –
IAS 18.35(b)(v) Dividend income from listed equity securities (AFS) 22 21
IFRS 7.20(a)(i) Fair value gains on forward exchange contracts held for trading 130 325
IFRS 7.20(a)(ii) Gains on AFS assets reclassified from other comprehensive income 50 –
994 793
26. Other financial itemsOther financial items consist of the following:
2013 2012(Restated)
CU’000 CU’000IFRS 7.20(a)(i) Gain from financial assets classified as held for trading (FVTPL) 6 18
IAS 21.52(a),
IFRS 7.20(a)(iv) Gain from exchange differences on loans and receivables 937 1,164
943 1,182

Example Consolidated Financial Statements 2013 59
27. Tax expenseThe major components of tax expense and the reconciliation of the expected tax expense basedon the domestic effective tax rate of Illustrative Corporation at 30% (2012: 30%) and thereported tax expense in profit or loss are as follows:
2013 2012(Restated)
CU’000 CU’000IAS 12.81(c)(i) Profit before tax 22,392 19,334
IAS 12.85 Domestic tax rate for Illustrative Corporation 30% 30%
Expected tax expense 6,718 5,800
IAS 12.84 Adjustment for tax-rate differences in foreign jurisdictions 16 18
IAS 12.84 Adjustment for tax-exempt income:
– Relating to equity accounted investments (18) (4)
– Other tax-exempt income (63) (117)
IAS 12.84 Adjustment for non-deductible expenses:
– Relating to goodwill impairment 240 57
– Other non-deductible expenses 17 9
Actual tax expense 6,910 5,763
IAS 12.79,
IAS 12.80 Tax expense comprises:
IAS 12.80(a) Current tax expense 5,798 5,164
Deferred tax expense:
IAS 12.80(c) – Origination and reversal of temporary differences 1,037 374
– Utilisation of unused tax losses 75 225
Tax expense 6,910 5,763
Deferred tax expense (income), recognised directly in other comprehensive income 1,064 (1,157)
IAS 12.81(ab)Note 15 provides information on deferred tax assets and liabilities. Note 20.3 providesinformation on deferred income tax recognised directly in each component of othercomprehensive income.
28. Earnings per share and dividendsEarnings per share
IAS 33.70(a) Both the basic and diluted earnings per share have been calculated using the profit attributableto shareholders of the parent company (Illustrative Corporation) as the numerator, ie noadjustments to profit were necessary in 2012 or 2013.
IAS 33.70(b) The reconciliation of the weighted average number of shares for the purposes of dilutedearnings per share to the weighted average number of ordinary shares used in the calculation ofbasic earnings per share is as follows:
Amounts in thousand shares: 2013 2012CU’000 CU’000
Weighted average number of shares used in basic earnings per share 12,520 12,000
Shares deemed to be issued for no consideration in respect of share-based payments 17 21
Weighted average number of shares used in diluted earnings per share 12,537 12,021
Guidance note: Tax expenseExamples of majorcomponents of taxexpense are included inIAS 12.80.
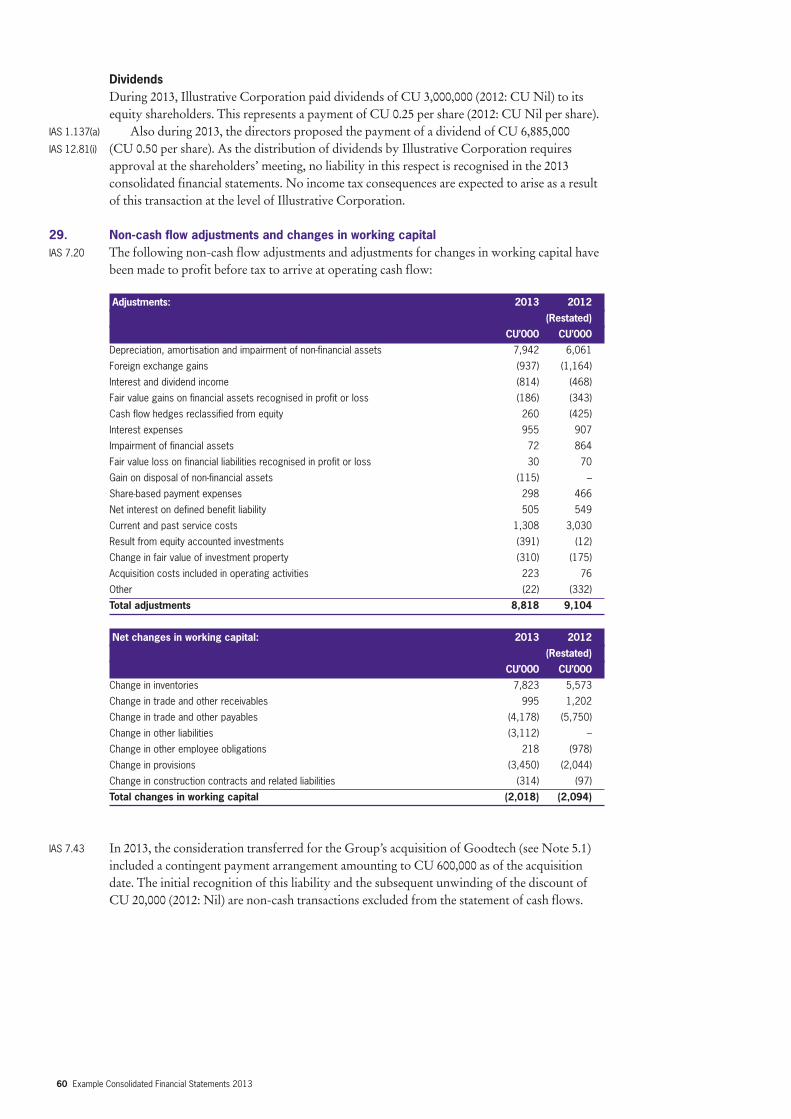
60 Example Consolidated Financial Statements 2013
DividendsDuring 2013, Illustrative Corporation paid dividends of CU 3,000,000 (2012: CU Nil) to itsequity shareholders. This represents a payment of CU 0.25 per share (2012: CU Nil per share).
IAS 1.137(a) Also during 2013, the directors proposed the payment of a dividend of CU 6,885,000IAS 12.81(i) (CU 0.50 per share). As the distribution of dividends by Illustrative Corporation requires
approval at the shareholders’ meeting, no liability in this respect is recognised in the 2013consolidated financial statements. No income tax consequences are expected to arise as a resultof this transaction at the level of Illustrative Corporation.
29. Non-cash flow adjustments and changes in working capitalIAS 7.20 The following non-cash flow adjustments and adjustments for changes in working capital have
been made to profit before tax to arrive at operating cash flow:
Adjustments: 2013 2012(Restated)
CU’000 CU’000Depreciation, amortisation and impairment of non-financial assets 7,942 6,061
Foreign exchange gains (937) (1,164)
Interest and dividend income (814) (468)
Fair value gains on financial assets recognised in profit or loss (186) (343)
Cash flow hedges reclassified from equity 260 (425)
Interest expenses 955 907
Impairment of financial assets 72 864
Fair value loss on financial liabilities recognised in profit or loss 30 70
Gain on disposal of non-financial assets (115) –
Share-based payment expenses 298 466
Net interest on defined benefit liability 505 549
Current and past service costs 1,308 3,030
Result from equity accounted investments (391) (12)
Change in fair value of investment property (310) (175)
Acquisition costs included in operating activities 223 76
Other (22) (332)
Total adjustments 8,818 9,104
Net changes in working capital: 2013 2012(Restated)
CU’000 CU’000Change in inventories 7,823 5,573
Change in trade and other receivables 995 1,202
Change in trade and other payables (4,178) (5,750)
Change in other liabilities (3,112) –
Change in other employee obligations 218 (978)
Change in provisions (3,450) (2,044)
Change in construction contracts and related liabilities (314) (97)
Total changes in working capital (2,018) (2,094)
IAS 7.43 In 2013, the consideration transferred for the Group’s acquisition of Goodtech (see Note 5.1)included a contingent payment arrangement amounting to CU 600,000 as of the acquisitiondate. The initial recognition of this liability and the subsequent unwinding of the discount ofCU 20,000 (2012: Nil) are non-cash transactions excluded from the statement of cash flows.

Example Consolidated Financial Statements 2013 61
30. Related party transactionsThe Group’s related parties include its associates and joint venture, key management, post-employment benefit plans for the Group’s employees and others as described below. Inaddition, Illustrative Corporation has a subordinated loan from its main shareholder, the LOMInvestment Trust (see Note 14.6 for information on terms and conditions), on which interest ofCU 200,000 (2012: CU 200,000) is paid.
IAS 24.18(b)(i) Unless otherwise stated, none of the transactions incorporate special terms and conditionsIAS 24.18(b)(ii) and no guarantees were given or received. Outstanding balances are usually settled in cash.
IAS 24.19(d) 30.1 Transactions with associatesIAS 24.18(a) In order to meet peak demands by its customers, the Group has some of its consulting services IAS 24.18(b) carried out by professionals of its associate, Equipe. During 2013, Equipe provided services
valued at CU 568,000 (2012: CU 590,000). The outstanding balance of CU 20,000 (2012: CU22,000) due to Equipe is included in trade payables.
IAS 24.19(e) 30.2 Transactions with joint venturesIAS 24.18(a) During 2013, Halftime provided services valued at CU 10,000 (2012: CU 3,000). ThereIAS 24.18(b) is no outstanding balance as at 31 December 2013 (2012: Nil).
IAS 24.19(f) 30.3 Transactions with key management personnelKey management of the Group are the executive members of Illustrative Corporation’s boardof directors and members of the executive council. Key management personnel remunerationincludes the following expenses:
2013 2012(Restated)
CU’000 CU’000IAS 24.17(a) Short-term employee benefits:
– Salaries including bonuses 2,420 2,210
– Social security costs 70 34
– Company car allowance 220 190
2,710 2,434
IAS 24.17(b) Post-employment benefits:
– Defined benefit pension plans 312 299
– Defined contribution pension plans 25 12
337 311
IAS 24.17(d) Termination benefits 100 –
IAS 24.17(e) Share-based payments 103 175
Total remuneration 3,250 2,920
IAS 24.18 During 2013, certain key management personnel exercised share options with total exerciseprice of CU 1,685,000 (2012: Nil) granted in the Group’s Star Programme.
IAS 24.18(a) The Group allows its employees to take up limited short-term loans to fund merchandiseIAS 24.18(b) and other purchases through the Group’s business contacts. This facility is also available to the
Group’s key management personnel. During 2013, the Group’s key management received shortterm loans totalling CU 40,000 (2012: CU 38,000). The outstanding balance of CU 1,000 (2012:CU 1,000) has been included in trade and other receivables.
During 2013, the Group used the legal services of one company director and the law firmover which he exercises significant influence. The amount billed related to this legal serviceamounted to CU 21,000 (2012: Nil), based on normal market rates and was fully paid as of thereporting date.

62 Example Consolidated Financial Statements 2013
30.4 Transactions with the defined benefit planIAS 24.9(b)(v) The defined benefit plan is a related party. The defined benefit plan does not hold shares in
Illustrative Corporation. The Group’s only transaction with the defined benefit plan relate tocontributions paid to the plan (see Note 21.3).
31. Contingent liabilitiesIAS 1.114(d)(i) Various warranty and legal claims were brought against the Group during the year. UnlessIAS 37.86 recognised as a provision (see Note 22), management considers these claims to be unjustified
and the probability that they will require settlement at the Group’s expense to be remote. Thisevaluation is consistent with external independent legal advice.
IAS 37.92 Further information on these contingencies is omitted so as not to seriously prejudice theGroup’s position in the related disputes.
32. Financial instruments riskIAS 1.114(d)(ii) Risk management objectives and policiesIFRS 7.33 The Group is exposed to various risks in relation to financial instruments. The Group’s
financial assets and liabilities by category are summarised in Note 14.1. The main types of risksare market risk, credit risk and liquidity risk.
IFRS 7.IG15 The Group’s risk management is coordinated at its headquarters, in close cooperation withthe board of directors, and focuses on actively securing the Group’s short to medium-term cashflows by minimising the exposure to financial markets. Long-term financial investments aremanaged to generate lasting returns.
The Group does not actively engage in the trading of financial assets for speculativepurposes nor does it write options. The most significant financial risks to which the Group isexposed are described below.
32.1 Market risk analysisThe Group is exposed to market risk through its use of financial instruments and specifically tocurrency risk, interest rate risk and certain other price risks, which result from both itsoperating and investing activities.
IFRS 7.33(a) Foreign currency sensitivityMost of the Group’s transactions are carried out in CU. Exposures to currency exchange ratesarise from the Group’s overseas sales and purchases, which are primarily denominated in USdollars (USD) and Pounds Sterling (GBP). The Group also holds an investment in a USDbond. Further, the Group has a USD loan designated at fair value through profit or loss, whichhas been used to fund the purchase of investment property in the United States.
IFRS 7.33(b) To mitigate the Group’s exposure to foreign currency risk, non-CU cash flows areIFRS 7.IG15 monitored and forward exchange contracts are entered into in accordance with the Group’s
risk management policies. Generally, the Group’s risk management procedures distinguishshort-term foreign currency cash flows (due within 6 months) from longer-term cash flows(due after 6 months). Where the amounts to be paid and received in a specific currency areexpected to largely offset one another, no further hedging activity is undertaken. Forwardexchange contracts are mainly entered into for significant long-term foreign currencyexposures that are not expected to be offset by other currency transactions.
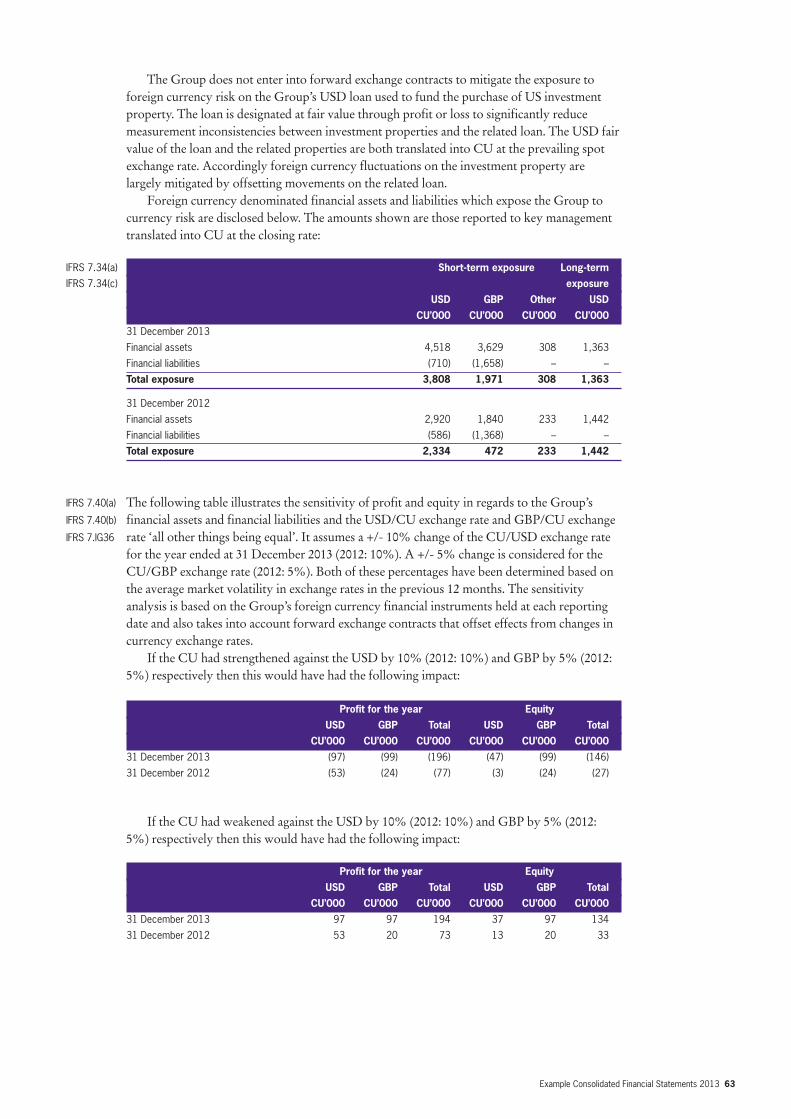
Example Consolidated Financial Statements 2013 63
The Group does not enter into forward exchange contracts to mitigate the exposure toforeign currency risk on the Group’s USD loan used to fund the purchase of US investmentproperty. The loan is designated at fair value through profit or loss to significantly reducemeasurement inconsistencies between investment properties and the related loan. The USD fairvalue of the loan and the related properties are both translated into CU at the prevailing spotexchange rate. Accordingly foreign currency fluctuations on the investment property arelargely mitigated by offsetting movements on the related loan.
Foreign currency denominated financial assets and liabilities which expose the Group tocurrency risk are disclosed below. The amounts shown are those reported to key managementtranslated into CU at the closing rate:
IFRS 7.34(a) Short-term exposure Long-term IFRS 7.34(c) exposure
USD GBP Other USDCU’000 CU’000 CU’000 CU’000
31 December 2013
Financial assets 4,518 3,629 308 1,363
Financial liabilities (710) (1,658) – –
Total exposure 3,808 1,971 308 1,363
31 December 2012
Financial assets 2,920 1,840 233 1,442
Financial liabilities (586) (1,368) – –
Total exposure 2,334 472 233 1,442
IFRS 7.40(a) The following table illustrates the sensitivity of profit and equity in regards to the Group’sIFRS 7.40(b) financial assets and financial liabilities and the USD/CU exchange rate and GBP/CU exchangeIFRS 7.IG36 rate ‘all other things being equal’. It assumes a +/- 10% change of the CU/USD exchange rate
for the year ended at 31 December 2013 (2012: 10%). A +/- 5% change is considered for theCU/GBP exchange rate (2012: 5%). Both of these percentages have been determined based onthe average market volatility in exchange rates in the previous 12 months. The sensitivityanalysis is based on the Group’s foreign currency financial instruments held at each reportingdate and also takes into account forward exchange contracts that offset effects from changes incurrency exchange rates.
If the CU had strengthened against the USD by 10% (2012: 10%) and GBP by 5% (2012:5%) respectively then this would have had the following impact:
Profit for the year EquityUSD GBP Total USD GBP Total
CU’000 CU’000 CU’000 CU’000 CU’000 CU’00031 December 2013 (97) (99) (196) (47) (99) (146)
31 December 2012 (53) (24) (77) (3) (24) (27)
If the CU had weakened against the USD by 10% (2012: 10%) and GBP by 5% (2012:5%) respectively then this would have had the following impact:
Profit for the year EquityUSD GBP Total USD GBP Total
CU’000 CU’000 CU’000 CU’000 CU’000 CU’00031 December 2013 97 97 194 37 97 134
31 December 2012 53 20 73 13 20 33

64 Example Consolidated Financial Statements 2013
IFRS 7.42 Exposures to foreign exchange rates vary during the year depending on the volume of overseastransactions. Nonetheless, the analysis above is considered to be representative of the Group’sexposure to currency risk.
IFRS 7.33(a) Interest rate sensitivityIFRS 7.33(b) The Group’s policy is to minimise interest rate cash flow risk exposures on long-term
financing. Longer-term borrowings are therefore usually at fixed rates. At 31 December 2013,the Group is exposed to changes in market interest rates through bank borrowings at variableinterest rates. Other borrowings are at fixed interest rates. The Group’s investments in bondsall pay fixed interest rates. The exposure to interest rates for the Group’s money market fundsis considered immaterial.
IFRS 7.40(b) The following table illustrates the sensitivity of profit and equity to a reasonablyIFRS 7.IG36 possible change in interest rates of +/- 1% (2012: +/- 1%). These changes are considered to be
reasonably possible based on observation of current market conditions. The calculations arebased on a change in the average market interest rate for each period, and the financialinstruments held at each reporting date that are sensitive to changes in interest rates. All othervariables are held constant.
Profit for the year EquityCU’000 CU’000 CU’000 CU’000
+1% -1% +1% -1%
IFRS 7.40(a) 31 December 2013 36 (36) 26 (16)
31 December 2012 32 (32) 23 (14)
IFRS 7.33(a) Other price sensitivityThe Group is exposed to other price risk in respect of its listed equity securities, the investmentin XY Ltd and debentures (see Note 14.3).
IFRS 7.40(a) For the listed equity securities, an average volatility of 20% has been observed during 2013IFRS 7.40(b) (2012: 18%). This volatility figure is considered to be a suitable basis for estimating how profit
or loss and equity would have been affected by changes in market risk that were reasonablypossible at the reporting date. If the quoted stock price for these securities increased ordecreased by that amount, other comprehensive income and equity would have changed byCU 85,000 (2012: CU 62,000). The listed securities are classified as AFS so there would be noeffect on profit or loss unless any decline in fair value below cost is determined to be animpairment (for example if the decline is significant or prolonged).
IFRS 7.40(b) The Group’s sensitivity to price risk in regards to its investment in XY Ltd cannot bereliably determined due to numerous uncertainties regarding the future development of thiscompany (see Note 14.3 for further information).
IFRS 7.33(b) The investments in listed equity securities and in XY Ltd are considered long-term,strategic investments. In accordance with the Group’s policies, no specific hedging activities areundertaken in relation to these investments. The investments are continuously monitored andvoting rights arising from these equity instruments are utilised in the Group’s favour.
IFRS 7.40(a) The average volatility of the listed debentures was 15% in 2013 (2012: 13%). If the marketIFRS 7.40(b) price had increased or decreased by this amount, other comprehensive income and equity
would have increased/decreased by CU 15,000 (2012: CU 15,000). As none of the debenturesclassified as AFS were sold during any of the periods under review, no effect on profit or losswould have occurred (unless any decline in fair value to below cost is considered to result fromimpairment of the asset).

Example Consolidated Financial Statements 2013 65
32.2 Credit risk analysisIFRS 7.33(a) Credit risk is the risk that a counterparty fails to discharge an obligation to the Group. The IFRS 7.36(a) Group is exposed to this risk for various financial instruments, for example by granting loans
and receivables to customers, placing deposits, investment in bonds etc. The Group’s maximumexposure to credit risk is limited to the carrying amount of financial assets recognised at 31December, as summarised below:
IFRS 7.34(a) 2013 2012(Restated)
CU’000 CU’000Classes of financial assets – carrying amounts:
– Bonds 2,814 2,992
– Listed equity securities and debentures 518 455
– Money market funds 655 649
– Derivative financial instruments 582 212
– Cash and cash equivalents 34,729 11,197
– Trade and other receivables 30,945 23,441
70,243 38,946
IFRS 7.33(b) The Group continuously monitors defaults of customers and other counterparties, identifiedeither individually or by the Group, and incorporates this information into its credit riskcontrols. Where available at reasonable cost, external credit ratings and/or reports on customersand other counterparties are obtained and used. The Group’s policy is to deal only withcreditworthy counterparties.
IFRS 7.36(c) The Group’s management considers that all of the above financial assets that are notimpaired or past due for each of the 31 December reporting dates under review are of goodcredit quality.
IFRS 7.37(a) At 31 December the Group has certain trade receivables that have not been settled by theIFRS 7.IG28 contractual due date but are not considered to be impaired. The amounts at 31 December,
analysed by the length of time past due, are:
2013 2012CU’000 CU’000
Not more than 3 months 671 602
More than 3 months but not more than 6 months 90 88
More than 6 months but not more than 1 year 55 15
More than one year 2 1
Total 818 706
IFRS 7.36(c) In respect of trade and other receivables, the Group is not exposed to any significant creditIFRS 7.IG23 risk exposure to any single counterparty or any group of counterparties having similar
characteristics. Trade receivables consist of a large number of customers in various industriesand geographical areas. Based on historical information about customer default ratesmanagement consider the credit quality of trade receivables that are not past due or impairedto be good.
IFRS 7.36(c) The credit risk for cash and cash equivalents, money market funds, debentures and derivatefinancial instruments is considered negligible, since the counterparties are reputable banks withhigh quality external credit ratings.
IFRS 7.36(a) No impairment loss has been recorded in relation to the bonds (HTM investments, seeIFRS 7.36(c) Note 14.2) which have been graded AA by Standard & Poor’s and are not past due. TheIFRS 7.IG23(a) carrying amounts disclosed above are the Group’s maximum possible credit risk exposureIFRS 7.20(e) in relation to these instruments.

66 Example Consolidated Financial Statements 2013
32.3 Liquidity risk analysisIFRS 7.33(a) Liquidity risk is that the Group might be unable to meet its obligations. The Group managesIFRS 7.33(b) its liquidity needs by monitoring scheduled debt servicing payments for long-term financialIFRS 7.39(c) liabilities as well as forecast cash inflows and outflows due in day-to-day business. The data
used for analysing these cash flows is consistent with that used in the contractual maturityanalysis below. Liquidity needs are monitored in various time bands, on a day-to-day andweek-to-week basis, as well as on the basis of a rolling 30-day projection. Long-term liquidityneeds for a 180-day and a 360-day lookout period are identified monthly. Net cashrequirements are compared to available borrowing facilities in order to determine headroom orany shortfalls. This analysis shows that available borrowing facilities are expected to besufficient over the lookout period.
IFRS 7.39(c) The Group’s objective is to maintain cash and marketable securities to meet its liquidityIFRS 7.B11F requirements for 30-day periods at a minimum. This objective was met for the reporting
periods. Funding for long-term liquidity needs is additionally secured by an adequate amountof committed credit facilities and the ability to sell long-term financial assets.
The Group considers expected cash flows from financial assets in assessing and managingliquidity risk, in particular its cash resources and trade receivables. The Group’s existing cashresources and trade receivables (see Note 14) significantly exceed the current cash outflowrequirements. Cash flows from trade and other receivables are all contractually due within six months.
As at 31 December 2013, the Group’s non-derivative financial liabilities have contractualmaturities (including interest payments where applicable) as summarised below:
IFRS 7.39(a) 31 December 2013 Current Non-currentIFRS 7.B11 within 6 6 to 12 1 to 5 later than
months months years 5 yearsCU’000 CU’000 CU’000 CU’000
US-dollar loans 280 280 1,761 8,215
Other bank borrowings 4,565 – – –
Non-convertible bond 208 208 8,888 –
Finance lease obligations 364 364 1,415 3,539
Trade and other payables 8,547 – – –
Total 13,964 852 12,064 11,754
This compares to the maturity of the Group’s non-derivative financial liabilities in the previousreporting periods as follows:
IFRS 7.39(a) 31 December 2012 Current Non-currentIFRS 7.B11 within 6 6 to 12 1 to 5 later than
months months years 5 years(Restated)
CU’000 CU’000 CU’000 CU’000US-dollar loans 289 289 1,781 8,508
Other bank borrowings 3,124 – – –
Non-convertible bond 208 208 9,303 –
Finance lease obligations 363 363 1,432 4,072
Trade and other payables 6,590 – – –
Total 10,574 860 12,516 12,580

Example Consolidated Financial Statements 2013 67
The above amounts reflect the contractual undiscounted cash flows, which may differ to thecarrying values of the liabilities at the reporting date. The subordinated shareholder loanamounting to CU 5,000,000 throughout all reporting periods is not included as this is onlyrepayable upon liquidation of Illustrative Corporation. Annual interest payments amount toCU 200,000.
In assessing and managing liquidity risks of its derivative financial instruments, the Groupconsiders both contractual inflows and outflows. As at 31 December 2013, the contractual cashflows of the Group’s derivative financial assets and liabilities are as follows:
IFRS 7.39(b) 31 December 2013 CurrentIFRS 7.B11 within 6 6 to 12
months monthsCU’000 CU’000
Gross-settled forward contracts
Cash outflow (212) (6,978)
Cash inflow 300 7,509
Total 88 531
IFRS 7.34(a) This compares to the contractual cash flows of the Group’s derivative financial assets andliabilities in the previous reporting periods as follows:
IFRS 7.39(b) 31 December 2012 CurrentIFRS 7.B11 within 6 6 to 12
months monthsCU’000 CU’000
Gross-settled forward contracts
Cash outflow (190) (7,100)
Cash inflow 203 7,050
Total 13 (50)
Derivative financial instruments reflect forward exchange contracts (see Note 14.5) that will besettled on a gross basis.
33. Fair value measurement33.1 Fair value measurement of financial instrumentsFinancial assets and financial liabilities measured at fair value in the statement of financialposition are grouped into three Levels of a fair value hierarchy. The three Levels are definedbased on the observability of significant inputs to the measurement, as follows:• Level 1: quoted prices (unadjusted) in active markets for identical assets or liabilities • Level 2: inputs other than quoted prices included within Level 1 that are observable for the
asset or liability, either directly or indirectly• Level 3: unobservable inputs for the asset or liability.
Guidance note: Fair valuemeasurement offinancial instrumentsIFRS 13 is appliedprospectively from 1January 2013. Itstransition provisionsinclude relief fromapplication of thedisclosure requirementsin comparativeinformation in the firstyear. However, some ofthe new disclosurerequirements, in as faras they apply tofinancial instruments,were previously requiredby IFRS 7. In thisPublication theapplicable disclosuresthat were provided lastyear in accordance withIFRS 7 are included ascomparative informationin the current period.

68 Example Consolidated Financial Statements 2013
The following table shows the Levels within the hierarchy of financial assets and liabilitiesmeasured at fair value on a recurring basis at 31 December 2013 and 31 December 2012:
IFRS 13.93 31 December 2013 Level 1 Level 2 Level 3 Total(a)-(b) CU’000 CU’000 CU’000 CU’000IFRS 13.94 Financial assets
Listed securities and debentures 518 – – 518
Money market funds 655 – – 655
US-dollar forward contracts – cash flow hedge – 467 – 467
Other forward exchange contracts – held-for-trading – 115 – 115
Total assets 1,173 582 – 1,755
Financial liabilitiesUS-dollar loans – (7,950) – (7,950)
Contingent consideration – – (620) (620)
Total liabilities – (7,950) (620) (8,570)
Net fair value 1,173 (7,368) (620) (6,815)
31 December 2012 Level 1 Level 2 Level 3 TotalCU’000 CU’000 CU’000 CU’000
Financial assetsListed securities and debentures 455 – – 455
Money market funds 649 – – 649
Other forward exchange contracts – held-for-trading – 212 – 212
Total assets 1,104 212 – 1,316
Financial liabilitiesUS-dollar forward contracts – cash flow hedge – (160) – (160)
US-dollar loans – (8,220) – (8,220)
Total liabilities – (8,380) – (8,380)
Net fair value 1,104 (8,168) – (7,064)
IFRS 13.93(c) There were no transfers between Level 1 and Level 2 in 2013 or 2012.
Measurement of fair value of financial instrumentsIFRS 13.93(d) The Group’s finance team performs valuations of financial items for financial reporting IFRS 13.93(g) purposes, including Level 3 fair values, in consultation with third party valuation specialists for
complex valuations. Valuation techniques are selected based on the characteristics of eachinstrument, with the overall objective of maximising the use of market-based information. Thefinance team reports directly to the chief financial officer (CFO) and to the audit committee.Valuation processes and fair value changes are discussed among the audit committee and thevaluation team at least every year, in line with the Group’s reporting dates.
The valuation techniques used for instruments categorised in Levels 2 and 3 are described below:

Example Consolidated Financial Statements 2013 69
Foreign currency forward contracts (Level 2)The Group’s foreign currency forward contracts are not traded in active markets. These havebeen fair valued using observable forward exchange rates and interest rates corresponding tothe maturity of the contract. The effects of non-observable inputs are not significant for foreigncurrency forward contracts.
US-dollar loans (Level 2)The fair values of the US-dollar loans are estimated using a discounted cash flow approach,which discounts the contractual cash flows using discount rates derived from observablemarket interest rates of similar loans with similar risk. The interest rate used for this calculationis 3.9%.
Contingent consideration (Level 3)IFRS 13.93(d) The fair value of contingent consideration related to the acquisition of Goodtech (see Note 5.1)IFRS 13.93(h) is estimated using a present value technique. The CU 620,000 fair value is estimated by
probability-weighting the estimated future cash outflows, adjusting for risk and discounting at4.4%. The probability-weighted cash outflows before discounting are CU 655,000 and reflectthe management’s estimate of a 50% probability that the contract’s target level will be achieved.The discount rate used is 4.4%, based on the Group’s estimated incremental borrowing rate forunsecured liabilities at the reporting date, and therefore reflects the Group’s credit position.The effects on the fair value of risk and uncertainty in the future cash flows are dealt with byadjusting the estimated cash flows rather than adjusting the discount rate.
The following table provides information about the sensitivity of the fair valuemeasurement to changes in the most significant inputs:
Significant Estimate of Sensitivity of the fair value measurement to inputunobservable input the inputProbability of meeting 50% An increase to 60% (decrease to 40%) would increase (decrease)
target fair value by CU 125,000.
Level 3 fair value measurements The reconciliation of the carrying amounts of financial instruments classified within Level 3 isas follows:
Contingent consideration2013 2012
CU’000 CU’000IFRS 13.93(e) Balance at 1 January 2013 – –
IFRS 13.93 Acquired through business combination (600) –
(e)(iii)
IFRS 13.93 losses recognised in profit or loss under:
(e)(i) – finance costs (20) –
Balance at 31 December 2013 (620) –
IFRS 13.93(f) Total amount included in profit or loss for unrealised losses (20) –
on Level 3 instruments under finance costs
Financial instruments measured at amortised cost for which the fair value is disclosedIFRS 13.97 See Notes 14.2 and 14.6.

70 Example Consolidated Financial Statements 2013
33.2 Fair value measurement of non-financial assets The following table shows the Levels within the hierarchy of non-financial assets measured atfair value on a recurring basis at 31 December 2013:
IFRS 13.93 31 December 2013 Level 1 Level 2 Level 3 Total(a)-(b) CU’000 CU’000 CU’000 CU’000IFRS 13.94 Property, plant and equipment:
– land held for production in Euroland – – 7,979 7,979
– Goodtech land – – 730 730
Investment property:– office building in Euroland – – 4,552 4,552
– Goodtech investment property – – 75 75
– office building in the US – – 8,035 8,035
IFRS 13.93(d) Fair value of the Group’s main property assets is estimated based on appraisals performed byIAS 40.75(e) independent, professionally-qualified property valuers. The significant inputs and assumptions
are developed in close consultation with management. The valuation processes and fair valuechanges are reviewed by the board of directors and audit committee at each reporting date.Further information is set out below.
Land held for production in Euroland (Level 3)IFRS 13.93(d) The appraisal was carried out using a market approach that reflects observed prices for recentIFRS 13.93(g) market transactions for similar properties and incorporates adjustments for factors specificIAS 16.77(a) to the land in question, including plot size, location, encumbrances and current use. IAS 16.77(b) In 2013, a negative adjustment of 7.5% was incorporated for these factors. The land was
revalued on 23 November 2013. The land was previously revalued in November 2011. IFRS 13.93(h) The significant unobservable input is the adjustment for factors specific to the land in
question. The extent and direction of this adjustment depends on the number andcharacteristics of the observable market transactions in similar properties that are used as thestarting point for valuation. Although this input is a subjective judgement, managementconsiders that the overall valuation would not be materially affected by reasonably possiblealternative assumptions.
IFRS 13.93(d) Land with a fair value of CU 730,000, recognised upon the acquisition of Goodtech inMarch 2013 (see Note 5.1), was not revalued at the reporting date. Management determinedthat the effect of changes in fair values between the acquisition and reporting date is immaterial.
Office buildings in Euroland and the US (Level 3)IFRS 13.93(d) The fair values of the office buildings are estimated using an income approach which capitalises
the estimated rental income stream, net of projected operating costs, using a discount ratederived from market yields implied by recent transactions in similar properties. When actualrent differs materially from the estimated rents, adjustments has been made to the estimatedrental value. The estimated rental stream takes into account current occupancy level, estimatesof future vacancy levels, the terms of in-place leases and expectations for rentals from futureleases over the remaining economic life of the buildings. The office buildings are revaluedannually on 31 December.
IFRS 13.93(h) The most significant inputs, all of which are unobservable, are the estimated rental value,assumptions about vacancy levels and the discount rate. The estimated fair value increases if theestimated rental increases, vacancy levels decline or if discount rate (market yields) decline. Theoverall valuations are sensitive to all three assumptions. Management considers the range ofreasonably possible alternative assumptions is greatest for rental values and vacancy levels andthat there is also an interrelationship between these inputs. The inputs used in the valuations at31 December 2013 were:

Example Consolidated Financial Statements 2013 71
Euroland USRental value CU 108/sqm USD 65/sqm
Vacancy levels 9% 11%
Discount rate (market yield) 4.4% 3.7%
IFRS 13.93(d) An investment property with a fair value of CU 75,000, recognised upon the acquisition ofGoodtech (see Note 5.1) in March 2013, was not revalued at the reporting date. Managementdetermined that the effect of changes in fair values between the acquisition and reporting date isimmaterial.
The reconciliation of the carrying amounts of non-financial assets classified within Level 3 is as follows:
PP&E Investment properties
Land held Euroland USfor production
CU’000 CU’000 CU’000IFRS 13.93(e) Balance at 1 January 2013 7,697 4,366 7,911
IFRS 13.93(e)(i) Gains recognised in profit or loss:
– increase in fair value of investment property – 186 124
IFRS 13.93(e)(ii) Gains recognised in other comprehensive income:
– revaluation of land 303 – –
– exchange differences on translating foreign operations (21) – –
IFRS 13.93(e)(iii) Acquired in business combination 730 75 –
Balance at 31 December 2013 8,709 4,627 8,035
IFRS 13.93(f) Total amount included in profit or loss for unrealised gains on Level 3 assets – 186 124
34. Capital management policies and proceduresThe Group’ s capital management objectives are:• to ensure the Group’s ability to continue as a going concern• to provide an adequate return to shareholders
by pricing products and services commensurately with the level of risk.IAS 1.135(a)(i) The Group monitors capital on the basis of the carrying amount of equity plus its
subordinated loan, less cash and cash equivalents as presented on the face of the statement offinancial position and cash flow hedges recognised in other comprehensive income.
IAS 1.135(a)(ii) The Group’s goal in capital management is to maintain a capital-to-overall financing ratioof 1:6 to 1:4. This is in line with the Group’s covenants resulting included in the terms of thesubordinated loan from its main shareholder advanced in 2010 (see Note 14.6).
IAS 1.135(a)(iii) Management assesses the Group’s capital requirements in order to maintain an efficientoverall financing structure while avoiding excessive leverage. This takes into account thesubordination levels of the Group’s various classes of debt. The Group manages the capitalstructure and makes adjustments to it in the light of changes in economic conditions and therisk characteristics of the underlying assets. In order to maintain or adjust the capital structure,the Group may adjust the amount of dividends paid to shareholders, return capital toshareholders, issue new shares, or sell assets to reduce debt.
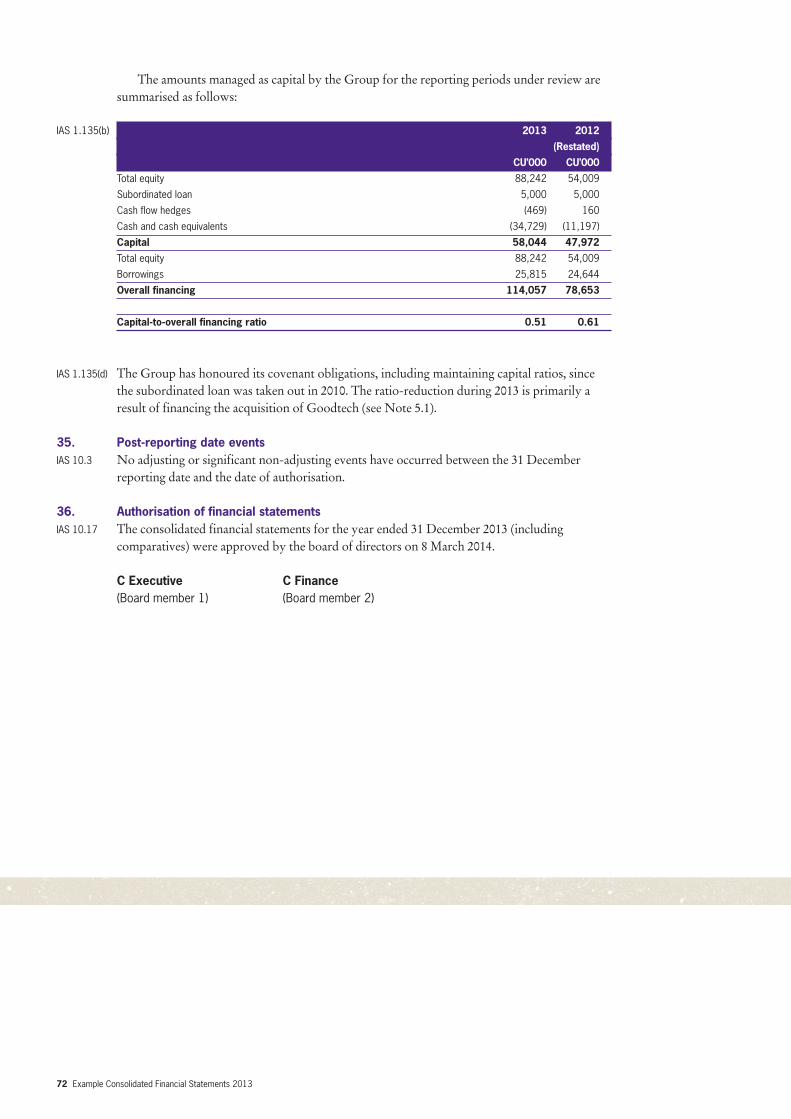
The amounts managed as capital by the Group for the reporting periods under review aresummarised as follows:
IAS 1.135(b) 2013 2012(Restated)
CU’000 CU’000Total equity 88,242 54,009
Subordinated loan 5,000 5,000
Cash flow hedges (469) 160
Cash and cash equivalents (34,729) (11,197)
Capital 58,044 47,972 Total equity 88,242 54,009
Borrowings 25,815 24,644
Overall financing 114,057 78,653
Capital-to-overall financing ratio 0.51 0.61
IAS 1.135(d) The Group has honoured its covenant obligations, including maintaining capital ratios, sincethe subordinated loan was taken out in 2010. The ratio-reduction during 2013 is primarily aresult of financing the acquisition of Goodtech (see Note 5.1).
35. Post-reporting date eventsIAS 10.3 No adjusting or significant non-adjusting events have occurred between the 31 December
reporting date and the date of authorisation.
36. Authorisation of financial statementsIAS 10.17 The consolidated financial statements for the year ended 31 December 2013 (including
comparatives) were approved by the board of directors on 8 March 2014.
C Executive C Finance (Board member 1) (Board member 2)
72 Example Consolidated Financial Statements 2013

AppendicesIllustrative Corporation Group 31 December 2013

74 Example Consolidated Financial Statements 2013
IAS 1.99 IAS 1.99 allows a statement of profit or loss format analysing expenses using a classificationbased on either the nature of expenses (NOE) or based on the function of expenses (FOE)within the entity. This depends on management’s assessment of which format providesinformation that is reliable and more relevant.
The NOE format is illustrated in the main body of the Example financial statements. TheFOE format is illustrated in this appendix. This appendix presents a separate statement of profitor loss, ie other comprehensive income is presented in a separate statement of comprehensiveincome (see the main body of the Example financial statements).
If the entity presents a single statement of comprehensive income (see Appendix B), the FOEformat included in this appendix may replace the NOE format presented in in Appendix B.
The FOE or NOE formats do not affect the presentation requirements for othercomprehensive income. Only the statement of profit or loss is affected.
IAS 1.104 Presenting the statement of profit or loss in the FOE format requires additionalconsiderations:• additional disclosures of the nature of certain expenses are required, including employee
benefit expenses and depreciation, amortisation and impairment of non-financial assets• the disclosures of the specific line items in the statement of profit or loss where certain
transactions or amounts are recognised (for example, see Note 9, Note 10 and Note 21 ofthe Example financial statements) should reflect the actual line items presented in the FOEstatement of profit or loss.
In addition, when an entity includes the analysis of profit or loss from a discontinued operationin the notes to the financial statements (see Note 19), such information should be presented inthe same format as the main statement of profit or loss. This will facilitate a betterunderstanding of the financial effects of the discontinued operations.
Appendix A: Organising thestatement of profit or loss byfunction of expenses

Example Consolidated Financial Statements 2013 75
Consolidated statement of profit or loss
IAS 1.51(c) Notes 2013 2012(Restated)
IAS 1.51(d-e) CU’000 CU’000IAS 1.82(a) Revenue 8 205,793 191,228
IAS 1.85 Costs of sales (109,342) (103,292)
IAS 1.85 Gross profit 96,451 87,936 IAS 1.85 Other income 427 641
IAS 1.85 Distribution costs (12,213) (11,473)
IAS 1.85 Administrative expenses (48,853) (45,894)
IAS 1.85 Research and development costs (1,690) (1,015)
IAS 1.85 Change in fair value of investment property 13 310 175
IAS 1.85 Other expenses (12,878) (11,276)
Operating profit 21,554 19,094
IAS 1.82(c) Share of profit from equity accounted investments 7 391 141
IAS 1.82(b) Finance costs 25 (1,490) (1,876)
IAS 1.85 Finance income 25 994 793
IAS 1.85 Other financial items 26 943 1,182
Profit before tax 22,392 19,334
IAS 1.82(d) Tax expense 27 (6,910) (5,763)
Profit for the year from continuing operations 15,482 13,571IAS 1.82(ea) Loss for the year from discontinued operations 19 (9) (325)
IAS 1.81A(a) Profit for the year 15,473 13,246
Profit for the year attributable to:IAS 1.81B(a)(i) Non-controlling interest 121 116
IAS 1.81B(a)(ii) Owners of the parent 15,352 13,130
15,473 13,246
CU CUEarnings per share 28
IAS 33.67A Basic earnings per share
IAS 33.66 – Earnings from continuing operations 1.22 1.14
IAS 33.68A – Loss from discontinued operations (0.00) (0.03)
IAS 33.66 Total 1.22 1.11
IAS 33.67A Diluted earnings per share
IAS 33.66 – Earnings from continuing operations 1.22 1.14
IAS 33.68A – Loss from discontinued operations (0.00) (0.03)
IAS 33.66 Total 1.22 1.11
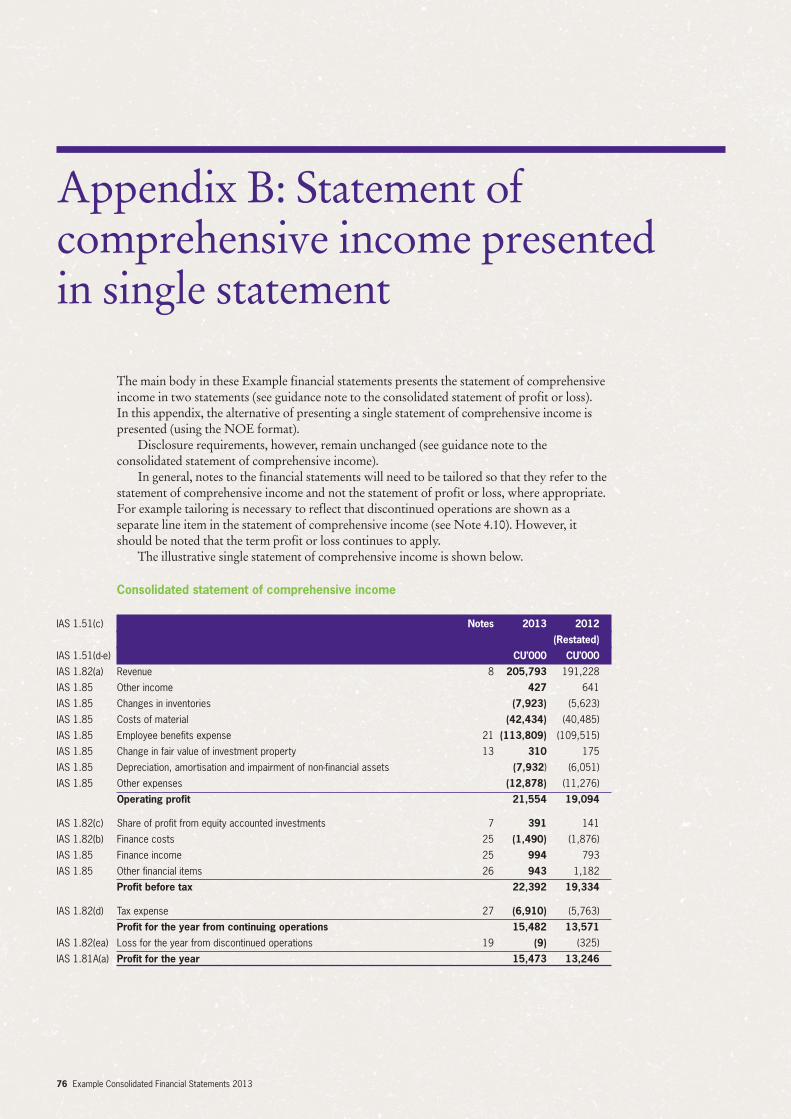
76 Example Consolidated Financial Statements 2013
The main body in these Example financial statements presents the statement of comprehensiveincome in two statements (see guidance note to the consolidated statement of profit or loss). In this appendix, the alternative of presenting a single statement of comprehensive income ispresented (using the NOE format).
Disclosure requirements, however, remain unchanged (see guidance note to theconsolidated statement of comprehensive income).
In general, notes to the financial statements will need to be tailored so that they refer to thestatement of comprehensive income and not the statement of profit or loss, where appropriate.For example tailoring is necessary to reflect that discontinued operations are shown as aseparate line item in the statement of comprehensive income (see Note 4.10). However, itshould be noted that the term profit or loss continues to apply.
The illustrative single statement of comprehensive income is shown below.
Consolidated statement of comprehensive income
IAS 1.51(c) Notes 2013 2012(Restated)
IAS 1.51(d-e) CU’000 CU’000IAS 1.82(a) Revenue 8 205,793 191,228
IAS 1.85 Other income 427 641
IAS 1.85 Changes in inventories (7,923) (5,623)
IAS 1.85 Costs of material (42,434) (40,485)
IAS 1.85 Employee benefits expense 21 (113,809) (109,515)
IAS 1.85 Change in fair value of investment property 13 310 175
IAS 1.85 Depreciation, amortisation and impairment of non-financial assets (7,932) (6,051)
IAS 1.85 Other expenses (12,878) (11,276)
Operating profit 21,554 19,094
IAS 1.82(c) Share of profit from equity accounted investments 7 391 141
IAS 1.82(b) Finance costs 25 (1,490) (1,876)
IAS 1.85 Finance income 25 994 793
IAS 1.85 Other financial items 26 943 1,182
Profit before tax 22,392 19,334
IAS 1.82(d) Tax expense 27 (6,910) (5,763)
Profit for the year from continuing operations 15,482 13,571IAS 1.82(ea) Loss for the year from discontinued operations 19 (9) (325)
IAS 1.81A(a) Profit for the year 15,473 13,246
Appendix B: Statement ofcomprehensive income presented in single statement

Example Consolidated Financial Statements 2013 77
Other comprehensive income:IAS 1.82A(a) Items that will not be reclassified subsequently to profit or lossIAS 16.77(f) Revaluation of land 11 303 –
IAS 19.120(c) Remeasurement of net defined benefit liability 21 3,830 (3,541)
IAS 1.90/91(b) Income tax relating to items not reclassified 15 (1,240) 1,062
IAS 1.82A(b) Items that will be reclassified subsequently to profit or lossCash flow hedging 14
IFRS 7.23(c-d) – current year gains 367 (47)
IAS 1.92 – reclassification to profit or loss 260 (425)
Available-for-sale financial assets 14
IFRS 7.20(a)(ii) – current year gains (losses) 113 35
IAS 1.92 – reclassification to profit or loss (50) –
IAS 21.52(b) Exchange differences on translating foreign operations (664) (341)
IAS 1.82A Share of other comprehensive income of equity accounted investments 7 5 –
IAS 1.92 – reclassification to profit or loss (3) –
IAS 1.90/91(b) Income tax relating to items that will be reclassified 15 176 95
IAS 1.81A Other comprehensive income for the year, net of tax 3,097 (3,162)
IAS 1.81A Total comprehensive income for the year 18,570 10,084
Profit for the year attributable to:IAS 1.81B(a)(i) Non-controlling interest 121 116
IAS 1.81B(a)(ii) Owners of the parent 15,352 13,130
15,473 13,246
Total comprehensive income attributable to:IAS 1.81B(b)(i) Non-controlling interest 121 116
IAS 1.81B(b)(ii) Owners of the parent 18,449 9,968
18,570 10,084
CU CUEarnings per share 28
IAS 33.67A Basic earnings per share
IAS 33.66 – Earnings from continuing operations 1.22 1.14
IAS 33.68A – Loss from discontinued operations (0.00) (0.03)
IAS 33.66 Total 1.22 1.11
IAS 33.67A Diluted earnings per share
IAS 33.66 – Earnings from continuing operations 1.22 1.14
IAS 33.68A – Loss from discontinued operations (0.00) (0.03)
IAS 33.66 Total 1.22 1.11

www.gti.org
© 2013 Grant Thornton International Ltd. “Grant Thornton” refers to the brand under which the Grant Thornton member firms provideassurance, tax and advisory services to their clients and/or refers to one or more member firms, as the context requires. GTIL and the member firms are not a worldwide partnership. GTIL and each member firm is a separate legal entity. Services are delivered by the memberfirms. GTIL does not provide services to clients. GTIL and its member firms are not agents of, and do not obligate, one another and are not liable for one another’s acts or omissions.
Grant Thornton International Ltd is a company limited by guarantee incorporated in England and Wales.Registered number: 05523714Registered office: Grant Thornton House, 22 Melton Street, Euston Square, London NW1 2EP