reportminer 7 tutorial - astera · pdf filereportminer 7 tutorial. 1 contents ... 2 creating a...
TRANSCRIPT
ReportMiner 7
Tutorial

1
Contents
Overview ............................................................................................................................................................................................................... 2
Creating a Report Model ................................................................................................................................................................................ 2
Extracting Header Data ................................................................................................................................................................................... 5
Adding Fields ...................................................................................................................................................................................................... 7
Renaming Fields ................................................................................................................................................................................................. 8
Changing Field Properties ............................................................................................................................................................................. 9
Creating a Data Region ................................................................................................................................................................................. 10
Using Multi-Column Regions ..................................................................................................................................................................... 11
Auto Creation of Data Regions .................................................................................................................................................................. 12
Creating a Collection Region ...................................................................................................................................................................... 12
Adding Formula Fields .................................................................................................................................................................................. 13
Verifying a Report Model ............................................................................................................................................................................. 15
Data Statistics and Summary ...................................................................................................................................................................... 15
Exporting Data .................................................................................................................................................................................................. 16
Rule-based Filtering from Export Settings ............................................................................................................................................ 18
Previewing Your Export ................................................................................................................................................................................. 19
Editing Fields and Regions .......................................................................................................................................................................... 20
Managing Field and Region Properties .................................................................................................................................................. 20
Deleting Fields and Regions ....................................................................................................................................................................... 20
Adjusting Fields ................................................................................................................................................................................................ 20
Identifying Text Patterns for Region ........................................................................................................................................................ 21
Using Optical Character Recognition for PDF Data Extraction ..................................................................................................... 22
Looping Through a Folder ........................................................................................................................................................................... 23
Auto Parsing of Names and Addresses .................................................................................................................................................. 23
Using Dataflows ............................................................................................................................................................................................... 24
Using PDF Forms in Dataflows ................................................................................................................................................................... 26
Creating Dataflows from Export Settings .............................................................................................................................................. 27
2
Overview
In this tutorial, we will explore the features of ReportMiner.
ReportMiner’s new and improved interface enables business
users with little or no technical background to easily
accomplish a wide range of data extraction tasks without
employing expensive IT resources.
To extract data from a printed document, a process called
data mining or report mining, you need to create a model
that describes your report’s layout. You will then use this
model to export the data to your destination of choice, for
instance, an Excel spreadsheet or database table. You can
also use your report as a source object in a dataflow, which
allows you to take advantage of many advanced
transformations, as well as conversion, filtering and routing
features of ReportMiner. This tutorial will demonstrate how
this can be accomplished.
Creating a Report
Model
No matter how simple or complicated your report document
is, a report model defining your report’s structure will always
have a data region with some fields in it. Depending on the
report document, you can also include a Header and/or
Footer in the report model, and optionally add one or more
Append regions, each with its own set of fields. ReportMiner
also supports true hierarchical report extraction. This
capability makes it possible to process complex layouts in
which a data region has child regions and those regions
could have their own children as well.
To create a new report model, go to File -> New and select
Report Model (Figure 1).
Key Features
Extract information from documents in popular
formats such as PDF, Word, RTF, PRN, TXT, and
Excel.
Export data to many destinations, including
popular database providers, such as Microsoft SQL
Server, Access, MySQL, PostgreSQL or any ODBC-
compatible database, or save extracted data to
fixed length, delimited, Excel, or XML file.
Extract data from PDF forms and perform on-the-
fly OCR (optical character recognition) during PDF
data extraction
Extract from single or multi-column sources
Import Monarch (XMOD) models and COBOL
copybooks
The single-click preview capability shows extracted
data and returns any conversion or validation
errors, enabling users to verify and test report
models as they are being built
Save time by reusing a single report model to
process a batch of report documents with a similar
layout
Instantly convert your report model into a
dataflow with a single mouse click and take
advantage of advanced transformations and
conversion features
Enterprise edition of ReportMiner includes a high-
performance parallel-processing engine for
optimized extracting of large data volumes from
multiple report documents

3
Figure 1
In the Report Options dialog that opens, select a data file that you want to extract from. ReportMiner will use this file to
create a report model. ReportMiner supports extracting unstructured data from text, Excel, Word, RTF, PRN, EDI, or PDF files.
Depending on the content type of your data, reading options will change. For example, if you selected a PDF file, you will be
able to adjust PDF specific settings such as scaling factor, font, tab size, or password, as well as specify whether you need to
run OCR (optical character recognition) on the selected PDF document.
Figure 2
4
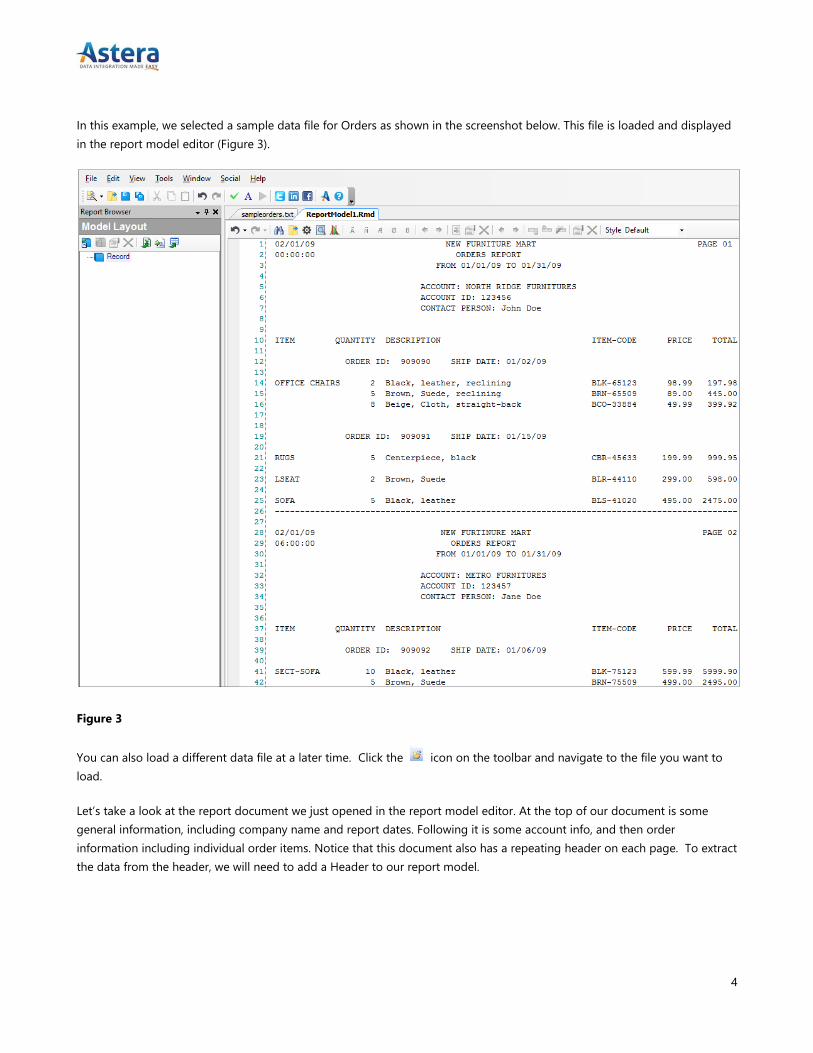
In this example, we selected a sample data file for Orders as shown in the screenshot below. This file is loaded and displayed
in the report model editor (Figure 3).
Figure 3
You can also load a different data file at a later time. Click the icon on the toolbar and navigate to the file you want to
load.
Let’s take a look at the report document we just opened in the report model editor. At the top of our document is some
general information, including company name and report dates. Following it is some account info, and then order
information including individual order items. Notice that this document also has a repeating header on each page. To extract
the data from the header, we will need to add a Header to our report model.

5
Extracting Header Data
In our sample document, the Header is at the top of the page, and it uses three lines starting at the line with the report date
(Figure 4).
Figure 4
Let’s add Header to our report model.
In the report model editor, select the top three lines. This is the area that contains the Header. Right click on your selection
and select Add Page Header Region… in the context menu, as shown in Figure 5.
Figure 5
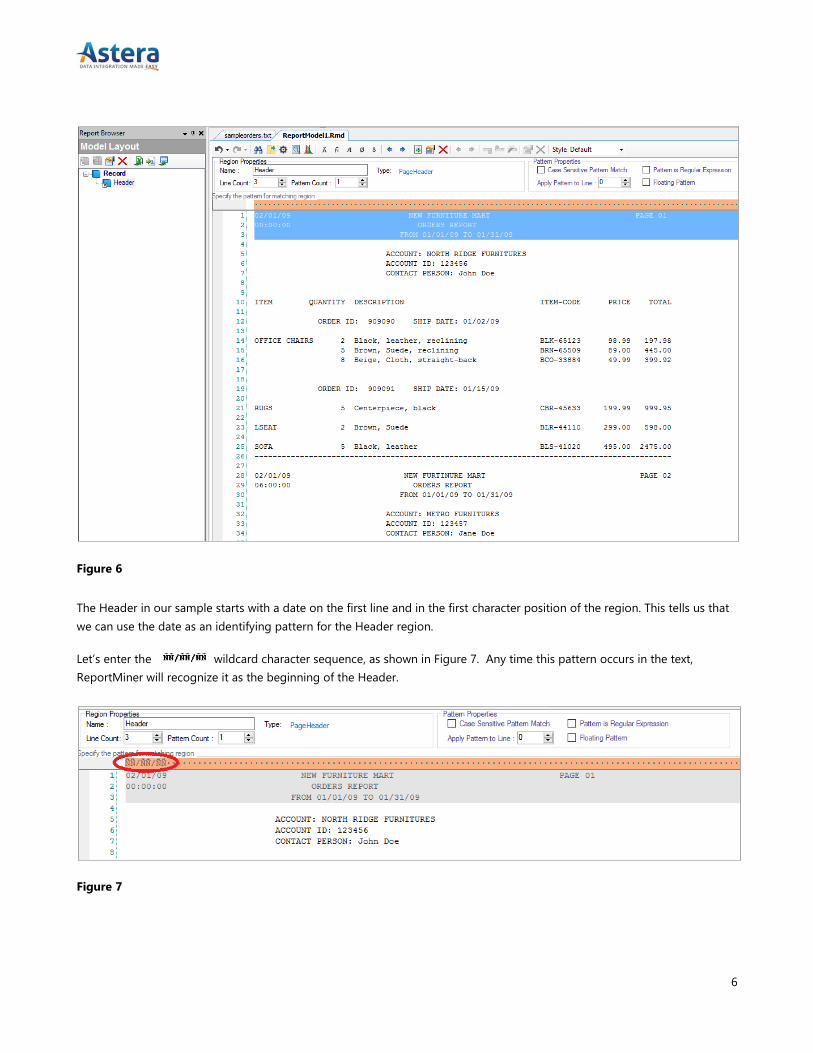
The Report Browser to the left of the report model editor now shows a new node called Header (see the following Figure 6).
6
Figure 6
The Header in our sample starts with a date on the first line and in the first character position of the region. This tells us that
we can use the date as an identifying pattern for the Header region.
Let’s enter the wildcard character sequence, as shown in Figure 7. Any time this pattern occurs in the text,
ReportMiner will recognize it as the beginning of the Header.
Figure 7

7
The report model editor now highlights the header in purple. The Header contains three lines, as shown by the purple block
in the editor. The height of the Header, or any other region (i.e., the number of lines that the region takes) is controlled by
the Line Count input below the toolbar.
The next step is to create the fields that make up the Header.
Adding Fields
There are two ways to create fields:
Highlight some area within the header (or another region that you are working on), right click and select Add Data
Field (Figure 8).
Figure 8
Right click anywhere within the region, and select Auto Create Fields from the context menu. ReportMiner will scan
the document and automatically create the fields based on the document’s content.
In our example, the Auto Create Fields feature added 4 fields. They are displayed in the Report Browser under the Header
node. The new fields are also highlighted in blue in the report model editor (Figure 9).

8
Figure 9
The new fields were assigned unique names: Field_0, Field_1, Field_2 and Field_3.
Renaming Fields
You can rename the fields as necessary. Let’s rename our fields to make them more descriptive. You can either:
Double click a field in the Report Browser, and enter the new name, or
Select a field in the report model editor (the selected field is highlighted in yellow), right click, and select Field
Properties… from the context menu. Enter the new name in the Field Properties dialog. Using this dialog, you can
also adjust many other properties of the field.
You can also change the field’s type here. In our example, ReportMiner correctly assigned the field type (also called data
type) to the fields based on our sample document (Figure 10). You can select a different data type in the Data Type
dropdown as needed. For example, you can change the Page field to Integer data type, since this field stores a number.
Figure 10

9
Changing Field Properties
Now that you have set up your fields, you can adjust their properties, for instance, change start position, field length or
height, among many others.
Right-click a field, and select Field Properties… from the context menu.
The Field Properties dialog will appear (Figure 11).
Figure 11
If you need to change the start position for the field, enter the appropriate value in the input under Start Position. If the data
in your report document is occasionally misaligned, you can use the After String: feature. This will allow ReportMiner to more
precisely identify the field even if its position varies throughout the document.
You also have the option to adjust other useful settings, for example change the length of the field, or remove any extra
spaces in the data that goes into the field.
10
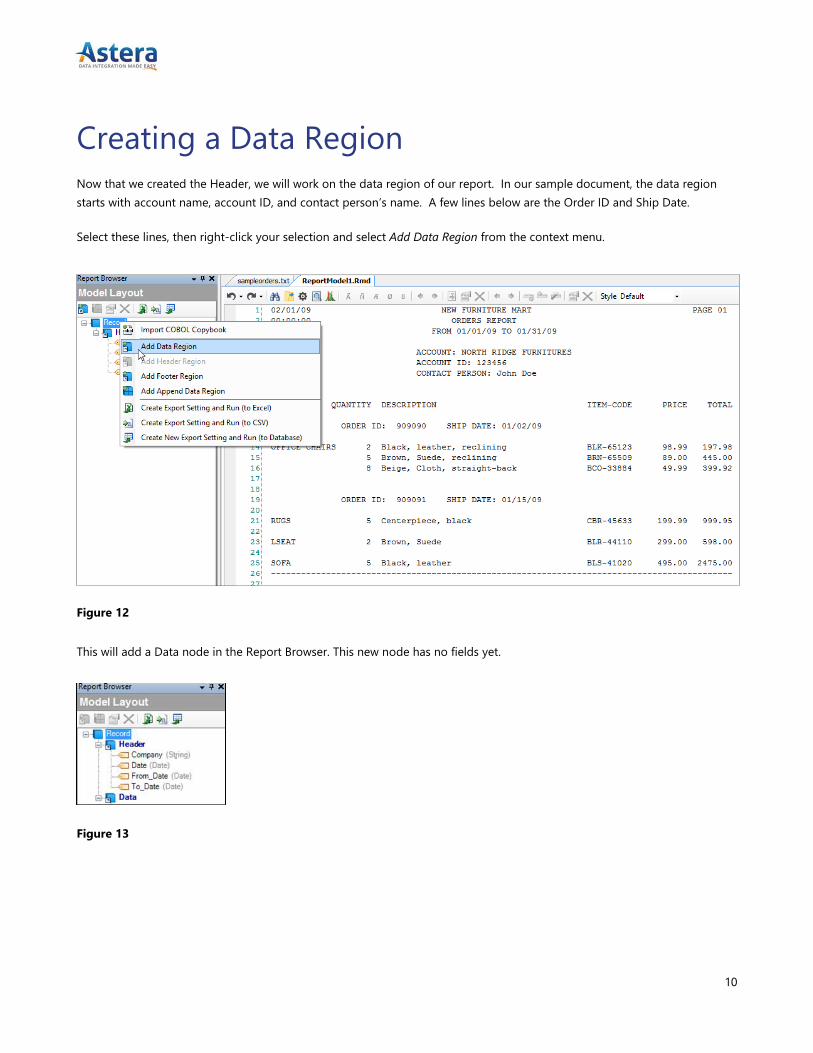
Creating a Data Region
Now that we created the Header, we will work on the data region of our report. In our sample document, the data region
starts with account name, account ID, and contact person’s name. A few lines below are the Order ID and Ship Date.
Select these lines, then right-click your selection and select Add Data Region from the context menu.
Figure 12
This will add a Data node in the Report Browser. This new node has no fields yet.
Figure 13

11
Now we will identify the beginning of this region using
appropriate masks. In this case, it’s easy to separate the
order from the surrounding data as the orders always start
with ‘ORDER ID:’ at the same character position. Place the
cursor at the position where the text ORDER ID: begins, as
shown in the screenshot below, and enter ‘ORDER’ in the
pattern text input (Figure 14).
The report model editor highlights any occurrences of the
order region in the report. If necessary, we can adjust the
height of the region by using the Line Count input above
the pattern text line.
Figure 14
Let’s rename our region Order. Our report model has two regions now: Header and Order.
Next, we will identify the fields making up the Order. The Order has two fields: Order ID and Ship Date. Let’s add these fields
to the Order region using the process we described above. To review adding fields, scroll back to the Adding Fields section in
which we created fields for the Header.
Using Multi-Column Regions
Our sample order report is a single column
document. In a single column document, the data
region takes the entire width of the page. This is in
contrast to multi-column documents where the
region would be split into several columns.
ReportMiner makes it easy to define the layout of a
multi-column document by visually selecting the
column dividers. To get more information on this
topic, please review the Using Single and Multi-
Column Regions article.

12
Auto Creation of Data Regions
In addition to manually defining the regions as described in the previous section, ReportMiner makes it easy to automatically
create most of your data regions with just a couple of mouse clicks.
To take advantage of this feature, go to the left side of your lines in the report model editor and select a couple of lines. You
will see a green (positive) marker appear where you have selected. ReportMiner will calculate a pattern and highlight the
lines that are similar to that lines where you placed green markers. Now, if some of the highlighted lines should be excluded,
click the green marker next to that line. This will turn it into a red marker which tells ReportMiner that a line like that
should be excluded from the region.
Step 1:
Step 2:
Creating a Collection Region
Our sample document has a hierarchical layout in that each customer can have several orders, and each order may have a
number of order items in it. To represent this relationship in a report model, we can assign a region as Collection region.
This section will demonstrate how to create a Collection region.
Select the Order node in the Report Browser, right click it and select Add Collection Data Region… from the context menu.

13
Let’s name this region Item.
We can identify this new region by the repeating pattern of item code. We are going to use a mask in the text pattern input
to match with the item code. Enter Match Any Alphabet three times, followed by a hyphen, and then Match Any Digit five
times as shown in Figure 15.
Figure 15
When a region has a collection of items in it, we need to enable its Collection Region property. Notice that the appearance of
the icon for the Item node in the Report Browser changes to help identify this node as a collection. When we add a collection
data region via the context menu, the Collection Region property is set automatically.
Right click anywhere within our region, and select Auto Create Fields. This creates a few fields named Field_0, Field_1, etc.
Let’s give these fields some descriptive names. Now that the fields are assigned good names, we will add a formula field.
Adding Formula Fields
Using ReportMiner, you can add any number of formula fields to your report model. A formula field does not directly read
from the document. Rather, it uses some formula or expression to derive the field value based on the report data. You can
also add a function to your expression by picking from the large number of built-in functions in the Expression Builder
(Figure 16).
Using the Report Browser, select a region in which you want to create a formula field, right click it and select Add a Formula
Field.
Enter the formula in the Expression Builder. When done, click Compile to verify that the expression has no errors in it.
For example, if you wanted to add a new field with the price 20% off, you would input the formula:
Price – Price * .2

14
Figure 16
Click OK. Your new field will appear in the Report Browser. Click the icon on the toolbar to see the values you get in that
field, as well as in the other existing fields in your report model.
Our model is completed, and it looks as shown in Figure 17.
Figure 17
15
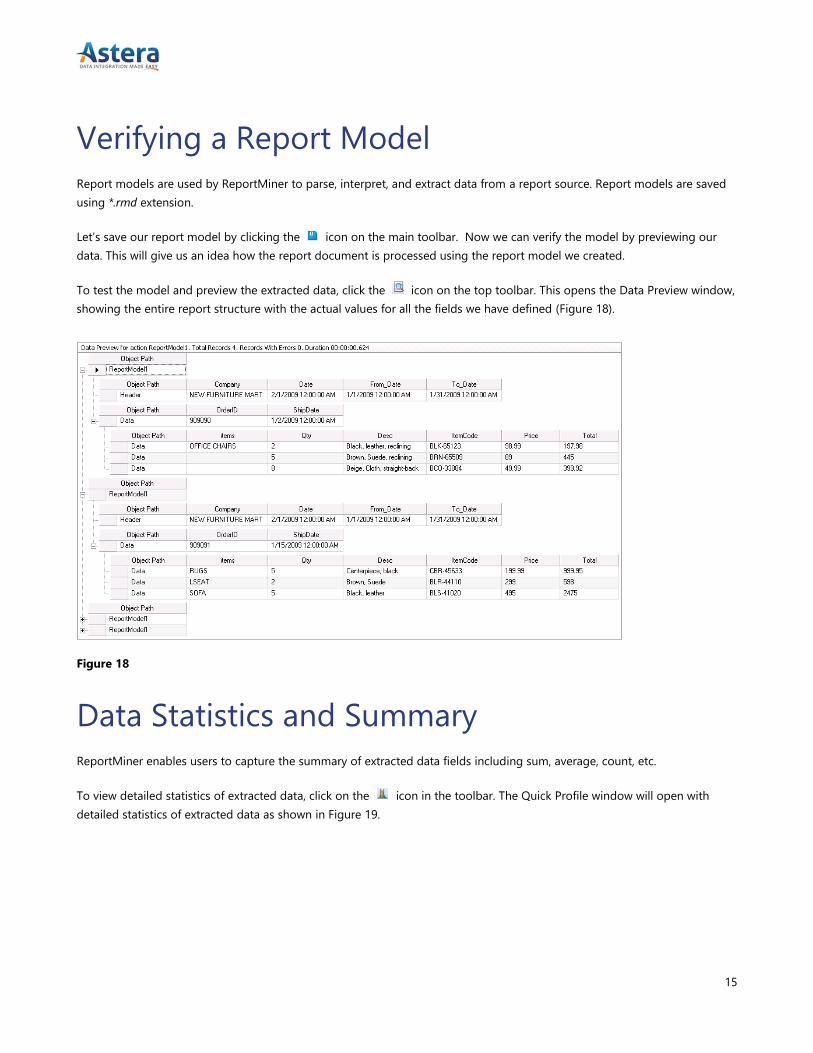
Verifying a Report Model
Report models are used by ReportMiner to parse, interpret, and extract data from a report source. Report models are saved
using *.rmd extension.
Let’s save our report model by clicking the icon on the main toolbar. Now we can verify the model by previewing our
data. This will give us an idea how the report document is processed using the report model we created.
To test the model and preview the extracted data, click the icon on the top toolbar. This opens the Data Preview window,
showing the entire report structure with the actual values for all the fields we have defined (Figure 18).
Figure 18
Data Statistics and Summary
ReportMiner enables users to capture the summary of extracted data fields including sum, average, count, etc.
To view detailed statistics of extracted data, click on the icon in the toolbar. The Quick Profile window will open with
detailed statistics of extracted data as shown in Figure 19.

16
Figure 19
Exporting Data
ReportMiner can exports data to a number of destinations. You can export data to Excel, XML, delimited files, fixed length
files, or to a database table such as Microsoft SQL Server, Access, PostgreSQL, MySQL, or ODBC, among others (the exact
providers supported depend on the particular license you purchased with your copy of ReportMiner).
For example, if you wish to export data to Excel, click the icon in the Model Layout toolbar. An export wizard will pop up
and walk you through the steps to configure the export.
In the first screen, you will choose the output file location. Clicking Next will take you to the layout grid that shows all the
fields to be exported, their sequence, header text, and the source field used to extract data from the source file. When you
click OK, the wizard screen will close, and at that point the extraction begins. You can see the progress in the progress
window (Figure 20).

17
Figure 20
The Data Export Settings window is also highlighted and a reusable export setting is added to the list. You can manage your
export settings in this window. You can edit existing settings, remove them, or add a new one. You can trigger a fresh export
from this window as well by clicking the icon on the Export Settings toolbar.
As the export is running, you can see the trace with the progress details and completion status. Upon the completion, a link
to the destination file or the log file will be added to the trace. If your export encountered any errors, you can click on the
link for the log file and view the error log.
In our example, the export was successful and the output Excel file is shown in Figure 21.

18
Figure 21
You can also create export settings and export data to delimited files or databases. Click the or button on the Data
Export Settings toolbar to open up the wizard for the selected destination.
Now we will introduce some other features that ReportMiner offers to help you customize your extraction.
Rule-based Filtering from Export Settings
When exporting in ReportMiner, you have the option to send only filtered data to your export destination. Select the export
icon of your choice. A window will pop up where you will point to where you want to save your export. Within that same
window you will see the option Rule for Filtering Data in blue. Click to expand it.
Figure 22
19
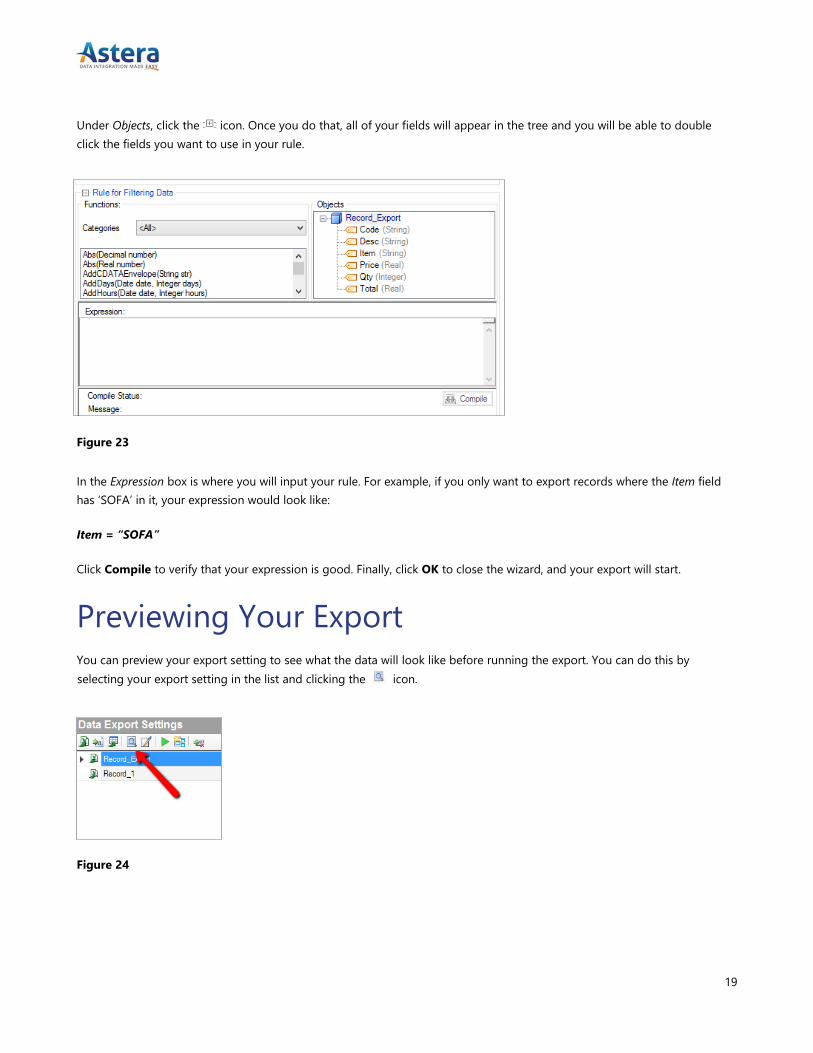
Under Objects, click the icon. Once you do that, all of your fields will appear in the tree and you will be able to double
click the fields you want to use in your rule.
Figure 23
In the Expression box is where you will input your rule. For example, if you only want to export records where the Item field
has ‘SOFA’ in it, your expression would look like:
Item = “SOFA”
Click Compile to verify that your expression is good. Finally, click OK to close the wizard, and your export will start.
Previewing Your Export You can preview your export setting to see what the data will look like before running the export. You can do this by
selecting your export setting in the list and clicking the icon.
Figure 24
20
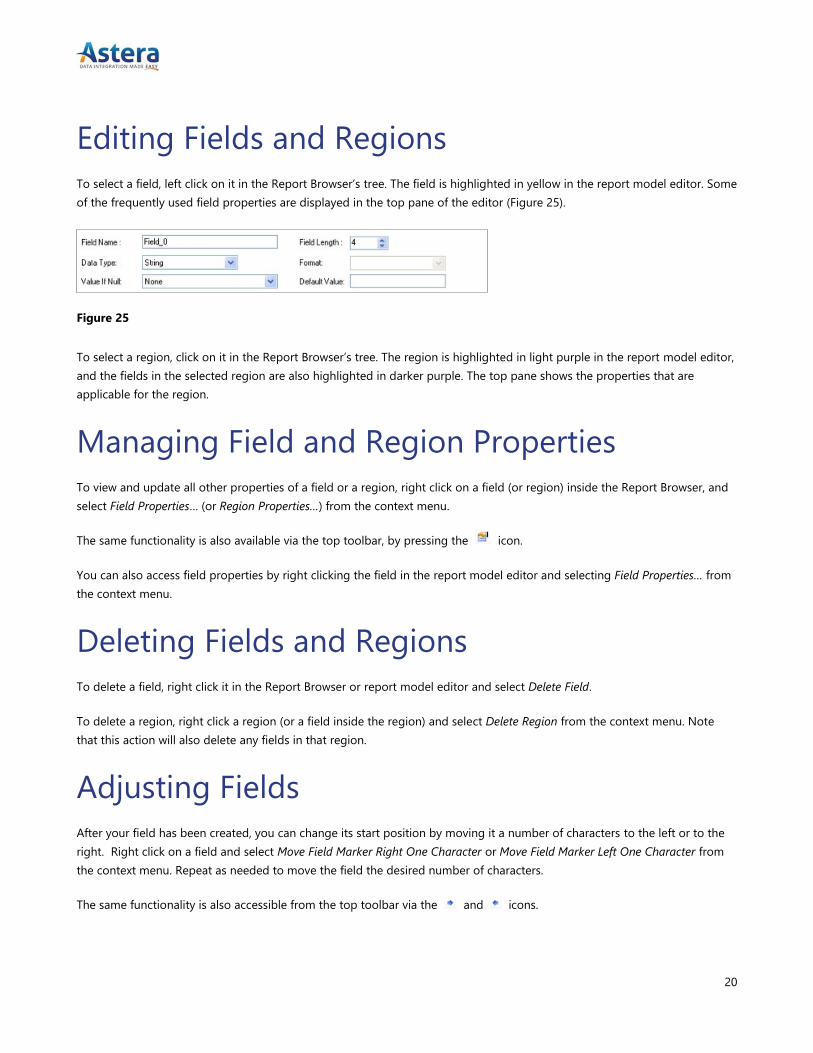
Editing Fields and Regions
To select a field, left click on it in the Report Browser’s tree. The field is highlighted in yellow in the report model editor. Some
of the frequently used field properties are displayed in the top pane of the editor (Figure 25).
Figure 25
To select a region, click on it in the Report Browser’s tree. The region is highlighted in light purple in the report model editor,
and the fields in the selected region are also highlighted in darker purple. The top pane shows the properties that are
applicable for the region.
Managing Field and Region Properties
To view and update all other properties of a field or a region, right click on a field (or region) inside the Report Browser, and
select Field Properties… (or Region Properties…) from the context menu.
The same functionality is also available via the top toolbar, by pressing the icon.
You can also access field properties by right clicking the field in the report model editor and selecting Field Properties… from
the context menu.
Deleting Fields and Regions
To delete a field, right click it in the Report Browser or report model editor and select Delete Field.
To delete a region, right click a region (or a field inside the region) and select Delete Region from the context menu. Note
that this action will also delete any fields in that region.
Adjusting Fields
After your field has been created, you can change its start position by moving it a number of characters to the left or to the
right. Right click on a field and select Move Field Marker Right One Character or Move Field Marker Left One Character from
the context menu. Repeat as needed to move the field the desired number of characters.
The same functionality is also accessible from the top toolbar via the and icons.
21
You can also change the field length by selecting Decrease Field Length By One Character and Increase Field Length By One
Character from the context menu. Repeat as many times as needed to change the field length by the desired number of
characters.
To auto determine field length based on the available sample data, right click a field and select Auto Determine Field Length
from the context menu. Or click the icon on the top toolbar.
Alternatively, you can also move all fields within the same region left or right by a specified number of characters. To do this,
right click on a region or field and select Move All Field Markers Left One Character or Move All Field Markers Right One
Character. You can also use the and icons on the top toolbar.
To undo any action in the editor, use the Undo dropdown menu on the toolbar or press CTRL + Z.
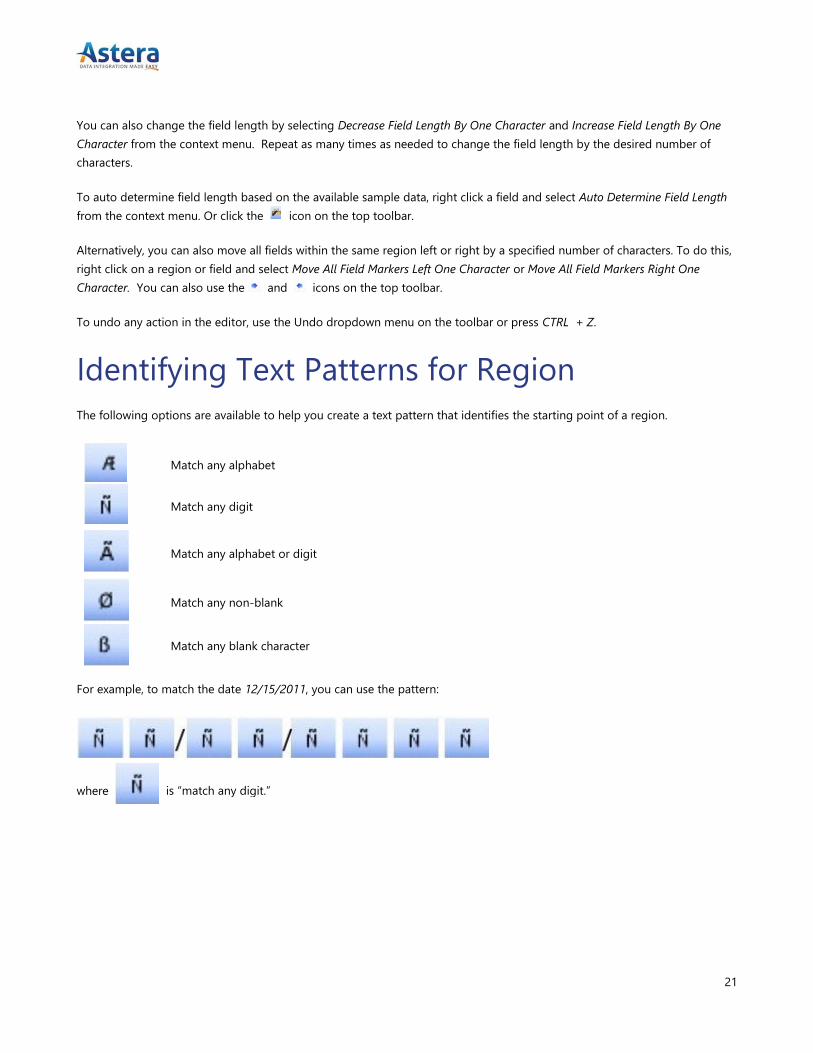
Identifying Text Patterns for Region
The following options are available to help you create a text pattern that identifies the starting point of a region.
For example, to match the date 12/15/2011, you can use the pattern:
Match any alphabet
Match any digit
Match any alphabet or digit
Match any non-blank
Match any blank character
where is “match any digit.”
22
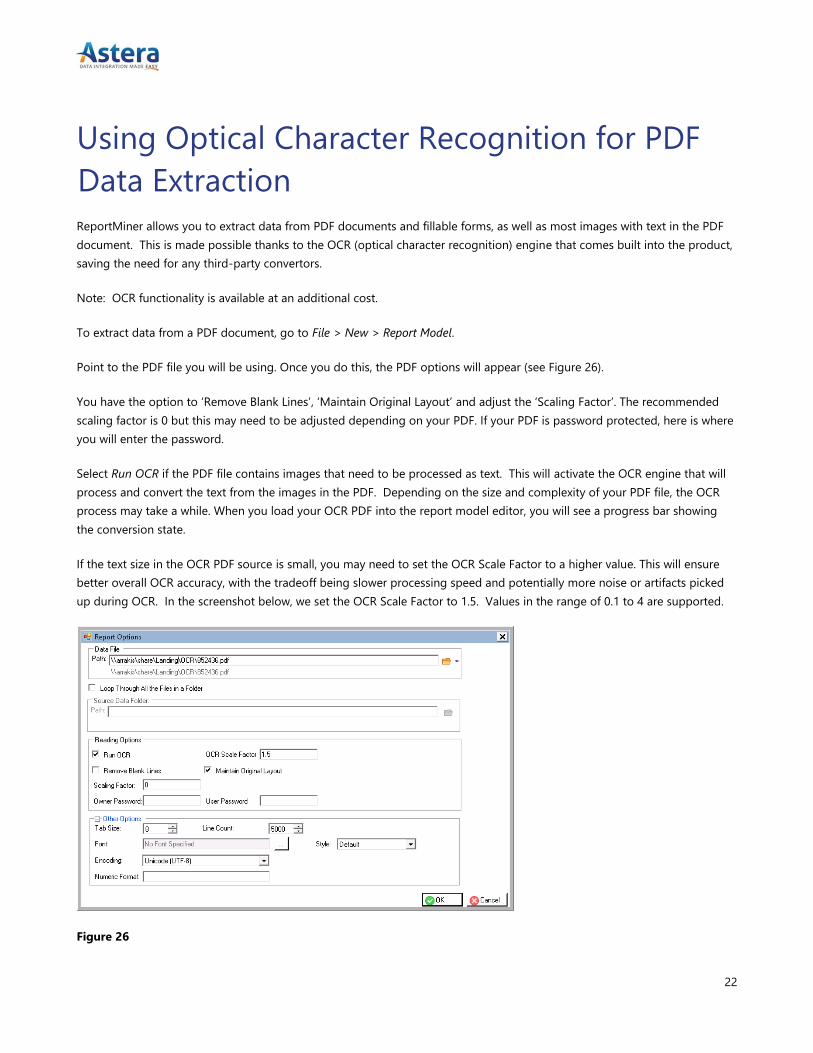
Using Optical Character Recognition for PDF
Data Extraction
ReportMiner allows you to extract data from PDF documents and fillable forms, as well as most images with text in the PDF
document. This is made possible thanks to the OCR (optical character recognition) engine that comes built into the product,
saving the need for any third-party convertors.
Note: OCR functionality is available at an additional cost.
To extract data from a PDF document, go to File > New > Report Model.
Point to the PDF file you will be using. Once you do this, the PDF options will appear (see Figure 26).
You have the option to ‘Remove Blank Lines’, ‘Maintain Original Layout’ and adjust the ‘Scaling Factor’. The recommended
scaling factor is 0 but this may need to be adjusted depending on your PDF. If your PDF is password protected, here is where
you will enter the password.
Select Run OCR if the PDF file contains images that need to be processed as text. This will activate the OCR engine that will
process and convert the text from the images in the PDF. Depending on the size and complexity of your PDF file, the OCR
process may take a while. When you load your OCR PDF into the report model editor, you will see a progress bar showing
the conversion state.
If the text size in the OCR PDF source is small, you may need to set the OCR Scale Factor to a higher value. This will ensure
better overall OCR accuracy, with the tradeoff being slower processing speed and potentially more noise or artifacts picked
up during OCR. In the screenshot below, we set the OCR Scale Factor to 1.5. Values in the range of 0.1 to 4 are supported.
Figure 26

23
Looping Through a Folder
ReportMiner enables users to run multiple reports with one report model by looping through a folder with your report
documents. This feature is available in Enterprise edition only.
Create a folder that contains all of the reports you need to process using a single report model.
Open the Report Options dialog.
Check the box next to Loop Through All Files in a Folder control.
Figure 27
Point to the folder that contains all of your files and click OK. ReportMiner will go through the files and process them one by
one.
Auto Parsing of Names and Addresses
ReportMiner has a useful feature where you can automatically parse your name and address data. ReportMiner will break up
names and addresses into separate components. For example:
Name: prefix, first, middle, last, and suffix.
Address: street, suite, city, state, zip, country.
To add a Name Field, highlight the name in your report document, right-click it and select Add Name Field..., or Add Two
Names Field…
To add an Address field, highlight the address area, right click and select Add Address Field…
ReportMiner will create your name and address fields with all the required pieces, as shown below.

24
Figure 28
Using Dataflows
ReportMiner enables users to build and run dataflows. A dataflow is a graphical representation for sources, destinations,
transformations, and object maps. Report models can be used as sources in dataflows in order to leverage the advanced
transformation features in ReportMiner. Let’s add our report model to a dataflow so we can read the source report and feed
it to a destination object on the dataflow.
Go to File -> New -> Dataflow. This creates a new dataflow.
Using the Toolbox pane, expand the Sources category, and select Report Source.
Drag and drop Report Source onto the dataflow designer.
Double click the ReportModel1 object that we just added (or right click it and select Properties) to open the Properties dialog.
Using the Properties dialog, enter the path to the report source file and the report model. The report model location should
point to the report model we created and saved earlier (Figure 29).

25
Figure 29
Click OK to close the dialog. The ReportModel1 object on the dataflow designer shows the report layout according to the
report model we created earlier (Figure 30). Note that we have also renamed our report source object by double-clicking on
the object title and entering the new name.
Figure 30
Depending on your dataflow view settings, you may need to expand the tree nodes to see the child nodes under the root
node.
Our new report source is ready to export data to any destination objects that we add to our dataflow.

26
Using PDF Forms in Dataflows
If you have a PDF form where you just want to export the form values, you can do this by using the Pdf Form Source object in
the dataflow. This saves the need to create a report model since ReportMiner reads the layout of the PDF form automatically.
Go to File > New > Dataflow.
Drag Pdf Form Source on to the dataflow designer (located under the Sources section in the Toolbox).
Figure 31
Right-click it, select Properties and point to the PDF form you will be reading. Click OK.
Once you do that, you’ll see that the form fields have been populated. You can preview output to see the actual values in the
PDF form.
Figure 32
27
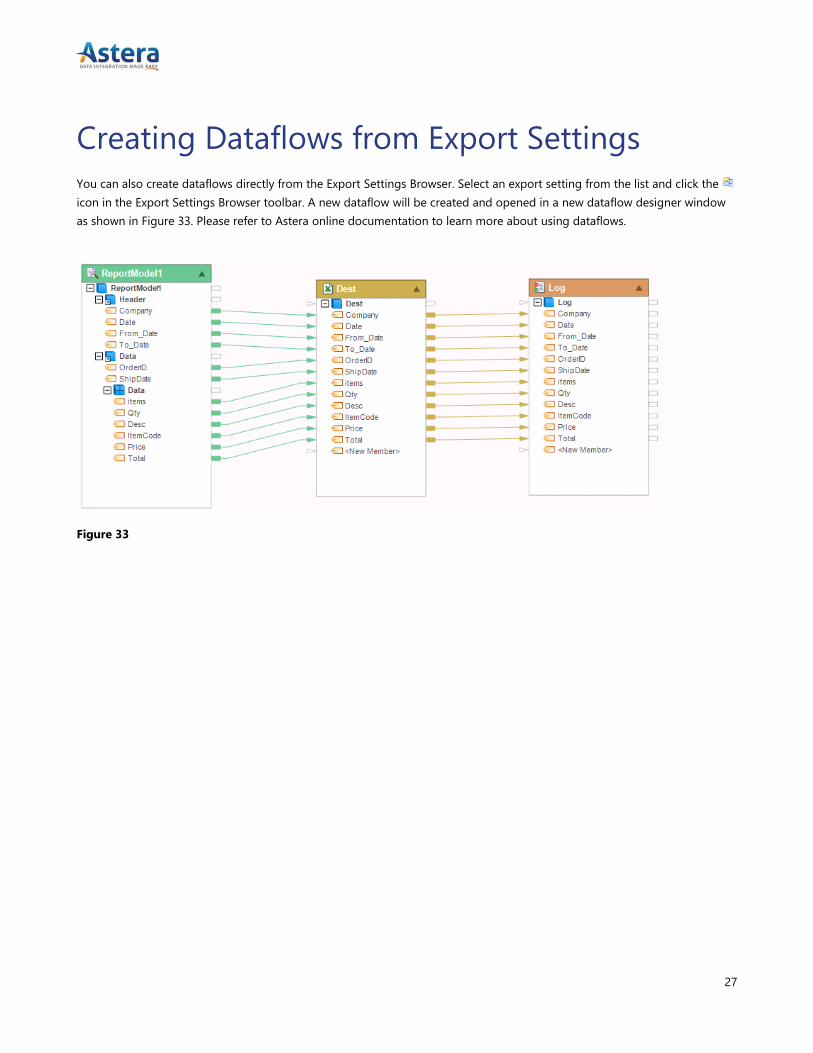
Creating Dataflows from Export Settings
You can also create dataflows directly from the Export Settings Browser. Select an export setting from the list and click the
icon in the Export Settings Browser toolbar. A new dataflow will be created and opened in a new dataflow designer window
as shown in Figure 33. Please refer to Astera online documentation to learn more about using dataflows.
Figure 33

28
www.astera.com
Contact us for more information or to request a free trial at [email protected]
888-77-ASTERA
Copyright © 2016 Astera Software Incorporated. All rights reserved. Astera and Centerprise are registered
trademarks of Astera Software Incorporated in the United States and / or other countries. Other marks are the property of their respective owners.