representative bureaucracy - cpsa · the case for representative bureaucracy ... service from an...
TRANSCRIPT

Representative Bureaucracy ? Employment Equity
in the Public Service of Canada
Carol Agocs
Department of Political Science, Western University
Paper presented at the 2012 Annual Conference of the Canadian Political Science Association, Edmonton, June 13-15. Please do not cite or quote without author’s permission.

1
Representative Bureaucracy? Employment Equity in the Public Service of Canada
Carol Agocs
Department of Political Science, Western University
A representative bureaucracy is essential to democratic governance in a diverse society, and it is the responsibility of government to be a model employer that exemplifies progressive human resource management practices. Canada’s employment equity policy has been in force in the federal sector for a quarter century, and one of its primary purposes is to develop a public service that is representative of Canada’s population. Has employment equity delivered on its potential to create a representative bureaucracy? An overview of the Canadian experience with employment equity in the federal public service reveals some advances for women, “visible minorities,”1 Aboriginal people and persons with
disabilities. Yet patterns of under-representation and inequality persist for each of the equity groups, notably for visible minorities, and the Government of Canada has yet to truly become a model employer. Canada’s labour market is increasingly diverse, suggesting both the need and the possibility of a more diverse public service for the future.2 This paper explores the degree to which employment equity policy has assisted the Public Service of Canada to become a representative bureaucracy. A representative bureaucracy may be defined as a public service whose members reflect the demographic composition of the population it serves, and to which its policies apply. To be truly representative, a public service would include members of significant sectors of the population throughout its workforce, including senior decision-making positions, not just in lower ranking jobs (Gidengil and Vengroff 1997, 459). The Canadian academic literature on representative bureaucracy is small and the topic has received little empirical study since the landmark works of John Porter (1958 and 1965) and Dennis Olsen (1980). Early literature contributed to a distinctively Canadian perspective on representative bureaucracy rooted in the history of Canada’s public service. Kerhaghan (1978, 496, 498) observed that the public service in the 1970s was “not a microcosm of Canadian society”, and that Francophone Canadians in Quebec and the rest of Canada, women and Aboriginal people were under-represented because of “barriers to equal opportunity” that government needed to take special measures to address. Following the publication of the report of the Royal Commission on Bilingualism and Biculturalism in 1969, the federal government introduced and extended programs to improve recruitment and career development for Francophones, establish language requirements and language training for public service positions, and provide services in French. Success in this endeavour required that the traditional narrow construction of the merit principle be broadened to encompass facility in both French and English.3 The result was that in the 1970s the public service made strides toward becoming a more representative bureaucracy with respect to (male) Francophone Canadians (Kernaghan 1978, 500-501). By 1983, French was identified as the first official language of 27 percent of public servants, rising to 29 percent in 2010 (Treasury Board 2010, Fig.5), roughly in line with the representation of this group in the Canadian population. The representation of public servants whose first official language was French also grew among the executive
1 The term “visible minorities” is used in the 1995 Employment Equity Act to refer to “persons, other than Aboriginal peoples, who are non-Caucasian in race or not-white in colour,” and despite critiques of this term it is still generally used in Canadian government policy contexts. 2 Statistics Canada’s projections show that by 2031, approximately 30 percent of Canada’s population could be members of a visible minority, and of these, 71 percent will be foreign born. Younger Canadians will be more diverse than the general population (Statistics Canada 2010). 3 The elasticity of the merit principle has not encompassed facility in Aboriginal languages or those of
other linguistic groups in Canadian society. But Canada offers another interesting case – that of the territory of Nunavut -- in which the concept of representative bureaucracy was stretched to envision a public service that was not only numerically representative of the predominantly Inuit population it serves, but delivered in the linguistic and cultural modalities of that population (Timpson 2006).

2
(EX) echelon, from 20 percent in 1983 to 30 percent in 2010 (Treasury Board 2010, Fig. 12). The same could not be said for women, Aboriginal people, persons with disabilities and racialized groups. However the progress of Francophones in public service employment inspired these under-represented groups to advocate for changes that would open employment opportunities to them. The Employment Equity Act (1987) was in part a response to the demands of these under-represented groups. After 1995, when the federal public service was brought under a revised Employment Equity Act, employment equity became a vehicle for the government’s efforts to develop a representative bureaucracy and to work toward substantive equality with respect to these four groups. Theory of Representative Bureaucracy From a public administration perspective, a representative bureaucracy has the theoretical potential to improve the quality, responsiveness and inclusiveness of policy-making as well as service delivery. Representative bureaucracy theorists assume that public servants approach their work with values and perspectives gained from their life histories and communities of origin, as well as from formal education and employment. They are expected to make policy decisions informed by understanding and consideration of the interests and values of the groups from which they come. When the public service is diverse there is a greater probability that the policies and services it generates will, in the aggregate, be inclusive and responsive toward the communities served and governed. While there has been little Canadian research on the impacts of representative bureaucracy on policy, U.S. researchers have investigated whether, and how, the presence of women and minorities in public service delivers benefits for these groups. This literature shows that “public organizations with larger proportions of women and/or minorities in decision-making roles are more likely to produce outcomes compatible with the interests of women and/or minorities than similar organizations with fewer women and/or minorities” (Bradbury and Kellough 2011, 160; Kelly 1998, 204). A critical issue is whether traditionally under-represented groups are present in leadership positions. Another reasonable hypothesis about representative bureaucracy is that the knowledge, skills and social networks that members of ethnocultural or racialized groups bring to their work as public servants can help them to communicate more effectively with these communities and to provide more relevant, sensitive and appropriate service delivery to them than majority group members may provide. This argument reflects the “business case” for diversity in the private sector: a diverse workforce will help a business in the service sector to respond successfully to markets in a diverse society. Knowledge of diverse languages, values and ways of being represent “merit”, helping a public service to communicate with and deliver services to diverse communities, and women’s presence facilitates communication and trust with women receiving services. If we consider both its administrative and political benefits, there is an argument for representative bureaucracy as a requirement for governance, and for the legitimacy of government, in a diverse society with a democratic polity. Many citizens expect their elected government, if it claims to be a democracy, as well as its public administration, to reflect the gender, disability status, ethnic and racial diversity of the population and to represent the interests of those diverse groups. Citizens and taxpayers have a right to expect that they, and their children, can find careers in the public service they support if they so choose and have appropriate qualifications. Alienation of citizens from their government, and from participation in elections, can be read as a perception that government does not represent people like themselves and is irrelevant to their lives. The case for representative bureaucracy points to the role of government as a model employer. Government should be a leader in the implementation of progressive, fair and equitable human resource management practices, and should show the way to the private sector. It is not reasonable to expect private sector employers to invest in progressive approaches such as employment equity, pay equity and workplace health and safety measures if the public sector is not leading by example.

3
History of Canada’s Federal Public Service: Toward Representative Bureaucracy? From another perspective, a representative bureaucracy might be seen as a public service that reflects the diversity of the labour market from which its members are recruited. However, this conception of representative bureaucracy must be situated within an historical context. From the passage of the Civil Service Act in 1918 until after World War 2 the public service of Canada was an elite institution whose management ranks were populated largely by highly educated white Anglophone men of middle class Protestant British origins (Porter 1965; Olsen 1980). In line with the Weberian model of bureaucracy, this type of organization is hierarchical, governed by rules such as political neutrality and the merit principle, and characterized by careers based on credentialism and professional specialization. In the realm of governance, an elite bureaucracy is usually seen as an improvement upon the political machines based on patronage that predated the professionalization of the public service. Yet Canada’s pre-1918 patronage regime was more diverse, with more Francophones and women, than the elite public service that followed it (Kernaghan 1978, 499; Andrew 2002, 161). The elite public service model presented many systemic barriers to the entry of women and minorities. The early 20
th century civil service consisted of a professional class of men at the top and a largely
female, poorly paid layer of clerical and other “routine” workers at the bottom. Job competitions were limited on the basis of sex and married women were barred from permanent positions until 1955 (Andrew 2002, 160). The exclusionary practices of institutions of higher education posed barriers to the access of women, Jews, and members of the working class to careers in the elite public service, where educational credentials were requirements for entry. During the 1950s through 1970s, as the Canadian welfare state took shape, the federal public service expanded in size and developed a somewhat broader demographic profile (Ornstein 1998, 151). The opening of opportunities for university education to growing numbers of women and members of working class and minority communities began the transformation of the public service from an elite and exclusive institution to one more appropriate to a democracy and more reflective of the diversity of Canada’s population. As it became less elitist, the public service became a path toward upward mobility for educated men of the working class.
4 But the 1970 Report of the Royal
Commission on the Status of Women identified numerous forms of employment inequality for women in the public service, government and the private sector. The prevailing gendered, raced and ableist conceptions of the merit principle continued to exclude women, persons with disabilities and racialized groups from career opportunities. The culture and structure of the public service, like corporate bureaucracies, were imbued with policies, practices and meanings that perpetuated inequality regimes (Acker 2006). For example, women and minorities were clustered in lower ranks of the hierarchy in clerical job ghettos, and in specialized program areas such as “women’s issues,” immigration, and services to Aboriginal peoples.5 Although some of the formal systemic barriers characteristic of the pre-war elite public service were gradually dismantled, informal systemic barriers remain entrenched to the present, and some formal barriers also persist.
4 In a review of Canadian research on elites, Ornstein (1998,167-169) noted that John Porter (1965)
examined the social backgrounds of federal civil servants at the director level and above in 1953. This bureaucratic elite was highly educated, and about 84 percent were of British origin, while 13% were French and 3% were of “other” ethnic backgrounds. Nearly a fifth came from elite or upper class families and 70 percent were from comfortable middle class origins. Olsen’s 1973 replication of Porter’s study found that the upper class component of the bureaucratic elite had fallen to 10 percent, and those of British origin made up 65 percent, while the French had increased to 24 percent and other ethnic origins to 11 percent. By 1979, the highest levels of the Canadian bureaucratic elite generally had graduate degrees, but 44 percent of members’ fathers had not graduated from high school, indicating significant social mobility and a trend toward the democratization of the bureaucratic elite, at least for men. In the late 1970s women comprised 34 percent of the public service but only 3 percent of senior executives. Only one percent of public servants were Aboriginal people – and 80 percent of these worked in the Department of Indian and Northern Affairs (Kernaghan 1978, 505). 5 There is a paradox in this pattern, since the argument for representative bureaucracy includes the benefits to specific populations of services delivered by members of those groups; but clustering in a narrow range of functions may follow, and contribute to inequality.

4
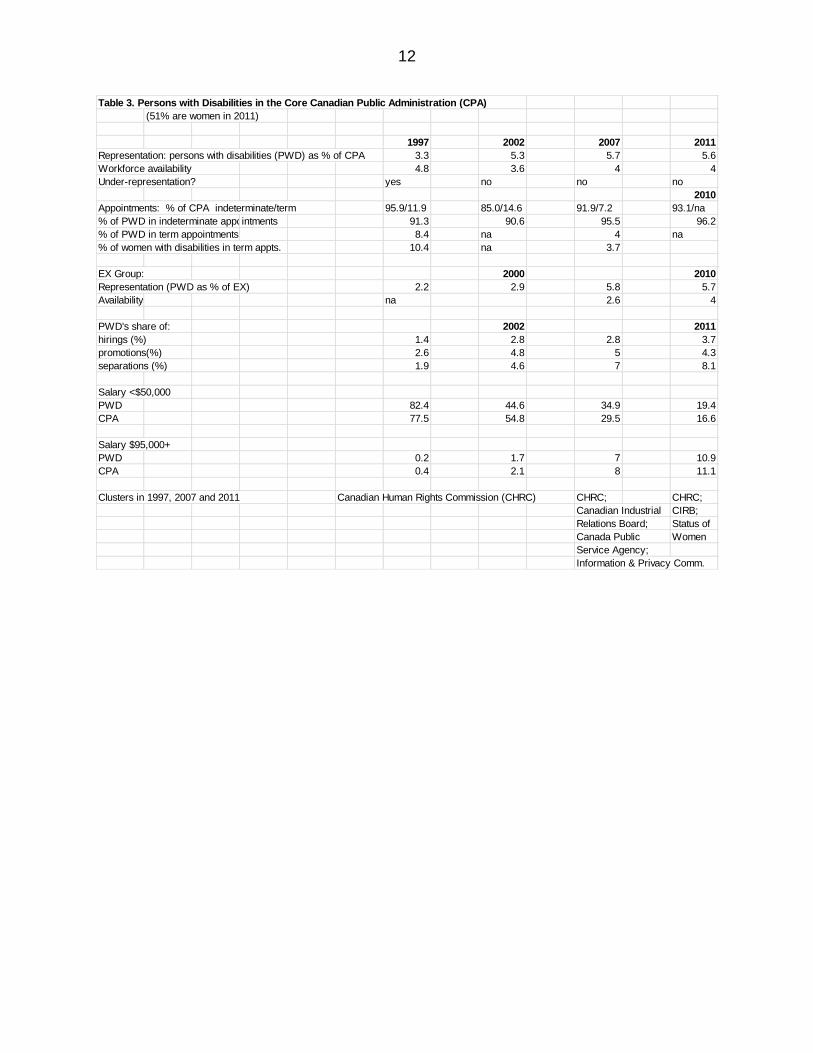
Employment Equity in the Public Service of Canada: Policy Framework and Implementation In 1995 the Public Service of Canada was brought under a revised Employment Equity Act which applied to the federally regulated private sector as well as to government employers. Employment equity set in motion a mandatory and proactive process designed to remove persisting barriers to access and career development for women, visible minorities, Aboriginal people and persons with disabilities. Employment equity policy is intended to bring the representation of these groups to the same level as their representation in the labour markets from which the public service recruits. According to the Treasury Board (2009, 10), the employer of approximately 90 percent of the Canadian public service, “employment equity is an essential first step toward a diverse, representative and inclusive Public Service.” Under the 1995 Act the government implemented a new Employment Equity Policy (1999) which requires federal departments and agencies to provide a supportive work environment for equity groups, attract and retain their members; conduct an internal workforce census and analysis in relation to external availability data; conduct employment systems reviews in order to identify and remove systemic barriers to the equity groups; maintain employment equity plans including goals and timetables, positive policies and practices and special measures to improve representation; provide reasonable accommodation; consult and collaborate with employee representatives; communicate with employees about employment equity; hold management accountable for employment equity implementation by making it part of their performance assessments; and cooperate with audits by the Canadian Human Rights Commission, which is responsible for enforcing compliance with the Employment Equity Act. Federal departments and agencies have varied in their level of compliance with these requirements, and while little specific information is available, it is likely that few have fully implemented them. The Employment Equity Policy notes that “the merit principle is at the core of employment equity” (Treasury Board Policy Suite 1999, 4). In 2002 the Public Service Commission expanded the definition of merit to encompass a public service that is competent, non-partisan and representative, and merit was defined in the 2005 Public Service Employment Act (PSEA) to include meeting “the essential qualifications of the position, including official language proficiency.” The employer may consider employment equity as part of merit if this corresponds to an organizational need. Deputy heads of departments establish the merit criteria for positions and delegate hiring to managers (PSC 2008). It is also notable that under the Public Service Employment Act Canadian citizens are given absolute preference in hiring for the public service. While this policy clearly constitutes a barrier to the hiring of members of visible minorities who are immigrants, it has been upheld by the Supreme Court of Canada. How Representative is the Public Service of Canada? Data Analysis and Discussion Tables 1-4 (Appendix) show indicators of inequality between the equity groups employed in the public service and the public service as a whole, and between the equity groups and their representation in the population from which the public service recruits (workforce availability). The data cover the core public administration (CPA), whose employer is the Treasury Board, which employs nearly 180,000 people working in over 70 departments and agencies. Analysis of trends starts with 1997, the first year the Treasury Board was required to comply with all requirements of the 1995 Employment Equity Act, followed by 2002, 2007 and 2011. (See the Appendix, Notes to the Tables, for details regarding data sources and definitions). There are some gaps in the data available, which were culled from various government reports, and this limits our ability to generalize about trends. Published data are not reported in ways that allow an intersectional analysis of variations within each of the equity groups. As noted in the tables, women comprise over half the members of each of the other three equity groups -- persons with disabilities, visible minorities and Aboriginal peoples – but the available data do not permit comparison of men and women within each group, or of the other three groups within the population of women.

5
a) Women The representation of women in the public service has increased gradually and remained in excess of their workforce availability. With respect to access to employment the public service is representative of women. However patterns of inequality persist, including a tendency for women to be under-represented in indeterminate positions and over-represented in term positions. While women’s representation in the executive group has increased substantially, they remain significantly under-represented relative to their presence in the public service. Women have been consistently well represented among employees hired and promoted, but they have been over-represented in the lowest salary group (less than $50,000) and under-represented in the highest salary group ($95,000 or more). Throughout the fourteen year study period women have made up a strong majority of three departments: the civilian staff of the RCMP, the national parole board, and Status of Women Canada, and they continue to be concentrated in administrative services support jobs. Hence while women have access to public service employment, they have not achieved equality in comparison with the public service as a whole – even though they have long constituted a majority of its members. b) Persons of Aboriginal Identity As is the case for women, the representation of Aboriginal people in the public service has increased gradually over fourteen years and consistently exceeded their representation in the labour force. In 2007 and 2011 their representation in indeterminate positions was slightly higher than that of the public service as a whole, and from 2002 forward their representation in term appointments was lower. These are all positive indicators. However throughout the study period Aboriginal people were under-represented in the executive group and in the highest salary category, and over-represented in the lowest salary group in 1997, 2007 and 2011. The trend in hiring of Aboriginal people turned negative in 2007 and 2011, when availability exceeded their representation among those hired, and the rate of separations exceeded the rate of hires. Furthermore, in 2011 the representation of Aboriginal people among employees promoted was less than their representation in the public sector workforce. Throughout the study period, Aboriginal employees were clustered in departments that provide services to Aboriginal people. To summarize, the public service is a representative bureaucracy for Aboriginal people if we focus only on access to employment, but they do not have equal access to senior management or the top salary group, and the hiring of Aboriginals is trending downward. The representation of Aboriginal peoples will not be sustained if separations continue to exceed hires. Furthermore, Aboriginal representation in the external labour market is increasing due to a birth rate in this population that is higher than that of the Canadian population as a whole, which means that the representation bar will be progresssively higher. c) Persons with Disabilities The indicators suggest that the representation of persons with disabilities exceeds their labour force availability throughout the study period, and they are well represented in indeterminate positions and in the executive group. From 1997 to 2002 and 2007 the representation of persons with disabilities in the public service increased, but 2011 brought a slight drop. It is likely that their representation rate has been sustained not by new hires, but by public service employees self-identifying as having a disability as they age (Public Service Commission 2011). The data show that public service employees with disabilities experience inequality. They are under-represented among employees promoted relative to their level of representation in the public service. In 2007 and 2011 persons with disabilities were over-represented in the lowest salary category and under-represented in the highest salary group. In 2007 and 2011, the rate of separations of persons with disabilities increased quite significantly to more than double their representation among hires, and their hire rate has been below availability for ten years. The trend, then, is negative, and the representativeness of the public service for persons with disabilities will not extend into the future if this continues, particularly since employees with disabilities are older and more likely to retire than other employees. In addition, the representation of persons with disabilities in the external labour market is increasing, which again raises the standard for representativeness (Public Service Commission 2011). d) Members of a Visible Minority Group The representation of visible minorities in the public service has consistently lagged their workforce availability quite significantly. Given that availability data for 2011 are five years out of date and the visible minority population is increasing rapidly due to immigration and natural increase, the indicators for

6
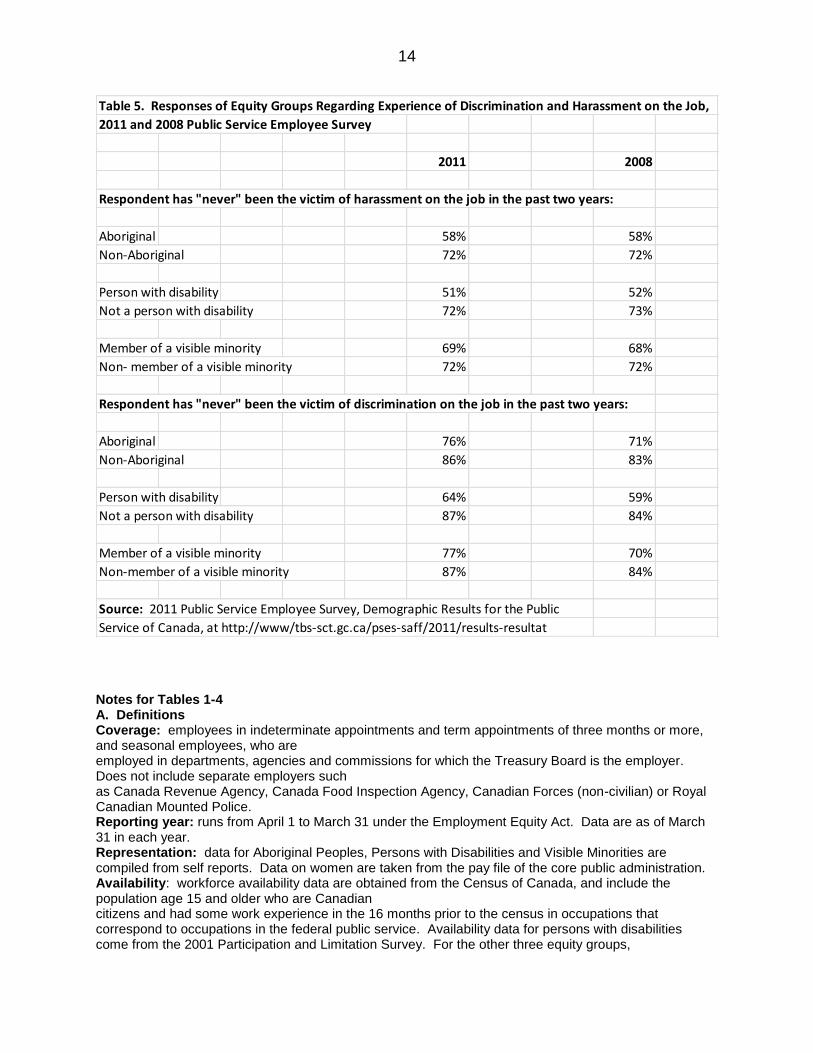
2011 understate the current gap between representation and availability. In addition, patterns of inequality for this population are clearly evident. Visible minorities are under-represented among employees in indeterminate appointments and over-represented among term appointees. They are significantly under-represented in the executive group compared with their presence in the public service. As to salary, visible minorities tend to be slightly over-represented in the lowest salary group and under-represented in the highest category. They show a pattern of clustering in the Immigration and Refugee Board, Citizenship and Immigration and Passport Canada but the most recent data show more dispersion among a broader range of departments. Furthermore, visible minorities have been promoted at a rate exceeding their representation in the public service, and their rate of hiring exceeds their separation rate, although it falls short relative to their level of representation. The federal public service has not been a representative bureaucracy for visible minorities and there is little indication that this situation will improve if present trends continue. Data from the Public Service Commission show that from 2008 through 2011, the percentage of visible minority applicants was considerably higher than their percentage of appointments – a pattern not shown by the three other equity groups (Public Service Commission 2011, chapter 3, table 11). A special survey was undertaken by the PSC to investigate whether applicants who are members of equity groups are eliminated during the appointment process to a greater degree than other applicants. The study found that this was true for visible minority applicants, but not for members of the other three equity groups, suggesting that systemic barriers, such as lack of recognition of foreign credentials, affect hiring for visible minorities (Public Service Commission 2009; Senate 2010, 23). The issue is not a shortage of visible minority applicants. Experience of discrimination and harassment Table 5 presents responses to the 2011 and 2008 Public Service Employee Survey by members and non-members of the equity groups. Aboriginal and visible minority members of the public service, and those with disabilities, are significantly less likely than non-members of these groups to report that they have “never” experienced harassment and discrimination on the job during the past two years, pointing to a generalized perception of inequality among them. Has Employment Equity Made the Public Service of Canada a Representative Bureaucracy? The analysis of data reported by the federal public service has shown that on the basis of access to employment alone, representation of all four equity groups has increased over time, and the public service is a representative bureaucracy for women, Aboriginal people and persons with disabilities – but not for visible minorities. However the representation of Aboriginal people and persons with disabilities is unlikely to keep up with increases in the representation of these groups in the external labour market. Moreover, if we consider factors beyond mere access, including representation in the executive group and indicators of inequality in salary and appointment status, all equity groups face persistent inequality. There have been a number of calls to action over many years concerning the lack of progress of the federal public service in recruiting, retaining and promoting visible minorities. In 1997, a landmark decision of the Canadian Human Rights Tribunal in NCARR v. Health and Welfare Canada was the first successful Canadian human rights case of systemic racial discrimination. The Tribunal found that barriers to promotion, including biased attitudes and discriminatory informal practices, created a “glass ceiling” for members of visible minorities, and ordered an employment equity remedy that produced some change at Health Canada. In 2000, the Task Force on the Participation of Visible Minorities in the Federal Public Service produced a hard-hitting report, Embracing Change in the Federal Public Service, which criticized the government’s lack of progress in fulfilling its obligations under the Employment Equity Act and recommended an action plan for improving the representation of visible minorities. The government adopted this plan, which included a benchmark of one in five appointments to the public service and to executive positions for visible minorities by 2005, and a fund dedicated to creating an inclusive workplace culture and supports for career development. However the benchmarks were not achieved and under-representation of visible minorities continued.

7
In 2007 the Senate Standing Committee on Human Rights published a report, Employment Equity in the Federal Public Service – Not There Yet, which contained evidence of failures to achieve employment equity for all the equity groups. The report pointed to “hidden barriers…within the system” that were preventing equitable representation (Senate 2007, 21), such as the increasing practice of recruiting into part time or short term positions for which staffing processes are less rigorous and based more on personal or local connections, and then using these positions as a source of recruitment into indeterminate positions: 75 percent of permanent hires from 2001 through 2007 were of term or casual employees (Senate 2007, 22; Senate 2010, 22). The Committee lamented the failure of the federal public service to implement employment equity and pointed to a lack of senior leadership commitment and accountability for results, recommending that bonuses of deputy ministers be tied to progress on reaching employment equity goals (Senate 2007, 29). In 2010 the Senate Committee revisited these issues in its report, Reflecting the Changing Face of Canada: Employment Equity in the Federal Public Service, which reiterated the recommendations of its 2007 report since these had not been implemented. The 2010 report also lamented the lack of leadership commitment and managerial accountability for achieving employment equity results, particularly under the new structure for hiring which gives deputy ministers and deputy heads of departments and agencies wide discretion over hiring and staffing (Senate 2010, 5). There was no mechanism in place for tying employment equity performance to performance pay. Also, while most departments and agencies had employment equity plans, few had staffing strategies through which those plans were translated into results. To put into perspective the employment equity record of the federal public service, it is useful to compare it with the private sector employers in the federal jurisdiction that are also covered by the Employment Equity Act, and for whom similar data are publicly available. Private sector employers covered by the Act include over 500 firms in banking, communications and transportation and other industries. In the federally regulated private sector workforce, women, persons with disabilities and Aboriginal peoples are under-represented, and the representation of women has declined in recent years. However visible minorities are represented at a level slightly higher than their availability in the external labour market, and they are being hired in the private sector at levels higher than their availability. In contrast, both Aboriginal people and persons with disabilities are represented in the private sector at levels well below availability and their representation among hires has remained low and stable. Women’s level of representation in senior management jobs in the private sector is far below their representation in executive jobs in the public service. The other three employment equity groups are also under-represented in senior management in the private sector (CHRC 2007 and 2010). The contrast between the public and private sectors is interesting: women, Aboriginal people and persons with disabilities benefit from more access to employment and career development in the public sector, while visible minorities are better represented in the private sector. Reasons for these outcomes for visible minorities may include the preference for hiring Canadian citizens in the public service (22 percent of the visible minority workforce are not Canadian citizens, including recent immigrants), and the concentration of public service employment in Ottawa versus the metropolitan areas of Toronto, Montreal and Vancouver, where more private sector employment and larger visible minority populations are located (CHRC 2010). In 1997, research commissioned by the Canadian Human Rights Commission studied federal agencies and departments in comparison with private sector firms in order to investigate factors in public service staffing practices and culture that may contribute to the under-representation of visible minorities in the public service. Among the findings were a perception that racial discrimination is prevalent in the public service, lack of flexibility in staffing processes, lack of minority representation on selection boards, lack of access to information about jobs and career development, a workplace climate that excludes visible minorities, and the absence of a critical mass of visible minorities in the senior management echelon. There was also concern about a lack of management commitment and accountability for increasing the representation of visible minorities in the public service (Samuel 1997). This issue has become a greater concern in the years following the research, after responsibility for setting merit criteria for jobs and for hiring was delegated downward. Clearly, a number of systemic barriers in the structure and culture of the public service contribute to the under-representation of visible minorities.

8
Regime Change and Organizational Change: Implications for Employment Equity and a Representative Bureaucracy Andrew (2002, 167) points out that “gender equality does not evolve in a linear fashion; it is influenced by macroeconomic, political, and administrative trends,” and by changing ideologies that have brought shifts in the structure and culture of the public service as well as in policy directions. The neo-liberal turn beginning in Canada in the early 1990s, and reaching its apogee with the Harper majority government, has brought a lengthy period of public service and program budget cuts, downsizing and a reversal or curtailment of many policies and programs of the welfare state. These actions are affecting equity groups on many levels, including access to public service employment and career development, and availability of services to women and diverse populations of Canadians. The current government’s political commitment to lean government, reflecting adherence to neo-liberal ideology and a withdrawal from the equality-oriented welfare state, is likely to hinder the potential of employment equity policy to deliver a federal bureaucracy that is representative of the diversity of Canadian society. A multi-year decline in external hiring, particularly into indeterminate positions, as well as a decline in term hiring, has already limited opportunities for jobs in the public service. The decline has also applied to casual and student hiring, and to staffing actions providing opportunities for lateral and upward mobility (Public Service Commission 2011). Budget cuts starting in 2012, added to three earlier waves of cuts to federal staff and programs, will have impacts on all equity groups, but their extent is difficult to predict because of a lack of transparency regarding what programs and departments will be cut (Macdonald 2012). Term employees are particularly vulnerable to cuts that take the form of early termination of contracts or failure to renew (PSAC 2011), and members of the equity groups tend to be over-represented among those on term contracts. The Public Service Commission states that “the public service is in a period of no growth, and potential decline going forward,” yet it must still deliver quality services and programs to Canadians and strive to meet its responsibilities under the Employment Equity Act to become a representative bureaucracy offering equal and fair employment and career opportunities. The Harper government has yet to attempt a repeal of the Employment Equity Act as the Harris government of Ontario did in 1996, despite the overlap in membership and ideological proclivities of the two governments. However the Harper government has made decisions that have had the effect of cutting the legs from under the Act. These decisions have included cuts to the Canadian Human Rights Commission and Citizenship and Immigration Canada, which have monitoring and enforcement responsibilities under the Act, and the scrapping of the mandatory long form of the census, upon which employers and enforcement agencies depend for availability data. Other measures have impaired the ability of the public, researchers and advocacy organizations to monitor employment equity implementation results and voice critical perspectives. Among these actions are the abolition of the Court Challenges Program, cuts to Status of Women Canada, the muzzling of public servants, and a general lack of transparency about government actions and programs. As well, not-for-profits which represent equality-seeking groups have had their budgets cut or threatened. Such actions can amount to a death by a thousand cuts, without the need to incur the political fallout of an attempt at outright repeal of the Employment Equity Act. In a diverse society such as Canada, a meritorious public service is a representative public service. While voices within the federal bureaucracy, and public service unions and associations representing the equity groups, continue their efforts to stay the course toward a representative public service without systemic barriers to equality, the regime within which they must operate is taking actions that undermine the long-standing institutional and legal commitment to employment equity. Under-representation of equity groups at senior levels means that government policy will not be responsive to women and diverse communities. Future declines in their representation will impair the responsiveness of services already weakened by cuts. Public policy, public services and governance will show the effects in years to come unless citizens mobilize to change the regime and chart a new direction.

9
References Acker, Joan, “Inequality Regimes: Gender, Class and Race in Organizations,” Gender and Society, 20(4), 2006, 441-464. Andrew, Caroline, “Women and the Public Sector,” in Christopher Dunn (ed.), The Handbook of Canadian Public Administration, Don Mills: Oxford University Press, 2002, pp. 159-168. Bradbury, Mark and J. Edward Kellough, “Representative Bureaucracy: Assessing the Evidence on Active Representation,” American Review of Public Administration 41(2) 2011, 157-167. Canadian Human Rights Commission (CHRC), “Annual Report,” 2007. Canadian Human Rights Commission (CHRC), “Impact of the Employment Equity Act and the Canadian Human Rights Commission Employment Equity Program Over the Years,” Employment Equity Compliance Division, March 2010. Gidengil, Elisabeth and Richard Vengroff, “Representative Bureaucracy, Tokenism and the Glass Ceiling: The Case of Women in Quebec Municipal Administration,” Canadian Public Administration, 1997,40 (3), 457-480. Kelly, Rita Mae, “An Inclusive Democratic Polity, Representative Bureaucracies, and the New Public Management, Public Administration Review, 1998, 58(3), 201-208. Kernaghan, Kenneth, “Representative Bureaucracy: The Canadian Perspective,” Canadian Public Administration, 1978, 21(4) 489-512. Macdonald, David, “The Cuts Behind the Curtain: How Federal Cutbacks Will Slash Services and Increase Unemployment,” Canadian Centre for Policy Alternatives, January 2012. Olsen, Dennis, The State Elite, Toronto: McClelland and Stewart, 1980. Ornstein, Michael, “Three Decades of Elite Research in Canada: John Porter’s Unfulfilled Legacy,” in Rick Helmes-Hayes and James Curtis (eds.), The Vertical Mosaic Revisited, Toronto: University of Toronto Press, 1998. Porter, John, “Higher Public Servants and the Bureaucratic Elite in Canada,” Canadian Journal of Economics and Political Science, 1958, 483-501. Porter, John. The Vertical Mosaic: An Analysis of Social Class and Power in Canada, Toronto: University of Toronto Press, 1965. Public Service Alliance of Canada (PSAC), “Q&A on Workforce Adjustment for Term Employees,” December 1, 2011, at http://psac-afpc.com/what/wfa/wfa_are_factsheet_term-e.shtml Public Service Commission of Canada, “2010-2011 Annual Report,” 2011. Public Service Commission of Canada, “Merit – Achieving Representativeness,” March 2008. Public Service Commission of Canada, “Highlights—Study on the drop-off of employment equity groups in recruitment,” October 2009. Public Service Commission of Canada, Equity and Diversity Directorate, “History of Employment Equity in the Public Service, and the Public Service Commission of Canada,” October 2011.

10
Public Service Commission of Canada, Equity and Diversity Directorate, “Recruitment of Persons with Disabilities: A Literature Review,” May 2011. Samuel, John, “Visible Minorities and the Public Service of Canada,” Ottawa: Canadian Human Rights Commission, February 1997. Senate of Canada, Standing Committee on Human Rights, “Employment Equity in the Federal Public Service -- Not There Yet,” February 2007. Senate of Canada, Standing Committee on Human Rights, “Reflecting the Changing Face of Canada: Employment Equity in the Federal Public Service,” June 2010. Statistics Canada,”Projections of the Diversity of the Canadian Population, 2006 to 2031,” 2010, at www.statcan.gc.ca/pub/91-551-x/91-551-x2010001-eng.pdf Timpson, Annis May. “Stretching the Concept of Representative Bureaucracy: The Case of Nunavut, International Review of Administrative Sciences, 72 (4), 2006, 517-530. Treasury Board of Canada Secretariat, Office of the Chief Human Resources Officer, “Demographic Snapshot of the Federal Public Service, 2010,” 2010, at http://www.tbs-sct.gc.ca/res/stats/demo-eng.asp Treasury Board of Canada Secretariat, Office of the Chief Human Resources Officer, “Employment Equity in the Public Service of Canada, 2006-2007 and 2007-2008,” 2009, archived at www.tbs-sct.gc.ca/rp/0608ee01-eng.asp. Treasury Board Policy Suite, “Employment Equity Policy,” 1999, at http://www.tbs-sct.gc.ca/pol/doc-eng.aspx$id=12543§ion=text

11
Table 1. Women in the Core Canadian Public Administration (CPA)
1997 2002 2007 2011
Representation (women as % of CPA) 49.5 52.5 53.9 54.8
Workforce availability 48.7 52.2 52.8 52.8
Under-representation? no no no no
Appointments: % of CPA indeterminate/term 95.9/11.9 85.0/14.6 91.9/7.2 88.5/9.1
% of women in indeterminate appointmentsnt 84 82.9 91.9 86.2
% of women in term appointments 15.6 7.8 na
EX Group: 2000 2010
Representation (women as % of EX) 23 28.4 40.4 44.1
Availability na na 42.8 45.5
Women's share of: 2002 2011
hirings (%) 63.2 56.8 55.7 55.2
promotions(%) 56.5 60.4 61.2 60.1
separations (%) 47.9 53.9 53.4 53.9
Salary <$50,000
women 87.6 50.2 37.6 20.6
CPA 77.5 54.8 29.5 16.6
Salary $95,000+
women 0.1 1 5 8.5
CPA 0.4 2.1 8 11.1
Clusters in 1997, 2007 and 2011 RCMP (civilian staff) RCMP (civilian staff)
National Parole Board National Parole Board
Status of Women Status of Women
Table 2. Persons of Aboriginal Identity in the Core Canadian Public Administration (CPA)
(61% are women in 2011)
1997 2002 2007 2011
Representation: (Aboriginal People (AP) as % of CPA 2.4 3.8 4.2 4.7
Workforce availability 1.7 2.5 3.8 3.8
Under-representation? no no no no
2010
Appointments: % of CPA indeterminate/term 95.9/11.9 85.0/14.6 91.9/7.2 93.1/na
% of AP in indeterminate appointmentsnt 83.2 83.6 93 94.7
% of AP in term appointments 15.6 4.9 6.2 na
% of Aboriginal women in term appts 18.2 na 6.8 na
EX Group: 2000 2010
Representation (AP as % of EX) 1.7 1.9 3.4 3.7
Availability na na 3.5 4.3
AP's share of: 2002 2011
hirings (%) 2.6 4.5 3.3 3.5
promotions(%) 2.9 4.1 4.3 4.5
separations (%) 1.7 4.5 3.9 4.4
Salary <$50,000
AP 86.4 48.7 34 18.5
CPA 77.5 54.8 29.5 16.6
Salary $95,000+
AP 0.1 0.8 4 7.5
CPA 0.4 2.1 8 11.1
Clusters in 1997, 2007 and 2011 Indian and Northern Affairs Indian & Northern Aboriginal Affairs &
Affairs; Northern Development
Office of Indian
Residential Schools
Resolution
12
Table 3. Persons with Disabilities in the Core Canadian Public Administration (CPA)
(51% are women in 2011)
1997 2002 2007 2011
Representation: persons with disabilities (PWD) as % of CPA 3.3 5.3 5.7 5.6
Workforce availability 4.8 3.6 4 4
Under-representation? yes no no no
2010
Appointments: % of CPA indeterminate/term 95.9/11.9 85.0/14.6 91.9/7.2 93.1/na
% of PWD in indeterminate appointmentsintments 91.3 90.6 95.5 96.2
% of PWD in term appointments 8.4 na 4 na
% of women with disabilities in term appts. 10.4 na 3.7
EX Group: 2000 2010
Representation (PWD as % of EX) 2.2 2.9 5.8 5.7
Availability na 2.6 4
PWD's share of: 2002 2011
hirings (%) 1.4 2.8 2.8 3.7
promotions(%) 2.6 4.8 5 4.3
separations (%) 1.9 4.6 7 8.1
Salary <$50,000
PWD 82.4 44.6 34.9 19.4
CPA 77.5 54.8 29.5 16.6
Salary $95,000+
PWD 0.2 1.7 7 10.9
CPA 0.4 2.1 8 11.1
Clusters in 1997, 2007 and 2011 Canadian Human Rights Commission (CHRC) CHRC; CHRC;
Canadian Industrial CIRB;
Relations Board; Status of
Canada Public Women
Service Agency;
Information & Privacy Comm.

13
Table 4. Members of a Visible Minority Group in the Core Canadian Public Administration (CPA)
(55% are women in 2011)
1997 2002 2007 2011
Representation: members of a visible minority (VMs) as % of CPA 4.7 6.8 8.8 11.3
Workforce availability 8.7 10.4 13 13
Under-representation? yes yes yes yes
2010
Appointments: % of CPA indeterminate/term 95.9/11.9 85.0/14.6 91.9/7.2 93.1/na
% of VMs in indeterminate appointmentsntments 88.1 81.5 91.2 92.9
% of VMs in term appointments 11.8 na 8.6 na
% of VM women in term appts. 14.3 na 9.5 na
EX Group: 2000 2010
Representation (VMs as % of EX) 2.5 3.1 6.2 7.3
Availability na na na 7.7
VM's share of: 2002 2011
hirings (%) 3.1 10 8.7 9.8
promotions(%) 4.9 7.7 10.5 12.5
separations (%) 2.1 6.3 7.1 7.1
Salary <$50,000
VMs 72.8 42.8 30.1 16.9
CPA 77.5 54.8 29.5 16.6
Salary $95,000+
VMs 0.1 1.7 7 9.4
CPA 0.4 2.1 8 11.1
Clusters in 1997, 2007 and 2011 Immigration & Refugee Board (IRB) Citizenship & Immigration (C&I); C&I;
Passport Canada (PC); PC;
IRB; Western IRB;
Economic Diversification (WED);WED;
Status of Women Health;
14
Table 5. Responses of Equity Groups Regarding Experience of Discrimination and Harassment on the Job,
2011 and 2008 Public Service Employee Survey
2011 2008
Respondent has "never" been the victim of harassment on the job in the past two years:
Aboriginal 58% 58%
Non-Aboriginal 72% 72%
Person with disability 51% 52%
Not a person with disability 72% 73%
Member of a visible minority 69% 68%
Non- member of a visible minority 72% 72%
Respondent has "never" been the victim of discrimination on the job in the past two years:
Aboriginal 76% 71%
Non-Aboriginal 86% 83%
Person with disability 64% 59%
Not a person with disability 87% 84%
Member of a visible minority 77% 70%
Non-member of a visible minority 87% 84%
Source: 2011 Public Service Employee Survey, Demographic Results for the Public
Service of Canada, at http://www/tbs-sct.gc.ca/pses-saff/2011/results-resultat Notes for Tables 1-4 A. Definitions Coverage: employees in indeterminate appointments and term appointments of three months or more, and seasonal employees, who are employed in departments, agencies and commissions for which the Treasury Board is the employer. Does not include separate employers such as Canada Revenue Agency, Canada Food Inspection Agency, Canadian Forces (non-civilian) or Royal Canadian Mounted Police. Reporting year: runs from April 1 to March 31 under the Employment Equity Act. Data are as of March 31 in each year. Representation: data for Aboriginal Peoples, Persons with Disabilities and Visible Minorities are compiled from self reports. Data on women are taken from the pay file of the core public administration. Availability: workforce availability data are obtained from the Census of Canada, and include the population age 15 and older who are Canadian citizens and had some work experience in the 16 months prior to the census in occupations that correspond to occupations in the federal public service. Availability data for persons with disabilities come from the 2001 Participation and Limitation Survey. For the other three equity groups,

15
availability data for 1997 come from the 1996 Census, availability data for 2002 come from the 2001 census, and availability data for 2007 and 2011 come from the 2006 census. Data from the 2011 census are not yet available.. Indeterminate appointments: positions held for an unspecified duration. Term appointments: positions held for a specified length of time of three months or more. Hirings: representation among new employees added in the past fiscal year. Promotions: representation among appointments to positions at higher pay level. Separations: representations among employees removed from payroll, including those who retired, resigned, or whose term ended. Clusters: government departments or agencies having 70 or more employees, in which 10% or more employees were Aboriginal or persons with disabilities, or 17% or more were members of visible minorities, or 75% or more were women. B. Data Sources for Tables 1-4: Data about the equity groups in the public service come from voluntary self-reports, except for data on women, which come from payroll records. Data reported for Aboriginal peoples, persons with disabilities and visible minorities include both women and men: 61 percent of Aboriginal employees are women, 51 percent of persons with disabilities are women, and 55 percent of visible minorities are women. The lack of reporting separately on women and men in these equity groups is one of the many limitations and inconsistencies encountered by users of government employment equity data. Data for 1997 come from President of the Treasury Board, “Employment |Equity in the Federal Public Service 1996-1997,” Annual Report to Parliament, 1997, pp. 37,41,56,63-65,67, archived at http://publications.gc/collections/Collection/BT1-9-1997E.pdf . Data for 2002 and some data for 1997 come from Treasury Board of Canada Secretariat, “Employment Equity in the Federal Public Service 2001-2002,” at http://www.tbs-sct.gc.ca/report/empequi/2002/ee-o2-1_e.asp. Data for 2006-07 and some data for 2001 are from Treasury Board of Canada Secretariat, Office of the Chief Human Resources Officer, “Employment Equity in the Public Service of Canada 2006-2007 and 2007-2008,” 2009, archived at www.tbs-sct.gc.ca/rp/0608ee01-eng.asp, ch. 3 (“What the Numbers Show: 2006-2007”), and Appendix 3 (“Statistical Tables, 2006-2007”). Some data shown on the tables are calculations based on data in this report. Data for 2011 come from Treasury Board of Canada Secretariat, “Employment Equity in the Public Service of Canada, 2010-11, Annual Report to Parliament,” 2012, archived at http://publications.gc.ca/collections/collection_2012/sct-tb. Data for 2010 were used when data for 2011 were not available; this is noted on the tables. Data for 2010 come from Treasury Board of Canada Secretariat, “Employment Equity in the Public Service of Canada 2009-10,” archived at http://www.tbs-sct.gc.ca/reports-rapports/ee/2009-2010. Workforce availability data for 2006, as well as data on EX representation in 2000 and 2010, come from Treasury Board of Canada Secretariat, Office of the Chief Human Resources Officer, “Demographic Snapshot of the Federal Public Service, 2010,” at http://www.tbs-sct.gc.ca/res/stats/demo-eng.asp Tracking of employment equity results depends upon comparisons between results of employers’ census of their workforce, based on employees’ voluntary disclosure of their Aboriginal ancestry, disability, or membership in a visible minority group, and “availability data”, which are census data on the representation of these groups in the labour force from which employers recruit. The census is conducted every five years, eg. In 1996, 2001, 2006 and 2011. However there is a delay of up to three years before census data are available for use as availability data, which means that the yardstick for measuring whether the employer’s workforce is representative or not is often out of date and inaccurate. For example, in their annual reports, employers’ analysis of their 2007 employment equity representation

16
is compared against the 2001 census, which understates the labour market representation of changing populations like visible minorities or Aboriginal peoples. In the analysis for this paper I used the most recent available census data for availability estimates. Public service data for 1997 are compared with 1996 census data, 2002 public service data are compared with 2001 census data, and public service data for 2007 and 2011 are compared with 2006 census data, the most recent now available.