reproducibility of blood pressure and inter-beat interval ... suppl 1/59_s113.pdf ·...
TRANSCRIPT
PHYSIOLOGICAL RESEARCH • ISSN 0862-8408 (print) • ISSN 1802-9973 (online) © 2010 Institute of Physiology v.v.i., Academy of Sciences of the Czech Republic, Prague, Czech Republic Fax +420 241 062 164, e-mail: [email protected], www.biomed.cas.cz/physiolres
Physiol. Res. 59 (Suppl. 1): S113-S121, 2010 Reproducibility of Blood Pressure and Inter-Beat Interval Variability in Man M. JÍRA1, E. ZÁVODNÁ1, Z. NOVÁKOVÁ1, B. FIŠER1, N. HONZÍKOVÁ1 1Department of Physiology, Faculty of Medicine, Masaryk University, Brno, Czech Republic
Received February 1, 2010 Accepted March 26, 2010 Summary
Increased blood pressure variability (BPV) and decreased inter-
beat interval (heart rate, respectively) variability (IBIV, HRV
respectively) are associated with cardiovascular disorders. The
aim of this study was to evaluate the reproducibility of BPV and
IBIV (HRV) in young healthy individuals. Blood pressure and
inter-beat intervals (instantaneous values of heart rate,
respectively) were recorded beat-to-beat at rest (5 min, Finapres,
breathing at 0.33 Hz) in 152 subjects (19-24 years) 3 times in
periods of one week. Systolic (SBPV0.1r/SBPV0.1a) and diastolic
(DBPV0.1r/DBPV0.1a) blood pressure variability in relative (r.u.) and
absolute (mmHg2/Hz) units and inter-beat interval
(IBIV0.1r/IBIV0.1a,), or heart rate (HRV0.1r/HRV0.1a) variability in
relative (r.u.) and absolute (ms2/Hz, resp. mHz2) units were
determined by the spectral method as spectral power at the
frequency of 0.1 Hz and 0.33 Hz (SBPV0.33r/SBPV0.33a,
DBPV0.33r/DBPV0.33a, IBIV0.33r/IBIV0.33a, HRV0.33r/HRV0.33a). All
indices of BPV and IBIV (resp. HRV) revealed a lower
intraindividual than interindividual variability (ANOVA; p<0.001).
The mean values of all indices in each subject significantly
correlated with distribution of individual values in the same
subject (Pearson's correlation coefficient; p<0.001). Blood
pressure and inter-beat interval (heart rate) variability is an
individual characteristic feature.
Key words
Blood pressure variability • Inter-beat interval variability •
Reproducibility • Spectral analysis
Corresponding author
N. Honzíková, Department of Physiology, Faculty of Medicine,
Masaryk University, Komenského nám. 2, Brno, Czech Republic.
Fax: +420-549 493 748. E-mail: [email protected]
Introduction
Increased circadian blood pressure variability (BPV) is considered to be an independent risk factor for atherosclerosis (Sander et al. 1996), cardiac hypertrophy (Cymerys et al. 2002), increased intima-media thickness (Zakopoulos et al. 2005), and for the end-organ damage (Parati et al. 1987). Mancia et al. (1983) also showed that hypertensive subjects have increased BPV in comparison with normotensive ones. Since the oscillations in blood pressure reflect the activity of the sympathetic nervous system, an increased 24h blood pressure variability could be one of the outcome of enhanced sympathetic nerve activity (Mark et al. 1996, Narkiewicz et al. 2002), which in itself is considered to be a risk factor for the development of hypertension, myocardial infarction and sudden cardiac death (Mark et al. 1996). The fluctuations of inter-beat interval, or heart rate can be expressed as inter-beat interval variability (IBIV), or heart rate variability (HRV). Both IBIV and HRV reflect the condition of autonomic nervous system and may be decreased in some cardiovascular disorders (Osterziel et al. 1995, Sleight 1997, La Rovere et al. 1998, Honzíková et al. 2000). It has been shown that reduced HRV represents independent indicator of unfavourable prognosis in patients with chronic heart failure and after myocardial infarction (Honzíková et al. 1997, Nolan et al. 1998, La Rovere et al. 1998). Fewer studies are focused to the association of short-term BPV and IBIV (or HRV) evaluated by means of spectral analysis with these cardiovascular diseases (Laitinen et al. 1999). Yet, there are some studies showing an increase of short-term BPV at a frequency of 0.1 Hz at an early stage of blood pressure elevation in adolescents (Honzíková et al. 2006). Another approach to the evaluation of HRV is calculation
S114 Jíra et al. Vol. 59 of ratio between low-frequency (LF; 0.03-0.12 Hz) and high-frequency (HF; 0.13-0.50 Hz) components of heart rate variability (LF/HF ratio), as an indicator of sympathovagal balance. Changes of a LF/HF ratio of heart rate variability are reported to be associated with some cardiovascular disorders. For example Pal et al. (2009) showed an increase of LF/HF in heart rate variability in pregnant women with developed pregnancy-induced hypertension.
Short-term blood pressure and heart rate variability are dynamic parameters. Fluctuations in blood pressure bring about changes of heart rate via baroreflex modulation and heart rate variability evoked by baroreflex have a dampening effect on blood pressure oscillations (Honzíková et al. 2003). We have shown that baroreflex sensitivity is an individually characteristic feature (Jíra et al. 2006a) influenced by genetic factors (Jíra et al. 2010). As in the case of baroreflex sensitivity the results of our former studies indicate that other parameters such as blood pressure and heart rate variability could be genetically determined (Jíra et al. 2006b, 2007). However, it is essential to know for further genetic study, whether the values of spectral power of blood pressure and heart rate variability are reproducible in individual subjects despite their spontaneous fluctuations, in other words whether these features are individually characteristic. The first data on individual characteristic features of blood pressure and heart rate power spectra distribution into certain ranges using spectral analysis were brought by Peňáz et al. (1978). Another study showed that interindividual variability of the relative division of spectra into ranges was substantially greater than the differences in a given subject after 1 year of follow up and that at the same time the individual feature of the relative division of the power spectra into ranges was distinctive for a given subject (Honzíková et al. 1990). Yet, there is a lack of sufficiently large study on blood pressure and heart rate variability reproducibility. Therefore the aim of this study was to evaluate the reproducibility of blood pressure and inter-beat interval (heart rate, respectively) variability in young healthy individuals. Methods Subjects and protocol
Young healthy individuals were recruited among university students for this study. Only apparently healthy individuals were included in the study; all of the subjects
were without positive juvenile history of cardiovascular disease including hypertension, and diabetes mellitus. The exclusion criteria also contained pathological metabolic profile. A total of 152 subjects (45 men and 107 women) aged 19-24 years was examined. The Ethics Committee approved the study and each subject gave his/her informed consent.
Systolic (SBP), diastolic (DBP) blood pressures, inter-beat interval (IBI) and instantaneous values of heart rate (HR), respectively were recorded beat-to-beat by a non-invasive, continuous method from finger arteries (Ohmeda Finapres Model 2300). The finger cuff was placed on the second phalanx of the middle or ring finger of the subject’s dominant hand. The hand was fixed at the level of the participant’s heart. The probands were sitting at rest for 15 minutes prior to the measurement, thereafter blood pressure was measured for 5 minutes. The examinations were performed in a quiet room (temperature 22 ˚C), in sitting position. All subjects were requested to breathe at a rate of 20 breaths per min (0.33 Hz) following the LED-bar metronome. They were allowed to adjust their tidal volume according to their own comfort. The participants had neither objective nor subjective problems to follow the metronome. The controlled breathing protocol allowed us to obtain spectral estimation of cardiovascular signals with a rhythm around 0.1 Hz without any interference with respiration. The examinations were done at five or three one week periods, at the same daytime. The values of SBP and DBP were verified by values measured by Korotkoff method. For statistical analysis the values of SBP, DBP and IBI (resp. HR) were evaluated as means from 5 minutes’ beat-to-beat recordings, i.e. from 300 to 400 values.
Data processing, spectral analysis, blood pressure and inter-beat interval variability assessment
BPV and IBIV (resp. HRV) were evaluated by spectral analysis (Honzíková et al. 1992). The values of SBP, DBP and IBI (resp. HR) of 5 minutes recordings were linearly interpolated and equidistantly sampled at 2 Hz. The linear trend was displaced. The Fast Fourier transformation of autocorrelations of the systolic and diastolic blood pressure sequences and inter-beat interval (instantaneous values of heart rate) sequences was used for the power spectra calculation. The methodology was described in details elsewhere (Závodná et al. 2006).
Systolic (SBPV) and diastolic blood pressure (DBPV) variability were determined as the values of the
2010 Reproducibility of Blood Pressure and Inter-Beat Interval Variability S115 spectra power at the frequency of 0.1 Hz and 0.33 Hz (respiratory frequency) in both relative (r.u.) and absolute (mm Hg2/Hz) units (SBPV0.1r, SBPV0.1a, DBPV0.1r, DBPV0.1a and SBPV0.33r, SBPV0.33a, DBPV0.33r, DBPV0.33a).
The values of the spectra power at the frequency of 0.1 Hz and 0.33 Hz (respiratory frequency) were taken as values of inter-beat interval (IBIV), resp. instantaneous values of heart rate (HRV) variability also in both relative (r.u.) and absolute (ms2/Hz, resp. mHz2) units (IBIV0.1r, IBIV0.1a, HRV0.1r, HRV0.1a and IBIV0.33r, IBIV0.33a, HRV0.33r, HRV0.33a).
Mean values of SBPV, DBPV and IBIV (resp. HRV) and standard deviations (SD) were calculated.
First, the number of measurements that would be sufficient to give individually reproducible results was tested in a smaller study group of 32 subjects. Values of SBPV, DBPV and IBIV (resp. HRV) at the frequency of 0.1 Hz were calculated from 5 measurements five times (preliminary test group A).
Next, the difference between intraindividual and interindividual variability of SBP, DBP and IBI, resp. HR were estimated in the larger group of 152 subjects from 3 measurements tree times (proper experimental group B).
Statistical analysis
Statistical analysis was performed using Statistica version 6.0. The significance of the differences between intraindividual and interindividual variability of SBP, DBP and IBI, resp. HR (i.e. the individual characteristics of these parameters) were evaluated by
ANOVA test (F-coefficient). The correlations between the mean values of SBPV, DBPV and IBIV (resp. HRV) from three measurements and standard deviation (SD) for all the parameters of three values measured in each subject were evaluated by Pearson's correlation coefficient (R) in the group of 152 subjects. Pearson's coefficient was also used for evaluating the correlation between the mean values of 5 measurements of SBPV, DBPV and IBIV (resp. HRV) at frequency of 0.1 Hz with the first value measured and with mean of 2 or 3 or 4 consecutive measurements in the smaller group of 32 subjects for optimalisation of number of measurements. Results Optimalisation of number of measurements
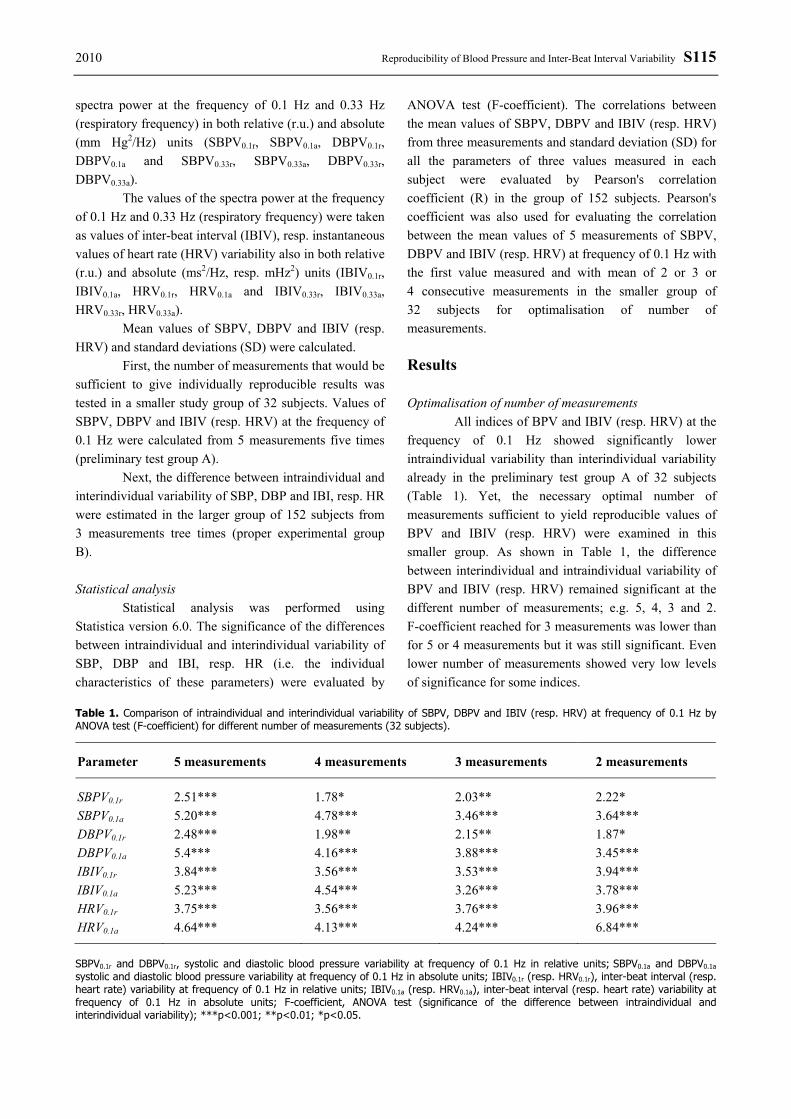
All indices of BPV and IBIV (resp. HRV) at the frequency of 0.1 Hz showed significantly lower intraindividual variability than interindividual variability already in the preliminary test group A of 32 subjects (Table 1). Yet, the necessary optimal number of measurements sufficient to yield reproducible values of BPV and IBIV (resp. HRV) were examined in this smaller group. As shown in Table 1, the difference between interindividual and intraindividual variability of BPV and IBIV (resp. HRV) remained significant at the different number of measurements; e.g. 5, 4, 3 and 2. F-coefficient reached for 3 measurements was lower than for 5 or 4 measurements but it was still significant. Even lower number of measurements showed very low levels of significance for some indices.
Table 1. Comparison of intraindividual and interindividual variability of SBPV, DBPV and IBIV (resp. HRV) at frequency of 0.1 Hz by ANOVA test (F-coefficient) for different number of measurements (32 subjects).
Parameter 5 measurements 4 measurements 3 measurements 2 measurements
SBPV0.1r 2.51*** 1.78* 2.03** 2.22* SBPV0.1a 5.20*** 4.78*** 3.46*** 3.64*** DBPV0.1r 2.48*** 1.98** 2.15** 1.87* DBPV0.1a 5.4*** 4.16*** 3.88*** 3.45*** IBIV0.1r 3.84*** 3.56*** 3.53*** 3.94*** IBIV0.1a 5.23*** 4.54*** 3.26*** 3.78*** HRV0.1r 3.75*** 3.56*** 3.76*** 3.96*** HRV0.1a 4.64*** 4.13*** 4.24*** 6.84***
SBPV0.1r and DBPV0.1r, systolic and diastolic blood pressure variability at frequency of 0.1 Hz in relative units; SBPV0.1a and DBPV0.1a systolic and diastolic blood pressure variability at frequency of 0.1 Hz in absolute units; IBIV0.1r (resp. HRV0.1r), inter-beat interval (resp. heart rate) variability at frequency of 0.1 Hz in relative units; IBIV0.1a (resp. HRV0.1a), inter-beat interval (resp. heart rate) variability at frequency of 0.1 Hz in absolute units; F-coefficient, ANOVA test (significance of the difference between intraindividual and interindividual variability); ***p<0.001; **p<0.01; *p<0.05.

S116 Jíra et al. Vol. 59 Table 2. Correlation between mean values of 5 measurements of BPV and IBIV (resp. HRV) indices at frequency of 0.1 Hz with the first value measured and with mean of 2 or 3 or 4 consecutive measurements (32 subjects).
Mean of 1.-5. measurement SBPV0.1a SBPV0.1a DBPV0.1r DBPV0.1a IBIV0.1r IBIV0.1a HRV0.1r HRV0.1a
1. measurement 0.73*** 0.90*** 0.69*** 0.85*** 0.77*** 0.85*** 0.77*** 0.90*** 1.-2. measurement 0.75*** 0.93*** 0.73*** 0.90*** 0.86*** 0.97*** 0.86*** 0.93*** 1.-3. measurement 0.79*** 0.95*** 0.81*** 0.93*** 0.88*** 0.94*** 0.88*** 0.94*** 1.-4. measurement 0.98*** 0.98*** 0.97*** 0.98*** 0.96*** 0.97*** 0.96*** 0.98*** SBPV0.1r and DBPV0.1r, systolic and diastolic blood pressure variability at frequency of 0.1 Hz in relative units; SBPV0.1a and DBPV0.1a systolic and diastolic blood pressure variability at frequency of 0.1 Hz in absolute units; IBIV0.1r (resp. HRV0.1r), inter-beat interval (resp. heart rate) variability at frequency of 0.1 Hz in relative units; IBIV0.1a (resp. HRV0.1a), inter-beat interval (resp. heart rate) variability at frequency of 0.1 Hz in absolute units; Pearson's correlation coefficient (correlation between mean values from five measurements and with the first value measured and with mean of 2 or 3 or 4 consecutive measurements; ***p<0.001.
Table 3. Correlation between mean values of SBPV, DBPV and IBIV (resp. HRV) at frequency of 0.1 Hz and their standard deviations. Mean values and standard deviations were calculated from equal number of measurements; e.g. mean value from 5 measurements and standard deviations from 5 measurements (32 subjects).
Parameter 5 measurements 4 measurements 3 measurements 2 measurements
SBPV0.1r 0.84*** 0.82*** 0.62*** 0.58*** SBPV0.1a 0.86*** 0.89*** 0.88*** 0.62*** DBPV0.1r 0.54*** 0.77*** 0.58*** 0.47*** DBPV0.1a 0.77*** 0.72*** 0.75*** 0.59*** IBIV0.1r 0.72*** 0.76*** 0.72*** 0.63*** IBIV0.1a 0.72*** 0.75*** 0.79*** 0.85*** HRV0.1r 0.70*** 0.75*** 0.71*** 0.59*** HRV0.1a 0.86*** 0.89*** 0.89*** 0.86***
SBPV0.1r and DBPV0.1r, systolic and diastolic blood pressure variability at frequency of 0.1 Hz in relative units; SBPV0.1a and DBPV0.1a systolic and diastolic blood pressure variability at frequency of 0.1 Hz in absolute units; IBIV0.1r (resp. HRV0.1r), inter-beat interval (resp. heart rate) variability at frequency of 0.1 Hz in relative units; IBIV0.1a (resp. HRV0.1a), inter-beat interval (resp. heart rate) variability at frequency of 0.1 Hz in absolute units; F-coefficient, ANOVA test (significance of the difference between intraindividual and interindividual variability); Pearson's correlation coefficient (correlation between mean values from 5, 4, 3 and 2 measurements and distribution (standard deviation) of these values; ***p<0.001.
The reliability of one measurement of BPV and
IBIV (resp. HRV), differences between reproducibility of all indices of BPV and IBIV (resp. HRV) and an influence of a different number of repeated resting measurements was further evaluated by correlation analysis. The mean values of 5 measurements of BPV and IBIV (resp. HRV) indices were correlated with the first value measured, or with mean of 2 or 3 or 4 consecutive measurements (Table 2). All correlation coefficients were significant on p<0.001. Differences among indices were smaller comparing means of greater number of measurements and seemed to be negligible at 3 measurements. These results were similar to those in our previous study on baroreflex sensitivity (Jíra et al.
2006). Therefore we chose 3 measurements as the optimum for the following analysis.
The mean value of SBPV, DBPV and IBIV (resp. HRV) at frequency of 0.1 Hz significantly correlated with the distribution of five values expressed as standard deviation of 5 values in each subject (Table 3).
Reproducibility of blood pressure, inter-beat interval (resp. heart rate) variability
On the basis of the results mentioned above we extended our study group to 152 subjects and evaluated reproducibility of blood pressure, and inter-beat interval (resp. heart rate) variability from three measurements in
2010 Reproducibility of Blood Pressure and Inter-Beat Interval Variability S117 each subject.
The values of blood pressure (mean ± standard deviation) of the larger study group (152 subjects) evaluated from 5 minute’ recordings were in a physiological interval (SBP: 112.0±10.4 mmHg; DBP:
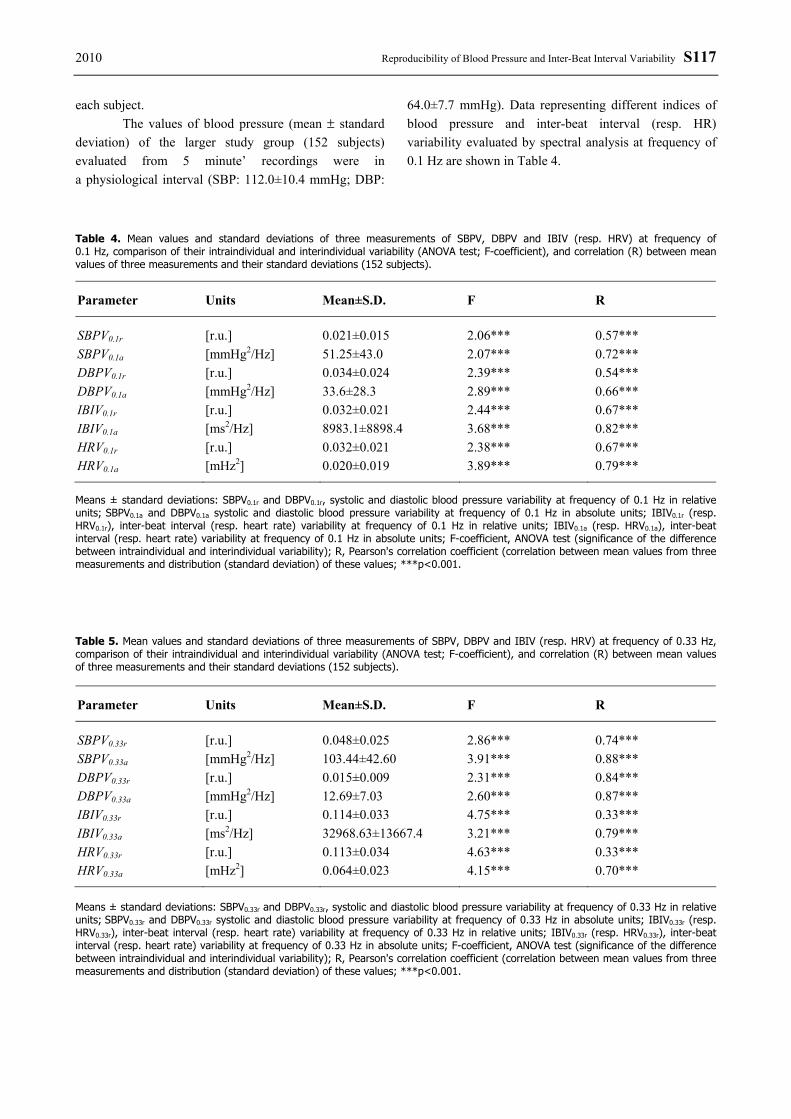
64.0±7.7 mmHg). Data representing different indices of blood pressure and inter-beat interval (resp. HR) variability evaluated by spectral analysis at frequency of 0.1 Hz are shown in Table 4.
Table 4. Mean values and standard deviations of three measurements of SBPV, DBPV and IBIV (resp. HRV) at frequency of 0.1 Hz, comparison of their intraindividual and interindividual variability (ANOVA test; F-coefficient), and correlation (R) between mean values of three measurements and their standard deviations (152 subjects).
Parameter Units Mean±S.D. F R
SBPV0.1r [r.u.] 0.021±0.015 2.06*** 0.57*** SBPV0.1a [mmHg2/Hz] 51.25±43.0 2.07*** 0.72*** DBPV0.1r [r.u.] 0.034±0.024 2.39*** 0.54*** DBPV0.1a [mmHg2/Hz] 33.6±28.3 2.89*** 0.66*** IBIV0.1r [r.u.] 0.032±0.021 2.44*** 0.67*** IBIV0.1a [ms2/Hz] 8983.1±8898.4 3.68*** 0.82*** HRV0.1r [r.u.] 0.032±0.021 2.38*** 0.67*** HRV0.1a [mHz2] 0.020±0.019 3.89*** 0.79*** Means ± standard deviations: SBPV0.1r and DBPV0.1r, systolic and diastolic blood pressure variability at frequency of 0.1 Hz in relative units; SBPV0.1a and DBPV0.1a systolic and diastolic blood pressure variability at frequency of 0.1 Hz in absolute units; IBIV0.1r (resp. HRV0.1r), inter-beat interval (resp. heart rate) variability at frequency of 0.1 Hz in relative units; IBIV0.1a (resp. HRV0.1a), inter-beat interval (resp. heart rate) variability at frequency of 0.1 Hz in absolute units; F-coefficient, ANOVA test (significance of the difference between intraindividual and interindividual variability); R, Pearson's correlation coefficient (correlation between mean values from three measurements and distribution (standard deviation) of these values; ***p<0.001. Table 5. Mean values and standard deviations of three measurements of SBPV, DBPV and IBIV (resp. HRV) at frequency of 0.33 Hz, comparison of their intraindividual and interindividual variability (ANOVA test; F-coefficient), and correlation (R) between mean values of three measurements and their standard deviations (152 subjects).
Parameter Units Mean±S.D. F R
SBPV0.33r [r.u.] 0.048±0.025 2.86*** 0.74*** SBPV0.33a [mmHg2/Hz] 103.44±42.60 3.91*** 0.88*** DBPV0.33r [r.u.] 0.015±0.009 2.31*** 0.84*** DBPV0.33a [mmHg2/Hz] 12.69±7.03 2.60*** 0.87*** IBIV0.33r [r.u.] 0.114±0.033 4.75*** 0.33*** IBIV0.33a [ms2/Hz] 32968.63±13667.4 3.21*** 0.79*** HRV0.33r [r.u.] 0.113±0.034 4.63*** 0.33*** HRV0.33a [mHz2] 0.064±0.023 4.15*** 0.70***
Means ± standard deviations: SBPV0.33r and DBPV0.33r, systolic and diastolic blood pressure variability at frequency of 0.33 Hz in relative units; SBPV0.33r and DBPV0.33r systolic and diastolic blood pressure variability at frequency of 0.33 Hz in absolute units; IBIV0.33r (resp. HRV0.33r), inter-beat interval (resp. heart rate) variability at frequency of 0.33 Hz in relative units; IBIV0.33r (resp. HRV0.33r), inter-beat interval (resp. heart rate) variability at frequency of 0.33 Hz in absolute units; F-coefficient, ANOVA test (significance of the difference between intraindividual and interindividual variability); R, Pearson's correlation coefficient (correlation between mean values from three measurements and distribution (standard deviation) of these values; ***p<0.001.
S118 Jíra et al. Vol. 59
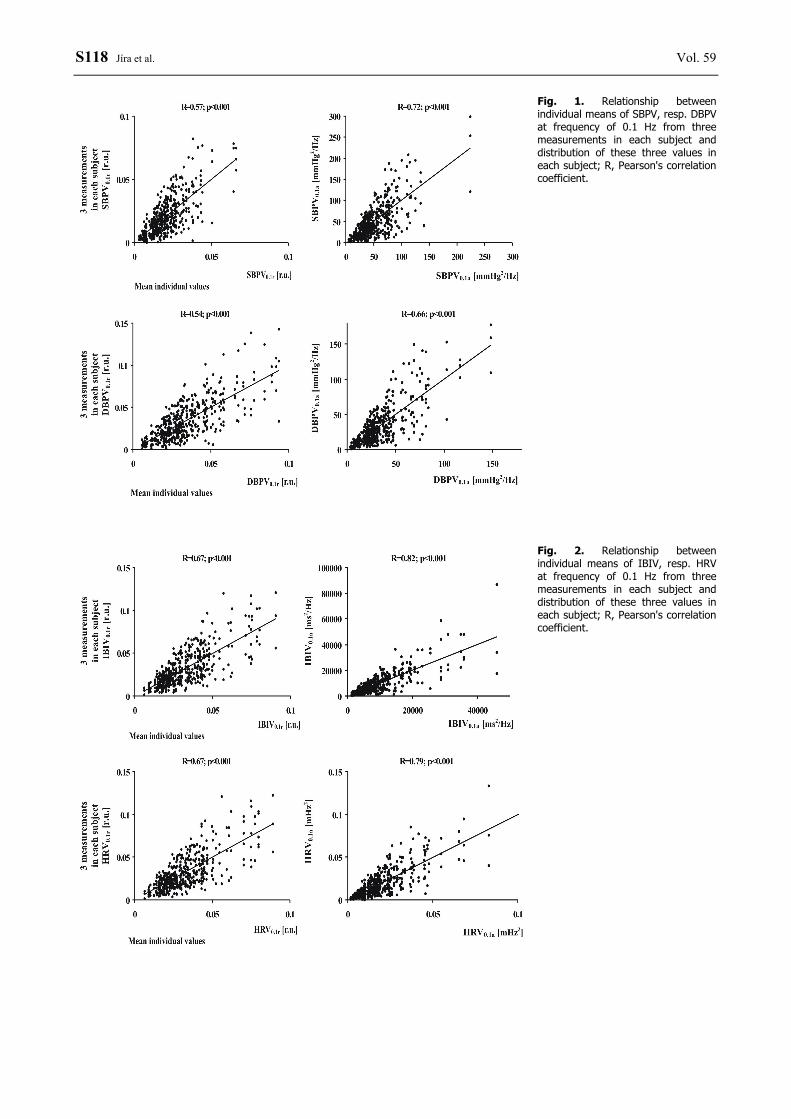
Fig. 1. Relationship between individual means of SBPV, resp. DBPV at frequency of 0.1 Hz from three measurements in each subject and distribution of these three values in each subject; R, Pearson's correlation coefficient.
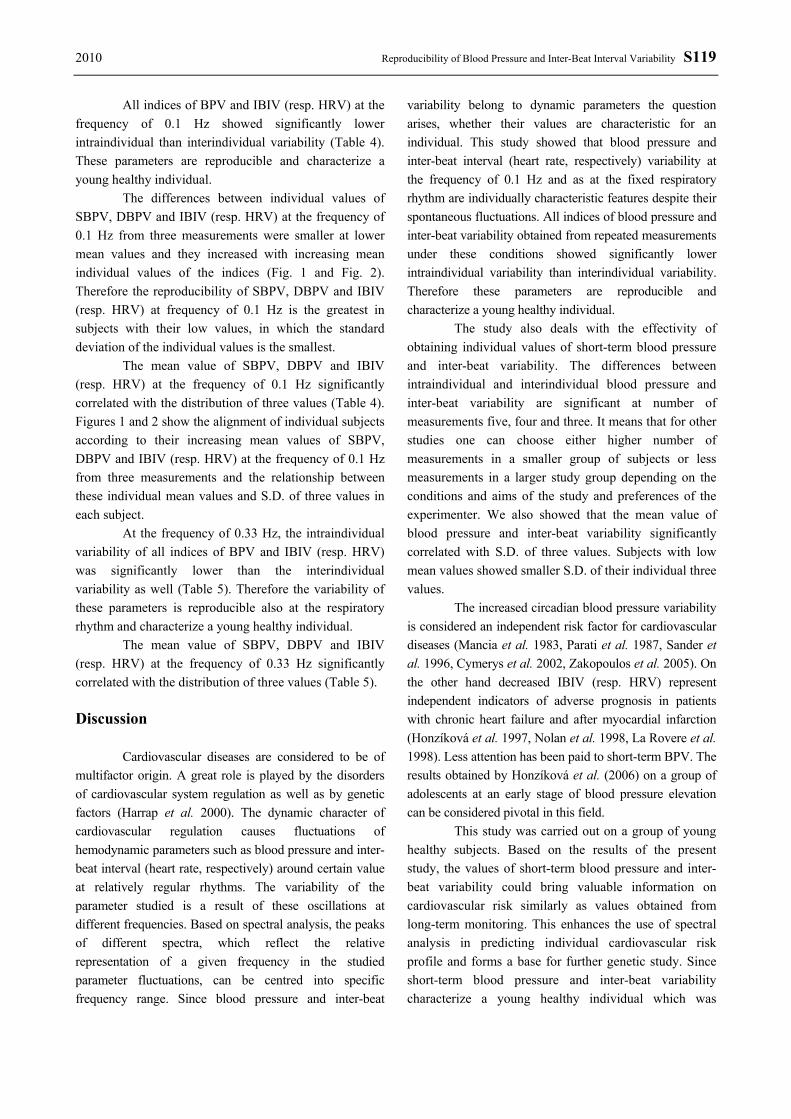
Fig. 2. Relationship between individual means of IBIV, resp. HRV at frequency of 0.1 Hz from three measurements in each subject and distribution of these three values in each subject; R, Pearson's correlation coefficient.
2010 Reproducibility of Blood Pressure and Inter-Beat Interval Variability S119
All indices of BPV and IBIV (resp. HRV) at the frequency of 0.1 Hz showed significantly lower intraindividual than interindividual variability (Table 4). These parameters are reproducible and characterize a young healthy individual.
The differences between individual values of SBPV, DBPV and IBIV (resp. HRV) at the frequency of 0.1 Hz from three measurements were smaller at lower mean values and they increased with increasing mean individual values of the indices (Fig. 1 and Fig. 2). Therefore the reproducibility of SBPV, DBPV and IBIV (resp. HRV) at frequency of 0.1 Hz is the greatest in subjects with their low values, in which the standard deviation of the individual values is the smallest.
The mean value of SBPV, DBPV and IBIV (resp. HRV) at the frequency of 0.1 Hz significantly correlated with the distribution of three values (Table 4). Figures 1 and 2 show the alignment of individual subjects according to their increasing mean values of SBPV, DBPV and IBIV (resp. HRV) at the frequency of 0.1 Hz from three measurements and the relationship between these individual mean values and S.D. of three values in each subject.
At the frequency of 0.33 Hz, the intraindividual variability of all indices of BPV and IBIV (resp. HRV) was significantly lower than the interindividual variability as well (Table 5). Therefore the variability of these parameters is reproducible also at the respiratory rhythm and characterize a young healthy individual.
The mean value of SBPV, DBPV and IBIV (resp. HRV) at the frequency of 0.33 Hz significantly correlated with the distribution of three values (Table 5). Discussion
Cardiovascular diseases are considered to be of multifactor origin. A great role is played by the disorders of cardiovascular system regulation as well as by genetic factors (Harrap et al. 2000). The dynamic character of cardiovascular regulation causes fluctuations of hemodynamic parameters such as blood pressure and inter-beat interval (heart rate, respectively) around certain value at relatively regular rhythms. The variability of the parameter studied is a result of these oscillations at different frequencies. Based on spectral analysis, the peaks of different spectra, which reflect the relative representation of a given frequency in the studied parameter fluctuations, can be centred into specific frequency range. Since blood pressure and inter-beat
variability belong to dynamic parameters the question arises, whether their values are characteristic for an individual. This study showed that blood pressure and inter-beat interval (heart rate, respectively) variability at the frequency of 0.1 Hz and as at the fixed respiratory rhythm are individually characteristic features despite their spontaneous fluctuations. All indices of blood pressure and inter-beat variability obtained from repeated measurements under these conditions showed significantly lower intraindividual variability than interindividual variability. Therefore these parameters are reproducible and characterize a young healthy individual.
The study also deals with the effectivity of obtaining individual values of short-term blood pressure and inter-beat variability. The differences between intraindividual and interindividual blood pressure and inter-beat variability are significant at number of measurements five, four and three. It means that for other studies one can choose either higher number of measurements in a smaller group of subjects or less measurements in a larger study group depending on the conditions and aims of the study and preferences of the experimenter. We also showed that the mean value of blood pressure and inter-beat variability significantly correlated with S.D. of three values. Subjects with low mean values showed smaller S.D. of their individual three values.
The increased circadian blood pressure variability is considered an independent risk factor for cardiovascular diseases (Mancia et al. 1983, Parati et al. 1987, Sander et al. 1996, Cymerys et al. 2002, Zakopoulos et al. 2005). On the other hand decreased IBIV (resp. HRV) represent independent indicators of adverse prognosis in patients with chronic heart failure and after myocardial infarction (Honzíková et al. 1997, Nolan et al. 1998, La Rovere et al. 1998). Less attention has been paid to short-term BPV. The results obtained by Honzíková et al. (2006) on a group of adolescents at an early stage of blood pressure elevation can be considered pivotal in this field.
This study was carried out on a group of young healthy subjects. Based on the results of the present study, the values of short-term blood pressure and inter-beat variability could bring valuable information on cardiovascular risk similarly as values obtained from long-term monitoring. This enhances the use of spectral analysis in predicting individual cardiovascular risk profile and forms a base for further genetic study. Since short-term blood pressure and inter-beat variability characterize a young healthy individual which was

S120 Jíra et al. Vol. 59 proved to be genetically determined (Jíra et al. 2006b), and there changes are associated with cardiovascular morbidity (Honzíková et al. 2006), one can expect positive results of investigating the genetic determination of these parameters.
In conclusion we have found that blood pressure and inter-beat interval (heart rate, respectively) variability is an individually characteristic feature.
Conflict of Interest There is no conflict of interest. Acknowledgements This study was supported by grant MSM 0021622402 of the Ministry of Education, Youth and Sports of the Czech Republic.
References CYMERYS M, MICZKE A, BRYL W, KUJAWSKA-LUCZAK M, BOGDANSKI P, PUPEK-MUSIALIK D:
Circadian rhythm and variability of blood pressure and target organ damage in essential hypertension. Pol Arch Med Wewn 108: 625-631, 2002.
HARRAP SB, STEBBING M, HOPPER JL, HOANG HN, GILES GG: Familial patterns of covariation for cardiovascular risk factors in adults - the Victorian Family Heart Study. Am J Epidemiol 152: 704-715, 2000.
HONZÍKOVÁ N, PEŇÁZ J, FIŠER B: Individual features of circulatory power spectra in man. Eur J Appl Physiol 59: 430-434, 1990.
HONZÍKOVÁ N, FIŠER B, HONZÍK J: Non-invasive determination of baroreflex sensitivity in man by means of spectral analysis. Physiol Res 41: 31-37, 1992.
HONZÍKOVÁ N, SEMRÁD B, FIŠER B, LÁBROVÁ R: Heart rate variability and baroreflex sensitivity in healthy subjects and in postinfarction patients treated by thrombolysis. Exp Clin Cardiol 2: 69-72, 1997.
HONZÍKOVÁ N, FIŠER B, SEMRÁD B: Critical value of baroreflex sensitivity determined by spectral analysis in risk stratification after myocardial infarction. PACE 23: 1965-1967, 2000.
HONZÍKOVÁ N, SEMRÁD B, FIŠER B, LÁBROVÁ R: Baroreflex sensitivity determined by spectral method and heart rate variability, and two-years mortality in patients after myocardial infarction. Phys Res 49: 643-650, 2000.
HONZÍKOVÁ N, KRTIČKA A, NOVÁKOVÁ Z, ZÁVODNÁ E: A dampening effect of pulse interval variability on blood pressure variations with respect to primary variability in blood pressure during exercise. Physiol Res 52: 299-309, 2003.
HONZÍKOVÁ N, NOVÁKOVÁ Z, ZÁVODNÁ E, PADEROVÁ J, LOKAJ P, FIŠER B, BALCÁRKOVÁ P, HRSTKOVÁ H: Baroreflex sensitivity in children, adolescents, and young adults with essential and white-coat hypertension. Klin Pädiatr 218: 237-242, 2006.
JÍRA M, ZÁVODNÁ E, HONZÍKOVÁ N, NOVÁKOVÁ Z, FIŠER B: Baroreflex sensitivity as an individual characteristic feature. Physiol Res 55: 349-351, 2006a.
JÍRA M, ZÁVODNÁ E, HONZÍKOVÁ N, NOVÁKOVÁ Z, VAŠKŮ A, IZAKOVIČOVÁ HOLLÁ L, ZNOJIL V, FIŠER B: Association of eNOS gene polymorphisms T-786C and G894T with blood pressure variability. Physiol Res 55: 26-26, 2006b.
JÍRA M, ZÁVODNÁ E, HONZÍKOVÁ N, NOVÁKOVÁ Z, VAŠKŮ A, IZAKOVIČOVÁ HOLLÁ L, FIŠER B: Association of A1166C polymorphism in AT1 receptor gene with baroreflex sensitivity. Physiol Res 59: in press 2010 (Epub ahead of print 2009).
JÍRA M, ZÁVODNÁ E, HONZÍKOVÁ N, NOVÁKOVÁ Z, VAŠKŮ A, IZAKOVIČOVÁ HOLLÁ L, FIŠER B: Influence of C5266T polymorphism in nNOS gene on inter-beat interval variability (in Czech). Cor Vasa 49 (Suppl): 44-44, 2007.
LA ROVERE MT, BIGGER JT JR, MARCUS FI, MORTARA A, SCHWARTZ PJ: Baroreflex sensitivity and heart-rate variability in prediction of total cardiac mortality after myocardial infarction. ATRAMI (Autonomic Tone and Reflexes After Myocardial Infarction) investigators. Lancet 351: 478-484, 1998.

2010 Reproducibility of Blood Pressure and Inter-Beat Interval Variability S121 LAITINEN T, HARTIKAINEN J, NISKANEN L, GEELEN G, LA NSIMIES E: Sympathovagal balance is major
determinant of short-term blood pressure variability in healthy subjects. Am J Physiol 276: H1245-H1252, 1999.
MANCIA G, FERRARI A, GREGORINI L, PARATI G, POMIDOSSI G, BERTINIERI G, GRASSI G, DI RIENZO M, PEDOTTI A, ZANCHETTI A: Blood pressure and heart rate variabilities in normotensive and hypertensive human beings. Circ Res 53: 96-104, 1983.
MARK AL: The sympathetic nervous system in hypertension: a potential long-term regulator of arterial pressure. J Hypertens 14 (Suppl 5): S159-S165, 1996.
NARKIEWICZ K, WINNICKI M, SCHROEDER K, PHILLIPS BG, KATO M, CWALINA E, SOMERS VK: Relationship between muscle sympathetic nerve activity and diurnal blood pressure profile. Hypertension 39: 168-172, 2002.
NOLAN J, BATIN PD, ANDREWS R, LINDSAY SJ, BROOKSBY P, MULLEN M, BAIG W, FLAPAN AD, COWLEY A, PRESCOTT RJ, NEILSON JMM, FOX KAA: Prospective study of heart rate variability and mortality in chronic heart failure: results of the United Kingdom Heart Failure Evaluation and Assessment of Risk Trial (UK-Heart). Circulation 98: 1510 -1516, 1998.
OSTERZIEL KJ, HANLEIN D, WILLENBROCK R, EICHHORN C, LUFT F, DIETZ R: Baroreflex sensitivity and cardiovascular mortality in patients with mild to moderate heart failure. Br Heart J 73: 517-522, 1995.
PAL GK, SHYMA P, HABEEBULLAH S, SHYJUS P, PAL P: Spectral Analysis of Heart Rate Variability for Early Prediction of Pregnancy-Induced Hypertension. Clin Exp Hypertens 31: 330-341, 2009.
PARATI G, POMIDOSSI G, ALBINI F, MALASPINA D, MANCIA G: Relationship of 24-hour blood pressure mean and variability to severity of target organ damage in hypertension. J Hypertens 5: 93-98, 1987.
PEŇÁZ J, HONZÍKOVÁ N, FIŠER B: Spectral analysis of resting variability of some circulatory parameters in man. Physiol Bohemoslov 27: 349-357, 1978.
SANDER D, KLINGELHOFER J: Diurnal systolic blood pressure variability is the strongest predictor of early carotid atherosclerosis. Neurology 47: 500-507, 1996.
SLEIGHT P: The importance of the autonomic nervous system in health and disease. Aust NZ J Med 27: 467-473, 1997. ZAKOPOULOS NA, TSIVGOULIS G, BARLAS G, PAPAMICHAEL C, SPENGOS K, MANIOS E, IKONOMIDIS
I, KOTSIS V, SPILIOPOULOU I, VEMMOS K, MAVRIKAKIS M, MOULOPOULOS SD: Time rate of blood pressure variation is associated with increased common carotid artery intima-media thickness. Hypertension 45: 505-512, 2005.
ZÁVODNÁ E, HONZÍKOVÁ N, HRSTKOVÁ H, NOVÁKOVÁ Z, MOUDR J, JÍRA M, FIŠER B: Can we detect the development of baroreflex sensitivity in humans between 11 and 20 years of age? Can J Physiol Pharmacol 84: 1275-1283, 2006.