reproducibility of keyhole charpy and tear test data … · fifth progress report (project sr-11o)...
TRANSCRIPT

7 ~~ fifth
; :,.,, . PROGRESS REPORT ‘
,,, ,, (Proiect SR-1 10)
on
REPRODUCIBILITY OF KEYHOLE CHARPY AND TEAR TEST DATA ON
,,, ,.
LABORATORY HEATS OF SEMIKILLED STEEL
by
:. R. H. FRAZIER,F. W. BOULGER and J. ‘W.,.SPRETNAK ‘ ,., ,.. ,),
Battelle Memorial Ins fifute ‘ ‘“’, . . .
: ““,.. .
,,,’. J,,’, ,’ ,,. , .
.,. :
Trmsmht,d through
NATIONAL RESiA17CH C0UNW3
COMMllTEE ON SHIP STEEL ! ., ‘
Division of Engineering and Indu,t,i.1 Research
Nat;onal Academy of S&nces N.,ic,,w R,,e, rch ‘Ounci[
Washington, D. C.
,.
Ssc - fn
FEBRUARY 7,.1955
...————.. .-
SHIPSTRUCTURE COMMITTEE
MEMBER AGENCIES:
❑ UREAU OF SHIPS. DCPT. o? MAW
MILITARY SEA TRAt4sPOR7AT10N SKEVICK. Dw’r. OF NAVY
UNITED STATES COAST GUARD, TREAWIRY DWT.
MARITIME ADMINISTRATION. DEPT. or COMMKRCC
AMERICAN BUREAU OF SHlwlNa
ADDRESS CORRESPONDENCE TO:
SECRETARY
SHIP STRUCTURE COMMITTEE
U. S. COAST GUARD HEADQUARTERS
WASHINGTON 25. D. C.
February 7,1955
Dear Sir:
As part of its research program related to the im-provement of hull structures of ships, the Ship StructureCommittee is sponsoring an investigation of the influenceof chemical composition and deoxidation on the notched barproperties of ship plate steels at Battelle Memorial In-
., ~.,,m,............... sjtit@e$ ....&pap.er go.y~r.lng,,~prk.~pns.=,o<>h~s...wo~~wasasPX.9$eP.t.9g...-.j...... .,at the Symposium on Effect of-Temperature on’ the 13r”ittleBe-havior of Metals with Particular Reference to Low Temperaturesheld at the annual meeting of the &merican Society forestingMaterials, Atlantic City, June 28--JO, 1953. This paper,entitled “Repro&ucibility of Keyhole Charpy and Tear-Test Dataon Laboratory Heats of Semiskilled Steel” by R. H. Frazier,J. ‘{~.Spretnak and F. M. Boulger, constitutes Part I of theattached report, SSC-83, the progress report on the project.Part II of the report describes the results of later calcula-tions.
The project is being conducted with the advisoryassistance of the Committee on Ship Steel of”’the NationalAcademy of Sciences-National Research Council.
Comments concerning this report m’fi solicited andshould be addressed to the Secretary- Ship Structure Committee.
This report is being distributed to those individualsand agencies associated with and interested in the work ofthe Ship Structure Committee.
Yours sincerely,
~<a~.aCOWART \
Rear Admiral, U. S. Coast GuardChaiman, Ship Structure
Committee
FIFTHProgress Report(Project SR-11O)
on
IUZPRQDUCIBILITY GF KEYHOLE CHARPY AND TEAR ThST DATA GNLABORATORY HEATS OF SEMIKILLM2 STEEL
by
R. Ho Frazier5 Jo W. Spretnak and F. W. Boulger
..,., . ..... .,, .,,.,,,,.... . . .,, ... . . ...
under
Department of the NavyBureau of Ships NObs- 53239
BuShips Project No. NS-011-078
for
..,,~.-.++........ 6, . . . . ,.- ... .,. .
SHIP STRUCTURE COMMITTEE

!,1
TABLE OF CONTENTS
Page
PART ~
Reprint, Symposium on Effect of Temperature on theBrittle Behavior of Metals with Particular Ref-erence to Low Temperatures. American Society forTesting Materials June 28:30,1953.
PART II——
Summary. . . . . . .
Materials . . , . . .
Testing Procedures .
● *e*o*
● e*a* a
● **O**
O,*OO o
O-*** .
00000 ●
.. . .. . ... ....... . ..... -:Expected-Uncertainty in-.Tea-r.TestT- ransitiofiTemperatures . . . . . . . . . . . . . . . .
Correlation Analysis of Tear Test Data . . .
Correlation of Charpy and Tear Test TransitionTemperatures . . . . . . . . . . . . . . . .
References . . . . . . . . . . . . . . . . . .
9
e
●
,,
0
●
0
0
0
●
●
. ..
●
*
o
0
2
2
..... , . .. ..,’‘8
17
22
..
+
.,;’~:,. . ,“. :
,,
,
.
AuthorizedReprint from the CopyrightedSymposiumon Effect of Temperatureon the Brittle Behavior
of Metals with Particular Referenceto Low TemperaturesJune 28-30, 19.53
Spc-cialTechnical Publication No. 158Publishedby the
AMERICAN SOCIETYFORTESTINGMATERI.AM1954
REPRODUCIBILITY OF KEYHOLE CHARPY AND TEAR-TEST DATA ONLABORATORY HEATS OF SEMIKILLED STEELl
By R. H. I?RAZIER,2 J. W. SPRETNAK,2 AND F. W. BOULGER2
SYNOPSIS
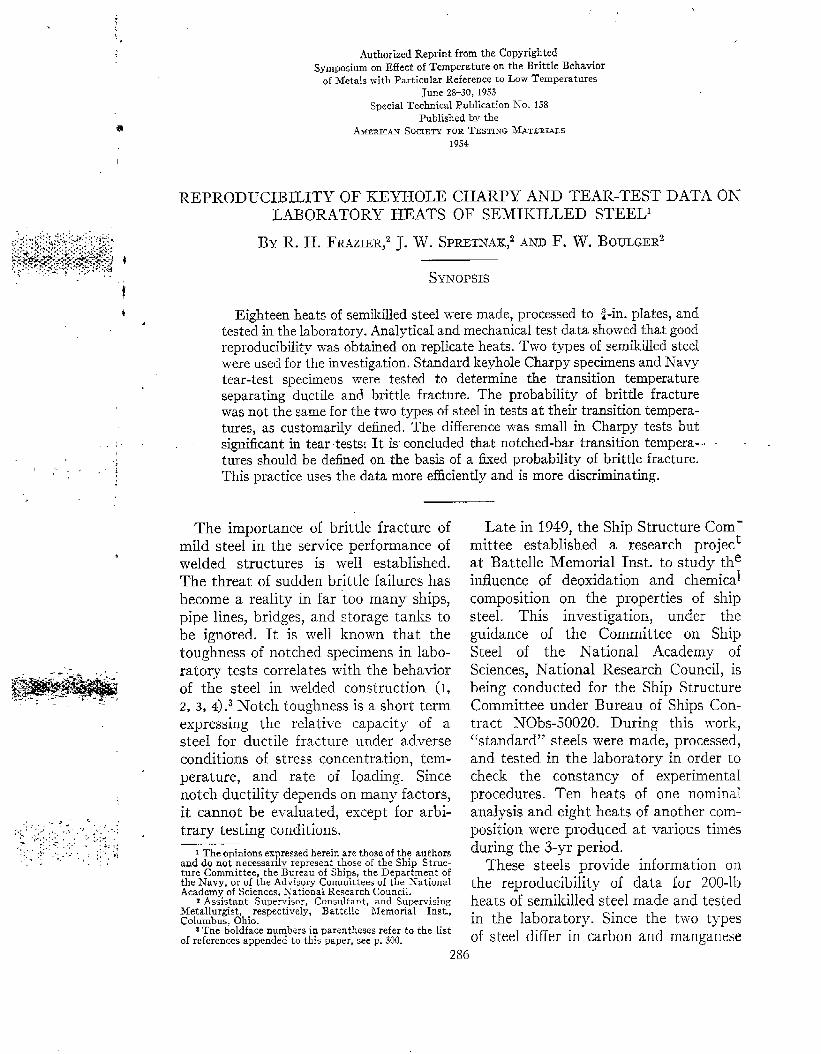
Eighteenheatsof semiskilledsteelwere made,processedto ~-in.plates,andtestedinthelaboratory.Analyticalandmechanicaltestdatashowedthatgoodreproducibilitywasobtainedonreplicateheats.Two typesofsernikilledsteelwereusedfortheinvestigation.StandardkeyholeCharpy specimensandNavytear-testspecimem were testedto determinethe transitiontemperatureseparatingductileand brittlefracture.The probabilityy ofbrittlefracturewasnotthesameforthetwotypesofsteelh testsattheirtransitiontempera-tures,ascustomarilydefined.The differencewas small in Charpy tests butsirnticant in teartests: It is concluded that notched-bar transitiontempera--turesshouldbedefiedon thebasisofa freedprobabilityofbrittlefra&ure.This practiceusesthe data more efficientlyand is more discriminating.
The importance of brittle fracture ofmild steel-intheserviceperformanceofwelded structures is well established.The threat of sudden brittle failures hasbecome a realityinfartoomany ships,pipe lines, bridges, and storage tanks tobe ignored. It is well known that thetoughness of notched specimens in labo-ratory tests correlates with the behaviorof the steel in welded construction (1,2, 3, 4.3 Notch toughness is a short termexpressing the relative capacity of asteel for ductile fracture under adverseconditions of stress concentration, tem-perature, and rate of loading. Sincenotch ductility depends on many factors,it cannot be evaluated, except for arbi-trary testing conditions..
1The opinionsexpressedhereinarethoseof the authorsand do not necessary representthose of the Ship Struc-ture Committee, the Bureauof Ships, the Departmentofthe Navy, or of the Advisory Committeesof the NationalAcademyof Sciences,h’ational ResearchCouncil.
z Assistant Super-visor,Consultant, and SupervisingMetallurgist, respectively, Battelle Memorial Inst.,Columbui, Ohio.
sThe boldface numbersin narenthcsesrefer to the listof referencesappendedto this”papcr,seep. S00.
Late in 1949, the Ship Structure Com-mittee established a research projectat Battelle Memorial Inst. to study theinfluence of deoxidation and chemicalcomposition on the properties of shipsteel. This investigation, under theguidance of the Committee on ShipSteel of the National Academy ofSciences, National Research Council, isbeing conducted for the Ship StructureCommittee under Bureau of Ships Con-tract NObs-50020. During this work,“standard” steels were made, processed,and tested in the laboratory in order tocheck the constancy of experimentalprocedures. Ten heats of one nominalanalysis and eight heats of another conl-position were produced at various timesduring the 3-yr period.
These steels provide information cmthe reproducibility of data for 200-llbheats of semiskilledsteel made and testedin the laboratory. Since the two ty-pesof steel differ in carbon and manganese
2S6

FRAZrER,ET AL., ON REPRODUCIBILITYOF DATA 281’
:,
contents, the laboratory heats illustratethe influence of manganese-carbon ratioon notched-bar toughness. Because thedata are fairly numerous, they alsopermit some opinions on the choice ofcriteria for evaluating toughness innotched-bar tests.
COMPOSITION AND TENSILE
PROPERTIES
The steels to be discussed were madein a laboratory induction furnace and
properties are comparable for bothgrades.
Table I shows that all heats had com-positions close to the intended analyses.In fact, the standard deviations of thevalues for the six elements reportedapproximate the limits of chemical analy-sis. The values for yield strength, tensilestrength, and elongation also fall withinnarrow limits. The consistency of resultsmay be surprising to some familiar withthe dficulties of making semiskilled
. TABLE I.—COMPOSITIONS AND PROPERTIES OF STEELS STUDIED9
Tensile ElongationStren@-h, in 8 in.,
psi pw cent..
I Composition, per cent Yield Strength,Dsi
HeatCar- Man- Sili- Phos- Sulfur Nitro-bon ganese con phorus gen Upper Lower
&PE A SmmLS
0.016 0.024 0.0030.IM’7 0.025. 0.W)4.0.011 0.024 0.004
0.47 0.060.44 o.#0.45 0.060.46 0.040.49 0.0.s0.44 0.030.43 0.040.44 0.040.42 0.020.46 0.030.45 0.040.02 0.01
3885037950
3405035’000
A6555. . . . . . . . . . . . . . . . . . . . 0.22A65S6.. . . . . . . ..”. . ... . . ...’ 0.23A6587.. . . . . . . . . . . . . . . . . . . 0.22A6550. . . . . . . . . . . . . . . . . . . . 0.22A6705. . . . . . . . . . . . . . . . . . . . 0.21A7663. . . . . . . . . . . . . . . . . . . . 0.22A7449.. . . . . . . . . . . . . . . . . . . 0.20A8132.. . . . . . . . . . . . . . . . . . . 0.23A6424. . . . . . . . . . . . . . . . . . . . 0.21
62700.$; g%
605506300061 1006075061 00058250
61 1801 3oa
27..531.0
,,. .
.:..3540035600370503505035600
3445034250359003450034200
29.528.024.531.s
0.012 0.023 0.0040.016 0.025 0.0040.015 0.027 0.0030.014 0.022 ::~0.015 0.027
31.530.529.0
36450 34500340000.014 0.029 0.004
0.016 0.027 0.0040.015 0.025 0.0340.002 0.002 0.0005
. . .A8361. . . . . . . . . . . . . . . . . . . . 0.23Average. .. . . . . . . . . . . . . . . . 0.22StandardDeviation. . . . . . 0.01
.,.29.22.2
. . .364901 262
.34760
700
LS
0.0050.0040.0040.0040.0050.0030.0040.0040.0040.0006
TYPEB STEI
A6557. . . . . . . . . . . . . . . . . . . . 0.22A6584. . . . . . . . . . . . . . . . . . . . 0.20A6588,. . . . . . . . . . . . . . . . . . . 0.21A6641. . . . . . . . . . . . . . . . . . . . 0.19A6651.. . . . . . . . . . . . . . . . . . . 0.19A7664. . . . . . . . . . . . . . . . . . . . 0.18A7450,. . . . . . . . . . . . . . . . . . . 0.21A8360. . . . . . . . . . . . . . . . . . . . 0.24
0.070.070.060.040.010.03
0.0160.014
0.750.760.790.810.740.690.760.750.760.03
0.0250.0220.0240.0220.0230.0260.0250.0230.0240.001
362003635035 55(33655037 2003610035050
.36 100
642
3s 5003540034900353.5035 7003480034200
.35 120
479
61 700619506235062850623006230061550
. .62 1401080
30.030.528.n24.028.5
0.0110.O160.0170.015 29.5
32.50.07 0.0160.04 0.0150.05 0.0150.02 0.002
.29.02.5
Average. . . . . . . . . . . . . . . . . . O.ZOStandardDeviation. . . . . . 0.02
a Tension specimenswere taken from ‘X-in. plate and had 8-in. gage sections.
steels. The analytical and tensile datarolled to ~-in. plate, using a finishingtemperature of 1850 F. Precautionstaken in melting and processing to ob-tain uniform heats of each type arediscussed elsewhere (10,1O. All testswere made in the hot-rolled condition.
Table I lists the compositions andtensile properties of the eighteen labora-tory steels. The type A steels have highercarbon and lower manganese contentsthan the type B steels. The compositionsare balanced, however, so that the tensile
indicate that laboratory heats can bemade and processed to give uniform andreproducible results, even if produced atdifferent times in a 3-yr period. Further-more, the tensile data are equivalent tothose for open-hearth steels of similarcomposition processed commercially.
NOTC=D-BAR PROPERTIES
Standard longitudinal keyhole Charpyspecimens, notched normal to plate
288 SWOSIm ON METALLIC MATERIALS AT
,.
Low TEWERATURES
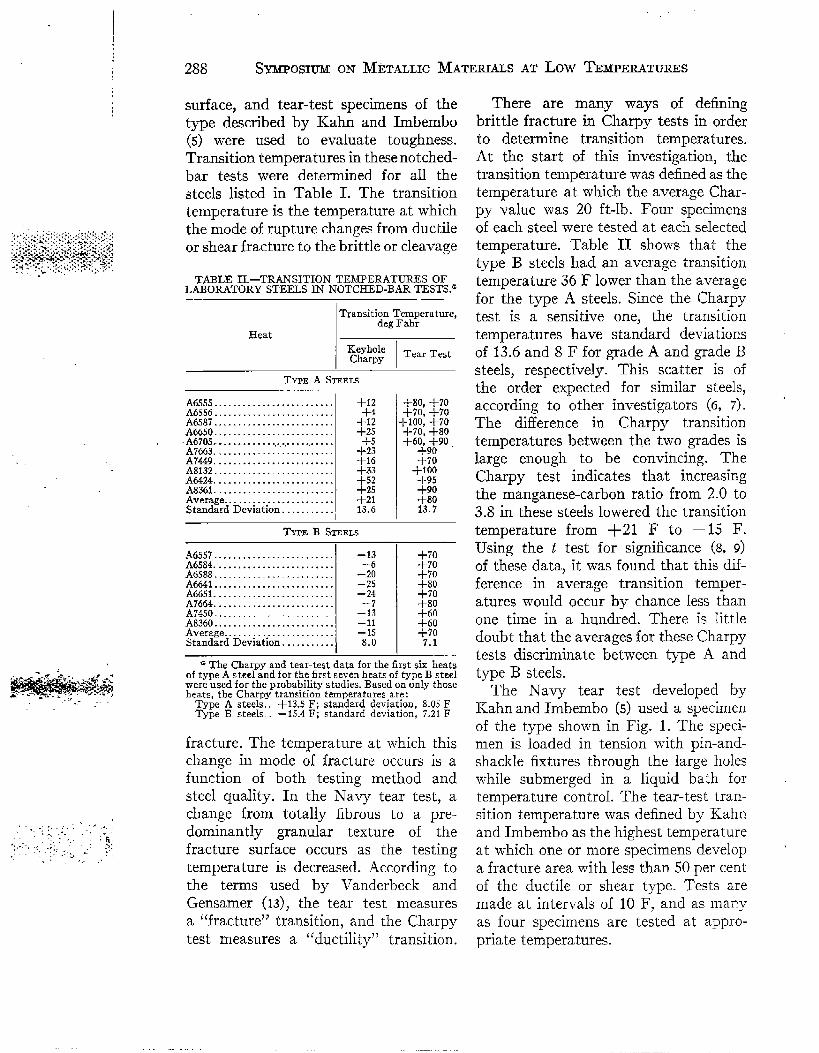
surface, and tear-test specimens of thetype described by Kahn and Imbembo(5) were used to evaluate toughness.Transition temperatures in thesenotched-bar tests were determined for all thesteels listed in Table I. The transitiontemperature is the temperature at whichthe mode of rupture changes from ductileor shear fracture to the brittle or cleavage
T~IX 11.—TRANSITION TEMPERATURES OFLABORATORY STEELS IN NOTCHED-BAR TESTS.a
Heat
Transiti~gTFea~:erature,
KeyholeCharpy ITear Test
TYPE A STEEiX
A6555. . . . . . . . . . . . . . . . . . . . . . . . . +12 +80, +70A6556. . . . . . . . . . . . . . . . . . . . . . . . .A6587. . . . . . . . . . . . . . . . . . . . . . . . .
+70, +70+% +100, +70
A6650. . . . . . . . . . . . . . . . . . . . . . . . .A6705...
+25 +70, +80. . . . . . . . . . ....... . . . ... . . . . +6~9~90
A7663. . . . . . . . . . . . . . . . . . . . . . . . . +73A7449. . . . . . . . . . . . . . . . . . . . . . . . . +16 +70A8132. . . . . . . . . . . . . . . . . . . . . . . . . +33 +JR:424::.. . . . . . . . . . . . . . . . . . . . . . +52
. . . . . . . . . . . . . . . . . . . . . . . +25 +90Average. . . . . . . . .. . . . . . . . . . . . . . +21 +80Standard Deviation. . . . . . . . . . 13.6 13.7
,,, ...; :, ,, ; ‘: .,.,.-,:,. X.-.
:.. , ::, :,.,: : ;“’6,. ,,., ,i., ,::; ,.. . . :?:
,:, .-’.. :. ’#’” :,.: ...’
TYPE ~ $TEELS
A6557. . . . . . . . . . . . . . . . . . . . . . . . .A6584. . . . . . . . . . . . . . . . . . . . . . . . .A6588. . . . . . . . . . . . . . . . . . . . . . . . .A6641. . . . . . . . . . . . . . . . . . . . . . . . .A6651. . . . . . . . . . . . . . . . . . . . . . . . .A7664. . . . . . . . . . . . . . . . . . . . . . . . .A7450. . . . . . . . . . . . . . . . . . . . . . . . .A8360. . . . . . . . . . . . . . . . . . . . . . . . .Average. . . . . . . . .. . . . . . . . . . . . . .StandardDeviation. . . . . . . . . .
– 13
–%–25–24
–-:–11– 158.0
+70+70+70+80+70+80+60+60$7;
a The Charpy and tear-testdata for the first six heatsof type As teel and for the first sevenheatsof type B steelwereused for the probability studies.Basedon only thoseheats, the Charpy transitiontemperaturesare:
Type A steels,. +13.5 F; standard deviation, 8.o5 FType )3 steels.. – 15.4F; standard deviation, 7.21F
fracture. The temperature at which thischange in mode of fracture occurs is afunction of both testing method andsteel quality. In the NTavytear test, achange from totally fibrous to a pre-dominantly granular texture of thefracture surface occurs as the testingtemperature is decreased. According tothe terms used by Vanderbeck andGensarner (13), the tear test measuresa “fracture” transition, and the Charpytest measures a ‘(ductility” transition.
There are many ways of definingbrittle fracture in Charpy tests in orderto determine transition temperatures.At the start of this investigation, thetransition temperature was defined as thetemperature at which the average Char-py value was 20 ft-lb. Four specimensof each steel were tested at each selectedtemperature. Table II shows that thetype B steels had an average transitiontemperature 36 F lower than the averagefor the type A steels. Since the Charpytest is a sensitive one, the transitiontemperatures have standard de~-iaticmsof 13.6 and 8 F for grade A and grade Bsteels, respectively. This scatter is ofthe order expected for similar steels,according to other investigators (6, 7).
The difference in Charpy transitiontemperatures between the two grades islarge enough to be convincing. TheCharpy test indicates that increasingthe manganese-carbon ratio from 2.0 to3.8 in these steels lowered the transitiontemperature from +21 1? to – 15 F.Using the t test for significance (s, g)of these data, it was found that this dif-ference in average transition temper-atures would occur by chance less thanone time in a hundred. There is littledoubt that the averages for these Charpytests discriminate between type A andtype B steels.
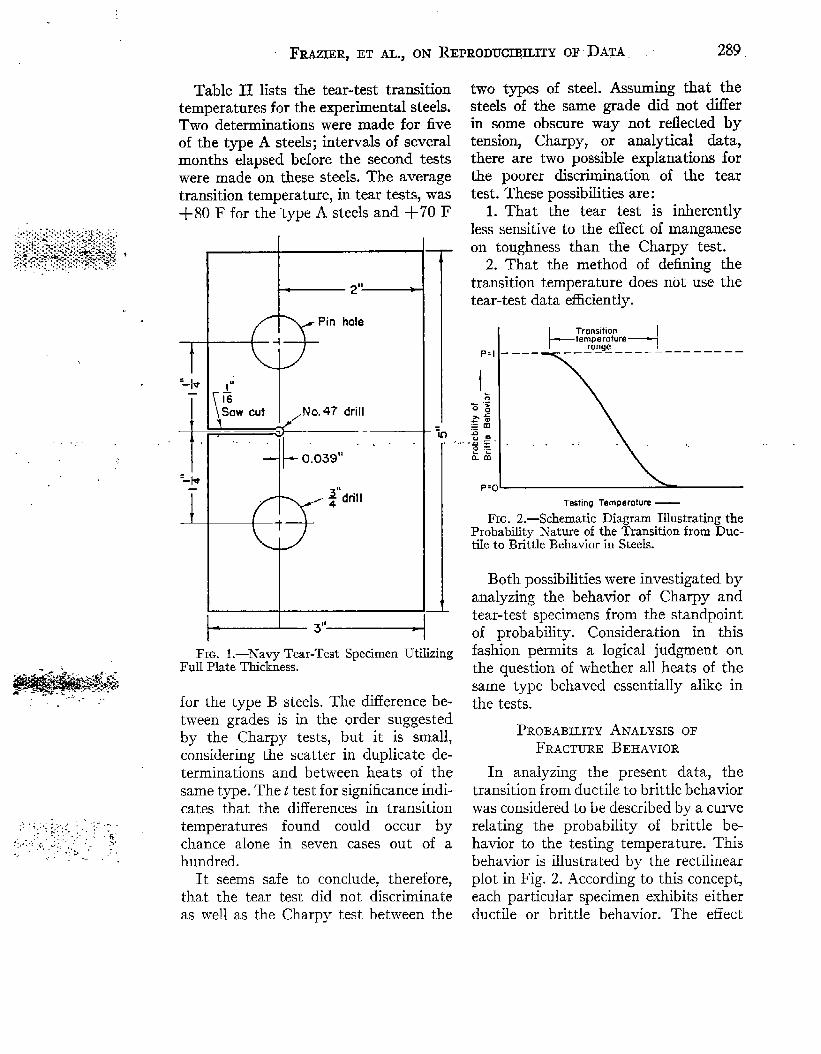
The Navy tear test developed byKahn and Imbembo (s) used a specimenof the type shown in Fig. 1. The speci-men is loaded in tension with pin-and-shackle fixtures through the large holeswhile submerged in a liquid bath fortemperature control. The tear-test tran-sition temperature was defined by Kahnand Imbembo as the highest temperatureat which one or more specimens developa fracture area with less than 50 per centof the ductile or shear type. Tests aremade at intervals of 10 F, and as manyas four specimens are tested at approp-riate temperatures.
FRAZIER,ET AL., ON REPRODUC~~ITY OF DATA 289
,.. ,
Table II lists the tear-test transitiontemperatures for the experimental steels.Two determinations were made for fiveof the type A steels; intervals of severalmonths elapsed before the second testswere made on these steels. The averagetransition temperature, in tear tests, was+80 F for the “type A steels and +7’0 F
T‘+—
,,
+‘+
1
2 “—
.. . .
3“- 1FIG. I.—Navy Tear-Test Specimen Utilizing
Full Plate Thickness.
for the type B steels. The difference be-tween grades is in the order suggestedby the Charpy tests, but it is small,considering the scatter in duplicate de-terminations and between heats of thesame type. The t test.for significance indi-cates that the differences in transitiontemperatures found could occur bychance alone in seven cases out of ahundred.
It seems safe to conclude, therefore,that the tear test did not discriminateas well as the Charpy test between the
two types of steel. Assuming that thesteels of the same grade did not diflerin some obscure way not reflected bytension, Charpy, or analytical data,there are two possible explanations forthe poorer discrimination of the teartest. These possibilities are:
1. That the tear test is inherentlyless sensitive to the effect of manganeseon toughness than the Charpy test.
2. T~at the method of defining thetransition temperature does not use thetear-test data efficiently.
p,l
p:(
t-Tronsitiontemperature
ronge -i
T@ing Temperature —
FIG. 2.—Schematic Diagram Illustrating the
Probability Nature of the Transition from Duc-tile to J3rittle Behavior in Steels.
Both possibilities were investigated byanalyzing the behavior of Charpy andtear-test specimens from the standpointof probability. Consideration in thisfashion permits a logical judgment onthe question of whether all heats of thesame type behaved essentially alike inthe tests.
PROBABILITY ANALYSIS OF
FRACTURE BEHAVIOR
In analyzing the present data, thetransition from ductile to brittle behaviorwas considered to be described by a curverelating the probability of brittle be-havior to the testing temperature. Thisbehavior is illustrated by the rectilinearplot in Fig. 2. According to this concept,each particular specimen exhibits eitherductile or brittle behavior. The effect
.! ..,.:.,.’ .:,7
. . .,. :J :- .,-, .. :.: .:,.....”:,:,: ,:. ,., :: ..::, ,,’ ::... ,. .: ‘u... ,...:
290 SmaosrTJMON METALLIC MATEKCALS AT Low TEnERATURES
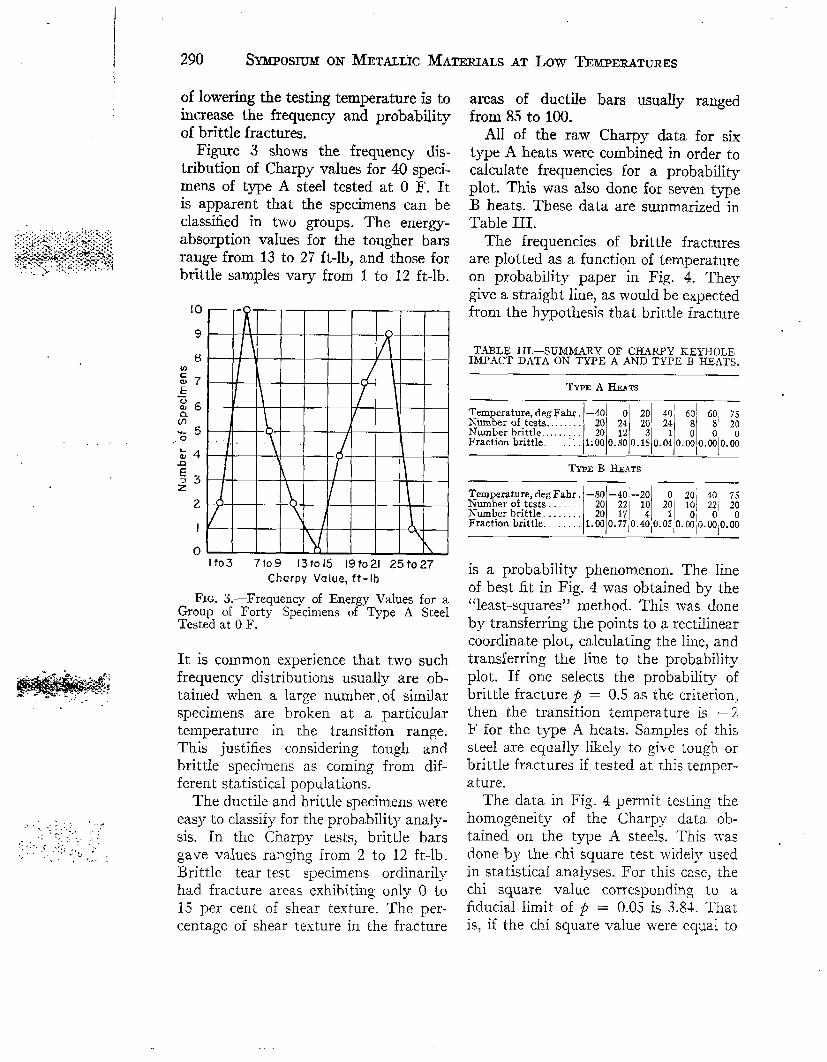
of lowering the testing temperature is toincrease the frequen~ and probabilityof brittle fractures.
Figure 3 shows the frequency dis-tribution of Charpy values for 40 speci-mens of type A steel tested at O l?. Itis apparent that the specimens can beclassified in two groups. The energy-absorption values for the tougher barsrange from 13 to 2T ft-lb, and those forbrittle samples vary from 1 to 12 ft-lb.
10
9
;4nE33z
2
I
olto3 7i09 13to15 19t021 25t027
Charpy Value, ft-lb
~IG. 3.—Frequency of Energy Values for aGroup of Forty Specimens of Type A SteelTested at OF.
It is common experience that two suchfrequency distributions usually are ob-tained when a large number. of similarspecimens are broken at a particulartemperature in the transition range.This justifies considering tough andbrittle specimens as coming from dif-ferent statistical populations.
The ductile and brittle specimens wereeasy to classify for the probability analy-sis. In the Charpy tests, brittle barsgave values ranging from 2 to 12 ft-lb.Brittle tear-test specimens ordinarilyhad fracture areas exhibiting only O to15 per cent of shear texture. The per-centage of shear texture in the fracture
areas of ductile bars usually rangedfrom 85 to 100.
All of the raw Charpy data for sixtype A heats were combined in order tocalculate frequencies for a probabilityplot. This was also done for seven typeB heats. These data are summarized inTable III.
The frequencies of brittle fracturesare plotted as a function of temperatureon probability paper in Fig. 4. Theygive a straight line, as would be expectedfrom the hypothesis that brittle fracture ~
‘TABLE 111.—SUMMARY OF CHARPY KEYHOLE,IMPACT DATA ON TYPE A AND TYPE B HEATS.—
TYPEA HFAT$
Temperature,degFahr. –401 o 20 40 60~ 60! 75Number of tests. . . . . . . . 20 24 20 24 8 8’ 20Number brittle, . . . . . . . 20 12 3 1 (loFraction brittle. . . ~: 1:000..50 0.15 0.04 O.O(,O.OJ0.0:
I 111111
TYPE B HEATS
Temperature,degFahr. -80 –40 –20 0, 20i 40 75Number of tests, . . . . . 20 22 10 20 10j 221 20Number brittk, . . . . . . . 20 17 4 10 (10Fraction brittle. . 1.00 0.77 0.40,0.05 o.m~o. mio. oo
is a probability phenomenon. The lineof best fit in Fig. 4 was obtained by the“least-squares” method. This was doneby transferring the points to a rectilinearcoordinate plot, calculating the line, anc[transferring the line to the probabilityplot. If one selects the probability ofbrittle fracture p = 0.5 as th~ criterion,,then the transition temperature is —2F for the type A heats. Samples of thissteel are equally likely to give tough orbrittle fractures if tested at this temper-ature.
The data in Fig. 4 permit testing thehomogeneity of the Charpy data ob-tained on the type A steels. This wasdone by the chi square test widely usedin statistical analyses. For this case, thechi square value corresponding to afiducial limit of p = 0.05 is 3.84. Thatis, if the chi square value were equal to

FRAZIE~,ET AL.,ON REPRODUCIBmITY OF DATA 291
3.84, and if the data were heterogeneous, B steel plotted, as a function. of temper-there would be five chances in one ature, on probability paper. The trendhundred of obtaining a second array of line was selected by the “least-squares”data with as little dispersion around the method. The chi square value indicatingtrend line. The chi square value calcu- heterogeneity in this case is also 3.84lated for the data plotted in Fig. 4 is for p = 0.05. The chi square value calcu-
50
40
30
20
w
go., -, ,+o.
wnE -10#
g-20:1-
“30
-40
-50
\
\
\
~ .
\%
\“~
\ “’ “’ ““
-600.01 0.10 0.30 0.50 0.70 0.90 0.99
Probability of Brittle Behovior
FIG. 4.—Frequencies of 13rittle Charp y Specimens at Various Testing Temperatures.
0.204; consequently, the Charpy data Iated from the plotted data is 0.195,for the type A heats give no evidence of which indicates that the type B steelsheterogeneity. Impact data for a group do not evidence significant heterogeneity.of heats which differed enough in com- The slope of the trend line in the prob-,,. . . :,::”’,.. .... .. . .*..,,- ...:, ...? :., “6 ‘ positions or processing to give a chi ability plot for the type B steels is some-.;,,.. ...:;:.-:, ,,” “:: ~... ,.‘-., :.. ,,. , square value of above 3.84 would be what greater than for the type A steels.judged statistically heterogeneous by the This means that the B steels are moresame criterion. sensitive to changes in temperature. If
Figure 4 also shows the frequencies the probability of brittle fracture p =of brittle fracture for specimens of type 0.5 is chosen as the criterion, the transi-
292 SWOSIUM ON METALLIC MATERIALS AT Low
30
35
u10
.,. . . .
35
30
10
5
0
5
0
~MX’EllATURES
I I / /Ductile Specimens 0 * /
_ ~ =0.152?-+20.1 > /Y
/
/ /
/ ‘/ /
/A
// /
#‘/)
// ●
/“-> I
, 2 u Limits
,/ ]
I,//f ! ~ ~ Brittle Specirn ens I.
Y /w
/,--I
--.
-60 -40 -20 0 20 40 60 80 100Temper,oture, deg Fahr.,. ,. -.. ,..
FIG. S.—Keyhole Charpy Test Characteristics of Type A Steels.
—.0 ‘
/
/Ductile Specimens
// o
/ ‘/
/
/
-w
..
-80 -60 -40 -20 0 20 40 60 80 100Temperature, deg Fohr
FIG. 6.—Keyhole Charpy Test Characteristics of Type B Steels.

F~~j ET AL.jON REPRODUC.IBmITYOF DATA 293
tion temperature of the type B steels The limits shown on’ the charts corrs-is –26 F. spend to twice the standard deviaticm
PROBABILITYANALYSIS OFcalculated from the values obtained for
CH&EW VALIJESthe,brittle or tough groups at eachtemperature.
The statistical studies already de- The experimental data from specimensscribed indicated that impact data from of type A steel are illustrated by Fig. 5.
35
30
,-
,, .4;..,,.” .,:’.:.:,,,:, ,:, ~ ,. ,:. : , ;;:.fi.,: .,.-. ,,:.,,, -., ::. .-; , ,,’ ~ :::
i.. ,, ‘< :.. . . :.,
10
5
0-[
// TyLe B Stkels
20’Fi-lb a?-16F/ I I
/.4k&uge/,’ // /
IType A Steels
1’ / 20 Fi-lb at+ 19F
.. ----Limits shown ore 95 per centConfidence Limits for Average
/ of Groups of Four Specimens. ——.-
A) -60 -40 -20 0 20 40 60 80 100
Testing Temperature, deg Fohr
FIG. 7.—Charpy Transition Curves and Their Confidence Limits Calculated by MethodsDescribed in the Appendix.
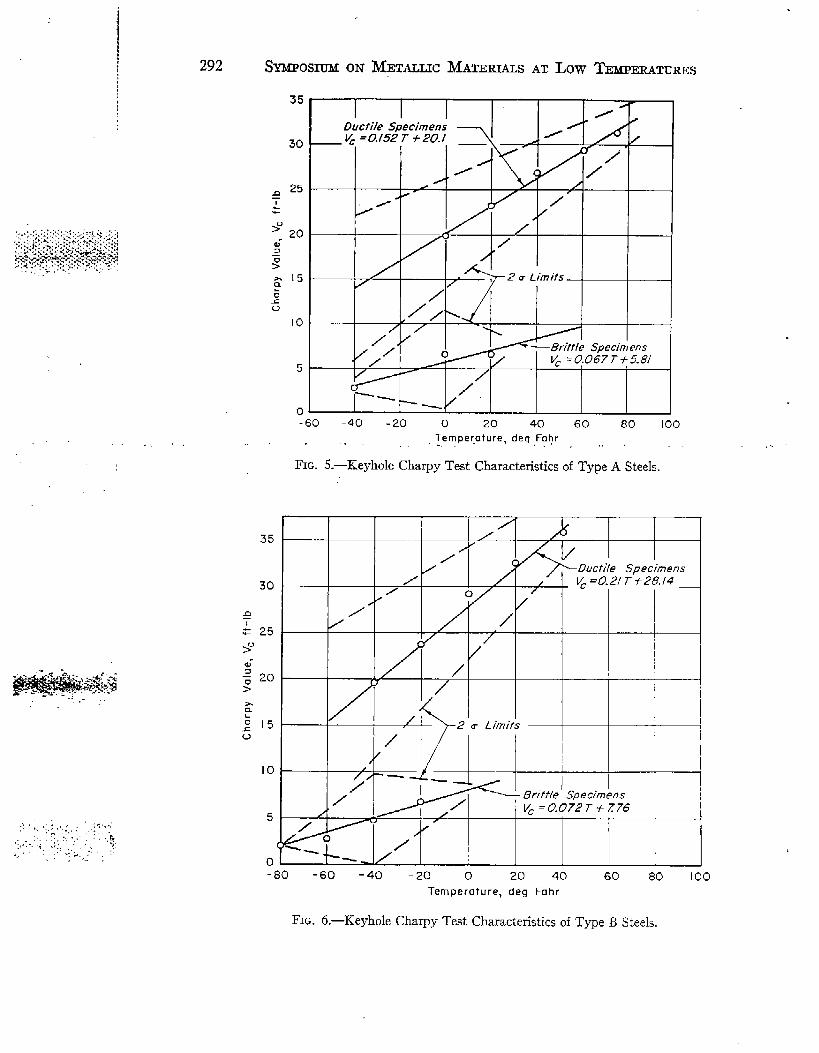
different heats of the same type ofsteel were not heterogeneous, Therefore,the data for each type of steel werecombined to give energy-temperaturecurves representative of the two gradesof material. Such curves are shown inFigs. 5 and 6. Four specimens of eachheat were tested at each temperature;the figures represent data for six typeA heats and seven type B heats.
Figures 5 and 6 are based on the actualexperimental data and the belief thattough and brittle specimens should betreated separately. Using this viewpoint,the lower trend line shows the averagesfor brittle specimens, and the other lineshows the averages for tough specimens.
The equations giving average Charpyvalues, VC,in ft-lb as a function of tem-perature, T, in deg Fahr for the two typesof fracture are:
Ductile FracturesV,= 0.152T+ 20.1 . . . . . . . . ..(I1)
Brittle FracturesVC=0.067T +5.81..........(2)
The graph shows that the dispersionof the impact values for the ductilespecimens increases w-ithdecreasing tem-perature, whereas, for the brittle spec[-mens, the dispersion passes through a ‘maximum at O F.
The averages for experimental dataobtained on specimens of type B steelare shown, with their two sigma limits,in Fig. 6. The equations for calculating
1
-. ...-.,
.~.:,..;:,. .’: .,.->.:,,. ?.,.-“..-.’, .-;fi:...,.:...,.,,., :,:,,..-. ;’;,-:: ,’.,.,. . :’ ,:.ti,.~ :
294 SYMPOSmMONMETUHC MATERIALS AT Low TEMPERATURES
average Charpy values V.; in ft-lb as afunction of temperature, T, in deg Fahrfor these steels are:
Ductile FracturesVo =0.21 T +28.14........;.(3)
Brittle FracturesVC=0.07T +7.76..........(4)
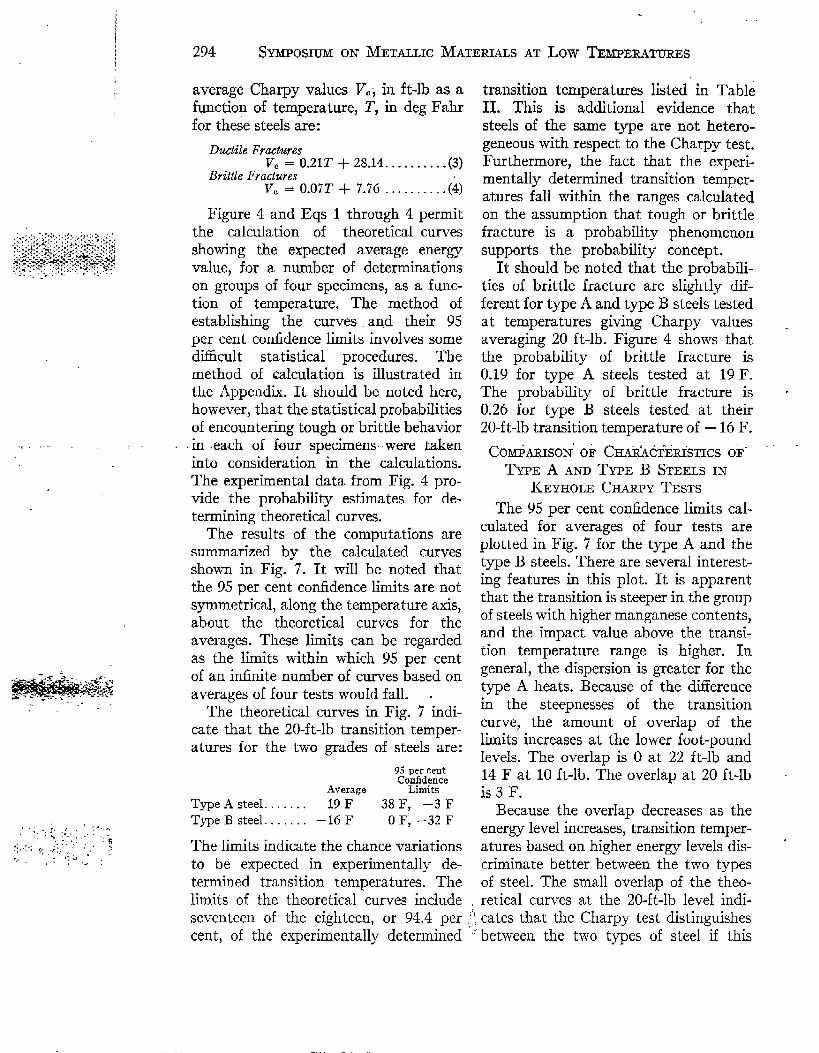
Figure 4 and Eqs 1 through 4 permitthe calculation of theoretical curvesshowing the expected average energyvalue, for a number of determinationson groups of four specimens, as a func-tion of temperature. The method ofestablishing ‘the curves and their 95per cent confidence limits involves somedif6cult statistical procedures. Themethod of calculation is illustrated inthe Appendix. It should be noted here,however, that the statistical probabilitiesof encountering tough or brittle behaviorin each of four specimens were takeninto consideration in the calculations.The experimental data from Fig. 4 pro-vide the probability estimates for de-termining theoretical curves,
The results of the computations aresummarized by the calculated curvesshown in Fig. 7. It will be noted thatthe 95 per ce-ntcofidence limits are notsymmetrical, along the temperature axis,about the theoretical curves for theaverages. These limits can be regardedas the limits within which 95 per centof an infinite number of curves based onaverages of four tests would fall. .
The theoretical curves in Fig. 7 indi-cate that the 20-ft-lb transition temper-atures for the two grades of steels are:
95 per centConfidence
Average LimitsType A steel . . . . . . . 19 F 38 F, –3 FType B steel . . . . . . . –16F OF, -32F
The limits indicate the chance variationsto be expected in experimentally de-termined transition temperatures. Thelimits of the theoretical curves includeseventeen of the eighteen, or 94.4 percent, of the experimentally determined
transition temperatures listed in Tabl~II. This is additional evidence thatsteels of the same type are not hetero-geneous with respect to the Charpy test.Furthermore, the fact that the experim-entally determined transition temper-atures fall within the ranges calculatedon the assumption that tough or brittlefracture is a probability phenomenonsupports the probability concept.
It should be noted that the probabili-ties of brittle fracture are slightly dif-ferent for type A and type B steels testedat temperatures giving Charpy valuesaveraging 20 ft-lb. Figure 4 shows thatthe probability of brittle fracture is0.19 for type A steels tested at 19 F.The probability of brittle fracture is0.26 for type B steels tested at their20-ft-lb transition temperature of – 16 F.
COMPMUSON’ OF CHXRkCTERiSTICSOF’”TYPE A AND TYPE B STEELS IN
KEYHOLE CHARPY TESTS
The 95 per cent confidence limits cal-culated for averages of four tests areplotted in Fig. 7 for the type A and thetype B steels. There are several interest-ing features in this plot. It is apparentthat the transition is steeper in the groupof steels with higher manganese contents,and the impact value above the transi-tion temperature range is higher. Ingeneral, the dispersion is greater for thetype A heats. Because of the differencein the steepnesses of the transitioncurve, the amount of overlap of thelimits increases at the lower foot-poundlevels. The overlap is O at 22 ft-lb and14 F at 10 ft-lb. The overlap at 20 ft-lbis 3 F.
Because the overlap decreases as theenergy level increases, transition temper-atures based on higher energy levels dis-criminate better between the two typesof steel. The small overlap of the theo-retical curves at the 20-ft-lb level indi-
~~cates that the Charpy test distinguishes‘ between the two types of steel if this

F~R, ET AL.,ON RIWRODUCIBIUTY OI?DATA 29’5
,,. .
TABLE IV.-SWARY OF TEAR-TEST DATA.
d
2u: V2
cr~ = _— . (.5)TYPE A HEATS N1N2” ”-”-”””””
Temperature,de~Fahr. 5: 6: fi 8:] 9: 100 110Number br,ttle. . . . . . ~ o where:Total number of tests.. 4 11 26 411 21 1; 8
Fraction brittle . . . . . . . - 1-00,0.82,0-54,0.1910.29,0-11]0-00 ‘1 =standard deviation of first sample,
U2 = standard deviation of~YP~B HEATS sample,
4; 501 601 70 80 9(J ATl = number of items in firstTemperature,degFahr.Number brittle. . . . . . . . j J J z; :Total numberof tests.. andFractionbrittle. . . . . . . . 1.0: 0.56~0.38 0-33 0.10,0.00 ~T2 = ~umber of items in second
,,
t
.“\L %-\-o~
seconld
sample,
sample.
30r7TTrrr I20 ~ I I I I 1 1
0.01 0.10 0.30 0,50 0.70 0.90 0.99 0.999
Probability of Brittle Behovior+
FIG. 8.—Frequencies of Brittle Tear-Test Specimens at Various Testing Temperatures.
criterion is used to define the transition The experimental data for the steels
temperature. used in the probability analysis given
Then the question arises of whether in the footnote of Table II can be sub-
m not the experimental Charpy data stituted in this equation:
separate type A and type B steels sig-nificantly at the 20-ft-lb level. This can
d
(i.05)’ + (7.21)’
be tested conveniently by examining the ‘D =6 7
,—
significance of the ‘clifferences of themeans for the transition temperatures
. d18.23 = 4.26F
determinedexperimentallyfor the 20-ft-lblevel.The standarddeviationofthe Statisticaltheoryteachesthatthe dif-
differencesofmeans isgivenby: ferencebetween averagesoftwo groups
296 SYMTOSmMON METALLIC MATEF.IMSAT Low TEMHHMTURES
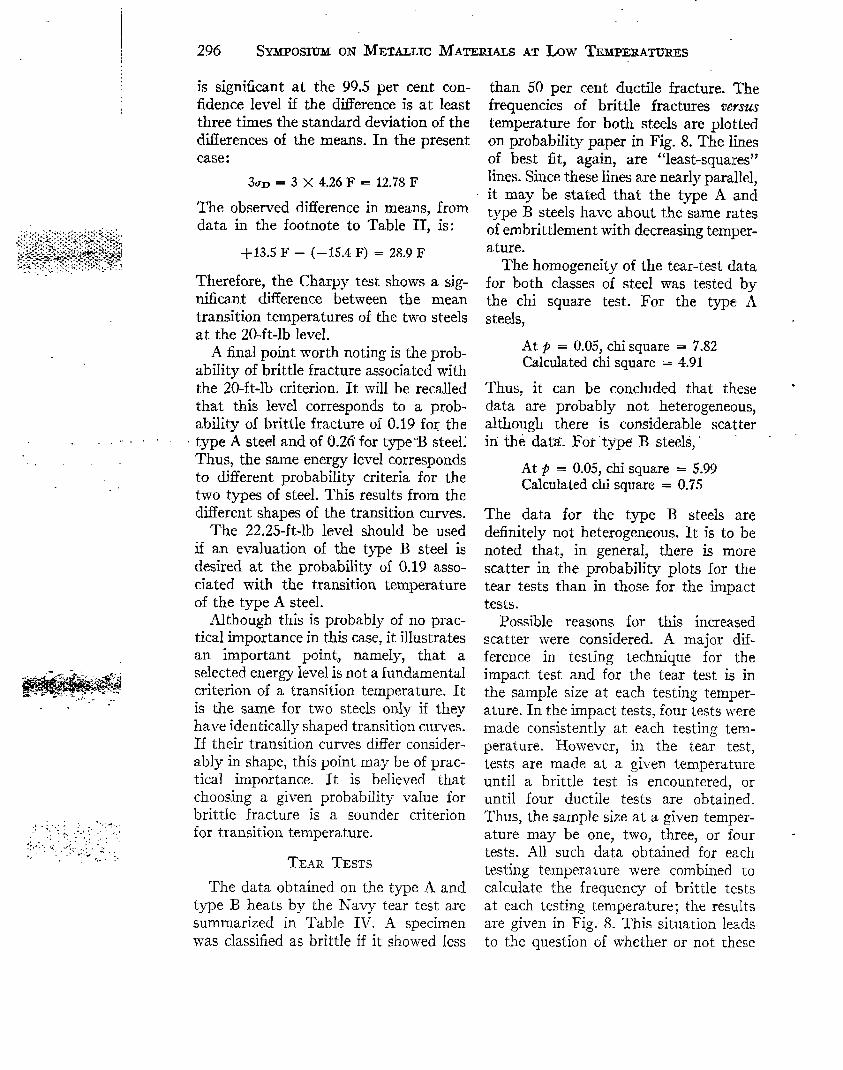
issigni6cant at the 99.5per cent con-fidence level if the difference is at leastthree times the standard deviation of thedifferences of the means. In the presentcase:
3UD = 3 X 4.26 F = 12.?8 F
The observed difference in means, fromdata in the footnote to Table 11: is::,:.;,;,,,,,:,>,-:.:<,.<.:,,;~;;.:,.,,,,,s>::::,:::A-.;~b&..:+:.,“i.:w>;.+,:,:.:;::::;,:>:;;:;$
!::J::;::::<;,!+,..,?++.2.,%..;;:~%+;:.?:~>?”:.$:-3X.?.,% +13.5 F – (–15.4 F) = 28.9 F
“-:”’ .’”’>:l,.,+ !-,~.:,.;-:,:.::;:,:,+.-,:,..,,.,,.. ....... -Therefore, the Charpy test shows a sig-nificant difference between the meantransition temperatures of the two steelsat the 20-ft-lb level.
A final point worth noting is the prob-ability of brittle fracture associated withthe 20-ft-lb criterion. It will be recalledthat this level corresponds to a prob-ability of brittle fracture of 0.19 for the
,.. . .,.”- type A steel and of 0.26 for type ‘“Bsteel;Thus, the same energy level corresponds,,to different probability criteria for thetwo types of steel. This results from thedifferent shapes of the transition curves.
The 22.25-ft-lb level should be usedif an evaluation of the type B steel isdesired at the probability of 0.19 asso-ciated with the transition temperatureof the type A steel.
Although this is probably of no prac-tical importance in this case, it illustratesan important point., namely, that aselected energy level is not a fundamentalcriterion of a transition temperature. Itis the same for two steels only if theyhave identically shaped transition curves.If their transition curves differ consider-ably in shape, this point may be of prac-tical importance. It is believed thatchoosing a given probability value forbrittle fracture is a sounder criterionfor transition temperature.
TE.AR TESTS
The data obtained on the type A andtype B heats by the Navy tear test aresummarized in Table IV. A specimenwas classified as brittle if it showed less
than 50per cent ductile fracture. Thefrequencies of brittle fractures versustemperature for both steels are. plottedon probability paper in Fig. 8. The linesof best fit, again, are “least-squares”lines. Since these lines are nearly parallel,it may be stated that the type A andtype B steels have about the same ratesof embrittlement with decreasing temper-ature.
The homogeneity of the tear-test datafor both classes of steel was tested bythe chi square test. For the type Asteels,
At p = 0.05, chi square = 7.82Calculatedchi square = 4.91
Thusj it can be concluded that these “data are probably not heterogeneous,although there is considerable scatterin thi data. For” type’ B steels,’
At p = 0.05, chi square = 5.99Calculatedchi square = 0.75
The data for the type B steels aredefinitely not heterogeneous. It is to benoted that, in general, there is morescatter in the probability plots for thetear tests than in those for the impacttests.
Possible reasons for this increasedscatter were considered. A major dif-ference in testing technique for theimpact test and for the tear test is inthe sample size at each testing temper-ature. In the impact tests, four tests weremade consistently at each testing tem-perature. However, in the tear test,tests are made at a given temperatureuntil a brittle test is encountered, oruntil four ductile tests are obtained.Thus, the sample size at a given temper-ature may be one, two, three, or four -tests. All such data obtained for eachtesting temperature were combined tocalculate the frequency of brittle testsat each testing temperature; the resultsare given in Fig. 8. This situation leadsto the question of whether or not these

FRAXE~, ET AL.,ON REPRODUCIBILITY orDATA 297
.
frequencies of brittle fracture areweighted either high or low by this test-ing technique. If more than the “statis-tically expected” number of brittle frac-tures occurred on the first tests, then
TABLE V.—COMPARISON OF DISTRIBUTION OFSAMPLE SIZES IN TEAR TESTS OF
TYPEA STEELS.
60 1?
in Fig. 8), and g = 1 — # = probabilitythat a single test will be ductilp. Thenthe probability that successive tests willbe ductile is given by:
(1 – p)”
TABLE VI.—COMPARISON OF DISTRIBUTION OFSAMPLE SIZES IN TEAR TESTS OF
TYPE B STEELS.
Event
50 1?
Expected., . . . . . 7 2 0 0 0Observed. . . . . . . i’ 2 0 0 0
0
Expected. . . . . . . ; 1 00Obsewed., . . . . . ; 1 00
4
70 F
Expected.-.:... .8 .4.. I2,. ..1. o. . . ~Observed. . . . . . . 8 5 0 11
4
80 F
Expected. . . . . . . 5 3 2 2 2Observed. . . . . . . 4 0 3 1 6
10
90 F
Expected. . . . . . . : 1 11 3Observed...,... 4 01 2 I 6
Total divergence= O+ 4 + 10+ 6 = 20Average divergence= 20/20= 1.00
60 F
Expected. . . . . . . 3 2Obsemed. . . . ... . 1 3 i“ ““;’ “: “ ‘-’
16
—
70 F
Expected. . . . . . . 2 1 ‘2Observed. . . . . . . 2 ; 2 :11 I
I ‘4—
80 F
Expected. . . . . . .
I
1 0 3Observed. . . . . . . : ; o 0 4
Total divergence = 4 -1-6 + 4 -+ 2 = 16Average divergence = 16/20 = 0.80
2
the frequency of brittletests wasweightedto the high side.Likewise, ifmore than the “statistically expected”number of brittle tests on the third andfourth tests were experienced, then thecalculated frequency of brittle tests wasweighted to the low side.
The above problem resolves itself tothe question of the probability of one,two, three, and four successive ductiletests at a given temperature. Theseprobabilities depend on the probabilityof brittle fracture on a single test.
Let p = probability that a single testwill be brittle (taken from trend line
The required probabilities arefollowing:
the
(a)P~obability that first test will bebrittle = p.
(b) Probability that the second testwill be brittle = (1 – P)P.
(c) Probability that the third test willbe brittle = (1 – p)’p.
(d) Probability that the fourth test willbe brittle = (1 – ~)3p.
(e) Probability that all four tests willbe ductile = (1 – ~)4.
For a group of tests, the five abovepossibilities should occur in the ratio oftheir probabilities. This, then, is the basisfor calculating the expected distribution
1i~
298 SYMPosruMON METALLIC MATERIALS AT Low TEMFERATURM
.:..,. ,,. ,.
of sample sizes at a given temperature.The “le&t-squares” lines of Fig. 8 areused as the best estimate of the prob-ability of brittle fracture at a giventemperature.
The expected and observed distribu-tions of sample sizes at 60, 70, 80, and90 F for the type A steels are summarizedin Table V employing all the data pre-
randomness of sample sizes at theseparticular values of the probability ofbrittle behavior. The irregularity insample sizes arose from the occurrenceof slightly more brittle fractures in“fist” specimens and the unexpectedlytough behavior of specimens at 80 F.
The expected and observed distribu-tions of sample sizes at 50, 60, 70, and
100
80 \
@
t 60 \
L~ 40 \
l-- 2 1’... i20- W, ~ I I 1..— ,. Ix-%
-20 wNote:l.Transition Temperatures
-40 - hosed on Probability ofBrittle Frocture OTu.a.
2.Average Transition Temper-ature from To blelI.
-60 i ‘%I -1
-80~0.01 0.10 0.30 0.50 0.70 0,90 0.99 0,999
Probability of Brittle Behavior-
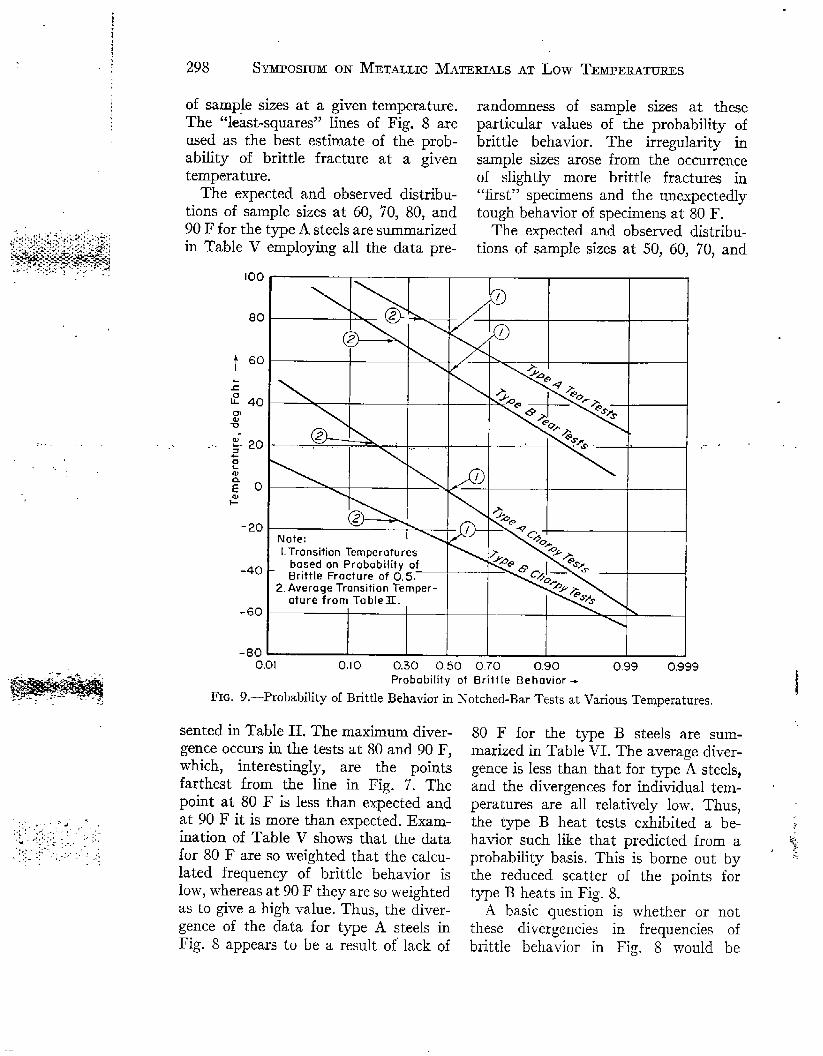
FIG. 9.—Probability of Brittle 13ehavior in Notched-Bar Tests at Various Temperatures.
sented in Table II. The maximum diver-gence occurs in the tests at 80 and 90 F,which, interestingly, are the pointsfarthest from the line in Fig. 7. Thepoint at 80 F is less than expected andat 90 F it is more than expected. Exam-ination of Table V shows that the datafor 80 F are so weighted that the calcu-lated frequency of brittle behavior islow, whereasat 90 F they are so weightedas to give a high value. Thus, the diver-gence of the data for type A steels inFig. 8 appears to be a result of lack of
80F for the type B steels are sum-marized in Table VI. The average diver-gence is less than that for type A steels,and the divergences for individual temp-eratures are all relatively low. Thus,the type B heat tests exhibited a be-havior such like that predicted from aprobability basis. This is borne out bythe reduced scatter of the points fortype B heats in Fig. 8.
A basic question is whether or notthese divergencies in frequencies ofbrittle behavior in Fig. 8 would be

FRAZIER,ET AL., ON REPRODUCIB~ITY OFDATA 299
minimized by filling out four tests ineach group. This question must remainunanswered at present because of lackof samples, There seemed to be no par-ticular individual heats which con-tributed to the unusual distribution ofsample sizes. This variation of distribu-tion of sample sizes from that expectedon a probability basis may be simplya matter of chance. For instance, intossing a coin, the probability of ob-taining “heads” is P = 0.5. A coin wastossed ten times and the number ofheads counted. This was repeated forten trials. The number of “heads” inthe ten trials was the following: 6, 6,7,4, 2,4, 5, 7, 5, 7. The meaning of P =0.5 is that, as the number of samples ismade infinitely large, the probability of,’(heads” or ,!’tails” approaches, 0.S,,as,..a limiting value.
COILPARISON OF CHARACTENSTICS OFTYPE A AND TYPE B STEELS
IN TEAR TESTS
Table II showed that the averagetransition temperatures in the tear testwere 80 and 70 F for type A and typeB steels, respectively. These temper-atures are the averages for the highesttemperatures at which one specimen ofeach heat exhibited a brittle fracture.
Figure 9 summarizes the probabilityanalyses of notched-bar data given sepa-rately in Figs. 4 and 8. The averagedifference between trend lines for typeA and type B steels is about 25 F inCharpy tests and approximately 20 Fin tear tests. The probability plots indi-cate that the tear test is capable of dis-criminating between the two types ofsteel almost as well as the Charpy test.The fact that the preceding paragraphlisted an average difference betweengrades of only 10 F shows that the cri-terion employed did not use the dataefficiently.
Figure 9 indicates that defining thetransition temperature as the highest
temperature at which a brittle fractureis encountered did not rate the two typesof steel on a fair basis. The probabilityof a brittle fracture in specimens testedat the transition temperature differs fcrthe two grades. The probability of brittlefracture for specimens of type A steeltested at 80 F is 0.37; the probabilityof brittle fracture in samples of type IBsteel tested at 70 F, the transition tem-perature for this grade, is 0.25. Thismeans that type A steels are more likelyto exhibit brittle fracture than type IBsteels when both are tested at the ap-propriate transition temperatures, as de-fined in the first paragraph of thissection. If, however, either p = 0.25or P = 0.37 is used consistently as thecriterion, the transition temperatures ofthe,two grades differ by 18 F. If P = !).5,is selected as the criterion for transitiontemperature, type A steels would havea transition temperature of 73 F andtype B steels would have 55 F, again adifference of 18 F.
SUw.mY AND CONCLUSIONS
1. Statistical analyses of notched-bardata and comparisons of analytical andtensile data demonstrate that repro-ducible properties can be obtained onsemiskilledsteels made in the Iaboratoqyover a 3-yr period.
2. Increasing the manganese contentfrom 0.45 to 0.76 per cent and decreasingthe carbon content from 0.22 to 0.20per cent improves the notched-bar tough-ness of sernikilled steels. The change inkeyhole Charpy transition temperatureproduced by the change in compositionwas 36 F. Similar changes in AmericanBureau of Shipping specifications forship plate caused an average change of31 F in Charpy transition temperatureof commercial plate (12). This shows thatconclusionsbased on small inductior~-furnaceheats agree closelywith ex-
perienceforopen-hearthsteels.
3.Defining the Charpy transition
,,. ,
300 S-!nmosnm
temperature as the
ON METALLIC MA~ERIALS AT Low TEWERATURJH
temperature corre-spo~ding to 20 ft-lb ga~e slightly dif-ferent probabilities of brittle fracturefor the two grades of steel. The differencewas small and not of practical im-portance.
4. The tear test did not separate thetwo grades of steel very well when thetransition temperature was defied asthe highest temperature at which abrittle fracture was detected. This re-sulted from the fact that the transitiontemperatures for the two grades corre-sponded to different probabilities ofbrittle fracture.
5. The tear test detected the effectof the changes in carbon and manganesecontents when the data were consideredon a probability basis. Treating the datain that fashion indicated the tear testto be almost as sensitive as the Charpytest.
6. The results justify reconsiderationof the definition of transition temper-ature for tear tests. They also suggestthat three or four specimens should betested at each appropriate temperature
(1)
(2)
(3)
(4)
(5)
and the data be treated on a probabilitybasis.
Acknowledgment:
The data for this paper were obtainedfrom experiments conducted under Ccm-tract NObs 50020, Index No. NS-011-078,and NObs 53239, Index No. NS-011-078.Grateful acknowledgment is made tothe Ship Structure Committee and theBureau of Ships for permission to publishthe results. We also wish to express ourappreciation to the Advisory Committeeon the project, T. S. Washburn, SamuelEpstein, Firm Jonassen, M. W. Lightner,T. T. Watson, and S. L. Hoyt, for ad-vice and counsel, and to tht investigator,C. H. Lorig.
The authors are especially grateful forassistance in and instructive counsel onstatistical calculations provided by LewisE. Hulbert of Battelle Memorial Inst.Mr. Hulbert prepared the Appendix,which describes the methods of calculat-ing average notched-bar values and 95per cent confidence limits on a prob-ability basis.
M. L. Williams,M. R. Meyerson,G. L.Kluge, and L. R. Dale, “Investigation ofFractured Steel Plates Removed fromWelded ShipS,” Ship Structure Committee,June 1, 1951.E. P. Klier, F. C. Wagner, and M. Gen.sarner, “Correlation of Laboratory TestsWith Ship-Plate Fracture Tests,” WeldingJournal, Research Supplement No. 27,pp. 71s-96s (1948).R. D. Stout and L. G. McGeady, “NotchSensitivity of Welded Steel Plate/’ WeldingJournal, Research Supplement No. 28, pp.1s-9s (1949).P. P. Bijlaard, “Brittle Fractures in WeldedBridges,” Efigineering News-Record, April26, 1951, pp. 4&48.N. A. Kahn and E. A. Imbembo, “AMethod of Evaluating Transition FromShear to Cleavage Failure in Ship Plate,”Welding Journal, Research Supplement No.SO, No. 2, pp. 79s-90s (1951).
(6)
(7)
(8)
(9)
N. A. Kahn and E. A. Imbembo,” Notch-Sensitivity of Ship Platej Correlation ofLaboratory-Scale Tests with Large-ScalePlate Tests,” Symposium on Deformationof Metal as Related to Forming andService, Am. %c. Testing Mats., p. 15(1947). (Issued as separate publicationASTM STP No. 87.)A. l?. Scotchbrook, B. G. Johnston, andR. D. Stout, “Scatter in TransitionCurves,” Welditig Journal, Research Sup-plement, No. 30, April, 1951, pp. 266s-271s.J. Rinebolt and N. J. Harrisj “StatisticalAnalysis of Tests of Charpy V-Notch andKeyhole Bars,” Welo%zg Journal, ResearchSupplement No. 30, pp. 202s-208s (1951).H. Levy, andE. E. Preidel, “ElementaryStatistics,” Ronald Press Co., New York,N. Y. (1945). .J. l?. Kenney, “Mathematics of Statistics,”D. Van Nostrand Co., Inc., New York,N. Y. (1941 Edition).

FRAZIER,ET AL.,ON REPRODUCIBmITY OI?DATA 301
. .
.
(lo)
(11)
H. M. Banta, R. H. Frazier, and C. H.Lorig, “An Irivestigationof the Ird3uenceof Deoxidation and ChemicalComposition (12)on Notched-Bar Properties of SemikfledShip Steel,” Ship Structure Committee,Report No. 49, November, 1951.R. H. Frazier,F. W. 130ulger,and C. H. (13)Lorig, “An Investigationof theInfluenceofDeoxidationand ChemicalCompositiononNotched-BarPropertiesof SemiskilledShip
Steel,” Ship StructureCommittee,Re@rtNo. 53,December, 19S1.“Investigationof the CharpyImpact Properties of Ship Plates Manufactured to194SandOlderA13SSpecifimtions,”Ameri-can Bureauof Shipping,New York, N. ‘Y.,September,1949.R. W. Vanderbeck and M. Gensamer,“Evaluating Notch Toughness:’ WeZdingJournai, Research Supplement No. ~29,pp. 37s-48s (1950).—
APPENDIX
CALCULATION OF THE MEAN AND 95 PER CENT CONFIDENCE LIMITSOF THE AVERAGE IMPACT VALUE OF FOUR TESTS
Mean oj the Average Irnfact Valwes of FourTests:Considera certaintemperatureT. The
problemistopredictthemean oftheaver-age impactvalueof allsetsof fourtestsmade atthistemperature.
The distributionof thesevaluesis a com-bination of five distributions-‘correspondingto the casesfor which O, 1, 2, 3, or 4 of thetests exhibit brittle failure. Consider thesedistributions.
First,let x andy denote the impactvaluesof ductileand brittle tests,respectively,andlet z and y be distributed normally withmeans 2 and ~ and standard deviationsa= andUy.
Considerthe functions:
Ao = *(W + X2 + x? + X4)
A, = *(X1 + Xq + X3 + yl)
Az = ~(XL + X2 + YI + Yz)A, = *(XI + YI + Y2 + ya)A, = ~(j? + Y2 + Y3 + Y4)
The subscriptson the x’s and y’s are usedto differentiatebetween different tests ineachset of four tests (that is, xl of AO is not
necessarily equal to xl of Al, etc.). Howevereach xi (i = 1, 2, 3 or 4) has the same dis-tributionas x and each Yi (i = 1, 2, 3 or 4)has the same distributionasy.Then,sincex and y aredistributednormallyitcanbeshownthateachA iisdistributednormalIy,witheasilydeterminablemean andstandarddeviation.As an example,forAq:
Sincexi and ~iaredistributedasx andy,respectively:
Thus,
A“,=*(i+i+j+y)=*(z+j)...
and
g-% = i(u.’+‘X2+‘,2+‘Y’)*
= $- (.=2+ .,’)
Now let P be the probability of obtaininga brittle.specimen in one test and q = 1 – #be the probabili~ of obtaining a ductilesample in one test. Then the probability,pi, of obtaining i brittle and (4 – i) ductiletests in a set of four tests is given by:
4! .*iq(4-U (;= 1,2, 3,4)
*i = ~!(4_~)!
Then the mean of the average impactvaluesof sets of four testsis:
m = *OAO + fJI + P2A2 + 4313 + p4A4
= pq(il + i2 + % + 24)
+ 4p3q %(T, + ?2 + % + j,)
+ 6~q2 ~(f, + f2 + j, + j2)
+ 4pq3 *(ii + 71 + 92 + j3)
+#HYl+j?+j3 +74)
= p4(@ + 4j’q(%t + ~Y) + 15P%W + W)
+ 4pq’(+f + +j) + q’(f)
= i(p4 + 3p3q + 3p2q’ + p@)
+ j(d + 3q’p + %’P’ + qp’)= ~P(P + d3 + Mp + q)3=pz+qy

..-
1
302 SYM.PosruMON METALLIC MATERIALS AT Low TEMPERATURES
That is, the mean of the average impactvalues of sets of four tests at a temperatureT is simply the mean impact. value for oneductile test multiplied by the probability ofgetting a ductile specimen in one test plusthe mean impact value for one brittle testmultiplied by the probability of getting abrittle specimen in one test.
95 Per cent ConjMence Limits of the AverageIn@act Values of Four Tests:
Given a temperature T, the problem is tofind an upper limit U and a lower limit Lsuch that the probability of getting a set offour tests with an average impact valuegreater than U is 0.02.5 and, similarly, theprobability of getting a set of four testswith an average impact value less than Lis 0.025.ConsiderthefunctionsA i withmeans ~i
and standard deviations ‘qhlj “&s defumdabove.
The probability Pi that Ai > U and theprobability Pi’ that A i < L are computedfrom the formulas:
/
(Ax ~i)2
Pi= ~~GAi ~ ~- 2uA~ dA
/
(A– Ii)2
P;= ‘;= _;; ZUAi dA
Then, if the probability of obtaining ibrittle samplesis pi (computed above), theprobability that a sampleof four tests withan averagevaluegreaterthan U or less thanL would be obtained is:
3 piPi or $ pi P; respectively.i=O i=O
As an example, consider the case forwhich the probability of brittle fracture oftype A steel is 0.2. From Fig. 4, this corre-sponds to a temperature of 18 F. Figure 5indicates that, at 18 F, Z = 22.85, j =7.00, ax = 2.47, and UY = 1.08.
Then:
m = (0.8) (22.85) + (0.2) (7.00) = 19.6S
To findthe95 percentconfidencelimitsU and L, first calculatethe following table,
——using x, y, uX,and UYand the formula
4!
*! = ;!(4 — ;)!~&U-iJa! (i = 1, z, 3, 4)
i I Zi I‘A,
IPi
o 22.85 1.235 0.409618.89 1.103 0.4096
; 14.93 0.953 0.15363 10.96 0.775 0.02564 7.0 0.540 0.0016
/7 and L are found by trial and error.The lower limit L will be found first. Con-sider the expression for I’i’.
Write
A–~iji=—UAi “
Then:
where:
L– AitiL = —
UAi
The value of this integralis tabulatedasa function of ~,L(g).
Assume,as a firstapproximation,a valueLI = 11.00. Then the following tabulationcan be calculated:
i I iiLl1
Pi I A I Piji
o12
:
–9.595–7.153—4. 123$;.:01
. . .
. . .10X5;;3’6
1:0000
0.4096 . . .0.4096 . . .0.1536 .0.0256 0.01330.0016 0.0016
P =0 .0149
This indicates that L1 was too low. There-fore, choose ~ = 12.00.
Neglecting cases for which i = 1 and 2,thefollowingtabulationisconstructed:
–3.075: +1.3424 ~9.259
I
Pi’
0.00110.91021.0000
P, PiJji
0.1536 0.00020.0256 0.02330.0016 0.0016
P = 0.0251
For Lt = 11.99,we findP = 0.0250.
..

FRMZE~, ET AL.7 ON REPRODUCIBEI~Y OF DATA 303~
To &d U, consider the expression forPi. Write again:
Then:.l .m
Assume,as a first approximation, UI =24.00. Then again a tabtiation is computed:
., ..
~liilJi/ Pi I#il#iPi—1 , 1 1
; 0.931 0.1759 0.4096 0.07204.633 <1 x 10⁻⁶ 0.4096 . . .9.517 <1 x 1O-J 0.1536 . . .
: 16.826 <1 x 1O–J 0.0256 . . .4 31.481 <1 x 10⁻⁶ 0.0016 . . .
I I I l—
I I I I0.0720
Since PI, P2, P,, and P4 are negligible,they are neglected here. Then, consideringonly POhere, the table orI pp. 225–227 ofReference (9) shows that, for tou = 1.544,PO = 0.06104, from which @O = 0.0250.Thus,
U = (1.544)uM+ & = (1.544)(1.235)+ (22.85)
= 24.76,

DISCUSSION
.
- ,.,:-.:..&.
.A A.... .- ,-T.-’,*:-. .
MR. R. W. VANDERBECK1 (presen~edin zAkvz form) .—The authors have ana-lyzed behavior in the transition temperat-ure zone on a probability basis. Inanother paper2 of this Symposium,numerous keyhole Charpy impact datahave been analyzed in a shndar manner,and the results defiitely indicate thatthe relationship between test temperat-ure and probability of brittle behaviorcan be represented by a straight line on
. probability paper. The method used bythe authors to obtain the line of best fit,however, is not believed to be an ac-cepted method for this type of analysis.The reliability of each observed per-centage of brittle behavior depends onhow many specimens were broken todetermine this percentage and also on aweighting coefficient which varies invalue for diflerent probabilities of brittlebehavior.3 The percentages of brittlebehavior close to 50 per cent are giventhe most weight, and those furthestremoved from 50 per cent the leastweight. The least-squares method usedby the authors is not believed to weightthe observations according to theirstatistical reliability. Therefore, too
~Research Associate, U. S. Steel Corp.,Pittsburgh, Pa.
2 R. W. Vanclerbeck, R. W. Lindsay, H. D.Wilde, W. T. Lankford, S. C. Snyder, “Effectof Specimen Preparation on Notch Toughness13ehavior of Keyhole Charpy Specimens in theTransition Temperature Zone, ” P. 306.313.J. Finney, “l?robit Analysis,” Second
Edition, University Press, Cambridge, p. 31(1952).
much emphasis is being placed on somepoints and not enough on others. For thetype of behavior observed, probit analy-sis3 of the data should provide a betterevaluation of the “line of best fit.” Suchan analysis also pen-nits the calculation “of confidence limits on this line.
Referring to Fig. 4, the authors statethat “the slope of the trend line in the .probability plot for the type B steels issomewhat greater than for the type Asteels. This means that the B steels are ~.more sensitive to changes in tempera-ture.” I do not believe, however, thatthese slopes are by any means signifi-cantly different. It is sugg~sted that theregression lines be recalculated by probitanalysis (this alone should alter theslopes to a certain extent) and that thesignificance of any dlff erence be deter-mined. Moreover, use may also be madeof the data at the temperatures at whichall brittle or all tough behavior wasobtained.
Since the regression lines in Fig. 4 arebased upon data from a number of dif-ferent heats, even if a real difference inslope were found to exist, this might bea reflection of the differences in meantransition temperature among the heatsof the two grades rather than a dfierence -in slope for the individual heats of thetwo grades. Another way of stating thisis that, even if the slopes of the individual .
heats of type A and type B steel werethe same, the slope obtained by groupingthe type A heats might differ from thatobtained by grouping the type B heats
304

305DISCUSSIONON REP~ODUCIBILITYOF DATA
because of dfierent distributions of theirmean transition temperatures.
It is surprising to note in Figs. 5 and6 that the dispersion of the impact valuesfor the brittle specimens passes througha maximum in the vicinity of the middleof the transition range. This has notbeen found to be so for steels that wehave examined. For example, the ac-companying Fig. 10 shows the results of
Would it not be more appropriate todivide by N – 1 as advocated at presentby most authorities?4 The use of just Nis proper if the true mean of the popula-tion is known, but, since we only havean estimate of the mean, the sum of thesquares of the deviations from the esti-
A B S Class B
o0
:~—
o
00
0 !
0—
al o0
0:000
00
0
0000: ,.
0 0
0
I I I I-60 -50 -40 ’30 “20
Test Temperature, deg Fahr
. . ... . ---
FIG. 10.—Keyhole Charpy Impact Test Results on ABS Type B Hull Steel.
200 keyhole Charpy impact tests on onepiece of $in. thick ABS type B hull steel.Twenty tests were conducted at each of10 temperatures. The specimens wererandomized with respect to both positionin the plate and order of drilling. It willbe observed that the dispersion of theenergy values for the brittle specimensis about the same at all temperatures.
With regard to the statistics used, Ishould like to raise two additional ques-tions. I believe that standard deviationswere based upon the formula:
mated mean will be smaller than thesum of the squares of the deviations fromthe true mean. This is compensated forby dividing by N – 1 instead of by N.
To determine the standard deviationof the difference between two means, theauthors use the following formula:
4K. A. Browrdee, “Industrial Experimenta-tion,” Fourth Edition, His Majesty’s StationeryOffice, London, p. 27 (1949).
-. .—.

306 Swosrm ON METALLICMA~ERMLSAT Low TEMPERATU~S
4
. .
This formula is used when the true vari-ances are not equal.5’ GIf that is the case,the ordinary t test should not be used tojudge the significance of the differencebetween the two means.
If the true variances are judged to beequal, however, u~ is calculated as fol-lows:5
()
U12(NI— 1) + f722(N2 - 1) 1~D =
Nl+N2–2~+;2
and the t test may then be used to judgethe significance of the dfierence betweenthe two means.
To judge whether the variances areequal or unequal, the F test or ratio ofthe variances is employed.
MR. L. P. DJAMO~7* (presented inwriiienjorm) .—A closer examination andextension of the statistics presented inTable II of this paper reveals the fol-lowing :
ItELATITEVARI-4131LI~YEXPRESSEDASA PERCENTAGEOF ~13EAVERAGE.
Steel I ‘eyhole Tear TestCharpy
Type A. . . . . . . . . . . . . . . . . 65 17Type B . . . . . . . . . . . . . . . . . . 53 10
The relative variability is obtained bydividing the standard deviation by theaverage and multiplying by 100. Thesefigures show a much lower relative vari-ability among the heats for the tear testthan that for the Charpy test. In view ofthe evidence presented in the paper of thehomogeneity among the heats, the teartest is more indicative of that fact than
sW. J. lXxon and F. J. Massey,Jr., “In-troduction to Statistical Analysis, ” First Edi.tion, McGraw-Hill 1300k Co., New York, N. Y.,pp. 103–105 (1951).
6 Alice A. Aspin, “Tables for Use in Compari-sons Whose Accuracy Involves Two VariancesSeparately Estimated, ” Biomeh+a, Vol. 36, pp.
290–296 (1949) .
~ Supervisory Analytical Statistician, Ma-terial Laboratory, New York Naval Shipyard.
* The Opilliolls contained herein are the pri-
~-ate ones of the discusser and are not to be
construed as reflecting the views of the NavyDepartment or the Naval Service at large.
is the Charpy. In addition, if the heatsare homogeneous, it may be inferred thatthe tear test is more reproducible thanthe Charpy, on a relative basis, by afactor of about 4.
The high variability of the Charpy testis further evidenced by the value of +52for heat A6424. If we divide the differ-ence between this heat and its nearestneighbor, in order of magnitude, by theentire range of the data for the Cha~y
test for type A steel, that is(52 – 33)
(52 – 4) ‘ ‘eobtain a value of 0.4. This is close to the +10 per cent level of significance (0.41) ofa Q criterion for the rejection of an ex-treme value. No such apparently extreme .value occurs in the tear test data.
If we also extend the use of the t dis-tribution beyond that mentioned in thepaper, still employing the data of TableII, signticant mean differences may becalculated. A significant mean differencemay be defined as the minimum differ-ence between any two averages (in agroup of common variance) which isnecessary to discriminate between theaverages at a given probability value.Thus
I Charpy Tear Test
Significant mean differenceat the 5 per cent level. . . . 17 18
It is evident that there is no appreciabledifference between the Charpy test andtear test in their ability to discriminatebetween averages.
Finally, reproducibility or precision is -a function of the variability evidencedby the data. In the state of the art ofdetermining properties of metals there ‘may be several admissible ways of defin-ing averages or central tendencies de-pending upon interpretation and finaluse. But it may be observed that thetear test is capable of discriminating atleast as well as the Charpy and withfewer specimens.

DISCUSSIONON REPRO~UCIBILITYOF DATA 307
MR. R. H. FRAZmR(auilwrs’ closure).—The discussions by R. W. Vanderbeckand L. P. Diamond are very much ap-preciated.
Probit analysis as suggested by Van-derbeck would give additional informat-ion and would probably weigh the datacorrectly. The lines of best fit have beencalculated, using probit analysis. Theslopes of these lines and the tempera-ture at which 50 per cent of the speci-mens are expected to be brittle are asfollows :
T;:e T#g,Test Specimen
Steel Fahr
Charpy . . . . . . . . A oOharpy . . . . . . . . B 26
,. Tear.:......’:”. A-’ .73’Tear . . . . . . . . . . B 56,,.
95 I I 9.5p;ocefi:t per cent
confi-dence Slope denceLimits Limitsof 2-60, of the
deg Fahr Slope—l—l—
. .
Comparisons based on probit analysisindicate that the slopes of the trend linesfor the Charpy data for the two typesof steel do not differ significantly.
Mr. Vanderbeck’s statement that thestandard deviations of the transitiontemperatures were calculated by using Ninstead of N — 1 in the denominator ofthe formula is correct. This practice isrecommended in the ASTM Manual ofPresentation of Data published in 1951.We are aware of the fact, however, thatsome texts on statistics define the stand-ard deviation and the variance on themore conservative basis. In the presentcase, either formula gives approximatelythe same estimate of uncertainty inaverages or reproducibility of the data.For example, the standard deviations forthe data shown in Table II are given be-low.
If the variances are judged to be equal,the standard deviations of the differencesin the mean Charpy transition tempera-tures can be calculated by the formulaquoted by Vanderbeck. That formulagives a standard deviation of the differ-
ence in the means of 4.6 F instead of4.26 F reported in the paper. As con-cluded in the “paper, the difference in themean Charpy transition temperatures ofthe two types of steel is significant at aconfidence level above 99 per cent.
Mr. Diamond suggests that the vari-ability be expressed on a relative rather’than absolute scale by dividing thestandard deviation by the average transi-tion temperature. This would appear tobe justified only if variability increaseswith transition temperature. The authorshave seen no evidence supporting thisopinion. Although the information is,scanty, published Chqy dataon =v-eral grades of steel indicate that thestandard deviation does not increasewithtransition temperature.
The conditions of the present casewere not considered suitable for extremeCharpy value.
Mr. Diamond agrees with the conclu-sion that both Charpy and tear tests arecapable of discriminating between aver-age transition temperatures equally well.This appears to be true only when thedata are used efficiently as in Fig. 9. Itshould be noted that the dtierences im
tear test transition temperatures givenin Table II are not statistically signifi-cant. This casts considerable doubt onthe opinion that it is safe to test fewerspecimens in tear tests than in Charpytests.
sTANDARD DEVIATION, DEG FAHR, FOR DATAIN TABLE II.
1 a I b
1
ICharpy tests on Type A
steel . . . . . . . . . . . . . . . . . . .CharpY tests on Type B
steel . . . . . . . . . . ..+.+....Tear tests on Type A steel. .Tear tests on Type B steel.
13.6
6.813.77.1
14.4
7.314.67.5
0 Based on formula u =r(x~ ‘)’)’ for
standard deviation of a sample.
bBased on formula u =r:::)’)’ ‘or
standard deviation of a “population.”
PART II——
REPRODUCIBILITY OF KEYHOLE CBARPY AND TEAR TESTDATA ~ J.dlBORAT~Y HEATS L-KILLED STEEL
S1310MRY
Part I of this report concluded that the method of defin-
ing the tear test transition temperature should be reconsidered.
Later calculations, based on 130 observations on Type A steel,
indicate the advantages of defining the transition temperature
on a probability basis. If twenty specimens are tested at
temperatures covering the transition zoney the transition tem-
J..-.. ., .,,-. p-etia.ttir~~’based dn ‘~qua’l Trababil~tles-o~d~ctl~%- ~“ti brit~l-e- -’ ~~~
fractures, can be determined with a standard deviation of 6.6°F.
The comparable limit of uncertainty for transition temperatures,
corresponding to the highest temperature where at least one
brittle specimen is found when testing groups of four, is lIoF.
A large number of tear test data were us~d to establish
the relationships between transition temperatures defined in
different ways. The study indicates that transition tempera-
tures, based on 50 per cent brittle fracture texture, are
equivalent to those based on p . O*S for brittle specimens.
Both give lower transition temperature values than the Kahn-
Imbembo criterion.
on a
with
IZven when tear test trarisition temperatures are defined
probability basis, they do not correlate very precisely
Charpy transition temperatures. Estimates of one

-2-
transition temperature, based on data obtained in the other
type of test, are likely to be in serious error.
MATERIALS
Data obtained on 95 plates of steel were used to compare
different criteria for defining the Ixransition temperate in
Ihvy tear tests. The Sfi-in. plates were rolled from #t experi-
mental open-hearth ingots. The steels represented two combina-
tions of carbon and manganese which gave tensile strengths of
approximately 62,S00 lb. per sq. in. The nominal compositions
-------- were0.20~marbmY*-0.T6% manganese~-- and-Oi-2@ carbofi+atid-~i~~~- +-’7+-- -J-- ~~~~
manganese. The steels varied in aluminum contents and had been
rolled at different finishing temperatures. The effects of the
variatims in composition and processing treatments are de-
(14)*scribed in a separate report .
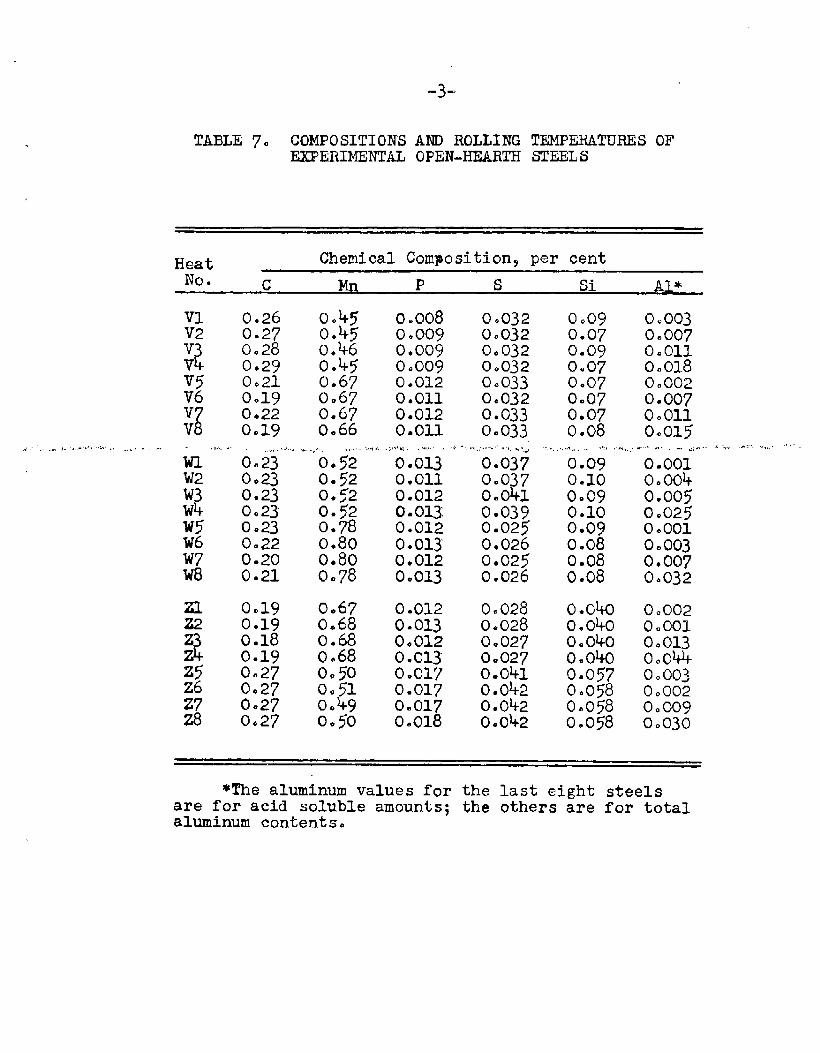
The compositions of the plates tested during this study
are listed in Table 7. The steel plants suppl+ed S/k-in. plates
and 1 s\4-in* slabs. The latter were rolled to S/k-in. plates
in the laboratory, using finishing temperatures of 16Jo0, 18500,
and 20sOOF.
TESTING PROCEDURES
Tests were made’on keyhole Charpy bars taken parallel to
the rolling direction of the plates and notched through the
●See References, page 22
-3-
TABLE 70 COMPOSITIONS Am ROLLING TEMPERATURESOFEXPERIMENTAL OPEN-HEARTH STEELS
Heat Chemical Composition~ per centNO. c P s Si A~*
VIV2
Rv~??6
%,,..-,..+.,,..........-,~.-........ ... - ,,,.
KLW2W3W4:2
W7W8
0.260.270.280.290.2100190.220.19
,,,+,........... .,0.230.230.230.230.230.220.200.21
0.450.450.460.45’0.6700670.67O*66
-,+--- ~,--.y“,0.520.52O*52m%
0.800.800.78
0.0080 e0090.0090.0090.0120●0110.0120.011
.?”.> .:, -.!. . .. .... - .$ --- .-.,
o.Q13o ● 0110.0120 ● Ou,0.0120.0130 ● 0120.013
a 0.19 0.67 0.01222 0.19 0.68
%o=013
0.18 O*68 o*0120.19 0068 0.013
;~ 0.27 0.50 0.0170.27 0.51 0.017
Z7 0.27 0.49 0.01728 0.27 O.jo 0.018
0.0320.0320*OS20.0320.0330.0320.0330.033,!...... ..., ...“,0.037000370.0410.0390.0250.0260.0250.026
0.0280.0280.0270.027:*&
0:0420.042
0.09 000030.07 0e0070.09 0a0130.07 0.0180.07 000020.07 0●007O*O7 000110.08 Oaolj
,......,........,,,,,,~,t~.~..,~..“,~.,n.........?...........0.09 0●001O*1O 000040.09 O.ooj0.10 0.025O*O9 0.0010.08 000030.08 0●0070.08 0.032
0.0400e0400eOko0.040:.:;g
0:0580.058
000020.001o* 0130004400oo~000020.0090.030
*The aluminum values for the last eight steelsare for acid soluble amounts; the others are for totalaluminum contents.
-4-
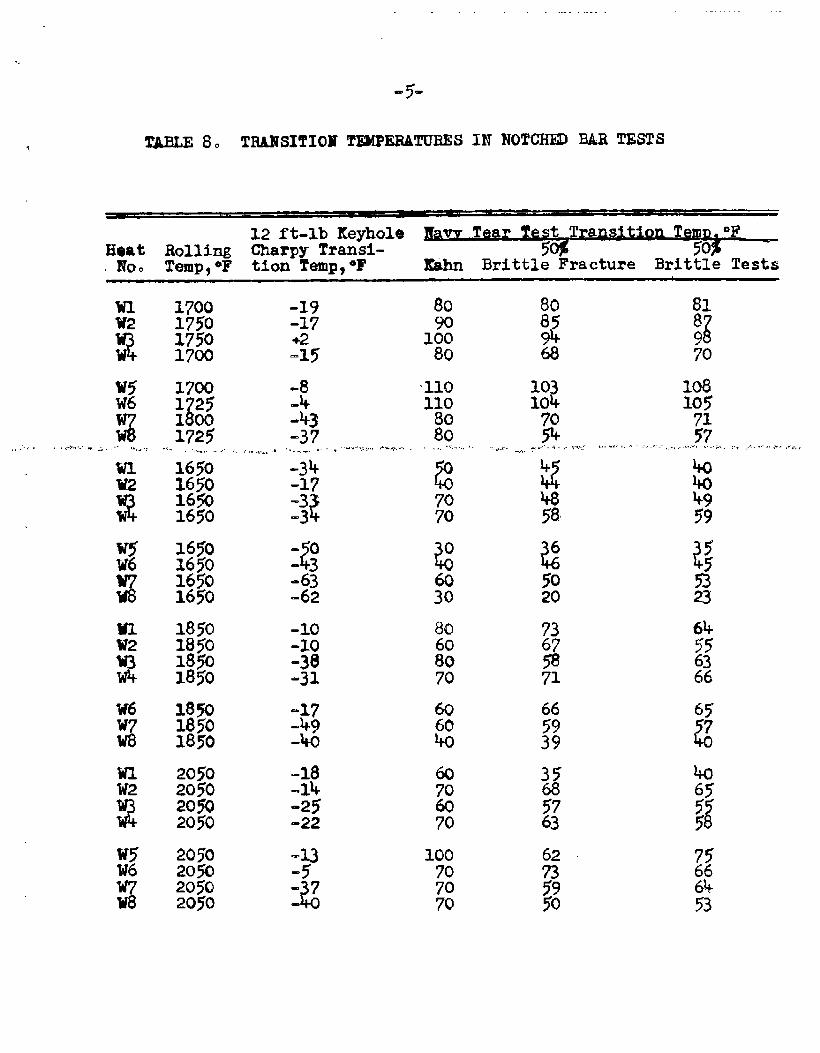
plate thickness. Four specimens from each plate were broken
at each temperature, and the Charpy tra~sition te~perakure
was taken as the temperature at which the average curve crossed
the 12 ft-lb level. Tear test specimens were also kken parallel
to the rolling direction- Four tear specimens ,were broken at
temperatures 10°F apart throughout the transition zone. This
practice permitted the tear test transition temperature to be
defined by three different criteria. These definitions for
transition temperature are:
1. The highest temperature at which one or more of four.-+.,,.,+.;, .. ., .- -,..,,,,, ....~:..,.,,”,, . ..q.-... 4,--..,.......... ..,H#.. -.=,.,:.. ...........~.,,...-+....-......,..... . . ,.,~--.”’.=,.,’-~,--- ,..,.. .,,~........ ; ....-.-...-.: y ,...
Specimens efiibits a fracture area with less than ~0
per cent shear texture. This is the definition used
by Kahn and Imbembo(5).
2.
3.
The
Table 8*
The temperature corresponding to 50 per cent shear
texture when average percentages of shear texture
in fractured surfaces are plotted against testing
hrnperature * This definition is used by some steel
companies
The temperature at which the probability of brittle
specimens is O.~ when brittle specimens are defined
as those having less than JO per cent shear texlmre
on the fractured surface. The reasons for suggesting
this criterion are discussed in Part I of this report.
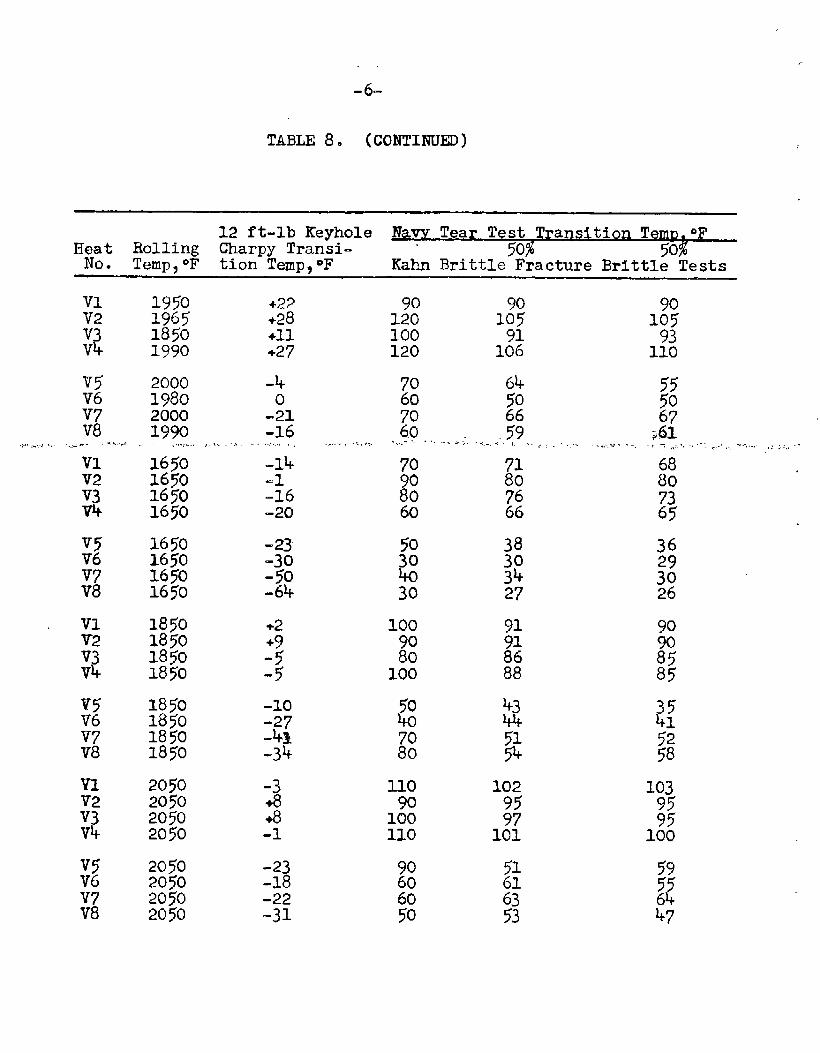
results of the notched bar tests are summarized in
The original data are re~orted senaratelv(14). but. * —“ ~..-
-5”
?XBLE 8. TRAlfSITICISi!MMI%RAT’CJRESIN NOTCHEDBARTESTS
12 f t-lb Keyhole Tern ‘FHeat Rolling Charpy Transi- 50%
F/o. Temp,*F tlon ?aupl°F Kahn Brittle Fracture Brittle Tests
wl 1700 -19W2 1750 -17
z17501700 ::~
W5 1700 -8W6
i1 25 -4
wd
-43;7Z -37 .@”,,,,,,,PNq,,,,.-... .-:%.,.-,.“.,..-.....:.... -....,.......,.,,.,.-O.,+......:.,
WIW2
%?
W6W7@
W5IN6
z
16501650165ti165o
1650165016501650
1850185018501850
185018501850
2050205020502050
2050205020502050
-34-17-3-3 c
Z-o-3-63-62
-10-lo-38-31
-18-14025-22
80 8090 i3310080 68
110 103110 1;;8080 *............. -,..,.,.:,,!.......,“’-$+-+..~’“
?0o 4
4?70 4870 58
?0o 6
L60 5030 20
80 7360 6J8070 71
60 6660 594’0 3960 237060 5770 63
100 6270 7370 5970 50
1081;;
.,,,,<,,,57,%
4040b959
64556366
65
?07
40
,.<,.,.. .. . ,.,.,.,.,,
-6-
12 ft-lb Keyhole Naw Tear Test !CranSitinn TernD.oFH~Ot Rolling Charpy Transi- - 50% Jo%
. Temp50F tion TempqOF Kahn Brittle Fracture Brittle Tests
V5
:;,,...“.,............,,.......
vlV2V3V4
V5V6V7V8
V1W?V3V4
v~V6V7V8
mV2V3W
V5V6V7V8
1950196518501990
2000198020001990........ ,.1. ,,,
1650165016JO165o
1650165o16501650
1850185018501850
1850185018501850
2050205020502050
2050205020502050
+22 90 90 90+28 120 105 105+11 100 91 93+27 120 106 110
-4 70 64 550 60 ~ 50
-21 70 67-16 ,~~ ~.,,., ,,,;. -59 2Q........ . . .. ...,..”,...,.,% -i,-,--, +. ... / .... .,+,...>.,-.-,. ,.; ,.-.,.. -.--,.*..,,,-.-~...... ,: ;.:,,.,
-14 70 71 68-1 90 i3# 80-16 :3 73-20 66 65
-23-30---
+2+9-5-5-10-27-43-34
-348+8-1
50
?-00
30
1009080100
38303427
91918688
434%51*
110 10290 95100 97110 101
90908585
35415258
1039595100
-23 90 ~; 59-18 60 ~:-22 60 63-31 50 53 47
,., .
-7”
12 ft-lb Keyhole . qHeat Rolling Charpy TrarM-
NOo-$
Templ-F tion Temp,°F Kahn Brittle Fracture Brittle Tests
1820 -181810 -lo1830 -161830 -37
60607050
66!%5739
;5
5538
‘:24
1980 -11950 +21855 +91890 0
901109080.,,.:g
5030
89968973
901009075
,.. .- - .. - .!:. +’..:,-, -...-,,. - ..-. .... ., .. .
;:
4219
:. ..,., . ... . ... ..... .. . .,,.-.
g
Z4
,, ... ,,.... .... .. ,. .... .. ...~.,.,, ........ -..- ‘-~,>’.’,,,
1650 -371650 ~j~16501650 -53
.<!. 1.. . . .
46 ‘“’563921
Z5Z6
1650165016501650
“lb-16
90906060
7587609
2728
1850185o10501850
-30-z6-21“35
6080g
63715952
185o185018501850
2050205020502050
N%20502050
86877067
-10
-7+12-lo
90908080
85907164
2728
160ZL22
-12-4-4-17
1009090
Z5Z62728
+8+9+21+18
1109010080
..
-8-
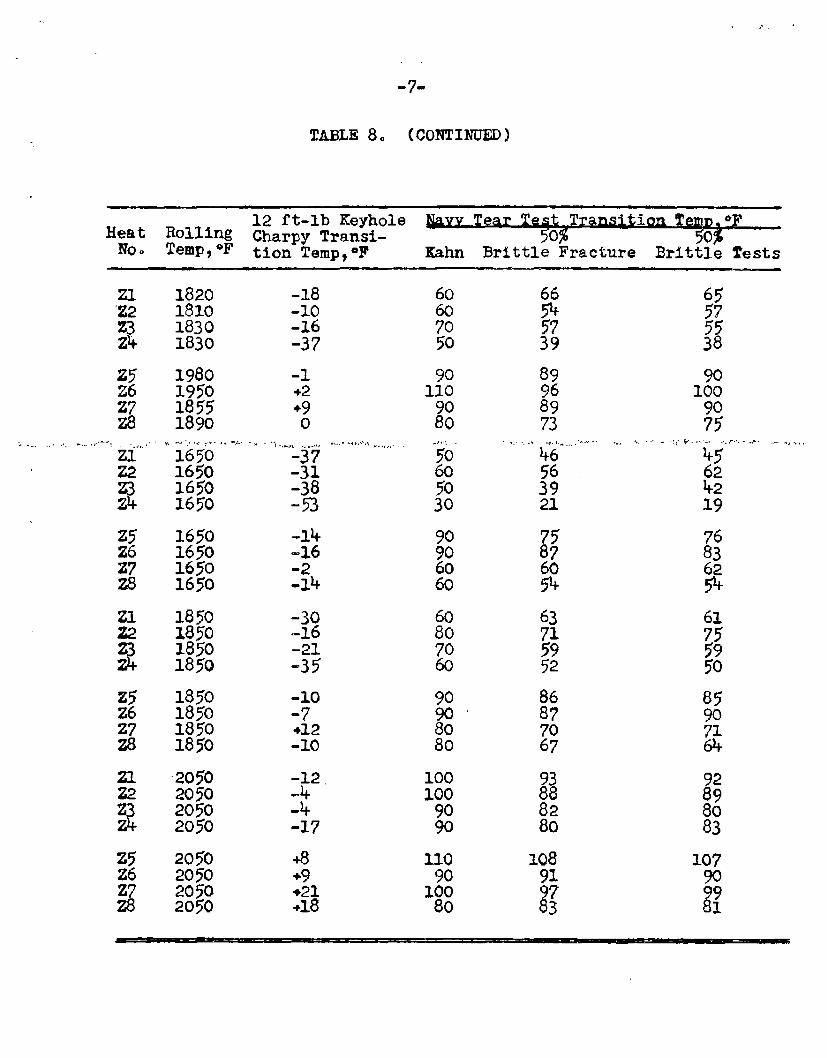
it can be mentioned that twenty specimens of each steel were
usually tested.
Before discussing the relationships among the transition
temperatures listed in Table 87 the uncertainties involved in
experimentally determined transition temperatures will be
considered~
EXPECTED UNCERTAINTY IN TEAR TEST TRANSITION TEMPERATURES
The data on Type A heats in Table 4 of Part I of this
report can be used for estimating the uncertainty attached to
.... .,,-.,,tear..tiest.$raUsit.ion..-~empe~a~uresd-eS~neded ~n-different..,..h,a~~se.. .-.... ..: ..............
This can be done for the IWhn definition and for p = 0.5
probability of brittle fractures at the transition temperature,
Fig. 10 is a plot on probability paper ofdata
from 130 specimens of Type A steel. Four specimens
at 500F; groups ranging from 8 to 41 specimens were
the other temperatures. The trend line and 95 per
fidence limits were determined by probit analysis.
perature corresponding to a probability of brittle
obtained
were tested
tested at
cent con-
The tem-
Fracture
P = Oa~ iS 73°Fa This is the transition temperature for that
criterion. The 95 per cent confidence limits for this transi-
tion temperature are 73 ● 5*2 ‘F or 67.8 and 78.20F5 based on
testing 130 specimens.
If the transition temperature were to be determined by
testing 20 specimens, the 95 per cent confidence limits would

., ..,-.
-9-
0
20
40
60
.. . .. ., .,..+.... - .,..,.~ “- -,..
alL3 80aL
EE
# 100
120
140
160
~95 per cent confidence
limit1
\\
Trend line determined
by probit analysis
95per cent confidencelimit
.. ... . .. . .. .. .
99 90 70 50 30 10 IProbability of Brittle Behaviora per cent
FIGURE IO. PROBABILITY OF BRITTLE BEHAVIOR IN NAVY TEAR TESTS
ON TYPE A STEELS AT VARIOUS TEMPERATURES
o-22383

,,
-1o-
be farther apart. They would be increased by a factor
& o or2.55.This means that by using the probability20
of
brittle fracture p = 0.5 to define the transition tempera-
ture, 95 determinations out of 100 would lie within a 26.50F
(2055 x 10.4oF) interval. The expected distribution is illus-
trated by the lower chart in Fig. 11.
Similar deductions can be made about the uncertainty of
the Kahn transition temperature by considering the probabilities
of encountering brittle or ductile specimens when testing groups
of four spectmens at five temperatures. It would not alwaFs be,:.....,,.,.,;,’-,.“,i;---,.{.,A-.....,,.~’. ..:..’+‘~-<.,.. ......... ..,. .,.,..,$,.}4
necessary ‘t% k“est 20 specimens because the test~n”g’’ternp’e;”atures
are chosen according to the sequence in which brittle specimens
are encountered. The Kahn transition temperature is the high. .
est temperature at which at least one specimenof four is brittle
and 10°F below the temperature at which four specimens are
ductile. Hence? it can be defined by as few as five specimens.
Since it is usually based on fewer observations the Kahn transi-
tion temperature would be expected to have wider limits of un-
certainty.
Table 9 lists the probabilities of encountering brittle
specimens when testing groups of four samples at various tem-
peratures. They are based on the trend line in Fig. 10. The
last two columns give the probabilities of encountering four
consecutive ductile specimens or at least one brittle specimen
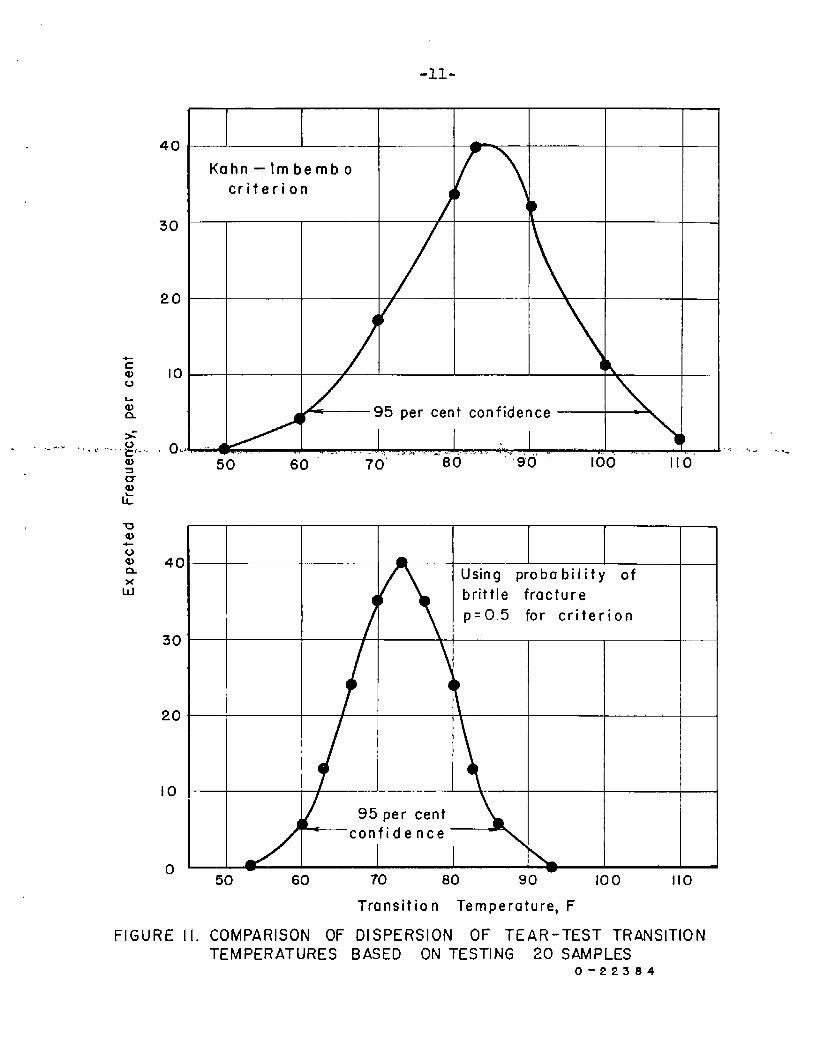
-11”
>-.. . .. ..... . . .. .... ...g.,
3u
zuw
vwnG
F
40
30
20
10
0,,
40
30
20
10
0
GURE
Kahn –Imbembo
criterion
95 per cent confidence
50/
Ia I I
Using probability of
brittle fracture
p=O.5 for triter on
~confidence
-50 - 60
1. COMPARISON OFTEMPERATURES
70 80 90 100 110Transition Temperature, F
DISPERSION OF TEAR-TEST TRANSITION
BASED ON TESTING 20 SAMPLES0-22384

TABLE 9. PROBABILITIESFOR PREDICTINGTEST SPECIMENSTEMPERATURES
2ALCULATED ON BASIS OF FIGURE 10BEHAVIOR OF GROUPS OF FOUR TEAROF TYPE A STEEL TESTED AT VARIOUS
ProbabilitiesTesting First Second Third Fourth All At LeastTemp, Specimen Specimen Specimen Specimen Four lofk‘F Brittle Brittle Brittle Brittle Ductile 3rittIe
.
60 0.76 0.1824 0.0%38 0.0105o.oo~~0.996770 0655 0.2475 000909 oook95000%08 009~9
80 0035 0.2275 0J+78 ooo9kl0.1785008215.........................,‘,,.,,-,,.,.,,.....,+ .....
90 0019 0.1539 0.1246 Ooloio“L-..0:4363,..>,0~.5697..;....... .:...,.,.
100 0.08 0.0736 0.0677 0.06230071640.2836110 0.03 0.0291 0.0282 0.02740088550.1145

-13-
in a group of four. From these values, the Kahn transition
temperatures to be expected when testing Type A steel can
be deduced. If testing is started at 60”F~ for example, the
probability of setting the Ghn transition.temperatureat 80*F
depends on the probability of finding at least one brittle
specimen out of four at 800F or lower temperatures and on the
probability of testing four ductile specimens at 900F. Accord-
ing to Table 9$ the probability of the Kahn transition temperat-
ure being 80”F is:
00997 x 0.959 x 0.82:5x 0043 = 0.338..,-’,-,-..-,....-.-..--,-~’...~.-..’-~-+,,-,---..........-.,, ,,,W, ................... ........!- .,.--’”’’’,’--,--“.‘.-.,.,.4.-..: ,Similar calculations for the other temperatures lead to the
upper chart shown in Fig. 11. This chart shows that the 951
per cent confidence limits for the Fkhn transition tempera-
‘ ture covers a range of ~oF~ It is a wider range than that
for the lower chart because it depends on information provided
by eight specimens or less even when more are tested.
The frequency charts in Fig. 11 show that when 20 speci-
mens are available the transition temperature can be determined
more precisely using the probability criterion. The charts
indicate that the Kahn criterion is less desirable for research
purposes because it leads to wider uncertainty limits.
Perhaps it should be mentioned that the data in Table 9
suggest that the Kahn transition temperature may be Influenced
by the sequence in which tear tests are made. J.~ appears that

.14=
starting tests at low temperatures leads to lower values of
the Kahn transition temperature. This can be illustrated by
calculations from the data in Table 9. If tests are started
at 600 or 700F$ the probabilities are 0.338 and 0.321 that
the &hn transition temperatures would be 80’ and 90@F$ re-
spectively. When starting tests at llOeFa the probability
is 0.224 that 800F and 0.362 that 900F would bp chosen by the
Kahn criterion. Biasing the Kahn transition temperature
toward the direction from which it is approached occurs because
of,th,e,way in wh~ch it is de,~ined......., ,. ...........,,....---- ,.>.. ,..,. .. ,-..,,...,,,.,.... ....,.
CMiREIATION ANALYSIS OF TEAR TEST DATA
The relationships among the transition temperatures listed ,
in Table 2
analysis.
marized in
It iS
were examined by standard(9) methods of statistical
The results of the correlation analyses are sum-
Table 10~
apparent that
the basis of probability
the basis of 50 per cent
transition temperatures~ defined on
of brittle fracture p = O.~ and on
brittle texture~ are in closest
agreement Fig. 12 illustrates
of the trend line is 100lka and
is 00986. The scatter from the
standard error is only 30700F0
this correlation. The slope
the correlation coefficient
trend line is smallq and the
These data show that trar@i-
tion temperatures defined on the basis of JO per cent brittle
fracture texture are equivalent to those established by

-15-
12C
100
,- ...
:0m 40
20
2u-#\ / A
/
/
//
—
Low carbon heats O ./‘AL
High carbon heats ./ ‘
/I /
....... . .... ... .. .Q&~... ..:g:fi..,,.j.. ,.,.,, ,,..... . ,1 .. . -*
I I / [1
/
0 20 40J
60 80 100 120Transition Temperature, F
(50 Per Cent Brittle Tests)
FIGURE 12. COMPARISON OF TEAR-TEST TRANSITION–TEMPERATURE CRITER 11A
0-22385

-16-
TABLE 10. CORRELATION BETWEEN TRANSITION TEMPEtiTIX&$/ESTABLISHED BY DIFFERENT CRITERIA IN TESTS ON95 MATERIALS. FOUR SPECIMENS WERE TESTED ATEACH TEMPERATURE OF INTEREST.
- ~ttrlbute
‘1 12 ft-lb keyhole Charpy transition temperature
‘2 Kahn”s definition~ tear test transition temperature
‘3 50per cent brittle fracture texture~ tear testtransition temperature
-.,-~, . .,,,.,,.......,.-,...-.,,,.., ..., ......*. .....-.’’-...... ,,+..,,.. . .. . .......Xq 0.5 probability of brittle fracture$ tear test
transition temperature.
StandardCorrelation Error or ●
Attributes Re~res si~ ~ ~ Estimatq
x~y X2 X2 . 008010 Xl ~ B7036 0.723 15031” F
% X3 x3=098455Xl+81061 00791 Isooy”l?
X19 ~ X4=0.8455Xl+81.34 0.769 lk.03°F
X29X3 X3=o.88j9X2+ ~095 00919 8OW=F
~, x~ x~=009349X2- 1085 00943 7032°F
X39\ x4= 10014 X3 - 1018 0.986 3,7C)°F
%11 temperatures In degrees Fahrenheit
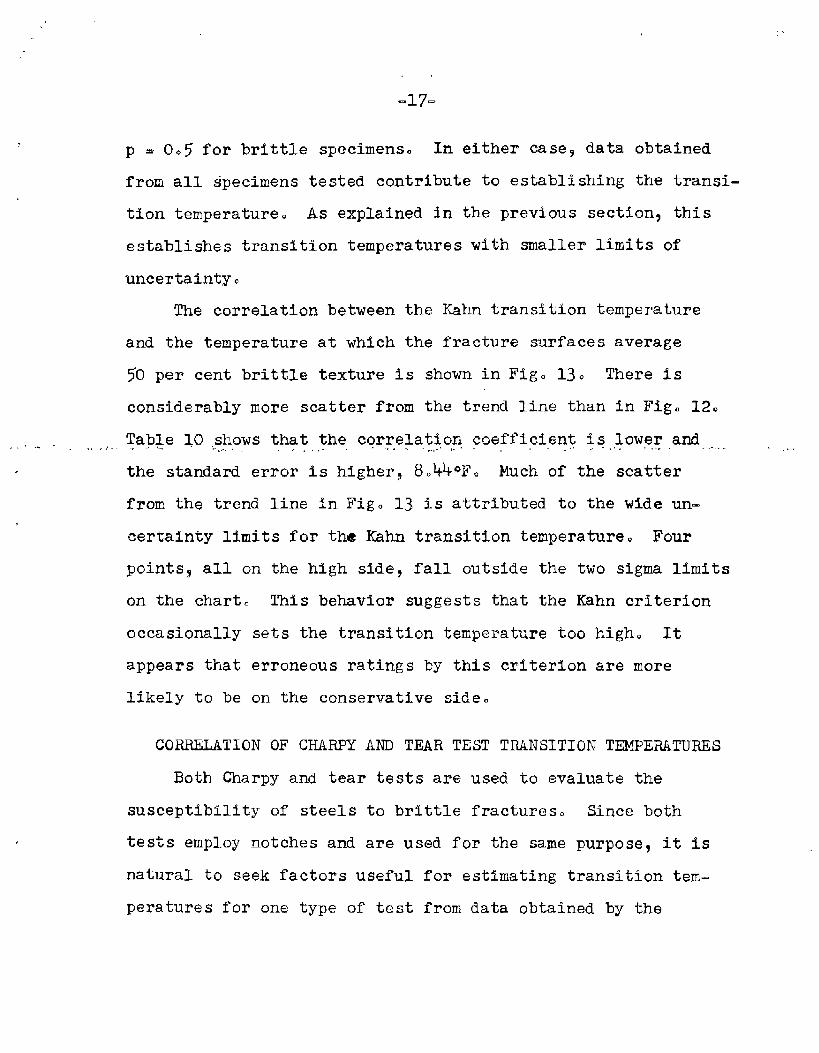
.,
-17-
p = 005 for brittle specimens. In either case$ data obtained
from all ipecimens tested contribute to establishing the transi-
tion temperature. As explained in the previous section, this
establishes transition temperatures with smaller limits of
uncertainty.
The correlation between the Kahn transition temperature
and the temperature at which the fracture surfaces average
50 per cent brittle texture is shown in Fig. 130 There is
considerably more scatter from the trend line than in Fig. 12.
Table 10 ,,showsthat the correlation coefficient is lowe,r,afifi,, ,...----- ....... .. .... ,,-,.,... ..... .... ..,,,,.,... . .,.. ,.. ......
. the standard error is higher$ 8.44QF0 Much of the scatter
from the trend line in Fig. 13 is attributed to the wide un-
certainty limits for the Kahn transition temperature. Four
pointsq all on the high side, fall outside the two sigma limits
on the chart. This behavior suggests that the Kahn criterion
occasionally sets the transition temperature too hi.gh~ It
appears that erroneous ratings by this criterion are more
likely to be on the conservative side.
CCIRRELATIONOF CHARPY AND TEAR TEST TRANSITION TEMPERILTURES
Both Charpy and tear tests are used to evaluate the
susceptibility of steels to brittle fractures. Since both
tests employ notches and are used for the same purpose, it is
natural to seek factors useful for estimating transition tem-
peratures for one type of test from data obtained by the
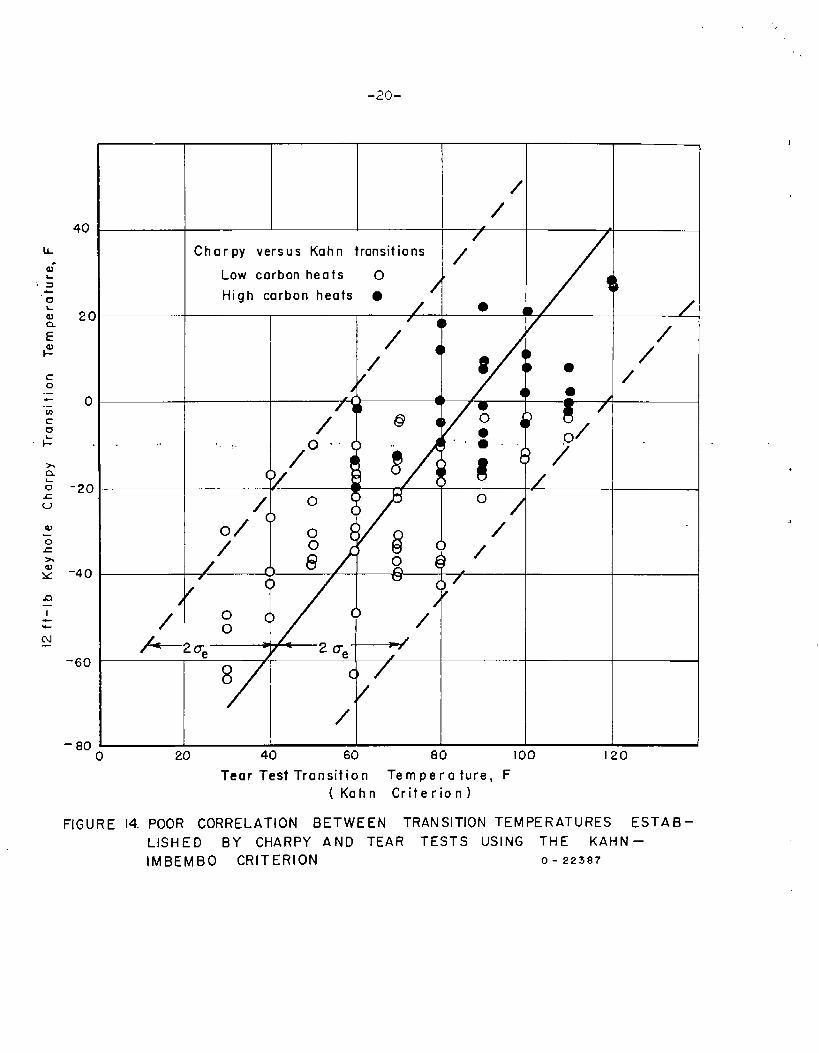
-20-
/
/
/Charpy versus Kahn transitions
/Low carbon heats O
High carbon heats ./ *
/ ●/
i●
//
4/ 8 ●
/
// ‘
*A dA ● /
0//
8/‘
/ g c)
+2C,
8 CU
/– 80
0 20 40 60 80 100 120
Tear Test Transition Temperature, F
(Kahn Criterion)
I
.
,
FIGURE 14. POOR CORRELATION BETWEEN TRANSITION TEMPERATURES ESTAB–
LISHED BY CHARPY AND TEAR TESTS USING THE KAHN –
IMBEMBO CRITERION O- 22387