reproduction, survival, and denning ecology of black bears
TRANSCRIPT

Reproduction, Survival, and Denning Ecology ofBlack Bears in Southwestern Virginia
Christopher W. Ryan
Thesis submitted to the Faculty of Virginia Polytechnic Institute and State University inpartial fulfillment of the requirement for the degree of
Master of ScienceIn
Fisheries and Wildlife Sciences
Dr. Michael R. Vaughan, Committee Chair Dr. Carola A. Haas Dr. Roy L. Kirkpatrick
December 10, 1997Blacksburg, Virginia Polytechnic Institute and State University
Keywords: Ursus americanus, George Washington and Jefferson National Forests,Exploited population, Population Dynamics
Copyright 1997, Christopher W. Ryan

ii
Reproduction, Survival, and Denning Ecology ofBlack Bears in Southwestern Virginia
Christopher W. Ryan
(Abstract)
Thirty-four (6 M, 28 F) of 93 black bears (Ursus americanus) captured during summers1995 and 1996 were equipped with radio-collars. The mean age of male and femalescaptured was 2.5 (n = 63; 2 males not aged) and 4.4 (n = 28) years, respectively. Themean date of females in estrus was 24 July, and we observed one 1.5-year old female inestrus. The average age of primiparity of radio-collared females was 3.0 years; however,we documented fetuses present in a 2-year old noncollared female’s reproductive tract.The average interbirth interval was 1.6 years and 95.4% of females without yearlingsproduced cubs. The mean litter size was 2.2 and the cub sex ratio was 1.3M:1F.
Hunting, vehicle collisions, poaching, research, and euthanasia accounted for 80.5%,5.5%, 5.5%, 5.5%, and 2.8%, respectively of the adult and juvenile male mortalities (n =36). Hunting, vehicle collisions, and research each accounted for 2 of the adult andjuvenile female mortalities (n = 6). Annual harvest rates for males in 1995 and 1996were 36.1% and 45.5%, respectively; corresponding harvest rates for females were 0.0%,and 5.9%. Annual survival rates estimated with Kaplan-Meier for adult females, juvenilefemales, and cubs were 100.0%, 93.3%, and 70.3%, respectively. Maximum juvenilemale survival rates were 52.0% in 1995 and 51.7% in 1996. Maximum adult malesurvival rates were 50.0% and 80.0% in 1995 and 1996, respectively.
We monitored 31 bears for 39 bear winters with 100% of the known bears denning.Bears denned in trees (41%), rock cavities (32%), excavations (14%), snags (8%), andground nests (5%). Chestnut oak (Quercus prinus; n = 9), red oak (Q. rubra ;n = 8), andtulip-poplar (Liriodendron tulipifera; n = 1) were used as tree dens. Habitatcharacteristics did not differ between ground dens and tree dens; however, older bearsused ground dens more frequently (Z = -2.484, P = 0.013) than tree dens. Fifty-sevenpercent of bears denned on public land, and we documented one instance of den reuse.

iii
Acknowledgments
Funding for this project was provided by the Virginia Department of Game and InlandFisheries. Additional funding was provided by the United States Forest Service, VirginiaPolytechnic Institute and State University, USGS (Biological Resources Division), theVirginia Bear Hunters Association, Virginia Houndsmen and Sporting Dog Association,Westvaco, Union Camp Corporation, Georgia Pacific, Virginia Chapter of the SierraClub, Northern Shenandoah Valley Audubon Society, Virginia Wilderness Committee,and Wildlife Forever Foundation.
Special thanks to my advisor Dr. Michael Vaughan for giving me the opportunity to be apart of such a great project. I will carry the insight, advice, and knowledge that you havegiven me for the rest of my life. I would also like to thank Dr. Carola Haas and Dr. RoyKirkpatrick for serving on my graduate committee. Their interest and advice throughoutthe project has been invaluable.
Special thanks go to Dave Steffen, Dennis Martin, Jerry Blank, Alan Boynton, AlBourgeois, David Kocka, and Carole Martin of the Virginia Department of Game andInland Fisheries. I thank Jesse Overcash, Tim Huffman, and Mike Quesenberry of theUnited States Forest Service. I would also like to thank Dr. David Moll of the Virginia-Maryland Regional College of Veterinary Medicine. Thanks go to Don Doffelmeyer andDennis Martin for providing assistance in aerial telemetry.
Special thanks go to all of the “bear students”: Cale Godfrey, Jennifer Higgins, KrisHiggins, Kim Needham, Sybille Klenzendorf, and Rachel Gray. Countless volunteersand technicians have served on the project, their hard work and determination was secondto none. I would like to thank Matt Lacy, Charisa Morris, Adam Vashon, ChristyGunnels, and Kevin Drury.
Thanks go to Kathryn Fabrycky, Jill Croft, Carol Linkous, Renee Speenburgh, and StacieCole. I appreciated all of the patience and assistance that you have given the bear projectand my fellow graduate students.
An extra special thanks go the VDGIF personnel of Region 3, District 1. Thank youBetsy Stinson, Larry Crane, Joe Watson, Marvin Gautier, and Roger Houck. Somehowwe survived snowstorms, long hikes, early mornings, long trips, and late evenings.Without them this project would not have been possible. Their friendship and guidancehelped me not only on the project but throughout my life. Thank you Ginger Ohleger foranswering all of my endless questions.
Thanks to my parents, grandmother, family, and friends. I could not have completed theproject without their love, support, and concern throughout the last 2 ½ years. Finally, Ithank God and my Lord, Jesus Christ, for giving me the strength to climb the mountainwhen I was tired, no matter what the mountain may have been, and the patience to dealwith every situation.

iv
Table of Contents
Abstract ............................................................................................................................ ii
Acknowledgments ........................................................................................................... iii
Table of Contents.............................................................................................................iv
List of Tables.................................................................................................................. vii
List of Figures............................................................................................................... viii
Introduction ..................................................................................................................... 1
General Methods.............................................................................................................. 2
Live Trapping and Handling Techniques.................................................................................. 2
Radio Telemetry ........................................................................................................................... 3
Study Area........................................................................................................................ 4
Chapter 1: Reproduction ................................................................................................. 7
Introduction................................................................................................................................... 7
Methods.......................................................................................................................................... 8
Results ............................................................................................................................................ 9Timing of Estrus......................................................................................................................................9Age of Primiparity.................................................................................................................................10Percent Reproducing .............................................................................................................................10Interbirth Interval ..................................................................................................................................10Litter Size..............................................................................................................................................10Cub Sex Ratio .......................................................................................................................................15Date of Parturition.................................................................................................................................15Cub Growth Measurements...................................................................................................................15
Discussion .................................................................................................................................... 21Timing of Estrus....................................................................................................................................21Age of Primiparity.................................................................................................................................21Percent Reproducing .............................................................................................................................22Interbirth Interval ..................................................................................................................................23Litter Size..............................................................................................................................................23Cub Sex Ratio .......................................................................................................................................24Date of Parturition.................................................................................................................................24Cub Growth Measurements...................................................................................................................25
Summary and Recommendations for Future Study .............................................................. 26
Chapter 2: Survival........................................................................................................ 27
Introduction................................................................................................................................. 27
Methods........................................................................................................................................ 28
Results .......................................................................................................................................... 30Age structure .........................................................................................................................................30Adult Mortality......................................................................................................................................30

v
Harvest Rate..........................................................................................................................................31Female Survival.....................................................................................................................................31Male Survival ........................................................................................................................................31Cub Transmitters...................................................................................................................................37Cub Mortality ........................................................................................................................................37Cub Survival..........................................................................................................................................37
Discussion .................................................................................................................................... 40Age Structure ........................................................................................................................................40Adult and Juvenile Mortality.................................................................................................................41Harvest Rate..........................................................................................................................................41Female Survival.....................................................................................................................................42Male Survival ........................................................................................................................................42Cub Transmitters...................................................................................................................................45Cub Mortality ........................................................................................................................................45Cub Survival..........................................................................................................................................45
Summary and Recommendations for Future Study .............................................................. 46
Chapter 3: Denning Ecology ......................................................................................... 47
Introduction................................................................................................................................. 47
Methods........................................................................................................................................ 49
Results .......................................................................................................................................... 51Denning Status ......................................................................................................................................51Habitat Characteristics ..........................................................................................................................51Den Type Characteristics ......................................................................................................................51Den Reuse .............................................................................................................................................51Fidelity to Den Type .............................................................................................................................58
Discussion .................................................................................................................................... 58Den Status .............................................................................................................................................58Den Site Habitat Characteristics............................................................................................................58Den Characteristics ...............................................................................................................................59Den Reuse .............................................................................................................................................60Fidelity to Den Type .............................................................................................................................61
Summary and Recommendations for Future Study .............................................................. 61
Literature Cited.............................................................................................................. 63
Appendix A: ................................................................................................................... 69
Appendix Table 1. Rating scale for signal strength of individual telemetry bearings............. 70
Appendix Table 2. Rating scale for a telemetry location.......................................................... 71
Appendix Table 3. Definitions of morphological measurements taken on black bear cubs atden sites in the southern George Washington and Jefferson National Forests, Virginia 1996 and1997............................................................................................................................................... 72
Appendix Table 4. Description of measurements taken at black bear den sites located in thesouthern George Washington and Jefferson National Forests, Virginia 1996 and 1997........... 73
Appendix Table 5. Definitions of morphological measurements taken on adult black bear inthe southern George Washington and Jefferson National Forests, Virginia 1995 – 1997......... 74
Appendix Table 6. Summer measurements of female black bears captured in the southernstudy area of the Cooperative Allegheny Bear Study, Virginia 1995 and 1996......................... 75

vi
Appendix Table 7. Measurements of black bear cubs captured at den sites in March 1996 and1997 in the southern George Washington and Jefferson National Forests, Virginia................. 78
Appendix Table 8. Den location sheet. Used when the den site is first located in the southernstudy area of the Cooperative Allegheny Bear Study, Virginia.................................................. 81
Appendix Table 9. Den description data sheet used in the southwestern study area of theCooperative Allegheny Bear Study, Virginia 1996 and 1997..................................................... 82
Appendix Table 10. Physical characteristics of tree den sites used by black bears in thesouthern George Washington and Jefferson National Forests, Virginia 1996 and 1997........... 83
Appendix Table 11. Physical characteristics of ground dens used by black in the southernGeorge Washington and Jefferson National Forests, Virginia 1996 and 1997.......................... 84
Appendix Table 12. Habitat characteristics of black bear den sites in the southern GeorgeWashington and Jefferson National Forests, Virginia 1996 and 1997....................................... 85
Vita................................................................................................................................. 87

vii
List of TablesTable 1. Age of first successful breeding for black bears in North America................. 11Table 2. Reproductive success of female black bears in the southern George Washington
and Jefferson National Forests, Virginia, 1996-1997............................................... 13Table 3. Average litter sizes and hunting status of black bears in North America......... 14Table 4. Estimate dates of parturition for bears in the southern George Washington and
Jefferson National Forests, Virginia in 1996 and 1997............................................. 16Table 5. Average measurements and ± SE of male cubs captured in the southern George
Washington and Jefferson National Forests in March 1996 and 1997...................... 17Table 6. Average measurements and ±SE of female cubs captured at den sites in
southern George Washington and Jefferson National Forests in March 1996 and1997......................................................................................................................... 18
Table 7. Average measurements and ±SE of male and female cubs captured at den sitesin the southern George Washington and Jefferson Forests during March 1996 and1997......................................................................................................................... 19
Table 8. Average measurements and ±SE of cubs at den sites in the southern GeorgeWashington and Jefferson National Forest in March 1996 and 1997....................... 20
Table 9. Mortality causes of black bears in the southern George Washington andJefferson National Forests, Virginia 1 June 1995 – 31 May 1997............................ 32
Table 10. Minimum, maximum, and program MARK survival estimates from malebears marked with black ear tags in the southern George Washington JeffersonNational Forest, Virginias, 1 June 1995 to 31 May 1997......................................... 35
Table 11. Fate of black bear cubs equipped with radio transmitters in the southernGeorge Washington Jefferson National Forests, Virginia 1996 and 1997................ 36
Table 12. Estimated age of mortality for black bear cubs in the southern GeorgeWashington National Forests, Virginia 1996........................................................... 38
Table 13. Maximum survival of black bear cubs in the southern George Washington andJefferson National Forests, Virginia 1996................................................................ 39
Table 15. Den site1 characteristics of ground and tree dens in the southern GeorgeWashington and Jefferson National Forests, Virginia in 1996 and 1997.................. 52
Table 16. Ground nest dimensions of black bear den sites in the southern GeorgeWashington and Jefferson National Forests, Virginia in 1996 and 1997.................. 55
Table 17. Characteristics of red and chestnut oaks used as dens in the southern GeorgeWashington and Jefferson National Forests, Virginia in 1996 and 1997.................. 56
Table 18. Characteristics of tree den sites used by black bears with and without cubs inthe southern George Washington and Jefferson National Forests, Virginia in 1996and 1997................................................................................................................... 57

viii
List of FiguresFigure 1. Southwestern study area of the Cooperative Alleghany Bear Study, Virginia.5Figure 2. Southwestern study area of the Cooperative Alleghany Bear Study, Virginia.6Figure 3. Females captured in estrus during the summer 1995 and 1996 in the southern
half of the George Washington and Jefferson National Forests................................ 12Figure 4. Age structure of male and female black bears captured on the George
Washington and Jefferson National Forests............................................................. 33Figure 5. Age structure by method of harvest for male black bears on the southern
George Washington and Jefferson National Forests, Virginia 1995 and 1996......... 34Figure 6. Black bear den types used i the southern George Washington and Jefferson
National Forests, Virginia in 1996 and 1997............................................................ 53Figure 7. Proportion of bears denned on private and public land in the southern George
Washington and Jefferson National Forests, Virginia in 1996 and 1997.................. 54

1
IntroductionBlack bear (Ursus americanus) hunting has been under close scrutiny throughout muchof the country for the past 10 years. Ethical questions surrounding springtime hunting,hunting over bait, and the use of hounds to hunt bears are issues that have been raised bythe public. In California, Burton (1994) noted that the public was interested in blackbear bag limits, season length, and the use of hounds to pursue or hunt bears. Publicopinion (Burton 1994) and insufficient biological data for some bear populations hasstopped or altered methods of bear hunting in a number of states including California,Oregon, Washington, Colorado, and Massachusetts.
In Virginia, where hunting bears with dogs is traditional, black bears are managed bysetting bag limits, weight limits, season lengths, and controlling access on public lands(through closed gates; Martin, 1991). Bear harvests in Virginia generally have increasedsince records were kept in the late 1920s, and harvest data have been the majorinformational tool to manage bear populations. However, because Virginia does not havea separate bear license, the number of hunters pursuing bears is unknown. Thus, huntereffort and success is not fully considered in Virginia’s bear management strategy.
Virginia state biologists began tagging bears in 1957 (Strickley 1961). Early studies(Raybourne 1977) provided some background information, but did not give specificinformation on reproductive rates, cub survival, dispersal, nonhunting moralities, ordenning ecology of the black bear. More recent studies (Carney 1985, Garner 1986,Hellgren 1988, Kasbohm 1994, Schrage 1994) of nonexploited populations in theShenandoah National Park (SNP) and Great Dismal Swamp National Wildlife Refuge(GDSNWR) provided some insight into the demographic characteristics of black bears inVirginia.
Data from the exploited black bear population are essential to ensure proper managementof the resource. In 1994, the Virginia Department of Game and Inland Fisheries(VDGIF) and Virginia Polytechnic Institute and State University began research on theexploited black bear population. The long-term goal of the project (CooperativeAllegheny Bear Study; CABS) was to construct a population model and provide datacrucial to the management of bears in Virginia. The first goal of CABS was to conduct ademographic analysis of the black bear population. This thesis is the first in a series ofstudies designed to provide baseline demographic and ecological data for bears in thesouthwestern study area of CABS. The specific objectives of this thesis were to1. determine the timing of estrus, age of primiparity, percent reproducing, litter size,
date of parturition, and cub sex ratio in the southern portion of the GeorgeWashington and Jefferson National Forests (GWJNF).
2. determine the age structure, age and sex specific survival rates, sex specific harvestrates, and causes of mortality in the southern portion of the GWJNF.
3. determine den types, habitat characteristics, and den reuse in the southern portion ofthe GWJNF.

2
General Methods
Live Trapping and Handling TechniquesBlack bears were trapped from June until the first Saturday in September in 1995 and1996. Culvert traps and modified Aldrich foot snares were used to capture bears. Thenumber and location of trap lines within the study area were selected to distribute thecapture sample and maximize use of personnel. Trap lines and areas trapped weredivided among VDGIF personnel and Virginia Tech graduate students.
Trap lines were prebaited for 4-8 days before snares were set. Bait and trap sites weredetermined in the field based on bear sign, accessibility of site, and safety of site topersonnel and trapped bears. We used meat scraps, pastries, bread with molasses, andcarrion as bait. Call bags (cloth sacks with meat scraps and molasses in it) were hung aminimum of 3 meters high in a tree to attract bears and determine use of site. Wechecked bait sites and put out new bait every other day; snares were set shortly after abear visit. Trap lines of 6-15 snares were run for 2 weeks before shifting to a new area.Captures per trap night and number of trap nights were recorded for each trapping crew.The Global Positioning System (GPS) was used to identify Universal TransverseMercator (UTM) grid coordinates of successful trap sites.
A 2:1 mixture of ketamine hydrochloride and xylazine hydrochloride was used toimmobilize black bears caught in snares (Schrage 1994). A jab stick, blow gun, or dartgun or pistol was used to administer the drug at a dosage rate of 1cc of ketaminehydrochloride and xylazine hydrochloride per 44 kilogram (kg) of estimated live weight.Each captured bear was marked with a numbered ear tag in each ear and a tattoo in theupper lip; both ear tags and the lip tattoo bore the same number.
We removed one of the upper first premolars for age determination (Willey 1974), took ahair sample for genetic analysis, and drew blood from each bear. One blood tube withEDTA anticoagulant for hematological and genetic analyses to be used by a currentstudent and 2 for blood serum analyses were drawn from the femoral vein. The bear’sear tag number, date of collection, sex, and ID were placed on the blood and hair samplecontainers. Each bears’ ID in the southwestern study area began with an S.
We recorded the weight of each bear to the nearest kg. Morphological measurementswere taken to be used by a current student. Each bear’s canine length and breadth,forepaw (length and width), hindpaw (length and width), ear length, tail length, shoulderheight, body length (zoological and actual length), zygomatic circumference, and chestand neck circumference were measured to the nearest millimeter (mm). On males, wemeasured testicle length and width and on females we measured the second thoracicnipple. For females, we also determined whether cubs were present and checked forlactation and estrus. Overall condition such as scars, parasites, wounds, teeth and coatcondition, injuries, and any abnormalities was entered onto the data sheet.

3
Radio TelemetryTelonics (Telonics Inc., Mesa, AZ) receivers and H-antennas were used for groundtelemetry. Compass bearings were taken from at least 3 fixed telemetry stations, andlocations were estimated through triangulation. Readings more than 30 minutes apart(unless transmitter was on mortality mode) or angles less than 30 degrees were not usedfor analysis. Aerial telemetry was used specifically for missing bears, den locations,dropped collars, and to supplement ground telemetry. Dennis Martin (VDGIF), a hiredpilot, or a graduate student conducted aerial telemetry. GPS was used for determiningaerial locations.
Accuracy of both aerial and ground telemetry was assessed. Den locations and droppedcollars were used to determine the accuracy of each pilot. The dens were chosen atrandom so that the pilots did not know they were being tested. Den locations and placedcollars were used to rate the accuracy of graduate students and volunteers. Students andvolunteers located the collars from the ground and percent error was calculated.Volunteer accuracy was combined into one rating for all volunteers.

4
Study AreaResearch was conducted from May 1995 through December 1997 on the Blacksburg andNewcastle Ranger Districts of the GWJNF (Figures 1 and 2). The 1,544 sq. km studyarea was in the Southern Appalachian Ridge and Valley Province (United StatesDepartment of Agriculture [USDA] 1965) of Giles, southern Craig, and northwesternMontgomery counties. Major valleys and ridges run parallel to the New River (SoilConservation Service [SCS] 1985). The southern study area was bordered by WestVirginia to the northwest, Bland County to the southwest, route 624 to the southeast, androute 311 to the northeast.
Average yearly temperatures at Mountain Lake Meteorological Station, in the middle ofthe study area, were 8.30C and 6.90C in 1995 and 1996, respectively with a range of –23.80C to 29.20C. Total precipitation was 119 cm and 153 cm in 1995 and 1996,respectively; the monthly range was 7 cm to 246 cm.
Mountain bedrock on the study area is generally sandstone and shale (SCS 1985). Theelevation ranges from 492 m along the Craig Creek drainage to 1,378 m at MountainLake. Soils are typically from the Gilpin, Nolichucky, Jefferson, and Lily series and aresloping to very steep and are well drained (SCS 1985).
Chestnut oak, white oak (Quercus alba), scarlet oak (Q. coccinea), northern red oak, andblack oak (Q. velutina), are the important tree species in the southern study area (USDA1985). In addition, red maple (Acer rubrum), pignut hickory (Carya glabraI), bitternuthickory (C. cordiformis), pitch pine (Pinus rigida), eastern white pine (P. strobus) werealso common overstory species. Sassafras (Sassafras albidum), mountain laurel (Kalmialatifolia), downy serviceberry (Amelanchier arborea), flowering dogwood (Cornusflorida), witch hazel (Hamamelis virginia), and rhododendron (Rhododendron maximum)were the common understory species.

5
Figure 1. Southwestern study area of the Cooperative Alleghany Bear Study, Virginia.
WestVirginia
250
460
460
460
311
Virginia

6
Figure 2. Southwestern study area of the Cooperative Alleghany Bear Study, Virginia.
Blacksburg
311
WestVirginia
460
460
81
81
Virginia

7
Chapter 1: Reproduction
Introduction
With delayed sexual maturity, small litter sizes, and a prolonged birth interval (Eiler et al.1989), black bears have one of the lowest reproductive rates of mammals in NorthAmerica; thus small changes in reproduction may severely alter population levels(Craighead et al. 1974). Reproduction in black bears may be affected by physicalcondition (Samson and Hout 1995) and age (Alt 1982) of reproducing females, and fallmast availability (Elowe and Dodge 1989). The number of cubs produced in any givenyear is largely a function of the number of breeding females in the population and ofhabitat quality. Beecham (1980), LeCount (1987), and Rogers (1977) hypothesized thatcub production is density-independent, with most females producing at or near maximumpotential, but LeCount (1987) stated that social regulation (density dependent) was afactor in cub survival in Arizona.
Black bears typically breed from late May through August. In most regions, the peak ofbreeding occurs during late June and July (Alt 1989, Eiler 1981, Jonkel and Cowan 1971,Kohn 1982, Rogers 1987). Breeding periods apparently are longer in southern black bearpopulations because reproductive cycles in males are triggered by photoperiod (Garshelisand Hellgren 1994). Bears give birth from mid-January to mid-February (Alt 1989,Carney 1985, Godfrey 1996). Cubs remain with their mother for 1.5 years, at which timethe family group breaks up and the female breeds again.
Female black bears typically breed every other year, but will breed in consecutive years ifthey lose their entire litter before late summer (Carney 1985); thus the interbirth intervaldepends on cub survival and nutritional condition of the female. Research has shown thatthe mean interbirth interval for the eastern United States is 1.9 - 2.3 years (Alt 1989,Carney 1985, Eiler et al. 1989, Elowe and Dodge 1989, Godfrey 1996, Hellgren andVaughan 1989, Kolenosky 1990). Kasworm and Thier (1994) reported a mean interbirthinterval of 3.2 years for black bears in Montana. In Alaska, the mean interbirth intervalwas 2.0 years (Miller 1994).
Female black bears typically first give birth between 3 and 7 years of age (Alt 1989,Carney 1985, Eiler et al. 1989, Elowe and Dodge 1989, Kasworm and Thier 1994,Lindzey and Meslow 1977, McLaughlin et al. 1994, Rogers 1987, Schwartz andFranzmann 1991). Age of first reproduction varies geographically, depending on sizeand condition of the bears (Alt 1989, Elowe 1987), and food availability (McLaughlin etal. 1994). However, Alt (1989) in Pennsylvania, where greater than 80% of the femalesgive birth by age 3, reported reproduction in one 2-year old female. In Virginia, Carney(1985) and Hellgren (1988) reported an average breeding age of 3 years (giving birth at 4years) for unexploited populations, and a minimum breeding age of 2 years. However,Godfrey (1996) showed the mean age of primiparity for an exploited population in thenorthern GWJNF to be 3.14 years. The mean age for first litters of bears in the southernAppalachian Mountains was 4.6 years (Eiler et al. 1989). In Washington, Lindzey and

8
Meslow (1977) observed that black bears on average gave birth as 4-year olds. InAlaska, the average age at first reproduction in black bears ranged from 4.6 to 5.1 years(Schwartz and Franzmann 1991). In Maine, black bears began reproducing as 6-yearolds when beechnuts (Fagus grandifolia) were scarce and 4 years when they wereplentiful (McLaughlin et al. 1994). In Montana, black bears were greater than 6-yearsold when they began to reproduce (Kasworm and Their 1994).
Age, weight, food availability, and nutritional condition (Alt 1989, Noyce and Garsheils1994, Samson and Hout, 1995) influence litter size of female black bears. The largestreported mean litter sizes were in Pennsylvania (x = 2.9 - 3.0; Alt 1982, Alt 1989) and
West Virginia (x = 2.87; Kraus et al. 1988). Carney (1985), Schrage (1994), andGodfrey (1996) reported mean litter sizes of 2.0 - 2.3 in Virginia. In Maine (McLaughlinet al. 1994), Alaska (Miller 1994), and Montana (Kasworm and Thier 1994) average littersizes were 2.5, 2.1, and 1.8, respectively. Litters of 5 have been reported in Michigan(Matson 1952), Saskatchewan (Rowan 1945), and Pennsylvania (Alt 1982).
First time mothers typically have smaller litters than older adult females (McLaughlin etal. 1994, Noyce and Garshelis 1994). Miller (1994) reported that all first litters in southcentral Alaska were 2 cubs. In Maine, the average first litter size was 2.1 (McLaughlin etal. 1994). Alt (1982) and Godfrey (1996) found a direct correlation between age ofmother and litter size, with young mothers producing smaller litters. In Minnesota,Noyce and Garhelis (1994) reported a significant difference between first litter size andsubsequent litters.
Sex ratios of black bear cubs tend to be 1:1 (Godfrey 1996, McLaughlin et al. 1994,Miller 1994, Schwartz and Franzmann 1991). However, in Pennsylvania, males made up51% of small litters (<3), but 63% of larger litters (4-5; Alt 1982). Samson and Hout(1995) in Quebec reported a sex ratio of 2.5M:1F. In Maine, the sex ratio of cubs was1.2M:1F (McLaughlin et al. 1994) and in Virginia it was 0.89M:1F (Hellgren 1988,Kasbohm 1994).
MethodsUpon capture, female bears were examined for signs of lactation and estrus (see livetrapping and handling). Vulval swelling indicated the timing of estrus, and dates ofestrus were tested between younger and older females with a Wilcoxon Rank Sum test.Lactating females exhibiting loss of hair around their nipples were assumed to havesuccessfully reproduced that year. Adult females (> 3 years) not showing signs oflactation were considered available to reproduce, whereas juvenile females (< 2 years)were not considered available to reproduce. Percent available to reproduce was testedbetween years with a z-test for proportions (α = 0.05 was the significance level for allstatistical tests).
Female reproductive success was determined during the denning season. Percent ofsuccessfully reproducing females that were available to reproduce was tested betweenyears with a z-test for proportions. Cub sex ratio, litter size, age of primiparity, and cub

9
and sow physical measurements (see live trapping and handling) were determined in theden season or shortly after den emergence. Cub sex ratio was tested between years with az-test for proportions. A Chi-square goodness of fit test was used to determine if the cubsex ratio differed from 1:1. The relationship between age of female and litter size wastested with a Spearman’s Correlation. Litter size by age classes (3 and 4 years vs. >5years), between years, and for females that denned in trees versus ground dens weretested with a Wilcoxon rank sum.
Body measurements, sex, markings (blazes), and overall condition were recorded foreach cub. Weight of each cub was determined to the nearest 0.5 kg. Measurements ofeach cub’s total length, neck and chest girth, forepaw (length and width), hindpaw (lengthand width), and hair length at the crown of the head were determined to the nearestmillimeter (mm). Selected cubs were fitted with radio transmitters to determine cubsurvival (Chapter 2). Cub growth measurements were tested between years and sexeswith analysis of covariance (covariant = cub age). Regression equations (Godfrey 1996)from physical characteristics and growth rates of captive bear cubs at Virginia Tech wereused to calculate date of parturition. Hair, measured between the ears, and ear lengthmeasurements were averaged per litter for multiple cub litters. The regression used fromGodfrey (1996) was
Age = -5.98 + (1.28*hair length) + (0.75* ear length)n = 56, Cp=48.52, Adjusted R2=0.983, MSE=11.006
Date of parturition was tested between years and age classes with a Wilcoxon rank sum.
Corpora lutea, placental scars, or fetuses per female were determined from reproductivetracts collected from road-killed and harvested females (Carney 1985). To assist in thecollection of reproductive tracts, diagrams with instructions on reproductive tract removaland storage were distributed to bear hunters, law enforcement officers, and game check-in stations. Reproductive tracts were labeled and frozen until further dissection. Numberof fetuses and corpora lutea present was determined by dissection of the reproductivetracts. Placental scars were counted for each reproductive tract (Tsubota et al. 1990).
Age of primiparity was determined by following radio-collared juvenile females (< 3years) until they produced their first litter. Interbirth interval was calculated by countingthe number of years between successive litters for the same bear.
Results
Timing of EstrusTen females with swollen vulvas were captured 11 times between 20 June and 21 August1995 and 1996 (Figure 1). Mean date for females exhibiting signs of estrus was 24 July(SE = 6.49, n = 10, median = 25 July). Five of 10 females with swollen vulvas werecaptured between 11 July and 3 August. Four of 9 non-lactating females capturedbetween 11 July and 30 July exhibited signs of estrus. Timing of estrus did not differ (Z= 1.358, P = 0.175) between younger females (< 3.5 years) and older females (> 4.5
10
years). One 6.5-year old female exhibited signs of estrus when captured on 18 July 1996and recaptured on 25 July 1996. We captured a 1.5-year-old female exhibiting signs ofestrus on 21 August 1995.
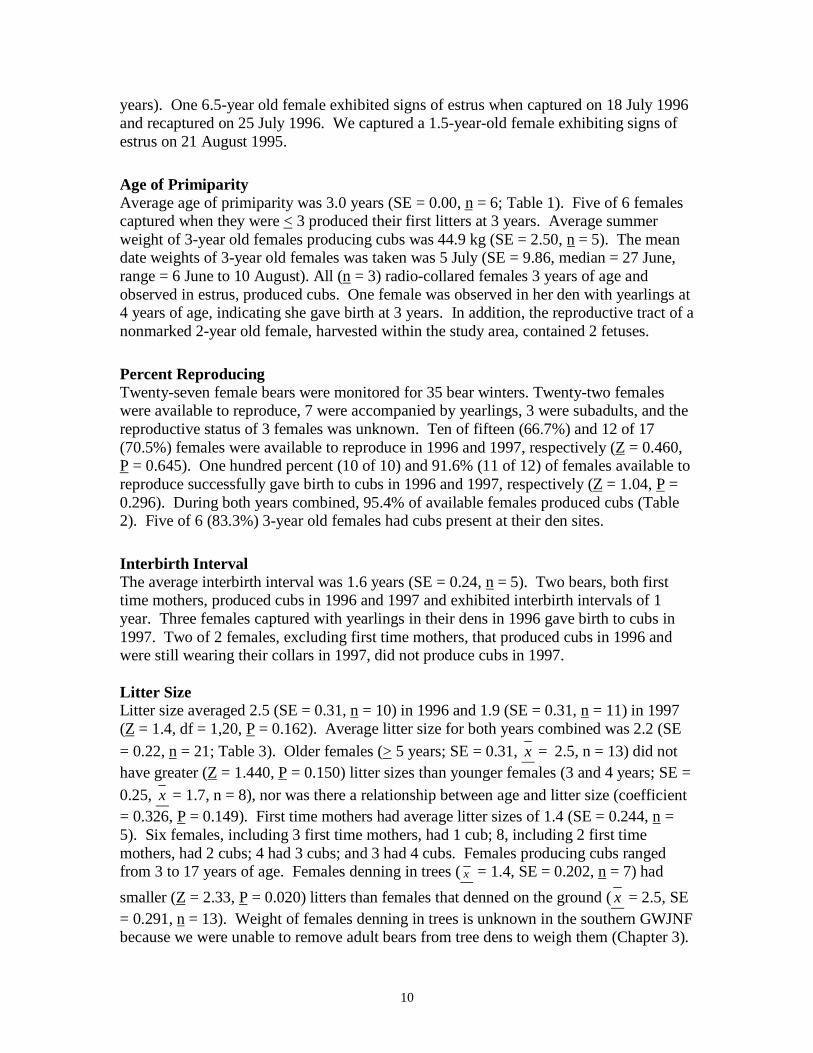
Age of PrimiparityAverage age of primiparity was 3.0 years (SE = 0.00, n = 6; Table 1). Five of 6 femalescaptured when they were < 3 produced their first litters at 3 years. Average summerweight of 3-year old females producing cubs was 44.9 kg (SE = 2.50, n = 5). The meandate weights of 3-year old females was taken was 5 July (SE = 9.86, median = 27 June,range = 6 June to 10 August). All (n = 3) radio-collared females 3 years of age andobserved in estrus, produced cubs. One female was observed in her den with yearlings at4 years of age, indicating she gave birth at 3 years. In addition, the reproductive tract of anonmarked 2-year old female, harvested within the study area, contained 2 fetuses.
Percent ReproducingTwenty-seven female bears were monitored for 35 bear winters. Twenty-two femaleswere available to reproduce, 7 were accompanied by yearlings, 3 were subadults, and thereproductive status of 3 females was unknown. Ten of fifteen (66.7%) and 12 of 17(70.5%) females were available to reproduce in 1996 and 1997, respectively (Z = 0.460,P = 0.645). One hundred percent (10 of 10) and 91.6% (11 of 12) of females available toreproduce successfully gave birth to cubs in 1996 and 1997, respectively (Z = 1.04, P =0.296). During both years combined, 95.4% of available females produced cubs (Table2). Five of 6 (83.3%) 3-year old females had cubs present at their den sites.
Interbirth IntervalThe average interbirth interval was 1.6 years (SE = 0.24, n = 5). Two bears, both firsttime mothers, produced cubs in 1996 and 1997 and exhibited interbirth intervals of 1year. Three females captured with yearlings in their dens in 1996 gave birth to cubs in1997. Two of 2 females, excluding first time mothers, that produced cubs in 1996 andwere still wearing their collars in 1997, did not produce cubs in 1997.
Litter SizeLitter size averaged 2.5 (SE = 0.31, n = 10) in 1996 and 1.9 (SE = 0.31, n = 11) in 1997(Z = 1.4, df = 1,20, P = 0.162). Average litter size for both years combined was 2.2 (SE
= 0.22, n = 21; Table 3). Older females (> 5 years; SE = 0.31, x = 2.5, n = 13) did nothave greater (Z = 1.440, P = 0.150) litter sizes than younger females (3 and 4 years; SE =
0.25, x = 1.7, n = 8), nor was there a relationship between age and litter size (coefficient= 0.326, P = 0.149). First time mothers had average litter sizes of 1.4 (SE = 0.244, n =5). Six females, including 3 first time mothers, had 1 cub; 8, including 2 first timemothers, had 2 cubs; 4 had 3 cubs; and 3 had 4 cubs. Females producing cubs rangedfrom 3 to 17 years of age. Females denning in trees (x = 1.4, SE = 0.202, n = 7) had
smaller (Z = 2.33, P = 0.020) litters than females that denned on the ground (x = 2.5, SE= 0.291, n = 13). Weight of females denning in trees is unknown in the southern GWJNFbecause we were unable to remove adult bears from tree dens to weigh them (Chapter 3).

11
Table 1. Age of first successful breeding for black bears in North America.
Age at first successful breedingArea Mean Min-Max CitationSouthern GWJNF 2.5 1.5-2.5 Present StudyNorthern GWJNF 2.6 2.5-3.5 Godfrey 1996SNP 3.0 2.5-3.5 Kasbohm 1994Tennessee 4.4 2.5-8.5 Eiler 1989Pennsylvania 2.7 1.5-4.5 Alt 1989Massachusetts 3.2 2.5-4.5 Elowe 1987Maine 4.6 3.5-5.5 McLaughlin et al. 1994Ontario 5.1 4.5-6.5 Kolenosky 1990Minnesota 5.0 2.5-7.5 Rogers 1987Idaho 4.3 3.5-5.5 Reynolds 1977Arizona 4.2 3.5-5.5 LeCount 1984Alaska 5.6 4.5-7.5 Miller 1987

12
0
1
2
3
Num
ber
of B
ears
June 20 June 27 July 4 July 11 July 18 July 25 August 1 August 8 August 15
Week Beginning
Figure 3. Females captured in estrus during the summer 1995 and 1996 in the southern half of the George Washington and Jefferson National Forests.
19961995

13
Table 2. Reproductive success of female black bears in the southern George Washington and Jefferson National Forests, Virginia,1996-1997.
Age# of female # with
yearlings# withunknown status
# Available toproduce cubs
# Producingcubs
Average littersize
% of Availablefemales with
cubs2 3 0 0 0 0 0.0 N/A3 9 0 3 6 5 1.4 83.3%4 4 1 0 3 3 2.3 100%5 4 1 0 3 3 2.0 100%6 1 0 0 1 1 4.0 100%7 5 1 0 4 4 2.0 100%8 2 1 0 1 1 4.0 100%9 1 0 0 1 1 3.0 100%10 0 0 0 0 0 N/A11 0 0 0 0 0 N/A12 1 1 0 0 0 N/A13 2 1 0 1 1 3.0 100%14 0 0 0 0 0 N/A15 1 0 0 1 1 2.0 100%16 0 0 0 0 0 N/A17 1 0 0 1 1 2.0 100%18 1 1 0 0 0 N/A
Total 35 7 3 22 21 N/A

14
Table 3. Average litter sizes and hunting status of black bears in North America.
Location Hunting StatusAverage Litter
SizeCitation
Southern GWJNF Exploited 2.2 Present StudyNorthern GWJNF Exploited 2.0 Godfrey 1996SNP Unexploited 2.5 Carney 1985GDS Unexploited 2.1 Hellgren 1988Pennsylvania Unexploited 3.0 Alt 1989Tennessee Exploited 2.6 Eiler et al. 1989Massachusetts Exploited 2.4 Elowe 1987West Virginia Exploited 2.8 Kraus et al. 1988Idaho Exploited 2.1 Reynolds and Beecham 1980Montana Exploited 1.8 Kasworm and Their 1994Alaska Exploited 2.1 Miller 1994Ontario Exploited 2.5 Kolenosky 1990Minnesota Exploited 2.5 Noyce and Garshelis 1994Maine Exploited 2.5 McLaughlin et al. 1994Quebec Exploited 2.5 Samson and Hout 1995

15
One of 4 reproductive tracts collected from harvested and roadkilled bears containedfetuses and corpora lutea. Three of the reproductive tracts were from marked femalesand 1 was from an unmarked harvested 2-year old female. The unmarked female, killedon 16 December, had 2 fetuses and 2 corpora lutea present. One fetus had implanted ineach uterine horn; however both corpora lutea came from the same ovary. The fetuseswere 15.2 mm and 15.8 mm in length. An average of 3 placental scars was observed inmarked females. Females S-19, SN-1, and SN-4, produced 4, 3, and 2 cubs in the springand had 4, 3, and 2 placental scars at time of death, respectively. An average of 2.3 (SE =0.211, n = 6) yearlings was observed in dens. Four females had 2 yearlings present and 2had 3.
Cub Sex RatioThe cub sex ratio of 1.3 M:1F (23 males, 18 females; 5 unknown) did not differ (χ2 =0.610, P = 0.435) from 1:1. Cub sex ratios were 1.6M:1F (13 males: 8 females; 4unknown) and 1M:1F (10 males: 10 females; 1 unknown) in 1996 and 1997, respectively,(Z = 0.773, P = 0.439).
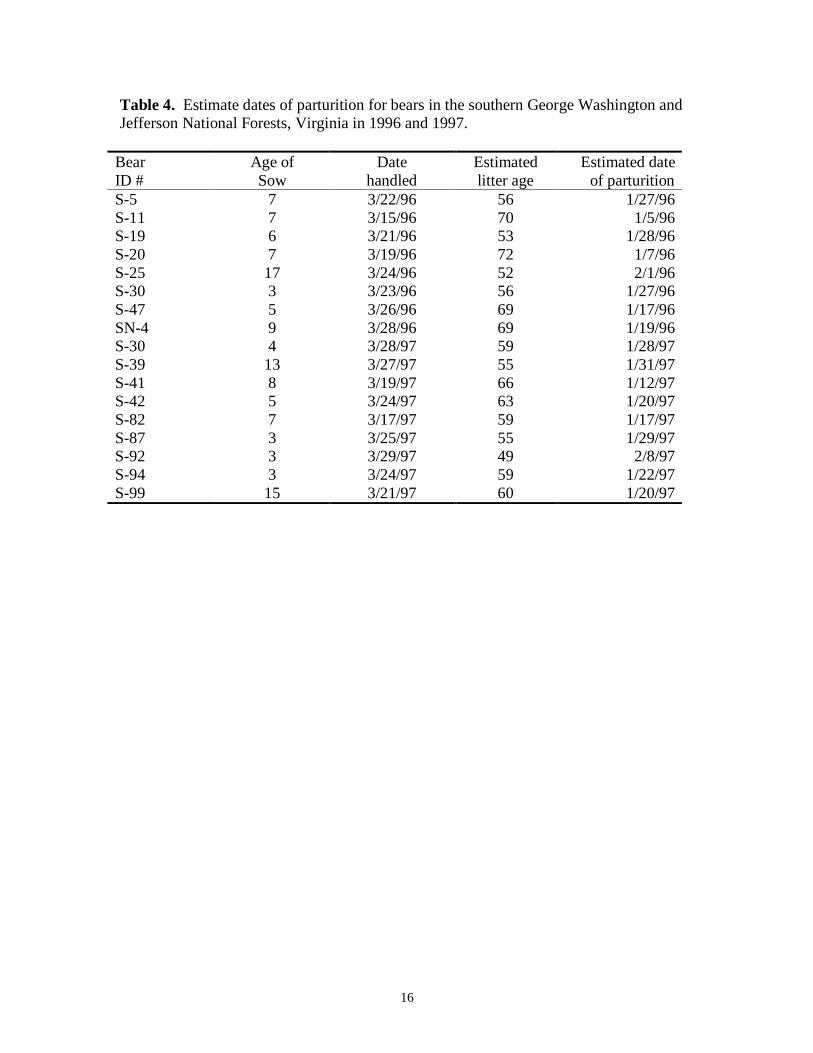
Date of ParturitionEstimated average dates of parturition were 20 January (SE = 3.56, n = 8, median = 23January) in 1996 and 24 January (SE = 2.75, n=9, median = 22 January) in 1997 (Z =0.868, P = 0.385). Dates of parturition ranged from 5 January to 1 February and 12January to 8 February in 1996 and 1997, respectively (Table 4). The average date ofparturition for both years combined was 22 January (SE = 2.19, n = 17, median = 22January). Mean parturition dates for older females (> 5 years) did not differ (Z = 1.902,P = 0.057) from younger (3 or 4 years) females.
Mean estimated litter age at time of cub measurements was 62.1 (SE = 3.03) and 58.3(SE = 1.64) days in 1996 and 1997, respectively. Litter age varied from 52 to 72 days in1996 and 49 to 66 days in 1997.
One female provided 2 estimated dates of parturition and at least one female provided anincorrect estimated date of parturition. Bear S-30’s estimated dates for parturition were27 January 1996 and 28 January 1997. The estimated date of parturition for female S-19was 28 January 1996. However, cubs were heard at her den site on 23 January 1996.This is the only known discrepancy in estimated date of parturition and when cubs wereheard at den sites. However, cubs were not heard at all den sites.
Cub Growth MeasurementsMale cubs had greater neck girth (F = 5.70, df = 1,34, P =0.023) and front paw width thanfemale cubs (F = 7.59, df = 1,34, P = 0.009; Tables 5, 6, and 7). Cubs weighed more (F =10.72, df = 1,35, P = 0.002) in 1997, but had greater front paw length (F = 11.74, df =1,34, P = 0.002) in 1996 (Table 8).
16
Table 4. Estimate dates of parturition for bears in the southern George Washington andJefferson National Forests, Virginia in 1996 and 1997.
Bear Age of Date Estimated Estimated dateID # Sow handled litter age of parturitionS-5 7 3/22/96 56 1/27/96S-11 7 3/15/96 70 1/5/96S-19 6 3/21/96 53 1/28/96S-20 7 3/19/96 72 1/7/96S-25 17 3/24/96 52 2/1/96S-30 3 3/23/96 56 1/27/96S-47 5 3/26/96 69 1/17/96SN-4 9 3/28/96 69 1/19/96S-30 4 3/28/97 59 1/28/97S-39 13 3/27/97 55 1/31/97S-41 8 3/19/97 66 1/12/97S-42 5 3/24/97 63 1/20/97S-82 7 3/17/97 59 1/17/97S-87 3 3/25/97 55 1/29/97S-92 3 3/29/97 49 2/8/97S-94 3 3/24/97 59 1/22/97S-99 15 3/21/97 60 1/20/97

17
Table 5. Average measurements and ± SE of male cubs captured in the southern GeorgeWashington and Jefferson National Forests in March 1996 and 1997.
AverageMeasurement 1996 (n)1 1997 (n)1
Weight (kg) 2.06±0.11 (13) 2.40±0.15 (10)Total length (mm) 459.5±12.3 (13) 459.2±7.8 (10)Chest girth (mm) 277.7±7.2 (13) 269.5±9.9 (10)Neck girth (mm) 189.7±6.8 (13) 188.3±6.3 (10)Front pawlength (mm)
47.5±3.0 (13) 37.5±1.9 (10)
Front pawwidth (mm)
38.5±1.2 (13) 38.8±1.3 (10)
Hind pawlength (mm)
56.4±2.5 (13) 59.7±1.2 (10)
Hind pawwidth (mm)
35.1±1.6 (13) 37.4±1.6 (10)
Hair length (mm) 39.5+2.4 (13) 26.0±0.4 (10)Ear length (mm) 32.2+1.2 (13) 39.7±1.2 (10)
1 sample size

18
Table 6. Average measurements and ±SE of female cubs captured at den sites insouthern George Washington and Jefferson National Forests in March 1996 and 1997.
AverageMeasurement 1996 (n)1 1997 (n)1
Weight (kg) 1.67±0.13 (8) 2.24±0.09 (7)Total length (mm) 438.6±16.4 (7) 462.3±12.1 (7)Chest girth (mm) 251.6±11.0 (7) 274.7±3.6 (7)Neck girth (mm) 166.8±7.7 (7) 183.6±7.3 (7)Front pawlength (mm)
44.4±2.8 (7) 36.4±1.7 (7)
Front pawwidth (mm)
33.3±2.2 (7) 36.7±1.7 (7)
Hind pawlength (mm)
54.1±6.2 (7) 55.3±3.2 (7)
Hind pawwidth (mm)
35.7±2.5 (7) 34.7±1.2 (7)
Hair length (mm) 29.7±1.6 (7) 31.9±2.0 (7)Ear length (mm) 38.3±4.2 (7) 38.3±1.7 (7)
1 sample size

19
Table 7. Average measurements and ±SE of male and female cubs captured at den sitesin the southern George Washington and Jefferson Forests during March 1996 and 1997.
AverageMeasurement Males (n)1 Females (n)1 P-value2
Weight (kg) 2.21±0.09 (23) 1.94±0.11 (15) 0.069Total length (mm) 459.4±7.6 (23) 450.4±10.3 (14) 0.316Chest girth (mm) 274.1±5.8 (23) 263.1±6.4 (14) 0.136Neck girth (mm) 189.1±4.6 (23) 175.2±5.6 (14) 0.023Front pawlength (mm)
43.2±2.1 (23) 40.4±1.9 (14) 0.331
Front pawwidth (mm)
38.6±0.8 (23) 35.0±1.4 (14) 0.009
Hind pawlength (mm)
57.8±1.5 (23) 54.7±3.3 (14) 0.428
Hind pawwidth (mm)
36.1±1.1 (23) 35.2±1.3 (14) 0.561
1 sample size2 Analysis of covariance (covariate – cub age)

20
Table 8. Average measurements and ±SE of cubs at den sites in the southern GeorgeWashington and Jefferson National Forest in March 1996 and 1997.
AverageMeasurement 1996 (n)1 1997 (n)1 P-value2
Weight (kg) 1.91±0.09 (21) 2.33±0.10 (17) 0.002Total length (mm) 452.2±9.9 (20) 460.5±6.5 (17) 0.362Chest girth (mm) 268.6±6.5 (20) 271.6±5.9 (17) 0.569Neck girth (mm) 181.7±5.6 (20) 186.4±4.6 (17) 0.335Front pawlength (mm)
46.5±2.1 (20) 37.1±1.3 (17) 0.002
Front pawwidth (mm)
36.6±1.2 (20) 37.9±1.0 (17) 0.297
Hind pawlength (mm)
55.6±2.6 (20) 57.8±1.5 (17) 0.579
Hind pawwidth (mm)
35.3±1.3 (20) 36.3±1.1 (17) 0.503
1 sample size2 Analysis of covariance (covariate – cub age)

21
Discussion
Timing of EstrusTiming of estrus in the GWJNF was slightly later than in other populations. Most studiesreported a peak in the timing of estrus (breeding) during the first week of July (Alt 1989,Eiler 1981, Barber and Lindzey 1986). In this study, 4 of 9 nonlactating females,captured between 11 July and 30 July were in exhibited signs of estrus. However,trapping effort may be not be the same over all studies; therefore the dates that bears wereobserved in estrus may not be comparable between studies.
Timing of estrus in this study supports data from other bear populations in Virginia. Fiveof 10 females in the present study were observed in estrus during 11 July – 3 August(range 20 June – 21 August). Godfrey (1996) and DuBrock (1980) reported similar datesin northern GWJNF and SNP, respectively. A later and longer breeding season in theGWJNF may be influenced by localized food sources, nutritional condition of thefemales (Eiler et al. 1989, Godfrey 1996, Jonkel and Cowan 1971, Rogers 1987), a lowerage of reproduction, and the variability in dates of estrus for young females.
Age of PrimiparityAge of primiparity (x = 3.0) in the current study was numerically lower than many otherreported populations (Alt 1989, Eiler et al. 1989, Elowe and Dodge 1989, Kasworm andTheir 1994, Kolenosky 1990, Lindzey and Meslow 1977, McLaughlin et al. 1994, Rogers1987, Schwartz and Franzmann 1991). In addition, within Virginia, age of primiparity inthe present study was numerically lower than for nonexploited populations (Carney 1985,Hellgren 1988), but numerically similar to exploited populations (Godfrey 1996).
In the present study, 5 of 6 radio-marked 3-year old females gave birth. This wasnumerically similar to Pennsylvania, where more than 80% of females gave birth by age3 (Alt 1989). However, this was a much higher numerical proportion than otherpopulations. Godfrey (1996) and Clark (1991) reported that 66.7% of 3-year old femalesgave birth in exploited populations. In unexploited Virginia populations, fewer than 40%of females gave birth by age 3 (DuBrock 1980, Hellgren 1988, Kasbohm 1994). Fewerthan 33.3% of 3-year olds gave birth in Tennessee, Ontario, and Arkansas (Eiler 1981,Kolenosky 1990, Smith 1985).
In Minnesota, no females produced cubs unless they weighed at least 41 kg the precedingMarch or 67 kg on 1 October of the preceding year (Rogers 1977, Noyce and Garshelis1994). Beecham (1980) reported that females in Idaho did not reproduce until theyweighed at least 52 kg. If female bears in the southeastern United States have to reach aminimum weight to reproduce, it is much lower than western populations. I could notaccurately estimate a minimum weight for females producing cubs in the GWJNF. In thepresent study, the only female available to reproduce that was not known to produce cubswas a 3-year old female that had a summer weight of 53.5 kg. The minimum summerweight of a female known to produce cubs was 36.4 kg.

22
Minimum breeding age increases from east to west and south to north (DuBrock 1980).The lowest and highest reported minimum breeding ages were 1.5 in the southernGWJNF (present study) and Pennsylvania (Alt 1989) and 5.6 in Alaska (Miller 1987).Other populations (Alt 1989, Elowe 1987, Godfrey 1996, McLaughlin et al. 1994) nearthe same longitude increased as latitude increased from south to north. Minimumbreeding age for female bears near the same latitude typically increased as longitudeincreased (LeCount 1984, Miller 1987, Reynolds 1977, Rogers 1987) from east to west.Females in the Smoky Mountains of Tennessee were the only exception (x = 4.4). InTennessee, the high age of minimum breeding was attributed to extreme mast failure(Eiler 1981).
A high average weight (x = 44.9 kg in summer) and small sample sizes of 3-year oldfemales might have been the main factors for the low age of primiparity in this study. Nofemales were documented giving birth at age 4. One radio-collared female did not givebirth at age 3 and will produce her first litter at a later age. The reproductive status of 33-year old females was unknown because of early den emergence. It is unlikely that anyof these females had cubs. If this is true and these females produce their first litters atage 4, the average age of primiparity likely will rise to that reported by other studies inthe eastern United States.
Alt (1989), in Pennsylvania, reported one case of a 2-year old female producing cubs. Inthe present study, no radio-collared 2-year old females produced cubs. However, thereproductive tract of a non-collared 2-year old female contained 2 fetuses, indicating thatshe bred at 1.5 years of age. In addition, we captured one 1.5-year-old female in estrus.
Percent ReproducingSmall litter sizes, a prolonged interbirth interval, and delayed sexual maturity make itnecessary for the maximum number of females to reproduce to sustain population levels.Percentage of reproductive tracts containing corpora lutea (Hellgren 1988) and interbirthintervals have been used to index the percent of the population that reproduces each year(Carney 1985, Kasbohm 1994, Kasworm and Their 1994, McLaughlin et al. 1994,Schrage 1994)
Percent reproducing was numerically higher in this study than other exploitedpopulations of Virginia. Godfrey (1996) reported that 82.6% of available females in thenorthern GWJNF produced cubs. Twenty-one of 22 (95.4%) available females in thisstudy reproduced. Small geographic effects probably influenced the percent reproducingin the northern GWJNF. Godfrey (1996) reported that all females in the Elliot Knob areafailed to reproduce in 1996, possibly because of localized mast conditions. In the presentstudy, there were not any specific geographical areas that showed a lack of reproduction.
In Maine, 80% of available females reproduced at the Spectacle Pond study site duringgood mast years, but only 13% of available females reproduced during bad mast years(McLaughlin et al. 1994). The mast conditions in the southern GWJNF were fair to goodand good (VDGIF unpublished doc.) in 1995 and 1996, respectively. As length of the

23
present study increases, further insight will be gained on how mast conditions anddifferent food sources affect reproduction in the southern GWJNF.
Interbirth IntervalFemale black bears normally breed every 2 years unless there is poor mast production(Eiler et al. 1989, McLaughlin et al. 1994) or an entire litter is lost (Carney 1985). InTennessee, skips in the every-other-year breeding cycle were caused by extreme mastfailure (Eiler 1981). Females in the Spectale Pond region of Maine did not reproducebecause of a failure in the beechnut crop even if entire litter loss occurred in the spring(McLaughlin et al. 1994).
Interbirth interval in the southern GWJNF was numerically lower than reported in otherstudies (Alt 1989, PA; Eiler et. al. 1989, TN; Elowe and Dodge 1989, MA; Hellgren andVaughan 1989, VA and NC; Kasworm and Their 1994, MT; Kolenosky 1990, ON; Miller1994, AS; Noyce and Garshelis 1994, MN). Carney (1985) reported that age andexperience of the mother heavily influenced entire litter loss and cub survival. A smallsample size of females followed in consecutive winters and entire litter loss by first timemothers greatly influenced the interbirth interval in this study. Godfrey (1996) alsoattributed a low interbirth interval to litter loss by first time mothers. Extreme mastfailures did not occur during the present study. All (n = 3) the adult females >5 years oldin this study exhibited interbirth intervals of 2.0 years. As length of the study increasesand a greater number of mature females are followed for consecutive years the interbirthinterval likely will approach 2.0.
Litter SizeAverage litter size in this study (x = 2.2) was numerically smaller than for otherexploited populations in the eastern United States (x = 2.4-3.0; Alt 1989, Eiler et al.1989, Elowe 1987, Kraus et al. 1988, McLaughlin et al. 1994, Rogers 1987, Smith 1985).However, it was similar to other populations in Virginia (x = 2.0-2.3; Carney 1985,Godfrey 1996, Hellgren 1988). The numerically smaller average litter size wasinfluenced by the higher proportion of young (3 and 4 years) mothers.
Average litter sizes have been correlated with age (Alt 1989, Fuller 1993, Godfrey 1996,Kolenosky 1990) and weight of the female (Alt 1989, Kolenosky, 1990), but in thisstudy, age of female and litter size were not closely related. Young females (< 4 years) inthe southern GWJNF had a numerically higher average litter size (x = 1.7, n = 8) than
those in the northern GWJNF (x = 1.4, n = 16). The relationship between weight offemales in the southern GWJNF and litter size could not be evaluated because we wereunable to remove adult bears from tree dens to weigh them (Chapter 3).
Immobilizing bears in tree dens has been a problem with bear studies in the past. Studieshave reported litter sizes without knowing the litter size of female bears denning in trees(Eiler 1989). Females that used ground dens in the southern GWJNF (present study) hada larger average litter size (x = 2.5) than females in tree dens (x = 1.4). Godfrey (1996)reported that there was no difference in litter sizes or age and weight of females using

24
ground dens and tree dens in the northern GWJNF. A scarcity of large tree dens couldforce larger females to den on the ground, but enable smaller females to den in trees(Chapter 3). Some studies may overestimate average litter sizes if there is a correlationbetween litter size and den type, but only ground den information is reported.
Some studies have used reproductive tracts to estimate mean litter size (Collins 1973,Strickley 1961, Harlow 1961, Hellgren 1988), percent reproducing, percent available toreproduce, minimum breeding age (Collins 1973, Hellgren 1988), and interbirth intervals(Hellgren 1988). Collins (1973) noted that 16 of 48 reproductive tracts in North Carolinacontained placental scars. Three of 4 (75%) reproductive tracts in this study containedplacental scars and 1 contained fetuses and corpora lutea. Tsubota et al. (1990) reportedthat all female grizzly bears with new placental scars had produced cubs that year. In thepresent study, all of the females with new placental scars were marked females thatproduced cubs that year. However, the high proportion of females with new placentalscars is not a representative sample of the population. Two of the 3 females werenuisance bears that had been introduced to our study area and later died from carcollisions (Chapter 2). If they had not been wearing eartags, I probably would not havebeen contacted about their deaths. One unmarked female’s reproductive tract contained 2fetuses and 2 corpora lutea. Each uterine horn contained 1 fetus; however both corporalutea came from 1 ovary. Collins (1973) in North Carolina and Eiler (1981) in Tennesseenoted one instance each of egg migration between the horns of the uterus from 48 and 6reproductive tracts, respectively.
Cub Sex RatioSome studies have reported a higher proportion of males than females in black bear litters(Alt 1982, Fuller 1993, Noyce and Garshelis 1994, Samson and Hout 1995). However,most studies have reported that cub sex ratios did not differ from 1:1 (Carney 1985,Godfrey 1996, Hellgren 1988, McLaughlin et al. 1994, Miller 1994, Schwartz andFranzman 1991). Cub sex ratio in the southern GWJNF did not differ from 1:1.Inadequate sample sizes prohibited cub sex ratio testing between litter size, weight offemales, and age of mother. As the length of the study increases, sample sizes shouldprovide enough power to detect long-term differences in cub sex ratios.
Date of ParturitionFew studies have reported dates of parturition for black bears. Alt (1989) and Carney(1985) located dens in late December and early January and returned to listen for soundsof newborn cubs. Cubs were estimated to have been born (± 2 days for Alt and ±3 daysfor Carney) at the midpoint from the date cubs were not heard until first sounds ofnewborn cubs were heard. Godfrey (1996) developed regression equations of cubgrowth, using hair and ear length from cubs of captive bears in Virginia, to predict datesof parturition for bears in the GWJNF. In Pennsylvania, Alt (1989) used regression fromhair length of wild cubs with known dates of parturition to predict cub age.
In the present study, the estimated average date for parturition was 22 January (20January 1996 and 24 January 1997). This is numerically similar to other populations inthe GWJNF, but slightly earlier than the SNP. Godfrey (1996) reported average dates of

25
parturition for the northern GWJNF ranged from 22 January to 26 January. Averagedates of parturition for bears in SNP were 20 January, 5 February, and 2 February(Carney 1985).
In Pennsylvania, older females gave birth earlier than younger females (Alt 1989).Godfrey (1996) in the northern GWJNF and Carney (1985) in SNP both reported thatfemales > 5 years old and females < 4 years old gave birth during a similar time interval.Females > 5 years old, in the present study, appeared to give birth earlier (10 days) thanfemales < 4 years old; however the differences were not significant (P = 0.057). The SNPand northern GWJNF are closer geographically to each other than to the southernGWJNF. Localized food sources, condition of adult females, and small sample sizes ofdates of parturition for young females may be the reason that they appeared to have givenbirth later in the southern GWJNF, but not in the northern GWJNF and SNP.
Estimated date of parturition for female S-19 was 28 January 1996; however, cubs wereheard at her den site on 23 January 1996. This was the only known discrepancy betweenestimated date of parturition and when cubs were heard at the den sites. Variabilitysurrounding the regression equation is unknown for wild bears because the data used todevelop the equation is from captive bears at Virginia Tech. There should be littleobserver bias in the measurements used because hair length (Alt 1989) and ear length areeasy to measure. Hair length showed low variation, it was easy to measure, and growthappears less influenced by nutritional status (Alt 1989). Alt (1989) concluded that hairlength would be an excellent predicator of date of parturition when cubs are less than 50days. However, the accuracy in predicting parturition dates decreases after 50 daysbecause hair growth is more variable. All females, except bear S-92, provided estimatedlitter ages over 50 days. Incidentally, female S-92 provided the latest date of parturition,8 February. One person, with the exception of 1 litter, took all of the cub measurementsin the southern GWJNF; therefore observer bias in the southern GWJNF cubmeasurements should be minimal. Estimated dates of parturition (using regressionequation) should be tested with known parturition dates in the southern GWJNF to showevidence that the regression is correct for wild populations. A random selection of easilyaccessible dens of females available to reproduce could be located before 1 January.Observers could return to the dens every 4 days and listen for newborn cubs (Alt 1989).Regression equations could then be used to predict the estimated date of parturition and aSigned Rank test performed to tell if there is a difference between known parturitiondates and estimated parturition dates.
Cub Growth MeasurementsBears are generally uniform in size and weight at birth, but experience sexualdimorphism later in life. Alt (1989), in Pennsylvania, reported that weights of cubs didnot differ at birth, but differed in March. However, most of Pennsylvania’s cubs weremeasured before they were 50 days old and had a chance to show large variation. Males,in the present study, had a greater neck girth and front paw width and appeared to weighmore than females, but the differences were not significant (P = 0.069). Cubs weremeasured at an average of 62.1 and 58.3 days after birth in 1996 and 1997, respectively.
26
Sexual dimorphism was probably more pronounced in the southern GWJNF thanPennsylvania because of the cub’s ages.
Cub growth measurements are difficult to compare across studies because there isvariation in date of birth, litter sizes, nutritional condition of the female, and in the timethe cubs are handled. Cubs in the GWJNF (northern and southern) during 1996 wereborn and handled at approximately the same time. Cub measurements in the southernGWJNF were slightly higher than measurements in the northern GWJNF (Godfrey 1996).The mast conditions in both areas were “fair to good” (VDGIF unpublished doc.).
Cub weight is heavily influenced by the weight of the mother, litter order (first orsubsequent litter for the mother), and litter size (Alt 1989, Noyce and Garshelis 1994). InMinnesota, 40% of the variation in total litter weight and 28% of variation of individualcub weight was accounted for by the weight of the mother. However, no other cub bodymeasurements were different (Noyce and Garshelis 1994). Mast conditions in thesouthern GWJNF were “fair to good” and “good” in 1996 and 1997, respectively(VDGIF unpublished doc.). Average litter size was numerically larger in 1996 (x = 2.5)than 1997 (x = 1.9), but the two were not statistically different. However, cubs weighedmore in 1997 than 1996. Smaller litter size and a better mast crop in 1997 might explainwhy cubs weighed more that year.
Summary and Recommendations for Future StudyThe mean dates for females captured in estrus and estimate dates of parturition were 24July and 22 January, respectively. The average age of primiparity of radio-collaredfemales was 3.0 years; however, we documented fetuses present in a 2-year-oldnoncollared female’s reproductive tract. The mean litter size was 2.2 with a cub sex ratioof 1:1. The average interbirth interval was 1.6 years with 95.4% of available femalesproducing cubs.
Future work should focus on the reproductive rates over an extended period of time withrespect to food availability, female survival rates, and the reproductive input of youngfemales. We can not explain why females in the southern GWJNF breed at an unusuallyearly age and why a higher proportion of them bred than would be expected. However,natural foods are adequate and an unknown amount of supplemental food is providedalmost year round by hunters. Future reproductive research should focus on determiningthe relationship between supplemental feeding and reproductive performance within thepopulation.

27
Chapter 2: Survival
IntroductionBlack bears are at the top of the food chain throughout much of their range and humansare the only predators that have an appreciable impact on black bear populations. Majorcauses of mortality come from hunting (Carney 1985, Kasworm and Thier 1994,Wooding and Hardisky 1994), car collisions (Wooding and Brady 1987), andcannibalism (Mattson et al. 1992).
Hunting is the major cause of mortality in adult black bears (Carney 1985, Higgins 1997,Kasworm and Thier 1994, Wooding and Hardisky 1994). Due to their large homeranges, males are more likely to come into contact with humans and thus are moresusceptible to human induced mortality (Carney 1985). Kasworm and Thier (1994)found an annual survival rate of 73% for adult males and 79% for adult females inMontana. In Ontario, overall survival of adults ranged from 74%-83%, but the survivalrate of adult males in a nonhunted population was 90% (Kolenosky 1986). In SNP,Virginia, the annual survival rate of adult males was 57%-60%, and 90-95% for females(Kasbohm 1994). In Alaska, females were 2-3 times more likely to survive to adulthoodthan males (Schwartz and Franzmann 1992).
Subadults have higher mortality rates than adults (Elowe and Dodge 1989). Malesdisperse from their natal areas as yearlings or 2-year olds, whereas many females tend tostay in their natal areas (Schwartz and Franzmann 1992). Dispersal directly affectssurvival by putting bears at a higher risk of mortality from car collisions and cannibalismfrom larger bears (Schwartz and Franzmann 1992). Carney (1985) reported thatyearlings had the highest mortality rate (54%) of any age class. Female bears 3-6 yearsold and males 2-6 years old in Ontario were more vulnerable to hunting than older ageclasses (Kolenosky 1986).
Cub survival is one of the most important demographic parameters to black bearpopulation growth. Long interbirth intervals, low reproductive rates, and high parentalinvestment cause cub survival to become crucial to bear populations. Black bear cubmortality can be caused by cannibalism (Higgins 1997), predation (Higgins 1997),disease, hunting (LeCount 1987), interactions with humans (Elowe and Dodge 1989), andnatal den flooding (Alt 1984a). Social regulation (LeCount 1987) and habitat quality(Rogers 1976) may play an important role in cub survival. Miller (1994) reported a 41%mortality rate of black bear cubs in Alaska during their first year. In Virginia, theestimated annual survival rate of black bear cubs was 65-76% (Carney 1985, Carney andVaughan 1987, Higgins 1997, Kasbohm 1994, Hellgren 1988, Schrage 1994). Alt (1982)reported a survival rate of 72% for Pennsylvania. Arizona cubs experienced the lowestreported survival rate (52%, LeCount 1987).
The majority of cub deaths occur while they are in the den or shortly after emergencefrom dens. In Ontario, black bear cubs had a higher mortality rate in the first 5-8 monthsof life than later in the year (Kolenosky 1990). LeCount (1987) and Higgins (1997)

28
reported that most cub moralities occurred within 60 days of den emergence. Alt (1984a)reported cases of black bear cub moralities due to natal den flooding in Pennsylvania. InMassachusetts, 76% of cub mortality occurred between 1.5 and 5 months of age (Elowe1987).
Black bear cubs of first time mothers experience a higher mortality rate than cubs ofolder females. In Pennsylvania, 55% of litters of first time mothers experienced somemortality, but only 15% of experienced females’ litters had any mortality (Alt 1982).Similarly, Elowe (1987) found that 57% of first litters were lost, whereas only 7% ofsubsequent litters did not survive. In Maine, 29% and 6% of first and subsequent litterswere lost, respectively (McLaughlin et al. 1994). Carney (1985) attributed the deaths of2 cubs to the inexperience of first time mothers. Alt (1982) hypothesized that the highermortality rate of young mothers’ litters may result from inability and inexperience toraise and nourish cubs.
Total mortality of litters is common in black bears. In Arizona, (46%) 6 of 13 littersexperienced total mortality (LeCount 1987). Carney and Vaughan (1987) showed that30% of 10 litters in SNP, Virginia experienced total mortality by the end of their firstsummer. Alt (1982) reported that 73% of females that lost cubs lost their entire litters.
Mortality rates, with respect to litter size, seem to vary among studies. In Minnesota,larger litters had higher cub mortality (Rogers 1976). Pennsylvania’s black bears had ahigher cub mortality when litter size was small (Alt 1982).
MethodsBlack bears were captured in summers of 1995 and 1996 (see live trapping and handling).Each bear was marked with an uniquely numbered black ear tag and tattooed on theinside lip with a number corresponding to the ear tag. All female bears and a sample ofmale bears were fitted with radio collars (Wildlife Materials, Inc., Carbondale, IL. orAdvanced Telemetry Systems [ATS], Isanti, Mn) with a breakaway cotton spacer. Eachradio collar was equipped with a motion sensitive mortality sensor. Each WildlifeMaterials collar had a 30-minute delay and ATS collars had an 8-hour delay foractivating the mortality switch. We tested total capture sex ratios between years with a z-test for proportions. A Chi-square goodness of fit test was used to determine if the totalcapture sex ratio differed from 1:1. We tested the age at first capture between years andsexes with a z-test of proportions and a t-test, respectively.
Adult radio-collared bears were checked twice a week to determine age and sex specificsurvival rates. Aerial telemetry was used when the bears left the study area. Bears withcollars on mortality mode for more than 3 hours were located to determine the bear’sstatus (mortality or prematurely dropped collar).
We fitted a sample of black bear cubs with transmitters during 1996 and 1997 todetermine cub survival. Den sites of radio-collared female bears were located in January

29
and visited in March (Chapter 3). In 1996 and 1997, we fitted a sample of cubs(weighing at least 1.8 kg) with expandable radio collars (ATS). Also in 1997, a sample ofcubs was equipped with radio transmitters implanted subcutaneously (ATS; Moll et al.1997). Cubs were immobilized with a 3:1 mixture of ketamine hydrochloride andxylazine hydrochloride at dosage rate of 0.045 ml per kg. Cub transmitters wereequipped with a 4-hour motion sensitive sensor. Dr. David Moll (Virginia-MarylandRegional Veterinary School) preformed the surgery on all implanted cubs (Moll et al.1997). In 1996 and part of 1997, each cub was marked with a uniquely numbered greenear tag. We mointered each female and her cubs within 24 hours of immobilizing thesow and again at 72 hours to ensure the cubs were not abandoned.
Radio marked cubs were monitored every 2 days following den emergence until 1 Augustand twice a week from 1 August until den entrance. We investigated the site of each cubtransmitter observed on mortality within 24 hours if the cub was not with the sow. Bodycondition, position of carcass, method of feeding (if preyed upon), and injuries weredetermined for each dead cub. All remains were collected and returned to Virginia Techfor further examination.
Total litter loss and minimal cub survival was determined by following females with cubsin consecutive years. Females producing cubs in consecutive years were assumed to haveexperienced total litter loss.
A direct harvest rate was calculated for bears caught and marked in the summer trappingseason and harvested in the next fall hunting season. We tested for differences in harvestrates between sexes with a Chi-square test. To account for bears moving outside thestudy area, the number of bears available for harvest was reduced by the proportion ofmarked bears killed outside the study area. We did not document any marked femalesbeing harvested outside of the study area. Differences in proportion of bears killed byhunting method were tested with a Chi-square test. In addition, we tested the differencesin ages of male bears harvested by deer hunters versus hound hunters with a t-test.
Survival rates for radio collared females were calculated using the Kaplan-Meierstaggered entry design (Pollock et al. 1989). Yearly survival estimates were calculatedfor adult females (> 4 years old) and juvenile females (1 to 4 years old) from 1 June toMay 31. Bears entered the survival calculations following a 7-day conditioning period toallow for any research-related bias. Bears that prematurely dropped their collars werecensored from analysis at the midpoint of when the collar was last heard in active modeand first day it was heard on mortality mode (Higgins 1997).
Annual male survival rates were calculated using MARK. Due to the bias associatedwith radio collars and visible eartags, only noncollared males marked with black eartagswere included in analysis. Yearly survival estimates were produced with programMARK (Burnham 1993). This program accounts for live recaptures and dead recoveries.Maximum and minimal survival estimates were calculated for each age class. All bearswith an unknown fate were assumed to have lived through the year for calculated

30
maximum survival estimates and assumed to have died in the year for calculated minimalsurvival estimates.
Variance and 95% confidence intervals were calculated for each survival estimate. Formale bears, an approximate chi-square test statistic was used to compare differentsurvival estimates. Annual survival rates of females were compared with a Z statistic(Pollock et al. 1989, Schwartz and Franzmann 1991). For female bears, survivalfunctions were compared among different age classes with a log rank and approximatechi-square statistic.
Results
Age structureNinety-three bears (65 M, 28 F) were captured 141 times. We equipped 34 bears (6 M,28 F) with radio collars. The average age of males (2 males were not aged) captured was2.7 (SE = 0.43, n = 39) and 2.1 (SE = 0.33, n = 24) in 1995 and 1996, respectively (t =0.865, P = 0.390; Figure 4). The average of females was 4.5 (SE = 0.85, n = 19) and 4.0(SE = 1.33, n = 9) in 1995 and 1996, respectively (t = 0.343, P = 0.735). The average ageof females (x = 4.4, SE = 0.71, n = 28) was greater (t = 2.950, P = 0.017) than males (x
= 2.5, SE = 0.30, n = 63). The capture sex ratios were 2.1M : 1F (50 males, 24 females)and 1.6M : 1F (41 males, 26 females) in 1995 and 1996, respectively (Z = 0.790, P =0.429). The total capture sex ratio of 1.8 M : 1 F (91 males, 50 females) differed (χ2 =11.922, P = 0.001) from 1:1.
Adult MortalityDuring 1995 and 1996, 42 (36M, 6F) of 92 marked bears were known to have died (Table9). Of the 36 marked males dying, 29 (80.5%) were harvested, 2 bears (5.5%) werekilled by car collisions, 2 (5.5%) were poached, 1 (2.8%) died from euthanasia, and 2(5.5%) died of research related moralities. Of the 6 marked females dying, 2 wereharvested, 2 were killed by car collisions, and 2 died of research related mortalities. Fourof the marked bears were equipped with radio collars; two (1M: 1F) died from carcollisions, 1 female from handling, and 1 male from hunting.
We documented 2 illegal kills and 1 wounding loss of juvenile male bears during thisstudy. In mid-November 1995, the pelt of a 2-year old male was recovered from a trashbin by game wardens and VDGIF personnel. The ear tags had been removed, but thebear was identified by his tattoo. The bear was poached during the first week ofmuzzleloader season for deer. In mid-January 1997, VDGIF personnel recovered thecarcass of a 3-year old male. The bear had been shot on posted private property. Onefront paw from the bear had been removed, but the bear was identified by his ear tags.Due to mortal injuries, 1 juvenile male bear captured by VDGIF on a nuisance complaint

31
died from euthanasia under the advice of the Virginia-Maryland Regional VeterinarySchool. The bear had been shot in the front leg and the bone was completely shattered.
Three (1M: 1F) of 4 bears dying from car collisions were bears moved to our study areaafter being captured on nuisance complaints. Both (n = 2) harvested females prematurelydropped their collars prior to hunting season. Two females died during den season due toresearch related moralities. One female, had a tight collar (cub collar did not expand) anddied while being immobilized. We suspect the second female died from suffocation afterbeing immobilized at Virginia Tech’s bear research facility.
Harvest RateThirty-one marked (29M, 2F) bears were reported harvested in 1995 and 1996. Harvestrates for marked males were 36.1% and 45.5% in 1995 and 1996, respectively (χ2 =0.126, P = 0.723, df = 1). Zero percent and 5.9% of marked females were harvested in1995 and 1996, respectively (χ2= 1.029, P = 0.310,df = 1). Males were harvested at agreater rate (χ2 = 10.065, P = 0.002, df = 1) than females. Three male bears wereharvested by bowhunters, deer hunters harvested 11 males, and hunters using dogsharvested 15 males and 2 females. Bowhunters harvested less (χ2 = 9.143, P = 0.002, df= 1) males than dog hunters, but a similar proportion as deer hunters (χ2 = 3.007, P =0.083, df = 1). Harvest rates between deer hunters and hunters using dogs did not differ(χ2 = 2.098, P = 0.147, df = 1). Age structure of harvested male bears did not differ (t =1.064, P = 0.299) between hunters using dogs and deer hunters (Figure 5). Age structurewas not tested between bears harvested by bowhunters and gun hunters or dog huntersbecause of small sample size. Mean age of captured and harvested males did not differ (t= 0.363, P = 0.718). Females were harvested at the same rate by bowhunters, deerhunters, and dog hunters (χ2 = 0.986, P = 0.321, df = 2).
Female SurvivalAnnual adult and juvenile survival rates for radio collared females were 100% (SE =0.00, n = 1-19, 95% CI = 100.0 % - 100.0%) and 93.3% (SE = 0.06, n = 1-14, CI = 80.7% - 100.0%), respectively. Survival of juvenile females was lower in 1995 (87.5%) thanin 1996 (100.0%; Z = 0.875, P > 0.05); however, survival of adult females did not differbetween 1995 and 1996 (Z = 0.00, P > 0.05). Annual survival rates for adult females wasnot higher than the annual survival rate of juvenile females (χ2 = 1.25, P > 0.05).
Male SurvivalMaximum and minimum annual survival rates for noncollared ear tagged males were51.6% (SE = 0.089, n = 31, 95% CI = 34.5% - 68.3%) and 32.2% (SE = 0.083, n = 32,95% CI = 18.3% - 50.2%), respectively in 1995 and 55.9% (SE = 0.085, n = 34, 95% CI= 39.2% - 71.4%) and 12.5% (SE = 0.068, n = 34, 95% CI = 4.1% - 32.3%), respectivelyin 1996 (Table 10). Annual survival estimates produced by MARK were 34.6% (SE =0.955, n = 31, 95% CI = 19.0% - 54.9%) and 33.8% (SE = 370.271, n = 34, 95% CI =0.0% - 100.0%) in 1995 and 1996, respectively. Maximum annual juvenile male survivalwas 52.0% and 51.7% in 1995 and 1996, respectively (χ2 = 0.074, P = 0.785).Inadequate sample sizes prevented us from testing differences between adult male andjuvenile survival.

32
Table 9. Mortality causes of black bears in the southern George Washington and Jefferson National Forests, Virginia 1 June 1995 –31 May 1997.
Number of bearsMales Females
Collared Noncollared Collared NoncollaredCause of death 95-96 96-97 95-96 96-97 95-96 96-97 95-96 96-97 TotalBear hunting with dogs 0 0 8 7 0 0 0 2 17Bear hunting without dogs 1 0 2 8 0 0 0 0 11Bear hunting with archery 0 0 2 1 0 0 0 0 3Vehicle collisions 1 0 1 0 1 0 0 1 4Poached 0 0 1 1 0 0 0 0 2Research 0 0 1 1 0 1 0 1 4Euthanasia 0 0 1 0 0 0 0 0 1Unknown 0 0 0 0 0 0 0 0 0
Total 2 0 16 18 1 1 0 4 42

33
Figure 4. Age structure of male and female black bears captured in 1995 and 1996 on the George Washington Jefferson National Forests, Virginia.
0
5
10
15
20
25
0.5 1 2 3 4 5 6 7 8 9 10 11 12 13 14 15 16
Age (Yrs.)
Num
ber
of B
ears
Male
Female

34
Figure 5. Age structure by method of harvest for male black bears on the southern George Washington Jefferson National Forests, Virginia 1995 and 1996.
0
1
2
3
4
5
6
7
8
0.5 1 2 3 4 Unknown
AGE
Num
ber
of B
ears
Doghunters
Deerhunters
Bowhunters

35
Table 10. Minimum, maximum, and program MARK survival estimates from male bears marked with black ear tags in the southernGeorge Washington Jefferson National Forest, Virginias, 1 June 1995 to 31 May 1997.
MINIMUM SURVIVAL EST. 1 MARK SURVIVAL EST.2 MAXIMUM SURVIVAL EST. 3
CLASS S(x) SE LOWER UPPER S(x) SE LOWER UPPER S(x) SE LOWER UPPERJUV. MALE 95 36.0% 0.096 19.9% 56.0% 36.0% 0.096 19.9% 56.0% 52.0% 0.099 33.1% 70.4%AD. MALE 95 16.7% 0.152 2.3% 63.1% 18.6% 213.877 0.0% 100.0% 50.0% 0.204 16.8% 83.2%MALE TOT 95 32.2% 0.083 18.3% 50.2% 34.6% 0.955 19.0% 54.9% 51.6% 0.089 34.5% 68.3%JUV. MALE 96 6.9% 0.047 1.7% 23.8% 33.7% 468.001 0.0% 100.0% 51.7% 0.093 34.1% 68.9%AD. MALE 96 20.0% 0.179 2.7% 69.1% 52.4% 0.000 52.4% 52.4% 80.0% 0.178 30.9% 97.3%MALE TOT 96 12.5% 0.068 4.1% 32.3% 33.8% 370.271 0.0% 100.0% 55.9% 0.085 39.2% 71.4%1Minimum survival using Program MARK; with unknown individuals assumed to have died2Survival estimates from Program MARK (Burhman 1993)3Maximum survival using Program Mark; with unknown individuals assumed to have lived

36
Table 11. Fate of black bear cubs equipped with radio transmitters in the southernGeorge Washington Jefferson National Forests, Virginia 1996 and 1997.
Cub Id Sow Id Transmitter type Status Days equipped Mortality causeS-60 S-20 COLLAR DIED 183 UNKNOWNS-61 S-20 COLLAR SURVIVED TO DEN1 350 RESEARCHS-68 S-5 COLLAR DIED 259 POACHEDS-72 S-30 COLLAR DIED 123 PREDATIONS-73 S-25 COLLAR SURVIVED TO DEN2 335 NAS-76 S-47 COLLAR DROPPED 3 NAS-79 SN-4 COLLAR DROPPED 103 NAS-80 SN-4 COLLAR DROPPED 47 NAS-114 S-39 COLLAR DROPPED 2 NAS-115 S-39 COLLAR DROPPED 1 NAS-117 S-30 IMPLANT SURVIVED TO DEN 257+ NAS-118 S-30 IMPLANT SURVIVED TO DEN 257+ NAS-121 S-41 COLLAR DROPPED 0 NAS-123 S-41 COLLAR DROPPED 13 NAS-124 S-94 COLLAR REMOVED 5 NAS-125 S-99 IMPLANT SURVIVED TO DEN 250+ NAS-126 S-99 IMPLANT SURVIVED TO DEN 250+ NAS-127 S-82 COLLAR DROPPED 10 NAS-128 S-2 IMPLANT DROPPED 5 NAS-129 S-2 IMPLANT DROPPED 11 NA1Collar did not expand 2Collar expanded

37
Cub TransmittersIn the winters of 1996 and 1997, we equipped 14 cubs with expandable radio collars and4 with transmitters implanted subcutaneously (Table 11; Moll et al. 1997). In addition,we equipped 2 cubs with subcutaneous implants in July 1997 and 1 cub in May 1996.Eight cubs dropped their collars prematurely, 2 implants came out of the cubs, 1 collarwas removed from a cub that was abandoned in the den season, 3 cubs died, and 6 cubslived until they were at least 1 year old. We fostered the abandoned cub to an adultfemale at Virginia Tech’s bear pens. Six of 8 cubs that dropped their collars prematurelydid so within 150 meters of their den sites. One of 2 expandable collars checked in theden did not expand; it had severely grown into the bear’s neck.
Cub MortalityThree of 14 cubs equipped with transmitters, which were not censored immediately afterden emergence, died in 1996 and 1997. One cub was killed by a mammalian predator on29 May, 1 cub died from unknown causes on 8 July, and 1 cub died from poaching on 12October. In addition, 1 ear tagged, non-collared cub died from a car collision on 17 May.Age of mortality ranged from 119 – 259 days of age (Table 12).
Cub SurvivalCub survival was lower (Z = 2.59, P = 0.0048) in 1996 (46.3%, n = 1-8, 95% CI = 2.4% -90.1%) than 1997 (100.0%, n = 1-6, 95% CI = 100% - 100%). We combined cubsurvival between years because of small sample sizes. Cub survival in the southernGWJNF was 70.1% (n = 1-14, 95% CI = 41.3% -98.9%).
Five of 9 (55.5%) females lost at least 1 cub in 1996 and maximum cub survival was70.8% (Table 13). In 1997, as of 10 December, no females were known to have lost 1cub. Two of three first time mothers in 1996 experienced total litter loss. However, twoadult females (> 4 years old), producing cubs in 1996, had an 83.3% cub survival.

38
Table 12. Estimated age of mortality for black bear cubs in the southern George Washington National Forests, Virginia 1996.
Cub Id Sow Id Estimated Date of Birth Mortality Cause Mortality Date Age at DeathS-60 S-20 1-7-96 Unknown 7-8-96 183 DaysS-68 S-5 1-27-96 Poached 10-12-96 259 DaysS-72 S-30 1-27-96 Predator 5-29-96 123 DaysS-781 SN-4 1-19-96 Vehicle collision 5-17-96 119 Days1Bear was not equipped with a radio transmitter

39
Table 13. Maximum survival of black bear cubs in the southern George Washington and Jefferson National Forests, Virginia 1996.
Sow Id Sow Age # of Cubs Sow Status in 1997 # of Cubs Known Dead Maximum SurvivalS-2 3 2 (2 unknown) Cubs 2 males 0.0%S-5 7 2 (1M, 1F) Dropped Collar 1 male (collared) 50.0%S-11 7 1 (1M, 0F)* Dropped CollarS-19 6 4 (1M, 3F) Harvested Unknown 100.0%S-20 7 4 (2M, 2F) Yearlings 1 male (collared) 75.0%S-25 17 2 (1M, 1F) Yearlings 0 100.0%S-29 4 2 (2 unknown) Harvested Unknown 100.0%S-30 3 2 (2M, 0F) Cubs 2 males (1 collared) 0.0%S-47 5 3 (2M, 1F) Dropped Collar Unknown 100.0%SN-4 5 3 (3M, 0F) Car Collision 1 male (not collared) 66.7%Total/Mean 6.4 25 (13M, 8F, 4 unknown) 7 70.8%
*Cub abandoned at den site and transported to Virginia Tech bear pens

40
Discussion
Age StructureDespite the facts that the sex ratio at birth was 1:1, and male bears had a higher mortalityrate than female bears, age structure of bears captured was skewed toward juvenile males.Larger home ranges (Carney 1985), dispersal from natal home ranges (Schwartz andFranzmann 1992), and male curiosity make males more susceptible to capture. Inaddition, our trapping season coincided with breeding season, when adult males increasetheir movements to find receptive females. Trapping also occurs during family breakup,when juveniles are first dispersing from their natal home range.
The average age of males at first capture in this study is indicative of other exploitedpopulations (x = 2.7 years; Higgins 1997), but was numerically lower than the
nonexploited population of the GDSNWR (x = 4.3 years; Hellgren 1988). The average
age of males in 1995 (x = 2.7 years) was numerically higher than in 1996 (x = 2.1years), but the difference was not statistically significant. The numerically higher age ofmales in 1995 was reflective of the first year of trapping in the southern GWJNF, becausefewer adult males were available for original capture in 1996. Because young malesimmigrate and emigrate into and from the study area, and because young males appear tobe more susceptible to capture than any other age and sex group the average age of malesat first capture is likely to remain around 2 years.
The average age of females at first capture (x = 4.4 years) was numerically similar to
other nonexploited (x = 4.0 – 4.3 years; Hellgren 1988, Kasbohm 1994) and exploited
populations (x = 4.9 years; Godfrey 1996) of Virginia. The average age of females was
numerically higher in 1995 (x = 4.5 years) than in 1996 (x = 4.0 years), but they did notdiffer statistically. As the length of the study increases, the average age of females at firstcapture may decrease because a larger proportion of adult females will be marked, youngfemales are less likely to immigrate into the study area, and female survival is high.Thus, there likely will be fewer adult females not previously captured. The age structurein the southern GWJNF shows evidence that males are killed at a younger age thanfemales.
To assure an unbiased marking of the population, changes could be made in trappingmethods. Because most trapping is done from roads in the same areas in consecutiveyears, bears living in home ranges with roads are more likely to be caught. Therefore,bias could be associated with mark/recapture population estimates, survival estimates(hunters are more likely to kill bears near roads), and age structures, if bears living awayfrom roads have a greater survival. However, in the present study there are few areas thatare inaccessible to vehicles and there is probably little bias associated with trapping in thesouthern GWJNF (unpubl. data). Trails through wilderness areas and areas inaccessibleto vehicles could be trapped to improve a random marking of the population.

41
Adult and Juvenile MortalityAll documented moralities (100%) were human related, closely matching that reported inthe northern GWJNF (81%; Higgins 1997), Alaska (88-100%; Schwartz and Franzmann1991), Arizona (83%; LeCount 1987), Minnesota (> 90%; Rogers 1976), and Tennessee(>95%; Smith 1985). Hunting (80.5%) was the major source of mortality in male bears,with harvest rates skewed to young (< 2) male bears. Higgins (1997), in the northernGWJNF, also reported hunting as the major source of mortality. In Virginia, the majorcauses of mortality in nonexploited populations were cannibalism, vehicle collisions,poaching, legal kills (outside of study area), and damage complaint kills (Hellgren 1988).
In the present study, 4 radio-collared bears (2M: 2F) died from vehicle collisions. Three(1M: 2F) of 4 were nuisance bears that were relocated in our study area. Comly (1993)reported vehicle collisions as a major mortality cause of relocated, nuisance bears. Inaddition, all 4 were killed during hunting season (1 in October, 1 in November, 2 inDecember). One male, hit and killed by a vehicle on 24 December, moved more than 40miles in less than 24 hours, indicating that hunting dogs might have pursued him.
Two juvenile male bears were killed illegally and 1 juvenile male bear died fromeuthanasia after sustaining mortal injuries from a bullet. In other Virginia populations,Kasbohm (1994), Hellgren (1988), and Higgins (1997) reported 3 illegal kills in the SNP,4 in the GDSNWR, and 0 in the northern GWJNF, respectively. We do not have anadequate assessment of the percentage of illegal kills or wounding loss in the population.
Harvest RateMarked males (mostly ear-tagged) were harvested at a higher rate than marked females(mostly radio-collared). Harvest rates did not differ between deer hunters and bearhunters using dogs; however, bear hunters using dogs harvested a numerically higherproportion of bears.
Hunting as currently practiced in the southern GWJNF is not likely to have a large impacton the female bear population. If the harvest rate of females reported in the present studyis accurate, only 2 of 29 (7.1%) tagged (collared and not collared) females wereharvested, this should not be large enough proportion to have an effect on the totalpopulation. Many pregnant females reduce their movements prior to bear hunting seasonwith dogs (Godfrey 1996); therefore they are less likely to be located by hunting dogs. Inaddition, many juvenile females (1 and 2 years old; Appendix 1) are below, or onlyslightly above, the legal harvest weight limit, making them less susceptible to hunting.Some hunters apparently select against harvesting female bears, and most of them knewthat the majority of collared bears were females (K. Higgins unpubl. doc.); thus, they mayavoid harvesting a collared bear when given the opportunity. The true association withcollar bias relating to hunting rates was unknown.
In the southern GWJNF, male harvest rates are numerically higher than other exploitedbear populations (Higgins 1997, Kasworm and Their 1994). In the present study, greaterthan 40% of the marked bears were harvested yearly. The long term effects of harvesting

42
such a high proportion of males is unknown at this time. Population modeling will bedone by the current Ph D. student. However, if the reproductive rates remain high andthe proportion of available females that reproduces remains constant, then there likelywill be enough males to sustain high harvest rates.
Female SurvivalThe survival rates of females were numerically similar to other populations (Beck 1991,Doan-Crider and Hellgren 1996, Elowe and Dodge 1989, Kasworm and Their 1994,LeCount 1982, Schwartz and Franzman 1991, Waddel 1984). In Virginia, adult femalesurvival (100%) was numerically similar to an exploited population in the northernGWJNF (95%; Higgins 1997), but only slightly higher than unexploited populations inthe SNP (92%; Carney 1985) and GDSNWR (87%; Hellgren 1988; Table 14). Inaddition, juvenile female survival rates were numerically similar in the southern (88%;present study) and northern (90%; Higgins 1997) GWJNF. The reported adult femalesurvival rates may be numerically lower in the SNP (Carney 1985) and GDSNWR(Hellgren 1988) because in those studies all age classes of females were grouped togetherfor survival analysis.
In the present study, reported survival rates of females may not accurately reflect the truesurvival for the population. All females captured in this study were equipped with a radiocollar to obtain reproductive information. Some hunters (especially those using hounds)apparently select against harvesting female bears (per. conversations with hunters). Weworked closely with the houndsmen that hunted our study area (Higgins unpubl. doc.),and most of them knew that the majority of collared bears were females; thus, they mayavoid harvesting a collared bear when given the opportunity.
To accurately estimate the female survival rate in the southern GWJNF, an unbiasedharvest rate must be calculated. Only 2 marked females were harvested in the southernGWJNF and both had prematurely dropped their radio transmitters. In addition, bothhunters harvesting the females said they would not have harvested them if they hadknown they were females (pers. communications with the hunters). Our sample size ofear tagged but noncollared females was inadequate to test for differences in survival ratesof collared females versus noncollared females. As the study lengthens, a larger sampleof females marked only with black ear tags will be needed if collar bias is to be assessed.Subcutaneous implants (Moll et al.1997) could be used to obtain both survival andreproductive information.
Male SurvivalOnly bears marked with black ear tags were used to calculate male survival rates; thusbias from visible marks was minimized. Some hunters revealed (per. commun.) that theyunknowingly harvested marked bears after looking for, but not discovering the tags.Fifty–six (34 of 60) percent of males marked only with black ear tags were reported dead,suggesting a high reporting rate.
Maximum survival rates for adult (64%; present study; 59%; Carney 1985; 59%;Hellgren 1988; 50%; Kasbohm 1994) and juvenile (52%; present study; 50%; Higgins

43
Table 14. Reported survival rates of black bears in Shenandoah National Park (SNP),Great Dismal Swamp National Wildlife Refuge (GDSNWR), and the George WashingtonJefferson National Forests (GWJNF), Virginia.
Sex and Age Class Survival Area Status CitationAdult Female 100 % Southern GWJNF Exploited Present Study
95 % Northern GWJNF Exploited Higgins 199792 % SNP Unexploited Carney 1985
89 – 94 % SNP Unexploited Kasbohm 199487% GDSNWR Unexploited Hellgren 1988
Juvenile Female 94 % Southern GWJNF Exploited Present Study90 % Northern GWJNF Exploited Higgins 1997
Adult Male 64 % Southern GWJNF Exploited Present Study100 % Northern GWJNF Exploited Higgins 199759 % SNP Unexploited Carney 198550 % SNP Unexploited Kasbohm 199459 % GDSNWR Unexploited Hellgren 1988
Juvenile Male 52 % Southern GWJNF Exploited Present Study50 % Northern GWJNF Exploited Higgins 1997100 % GDSNWR Unexploited Hellgren 1988
Cub 73 % Southern GWJNF Exploited Present Study64 % Northern GWJNF Exploited Higgins 199773 % SNP Unexploited Carney 198576 % GDSNWR Unexploited Hellgren 1988

44
1997) males were numerically similar to survival rates of male bears in other Virginiapopulations. However, adults in the northern GWJNF (100%; Higgins 1997) andjuveniles in the GDSNWR (100%; Hellgren 1988) had a higher survival rate than bears inthe present study. In the present study, juvenile male survival was numerically lowerthan unexploited populations in Mexico (100%; Doan-Crider and Hellgren 1996) andColorado (76%; Beck 1991), but numerically higher than an exploited population inMassachusetts (25%; Elowe and Dodge 1989). Other survival rates for juvenile males inArizona (77% - 93%; LeCount 1982, Waddel 1984) and Alaska (38 – 70%; Schwartz andFranzmann 1991) varied among exploited populations. In Virginia, most mortalities ofmale bears were human caused (Higgins 1997, Hellgren 1988, Kasbohm 1994).
The difference between minimum and maximum survival estimates is the percentage ofanimals with unknown fates; i.e. natural mortality, bears immigrating from the study areaor not recaptured, illegally killed, or wounding loss. As the length of the study increases,the gap between the minimum and maximum survival estimates should narrow. Whenminimum survival ceases to increase, the difference between the 2 estimates could beused as an index of natural moralities, illegally killed, and wounding loss in thepopulation. The range in the minimum and maximum survival rates for juvenile maleswas numerically greater in 1996 - 1997 (6.9% - 51.7%) than in 1995 – 1996 (36.0% -52.0%); however, we had a greater opportunity to account for, recapture, or harvest theanimals tagged in 1995. The maximum juvenile male survival estimates did not differbetween years, indicating that this might be an accurate reflection of the true maximumsurvival of the population.
Many bear studies concentrate on the female segment of the population; thus low samplesizes of males equipped with radio transmitters prevent many studies from makingaccurate estimates of male survival. Juvenile males are difficult to equip with radio-collars because they grow rapidly, and adults’ necks are too large to collar. In addition,bears are generally trapped in the summer, but may double their weight in the fall,making tight collars a problem (present study).
Survival estimates of individuals tagged with black ear tags may accurately reflect thetrue mortality from hunting. However, a large random proportion of the population mustbe marked to accurately estimate the percentage of bears dying from illegal kills,wounding loss, and natural mortalities. To accurately reflect the true survival rate of thepopulation, the mark (transmitter or ear tag) must not affect the survival of the individual(White and Garrott 1990). Thus, if the mark has an effect on its survival, hunters orpoachers must not be able to distinguish that the animal is marked in any manner. Arandom sample of males could be equipped with subcutaneous implants (Moll et al.1997) to determine if natural mortality, poaching, or wounding loss has an impact on thepopulation in the southern GWJNF. If natural mortality, poaching, or wounding loss donot have a significant impact on the GWJNF, and tag returns are high, then the truesurvival of the population is close to the maximum survival of individuals with black eartags.

45
Cub TransmittersTo estimate cub survival, we equipped 14 and 6 cubs with expandable radio collars(Higgins 1997) and subcutaneous implants (Moll et al. 1997), respectively. The collarswere largely ineffective, because we lacked experience in equipping cubs withexpandable collars. I put the majority of expandable collars on cubs in the southweststudy area.
Nine of 14 cubs dropped their collars early, 1 collar did not expand, 3 cubs died duringthe year, and 1 collar had expanded properly when checked in its den. Higgins (1997)noted that without a standardized amount of torque to tighten the bolts to the collar, thecub collar might drop prematurely or not expand. To date, we have been unable tocalculate the standardized amount of torque. In addition, weather conditions appeared tohave an effect on expandable cub collars. Some of the collars' bolts rusted, preventingthe collar from expanding, whereas the material in some collars expanded (or shrunk)making the collar ineffective. To make the collar effective, all of the hardware must betotally rust resistant, collar material must not shrink or expand, and the tightness of thecollar must be standardized.
Four of 6 transmitters implanted subcutaneously during March 1997 - July 1997 werestill working on 10 December 1997; however 2 implants were dropped prematurely.Cubs may prematurely drop their implants because of sibling or maternal behavior, sizeof the implant, or physiological rejection (pers. obs.).
Cub MortalityMost cub morality is reported to occur between 1 and 5 months of age (Doan-Crider andHellgren 1996, Elowe and Dodge 1989, Higgins 1997, LeCount 1987); however, in thepresent study, cub moralities ranged from 4-9 months of age. LeCount (1987) noted thatcubs were more vulnerable to predators shortly after den emergence. In the presentstudy, the only cub known to be killed by a predator was killed within 1.5 months of denemergence. Cubs, separated from their mothers before late summer, may not haveenough experience to survive their first year. I suspect that one cub, which died ofunknown causes in July, died of starvation after being separated from his mother. Humanrelated mortality in the present study accounted for 50% of the total cub mortalities.
Cub SurvivalCub survival is one of the most important, but least understood parameters of black bearbiology. Small litter sizes and delayed sexual maturity require high cub survival rates tomaintain a stable or increasing bear populations. In the past, researchers have estimatedcub survival by counting the number of cubs in a female’s den and then observing howmany yearlings den with her the next year (Carney 1985). However, this mayunderestimate cub survival because yearlings may den separately from their mothers(Higgins 1997). To accurately estimate cub survival, cubs must be equipped with radiotransmitters.
In Virginia, cub survival in the southern GWJNF (70%) was numerically similar topopulations in the SNP (73%; Kasbohm 1994), GDSNWR (76%; Hellgren 1988), and the

46
northern GWJNF (65%; Higgins 1997). However, it was numerically higher than cubsurvival in Massachusetts (59%; Elowe and Dodge 1989), Ontario (46%; Strathearn et al.1984), and Arizona (52%; LeCount 1987) and numerically lower than cub survival inMexico (81%; Doan-Crider and Hellgren 1996), New York (80%; Simek 1995), andAlaska (74% - 91%; Schwartz and Franzmann 1991). Differing methods of estimationand small sample sizes make it difficult to compare cub survival across different regions.However, even with different methods, all estimations of cub survival in Virginia werenumerically similar.
Likely young mothers have a lower cub survival due to inexperience and inability tonourish cubs (Alt 1982, Elowe and Dodge 1989). In the present study, 2 of 3 youngmothers experienced total litter loss. Experience gained as a 3-year old mother, even ifthe entire litter is lost, could help prepare for subsequent litters. Three-year old mothersS-30 and S-2 experienced total litter loss in 1996; however they produced 2 and 3 cubs,respectively in 1997. Female S-2’s cubs were observed in late July, indicating that theyprobably lived through their first year. In addition, female S-30’s cubs were both radio-marked and were alive on 10 December 1997.
Summary and Recommendations for Future StudyThe average age of male and females at first capture was 2.5 and 4.4 years, respectively.Yearly harvest and maximum survival rates for males ranged from 36%-45% and 52%-56%, respectively. Yearly harvest and survival rates ranged from 0%-6% and 88-100%,respectively for females. In the southern GWJNF, the annual cub survival was 70%.
To accurately estimate survival in the southern GWJNF, bears marked only with blackear tags and bears equipped with radio transmitters should be used in the survivalestimates. Unbiased radio transmitter data, from subcutaneous implants, could becombined with data from bears marked only with black ear tags to increase sample sizesand more accurately assess the survival of both male and female bears. As the studylengthens, we should know what, if any, causes of mortality have a detrimental affect onthe male black bear population of the southern GWJNF.
By continuing to equip cubs with radio transmitters we should be able to estimate theeffects of mortality causes and the timing of mortality for black bear cubs. In addition, alarger sample of cubs from young mothers (3 and 4 years old) should be equipped withtransmitters to assess the reproductive contribution of young mothers to the population.Also, a transmitter should be designed so that the cubs may be equipped randomly (i.e.without regard to size and weight). In the present study, no cubs weighing less than 1.8kg were equipped with a transmitter. If heavier cubs are more likely to survive, we mayhave overestimated cub survival.

47
Chapter 3: Denning Ecology
IntroductionBlack bears have adapted to decreased food availability and severe winter climaticconditions by denning (Johnson and Pelton 1980). The metabolic state of hibernation andenergy-conserving adaptations help bears to survive hard winters (Hellgren and Vaughan1989, Nelson et al. 1983). Types of dens, time of den entrance and emergence, length oftime spent in den, and den availability differ within the black bear’s range. Manville(1987) showed that male black bears in Michigan den an average of 1.26 km and females0.55 km away from human disturbance. In some areas, denning makes bears lessvulnerable to hunting (Alt 1984b). Den sites that tend to be successful provide adequateprotection from weather, are safe from predation or human disturbances, and areenergetically efficient (Oli et al 1997).
Bears prepare for denning by accumulating fat reserves. Schwartz et al. (1987) noted thatthe amount of fat and rate of fat catabolism is related to how much time a bear may spendin its den. As den entry approaches, bears confine themselves to a small area around theirden (Kolenosky and Strathearn 1987). Once the bear enters its den, it does not eat, drink,defecate, or urinate for as long as 7 months (Hellgren et al. 1990). Declines in bodytemperature, heart rate, and oxygen consumption are characteristic of hibernating blackbears (Folk 1967, Hellgren et al. 1990, Watts et al. 1981).
Types of dens vary geographically and depend in part on length and severity of winter,den availability, and human disturbance. Bears den in tree cavities, excavated dens, rockpiles or cavities, nest-like depressions, man made structures (culvert pipes), andbrushpiles. The majority of dens in Tennessee (Johnson and Pelton 1980, Wathen et al.1986), Virginia (Godfrey 1996, Kasbohm 1994), Louisiana (Weaver and Pelton 1994),and Prince William Sound, Alaska (Schwartz et al. 1987) were tree dens. Excavated denswere prominent in Alaska (Schwartz et al. 1987), Idaho (Beecham et al. 1983), Montana(Jonkel and Cowan 1971), Ontario (Kolenosky and Strathearn 1987), West Virginia(Kraus et al. 1988), and forested wetlands of Virginia and North Carolina (Hellgren andVaughan 1989). Ground nests were the most predominant type of den in swamps ofFlorida (Wooding and Hardisky 1992), Virginia, and North Carolina (Hellgren andVaughan 1989). Bears in Pennsylvania (Alt 1984b), Arkansas (Hayes and Pelton 1994),and SNP, Virginia, (Carney 1985) denned most frequently in rock cavities. Manville(1987) reported that den selection of upland, swamp, and lowland habitats in Michiganwas significantly different between the sexes.
Tree dens are important to successful denning throughout much of the black bear’s range.Weaver and Pelton (1994) found that the majority of tree dens in Louisiana were in baldcypress (Taxodium distichum), whereas most of the bears in the SNP (Carney 1985,Kasbohm 1994), the northern GWJNF (Godfrey 1996), and the southern AppalachianMountains (Wathen et al. 1986) denned in chestnut oak or northern red oak. The averagedistance of the den entrance hole above the ground was 14 meters in Louisiana (Weaver

48
and Pelton 1994), 9.2 m in SNP, Virginia, (Carney 1985) and 12.1 meters in the southernAppalachian Mountains (Wathen et al. 1986). In the northern GWJNF, Godfrey (1996)reported that the average height of entrance holes above the ground were 7.1 m and 9.6 mfor chestnut and red oaks, respectively. Wathen et al. (1986), in Tennessee, and Carney(1985), in Virginia, found the mean DBH of tree dens was 100.7 cm and 94.6 cm,respectively. The mean DBH of chestnut and red oaks in the northern GWJNF was 85cm and 95 cm, respectively (Godfrey 1996). Weaver and Pelton (1994) reported thatbald cypress den trees averaged 183 cm DBH. Ground dens had more understoryvegetation (Wathen et al. 1986) and a greater slope (Carney 1985) than tree dens.
Rock cavity dens are essential to many black bear populations. They are usuallystructurally secure and typically on steep slopes far away from any human disturbance(Hayes and Pelton 1994). Den sites with a larger amount of basal area and those foundon steeper slopes may offer more protection to the bears from human disturbance. Rockcavities had lower understory stem density and were in larger stands of timber thanexcavated dens (Hayes and Pelton 1994).
Den availability is one of the least studied, but potentially most important aspects of denecology. In southern wetlands, den sites, and thus female productivity, may be limited byperiodic flooding (Hellgren and Vaughan 1989). Alt (1984a) found that flooding of nataldens caused increased cub mortality. In Arkansas, Hayes and Pelton (1994) reported thatthe den types used by bears correspond closely to availability.
Early den entry and late emergence may protect vulnerable adult female bears fromhunting. In most areas, adult females denned earlier and emerged later than subadultsand adult males (Hellgren and Vaughan 1989, Johnson and Pelton 1980, O’Pezio et al.1983, Tietje and Ruff 1980). In Alberta, Kolenosky and Strathearn (1987) found thatyearlings denned before adult females. Weaver and Pelton (1994) in Louisiana andHellgren and Vaughan (1989) in Virginia reported that pregnant females were typicallythe first to enter dens and the last to emerge. Schwartz et al. (1987) hypothesized thatnonlactating females (assumed to be pregnant) denned first because they had the bestopportunity to prepare for the winter. Schooley et al. (1994) hypothesized that whenpregnant bears have stored enough fat for reproduction they will den.
Food availability (Schooley et al. 1994), physical condition of bears, above averageprecipitation (Jonkel and Cowan 1971, Lindzey and Meslow 1976), and overallcumulative effects of winter are all stimuli for den entry (Hellgren and Vaughan 1989,Johnson and Pelton 1980, Lindzey and Meslow 1976, Schwartz et al. 1987). Denentrance dates vary widely throughout the bear’s range and appear to be a function oflatitude. Mean den entrance dates range from early October in Alaska (Schwartz et al.1987) to late January in Florida (Wooding and Hardisky 1992). The mean den entrancedate was mid-December to early January in eastern Virginia (Hellgren and Vaughan1989), mid-November in New York (O’Pezio et al. 1983) and Montana (Aune 1994), 27October in Ontario (Kolenosky and Strathearn 1987), and 15 October in Alberta(Schwartz et al. 1987). The earliest den entrance date was 9 September in Alaska(Schwartz et al. 1987).

49
Length of time in the den generally decreases from northern to southern latitudes.Schwartz et al. (1987) reported that black bears in Alaska denned 189 - 233 days, butWooding and Hardisky (1992) showed that bears in Florida denned on average < 90 days.Bears den for approximately 3-4 months in Tennessee (Johnson and Pelton 1980), NorthCarolina (Hamilton and Marchinton 1980), Mississippi (Smith 1986), and Virginia(Hellgren and Vaughan 1989), 4.5 months in New York (O’Pezio et al. 1983), 5-6months in Montana (Aune 1994) and Ontario (Kolenosky and Strathearn 1987), and 6-7months in Alaska (Schwartz et al. 1987). Studies have shown that males and non-pregnant females may remain active throughout the winter in the southern portion of theirrange (Carney 1985, Godfrey 1996, Hellgren and Vaughan 1989, Smith 1986, Weaverand Pelton 1994). Mild winter temperatures, lack of persistent snow cover, and diversefood items are factors that may contribute to winter activity and lack of denning by blackbears (Hellgren and Vaughan 1989).
Den emergence may be associated with photoperiod (Kolenosky and Strathearn 1987,Lindzey and Meslow 1976), snow melt (Rogers 1987, Schooley et al. 1994, Schwartz etal. 1987), cub growth and condition, body condition, and increasing temperature(Kolenosky and Strathearn 1987, Lindzey and Meslow 1976, O’Pezio et al. 1983, Rogers1987). Emergence dates are probably a combination of these environmental factors.Bears in the middle to southern portion of their range emerge from late March throughmid April (Aune 1994, Hellgren and Vaughan 1989, Johnson and Pelton 1980, O’Pezio etal. 1983, Smith 1986). In the northern part of the black bear’s range den emergenceoccurs from mid April to early May (Kolenosky and Strathearn 1987, Schwartz et al.1987).
Most studies have shown that reuse of dens is low. Kolenosky and Strathearn (1987)found no indication of den reuse in Ontario, but Schwartz et al. (1987) reported den reuseas high as 75% in Alaska. Other studies (Alt 1984b, Jonkel and Cowan 1971, Weaverand Pelton 1994) reported little or no den reuse. Den reuse may be related to denavailability (Tietje and Ruff 1980) and types of dens used in that area (Alt 1984b). Alt(1984b) hypothesized that low reuse may increase survival rates of black bears throughdecreased predation.
Human disturbance (Hellgren 1988) and flooding (Oli et al. 1997) may cause bears to usemore than one den during the winter. Weaver and Pelton (1994) reported that at least45% of bears in Louisiana used more than one den during the winter. Bears in Michiganalso occasionally used more than one den (Manville 1987).
MethodsDens were located in December, January, and February via telemetry (see telemetry).Each den site was photographed or a picture was drawn to aid in the assessment of howto enter the den when researchers returned in late February and March. Height ofentrance hole from ground, width of hole, slope of the ground around the tree, andaccessibility were estimated for all tree and snag dens when the den site was located.

50
Width of entrance hole and distance from entrance hole to bear were estimated for eachground den when the den site was located. Researchers listened for cubs (nursing andwhimpering; Alt 1989) at each den located after 1 January (Chapter 1).
All accessible dens were visited in February and March. We handled male bears in lateFebruary, lone females and females with yearlings in late February to mid - March, andfemales with cubs in late March. Physical measurements (see live trapping and handling)were taken on adult and yearling bears. We determined reproductive status and took cubmeasurements in the den (Chapter 1). Ear tags, cotton spacers, and radio-collars werereplaced when needed. Dens were classified as tree, snag, rock cavity, ground bed, orexcavation.
Den measurements taken at each tree den site included height and width of entrance hole,aspect of den entrance, diameter of cavity inside, distance from ground to entrance hole,distance from bear to entrance hole, and diameter at breast height (DBH) (Godfrey 1996).We measured tree height and height to entrance hole with a clinometer. We tested DBH,tree height, height of entrance hole, slope, and basal area for differences between treespecies with a Wilcoxon Rank Sum Test. In addition, we tested these measurements fordifferences in reproductive status (with cubs or without cubs) with a Wilcoxon Rank Sumtest. Cavity length, width, and height were measured for rock cavities and excavations.All dens were measured according to length of nest, width of nest, depth of beddingmaterial, and description of bedding material (Hellgren 1988).
Each den site served as the center of a .04 ha circular plot. We recorded aspect andpercent slope for each den site. Basal area around den site, large, medium, and small treedensities, and understory density were estimated for each den. We tested for differencesin basal area, large, medium and small tree density, understory density, slope, summerweight of bears, and mean ages of bears in tree versus ground dens with a WilcoxonRank Sum test. Rock cavities, excavations, slashpiles, and ground beds were consideredground dens. Den site locations were determined with GPS units and plotted on atopographic map.
Researchers used climbing gear (safety equipment, belay system, ascenders, tree pegs,and climbing rope) to access tree dens (Godfrey unpubl. manuscript). Decisions onwhether to enter dens were based upon safety of workers and position of the bear in itsden. Bears in tree dens were not immobilized unless they were lying down (bears in asitting position in tree dens have been reported to suffocate when immobilized; Higgins1997). Dens were considered workable only if a researcher could safely handle the adultbear.

51
Results
Denning StatusWe mointered 31 bears for 39 bear winters with 100% of the bears denning. The denningstatus of 2 bears was unknown. We lost radio contact with a relocated nuisance bear inOctober 1996 and did not locate her until May 1997. Her denning status was unknown;however, it is likely that she denned that winter because we were unable to locate herthrough aerial telemetry. One female with an unknown denning status was in aninaccessible area from December 1996 to mid March 1997.
Habitat CharacteristicsSlope, basal area, large tree density, medium tree density, small tree density, stemdensity, and summer weight of bears did not differ (P > 0.05) between ground and treeden sites (Table 15). Average age of bears using ground dens (x = 7.1, SE = ± 0.97) was
greater (Z = -2.484, P = 0.013) than bears using tree dens (x = 4.4, SE = ±0.91).
Den Type CharacteristicsFemales denned in tree cavities (n = 17, 48.6%), rock cavities (n = 11, 31.4%), excavateddens (n = 5, 14.3%), and ground nests (n = 2, 5.7%). Males denned in rock cavities (n =1) and tree cavities (n = 1, Figure 6). Cavity length and width of ground dens were 206.4cm (SE ± 24.1, n = 12) and 120.5 cm (SE ±18.7, n = 12), respectively (Table 16). Snagsmade up three of 17 tree cavities. Den types did not differ (Z = -1.298, P = 0.1941)between years. Percent of bears denning on public land (n = 21, 57%) did not differ (χ2
= 0.676, P = 0.411) from those denning on private property (n = 16, 43%; Figure 7).
Tree species used as tree dens included chestnut oak (n = 9, 50.0%), red oak (n = 8,44.4%), and tulip-poplar (n = 1, 5.6%). Red oaks had higher (Z = -2.593, P = 0.010)cavity entrances than chestnut oaks (Table 17). Tree height, slope, basal area, and DBHdid not differ (P > 0.05) between chestnut and red oaks or between bears with cubs andbears without cubs (Table 18).
Den ReuseOne of 19 (5.3%) dens was reused in 1997. An ear-tagged male (noncollared) used aground den that was occupied the previous year by a radio-collared female. No radio-collared bear reused the same den.
Eight of 8 (100%) tree dens had no obvious structural damage after 1 year. However, 1excavated den had partially collapsed.

52
Table 15. Den site1 characteristics of ground and tree dens in the southern GeorgeWashington and Jefferson National Forests, Virginia in 1996 and 1997.
Characteristic Ground Dens Tree Dens P-ValueSlope 34.5 ± 3.1 (13) 33.7 ± 3.5 (17) 0.6012
Basal area 80 ± 30 (13) 80 ± 10 (17) 0.9322
Trees > 50.8cm dbh/ha 70 ± 20 (13) 70 ± 20 (17) 0.8332
Trees 25.5-50.8cm dbh/ha 130 ± 30 (13) 90 ± 20 (17) 0.3432
Trees 12.7-25.4cm dbh/ha 1200 ± 840 (13) 310 ± 50 (17) 0.6722
Stem density (stems/ha) 8300 ± 1900 (13) 5700 ± 900 (17) 0.2672
Summer weight of bear (kg) 59.6 (17) 49.8 (16) 0.0582
Age of bear using den (mean) 7.1(19) 4.4(18) 0.0132
1 0.04 ha circular plot centered on den2 Wilcoxon Rank Sum

53
Figure 6. Black bear den types used in the southern George Washinton and Jefferson National Forests, Virginia in 1996 and 1997.
Rock Cavity32%
Snag8%
Tree41%
Ground Nests5%
Excavated 14%

54
Figure 7. Proportion of bears denned on private and public land in southern George Washington and Jefferson National Forests, Virginia in 1996 and 1997.
PRIVATE43%
PUBLIC57%

55
Table 16. Ground nest dimensions of black bear den sites in the southern George Washington and Jefferson National Forests,Virginia in 1996 and 1997.
Habitat Characteristic Mean Standard error Number Minimum MaximumCavity height (cm) 67.6 3.4 12 51.0 82.7Cavity length (cm) 206.4 24.1 12 102.0 329.0
Cavity width (cm) 120.5 18.7 12 11.4 244.0Nest length (cm) 106.6 8.9 12 58.0 157.0Nest width (cm) 79.3 7.9 12 11.4 121.0Bedding material depth (cm) 12.8 4.8 12 0.0 50.0Entrance hole height (cm) 64.2 12.3 12 27.0 186.0Entrance hole width (cm) 96.7 24.8 12 29.3 347.0

56
Table 17. Characteristics of red and chestnut oaks used as dens in the southern GeorgeWashington and Jefferson National Forests, Virginia in 1996 and 1997.
Characteristic Red Oak Chestnut Oak P-ValueHeight of tree (m) 23.3 ± 4.1 (6) 13.8 ± 8.0 (9) 0.0991
Height of entrance (m) 12.1 ±1.7 (7) 6.6 ± 1.6 (9) 0.0101
DBH (m) 1.92 ± 0.16 (8) 1.65 ± 0.16 (8) 0.1891
Slope (%) 29.0 ± 3.9 (8) 40.3 ± 5.6 (8) 0.0741
Basal area 90 ± 10 (8) 80 ± 10 (8) 0.3951
1Wilcoxon Rank Sum
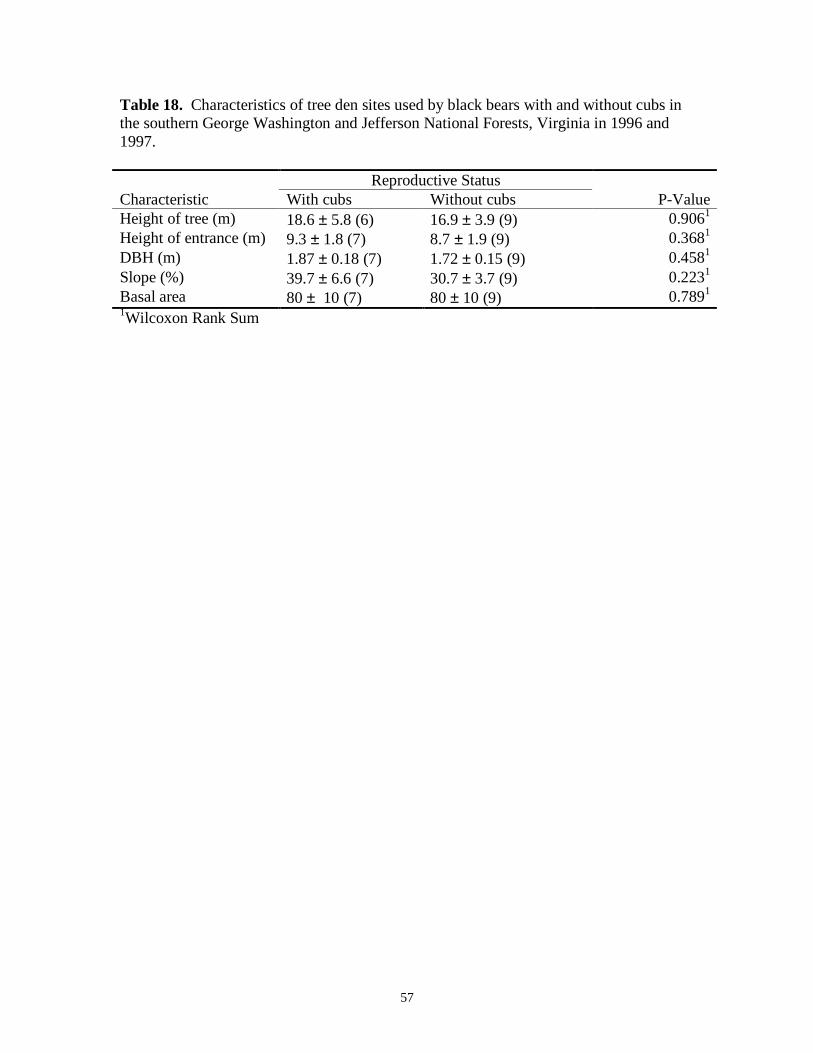
57
Table 18. Characteristics of tree den sites used by black bears with and without cubs inthe southern George Washington and Jefferson National Forests, Virginia in 1996 and1997.
Reproductive StatusCharacteristic With cubs Without cubs P-ValueHeight of tree (m) 18.6 ± 5.8 (6) 16.9 ± 3.9 (9) 0.9061
Height of entrance (m) 9.3 ± 1.8 (7) 8.7 ± 1.9 (9) 0.3681
DBH (m) 1.87 ± 0.18 (7) 1.72 ± 0.15 (9) 0.4581
Slope (%) 39.7 ± 6.6 (7) 30.7 ± 3.7 (9) 0.2231
Basal area 80 ± 10 (7) 80 ± 10 (9) 0.7891
1Wilcoxon Rank Sum

58
Fidelity to Den TypeSeven female bears were monitored in consecutive winters. Three of 7 (42.9%) switchedfrom ground dens to tree dens. No bears switched from a tree den to ground den.
Eight of 21 (38.1%) and 10 of 16 (58.8%) bears used tree dens in 1996 and 1997,respectively (Z = -1.298, P = 0.194). However, the proportion of females with cubs usingground dens was higher (Z = 2.752, P = 0.005) in 1996 (9 of 10) than 1997 (4 of 10). Wedocumented 2 bears using more than 1 den during a winter. Female S-33 emerged fromher tree den after being handled and redenned in a tree den. Female S-42 emerged fromher initial tree den and redenned in a tree den. We located a dead yearling bear in herinitial den and suspect that she emerged after it died.
Discussion
Den StatusHellgren and Vaughan (1989) reported that bears might show a lesser degree ofdormancy or may not den at all when climatic conditions are favorable. In the southernGWJNF (present study), a numerically higher proportion of bears (100%) denned than onthe northern GWJNF (81%; Godfrey 1996), SNP (94%; Kasbohm 1994), and theGDSNWR (86%; Hellgren 1988, Hellgren and Vaughan 1989). However, it is difficultto compare the proportion of bears denning between studies because of fluctuations in theannual precipitation and temperatures.
At birth, black bear cubs are uncoordinated, altricial, can not see, and may not be able tosmell (Alt 1989); thus pregnant females must den to ensure that their cubs will survive.By denning, females give their cubs more time to grow, which enables them to avoidpredators following den emergence. In the present study, the northern GWJNF (Godfrey1996), SNP (Kasbohm 1994), and GDSNWR (Hellgren 1988) 51%, 47%, 33%, and 20%,respectively of bears monitored throughout the winter produced cubs. Thus, anumerically larger proportion of bears in the southern GWJNF needed to den to ensuresuccessful reproduction.
Den Site Habitat CharacteristicsSome studies report that habitat characteristics differ between ground and tree den sites.The habitat around tree dens in the southern Appalachians typically has greater basal area(Godfrey 1996, Johnson and Pelton 1980), a higher proportion of trees with a dbh greaterthan 50.8 cm (Godfrey 1996), and lower stem density (Godfrey 1996) than ground dens.Ground dens are on steeper slopes with a greater understory than tree dens (Johnson andPelton 1980, Wathen et al. 1986).
Habitat characteristics of tree dens and ground dens may differ because tree dens mayoffer more protection from humans and predators. Habitat characteristics in the southernGWJNF did not differ between ground and tree den sites. Godfrey (1996) noted that rock

59
cavity dens and tree dens might have similar habitat characteristics and offer the sameprotection from predators. However, the habitat around ground nests may have a greaterstem density and a greater proportion of trees under 12.5 cm than the habitat around rockcavities because bears using ground nests are more likely to be seen by a human oranother bear. In the present study, bears used a large proportion of rock cavity dens(32.4%), but fewer ground nests (5.7%) and excavations (14.3%). We pooled grounddens because of small sample sizes and were unable to test for difference habitatcharacteristics between ground nests and rock cavities.
Den types used by bears correspond with den availability (Hayes and Pelton 1994). Inthe northern GWJNF, Godfrey (1996) reported that the age and summer weights offemales did not influence selection of den types. In the present study, bears using treedens were younger than bears using ground dens. Average summer weights of bearsusing tree dens did not differ (P = 0.058) from bears using ground dens, but bears inground dens were on average 9.8 kg heavier. However, we do not know anything aboutden availability because we did not measure it.
Den CharacteristicsDen types vary geographically, with tree dens (Godfrey 1996, Kasbohm 1994, Johnsonand Pelton 1980, Schwartz et al. 1987), rock cavities (Alt 1984b, Carney 1985, Hayesand Pelton 1994), and excavations (Hellgren and Vaughan 1989, Jonkel and Cowan1971, Kraus et al. 1988) being the most predominant in many populations. Tree densmay offer more protection to bears from disturbance by humans, hunters using hounds,and other bears. We expected bears in the southern GWJNF to use tree dens at the sameproportion as bears in the northern GWJNF. In the southern GWJNF, use of rock cavities(32.4%) and tree dens (48.6%) did not differ significantly (Z = 1.4404, P = 0.14975).Bears in the southern GWJNF (48.6%) used a lower (Z = -3.72393, P = 0.0002)proportion of tree dens than the northern GWJNF (82.3%; Godfrey 1996). Bears in thenorthern GWJNF may have used a higher proportion of tree dens than bears in thesouthern GWJNF because a larger proportion of tree dens were available, although nomeasurements of den availability were made on either study area. In addition, bears inthe present study used a numerically higher proportion of tree dens than bears in theGDSNWR (Hellgren 1988), a wetland in eastern Virginia, but a numerically lowerproportion than bears in SNP (Kasbohm 1994), an oak-hickory forest protected since1955.
Bears in this study used red and chestnut oaks as dens in numerically similar proportionsto bears in the northern GWJNF (Godfrey 1996) and SNP (Kasbohm 1994). Chestnutand red oaks comprised 93% and 79% of the tree species used as den sites in the northernGWJNF (Godfrey 1996) and the SNP (Kasbohm 1994), respectively. Chestnut(McQuilkin 1990) and red oak (Sander 1990) are the major components of theirrespective forest types in the Appalachian Mountains. The northern red oak is amoderate to fast growing species living on a variety of soils and topography (Sander1990). The chestnut oak is a slow growing, long-lived tree growing on dry south andwest facing slopes, rocky outcrops, and ridge tops at a range in elevation from 450 to1400 m (McQuilkin 1990). In addition, chestnut oak is at a higher risk to decay and fire
60
damage than other oaks in the Appalachian Mountains (McQuilkin 1990). Sander (1990)reported that northern red oaks are susceptible to oak wilt (Ceratocystis fagacerum),carpenterworm (Prionoxystus robiniae), Columbian timber beetle (Corythyluscolumbianus), red oak borer (Enaphalodes rufulus), and oak timberer (Arrhenodesminutus), which may kill or decay their wood. A combination of red and chestnut oakbeing the most predominant tree species in our study area, and their susceptibility todecay, may indicate why bears choose these species as den types. In the Great SmokyMountain National Park (GSMNP), Tennessee, only 45% of tree dens were red orchestnut oaks (Wathen et al. 1986); however, Carlock et al. (1983), in Tennessee outsideof GSMNP and Georgia, reported that a majority of tree dens were chestnut oak. Oli etal. (1997), in Arkansas, reported that tree den species were comprised of overcup oak (Q.lyrata), bald cypress (Taxodium distichum), and sycamore (Platanus occidentalis) in abottomland wetland. Patterns of land use (Godfrey 1996) and tree species availability(Carlock et al. 1983) may influence tree species selected as den sites. Topographicalfeatures, slopes or amount of moisture, could also influence the tree species available asden sites.
In the southern GWJNF, 43% of radio-collared bears denned on private land; however,all of the marked bears were captured on public land. The large proportion of bearsdenning on private land may be a function the large amount of land within our study areathat is privately owned (roughly 40-50%). Alternatively, it could result from hunterswith hounds pressuring bears onto public land (Godfrey 1996), land use patterns onprivate land, or the similarity between public and private lands in the southern GWJNF.Many private landowners do not permit hunting with hounds on their property; thus thechances for disturbance in a bear’s den are reduced in December (during the hound-hunting season) if a bear is denned on private land. In addition, 9 of 11 bears captured onthe Virginia – West Virginia State line moved to West Virginia to den. In Mercer andMonroe counties West Virginia (the counties adjacent to the southern GWJNF studyarea) hunting with hounds is not permitted. Further, the majority of the adjacent land inWest Virginia is private and the majority of the land in Virginia, along the state line, ispublic. Thus, bears that move to West Virginia might experience less hunting pressureand more favorable denning conditions.
Den ReuseDen reuse in the southern GWJNF was similar to most studies (Alt 1984b, Carney 1985,Godfrey 1996, Jonkel and Cowan 1971, Kasbohm 1994, Kolenosky and Strathearn 1987,Oli et al. 1997, Weaver and Pelton 1994) where den reuse was less than 10%. However,it was numerically lower than populations in Alaska were den reuse was as high as 75%(Kolenosky and Strathearn 1987).
Den reuse may be related to types of den in the area (Alt 1984b), den availability (Tietjeand Ruff 1980), the smell of another bear, parasites, or the probability of a bear finding aden that had been used before. In Virginia, Godfrey (1996) and Kasbohm (1994)reported that only tree dens were reused in the northern GWJNF and SNP, respectively.In the southern GWJNF, only a rock cavity den was reused. Godfrey (1996) reported thatall cases of reuse occurred by the same bear; however, Kasbohm (1994) reported one

61
instance of an uncollared bear reusing a den that had been used previously by a collaredbear. Oli et al. (1997), in Arkansas, reported an unmarked bear reusing a den that hadbeen used previously by a radio marked animal. In the present study, a marked male bearreused a rock cavity den that had been used the previous year by a radio-collared female.Kasbohm (1994), in the SNP, reported that many trees were heavily scarred and may beused frequently as den sites. We located an unmarked female bear in a tree den that hadnot been used before by a radio-collared bear. The tree had claw marks on its bark andappeared to have been used before. In the southern GWJNF, we observed trees that wereheavily scarred with bear claws; however many of the entrance holes were unsafe tocheck.
Fidelity to Den TypeFour of 7 bears in the southern GWJNF and 11 of 13 bears in the northern GWJNF usedthe same den types in consecutive years. In the northern GWJNF (Godfrey 1996), both (n= 2) bears that switched, switched from tree dens to ground dens, whereas in the southernGWJNF all (n = 3) bears switched from ground dens to tree dens. In the present study, 2of 3 females that changed den types also had a different reproductive status the followingyear. Females S-20 and S- 25 produced cubs in 1996 and had yearlings present in theirdens during 1997. Female S-30 (also changed den types) produced cubs in 1996 andagain in 1997 (Chapter 1). In the northern GWJNF, both bears that change den typesproduced cubs during both years (Godfrey 1996).
The use of multiple dens in the same year may be attributed to flooding (Oli et al. 1997)and human disturbance (Hellgren 1988). In the present study, 2 bears used multiple densites within the same year. One 2-year old female emerged from her den after beinghandled and 1 bear redenned after 1 of her yearlings died in the den. The actual numberof bears using multiple dens may be higher than reported. We located the majority of densites in January and February. Therefore, we could not document bears that weredisturbed from their dens during the hound-hunting season in December.
Summary and Recommendations for Future StudyIn the southern GWJNF, 100% of the bears denned. Bears denned in trees (41%), rockcavities (32%), excavations (14%), snags (8%), and ground nests (5%). Chestnut oak (n= 9), red oak (n = 8), and tulip-poplar (n = 1) were used as tree dens. Habitatcharacteristics did not differ between tree dens and ground dens; however, older bearsused ground dens. Fifty-seven percent of bears denned on public land and wedocumented one instance of den reuse.
Future work should focus on den availability and denning chronology. In the southernGWJNF, understanding the availability of tree dens may reveal why heavier, older bearsuse rock cavities. In addition, it may assist in understanding why a large proportion ofbears den on private land. The importance of denning chronology should be evaluated inthe southern GWJNF. If denning chronology is to be understood, a larger number ofresearcher hours must be devoted to telemetry. However, before an attempt is made tounderstand denning chronology, an unbiased assessment of telemetry error must be made.

62
To ensure that den entrance dates are accurate, dens should be located within 7 days aftera bear reduces its movements. Also, dens should be checked every 3-4 days in Marchand April to ensure that bears have emerged from their dens.

63
Literature Cited
Alt, G. L. 1982. Reproductive biology of Pennsylvania’s black bear. Pa. Game News.53(2):9-15.
_____. 1984a. Black bear cub mortality due to flooding of natal dens. J. Wildl.Manage. 48(4):1432-1434.
____. 1984b. Reuse of black bear dens in northeastern Pennsylvania. J. Wildl. Manage.48:236-239.
_____. 1989. Reproductive biology of female black bears and early growth anddevelopment of cubs in northeastern Pennsylvania. Ph.D. Thesis, West VirginiaUniv., Morgantown. 114pp.
Aune, K. E. 1994. Comparative ecology of black and grizzly bears on the RockyMountain Front, Montana. Int. Conf. Bear Res. and Manage. 9(1):365-374.
Barber, K. R., and F. G. Lindzey. 1986. Breeding behavior of black bears. Int. Conf.Bear Res. and Manage. 6:129-136.
Beck, T. D. 1991. Black bears of west-central Colorado. Colo. Div. Wildl. Tech. Pub.39. 86pp.
Beecham, J. J. 1980. Population characteristics, denning, and growth patterns of blackbears in Idaho. Ph.D. Thesis, Univ. Mont., Missoula. 101pp.
_____, D. G. Reynolds, and M. G. Hornocker. 1983. Black bear denning activities andden characteristics in west-central Idaho. Int. Conf. Bear Res. and Manage. 5:79-86.
Burnham, K. P. 1993. A theory for combined analysis of ring recovery and recapturedata. Pages 199-213 in J.-D. Lebreton and P. M. North, editors. Markedindividuals in the study of bird population. Birkhauser Verlag, Basel,Switzerland.
Burton, T., D. Koch, D. Updike, and A. Brody. 1994. Evaluation of the potential effectsof sport hunting on California black bears. Int. Conf. Bear Res. and Manage.9:231-236.
Carlock, D. M., R. H. Conley,. J. H. Collins, P. E. Hale, K. G. Johnson, and M. R. Pelton.1983. The tri-state black bear study. Tech. Rep. 83-9. Univ. Tennessee,Knoxville. 286pp.
Carney, D. W. 1985. Population dynamics and denning ecology of black bears inShenandoah National Park, Virginia. M.S. thesis, Virginia Polytechnic Inst. andState Univ., Blacksburg, Va. 84 pp.
_____, and M. R. Vaughan. 1987. Survival of introduced black bear cubs in ShenandoahNational Park, Virginia. Int. Conf. Bear Res. and Manage. 7:83-85.
Clark, J. D. 1991. Ecology of two black bear (Ursus americanus) populations in theinterior highlands of Arkansas. Ph.D. Dissertation, Univ. of Arkansas, LittleRock. 228pp.
Collins, J. M. 1973. Some aspects of reproduction and age structure in the black bear inNorth Carolina. Proc. Southeast Assoc. Game and Fish Comm. 27:163-170.
Craighead, J. J., M. G. Hornocker, and F. C. Craighead, Jr. 1974. A population analysisof the Yellowstone grizzly bears. Mont. For. Conserv. Exp. Stn. Bull. 40. 20 pp.

64
Doan-Crider, D. L., and E. C. Hellgren. 1996. Population characteristics and winterecology of black bears in Coahuila, Mexico. J. Wildl. Manage. 60(2):398-407.
DuBrock, C. W. 1980. An analysis of Virginia black bear population dynamics. M.S.Thesis. Virginia Polytechnic and State Univ., Blacksburg. 115pp.
Eiler, J. H. 1981. Reproductive biology of black bears in the Smoky Mountains ofTennessee. M.S. Thesis. Univ. Tennessee, Knoxville. 128pp.
_____, W. G. Wathers, and M. R. Pelton. 1989. Reproduction in black bears in southernAppalachian Mountains. J. Wildl. Manage. 53:353-360.
Elowe, K. D. 1987. Factors affecting black bear reproductive success and cub survivalin Massachusetts. Ph.D. Thesis, Univ. Massachusetts, Amherst. 71 pp.
_____, and W. E. Dodge. 1989. Factors affecting black bear reproductive success andcub survival. J. Wildl. Manage. 53:962-968.
Folk, G. E., Jr. 1967. Physiological observation of subarctic under winter denconditions. Pages 75-85 in K. C. Fisher, A. R. Dawe, C. P. Lyman, E.Schonbaum, and F. E. South, Jr. eds. Mammalian hibernation III AmericanElsevier Publishing Company, Inc., New York.
Fuller, D. P. 1993. Black bear population dynamics in western Massachusetts. M. S.Thesis. Univ. of Massachusetts, Amherst. 136pp.
Garner, N. P. 1986. Seasonal movements, habitat selection, and food habits of blackbears (Ursus americanus) in Shenandoah National Park. M.S. Thesis. VirginiaPolytech. Inst. and Sate Univ., Blacksburg. 104pp.
Garshelis, D. L., and E. C. Hellgren. 1994. Variation in reproductive biology of maleblack bears. J. Mammal. 75(1):175-188.
Godfrey, C.L. 1996. Reproductive biology and denning ecology of Virginia’s exploitedblack bear population. M.S. Thesis, Virginia Polytechnic Inst. and State Univ.,Blacksburg. 136pp.
Hamilton, R. J., and R. L. Marchinton. 1980. Denning and related activities of blackbears in coastal plain of North Carolina. Int. Conf. Bear Res. and Manage. 4:121-126.
Harlow, R. F. 1961. Characteristics and status of Florida black bear. Trans. North Am.Wildl. And Nat. Resource Conf. 26:481-495.
Hayes, S. G., and M. R. Pelton. 1994. Habitat characteristics of female black bear densin northwestern Arkansas. Int. Conf. Bear Res. and Manage. 9(1): 411-418.
Hellgren, E. C. 1988. Ecology and physiology of a black bear (Ursus americanus)population in Great Dismal Swamp and reproductive physiology in the captivefemale black bear. Ph. D. Thesis, Virginia Polytechnic Inst. and State Univ.Blacksburg. 231pp.
_____, and M. R. Vaughan. 1989. Denning ecology of black bears in a southeasternwetland. J. Wildl. Manage. 53(2):347-353.
_____, _____, R. L. Kirkpatrick, P. F. Scanlon. 1990. Serial changes in metaboliccorrelates of hibernation in female black bears. J. Mammal. 71(3):291-300.
Higgins, J. C. 1997. Survival, home range and spatial relationships of Virginia’sExploited black bear population. M.S. Thesis, Virginia Polytechnic Inst. andState Univ., Blacksburg. 124pp.
Johnson, K. G., and M. R. Pelton. 1980. Environmental relationships and denningperiod of black bears in Tennessee. J. Mammal. 61:653-660.
65
Jonkel, C. J., and I. Mct. Cowan. 1971. The black bear in the spruce-fir forest. Wildl.Monogr. No. 27. 57 pp.
Kasbohm, J. W. 1994. Response of black bears to gypsy moth infestation in ShenandoahNational Park, Virginia. Ph. D. Thesis. Virginia Polytechnic Inst. and StateUniv., Blacksburg. 217 pp.
Kasworm, W. F. and T. J. Thier. 1994. Adult black bear reproduction, survival, andmortality sources in northwest Montana. Int. Conf. Bear Res. and Manage.9(1):223-230.
Kohn, B. E. 1982. Status and management of black bears in Wisconsin. Wis. Dep. Nat.Res. Tech. Bull. 129. 31pp.
Kolenosky, G. B. 1986. The effects of hunting on an Ontario black bear population. Int.Conf. Bear Res. and Manage. 6:45-55.
_____. 1990. Reproductive biology of black bears in east-central Ontario. Int. Conf.Bear Res. and Manage. 8:385-392.
_____. and S. M. Strathearn. 1987. Winter denning of black bears in east-centralOntario. Int. Conf. Bear Res. and Manage. 7:305-316.
Kraus, J. G., R. L. Smith, and J. C. Rieffenberger. 1988. Home ranges, movements, andden site characteristics of female black bears in West Virginia. Trans. NortheastSect. Wildl. Soc. 45:71.
LeCount, A. L. 1982. Characteristics of a central Arizona black bear population. J.Wildl. Manage. 2(1):26-31.
_____. 1984. Black bear cub production and survival in central Arizona. Fed. Aid inWildl. Restoration Final Report. Arizona Game and Fish. 10pp.
_____. 1987. Causes of black bear cub mortality. Int. Conf. Bear Res. and Manage.7:75-82.
Lindzey, F. G., and E. C. Meslow. 1976. Winter dormancy in black bears insouthwestern Washington. J. Wildl. Manage. 40:408-415.
_____, and _____. 1977. Population characteristics of black bears on an island inWashington. J. Wildl. Manage. 41:408-412.
Manville, II, A. M. 1987. Den selection and use by black bears in Michigan’s northernlower peninsula. Int. Conf. Bear. Res. and Manage. 7:317-322.
Martin, D. D. 1991. Virginia status report. East. Workshop Black Bear Res. andManage. 10:76-79.
Matson, J. R. 1952. Litter size in the black bear. J. Mammal. 33:246-247.Mattson, D. J., R. R. Knight, and B. M. Blanchard. 1992. Cannibalism and predation on
black bears by grizzly bears in the Yellowstone ecosystem, 1975-1990. J.Mammal. 73(2):422-425.
McLaughlin, C. R., G. J. Matula, Jr., R. J. O’Connor. 1994. Synchronous reproductionby Maine black bears. Int. Conf. Bear Res. and Manage. 9(1):471-479.
McQuilkin, R. A. 1990. Chestnut oak. Pages 721-726 in R. M. Burns and B. H.Honkala, Tech. Coordinators. Silvics of North America, Volume 2, Hardwoods.USDA Forest Service, Agriculture Handbook 654. Washington, DC.
Miller, S. D. 1987. Sustina Hydroelectric Project Final Report Big Game Studies. Vol.VI. Black bear and brown bear. Alaska Dept. Fish and Game. 276pp.
_____. 1994. Black bear reproduction and cub survivorship in south-central Alaska. Int.Conf. Bear Res. and Manage. 9(1):263-273.

66
Moll, H. D., M. R. Vaughan, R. Duncan, K. A. Needham, C. W. Ryan, D. D. Martin.1997. Telemetry implants for black bear cub and yearlings. Ninth AnnualResearch Symposium Proceedings, Virginia-Maryland Regional College ofVeterinary Medicine 1997; 24.
Nelson, R. A., G. E. Folk, Jr., E. W. Pfeiffer, J. J. Craighead, C. J. Jonkel, and D. L.Steiger. 1983. Behavior, biochemistry, and hibernation in black, grizzly, andpolar bears. Int. Conf. Bear Res. and Manage. 5: 284-290.
Noyce, K. V., and D. L. Garshelis. 1994. Body size and blood characteristics asindicators of condition and reproductive performance in black bears. Int. Conf.Bear Res. and Manage. 9(1):481-496.
Oli, M. K., H. A. Jacobson, and B. D. Leopold. 1997. Denning ecology of black bears inthe White River National Wildlife Refuge, Arkansas. J. Wildl. Manage.61(3):700-706.
O’ Pezio, J. S., H. Clarke, and C. Hackford. 1983. Chronology of denning black bearsin the Catskill region of New York (USA). NY Fish and Game J. 30:1-11.
Pollock, K. H., S. R. Winterstein, C. M. Bunck, and P. D. Curtis. 1989. Survivalanalysis in telemetry studies: the staggered entry design. J. Wildl. Manage.53(1):7-15.
Raybourne, J. W. 1977. A study of black bear populations in Virginia. Trans. NortheastSect. Wildl. Soc. 33:71-81.
Reynolds, D. G. 1977. Home range activities and reproduction of black bears in west-central Idaho. M.S. Thesis. Univ. Idaho, Moscow. 38pp.
Reynolds, D. G. and, J. J. Beecham. 1980. Home range activities and reproduction ofblack bears in west-central Idaho. Int. Conf. Bear Res. And Manage. 4:181-190.
Rogers, L. L. 1976. Effects of mast and berry crop failures on survival, growth, andreproductive success of black bears. Trans. North Am. Wildl. and Nat. Resour.Conf. 41:431-438.
_____. 1977. Social relationships, movements, and population dynamics of black bearsin northeastern Minnesota. Ph.D. Thesis, Univ. Minnesota, Minneapolis. 194pp.
_____. 1987. Effects of food supply and kinship on social behavior, movements, andpopulation dynamics of black bears in Northeastern Minnesota. Wildl. Monogr.97pp.
Rowan, W. 1945. Number of young in the common black bear and grizzly bears inWestern Canada. J. Mammal. 26:197-199.
Samson, C., and J. Huot. 1995. Reproductive biology of female black bears in relationto body mass in early winter. J. Mammal. 76(1):68-77.
Sander, I. L. 1990. Northern red oak. Pages 727-733 in R. M. Burns and B. H. Honkala,Tech. Coordinators. Silvics of North America, Volume 2, Hardwoods USDAForest Service, Agriculture Handbook 654. Washington, DC.
Schooley, R. L., C. R. McLaughlin, G. J. Matula, Jr., and W. B. Krohn. 1994. Denningchronology of female black bears: effects of food, weather, and reproduction. J.Mammal. 75(2)466-477.
Schrage, M. W. 1994. Influence of gypsy moth induced oak mortality on a black bearpopulation. M.S. thesis, Virginia Polytechnic Inst. and State Univ. Blacksburg,113 pp.

67
Schwartz, C. C., and A. W. Franzmann. 1991. Interrelationships of black bears to mooseand forest succession in the northern coniferous forest. Wildl. Monogr. 113.58pp.
_____,and _____. 1992. Dispersal and survival of subadult black bears from the KenaiPeninsula, Alaska. J. Wildl. Manage. 56(3) :426-431.
_____, S. D. Miller, and A. W. Franzmann. 1987. Denning ecology of these black bearpopulations in Alaska. Int. Conf. Bear Res. and Manage. 7:281-291.
Simek, S. L. 1995. Impacts of forest land management on black bear population in theCentral Adironacks. M.S. Thesis, State Univ. of New York College ofEnvironmental Science and Forestry. 232pp.
Smith, T. R. 1985. Ecology of black bears in a bottomland harwood forest in Arkansas.Ph. D. Dissertation, Univ. Tennessee, Knoxville. 209pp.
_____. 1986. Activity and behavior of denned black bears in the lower MississippiRiver Valley. Int. Conf. Bear Res. and Manage. 6:137-143.
Soil Conservation Service. 1985. Soil survey of Giles County Virginia, southern andcentral parts. Soil Conservation Service USDA. Washington, D.C.
Strathearn, S. M., J. S. Lotimer, and G. B. Kolenosky. 1984. An expanding break-awayradio collar for black bear. J. Wildl. Manage. 48(3):939-942.
Strickley, A. R., Jr. 1961. A black bear tagging study in Virginia. Proc. Annu. Conf.Southeast. Assoc. Game and Fish Comm., 15:43-52.
Tietje, W. D., and R. L. Ruff. 1980. Denning behavior of black bears in boreal forest ofAlberta. J. Wildl. Manage. 44:858-870.
Tsubota, T, H. Kanagawa, T. Mano, T. Aoi. 1990. Corpora albicantia and placentalscars in the hokkaido brown bear. Int. Conf. Bear Res. and Manage. 8:125-128.
United States Department of Agriculture. 1965. Land resource regions and major landresource areas of the United States. Soil Conserv. Serv., U.S. Dep. Agric. Hanb.296, 82pp.
United States Department of Agriculture. 1985. Final Environmental Impact Statement.Jefferson National Forest Resource Management Plan. U.S. Forest Service.
Waddel, T. E. 1984. Exploitation of two subpopulation of black bears in an isolatedmountain range. J. Wildl. Manage. 48(3):933-938.
Wathen, W. G., K. G. Johnson, and M. R. Pelton. 1986. Characteristics of black beardens in the southern Appalachian region. Int. Conf. Bear Res. and Manage.6:119-127.
Watts, P. D., N. A. Oritsland, C. Jonkel, and K. Ronald. 1981. Mammalian hibernationand the oxygen consumption of a denning black bear (Ursus americanus).Comparative Biochemistry and Physiology, A. Comparative Physiology, 69:121-123.
Weaver, K. M., and M. R. Pelton. 1994. Denning ecology of black bears in the TensasRiver Basin of Louisiana. Int. Conf. Bear Res. and Manage. 9(1):427-433.
White, G. C. and R. A. Garrott. 1990. Analysis of wildlife radio-tracking data.Academic Press, Inc. San Diego, CA. 383pp.
Willey, C. H. 1974. Aging black bears from first premolar tooth sections. J. Wildl.Manage. 38:97-100.
Wooding, J. B., and J. R. Brady. 1987. Black bear road kills in Florida. Proc. Annu.Conf. Southeast. Assoc. Fish and Wildl. Agencies. 41:438-442.

68
_________, and T. S. Hardisky. 1992. Denning by black bears in northcentral Florida.J. Mammal. 73(4):895-898.
_____ ,and _____. 1994. Home range, habitat use, and mortality of black bears innorth-central Florida. Int. Conf. Bear Res. and Manage. 9(1):349-356.

69
Appendix A:Tables

70
Appendix Table 1. Rating scale for signal strength of individual telemetry bearings.
Confidence factor Description1 Transmitter signal is picked up using only
the receiver
2 Signal is loud, little static
3 Signal is strong, moderate amount of staticpresent
4 Signal is weak but consistent
5 Signal is faint and broken
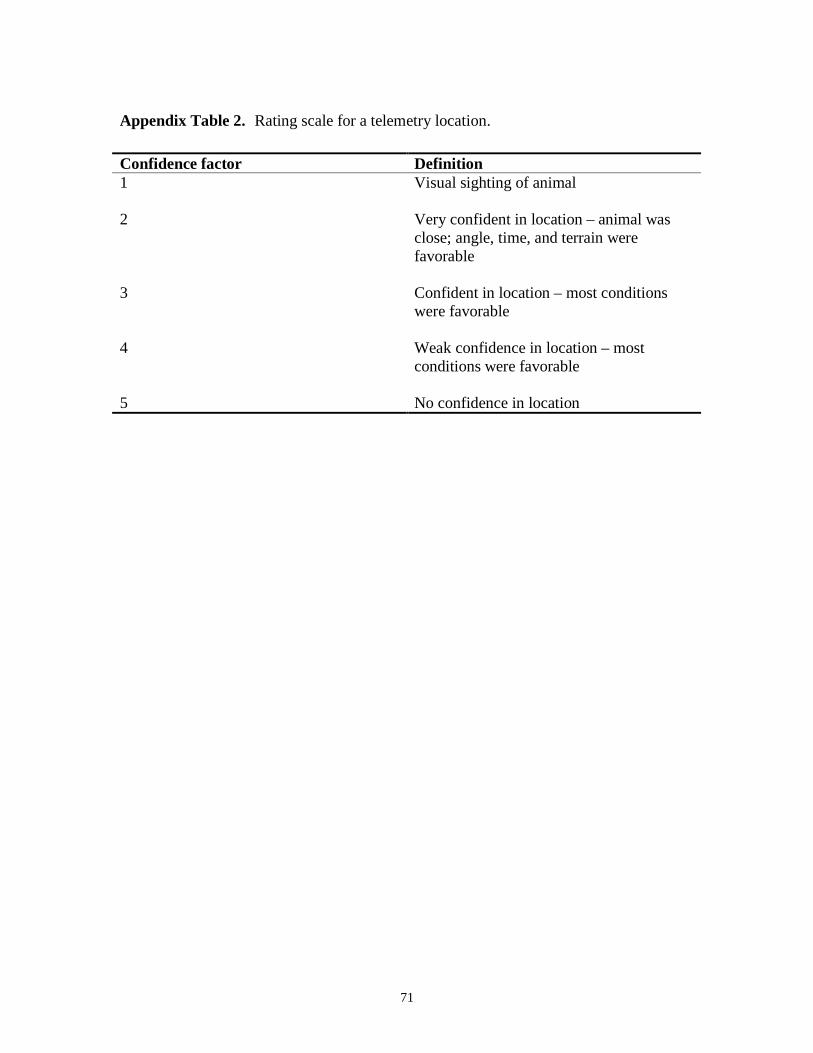
71
Appendix Table 2. Rating scale for a telemetry location.
Confidence factor Definition1 Visual sighting of animal
2 Very confident in location – animal wasclose; angle, time, and terrain werefavorable
3 Confident in location – most conditionswere favorable
4 Weak confidence in location – mostconditions were favorable
5 No confidence in location

72
Appendix Table 3. Definitions of morphological measurements taken on black bearcubs at den sites in the southern George Washington and Jefferson National Forests,Virginia 1996 and 1997.
Measurement DefinitionTotal length Length along back bone from tip of nose to
tip of caudal bone in tail
Ear length Length of ear from bottom of notch toouter most edge of the ear lobe
Front paw length Length of paw from back of main pad toanterior tip of middle tow pad
Front paw width Width of large pad on front paw
Hind paw length Length of paw from back of pad to anteriortip of middle toe pad
Hind paw width Width of large pad on hind paw
Hair length Length of longest hair on top of headmidway between ears

73
Appendix Table 4. Description of measurements taken at black bear den sites located inthe southern George Washington and Jefferson National Forests, Virginia 1996 and 1997.
Measurement DescriptionTree height Distance form base of tree to the top of the
highest branches
Cavity height Distance from the base of tree to bottom ofthe cavity entrance hole
Depth to bear Distance from bottom of entrance hole tothe top of the bear inside the cavity
Entrance height Maximum height of the entrance holemeasured from top to bottom
Entrance width Maximum width of entrance hole takenperpendicular to the entrance height
Depth of bedding material Depth of material lining bear’s nest at thecenter of the nest
Length of nest Length of nest at the widest point
Width of nest Maximum width of nest takenperpendicular to net length
Cavity length Distance from cavity entrance to the backwall of the cavity for a ground den
Cavity width Maximum width of ground den cavity
Cavity height Height of ground den cavity from thecenter of the nest to the tope of the cavity
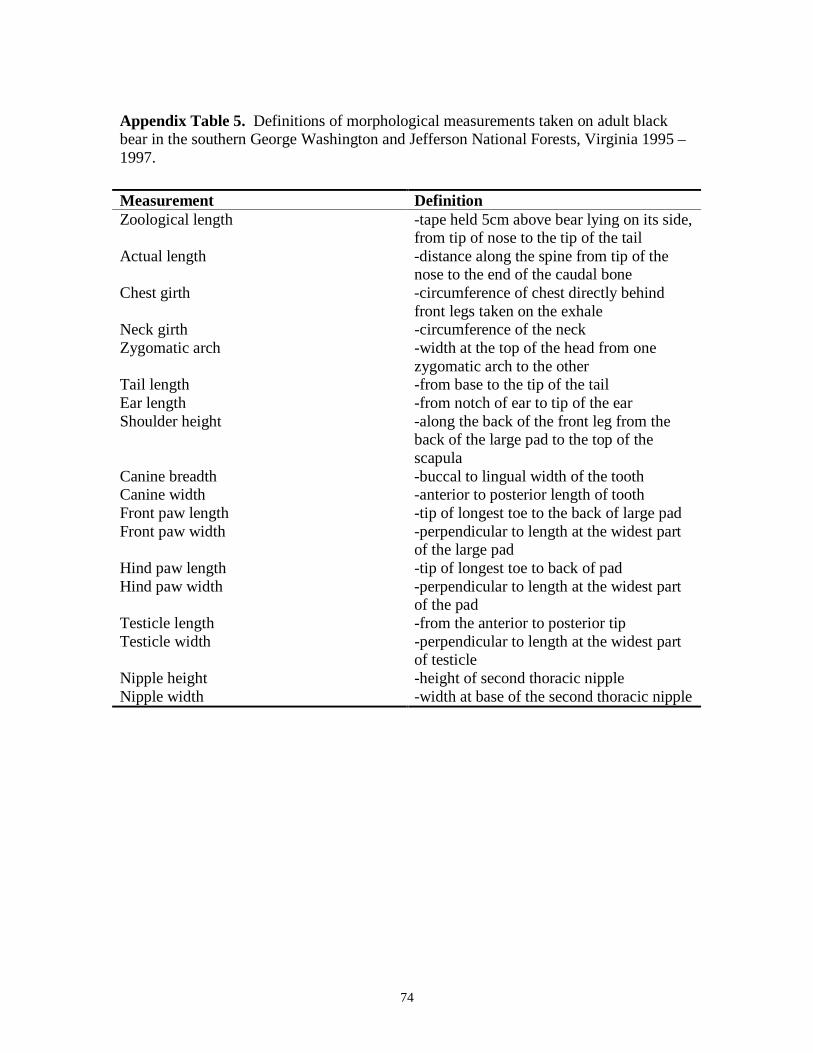
74
Appendix Table 5. Definitions of morphological measurements taken on adult blackbear in the southern George Washington and Jefferson National Forests, Virginia 1995 –1997.
Measurement DefinitionZoological length -tape held 5cm above bear lying on its side,
from tip of nose to the tip of the tailActual length -distance along the spine from tip of the
nose to the end of the caudal boneChest girth -circumference of chest directly behind
front legs taken on the exhaleNeck girth -circumference of the neckZygomatic arch -width at the top of the head from one
zygomatic arch to the otherTail length -from base to the tip of the tailEar length -from notch of ear to tip of the earShoulder height -along the back of the front leg from the
back of the large pad to the top of thescapula
Canine breadth -buccal to lingual width of the toothCanine width -anterior to posterior length of toothFront paw length -tip of longest toe to the back of large padFront paw width -perpendicular to length at the widest part
of the large padHind paw length -tip of longest toe to back of padHind paw width -perpendicular to length at the widest part
of the padTesticle length -from the anterior to posterior tipTesticle width -perpendicular to length at the widest part
of testicleNipple height -height of second thoracic nippleNipple width -width at base of the second thoracic nipple

75
Appendix Table 6. Summer measurements of female black bears captured in the southern study area of the Cooperative AlleghenyBear Study, Virginia 1995 and 1996.
Chest NeckBear Id# Date Sex Age Lactating Estrus Cubs Weight (kg) girth (mm) girth (mm)S001 6/20/95 F 4 YES NO NO 128 880 495S001 8/18/95 F 4 YES NO YES 130 (est) 735 440S001 6/24/96 F 5 NO NO NO 115 750 480
S002 6/20/95 F 2 NO YES NO 97 720 420S002 7/8/95 F 2
S005 6/20/95 F 6 121 770 500
S011 6/29/95 F 6 NO YES NO 160 910 585S011 8/23/95 F 6
S019 7/20/95 F 5 NO YES NO 112 740 450S019 9/1/95 F 5 NO NO NO 100
S020 7/20/95 F 6 NO NO NO 168 870 587S020 8/11/96 F 7 NO NO YES 162 875 529
S025 8/3/95 F 16 NO YES NO 182 860 520S025 6/12/96 F 17 YES NO YES 148 806 450
S029 8/8/95 F 3 NO YES NO 125 758 450S029 7/30/96 F 4 YES NO YES 108 858 480

76
Appendix Table 6. Cont.
Chest NeckBear Id# Date Sex Age Lactating Estrus Cubs Weight (kg) girth (mm) girth (mm)S030 8/10/95 F 2 NO NO NO 82 751 465
S033 8/12/95 F 1 NO NO NO 60 583 350
S039 8/19/95 F 11 YES NO NO 140 793 480S039 8/22/95 F 11S039 7/1/96 F 12 NO NO NO 180 (est) 880 489S039 7/22/96 F 12 NO NO NO 170 910
S041 8/20/95 F 6 YES NO YES 142 803 475S041 7/1/96 F 7 NO NO NO 840 51.5S041 7/12/96 F 7 152
S042 8/20/95 F 3 YES NO 115 760 465S042 8/17/96 F 4 NO NO NO 159 872 510
S044 8/21/95 F 1 NO YES NO 72 630 380
S047 8/25/95 F 4 NO NO NO 148 865 510
S049 8/28/95 F 2 NO 105 792 470
S052 8/30/95 F 1 NO NO NO 68 670 425
S082 6/8/96 F 6 NO NO NO 103 726 468S082 7/18/96 F 6 NO YES NO 105
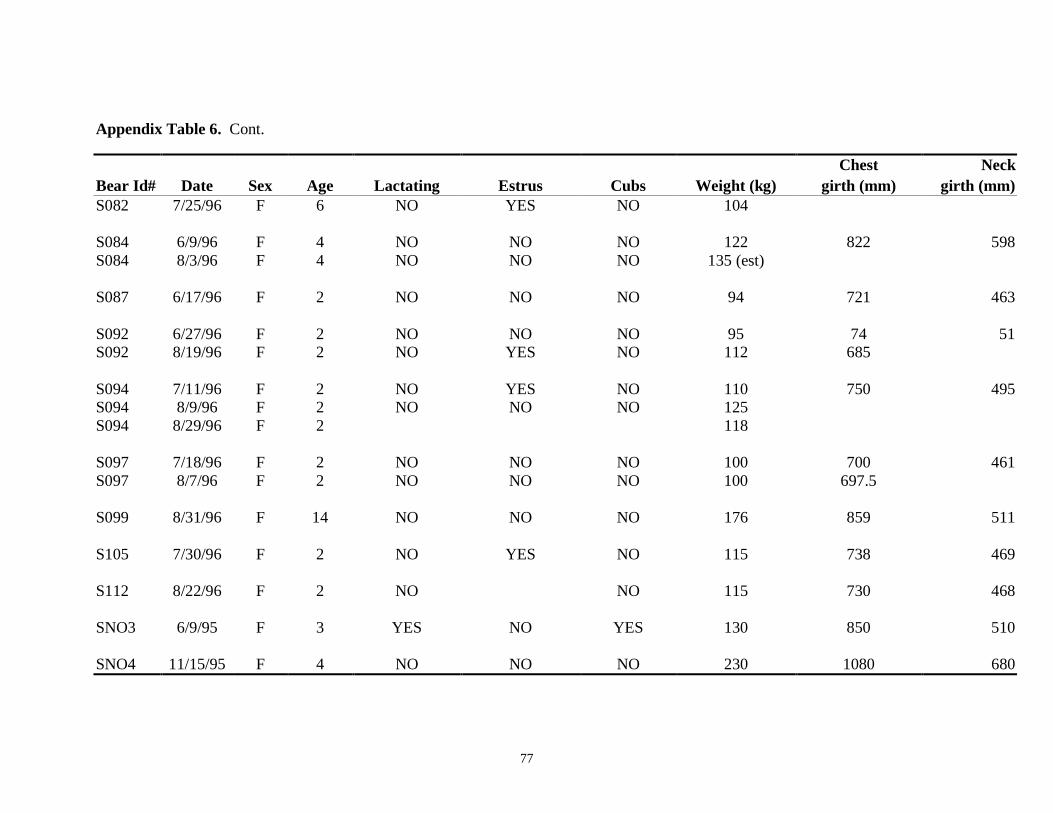
77
Appendix Table 6. Cont.
Chest NeckBear Id# Date Sex Age Lactating Estrus Cubs Weight (kg) girth (mm) girth (mm)S082 7/25/96 F 6 NO YES NO 104
S084 6/9/96 F 4 NO NO NO 122 822 598S084 8/3/96 F 4 NO NO NO 135 (est)
S087 6/17/96 F 2 NO NO NO 94 721 463
S092 6/27/96 F 2 NO NO NO 95 74 51S092 8/19/96 F 2 NO YES NO 112 685
S094 7/11/96 F 2 NO YES NO 110 750 495S094 8/9/96 F 2 NO NO NO 125S094 8/29/96 F 2 118
S097 7/18/96 F 2 NO NO NO 100 700 461S097 8/7/96 F 2 NO NO NO 100 697.5
S099 8/31/96 F 14 NO NO NO 176 859 511
S105 7/30/96 F 2 NO YES NO 115 738 469
S112 8/22/96 F 2 NO NO 115 730 468
SNO3 6/9/95 F 3 YES NO YES 130 850 510
SNO4 11/15/95 F 4 NO NO NO 230 1080 680

78
Appendix Table 7. Measurements of black bear cubs captured at den sites in March 1996 and 1997 in the southern GeorgeWashington and Jefferson National Forests, Virginia.
WT = weight (kg) NG = neck girth (mm) EL = ear length (mm)TL = total length (mm) FPL = front paw length (mm) FPW = front paw width (mm)HPL = hind paw width (mm) HPW = hind paw width (mm) HL = hair length (mm)BZ = blaze (yes or no)
Cub ID Sow ID Date Sex WT NG EL TL CG FPL FPW HPL HPW HL BZS-58 S-11 3/15/96 M 2.80 210 50 530 317 64 41 57 42 30 YS-60 S-20 3/19/96 M 2.70 210 39 470 328 60 48 65 38 39 YS-61 S-20 3/19/96 F 2.20 182 50 500 260 34 36 32 34 25 YS-62 S-20 3/19/96 M 2.20 195 56 462 260 32 39 40 37 28 NS-63 S-20 3/19/96 F 1.80 202 35 270 38 40 62 39 35 NS-64 S-19 3/21/96 M 1.50 170 32 447 270 40 34 45 30 25 YS-65 S-19 3/21/96 F 1.55 151 33 415 230 49 30 50 30 32 YS-66 S-19 3/21/96 F 1.65 160 25 420 250 47 30 54 31 32 YS-67 S-19 3/21/96 F 1.10 145 34 390 210 45 25 47 47 23 Y

79
Appendix Table 7. Cont.
Cub ID Sow ID Date Sex WT NG EL TL CG FPL FPW HPL HPW HL BZS-68 S-5 3/22/96 M 2.50 190 40 516 293 63 40 60 37 35 NS-69 S-5 3/22/96 F 2.15 175 42 475 300 56 41 85 40 32 NS-71 S-30 3/23/96 M 1.85 168 28 416 281 43 32 48 32 33 NS-72 S-30 3/23/96 M 1.95 191 29 485 267 43 38 57 31 31 YS-73 S-25 3/24/96 M 1.80 169 30 416 255 57 33 51 35 27 NS-74 S-25 3/24/96 F 1.40 153 29 397 241 42 31 49 29 29 YS-75 S-47 3/26/96 M 1.50 162 39 367 228 39 37 76 29 33 NS-76 S-47 3/26/96 M 2.00 170 45 500 265 35 37 59 35 35 YS-77 S-47 3/26/96 F 1.50S-78 SN-4 3/28/96 M 2.15 200 49 475 275 50 40 60 45 39 NS-79 SN-4 3/28/96 M 1.90 250 35 445 290 41 41 59 40 32 YS-80 SN-4 3/28/96 M 2.00 181 41 445 281 51 40 56 25 32 YS-113 S-39 3/27/97 M 2.65 207 38 465 307 32 29 61 39 24 NS-114 S-39 3/27/97 M 2.65 200 40 478 307 31 39 62 38 24 YS-115 S-39 3/27/97 F 2.18 216 40 484 276 38 40 61 39 25 NS-116 S-87 3/25/97 M 1.50 149 39 469 205 38 37 49 31 25 NS-117 S-30 3/28/97 M 2.55 191 41 444 288 41 42 62 38 27 YS-118 S-30 3/28/97 M 2.50 187 40 479 251 42 43 61 49 27 NS-119 S-92 3/29/97 M 1.80 168 31 399 242 31 39 60 32 25 NS-120 S-41 3/19/97 F 2.10 171 36 463 264 39 39 60 34 33 YS-121 S-41 3/19/97 F 1.85 170 34 402 268 28 29 54 31 36 YS-122 S-41 3/19/97 F 2.60 193 39 492 278 33 32 39 35 39 YS-123 S-41 3/19/97 F 2.50 192 33 478 292 41 41 58 39 35S-124 S-94 3/24/97 F 2.25 185 40 438 278 40 39 51 32 27 NS-125 S-99 3/21/97 M 2.95 190 42 469 269 49 39 59 39 28 YS-126 S-99 3/21/97 M 2.95 219 39 469 288 33 44 61 39 27 Y

80
Appendix Table 7. Cont.
Cub ID Sow ID Date Sex WT NG EL TL CG FPL FPW HPL HPW HL. BZS-127 S-82 3/17/97 M 2.00 194 42 444 264 42 38 62 34 26 NS-130 S-42 3/24/97 F 2.20 158 46 479 267 36 37 64 33 28 NS-131 S-42 3/24/97 M 178 45 476 274 36 38 60 35 27 N

81
Appendix Table 8. Den location sheet. Used when the den site is first located in thesouthern study area of the Cooperative Allegheny Bear Study, Virginia.
Den Location Sheet
Observer (s):________________________________ Date:_________Bear ID#:__________ Frequency:___________
State:______________ County:____________Quad Map:__________Approximate Lat :__________
Long:_________
Den Type: Tree Snag Rock CavitySlashpile Excavated Day Bed
Tree and Snag Dens:Approximate height of entrance hole:________mApproximate DBH of tree:______cmApproximate size of entrance hole:_________mIs tree or snag slanted: Yes No
Rock Cavity or Excavated Dens:Approximate size of entrance hole:____mIs bear visible: Yes No
All Dens:Were cubs heard: Yes NoPictures taken: Yes No(if no draw picture on back of paper)Is den workable: 1 2 3 4 5
Yes No
Comments:______________________________________________________________________________________________________________________________________________________________________________________________________________________________________________________________________________________________________________________________________________________________

82
Appendix Table 9. Den description data sheet used in the southwestern study area of theCooperative Allegheny Bear Study, Virginia 1996 and 1997.
Den Data SheetIdentification/ LocationBear Id: _____ Radio collar freq: _______Den Site #: ________ Quad map: ________UTM East:________ North: ________County:___________
Den TypeTree Snag Slashpile Rock CavityDay Bed Excavated
Tree den:1. Live or Dead2. Total tree height: _______3. Height to cavity entrance: _______4. Depth of bear in cavity from entrance: _________5. DBH of tree: _________6. Stand type: _______
Den MeasurementsHeight of entrance hole: _______Width of entrance hole: ________Diameter of cavity inside tree: _______Depth of bedding material: _______Description of bedding material: ____________________________Length of nest: __________________Width of nest: _____________Cavity length :_____________Cavity width: ______________Cavity height: ______________
Macroscopic Site DataAspect of den site: __________Aspect of den entrance: ____________% Slope of den site: Uphill: _________ Downhill: __________Basal area around den site: __________Tree density: ________________Understory density: ___________Elevation of site: ____________Mean stand age:_____________

83
Appendix Table 10. Physical characteristics of tree den sites used by black bears in the southern George Washington and JeffersonNational Forests, Virginia 1996 and 1997.
TS – Tree status (D=dead; A=alive) TH – Tree height (m) CH – Cavity height (m) DB – Depth to bear (m)DBH – Diameter breast height (m) EH – Entrance height (cm) EW – entrance width (cm) NL – Nest length (cm)BMD – bedding material depth (cm) NW – Nest width (cm) DSA – Den site aspect DEA – Den entrance aspect
Den Bear TreeId# status TS species TH CH DB DBH EH EW BMD NL NW DSA DEA96-02 lone D C. OAK 2.3 2.3 2.3 0.0 58.4 0.0 63.2 52.996-05 lone A C. OAK 40.2 4.1 1.1 1.92 31.0 41.0 0.0 76.0 83.0 N N96-10 cubs D C. OAK 19.7 6.6 3.1 0.99 49.5 49.0 2.5 77.5 66.0 E E96-11 lone D C. OAK 9.5 4.9 4.9 0.94 0.0 26.7 2.5 111.8 86.4 NW NONE96-18 lone A C. OAK 25.6 18.6 2.17 E SW96-19 lone A R. OAK 18.9 7.7 0.94 S NONE96-20 lone A C. OAK 10.8 8.2 2.03 S W96-21 unknown A T.POPLAR 24.7 12.5 4.45 NE SE97-02 lone A C. OAK 5.7 4.5 3.8 1.82 129.5 63.5 5.1 91.4 88.9 ESE SSE97-03 lone A R. OAK 20.7 17.1 1.91 SW NONE97-04 cubs A R. OAK 13.6 9.0 1.5 2.31 130.0 280.0 2.5 87.0 66.0 NE SW97-05 cubs A C. OAK 5.4 5.4 5.4 1.65 99.5 37.0 1.3 64.0 61.5 ENE SSW97-07 cubs A R. OAK 25.4 12.2 5.8 1.97 0.0 56.0 2.5 68.0 66.0 NNW NONE97-09 cubs A R. OAK . 8.3 4.7 2.17 34.5 26.2 5.1 59.0 65.0 NW S97-10 lone A R. OAK . . 2.2 1.74 80.0 40.0 2.5 48.0 48.0 NNW SSE97-11 cubs D C. OAK 5.0 5.0 5.0 1.71 0.0 29.0 0.0 96.0 90.0 E NONE97-12 lone A R. OAK 18.7 11.2 2.7 1.99 60.0 55.0 NW SW97-15 cubs A R. OAK 42.4 18.9 2.30 E SE

84
Appendix Table 11. Physical characteristics of ground dens used by black in the southern George Washington and Jefferson NationalForests, Virginia 1996 and 1997.
EH – entrance height (cm) EW – entrance width (cm) BMD – bedding material depth (cm)NL – Nest length (cm) NW – Nest width (cm) CL – Cavity length (cm)CW – Cavity width (cm) CH – Cavity height DSA – Den site aspectDEA – Den entrance aspect
Den BeddingID# EH EW BMD Material NL NW CL CW CH DSA DEA96-01 47.0 55.5 7.0 LEAVES 157.0 91.0 329.0 131.0 59.5 SSE SSE96-0396-04 186.0 347.0 16.0 OAK LEAVES 125.0 97.0 275.0 244.0 67.0 N NE96-06 83.6 114.2 30.6 OAK LEAVES 113.5 0.96.7 272.8 186.0 82.7 NW E96-0796-08 . SE SW96-09 29.5 71.0 0.0 78.0 106.0 195.0 124.0 57.0 S S96-12 27.0 49.5 2.5 OAK LEAVES 115.6 72.5 115.6 72.5 62.0 NE NE96-13 38.0 65.3 4.3 OAK LEAVES 58.0 74.4 325.0 155.0 71.5 E S96-1496-1596-16 69.7 48.9 0.0 NONE 69.3 72.0 132.1 94.3 67.8 NE NW96-1797-01 83.6 114.2 34.8 OAK LEAVES 129.5 121.0 272.8 186.0 82.7 NW E97-0697-08 55.9 29.3 50.0 OAK LEAVES 113.0 65.0 136.0 54.0 82.0 SE E97-13 46.0 146.1 4.0 OAK LEAVES 146.1 11.4 146.1 11.4 51.0 N NE97-16 55.2 68.8 1.9 OAK LEAVES 93.2 72.9 175.2 89.7 54.2 SW NE97-18 49.2 50.2 2.2 OAK LEAVES 81.0 72.0 102.0 98.0 74.0 N E

85
Appendix Table 12. Habitat characteristics of black bear den sites in the southern George Washington and Jefferson NationalForests, Virginia 1996 and 1997.
Type – Den type (G=ground;T=tree) DSA – den site aspect DEA – Den entrance aspectBA - Basal area LT – Large tree density1 MT – Medium tree density2
ST – Small tree density3 SD – Stem density (stems/ha)
Den Id# Type DSA DEA Slope BA LT MT ST SD96-01 G 22.5 50 110 110 110 2220096-02 T96-03 G96-04 G N NE 40 150 110 110 0 220096-05 T N N 35 120 110 110 340 380096-06 G NW E 36 80 110 230 110 610096-07 G96-08 G SW 22.5 70 110 110 570 720096-09 G S S 27 80 220 220 110 200096-10 T E E 25.5 70 0 110 0 530096-11 T NW 28.5 90 110 110 0 670096-12 G NE NE 44 60 0 220 570 270096-13 G E S 36 80 0 0 110 760096-14 G96-15 G96-16 G NE NW 60 70 110 0 11250 550096-17 G96-18 T E SW 54 50 110 0 0 53001Large trees had a DBH > 50.8 cm and were reported as (#/ha)2Medium trees had a DBH between 25.5 – 50.8 cm and were reported as (#/ha)3Small trees had a DBH between 12.7 – 25.4 cm and were reported as (#/ha)

86
Appendix Table 12. Cont.
Den Id# Type DSA DEA Slope BA LT MT ST SD96-19 T S 24.5 150 110 110 110 300096-20 T S W 42 80 110 110 450 690096-21 T NE 19 60 0 110 340 1320097-01 G NW E 36 80 110 230 230 640097-02 T 27 50 0 0 680 310097-03 T SW 19 90 110 0 230 1330097-04 T NE SW 47 80 0 0 680 190097-05 T NE SW 72.5 70 0 230 450 440097-06 G97-07 T NW 19.5 80 110 110 110 530097-08 G E 30 100 0 0 1480 480097-09 T NW S 30.5 60 0 0 450 970097-10 T NW 21.5 60 110 110 340 80097-11 T E 38 70 110 0 570 240097-12 T NW SW 25 70 0 230 340 860097-13 G N NE 25.5 70 0 0 680 2360097-15 T E . 45 110 230 230 110 240097-16 G SW NE 46 80 0 230 340 990097-18 G N E 23 40 0 230 230 7500
87
Vita
Christopher W. Ryan
Christopher William Ryan was born in Morgantown, West Virginia on December28, 1972 to William and Carolyn Ryan. He graduated from Morgantown High School inJune 1991. He attended West Virginia University where he received his Bachelor ofScience Degree in Wildlife and Fisheries Management in 1995. He began work hisMaster’s of Science Degree in Wildlife Science at Virginia Polytechnic Institute andState University in August 1995.