reproductions supplied by edrs are the best that can be ... · pdf filenational center for...
TRANSCRIPT

DOCUMENT RESUME
ED 453 590 EA 031 035
AUTHOR NAthanson, Jeanne H.
TITLE The Condition of Education 2000 in Brief.INSTITUTION National Center for Education Statistics (ED), Washington,
DC.
REPORT NO NCES-2001-045PUB DATE 2001-05-00NOTE 39p.; For the 2000 full report, see ED 437 742.AVAILABLE FROM ED Pubs, P.O. Box 1398, Jessup, MD 20794-1398. Tel:
877-433-7827 (Toll Free); Fax: 202-512-2250; Web site:http://nces.ed.gov/pubsearch/.
PUB TYPE Numerical/Quantitative Data (110) Reports - Descriptive
(141)
EDRS PRICE MF01/PCO2 Plus Postage.DESCRIPTORS Educational Change; *Educational Practices; Educational
Trends; Elementary Secondary Education; National Surveys;Program Evaluation; *School Statistics
IDENTIFIERS *Condition of Education (NCES); Educational Indicators
ABSTRACTThis report is an indicator summary, synopsizing the state
of education, monitoring important developments, and showing trends in majoraspects of education. It contains a sampling of charts of the 67 indicatorsin "The Condition of Education 2000." Graphs depict past and projected trendsin elementary, secondary, and postsecondary school enrollment; racial-ethnicdistribution of public school students; language spoken at home by Hispanicstudents; high performance in mathematics and science; trends in theachievement gap in reading between white and black students; internationalcomparisons of student performance in mathematics; annual earning of youngadults; educational plans; first-time kindergartners' approaches to learning;remediation and degree completion; who is prepared for college; enrollment ofstudents with risk factors; sex differences in graduate/professionalenrollment; degrees earned by women; educational attainment; coursetaking inmathematics and science; kindergarten class sizes; student/teacher ratios;instructional environments in Eighth grade mathematics; students' Internetusage; school choice and parental satisfaction; preparation andqualifications of public school teachers; perceived impact of professionaldevelopment; age of school buildings; distance learning in postsecondaryeducation; services for disabled postsecondary students; before- andafter-school care; disparity in public school finance; and financialpreparation for postsecondary education. (RT)
Reproductions supplied by EDRS are the best that can be madefrom the original document.

II I
EST COPY AVAILABLE
U.S. DEPARTMENT OF EDUCATIONOff ice of Educational Research and Improvement
EDUCATIONAL RESOURCES INFORMATIONCENTER (ERIC)
VThis document has been reproduced asreceived from the person or organizationoriginating it.
El Minor changes have been made toimprove reproduction quality.
° Points of view or opinions stated in thisdocument do not necessarily representofficial OERI position or policy.

\ATIO\ALCE\TER
FOR
EDUCATIO\
STATISTICS
U S Depairmcntof Education
50
40
30
Office of Fclucational RLseaich t
and Impi ovement
NCES 2001-045
"
'
4,

U.S. Department of EducationRod PaigeSecretary
National Center for Education StatisticsGary W. PhillipsActing Commissioner
The National Center for Education Statistics (NCES) is the primary federal entity for collecting, analyzing, and reporting data related to education in the UnitedStates and other nations. It fulfills a congressional mandate to collect, collate, analyze, and report full and complete statistics on the condition of education in theUnited States; conduct and publish reports and specialized analyses of the meaning and significance of such statistics; assist state and local education agencies inimproving their statistical systems; and review and report on education activities in other countries.
NCES activities are designed to address high priority education data needs; provide consistent, reliable, complete, and accurate indicators of education status andtrends; and report timely, useful, and high quality data to the U.S. Department of Education, the Congress, the states, other education policymakers, practitioners,data users, and the general public.
We strive to make our products available in a variety of formats and in language that is appropriate to a variety of audiences. You, as our customer, are the bestjudge of our success in communicating information effectively. If you have any comments or suggestions about this or any other U.S. Department of Education,National Center for Education Statistics product or report, we would like to hear from you. Please direct your comments to:
National Center for Education StatisticsOffice of Educational Research and ImprovementU.S. Department of Education1990 K Street, NWWashington, DC 20006-5574
May 2001
The NCES World Wide Web Home Page is: http://NCES.ed.goyThe NCES World Wide Web Electronic Catalog is: http://nces.ed.gov/pubsearch/index.asp
Suggested Citation:
U.S. Department of Education, National Center for Education Statistics, The Condition of Education 2000 in Brief, Jeanne H. Nathanson, NCES 2001 -045, Washington,DC: U.S. Government Printing Office, 2001.
For ordering information on this report, write:
U.S. Department of EducationED PubsP.O. Box 1398Jessup, MD 20794-1398
or call toll free 1-877-4ED-PUBS

The following charts are a sample of the 67 indicators contained in The Condition of Education 2000 and have been sequentially numbered for thispublication. The table of contents offers a cross reference between the two publications. The indicator numbers cited in parantheses correspond to theindicators as presented in The Condition of Education 2000.
Since 1870, the federal government has been gathering data about students, teachers, schools, and education funding.The U.S. Department ofEducation's National Center for Education Statistics (NCES) annually publishes a statistical report on the status and progress of education in the UnitedStates. The Condition of Education includes data and analysis on a wide variety of issues.The indicators in the 2000 edition are in six sections:
Participation in Education
Learner Outcomes
Student Effort and Academic Progress
Quality of Elementary and Secondary Educational Environments
The Context of Postsecondary Education
Societal Support for Learning
The indicators in the publication use data from government and private sources. The publication includes an essay on what students know as they enterschool, as well as additional tables and notes related to each indicator.
Until supplies are exhausted,a single copy of The Condition of Education 2000 (NCES 2000-062) may be obtained at no cost from ED Pubs (1-8/7-4ED-Pubs).
This report, as well as many other NCES products, are also available on the NCES Internet site at http://nces.ed.gov.
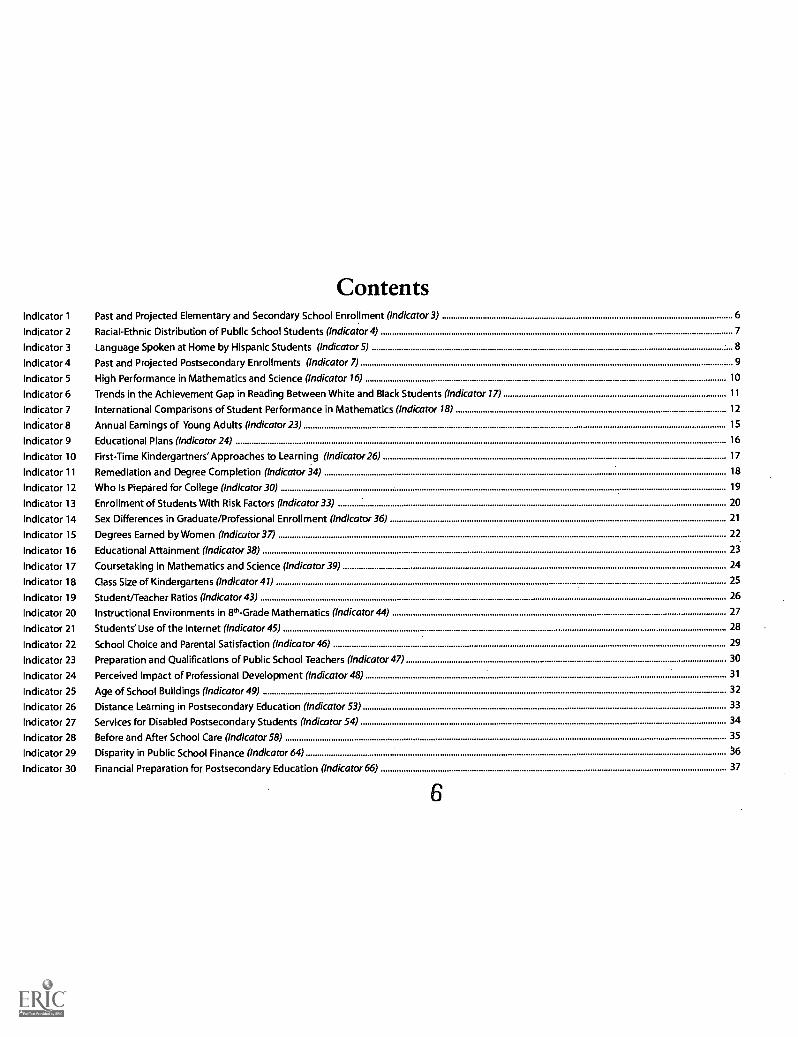
ContentsIndicator 1 Past and Projected Elementary and Secondary School Enrollment (Indicator 3) 6
Indicator 2 Racial-Ethnic Distribution of Public School Students (Indicator 4) 7
Indicator 3 Language Spoken at Home by Hispanic Students (Indicator 5) 8
Indicator 4 Past and Projected Postsecondary Enrollments (Indicator 7) 9
Indicator 5 High Performance in Mathematics and Science (Indicator 16) 10
Indicator 6 Trends in the Achievement Gap in Reading Between White and Black Students (Indicator 17) 11
Indicator 7 International Comparisons of Student Performance in Mathematics (Indicator 18) 12
Indicator 8 Annual Earnings of Young Adults (Indicator 23) 15
Indicator 9 Educational Plans (Indicator 24) 16
Indicator 10 First-Time Kindergartners' Approaches to Learning (Indicator 26) 17
Indicator 11 Remediation and Degree Completion (Indicator 34) 18
Indicator 12 Who Is Piepared for College (Indicator 30) 19
Indicator 13 Enrollment of Students With Risk Factors (Indicator 33) 20
Indicator 14 Sex Differences in Graduate/Professional Enrollment (Indicator 36) 21
Indicator 15 Degrees Earned by Women (Indicator 37) 22
Indicator 16 Educational Attainment (Indicator 38) 23
Indicator 17 Coursetaking in Mathematics and Science (Indicator 39) 24
Indicator 18 Class Size of Kindergartens (Indicator 41) 25
Indicator 19 Student/Teacher Ratios (Indicator 43) 26
Indicator 20 Instructional Environments in 8th-Grade Mathematics (Indicator 44) 27
Indicator 21 Students' Use of the Internet (Indicator 45) 28
Indicator 22 School Choice and Parental Satisfaction (Indicator 46) 29
Indicator 23 Preparation and Qualifications of Public School Teachers (Indicator 47) 30
Indicator 24 Perceived Impact of Professional Development (Indicator 48) 31
Indicator 25 Age of School Buildings (Indicator 49) 32
Indicator 26 Distance Learning in Postsecondary Education (Indicator 53) 33
Indicator 27 Services for Disabled Postsecondary Students (Indicator 54) 34
Indicator 28 Before and After School Care (Indicator 58) 35
Indicator 29 Disparity in Public School Finance (Indicator 64)
Indicator 30 Financial Preparation for Postsecondary Education (Indicator 66) 37

Indicator 1 Elementary/Secondary Education
Past and ProjectedElementary andSecondary SchoolEnrollment
After declining during the 1970s and early 1980s, public school enrollment for grades 1-12 increasedduring the latter part of the 1980s and the 1990s, reaching a projected 43.2 million in 1999. It is projectedto be 43.5 million in fall 2000. Public school enrollment for grades 1-12 is projected to continue increas-ing through the first half of this decade to an all-time high of 44.4 million students in 2006, and then tobegin declining slightly.
The regional distribution of students in public schools has changed since the 1970s, with a large increase inthe total share of enrollment occurring in the West. Declining shares of enrollment for the Northeast andMidwest are projected through 2009, whereas increases are expected for the West and South. These changescoincide with increased population growth in the West and South compared with other regions.
SCHOOL ENROLLMENT: Public elementary and secondary school enrollment by grade level: Fall 1965-2009
Number
50,000
40,000
30,000
(in thousands) Projected
Total
Grades 1 &
20,000 ......--- . .............. ..........Grades 9-12
10,000
SOURCE: U.S. Department of Education, NCES. Common Core
of Data, various years, and Projections of Education Statistics to
2009 (NCES 1999-038), 1999. 0 mill1965. 1969 1973
I I I1977
I.III.1.1 I I I I i
1981 1985 1989LI i i i i i
1993 1997a tiii.1 i 1,1
2001 2005 2009
Fall 'of year
Page 6 I The Condition of Education 2000 in Brief

Elementary/Secondary Education Indicator 2
In 1998, 37 percent of public school students enrolled in grades 1-12 were considered to be part of aminority group, an increase of 15 percentage points from 1972. This increase was largely due to thegrowth in the proportion of students who were Hispanic. In 1998, black and Hispanic students accountedfor 17 and 15 percent of the public school enrollment, up 2 and 9 percentage points, respectively, from1972. The percentage of students from other racial-ethnic groups also increased, from 1 percent in 1972 to5 percent in 1998.
ENROLLMENT: Percentage of public school students enrolled in grades 1-12 who were minorities, by region: October1972 98
Percent
50
40
30
20
10
O i
ii
N op m co en co N co en op en co NN N CO CO 01 05 N N 03 00 Ot O NON 01 05 01 ON 05 05 05 05 01 01 0501r-
Northeast
CO 01
ONN CO
01OS
(11
0,ON
Midwest SouthRegion
CO N01 N0,01 it
coco
cr,
coT
West
S
f Other12 Hispanic
Black
Racial-Ethnic Distributionof Public School Students
NOTE: Data not available for 1979 and 1980. In 1994,the meth-
odology for the Current Population Survey (CPS) was changed
and weights were adjusted.
SOURCE: U.S.Department of Commerce, Bureau of the Census.
October Current Population Surveys, 1972-98.
The Condition of Education 2000 in Brief I Page 7
''c'ST COPY AVAILABLE

Indicator 3 Elementary/Secondary Education
Language Spoken atHome by HispanicStudents
Information is not available for Hispanic students who did
not live with their mothers.
SOURCE: U.S. Department of Education, NCES. National House-
hold Education Survey (NHES), 1999 (Parent Interview Com-
ponent).
In 1999, 57 percent of Hispanic students in grades K-12 spoke mostly English at home, 25 percent spokemostly Spanish, and 17 percent spoke English and Spanish equally. Hispanic students who were enrolled ingrades K-5 were more likely than those enrolled in higher grades (6-8 or 9-12) to speak mostly Spanish athome (28 versus 21 and 22 percent, respectively).While over half of Hispanic students spoke mostly English at home, language usage varied according totheir mothers' place of birth. Nearly 90 percent of the students whose mothers were born in the UnitedStates spoke mostly English at home, while 28 percent of the students whose mothers were not U.S. borndid so.
Hispanic students who spoke mostly Spanish at home had parents who had less education than those whospoke mostly English at home.
LANGUAGE SPOKEN AT HOME: Percentage of Hispanic students who spoke English or Spanish at home, by mother's place
of birth and grade level: 1999Percent
100
Page 8 I The Condition of Education 2000 in Brief
80
60
90
Hispanic students whose mothers were92 born in the United States
86
20
Hispanic students whose mothers were notborn in the United States*
10
5 4 4 4
49
Spoke mostly Spoke English Spoke mostlyEnglish and Spanish Spanishat home equally at home at home
Spoke most y Spoke English Spoke mostlyEnglish and Spanish Spanishat home equally at home at home
Grades K-5 LI Grades 6-8 52 Grades 9-12
BEST COPY AVADLABLE

Undergraduate Education Indicator 4
In the 1970s, part-time enrollment increased at a faster rate than did full-time enrollment, but the majorityof students were still enrolled full time. More students attend 4 -year institutions than 2-year institutions.Four-year enrollment has consistently increased over the past three decades and is expected to increase ata rate at least one and one-half times the rate of 2-year enrollment in the next decade.
The total number of women enrolled in degree-granting 2- and 4-year postsecondary institutions exceededthe number of men enrolled by 1980. The number and proportion of students in higher education who arewomen are projected to reach new highs in the next decade.
POSTSECONDARY ENROLLMENT: Total undergraduate enrollment in degree-granting 2- and 4-year postsecondary edu-
cation institutions, with projections, by sex, enrollment status, and level: Fall 1970-2009
Enrollment (in thousands)
12,000
11,000
10,000
9,000
8,000
7,000
6,000
5,000
4,000
3,000
2,000
1,000
Projected
Female
-Male
0 i Ili I I
1970 1980 1990 2000 2009 1970 1980 1990 2000 2009 1970 1980 1990 2000 2009Year
1970 -96: Actual 1997 -2009: Projected
10
Past and ProjectedPostsecondary
Enrollments
SOURCE: U.S. Department of Education, NCES. Digest of Edu-
cation Statistics 1998 (NCES 1999-036), 1999, Digest of Edu-
cation Statistics 1999 (NCES 2000-031),2000, and Projections
of Education Statistics to 2009 (NCES 1999-038), 1999.
The Condition of Education 2000 in Brief I Page 9
BEST COPY AVAILABLE

Indicator Academic Outcomes
High Performance inMathematics and Science
For both mathematics and science performance as assessed by the National Assessment of EducationalProgress (NAEP), a greater percentage of 17-year-old students scored at or above 300 in 1996 than in 1978(for mathematics) or 1977 (for science). For mathematics, the percentage of students scoring at or above300 remained stable from 1978 to 1982, was greater in 1990 than in 1982, and remained stable againbetween 1990 and 1996. For science, the percentage of students scoring at 300 or above decreased be-tween 1977 and 1982, but then increased between 1982 and 1996.
Trends in high mathematics performance were slightly different for females than males. In 1978, maleswere slightly more likely than females to score at or above 300 on the mathematics assessments; in 1996,males and females were as likely to score at or above 300.
HIGH PERFORMANCE: Percentage of 17-year-old students scoring at or above 300 on the NAEP mathematics and science
assessments: 1977-96
Percent100
80.
60Mathematics
4111
40Science
SOURCE: U.S.Department of Education, NCES.NAEP 1999 Trends
in Academic Progress (NCES 2000-469),2000.
20
0,1978 1982 1986 1990
I
1992 1994 19961977
Page 10 I The Condition of Education 2000 in Brief
Year
11

Academic Outcomes Indicator 6
Since 1971, black 9-, 13-, and 17-year-olds have had lower reading scores on the National Assessment ofEducational Progress (NAEP), on average, than those of their white peers. However, the average differencebetween black and white students' scores has changed over time. There has been an overall narrowing inthis achievement gap since 1971, most of which is due to decreases that occurred before 1988.
One indication of the meaning of these score changes for the achievement of black students is that in 1971the average reading score of black 17-year-olds (239) was below that of white 13-year-olds (261). By 1988the average reading score of black 17-year-olds (274) was between that of white 17-year-olds (295) and
white 13-year-olds (261).
READING ACHIEVEMENT GAP: Difference in average reading performance of 9-, 13-, and 17-year-old white and black
students: 1971-96
Scale score difference60
50
40
30
20
10
0
Age 17
Age 13
1971 1975 1980 1984
Year
1988 1990 1992 1994 1996
12
Trends in theAchievement Gap in
Reading Between Whiteand Black Students
SOURCE: U.S.Department of Education,NCES. NAEP 1999 Trends
in Academic Progress (NCES 2000-469),2000.
The Condition of Education 2000 in Brief I Page 11

Indicator 7 Academic Outcomes
InternationalComparisons of StudentPerformance inMathematics
' In most countries.
Did not satisfy one or more of the sampling or other guide-
lines. In the final year of secondary school, this included the
United States. Latvia is designated LSS for Latvian-speaking
schools only
SOURCES: U.S. Department of Education, NCES. Pursuing Excel-
lence: A Study of U.S. Fourth-Grade Mathematics and Science
Achievement in International Context (NCES 97-255),1997; U.S.
Department of Education, NCES. Pursuing Excellence: A Study of
U.S. Eighth-Grade Mathematics and Science Teaching, Learning,
Curriculum, and Achievement in International Context (NCES 91-
198),1996; U.S.Department of Education, NOES. Pursuing Excel-
lence: A Study of U.S. Twelfth-Grade Mathematics and Science
Achievement in International Context (NCH 98-049),1998.
On the Third International Mathematics and Science Study (TIMSS) conducted in 1995, U.S. students atthe 4th-grade level scored, on average, above the international average in mathematics, performed abovetheir peers in 12 countries, and scored lower than their peers in 7 countries in mathematics.
Both 8th- and 12th-grade students in the United States scored below the international averages in mathemat-ics. Of the 41 nations participating at the 8th-grade level, the average student in the United States scoredhigher than their peers in 7 countries and was outperformed by students in 20 countries. Of the 21 nationsparticipating at the final year of secondary school level, U.S. students scored, on average, below the aver-age student in 14 other countries and above the average student in 2 other countries.Sex gaps in mathematics performance were apparent in some of the participating countries. In the UnitedStates, males and females scored similarly at all three grade levels. Female students did not score higherthan male students at any grade level in any country.
MATHEMATICS PERFORMANCE: Average mathematics performance of 4°r- grade' students: 1995
Average score relative to U.S. Country
Significantly higher Austria2 Korea
Czech Republic Netherlands'
Hong Kong Singapore
Japan
Not significantly different Australia' Ireland
Canada Israel'
Hungary' Slovenia'
Significantly lower Cyprus Latvia (LSS)2
England New Zealand
Greece Norway
Iceland Portugal
International average Scotland
Iran, Islamic Republic Thailand'
Kuwait'
Page 12 I The Condition of Education 2000 in Brief
BEST COPY AMA ! LAKE
13

Academic Outcomes Indicator 7Continued
MATHEMATICS PERFORMANCE: Average mathematics performance of 8th-grade students:1995
NIS
Average score relative to U.S. Country
Significantly higher Australia' Ireland
Austria' Japan
Belgium (Flemish) Korea
Belgium (French)' Netherlands'
Bulgaria' Russian Federation
Canada Singapore
Czech Republic Slovak Republic
France Slovenia'
Hong Kong Sweden
Hungary Switzerland
International average
Not significantly different Denmark' New Zealand
England Norway
Germany' Romania'
Greece' Scotland'
Iceland Spain
Israel' Thailand'
Latvia (LSS)
Significantly lower Colombia' Lithuania
Cyprus Portugal
Iran, Islamic Republic South Africa'
Kuwait'
14
BEST COPY MORE
InternationalComparisons of Student
Performance inMathematics
' In most countries.
Did not satisfy one or more of the sampling or other guide-
lines. In the final year of secondary school, this included the
United States. Latvia is designated LSS for Latvian-speaking
schools only.
SOURCES: U.S. Department of Education, NCES. Pursuing Excel-
lence: A Study of U.S. Fourth-Grade Mathematics and Science
Achievement in International Context (NCES 97-2551,1997; U.S.
Department of Education, NCES. Pursuing Excellence: A Study of
U.S. Eighth-Grade Mathematics and Science Teaching, Learning,
Curriculum, and Achievement in International Context{ NCES 97
198), 1996; U.S.Department of Education, NCES. Pursuing Excel-
lence.. A Study of U.S. Twelfth-Grade Mathematics and Science
Achievement in International Context (NCES 98-0491,1998.
The Condition of Education 2000 in Brief I Page 13

Indicator 7Continued Academic Outcomes111111MilENIMMI
InternationalComparisons of StudentPerformance inMathematics
' Did not satisfy one or more of the sampling or other guide-
lines. In the final year of secondary school, this included the
United States. Latvia is designated LSS for Latvian-speaking
schools only.
SOURCES: U.S. Department of Education, NCES.Pursuing Excel-
lence: A Study of U.S. Fourth-Grade Mathematics and Science
Achievement in International Context (NCES 97-255),1997; U.S.
Department of Education, NCES. Pursuing Excellence: A Studyof
U.S. Eighth-Grade Mathematics and Science reaching, Learning,
Curriculum, and Achievement in International Context (NCES 97
198),1 996; U.S. Department of Education, NCES. Pursuing Excel-
lence: A Study of U.S. Twelfth-Grade Mathematics and Science
Achievement M International Context (NCES 98-049),1998.
MATHEMATICS PERFORMANCE: Average mathematics performance of students in their final year of secondary school:
1995
Average score relative to U.S. Country
Significantly higher
Not significantly different
Australia' International average
Austria' Netherlands'
Canada' New Zealand
Denmark' Norway'
France' Slovenia'
Germany' Sweden
Hungary Switzerland
Iceland'
Czech Republic Lithuania
Italy' Russian Federation
Significantly lower Cyprus' South Africa'
Page 14 I The Condition of Education 2000 in Brief1 5
BEST COPY AVA@ LAME
Economic Outcomes Indicator 8
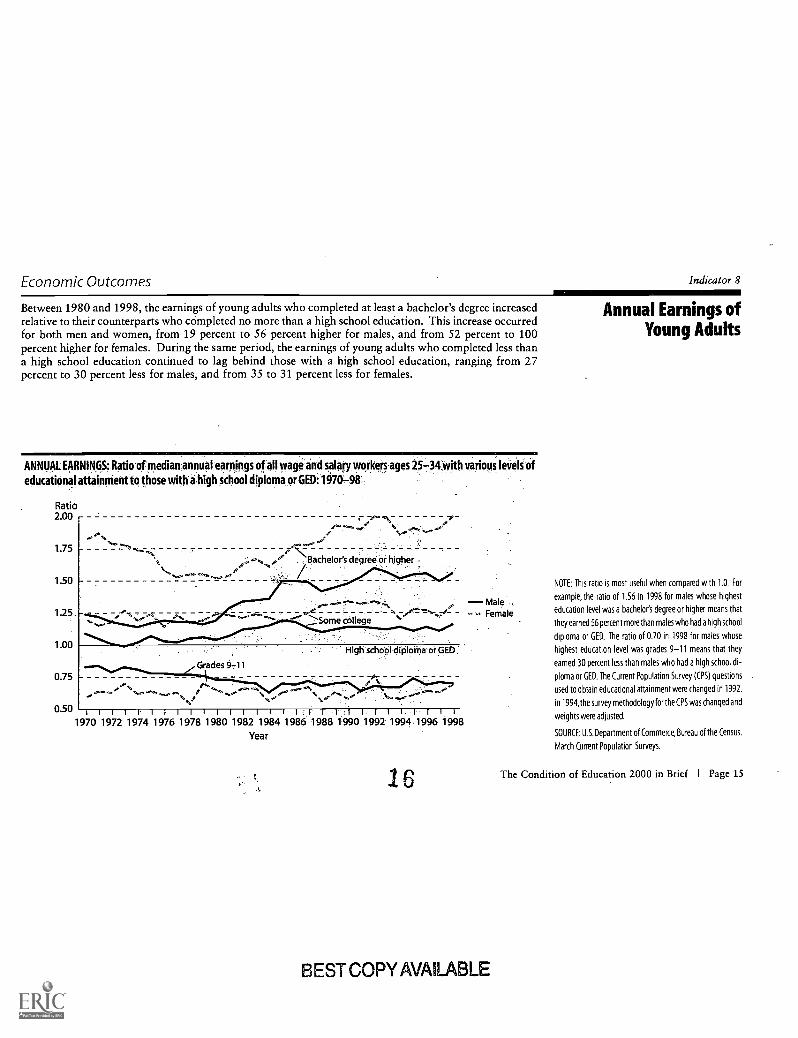
Between 1980 and 1998, the earnings of young adults who completed at least a bachelor's degree increasedrelative to their counterparts who completed no more than a high school education. This increase occurredfor both men and women, from 19 percent to 56 percent higher for males, and from 52 percent to 100percent higher for females. During the same period, the earnings of young adults who completed less thana high school education continued to lag behind those with a high school education, ranging from 27percent to 30 percent less for males, and from 35 to 31 percent less for females.
ANNUAL EARNINGS: Ratio of median annual earnings of all wage and salary workers ages 25-34 with various levels of
educational attainment to those with a high school diploma or GED: 1970-98
Ratio2.00
1.75
1.50
1.25
1.00
0.75
0.501970 1972 1974 1976 1978 1980 1982 1984 1986 1988 1990 1992 1994 1996 1998
Year
44 4/ 4.4
F
om°7 \,` Bachelor's degree or higher
-®`z, ,AT
MaleFemale
Some college '"
High: school diploma or GED
Grades 9-11
.4.
/6
BEST COPY AVAILABLE
Annual Earnings ofYoung Adults
NOTE: This ratio is most useful when compared with 1.0. For
example, the ratio of 1.56 in 1998 for males whose highest
education level was a bachelors degree or higher means that
they earned 56 percent more than males who had a high school
diploma or GED. The ratio of 0.70 in 1998 for males whose
highest education level was grades 9-11 means that they
earned 30 percent less than males who had a high school di-
ploma or GED. The Current Population Survey (CPS) questions
used to obtain educational attainment were changed in 1992.
In 1994, the survey methodology for the CPS was changed and
weights were adjusted.
SOURCE: U.S. Department of Commerce, Bureau of the Census.
March Current Population Surveys.
The Condition of Education 2000 in Brief I Page 15

Indicator 9 Student Attitudes and Aspirations
Educational Plans
NOTE: The response rates for this survey do not meet NCES
standards. Students were asked how likely it was that they
would participate in different types of postsecondary educa-
tion. The response options were "definitely will," "probably
will: "probably won't," and "definitely won't"
SOURCE: U.S. Department of Education, NCES. Trends in Edu-
cational Equity for Girls and Women (NCES 2000-030), 2000
(1980 and 1990 data); University of Michigan, Institute for So-
cial Research,Monitoring the Future Study (1997 data).
The percentage of 126-graders who said they "definitely will" complete a bachelor's degree increasedconsiderably between 1980 and 1997 (from 35 to 56 percent). The proportion who said they "definitelywill" attend graduate or professional school nearly doubled during the same period, from 11 to 21 percent.The percentage of students who definitely planned to complete a 2-year college program increased be-tween 1980 and 1990, but that percentage did not change between 1990 and 1997. The percentage of 12th-grade students who definitely planned to attend a technical vocational school declined slightly from 1980to 1997.
In 1980, 1990, and 1997, women were more likely than men to report definite plans to complete 2-yeardegrees. In 1980, there was no sex difference in the percentage with definite plans to complete a 4-yeardegree, but in 1997, females were more likely than males to have such plans. In 1980, males were slightlymore likely than females to report definite plans to attend graduate/professional school, but in 1997, thatsex difference was reversed (24 percent of females versus 17 percent of males).
STUDENTS'EDUCATIONAL PLANS: Percentage of high school seniors who reported definite plans for postsecondary edu-
cation, by type of program:1980, 1990, and 1997
Type of program
Attend a technical/vocational school
Graduate from a2-year college program
Graduate from a4-year college program
Attend graduate orprofessional school
after college
Page 16 I The Condition of Education 2000 in Brief
1216
16
35
1980
0 1990
M 1997
17
BEST COPY AVAILABLE

Student Effort Indicator 10
In 1998, kindergarten teachers reported that 71 percent of first-time kindergartners persisted at tasks, 75percent seemed eager to learn, and 66 percent paid attention often or very often.
Teachers perceived girls to be more likely than boys to persist at tasks, to be eager to learn, and to payattention often or very often.Children of mothers with lower levels of education were perceived as generally less likely than childrenwhose mothers had higher levels of education to persist at tasks, to be eager to learn, and to pay attentionoften or very often.Teachers perceived white and Asian children to be more likely than black or Hispanic children to persist attasks, to be eager to learn, and to pay attention often or very often.
APPROACHES TO LEARNING: Percentage of first-time Idndergartners whose teachers reported that they persist at tasks,
are eager to learn, and pay attention "often or very often," by sex: Fa111998
Percent
100
80
60
40
20
0
78 7874
Eager to learn
Boys 0 Girls
18
First-TimeKindergartners'
Approaches to Learning
SOURCE: U.S.Department of Education, NCES. Early Childhood
Longitudinal Study,"Kindergarten Class of 1998-99,"Fall 1998.
The Condition of Education 2000 in Brief I Page 17
BEST COPY AVAILABLE

Indicator 11
Remediation and DegreeCompletion
NOTE: The patterns of remedial coursework are mutually ex-
clusive, starting with 'any remedial reading" and proceed-
ing downward. Thus, no student included in a pattern is in-
cluded in any pattern below. Students who attended only
sub-baccalaureate vocational/technical schools are not in-
cluded.
SOURCE: U.S. Department of Education, NCES. High School
and Beyond Longitudinal Study of 1980 Sophomores,
"Postsecondary Education Transcript Study"(HS&B:So PETS).
Postsecondary Persistence and Progress
Among 1982 high school graduates who took any postsecondary remedial reading, 42 percent were inthree or more other remedial courses, and 67 percent took remedial mathematics. In contrast, amongstudents who stook any postsecondary remedial mathematics courses, 16 percent were in three or moreremedial courses and 24 percent took remedial reading.
Students who took only one remedial course (other than remedial mathematics or reading) completeddegrees at the same rate as students who took no remedial courses (55 and 56 percent, respectively).
A higher percentage of community college students than 4-year college students are assigned to remedialcourses.
REMEDIATION AND COMPLETION: Percentage of postsecondary education students with varying patterns of remedial
courses who complete 2- or 4-year degrees: 1980-93
Remedial courses
Any remedial reading
Two or fewer remedialcourses: mathematics only
Two or more remedial coursesbut no reading courses
One remedial course, notmathematics or reading
Page 18 I The Condition of Education 2000 in Brief
No remedial courses
34
43
45
55
56
0 10 20 30 40 50 60Percent
BEST COPY Mil LAB LE
19

Transitions to College Indicator 12
Eighty-six percent of 1992 high school graduates from families with high incomes ($75,000 or more) wereat least minimally academically qualified for admission to a 4-year institution, compared with 68 percentof those from middle income ($25,000-74,999) and 53 percent from low-income (less than $25,000)families.
High income graduates were almost twice as likely as middle-income graduates and four times as likely aslow-income graduates to be very highly qualified for 4-year college admission.
Asian/Pacific Islander and white graduates were more likely than black and Hispanic graduates to be atleast minimally qualified for 4-year college admission. The proportion of very highly qualified graduateswas largest among Asians/Pacific Islanders.
QUALIFIED FOR COLLEGE: Percentage of 1992 high school graduates qualified for admission at a 4-year institution, by
level of qualification and family income
Family income
Less than $25,000
$25,000-74,999
$75,000 or more
14 19
lo
V7 1/5
0 20 40 60Percent
ra Very highly qualified .511 Highly qualified C1 Somewhat qualified n Minimally qualified
80
20
BEST COPY AVAILABLE
100
Who Is Preparedfor College
NOTE: The 4-year College Qualification Index is based on high
school GPA, senior class rank,NELS 1992 aptitude test,SAT or
ACT scores,and curricular rigor.
SOURCE: U.S. Department of Education, NOES. National Edu-
cation Longitudinal Study of 1988 Eighth Graders,"Third Fol-
low-up" (NELS:1988/1994).
The Condition of Education 2000 in Brief I Page 19
BEST COPY AVAILABLE

Indicator 13 Transitions to College
Enrollment of StudentsWith Risk Factors
NOTE: Percentages may not add to 100 due to rounding.
SOURCE: U.S.Department of Education, NCES. National Edu-
cation Longitudinal Study of 1988 Eighth Graders (NELS:1988/
1994), Data Analysis System.
About 58 percent of all 1992 high school graduates had at least one factor in their family background orschool experiences prior to entering high school that placed them at some risk of lower educational attain-ment. However, 35 percent of these graduates with risk factors not only finished high school, but alsoenrolled in a 4-year college or university within two years of their high school graduation (and 68 percentenrolled in some type of postsecondary institution).
TRANSITION TO COLLEGE: Percentage of 1992 high school graduates with risk factors who enrolled in a 4-year college by
1994, by selected student characteristics
Student's 10th-grade aspirationsLess than a bachelor's degree
Bachelor's degree or higher 53
High school mathematicsNon- or low-academic
Algebra I and Geometry 24
Algebra!! 36
Advanced academic :68
Academic preparationNot prepared o
At least minimally prepared
Help with postsecondary applicationHigh school did not help
High school helped
Extracurricular activities: N1 09 n90e
One 31
Two or more 46
29
toe
43
Parents'highest educational levelHigh school diploma or less
Page 20 I The Condition of Education 2000 in Brief
21
Some postsecondary 32
Bachelor's degree or higher 69
57
0 10 20 30 40 50 60Percent
BEST COPY AM LAKE
21
70 80

Postseconday Persistence and Progress Indicator 14
Of those who had earned bachelor's degrees in 1992-93, the same percentages of the men and women had,by 1997, applied for admission to an advanced degree program (41 percent), been accepted (35 percent),and enrolled (30 percent).Men were more likely than women to enroll in business and management; medicine or dentistry; engineer-ing, mathematics, or computer science; and life and physical sciences.
Women were more likely than men to enroll in education, in health sciences other than medicine or den-tistry, and in social and behavioral sciences. Enrollment rates in law, arts and humanities, and "other"fields did not differ significantly by sex.
GRADUATE FIELDS: Percentage distribution of 1992-93 bachelor's degree recipients who enrolled in a graduate or first-
professional progam by 1997 according to graduate field of study, by sex
Graduate field of study
Business and management.
Medicine/dentistry
Engineering/mathematics/computer science
Life and physical sciences
Education
Other health sciences
Social and behavioral sciences
Arts and humanities
Law
Other
.1.11.11.0111.1111.11101011.11MMIONI 23
8Y, 3
14
1.111.11.111`4, 8
8 ;12
Male
ri Female
0 5 10 15 20Percent
22
25 30 35
Sex Differences inGraduate/Professional
Enrollment
NOTE: If students enrolled in more than one program, the field
corresponding to the highest level program is shown.Percent-
ages may not add to 100 due to rounding.
SOURCE: U.S. Department of Education, NCES. Baccalaureate
and Beyond Longitudinal Study, "Second Follow-up"
(B&B:1993/1997), Data Analysis System.
The Condition of Education 2000 in Brief I Page 21
BEST copy AVAILABLL

Indicator 15
Degrees Earned byWomen
* Includes other fields of study not shown separately.
SOURCE: U.S.Department of Education,NCES.1970-71 Higher
Education General Information Survey (HEGIS), "Degrees and
Other Formal Awards Conferred" survey and 1996-97 Inte-
grated Postsecondary Education Data System (IPEDS):Comple-
tions" survey.
Completions
In 1970-71, women earned 43 percent of all bachelor's degrees. They made gradual gains throughout the1970s, and in each year since the early 1980s, they have earned more than half of all the bachelor's degreesawarded. In 1996-97, they earned 56 percent of the bachelor's degrees awarded.
In certain fields (health professions and related sciences, education, English, and visual and performingarts), women earned a majority of bachelor's degrees in both 1970-71 and 1996-97.
In 1996-97, women still earned considerably less than half the bachelor's degrees in the traditionally male-dominated fields of agriculture/natural resources (39 percent), physical sciences (37 percent), computerand information sciences (33 percent), and engineering (17 percent).
BACHELOR'S DEGREES: Percentage of bachelor's degrees earned by women, by field of study: 1970-71 and 1996-97
Field of study
Total*
Health professionsand related sciences
Education
English languageand literature/letters
Visual and performing arts
Business managementand administrative services
Social sciences and history
Mathematics
Agriculture and natural resources
Physical sciences
Computer andinformation sciences
Engineering
Page 22 I The Condition of Education 2000 in Brief
43
771
75
,77:71 -""`
46
"` 3
111.11.11.`-L.12-.141" SM.:L.:3.-A 33
Li17:
6059
M 1970-71
ia 1996-97
0 20 40 60
Percent
BEST COPY MOUBLE
23
80 100

Completions Indicator 16
The percentage of 25- to 29-year-olds who completed at least high school rose from 78 percent in 1971 to88 percent in 1999. Over the same period, the percentage of high school completers in this age group whoalso completed at least some college increased from 44 to 66 percent, and the percentage who obtained abachelor's degree or higher rose from 22 to 32 percent.
The gap in attainment between white and black high school completers with at least some college remainedsimilar, and the gap between blacks and whites who completed college widened. The differences in attain-ment rates between whites and Hispanics remained about the same at every educational level.
By 1999, females had higher rates than males for completing high school and some college.
EDUCATIONAL ATTAINMENT:Percentage of 25- to 29-year-olds attaining selected levels of education, by race-ethnicity:
March 1971 and 1999Percent
100
80
60
40
20
0High schoolcompleters*
23
12 11
High school High schoolcompleters completerswith some with a bachelor's
college degree or higher
High schoo High schoo High schoolcompleter? completers completers
with some with a bachelor'scollege degree or higher
White L.1 Black [11 Hispanic
24
Educational Attainment
* Included in high school completers with some college or a
bachelor's degree or higher.
NOTE: The Current Population Survey (CPS) questions used to
obtain educational attainment were changed in 1992. In 1994,
the methodology for the CPS was changed and weights were
adjusted.
SOURCE: U.S. Department of Commerce, Bureau of the Cen-
sus. March Current Population Surveys,1971 and 1999.
The Condition of Education 2000 in Brief I Page 23
BEST COPY AVAILABLE
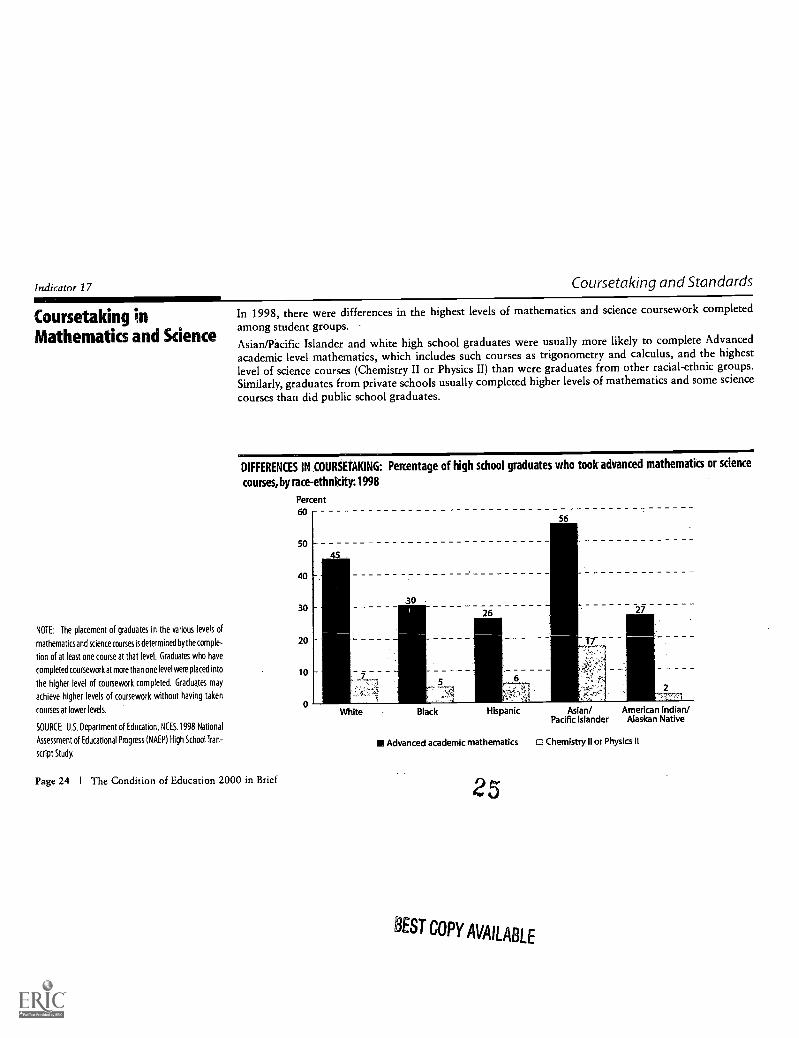
Indicator 17
Coursetaking inMathematics and Science
NOTE: The placement of graduates in the various levels of
mathematics and science courses is determined by the comple-
tion of at least one course at that level. Graduates who have
completed coursework at more than one level were placed into
the higher level of coursework completed. Graduates may
achieve higher levels of coursework without having taken
courses at lower levels.
SOURCE: U.S. Department of Education, NCES. 1998 National
Assessment of Educational Progress (NAEP) High School Tran-
script Study.
Coursetaking and Standards
In 1998, there were differences in the highest levels of mathematics and science coursework completedamong student groups.Asian/Pacific Islander and white high school graduates were usually more likely to complete Advancedacademic level mathematics, which includes such courses as trigonometry and calculus, and the highestlevel of science courses (Chemistry II or Physics II) than were graduates from other racial-ethnic groups.Similarly, graduates from private schools usually completed higher levels of mathematics and some science
courses than did public school graduates.
DIFFERENCES IN COURSETAKING: Percentage of high school graduates who took advanced mathematics or science
courses, by race-ethnicity: 1998
Percent
60
Page 24 I The Condition of Education 2000 in Brief
50
40
30
20
10
0White
30
26
56
27
Black Hispanic Asian/ American Indian/Pacific Islander Alaskan Native
Advanced academic mathematics C: Chemistry II or Physics II
25
BEST COPY AVAILABLE

Learning Opportunities Indicator 18
The average kindergarten class in public schools had 20 students in 1998. Approximately 15 percent ofthese kindergarten classrooms had 15 or fewer children enrolled; 85 percent had more than 15 childrenenrolled. The average kindergarten class in private schools had 18 children. Forty-one percent of theseclasses had 15 or fewer students and the remainder had more than 15 students.
Class size also varied by the percentage of minority children in the classroom. Kindergarten classroomswith less than 10 percent minority children were more likely to have 15 or fewer children than classroomswhere 75 percent or more of the children were minorities.
CLASS SIZE: Percentage distribution of kindergarten classrooms, by control of school and class size: Fa111998
Percent100
80
60
40
20
0
15
85
59
41
PUblic, PrivateControl of school
15 or fewer students t More than 15 students
26
BEST COPY AVAILABLE
Class Size ofKindergartens
NOTE: Percentages may not add to 100 due to rounding.
SOURCE: U.S. Department of Education, NCES.Early Childhood
Longitudinal Study,"Kindergarten Gass of 1998-99:Fa111998.
The Condition of Education 2000 in Brief I Page 25

Indicator 19 Learning Opportunities
Student/Teacher Ratios
' .0TE: Data for teachers are expressed in full-time equivalent
,FTE) units. Distribution of unclassified teachers by level is es-
timated. Distribution of elementary and secondary school
teachers by level is determined by reporting units. Included in
the totals and the elementary category are a small number of
nursery school teachers and students. Public school ratios for
1998 and private school ratios for 1971-75,1979-80,1981
82, 1984-85, and 1986-96 are estimated. Private school ra-
tios for 1997 and 1998 are projected.
SOURCE: U.S.Department of Education, NCES. Statistics of Pub-
lic Elementary and Secondary Day Schools; Common Core of
Data surveys; Private School Surveys; Projections of Education
Statistics to 2009 (NCES 1999-038), 1999; and Digest of Edu-
cation Statistics 1999 (NCES 2000-031),2000.
Student/teacher ratios were smaller in 1998 than in 1970. In 1970, there were 24 and 20 elementary andsecondary students per teacher, respectively, in public schools. In 1998, there were an estimated 19 and 14elementary and secondary students per public school teacher, respectively. Decreases in student/teacherratios also occurred at private schools, with most of them taking place during the 1970s and the 1980s.
In most years, student/teacher ratios were usually smaller at private schools than public schools and at thesecondary level than the elementary level.
STUDENTS AND TEACHERS: Student/teacher ratios: 1970-98
Page 26 I The Condition of Education 2000 in Brief
Ratio30
25
20
15
10
5
Private'elementary
`1%Public elementary/
Private secondaryPublic secondary
0 1:1 i 1.1 1 11 i i l i i r 1111970 1972 1974 1976 1978 1980 1982 1984 1986 1988 1990 1992 1994 1996 1998
Year
BEST COPY AVAILABLE
27

Learning Opportunities
A rating of the quality of the mathematical content of a subset of lessons was obtained from the ThirdInternational Mathematics and Science Study (TIMSS) Videotape Classroom Study. It found the UnitedStates lagging behind Germany and Japan in the quality of content in its 8th-grade mathematics lessons.Thirty-nine percent of the Japanese mathematics lessons and 28 percent of the German lessons received thehighest quality rating whereas none of the U.S. lessons received this rating. In addition, U.S. lessons weremore likely to receive the lowest rating (89 percent) than lessons in Germany (34 percent) or Japan (11percent).
While German and U.S. teachers emphasized mathematical skills as a goal more often than Japaneseteachers, Japanese teachers emphasized mathematical thinking more often than did their German andAmerican counterparts.
CONTENT QUALITY: Percentage .distribution of 8th-grade lessons rated as having low-, medium-, and high-quality
mathematical content: 1994-95
Germany
Country
Low as Medium CI High
28
Indicator 20
InstructionalEnvironments in
8th-Grade Mathematics
NOTE: Percentages may not add to100 due to rounding.
SOURCE: U.S. Department of Education, NCES. The TIMSSVid-
eotape Classroom Study: Methods and findings from an Ex-
ploratory Research Project on Eighth-Grade Mathematics In-
struction in Germanydapan, and the United States (NCES 1999
074), 1999.
The Condition of Education 2000 in Brief I Page 27

Indicator 21 Learning Opportunities
Students' Use of theInternet
NOTE: Analysis includes only those students in grades 1-12
who were ages 5-18.
SOURCE: U.S. Department of Commerce, Bureau of the Census.
December and October Current Population Surveys, 1998.
In 1998,78 percent of students in grades 1-12 used the Internet at school. White students in grades 1-12were more likely than black or Hispanic students to use the Internet at school (83 versus 70 and 71 percent,respectively). Students from high-income families were more likely than students from low- and middle-income families to use the Internet at school (86 versus 68 and 78 percent, respectively).
Fifty-eight percent of students in grades 1-12 had a computer in their household in 1998, but such accessvaried substantially across racial-ethnic groups. In 1998,70 percent of white students had a computer intheir household, compared with 28 percent of black or Hispanic students.
Access to a computer also varied substantially with family income: 88 percent of students from high-income families had a computer in the household, compared with 54 percent of students from middle-income families and 21 percent of students from low-income families.
INTERNET USE: Percentage of students in grades 1-12 who used the Internet for various purposes atvarious locations:
1998
Purpose and location
EmailEducational courses/
research for school
News, weather, sports
Search for information
Games, entertainment, fun
At school
At home
Outside the home
Page 28 I The Condition of Education 2000 in Brief
15
5
MI 9
12
19
Purpose for use at home
At public library 12At someone
else's computer II 30
20
25
Location
78
20 40 60Percent
29
BEST COPY AVAILABLE
80 100

School Choice Indicator 22
Between 1993 and 1999, the percentage of students in grades 3-12 attending an assigned public schooldropped from 80 to 76 percent. Black students were more likely to be in a chosen school than -white andHispanic students. Of the black and Hispanic children whose parents selected their schools, more attendeda public rather than a private school.
At private schools, a greater percentage of children had parents who were very satisfied with disciplinethan with the school or teachers in 1999.
In 1997, the percentages of students whose parents reported being very satisfied with their child's school,teachers, school's discipline, and academic standards were highest among those in private schools.
SCHOOL SATISFACTION: Percentage of students in grades 3-12 whose parents reported being very satisfied with as-
pects of their child's school, by type of choice: 1999Percent
100
80
60
40
20
0
78
53
6
75
8185
School Teachers Academicstandards
Satisfaction measure
Public-assigned Public-chosen ID Private
Discipline
30
School Choice andParental Satisfaction
NOTE: Includes those who responded"very satisfied:from a scale
of "very satisfied," somewhat satisfied: "somewhat dissatis-
fied: and "very dissatisfied." Ungraded students and
homeschoolers were excluded from the estimates.
SOURCE: U.S.Department of Education,NCES. National House-
hold Education Survey (NHES), 1999 (Parent Interview Com-
ponent).
The Condition of Education 2000 in Brief I Page 29
BEST COPY AVAILABLE
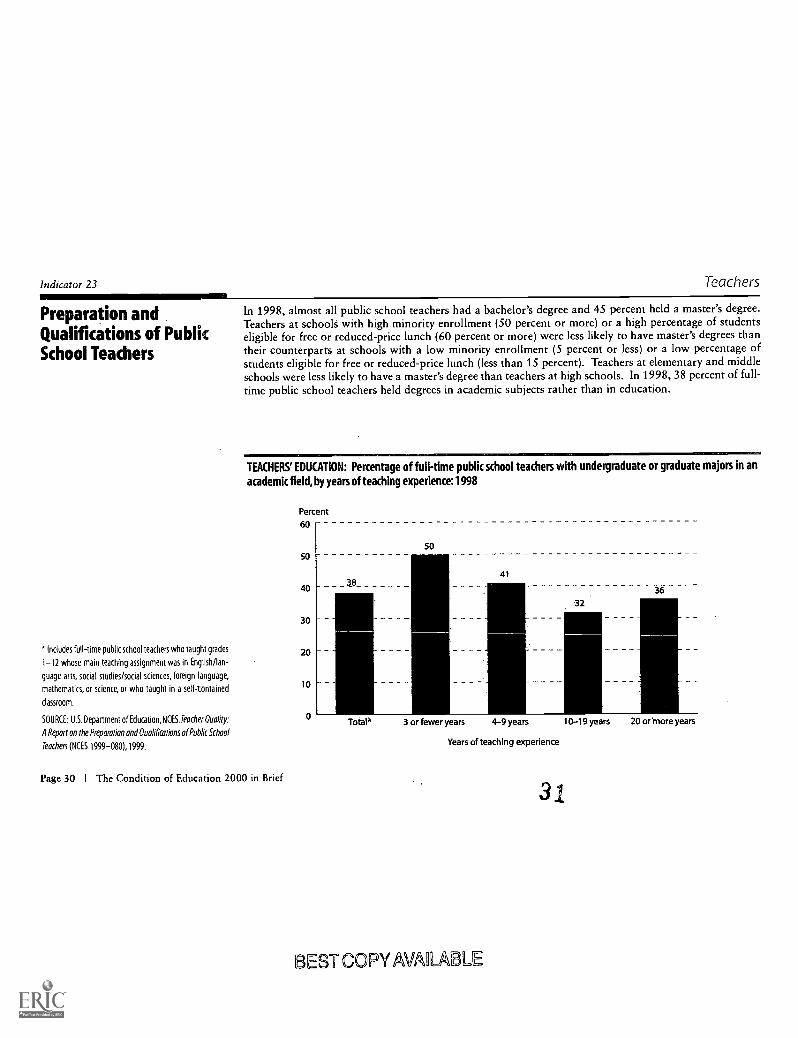
Indicator 23 Teachers
Preparation andQualifications of PublicSchool Teachers
*Includes full-time public school teachers who taught grades
1-12 whose main teaching assignment was in English /lan-
guage arts, social studies /social sciences, foreign language,
mathematics, or science, or who taught in a self-tontained
classroom.
SOURCE: U.S.Department of Education, NCES. Teacher Quality:
A Report on the Preparation and Oualifications of Public School
Teachers (NCES 1999-080), 1999.
In 1998, almost all public school teachers had a bachelor's degree and 45 percent held a master's degree.Teachers at schoolS with high minority enrollment (50 percent or more) or a high percentage of studentseligible for free or reduced-price lunch (60 percent or more) were less likely to have master's degrees thantheir counterparts at schools with a low minority enrollment (5 percent or less) or a low percentage ofstudents eligible for free or reduced-price lunch (less than 15 percent). Teachers at elementary and middleschools were less likely to have a master's degree than teachers at high schools. In 1998, 38 percent of full-time public school teachers held degrees in academic subjects rather than in education.
TEACHERS' EDUCATION: Percentage of full-time public school teachers with undergraduate or graduate majors in an
academic field, by years of teaching experience: 1998
Page 30 I The Condition of Education 2000 in Brief
Percent
60
5050
41
4038
36
32
30
20
10
0Total. 3 or fewer years 4-9 years 10-19 years 20 orOlore years
Years of teaching experience
BEST COPY AVAlliABLE
31

Teachers Indicator 24
In 1998, the percentage of full-time public school teachers who participated in professional developmentactivities in the past 12 months ranged from 81 percent (implementing state or district curriculum andperformance standards) to 31 percent (addressing the needs of students with limited English proficiency orfrom diverse cultural backgrounds).
In 1998, 12 percent of teachers who participated in an in-depth study in the subject area of their mainteaching assignment for 1-8 hours believed that the activity improved their classroom teaching "a lot,"whereas 41 percent of teachers who spent more than 8 hours participating in this activity shared the sameperception.
PARTICIPATION IN PROFESSIONAL DEVELOPMENT:Percentage of full-time public school teachers who participated in pro-
fessional development in the past 12 months who believed the activity improved their classroom teaching"a lot": 1998
Selected activities
In-depth study in subject area ofmain teaching assignment
New methods of teaching
State/district curriculum andperformance standards
Integration of educationaltechnology in grade/
subject taughtAddressing the needs of LEP
students or those from diversecultural backgrounds r
Addressing the needs ofstudents with disabilities
111 1-8 hours
rn More than8 hours
20 30Percent
50
Perceived Impact ofProfessional
Development
SOURCE: U.S. Department of Education, NCES. Teacher Quality:
A Report on the Preparation and Qualifications of Public School
Teachers (NCES 1999-080), 1999.
The Condition of Education 2000 in Brief I Page 31
BEST COPY AVAILABLE

Indicator 25 Other School Resources
Age of School Buildings
NOTE: Estimates are aggregates of data collected in 1.994,1995,
and 1996. Percentages may not add to 100 due to rounding.
SOURCE: U. S. Department of Education, NCES. How Old Are
Americo's Public Schools? (NCES 1999-048), 1999.
Nationwide, the average age of public schools is 42 years old, and 73 percent are 30 years old or older.
Across the nation, 29 percent of all public schools are in the "oldest" condition, built before 1970 and notrenovated since 1980. Sixty-one percent are "moderate" schools, built between 1970 and 1984 or before1970 and last renovated in 1980 or later. Ten percent are "newest" schools, which were built after 1984,
renovated or not.
A larger percentage of public schools in the Central region than in the Southeast are in the oldest category(36 versus 21 percent). In the rest of the country, 25 percent of public schools in the West and 33 percentin the Northeast are among the oldest. A smaller percentage of schools in the Central and Northeastregions than in the West are in the newest category (6 and 5 percent, respectively, versus 15 percent).Eleven percent of public schools in the Southeast are considered newest.
CONDITION OF SCHOOLS:Percentage distribution of public schools according to school condition,by region: 1994-96
Page 32 I The Condition of Education 2000 in Brief
Percent
100
80
60
40
20
0
62
3
21
5
Northeast Southeast
68
57 59
25
Central
Region
Oldest 0 Moderate 0 Newest
33
BEST COPY AVAILABLE
West

Learning Opportunities Indicator 26
Increasing numbers of institutions, particularly in the public sector, have begun offering distance learning.Among public 4-year institutions, the percentage offering such courses grew from 62 percent in fall 1995to 79 percent in 1997-98, and in public 2-year institutions, rising from 58 to 72 percent. In 1997-98, anadditional 12 percent of public 4-year and 19 percent of public 2-year institutions planned to offer them inthe next 3 years.Total enrollment in distance education courses across all postsecondary degree-granting institutions ap-proximately doubled from 1995 to 1997-98, from 754,000 to 1.6 million.
DISTANCE EDUCATION COURSES: Percentage of postsecondary, degree-granting institutions that offered distance edu-
cation courses, by institution type: Fa111995 and 1997-98
Percent100
80
60
40
20
Public 2-year Public 4-yearInstitution type
Fall 1995 C5 1997-98
Private 4-year
34
BEST COPY AVAILABLE
Distance Learning inPostsecondary Education
SOURCE: U.S. Department of Education, NCES. Postsecondary
Education Quick Information System,"Survey on Distance Edu-
cation Courses Offered by Higher Education Institutions," 1995;
and °Survey on Distance Education at Postsecondary Institu-
tions," 1997-98.
The Condition of Education 2000 in Brief I Page 33

Indicator 27 Special Programs
Services for DisabledPostsecondary Students
In 1995-96, about 6 percent of undergraduates reported that they had a disability. Of those with disabili-ties, 29 percent had a learning disability, 23 percent an orthopedic impairment, 16 percent a noncorrectablevision impairment, 16 percent a hearing impairment, and 3 percent a speech impairment. Compared withother students, students with disabilities were less likely to attend public 4-year institutions and morelikely to attend for-profit or less-than-4-year institutions.In 1996-97 or 1997-98, about three-quarters of 2- and 4-year postsecondary education institutions en-rolled students with disabilities, and nearly all (98 percent) of these institutions provided at least onesupport service or accommodation for students with disabilities.Although students with disabilities were more likely to attend public 2-year institutions than public 4-yearinstitutions, public 4-year institutions were more likely than public 2-year institutions to provide alterna-tive examination formats or more time to complete exams and to provide readers, notetakers, or scribes
and textbooks on tape.
SERVICES FOR DISABLED STUDENTS: Percentage of 2-year and 4-year postsecondary education institutions that enrolled
students with disabilities that offered selected services or accommodations to students with disabilities, by type of
service or accommodation:1996-97 or 1997-98
NOTE: Institutions were asked whether they provided each
service in 1996-97 or 1997-98.
SOURCE: U.S. Department of Education, NCES. Postsecondary
Education Quick Information System,"Survey on Students with
Disabilities at Postsecondary Education Institutions," 1998.
Selected service
or accommodation Total
Public Private
2-year 4-year 2-year 4-year
Alternative exam formats or more time 88 94 100 55 90
Tutors to assist with ongoing coursework 77 87 82 51 75
Readers, notetakers, scribes 69 82 93 18 66
Registration assistance or priority registration 62 77 83 26 53
Adaptive equipment/technology 58 81 80 30 39
Textbooks on tape 55 66 85 11 49
Page 34 I The Condition of Education 2000 in Brief 35
BEST COPY AVAILABLE
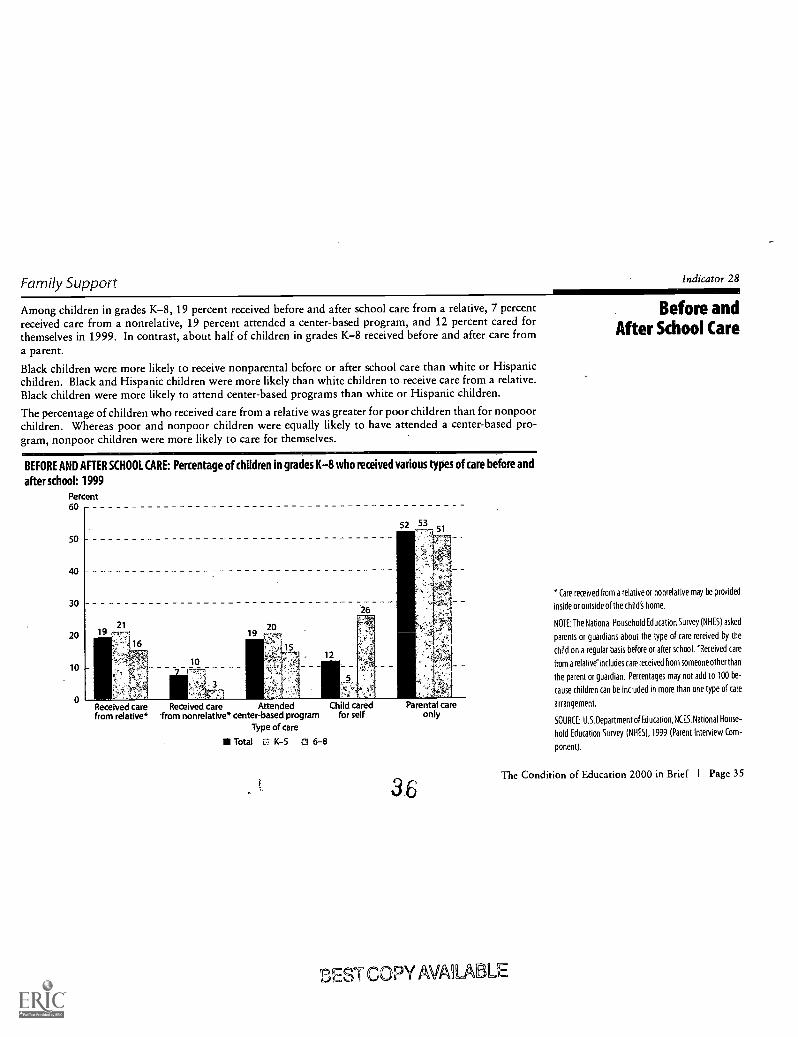
Family Support Indicator 28
Among children in grades K-8, 19 percent received before and after school care from a relative, 7 percentreceived care from a nonrelative, 19 percent attended a center-based program, and 12 percent cared forthemselves in 1999. In contrast, about half of children in grades K-8 received before and after care froma parent.Black children were more likely to receive nonparental before or after school care than white or Hispanicchildren. Black and Hispanic children were more likely than white children to receive care from a relative.Black children were more likely to attend center-based programs than white or Hispanic children.
The percentage of children who received care from a relative was greater for poor children than for nonpoorchildren. Whereas poor and nonpoor children were equally likely to have attended a center-based pro-gram, nonpoor children were more likely to care for themselves.
BEFORE AND AFTER SCHOOL CARE: Percentage of children in grades K-8 who received various types of care before and
after school: 1999
Percent60
50
30
20
10
0
10
3
12
26
Received care Received care Attended Child caredfrom relative* from nonrelative* center-based program for self
Type of care
Total K-5 CI 6-8
Parental careonly
3.6
Before andAfter School Care
* Care received from a relative or nonrelative may be provided
inside or outside of the child's home.
NOTE: The National Household Education Survey (NHES) asked
parents or guardians about the type of care received by the
child on a regular basis before or after school. °Received cam
from a relative"includes care received from someone other than
the parent or guardian. Percentages may not add to 100 be-
cause children can be included in more than one type of care
arrangement.
SOURCE: U.S. Department of Education,NCES. National House-
hold Education Survey (NHES), 1999 (Parent Interview Com-
ponent).
The Condition of Education 2000 in Brief I Page 35
BEST COPY AMIABLE

Indicator 29 Financial Support
Disparity in PublicSchool Finance
NOTE: Disparity measures for within states and among states,
and the relative shares of each, were calculated using analysis
of variance (ANOVA). Only insturctional expenditures and uni-
fied school districts are included in the analysis.
SOURCE: U.S. Department of Commerce, Bureau of the Census,
Elementary-Secondary School District Finance Data Files,
1992-93 to 1996-97.
Examination of the average per pupil expenditures on instruction of school districts between 1992-93 and1996-97 shows that the disparity in per pupil spending due to differences within states declined from 45percent of the total variation nationally in 1992-93 to 38 percent in 1994-95. Between 1994-95 and1996-97, the proportion of the differences in per pupil expenditures attributable to within-state differ-
ences increased slightly but still remained less than in 1992-93 or 1993-94.
Conversely, the proportion of the disparity in per pupil instructional expenditures due to differences amongstates rose from 55 percent of the total variation nationally in 1992-93 to 62 percent in 1994-95 andstayed between 60 and 62 percent through 1996-97.
FINANCE INEQUALITY: Percentage distribution of disparity in per-pupil instructional expenditures among and within
states: School years 1992-93 to 1996-97
Percent100 F77:77
,1
Page 36 I The Condition of Education 2000 in Brief
1992-93 1993-94 1994-95 1995-96 1996-97School year
BEST COPY AVAILABLE
37
Li Within statesAmong states

Financial Support Indicator 30
In 1999, parents of 93 percent of students in grades 6-12 expected their children to continue their educa-tion after high school, although not all had begun preparing financially. Among students in these gradeswhose parents expected them to go on to postsecondary education, parents of 55 percent reported thatthey had obtained information on or an estimate of the cost of tuition and fees, 60 percent had startedsaving money or making other financial plans, and 38 percent had talked with someone or read materialsabout financial aid.
The lower the family income, the less likely students in grades 6-12 generally were to have parents makingany of these financial preparations for their children's postsecondary education.
FINANCIAL PREPARATION: Percentage of students in grades 6-12 whose parents reported that their children would
continue education after high school, and of those students, percentage whose parents reported having taken various
steps to prepare to pay for their children's postsecondary education, by grade and family income: 1999
Grade and
family income
Total
Percentage ofstudents whose
parents reportedthat they expected
their children tocontinue education
after high school
Of students whose parents expectedthem to go on to postsecondary education,
percentage whose parents reported that they had
Obtained Talked with Heard of Lifetime
information/hadan estimate of
tuition and fees
Started savingmoney/makingfinancial plans
someone/readmaterials about
financial aid
Learning orHope Scholar-
ship tax credits
Grade
6-8
9-12
Family income
$25,000 or less
25,001-50,000
50,001-75,000
Over $75,000
Financial Preparation forPostsecondary Education
93.3 55.2 60.3 38.4 29.7
94.9 45.7 57.9 27.0 27.6
92.1 62.7 62.2 47.4 31.4SOURCE: U.S.Department of Education, NCES. National House-
hold Education Survey (NHES), 1999 (Parent Interview Com-
89.1 35.2 385 31.5 19.8 ponent).
92.7 50.9 58.2 38.7 27.6
95.6 66.2 69.2 43.1 33.9
97.6 75.4 81.5 42.4 40.4
The Condition of Education 2000 in Brief I Page 37
38
iEST COPY AVAILABLE

United States
Department of EducationED Pubs
824243 Sandy Court
Jessup, MD 207944398
Official BusinessPenalty for Private Use, $300
First Class MailPostacte & Fees Paid
U.S. Department VI EducationPermit No. G-17
39
BEST COPYAVAILABLE

U.S. Department of EducationOffice of Educational Research and Improvement (OERI)
National Library of Education (NLE)
Educational Resources Information Center (ERIC)
NOTICE
Reproduction Basis
en 031035
ERIC
This document is covered by a signed "Reproduction Release(Blanket)" form (on file within the ERIC system), encompassing allor classes of documents from its source organization and, therefore,does not require a "Specific Document" Release form.
O This document is Federally-funded, or carries its own permission toreproduce, or is otherwise in the public domain and, therefore, maybe reproduced by ERIC without a signed Reproduction Release form(either "Specific Document" or "Blanket").
EFF-089 (3/2000)