reproductions supplied by edrs are the best that can be … resume ed 473 128 ud 035 457 author...
TRANSCRIPT

DOCUMENT RESUME
ED 473 128 UD 035 457
AUTHOR Smith, Christian; Faris, Robert
TITLE Religion and American Adolescent Delinquency, Risk Behaviorsand Constructive Social Activities. A Research Report of theNational Study of Youth and Religion.
INSTITUTION North Carolina Univ., Chapel Hill.SPONS AGENCY Lilly Endowment, Inc., Indianapolis, IN.REPORT NO No-1
PUB DATE 2002-00-00NOTE 64p.; Produced by the National Study of Youth and Religion.
For a companion volume, see UD 035 458. For a relateddocument, see ED 465 850.
AVAILABLE FROM National Study of Youth and Religion, University of NorthCarolina at Chapel Hill, CB #3057, Chapel Hill, NC 27599-3057(4). E-mail: [email protected]; Web site:http://www.youthandreligion.org.
PUB TYPE Reports Research (143)
EDRS PRICE EDRS Price MF01/PC03 Plus Postage.DESCRIPTORS *Adolescents; Athletics; Drinking; Drug Abuse; Expulsion;
High School Seniors; Parent Student Relationship; *ReligiousFactors; Secondary Education; Stealing; *Student Attitudes;*Student Behavior; Student Government; Student Surveys;Suspension; Truancy; Violence; Youth Programs
IDENTIFIERS Juvenile Crime; *Religiosity; Risk Reduction; *Risk TakingBehavior
ABSTRACT
This study used data from the Monitoring the Future Survey ofhigh school seniors to examine the impact of religion on U.S. adolescents'participation in constructive youth activities. Overall, religion positivelyrelated to participation in constructive activities. Students whoparticipated in religious activities tended to be less likely to participatein many delinquent and risk behaviors. This report presents data on theimpact of religious participation on the following: smoking; first timedrinking to get drunk; going to bars; frequency of drinking to get drunk;drugs; transition to marijuana use; driving safety; danger seeking; risktaking; violent behavior; theft and other crimes; shoplifting; skippingschool; being sent to principal's office or detention for misbehavior; beingsuspended or expelled; parents limiting time out with friends on schoolnights; arguing with parents; community affairs or volunteer work; sports,athletics, or exercise; and student government. Four appendices containregression tables on religious service attendance, importance of religion,religious youth group participation, and religious tradition. (SM)
Reproductions supplied by EDRS are the best that can be madefrom the original document.

in
. , - .: :7.... 4 -.... , -
ftr.
l ,14',-..1!'
p.
/
(41
p
I
A
A1 a
6 ,
N
:,,k,
t ,. , i i , u 4 ,i , , "it' ' 4',"''''`- li t i ' > , ,, ; ... -,-_,,,' 1,,,M4 7) i VJ J' ' I ," tt, g.r:, r .,-. l'
.,, -, ',AO
'14: ' ''''' !j) r
0
PERMISSION TO TO REPRODUCE ANDDISSEMINATE THIS MATERIAL HAS
BEEN GRANTED BY
C .S.'irteA
TO THE ED ATIONAL RESOURCESINFORMATION CENTER (ERIC)
US DEPARTMENT OF EDUCATIONOffice of Educational Research and Improvement
EDUCATIONAL RESOURCES INFORMATIONCENTER (ERIC)
W'This document has been reproduced asreceived from the person or organizationoriginating it
O Minor changes have been made toimprove reproduction quality.
o Points of view or opinions stated in thisdocument do not necessarily representofficial OERI position or policy.
A
I
9 'I ' ' I .IS
I I
a -1
'
I
2 1BEST COPY AVAILABLE

byChristian
Sm
ithandRobert
Faris
3

NATIONALSTUDY OFYOUTH &RELIGION
The National Study of Youth and Religion is aresearch project being conducted at the Universityof North Carolina at Chapel Hill under the directionof Dr. Christian Smith, professor in the Departmentof Sociology. This four-year project, funded by LillyEndowment Inc., began in August 2001 and willcontinue until August 2005. The purpose of the
project is to research the shape and influence of religion and spirituality in the lives ofAmerican adolescents; to identify effective practices in the religious, moral, and social forma-tion of the lives of youth; to describe the extent to which youth participate in and benefit fromthe programs and opportunities that religious communities are offering to their youth; and tofoster an informed national discussion about the influence of religion in youth's lives, in orderto encourage sustained reflection about and rethinking of our cultural and institutional prac-tices with regard to youth and religion.
Religion and American Adolescent Delinquency, Risk Behaviors and ConstructiveSocial Activitiesby Christian Smith and Robert Fads
About the Authors Christian Smith is professor and associate chair of sociology at theUniversity of North Carolina at Chapel Hill. Robert Fads is a Ph.D. graduate student in sociologyat the University of North Carolina at Chapel Hill.
Cover Design: Sandy Fay, Laughing Horse Graphics, Quakertown, PAInterior Design: Roxann L. Miller
Editors: Roxann L. MillerTheresa M. Rupar
© 2002 by the National Study of Youth and ReligionAll rights reserved.
For more information:National Study of Youth and ReligionThe University of North Carolina at Chapel HillCB# 3057Chapel Hill, NC 27599-3057
Website: www.youthandreligion.orgEmail: [email protected]
4

ContentsExecutive Summary 5
A Note on Data and Methods 7
Table 1 9
Smoking 10
First Time Drinking to Get Drunk 12
Going to Bars 14
Frequency of Drinking to Get Drunk 16
Drugs 18
Transition to Marijuana Use 20
Driving Safety 22
Danger-Seeking 24
Risk-Taking 26
Violent Behavior 28
Theft and Other Crimes 30
Shoplifting 32
Skipping School 34
Sent to Principal's Office or Detention for Misbehavior 36
Suspended or Expelled 38
Parents Limit Time Out With Friends on School Nights 40
Argue with Parents 42
Community Affairs or Volunteer Work 44
Sports, Athletics or Exercise 46
Student Government 48
Appendix 1 Religious Service Attendance Regression Table 50
Appendix 2 Importance of Religion Regression Table 54
Appendix 3 Religious Youth Group Participation Regression Table 58
Appendix 4 Religious Tradition Regression Table 62

Executive SummaryThis report demonstrates that religion among U.S.
adolescents is positively related to participation inconstructive youth activities. In addition, those whoparticipate in religious activities seem to be less likely toparticipate in many delinquent and risk behaviors, as seenin the following areas:
Substance AbuseReligious 12th graders are less likely than theirnon-religious counterparts to smoke cigarettes andless likely to start smoking tobacco at early ages.Religious 12th graders are also less likely to drinkalcohol and are more likely to postpone their firsttime getting drunk. When they do drink, religioushigh school seniors are also significantly less likelyto drink alcohol until they are drunk, compared totheir non-religious peers. They also go to barssignificantly less often than non-religious 12thgraders.
Religious high school seniors are less likely to haveever tried any kind of drug, including hard drugs,than their non-religious peers. They are also morelikely to postpone first use of marijuana and oftennever try marijuana.
There is apositive
relationshipbetween
religion andconstructive
youthactivities.
Religion and Risk Behaviors
BEST COPY AVNLA1BLE

Safety and Danger
Religious 12th graders receive fewer traffic tickets andare more likely to wear their seatbelts than less religiousseniors. Religious high school seniors are also less likelyto enjoy danger or to take risks.
Crime and Violence
Religiosity is associated with fewer violent incidentsamong youth, such as hitting teachers and getting intofights. Religious 12th graders are also less likely than non-religious seniors to commit a variety of crimes, includingshoplifting, theft of more than $50, vandalism, trespass-ing, auto theft, arson and armed robbery. Religious ado-lescents are also less likely to get in trouble with police.
School Problems
Religious 12th graders tend to be better-behaved atschool. They are less likely than non-religious adolescentsto be sent to detention, skip school or be suspended orexpelled.
Constructive Activities and SupervisionReligious 12th graders are more likely to volunteer intheir community and to participate in student government
than their non-religious peers. They alsoplay sports or exercise significantly moreoften than less religious seniors. The parentsof religious 12th graders also tend to bestricter than those of less religious seniors,and their children are less likely to arguewith them.
Religious 12thgraders are
more likely tovolunteer in
their communityand participate
in studentgovernmentthan their
non-religiouspeers.
These relationships are statistically signifi-cant even after controlling for race, age, sex,rural versus urban residence, region, educa-tion of parents, number of siblings, whetherthe mother works and the presence of afather or male guardian in the household.
In sum, regular religious service attendance,high subjective importance of faith andmany years spent participating in religiousyouth groups are clearly associated with
7BEST COPY AVk,-LL__
National Study of Youth and Religion

safer, healthier, more constructive lifestyles for U.S.teenagers even after holding constant the effects ofnine other control variables.
It is important to note that the cross-sectional data (gath-ered at one point in time, not over time) upon which theanalyses in this report are based make it difficult to deter-mine the direction of cause and effect between religionand risk behaviors and social activities. It might be thatreligion itself influences youth to reduce risk behaviors. Itmight also be that youth and families who are already pre-disposed to avoid risky behaviors choose to become morereligiously involved as one strategy to pursue that kind oflifestyle. It might also be that some religious youth whofor whatever reasons become involved in risk behaviorssubsequently reduce their religious involvements and socount on surveys as less religious. It might be that someother unknown factor influences youth both to be reli-gious and to engage in fewer risky behaviors. A combina-tion of these influences might operate to produce theresults presented in this report. What is clear in thisreport's findings, however, is that, for whatever reasons,religiously involved U.S. teenagers engage in fewer riskbehaviors, get into less trouble and participate in moresocially constructive activities than do less religiouslyinvolved youth. That is an important starting point ofknowledge for considering ways to enhance the quality oflife of U.S. adolescents.
A Note on Data and MethodsMonitoring the Future is a nationally representative sur-vey of high school seniors that includes information abouta wide range of outcomes of interest to policymakers, par-ents, schools and youth workers, such as drug and alcoholuse, criminal behavior, extra-curricular activities and self-esteem. The survey's unweighted N is 2,478; individualtables use weighted Ns and might involve minor differ-ences in sample due to missing cases. Our analyses employmultiple regression techniques that allow us to control fornine other factors that also may be related to the outcomeof interest. These nine control factors are race, age, sex,rural versus urban residence, region, education of par-ents, number of siblings, whether the mother works andthe presence of a father or male guardian in the house-hold. The religion variables we examine are frequency of
Religion and Risk Behaviors
BEST COPY AVAILABLE

religious service attendance, importance of religion, years ofparticipation in religious youth groups and religious affiliation.(Frequency distributions for these four variables are presentedin Table 1.) Of the 30 delinquency, risk and activity outcomeswe investigated, only one (taking a gun to school a relativelyrare event) was not significantly related to religion.
We ran each regression model separately for each religion vari-able, so a model testing the relationship between religious serv-ice attendance and drug use, for instance, does not control forother dimensions of religion, like affiliation. Differencesamong religious types are presented in the following tables incross-tabulation form. Religious variables that show statisticallysignificant differences in outcomes across religious categoriesat the p<.05 level when compared to the designated non-religious and low-religious comparison categories (shown initalics) have asterisks (*) next to them in the tables that follow.We present our findings as unadjusted percentages in cross-tab-ulations for ease of interpretation, but we mark in those tableswith asterisks differences that are statistically significant in theregression analyses. Full regression models with significanceresults for all analyses follow in an appendix at the end of thisreport.
Source: Johnston, Lloyd D., Jerald G. Bachman, Patrick M.O'Malley, and John Schulenberg. MONITORING THEFUTURE: A CONTINUING STUDY OF AMERICAN YOUTH,12th grade, 1996 [Computer file]. Conducted by University ofMichigan, Survey Research Center. ICPSR ed. Ann Arbor, MI:Inter-university Consortium for Political and Social Research[producer and distributor]. The original collector of the data,ICPSR, and the relevant funding agency bear no responsibilityfor use of the data or for interpretations or inferences basedupon such uses.
8 National Study of Youth and Religion

Table 1: Religion and 12th Graders, 1996
Percent of 12th Graders
Attendance
Weekly or more 31.2
Once or twice a month 18.4
Rarely 35.4
Never 15.0
Total: 100.0
Importance of Religion
Very important 29.9
Pretty important 30.3
A little important 24.6
Not important 15.2
Total: 100.0
Years of Church Youth Group
Six or more 16.0
Four to five 8.7
Two to three 15.6
Less than two 15.4
None 44.4
Total: 100.1
Denomination
Baptist 17.9
Other Protestant 26.6
Catholic 24.9
Jewish 2.8
Mormon 2.4
Other religion 9.4
No religion 16.1
Total: 100.1
N = 2,423; Source: Monitoring the Future, 1996
Religion and Risk Behaviors 9
10

SmokingReligious 12th graders are less likely to smoke, and, if they dosmoke, they tend to wait longer before beginning to smoke. Weeklyreligious service attenders, those for whom religion is very impor-tant and those who have been involved in a religious youth groupsix or more years are significantly more likely to delay their firstuse of cigarettes when compared to non-attenders, those for whomreligion is not important and those who have never been in a reli-gious youth group.
Furthermore, although one-fifth of all seniors smoke regularly, thisis less likely to be true of students who attend religious services atleast monthly and those for whom religion is very important. (Seethe "Smokes Regularly" column on the far right.) Long-term reli-gious youth group participants (six or more years), Baptist, otherProtestant, Catholic, Mormon, and Jewish students are also lesslikely to smoke than the non-religious.
These relationships are statistically significant controlling for race,age, sex, rural/urban residence, region, education of parents, num-ber of siblings, whether the mother works and the presence of afather/male guardian in the household.
10 National Study of Youth and Religion

Table 2: Transition to Cigarette Use, 12th Graders, 1996 (Percents)
"When (if ever) did you smoke your first cigarette?"Grade when first smoked a cigarette Smokes
Never 6th 7th 8th 9th 10th 11th 12th Regularly
Overall 34.4 14.5 10.5 9.6 11.4 8.1 7.7 3.7 19.7
Attendance
Weekly or more* 42.9 8.9 6.7 6.6 11.5 9.3 9.5 4.6 11.9*
Once or twice a month 30.8 13.0 13.3 10.2 11.6 8.8 9.3 3.0 19.8*
Rarely 30.3 18.4 10.9 12.3 11.0 7.9 5.6 3.6 22.1
Never 30.9 18.5 14.1 8.8 12.1 5.3 7.1 3.2 30.1
Importance of Religion
Very important* 44.5 10.4 5.8 72 11.1 7.9 8.2 5.1 11.4*
Pretty important 32.0 16.5 10.5 9.1 12.0 9.9 7.6 2.5 20.4
A little important 26.6 14.3 14.8 12.8 12.4 7.9 7.3 3.9 24.7
Not important 30.8 19.8 12.8 10.3 9.4 5.7 8.0 3.5 25.6
Years of Church Youth Group
Six or more* 42.5 7.4 10.6 4.2 10.9 10.8 9.2 4.4 12.8*
Four to five 30.6 13.2 8.3 14.2 11.0 9.7 9.8 3.3 25.2
Two to three 29.9 13.4 12.0 11.9 13.1 9.7 6.4 3.6 20.9
Less than two 35.0 16.1 11.4 8.2 12.6 5.1 8.5 3.1 16.9
None 33.6 174 10.2 10.3 10.5 72 6.9 3.9 21.7
Denomination
Baptist 37.0 15.5 9.2 77 9.9 9.9 6.4 4.5 14.0*
Other Protestant* 31.4 14.1 9.6 9.7 12.2 9.6 9.5 4.0 22.2*
Catholic 30.3 11.1 11.7 11.0 14.5 8.5 9.5 3.5 19.6*
Jewish 47.7 15.8 11.5 5.4 12.4 3.9 1.2 2.2 22.4*
Mormon* 571 10.6 11.8 7.3 0.0 12.4 0.0 0.8 1.9*
Other religion 38.6 20.5 77 9.5 8.5 4.5 6.5 4.1 15.4
No religion 33.5 176 13.3 11.2 9.6 5.7 7.0 2.1 26.8
N = 2,423; Statistically significant difference, at the .05 level; Source: Monitoring the Future, 1996
Religion and Risk Behaviors
12
11

First Time
Drinking to Get DrunkSeniors who are religious are more likely to postpone or avoid get-ting drunk for the first time. Twelfth graders who attend religiousservices weekly, those for whom religion is very important and thosewho participated in religious youth groups for at least six years areall more likely to have never gotten drunk or to delay their firsttime getting drunk significantly longer than the non-religious. Thisis also the case for Jewish and Mormon youth when compared tonon-religious youth.
These relationships are statistically significant controlling for race,age, sex, rural/urban residence, region, education of parents,whether the mother works and the presence of a father/maleguardian in the household.
12
13
National Study of Youth and Religion

Table 3: First Time Drinking12th Graders, 1996
"When (if ever) did you firstto feel drunk or very
to Get DrunkPercents)
drink enoughhigh?"
Never 6th
Grade when first got drunk
7th 8th 9th 10th 11th 12th
Overall 35.3 2.1 4.3 9.4 16.2 13.3 12.8 6.6
Attendance
Weekly or more* 48.7 1.8 2.0 5.6 11.4 11.6 11.2 7.8
Once or twice a month 29.9 2.2 2.9 9.9 21.1 12.2 15.1 6.7
Rarely 29.5 2.4 6.6 11.1 18.0 14.6 12.6 5.2
Never 27.8 2.0 5.5 12.9 16.1 14.9 13.6 7.2
Importance of Religion
Very important* 50.8 1.8 2.9 5.5 13.0 9.5 9.1 7.4
Pretty important 31.6 1.9 4.5 8.6 16.3 17.4 13.1 6.7
A little important 25.0 2.0 5.9 15.1 17.8 13.5 16.2 4.5
Not important 30.5 3.9 4.1 9.3 17.9 12.1 _13.8 .8.4
Years of Church Youth Group
Six or more* 47.3 2.6 1.7 5.4 11.0 12.4 12.9 6.8
Four to five 35.1 2.1 1.9 11.9 18.7 15.8 8.1 6.5
Two to three 29.1 1.5 5.4 9.4 18.4 16.0 12.7 7.6
Less than two 31.8 0.7 3.4 12.9 17.2 10.4 17.6 6.1
None 34.4 2.9 5.7 8.7 16.8 13.2 11.8 6.6
Denomination
Baptist 40.8 2.2 3.6 8.8 15.0 12.9 10.4 6.3
Other Protestant 31.6 0.6 4.2 9.5 18.0 18.1 13.3 4.7
Catholic 30.2 3.0 4.6 9.3 18.5 10.9 14.4 9.1
Jewish* 46.7 0.0 2.5 4.3 21.5 7.2 15.6 2.2
Mormon* 67.1 2.0 6.9 0.0 2.4 7.1 5.6 8.9
Other religion 46.0 4.9 5.9 8.9 9.7 9.1 11.9 3.7
No religion 30.4 2.6 4.1 13.6 15.4 13.2 12.9 7.8
N = 2,423; Source: Monitoring the Future, 1996
Religion and Risk Behaviors 13
14

Going to Bars
Religious 12th graders go to bars less often. Not surprisingly, con-sidering age restrictions, most (67 percent) 12th graders go to barsjust a few times or never. This is significantly more likely to be trueof the most religious students: those who attend religious servicesweekly, those for whom religion is very important or those who par-ticipated in religious youth groups for at least six years. Less fre-quent attenders, those for whom religion is only a little or prettyimportant and those who participated in religious youth groups forup to five years are not statistically different than the non-religious.
These relationships are statistically significant controlling for race,age, sex, rural/urban residence, region, education of parents, num-ber of siblings, whether the mother works and the presence of afather/male guardian in the household.
14 National Study of Youth and Religion
14

Table 4: Frequency of Going Out To Bars12th Graders, 1996 (Percents)
"How often (if ever) do you go to taverns, bars or nightclubs?"
Never
A fewtimes
each year
1-2 timeseach
month Weekly Daily
Overall 45.1 21.6 20.9 10.8 1.7
Attendance
Weekly or more 54.9 18.0 18.6 8.0 0.5
Once or twice a month 40.9 21.0 27.7 9.9 0.6
Rarely 38.6 25.9 21.4 12.0 2.1
Never 45.4 19.9 15.9 14.6 4.4
Importance of Religion
Very important* 55.5 17.1 16.1 10.2 1.2
Pretty important 40.4 23.9 23.6 10.5 1.6
A little important 39.0 24.3 26.4 9.4 0.9
Not important 45.0 21.8 15.6 13.6 4.1
Years of Church Youth Group
Six or more* 52.5 19.1 21.3 6.2 0.9
Four to five 40.9 23.7 24.5 9.4 1.6
Two to three 43.2 19.6 23.2 12.9 1.1
Less than two 45.5 22.8 23.3 8.4 0.0
None 43.3 22.4 19.0 12.5 2.8
Denomination
Baptist 45.8 21.6 19.3 11.8 1.6
Other Protestant 42.8 22.0 24.1 10.3 0.9
Catholic 41.4 22.5 23.7 11.1 1.3
Jewish 35.7 22.3 26.3 15.7 0.0
Mormon 74.4 5.1 11.7 8.2 0.6
Other religion 48.4 21.4 18.5 9.0 2.8
No religion 48.0 22.5 16.3 10.6 2.7
N = 2,423; Source: Monitoring the Future, 1996
Religion and Risk Behaviors 15
15

Frequency of Drinking
to Get Drunk
Religious 12th graders who drink are less likely to do so excessively.Most 12th graders (80 percent) drink on some occasions, and onlyhalf of those who do (40 percent overall) drink to get drunk atleast half the time. Twelfth graders who attend religious servicesweekly, participated in youth groups for at least six years or forwhom religion is at least pretty important are all significantly lesslikely to drink to get drunk. Not surprisingly, considering their pro-hibition of alcohol, Mormons are significantly less likely to getdrunk than the non-religious.
These relationships are statistically significant controlling for race,age, sex, rural/urban residence, region, education of parents, num-ber of siblings, whether the mother works and the presence of afather/male guardian in the household.
16 National Study of Youth and Religion
1.5A-

Table 5: Alcohol Abuse, 12th Graders, 1996 (Percents)
"On the occasions that you drink alcoholic beverages, howoften do you drink enough to feel pretty high?"
Never drink None Few Half Mostly all Nearly all
Overall 20.2 18.2 21.3 13.0 16.6 10.7
Attendance
Weekly or more' 28.7 21.9 18.6 10.6 12.8 7.4
Once or twice a month 15.1 17.9 24.0 11.2 20.8 11.0
Rarely 16.5 16.7 22.6 16.4 17.5 10.3
Never 17.5 14.2 20.3 12.2 172 18.5
Importance of Religion
Very important* 30.2 22.0 20.9 8.8 10.6 7.4
Pretty important* 18.3 15.6 22.8 14.8 19.8 8.7
A little important 12.0 18.0 21.7 16.7 18.4 13.3
Not important 17.7 16.3 18.6 11.8 18.1 17.5
Years of Church Youth Group
Six or more* 28.9 22.3 21.2 8.5 10.9 8.2
Four to five 22.2 14.0 14.9 15.2 26.9 6.8
Two to three 17.0 16.0 21.6 15.4 15.7 14.3
Less than two 18.1 16.5 25.5 13.8 170 9.2
None 18.4 18.4 21.1 13.0 16.9 12.2
I
Denomination._.]
Baptist 19.2 20.8 26.6 9.6 16.8 7.1
Other Protestant 16.3 20.3 20.1 13.2 18.4 11.7
Catholic 16.5 17.5 20.8 16.0 18.6 10.7
Jewish 22.5 24.4 24.0 8.5 15.8 4.8
Mormon* 62.3 8.6 74 2.1 0.7 18.8
Other religion 29.6 16.8 18.7 10.1 13.0 12.0
No religion 20.2 14.7 20.3 16.3 14.9 13.6
N = 2,423; Source: Monitoring the Future, 1996
Religion and Risk Behaviors 17
(3, 11 IS

Drugs
Religious 12th graders are less likely to use, sell or be offered drugs.Fewer 12th graders (34 percent) report having been offered drugs in thepast year than report having ever used drugs (51 percent). Interestingly,both weekly and rare religious service attenders are less likely to havebeen offered drugs; the same is true of students for whom religion is atleast pretty important. Both Catholic and Jewish 12th graders are less like-ly than the non-religious to have been offered drugs.
One out of every seven high school seniors said they sold drugs in thepast year. Seven percent of weekly religious service attenders sold drugs,significantly lower than the 21 percent of non-attenders. Every level ofimportance of faith is less likely to participate in drug dealing, as areBaptist, Catholic and Jewish religious affiliations.
More than half (51 percent) of all 12th graders have used some kind ofillegal mind-altering drug in the last 12 months; the vast majority of these(92 percent of users, 47 percent overall) have used marijuana, and rough-ly 60 percent of users (29 percent overall) have used some kind of harddrug (heroin, LSD, methamphetamine, cocaine, barbiturates, speed, etc.).Only the most frequent religious service attenders are significantly lesslikely than non-attenders to have used drugs in the last year (marijuana,hard drugs or both). Even for these students the drug problem is signifi-cant: Nearly 39 percent have used some kind of drug, and 20 percenthave used hard drugs.
Those for whom religion is important are less likely to use drugs: Twelfthgraders who say religion is at least pretty important are significantly lesslikely to use either marijuana or hard drugs. Seniors who participated inreligious youth groups for at least six years are less likely to use drugsthan non-participants, although there are no significant associations forfewer years of participation. Baptist, other Protestant, Catholic, Mormonand Jewish students are less likely than the non-religious to use any kindof drug, and this is also true of "other" religion with respect to marijuana.
These relationships are statistically significant controlling for race, age,sex, rural/urban residence, region, education of parents, number of sib-lings, whether the mother works and the presence of a father/maleguardian in the household.
1817
National Study of Youth and Religion

Table 6: Drug Use, 12th Graders, 1996 (Percents)
"During the last 12 months, have you..:'Been
offereddrugs atschool?
Solddrugs?
Used illegaldrugs?
Smokedmarijuana?
Usedhard
drugs?
Overall 34.4 13.6 51.4 47.4 29.0
Attendance
Weekly or more 26.8* 6.7* 38.5* 31.1* 19.8*
Once or twice a month 38.4 14.4 59.0 52.0 29.8
Rarely 35.3* 16.3* 62.1 55.5 34.5
Never 43.1 20.8 61.3 55.3 37.3
Importance of Religion
Very important 24.2* 7.0* 39.7* 31.6* 21.0*
Pretty important 34.7* 12.3* 56.3* 49.6* 29.1*
A little important 39.9 16.9* 63.0 57.8 36.7
Not important 44.1 24.0 62.7 56.2 35.2
Years of Church Youth Group
Six or more 32.1 8.8 39.7* 33.5* 19.8*
Four to five 32.7 10.2 57.2 51.3 31.2
Two to three 34.9 17.1 60.3 50.7 34.7
Less than two 36.7 14.4 54.9 45.0 31.0
None 34.8 14.3 57.8 51.1 29.7
Denomination
Baptist 29.8 9.9* 50.3* 41.5* 22.1"
Other Protestant 34.4 14.4 54A* 48.2* 30.0*
Catholic 33.2* 11.2* 53.1* 48.3* 28.4*
Jewish 30.7* 13.1* 49.0* 40.2* 18.9*
Mormon 40.0 13.0 34.0* 26.5* 24.1*
Other religion 372 17.5 58.3 45.6* 37.1
No religion 39.7 18.4 62.4 57.1 37.1
N = 2,423; Source: Monitoring the Future, 1996
Religion and Risk Behaviors 19
A8

Transition to
Marijuana Use
Religious 12th graders are less likely to have tried marijuana everor early in life. Twelfth graders who attend religious services weekly,for whom religion is very important or who participated in religiousyouth groups for at least six years were more likely to delay marijua-na use or avoid it altogether. They demonstrate lower risk of mari-juana use at every grade level. Every religious affiliation besides"other" religion was also at lower risk of first marijuana use whencompared to the non-religious.
These relationships are statistically significant controlling for race,age, sex, rural/urban residence, region, education of parents, num-ber of siblings, whether the mother works and the presence of afather/male guardian in the household.
20 National Study of Youth and Religion
1 9

Table 7: Transition to Marijuana Use12th Graders, 1996 (Percents)
"When (if ever) did you first try marijuana or hashish?"
Grade When First Smoked Marijuana
Never 6th 7th 8th 9th 10th 11th 12th
Overall 54.0 1.4 1.9 3.9 11.4 12.3 10.0 5.1
Attendance
Weekly or more* 69.7 0.3 0.8 2.0 7.9 7.7 8.5 3.0
Once or twice a month 49.8 0.5 1.5 3.4 11.8 11.8 12.8 8.5
Rarely 45.7 2.2 2.8 5.0 14.2 15.3 9.7 5.2
Never 47.3 2.2 2.4 5.8 11.1 15.2 11.3 4.9
Importance of Religion
Very important* 69.8 0.9 0.9 1.7 9.1 8.3 6.2 3.0
Pretty important 51.6 1.3 2.3 4.0 11.2 11.2 13.3 5.1
A little important 43.7 1.7 2.1 5.2 14.0 16.4 10.1 6.9
Not important 46.2 1.9 2.6 5.5 11.1 15.3 11.3 6.0
Years of Church Youth Group
Six or more* 68.4 0.5 0.0 1.3 9.2 8.9 7.4 4.4
Four to five 52.5 1.6 0.0 3.0 19.1 8.6 11.9 3.3
Two to three 49.5 1.2 2.1 4.9 10.7 12.0 14.2 5.5
Less than two 56.7 1.8 3.3 3.8 9.4 12.9 7.6 4.5
None 50.5 1.4 2.3 4.8 11.1 13.8 10.3 5.9
Denomination
Baptist* 61.5 1.3 2.1 2.4 7.9 11.9 7.1 6.0
Other Protestant* 52.6 1.7 0.9 4.6 13.7 11.5 11.0 4.0
Catholic* 52.9 1.0 1.7 2.7 13.1 11.2 11.0 6.5
Jewish* 60.2 0.0 0.0 2.4 12.8 16.6 4.2 3.8
Mormon* 72.5 0.0 1.8 0.0 0.0 8.0 6.3 11.5
Other religion 56.6 2.3 1.9 7.9 8.1 12.0 8.5 2.7
No religion 44.3 1.5 4.0 5.3 12.4 15.7 12.6 4.3
N = 2,423; Source: Monitoring the Future, 1996
Religion and Risk Behaviors 21
2

Driving Safety
Religious 12th graders tend to be safer in cars. They are less likelyto get traffic tickets and more likely to wear seatbelts. Less thanhalf of all seniors say they always wear a seatbelt when in a car, andone-third have gotten at least one traffic ticket in the past year.Students who attend religious services weekly are more likely towear a seatbelt (see "Always Wears a Seatbelt" column at the farright of the table) than those who do not attend but not significant-ly less likely to get tickets. Those for whom religion is very impor-tant are more likely to wear seatbelts and less likely to get ticketsthan those for whom religion is not important. Jewish students aremore likely than the non-religious to wear a seatbelt and less likelyto get tickets. Baptists are also less likely to get tickets than thenon-religious.
These relationships are statistically significant controlling for race,age, sex, rural/urban residence, region, education of parents, num-ber of siblings, whether the mother works and the presence of afather/male guardian in the household.
22 National Study of Youth and Religionjt41,1

Table 8: Driving Safety, 12th Graders, 1996 (Percents)
"How many times, if any, have you receiveda ticket (or been stopped and warned) formoving violations, such as speeding, run-ning a stop light, or improper passing?"
"Do youalwayswear a
seatbelt?"None One Two Three Four +
Overall 67.8 18.3 7.2 3.7 3.0 45.0
Attendance
Weekly or more 71.9 15.7 5.4 3.8 3.3 50.2*
Once or twice a month 69.9 18.0 7.2 2.7 2.2 40.5
Rarely 63.6 20.7 9.2 3.5 3.0 45.8*
Never 66.6 18.7 6.7 5.2 2.8 38.0
Importance of Religion
Very important* 74.6 16.1 4.6 2.1 2.7 50.1*
Pretty important 68.2 16.1 9.3 4.3 2.1 42.7
A little important 63.3 20.8 7.8 4.0 4.2 40.8
Not important 60.8 23.3 7.5 5.5 3.0 45.7
Years of Church Youth Group
Six or more 69.4 17.5 6.4 4.7 1.9 51.1
Four to five 66.6 13.6 9.4 5.8 4.6 41.1
Two to three 62.9 22.6 7.8 3.1 3.6 38.3
Less than two 71.3 19.9 4.6 1.7 2.5 49.1
None 67.7 17.8 7.9 3.9 2.7 44.3
Denomination
Baptist* 72.3 16.4 5.2 4.1 2.1 39.2
Other Protestant 62.1 20.7 11.1 2.1 4.0 44.3
Catholic 71.6 16.7 5.7 3.4 2.7 47.6
Jewish * 771 13.4 2.1 7.4 0.0 75.7*
Mormon 58.8 16.0 6.6 12.3 6.3 44.8
Other religion 74.1 11.7 5.4 4.7 4.1 39.7
No religion 63.0 24.4 75 3.6 1.6 45.3
N = 2,423; Source: Monitoring the Future, 1996
Religion and Risk Behaviors 23
2R

Danger-Seeking
Religious high school seniors are less likely to enjoy danger.Twelfth graders who attend religious services weekly and those forwhom religion is very important are significantly less likely than thenon-religious to "get a real kick out of doing things that are a littledangerous," although nearly half of these groups (both 43 percent)do enjoy mild danger. Jewish teens are also less likely than non-religious teens to engage in dangerous activities for fun. Youthgroup participation was not significantly related to danger-seeking.
These relationships are statistically significant controlling for race,age, sex, rural/urban residence, region, education of parents, num-ber of siblings, whether the mother works and the presence of afather/male guardian in the household.
24 National Study of Youth and Religion
23

Table 9: Danger-Seeking, 12th Graders, 1996 (Percents)
"I get a real kick out of doing thingsthat are a little dangerous."
DisagreeMostly
disagreeNeither
Mostlyagree
Agree
Overall 13.6 16.0 22.9 28.0 19.5
Attendance
Weekly or more* 16.4 18.7 21.5 27.6 15.8
Once or twice a month 12.7 13.7 23.5 27.8 22.3
Rarely 12.0 16.6 22.8 28.3 20.4
Never 12.8 12.0 25.5 28.2 21.5
Importance of Religion
Very important* 20.2 16.0 21.3 26.3 16.3
Pretty important 12.1 17.1 25.0 26.7 19.2
A little important 8.7 17.5 23.4 29.6 20.7
Not important 11.7 11.9 21.7 31.4 23.4
Years of Church Youth Group
Six or more 15.0 19.9 20.9 26.4 17.7
Four to five 10.9 18.0 27.6 26.5 17.0
Two to three 10.1 13.3 20.6 36.4 19.6
Less than two 18.6 13.7 22.1 29.0 16.7
None 13.2 15.9 23.9 25.3 21.6
Denomination
Baptist 17.0 14.4 22.3 27.7 18.7
Other Protestant 10.9 15.8 24.0 30.3 19.0
Catholic 12.8 16.9 24.3 25.9 20.1
Jewish* 19.0 35.2 17.1 23.2 5.5
Mormon 11.7 19.5 11.7 27.2 29.8
Other religion 17.0 16.0 23.3 23.0 20.8
No religion 12.1 14.6 22.0 30.6 20.7
N = 2,423; Source: Monitoring the Future, 1996
Religion and Risk Behaviors 25
,,

Risk-Taking
Religious teens are also less likely to take risks. Nearly half of all12th graders "like to test [themselves] by doing something a littlerisky." The most religious teens are significantly less likely to takerisks: Weekly religious service attenders and teens who say religionis very important are significantly less likely than the non-religiousto take risks. Religious youth group participation and religious affil-iation are not significantly related to risk-taking.
These relationships are statistically significant controlling for race,age, sex, rural/urban residence, region, education of parents, num-ber of siblings, whether the mother works and the presence of afather/male guardian in the household.
2625
National Study of Youth and Religion

Table 10: Risk-Taking, 12th Graders, 1996 (Percents)
"I like to test myself every now and thenby doing something a little risky."
DisagreeMostly
disagreeNeither
Mostlyagree
Agree
Overall 16.4 15.0 20.8 31.7 16.1
Attendance
Weekly or more* 18.8 16.5 20.1 29.4 15.1
Once or twice a month 17.8 14.2 22.8 30.4 14.8
Rarely 14.6 15.6 18.8 35.0 16.0
Never 14.0 11.3 24.8 30.0 19.9
Importance of Religion
Very important* 22.0 15.7 19.2 27.8 15.4
Pretty important 15.3 15.0 20.8 34.7 14.1
A little important 12.8 15.4 24.0 30.5 17.4
Not important 13.3 13.1 19.0 35.3 19.4
Years of Church Youth Group
Six or more 15.6 16.2 17.9 32.1 18.2
Four to five 20.5 17.4 18.9 27.0 16.2
Two to three 15.8 11.9 20.8 38.2 13.4
Less than two 19.2 17.0 17.8 30.7 15.3
None 15.0 14.5 23.6 30.5 16.5
Denomination
Baptist 21.0 12.1 22.8 28.6 15.5
Other Protestant 13.3 16.1 16.4 37.6 16.6
Catholic 16.9 15.6 25.5 27.8 14.2
Jewish 15.9 27.8 13.3 28.4 14.6
Mormon 7.9 16.8 17.2 27.0 31.1
Other religion 22.1 11.2 22.1 28.3 16.2
No religion 14.0 15.7 19.8 34.7 15.8
N = 2,423; Source: Monitoring the Future, 1996
Religion and Risk Behaviors
26
27

Violent Behavior
Religious 12th graders are less violent than non-religious 12thgraders. Only 2 percent of all high school seniors have hit a teacherin the past year. However, seniors who attend religious servicesat all and those for whom religion is even a little important are sig-nificantly less likely than the non-religious to have hit their teach-ers in the last 12 months. Youth group participation is not signifi-cantly related to hitting a teacher, but Catholics are significantlyless likely than the non-religious to do so.
Fighting, on the other hand, is more common overall: Nearly one-quarter of all seniors got into a fight in the past year. Religiousservice attendance is not significantly related to fighting, and onlythose who say religion is very important are significantly less likelythan the non-religious to get into fights. Religious youth group par-ticipation and religious affiliation are also unrelated to fighting.
Despite widespread media attention about guns at school, this is arelatively rare crime: Just 3 percent of all seniors said they took agun to school in the past four weeks. There appear to be no statis-tically significant differences between religious and non-religious stu-dents with respect to this outcome, however.
These relationships are statistically significant controlling for race,age, sex, rural/urban residence, region, education of parents, num-ber of siblings, whether the mother works and the presence of afather/male guardian in the household.
28 National Study of Youth and Religion
-X27

Table 11: Violent Behavior, 12th Graders, 1996 (Percents)
"During the last12 months, have you.:
"Hit a "Gotten intoteacher?" a fight?"
"Have you takena gun to school
in the past4 weeks?"
Overall 2.3 23.4 3.3
Attendance
Weekly or more 1.7* 19.1 2.7
Once or twice a month 0.7* 23.3 2.1
Rarely 2.3* 25.2 3.3
Never 5.5 28.2 5.1
Importance of Religion
Very important 1.7* 19.2* 3.5
Pretty important 1.0' 24.3 2.7
A little important 1.7* 23.9 3.1
Not important 5.9 28.0 3.8
Years of Church Youth Group
Six or more 1.0 18.1 3.0
Four to five 1.1 17.5 2.3
Two to three 1.8 30.7 4.9
Less than two 2.9 23.9 1.7
None 3.0 23.6 3.3
Denomination
Baptist 3.7 19.9 3.1
Other Protestant 2.2 24.0 2.6
Catholic 1.0' 23.7 1.9
Jewish 0.0 18.0 1.8
Mormon 0.6 18.2 0.6
Other religion 2.8 24.6 8.4
No religion 3.2 25.0 3.7
N = 2,423; Source: Monitoring the Future, 1996
Religion and Risk Behaviors 29

Theft and Other Crimes
Religious adolescents are less likely to be involved with most formsof criminal activity than non-religious 12th graders. More than one-quarter of all high school seniors have stolen something worth lessthan 50 dollars, and 11 percent have stolen something worth morethan that. However, only rarely are these things taken by force (3percent have used a weapon to take something) or involve car theft(only 4 percent have stolen a car). Trespassing (23 percent) is alsoa relatively common delinquent activity of 12th graders.
Destruction of property is somewhat less likely than trespassing: 14percent of seniors have vandalized property in the past year, and 2percent have committed arson. Despite these rates of criminality,only 11 percent of 12th graders have been in trouble with thepolice in the past year, perhaps a commentary on police effective-ness or the seriousness of these offenses.
Weekly religious service attenders are significantly less likely thannon-attenders to trespass and steal, regardless of value (althoughthey are not significantly different with respect to armed robberyand auto theft). They are also significantly less likely to get introuble with the police. However, they are no less likely than non-attenders to vandalize or burn property.
Importance of religion reveals broader differences. The 60 percentof seniors who say religion is at least pretty important are signifi-cantly less likely than those for whom religion is not important tosteal anything (including cars), to trespass, to vandalize property orto commit arson. Seniors for whom religion is very important or alittle important are less likely than those for whom religion is notimportant to commit armed robbery.
Seniors who participate in religious youth groups are not signifi-cantly less likely to commit these crimes than non-participants.Religious affiliation is also unrelated to any of these crimes.
These relationships are statistically significant controlling for race,age, sex, rural/urban residence, region, education of parents, num-ber of siblings, whether the mother works and the presence of afather/male guardian in the household.
30 National Study of Youth and Religion
429

Table 12: Theft and Other Crimes, 12th Graders, 1996 (Percents)
"During the past 12 months, have you..:'
Been introuble
withpolice?
Overall 11.4
Attendance
Weekly or more 6.4*
Once or twice a month 13.9
Rarely 13.5
Never 14.1
Importance of Religion
Very important 8.02*
Pretty important 10.3*
A little important 14.6
Not important 15.6
Years of Church Youth Group
Six or more 9.7
Four to five 9.2
Two to three 12.8
Less than two 12.9
None 11.4
Denomination
Baptist 11.3
Other Protestant 12.3
Catholic 10.1
Jewish 10.8
Mormon 8.5
Other religion 10.1
No religion 13.7
Stolenan itemworth<$50?
Stolenan itemworth>$50?
Committedarmed
robbery?
Stolena car?
Vandalizedproperty?
CommittedTrespassed?
arson?
28.1 11.4 3.4 4.5 14.3 2.1 22.5
24.4* 6.4* 2.9 4.5 12.2 1.8 18.6*
28.7 13.9 2.1 3.1 14.0 1.0 24.0
29.2 13.5 3.5 3.8 15.3 1.76* 22.1
32.7 14.1 5.6 7.7 18.2 5.0 29.6
21.0* 8.0* 1.9* 3.4* 10.8* 1.1* 16.3*
26.4* 10.3* 3.4 3.7* 12.1* 1.7* 23.2*
33.9 14.6 4.0* 5.1 17.6 1.5* 25.7
36.5 15.6 5.3 7.1 21.5 5.8 28.2
27.6 9.7 2.8 3.8 14.0 1.6 21.6
25.7 9.2 3.1 2.8 11.3 1.5 16.3
28.9 12.8 3.2 3.7 15.4 2.1 26.2
30.7* 12.9 4.6 2.9 16.5 2.5 24.4
27.1 11.4 3.5 5.7 14.2 2.4 22.5
24.4 11.3 2.2 5.4 12.0 2.4 18.7
29.7 12.3 3.6 4.2 15.7 1.8 25.5
28.7 10.1 2.3 3.8 13.7 2.2 22.5
22.1 10.8 0.0 0.0 7.4 0.0 27.2
29.6 8.5 0.6 2.3 20.0 2.3 4.7
26.1 10.1 7.9 6.8 18.0 3.1 21.0
31.5 13.7 4.3 3.9 15.3 2.0 24.5
N = 2,423; Source: Monitoring the Future, 1996
Religion and Risk Behaviors
3031

ShopliftingReligious 12th graders are less likely to shoplift. Less than one-third of 12th graders shoplifted in the past year, and the rate is sig-nificantly lower for those who are religious. High school seniorswho attend religious services at least monthly or with any level ofimportance of faith are significantly less likely than the non-reli-gious to steal from stores. In addition, Baptist and Jewish youth aresignificantly less likely to have shoplifted in the past year whencompared to non-religious 12th graders.
These relationships are statistically significant controlling for race,age, sex, rural/urban residence, region, education of parents, num-ber of siblings, whether the mother works and the presence of afather/male guardian in the household.
32
3National Study of Youth and Religion

Table 13: Shoplifting in the Past Year, 12th Graders, 1996 (Percents)
"During the last 12 months how often have you takensomething from a store without paying for it?"
Not at all Once Twice 3-4 times 5+ times
Overall 69.6 11.3 6.6 5.2 7.3
Attendance
Weekly or more* 76.3 9.2 5.4 3.2 6.0
Once or twice a month* 70.0 12.6 6.5 4.4 6.5
Rarely 66.5 12.4 7.5 6.7 7.0
Never 62.2 11.7 7.6 7.0 11.6
Importance of Religion
Very important* 77.2 8.8 4.7 3.2 6.2
Pretty important* 68.1 13.2 7.8 5.2 5.6
A little important* 66.0 11.5 7.6 5.8 9.2
Not important 62.9 12.4 6.4 8.3 10.0
Years of Church Youth Group
Six or more 70.8 10.5 6.3 3.7 8.7
Four to five 78.0 11.8 2.8 2.5 4.8
Two to three 65.1 10.4 7.0 7.2 10.3
Less than two 68.2 13.0 6.2 5.0 7.7
None 70.1 10.7 7.4 5.7 6.2
Denomination
Baptist* 76.1 9.8 4.1 5.8 4.2
Other Protestant 67.7 11.3 7.1 5.1 9.0
Catholic 67.4 13.7 7.9 5.2 5.8
Jewish* 79.0 10.7 6.9 1.4 1.9
Mormon 75.2 13.8 2.9 0.7 7.4
Other religion 69.1 9.8 6.7 4.5 9.9
No religion 65.9 10.6 7.0 7.0 9.5
N = 2,423; Source: Monitoring the Future, 1996
Religion and Risk Behaviors3 (i
32
33

Skipping School
Religious 12th graders are less likely to skip school without permis-sion than those who are not religious. Most high school seniors (65percent) seldom or never skip all or part of a school day. Only 15percent do so often or very often. Religious seniors are significantlyless likely to skip: Those at any level of religious service attendance(compared to non-attendance) are significantly less likely to skipschool, as are seniors who report any level (even "a little impor-tant") of religiosity. Those who participate in religious youthgroups are also less likely to skip school, and youth from Baptist,other Protestant, Catholic and "other" religions are less likely thanthe non-religious to skip school.
These relationships are statistically significant controlling for race,age, sex, rural/urban residence, region, education of parents, num-ber of siblings, whether the mother works and the presence of afather/male guardian in the household.
34 National Study of Youth and Religion

Table 14: Frequency of Skipping School12th Graders, 1996 (Percents)
"How often did you skip a day of school, or part of a day(without permission) over the past school year?"
Never Seldom Sometimes Often Always
Overall 39.0 24.9 21.3 12.2 2.7
Attendance
Weekly or more* 47.8 25.3 15.8 9.4 1.8
Once or twice a month* 38.3 31.3 18.5 9.4 2.5
Rarely* 34.9 24.2 24.8 13.4 2.7
Never 31.1 17.9 27.7 18.6 4.8
Importance of Religion
Very important* 45.8 25.5 17.5 9.4 1.9
Pretty important* 39.3 27.3 19.5 11.0 2.8
A little important* 36.5 23.5 25.9 11.6 2.5
Not important 29.7 22.2 24.4 19.4 4.4
Years of Church Youth Group
Six or more* 44.7 27.3 16.9 9.2 1.9
Four to five 40.0 30.4 17.5 9.3 2.8
Two to three* 42.7 21.3 21.4 12.1 2.6
Less than two 38.0 23.2 25.8 10.6 2.5
None 36.3 24.4 22.4 14.0 2.9
Denomination
Baptist* 43.8 24.8 19.9 9.3 2.2
Other Protestant* 41.9 22.7 22.7 10.6 2.1
Catholic* 41.2 27.8 19.2 10.2 1.7
Jewish 45.1 23.5 25.9 5.5 0.0
Mormon 16.4 14.9 37.3 18.6 12.8
Other religion* 32.1 27.9 178 18.0 4.3
No religion 31.0 23.8 22.7 18.5 4.0
N = 2,423; Source: Monitoring the Future, 1996
Religion and Risk Behaviors 35
(-34

Sent to the Principal's Office orDetention for MisbehaviorReligious 12th graders are less likely to misbehave at school. Mostseniors (71 percent) have not gotten in trouble at all for misbehav-ior in the past year, and just 10 percent have done so "sometimes"or more frequently. Students who attend religious services at leastmonthly or who find religion at least pretty important are even lesslikely to misbehave. Religious youth group participation is statisti-cally unrelated to misbehavior, but Jewish and "other" religion stu-dents are less likely than the non-religious to get into minor trou-ble at school.
These relationships are statistically significant controlling for race,age, sex, rural/urban residence, region, education of parents, num-ber of siblings, whether the mother works and the presence of afather/male guardian in the household.
36 National Study of Youth and Religion

Table 15: Sent To The Principal's Office or Detentionfor Misbehavior in the Past Year12th Graders, 1996 (Percents)
"Over the past year in school, how often did youget sent to the principal's office or have to stay
after school because you misbehaved?"Never Seldom Sometimes Often Always
Overall 71.4 18.7 6.7 2.1 1.1
Attendance
Weekly or more* 76.8 14.9 5.9 1.5 0.9
Once or twice a month* 74.8 19.1 5.0 0.6 0.5
Rarely 67.1 21.7 7.1 3.1 1.1
Never 67.2 19.0 9.0 2.5 2.3
Importance of Religion
Very important* 77.6 15.8 4.4 1.5 0.8
Pretty important* 72.2 18.2 6.8 1.5 1.3
A little important 67.6 20.3 8.4 2.6 1.1
Not important 67.1 21.0 7.4 3.2 1.4
Years of Church Youth Group
Six or more 74.8 16.9 6.2 1.3 0.8
Four to five 76.0 18.1 4.6 1.3 0.0
Two to three 70.0 19.2 7.1 2.9 0.8
Less than two 71.9 19.9 5.7 1.6 1.0
None 69.9 18.7 7.4 2.3 1.6
Denomination
Baptist 68.0 24.0 5.5 1.7 0.8
Other Protestant 71.6 18.9 6.6 1.7 1.2
Catholic 75.7 16.5 5.9 1.6 0.5
Jewish* 77.7 15.8 4.7 1.8 0.0
Mormon 94.8 1.9 1.1 1.7 0.6
Other religions 67.9 16.7 9.6 2.9 2.9
No religion 67.5 19.5 8.4 2.9 1.7
N = 2,423; Source: Monitoring the Future, 1996
Religion and Risk Behaviors 37

Suspended or Expelled
Religious students are less likely to be suspended or expelled.Three-quarters of all 12th graders have never been suspended orexpelled. This is even more likely to be true of those who attendreligious service once or twice a month or more, those who say reli-gion is very important and those who have been involved in a reli-gious youth group six or more years. Catholics are less likely butstudents of "other" religions are more likely to be suspended orexpelled than non-religious students. Youth group participation isstatistically unrelated to suspension or expulsion.
These relationships are statistically significant controlling for race,age, sex, rural/urban residence, region, education of parents, num-ber of siblings, whether the mother works and the presence of afather/male guardian in the household.
38 National Study of Youth and Religion37

Table 16: Suspended or Expelled in Lifetime12th Graders, 1996 (Percents)
"Have you ever been suspended or expelled from school?"
Never Once Twice or More
Overall 74.8 15.3 9.9
Attendance
Weekly or more* 82.2 11.2 6.6
Once or twice a month* 76.6 15.8 7.6
Rarely 72.1 15.9 12.0
Never 68.2 18.9 13.0
Importance of Religion
Very important* 78.9 13.9 7.3
Pretty important 75.9 14.0 10.2
A little important 71.2 18.2 10.6
Not important 74.7 13.8 11.5
Years of Church Youth Group
Six or more* 80.7 12.3 7.0
Four to five 79.5 13.2 7.3
Two to three 74.6 17.6 7.7
Less than two 75.8 11.6 12.5
None 71.9 17.0 11.2
Denomination
Baptist 70.3 18.5 11.2
Other Protestant 74.6 15.4 10.1
Catholic* 83.0 11.0 6.1
Jewish 90.1 7.7 2.2
Mormon 88.7 2.5 8.9
Other religion* 69.2 14.9 15.9
No religion 70.9 18.4 10.7
N = 2,423; Source: Monitoring the Future, 1996
Religion and Risk Behaviors 39Ce'k
11 ""
38

Parents Limit Time
Out With Friends on
School Nights
Religious 12th graders are more likely to have strict parents. Highschool seniors are almost evenly divided in terms of how often theirparents restrict the amount of time they spend out on school nights
46 percent say rarely or never, and 54 percent say sometimes oroften. The parents of religious 12th graders, however, are morelikely to be strict: 61 percent of weekly attenders, 55 percent ofmonthly attenders and 51 percent of rare attenders find their activ-ities limited by their parents on school nights, significantly higherthan the 44 percent of non-attenders. Twelfth graders for whomreligion is at least pretty important and those who have beeninvolved in religious youth groups for six or more years are also sig-nificantly more likely to be limited by their parents. Finally,Catholics and non-Baptist Protestants are more likely than the non-religious to be restricted by their parents.
These relationships are statistically significant controlling for race,age, sex, rural/urban residence, region, education of parents, num-ber of siblings, whether the mother works and the presence of afather/male guardian in the household.
39
40 National Study of Youth and Religion

Table 17: Parents Limit Time Spent Out With Friends onSchool Nights, 12th Graders, 1996 (Percents)
"How often do your parents limit the amount of timeyou can go out with friends on school nights?"
Never Rarely Sometimes Often
Overall 25.2 20.9 27.2 26.7
Attendance
Weekly or more* 21.3 17.7 30.2 30.9
Once or twice a month* 24.0 20.6 29.0 26.4
Rarely* 25.4 23.4 25.2 26.1
Never 33.5 22.4 24.7 19.5
Importance of Religion
Very important* 24.0 19.0 27.4 29.6
Pretty important* 22.9 17.3 31.2 28.7
A little important 25.7 25.1 24.4 24.9
Not important 31.2 25.2 23.1 20.5
Years of Church Youth Group
Six or more* 23.5 17.4 30.8 28.3
Four to five* 17.6 21.7 32.2 28.5
Two to three 21.6 23.2 28.9 26.3
Less than two 24.3 19.7 26.1 29.9
None 28.7 21.6 24.9 24.8
Denomination
Baptist 30.1 18.8 30.1 21.0
Other Protestant* 24.5 18.7 28.2 28.6
Catholic* 22.3 20.6 26.6 30.5
Jewish 22.4 35.2 25.3 17.2
Mormon 10.3 48.8 23.5 17.4
Other religion 28.0 13.5 25.2 33.3
No religion 27.2 25.7 25.8 21.3
N = 2,423; Source: Monitoring the Future, 1996
Religion and Risk Behaviors 41
441

Argue With Parents
Religious 12th graders argue with their parents less frequently.Only 40 percent of all 12th graders report arguing with their par-ents five or more times in the past year, and 40 percent arguedtwice or less. Frequency of arguing with parents was statisticallyunrelated to attendance and affiliation, but 12th graders for whomreligion is very important and those who spend four to five years ina religious youth group are significantly less likely to do so thanthose for whom religion is not important and who have never beenin a religious youth group.
These relationships are statistically significant controlling for race,age, sex, rural/urban residence, region, education of parents, num-ber of siblings, whether the mother works and the presence of afather/male guardian in the household.
42 National Study of Youth and Religion
41it

Table 18: Argued With Parents in Past 12 Months12th Graders, 1996 (Percents)
"How often have you argued or had a fightwith either of your parents?"Not at all Once Twice 3-4 times 5+ times
Overall 14.4 11.6 14.6 20.0 39.5
Attendance
Weekly or more 16.1 13.0 16.6 18.3 36.0
Once or twice a month 13.8 8.5 14.7 20.8 42.3
Rarely 11.3 12.6 14.5 22.4 39.2
Never 17.4 8.8 11.3 17.7 44.9
Importance of Religion
Very important* 19.4 12.1 18.0 16.5 34.0
Pretty important 13.1 10.0 13.0 24.4 39.5
A little important 11.5 12.5 14.9 19.3 41.8
Not important 10.7 11.4 11.3 18.7 47.8
Years of Church Youth Group
Six or more 14.4 13.5 13.3 19.9 39.0
Four to five* 8.5 7.7 14.4 19.2 50.2
Two to three 11.9 10.5 14.0 22.8 40.8
Less than two 16.6 10.2 15.5 17.5 40.3
None 15.7 12.5 14.8 20.3 36.7
Denomination
Baptist 21.7 11.0 14.1 18.6 34.7
Other Protestant 10.6 12.0 14.8 18.7 43.9
Catholic 11.7 10.3 15.2 24.0 38.9
Jewish 6.6 4.5 17.0 20.6 51.3
Mormon 17.5 8.3 11.4 21.6 41.2
Other religion 18.4 13.1 18.5 18.9 31.2
No religion 13.2 13.1 11.9 19.9 41.9
N = 2,423; Source: Monitoring the Future, 1996
Religion and Risk Behaviors 43
*.t
4 2

Community Affairs orVolunteer Work
Religion is positively related to volunteer work among 12th graders.Three-quarters of all 12th graders have done some volunteer workin the past year, although more than half of them have only doneso a few times. The data reveal significant positive correlations withreligion: Every level of religious service attendance is positivelyrelated to volunteerism, even rare attendance. Seventeen percent ofall weekly religious service attenders volunteer at least weekly, andmore than 40 percent do so at least monthly. Seniors at every levelof religiosity even those for whom religion is only a little impor-tant are more likely to volunteer than those who say religion isnot important. Similarly, students who participated in religiousyouth groups for any length of time are more likely to volunteerthan others. Finally, seniors of every religious affiliation besides"other" are significantly more likely to volunteer than the non-religious.
These relationships are statistically significant controlling for race,age, sex, rural/urban residence, region, education of parents, num-ber of siblings, whether the mother works and the presence of afather/male guardian in the household.
43
BEST COPY AVAILABLE
44 National Study of Youth and Religion

Table 19: Community Affairs or Volunteer Work12th Graders, 1996 (Percents)
"How often do you participate incommunity affairs or volunteer work?"
NeverFew times
a year1-2 timesa month
WeeklyNearlydaily
Overall 25.7 45.0 18.4 8.1 2.8
Attendance
Weekly or more* 13.1 44.0 26.2 12.3 4.4
Once or twice a month* 20.4 46.3 22.6 8.5 2.2
Rarely* 28.6 49.5 14.4 5.6 1.9
Never 48.2 35.7 9.0 4.8 2.4
Importance of Religion
Very important* 16.9 45.4 23.1 10.5 4.1
Pretty important* 19.8 45.7 22.9 9.4 2.4
A little important* 32.8 46.8 13.6 5.3 1.6
Not important 40.8 40.1 11.0 5.1 3.1
Years of Church Youth Group
Six or more* 11.6 40.6 30.0 12.6 5.3
Four to fives 7.2 54.3 21.4 12.3 4.9
Two to three* 18.3 51.0 20.6 7.5 2.5
Less than two* 20.3 48.2 19.1 10.8 1.6
None 39.3 41.6 12.4 4.7 2.0
Denomination
Baptist* 22.4 45.1 20.1 9.1 3.4
Other Protestant* 21.2 46.5 23.3 6.7 2.3
Catholic* 23.2 46.0 17.6 10.0 3.3
Jewish * 11.1 42.6 31.1 12.2 3.1
Mormon* 14.4 52.6 27.7 4.7 0.6
Other religion 34.7 42.6 13.8 6.7 2.3
No religion 37.8 41.8 11.6 5.7 3.1
N = 2,423; Source: Monitoring the Future, 1996
Religion and Risk Behaviors 45

Sports, Athletics or ExerciseReligion is positively related to active participation in sports, athlet-ics or exercise among 12th graders. Two-thirds of all 12th gradersreport participating sports, athletics or exercise at least weekly.Any level of religious service attendance, any level of religiosity andany amount of religious youth group participation (beyond none)increase participation significantly. Additionally, 12th graders ofevery religious affiliation besides "other" are significantly morelikely than the non-religious to actively participate in sports,athletics or exercise.
These relationships are statistically significant controlling for race,age, sex, rural/urban residence, region, education of parents, num-ber of siblings, whether the mother works and the presence of afather/male guardian in the household.
46 National Study of Youth and Religion
5

Table 20: Frequency of Participation in Sports, Athleticsor Exercise, 12th Graders, 1996 (Percents)
"How often do you actively participate in sports,athletics or exercise?"
NeverFew times
a year1-2 timesa month
Weekly Daily
Overall 8.2 11.2 12.6 24.5 43.6
Attendance
Weekly or more* 6.3 12.1 10.8 22.2 48.6
Once or twice a month* 6.7 9.0 12.1 24.2 48.0
Rarely* 7.5 10.9 14.3 26.9 40.4
Never 15.6 12.6 13.2 23.9 34.7
Importance of Religion
Very important* 7.1 12.7 11.6 23.7 44.9
Pretty important* 6.7 9.8 13.5 25.0 45.0
A little important* 7.6 9.7 12.0 25.7 45.1
Not important 14.2 13.0 14.3 23.6 35.1
Years of Church Youth Group
Six or more* 5.1 11.1 14.1 21.8 48.0
Four to five* 5.4 7.3 14.9 27.0 45.4
Two to three* 6.4 8.4 11.0 26.3 48.0
Less than two* 9.5 10.4 11.9 23.0 45.2
None 10.4 12.9 12.9 24.0 39.8
Denomination
Baptist* 7.8 13.0 12.7 23.2 43.4
Other Protestant* 5.9 9.0 11.0 25.6 48.4
Catholic* 6.4 10.0 11.9 23.9 47.8
Jewish 3.8 11.2 19.5 37.6 28.0
Mormon* 0.0 10.0 13.4 26.3 50.4
Other religion 10.8 12.2 14.1 25.4 37.5
No religion 14.2 14.8 15.2 22.3 33.6
N = 2,423; Source: Monitoring the Future, 1996
Religion and Risk Behaviors 47

Student Government
Religious 12th graders are more likely to participate in student gov-ernment. The majority (77 percent) of 12th graders did not partic-ipate in student government in the last school year. Religious stu-dents, however, are much more likely to do so: Any amount of reli-gious service attendance or any amount of religiosity is positivelyrelated to student government participation. Additionally, 12thgraders who have participated in religious youth groups for at leastfour years are significantly more likely to participate than thosewho never joined such a group. Baptist, other Protestant, Catholicand Jewish 12th graders are also significantly more likely than thenon-religious to participate in student government.
These relationships are statistically significant controlling for race,age, sex, rural/urban residence, region, education of parents, num-ber of siblings, whether the mother works and the presence of afather/male guardian in the household.
48 National Study of Youth and Religion
7
1/4.0 P

Table 21: Participation in Student Government12th Graders, 1996 (Percents)
"To what extent have you participated in Student Council orGovernment during this school year?"
Not at all Slight Moderate Considerable Great extent
Overall 76.6 7.6 5.0 5.2 5.6
Attendance
Weekly or more* 71.6 10.1 6.1 5.9 6.4
Once or twice a months 74.5 7.1 4.7 5.4 8.2
Rarely* 78.6 5.9 5.7 5.2 4.7
Never 85.2 6.7 1.4 3.8 2.9
Importance of Religion
Very important* 70.4 9.5 5.8 5.6 8.7
Pretty important* 74.7 8.8 5.7 5.7 5.2
A little important* 80.2 4.7 5.2 5.8 4.1
Not important 87.6 6.2 0.7 2.7 2.8
Years of Church Youth Group
Six or more* 67.5 12.6 6.5 6.3 7.2
Four to five* 64.9 10.1 8.6 5.0 11.4
Two to three 77.0 5.9 5.3 5.3 6.5
Less than two 77.2 7.8 4.1 6.4 4.5
None 82.4 5.4 4.0 4.3 3.9
Denomination
Baptist* 73.3 4.9 8.2 7.5 6.2
Other Protestant* 74.7 8.6 4.6 5.1 7.0
Catholic* 74.5 7.9 5.5 5.0 7.1
Jewish * 67.6 7.9 7.7 8.2 8.7
Mormon 70.8 22.1 0.6 0.0 6.6
Other religion 85.2 7.1 2.4 3.0 2.2
No religion 84.5 6.0 3.2 4.6 1.7
N = 2,423; Source: Monitoring the Future, 1996
Religion and Risk Behaviors 49c3v0

Appendix 1a Religious Service Attendance Regression Table
FirstCigarettet
SmokesRegularly
First TimeDrunkI
Goesto Barst
Drinks toGet Drunkt
OfferedDrugs
SoldDrugs
TriedAny Drug
TriedMarijuana
Tried HardDrugs
Attends weekly -0.384" -0.921" -0.522" -0.516" -0.826" -0.657" -1.211" -0.936" -1.022" -0.879"
(0.092) (0.180) (0.094) (0.129) (0.124) (0.147) (0.207) (0.140) (0.142) (0.157)
Attends 1-2 times a month -0.049 -0.453' -0.010 0.003 -0.164 -0.171 -0.383 -0.103 -0.162 -0.211
(0.098) (0.189) (0.098) (0.139) (0.134) (0.160) (0.203) (0.154) (0.153) (0.164)
Attends rarely 0.033 -0.218 0.035 0.056 -0.173 -0.346' -0.482" -0.034 -0.033 -0.150
(0.085) (0.155) (0.085) (0.121) (0.118) (0.138) (0.170) (0.133) (0.133) (0.139)
Female 0.032 0.028 -0.079 -0.283" -0.292" -1.137" -1.162" -0.156 -0.291" -0.083
(0.058) (0.117) (0.059) (0.081) (0.078) (0.098) (0.141) (0.090) (0.091) (0.101)
Black -0.542" -1.949" -0.826" -0.227 -0.815" -0.423" -0.331 -0.613" -0.483" -1.969"
(0.104) (0.286) (0.117) (0.132) (0.126) (0.161) (0.219) (0.146) (0.149) (0.246)
Other minority -0.169' -0.892" -0.357" 0.097 -0.553" -0.344' -0.121 -0.489" -0.467" -0.259
(0.081) (0.179) (0.086) (0.112) (0.107) (0.134) (0.181) (0.124) (0.126) (0.136)
Rural -0.131 -0.257 -0.147 -0.361" -0.371" -0.524" -0.247 -0.325' -0.477" -0.173
(0.093) (0.184) (0.096) (0.132) (0.127) (0.160) (0.220) (0.147) (0.150) (0.163)
Small town -0.062 -0.232 -0.033 -0.351" -0.184 -0.323' -0.162 -0.280' -0.376" -0.088
(0.085) (0.168) (0.086) (0.121) (0.117) (0.145) (0.199) (0.136) (0.137) (0.148)
City -0.080 -0.214 -0.099 -0.163 -0.171 -0.080 0.045 -0.127 -0.155 -0.202
(0.081) (0.166) (0.083) (0.114) (0.110) (0.134) (0.185) (0.128) (0.129) (0.143)
North Central -0.005 -0.140 -0.077 -0.447" -0.035 -0.001 0.076 -0.097 -0.051 0.009
(0.082) (0.157) (0.083) (0.116) (0.112) (0.138) (0.180) (0.128) (0.130) (0.143)
South 0.097 -0.020 0.047 0.013 -0.012 0.081 -0.070 0.055 0.029 0.160
(0.076) (0.144) (0.077) OA 04) (0.101) (0.127) (0.171) (0.118) (0.119) (0.131)
West -0.117 -0.793" -0.036 -0.713" -0.202 0.344' -0.341 -0.110 -0.136 0.074
(0.093) (0.206) (0.094) (0.131) (0.124) (0.151) (0.214) (0.143) (0.145) (0.156)
Age 0.021 0.017 0.113' 0.190" 0.104 -0.147 -0.056 0.128 0.130 0.122
(0.049) (0.095) (0.052) (0.064) (0.065) (0.080) (0.103) (0.074) (0.076) (0.081)
No HS degree 0.152 0.351 0.029 0.366' -0.061 0.339 0.066 0.503" 0.275 0.429'
(0.128) (0.255) (0.137) (0.173) (0.166) (0.206) (0.287) (0192) (0.193) (0.213)
Some college 0.114 0.174 0.137 0.121 0.286' 0.259 0.207 0.158 0.188 0.280
(0.088) (0.175) (0.092) (0.125) (0.118) (0.147) (0.196) (0.136) (0.139) (0.156)
College graduate 0.059 -0.039 0.113 0.235' 0.224' 0.148 0.070 0.184 0.185 0.211
(0.082) (0.163) (0.084) (0.114) (0.109) (0.138) (0.187) (0.126) (0.128) (0.145)
Graduate school 0.004 -0.057 0.039 0.200 0.161 0.389" 0.191 0.244 0.159 0.341'
(0.090) (0.177) (0.092) (0.123) (0.119) (0.147) (0.199) (0.137) (0.139) (0.154)
Dad at home -0.085 -0.279' -0.069 -0.034 -0.019 -0.018 -0.427" -0.216' -0.220` -0.211
(0.069) (0.136) (0.072) (0.096) (0.092) (0.114) (0.147) (0.107) (0.108) (0.119)
Mom not working -0.242" -0.410' -0.293" -0.043 -0.419" -0.170 -0.332 -0.263' -0.260' -0.335'
(0.080) (0.166) (0.083) (0.109) (0.106) (0.130) (0.193) (0.120) (0.123) (0.139)
One sibling -0.020 0.343 0.273 0.495' 0.188 0.377 0.123 0.089 0.229 0.103
(0.129) (0.269) (0.140) (0.193) (0.185) (0.226) (0.288) (0.203) (0.206) (0.233)
Two siblings 0.067 0.084 0.399" 0.410' 0.273 0.445 -0.017 0.103 0.228 0.211
(0.130) (0.275) (0.142) (0.194) (0.185) (0.227) (0.292) (0.205) (0.208) (0.235)
Three siblings 0.143 0.331 0.446" 0.444' 0.310 0.543' 0.259 0.261 0.327 0.400
(0.129) (0.270) (0.141) (0.192) (0.183) (0.224) (0.283) (0.202) (0.205) (0.232)
Constant -0.773 2.591 0.528 -1.647 -1.767 -2.793
(1.785) (1.499) (1.944) (1.392) (1.432) (1.519)
Observations 1906 2177 1862 2190 2152 2180 2173 2198 2163 2198
Standard errors in parentheses ' significant a 5%; " significant at 1%; Ref. = Male, White, Suburb, Northeast Parents with HS degree, no siblings, andnever at endsreligious services. All models are logistic regressions unless noted: t = ordered logistic regression, 0 = Cox proportional hazard model.
50 National Study of Youth and Religion
BEST COPY AVALAKE 4 9

Appendix 1b: Religious Service Attendance Regression Table
FirstMarijuana
Use
TrafficTicketst
AlwaysWears
Seatbelt
Gets a KickOut ofDanger
Tests Selfby Taking
Risks
HitTeacher
Beenin Fight
Brought aGun toSchool
Attends weekly -0.721" -0200 0.498" -0.287' -0.288' -0.949' -0.293 -0.321
(0.113) (0.155) (0.147) (0.126) (0.126) (0.401) (0.166) (0.387)
Attends 1-2 Times a Month -0.087 -0.016 0.185 -0.019 -0.168 -1.473" -0.099 -0.582
(0.114) (0.171) (0.164) (0.140) (0.140) (0.572) (0.182) (0.484)
Attends rarely 0.041 0.193 0.321' -0.047 -0.125 -1.003" 0.040 -0.194
(0.097) (0.144) (0.142) (0.122) (0.121) (0.366) (0.154) (0.350)
Female -0.199" -0.626" 0.408" -0.943" -0.749" -1.777" -0.895" -3.079"
(0.069) (0.098) (0.094) (0.082) (0.082) (0.417) (0.110) (0.596)
Black -0.341" -0.920" -0.621" -1.295" -0.684" -0.074 0.011 0.459
(0.122) (0.180) (0.159) (0.137) (0.136) (0.541) (0.171) (0.399)
Other minority -0.235' -0.137 -0.115 -0.105 -0.155 0.974" 0.020 0.754'
(0.099) (0.136) (0.129) (0.113) (0.111) (0.357) (0.147) (0.328)
Rural -0.331" -0.000 -0.228 0.079 0.163 0.871' -0.050 0.479
(0.116) (0.159) (0.151) (0.131) (0.132) (0.432) (0.172) (0.450)
Small town -0.237' 0.062 -0.386" -0.026 0.064 -0.311 -0.395' -0.029
(0.101) (0.146) (0.140) (0.120) (0.121) (0.500) (0.166) (0.472)
City -0.086 0.044 -0.158 -0.076 0.058 -0.554 -0.061 0.402
(0.095) (0.139) (0.132) (0.113) (0.114) (0.467) (0.151) (0.405)
North Central -0.057 0.679" -0.228 0.161 0.094 -0.299 -0.073 0.030
(0.099) (0.141) (0.134) (0.114) (0.114) (0.406) (0.149) (0.376)
South 0.043 0.640" 0.134 0.179 0.132 -0.333 -0.211 0.038
(0.091) (0.132) (0.122) (0.105) (0.106) (0.376) (0.139) (0.340)
West -0.090 0.200 0.711" 0.202 0.100 -0.887 -0.410' -0.419
(0.110) (0.164) (0.148) (0.129) (0.128) (0.508) (0.174) (0.440)
Age 0.098 0.233" 0.003 0.012 0.090 0.179 0.029 0.207
(0.056) (0.079) (0.079) (0.070) (0.070) (0.196) (0.084) (0.171)
No HS degree 0.197 -0.455 -0.238 0.227 0.083 0.735 0.405 0.475
(0.153) (0.243) (0.206) (0.177) (0.174) (0.472) (0.214) (0.448)
Some college 0.201 0.005 0.171 0.173 0.012 0.169 0.182 -0.100
(0.107) (0.156) (0.143) (0.124) (0.123) (0.452) (0.159) (0.405)
College graduate 0.186 0.411" 0.341" 0.160 -0.011 0.038 -0.080 -0.122
(0.100) (0.137) (0.131) (0.113) (0.113) (0.432) (0.151) (0.389)
Graduate school 0.141 0.357' 0.605" -0.028 0.140 0.017 -0.148 0.113
(0.109) (0.149) (0.142) (0.123) (0.124) (0.474) (0.166) (0.392)
Dad at home -0.118 -0.038 0.159 -0.045 -0.099 -0.793' -0.019 -0.502
(0.082) (0.118) (0.112) (0.096) (0.097) (0.314) (0.125) (0.284)
Mom not working -0.175 -0.117 0.355" -0.211' -0.237' 0.281 -0.064 0.151
(0.098) (0.134) (0.125) (0.108) (0.108) (0.353) (0.144) (0.335)
One sibling 0.167 -0.198 -0.115 0.024 0.094 0.274 -0.039 0.216
(0.163) (0.211) (0.208) (0.180) (0.181) (0.674) (0.243) (0.583)
Two siblings 0.155 -0.190 -0.392 0.104 0.100 0.099 0.078 0.088
(0.165) (0.213) (0.210) (0.182) (0.182) (0.687) (0.244) (0.586)
Three siblings 0.276 -0.101 -0.391 0.091 0.075 0.355 0.123 0.118
(0.162) (0.210) (0.207) (0.180) (0.180) (0.651) (0.239) (0.565)
Constant -0.737 -5.580 -1.086 -6.724'
(1.481) (3.708) (1.584) (3.264)
Observations 1911 2087 2083 2056 2049 2189 2198 2182
Standard errors in parentheses; " significant at 5%; " significant at 1%; Ref. = Male, White, Suburb, Northeast, Parents with HS degree, no siblings, andneverattends religious services. All models are logistic regressions unless noted: 1 = ordered logistic regression, * = Cox proportional hazard model.
Religion and Risk Behaviors 51

52
Appendix 1c: Religious Service Attendance Regression TableTrouble
with PolicePettyTheft
SignificantTheft
ArmedRobbery
Stolena Car
VandalizedProperty
Arson Trespassed Shopliftedt
Attends weekly -0.726" -0.421" -0.726" -0.245 -0.562 -0.280 -0.621 -0.509" -0.643"
(0.225) (0.151) (0.225) (0.348) (0.307) (0.191) (0.391) (0.161) (0.144)
Attends 1-2 Times a Month -0.167 -0.159 -0.167 -0.518 -0.528 -0.131 -0.887 -0.285 -0.416"
(0.232) (0.165) (0.232) (0.430) (0.353) (0.211) (0.499) (0.177) (0.156)
Attends rarely -0.191 -0.226 -0.191 -0.153 -0.523 -0.202 -0.755' -0.258 -0.196
(0.196) (0.142) (0.196) (0.316) (0.290) (0.178) (0.363) (0.150) (0.131)
Female -1.304" -0.821" -1.304" -2.044" -0.917" -1.291" -1.755" -0.700" -0.554"
(0.161) (0.100) (0.161) (0.345) (0.231) (0.139) (0.392) (0.109) (0.094)
Black 0.164 -0.154 0.164 0.288 0.486 -0.537' 0.342 -0.458' 0.038
(0.221) (0.161) (0.221) (0.362) (0.324) (0.225) (0.442) (0.186) (0.150)
Other minority 0.439' -0.002 0.439' 0.655' 0.934" -0.065 0.336 -0.053 0.233
(0.187) (0.135) (0.187) (0.290) (0.261) (0.174) (0.373) (0.146) (0.126)
Rural -0.293 -0.335" -0.293 -0.152 0.164 -0.182 0.145 -0.266 -0.388"
(0.236) (0.162) (0.236) (0.403) (0.367) (0.198) (0.422) (0.171) (0.150)
Small town -0.295 -0.328' -0.295 -0.446 0.101 -0.472' -0.240 -0.249 -0.420"
(0.217) (0.149) (0.217) (0.401) (0.348) (0.190) (0.424) (0.157) (0.139)
City -0.261 -0.200 -0.261 0.293 0.182 -0.362' -0.773 -0.333' -0.457"
(0.200) (0.138) (0.200) (0.328) (0.312) (0.178) (0.428) (0.149) (0.129)
North Central 0.294 0.188 0.294 -0.133 0.214 0.032 -0.862' -0.029 -0.136
(0.205) (0.140) (0.205) (0.316) (0.319) (0.170) (0.430) (0.150) (0.134)
South 0.338 0.096 0.338 -0.382 0.367 -0.385' -0.596 0.023 -0.049
(0.189) (0.130) (0.189) (0.297) (0.288) (0.167) (0.362) (0.138) (0.122)
West -0.337 -0.066 -0.337 -0.940' 0.023 -0.449' -0.592 -0.171 -0.127
(0.250) (0.159) (0.250) (0.409) (0.344) (0.206) (0.451) (0.171) (0.147)
Age 0.154 -0.081 0.154 0.246 0.142 -0.202 0.206 0.029 -0.072
(0.103) (0.080) (0.103) (0.160) (0.146) (0.105) (0.188) (0.085) (0.075)
No HS degree 0.125 -0.094 0.125 0.485 -0.051 0.262 0.269 0.009 -0.145
(0.288) (0.214) (0.288) (0.439) (0.404) (0.262) (0.517) ( 0.237) (0.201)
Some college 0.070 0.105 0.070 0.402 0.253 0.186 0.332 0.367' 0.146
(0.213) (0.147) (0.213) (0.346) (0.307) (0.187) (0.402) (0.162) (0.137)
College graduate -0.078 -0.163 -0.078 0.111 -0.082 -0.115 0.097 0.132 -0.200
(0.206) (0.140) (0.206) (0347) (0319) (0.179) (0.398) (0.154) (0.132)
Graduate school 0.136 0.074 0.136 0.056 0.242 -0.227 -0.498 0.367' 0.007
(0.216) (0.149) (0.216) (0.370) (0.318) (0.198) (0.506) (0.162) (0.140)
Dad at home -0.419" -0.176 -0.419" -0.298 -0.200 -0.205 -0.859" -0.109 -0.296-
(0.158) (0.116) (0.158) (0.260) (0.234) (0.147) (0.299) (0.125) (0.107)
Mom not working -0.047 -0.134 -0.047 0.005 0.367 -0.184 0.371 0.054 -0.279'
(0.198) (0.134) (0.198) (0.314) (0.260) (0.173) (0.344) (0.140) (0.129)
One sibling -0.537 0.329 -0.537 0.060 0.113 -0.170 -0.615 0.023 0.316
(0.292) (0.234) (0.292) (0.485) (0.516) (0.282) (0.539) (0.245) (0.219)
Two siblings -0.353 0.432 -0.353 -0.091 0.116 -0.046 -0.995 0.174 0.268
(0.289) (0.235) (0.289) (0.490) (0.517) (0.283) (0.572) (0.246) (0.221)
Three siblings -0.124 0.462' -0.124 -0.289 0.593 0.170 -0.064 0367 0.351
(0.277) (0.231) (0.277) (0.481) (0.492) (0.274) (0.488) (0.241) (0.217)
Constant -3.619 1.126 -3.619 -6.768' -5.831' 3.366 -4.957 -1.157
(1.948) (1.513) (1.948) (3.036) (2.789) (1.977) (3.549) (1.601)
Observations 2177 2173 2177 2184 2188 2198 2184 2178 2172
Standard errors in parentheses; significant at 5%; " significant at t%; Ref. = Male, White. Suburb, Northe st, Parents with HS degree, no siblings, and never attendsreligious services. All models are logistic regressions unless noted: t = ordered logistic regression, 8 = Cox proportional hazard model.
BEST COPY AVAILABLE
National Study of Youth and Religion

Appendix 1d: Religious Service Attendance Regression Table
SkippedSchool
Sent toDetentiont
Suspended orExpelled
Parents LimitTime Out on
School Nights
Argues WithParents
Volunteers InCommunity -1-
Participates inSports, Athletics
or Exerciset
Participates inStudent
Governmentt
Attends weekly -0.987" -0.530" -0.859" 0.491" -0.116 1.678" 0.583" 0.643"
(0.126) (0.153) (0.162) (0.123) (0.126) (0.134) (0.126) (0.175)
Attends 1-2 Times a Month -0.634" -0.362" -0.468" 0.321' 0.138 1.107" 0.525" 0.671"
(0.137) (0.168) (0.174) (0.136) (0.139) (0.144) (0.139) (0.190)
Attends rarely -0.349" -0.108 -0.150 0.288' -0.008 0.722" 0.348" 0.404*
(0.118) (0.140) (0.144) (0.118) (0.120) (0.126) (0.119) (0.173)
Female -0.451" -1.072" -1.066" 0.283" 0.462" 0.474" -0.691" 0.505"
(0.080) (0.101) (0.107) (0.079) (0.080) (0.082) (0.082) (0.105)
Black -0.190 0.249 0.993" 0.248' -1.066" -0.021 -0.335" 0.271
(0.129) (0.151) (0.150) (0.125) (0.132) (0.130) (0.128) (0.163)
Other minority 0.030 0.075 0.256 0.285" -0.361" 0.033 -0.104 -0.044
(0.110) (0.136) (0.139) (0.109) (0.110) (0.114) (0.111) (0.146)
Rural -0.019 0.112 -0.079 -0.247 -0.671" 0.093 -0.115 -0.009
(0.131) (0.160) (0.172) (0.131) (0.130) (0.132) (0.132) (0.166)
Small town -0.189 0.011 -0.203 -0.233 -0.418" -0.023 -0.021 0.027
(0.122) (0.148) (0.161) (0.119) (0.122) (0.122) (0.121) (0.151)
City 0.153 -0.060 0.009 -0.178 -0.300" 0.036 -0.021 -0.203
(0.114) (0.141) (0.146) (0.112) (0.115) (0.115) (0.114) (0.145)
North Central -0.176 -0.482" 0.133 -0.003 0.054 -0.344" -0.119 -0.076
(0.114) (0.142) (0.150) (0.113) (0.114) (0.116) (0.115) (0.149)
South -0.050 -0.129 0.248 0.055 -0.161 -0.384" -0.384" -0.094
(0.104) (0.124) (0.137) (0.103) (0.104) (0.107) (0.104) (0.135)
West 0.249' -0.623" -0.012 0.119 -0.051 -0.163 -0.030 0.118
(0.126) (0.162) (0.168) (0.124) (0.127) (0.129) (0.128) (0.164)
Age 0.168' 0.043 0.126 -0.309" -0.250" -0.111 -0.023 -0.194'
(0.066) (0.077) (0.080) (0.067) (0.065) (0.068) (0.066) (0.092)
No HS degree 0.107 0.309 0.607" 0.031 0.100 -0.254 -0.397' -0.761"
(0.169) (0.200) (0.198) (0.168) (0.167) (0.175) (0.167) (0.273)
Some college 0.103 -0.064 -0.026 -0.010 0.333" 0.057 0.123 -0.038
(0.120) (0.145) (0.152) (0.119) (0.121) (0.124) (0.120) (0.160)
College graduate -0.029 -0.173 -0.091 0.150 0.264' 0.254' 0.304" 0.240
(0.112) (0.136) (0.144) (0.111) (0.111) (0.114) (0.112) (0.145)
Graduate school -0.164 -0.115 -0.347' 0.078 0.290' 0.453" 0.240' 0.315'
(0.123) (0.149) (0.163) (0.120) (0.121) (0.124) (0.122) (0.156)
Dad at home -0.068 -0.123 -0.307" 0.518" 0.156 0.337" 0.151 0.164
(0.094) (0.112) (0.115) (0.095) (0.094) (0.097) (0.095) (0.128)
Mom not working -0.234' -0.209 -0.282 -0.055 -0.148 0.037 0.028 -0.120
(0.108) (0.135) (0.145) (0.106) (0.106) (0.108) (0.107) (0.142)
One sibling 0.168 0.548' 0.247 -0.365' -0.252 -0.022 0.262 0.066
(0.186) (0.241) (0.243) (0.182) (0.179) (0.189) (0.184) (0.239)
Two siblings 0.339 0.539' 0.316 -0.411' -0.495" -0.241 0.293 0.222
(0.187) (0.242) (0.243) (0.183) (0.180) (0.190) (0.185) (0.239)
Three siblings 0.501" 0.646" 0.569' -0.310 -0.381' -0.360 0.301 -0.029
(0.185) (0.238) (0.237) (0.180) (0.178) (0.188) (0.183) (0.239)
Observations 2195 2191 2178 2188 2183 2193 2193 2185
Standard errors in parentheses; ' significant at 546; " significant at 1%; Ref. = Male, White, Suburb, Northeast. Parents with HS degree, no siblings, and never attendsreligious services. All models are logistic regressions unless noted: t = ordered logistic regression, 1 = Cox proportional hazard model.
Religion and Risk Behaviors
!t53
q
BEST COPY AVAILABLE

Appendix 2a: Importance of Relig'on Regression TableFirst
Cigarette*Smokes
RegularlyFirst Time
DrunkGoes
to Bars°Drinks tot et
DrunkOfferedDrugs
SoldDrugs
Tried DrugsTried
MarijuanaTried Hard
Drugs
Religion very important -0.314" -0.855" -0.387" -0.525" -0.742" 0.714" -1.336" -0.845" -0.969" -0.603"
(0.094) (0.184) (0.096) (0.130) (0.126) (0.151) (0.210) (0.142) (0.144) (0.154)
Religion pretty important -0.051 -0.272 -0.029 -0.050 -0.290' -0.385" -0.855" -0.341' -0.408" -0.473"
(0.089) (0.164) (0.089) (0.124) (0.123) (0.144) (0.184) (0.138) (0.139) (0.148)
Religion a little important 0.044 -0.203 0.085 -0.093 -0.076 -0.237 -0.483" -0.143 -0.190 -0.161
(0.090) (0.164) (0.090) (0.127) (0.125) (0.146) (0.176) (0.142) (0.142) (0.147)
Female 0.047 0.049 -0.055 -0.262" -0.260" -1.106" -1.128" -0.125 -0.256" -0.065
(0.058) (0.117) (0.060) (0.081) (0.078) (0.098) (0.142) (0.090) (0.091) (0.101)
Black -0.508" -1.892" -0.782" -0.184 -0.748" -0.341' -0.173 -0.535" -0.398" -1.917"
(0.105) (0.288) (0.118) (0.133) (0.127) (0.162) (0.222) (0.146) (0.149) (0.246)
Other minority -0.145 -0.863" -0.334" 0.117 -0.513" -0.314' -0.047 -0.446" -0.414" . -0.230
(0.082) (0.179) (0.087) (0.112) (0.108) (0.134) (0.182) (0.124) (0.126) (0.136)
Rural -0.140 -0.272 -0.147 -0.374" -0.383" -0.518" -0.234 -0.344' -0.482" -0.183
(0.094) (0.184) (0.096) (0.133) (0.127) (0.160) (0.221) (0.146) (0.148) (0.162)
Small town -0.066 -0.246 -0.038 -0.345" -0.196 -0.338' -0.188 -0.291' -0.388" -0.102
(0.085) (0.168) (0.086) (0.121) (0.117) (0.145) (0.200) (0.135) (0.136) (0.147)
City -0.088 -0.219 -0.097 -0.171 -0.176 -0.085 0.052 -0.135 -0.162 -0.208
(0.081) (0.165) (0.083) (0.114) (0.110) (0.135) (0.185) (0.127) (0.128) (0.143)
North Central -0.010 -0.159 -0.077 -0.439" -0.023 -0.005 0.063 -0.099 -0.058 -0.011
(0.082) (0.157) (0.083) (0.116) (0.112) (0.138) (0.180) (0.127) (0.129) (0.142)
South 0.095 -0.008 0.036 0.029 0.026 0.116 -0.002 0.073 0.057 0.156
(0.076) (0.145) (0.077) (0.105) (0.102) (0.127) (0.172) (0.117) (0.119) (0.131)
West -0.090 -0.745" -0.003 -0.676" -0.138 0.387' -0.273 -0.055 -0.079 0.109
(0.093) (0.206) (0.094) (0.131) (0.124) (0.151) (0.215) (0.142) (0.144) (0.156)
Age 0.030 0.051 0.123' 0.208" 0.136' -0.117 -0.004 0.164' 0.167' 0.143
(0.049) (0.094) (0.051) (0.065) (0.065) (0.079) (0.102) (0.074) (0.076) (0.080)
No HS degree 0.151 0.337 0.024 0.373' -0.037 0349 0.063 0.500" 0.280 0.407
(0.128) (0.255) (0.137) (0.174) (0.166) (0.206) (0.289) (0.191) (0.192) (0.212)
Some college 0.104 0.143 0.118 0.105 0.256' 0.246 0.196 0.123 0.143 0.242
(0.088) (0.175) (0.092) (0.125) (0.118) (0.147) (0.196) (0.135) (0.137) (0.156)
College graduate 0.023 -0.118 0.067 0.182 0.164 0.112 0.009 0.098 0.094 0.140
(0.082) (0.162) (0.084) (0.113) (0.109) (0.138) (0.187) (0.124) (0.127) (0.143)
Graduate school -0.037 -0.126 -0.005 0.152 0.101 0.361' 0.144 0.162 0.073 0.265
(0.089) (0.176) (0.092) (0.123) (0.119) (0.146) (0.199) (0.135) (0.138) (0.153)
Dad at home . -0.127 -0.354" -0.128 -0.082 -0.059 -0.032 -0.477" -0.284" -0.305" -0.270'
(0.069) (0.135) (0.071) (0.095) (0.092) (0.114) (0.146) (0.106) (0.107) (0.118)
Mom not working -0.244" -0.421' -0.299" -0.079 -0.458" -0.194 -0.396' -0.302' -0.300' -0.358"
(0.080) (0.165) (0.083) (0.108) (0.106) (0.130) (0.193) (0.120) (0.122) (0.138)
One sibling -0.010 0335 0.280' 0.521" 0.184 0.338 0.063 0.110 0.251 0.103
(0.129) (0.268) (0.141) (0.192) (0.183) (0.224) (0.288) (0.201) (0.204) (0.231)
Two siblings 0.053 0.053 0.377" 0.413' 0.246 0.408 -0.081 0.094 0.217 0.184
(0.130) (0.274) (0.142) (0.193) (0.184) (0.226) (0.293) (0.202) (0.206) (0.233)
Three siblings 0.108 0.266 0.394" 0.435' 0.267 0.496' 0.183 0.226 0.287 0.357
(0.129) (0.268) (0.140) (0.191) (0.181) (0.222) (0.282) (0.199) (0.202) (0.229)
Constant -1.336 2.088 -0.237 -2.156 -2.267 -3.076'
(1.775) (1.491) (1.924) (1.384) (1.425) (1.511)
Observations 1906 2177 1862 2190 2152 2180 2173 2198 2163 2198
Standard errors in parentheses; significan at 5%; " signi icant at 1%; Ref. = Male, Wh'te, Suburb, Northeast, Parents with HS degree, no sibling , and never attends religiousservices. All models are logistic regressions unless noted: 1-= ordered logistic regression, 0 = Cox proportional hazard model.
5453
BEST COPY AVAILABLE
National Study of Youth and Religion
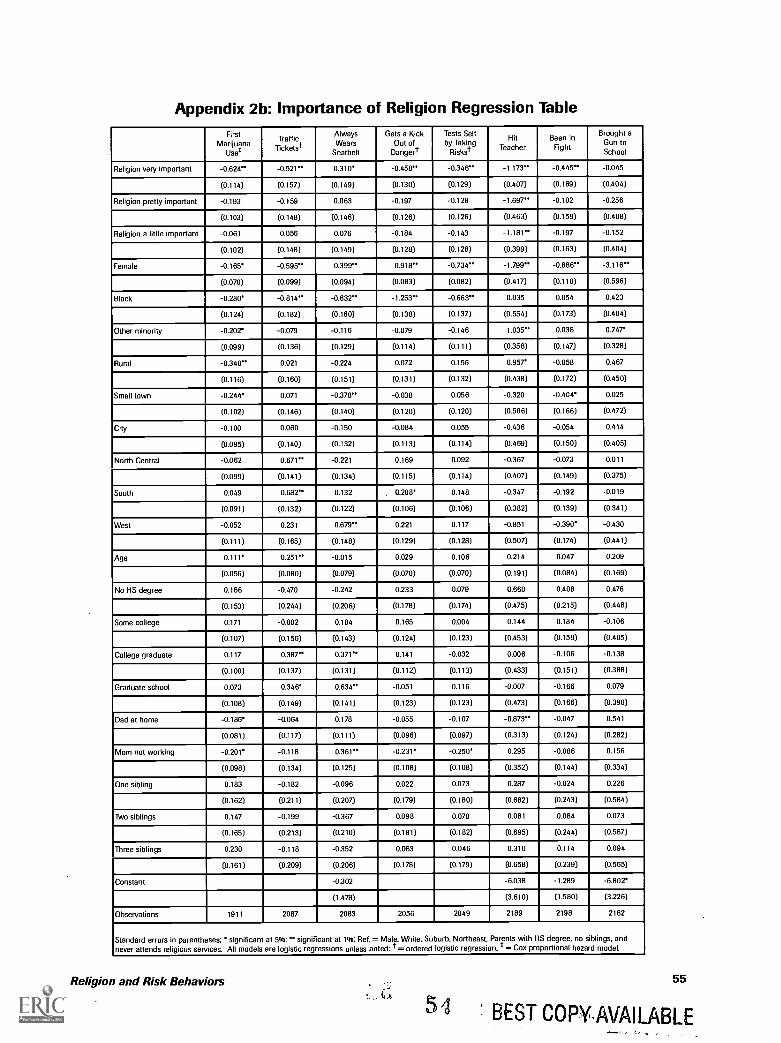
Appendix 2b: Importance of Religion Regression TableFirst
MarijuanaUse
TrafficTicketst
AlwaysWears
Seatbelt
Gets a KickOut of
Danger
Tests Selfby Taking
Risks
HitTeacher
Been inFight
Brought aGun toSchool
Religion very important -0.624" -0.521** 0.310* -0.458" -0.346" -1.173" -0.445" -0.045
(0.114) (0.157) (0.149) (0.130) (0.129) (0.407) (0.169) (0.404)
Religion pretty important -0.193 -0.159 0.063 -0.197 -0.128 -1.697** -0.102 -0.256
(0.103) (0.148) (0.146) (0.126) (0.126) (0.463) (0.159) (0.408)
Religion a little important -0.061 0.056 0.076 -0.184 -0.143 -1.181" -0.197 -0.152
(0.102) (0.148) (0.149) (0.128) (0.128) (0.399) (0.163) (0.404)
Female -0.165* -0.595" 0.399" -0.918" -0.734" -1.799" -0.886" -3.116"
(0.070) (0.099) (0.094) (0.083) (0.082) (0.417) (0.110) (0.596)
Black -0.280* -0.814" -0.632" -1.253" -0.663" 0.035 0.054 0.423
(0.124) (0.182) (0.160) (0.138) (0.137) (0.554) (0.173) (0.404)
Other minority -0.202* -0.079 -0.116 -0.079 -0.146 1.035" 0.038 0.747*
(0.099) (0.136) (0.129) (0.114) (0.111) (0.358) (0.147) (0.328)
Rural -0.340" 0.021 -0.224 0.072 0.156 0.957 -0.058 0.467
(0.116) (0.160) (0.151) (0.131) (0.132) (0.438) (0.172) (0.450)
Small town -0.244* 0.071 -0.378" -0.038 0.056 -0.320 -0.404* -0.025
(0.102) (0.146) (0.140) (0.120) (0.120) (0.506) (0.166) (0.472)
City -0.100 0.060 -0.150 -0.084 0.055 -0.436 -0.054 0.414
(0.095) (0.140) (0.132) (0.113) (0.114) (0.469) (0.150) (0.405)
North Central -0.062 0.671" -0.221 0.169 0.092 -0.367 -0.073 0.011
(0.099) (0.141) (0.134) (0.115) (0.114) (0.407) (0.149) (0.375)
South 0.049 0.682" 0.132 0.208* 0.148 -0.347 -0.192 -0.019
(0.091) (0.132) (0.122) (0.106) (0.106) (0.382) (0.139) (0.341)
West -0.052 0.231 0.679" 0.221 0.117 -0.851 -0.390* -0.430
(0.111) (0.165) (0.148) (0.129) (0.128) (0.507) (0.174) (0.441)
Age 0.111* 0.251" -0.015 0.029 0.106 0.214 0.047 0.209
(0.056) (0.080) (0.079) (0.070) (0.070) (0.191) (0.084) (0.169)
No HS degree 0.186 -0.470 -0.242 0.233 0.079 0.660 0.408 0.476
(0.153) (0.244) (0.206) (0.178) (0.174) (0.475) (0.215) (0.448)
Some college 0.171 -0.002 0.184 0.165 0.004 0.144 0.184 -0.106
(0.107) (0.156) (0.143) (0.124) (0.123) (0.453) (0.159) (0.405)
College graduate 0.117 0.387" 0.371" 0.141 -0.032 0.006 -0.106 -0.138
(0.100) (0.137) (0.131) (0.112) (0.113) (0.433) (0.151) (0.388)
Graduate school 0.073 0.346* 0.634" -0.051 0.116 -0.007 -0.166 0.079
(0.108) (0.149) (0.141) (0.123) (0.123) (0.473) (0.166) (0.390)
Dad at home -0.186* -0.064 0.178 -0.055 -0.107 -0.873" -0.047 -0.541
(0.081) (0.117) (0.111) (0.096) (0.097) (0.313) (0.124) (0.282)
Mom not working -0.201* -0.118 0.361" -0.231* -0.250* 0.295 -0.086 0.156
(0.098) (0.134) (0.125) (0.108) (0.108) (0.352) (0.144) (0.334)
One sibling 0.183 -0.182 -0.096 0.022 0.073 0.287 -0.024 0.226
(0.162) (0.211) (0.207) (0.179) (0.180) (0.682) (0.243) (0.584)
Two siblings 0.147 -0.199 -0.367 0.098 0.078 0.081 0.084 0.073
(0.165) (0.213) (0.210) (0.181) (0.182) (0.695) (0.244) (0.587)
Three siblings 0.230 -0.118 -0.352 0.083 0.046 0.310 0.114 0.094
(0.161) (0.209) (0.206) (0.178) (0.179) (0.658) (0.239) (0.565)
Constant -0302 -6.038 -1.289 -6.802*
(1.478) (3.610) (1.580) (3.226)
Observations 1911 2087 2083 2056 2049 2189 2198 2182
Standard errors in parentheses; significan at 5%; " significant at 1%; Ref. = Male, White, Suburb, Northeast, Parents with HS degree, no siblings, andnever attends religious services. All models are logistic regressions unless noted: t = ordered logistic regression, 4 = Cox proportional haza d model.
Religion and Risk Behaviors 55n
54 BEST COP' AILABLE

Appendix 2c: Importance of Religion Regression Table
Troublewith the
Police
PettyTheft
SignificantTheft
ArmedRobbery
Stolena Car
Vandalism Arson Trespassed Shopliftedt
Religion very important -0.854" -0.702" -0.854" -1.081" -1.088" -0.707" -1.333" -0.689" -0.777-
(0.226) (0.157) (0.226) (0.364) (0.322) (0.197) (0.444) (0.167) (0.148)
Religion pretty important -0.554" -0.299' -0.554" -0.607 -0.937" -0.532" -0.862' -0.381' -0.310'
(0.209) (0.147) (0.209) (0.320) (0.308) (0.183) (0.372) (0.156) (0.137)
Religion a little important -0.293 -0.120 -0.293 -0.820' -0.449 -0.347 -1.056" -0.185 -0.288'
(0.205) (0.148) (0.205) (0.338) (0.293) (0.180) (0.403) (0.156) (0.141)
Female -1.279" -0.786" -1.279" -2.044" -0.875" -1.252" -1.746" -0.673" -0.542"
(0.162) (0.101) (0.162) (0.345) (0.231) (0.139) (0.393) (0.109) (0.094)
Black 0.273 -0.041 0.273 0.458 0.645 -0.428 0.485 -0.374' 0.108
(0.224) (0.164) (0.224) (0.369) (0.330) (0.227) (0.450) (0.188) (0.152)
Other minority 0.476' 0.042 0.476' 0.746' 1.011" -0.015 0.396 -0.016 0.263'
(0.188) (0.136) (0.188) (0.292) (0.262) (0.175) (0.375) (0.147) (0.126)
Rural -0.287 -0.321' -0.287 -0.115 0.214 -0.171 0.233 -0.256 -0.379'
(0.237) (0.162) (0.237) (0.406) (0.370) (0.199) (0.425) (0.172) (0.150)
Small town -0.316 -0.340' -0.316 -0.473 0.102 -0.490' -0.274 -0.259 -0.421"
(0.218) (0.149) (0.218) (0.404) (0.351) (0.191) (0.429) (0.157) (0.139)
City -0.247 -0.194 -0.247 0.360 0.242 -0.353' -0.673 -0.325' -0.441"
(0.200) (0.138) (0.200) (0.329) (0.313) (0.178) (0.430) (0.149) (0.129)
North Central 0.287 0.189 0.287 -0.170 0.193 0.033 -0.882' -0.039 -0.145
(0.205) (0.140) (0.205) (0.318) (0.320) (0.171) (0.431) (0.151) (0.134)
South 0.383" 0.152 0.383' -0.314 0.440 -0.320 -0.546 0.061 -0.028
(0.190) (0.131) (0.190) (0.299) (0.289) (0.168) (0.364) (0.139) (0.122)
West -0.284 -0.021 -0.284 -0.933' 0.088 -0.414' -0.576 -0.132 -0.086
(0.250) (0.160) (0.250) (0.411) (0.345) (0.207) (0.453) (0.171) (0.147)
Age 0.181 -0.057 0.181 0.271 0.156 -0.186 0.231 0.052 -0.044
(0.103) (0.080) (0.103) (0.156) (0.144) (0.105) (0.185) (0.085) (0.075)
No HS degree 0.120 -0.085 0.120 0.466 -0.049 0.249 0.229 0.011 -0.131
(0.288) (0.215) (0.288) (0.441) (0.406) (0.264) (0.519) (0.238) (0.201)
Some college 0.056 0.104 0.056 0.451 0.229 0.188 0.324 0.361' 0.129
(0.213) (0.148) (0.213) (0.347) (0.308) (0.188) (0.404) (0.162) (0.137)
College graduate -0.121 -0.184 -0.121 0.136 -0.091 -0.122 0.081 0.105 -0.247
(0.206) (0.140) (0.206) (0.347) (0.320) (0.179) (0.399) (0.154) (0.132)
Graduate school 0.094 0.066 0.094 0.088 0.234 -0.223 -0.479 0.349' -0.025
(0.215) (0.149) (0.215) (0.370) (0.319) (0.198) (0.507) (0.162) (0.140)
Dad at home -0.451" -0.176 -0.451" -0.301 -0.190 -0.197 -0.882" -0.123 -0.336"
(0.157) (0.115) (0.157) (0.259) (0.234) (0.146) (0.299) (0.125) (0.106)
Mom not working -0.094 -0.139 -0.094 -0.020 0.359 -0.198 0.338 0.048 -0.303'
(0.198) (0.135) (0.198) (0.315) (0.261) (0.174) (0.343) (0.141) (0.130)
One sibling -0.554 0.300 -0.554 0.086 0.074 -0.201 -0.636 -0.007 0.309
(0.291) (0.234) (0.291) (0.488) (0.519) (0.282) (0.542) (0.245) (0.219)
Two siblings -0.386 0.401 -0.386 -0.049 0.085 -0.066 -1.016 0.142 0.243
(0.289) (0.235) (0.289) (0.493) (0.520) (0.283) (0.576) (0.246) (0.221)
Three siblings -0.162 0.429 -0.162 -0.267 0.561 0.156 -0.124 0.326 0.309
(0.276) (0.231) (0.276) (0.484) (0.495) (0.275) (0.490) (0.241) (0.217)
Constant -3.931' 0.744 -3.931' -6.930' -5.969' 3.261 -5.212 -1.523
(1.938) (1.512) (1.938) (2.966) (2.746) (1.971) (3.482) (1.598)
Observations 2177 2173 2177 2184 21138 2198 2184 2178 2172
Standard errors in parentheses; significant at 5%; " signif cant at 1%; Re. = Male. White, Suburb, Northeast. Parents wi h HS degree, no siblings, and never attendsreligious services. All models are logistic regressions unles noted: t = ordered logistic regression, 0 = Cox proportional hazard model.
56 National Study of Youth and Religion
55

Appendix 2d: Importance of Religion Regression Table
SkippedSchool/
Sent toDetention/
Suspended orExpelled/
Parents LimitTime Out on
School Nights/
Argues WithParents/
Volunteers InCommunity f
Participates inSports, Athletics
or Exercise
Participates inStudent
Government/
Religion very important -0.935" -0.587" -0.612" 0.365" -0.419" 1.135" 0.533" 1.010"
(0.128) (0.155) (0.167) (0.124) (0.128) (0.132) (0.126) (0.184)
Religion pretty important -0.641" -0.314' -0.260 0.383" -0.242 0.837" 0.407" 0.764"
(0.123) (0.147) (0.157) (0.121) (0.125) (0.128) (0.123) (0.183)
Religion a little important -0.489" -0.088 -0.024 0.204 -0.236 0.270' 0.374" 0.541"
(0.125) (0.147) (0.158) (0.124) (0.128) (0.131) (0.126) (0.190)
Female -0.441" -1.055" -1.055" 0.283" 0.492" 0.467" -0.686" 0.481"
(0.081) (0.101) (0.107) (0.079) (0.080) (0.082) (0.082) (0.106)
Black -0.141 0.307' 1.014" 0.236 -1.003" -0.062 -0.348" 0.181
(0.130) (0.152) (0.152) (0.127) (0.133) (0.132) (0.130) (0.165)
Other minority 0.081 0.105 0.279' 0.273' -0.333" 0.007 -0.112 -0.093
(0.110) (0.137) (0.139) (0.109) (0.110) (0.113) (0.111) (0.147)
Rural -0.033 0.113 -0.083 -0.244 -0.667" 0.114 -0.107 -0.013
(0.131) (0.160) (0.172) (0.131) (0.130) (0.131) (0.131) (0.166)
Small town -0.204 0.000 -0.206 -0.225 -0.431" -0.012 -0.023 0.036
(0.122) (0.149) (0.161) (0.119) (0.122) (0.122) (0.121) (0.152)
City 0.153 -0.046 0.024 -0.168 -0.312" 0.030 -0.026 -0.211
(0.114) (0.141) (0.145) (0.112) (0.115) (0.114) (0.114) (0.145)
North Central -0.187 -0.502" 0.116 -0.005 0.057 -0.318" -0.109 -0.075
(0.114) (0.142) (0.149) (0.113) (0.114) (0.115) (0.115) (0.149)
South -0.037 -0.112 0.240 0.049 -0.125 -0.378" -0.381" -0.141
(0.104) (0.124) (0.138) (0.103) (0.104) (0.107) (0.105) (0.136)
West 0.282' -0.591" 0.026 0.089 -0.031 -0.224 -0.055 0.080
(0.126) (0.162) (0.168) (0.124) (0.127) (0.129) (0.128) (0.165)
Age 0.201" 0.070 0.159' -0.321" -0.246" -0.158' -0.041 - 0.217'
(0.066) (0.077) (0.079) (0.066) (0.065) (0.068) (0.066) (0.093)
No HS degree 0.099 0.308 0.607" 0.036 0.095 -0.251 -0.392' -0.774"
(0.169) (0.200) (0.197) (0.168) (0.167) (0.173) (0.167) (0.274)
Some college 0.074 -0.073 -0.046 0.008 0.326" 0.108 0.136 -0.041
(0.120) (0.145) (0.151) (0.119) (0.121) (0.123) (0.120) (0.160)
College graduate -0.102 -0.210 -0.159 0.179 0.259' 0.362" 0.336" 0.258
(0.111) (0.136) (0.143) (0.111) (0.111) (0.114) (0.112) (0.145)
Graduate school -0.243' -0.147 -0.416' 0.115 0.285' 0.580" 0.282' 0.342'
(0.122) (0.148) (0.162) (0.119) (0.121) (0.123) (0.122) (0.155)
Dad at home -0.128 -0.161 -0.367" 0.534" 0.160 0.408" 0.176 0.174
(0.093) (0.112) (0.114) (0.094) (0.094) (0.096) (0.094) (0.127)
Mom not working -0.280' -0.217 -0.304' -0.041 -0.166 0.056 0.034 -0.123
(0.109) (0.135) (0.145) (0.106) (0.106) (0.107) (0.107) (0.143)
One sibling 0.141 0.531' 0.243 -0.332 -0.248 0.008 0.297 0.121
(0.185) (0.240) (0.242) (0.181) (0.179) (0.187) (0.183) (0.239)
Two siblings 0.299 0.504' 0.278 -0.384' -0.482" -0.160 0.331 0.270
(0.186) (0.241) (0.242) (0.182) (0.180) (0.188) (0.184) (0.240)
Three siblings 0.437' 0.601' 0.510' -0.275 -0.368' -0.237 0.357' 0.031
(0.183) (0.237) (0.236) (0.179) (0.177) (0.186) (0.182) (0.239)
Constant
Observations 2195 2191 2178 2188 2183 2193 2193 2185
Standard errors in parenthe es; significant at 5%; " significant at 1%; Ref. = Male, White, Suburb, Northeast, Paren s with HS degree, no siblings, and never attendsreligious services. All models are logistic regressions unless noted: / = ordered logistic regression, / = Cox proportional hazard model.
Religion and Risk Behaviors
.2,k: 4 0 56 BEST AVAILABLEJL
57

Appendix 3a: Religious Youth Group Participation Regression Table...
First Cigarette'SmokesRegularly
First TimeDrunk*
Goesto Borst
Drinksto GetDrunkt
OfferedDrugs
SoldDrugs
TriedDrugs
TriedMarijuana
TriedHard Drugs
Youth group 1-2 yrs -0.042 -0.209 0.004 -0.117 0.002 0.235 0.242 -0.005 -0.132 0.081
(0.087) (0.172) (0.088) (0.119) (0.114) (0.142) (0.186) (0.132) (0.133) (0.145)
Youth group 2-4 yrs -0.015 -0.239 -0.024 -0.033 0.001 0.077 0.173 0.159 0.071 -0.085
(0.083) (0.170) (0.084) (0.119) (0.115) (0.142) (0.188) (0.132) (0.132) (0.147)
Youth group 4-5 yrs -0.170 -0.256 -0.191 0.087 -0.235 0.185 -0.023 -0.220 -0.231 -0.083
(0.110) (0.217) (0.114) (0.152) (0.148) (0.183) (0.264) (0.167) (0.169) (0.189)
Youth group 6+ yrs -0.304" -0.708" -0.393" -0.518" -0.628" -0.104 -0.436 -0.722" -0.750" -0.611"
(0.092) (0.202) (0.097) (0.127) (0.119) (0.148) (0.226) (0.138) (0.141) (0.169)
Female 0.029 0.043 -0.072 -0.296" -0.305" -1.166" -1.205" -0.168 -0.305" -0.086
(0.059) (0.118) (0.060) (0.082) (0.079) (0.099) (0.143) (0.091) (0.091) (0.102)
Black -0.544" -2.031" -0.851" -0.289' -0.878" -0.470" -0.381 -0.685" -0.555" -2.063"
(0.104) (0.286) (0.118) (0.132) (0.127) (0.160) (0.217) (0.145) (0.148) (0.250)
Other minority -0.197' -0.977" -0.389" 0.102 -0.619" -0.357" -0.183 -0.526" -0.510" -0.313'
(0.083) (0.182) (0.088) (0.113) (0.108) (0.134) (0.182) (0.124) (0.126) (0.137)
Rural -0.106 -0.258 -0.127 -0.348" -0.346" -0.519" -0.253 -0.293' -0.429" -0.171
(0.094) (0.185) (0.096) (0.134) (0.128) (0.160) (0.219) (0.147) (0.149) (0.163)
Small town -0.047 -0.261 -0.027 -0.324" -0.161 -0.321" -0.192 -0.251 -0.341' -0.100
(0.086) (0.169) (0.087) (0.122) (0.118) (0.145) (0.199) (0.136) (0.137) (0.148)
City -0.078 -0.226 -0.092 -0.141 -0.167 -0.082 0.005 -0.147 -0.165 -0.194
(0.082) (0.166) (0.084) (0.114) (0.111) (0.135) (0.184) (0.128) (0.128) (0.143)
North Central 0.003 -0.136 -0.064 -0.414" -0.022 0.003 0.050 -0.075 -0.028 0.010
(0.083) (0.158) (0.084) (0.117) (0.113) (0.139) (0.180) (0.128) (0.129) (0.144)
South 0.103 -0.005 0.035 0.030 -0.001 0.046 -0.141 0.076 0.040 0.170
(0.077) (0.146) (0.078) (0.106) (0.102) (0.127) (0.172) (0.118) (0.119) (0.132)
West -0.090 -0.724" -0.016 -0.673" -0.131 0.361' -0.303 -0.030 -0.050 0.143
(0.094) (0.208) (0.095) (0.133) (0.126) (0.151) (0.215) (0.143) (0.145) (0.157)
Age 0.020 0.043 0.119' 0.170' 0.092 -0.134 -0.010 0.123 0.120 0.133
(0.049) (0.096) (0.052) (0.066) (0.066) (0.080) (0.103) (0.075) (0.077) (0.082)
No HS degree 0.146 0.291 0.012 0.300 -0.041 0.341 0.140 0.482' 0.248 0.430'
(0.129) (0.257) (0.138) (0.174) (0.166) (0.206) (0.287) (0.190) (0.192) (0.213)
Some college 0.106 0.128 0.118 0.098 0.230 0.231 0.209 0.129 0.144 0.266
(0.089) (0.176) (0.092) (0.126) (0.118) (0.148) (0.196) (0.136) (0.138) (0.157)
College graduate 0.044 -0.101 0.090 0.182 0.191 0.116 0.037 0.151 0.136 0.190
(0.083) (0.163) (0.085) (0.114) (0.110) (0.138) (0.187) (0.126) (0.127) (0.145)
Graduate school -0.001 -0.089 0.034 0.186 0.165 0.358' 0.184 0.253 0.149 0.330'
(0.090) (0.177) (0.092) (0.124) (0.120) (0.147) (0.199) (0.137) (0.139) (0.154)
Dad at home -0.136' -0.355" -0.127 -0.095 -0.072 -0.057 -0.486" -0.314" -0.332" -0.253'
(0.069) (0.136) (0.071) (0.096) (0.092) (0.113) (0.145) (0.106) (0.107) (0.118)
Mom not working -0.254" -0.486" -0.320" -0.092 -0.474" -0.199 -0.349 -0.335" -0.322" -0.413"
(0.081) (0.168) (0.084) (0.109) (0.107) (0.130) (0.192) (0.121) (0.122) (0.140)
One sibling 0.005 0.344 0.291' 0.538" 0.218 0.362 0.056 0.133 0.276 0.088
(0.130) (0.268) (0.142) (0.193) (0.184) (0.225) (0.286) (0.201) (0.204) (0.232)
Two siblings 0.070 0.040 0.377" 0.441' 0.267 0.424 -0.069 0.108 0.237 0.155
(0.131) (0.275) (0.143) (0.194) (0.185) (0.227) (0.290) (0.203) (0.206) (0.234)
Three siblings 0.123 0.279 0.405" 0.459' 0.278 0.498' 0.141 0.249 0.310 0.336
(0.130) (0.269) (0.142) (0.193) (0.183) (0.223) (0.281) (0.200) (0.202) (0.230)
Constant -1.329 2.060 -0.675 -1.690 -1.717 -3.130'
(1.800) (1.502) (1.942) (1.402) (1.440) (1,542)
Observations 1878 2144 1835 2156 2119 2162 2148 2164 2131 2164
Standard errors in parentheses: significant at 54k; " significant at 1% Ref. = Male, White, Suburb, Northeast, Paren s with HS degree, no siblings, and never attends religiousservices. All models are logistic regressions unless noted: t = ordered logistic regression, *= Cox proportional haza d model.
58BEST COPY AVAILABLE 57 National Study of Youth and Religion

Appendix 3b: Religious Youth Group Participation Regression Table
FirstMarijuana
Use
TrafficTicketsT
AlwaysWears
Seatbelt
Gets a KickOut of
Danger
Tests Selfby Taking
Risks
HitTeacher
Been inFight
Brought aGun toSchool
Youth group 1-2 yrs -0.099 -0.063 0.142 -0.129 -0.018 0.265 -0.052 -0.504
(0.105) (0.148) (0.139) (0.121) (0.120) (0.409) (0.163) (0.494)
Youth group 2-4 yrs 0.030 0.225 -0.253 0.125 -0.002 0.054 0.205 0.272
(0.097) (0.140) (0.140) (0.117) (0.117) (0.473) (0.154) (0.380)
Youth group 4-5 yrs -0.180 -0.043 -0.033 -0.045 -0.167 -0.905 -0.250 -0.091
(0.135) (0.190) (0.176) (0.150) (0.154) (0.778) (0.221) (0.564)
Youth group 6+ yrs -0.564" -0.227 0.227 -0.235 -0.004 -0.220 -0.121 0.100
(0.120) (0.153) (0.141) (0.122) (0.123) (0.514) (0.168) (0.400)
Female -0.192" -0.639" 0.425" -0.925" -0.732" -1.846" -0.908" -3.072"
(0.071) (0.100) (0.095) (0.084) (0.083) (0.419) (0.112) (0.597)
Black -0.381" -0.955" -0.584" -1.281" -0.715" -0.459 -0.010 0.473
(0.123) (0.180) (0.160) (0.137) (0.137) (0.583) (0.171) (0.399)
Other minority -0.271" -0.137 -0.103 -0.106 -0.171 0.854* 0.009 0.808*
(0.101) (0.137) (0.130) (0.114) (0.112) (0.361) (0.148) (0.328)
Rural -0.310" -0.005 -0.220 0.085 0.139 1.152' 0.014 0.489
(0.117) (0.161) (0.152) (0.132) (0.133) (0.450) (0.174) (0.453)
Small town -0.218* 0.052 -0.380" -0.028 0.051 -0.201 -0.338* -0.016
(0.102) (0.147) (0.141) (0.121) (0.121) (0.526) (0.168) (0.472)
City -0.096 0.052 -0.151 -0.087 0.036 -0.334 -0.019 0.345
(0.096) (0.140) (0.133) (0.114) (0.114) (0.481) (0.152) (0.408)
North Central -0.045 0.699" -0.228 0.132 0.074 -0.396 -0.070 0.010
(0.100) (0.142) (0.135) (0.115) (0.115) (0.416) (0.151) (0.377)
South 0.042 0.654" 0.146 0.153 0.102 -0.385 -0.200 -0.112
(0.092) (0.134) (0.123) (0.107) (0.108) (0.376) (0.141) (0.347)
West -0.040 0.217 0.697" 0.201 0.106 -0.937 -0.373" -0.451
(0.112) (0.166) (0.150) (0.130) (0.129) (0.511) (0.176) (0.440)
Age 0.100 0.218" -0.018 0.007 0.109 0.133 -0.003 0.229
(0.057) (0.082) (0.081) (0.071) (0.071) (0.195) (0.086) (0.169)
No HS degree 0.173 -0.491' -0.229 0.197 0.068 0.995* 0.406 0.516
(0.156) (0.247) (0.207) (0.179) (0.176) (0.483) (0.216) (0.453)
Some college 0.179 -0.029 0.207 0.157 -0.011 0.303 0.156 -0.074
(0.108) (0.157) (0.145) (0.125) (0.124) (0.464) (0.160) (0.411)
College graduate 0.146 0.377" 0.376" 0.163 -0.021 0.161 -0.093 -0.106
(0.101) (0.138) (0.132) (0.114) (0.114) (0.443) (0.152) (0.394)
Graduate school 0.132 0.338* 0.641" -0.025 0.125 0.184 -0.163 0.108
(0.109) (0.151) (0.144) (0.124) (0.125) (0.485) (0.168) (0.399)
Dad at home -0.208' -0.108 0.195 -0.070 -0.125 -0.888" -0.064 -0.589'
(0.082) (0.117) (0.112) (0.097) (0.097) (0.316) (0.125) (0.287)
Mom not working -0.230* -0.167 0.387" -0.206 -0.226" 0.391 -0.076 0.173
(0.099) (0.136) (0.127) (0.109) (0.110) (0.352) (0.146) (0.337)
One sibling 0.219 -0.177 -0.083 0.033 0.083 0.200 0.013 0.172
(0.164) (0.212) (0.209) (0.181) (0.181) (0.670) (0.245) (0.586)
Two siblings 0.176 -0.205 -0.360 0.086 0.072 -0.149 0.116 0.070
(0.167) (0.213) (0.211) (0.183) (0.183) (0.693) (0.246) (0.586)
Three siblings 0.273 -0.119 -0.352 0.069 0.042 0.177 0.136 0.088
(0.163) (0.210) (0.208) (0.180) (0.180) (0.649) (0.241) (0.565)
Constant -0.194 -5.482 -0.594 -7237'
(1.514) (3.716) (1.626) (3.240)
Observations 1882 2056 2052 2026 2019 2164 2164 2163
Standard errors in parentheses; sig ificant at 54b; " significant at 1%; Ref. = Male, White, Suburb, Northeast, Parents wi h HS degree, no siblings, andnever attends religious services. All models are logistic regressions unless noted: T = o dered logistic regression, *= Cox proportional hazard model.
Religion and Risk Behaviors 59te
58 BEST COPY AVAILABLE

Appendix 3c: Religious Youth Group Participation Regression Table
Troublewith the
Police
PettyTheft
SignificantTheft
ArmedRobbery
Stolena Car
Vandalism Arson Trespassed Shoplifted
Youth group 1-2 yrs 0.152 0.306' 0.152 0.401 -0.448 0.286 0.022 0.207 0.125
(0.211) (0.145) (0.211) (0.331) (0.358) (0.187) (0.421) (0.158) (0.136)
Youth group 2-4 yrs 0.133 0.103 0.133 -0.109 -0.205 0.146 -0.265 0.270 0.236
(0.211) (0.146) (0.211) (0.385) (0.333) (0.190) (0.501) (0.155) (0.135)
Youth group 4-5 yrs -0.236 -0.062 -0.236 0.062 -0.149 0.221 -0.287 0.045 -0.320
(0.308) (0.196) (0.308) (0.501) (0.424) (0.249) (0.641) (0.209) (0.193)
Youth group 6+ yrs -0.087 0.018 -0.087 0.139 -0.060 0.135 0.366 0.080 -0.086
(0.224) (0.151) (0.224) (0.364) (0.312) (0.199) (0.413) (0.163) (0.145)
Female -1.320" -0.849" -1.320" -2.086" -0.953" -1.345" -1.801" -0.750" -0.590"
(0.163) (0.102) (0.163) (0.347) (0.234) (0.141) (0.393) (0.110) (0.095)
Black 0.129 -0.175 0.129 0.182 0.425 - 0.535' 0.221 -0.488" -0.008
(0.219) (0.160) (0.219) (0.368) (0.323) (0.224) (0.443) (0.186) (0.150)
Other minority 0.389* -0.021 0.389' 0.641" 0.843" -0.064 0.310 -0.105 0.193
(0.189) (0.136) (0.189) (0.291) (0.265) (0.175) (0.373) (0.148) (0.127)
Rural -0.304 -0.335' -0.304 -0.088 0.197 -0.183 0.152 -0.287 -0.369"
(0.236) (0.162) (0.236) (0.410) (0.367) (0.200) (0.422) (0.172) (0.150)
Small town -0.315 -0.342' -0.315 -0.359 0.082 -0.465' -0.223 -0.266 -0.405"
(0.217) (0.150) (0.217) (0.407) (0.350) (0.192) (0.422) (0.157) (0.140)
City -0.284 -0.197 -0.284 0.390 0.175 -0.348 -0.771 -0.348' -0.444"
(0.199) (0.138) (0.199) (0.335) (0.313) (0.178) (0.428) (0.149) (0.130)
North Central 0256 0.174 0.256 -0.113 0.089 0.023 -0.883* -0.082 -0.134
(0205) (0.141) (0.205) (0319) (0.327) (0.171) (0.427) (0.151) (0.135)
South 0.262 0.066 0.262 -0.386 0.316 -0.424" -0.743" -0.039 -0.084
(0.189) (0.131) (0.189) (0.302) (0.288) (0.170) (0.362) (0.140) (0.123)
West -0.351 -0.074 -0.351 0.954' 0.035 -0.461" -0.684 -0.182 -0.103
(0.250) (0.160) (0.250) (0.413) (0.344) (0.208) (0.452) (0.172) (0.148)
Age 0.186 -0.066 0.186 0.223 0.050 -0.197 0.223 0.011 -0.037
(0.104) (0.081) (0.104) (0.163) (0.155) (0.106) (0.184) (0.087) (0.076)
No HS degree 0.195 -0.040 0.195 0.576 -0.003 0.284 0.309 0.062 -0.101
(0.288) (0.215) (0.288) (0.444) (0.407) (0.264) (0.518) (0.238) (0.202)
Some college 0.083 0.105 0.083 0.455 0.194 0.181 0.284 0.341' 0.111
(0.214) (0.148) (0.214) (0.351) (0.314) (0.188) (0.403) (0.163) (0.138)
College graduate -0.081 -0.150 -0.081 0.146 -0.118 -0.126 0.035 0.107 -0.246
(0.207) (0.141) (0.207) (0.351) (0.321) (0.179) (0.397) (0.155) (0.133)
Graduate school 0.115 0.069 0.115 0.085 0.205 -0.242 -0.559 0.319 -0.023
(0.217) (0.150) (0.217) (0.375) (0.321) (0.200) (0.508) (0.163) (0.141)
Dad at home -0.464" -0.195 -0.464" -0.340 -0.221 -0.206 -0.876" -0.155 -0.355"
(0.157) (0.115) (0.157) (0.260) (0.236) (0.147) (0.300) (0.125) (0.107)
Mom not working -0.065 -0.149 -0.065 0.049 0.351 -0.161 0.399 0.071 -0.294'
(0.198) (0.135) (0.198) (0.315) (0.261) (0.174) (0.343) (0.140) (0.131)
One sibling -0.561 0.294 -0.561 0.030 0.064 -0.204 -0.696 -0.003 0.343
(0.291) (0.234) (0.291) (0.486) (0.513) (0.282) (0.538) (0.245) (0.220)
Two siblings -0.373 0.403 -0.373 -0.145 0.054 -0.075 -1.057 0.141 0.261
(0.288) (0.235) (0.288) (0.491) (0.514) (0.283) (0.570) (0.246) (0.223)
Three siblings -0.178 0.403 -0.178 -0.334 0.503 0.092 -0.187 0.274 0.316
(0.276) (0.231) (0.276) (0.479) (0.490) (0.275) (0.485) (0.241) (0.219)
Constant -4.362' 0.665 -4.362* -6.629' -4.260 3.072 -5.604 -1.007
(1.972) (1.529) (1.972) (3.096) (2.945) (1.990) (3.483) (1.634)
Observations 2153 2149 2153 2159 2163 2164 2159 2153 2147
Standard errors in parentheses; ' significant at 548; " significant at 1%; Ref. --- Male. White, Suburb, Northeast, Parents with HS degree, no sibling , and neverattends religious services. All models are logistic regressions unless noted: t = ordered logistic regression, t = Cox proportional hazard model.
60 National Study of Youth and Religion
59BEST COPY AVAILABLE

Appendix 3d: Religious Youth Group Participation Regression Table
SkippedSchoolt
Sent toDetentiont
Suspended orExpelledt
Parents LimitTime Out on
School Nights t
Argues WithParentst
Volunteers InCommunity}
Participates inSports, Athletics
or Exercise t
Participates inStudent
Government t
Youth group 1-2 yrs -0.099 0.171 -0.262 0.184 0.023 0.612" 0.306' 0.275
(0.119) (0.143) (0.157) (0.116) (0.118) (0.122) (0.119) (0.155)
Youth group 2-4 yrs -0.291* 0.150 -0.086 0.167 0.135 0.830" 0.584" 0.262
(0.119) (0.144) (0.151) (0.116) (0.119) (0.120) (0.121) (0.154)
Youth group 4-5 yrs -0.206 -0.037 -0.261 0.388" 0.423" 1.212" 0.518" 0.769"
(0.149) (0.190) (0.202) (0.146) (0.152) (0.152) (0.152) (0.180)
Youth group 6+ yrs -0.505" -0.110 -0.438" 0.242" 0.085 1.510" 0.478" 0.579"
(0.123) (0.152) (0.164) (0.119) (0.121) (0.125) (0.122) (0.147)
Female -0.487" -1.105" -1.088" 0.259" 0.433" 0.442" -0.726" 0.479"
(0.081) (0.102) (0.108) (0.080) (0.081) (0.083) (0.083) (0.106)
Black - 0.292' 0.168 0.917" 0.319' -1.091" 0.105 0.291' 0.341'
(0.129) (0.151) (0.148) (0.125) (0.132) (0.131) (0.129) (0.163)
Other minority -0.064 -0.000 0.193 0.336" -0.351" 0.216 -0.019 0.030
(0.111) (0.138) (0.140) (0.110) (0.111) (0.115) (0.112) (0.147)
Rural -0.005 0.118 -0.094 0.258' -0.706" 0.042 -0.125 -0.053
(0.132) (0.162) (0.172) (0.131) (0.131) (0.133) (0.133) (0.167)
Small town -0.198 0.030 -0.180 -0.229 -0.411" -0.076 -0.001 -0.002
(0.123) (0.150) (0.161) (0.120) (0.123) (0.124) (0.122) (0.153)
City 0.151 -0.029 0.002 -0.173 -0.305" 0.047 0.013 -0.195
(0.115) (0.142) (0.146) (0.112) (0.116) (0.115) (0.114) (0.145)
North Central -0.192 -0.497" 0.114 0.003 0.036 -0.418" -0.136 -0.115
(0.115) (0.143) (0.150) . (0.113) (0.115) (0.117) (0.117) (0.150)
South -0.069 -0.162 0.186 0.041 -0.194 -0.487" -0.416" -0.148
(0.105) (0.126) (0.138) (0.104) (0.105) (0.108) (0.106) (0.137)
West 0.309' -0.587" 0.005 0.091 -0.051 -0.373" -0.104 0.018
(0.127) (0.163) (0.169) (0.125) (0.128) (0.131) (0.129) (0.165)
Age 0.159' 0.022 0.124 -0.296" -0.268" -0.124 -0.047 - 0.211'
(0.067) (0.079) (0.080) (0.068) (0.067) (0.069) (0.068) (0.094)
No HS degree 0.105 0.315 0.559" 0.049 0.133 -0.243 0.410' -0.750"
(0.170) (0.201) (0.198) (0.169) (0.168) (0.175) (0.169) (0.274)
Some college 0.084 -0.099 -0.092 -0.004 0.327" 0.082 0.102 -0.038
(0.121) (0.146) (0.152) (0.120) (0.122) (0.124) (0.121) (0.161)
College graduate -0.065 -0.194 -0.172 0.166 0.248' 0.276' 0.290' 0.238
(0.112) (0.137) (0.143) (0.112) (0.112) (0.115) (0.113) (0.146)
Graduate school -0.191 -0.178 -0.433" 0B86 0.283" 0.453" 0.229 0.285
(0.124) (0.150) (0.164) (0.121) (0.123) (0.125) (0.123) (0.157)
Dad at home -0.143 -0.180 -0.394" 0.554" 0.150 0.448" 0.180 0.215
(0.094) (0.112) (0.114) (0.094) (0.094) (0.098) (0.095) (0.127)
Mom not working -0.314" -0.214 -0.338' -0.040 -0.181 0.126 0.068 -0.123
(0.109) (0.136) (0.147) (0.107) (0.107) (0.109) (0.109). (0.144)
One sibling 0.169 0.525' 0.257 -0.344 -0.233 -0.125 0.266 0.067
(0.186) (0.240) (0.242) (0.181) (0.180) (0.191) (0.186) (0.239)
Two siblings 0.297 0.497' 0.281 - 0.377' -0.495" -0.260 0.313 0.248
(0.187) (0.242) (0.243) (0.182) (0.181) (0.193) (0.187) (0.240)
Three siblings 0.429' 0.569' 0.520' -0.257 - 0.367' -0.369 0.317 -0.022
(0.184) (0.238) (0.236) (0.179) (0.178) (0.190) (0.184) (0.239)
Constant
Observations 2161 2157 2159 2163 2158 2159 2159 2161
Standard errors in parentheses; signific nt at 5%; " significant at 1%; Ref = Male, White, Subu b, Northeast, Parents with HS degree, no siblings, and never attendsreligious services. All models are logistic regressions unless noted: t = ordered logistic regression, t = Cox proportional hazard model.
Religion and Risk Behaviors 61.4
60 BEST COPY,MAILABLE

Appendix 4a: Religious Tradition Regression Table
FirstCigarettet
SmokesRegularly
First TimeDrunk*
Goesto Bust
Drinksto GetDrunkt
OfferedDrugs
SoldDrugs
Tried DrugsTried
MarijuanaTried
Hard Drugs
Baptist -0.018 -0.527' -0.167 -0.070 -0.093 -0.199 -0.478' -0.407' -0.533" -0.524"
(0.106) (0.212) (0.111) (0.152) (0.145) (0.177) (0.238) (0.165) (0.168) (0.189)
Other Prot -0.192' -0.365' -0.131 -0.058 -0.184 -0.271 -0.295 -0.431" -0.491" -0.535"
(0.091) (0.170) (0.091) (0.130) (0.127) (0.151) (0.192) (0.143) (0.144) (0.154)
Catholic -0.150 -0.541" -0.057 0.120 -0.027 -0.327' -0.602" -0.334' -0.384" -0.457"
(0.091) (0.174) (0.091) (0.128) (0.124) (0.150) (0.201) (0.142) (0.143) (0.152)
Jewish -0.395 -0.759' -0.450' 0.033 -0.439 -1.030" -1.142' -0.626' -0.854" -1.165"
(0.204) (0.379) (0.208) (0.266) (0.261) (0.338) (0.515) (0.293) (0.301) (0.367)
LDS -0.717' -2.041' -0.852" -0.072 -1.434" -0.248 -0.307 -0.852' -1.195" -1.126'
(0.318) (1.041) (0.318) (0.414) (0.407) (0.419) (0.591) (0.413) (0.436) (0.491)
Other -0.161 -0.243 -0.178 -0.116 -0.260 -0.205 -0.182 -0.251 -0.387' 0.117
(0.121) (0.236) (0.129) (0.166) (0.162) (0.192) (0.250) (0.180) (0.182) (0.193)
Female -0.013 0.019 -0.100 -0.300" -0.313" -1.114" -1.151" -0.193' -0.324" -0.099
(0.058) (0.117) (0.060) (0.082) (0.079) (0.099) (0.141) (0.090) (0.091) (0.102)
Black -0.615" -1.971" -0.840" -0.245 -0.918" -0.513" -0.360 -0.663" -0.517" -2.055"
(0.109) (0.294) (0.123) (0.141) (0.135) (0.171) (0.231) (0.154) (0.157) (0.253)
Other minority -0.171' -0.948" -0.378" 0.059 -0.584" -0.377" -0.142 -0.520" -0.524" -0.420"
(0.085) (0.187) (0.091) (0.117) (0.112) (0.140) (0.189) (0.128) (0.131) (0.143)
Rural -0.179 -0.335 -0.174 -0.338' -0.438" -0.595" -0.350 -0.382' -0.528" -0.280
(0.096) (0.189) (0.098) (0.136) (0.130) (0.164) (0.224) (0.149) (0.152) (0.168)
Small town -0.078 -0.264 -0.058 -0.311' -0.194 -0.372' -0.233 -0.289' -0.404" -0.150
(0.087) (0.171) (0.088) (0.124) (0.120) (0.147) (0.202) (0.138) (0.139) (0.151)
City -0.090 -0.299 -0.114 -0.167 -0.208 -0.154 -0.065 -0.161 -0.207 -0.273
(0.082) (0.168) (0.084) (0.115) (0.112) (0.136) (0.187) (0.128) (0.129) (0.146)
North Central -0.052 -0.266 -0.113 -0.453" -0.065 -0.084 -0.062 -0.121 -0.098 -0.075
(0.083) (0.161) (0.085) (0.118) (0.115) (0.142) (0.184) (0.129) (0.131) (0.146)
South 0.014 -0.145 -0.014 0.009 -0.074 -0.034 -0.251 0.006 -0.013 0.079
(0.080) (0.154) (0.082) (0.111) (0.108) (0.134) (0.179) (0.123) (0.125) (0.139)
West -0.123 -0.806" -0.016 -0.643" -0.129 0.294 -0.451' -0.099 -0.103 0.049
(0.096) (0.213) (0.098) (0.136) (0.129) (0.157) (0.222) (0.147) (0.149) (0.163)
Age 0.020 0.053 0.112' 0.191" 0.128 -0.150 -0.019 0.140 0.134 0.131
(0.050) (0.097) (0.052) (0.066) (0.066) (0.081) (0.104) (0.074) (0.076) (0.082)
No HS degree 0.158 0.306 0.027 0.306 -0.063 0.297 0.103 0.448' 0.238 0.417
(0.129) (0.259) (0.137) (0.176) (0.169) (0.210) (0.293) (0.192) (0.193) (0.217)
Some college 0.068 0.138 0.106 0.081 0.236' 0.221 0.208 0.083 0.118 0.222
(0.089) (0.176) (0.093) (0.126) (0.119) (0.149) (0.197) (0.136) (0.138) (0.158)
College graduate 0.013 -0.107 0.077 0.150 0.156 0.083 0.020 0.077 0.085 0.156
(0.082) (0.164) (0.085) (0.114) (0.110) (0.139) (0.188) (0.125) (0.127) (0.146)
Graduate school -0.017 -0.124 0.019 0.129 0.094 0.369' 0.152 0.166 0.103 0.301
(0.090) (0.180) (0.093) (0.125) (0.122) (0.149) (0.201) (0.138) (0.140) (0.156)
Dad at home -0.125 -0.305' -0.129 -0.098 -0.079 -0.042 -0.444" -0.290" -0.301" -0.253'
(0.069) (0.137) (0.072) (0.097) (0.093) (0.115) (0.148) (0.106) (0.108) (0.120)
Mom not working . -0.279" -0.444" -0.327" -0.071 -0.475" -0.189 -0.435' -0.341" -0.336" -0.422"
(0.081) (0.167) (0.085) (0.109) (0.108) (0.131) (0.196) (0.120) (0.123) (0.141)
One sibling -0.007 0.312 0.264 0.504" 0.226 0.323 0.048 0.122 0.255 0.109
(0.130) (0.268) (0.142) (0.193) (0.185) (0.224) (0.286) (0.201) (0.204) (0.235)
Two siblings 0.071 0.061 0.363' 0.372 0.289 0.358 -0.075 0.124 0.240 0.194
(0.131) (0.275) (0.143) (0.194) (0.186) (0.226) (0.291) (0.203) (0.206) (0.238)
Three siblings 0.138 0.295 0.395" 0.412' 0.335 0.430 0.119 0.258 0.316 0.377
(0.130) (0.270) (0.142) (0.193) (0.184) (0.223) (0.282) (0.200) (0.203) (0.234)
Constant -1.201 2.786 -0.020 -1.662 -1.595 -2.665
(1.827) (1.527) (1.972) (1.393) (1.426) (1.549)
Observations 1873 2124 1831 2137 2100 2127 2120 2144 2113 2144
Standard errors in parentheses; significant at 54b significant at loit Ref. = Male, White, Suburb, Northeast. Parents with HS degree, no siblings, and never attendsreligious services. All models are logistic regressions unless noted: t = ordered logistic regression, t = Cox proportional hazard model.
62 National Study of Youth and Religion
611150

Appendix 4b: Religious Tradition Regression Table
FirstMarijuana Use
TrafficTickets
AlwaysWears
Seatbelt
Gets a KickOut ofDanger
Tests Selfby Taking
Risks
HitTeacher
Been ina Fight
Brought aGun
to School
Baptist -0.413" -0.395' -0.151 0.038 -0.026 0.063 -0.104 0.351
(0.128) (0.183) (0.176) (0.150) (0.149) (0.516) (0.200) (0.502)
Other Prot -0.306" -0.010 0.125 -0.114 0.013 -0.335 -0.078 0.087
(0.105) (0.149) (0.150) (0.128) (0.128) (0.436) (0.171) (0.450)
Catholic -0.273" -0.155 0.120 -0.237 -0.126 -1.090' -0.116 -0.564
(0.103) (0.152) (0.148) (0.128) (0.127) (0.506) (0.169) (0.507)
Jewish 0.559' -0.788' 1.260" -1.010" -0.423 0.462 0.249 0.663
(0.237) (0.368) (0.359) (0.255) (0.262) (1.152) (0.481) (1.167)
LDS -0.822* 0.348 -0.421 -0.397 -0.017 -0.506 0.028 0.916
(0.353) (0.430) (0.421) (0.391) (0.375) (0.541) (0.213) (0.470)
Other -0.246 -0.251 -0.141 -0.061 -0.088 -0.707 -0.220
(0.142) (0.207) (0.193) (0.166) (0.166) (0.420) (1.122)
Female -0.232" -0.615" 0.427" -0.950" -0.776" -1.856" -0.896" -3.046"
(0.070) (0.099) (0.095) (0.083) (0.083) (0.421) (0.112) (0.598)
Black -0.365" -0.795" -0.455" -1.420" -0.756" -0.556 -0.061 0.306
(0.129) (0.190) (0.169) (0.146) (0.145) (0.601) (0.184) (0.427)
Other minority -0.266" -0.148 -0.074 -0.126 -0.153 1.052" -0.012 0.672
(0.103) (0.143) (0.135) (0.119) (0.116) (0.380) (0.155) (0.364)
Rural -0.365" -0.039 -0.109 -0.067 0.097 0.905" -0.117 0.308
(0.119) (0.164) (0.156) (0.134) (0.136) (0.457) (0.177) (0.469)
Small town -0.261' 0.018 -0.296' -0.123 0.020 -0.255 -0.442" 0.002
(0.103) (0.149) (0.143) (0.123) (0.123) (0.515) (0.170) (0.484)
City -0.120 -0.007 -0.110 -0.168 0.017 -0.600 -0.100 0.284
(0.096) (0.142) (0.135) (0.114) (0.115) (0.498) (0.154) (0.419)
North Central -0.096 0.628" -0.200 0.101 0.044 -0.354 -0.111 0.135
(0.100) (0.144) (0.138) (0.116) (0.116) (0.413) (0.154) (0397)
South 0.003 0.633" 0.242 0.057 0.061 -0.821 -0.284 -0.160
(0.095) (0.139) (0.130) (0.112) (0.112) (0.421) (0.149) (0.376)
West -0.102 0.165 0.764" 0.156 0.082 -1.086' -0.453' -0.627
(0.114) (0.171) (0.155) (0.134) (0.133) (0.529) (0.182) (0.479)
Age 0.101 0.229" -0.011 0.009 0.100 0.115 0.050 0.229
(0.058) (0.080) (0.080) (0.071) (0.071) (0.198) (0.086) (0.173)
No HS degree 0.195 -0.487 -0.352 0.213 0.026 1.019' 0.463' 0.615
(0.153) 0.251) (0.212) (0.180) (0.176) (0.508) (0.218) (0.483)
Some college 0.148 0.003 0.196 0.138 -0.036 0.314 0.196 -0.001
(0.108) (0.157) (0.145) (0.125) (0.124) (0.476) (0.161) (0.422)
College graduate 0.118 0.361" 0.353" 0.162 -0.032 0.327 -0.111 -0.016
(0.100) (0.138) (0.132) (0.114) (0.114) (0.456) (0.154) (0.414)
Graduate school 0.107 0.345' 0.574" 0.022 0.116 0.248 -0.193 0.284
(0.110) (0.152) (0.145) (0.125) (0.126) (0.496) (0.171) (0.411)
Dad at home -0.202' -0.073 0.196 -0.049 -0.111 -0.996" -0.031 -0.416
(0.082) (0.119) (0.113) (0.097) (0.098) (0323) (0.127) (0.300)
Mom not working -0.247' -0.147 0.363" -0.231' -0.250' 0.354 -0.106 0.120
(0.099) (0.136) (0.127) (0.109) (0.109) (0.367) (0.147) (0.352)
One sibling 0.209 -0.184 -0.081 0.061 O.U67 0.136 -0.098 0.060
(0.164) (0.212) (0.211) (0.181) (0.182) (0.693) (0.244) (0.590)
Two siblings 0.193 -0.237 -0325 0.121 0.072 -0.058 0.011 0.014
(0.167) (0.214) (0.214) (0.183) (0.184) (0.707) (0.245) (0.593)
Three siblings 0.275 -0.156 -0.307 0.120 0.044 0.200 0.044 -0.105
(0.164) (0.211) (0.211) (0.181) (0.183) (0.664) (0.241) (0.574)
Constant -0.468 -4.547 -1.307 -7.330'
(1.506) (3.785) (1.620) (3331)
Observations 1879 2045 2041 2020 2012 2073 2144 2128
Standard errors in parentheses; sign'ficant at 546; ignificant at 1% Ref. = Male, Whie, Suburb, Northeast, Parents with HS degree, no siblings, andnever attends religious services. All models are logistic regressions unless noted:*= ordered logistic regression, 0 = Cox proportional hazard model.
Religion and Risk BehaviorsBEST.COPY AVAILABLE
S2
63

Appendix 4c: Religious Tradition Regression TableTroublewith the
Police
PettyTheft
SignificantThefteft
ArmedRobbery
Stolena Car
VandalizedProperty
Arson Trespassed Shoplifted
Baptist -0.410 -0.258 -0.410 -0.321 0.197 0.070 0.784 -0.285 -0.471"
(0.262) (0.184) (0.262) (0.445) (0.382) (0.241) (0.537) (0.201) (0.175)
Other Prot -0.220 -0.096 -0.220 -0.244 0.102 0.043 -0.030 -0.065 -0.213
(0.220) (0.156) (0.220) (0.366) (0.338) (0.201) (0.515) (0.166) (0.147)
Catholic -0.217 -0.043 -0.217 -0.774 -0345 -0.091 0.303 -0.141 -0.131
(0.220) (0.154) (0.220) (0.396) (0.353) (0.201) (0.489) (0.166) (0.144)
Jewish 0.285 0.375 0.285 0.252 0.332 0.534 1.276 -0.903 0.756'
(0.616) (0.426) (0.616) (1.149) (0.825) (0.524) (0.923) (0.574) (0.332)
LDS -0.411 -0.241 -0.411 0.646 -0.078 0.130 0.389 -0.092 0.058
.. (0.289) (0.201) (0.289) (0.388) (0.402) (0.254) (0.561) (0.214) (0.405)
Other -0.913 . -0.606 -0.913 -0.812 -0.254 -0.152
(0.639) (0.353) (0.639) (0.518) (0.350) (0.185)
Female -1.301" -0.815" -1.301" -2.030" -0.920" -1.308" -1.848" -0.693" -0.574"
(0.162) (0.101) (0.162) (0.348) (0.232) (0.141) (0.394) (0.109) (0.095)
Black 0.188 -0.092 0.188 0.012 0.319 -0.609' -0.012 -0.432' 0.108
(0.237) (0.172) (0.237) (0.393) (0.344) (0.240) (0.462) (0.198) (0.161)
Other minority 0.438' 0.001 0.438' 0.461 0.941" -0.072 0.218 -0.124 0.167
(0.197) (0.141) (0.197) (0.315) (0.275) (0.183) (0.395) (0.154) (0.132)
Rural -0.328 -0.335' -0.328 -0.320 -0.013 -0.259 0.102 -0.281 -0.411"
(0.241) (0.166) (0.241) (0.424) (0.374) (0.204) (0.429) (0.177) (0.154)
Small town -0.338 -0.361' -0.338 -0.442 -0.026 -0.525" -0.278 -0.250 -0.460"
(0.221) (0.152) (0.221) (0.412) (0.353) (0.194) (0.424) (0.161) (0.142)
City -0.337 -0.221 -0.337 0.276 0.119 -0.444' -0.868' -0.353' -0.483"
(0.202) (0.140) (0.202) (0.340) (0.312) (0.182) (0.437) (0.152) (0.131)
North Central 0.235 0.150 0.235 -0.225 0.089 -0.010 -0.822 -0.096 -0.189
(0.211) (0.143) (0.211) (0.332) (0.330) (0.175) (0.435) (0.155) (0.137)
South 0.270 0.065 0.270 -0.537 0.150 -0.482" -0.864' -0.007 -0.062
(0.199) (0.138) (0.199) (0.319) (0.302) (0.179) (0.393) (0.147) (0.129)
West -0.381 -0.123 -0.381 -1.134" -0.084 -0.545' -0.751 -0.117 -0.138
(0.259) (0.166) (0.259) (0.425) (0.355) (0.218) (0.486) (0.177) (0.153)
Age 0.185 -0.063 0.185 0.193 0.132 -0.165 0.212 0.065 -0.055
(0.105) (0.081) (0.105) (0.166) (0.147) (0.106) (0.180) (0.086) (0.076)
No HS degree 0.141 -0.062 0.141 0.596 0.060 0.346 0.410 0.050 -0.112
(0.294) (0.216) (0.294) (0.472) (0.407) (0.266) (0.528) (0.239) (0.203)
Some college 0.073 0.079 0.073 0.487 0.205 0.159 0.296 0.347' 0.129
(0.215) (0.149) (0.215) (0.363) (0.310) (0.190) (0.412) (0.164) (0.139)
College graduate -0.127 -0.211 -0.127 0.285 -0.157 -0.160 0.139 0.060 -0.262'
(0.209) (0.142) (0.209) (0.362) (0.325) (0.182) (0.406) (0.156) (0.133)
Graduate school 0.110 0.057 0.110 0.213 0.176 -0.219 -0.434 0.319 -0.013
(0.219) (0.151) (0.219) (0.389) (0.323) (0.202) (0.513) (0.165) (0.143)
Dad at home -0.524" -0.220 -0.524" -0.389 -0.160 -0.199 -0.915" -0.113 -0.343"
(0.159) (0.116) (0.159) (0.266) (0.237) (0.149) (0.304) (0.127) (0.108)
Mom not working -0.116 -0.122 -0.116 -0.054 0.340 -0.214 0.465 0.034 -0.288'
(0.201) (0.136) (0.201) (0.329) (0.265) (0.176) (0.345) (0.142) (0.131)
One sibling -0.573 0.299 -0.573 -0.075 0.021 -0.232 -0.755 -0.023 0.282
(0.293) (0.235) (0.293) (0.494) (0.518) (0.284) (0.548) (0.246) (0.219)
Two siblings -0.350 0.382 -0.350 -0.146 0.016 -0.082 -1.106 0.105 0.205
(0.290) (0.236) (0.290) (0.497) (0.519) (0.284) (0.574) (0.247) (0.222)
Three siblings -0.200 0.367 -0.200 -0.464 0.490 0.071 -0.215 0.306 0.246
(0.279) (0.233) (0.279) (0.491) (0.493) (0.277) (0.490) (0.242) (0.219)
Constant -4.020' 0.830 -4.020' -5.492 -5.679' 2.694 -5.543 -1.850
(1.991) (1.537) (1.991) (3.177) (2.817) (1.989) (3.442) (1.634)
Observations 2125 2122 2125 2068 2072 2144 2068 2124 2119
Standard errors in parentheses; significant at 5%; " significant at 1%; Ref. = Male, White, Suburb, Northeast, Parents with HS degree, no siblings, and never attendsreligious services. All models are logistic regressions unless noted: * = ordered logistic regression, 0 = Cox proportional hazard model.
64 National Study of Youth and Religion

Appendix 4d: Religious Tradition Regression Table
SkippedSchool
Sent toDetention
Suspended orExpelled
Parents LimitTime Out on
School Nightst
Argues WithParentst
Volunteers InCommunity t
Participates inSports, Athletics
or Exerciset
Participates inStudent
Governmentt
Baptist -0.572" -0.096 -0.125 0.044 -0.044 0.678" 0.399" 0.622"
(0.149) (0.177) (0.181) (0.146) (0.148) (0.154) (0.147) (0.203)
Other Prot -0.486" -0.151 -0.286 0.277' 0.002 0.592" 0.588" 0.581"
(0.129) (0.155) (0.161) (0.125) (0.128) (0.132) (0.129) (0.181)
Catholic -0.576" -0.272 -0.675" 0.332" -0.019 0.568" 0.646" 0.579"
(0.127) (0.156) (0.166) (0.124) (0.127) (0.131) (0.129) (0.180)
Jewish 0.096 -0.758' -0.403 -0.138 0.162 0.759" 0.095 0.774'
(0380) (0.375) (0.503) (0.255) (0.277) (0.258) (0.255) (0.323)
LDS -0.236 -0.744 -0.038 -0.088 -0.182 0.788' 0.842' 0.464
(0.160) (0.575) (0.194) (0.340) (0.390) (0.352) (0.383) (0.455)
Other -0.776" -0.108' -1.094' 0.310 -0.252 0.181 0.309 0.016
(0.267) (0.375) (0.465) (0.162) (0.160) (0.168) (0.159) (0.240)
Female -0.496" -1.101" -1.093" 0.306" 0.473" 0.524" -0.653" 0.523"
(0.081) (0.102) (0.108) (0.080) (0.081) (0.083) (0.082) (0.106)
Black -0.241 0.114 0.759" 0.362" -1.066" 0.096 -0.254 0.331
(0.137) (0.161) (0.161) (0.136) (0.141) (0.141) (0.137) (0.177).
Other minority 0.034 0.032 0.269 0.208 -0.329" 0.095 -0.136 0.005
(0.115) (0.144) (0.146) (0.114) (0.115) (0.118) (0.116) (0.154)
Rural -0.095 0.012 -0.272 -0.262 -0.662" 0.145 -0.091 0.055
(0.135) (0.164) (0.177) (0.135) (0.133) (0.135) (0.136) (0.171)
Small town -0.228 -0.043 -0.246 -0.276' -0.366" -0.009 -0.051 0.047
(0.124) (0.152) (0.164) (0.122) (0.125) (0.124) (0.124) (0.156)
City 0.102 -0.117 -0.075 -0.196 -0.299' 0.078 -0.032 -0.176
(0.115) (0.143) (0.148) (0.114) (0.116) (0.116) (0.116) (0.148)
North Central -0.211 -0.524" 0.035 -0.025 0.024 -0.313" -0.069 -0.026
(0.117) (0.145) (0.154) (0.115) (0.116) (0.118) (0.118) (0.153)
South -0.105 -0.253 0.017 0.118 -0.160 -0.272' -0.299" -0.052
(0.111) (0.132) (0.145) (0.109) (0.110) (0.113) (0.111) (0.146)
West 0.159 -0.632" -0.110 0.143 -0.031 -0.146 0.004 0.161
(0.131) (0.168) (0.175) (0.130) (0.132) (0.135) (0.133) (0.174)
Age 0.173' 0.063 0.153 -0.316" -0.249" -0.128 -0.035 -0.187'
(0.067) (0.079) (0.080) (0.068) (0.066) (0.069) (0.067) (0.094)
No HS degree 0.070 0.338 0.547" 0.081 0.085 -0.227 -0.406' -0.775"
(0.173) (0.203) (0.203) (0.171) (0.170) (0.177) (0.171) (0.280)
Some college 0.060 -0.091 -0.078 0.010 0.342" 0.080 0.142 -0.047
(0.121) (0.147) (0.153) (0.121) (0.123) (0.124) (0.122) (0.163)
College graduate -0.105 -0.207 -0.196 0.180 0.228' 0.339" 0.344" 0.287
(0.113) (0.138) (0.145) (0.112) (0.112) (0.115) (0.113) (0.147)
Graduate school -0.231 -0.136 -0.392' 0.109 0.249' 0.530" 0.314' 0.316'
(0.125) (0.152) (0.164) (0.122) (0.124) (0.126) (0.125) (0.160)
Dad at home -0.136 -0.149 -0.337" 0.585" 0.154 0.424" 0.161 0.206
(0.095) (0.114) (0.116) (0.096) (0.095) (0.098) (0.096) (0.129)
Mom not working -0.305" -0.269' -0.385" -0.048 -0.184 0.079 0.075 -0.126
(0.110) (0.137) (0.149) (0.107) (0.107) (0.108) (0.108) (0.145)
One sibling 0.159 0.496' 0.236 -0.339 -0.266 0.028 0.283 0.122
(0.187) (0.241) (0.243) (0.183) (0.180) (0.188) (0.185) (0.243)
Two siblings 0.319 0.492' 0.311 -0.402' -0.476" -0.141 0.315 0.298
(0.188) (0.243) (0.243) (0.184) (0.182) (0.190) (0.187) (0.244)
Three siblings 0.428' 0.575' 0.505' -0.272 -0359' -0.190 0.338 0.093
(0.186) (0.239) (0.238) (0.182) (0.179) (0.188) (0.185) (0.244)
Observations 2141 2138 2124 2134 2129 2140 2139 2131
Standard errors in parentheses:' significant at 5%; significant at 1% Ref. = Male, White Suburb, Northea t, Parents with HS degree, no sib ings, and neverattends religious services. All models are logistic regressions unless noted: t = ordered logistic regression, = Cox proportional hazard model.
Religion and Risk Behaviors 65
64' BEST COPY AVAILABLE

U.S. Department of EducationOffice of Educational Research and Improvement (OERI)
National Library of Education (NLE)Educational Resources Information Center (ERIC)
Reproduction Release(Blanket)
I. DOCUMENT IDENTIFICATION (Class of Documents):
All Publications: National Study of Youth and Religion
Series (Identify Series):Division/Department Publications (Specify):
hThe Odum Institute for Research in Social Science at The
niversity of North Carolina at Chapel HillPublication Date:
H. REPRODUCTION RELEASE:In order to disseminate as widely as possible timely and significant materials of interest to the educationalcommunity, documents announced in the monthly abstract journal of the ERIC system, Resources in Education(RIE), are usually made available to users in microfiche, reproduced paper copy, and electronic media, and soldthrough the ERIC Document Reproduction Service (EDRS). Credit is given to the source of each document, and, ifreproduction release is granted, one of the following notices is affixed to the document.
If permission is granted to reproduce and disseminate the identified document, please CHECK ONE of the followingthree options and sign in the indicated space following.
The sample sticker shown below will beaffixed to all Level I documents
' a ADISSEMINATE THIS NIATERIAL HAS
BEEN GRANYGD BY
to THE. EDUCATIONAL RESOURCEINFORMATION CENTER (ERIC)
Level 1
xm
The sample sticker shown below will be affixed to allLevel 2A documents
101.1. be A
DISSEMINATE THIS MATERIAL INMICROFICHE, AND IN ELECTRONIC MEDIA
FOR- ERIC COLLECTION SUBSCRIBERS ONLY,HA BEEN GRAN" BY
cc,TO THE EDUCATIONAL RESOURCES
INFORMATION CENTER (ERIC)
Level 2A
Check here for Level 1 release, permittingCheck here for Level 2A release, permitting reproduction
reproduction and dissemination in microficheand dissemination in microfiche and in electronic mediaor other ERIC archival media (e.g. electronic)
for ERIC archival collection subscribers onlyand paper copy.
The sample sticker shown below will be affixed to allLevel 2B documents
T. S ' !PIDISSEMINATE THIS MATERIAL IN
MICROFICHE ONLY HAS B1iN GRANTED BY
'10 THE EDUCATIONAL RESOURCESINFORMATION CENTER 4 ERIC)
Level 2B
Check here for Level 2B release, permittingreproduction and dissemination in microfiche only
Documents will be processed as indicated provided reproduction quality permits.If permission to reproduce is granted, but no box is checked, documents will be processed at Level 1.
II hereby grant to the Educational Resources Information Center (ERIC) nonexclusive permission

_
to reproduce and disseminate this document as indicated above. Reproduction from the ERICmicrofiche, or electronic media by persons other than ERIC employees and its systemcontractors requires permission from the copyright holder. Exception is made for non-profitreproduction by libraries and other service agencies to satisfy information needs of educators inresponse to discrete inquiries.Signature: Printed Name/Position/Title:
_ .
Christian S. Snaith/Professor of Sociology/PrincipalInvestigator
/-=w1rIsTriiII//rya 1 law-1
Organization/Address:
ational Study of Youth and Religion,Th
The University of North Carolina atChapel HillCB# 3057Chapel Hill, NC 27599-3057
Telephone:
919.962.4524
Fax:
919.962.7568
E-mail Address:
Date:
1/7/2003
HI. DOCUMENT AVAILABILITY INFORMATION (FROM NON-ERIC SOURCE):
If permission to reproduce is not granted to ERIC, or, if you wish ERIC to cite the availability ofthe document from another source, please provide the following information regarding theavailability of the document. (ERIC will not announce a document unless it is publicly available,and a dependable source can be specified. Contributors should also be aware that ERIC selectioncriteria are significantly more stringent for documents that cannot be made available throughEDRS.)
Oublisher/Distributor: National Study of Youth and Religionddress: The University of North Carolina at Chapel Hill
CB# 3057Chapel Hill, NC 27599-3057
'Price: $4.00
IV. REFERRAL OF ERIC TO COPYRIGHT/REPRODUCTION RIGHTS HOLDER:If the right to grant this reproduction release is held by someone other than the addressee, please provide theappropriate name and address:Name:'Address:
V. WHERE TO SEND THIS FORM:
Send this form to the following ERIC Clearinghouse:ERIC Clearinghouse on Urban Education
Box 40, Teachers College, Columbia University525 West 120th StreetNew York, NY 10027
Telephone: 212-678-3433Toll Free: 800-601-4868
Fax: 212-678-4012http: / /eric- web.tc.columbia.edu
EFF-088 (Rev. 2/2000)