reproductions supplied by edrs are the best that can be ... · rfrt r.npv avatt. api c. who are...
TRANSCRIPT

ED 467 357
AUTHORTITLE
INSTITUTIONSPONS AGENCYPUB DATENOTEAVAILABLE FROMPUB TYPE
EDRS PRICEDESCRIPTORS
IDENTIFIERS
ABSTRACT
DOCUMENT RESUME
UD 035 020
Ro, MargueriteOverview of Asian and Pacific Islanders in the United Statesand California: A Series of Community Voices Publications.Center for Policy Alternatives, Washington, DC.Kellogg Foundation, Battle Creek, MI.2000-00-0028p.
For full text: http://www.communityvoices.org.Numerical/Quantitative Data (110) Reports Descriptive(141)
EDRS Price MF01/PCO2 Plus Postage.Access to Health Care; *Asian Americans; Child Health;Citizenship; Cultural Differences; Educational Attainment;Immigrants; Language Proficiency; Limited English Speaking;*Pacific Americans; Political Issues; *Population Trends;Poverty; Residential Patterns; Socioeconomic Status; Tables(Data); Welfare ServicesBarriers to Participation; California; Health ResourcesUtilization
This report presents data on Asian and Pacific IslanderAmericans (APIAs), focusing on California. It discusses: who APIAs are;nativity and citizenship; residence (nearly all APIAs reside in metropolitanareas, particularly California); educational attainment (because of the modelminority myth about Asians, APIA children are deprived of bilingual classesand bicultural counselors); language ability (APIAs have no common language);economic status (the combination of relatively high median income and highpoverty reflects the great economic diversity of APIAs); APIA politics(political empowerment is a significant challenge); health (as a group, Asiansare healthier than others, but they face disparate health risks); access tohealth care (many APIAs are uninsured); children's health coverage; culturaland linguistic competency standards for the Healthy Families Program; barriersto care (cost, insurance, and linguistic and cultural differences); healthservice utilization (APIAs underutilize mental health, preventive, andprenatal services); traditional medicine; health professions and healthproviders; public benefits (immigrants are considerably less likely thannatives to receive welfare); pressing health and social issues; culturallycompetent health and social services; and race relations. (Contains 31references.) (SM)
Reproductions supplied by EDRS are the best that can be madefrom the original document.

a
a
A
C.4
0TO THE EDUCATIONAL RESOURCES
INFORMATION CENTER (ERIC)1
2..
a a
I
$
a
U S DEPARTMENTOF EDUCATIONOffice of Educational
Research and ImprovementiED CA TIONALRESOURCES INFORMATION
CENTER (ERIC)This document has been reproduced asreceived from the person or organizationonginating it
O Minor changeshave been made toimprove reproductionquality
Points of view oropinions stated in thisdocument do notnecessarily representofficial OERI positionor policy
PERMISSION TO REPRODUCE ANDDISSEMINATEN E THIS MATERIAL HAS
SE GRANTED BY
RFRT r.npv avAtt API C
Who are Asian and Pacific Islander Americans?
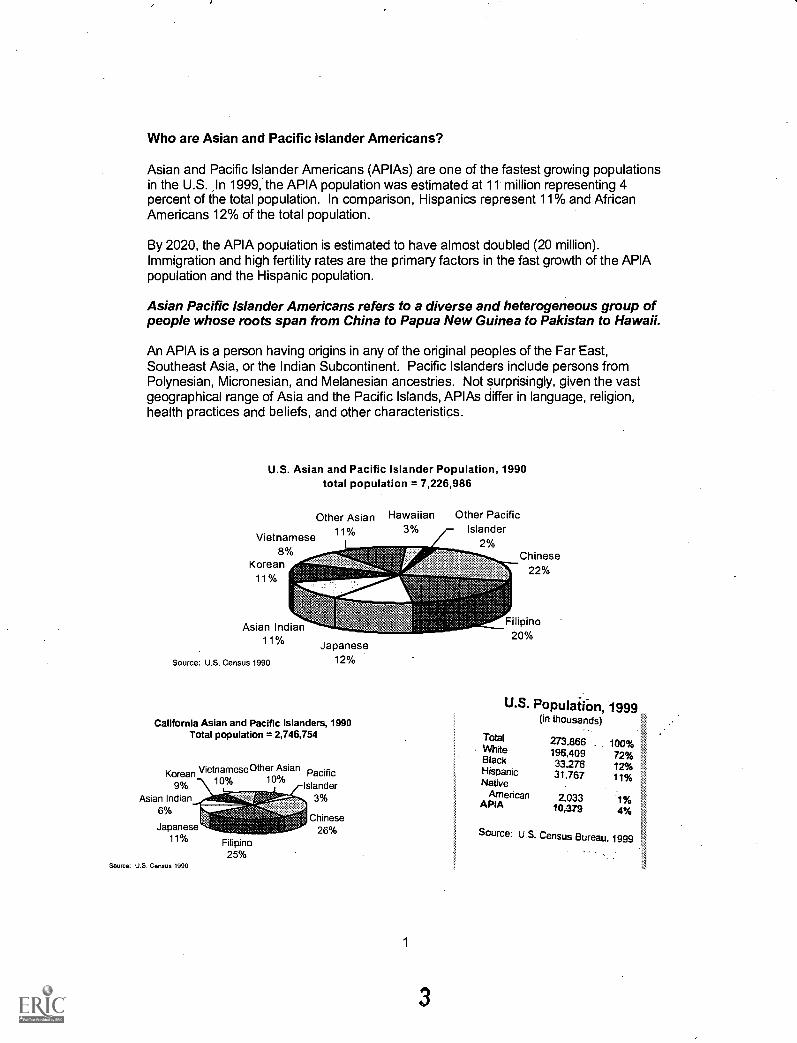
Asian and Pacific Islander Americans (APIAs) are one of the fastest growing populationsin the U.S. In 1999, the APIA population was estimated at 11 million representing 4percent of the total population. In comparison, Hispanics represent 11% and AfricanAmericans 12% of the total population.
By 2020, the APIA population is estimated to have almost doubled (20 million).Immigration and high fertility rates are the primary factors in the fast growth of the APIApopulation and the Hispanic population.
Asian Pacific Islander Americans refers to a diverse and heterogeneous group ofpeople whose roots span from China to Papua New Guinea to Pakistan to Hawaii.
An APIA is a person having origins in any of the original peoples of the Far East,Southeast Asia, or the Indian Subcontinent. Pacific Islanders include persons fromPolynesian, Micronesian, and Melanesian ancestries. Not surprisingly, given the vastgeographical range of Asia and the Pacific Islands, APIAs differ in language, religion,health practices and beliefs, and other characteristics.
U.S. Asian and Pacific Islander Population, 1990total population = 7,226,986
Other Asian
Vietnamese 11%
8%Korean
11%
t\
Asian Indian11%
Source: U.S. Census 1990
,tuzJapanese
12%
California Asian and Pacific Islanders, 1990Total population = 2,746,754
KoreanVietnameseOther Asian Pacific
9% -\1.11..._.1113% ,-IslanderAsian Indian 3%
6%Chinese
26%Japanese11%
Source: U.S. Census 1990
Filipino25%
Hawaiian Other Pacific3% Islander
2%
1
Chinese22%
Filipino20%
U.S. Population, 1999.(in thousands)
TotalWhiteBlackHispanicNative
AmericanAPIA
273.866 100%196,409 72%33-278 12%31,767 11%
2.033 1%10,379 4%
Source: U.S. Census Bureau, 1999

APIAs National & Ethnic Origins
Bangladeshi Hmong Melanesian Solomon IslanderBikini Islander Indian Micronesian Sri LankanBurmese Indochinese Mongolian TahitianBhutanese Indonesian Nepali Tarawa IslanderBorneon Iwo-Jiman New Hebrides ThaiCambodian Japanese Islander TibetanCarolinian Javanese Okinawan Tinian IslanderCelebesian Korean Pakistani TokelauanCerem Kwajalein Islander Palauan TonganCernam Laotian Papua New TrukeseChinese Malayan Guinean VietnameseEniwetok Islander Maldavian Polynesian YapeseFijian Mariana Islander PonapeanFilipino Marshallese SaipaneseGuamanian Marshall Islander SamoanHawaiian Sikkim
Singaporean
Due to small numbers, the historical category of "Other Asian" included NativeHawaiians, Pacific Islanders, and smaller Asian ethnic subgroups in the U.S.
Filipino 20 4%
Japanese 12.3%
Asian Indian 11 8%
Percent Distribution of the Asian Population, 1990
Chinese 23 8%
Kaman 11.6%
Vietnamese 8.9%
Percent Distribution of the Pacific IslanderPopulation, 1990
Samoan 172%
Hawaiian 57.8%
Guamanian 13.5%
Tongan 4.8%
AS other Pacific
Islander 3.8%
Fijian 1.9%
Palauan 0.4%
Tahitian 0.3%
Northern MarianaWander 0.3%
2
4
Burmese 0.1%
Malayan 0.2%
Bangladeshi 0.2%
Sri Lankan 0.2%
Indonesian 0.0%
Pakistani 1.2%
All oMer Asian 2.1%
In October 1997, OMBDirective 15disaggregated the "Asianor Pacific Islander"category into separatecategories of "Asian" and`Native_ Hawaiian or Other'Pacific Islander".
By creating separatecategories, the data onNative Hawaiians andother Pacific Islandergroups will no longer beoverwhelmed by theaggregate date of themuch' larger Asian groups.

Nativity and Citizenship
Immigration has been a major factor in the growth of the APIA population, with largenumbers coming to the US after the adoption of the Immigration Act of 1965.
In 1997, 61% of APIAs were foreign-born, compared to 38% of Hispanics, 8% of Whites,6% of African Americans and 6% of Native Americans.
The percent of those foreign born varies by ethnicity. For example, in the 1990 Censusover 60% of Japanese Americans reported being native born compared to 20% ofVietnamese Americans.
Top Ten Countries of Immigrants have the option of becoming naturalized
Origin for Legal citizens or remaining "permanent resident aliens". AsiansImmigrants. 1998 generally naturalize to a great extent and faster than
Mexico 131.575China 36,884India 36.482Philippines 343,466DominicanRepublic 20.387Vietnam 17,469Cuba 17,375Jamaica 15.146Ei Salvador 14,590Korea 14.268
immigrants coming from other parts of the world(Barringer et al, 1993). The proportion of those whobecome naturalized is, of course, dependent upon anumber of factors including sponsorship and duration ofresidency. Of all 1970-1979 APIA immigrants, over 55%had become. citizens by 1988 (USINS 1998 yearbook).
Citizenship and legal status often determines theavailability of federal and state health and social services.
The anti-immigrant campaigns in California and inCongress in the last five years have been partly
responsible for inspiring the greatest rush to naturalization in the history of the UnitedStates. (Mydans, 1995)
Residence
The majority of APIAs reside in the West. In 1990, 54% of Asians, 86% of PacificIslander lived in the West compared to 21% of the total population. APIAs now make up12% of California's population and 63% of Hawaii's population.
Nearly all APIAs (94%) reside in metropolitan areas.
Top 5 states, 1997APIA
population
California . 3.8 million
New York 952,736
Hawaii 748,748
Texas ,. 523,972
New Jersey 423,838
Top 5 counties, 1997APIA
population
Los Angeles County, CA 1.2 million
Honolulu County, HI 559,752
Orange County, CA 334,330
Santa Clara County, CA 343,387
Queens County, NY 317,893
3
5

Nearly one-third of all immigrants reside in California. Los Angeles (18.2%) andthe San Francisco Bay area (5.3%) account for almost a quarter of the country'simmigrants.
APIA households (Pacific Islanders 4.1 person per household, Asians 3.8 personsper household) are larger than the nation's average household (3.2 persons perhousehold).
Within metropolitan areas, APIA households were 8 times more likely than Whitehouseholds to be crowded (24 % compared to 3%). Crowded is defined as householdswith more than one person per room.
As other immigrant populations have done, many first generation Asian ethnic groupsestablished segregated communities. Early Chinese immigrants established"Chinatowns" in San Francisco, Los Angeles, and other cities. Koreans, Vietnamese,and other Indochinese immigrants and refugees established their own ethnic enclaves.In contrast, Filipinos and Asian Indian immigrants are widely scattered.
These ethnic enclaves provide a foothold for immigrants as they learn a new languageand transition into a new life. With each succeeding generation, APIA and Hispanicimmigrants tend to move into more mainstream integrated neighborhoods. From ahealth and welfare perspective, ethnic enclaves provide immigrants with the linguisticand cultural social support that might otherwise be difficult to find.
Asian Health Services (AHS) located in Oakland's Chinatown is acomprehensive primary care community health clinic that provides services forprimarily low income and uninsured APIAs. Interpretation services are offered innine different languages: English, Cantonese, Mandarin, Korean, Vietnamese.Tagalog, Cambodian. Laotian and Mien. By focusing on community, AHS Isable to provide linguistically appropriate and culturally competent services toOakland's diverse APIA population:
Educational attainment
In 1998, the vast majority (85%) of APIAs 25 years and older had obtained at least ahigh school diploma and 42% of APIAs had earned at least a bachelor's degreecompared to 83% and 24% of the total population respectively.
Educational attainment of adults aged 25 and over, 1998
Whites
Source: US Bureau of the Census, 1997
AfricanAmericans
Hispanics Asian PacificIslanders
M Bachelorsdegree ormore
0Highschooldegree ormore
4
6

Although education is highly valued among all Asian communities, the educationalattainment of different Asian ethnicities varies widely. For example, in 1990 theproportion of Japanese completing high school was 88% compared to 31% of Hmong.
Because of the "model minority" myth that Asians are perceived to excel ineducation immigrant children, particularly Southeast Asian refugees, aredeprived of educational services such as bilingual classes and biculturalcounselors.
Language ability
APIAs speak over 100 languages and dialects. Unlike Hispanics who share thecommon languages of Spanish and Portuguese, there is no common language thatbinds APIAs. Even among ethnic groups, such as the Chinese, there is no commonverbal language. For instance, while the Chinese share a common written language,those who speak Cantonese cannot verbally understand those who speak Mandarin andvice versa.
Nearly 66% of APIAs speak an Asian or Pacific Islander language at home.Approximately 35% of APIAs are linguistically isolated (Census 1990). In terms oflimited English proficiency, Pacific Islanders are the least limited and the SoutheastAsians are the most limited.
English Ability of Children, by Generation, 1990
Speaks only Englishat home
1st Generation 2nd Generation 3rd Generation
APIA children 10.7 % 49.6 % 85.3 %Hispanic children 2.9 % 16.0 % 65.7%Source: 1990 Census PUMS
There is a serious lack of translation services for APIAs in health and social servicessettings. When translation services are available, they are generally very limited bylanguage and dialect. Linguistically appropriate health and social services arenecessary to assure that minority populations have equal access to care.
There are no funds in the hospital budget specifically earmarked for interpreters'there have often been no Hmong-speaking employees of any kind present in thehospital at night. Obstetricians have had to obtain consent for cesarean sections,or episiotomies using embarrassed teenaged sons, who have learned English inschool, as translators. Ten-year-old girls have had to translate discussions ofwhether or not a dying family member should be resuscitated. Sometimes noteven a child is available. (Fadiman, 1997)
According to the Asian & Pacific Islander American Health Forum (1997), only sevenfederally funded community health centers exist to provide linguistically and culturallyappropriate primary health care to APIAs. Only two residential recovery programs existin the U.S. to treat APIA substance abusers (both are in California: San Francisco andLos Angeles).
5
7

Economic status
The combination of relatively high median income and high poverty reflects thegreat economic diversity of the APIA community.
Median Household Income,1997
$50,000 $45,249$40,577
$40,000 $37,005
$30,000 $25,05 $26,628
g $20,000
$10,000
$0
All White Black Hispanic APIAHouseholds
Source: U.S. Bureau of the Census, 1998
APIA families ($44,460) and non-Hispanic White ($41,110) families have comparablemedian incomes (US Bureau of the Census, 1993). However, there are great differencesin income among Asian ethnic subgroups. For example, according to the 1990 Census,the median family income of Japanese Americans exceeded that of non-Hispanic whitefamilies, whereas the income of Cambodian American families was lower than that ofAfrican American families.
Percentage of Persons Living Below Poverty, 1997
Total White Black Hispanic APIA
Source: U.S. Bureau of the Census, 1998
Despite higher educational attainments and comparable median family incomes, thepoverty rate for APIAs (12.5%) was higher than that for non-Hispanic Whites (8.2%).The rate of poverty varies widely among APIA ethnicities. In 1990, more than 60% ofHmong Americans and 40% of Cambodian Americans were living below the poverty linecompared to 7% of Japanese Americans or 6% of Filipino Americans.
6

Average Annual Poverty Rate for Individuals, 1992 - 1994
Chinese
Filipino
Asian Indian
Japanese
VietnameseH
Korean
Other API
Non-Hispanic White
27.9
111.2
111.1
3.2
I 5 3
1
19.0
I 30.0
31 7
Source: 1992 - 1994 National Health Interview Survey
In California, Southeast Asians represented the highest percentage of persons below thepoverty level by ethnicity among APIA ethnic groups: Hmong (63%), Laotian (51%), andCambodian (47%).
In order to make a living, many immigrants take underpaid jobs with poor workingconditions.
The Garment Industry (Bonacich, 1994)Immigrants and women are among the cheapest and most exploitable of workers. Asianimmigrant women are an important component of the U.S. garment labor force, alongwith other immigrant workers from Mexico and the Caribbean area. Wages and workingconditions are notoriously bad. Most workers are paid on a piecemeal basis.Inexperienced workers have a hard time coming up to minimum wage. Benefits or paidvacation time are almost nonexistent. The 1990 estimates of the number of garmentworkers in Los Angeles is between 95,900 to 120,000.
Silicon Valley's Electronic Piecework Industry (Mercury News, 1999)Some high tech industries are using networks of immigrant workers to assemble printedcircuit boards and cables piece-by-piece for as little as a penny per component. Similarto the garment industry, many workers earn less than minimum wage, are not paidovertime, and face retaliation for seeking recourse from government labor officials.Additionally, many immigrant workers expose their families to hazardous materials bydoing the work at home.
A 1996 Rand study showed that "Japanese, Korean, and Chinese immigrants enter withwages much lower than those of native-born workers, but that their earnings increaserapidly. Within 10-15 years, their wages reach parity with those of native-born workers.Mexicans, on the other hand, enter with very low wages and experience a persistentwage gap."Small business
Employees of small business often are left uninsured.
7
9
"Small business owners often want to provide insurance at a low cost to employees andthey want to have a choice in plans, but very often these businesses don't have theability to offer insurance in a cost efficient way." -- Rosa Gil, DSW, special advisor to themayor for health policy and director of Health Services in New York City.
The rise in health care costs has made it difficult for small businesses to begin orcontinue to offer insurance coverage for their employees.
APIA-owned small business
In part, due to the high percentage of foreign-born APIAs, there is an over-representation of APIAs in the small business sector
Bruce Cain and Roderick Kiewiet, in their 1986 study of minority-owned businesses inCalifornia, found that the businesses are primarily sole proprietorships, using family andother unpaid employees, and profits are generally small. APIAs have an advantage byhaving greater family resources resulting in larger capital and employee bases thanother minority groups. However, they are more likely to be hampered by languageproblems and dependence upon ethnic clientele.
Out of 3.25 million minority-owned businesses, there were 1.1 million Asian-ownedbusinesses, compared to 1.4 million Hispanic-owned businesses and 880,000 AfricanAmerican-owned businesses.
Although Asian-owned businesses represented just one-third of all minority-ownedbusinesses, they accounted for a majority ($275 billion or 56%) of the $495 billion totalminority-owned businesses generated in 1997 followed by Hispanic-owned businesses($184 billion or 37%) and African American-owned businesses ($59 billion or 12%).
Asians are the most likely to have employees: nearlyone-quarter of Asian-owned businesses in 1997 hademployees, versus one-seventh of Hispanic-ownedbusinesses and one-tenth of African American-ownedbusinesses. Asian-owned firms employed more than 1.9million workers in 1997.
About 75% of Asian business owners were between theages of 25 and 54. Just under one-third were born in theU.S. (32%).
8
10
Immigrants pay more intaxes than they use inservices over theirlifetimes. The direct taxespaid by immigrants areroughly $133 billion in1997. If the taxes paid byimmigrant businesses areincluded, the total wouldbe at least $162 billion.(Moore, 1998)

Immigrants in small business
Recent immigrants are more likely to be employed in small firms than earlier immigrantswho are more likely to be employed in small firms than native-born persons.
Even among persons with the same amount of skill, recent immigrants are more likely tobe employed in small firms than earlier immigrants and the native born.
Even after many years in the U.S., immigrants are more likely to be employed in smallfirms than native-born persons.
The likelihood of being employed in a small firm is directly related to an immigrant'sability to speak English and is therefore dependent on their country of origin. Those whoimmigrate from non-English speaking countries are more likely to be employed in smallfirms than those from English-speaking countries.
Overall, the number of Asian-owned businesses has skyrocketed by 180% from 1987 to1997, to a total of 1.06 million businesses, nationally. Estimated revenue from thesebusinesses in $275 billion, a 463% increase since 1987.
Asian Pacific Islander American politics
Political empowerment remains to be one of the largest challenges that APIAsface.
Despite APIA history that dates back to the 1800s, as Helen Zia writes: "AsianAmericans have lost at least three generations of political development because offederal laws that barred us from citizenship and full political participation. It was not until1952 that all Asian Americans got the right to become citizens and to vote, whenCongress finally struck down the last of the anti-Asian exclusionary citizenship laws."
In 1999, there were 3 Asian American members of Congress from Hawaii and only fiveothers in the House that includes the Pacific. Islander non-voting representatives fromGuam and American Samoa.
In California.APIAs now account forone-third of the memberson the San FranciscoBoard of Supervisors.
In Santa Clara County,more than 60% of the106,000-APIA votersregistered in the last sixyears.
Governor Gary Locke (WA) is the first and only mainlandAPIA govemor.
There is increasing involvement of APIAs in electoralpolitics. By 1998, more than 300 APIAs were elected tooffice in the U.S. and its territories.
Republicans once dominated among Asian Americans,but now registrations are evenly divided among bothparties and those voters who decline to state theiraffiliation.
9
11

Health Life Expectancy, 1992.
General health measures indicate that overallAsians, as a group, are healthier than Whites andother minorities. However, a closer examinationreveals disparate health risks faced by Asians andAsian ethnic groups.
WhitesAsianChineseJapaneseNative HawaiianFilipinoVietnameseKorean
75.180.381.782.168.380.678.882.3
Source: CIDCINCHS.
Although national data reveal that age-adjusted death rates for Asians (285.8 per100,000) were lower than Whites (477.5 per 100,000) (Monthly Vital Statistics Report,1995), life expectancy data reveal that there are differences in life expectancy acrossAsian ethnic groups. In particular, Native Hawaiians fare more poorly than Whites andother Asian ethnic groups.
Self-Rated Health Status by Hispanic and Asian Origin, 1994
Total
White
Black
Total Hispanic
Mexican
Puerto Rican
Cuban
Total APIA
Chinese
Vietnamese
Korean
Percent rating health as fair or poor
1 19
18
1 13
19
22
125
1 24
24
127
1 29
More APIAs (22%)and Hispanics (24%)rated their health asfair or poor thanWhites (18%).
Wide variation existsamong Asian ethnicgroups. VietnameseAmericans reportedfair or poor healthmore often than eitherChinese or KoreanAmericans.
Source: The Commonwealth Fund 1994 National Comparative Survey of Minority Health Care
Although, general health statistics appear to be favorable for Asians, a closerexamination reveals several areas where Asians fare worse than Whites. For instance,data from the Surveillance, Epidemiology and End Result program (SEER) reveal thatseveral Asian ethnic groups experience excess incidence of stomach cancer and livercancer compared to Whites.
10
12

Cancer Incidence Rates per 100,000 Population, 1988-1992.
Site White Chinese Filipino Japanese Korean Vietnamese
Stomach 6.4 11.8 6.9 22.0 30.5 26.0
Liver 2.2 12.6 6.7 5 16.3 23.9
Source: NIH/NCI, SEER
Two infectious diseases that disproportionately affect APIAs are tuberculosis andhepatitis.
Tuberculosis Case Rates per 100,000 Population:U.S., 1998
36.6
17.813.6
6.82.3
12.6
Total Cases Non-Hispanic Non-Hispanic Hispanic Native Asian PacificWhite Black American Islander
Source: Centers for Disease Control 1999
Incidence Ratesfor Tuberculosis,California 1990.
Total 11.5
White 4.2
Black 30.8Native
American 23.1
Hispanic 26.2Asian Pacific
Islander 53.3
Source: Dumbauld, 1994
Summarizing the findings from community-based studies, Tong (1994) and Hann (1994)showed that the prevalence rates of hepatitis B in Asian ethnic subgroups range from5% to 15% compared to 0.2% for the general population.
Oral disease remains pervasive among millions of children in the U.S. Children fromlow-income families and racial and ethnic minorities (including APIAs) are at high risk oforal disease.
There continues to be a lack of data regarding the health and well being of many of thesmaller APIA groups. Empirical data suggests that certain APIA groups, such asSoutheast Asians fare much worse than predominant Asian groups (e.g., Chinese,Japanese and Filipino) with regards to mortality and specific health issues (e.g.,tuberculosis, depression, etc...). Based on the empirical data, it is clear that using theaggregate measure of "Asian" does not accurately reflect the health risks or healthstatus of the smaller Asian and Pacific Islander groups.
11
13

t
Access to Health Care.
An individual's ability to access quality health care is largely dependent upon whether heor she has health insurance. For immigrants and racial/ethnic minorities, the challengeof accessing health care is compounded by the lack of insurance coverage for traditionalor culturally based medicine (e.g., acupuncture and herbal medicine) and other non-financial barriers ranging from transportation to the lack of culturally competentproviders.
Many APIAs are uninsured because they work in small businesses or servicesindustries that do not offer health insurance.
Uninsured persons in 1998
Percent uninsured Number uninsured
United States 16.3 % 44.3 million
California 22.1 % 7.2 millionSource: U.S. Census Bureau, 1999
The uninsured rate in 1998 among all APIAs was higher than that of non-HispanicWhites 21.1 percent compared to 11.9 percent. Among poor people, the uninsuredrate among APIAs (32.3 percent) was higher than non-Hispanic Whites (28.5 percent)and Blacks (28.8 percent).
The foreign-born population was more likely to be without health insurance thannatives-34.1 percent compared with 14.4 percent in 1998. Poor immigrants were evenworse off-53.3 percent were without health insurance.
People Without Health Insurance for the Entire Year: 1998
Total
White
Non-Hispanic White
Black
Asian and Pacific Islander
Hispanic Origin
Native
Foreign born
Naturalized citizen
Not a citizen
16.332.3
33.8
58.6
0All people
llaPoor people
15
9
32.3
1 11285
28.8
53.3
1 22.21
21.1
35.3
14429
44
^119235 2
42.9
Source: U.S Ceram Swears Current Population Survey. March 1999.
12
BEST COPY AVA1LABL,

Health Insurance Coverage, APIAs, Ages 0-64, 1997
UninsuredJob-basedinsurance Medicaid
Privatelypurchasedinsurance
Othergovernment
coverageAPIAs overall 21% 64% 7% 6% 2%South Asians 22% 69% 4% 5% 0%Chinese 20% 67% 2% 10% 1%Filipinos 20% 73% 2% 3% 2%Japanese 13% 77% 2% 7% 1%Koreans 34% 48% 1% 14% 3%Southeast 27% 49% 18% 4% 2%AsiansOther APIAs 23% 59% 11% 5% 2%Source: March 1998 Current Population Survey
Children's health care coverage
The total number of uninsured children was 11.1 million (15.4 percent) in 1998. Amongpoor children, 3.4 million (25.2 percent) were uninsured. Poor children made up 30.6percent of all uninsured children.
APIA children were more likely than non-Hispanic Whites to be uninsured, though lesslikely to be uninsured compared to other minority groups.
Total
Poor Children
White
Black
Asian and Pacific Islander
Hispanic origin
Non-Hispanic White
Uninsured Children: 1998 (In percent)
15.4
125.2
mx111TIM.M.r.r.a.M.11=11=3.10g 14.4
419.7
IBBEEMS=11111111. 16.830
10.6
Source: U.S. Census Bureau. Current Population Survey, March 1999.
Uninsured population, 1994-95
California United StatesNumber Percent Percent
(thousands) Uninsured UninsuredTotal (nonelderly) 5,560 19.7 15.5
Children under age 19 1,185 12.5 10.4
Adults (19-64) 4,375 23.3 17.9Source: Kaiser Family Foundation, 1999
13
15BEST COPY AVAILABLE
The two primary publicly funded programs that provide children with health insuranceare Medicaid and the State Children's Health Insurance Program (S-CHIP). Medicaidcovers about 3 out of ten children (27 million in 1997). Children under 6 living below 133percent of the poverty line are eligible for Medicaid. By 2002, children under 19 livingbelow the poverty line ($13,880 for a family of three in 1999) will become eligible. Statesdo have the flexibility to expand the eligibility limits.
S-CHIP was created in 1997 to cover children from families who did not qualify forMedicaid, but who could not afford private coverage. Twenty-nine states (includingCalifornia) and D.C. provide coverage for children at or above 200 percent of poverty($27,760 for a family of three in 1999). Healthy Families (California's S-CHIP) coverschildren, ages 19 or below, up to 250% of poverty. States also have the flexibility toexpand the eligibility limits of these programs.
Cultural and Linguistic Competency Standards for Healthy Families Program11/15/99The Managed Risk Medical Insurance Board (MRMIB) is currently considering thecultural and linguistic competency standards for the Healthy Families Program (HFP).The proposal being looked at by MRMIB is being criticized by healthcare accessadvocates as inadequate in meeting the cultural competency service needs of thoseeligible for HFP.
The HFP is the state's program to provide health insurance for uninsured, low-incomechildren below 19 years old. There has been mounting concern that the program'senrollment efforts be able to reach immigrant communities; otherwise, eligible childrenwill remain uncovered and without access to care. Likewise, it is imperative that serviceproviders on contract with HFP be held to cultural and linguistic competency standardsthat ensure fullest access to services.
Asian Health Services has joined other advocates through the California Pan-EthnicHealth Network in calling on MRMIB to fully adopt the existing DHS Medi-Cal managedcare cultural and linguistic service requirements. Furthermore, advocates are also callingon MRMIB to convene a cultural and linguistics standards task force or work group tomonitor implementation of the requirements and to further develop the standards.
14
16

Barriers to Care
APIAs face barriers to care similar to those of the general population, such as highmedical costs and lack of health insurance. In addition, APIAs may face additionalbarriers to care, such as language difficulties and lack of cultural understanding andsensitivity by providers.
50
E 40
.EE 30o r,aai 0.2 20
10
0
Percent of Adults (18 yrs +) Reporting Dificulty Paying forMedical Care, 1994
Total White Black Hispanic APIA
Source: The Commonwealth Fund 1994 National Comparative Survey of Minority Health
There is a general lack of knowledge about the specific knowledge, attitudes, beliefs,and values of particular APIA ethnic subgroups and how these may affect health carepractices and disease interventions.
The lack of quantitative and qualitative data on the health and the health care practicesof APIAs, demonstrates the need for targeted research so that culturally competent carecan be provided and that effective interventions (i.e. preventive health education) can bedesigned.
Furthermore, given the increasing evidence that social support and emotional well being,it is necessary for providers to understand the socio-cultural environment of the patient.
Non-citizen residency status, particularly undocumented residency status, deters manyfrom seeking eligibility for entitlement and other publicly sponsored programs. Complexeligibility processes and service arrangements deter immigrants from accessing care.
Most old people prefer not to go to the doctor. They feel, maybe doctor justwant to study me. not help my problems. They scary this. If they go one time,if they not follow appointment and do like doctor want, doctor get mad: Doctoris like earth and sky. He think, you are refugee. you know nothing."
(froth interviews of Hmong in Merced, CA Fadiman, 1997)
15
17 BEST COPY AVAILABLE

Utilization of Health Services
There is increasing evidence that Apia's use fewer health services than Whites andother minority groups even after adjusting for health status. This includes under-utilization' of mental health services, preventive care and prenatal use.
Satisfaction with Quality of Health Care Services,1994
Total
White
Black
Total Hispanic
Mexican
Puerto Rican
Cuban
Total APIA
Chinese
Vietnames
Korean
Percent of adults (18+ yrs) reporting "very satisfied"
1 35
1 24
I 30
137
17
1 57
160
148
1 47
1 47
Source: TheCommonwealth Fund1994 NationalComparative Survey ofMinority Health Care.
Minority adults are lesslikely than white adults tofeel "very satisfied" with thecare they receive.
Less than one-third ofAPIAs and less than one-half of Blacks andHispanics feel verysatisfied with their care.
Chinese and KoreanAmericans reported thelowest levels ofsatisfaction with theirhealth care services.
Cultural attitudes and beliefs may hinder the use of mental health services in APIAfamilies.
Compared with Whites and other ethnic groups, Apia's underutilize mental healthservices (Sue 1994). As a result, when Apia's seek treatment, cases are often moresevere and require more intensive services.
The underutilization may, in part, be due to different conceptions of mental health anddisturbance by Apia's and mainstream Americans. Because of the strong stigma andshame that is attached to mental illness, Apia's may not acknowledge mental illness ordisorder and avoid seeking help.
Certain groups of APIA women are less likely to use preventive care and prenatalcare than White women.
1 The term 'under-utilization' is specifically used to imply that Asians are not using services eventhough the need for care exists.
16
18

In 'The Commonwealth Fund 1998 Survey of Women's Health", less than half of theAPIA women respondents received physical exams, cholesterol tests, breast exams andpap smears in the preceding year the lowest of all racial and ethnic groups in thesurvey. Almost one-third of APIA women reported receiving no preventive services atall.
In one California County, 40% of Korean women reported never having a pap smearcompared to 8% of all women living in the county (Public Health Service, 1997).
Numerous barriers exist that prevent APIA communities from accessing the oralhealth care they need.
Financing dental services remains one of the most significant barriers to accessingnecessary oral care. Lack of dental insurance, particularly for employees of smallbusinesses and for the working poor, is a major barrier to obtaining services. Inaddition, APIAs are faced with the lack of linguistically appropriate and culturallycompetent oral health services.
Traditional medicine
APIA patients may first seek alternative, indigenous healers as the first line ofhealth care or as parallel services.
For instance, in South Asian communities both ayurvedic (traditional Hindu system ofmedicine which is based on customs, beliefs, and practices of the Hindu culture.Ayurveda means "the science of life": veda science, ayur life.) and homeopathicmedicine are well known and used. In East Asian communities, use of acupuncture andtraditional herbal remedies are common. Often, alternative medicine is used inconjunction with Western medicine.
There is little to no data on the extent to which traditional medicine is used by itself or inconjunction with Western medicine.
Health Professions and Health Providers
When grouped as a whole, it appears that there is more than an adequate number ofAsian physicians to serve the APIA population. Based on a physician to population ratio,the ratio of APIA physicians to APIA population is 887 per 100,000 compared to ratios of251 per 100,000 for Whites, 128 per 100,000 for Hispanics, 72 per 100,000 for Blacks,and 50 per 100,000 for Native Americans.
Despite the high ratio of APIA professionals per population, a closer examination revealsthat there is a lack of racial/ethnically similar physicians for several APIA communitiessuch as Hawaiians and Laotians.
17
19

Physician to Population Ratio by Race/Ethnicity, 1990
Race/Ethnicity # of PhysiciansPopulation
(# of Persons)
Ratio of Physiciansto Population(per 100, 000)
Laotian 24 149,014 16Cambodian 34 147,411 23Samoan 21 62,964 34Guamanian (Chamorro) 18 49,345 37Hawaiian 134 211,014 63Vietnamese 1,417 314,547 231Japanese 3,772 847,562 445Korean 5,797 798,849 726Chinese 12,538 1,645,472 762Other API 3,820 433,992 880Filipino 13,250 1,406,770 942Thai 996 91,275 1,092Asian Indian 22,715 815,447 2,786Total APIA 64,535 7,273,662 887
Non-Hispanic White 472,351 188,128,296 251African American 21,538 29,986,060 72Native American 979 1,959,234 50Hispanic 27,023 21,113,528 128Total 586,715 248,709,873 236Source: U.S. Bureau of the Census, 1990
It appears that APIAs are "over-represented" in allopathic medicine and dentistry,however, due to the broad categorization of Asians as a whole, the distribution ofstudents from Asian and Pacific Islander subgroups is unknown. Given the lower ratesof educational attainment for groups such as Southeast Asians and Pacific Islanders, itseems likely that they would be "under-represented" in the health professions.
18
20

Total Enrollment in Schools for Selected Health Professions forAcademic Years 1996-7
Number of students Percent of StudentsAllopathic medicine Non-Hispanic White 44,283 65.8
Non-Hispanic Black 5.400 8.0Hispanic 4,424 6.6Native American 528 0.8Asian 11,808 17.6
Dentistry Non-Hispanic White 11,100 67.7Non-Hispanic Black 891 5.4Hispanic 654 4.0Native American 83 0.5Asian 3,672 22.4
Nursing (RN programs) Non-Hispanic White 193,061 81.0Non-Hispanic Black 23,611 9.9Hispanic 9,227 3.9Native American 1,816 0.8Asian 10,529 4.4
Source: Bureau of Health Professions
Immigrants and Public Benefits
What Federal Public Benefits can "Qualified" Immigrants Receive? (National ImmigrationForum, Feb 1999)
"Qualified" Immigrants entering the U.S. onor after 8/22/96
Barred from Supplemental Security Incomeand Food Stamps.
Subject to a 5-year bar on non-emergencyMedicaid, the state Child Health InsuranceProgram, and Temporary Assistance for NeedyFamilies.
After 5-year bar, subject to deeming for theabove programs. Exemptions from deemingup to one year exist for some battered spousesand children, and those at risk of going hungryor becoming homeless.
After 5-year bar, states still retain the option todetermine immigrant eligibility for TANF,Medicaid and social services block grants (Title>09.
"Qualified" Immigrants in the U.S. before8/22/96 (date of enactment of welfare law)
Eligible for SSI:- if they were receiving the benefit on
8/22/96; orif they are or become disabled.
Eligible for Food Stamps:.if they were 65 years of age or older as of8/22/96;if they are under 18 years of age;if they are disabled;
- if they are a tribal member or familymember of a Hmong or Highland Laotiantribe: ORif they are a member of specific Indiantribes living along the U.S. border.
States have the option to determine immigranteligibility for TANF, Medicaid, and socialservices block grant (Title >00.
Note: "Qualified" immigrants include Lawful Permanent Residents; refugees and asylees; persons paroled into thecountry for at least one year; persons granted withholding of deportation; Cuban-Haitian entrants; Amerasians; andcertain battered women and children.
19
21
"Deeming" is a process where the income and resources of the U.S. citizen or legal permanent resident sponsoring theimmigrant are added to the immigrant's own income to determine whether the immigrant is poor enough to qualify for thebenefit under the program's financial guidelines.
As a result of the new federal welfare law (the Personal Responsibility and WorkOpportunity Reconciliation Act of 1996 (PRWORA), states acquired the authority todetermine immigrants' eligibility for public benefits. While states gained the authority tobar noncitizens from public benefit programs such According to a recent poll. 77%as TANF and Medicaid, states could also create
of Americans believe legalnew state-funded substitute benefits for immigrants. immigrants "should be eligible
What is left is a patchwork of benefits available to for the same kinds of public
immigrants that varies by state. The combination of assistance that are available to
the federal restrictions and the state choices the native-born."Source: W.K. Kellogg Foundation colt Oy Bonney
resulting from PRWORA have led to increased & Ccmoanv. -The National Poll on Welfare
fiscal inequalities across states. State and localities Reform ano Healthcare Reform.' January 1999.
often carry a net fiscal burden, despite the fact thatthe federal tax contributions made by immigrants outweigh the cost of providing themwith federally funded services. States with large immigrant populations, such asCalifornia and New York, are disproportionately burdened.
Except for refugees and elderly immigrants, immigrants are considerably lesslikely than natives to receive welfare. Among longer-term immigrants (at least tenyears in the U.S.) of working age 3.2 percent are on welfare versus 3.7 percent forworking-age natives. (Fix and Passel, 1994)
The California Experience
Despite the state's anti-immigrant reputation (brought on by the passage of Prop 187and former Gov. Wilson's executive orders that restrict public benefits to undocumentedimmigrants), a recent study by The Urban Institute found that California is one of the .
most generous states in providing comprehensive state-funded benefits to qualifiedimmigrants. Yet, it is also the most aggressive in trying to bar the unqualified from statepublic benefits.
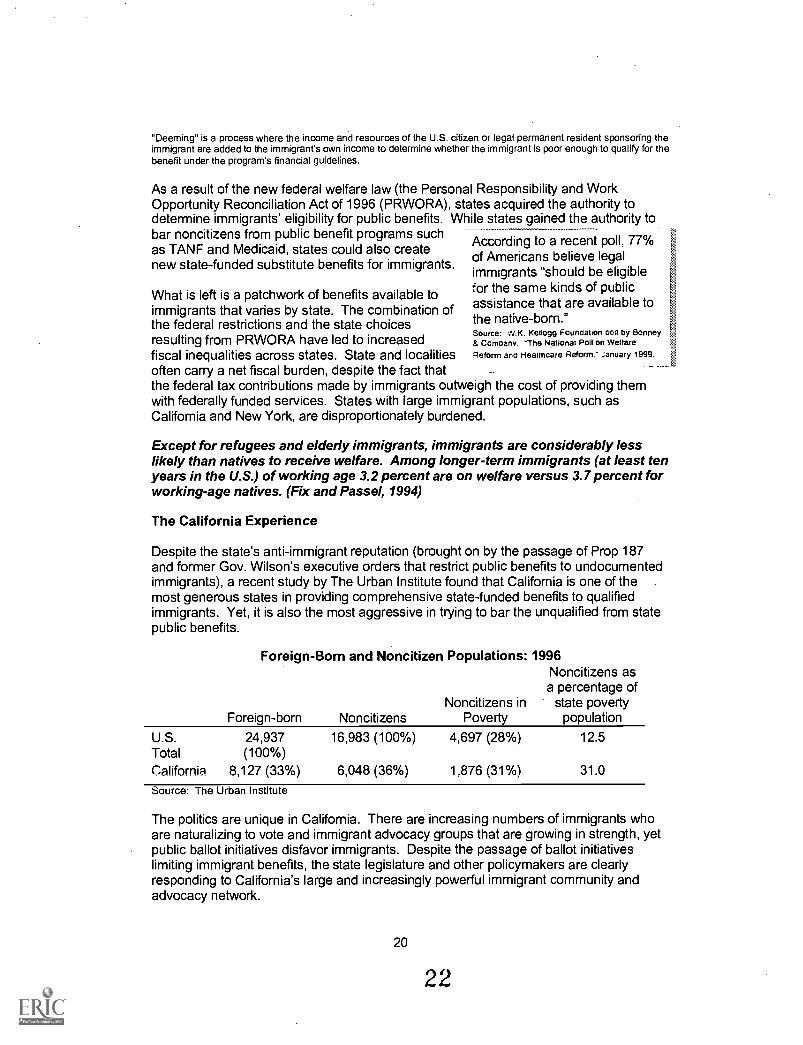
Foreign-Born and Noncitizen Populations: 1996Noncitizens as
a percentage ofNoncitizens in state poverty
Foreign-born Noncitizens Poverty population
U.S. 24,937 16,983 (100%) 4,697 (28%) 12.5Total (100%)California 8,127 (33%) 6,048 (36%) 1,876 (31%) 31.0
Source: The Urban Institute
The politics are unique in California. There are increasing numbers of immigrants whoare naturalizing to vote and immigrant advocacy groups that are growing in strength, yetpublic ballot initiatives disfavor immigrants. Despite the passage of ballot initiativeslimiting immigrant benefits, the state legislature and other policymakers are clearlyresponding to California's large and increasingly powerful immigrant community andadvocacy network.
20
22

Positive or Negative? California's benefit policies for immigrants
California ...
- is one of two states (the other beingMaine) that provides state-fundedsubstitute benefits in 4 key areas: foodstamps, SSI, TANF, and Medicaid.
provides a substitute SSI program,however, it provides lower benefits toimmigrants than to citizens.
makes state-funded SSI program availableto post-enactment immigrants, though onlyif they have a sponsor who is abusive,disabled or deceased.
provides immigrants equivalent Medicaidservices.that were provided prior toPRWORA.
imposes a short sponsor-deeming periodon post-enactment elderly and disableimmigrants than is required under federalprograms.
California ...
- at least 20 CA state agencies have issuedregulations barring unqualified immigrantsfrom various federal and state benefits andstate-issued professional licenses, rangingfrom assistance on lead hazard control tothe issuance of commercial driver'slicenses. (Implementation of theseregulations is still on hold due to courtchallenges.)issued regulations barring unqualifiedimmigrants from services provided underthe Community Services Block Grant.successfully passed ballot initiativeslimiting affirmative action and bilingualeducation
What are the most pressing health and social issues facing Asian and PacificIslander Americans?
Public charge
Recent immigration and welfare reform laws have generated considerable publicconfusion and concern about whether a non-citizen who is eligible to receive certainFederal, State, or local public benefits may face adverse immigration consequences as a"public charge" for having received public benefits.
Public charge, as defined in the Immigration and Naturalization Act, is when anindividual is "primarily dependent on the government for subsistence."
By law, a non-citizen who is likely at any time to become a public charge is inadmissibleand ineligible to become a legal permanent resident of the United States. Also, a non-citizen can be deported if he or she becomes a public charge within five years ofentering the United States from causes that existed before entry.
In 1997, the issue of public charge became so confusing that immigrants avoidedseeking basic health care and other needed services that were eligible to them becauseof fear that it would lead to denial of a green card or immigrant visa. For example,immigrant parents were afraid to enroll immigrant or citizen children in the new stateChildren's Health Insurance Program (CHIP) enacted in 1997 to protect the health ofchildren in working families.
21
23

On May 25, 1999, the Administration clarified the new standard of public charge. Theguidance provided that the only government programs that can have a negative effect onimmigration status are cash welfare for income maintenance and long-term institutionalcare at government expense. It also clarified the circumstances under which receipt ofcash welfare or institutionalization can become a factor in immigration determinations.
Availability of basic health and social services is limited due to "deeming".
"Deeming" is a process where the income and resources of the U.S. citizen or legalpermanent resident sponsoring the immigrant are added to the immigrant's own incometo determine whether the immigrant is poor enough to qualify for the benefit under theprogram's financial guidelines. Deeming will make most immigrants sponsored underthe new affidavit of support ineligible for means-tested public benefits.
The use of public benefits by potential sponsors must be clarified.
A question on the Affidavit of Support (Form 1-864) that asks whether the sponsor or amember of the sponsor's household has received means-tested public benefits withinthe past three years leads potential sponsors to incorrectly believe that if they usebenefits they will be considered a public charge or found ineligible to be a sponsor.
There is a need to educate immigrants, health and social practitioners,immigration officers, and other professionals about public charge.
Because there has been so much confusion around the issue of public charge, manyeligible immigrants are still fearful of using needed and available services. Likewise,health and social practitioners are unaware of the clarification and may be illegallyprohibiting immigrants from receiving services.
Culturally competent health and social services
"More and more providers are treating a diverse group of patients, and culturallycompetent care improves health outcomes and patient satisfaction." --GuadalupePacheco, special assistant to the director of the Office of Minority Heath.
It is clear that providing culturally competent services will benefit the individual, theprovider and the community. "Cultural and linguistic competence is a set of congruentbehaviors, attitudes, and policies that come together in a system, agency, or amongprofessionals that enables effective work in cross cultural situations. Culture refers tointegrated patterns of human behavior that include the language, thoughts,communications, actions, customs, beliefs, values, and institutions of racial, ethnic,religious or social groups. Competence implies having the capacity to functioneffectively as an individual and an organization within the context of the cultural beliefs,behaviors, and needs presented by consumers and their communities."
In other words, a culturally competent system of care would be one that does thefollowing: 1) value diversity; 2) have the capacity for cultural self-assessment; 3) beconscious of the dynamics inherent when cultures interact; 4) have institutionalizedcultural knowledge; and 5) have developed adaptations to diversity. Further, each ofthese five elements must function at every level of the system. Attitudes, policies, andpractices must be congruent within all levels of the system. Practice must be based on
22
24

accurate perceptions of behaviors, policies must be impartial, and attitudes should beunbiased. (Cross, Bazron, Dennis, & Isaacs, 1989, p.v)
Various models, standards, and tools have been developed for providing culturallycompetent care. It should be noted that many of these models and tools must still beevaluated and refined. There have also been various policies that support thedevelopment and implementation of culturally competent care. Yet as with all policies,the accountability and programmatic and financial support has to be in place for thepolicies to be effective.
Race relations
Sa-i-gu, pronounced "sah-ee-goo", or April 2-9, became the most visible and devastatingindication of the racial divide that APIAs experience. On April 29, 1992, Koreatown wentup in smoke. By the end of the three-day uprising, more than 54 people had died and4,500 shops were reduced to ashes. This particular event was the result of the growingtension between Korean Americans and African Americans and a need to unleash furyabout social, economic and racial inequities that never got meaningfully addressed.Meanwhile, White Americans stood by watching.
Sa-i-gu highlighted the need to address inter- and intra- group relations. Stereotypesand misunderstandings are prevalent. For APIAs specifically, there remains the need toexplain and share cultural beliefs, values, and practices with other groups. Likewise,APIAs must reach out to others and learn about their beliefs, values, and practices.There is a need to further develop pan-Asian organizations, so that race issues can beaddressed on the community, as well as individual, level.
IntermarriageIntermarriage is an example of how on an individual level Americans cross-theracial and ethnic divide. It is the most potent example of America's melting pot.
"Both foreign born Asians and foreign-born Hispanics have higher rates ofintermarriage than do U.S. born Whites and Blacks. By the third generation,intermarriage rates for Asians and Latinos are extremely high. Fully one-third ofthird-generation Hispanic women are married to non-Hispanics, and 41% of third-generation Asian American women have non-Asian spouses." (NationalImmigration Forum, 1999)
From a community and economic development standpoint, improving race relations isnot only important, but also necessary if racial and ethnic minorities are to maximizetheir potential and capture the opportunities afforded to them. Together, racial minoritiescan challenge the "glass ceiling" and can confront discriminatory policies and practices.
Like others, the hope of Asian and Pacific Islander Americans is to fully participate in theAmerican dream.
23
25
References
Alliance for Health Reform. (2000). Health Coverage Update: Children's HealthInsurance. Washington D.C. Alliance for Health Reform.
Barringer, H., R. W. Gardner, et al. (1993). Asians and Pacific Islanders in the UnitedStates. New York, Russell Sage Foundation.
Bennett, C. E. and B. Martin (1995). The Asian and Pacific Islander Population.Population Profile of the United States 1995. U.S. Department of Commerce.Washington D.C., Bureau of the Census.
Bureau of the Census (1995). Housing in Metropolitan Areas Asian or Pacific IslanderHouseholds. Washington D.C., U.S. Department of Commerce, Bureau of the. Census.
Bureau of the Census (1999). Census. Bureau Releases State and County PopulationChanges for the Nation's Racial and Hispanic Groups Substantial Increases Estimatedfrom 1990. U.S. Department of Commerce News. Washington D.C.
Campbell, J. A. (1999). Health Insurance Coverage 1998. Washington D.C., U.S.Census Bureau.
Center for Substance Abuse Prevention (1999). Developing Cultural Competence inAsian-American and Pacific Islander Communities: Opportunities in Primary HealthCare and Substance Abuse prevention. U.S. Dept. of Health and Human Services,Substance Abuse and Mental Health Administration, Office of Minority Health.Washington D.C.
Collins, K.S., Hall, A, et al. (1999). U.S. Minority Health: A Charbook. New York, TheCommonwealth Fund.
Collins, K. S., C. Schoen, et al. (1999). Health Concerns Across a Woman's Lifetime:The Commonwealth Fund 1998 Survey of Women's Health. New York, TheCommonwealth Fund.
Council of Economic Advisers for the President's Initiative on Race (1998). ChangingAmerica: Indicators of Social and Economic Well-Being by Race and Hispanic Origin.Washington D.C., President's Initiative on Race.
Dumbauld, S., J. A. McCullough, et al. (1994). Analysis of Health Indicators forCalifornia's Minority Population. Sacramento, Minority Health Information ImprovementProject.
Jang, D. (1999). Re: INS No. 1989-99 -- Inadmissibility and Deportability on PublicCharge Grounds, Asian Pacific Islander American Health Forum.
Kirschten, D. (1999). Immigrant Integration & Intergroup Relations: New Directions for aNew Century. Washington D.C., The National Immigration Forum.
Kitano, H. H. L. and R. Daniels (1995). Asian Americans: Emerging Minorities.Englewood Cliffs, Prentice Hall.
24
26

Kuo, J. (1998). Health Status of Asian Americans: United States, 1992-94. AdvanceData. Hyattsville, National Center for Health Statistics.
Lustgarten, S. (1996). The Role of Small Firms in the Upward Mobility of NewImmigrants. Washington D.C., U. S. Small Business Administration, Office of Advocacy.
Meadows, M. (2000). Moving Toward Consensus on Cultural Competency in HealthCare. Closing the Gap. Jan 2000.
Moore, S. (1998). A Fiscal Portrait of the Newest Americans. Washington D.C. TheNational Immigration Forum.
National Immigration Law Center (1999). "Administration Clarifies Public Charge Policyfor Immigrants Who Use Health Care and Other Safety Nbt Programs." Immigrants'Rights Update 13(3 Special Insert).
Office of Advocacy (1999). The Facts about Small Business 1999. Washington D.C.,U.S. Small Business Administration, Office of Advocacy.
Office of Advocacy (1999). Minorities in Business. Asian-Owned Business. WashingtonD.C., U.S. Small Business Administration, Office of Advocacy.
Paisano, E. L. (1993). We the Americans: Asians. Washington D.C., U.S. Department ofCommerce, Bureau of the Census.
Paisano, E. L. (1993). We the Americans: Pacific Islanders. Washington D.C., U.S.Department of Commerce, Bureau of the Census.
Ro, M. J. (1998). Utilization of Health Services by Non-Elderly Adult Asians and AsianEthnic Groups. Baltimore, The Johns Hopkins School of Public Health, Dept of HealthPolicy and Management.
Rodriguez, G. (1999). From Newcomers to New Americans: The Successful Integrationof Immigrants into American Society. Washington D.C. The National ImmigrationForum.
U.S. Census Bureau (1998). California Leads States and Los Angeles Count, Calif.,Tops Counties in Asian and Pacific Islander Population Increase, Census BureauReports. U.S. Department of Commerce News. Washington D.C., U.S. Census Bureau.
U.S. Census Bureau (1998). Resident Population Estimates of the United States by Sex,Race, and Hispanic Origin: April 1, 1990 to November 1, 1999, U.S. Census BurPni
U.S. Census Bureau (1998). USA Counties 1998, California, General Profile, U.S.Census Bureau.
Warren, R. C. (1999). Oral Health for All: Policy for Available, Accessible andAcceptable Care. Washington D.C., Center for Policy Alternatives.Zane, N. W. S., D. T. Takeuchi, et al., Eds. (1994). Confronting Critical Health Issues ofAsian and Pacific Islander Americans. Thousand Oaks, Sage.
25
27

Zia, H. (2000). Asian American Dreams: The Emergence of an American People. NewYork, Farrar, Straus and Giroux.
Zimmerman W. and Tumlin T. (1999). Patchwork Policies: State Assistance forImmigrants under Welfare Reform. Washington D.C., The Urban Institute.
26
28

07/29/2002 15:56 FAX 202 387 8529
MAY-16-1900 21:12
CFPA
U.S. Department f EducaticanOffice of Educational Research and Improvement (OEM
National Library of Education (NLE)Educational Resources Information Center (ERIC)
REPRODUCTION RELEASE(Specific Document)
IDENTIFICATION:
002P.03
ERIC035 OW
ON RELEASE:as widely as passible timely and significant materiels of ENCIESL to the educational onnaeunity, docurnents annauncesi .ql.
and said through the ERIC Document Reptedu.ction Service (EDRS). Credit is given to the Solna Of each document and, ifof le ERIC, syetem, Resources in Education (RIE), are ult.* made available to users In microfiche. reproduced paper copy...,
Iogrentod, one of the folIcOMng notices is affixed to the document
irantedto repraduoe and disseminate the identified dccurnent please CHECK ONE of the following three opdonsand sign at the bottom.
. .
Boa baker ell Mseine 1
ONAL RESOURCES,cetaieti (ERIC)
The mope adder mom Dologo %AO beerred to 89 Wool ItOtivemits
PERMISSION TO REPRODUCE ANDDISSEMINATE THIS MATERIAL IN
MICROFICHE AND IN ELECTRONIC MEDLAFOR ERIC COLLECTION SUBSCRIBERS ONLY.
HAS BEEN GRANTED BY
TO THE EDUCATIONAL RESOURCESINFORMATION CENTER (ERIC)
2A
Lever 2A
Ted Edmore sew MOM bet= MU beNeed to al Wee 213 documents
PERMISSION TO REPRODUCE ANDDISSEMINATE THIS MATERIAL IN'
MICROFICHE ONLY HAS BEEN GRANTEE)
2B
c6TO THE EDUCATIONAL RESOURCES
INFORMATION CENTER (ERIC)
Lovsl fie
. ,sematag
to rskielighe maentniwoneolespor
Cleat herd ref MO att Neese. modeminproshrolion mid aleornitteen b ItSCroBad MIS in
eacemeac credo fe ERIC mehbol calledloosubsmiNfooNy
Om& here for Lode, 20 release. pernialittlV-4 COIAM .Emir Q' in rreaml..,eat
Daeseterds en Eld processed ea teserend prodded Ispreeticeon quaky pomdts.oermIsalon te reproMsoo to grease. Sae en Medi Ogee& aseumente till be geocended et Level 1.
stow to the Egueepanal "mem iniermation Center(ER(C)nanexclusdVe permission to reproduce end disseminate this document&brave. ^production fmm die ERIC micmdche of ate ctorde media by eersOnS Other then ERIC emPt0YeeS and Ire eySeart
reguireepermIsslon from Ma ooppfghtholdes. El:cep/art Isrnedis for nonprofit leproduction by filmaries andoffierservicewomenhdonnedon needs of 6M in response rto diaCfella *sine&
C0141640414411MittJltr4692.
S-1". 8521
Amm4A

III. DOCUMENT AVAILABILITY INFORMATION (FROM NON-ERIC SOURCE):
If permission to reproduce is not granted to ERIC, or, if you wish ERIC to cite the availability of the document from another source,please provide the following information regarding the availability of the document. (ERIC will not announce a document unless it is
publicly available, and a dependable source can be specified. Contributors should also be aware that ERIC selection criteria aresignificantly more stringent for documents that cannot be made available through EDRS.)
Publisher/Distributor:
Address:
Price:
IV. REFERRAL OF ERIC TO COPYRIGHT/REPRODUCTION RIGHTS HOLDER:
If the right to grant this reproduction release is held by someone other than the addressee, please provide the appropriate name and
address:
Name:
Address:
V. WHERE TO SEND THIS FORM:
Send this form to the following ERIC Clearinghouse:
However, if solicited by the ERIC Facility, or if making an unsolicited contribution to ERIC, return this form (and the document being
contributed) to:
ERIC Processing and Reference Facility4483-A Forbes BoulevardLanham, Maryland 20706
Telephone: 301-552-4200Toll Free: 800-799-3742
FAX: 301-552-4700e-mail: [email protected]: http://ericfacility.org
EFF-088 (Rev. 2/2001)