reproductions supplied by edrs are the best that can be ... · the center for education statistics...
TRANSCRIPT

ED 468 162
TITLE
INSTITUTION
REPORT NOPUB DATENOTE
AVAILABLE FROM
PUB TYPEEDRS PRICEDESCRIPTORS
IDENTIFIERS
ABSTRACT
DOCUMENT RESUME
HE 035 178
National Postsecondary Student Aid Study: Student FinancialAid Estimates for 1999-2000. E.D. Tabs.National Center for Education Statistics (ED), Washington,DC.; Research Triangle Inst., Research Triangle Park, NC.;MPR Associates, Berkeley, CA.NCES-2001-2092001-07-0053p.; Project Officer, Andrew G. Malizio.ED Pubs, P.O. Box 1398, Jessup, MD 20794-1398. Tel: 877 -433-7827 (Toll Free); Fax: 301-470-1244; e-mail:[email protected]. For full text:http://nces.ed.gov/pubs2001/2001209.pdf.Numerical/Quantitative Data (110) Reports Research (143)EDRS Price MF01/PC03 Plus Postage.
*College Students; Estimation (Mathematics); *Federal Aid;Higher Education; National Surveys; *Paying for College;Professional Education; *Student Financial Aid*National Postsecondary Student Aid Study; Pell GrantProgram; Stafford Student Loan Program
The National Postsecondary Student Aid Study (NPSAS) is acomprehensive survey that examines how students and their families pay forpostsecondary education. The study included nationally representative samplesof students, including those who do and do not receive financial aid. Thisreport has been prepared to provide some key estimates as policymakers,researchers, and analysts begin working on research for the nextreauthorization of the Higher Education Act. It is based on information about50,000 undergraduates, 11,000 graduate students, and 1,000 first-professionalstudents enrolled at approximately 1,000 institutions. The sample representsabout 15.5 million undergraduates, 2.3 graduate students, and 330,000 first-professional students. In the 1999-2000 academic year, 55% of undergraduatesreceived some type of financial aid, and about 39% received some type offederal aid. Percentages of undergraduates receiving federal aid varieddepending on family income and type of institution. At private institutions,80% of undergraduates received federal aid; at public institutions, thepercentage was 21%. About 30% of students enrolled full time for the fullyear received a federal Pell grant, and about 23% received a Stafford loan.About 6 in 10 graduate and first-professional students received somefinancial aid, averaging $13,255. Eight of 10 full-time/full-year studentsreceived some types of financial aid. Overall, 29% of graduate and first-professional students received Stafford loans, and overall, 27% received someinstitutional aid, although this varied considerably, depending on the typesof program. About one in four master's degree students received employer aid.A technical appendix provides details and contains supplemental information.(Contains 20 tables.) (SLD)
Reproductions supplied by EDRS are the best that can be madefrom the original document.

NATIONAL CENTER FOR EDUCATION STATISTICS
E.D. Tabs July 2001
National Postsecondary Student Aid Study:Student Financial Aid Estimates for 1999-2000
U.S. DEPARTMENT OF EDUCATIONOffice of Educational Research and Improvement
EDUCATIONAL RESOURCES INFORMATIONCENTER (ERIC)
leThis document has been reproduced asreceived from the person or organizationoriginating it.
O Minor changes have been made toimprove reproduction quality.
Points of view or opinions stated in thisdocument do not necessarily representofficial OERI position or policy.
U.S. Department of EducationOffice of Educational Research and Improvement NCES 2001-209
BEST COPY AVAILABLE 2
U.S. Department of EducationRod PaigeSecretary
National Center for Education StatisticsGary PhillipsActing Commissioner
The Center for Education Statistics (NCES) is the primary federal entity for collecting, analyzing and reporting datarelated to education in the-United States and other nations. It fulfils a congressional mandate_to collect, collate,analyze, and report full and complete statistics on the condition of education in the United States; conduct andpublish reports and specialized analyses of the meaning and significance of such statistics; assist state and localeducation agencies in improving their statistical systems; and review and report on education activities in foreigncountries.
NCES activities are designed to address high priority education data needs; provide consistent, reliable, complete,and accurate indicators of education status and trends; and report timely, usefully, and high quality data to the U.S.Department of Education, the Congress, the state, other education policymaker, practitioners, data users and thegeneral public.
We strive to make our products available in a variety of formats and in language that is appropriate to a variety ofaudiences. You, as our customer, are the best judge of our success in communicating information effectively. If youhave any comments or suggestions about this or any other NCES product or report, we would like to hear from you.Please direct your comments to:
National Center for Education StatisticsOffice of Educational Research and ImprovementU.S. Department of Education1990 K Street, NWWashington, DC 20006
July 2001
The NCES World Wide Web Home Page address is: http://www.ed.gov/NCES/
Suggested Citation
U.S. Department of Education, National Center for Education Statistics. National Postsecondary Student Aid Study:
Student Financial Aid Estimates for 1999-2000, NCES 2001-209, Andrew G. Malizio, Project Officer. Washington, DC:2001.
Contact:
Aurora M. D'Amico OR Andrew G. MalizioAurora.D'Amico @ed.gov [email protected]@inet.ed.gov(202) 502-7334
3

ACKNOWLEDGMENTS
Research Triangle Institute (RTI) in North Carolina and MPR Associates, Inc., under contractwith the National. Center for Education Statistics (NCES), conducted the 1999-2000 NationalPostsecondary Student Aid Study (NPSAS:2000). John Riccobono of RTI provided projectdirection and management. Lutz Berkner at MPR directed the development of the financial aidvariables in this report. A cadre of other staff too numerous to list worked long hours toproduce the NPSAS:2000.
More than 1,000 individuals at the postsecondary institutions and 80 field data collatorsassisted in the data collection activities at 999 institutions. These institutional coordinators,financial aid administrators, and their staff were helpful, diligent, and productive. Without theirassistance, NPSAS:2000 would not exist.
The following NCES reviewers provided helpful comments and suggestions for this report:C. Dennis Carroll, Arnold A. Goldstein, Lisa Hudson, Paula R. Knepper, and Karen O'Conor.Others from the Department include Dan Madzelan and David Bergeron (Office of PostsecondaryEducation), Dan Goldenberg (Office of Policy and Planning), Cliff Adelman and Jon Oberg (Officeof Educational Research and Improvement). Frank Balz (National Association of IndependentColleges and Universities), Kent A. Phillippe (American Association of Community Colleges),Melanie Corrigan and Jacqueline King (American Council on Education) and Peter Syverson(Council of Graduate Schools), Sue Clery (JBL Associates), Alisa Cunningham (Institute forHigher Education Policy) also reviewed the final draft of the report and provided helpfulsuggestions.
Andrew G. Malizio, Program Director for Postsecondary Longitudinal Studies and SampleSurveys, served as the NCES project officer who managed the study under the overallsupervision of C. Dennis Carroll, Associate Commissioner, Postsecondary Education Studies.Dennis Carroll developed the software system used to produce the estimates in this publication.
The NPSAS:2000 received support and advice from a varied constituency over the duration ofthe study, including more than 65 members of the Technical Review Panel. NCES is indebtedto all these individuals who assisted NCES and RTI in the planning, design, and implementationof the study.
Hi 4

THIS PAGE IS BLANK
iv
TABLE OF CONTENTS
ACKNOWLEDGMENTS iii
INTRODUCTION 1
HIGHLIGHTS 2
List of Tables.
Table
1 Percentage of undergraduates receiving selected types of aid: 1999-2000 6
2 Average amounts of aid received by undergraduates: 1999-2000 7
3 Percentage of undergraduates receiving selected types of federal, institutional, orstate aid: 1999-2000 8
4 Average amounts of selected types of federal, institutional, or state aid received byundergraduates: 1999-2000 9
5 Percentage of undergraduates at specified dependency and incomelevels: 1999-2000 10
6 Percentage of dependent undergraduates at specified income levels: 1999-2000 12
7 Percentage of independent undergraduates at specified income level: 1999 2000 13
8 Percentage of undergraduates receiving selected types of Title IV aid: 1999-2000 14
9 Average amounts of Title IV aid received by undergraduates: 1999-2000 15
10 Percentage of full-time/full-year undergraduates receiving selected Title IVaid: 1999-2000 16
11 Average amounts of Title IV aid received by full-time/full-yearundergraduates: 1999-2000 17
12A Percentage of undergraduates receiving various combinations offinancial aid: 1999-2000 18
12B Percentage of aided undergraduates receiving various combinationsof financial aid: 1999-2000 19
13 Percentage of graduate and first-professional students receiving varioustypes of financial aid: 1999-2000 20
14 Average amounts of selected types of financial aid received by graduate andfirst-professional students: 1999-2000 21
6

TECHNICAL APPENDIX 23
Appendix Tables
Al Overall institutional eligibility and enrollment list participation rates 25
A2 Institution-level rates for obtaining institutional record data (CADE), by selectedclassifications 26
A3 Student-level rates for obtaining institutional record data (CADE) by selectedclassifications 27
A4 Student interview response rates, by selected classifications 28
A5 Study respondents by selected classifications 29
A6 Standard errors for estimates in Table 1 30
vi

INTRODUCTION
The National Postsecondary Student Aid Study (NPSAS) is a comprehensive survey thatexamines how students and their families pay for postsecondary education. The studyincludes nationally representative samples of undergraduate, graduate, andfirst-professional students; students attending less-than-2-year, 2-year, 4-year, anddoctorate-granting institutions; students who receive financial aid and those who do notreceive aid.
This report has been prepared to provide some key estimates as policymakers,researchers, and analysts begin working on research for the next reauthorization of theHigher Education Act. It is based on information from about 50,000 undergraduates,11,000 graduate students and 1,000 first-professional students enrolled atapproximately 1,000 postsecondary institutions during the 1999-2000 academic year.The sample represents about 16.5 million undergraduates, 2.3 million graduate, and330,000 first-professional students enrolled at any time between July 1, 1999 and June30, 2000. Considerably more detail on how students finance their postsecondaryeducation and student background characteristics will be published in subsequentreports.
Estimates in this report focus primarily on percentages of students receiving specifiedtypes of financial aid, and average amounts of specific types of financial aid received.Unless otherwise noted, all average amounts of financial aid described in the reportHighlights and presented in the tables reflect the weighted means and are based onlyon the recipients of the specified types of aid. Further, the estimates in this report aresubject to sampling and nonsampling errors. Additional information, includingNPSAS:2000 data sources and a description of the variables, is presented in theTechnical Appendix.

HIGHLIGHTS
The estimates in this report are based on information from 50,000 undergraduates, 11,000graduate students and 1,000 first-professional students enrolled at approximately 1,000postsecondary institutions at any time during the 1999-2000 academic year. Unless otherwisenoted, all average amounts of aid described here and presented in the tables reflect theweighted means and are based only on the amounts received by recipients of the specified aid.Highlights are presented separately for undergraduates and graduate and first-professionalstudents.
Among the 16.5 million undergraduates (including full- time-and' part-time students)enrolled during 1999-2000:
Fifty-five percent of undergraduates (about 9.2 million) received some type of financialaid, averaging $6,265 (table 1, 2). Overall, about two out of five undergraduates (39percent) received some type of federal aid, averaging about $5,230 (table 3, 4).
Percentages of undergraduates receiving federal aid varied depending on family incomeand type of institution. Among dependent students, percentages receiving federal aidranged from 70 percent of undergraduates from families with incomes of less than$20,000 to about 25 percent of undergraduates from families with incomes of $100,000or more. Among independent students, 67 percent of those with incomes less than$10,000 received some federal financial aid (table 3).
Percentages of undergraduates receiving federal aid ranged from 21 percent at public 2-year institutions to 80 percent at private for-profit institutions (table 3).
Forty-seven percent of undergraduates at private not-for-profit 4-year institutions receivedsome institutional aid, averaging about $6,760 (table 3, 4).
About one of every eight dependent undergraduates (13 percent) came from familieswith income less than $20,000 (table 6). Among Title IV aid recipients who weredependent on their parents for financial support, 21 percent had incomes less than$20,000 (table 6). Three of every eight independent undergraduates (38 percent) whoreceived Title IV aid had family incomes less than $10,000 (table 7).
Among students enrolled full time for the full year at one institution, about 30 percentreceived a federal Pell grant, averaging $2,281 (table 8, 9).
Nearly one of every four undergraduates (23 percent) received a federally subsidizedStafford loan, averaging about $3,214 (table 8, 9).
Among the Title IV loan recipients enrolled in private not-for-profit, doctorate-grantinginstitutions, the average loan amount was $5,161. At private not-for-profit non-doctorate-granting 4-year institutions, the average received was $5,095 (table 9).
Among the Title IV loan recipients enrolled in public doctorate-granting institutions, theaverage student loan amount was $4,743. At public non-doctorate-granting 4-yearinstitutions, the average received was $4,225 (table 9).
2
9

Fifty-four percent of students enrolled in private for-profit less-than-2-year institutionsreceived a Title IV loan; the average received was $4,878 (table 8, 9).
Among full-time, full-year students, about 39 percent at public 2-year, 56 percent ofthose at public 4-year institutions and 67 percent of those at private not-for-profit 4-yearinstitutions received some Title IV financial aid (table 10).
Among aided undergraduates, 40 percent received grants only; 1.3 percent receivedloans only; 26 percent received grants and loans; 8 percent received grants, loans,and work-study; and the remaining 13 percent received other combinations of aid(table 12B).
Among the 2.7 million graduate and first-professional students (includingfull-time and part-time students) enrolled during 1999-2000:
About six of every ten graduate/first-professional students received some financial aidaveraging $13,255. Eight of every 10 full-time/full-year students (82 percent)received some type of financial aid, averaging almost $19,600. First-professionalstudents received an average of about $21,500 (table 13, 14).
Overall, 29 percent of graduate and first-professional students received Staffordloans, averaging nearly $12,850. Average amounts borrowed varied considerably bydegree program. For example, about 73 percent of first-professional students tookout loans, compared to 26 percent for master's students and 21 percent for doctoralstudents (table 13, 14).
Overall, 27 percent received some institutional aid, averaging about $9,840; but thisvaried considerably depending on the type of program. For example, 22 percent ofstudents in master's degree programs compared to 58 percent of students in doctoraldegree programs received some institutional aid (table 13, 14).
About one in four master's degree students received employer aid, averaging about$3,840. About 11 percent of doctoral students and 5 percent of first-professionalstudents received employer aid (table 13, 14).
3 1 0

REPORTS IN PROGRESS
Additional information on NPSAS will be published in future reports, including the following:
Methodology Report for the National Postsecondary Student Aid Study: 1999-2000Describes the sampling, student eligibility, data collection procedures, variables in the DataAnalysis System, weighting, and variance estimation procedures for the study.
Bias Analysis Report for the National Postsecondary Student Aid Study: 1999-2000Describes the methods used to analyze and reduce the bias in survey estimates due to institutionand student nonresponse, and contains tables displaying estimates of bias before and afterweighting for selected variables.
Profile of Undergraduates in U.S. Postsecondary Education Institutions: 1999-2000Describes the characteristics of undergraduates enrolled during 1999-2000, including age,race/ethnicity, gender, income, financial aid receipt, community service, veteran status, andmore. Includes an essay on the diversity of undergraduate students.
Student financing of Undergraduate Education: 1999-2000Focuses on how undergraduate students enrolled during 1999-2000 financed theireducation, with detailed tables on the distribution and average amounts of grants, loans, andwork-study funds received by students from federal, state, institutional, and private sources.These are shown by selected student characteristics, such as age, gender, race/ethnicity,income, and attendance status for the various types of institutions. Information includestuition, total student budgets, and the net price of attendance by type of institution. Includesan essay on students who borrow at the federal loan limits.
Student Financing of Graduate and First-Professional Education: 1999-2000Describes the characteristics of graduate and first-professional students enrolled during1999-2000, including age, race, gender, income, financial aid receipt, community service,veteran status, and more. Also describes those graduate and first-professional students whoreceived financial aid, including grants, loans and work-study from federal, state,institutional, or other sources, by selected student characteristics. Includes an essay ongraduate students with assistantships.
114

TABLES
5 12

Table 1.-Percentage of undergraduates receiving selected types of aid: 1999-2000
Any aid Grants Loans Work-study Other
Total 55.3 44.4 28.8 5.4 6.9
Dependency and 1998 income levelDependent 58.9 46.1 34.9 8.9 7.8
Less than $20,000 77.4 75.0 35.8 12.2 5.1
$20,000-39,999 67.6 61.1 38.8 11.9 6.6$40,000-59,999 57.5 42.7 38.1 9.9 8.3$60,000-79,999 53.8 34.7 36.6 8.0 9.4$80,000-99,999 52.3 33.2 32.6 5.5 8.8$100,000 or more 44.4 28.7 24.4 4.2 8.3
Independent 51.9 42.7 23.0 2.1 6.1
Less than $10,000 74.6 70.0 40.7 6.2 6.6$10,000-19,999 62.2 51.5 32.5 2.5 6.9$20,000-29,999 52.7 41.8 22.1 1.3 6.9$30,000-49,999 41.8 31.3 15.3 0.9 6.5$50,000 or more 33.6 24.2 8.4 0.2 4.1
Tuition and fees$1-$999 38.3 31.4 11.0 1.1 4.7$1,000-1,999 56.4 45.7 23.3 3.4 5.8$2,000-2,999 66.8 52.4 37.3 6.2 6.3
$3,000-3,999 70.5 53.5 45.4 7.6 8.0$4,000-4,999 69.9 52.1 48.2 8.0 8.8$5,000-7,499 77.3 59.0 54.7 7.2 9.1
$7,500 or more 80.5 66.5 61.9 18.8 14.0
Institution typePublic
Less-than-2-year 43.8 34.1 6.3 1.4 12.6
2-year 37.7 32.6 7.4 1.5 4.34-year 62.0 46.3 39.6 6.4 7.0
Non-doctorate-granting 62.4 48.1 37.6 6.8 6.1
Doctorate-granting 61.9 45.3 40.7 6.2 7.5Private not-for-profit
Less-than-4-year 75.1 66.5 37.0 9.4 11.1
4-year 75.9 66.4 49.8 17.6 10.7Non-doctorate-granting 78.4 68.2 49.7 16.6 11.0
Doctorate-granting 72.5 63.5 49.8 19.2 10.3
Private for-profitLess-than-2-year 85.9 66.3 55.7 0.6 11.9
2-year or more 84.3 55.4 73.4 1.2 13.5
Attendance patternFull-time/full-year 72.1 58.3 45.1 11.6 9.5Full-time/part-year 62.1 49.2 32.8 3.6 8.2
Part-time/full-year 48.9 39.5 20.5 2.7 4.5Part-time/part-year 29.7 24.4 6.7 0.5 3.9
NOTE: "Any aid" includes all types of financial aid except aid from parents, friends, and relatives. "Other" aid includes PLUS loans toparents, veteran's benefits, and any vocational rehabilitation aid. Students can receive more than one type of aid. Estimates bytuition and fees categories, institution type, and attendance pattern exclude students who attended multiple institutions.
SOURCE: U.S. Department of Education, National Center for Education Statistics, 1999-2000 National Postsecondary StudentAid Study (NPSAS:2000).
6
BEST COPY MUM 13
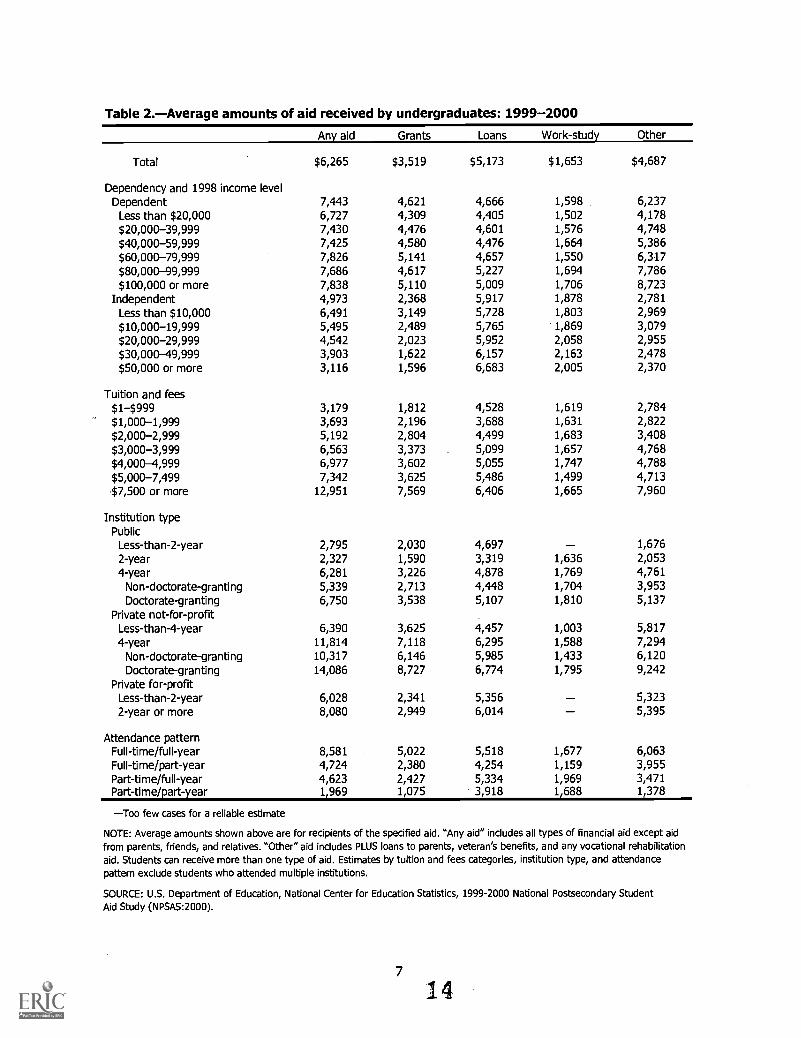
Table 2.-Average amounts of aid received by undergraduates: 1999-2000
Any aid Grants Loans Work-study Other
Total $6,265 $3,519 $5,173 $1,653 $4,687
Dependency and 1998 income levelDependent 7,443 4,621 4,666 1,598. 6,237
Less than $20,000 6,727 4,309 4,405 1,502 4,178$20,000-39,999 7,430 4,476 4,601 1,576 4,748$40,000-59,999 7,425 4,580 4,476 1,664 5,386$60,000-79,999 7,826 5,141 4,657 1,550 6,317$80,000-99,999 7,686 4,617 5,227 1,694 7,786$100,000 or more 7,838 5,110 5,009 1,706 8,723
Independent 4,973 2,368 5,917 1,878 2,781Less than $10,000 6,491 3,149 5,728 1,803 2,969$10,000-19,999 5,495 2,489 5,765 1,869 3,079$20,000-29,999 4,542 2,023 5,952 2,058 2,955$30,000-49,999 3,903 1,622 6,157 2,163 2,478$50,000 or more 3,116 1,596 6,683 2,005 2,370
Tuition and fees$1-$999 3,179 1,812 4,528 1,619 2,784$1,000-1,999 3,693 2,196 3,688 1,631 2,822$2,000-2,999 5,192 2,804 4,499 1,683 3,408$3,000-3,999 6,563 3,373 5,099 1,657 4,768$4,000-4,999 6,977 3,602 5,055 1,747 4,788$5,000-7,499 7,342 3,625 5,486 1,499 4,713$7,500 or more 12,951 7,569 6,406 1,665 7,960
Institution typePublic
Less-than-2-year 2,795 2,030 4,697 1,6762-year 2,327 1,590 3,319 1,636 2,0534-year 6,281 3,226 4,878 1,769 4,761
Non-doctorate-granting 5,339 2,713 4,448 1,704 3,953Doctorate-granting 6,750 3,538 5,107 1,810 5,137
Private not-for-profitLess-than-4-year 6,390 3,625 4,457 1,003 5,8174-year 11,814 7,118 6,295 1,588 7,294
Non-doctorate-granting 10,317 6,146 5,985 1,433 6,120Doctorate-granting 14,086 8,727 6,774 1,795 9,242
Private for-profitLess-than-2-year 6,028 2,341 5,356 - 5,3232-year or more 8,080 2,949 6,014 - 5,395
Attendance patternFull-time/full-year 8,581 5,022 5,518 1,677 6,063Full-time/part-year 4,724 2,380 4,254 1,159 3,955Part-time/full-year 4,623 2,427 5,334 1,969 3,471Part-time/part-year 1,969 1,075 3,918 1,688 1,378
-Too few cases for a reliable estimate
NOTE: Average amounts shown above are for recipients of the specified aid. "Any aid" includes all types of financial aid except aidfrom parents, friends, and relatives. "Other" aid includes PLUS loans to parents, veteran's benefits, and any vocational rehabilitationaid. Students can receive more than one type of aid. Estimates by tuition and fees categories, institution type, and attendancepattern exclude students who attended multiple institutions.
SOURCE: U.S. Department of Education, National Center for Education Statistics, 1999-2000 National Postsecondary StudentAid Study (NPSAS:2000).
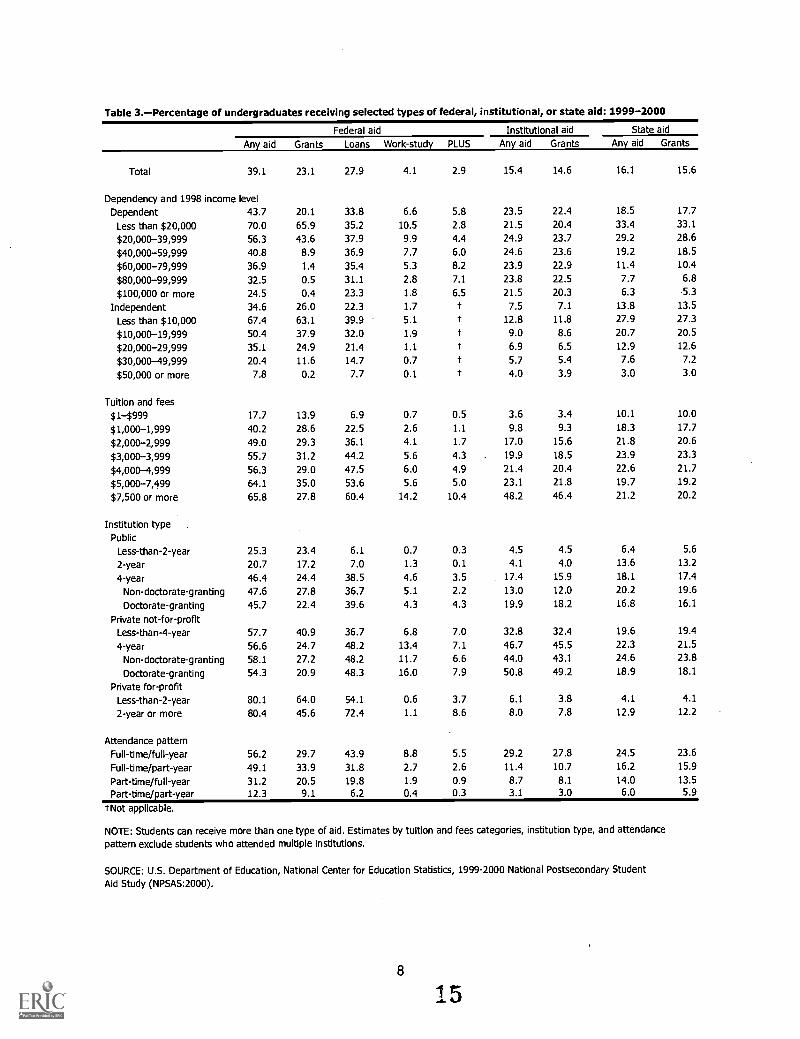
Table 3.-Percentage of undergraduates receiving selected types of federal, institutional, or state aid: 1999-2000
Federal aid Institutional aid State aid
Any aid Grants Loans Work-study PLUS Any aid Grants Any aid Grants
Total 39.1 23.1 27.9 4.1 2.9 15.4 14.6 16.1 15.6
Dependency and 1998 income levelDependent 43.7 20.1 33.8 6.6 5.8 23.5 22.4 18.5 17.7
Less than $20,000 70.0 65.9 35.2 10.5 2.8 21.5 20.4 33.4 33.1
$20,000-39,999 56.3 43.6 37.9 9.9 4.4 24.9 23.7 29.2 28.6
$40,000-59,999 40.8 8.9 36.9 7.7 6.0 24.6 23.6 19.2 18.5
$60,000-79,999 36.9 1.4 35.4 5.3 8.2 23.9 22.9 11.4 10.4
$80,000-99,999 32.5 0.5 31.1 2.8 7.1 23.8 22.5 7.7 6.8
$100,000 or more 24.5 0.4 23.3 1.8 6.5 21.5 20.3 6.3 5.3
Independent 34.6 26.0 22.3 1.7 t 7.5 7.1 13.8 13.5
Less than $10,000 67.4 63.1 39.9 5.1 t 12.8 11.8 27.9 27.3
$10,000-19,999 50.4 37.9 32.0 1.9 t 9.0 8.6 20.7 20.5
$20,000-29,999 35.1 24.9 21.4 1.1 t 6.9 6.5 12.9 12.6
$30,000-49,999 20.4 11.6 14.7 0.7 t 5.7 5.4 7.6 7.2
$50,000 or more 7.8 0.2 7.7 0.1 t 4.0 3.9 3.0 3.0
Tuition and fees$1-$999 17.7 13.9 6.9 0.7 0.5 3.6 3.4 10.1 10.0
$1,000-1,999 40.2 28.6 22.5 2.6 1.1 9.8 9.3 18.3 17.7
$2,000-2,999 49.0 29.3 36.1 4.1 1.7 17.0 15.6 21.8 20.6
$3,000-3,999 55.7 31.2 44.2 5.6 4.3 19.9 18.5 23.9 23.3
$4,000-4,999 56.3 29.0 47.5 6.0 4.9 21.4 20.4 22.6 21.7
$5,000-7,499 64.1 35.0 53.6 5.6 5.0 23.1 21.8 19.7 19.2
$7,500 or more 65.8 27.8 60.4 14.2 10.4 48.2 46.4 21.2 20.2
Institution typePublic
Less-than-2-year 25.3 23.4 6.1 0.7 0.3 4.5 4.5 6.4 5.6
2-year 20.7 17.2 7.0 1.3 0.1 4.1 4.0 13.6 13.2
4-year 46.4 24.4 38.5 4.6 3.5 17.4 15.9 18.1 17.4
Non-doctorate-granting 47.6 27.8 36.7 5.1 2.2 13.0 12.0 20.2 19.6
Doctorate-granting 45.7 22.4 39.6 4.3 4.3 19.9 18.2 16.8 16.1
Private not-for-profitLess-than-4-year 57.7 40.9 36.7 6.8 7.0 32.8 32.4 19.6 19.4
4-year 56.6 24.7 48.2 13.4 7.1 46.7 45.5 22.3 21.5
Non-doctorate-granting 58.1 27.2 48.2 11.7 6.6 44.0 43.1 24.6 23.8
Doctorate-granting 54.3 20.9 48.3 16.0 7.9 50.8 49.2 18.9 18.1
Private for-profitLess-than-2-year 80.1 64.0 54.1 0.6 3.7 6.1 3.8 4.1 4.1
2-year or more 80.4 45.6 72.4 1.1 8.6 8.0 7.8 12.9 12.2
Attendance patternFull-time/full-year 56.2 29.7 43.9 8.8 5.5 29.2 27.8 24.5 23.6
Full-time/part-year 49.1 33.9 31.8 2.7 2.6 11.4 10.7 16.2 15.9
Part-time/full-year 31.2 20.5 19.8 1.9 0.9 8.7 8.1 14.0 13.5
Part-time/part-year 12.3 9.1 6.2 0.4 0.3 3.1 3.0 6.0 5.9
tNot applicable.
NOTE: Students can receive more than one type of aid. Estimates by tuition and fees categories, institution type, and attendancepattern exclude students who attended multiple institutions.
SOURCE: U.S. Department of Education, National Center for Education Statistics, 1999-2000 National Postsecondary StudentAid Study (NPSAS:2000).
8
15

Table 4.-Average amounts of selected types of federal, institutional, or state aid received by undergraduates: 1999-2000
Federal aid Institutional aid State aid
Any aid Grants Loans Work-study PLUS Any aid Grants Any aid Grants
Total $5,230 $2,064 $4,643 $1,534 $7,127 $4,203 $4,165 $1,652 $1,546
Dependency and 1998 income levelDependent 5,243 2,133 3,999 1,470 7,129 4,896 4,853 1,989 1,849
Less than $20,000 4,883 2,591 4,015 1,410 5,345 3,796 3,773 1,796 1,752
$20,000-39,999 4,925 1,920 4,095 1,480 5,367 4,501 4,463 2,036 1,942
$40,000-59,999 5,017 1,188 3,950 1,505 6,199 5,165 5,128 2,004 1,862
$60,000-79,999 5,467 1,400 3,889 1,464 6,688 5,508 5,469 2,091 1,844
$80,000-99,999 5,838 - 4,002 1,522 8,538 4,914 4,885 1,958 1,654
$100,000 or more 6,633 4,058 1,449 9,981 5,238 5,141 2,320 1,820
Independent 5,214 2,013 5,584 1,774 t 2,105 2,055 1,218 1,163
Less than $10,000 5,507 2,278 5,444 1,662 t 2,454 2,436 1,355 1,303
$10,000-19,999 5,039 1,994 5,470 1,655 t 2,125 2,041 1,173 1,112
$20,000-29,999 4,683 1,762 5,523 2,093 t 1,963 1,914 1,077 1,031
$30,000-49,999 4,947 1,188 5,779 2,388 t 1,805 1,772 1,108 1,033
$50,000 or more 6,290 - 6,341 - t 1,715 1,667 1,097 1,058
Tuition and fees$1-$999 2,875 1,485 3,759 1,634 6,290 1,152 1,132 588 582
$1,000-1,999 3,533 1,914 3,520 1,559 4,019 1,176 1,141 1,144 1,091
$2,000-2,999 4,768 2,226 4,251 1,603 4,680 1,844 1,792 1,629 1,475
$3,000-3,999 5,656 2,393 4,675 1,434 5,956 2,243 2,141 1,824 1,715
$4,000-4,999 5,834 2,286 4,725 1,637 5,721 2,259 2,235 2,090 1,974
$5,000-7,499 5,955 2,217 5,029 1,381 5,318 2,954 2,913 2,036 1,950
$7,500 or more 7,634 2,527 5,290 1,543 8,663 7,015 6,918 3,055 2,811
Institution typePublic
Less-than-2-year 2,824 1,760 4,613 - 667 667 972 721
2-year 2,609 1,741 3,052 1,589 - 846 829 826 768
4-year 5,574 2,197 4,568 1,636 6,153 2,590 2,573 1,867 1,773
Non-doctorate-granting 4,912 2,131 4,226 1,600 5,119 1,926 1,873 1,618 1,513
Doctorate-granting 5,972 2,245 4,751 1,660 6,461 2,839 2,840 2,039 1,955
Private not-for-profitLess-than-4-year 4,780 2,091 3,943 963 5,625 2,690 2,615 2,148 2,125
4-year 6,869 2,398 5,132 1,464 8,840 6,757 6,605 2,661 2,460
Non-doctorate-granting 6,415 2,285 5,096 1,270 7,627 5,863 5,722 2,454 2,292
Doctorate-granting 7,621 2,628 5,187 1,683 10,420 7,957 7,804 3,079 2,800
Private for-profitLess-than-2-year 5,284 2,177 4,878 5,303 1,252 740 538 526
2-year or more 6,976 2,154 5,558 - 6,597 1,442 1,306 2,697 2,427
Attendance patternFull-time/full-year 6,092 2,508 4,832 1,561 7,589 5,009 4,957 2,077 1,935
Full-time/part-year 4,001 1,677 3,827 1,102 5,686 2,588 2,572 1,181 1,140
Part-time/full-year 4,762 1,901 5,037 1,839 6,579 2,567 2,558 1,216 1,124
Part-time/part-year 2,810 1,088 3,701 1,412 4,515 1,160 1,086 699 672
-Too few cases for a reliable estimate.tNot applicable.
NOTE: Average amounts shown above are for recipients of the specified aid. Students can receive more than one type of aid. Estimates bytuition and fees categories, institution type, and attendance pattern exclude students who attended multiple institutions.
SOURCE: U.S. Department of Education, National Center for Education Statistics, 1999-2000 National Postsecondary StudentAid Study (NPSAS:2000).
BEST COPY AVAALABLE9 16

Table 5.-Percentage of undergraduates at specified dependency and income levels: 1999-2000
DependentLess than $20,000- $40,000- $60,000- $80,000- $100,000$20,000 39,999 59,999 79,999 99,999 or more
Total 6.5 10.2 10.6 8.4 5.5 7.9
Tuition and fees$1-$999 4.7 7.3 6.6 5.3 3.2 4.2$1,000-1,999 8.1 10.3 11.7 8.2 4.8 6.0
$2,000-2,999 7.7 12.2 14.4 10.2 6.9 8.9
$3,000-3,999 9.1 13.6 13.9 10.9 8.4 11.4
$4,000-4,999 7.7 13.4 13.5 13.1 8.4 12.3
$5,000-7,499 7.9 11.0 11.0 9.7 5.8 7.5
$7,500 or more 6.6 13.2 14.9 13.2 9.1 16.7
Institution typePublic
Less-than-2-year 2.5 5.9 5.3 4.2 1.8 1.3
2-year 5.6 8.3 8.5 6.2 3.3 4.44-year 7.1 12.4 13.4 10.9 7.7 10.9
Non-doctorate-granting 7.6 12.2 12.7 9.6 6.5 7.8
Doctorate-granting 6.8 12.5 13.9 11.7 8.4 12.7
Private not-for-profitLess-than-4-year 10.7 11.6 11.9 8.6 4.1 5.8
4-year 7.1 11.2 12.8 11.1 7.4 13.6
Non-doctorate-granting 7.0 11.2 12.4 10.3 6.2 9.7
Doctorate-granting 7.2 11.3 13.5 12.3 9.4 19.8
Private for-profitLess-than-2-year 9.2 5.7 3.3 1.7 0.7 0.6
2-year or more 7.3 7.9 5.9 4.7 2.7 2.4
Attendance patternFull-time/full-year 9.1 14.5 16.0 12.9 8.4 13.1
Full-time/part-year 8.3 10.6 9.9 7.9 4.8 6.6
Part-time/full-year 4.5 7.4 7.6 6.3 3.9 4.6
Part-time/part-year 3.4 5.6 5.8 3.9 2.5 3.5
Total aidDid not receive any financial aid 3.3 7.4 10.1 8.7 5.8 9.9Aid recipient 9.1 12.5 11.0 8.2 5.2 6.4
Recipients of various federal aidPell grant recipients 18.8 19.3 3.8 0.3Stafford loan recipients 8.1 13.7 14.0 10.7 6.1 6.7
Stafford subsidized loan recipients 9.5 16.0 14.8 8.7 3.5 2.6
Stafford unsubsidized loan recipients 3.3 6.0 9.7 11.4 8.3 10.0
Title IV aid recipients 11.7 14.7 11.1 8.0 4.5 4.9
Title IV loan (except PLUS) recipients 8.2 13.8 14.0 10.7 6.1 6.6Perkins loan recipients 14.3 26.5 18.6 7.5 3.1 2.3
10
1 7

IndependentLess than$10,000
$10,000-19,999
$20,000-29,999
$30,000-49,999
$50,000or more
10.1 9.7 8.1 10.7 12.2 Total
Tuition and fees9.3 11.7 11.3 16.3 20.1 $1-$999
10.2 11.2 8.8 10.0 10.9 $1,000-1,99910.4 9.3 5.9 7.2 6.8 $2,000-2,99910.2 7.5 5.2 5.1 4.8 $3,000-3,9999.8 7.6 4.6 4.8 4.9 $4,000-4,999
13.8 10.2 6.5 8.1 8.6 $5,000-7,4998.7 6.3 3.9 4.2 3.3 $7,500 or more
Institution typePublic
16.5 16.7 14.6 16.0 15.1 Less-than-2-year
9.4 11.0 10.7 15.2 17.6 2-year
9.8 8.0 5.6 6.9 7.2 4-year
10.0 9.1 6.8 9.2 8.7 Non-doctorate-granting
9.7 7.4 5.0 5.7 6.3 Doctorate-grantingPrivate not-for-profit
17.7 11.4 6.8 6.9 4.6 Less-than-4-year
7.3 6.8 5.7 6.9 10.1 4-year7.9 7.7 7.1 8.4 12.3 Non-doctorate-granting
6.5 5.5 3.5 4.6 6.6 Doctorate-grantingPrivate for-profit
34.5 18.7 10.6 8.7 6.3 Less-than-2-year
18.5 17.9 11.2 12.0 9.6 2-year or more
Attendance pattern
9.1 7.3 3.7 3.5 2.5 Full-time/full-year19.0 12.6 7.9 7.0 5.4 Full-time/part-year8.9 11.4 11.0 15.1 19.3 Part-time/full-year8.0 10.5 12.6 19.9 24.4 Part-time/part-year
Total aid
5.6 8.4 8.6 14.1 18.2 Did not receive any financial aid
13.2 11.1 7.7 8.2 7.5 Aid recipient
Recipients of various federal aid
27.2 16.4 8.8 5.4 0.0 Pell grant recipients
13.9 11.4 6.2 5.6 3.4 Stafford loan recipients
16.2 13.2 6.9 6.0 2.6 Stafford subsidized loan recipients
15.9 14.3 8.2 7.6 5.4 Stafford unsubsidized loan recipients17.0 12.8 7.3 5.6 2.4 Title IV aid recipients14.1 11.4 6.2 5.6 3.3 Title IV loan (except PLUS) recipients14.3 7.4 3.0 2.9 0.2 Perkins loan recipients
-Too few cases for a reliable estimate.
NOTE: This table was designed to span facing pages. AllAmong all undergraduates, 6.5 percent of students wereEstimates by tuition and fees categories, institution type,
SOURCE: U.S. Department of Education, National CenterAid Study (NPSAS:2000).
11 columns sum across; but may not total 100 percent due to rounding.dependent and their parents' income in 1998 was less than $20,000.and attendance pattern exclude students who attended multiple institutions.
for Education Statistics, 1999-2000 National Postsecondary Student
11
18

Table 6.-Percentage of dependent undergraduates at specified income levels: 1999-2000
Less than $20,000- $40,000- $60,000- $80,000- $100,000
$20,000 39,999 59,999 79,999 99,999 or more
Total 13.3 20.8 21.6 17.2 11.1 16.2
Tuition and fees$1-$999 15.1 23.4 21.2 16.8 10.2 13.3
$1,000-1,999 16.4 21.0 23.8 16.8 9.7 12.3
$2,000-2,999 12.8 20.2 23.9 16.9 11.5 14.7
$3,000-3,999 13.5 20.3 20.7 16.2 12.4 16.9
$4,000-4,999 11.2 19.6 19.8 19.1 12.2 18.0
$5,000-7,499 14.9 20.8 20.8 18.3 11.0 14.3
$7,500 or more 9.0 17.9 20.2 17.9 12.3 22.7
Institution typePublic
Less-than-2-year 11.9 28.0 25.3 20.0 8.5 6.2
2-year 15.4 22.9 23.3 17.1 9.2 12.0
4-year 11.3 19.8 21.5 17.5 12.4 17.5
Non-doctorate-granting 13.5 21.6 22.5 17.0 11.6 13.9
Doctorate-granting 10.3 18.9 21.1 17.7 12.7 19.3
Private not-for-profitLess-than-4-year 20.3 22.1 22.7 16.3 7.7 11.0
4-year 11.2 17.8 20.2 17.5 11.7 21.6
Non-doctorate-granting 12.4 19.7 21.8 18.2 10.9 17.0
Doctorate-granting 9.8 15.5 18.3 16.7 12.8 27.0
Private for-profitLess-than-2-year 43.4 26.8 15.6 8.1 3.2 2.8
2-year or more 23.7 25.6 19.1 15.1 8.8 7.7
Attendance patternFull-time/full-year 12.3 19.7 21.6 17.4 11.3 17.7
Full-time/part-year 17.2 22.0 20.6 16.5 9.9 13.8
Part-time/full-year 13.1 21.7 22.1 18.2 11.4 13.5
Part-time/part-year 13.8 22.5 23.3 15.8 10.3 14.3
Total aidDid not receive any financial aid 7.3 16.4 22.3 19.3 12.9 21.8
Aid recipient 17.4 23.8 21.1 15.7 9.8 12.2
Recipients of various federal aidPell grant recipients 44.6 45.8 8.9 0.7 -Stafford loan recipients 13.7 23.1 23.6 18.1 10.3 11.2
Stafford subsidized loan recipients 17.2 29.0 26.9 15.8 6.3 4.7
Stafford unsubsidized loan recipients 6.8 12.2 19.9 23.5 17.1 20.5
Title IV aid recipients 21.3 26.8 20.2 14.5 8.2 9.0
Title IV loan (except PLUS) recipients 13.8 23.3 23.6 18.0 10.2 11.1
Perkins loan recipients 19.8 36.7 25.7 10.4 4.3 3.1
-Too few cases for a reliable estimate.
NOTE: Table based on dependent undergraduates only. Columns sum across, but may not total 100 percent due to rounding.Estimates by tuition and fees categories, institution type, and attendance pattern exclude students who attended multipleinstitutions.
SOURCE: U.S. Department of Education, National Center for Education Statistics, 1999-2000 National Postsecondary Student
Aid Study (NPSAS:2000).
12
19

Table 7.-Percentage of independent undergraduates at specified income levels: 1999-2000
Less than$10,000
$10,000-19,999
$20,000-29,999
$30,000-49,999
$50,000or more
Total 19.3 19.4 16.0 21.2 24.1
Tuition and fees$1-$999 13.6 17.0 16.4 23.7 29.2
$1,000-1,999 20.0 22.0 17.2 19.5 21.3
$2,000-2,999 26.3 23.4 15.0 18.2 17.0
$3,000-3,999 31.0 23.0 15.9 15.6 14.6
$4,000-4,999 30.8 23.9 14.6 15.1 15.6
$5,000-7,499 29.2 21.6 13.8 17.2 18.2
$7,500 or more 33.0 24.0 14.9 15.7 12.5
Institution typePublic
Less-than-2-year 22.9 21.5 20.3 18.5 16.9
2-year 14.5 18.2 16.9 23.6 26.7
4-year 24.7 21.0 14.4 19.0 20.9
Non-doctorate-granting 21.7 20.6 15.6 21.2 20.9
Doctorate-granting 27.0 21.3 13.5 17.4 20.8
Private not-for-profitLess-than-4-year 35.1 24.9 12.8 18.1 9.2
4-year 19.0 17.5 15.2 19.5 28.8
Non-doctorate-granting 17.9 17.3 15.5 19.4 29.9
Doctorate-granting 21.6 18.0 14.6 19.9 25.9
Private for-profitLess-than-2-year 43.3 24.4 13.6 11.8 7.0
2-year or more 26.2 25.5 16.7 17.4 14.3
Attendance patternFull-time/full-year 32.6 26.1 14.7 15.0 11.7
Full-time/part-year 32.5 23.3 15.8 16.3 12.1
Part-time/full-year 13.8 17.5 17.7 23.3 27.7
Part-time/part-year 11.6 16.2 15.5 24.8 32.0
Total aidDid not receive financial aid 10.2 15.3 15.7 25.6 33.2
Financial aid recipient 27.8 23.3 16.2 17.1 15.6
Recipients of various federal aidPell grant recipients 47.0 28.3 15.3 9.4 0.0
Stafford loan recipients 34.3 28.0 15.4 14.0 8.4
Stafford subsidized loan recipients 35.9 29.3 15.5 13.4 5.8
Stafford unsubsidized loan recipients 30.9 27.6 16.0 14.9 10.6
Title IV aid recipients 37.6 28.3 16.2 12.5 5.4
Title IV loan (except PLUS) recipients 34.6 27.9 15.3 14.0 8.3Perkins loan recipients 51.5 25.9 10.9 10.9 0.8
NOTE: Table based on independent undergraduates only. Columns sum across, but may not total 100 percent due to rounding.Estimates by tuition and fees categories, institution type, and attendance pattern exclude students who attended multiple institutions.
SOURCE: U.S. Department of Education, National Center for Education Statistics, 1999-2000 National Postsecondary Student
Aid Study (NPSAS:2000).
MST COPY AM BLE13
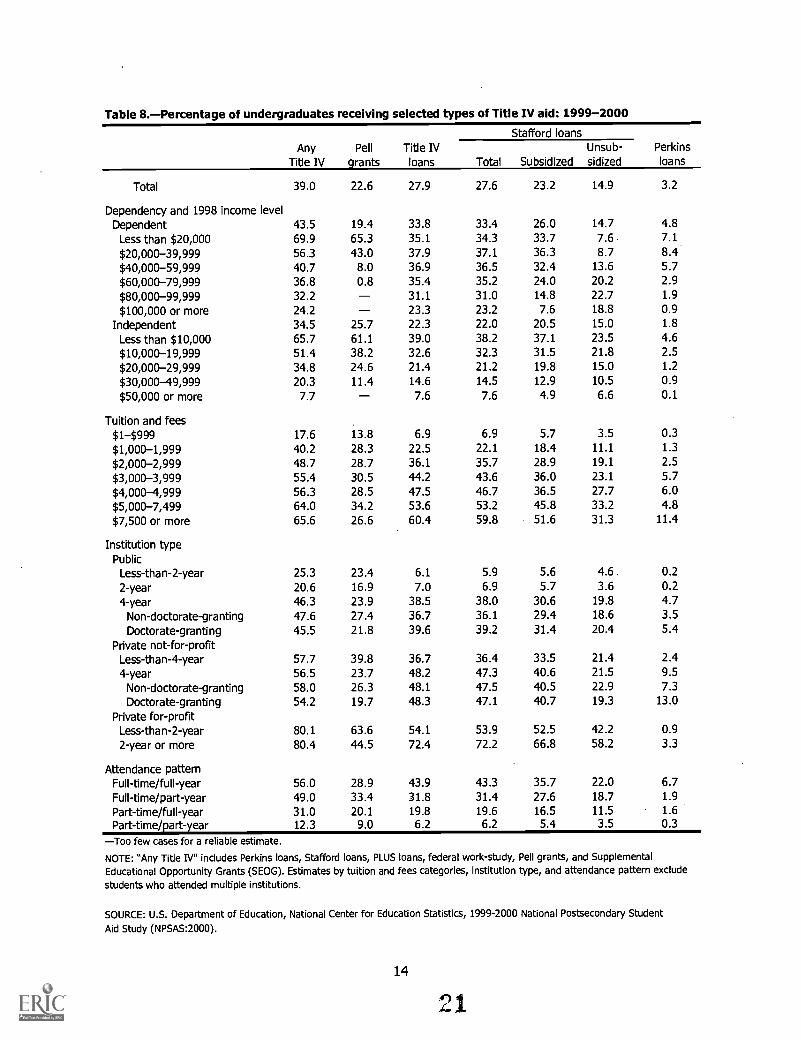
Table 8.-Percentage of undergraduates receiving selected types of Title IV aid: 1999-2000
AnyTitle IV
Pell
grantsTitle IVloans
Stafford loansPerkinsloansTotal Subsidized
Unsub-sidized
Total 39.0 22.6 27.9 27.6 23.2 14.9 3.2
Dependency and 1998 income levelDependent 43.5 19.4 33.8 33.4 26.0 14.7 4.8
Less than $20,000 69.9 65.3 35.1 34.3 33.7 7.6 7.1
$20,000-39,999 56.3 43.0 37.9 37.1 36.3 8.7 8.4$40,000-59,999 40.7 8.0 36.9 36.5 32.4 13.6 5.7
$60,000-79,999 36.8 0.8 35.4 35.2 24.0 20.2 2.9
$80,000-99,999 32.2 31.1 31.0 14.8 22.7 1.9
$100,000 or more 24.2 23.3 23.2 7.6 18.8 0.9Independent 34.5 25.7 22.3 22.0 20.5 15.0 1.8
Less than $10,000 65.7 61.1 39.0 38.2 37.1 23.5 4.6$10,000-19,999 51.4 38.2 32.6 32.3 31.5 21.8 2.5$20,000-29,999 34.8 24.6 21.4 21.2 19.8 15.0 1.2
$30,000-49,999 20.3 11.4 14.6 14.5 12.9 10.5 0.9$50,000 or more 7.7 7.6 7.6 4.9 6.6 0.1
Tuition and fees$1-$999 17.6 13.8 6.9 6.9 5.7 3.5 0.3
$1,000-1,999 40.2 28.3 22.5 22.1 18.4 11.1 1.3
$2,000-2,999 48.7 28.7 36.1 35.7 28.9 19.1 2.5
$3,000-3,999 55.4 30.5 44.2 43.6 36.0 23.1 5.7
$4,000-4,999 56.3 28.5 47.5 46.7 36.5 27.7 6.0
$5,000-7,499 64.0 34.2 53.6 53.2 45.8 33.2 4.8$7,500 or more 65.6 26.6 60.4 59.8 51.6 31.3 11.4
Institution typePublic
Less-than-2-year 25.3 23.4 6.1 5.9 5.6 4.6. 0.2
2-year 20.6 16.9 7.0 6.9 5.7 3.6 0.2
4-year 46.3 23.9 38.5 38.0 30.6 19.8 4.7
Non-doctorate-granting 47.6 27.4 36.7 36.1 29.4 18.6 3.5
Doctorate-granting 45.5 21.8 39.6 39.2 31.4 20.4 5.4Private not-for-profit
Less-than-4-year 57.7 39.8 36.7 36.4 33.5 21.4 2.4
4-year 56.5 23.7 48.2 47.3 40.6 21.5 9.5Non-doctorate-granting 58.0 26.3 48.1 47.5 40.5 22.9 7.3
Doctorate-granting 54.2 19.7 48.3 47.1 40.7 19.3 13.0
Private for-profitLess-than-2-year 80.1 63.6 54.1 53.9 52.5 42.2 0.92-year or more 80.4 44.5 72.4 72.2 66.8 58.2 3.3
Attendance patternFull-time/full-year 56.0 28.9 43.9 43.3 35.7 22.0 6.7Full-time/part-year 49.0 33.4 31.8 31.4 27.6 18.7 1.9
Part-time/full-year 31.0 20.1 19.8 19.6 16.5 11.5 1.6Part-time/part-year 12.3 9.0 6.2 6.2 5.4 3.5 0.3
-Too few cases for a reliable estimate.
NOTE: "Any Title IV" includes Perkins loans, Stafford loans,Educational Opportunity Grants (SEOG). Estimates by tuitionstudents who attended multiple institutions.
PLUS loans, federal work-study, Pell grants, and Supplementaland fees categories, institution type, and attendance pattern exclude
SOURCE: U.S. Department of Education, National Center for
Aid Study (NPSAS:2000).
Education Statistics, 1999-2000 National Postsecondary Student
14

Table 9.-Average amounts of Title IV aid received by undergraduates: 1999-2000
AnyTitle IV
Pell
grantsTitle IVloans
Stafford loansPerkinsloansTotal Subsidized
Unsub-sidized
Total $5,228 $1,910 $4,637 $4,492 $3,214 $3,328 $1,695
Dependency and 1998 income levelDependent 5,245 1,940 3,995 3,800 3,145 3,060 1,703
Less than $20,000 4,875 2,384 4,011 3,754 3,178 2,878 1,713
$20,000-39,999 4,916 1,701 4,086 3,786 3,283 2,472 1,701
$40,000-59,999 5,020 1,009 3,950 3,722 3,131 2,542 1,732
$60,000-79,999 5,465 1,173 3,885 3,771 2,979 3,035 1,608
$80,000-99,999 5,877 4,001 3,928 2,959 3,446 1,433
$100,000 or more 6,676 4,051 3,979 3,056 3,681 2,101
Independent 5,208 1,889 5,577 5,504 3,299 3,581 1,676
Less than $10,000 5,497 2,116 5,432 5,329 3,417 3,254 1,771
$10,000-19,999 5,032 1,880 5,475 5,398 3,296 3,247 1,549
$20,000-29,999 4,682 1,684 5,499 5,435 3,145 3,526 1,734
$30,000-49,999 4,922 1,099 5,766 5,716 3,227 3,922 1,438
$50,000 or more 6,346 6,363 6,354 3,158 5,031
Tuition and fees$1-$999 2,873 1,437 3,757 3,695 2,657 2,933 1,824$1,000-1,999 3,528 1,836 3,518 3,496 2,601 2,666 1,201
$2,000-2,999 4,764 2,088 4,247 4,170 3,126 3,059 1,841
$3,000-3,999 5,671 2,255 4,672 4,533 3,317 3,388 1,598$4,000-4,999 5,821 2,098 4,717 4,584 3,355 3,304 1,638
$5,000-7,499 5,956 2,049 5,025 4,941 3,182 3,526 1,395
$7,500 or more 7,632 2,118 5,281 4,995 3,557 3,677 1,798
Institution typePublic
Less-than-2-year 2,807 1,707 4,613 4,746 2,426 3,1352 -year 2,610 1,673 3,051 3,035 2,191 2,3904 -year 5,572 2,033 4,562 4,419 3,354 3,307 1,655
Non-doctorate-granting 4,906 2,012 4,225 4,145 3,129 3,096 1,572
Doctorate-granting 5,974 2,049 4,743 4,564 3,476 3,417 1,686
Private not-for-profitLess-than-4-year 4,770 1,899 3,943 3,838 2,358 2,852 1,969
4-year 6,862 2,010 5,121 4,853 3,694 3,723 1,776
Non-doctorate-granting 6,412 2,009 5,095 4,898 3,618 3,763 1,689
Doctorate-granting 7,609 2,011 5,161 4,782 3,812 3,650 1,852
Private for-profitLess-than-2-year 5,282 2,112 4,878 4,870 2,361 3,274 1,569
2-year or more 6,974 2,045 5,558 5,517 2,906 3,510 1,352
Attendance patternFull-time/full-year 6,092 2,281 4,824 4,615 3,479 3,441 1,775Full-time/part-year 4,001 1,592 3,825 3,800 2,423 2,802 1,256
Part-time/full-year 4,763 1,775 5,033 4,947 3,343 3,637 1,598Part-time/part-year 2,804 1,057 3,699 3,679 2,435 2,715 1,118
-Too few cases for a reliable estimate.
NOTE: Average amounts shown above are for recipients of the specified aid. "Any Title IV" includes Perkins loans, Stafford loans,PLUS loans, federal work-study, Pell grants, and Supplemental Educational Opportunity Grants (SEOG). Estimates by tuition and feescategories, institution type, and attendance pattern exclude students who attended multiple institutions.
SOURCE: U.S. Department of Education, National Center for Education Statistics, 1999-2000 National Postsecondary StudentAid Study (NPSAS:2000).
15
'9 2

Table 10.-Percentage of full-time/full-year undergraduates receiving selected Title IV aid: 1999-2000
Any
Title IVPell
grantsTitle IVloans
Stafford loansPerkins
loansTotal Subsidized
Unsub-
sidized
Total 56.0 28.9 43.9 43.3 35.7 22.0 6.7
Dependency and 1998 income levelDependent 52.6 21.9 42.7 42.1 32.8 18.3 7.1
Less than $20,000 79.4 74.2 43.6 42.3 41.6 7.9 10.7
$20,000-39,999 69.5 53.1 49.2 48.2 46.9 11.0 12.9
$40,000-59,999 52.0 10.1 47.5 47.1 42.3 16.7 9.0
$60,000-79,999 47.2 0.7 45.8 45.7 31.3 25.6 4.3
$80,000-99,999 40.2 39.2 39.1 19.4 27.7 2.9
$100,000 or more 29.1 - 27.9 27.8 9.1 22.5 1.4
Independent 65.5 48.9 47.4 46.7 44.1 32.6 5.4
Less than $10,000 77.5 72.3 52.9 51.3 50.3 32.4 8.8
$10,000-19,999 70.0 50.4 50.6 50.0 48.6 35.0 4.9
$20,000-29,999 63.7 42.3 44.8 44.6 41.9 34.0 3.8
$30,000-49,999 52.1 26.8 41.8 41.8 37.9 30.9 2.3
$50,000 or more 30.2 30.2 30.1 20.3 26.5 0.4
Tuition and fees$1-$999 34.9 31.4 8.4 8.3 6.9 4.9 0.3
$1,000-1,999 45.9 34.1 22.8 22.4 18.5 10.5 1.3
$2,000-2,999 52.3 30.6 38.1 37.6 29.5 20.1 2.5
$3,000-3,999 57.0 30.8 45.5 44.8 36.1 21.9 7.1
$4,000-4,999 58.4 29.7 49.4 48.3 36.5 26.9 7.9
$5,000-7,499 64.6 31.1 55.1 54.6 45.3 32.8 5.6
$7,500 or more 64.2 23.0 60.1 59.4 50.4 27.9 13.2
Institution typePublic
Less-than-2-year 44.9 40.9 10.9 10.9 10.1 8.4
2 -year 38.7 30.3 16.1 15.9 12.8 8.7 0.3
4-year 55.8 27.5 47.2 46.6 36.9 24.2 6.5
Non-doctorate-granting 60.7 33.1 47.9 47.3 38.1 25.3 5.0
Doctorate-granting 53.4 24.8 46.8 46.3 36.4 23.7 7.2
Private not-for-profitLess-than-4-year 59.7 38.4 39.4 38.9 34.6 21.2 4.3
4-year 66.8 25.8 58.2 57.1 48.7 23.5 13.6
Non-doctorate-granting 71.1 29.5 60.7 60.0 50.7 26.1 11.1
Doctorate-granting 61.3 21.2 55.0 53.5 46.1 20.2 16.9
Private for-profitLess-than-2-year 87.7 68.8 59.8 59.8 57.0 43.1 2.2
2-year or more 84.7 44.1 78.3 78.3 72.9 62.6 4.0-Too few cases for a reliable estimate.
NOTE: "Any Title IV" includes Perkins loans, Stafford loans, PLUS loans, federal work-study, Pell grants, and SupplementalEducational Opportunity Grants (SEOG). Estimates based on undergraduates enrolled full-time, full-year at one institution, about 35percent of undergraduates
SOURCE: U.S. Department of Education, National Center for Education Statistics, 1999-2000 National Postsecondary StudentAid Study (NPSAS:2000).
16
BEST COPY AVAILABLE3

Table 11.-Average amounts of Title IV aid received by full-time/full-year undergraduates: 1999-2000
AnyTitle IV
Pell
grantsTitle IVloans
Stafford loansPerkins
loansTotal Subsidized
Unsub-
sidized
Total $6,092 $2,281 $4,824 $4,615 $3,479 $3,441 $1,775
Dependency and 1998 income levelDependent 5,794 2,147 4,208 3,962 3,314 3,192 1,761
Less than $20,000 5,702 2,714 4,265 3,945 3,446 2,965 1,784
$20,000-39,999 5,585 1,883 4,349 3,963 3,478 2,526 1,768
$40,000-59,999 5,429 1,091 4,165 3,864 3,282 2,567 1,787
$60,000-79,999 5,767 4,023 3,885 3,100 3,140 1,628
$80,000-99,999 6,189 - 4,202 4,114 3,050 3,665 1,425
$100,000 or more 7,014 4,265 4,170 3,226 3,863 2,195
Independent 6,771 2,450 6,395 6,285 3,825 3,839 1,829
Less than $10,000 7,218 2,698 6,224 6,084 3,979 3,466 1,914
$10,000-19,999 6,380 2,302 6,178 6,085 3,766 3,473 1,643
$20,000-29,999 6,222 2,309 6,455 6,322 3,563 3,904 1,873
$30,000-49,999 6,503 1,524 6,821 6,724 3,877 4,345
$50,000 or more 7,607 7,598 7,585 3,520 5,987
Tuition and fees$1-$999 3,351 2,297 3,923 3,875 2,713 2,739
$1,000 -1,999 3,903 2,298 3,682 3,659 2,863 2,765 1,553
$2,000-2,999 4,921 2,298 4,307 4,224 3,253 3,132 2,138
$3,000-3,999 5,674 2,393 4,524 4,346 3,333 3,398 1,565
$4,000-4,999 6,024 2,293 4,687 4,527 3,565 3,284 1,660
$5,000-7,499 6,256 2,208 5,169 5,047 3,473 3,604 1,570
$7,500 or more 7,936 2,202 5,252 4,902 3,723 3,701 1,848
Institution typePublic
Less-than-2-year 3,506 2,325 5,551 5,551 2,829 3,834 -2 -year 3,484 2,324 3,326 3,336 2,445 2,520
4 -year 6,014 2,263 4,719 4,531 3,491 3,397 1,740
Non-doctorate-granting 5,375 2,257 4,468 4,354 3,288 3,192 1,623
Doctorate-granting 6,371 2,266 4,845 4,620 3,596 3,505 1,780
Private not-for-profitLess-than-4-year 5,506 2,286 4,236 4,058 2,725 2,995 -4 -year 7,291 2,219 5,112 4,775 3,822 3,705 1,818
Non-doctorate-granting 6,823 2,251 5,079 4,824 3,767 3,774 1,731
Doctorate-granting 7,972 2,164 5,157 4,707 3,898 3,592 1,889
Private for-profitLess-than-2-year 5,728 2,394 4,847 4,776 2,503 3,3142 -year or more 8,291 2,439 6,256 6,178 3,311 3,870
-Too few cases for a reliable estimate.
NOTE: Estimates based on undergraduates enrolled full-time, full-year at one institution, about 35 percent of undergraduates.Average amounts shown above are for full-time/full-year undergraduate recipients of the specified aid. "Any Title IV" includesPerkins loans, Stafford loans, PLUS loans, federal work-study, Pell grants, and Supplemental Educational Opportunity Grants(SEOG).
SOURCE: U.S. Department of Education, National Center for Education Statistics, 1999-2000 National Postsecondary StudentAid Study (NPSAS:2000).
17 24

Table 12A.-Percentage of undergraduates receiving various combinations of financial aid: 1999-2000
No aidreceived
Grantsonly
Grants,loans, andwork-study
Grantsand loans
Loansonly Other
Total 44.7 22.1 4.3 14.3 7.3 7.4
Dependency and 1998 income levelDependent 41.1 20.3 6.8 14.5 8.7 8.7
Less than $20,000 22.6 35.7 11.5 23.7 1.2 5.3$20,000-39,999 32.4 24.5 10.0 21.6 4.2 7.3$40,000-59,999 42.5 16.1 7.1 14.3 10.6 9.5$60,000-79,999 46.2 14.4 5.3 10.2 13.2 10.7$80,000-99,999 47.7 16.5 3.4 9.2 13.3 9.9$100,000 or more 55.6 16.5 2.5 6.2 10.0 9.2
Independent 48.1 23.8 1.8 14.0 6.0 6.2Less than $10,000 25.4 28.4 5.5 30.9 3.1 6.8$10,000-19,999 37.8 24.7 2.1 20.7 7.8 7.0$20,000-29,999 47.3 24.9 1.1 12.3 7.4 7.0$30,000-49,999 58.2 20.8 0.6 7.6 6.1 6.7$50,000 or more 66.4 21.3 0.1 2.0 6.0 4.2
Tuition and fees$1-$999 64.3 24.0 0.8 3.8 2.7 4.5$1,000-1,999 43.6 27.6 2.6 12.5 7.6 6.2$2,000-2,999 33.2 24.4 4.6 19.7 10.6 7.4$3,000-3,999 29.5 20.9 5.8 22.3 12.3 9.2$4,000-4,999 30.1 17.6 6.1 23.7 12.6 9.9$5,000-7,499 22.7 18.7 5.9 28.7 14.3 9.8$7,500 or more 19.5 14.2 14.8 27.5 9.1 14.9
Institution typePublic
Less-than-2-year 56.2 24.5 1.0 4.0 1.6 12.62-year 62.3 25.6 1.2 4.2 2.3 4.54-year 37.9 18.8 4.8 18.9 11.7 7.9
Non-doctorate-granting 37.6 20.3 5.4 18.9 10.8 7.1Doctorate-granting 38.1 17.9 4.5 18.9 12.2 8.5
Private not-for-profitLess-than-4-year 25.0 31.9 7.2 19.3 5.5 11.24-year 23.9 21.0 14.1 23.3 6.1 11.6
Non-doctorate-granting 21.7 22.5 13.1 24.5 6.6 11.7Doctorate-granting 27.5 18.6 15.5 21.5 5.5 11.4
Private for-profitLess-than-2-year 14.1 24.3 0.6 35.9 13.2 11.92-year or more 15.7 9.3 1.2 36.9 23.4 13.5
Attendance patternFull-time/full-year 27.9 21.8 9.1 21.2 9.5 10.5Full-time/part-year 37.9 24.1 2.9 17.9 8.7 8.5Part-time/full-year 51.1 24.6 2.0 10.7 6.8 4.8Part-time/part-year 70.3 19.5 0.4 3.5 2.4 4.0
NOTE: The loans in columns 3, 4, and 5 refer to student loans. Students whose parents received PLUS loans are included only inthe "other" column. For example, if students received Pell grants, Stafford loans, and their parent received a PLUS loan, they areincluded only in the "Other" column. Estimates by tuition and fees categories, institution type, and attendance pattern excludestudents who attended multiple institutions.
SOURCE: U.S. Department of Education, National Center for Education Statistics, 1999-2000 National Postsecondary StudentAid Study (NPSAS:2000).
18-715
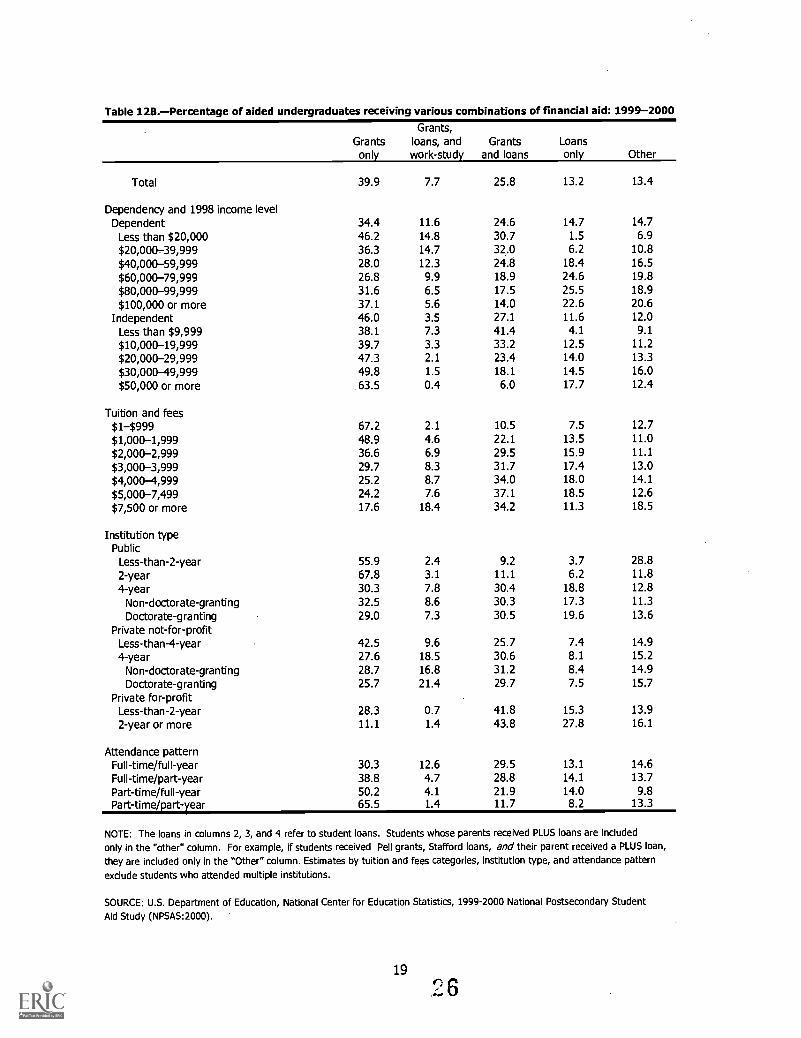
Table 12B.- Percentage of aided undergraduates receiving various combinations of financial aid: 1999-2000
Grantsonly
Grants,loans, andwork-study
Grantsand loans
Loansonly Other
Total 39.9 7.7 25.8 13.2 13.4
Dependency and 1998 income levelDependent 34.4 11.6 24.6 14.7 14.7
Less than $20,000 46.2 14.8 30.7 1.5 6.9$20,000-39,999 36.3 14.7 32.0 6.2 10.8
$40,000-59,999 28.0 12.3 24.8 18.4 16.5
$60,000-79,999 26.8 9.9 18.9 24.6 19.8
$80,000-99,999 31.6 6.5 17.5 25.5 18.9$100,000 or more 37.1 5.6 14.0 22.6 20.6
Independent 46.0 3.5 27.1 11.6 12.0
Less than $9,999 38.1 7.3 41.4 4.1 9.1
$10,000-19,999 39.7 3.3 33.2 12.5 11.2
$20,000-29,999 47.3 2.1 23.4 14.0 13.3$30,000-49,999 49.8 1.5 18.1 14.5 16.0
$50,000 or more 63.5 0.4 6.0 17.7 12.4
Tuition and fees$1-$999 67.2 2.1 10.5 7.5 12.7
$1,000-1,999 48.9 4.6 22.1 13.5 11.0
$2,000-2,999 36.6 6.9 29.5 15.9 11.1
$3,000-3,999 29.7 8.3 31.7 17.4 13.0
$4,000-4,999 25.2 8.7 34.0 18.0 14.1
$5,000-7,499 24.2 7.6 37.1 18.5 12.6
$7,500 or more 17.6 18.4 34.2 11.3 18.5
Institution typePublic
Less-than-2-year 55.9 2.4 9.2 3.7 28.82-year 67.8 3.1 11.1 6.2 11.8
4-year 30.3 7.8 30.4 18.8 12.8
Non-doctorate-granting 32.5 8.6 30.3 17.3 11.3
Doctorate-granting 29.0 7.3 30.5 19.6 13.6Private not-for-profit
Less-than-4-year 42.5 9.6 25.7 7.4 14.94-year 27.6 18.5 30.6 8.1 15.2
Non-doctorate-granting 28.7 16.8 31.2 8.4 14.9
Doctorate-granting 25.7 21.4 29.7 7.5 15.7Private for-profit
Less-than-2-year 28.3 0.7 41.8 15.3 13.9
2-year or more 11.1 1.4 43.8 27.8 16.1
Attendance patternFull-time/full-year 30.3 12.6 29.5 13.1 14.6
Full-time/part-year 38.8 4.7 28.8 14.1 13.7
Part-time/full-year 50.2 4.1 21.9 14.0 9.8Part-time/part-year 65.5 1.4 11.7 8.2 13.3
NOTE: The loans in columns 2, 3, and 4 refer to student loans. Students whose parents received PLUS loans are includedonly in the "other" column. For example, if students received Pell grants, Stafford loans, and their parent received a PLUS loan,they are included only in the "Other" column. Estimates by tuition and fees categories, institution type, and attendance patternexclude students who attended multiple institutions.
SOURCE: U.S. Department of Education, National Center for Education Statistics, 1999-2000 National Postsecondary Student
Aid Study (NPSAS:2000).
19
6

Table 13.-Percentage of graduate and first-professional students receiving various types of financial aid: 1999-2000
Any
aid
Stafford loansPerkinsloans
Institutional aidEmployer
aidTotal Subsidized
Unsub-sidized
Institutionalaid, any
Assis-
tantships
Total 59.7 29.0 26.9 22.6 3.7 27.2 13.6 19.8
Type of graduate programMaster's and doctoral students 60.6 25.1 22.7 18.8 2.2 28.8 16.5 22.1
Master's degree 57.9 26.0 23.4 19.5 2.1 22.2 10.5 24.7
Doctorate 72.4 21.3 19.4 15.4 3.0 58.3 42.7 10.5
Other graduate program 36.3 12.7 10.9 8.9 0.9 12.4 2.2 21.0
Post baccalaureate certificate 43.8 22.0 19.1 15.9 1.2 13.2 3.7 17.0
Other, including non-degree 30.5 5.6 4.6 3.6 0.7 11.8 1.0 24.2
First-professional 85.4 73.1 71.7 62.8 15.4 37.1 7.1 4.6
Institution controlPublic 55.5 23.8 22.0 16.8 2.5 28.4 17.4 17.5
Private not-for-profit 65.2 35.4 32.9 29.8 5.4 27.1 9.1 22.4
Private for-profit 70.0 46.0 41.1 43.5 1.1 5.3 1.8 35.4
Graduate program and institution typeMaster's
Public non-doctorate-granting 43.8 19.5 17.4 12.7 1.4 12.4 4.8 20.6
Public doctorate-granting 58.8 23.4 21.2 15.8 1.3 28.8 17.7 21.5
Private non-doctorate-granting 55.3 26.0 21.9 20.2 1.6 11.3 3.5 31.3
Private doctorate-granting 63.8 31.4 29.1 26.0 3.8 24.5 7.4 27.4
DoctoratePublic 72.1 18.2 16.8 11.8 0.7 61.4 50.9 10.7
Private not-for-profit 75.0 26.8 24.3 22.2 7.5 56.3 32.0 10.0
First-professional
Public 87.2 77.5 76.5 62.5 17.9 37.1 7.8 3.0
Private not-for-profit 85.3 71.5 69.8 64.2 13.9 37.9 6.7 5.5
Other programPublic non-doctorate-granting 30.6 8.2 6.7 4.2 0.7 9.2 1.1 17.7
Public doctorate-granting 37.9 12.8 10.5 8.8 0.9 15.2 3.2 22.8
Other, including for-profit 45.5 20.7 18.5 17.3 1.0 10.7 2.9 23.7
Attendance patternFull-time/full-year 82.3 52.1 49.5 41.6 8.8 48.7 26.5 6.5
Full-time/part-year 62.1 31.3 28.1 24.1 2.7 27.9 17.2 10.6
Part-time/full-year 54.7 21.3 18.9 16.4 1.1 19.0 6.6 31.4
Part-time/part-year 35.5 7.1 6.2 4.9 0.3 9.2 3.0 28.2
Total 1998 incomeLess than $5,000 84.7 65.3 64.1 48.7 15.5 45.0 17.4 2.9
$5,000-9,999 82.0 61.8 60.6 45.6 10.5 46.2 24.9 4.5
$10,000-19,999 71.5 44.4 43.0 33.6 5.2 41.1 29.9 6.2
$20,000-29,999 63.3 33.9 32.8 26.9 2.8 28.6 15.4 ,, 14.2
$30,000-49,999 52.0 20.5 18.6 16.3 1.0 21.5 9.6 24.7
$50,000 or more 47.8 11.8 8.1 10.5 0.4 14.6 4.9 32.0
NOTE: "Any aid" includes all types of financial aid except aid from parents, friends, and relatives. Students can receive more than one type ofaid. Although assistantships may include federal, state, or institutional dollars, all assistantships are counted both as "institutional aid" and asassistantships. NCES defines first-professional programs to include the following fields of study: dentistry, medicine, optometry, osteopathicmedicine, veterinary medicine, pharmacy, podiatric medicine, chiropractic, law, and theological professions. Private master's and doctoralprogram are private not-for-profit. All for-profit programs are included under "other program". Estimates by type of graduate program,institution control, and attendance pattern exclude students who attended multiple institutions.
SOURCE: U.S. Department of Education, National Center for Education Statistics, 1999-2000 National Postsecondary StudentAid Study (NPSAS:2000).
BEST COPY AVAILABLE

Table 14.-Average amounts of selected types of aid received by graduate and first-professional students: 1999-2000
Anyaid
Stafford loansPerkinsloans
Institutional aidEmployer
aidTotal SubsidizedUnsub-sidized
Institutionalaid, any
Assis-tantships
Total $13,255 $12,849 $7,099 $8,067 $2,767 $9,839 $9,179 $3,546
Type of graduate programMaster's and doctoral students 12,160 11,426 6,706 7,175 2,459 10,918 9,505 3,852
Master's degree 10,391 11,309 6,655 7,054 2,627 7,731 7,481 3,838
Doctorate 18,466 12,059 6,983 7,860 1,952 16,320 11,676 3,998
Other graduate program 6,465 9,515 5,962 6,254 - 4,726 - 1,324
Post baccalaureate certificate 8,700 9,912 6,114 6,357 - 6,572 - 2,101
Other, including non-degree 3,994 8,320 5,477 5,903 3,126 - 903
First-professional 21,505 16,428 8,042 9,945 3,081 7,221 4,981 4,847
Institution controlPublic 10,976 11,060 6,766 6,822 2,536 8,969 9,165 2,365
Private, not-for-profit 16,245 14,624 7,467 9,091 2,979 11,342 9,477 4,756
Private, for profit 12,545 14,714 7,012 8,936 - - 4,874
Graduate program and institution typeMaster's
Public non-doctorate-granting 6,561 8,849 5,867 5,529 - 4,095 5,560 1,734
Publicdoctorate- granting 9,168 9,764 6,228 6,103 2,361 7,804 7,611 2,685
Private non-doctorate-granting 7,970 10,479 6,317 6,678 - 4,594 - 3,435
Private doctorate-granting 14,086 13,521 7,349 8,086 3,126 9,393 8,955 5,987
DoctoratePublic 16,065 10,279 6,567 6,551 14,334 11,374 4,020
Private not-for-profit 23,332 14,422 7,448 9,265 1,954 20,632 12,957 4,292
First-professionalPublic 18,101 14,633 7,995 8,360 2,767 4,614 5,896
Private not-for-profit 24,014 17,787 8,079 11,024 3,363 9,001 4,216 5,612
Other programPublic non-doctorate-granting 3,295 - - 700
Public doctorate-granting 6,829 9,294 6,331 5,991 5,833 1,432
Other, including for-profit 8,793 12,396 6,672 7,672 - 4,153 - 2,934
Attendance patternFull-time/full-year 19,589 14,417 7,709 8,874 2,881 12,361 9,888 6,034
Full-time/part-year 11,515 10,507 5,989 6,651 8,402 7,464 6,298
Part-time/full-year 8,689 11,474 6,509 7,437 2,052 6,018 7,935 3,738
Part-time/part-year 3,738 7,089 4,650 4,456 - 3,479 7,646 2,143
Total 1998 incomeLess than $5,000 18,669 14,057 7,668 8,811 2,683 7,888 5,937 -$5,000 -9,999 17,381 12,841 7,537 7,378 2,727 9,062 8,092 5,507
$10,000-19,999 17,436 12,669 7,288 7,423 2,558 12,584 10,791 4,533
$20,000-29,999 13,779 12,684 6,808 7,723 3,418 10,915 10,962 2,967
$30,000-49,999 10,423 11,858 6,257 7,808 - 9,173 8,981 2,798
$50,000 or more 8,043 12,394 6,242 9,081 7,352 7,879 3,728
-Too few cases for a reliable estimate.
NOTE: Average amounts shown above are for recipients of the specified aid. "Any aid" indudes all types of financial aid except aid from parents,friends, and relatives. Students can receive more than one type of aid. Although assistantships may include federal, state, or institutionaldollars, all assistantships are counted both as "institutional aid" and as assistantships. NCES defines first-professional programs to include thefollowing fields of study: dentistry, medicine, optometry, osteopathic medicine, veterinary medicine, pharmacy, podiatric medicine, chiropractic,law, and theological professions. Private master's and doctoral programs are private not-for-profit. All for-profit programs are included under"other program". Estimates by type of graduate program, institution control, and attendance pattern exclude students who attended multipleinstitutions.
SOURCE: U.S. Department of Education, National Center for Education Statistics, 1999-2000 National Postsecondary StudentAid Study (NPSAS:2000).
21
41 8

TECHNICAL APPENDIX
A stratified sample of 1,083 postsecondary institutions was selected from all Title IV-participating institutions listed in the 1998-99 Integrated Postsecondary Education Data System(IPEDS) Institutional Characteristics (IC) database. Readers interested in learning more aboutthe Department of Education's Title IV aid programs can find it by pointing their Web browserto: http://www.ed.gov/offices/OSFAP/Students/student.html.
Specifically, to be eligible for NPSAS:2000 an institution was required, during the 1999-2000 academic year, to:
offer an educational program designed for persons who have completed secondaryeducation; andoffer more than just correspondence courses; andoffer at least one academic, occupational, or vocational program off study lasting atleast 3 months or 300 clock hours; andoffer courses that were open to more than the employees or members of thecompany or group (e.g., union) that administers the institution; andbe located in the 50 states, the District of Columbia, or Puerto Rico;be other than a U.S. Service Academy; andhave a Title-IV program participation agreement with the Department of Education.
The postsecondary students eligible for NPSAS:2000 were those who attended a NPSAS-eligibleinstitution sometime between July 1, 1999 and June 30, 2000 and who were:
enrolled in either (a) an academic program; (b) at least one course for credit thatcould be applied toward fulfilling the requirements for an academic degree;or(c) an occupational or vocational program that required at least 3 months or300 clock hours of instruction to receive a degree, certificate, or other formalaward;
not concurrently enrolled in high school; and
not enrolled solely in a GED or other high school completion program.
Institutions were selected with probabilities proportional to a composite measure of size basedon expected enrollment in the seven student-level sampling strata: baccalaureate studentsmajoring in business; other baccalaureate students; other undergraduate students; master'sstudents, doctoral students; other graduate students; and first-professional students. A total of287 institutions had such large expected enrollment that they were selected with certainty, andthe remaining 796 sample institutions were selected with probabilities proportional to size fromthe 22 institutional sampling strata. Out of the 1,072 NPSAS-eligible institutions, 999 sentenrollment lists/files. Table A-1 shows: the number of institutions sampled; the number eligible,and the number providing lists for sampling by sector.
Table A-2 shows the numbers of institutions that provided student level data from institutionalrecords for at least one student sampled at that institution and the response rates byinstitutional strata. Rates for obtaining institutional record data among all eligible sample
23

students are shown in Table A-3. Table A-4 shows student interview response rates, overalland by institutional sector. Student response, or participation rates for the overall study arepresented in Table A-5 and are based on the numbers of students with completed institutionalrecords data and/or student interview data. Additional information on the sampling proceduresand response rates will be available in the NPSAS:2000 Methodology Report. Finally, Table A-6shows standard errors for estimates in Table 1.
DATA SOURCES for NPSAS:2000 Information for NPSAS:2000 came from several sources,including:
CADE (Computer Assisted Data Entry) Data from institutional financial aid and registrarrecords entered at the institution by field collectors or institutional personnel in 1999-2000.
Student CATI (Computer Assisted Telephone Interview) Data collected in telephoneinterviews of the sampled students in 1999-2000.
CPS:2000 (Central Processing System) U. S. Department of Education database offederal financial aid applications for the 1999-2000 academic year.
NSLDS (National Student Loan Data System) U. S. Department of Education database offederal Title IV loans and Pell Grants.
IPEDS-IC (Integrated Postsecondary Education. Data System-InstitutionalCharacteristics) U. S. Department of Education, National Center for Education Statistics,database of descriptive information about individual postsecondary institutions.
Testing Organizations (ETS/ACT) Educational Testing Service and American CollegeTesting program provide SAT/ACT information on sampled students who took theSAT/ACT college entrance examination since 1995.
Derived -- Composite variables created by combining data from more than one source orfrom more than one other variable.
DATA LIMITATIONS AND ACCURACY OF ESTIMATES
Students who attended more than one institution (about 6 percent of undergraduates andnearly 4 percent of graduate students) are coded in a separate category ("multiple institutions")for institution type, institution control, and attendance pattern. Although included in the "totals"in this report, due to confounding tuition and fees and attendance patterns, students whoattended multiple institutions were excluded in the estimates by institution type, tuition and feescategories, and attendance pattern in this report.
The estimates in this report are subject to sampling and nonsampling errors. Nonsamplingerrors are due to a number of sources, including but not limited to, nonresponse, inaccuratecoding, misspecification of composite variables, and inaccurate imputations. Sampling errorsexist in all sample-based data sets, including NPSAS. Estimates calculated from a sample willdiffer from estimates calculated from other samples even if all the samples used the samesample design and methods. For similar reasons, estimates of average aid amounts based on

the NPSAS sample will probably differ from specific program amounts reported by theDepartment's program offices.
The standard error is a measure of the precision of the estimate. In this tabulation, eachestimate's standard error was calculated using Taylor series procedures and can be producedusing the NPSAS:2000 Data Analysis System software. Standard errors for Table 1 are reportedin Table A-6. All differences reported in the Highlights were significant at the .05 level, using theBonferroni procedure when appropriate.
CAUTIONS WHEN COMPARING NPSAS:2000 ESTIMATES TO PRIOR NPSASESTIMATES
Comparison of results with prior rounds of NPSAS requires compensation for three changes inthe design of the survey over time. For NPSAS:2000, the survey was restricted for the first timeto institutions participating in Title IV student aid programs. According to the Data AnalysisSystem (DAS) for NPSAS:96, only about 1 percent of the sampled undergraduates wereattending an institution not eligible to participate in the Department's Title IV aid programs.When students attending non-Title IV-eligible institutions were excluded from the NPSAS:96sample, the percentage of undergraduates who received financial aid increased by less than 0.3percent. This small change primarily affects comparisons of students enrolled in less- than -2-year and private for-profit institutions. When using the DAS from prior NPSAS studies forcomparisons to NPSAS:2000, analysts may want to filter cases in the prior studies (e.g,NPSAS:96 or NPSAS:93) based on the variable that identifies whether the student was sampledfrom an institution that was eligible to participate in Title IV aid programs (T4ELIG).
Another design change was made beginning with NPSAS:90 to improve full-year estimates.NPSAS:87 sampled students enrolled in the fall (October). However, NPSAS:90 sampledstudents who were enrolled at four discrete points in time: summer (August), fall (October),winter (February), and spring (June). In NPSAS:93, NPSAS:96, and NPSAS:2000, institutionswere asked to provide one list (if possible), that represented students enrolled at any timeduring the respective financial aid award year. In NPSAS:87 and NPSAS:90, those studentswho were initially sampled in the fall could have been enrolled for the full academic year.
The 1990, 1993, 1996, and 2000 NPSAS samples also included some students from Puerto Rico.Puerto Rico was not included in the NPSAS:87 sample. The final restricted data files and the2000 NPSAS Data Analysis System software will allow users to produce estimates comparable to1987 by selecting only students who were enrolled in the fall and excluding those sampled fromPuerto Rico (see the variable description for COMPTO87 in the Data Analysis System). Theseestimates will reflect full-year amounts of aid for students who were enrolled in the fall. Suchestimates, however, will not reflect total expenditures as reported by the Department's specificTitle IV program offices. This difference will be explained more fully in the forthcomingmethodology report.

The estimates for average amounts in this report are only for aid recipients who received thespecified type of aid. Further, average aid amounts for specific groups where most students donot receive aid are not reflective of the amount of support these students receive overall, andthe type of support (e.g., whether it is grants, subsidized loans, unsubsidized loans, work-study,or some combination) is likely to differ. For example, among Title IV aid recipients, dependentundergraduates with family incomes of $100,000 or more, 24.2 percent received Title IV aid(including PLUS loans); average amount among recipients in this group was $6,676 (includingPLUS loans). But 69.9 percent of dependent undergraduates with parent income of less than$20,000 received Title IV aid; average amount was $4,875 (table 8, 9).
Further, NCES recommends that readers not try to produce their own estimates such as thepercentage of all students receiving aid or the numbers of undergraduates enrolled in the fallwho received any aid, federal aid, state aid, etc., by combining estimates in this tabulation withthe Center's Integrated Postsecondary Education Data System (IPEDS) fall 1999 enrollmentnumbers. The IPEDS enrollment data are for fall enrollment only and include some students noteligible for NPSAS (e.g., those enrolled in U.S. Service Academies, those taking college courseswhile enrolled in high school). Additional information on the NPSAS:2000 sample will bedescribed in the forthcoming methodology report.
ADDITIONAL NOTES ON THE ACCURACY OF THE ESTIMATES
Unit nonresponse can cause bias in survey estimates. Weight adjustments are typically used toreduce bias due to unit nonresponse. RTI incorporated all, potentially biased variables that wereknown for most respondents and nonrespondents into the nonresponse adjustment models tomaximize the bias reduction. Three stages of CATI nonresponse adjustment also were used toadjust for the bias resulting from three different types of nonresponse: adjustment for inabilityto locate; adjustment for refusal among located students; and adjustment for othernonresponse among located students who did not refuse. Poststratification to control totals alsowas used to adjust for the potential for bias resulting from frame errors. Control totals includedweighted totals (using the study weight) for six variables (age, gender, applied for federal aid,received federal aid, received state aid, and received institution aid) crossed with type ofinstitution. These variables were known for most respondents and nonrespondents. Additionaldetails regarding the weighting process will be described in the forthcoming MethodologyReport.
RTI conducted a bias analysis to determine if any variables were significantly biased due tononresponse. Several variables were found to be biased before weighting. The weightingprocedures appear to have reduced the bias for these variables. However one variable that wasknown for respondents and nonrespondents (fall attendance status) was still slightly biased.The poststratification adjustments were re-computed adding as additional control totals theweighted totals for this variable crossed with type of institution. Therefore, when the weightingwas completed, no variables available for most respondents and nonrespondents had significantbias. Additional information on the nonresponse bias analysis will be described in theforthcoming Bias Analysis Report.

COMPUTATION OF STANDARD ERRORS
To facilitate computation of standard errors for nonlinear statistics using the first-order Taylorseries approximation, RTI defined analysis strata and analysis replicates (or PSUs). Each non-certainty sample institution was defined to be an analysis replicate, except when it containedfewer than four responding students. It was then combined with another comparable institutionto form an analysis replicate. Each certainty institution was divided into two, three, or fourrandom samples, each of which was defined to be an analysis replicate, except when thatresulted in a replicate containing fewer than four responding students. The sample replicates(non-certainty institutions and samples of students from certainty institutions) were thenassigned to analysis strata by pairing the replicates within institutional sampling strata, wherepossible. When a sampling stratum had an odd number of replicates from non-certaintyinstitutions, then one analysis stratum contained three replicates rather than two. Somecertainty institutions contained three or four replicates which formed an analysis stratum.
All estimates in this tabulation were produced using software developed by NCES. The softwareincludes more than 200 variables and allows users to produce tables or correlation matrices foruse in regression analyses. Users can specify row and column variables to produce estimatedmeans, percentages, standard errors, and weighted sample sizes. Estimates can be producedfor specific subgroupsfor example, aided, full-time, dependent students. To download thesoftware containing the NCES 2000 NPSAS Data Analysis System readers can connect directly tothe NCES Data Analysis Systems Web Site at http: / /nces.ed.gov /dasor contact the NCESPostsecondary Studies Division, 1990 K Street, NW, Washington, DC 20006; or call (202)502-7334. The software for NPSAS:2000 should be available on CD-ROM by late September2001.
27 33

Tab
le A
-1.-
Ove
rall
inst
itutio
nal e
ligib
ility
and
enr
ollm
ent l
ist p
artic
ipat
ion
rate
s
Typ
e of
inst
itutio
n'In
stitu
tions
sam
pled
2E
ligib
leIn
stitu
tions
2
Inst
itutio
ns p
rovi
ding
list
s4
Num
ber
Unw
eigh
ted
perc
ent
Wei
ghte
dpe
rcen
t
All
inst
itutio
ns1,
083
1,07
299
993
.291
.3In
stitu
tiona
l lev
el
Less
-tha
n-2-
year
123
117
103
88.0
87.5
2-ye
ar24
724
423
295
.195
.9
r..)
4-ye
ar n
on-d
octo
rate
gra
ntin
g31
731
529
292
.786
.1
co4-
year
doc
tora
te g
rant
ing
396
396
372
93.9
96.2
Inst
itutio
nal c
ontr
olP
ublic
580
576
545
94.6
94.4
Priv
ate
not-
for-
prof
it37
637
133
991
.488
.6
Priv
ate
for-
prof
it12
712
511
592
.091
.0
Inst
itutio
nal s
ecto
rP
ublic
less
-tha
n-2-
year
3432
2887
.579
.1
Pub
lic 2
-yea
r19
819
618
594
.496
.4
Pub
lic 4
-yea
r no
n-do
ctor
ate
gran
ting
127
127
123
96.9
94.0
Pub
lic 4
-yea
r do
ctor
ate
gran
ting
221
221
209
94.6
95.0
Priv
ate
not-
for-
prof
it, 2
-yea
r or
less
3532
3093
.897
.6
Priv
ate
not-
for-
prof
it, 4
-yea
r no
n-do
ctor
ate
gran
ting
173
171
153
89.5
81.6
Priv
ate
not-
for-
prof
it, 4
-yea
r do
ctor
ate
gran
ting
168
168
156
92.9
96.5
Priv
ate
for-
prof
it, le
ss-t
han-
2-ye
ar77
7567
89.3
88.4
Priv
ate
for-
prof
it, 2
-yea
r or
mor
e50
5048
96.0
94.8
'Inst
itutio
n cl
assi
ficat
ions
wer
e ve
rifie
d by
par
ticip
atin
g in
stitu
tions
to c
orre
ct c
lass
ifica
tion
erro
rs o
n th
e sa
mpl
ing
fram
e.
2Dur
ing
inst
itutio
n co
ntac
ting,
it w
as d
isco
vere
d th
at p
art o
f one
sch
ool h
ad r
ecen
tly s
plit
off a
nd fo
rmed
a s
epar
ate
inst
itutio
n. B
oth
inst
itutio
ns a
re in
clud
ed.
3A
mon
g th
e 11
inst
itutio
ns c
onsi
dere
d in
elig
ible
: 2 c
lose
d af
ter
the
sam
plin
g fr
ame
was
def
ined
; 2 w
ere
dupl
icat
es w
ith o
ther
sel
ecte
d in
stitu
tions
; and
the
rem
aini
ng 7
faile
d to
mee
ton
e or
mor
e of
the
crite
ria fo
r in
stitu
tiona
l NP
SA
S e
ligib
ility
.4 P
erce
nts
are
base
d on
the
elig
ible
inst
itutio
ns w
ithin
the
row
und
er c
onsi
dera
tion.
SO
UR
CE
: U.S
. Dep
artm
ent o
f Edu
catio
n, N
atio
nal C
ente
r fo
r E
duca
tion
Sta
tistic
s, N
PS
AS
:200
0 M
etho
dolo
gy R
epor
t (fo
rthc
omin
g).
34B
EST
CO
PY A
VA
ILA
BL
E35

Tab
le A
-2.-
Inst
itutio
n-le
vel r
ates
for
obta
inin
g in
stitu
tiona
l rec
ord
data
(C
AD
E),
by
sele
cted
cla
ssifi
catio
ns
Typ
e of
inst
itutio
nE
ligib
lein
stitu
tions
1'2
Inst
itutio
nyi
eld3
Unw
eigh
ted
perc
ene
Wei
ghte
dpe
rcen
t4
All
inst
itutio
ns99
993
793
.895
.0In
stitu
tion
leve
lLe
ss th
an 2
-yea
r10
389
86.4
91.1
2-ye
ar23
222
295
.798
.6
4-ye
ar n
on-d
octo
rate
gra
ntin
g29
227
493
.894
.6
4-ye
ar d
octo
rate
gra
ntin
g37
235
294
.694
.1
Inst
itutio
nal c
ontr
olP
ublic
545
514
94.3
95.8
Priv
ate
not-
for-
prof
it33
931
793
.593
.6
Priv
ate
for-
prof
it11
510
692
.295
.6N
.)ci
pIn
stitu
tiona
l sec
tor
Pub
lic le
ss th
an-2
-yea
r28
2589
.388
.2
Pub
lic 2
-yea
r18
517
695
.197
.3
Pub
lic 4
-yea
r no
ndoc
tora
te-g
rant
ing
123
117
95.1
95.4
Pub
lic 4
-yea
r do
ctor
ate-
gran
ting
209
196
93.8
93.8
Priv
ate
not-
for-
prof
it 2-
year
or
less
3027
90.0
93.8
Priv
ate
not-
for-
prof
it 4-
year
non
-doc
tora
te g
rant
ing
153
141
92.2
93.3
Priv
ate
not-
for-
prof
it 4-
year
doc
tora
te g
rant
ing
156
149
95.5
94.0
Priv
ate
for-
prof
it le
ss th
an-2
-yea
r67
5886
.692
.4
Priv
ate
for
prof
it 2-
year
or
mor
e48
4810
0.0
100.
0
'Inst
itutio
nal c
lass
ifica
tions
wer
e ve
rifie
d by
par
ticip
atin
g in
stitu
tions
to c
orre
ct c
lass
ifica
tion
erro
rs o
n th
e sa
mpl
ing
fram
e.
Inst
itutio
ns th
at p
rovi
ded
lists
for
stud
ent s
ampl
ing.
3C
AD
E (
Com
pute
r A
ssis
ted
Dat
a E
ntry
for
inst
itutio
nal r
ecor
d da
ta)
resp
onde
nts
mus
t hav
e pr
ovid
ed a
t lea
st o
ne s
tude
nt r
ecor
d.4 P
erce
ntag
es a
re b
ased
on
the
elig
ible
inst
itutio
ns w
ithin
the
row
und
er c
onsi
dera
tion.
SO
UR
CE
: U.S
. Dep
artm
ent o
f Edu
catio
n, N
atio
nal C
ente
r fo
r E
duca
tion
Sta
tistic
s, N
PS
AS
:200
0 M
etho
dolo
gy R
epor
t (fo
rthc
omin
g).
3637

Tab
le A
-3.-
Stu
dent
-leve
l rat
es fo
r ob
tain
ing
inst
itutio
nal r
ecor
d da
ta (
CA
DE
) by
sel
ecte
d cl
assi
ficat
ions
i2T
ype
of s
tude
nt'
Elig
ible
stud
ents
3S
tude
ntyi
eld4
Unw
eigh
ted
perc
ents
Wei
ghte
dpe
rcen
ts
All
stud
ents
64,4
7159
,284
92.0
97.1
Inst
itutio
n le
vel
Less
than
2-y
ear
5,81
04,
640
79.9
86.4
2-ye
ar11
,548
10,9
6795
.094
.54-
year
non
-doc
tora
te g
rant
ing
17,3
8316
,281
93.7
92.1
4-ye
ar d
octo
rate
gra
ntin
g29
,730
27,3
9692
.193
.6In
stitu
tiona
l con
trol
Pub
lic39
,984
37,1
9993
.093
.4P
rivat
e no
t-fo
r-pr
ofit
17,9
9516
,439
91.4
93.5
Priv
ate
for-
prof
it6,
492
5,64
687
.094
.2In
stitu
tiona
l sec
tor
Pub
lic le
ss th
an-2
-yea
r1,
169
912
78.0
81.6
Pub
lic 2
-yea
r9,
167
8,68
794
.894
.3co o
Pub
lic 4
-yea
r no
ndoc
tora
te-g
rant
ing
9,13
28,
676
95.0
91.2
Pub
lic 4
-yea
r do
ctor
ate-
gran
ting
20,5
1618
,924
92.2
93.2
Priv
ate
not-
for-
prof
it, 2
-yea
r or
less
1,65
91,
475
88.9
97.4
Priv
ate
not-
for-
prof
it 4-
year
non
-doc
tora
te g
rant
ing
7,48
16,
838
91.4
92.2
Priv
ate
not-
for-
prof
it, 4
-yea
r do
ctor
ate
gran
ting
8,85
58,
126
91.8
94.5
Priv
ate
for-
prof
it le
ss th
an-2
-yea
r4,
096
3,31
681
.087
.0P
rivat
e fo
r pr
ofit
2-ye
ar o
r m
ore
2,39
62,
330
97.2
98.0
Stu
dent
type
Und
ergr
adua
te52
,033
48,0
0792
.393
.7G
radu
ate
11,1
5510
,147
91.0
92.3
Firs
t-pr
ofes
sion
al1,
283
1,13
088
.190
.8
'Inst
itutio
nal c
lass
ifica
tions
wer
e ve
rifie
d by
par
ticip
atin
g in
stitu
tions
to c
orre
ct c
lass
ifica
tion
erro
rs o
n th
e sa
mpl
ing
fram
e.
2Stu
dent
cla
ssifi
catio
ns h
ave
been
ver
ified
aga
inst
col
lect
ed d
ata
to c
orre
ct e
rror
s on
the
sam
plin
g fr
ame.
'The
elig
ible
gro
up is
com
pris
ed o
f all
70,2
32 s
ampl
ed s
tude
nts
min
us th
e 5,
761
foun
d to
be
NP
SA
S-in
elig
ible
at a
ny s
tage
of d
ata
colle
ctio
n.
"Alth
ough
the
inst
itutio
n pr
ovid
es th
e in
form
atio
n, a
stu
dent
is c
lass
ified
as
a C
AD
E r
espo
nden
t if k
ey d
emog
raph
ic, e
nrol
lmen
t, an
d fin
anci
al a
id d
ata
wer
e pr
ovid
ed.
5Per
cent
ages
are
bas
ed o
n el
igib
le s
tude
nts
with
in th
e ro
w u
nder
con
side
ratio
n.
SO
UR
CE
: U.S
. Dep
artm
ent o
f Edu
catio
n, N
atio
nal C
ente
r fo
r E
duca
tion
Sta
tistic
s, N
PS
AS
:200
0 M
etho
dolo
gy R
epor
t (fo
rthc
omin
g).
3839

Tab
le A
-4.-
Stu
dent
inte
rvie
w r
espo
nse
rate
s, b
y se
lect
ed c
lass
ifica
tions
Typ
e of
Inst
itutio
n'E
ligib
lest
uden
ts2
Stu
dent
yie
ld
Unw
eigh
ted
stud
ent
perc
enta
geyi
eld'
Wei
ghte
dst
uden
tpe
rcen
tage
yiel
d'
Wei
ghte
din
stitu
tiona
lpe
rcen
tage
yiel
d'
Ove
rall
wei
ghte
dre
spon
se3'
4
All
stud
ents
63,6
0344
,491
70.0
71.9
91.3
65.6
Inst
itutio
n Le
vel
Less
than
2-y
ear
5,74
13,
537
61.6
67.8
87.5
59.3
2-ye
ar11
,400
7,48
865
.768
.895
.966
.0
4-ye
ar n
on-d
octo
rate
gra
ntin
g17
,206
12,6
3073
.474
.986
.164
.5
4-ye
ar d
octo
rate
gra
ntin
g29
,526
21,0
1671
.274
.196
.271
.2
Inst
itutio
nal c
ontr
ol
Pub
lic39
,485
28,0
6471
.171
.594
.467
.5
Priv
ate
not-
for-
prof
it17
,698
12,5
3570
.874
.288
.665
.7
Priv
ate
for-
prof
it6,
420
3,89
260
.668
.791
.062
.5
Inst
itutio
nal s
ecto
r
Pub
lic le
ss th
an-2
-yea
r1,
149
742
64.6
71.8
79.1
56.8
Pub
lic 2
-yea
r9,
048
5,95
465
.868
.796
.466
.2
Pub
lic 4
-yea
r no
ndoc
tora
te-g
rant
ing
9,04
76,
725
74.3
75.7
94.0
71.1
Pub
lic 4
-yea
r do
ctor
ate-
gran
ting
20,2
4114
,643
72.3
74.1
95.0
70.4
Priv
ate
not-
for-
prof
it, 2
-yea
r or
less
1,63
197
960
.068
.797
.667
.0
Priv
ate
not-
for-
prof
it, 4
-yea
r nb
n-do
ctor
ate
gran
ting
7,40
55,
407
73.0
74.5
81.6
60.8
Priv
ate
not-
for-
prof
it, 4
-yea
r do
ctor
ate
gran
ting
8,66
26,
149
71.0
74.3
96.5
71.7
Priv
ate
for-
prof
it, le
ss th
an-2
-yea
r4,
059
2,34
557
.867
.188
.459
.4
Priv
ate
for
prof
it, 2
-yea
r or
mor
e2,
361
1,54
765
.569
.594
.865
.9
'Inst
itutio
nal c
lass
ifica
tions
wer
e ve
rifie
d by
par
ticip
atin
g in
stitu
tions
to c
orre
ct c
lass
ifica
tion
erro
rs o
n th
e sa
mpl
ing
fram
e.2
The
elig
ible
gro
up is
com
pris
ed o
f all
70,2
32 s
ampl
ed s
tude
nts
min
us th
e 5,
761
foun
d to
be
NP
SA
S-in
elig
ible
at a
ny s
tage
of d
ata
colle
ctio
n, a
nd86
8 sa
mpl
e m
embe
rs e
xclu
ded
from
CA
TI-
elig
ibili
ty (
e.g.
, out
-of-
coun
try,
inst
itutio
naliz
ed),
eve
n th
ough
they
wer
e C
AD
E e
ligib
le.
3 P
erce
nts
are
base
d on
elig
ible
stu
dent
s w
ithin
the
row
und
er c
onsi
dera
tion.
The
ove
rall
stud
ent r
espo
nse
rate
is c
ompu
ted
as th
e pr
oduc
t of t
he w
eigh
ted
stud
ent y
ield
and
the
wei
ghte
d in
stitu
tiona
l yie
ld a
nd, t
hus,
acc
ount
s fo
r no
nres
pons
eat
eac
h st
age
ofda
ta c
olle
ctio
n.S
OU
RC
E: U
.S. D
epar
tmen
t of E
duca
tion,
Nat
iona
l Cen
ter
for
Edu
catio
n S
tatis
tics,
NP
SA
S:2
000
Met
hodo
logy
Rep
ort (
fort
hcom
ing)
.
4041

Tab
le A
-5.-
Stu
dy r
espo
nden
ts b
y se
lect
ed c
lass
ifica
tions
Typ
e of
inst
itutio
n.
Elig
ible
stud
ents
'S
tude
ntyi
eld2
Unw
eigh
ted
stud
ent
perc
ent3
Wei
ghte
dst
uden
tpe
rcen
t3
Wei
ghte
din
stitu
tiona
lpe
rcen
t3
Ove
rall
wei
ghte
dre
spon
sepe
rcen
t3'4
All
stud
ents
64,4
7161
,767
95.8
97.1
91.3
88.7
Inst
itutio
n le
vel
Less
than
2-y
ear
5,81
05,
143
88.5
93.5
87.5
81.8
2-ye
ar11
,548
11,2
2297
.297
.295
.993
.24-
year
non
-doc
tora
te g
rant
ing
17,3
8316
,910
97.3
97.2
86.1
83.7
4-ye
ar d
octo
rate
gra
ntin
g29
,730
28,4
9295
.897
.296
.293
.4In
stitu
tiona
l con
trol
o) N)
Pub
licP
rivat
e no
t-fo
r-pr
ofit
39,9
8417
,995
38,6
7517
,113
96.7
95.1
97.1
97.3
94.4
88.6
91.7
86.2
Priv
ate
for-
prof
it6,
492
5,97
992
.196
.891
.088
.1In
stitu
tiona
l sec
tor
Pub
lic le
ss th
an-2
-yea
r1,
169
1,06
390
.995
.479
.175
.5P
ublic
2-y
ear
9,16
78,
932
97.4
97.2
96.4
93.7
Pub
lic 4
-yea
r no
ndoc
tora
te-g
rant
ing
9,13
28,
950
98.0
97.0
94.0
91.2
Pub
lic 4
-yea
r do
ctor
ate-
gran
ting
20,5
1619
,730
96.2
97.1
95.0
92.2
Priv
ate
not-
for-
prof
it, 2
-yea
r or
less
1,65
91,
511
91.1
98.4
97.6
96.1
Priv
ate
not-
for-
prof
it, 4
-yea
r no
n-do
ctor
ate
gran
ting
7,48
17,
190
96.1
97.2
81.6
79.3
Priv
ate
not-
for-
prof
it, 4
-yea
r do
ctor
ate
gran
ting
8,85
58,
412
95.0
97.4
96.5
94.0
Priv
ate
for-
prof
it le
ss th
an-2
-yea
r4,
096
3,63
288
.793
.288
.482
.4P
rivat
e fo
r pr
ofit
2-ye
ar o
r m
ore
2,39
62,
347
98.0
98.6
94.8
93.5
'The
elig
ible
gro
up is
com
pris
ed o
f all
70,2
32 s
ampl
ed s
tude
nts
min
us th
e 5,
761
foun
d to
be
NP
SA
S-in
elig
ible
at a
ny s
tage
of d
ata
colle
ctio
n.
2All
stud
ents
com
plet
ing
at le
ast a
par
tial i
nter
view
, and
thos
e w
ith s
uffic
ient
info
rmat
ion
from
inst
itutio
nal r
ecor
ds, i
nclu
ding
the
Dep
artm
ent o
f Edu
catio
n's
Cen
tral
Pro
cess
ing
Sys
tem
, and
Nat
iona
l Stu
dent
Loa
n D
ata
Sys
tem
wer
e cl
assi
fied
as a
res
pond
ent f
or a
naly
sis
purp
oses
.
3Per
cent
s ar
e ba
sed
on e
ligib
le s
tude
nts
with
in th
e ro
w u
nder
con
side
ratio
n.
4 T
he o
vera
ll st
udy
wei
ghte
d re
spon
se r
ate
is c
ompu
ted
as th
e pr
oduc
t of t
he w
eigh
ted
stud
ent y
ield
and
the
wei
ghte
d in
stitu
tiona
l yie
ld a
nd, t
hus,
acc
ount
sfo
rno
nres
pons
e at
eac
h st
age
of d
ata
colle
ctio
n.
SO
UR
CE
: U.S
. Dep
artm
ent o
f Edu
catio
n, N
atio
nal C
ente
r fo
r E
duca
tion
Sta
tistic
s, N
PS
AS
:200
0 M
etho
dolo
gy R
epor
t (fo
rthc
omin
g).
4243

Table A-6.-Standard errors for estimates in Table 1
Any aid Grants Loans Work-study Other
Total 0.61 0.56 0.51 0.19 0.27
Dependency and 1998 income levelDependent 0.62 0.64 0.56 0.33 0.26
Less than $20,000 1.14 1.21 1.27 0.81 0.45$20,000-39,999 0.95 1.00 1.09 0.62 0.45$40,000-59,999 1.02 1.00 0.99 0.56 0.49$60,000-79,999 1.17 1.08 1.00 0.55 0.53$80,000-99,999 1.39 1.24 1.19 0.53 0.60$100,000 or more 1.00 0.87 0.80 0.37 0.51
Independent 0.85 0.75 0.65 0.14 0.41Less than $10,000 1.06 1.08 1.21 0.43 0.53$10,000-19,999 1.40 1.32 1.24 0.28 0.50
$20,000-29,999 1.37 1.31 1.00 0.26 0.72$30,000-49,999 1.24 1.15 0.78 0.25 0.62$50,000 or more 1.13 0.97 0.47 0.06 0.58
Tuition and fees$1-$999 1.14 1.03 0.39 0.19 0.53$1,000-1,999 1.14 1.18 0.87 0.31 0.47$2,000-2,999 0.92 1.03 1.04 0.55 0.45$3,000-3,999 0.96 1.25 1.17 0.55 0.58$4,000-4,999 1.17 1.28 1.34 0.68 0.63
$5,000-7,499 1.04 1.39 1.53 0.65 0.67$7,500 or more 0.71 0.98 0.95 0.99 0.62
Institution typePublic
Less-than-2-year 3.68 3.89 3.37 0.48 2.382-year 1.13 1.06 0.54 0.20 0.504-year 0.57 0.57 0.66 0.34 0.26
Non-doctorate-granting 1.18 1.27 1.38 0.73 0.46Doctorate-granting 0.60 0.50 0.69 0.33 0.32
Private not-for-profitLess-than-4-year 3.65 3.38 5.02 2.10 1.71
4-year 0.76 1.01 1.19 0.83 0.62Non-doctorate-granting 1.06 1.50 1.80 1.22 0.90Doctorate-granting 1.04 1.14 1.18 0.94 0.72
Private for-profitLess-than-2-year 2.02 2.47 5.49 0.44 3.032-year or more 1.53 2.50 2.40 0.46 1.33
Attendance patternFull-time/full-year 0.55 0.63 0.66 0.41 0.33Full-time/part-year 1.38 1.24 1.52 0.33 0.67Part-time/full-year 0.97 0.92 0.70 0.22 0.31Part-time/part-year 1.01 0.79 0.36 0.09 0.64
SOURCE: U.S. Department of Education, National Center for Education Statistics, 1999-2000 National Postsecondary StudentAid Study (NPSAS:2000).
33 44

Variables used in this report using the Data Analysis System are listed below inuppercase.
ROW VARIABLES IN MOST TABLES
INCOME Dependency and 1998 income levelTUITION2 Tuition and fees 1999-2000AIDSECT Institution type 1999-2000ATTNSTAT Attendance pattern 1999-2000DEPEND Dependency status 1999-2000
COLUMN VARIABLES USED IN TABLES 1-2TOTAID Total aid 1999-2000TOTGRT Total grants 1999-2000TOTLOAN Total loans (except PLUS) 1999-2000TOTWKST Total work-study 1999-2000TOTOTHR Total other type of aid (includes assistantships & PLUS) 1999-2000
COLUMN VARIABLES USED IN TABLES 3-4TFEDAID Total federal aid amount 1999-2000TFEDGRT Total federal grant amount 1999-2000TFEDLN Total federal loan amount (except PLUS) 1999-2000TFEDWRK Total federal work-study 1999-2000PLUSAMT PLUS loan total 1999-2000INSTAMT Institutional total aid 1999-2000INGRTAMT Institutional grant total 1999-2000STATEAMT State aid total amount 1999-2000STGTAMT State grant total 1999-2000
ADDITIONAL ROW VARIABLES USED IN TABLES 5-7; ALSO USED AS COLUMNVARIABLES IN TABLES 8-11
TOTAID Total aid 1999-2000PELLAMT Pell grant 1999-2000STAFFAMT Stafford loan total amount (FFEL+Direct) 1999-2000STAFSUB Stafford subsidized amount (FFEL+Direct) 1999-2000STAFUNSB Stafford unsubsidized amount (FFEL+Direct) 1999-2000TITIVAMT Title IV aid total amount 1999-2000T4LNAMT1 Title IV loans (except PLUS) 1999-2000PERKAMT Perkins loan amount 1999-2000
COLUMN VARIABLE USED IN TABLE 12AIDPACK Aid package by type of aid 1999-2000

COLUMN VARIABLES USED IN TABLES 13-14TOTAIDTOTLOANSTAFFAMTSTAFSUBSTAFUNSBPERKAMTINSTAMTASTAMTEMPLYAMT
Total aid 1999-2000Total loan (except PLUS) 1999-2000Stafford loan total amount (FFEL+Direct) 1999-2000Stafford subsidized amount (FFEL+Direct) 1999-2000Stafford unsubsidized amount (FFEL+Direct) 1999-2000Perkins amount 1999-2000Institutional total aid 1999-2000Total assistantships 1999-2000Total employer aid 1999-2000
ROW VARIABLES USED IN TABLES 13-14AIDCTRL InstitUtion control 1999-2000GRADDEG Type of graduate program 1999-2000PGMSEC Graduate program and institution type 1999-2000INCOME 1998 income level++++++++++++++++++++++++++++++++++++++++++++++++++++++++
DESCRIPTION OF VARIABLES USED IN THIS REPORT
Readers interested in learning more about the Department of Education's Title IV aid programscan find it by pointing their Web browser to:htto://www.ed.aov/offices/OSFAP/Students/student.html
Students who attended more than one institution (about 6 percent of undergraduates andnearly 4 percent of graduate students) are coded in a separate category ("multiple institutions")for institution type, institution control, and attendance pattern. Although included in the "totals"in this report, due to confounding tuition and fees and attendance patterns, students whoattended multiple institution were excluded in the estimates by institution type, tuition and feescategories, and attendance pattern.
AIDCTRL Institution control (with multiple) 1999-2000Control of the NPSAS sample institution attended during 1999-2000, indicating those who alsoattended other institutions. Students who attended more than one institution (about 6 percentof undergraduates and nearly 4 percent of graduate students) are coded in a separate category,'but were not reported in the estimates for institution control in this report. For students whoattended more than one institution during 1999-2000, the NPSAS sample institution may notrepresent where all or part of the financial aid was actually received.Sources: Derived
AIDPACK Aid package by type of aid 1999-2000Indicates package by type of aid (grants, loans, work-study, other) received during 1999-2000.For students with any aid (TOTAID >0), indicates combinations of aid from grants (TOTGRT),student loans (TOTLOAN), work-study (TOTWKST), and other types of aid (TOTOTHR, whichincludes parent PLUS loans).See individual variable descriptions for further details.Sources: Derived

AIDSECT Institution type (with multiple) 1999-2000Indicates the level and control of the institution attended. For students who attended only oneinstitution (STUDMULT=1), this is the same as the NPSAS sample institution type (SECTOR9).Students who attended more than one institution (about 6 percent of undergraduates andnearly 4 percent of graduate students) are coded in a separate category, but were not reportedin the estimates for institution type in this report. For students who attended more than oneinstitution during 1999-2000, the NPSAS sample institution may not represent where all or partof the financial aid was actually received.See individual variable descriptions for further details.Sources: Derived
ASTAMT Assistantship amount total 1999-2000Indicates total amount of assistantship funds received during 1999-2000. The sum of amountsfrom all research assistantships (RESAMT), teaching assistantships (TEACHAMT), and any othertype of graduate assistantship (GRADAST). Classified as "other" type of institutional aid in theaward grid (see TOTAID). Assistantships are often treated as employee salaries rather thanfinancial aid by institutions and may not be recorded in the financial aid records. Fornonrespondents to the telephone interviews, assistantships are substantially underreported inCADE, so the CATIWT should be used for reliable estimates of these variables.See individual variable descriptions for further details.Sources: Student CATI, CADE
ATTNSTAT Attendance pattern 1999-2000
Indicates a student's attendance pattern at all institutions attended during 1999-2000. Studentsare considered to have enrolled for a full year if they were enrolled 9 or more months during theNPSAS year. Months did not have to be contiguous, and students did not have to be enrolledfor a full month in order to be considered enrolled for that month. Specific categories ofATTNSTAT: Full-time/full-year, 1 institution: Enrolled 9 or more months full time during 1999-2000. (Additional months enrolled could be part time) Full-time/part-year, 1 institution: Enrolledless than 9 months during 1999-2000 and attending full time in all of these months. Part-time/full-year, 1 institution: Enrolled 9 or more months during 1999-2000, but less than 9months were full time. Part-time/part-year, 1 institution: Enrolled less than 9 months during1999-2000 and all or some of these months were part time. Multiple institutions: Studentattended more than one institution in 1999-2000. Sources: CADE, student CATI
DEPEND Dependency status 1999-2000Student dependency status for federal financial aid. Students under age 24 are generallyconsidered to be dependent on their parents for financial support. Students were considered tobe independent in 1999-2000 if they met any of the following criteria:
1) Age twenty-four or older as of 12/31/19992) A veteran of the U.S. Armed Forces3) Enrolled in a graduate or professional program beyond a bachelor's degree4) Married5) Orphan or ward of the court6) Have legal dependents other than a spouse
36 47

Students under 24 who do not meet any of these conditions but are receiving no parentalsupport may be classified as independent by campus financial aid officers using theirprofessional judgment.Sources: CPS:2000, CADE, derived from Student CATI, imputation
EMPLYAMT Employer aid 1999-2000Indicates total amount of aid received from employers during 1999-2000. Includes tuitionwaivers for employees and dependents of postsecondary institutions and employer-paid tuitionreimbursements. Employer paid tuition reimbursements are usually paid directly to the student,and not through the financial aid office, so they are substantially underreported by institutionsin CADE. For a more reliable estimate use the CATI weight.Sources: Student CATI, CADE
GRADDEG Type of graduate program 1999-2000Indicates the general type of graduate degree program in which the student was enrolled in1999-2000. For a detailed list of the degree programs see DEGPGM. NCES defines first-professional programs to include the following ten fields of study: dentistry, medicine,optometry, osteopathic medicine, pharmacy, podiatric medicine, veterinary medicine,chiropractic, law, and theological professions.Sources: Student CATI, CADE
INCOME Dependency and 1998 income levelIndicates total income in 1998 (categorical). Recodes total income (CINCOME) by dependency(DEPEND) into categorical income levels. Calendar year income in 1998 was used for the federalneed analysis to determine financial aid eligibility in 1999-2000. DEPINC, INDEPINC, andCINCOME are continuous income variables.See individual variable descriptions for further details.Sources: CPS:2000, Student CATI, imputation
INGRTAMT Institutional grants total 1999-2000Indicates the total amount of institutional grant aid received in 1999-2000. Includes all grantsand scholarships, tuition waivers, and graduate fellowships received during the NPSAS year.See grid under TOTAID for more information.Sources: CADE, student CATI
INSTAMT Institutional aid total 1999-2000Indicates the total institutional aid amount received during 1999-2000. Equal to the sum ofinstitutional grants and fellowships (INGRTAMT), institutional loans (INLNAMT), institution-sponsored work-study (INSTWRK), and all other institutional amounts including assistantships(INOTHAMT).See grid under TOTAID for more information.Sources: CADE, student CATI
37 48
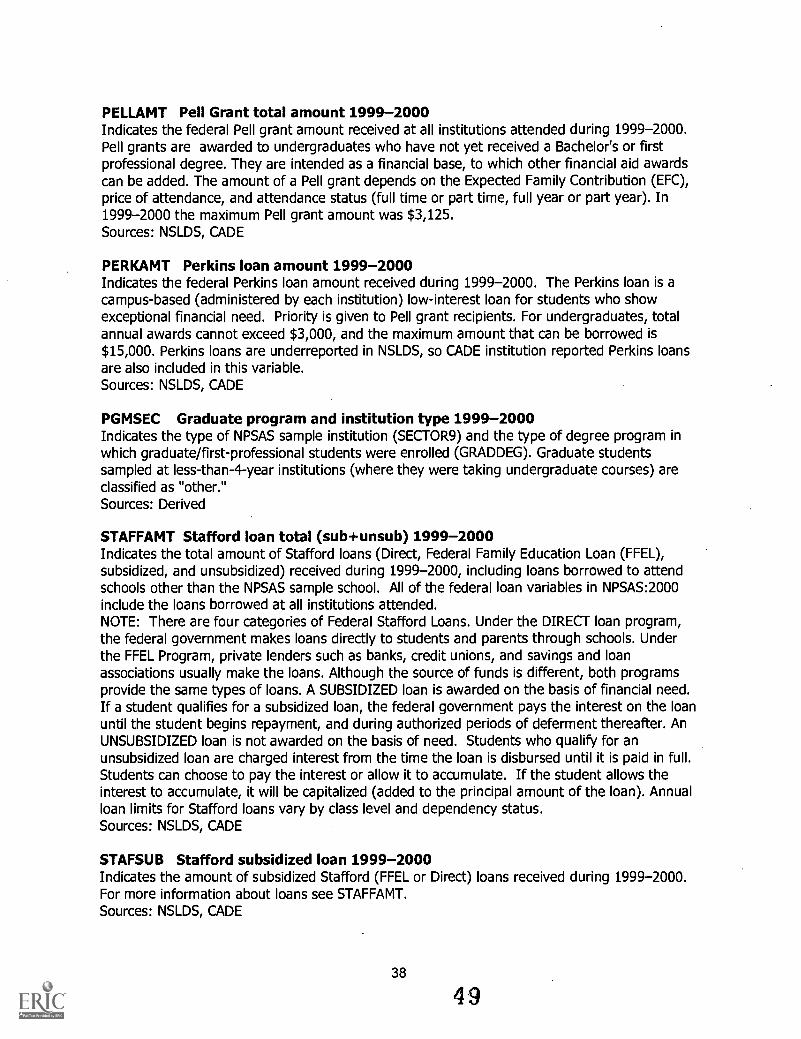
PELLAMT Pell Grant total amount 1999-2000Indicates the federal Pell grant amount received at all institutions attended during 1999-2000.Pell grants are awarded to undergraduates who have not yet received a Bachelor's or firstprofessional degree. They are intended as a financial base, to which other financial aid awardscan be added. The amount of a Pell grant depends on the Expected Family Contribution (EFC),price of attendance, and attendance status (full time or part time, full year or part year). In1999-2000 the maximum Pell grant amount was $3,125.Sources: NSLDS, CADE
PERKAMT Perkins loan amount 1999-2000Indicates the federal Perkins loan amount received during 1999-2000. The Perkins loan is acampus-based (administered by each institution) low-interest loan for students who showexceptional financial need. Priority is given to Pell grant recipients. For undergraduates, totalannual awards cannot exceed $3,000, and the maximum amount that can be borrowed is$15,000. Perkins loans are underreported in NSLDS, so CADE institution reported Perkins loansare also included in this variable.Sources: NSLDS, CADE
PGMSEC Graduate program and institution type 1999-2000Indicates the type of NPSAS sample institution (SECTOR9) and the type of degree program inwhich graduate/first-professional students were enrolled (GRADDEG). Graduate studentssampled at less-than-4-year institutions (where they were taking undergraduate courses) areclassified as "other."Sources: Derived
STAFFAMT Stafford loan total (sub+unsub) 1999-2000Indicates the total amount of Stafford loans (Direct, Federal Family Education Loan (FFEL),subsidized, and unsubsidized) received during 1999-2000, including loans borrowed to attendschools other than the NPSAS sample school. All of the federal loan variables in NPSAS:2000include the loans borrowed at all institutions attended.NOTE: There are four categories of Federal Stafford Loans. Under the DIRECT loan program,the federal government makes loans directly to students and parents through schools. Underthe FFEL Program, private lenders such as banks, credit unions, and savings and loanassociations usually make the loans. Although the source of funds is different, both programsprovide the same types of loans. A SUBSIDIZED loan is awarded on the basis of financial need.If a student qualifies for a subsidized loan, the federal government pays the interest on the loanuntil the student begins repayment, and during authorized periods of deferment thereafter. AnUNSUBSIDIZED loan is not awarded on the basis of need. Students who qualify for anunsubsidized loan are charged interest from the time the loan is disbursed until it is paid in full.Students can choose to pay the interest or allow it to accumulate. If the student allows theinterest to accumulate, it will be capitalized (added to the principal amount of the loan). Annualloan limits for Stafford loans vary by class level and dependency status.Sources: NSLDS, CADE
STAFSUB Stafford subsidized loan 1999-2000Indicates the amount of subsidized Stafford (FFEL or Direct) loans received during 1999-2000.For more information about loans see STAFFAMT.Sources: NSLDS, CADE
38
49
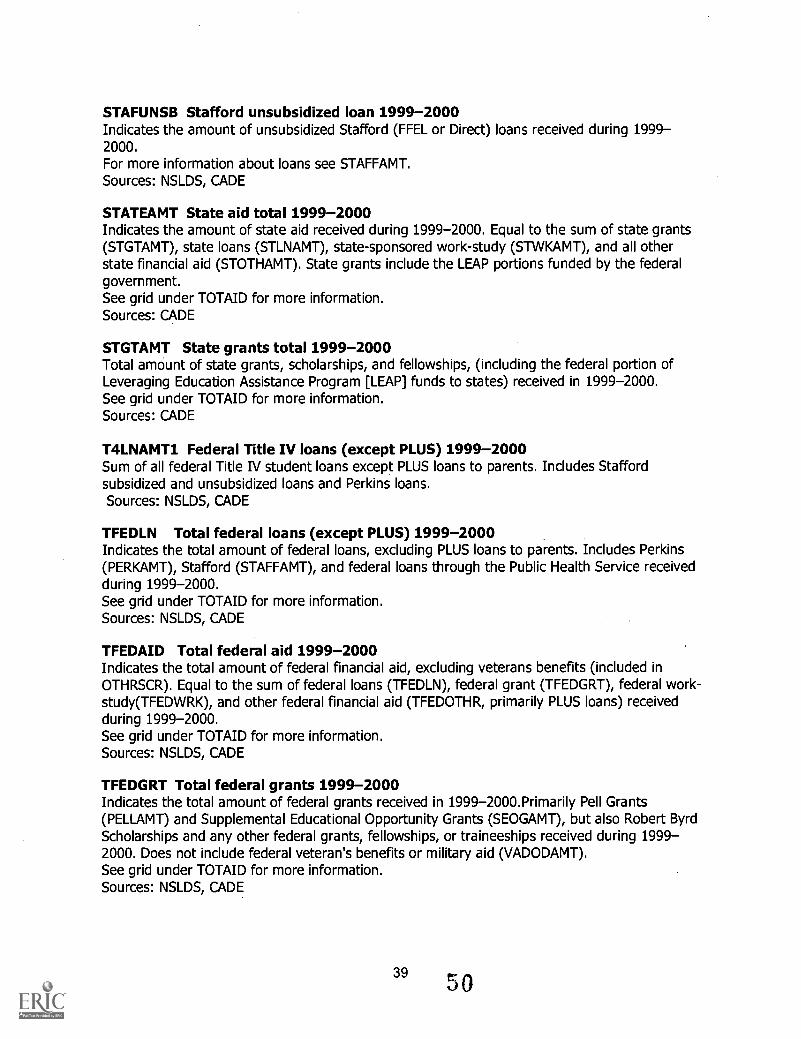
STAFUNSB Stafford unsubsidized loan 1999-2000Indicates the amount of unsubsidized Stafford (FFEL or Direct) loans received during 1999-2000.For more information about loans see STAFFAMT.Sources: NSLDS, CADE
STATEAMT State aid total 1999-2000Indicates the amount of state aid received during 1999-2000. Equal to the sum of state grants(STGTAMT), state loans (STLNAMT), state-sponsored work-study (STWKAMT), and all otherstate financial aid (STOTHAMT). State grants include the LEAP portions funded by the federalgovernment.See grid under TOTAID for more information.Sources: CADE
STGTAMT State grants total 1999-2000Total amount of state grants, scholarships, and fellowships, (including the federal portion ofLeveraging Education Assistance Program [LEAP] funds to states) received in 1999-2000.See grid under TOTAID for more information.Sources: CADE
T4LNAMT1 Federal Title IV loans (except PLUS) 1999-2000Sum of all federal Title IV student loans except PLUS loans to parents. Includes Staffordsubsidized and unsubsidized loans and Perkins loans.Sources: NSLDS, CADE
TFEDLN Total federal loans (except PLUS) 1999-2000Indicates the total amount of federal loans, excluding PLUS loans to parents. Includes Perkins(PERKAMT), Stafford (STAFFAMT), and federal loans through the Public Health Service receivedduring 1999-2000.See grid under TOTAID for more information.Sources: NSLDS, CADE
TFEDAID Total federal aid 1999-2000Indicates the total amount of federal financial aid, excluding veterans benefits (included inOTHRSCR). Equal to the sum of federal loans (TFEDLN), federal grant (TFEDGRT), federal work-study(TFEDWRK), and other federal financial aid (TFEDOTHR, primarily PLUS loans) receivedduring 1999-2000.See grid under TOTAID for more information.Sources: NSLDS, CADE
TFEDGRT Total federal grants 1999-2000Indicates the total amount of federal grants received in 1999-2000.Primarily Pell Grants(PELLAMT) and Supplemental Educational Opportunity Grants (SEOGAMT), but also Robert ByrdScholarships and any other federal grants, fellowships, or traineeships received during 1999-2000. Does not include federal veteran's benefits or military aid (VADODAMT).See grid under TOTAID for more information.Sources: NSLDS, CADE
3950
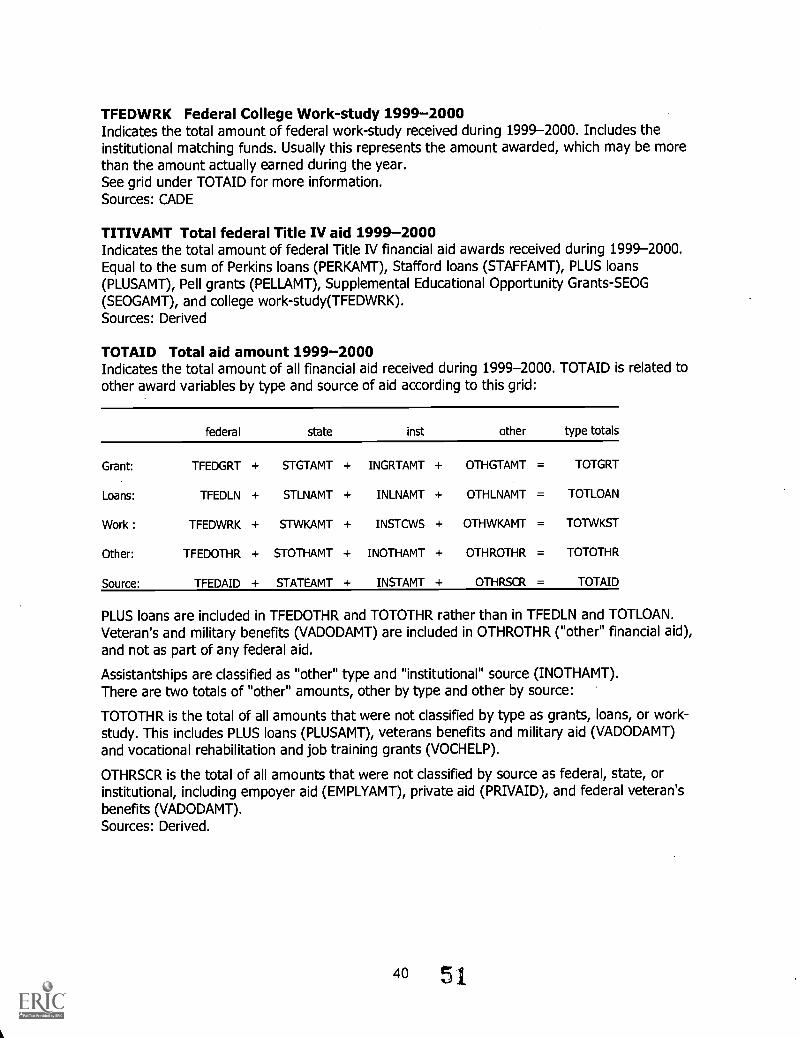
TFEDWRK Federal College Work-study 1999-2000Indicates the total amount of federal work-study received during 1999-2000. Includes theinstitutional matching funds. Usually this represents the amount awarded, which may be morethan the amount actually earned during the year.See grid under TOTAID for more information.Sources: CADE
TITIVAMT Total federal Title IV aid 1999-2000Indicates the total amount of federal Title IV financial aid awards received during 1999-2000.Equal to the sum of Perkins loans (PERKAMT), Stafford loans (STAFFAMT), PLUS loans(PLUSAMT), Pell grants (PELLAMT), Supplemental Educational Opportunity Grants-SEOG(SEOGAMT), and college work-study(TFEDWRK).Sources: Derived
TOTAID Total aid amount 1999-2000Indicates the total amount of all financial aid received during 1999-2000. TOTAID is related toother award variables by type and source of aid according to this grid:
federal state inst other type totals
Grant: TFEDGRT + STGTAMT + INGRTAMT + OTHGTAMT = TOTGRT
Loans: TFEDLN + STLNAMT + INLNAMT + OTHLNAMT = TOTLOAN
Work : TFEDWRK + STWKAMT + INSTCWS + OTHWKAMT = TOTWKST
Other: TFEDOTHR + STOTHAMT + INOTHAMT + OTHROTHR = TOTOTHR
Source: TFEDAID + STATEAMT + INSTAMT + OTHRSCR = TOTAID
PLUS loans are included in TFEDOTHR and TOTOTHR rather than in TFEDLN and TOTLOAN.Veteran's and military benefits (VADODAMT) are included in OTHROTHR ("other" financial aid),and not as part of any federal aid.
Assistantships are classified as "other" type and "institutional" source (INOTHAMT).There are two totals of "other" amounts, other by type and other by source:
TOTOTHR is the total of all amounts that were not classified by type as grants, loans, or work-study. This includes PLUS loans (PLUSAMT), veterans benefits and military aid (VADODAMT)and vocational rehabilitation and job training grants (VOCHELP).
OTHRSCR is the total of all amounts that were not classified by source as federal, state, orinstitutional, including empoyer aid (EMPLYAMT), private aid (PRIVAID), and federal veteran'sbenefits (VADODAMT).Sources: Derived.
40 51

TOTGRT Total grants and scholarships 1999-2000Indicates the total amount of all grants and scholarships: federal, state, institutional, and otherreceived during 1999-2000. Equal to sum of all federal grants (TFEDGRT), state grants(STGTAMT), institutional grants (INGTAMT), and "other" grants that were not classified asfederal, state or institutional (OTHGTAMT). Includes employer tuition reimbursements(EMPLYAMT) and grants from private sources (PRIVAID).See grid under TOTAID for more information.Sources: CADE, NSLDS, student CATI
TOTLOAN Total student loans (except PLUS) 1999-2000Indicates the total amount of all loans to students: federal, state, institutional, and privatesector received during 1999-2000. Equal to the sum of federal loan amount (TFEDLN), stateloan amount (STLNAMT), institution loan amount (INLNAMT), and other loan amounts(OTHLNAMT) which include private commercial loans (PRIVLOAN). Does not include PLUS loans(PLUSAMT).See grid under TOTAID for more information.Sources: NSLDS, CADE, student CATI
TOTOTHR Other type of aid (includes PLUS) 1999-2000Indicates the total amount of aid received during 1999-2000 that was not classified as grants,student loans, or work-study. Equal to the sum of other federal amounts (TFEDOTHR), otherstate amounts (STOTHAMT), other institutional amounts (INOTHAMT), and other types ofaid from other sources (OTHRSCR),Includes PLUS loans (in TFEDOTHR), teaching and researchassistantships (in INOTHAMT), vocational rehabilitation and job training grants (usually inSTOTHAMT), and veterans benefits and military tuition aid (in OTHRSCR).See grid under TOTAID for more information.Sources: Derived
TOTWKST Total work-study amount 1999-2000Indicates the total amount of all work study awards received during 1999-2000. Equal to thesum of federal work-study amount (TFEDWRK), state work-study amount (STWKAMT),institution work-study amount (INSTWRK), and other unclassified work-study amount(OTHWKAMT). Usually reflects the amount awarded, which may be more than the amountactually earned. Research and teaching assistantships are included in INOTHAMT ("other"institutional aid amounts).See grid under TOTAID for more details.Sources: CADE
TUITION2 Tuition and fees 1999-2000 .
Tuition and fees charged at the sampled NPSAS institution for students who attended only oneinstitution during 1999-2000. Based primarily on information from the registrar's office.Excludes about 6 percent of undergraduates and nearly 4 percent of graduate students whoattended more than one institution because the tuition that the student was charged at theother institution(s) was not known.Sources: CADE, IPEDS-IC, Derived
415 2

Analysis Weights
Additional information on the weight components will be described in the forthcomingMethodology Report. The weight components for the student weights for this analysis are thefollowing:
(1) Institution Sampling Weight (WT1)(2) Adjustment for Institution Multiplicity (WT2)(3) Institution Poststratification Adjustment (WT3)(4) Adjustment for Institution Nonresponse (WT4)(5) Student Sampling Weight (WT5)(6) Student Subsampling Weight (WT6)(7) Adjustment for Students Never Sent to CATI (WT7)(8) Adjustment for Student Multiplicity (WT8)(9) Adjustment for Unknown Eligibility Status (WT9)(10) Weight Trimming Adjustment (WT10)(11) Adjustment for Study Nonresponse (WT11)(12) Poststratification Adjustment for Study Respondents (WT12)(13) Adjustment for Not Locating Students (WT13)(14) Adjustment for CATI Refusals (WT14)(15) Adjustment for Other CATI Nonresponse (WT15)(16) Poststratification Adjustment for CATI Respondents (WT16)
Properly combined, these components result in two analysis weights: CATIWT and STUDYWT.Except for employer aid and assistantships for graduate students, all estimates in this reportwere produced using the STUDYWT. The appropriate weight for analysis depends on theparticular variables of interest to the analyst, as described below:
CATIWT is the analysis weight for computer-assisted telephone interview (CATI) respondents.Use this weight when producing estimates where the items of interest are based entirely ontelephone interview data (or require interview data to be reliable). These would includeestimates such as: the percentage employed or percentage who did any community service orother items where the primary source of the information is the telephone interview (StudentCATI).
STUDYWT is the analysis weight for all students in the study, including those without atelephone interview. Use this weight when the primary source of the data is from the institution(CADE), the Central Processing System (CPS) or the National Student Loan Data System(NSLDS). For example, when producing percentages and average amounts of financial aid byinstitution type or family income level, the STUDYWT should be used.
For further information on these and other variables in the NPSAS:2000 data set, see the fullData Analysis System at http://nces.ed.gov/das, or the forthcoming NPSAS:2000 MethodologyReport.
42 53

U.S. Department of EducationOffice of Educational Research and Improvement (OERI)
National Library of Education (NLE)Educational Resources Information Center (ERIC)
NOTICE
Reproduction Basis
Ebel Wool Resource In !carnation Centel
This document is covered by a signed "Reproduction Release (Blanket)"form (on file within the ERIC system), encompassing all or classes ofdocuments from its source organization and, therefore, does not require a"Specific Document" Release form.
This document is Federally-funded, or carries its own permission toreproduce, or is otherwise in the public domain and, therefore, may bereproduced by ERIC without a signed Reproduction Release form (either"Specific Document" or "Blanket").
EFF-089 (1/2003)