republic of indonesia - djppr.kemenkeu.go.id · this presentation may not be reproduced, ......
TRANSCRIPT

Republic of Indonesia
2018 Investor Update
Stability at the Forefront with Unwavering
Reforms Commitment
June 2018
2
This presentation has been prepared by the Republic of Indonesia (the “Republic”). This presentation is being presented solely for your
information and is subject to change without notice. By accessing this presentation, you are agreeing to be bound by the restrictions set out
below. Any failure to comply with these restrictions may constitute a violation of applicable securities laws.
This presentation contains forward-looking statements that involve risks and uncertainties. All statements other than statements of historical
facts are forward-looking statements. These statements involve known and unknown risks, uncertainties and other factors that may cause the
actual results, performance or achievements of the Republic to be materially different from those expressed or implied by the forward-looking
statements.
The Republic has filed a registration statement (including the prospectus) with the U.S. Securities and Exchange Commission (the “SEC”). You
should read the prospectus in that registration statement (file no. -223441), any prospectus supplement and other documents that the Republic
has filed with the SEC for more complete information about the Republic. A copy of the prospectus can be obtained for free by visiting EDGAR
on the SEC web site at www.sec.gov, from Deutsche Bank Securities Inc. at 60 Wall Street, New York, NY 10005, USA, Attention: Prospectus
Group, by calling 1-800-503-4611, or by emailing [email protected].
A prospectus of the Republic, dated March 16, 2018, is available from the SEC website at
https://www.sec.gov/Archives/edgar/data/1719614/000119312518070289/d714087dsb.htm
This presentation may not be reproduced, disseminated or quoted without the prior written consent of the Republic.
Disclaimer
3
Outline
Recent Macroeconomic Development2
3 Financial Market Condition
2018 State Budget Realization Performance4
5 Fiscal Incentive to Support Investment and Export
6 Medium Term Fiscal Objectives & 2019 Macro-Fiscal Framework
7 Monetary Policy and Banking Sector
Executive Summary1
8 Debt Management and Budget Financing

Executive Summary
01Widi Island in North Maluku,
Indonesia
5
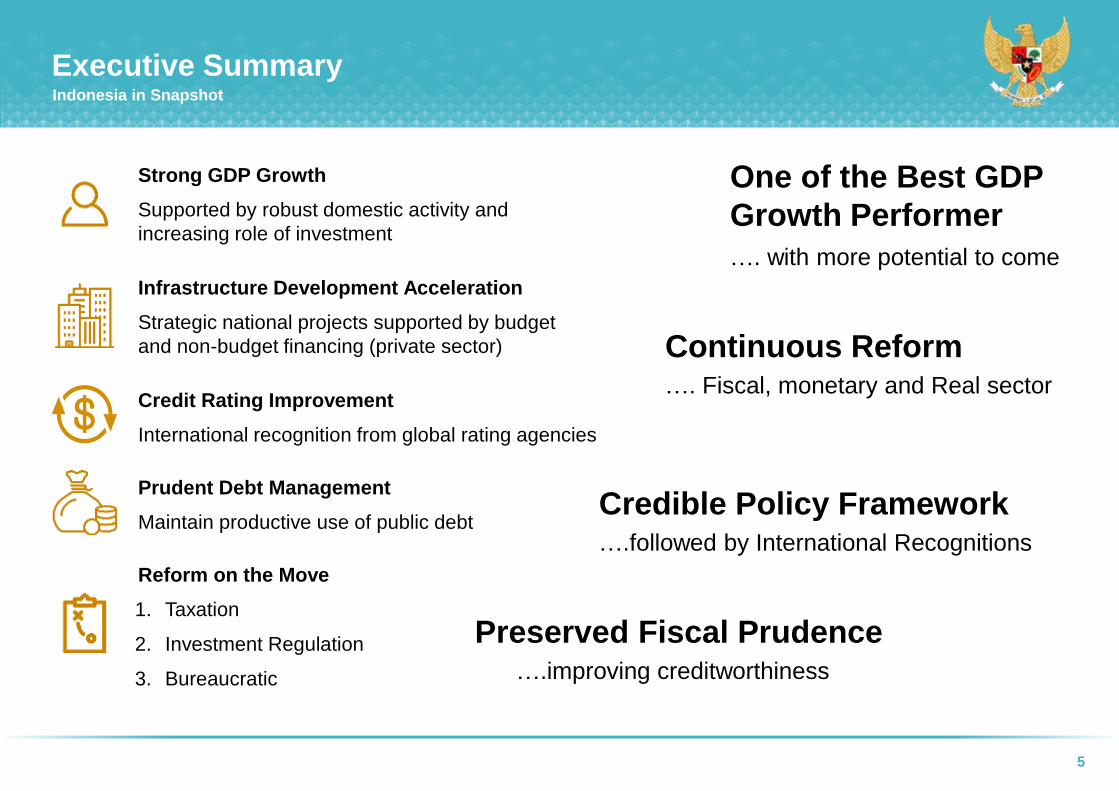
Executive SummaryIndonesia in Snapshot
…. with more potential to come
One of the Best GDP
Growth Performer
Infrastructure Development Acceleration
Strategic national projects supported by budget
and non-budget financing (private sector)
Strong GDP Growth
Supported by robust domestic activity and
increasing role of investment
Credit Rating Improvement
International recognition from global rating agencies
Reform on the Move
1. Taxation
2. Investment Regulation
3. Bureaucratic
…. Fiscal, monetary and Real sector
Continuous Reform
Prudent Debt Management
Maintain productive use of public debt….followed by International Recognitions
Credible Policy Framework
….improving creditworthiness
Preserved Fiscal Prudence

6
Indonesia’s GDP Growth Has Been RobustConsumption and investment remain as the main engines of growth
GDP breakdown by expenditure
(%, YoY)
2016 2017 2018
Q1 Q2 Q3 Q4 Y Q1 Q2 Q3 Q4 Y Q1
Household Consumption 4.98 5.10 5.04 5.03 5.04 5.00 5.02 4.95 4.98 4.98 5.01
Government Consumption 3.43 6.21 (2.95) (4.03) (0.14) 2.69 (1.92) 3.48 3.81 2.14 2.73
Gross Fixed Capital Formation 4.67 4.18 4.24 4.79 4.47 4.77 5.34 7.08 7.27 6.15 7.95
Export (3.10) (1.50) (5.75) 4.15 (1.57) 8.41 2.80 17.01 8.50 9.09 6.17
Import (5.04) (3.47) (4.13) 2.72 (2.45) 4.81 0.20 15.46 11.81 8.06 12.75
GDP 4.94 5.21 5.03 4.94 5.03 5.01 5.01 5.06 5.19 5.07 5.06
7.2 7.1
6.0
5.1
3.0 2.5 2.4 2.3 2.2 2.2 2.1
1.7 1.5 1.3 1.1 0.7
0.3 0.3
(0.5)
India
Ch
ina
Turk
ey
Indon
esia
Kore
a
Me
xic
o
Austr
alia
Saud
i A
rabia
Un
ite
d K
ing
dom
Un
ite
d S
tate
s
Ca
nad
a
Germ
any
South
Afr
ica
Japa
n
Fra
nce
Arg
entina
Ita
ly
Ru
ssia
Bra
zil
Avg. GDP Growth 5 Years Std. Dev. GDP Growth 5 Years
Institutions2018 GDP Growth
Projection
Government of Indonesia (2018 Budget) 5.4%
IMF (WEO Apr 2018) 5.3%
World Bank (IEQ June 2018) 5.2%
ADB (ADO Apr 2018) 5.3%
S&P (May 2018) 5.3%
Fitch (Dec 2017) 5.4%
Domestic and foreign direct investment have
been picking up thanks to the acceleration of
infrastructure spending.
International trade is rebounding and supporting
growth, partly attributed to the increase of
commodity prices, but also signals that global
demand improves.
Indonesia’s growth is still stable and higher than
most of its G20 peers
Medium term growth is well maintained through
improving investment climate and fiscal incentive
Indonesia GDP ProjectionGDP Growth Comparison Amongst G-20 Countries
7
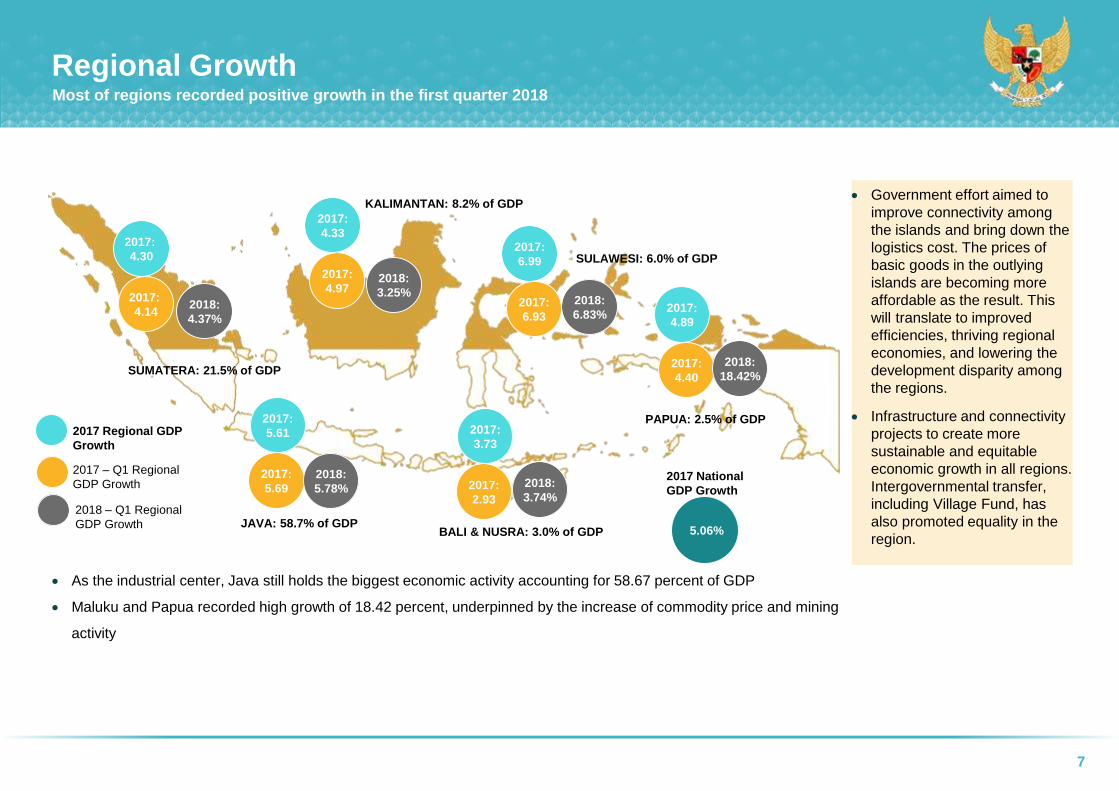
Regional GrowthMost of regions recorded positive growth in the first quarter 2018
5.06%
2017 National
GDP Growth
SUMATERA: 21.5% of GDP
2018:
4.37%
2017:
4.14
2017:
5.69
2018:
5.78%
2018:
3.25%
2017:
4.972018:
6.83%2017:
6.93
2018:
3.74%2017:
2.93
2017:
4.40
JAVA: 58.7% of GDP
KALIMANTAN: 8.2% of GDP
SULAWESI: 6.0% of GDP
PAPUA: 2.5% of GDP
BALI & NUSRA: 3.0% of GDP
2018:
18.42%
As the industrial center, Java still holds the biggest economic activity accounting for 58.67 percent of GDP
Maluku and Papua recorded high growth of 18.42 percent, underpinned by the increase of commodity price and mining
activity
2017:
4.30
2017:
5.61
2017:
4.332017:
6.99
2017:
3.73
2017:
4.89
2017 Regional GDP
Growth
2017 – Q1 Regional
GDP Growth
2018 – Q1 Regional
GDP Growth
Government effort aimed to
improve connectivity among
the islands and bring down the
logistics cost. The prices of
basic goods in the outlying
islands are becoming more
affordable as the result. This
will translate to improved
efficiencies, thriving regional
economies, and lowering the
development disparity among
the regions.
Infrastructure and connectivity
projects to create more
sustainable and equitable
economic growth in all regions.
Intergovernmental transfer,
including Village Fund, has
also promoted equality in the
region.
8
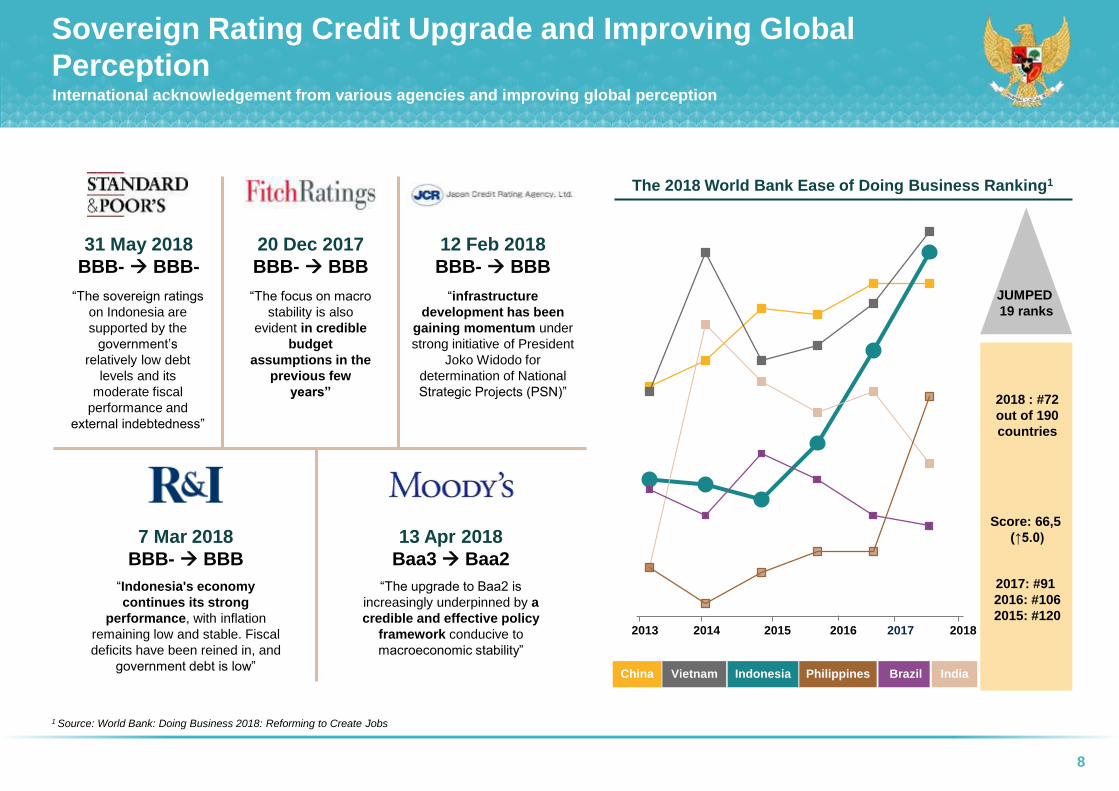
Sovereign Rating Credit Upgrade and Improving Global
PerceptionInternational acknowledgement from various agencies and improving global perception
1 Source: World Bank: Doing Business 2018: Reforming to Create Jobs
The 2018 World Bank Ease of Doing Business Ranking1
JUMPED
19 ranks
2017: #91
2016: #106
2015: #120
2018 : #72
out of 190
countries
Score: 66,5
(↑5.0)
China Vietnam Indonesia Philippines Brazil India
2013 2014 2015 2016 2017 2018
31 May 2018
BBB- BBB-
20 Dec 2017
BBB- BBB
12 Feb 2018
BBB- BBB
7 Mar 2018
BBB- BBB
13 Apr 2018
Baa3 Baa2
“The upgrade to Baa2 is
increasingly underpinned by a
credible and effective policy
framework conducive to
macroeconomic stability”
“The sovereign ratings
on Indonesia are
supported by the
government’s
relatively low debt
levels and its
moderate fiscal
performance and
external indebtedness”
“The focus on macro
stability is also
evident in credible
budget
assumptions in the
previous few
years”
“infrastructure
development has been
gaining momentum under
strong initiative of President
Joko Widodo for
determination of National
Strategic Projects (PSN)”
“Indonesia's economy
continues its strong
performance, with inflation
remaining low and stable. Fiscal
deficits have been reined in, and
government debt is low”

9
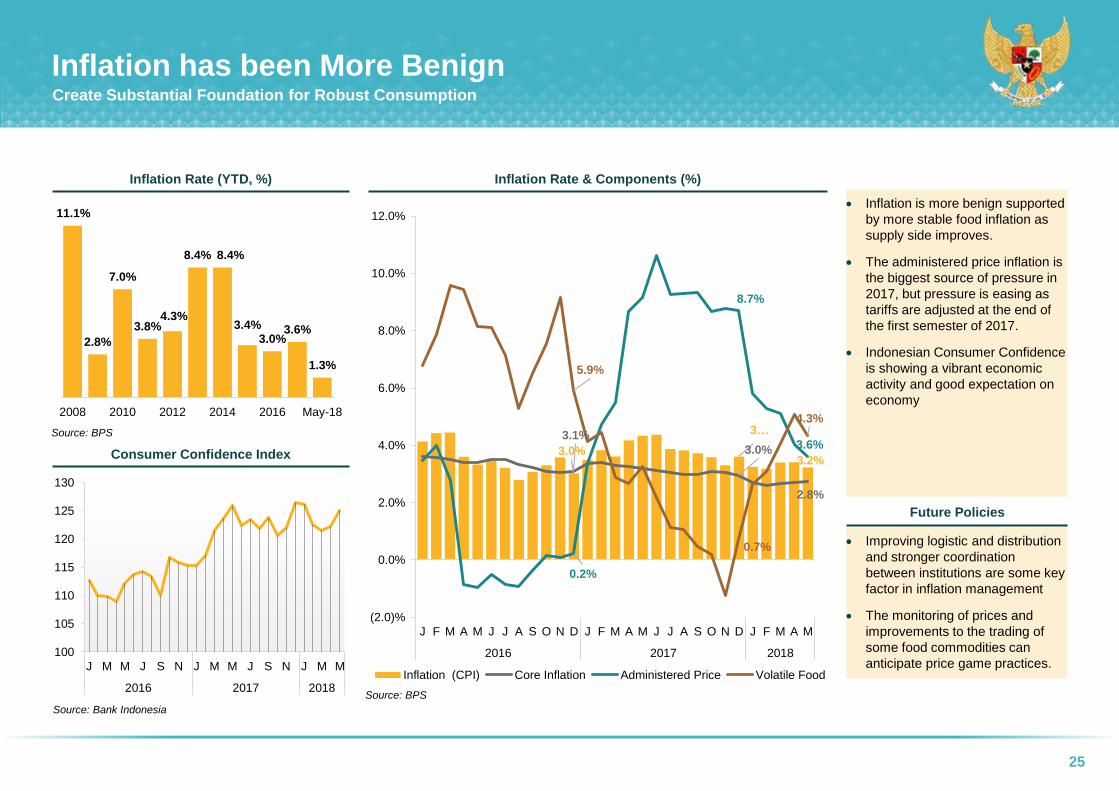
Inflation has been More BenignCreate Substantial Foundation for Robust Consumption
Inflation Rate & Components (%)Inflation Rate (YTD, %)
3.0%
3…
3.2%
3.1%
3.0%
2.8%
0.2%
8.7%
3.6%
5.9%
0.7%
4.3%
(2.0)%
0.0%
2.0%
4.0%
6.0%
8.0%
10.0%
12.0%
J F M A M J J A S O N D J F M A M J J A S O N D J F M A M
2016 2017 2018
Inflation (CPI) Core Inflation Administered Price Volatile Food
Future Policies
Improving logistic and distribution
and stronger coordination
between institutions are some key
factor in inflation management
The monitoring of prices and
improvements to the trading of
some food commodities can
anticipate price game practices.
Inflation is more benign supported
by more stable food inflation as
supply side improves.
The administered price inflation is
the biggest source of pressure in
2017, but pressure is easing as
tariffs are adjusted at the end of
the first semester of 2017.
Indonesian Consumer Confidence
is showing a vibrant economic
activity and good expectation on
economy
Consumer Confidence Index
Source: Bank Indonesia
100
105
110
115
120
125
130
J M M J S N J M M J S N J M M
2016 2017 2018
11.1%
2.8%
7.0%
3.8%4.3%
8.4% 8.4%
3.4%3.0%
3.6%
1.3%
2008 2010 2012 2014 2016 May-18
Source: BPS
Source: BPS
10
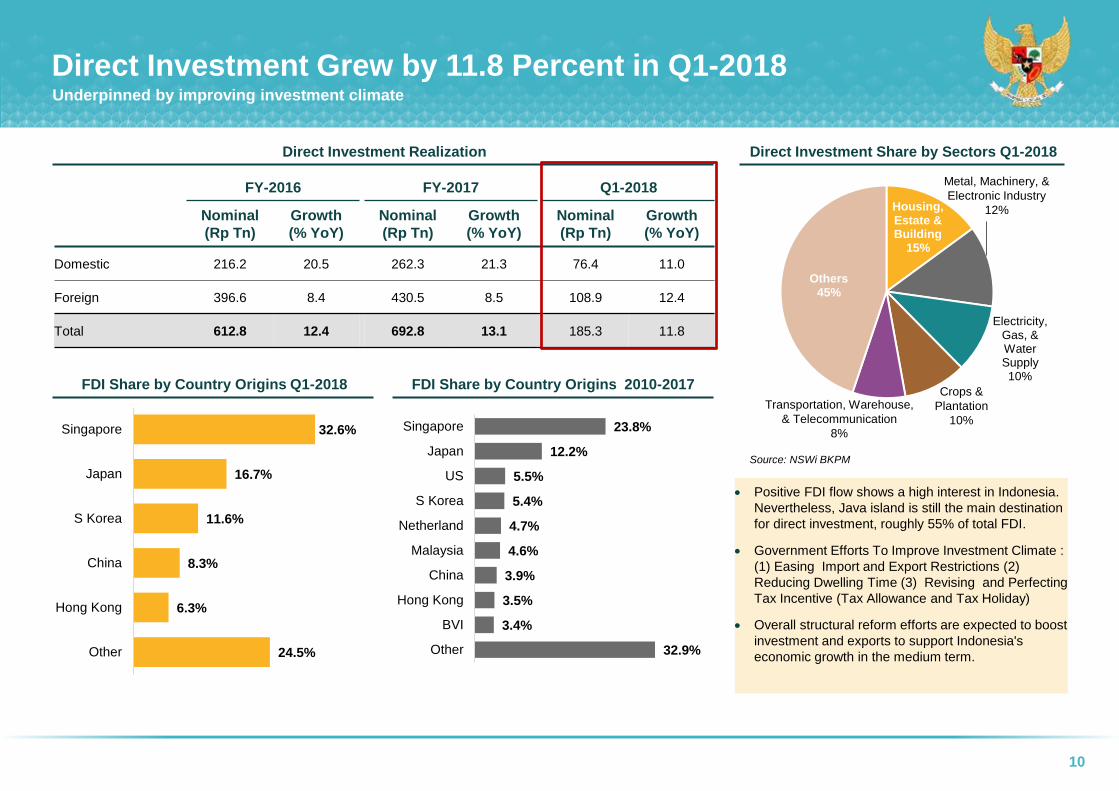
Direct Investment Grew by 11.8 Percent in Q1-2018Underpinned by improving investment climate
Direct Investment Share by Sectors Q1-2018Direct Investment Realization
FY-2016 FY-2017 Q1-2018
Nominal
(Rp Tn)
Growth
(% YoY)
Nominal
(Rp Tn)
Growth
(% YoY)
Nominal
(Rp Tn)
Growth
(% YoY)
Domestic 216.2 20.5 262.3 21.3 76.4 11.0
Foreign 396.6 8.4 430.5 8.5 108.9 12.4
Total 612.8 12.4 692.8 13.1 185.3 11.8
FDI Share by Country Origins Q1-2018 FDI Share by Country Origins 2010-2017
32.6%
16.7%
11.6%
8.3%
6.3%
24.5%
Singapore
Japan
S Korea
China
Hong Kong
Other
23.8%
12.2%
5.5%
5.4%
4.7%
4.6%
3.9%
3.5%
3.4%
32.9%
Singapore
Japan
US
S Korea
Netherland
Malaysia
China
Hong Kong
BVI
Other
Housing, Estate & Building
15%
Electricity, Gas, & Water Supply10%
Others45%
Metal, Machinery, &
Electronic Industry
12%
Transportation, Warehouse,
& Telecommunication
8%
Crops &
Plantation
10%
Source: NSWi BKPM
Positive FDI flow shows a high interest in Indonesia.
Nevertheless, Java island is still the main destination
for direct investment, roughly 55% of total FDI.
Government Efforts To Improve Investment Climate :
(1) Easing Import and Export Restrictions (2)
Reducing Dwelling Time (3) Revising and Perfecting
Tax Incentive (Tax Allowance and Tax Holiday)
Overall structural reform efforts are expected to boost
investment and exports to support Indonesia's
economic growth in the medium term.

11
(2.0)
(1.0)
0.0
1.0
2.0
3.0
M J J A S O N D
201
7-J F M A M J J A S O N D
201
8-J F M A
Non O&G O&G Total
Import Growth Upholds Increasing Domestic Economic
ActivitiesUntil April 2018, Trade Balance is Recording a Deficit of USD1.31 billion
Source: BPS
Cumulative Growth of Export CommodityTrade Balance (USD Billion)
Trade balance is recording deficit
cumulatively in April 2018, due to
high import growth that supports
growing domestic production
Import grew by 23.65% (YTD)
supported by higher demand for
festive seasons of Ramadhan and
Idul Fitri; capital good increase to
support infrastructure development
and military equipment; and raw
material increase that highlights
improving domestic productivity and
economic activity
Export grew by 8.77% (YTD),
underpinned by mining commodity
growth of 33.4% and manufacturing
of 5.3%
Deficit Jan-Apr
2018:
USD1.31 billion
Surplus FY 2016:
USD9.5 billion
Surplus FY 2017:
USD11.8 billion
Cumulative Growth of Import Goods
Contribution to
Total Import
Capital Goods
16.3%
Consumption
Goods 9.1%
Raw Materials
74.6%
Top 4 Export/Import (Non-O&G) by Country
April 2018 (USD Billion)
Export (Non O&G) Import (Non O&G)
China 3.4
Japan 1.6
United States 1.0
Thailand 0.9
1
2
3
4
China 1.8
United States 1.4
Japan 1.4
India 1.0
1
2
3
4
26.1%
21.9%
31.0%
(30.0)%
(10.0)%
10.0%
30.0%
50.0%
M J S N
201
7-J M M J S N
201
8-J M
Consumption goods Raw materials Capital goods
(5.1)%
5.3%
33.4%
4.0%
(60.0)%
(40.0)%
(20.0)%
0.0%
20.0%
40.0%
60.0%
M J J A S O N D
201
7-J F M A M J J A S O N D
201
8-J F M A
Agriculture Manufacturing Mining O&G

12
Macroeconomic Indicators Remain Strong
1 Q1 figures.2 As of April.
Indicators
2016 2017 2018 2019
Revised
Budget
(APBN-P)
Realized
31 May APBN
Realized
31 May
Budget
(APBN)
Realized
31 May
Submitted
to
Parliament
Economic growth (%, yoy) 5.2 4.941
5.2 5.011 5.4 5.061 5.4 – 5.8
Inflation (%, yoy) 4.0 3.3 4.3 4.3 3.5 3.2 2.5 – 4.5
3-Month Treasury Bill
(SPN) (%)5.5 5.8 5.2 5.1 5.2 4.2 4.6 – 5.2
Exchange Rate
(Average, IDR/USD)13,500 13,435 13,400 13,336 13,400 13,714
13,700 –
14,000
ICP (USD/barrel) 40 34 48 50 48 64 60 – 70
Oil Production
(thousands of barrel/day)820 805 815 784 800 7422 722 – 805
Gas Production
(millions of barrels/day)1.15 1.18 1.15 1.14 1.20 1.142 1.21 – 1.30
Indonesia has been able to
maintain robust economic
performance which expected to
continue in 2018 and 2019.
Inflation is benign supported by
improving logistic and
infrastructure acceleration
Interest rate and exchange rate
are stable, benefiting from strong
fundamental and positive investor
perception in the midst of
uncertain global condition.
Increasing commodity price
helped in boosting external
position and revenue.
Indonesia's economy is currently
in the process of transitioning.
However, Indonesia economy
cannot be separated from
external conditions (technology,
trade, and geopolitics) as well as
domestic challenges.

13
Performance of State BudgetFiscal Sustainability is Well Preserved as Fiscal Deficit Narrowed and Primary Balance Recorded a Substantial Surplus
The robust tax growth and
positive performance in export
and import duty good in the
first quarter of 2018 is a
positive support.
Central Government
Expenditure grows robustly
Deficit realization of 0.64% of
GDP is much lower compared
to May 2017
Primary balance surplus is
significantly higher than last
year, highlighting improving
fiscal performance and
sustainability that well
preserved
2017 2018
R-Budget
May
Realization
% Real
to Budget Budget
May
Realization
% Real to
Budget
% of Growth
(YoY)
A. Revenue & Grant 1,736.1 594.0 34.2 1,894.7 685.1 36.2 15.3
I. Domestic Revenue 1,733.0 593.8 34.3 1,893.5 683.7 36.1 15.1
1. Taxation Revenue 1,472.7 470.3 31.9 1,618.1 538.7 33.3 14.5
2. Non Tax Revenue 260.2 123.5 47.5 275.4 145.0 52.6 17.4
II. Grants 3.1 0.2 6.8 1.2 1.4 118.2 565.9
B. Expenditure 2,133.3 722.8 33.9 2,220.7 779.5 35.1 7.9
I. Central Government Expenditure 1,367.0 388.0 28.4 1,454.5 458.0 31.5 18.0
1. Ministerial Spending 798.6 193.0 24.2 847.4 231.5 27.3 19.9
2. Non Ministerial Spending 568.4 195.0 34.3 607.1 226.5 37.3 16.2
II. Transfer to Region and Village
Fund766.3 334.7 43.7 766.2 321.5 42.0 (4.0)
1. Transfer to Region 706.3 306.5 43.4 706.2 300.8 42.6 (1.9)
2. Village Fund 60.0 28.2 47.0 60.0 20.7 34.4 (26.7)
C. Primary Balance (178.0) (29.9) 16.8 (87.3) 18.1 (20.7) (160.5)
D. Surplus/(Deficit) (397.2) (128.7) 32.4 (325.9) (94.4) 29.0 (26.6)
% of GDP (2.92) (0.94) (2.19) (0.64)
E. Financing 397.2 195.6 49.3 325.9 169.9 52.1 (13.1)
% of GDP 2.92 1.45 2.19 1.15
I. Debt 461.3 193.9 42.0 399.2 169.0 42.3 (12.8)
II. Investment (59.7) 0.0 0.0 (65.7) 0.0 0.0 0.0
III. SLA (3.7) 1.6 (43.6) (6.7) 0.8 (11.9) (50.1)
IV. Guarantee (1.0) 0.0 0.0 (1.1) 0.0 0.0 0.0
V. Other 0.3 0.2 50.6 0.2 0.1 53.4 (35.6)
Surplus/(Deficit) Financing 0.0 66.9 - 0.0 75.5 - 12.8
14
(0.33)
(0.85)
(1.19)
(1.67)
(1.76)
(1.91)
(2.08)
(2.75)
(3.48)
(3.90)
(6.26)
(8.43)
(1.50)
(0.85)
(1.22)
0.13
(1.02)
(1.41)
(1.46)
(1.11)
(1.12)
(3.57)
(5.84)
(10.15)
(12.00) (10.00) (8.00) (6.00) (4.00) (2.00) 0.00 2.00
PHP
KRW
CNY
IDR
SGD
MYR
THB
INR
ZAR
EUR
BRL
TRY
May vs April 2018
Point to Point Average
Source: BPS, Bank Indonesia
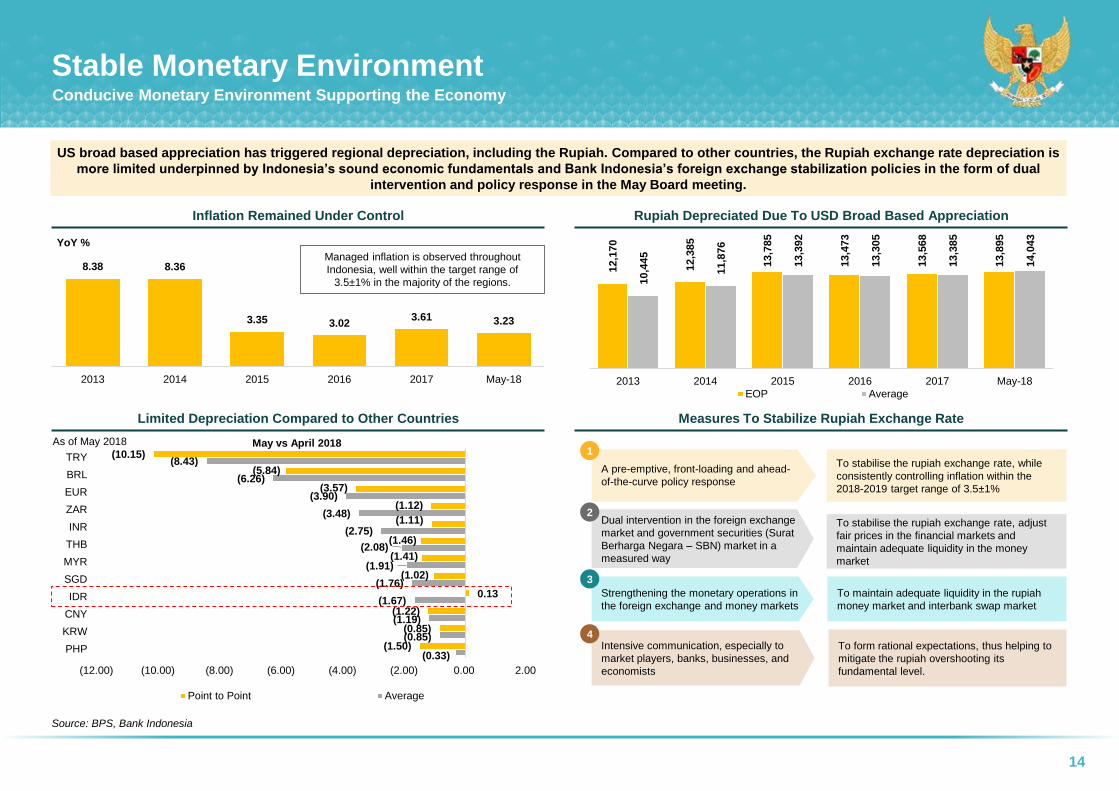
Stable Monetary EnvironmentConducive Monetary Environment Supporting the Economy
8.38 8.36
3.35 3.023.61 3.23
2013 2014 2015 2016 2017 May-18
YoY %
12,1
70
12,3
85
13,7
85
13,4
73
13,5
68
13,8
95
10,4
45
11,8
76
13,3
92
13,3
05
13,3
85
14,0
43
2013 2014 2015 2016 2017 May-18
EOP Average
US broad based appreciation has triggered regional depreciation, including the Rupiah. Compared to other countries, the Rupiah exchange rate depreciation is
more limited underpinned by Indonesia’s sound economic fundamentals and Bank Indonesia’s foreign exchange stabilization policies in the form of dual
intervention and policy response in the May Board meeting.
Managed inflation is observed throughout
Indonesia, well within the target range of
3.5±1% in the majority of the regions.
Rupiah Depreciated Due To USD Broad Based AppreciationInflation Remained Under Control
Measures To Stabilize Rupiah Exchange RateLimited Depreciation Compared to Other Countries
As of May 2018
A pre-emptive, front-loading and ahead-
of-the-curve policy response
Strengthening the monetary operations in
the foreign exchange and money markets
To stabilise the rupiah exchange rate, while
consistently controlling inflation within the
2018-2019 target range of 3.5±1%
To stabilise the rupiah exchange rate, adjust
fair prices in the financial markets and
maintain adequate liquidity in the money
market
To maintain adequate liquidity in the rupiah
money market and interbank swap market
To form rational expectations, thus helping to
mitigate the rupiah overshooting its
fundamental level.
Dual intervention in the foreign exchange
market and government securities (Surat
Berharga Negara – SBN) market in a
measured way
Intensive communication, especially to
market players, banks, businesses, and
economists
3
2
1
4
15
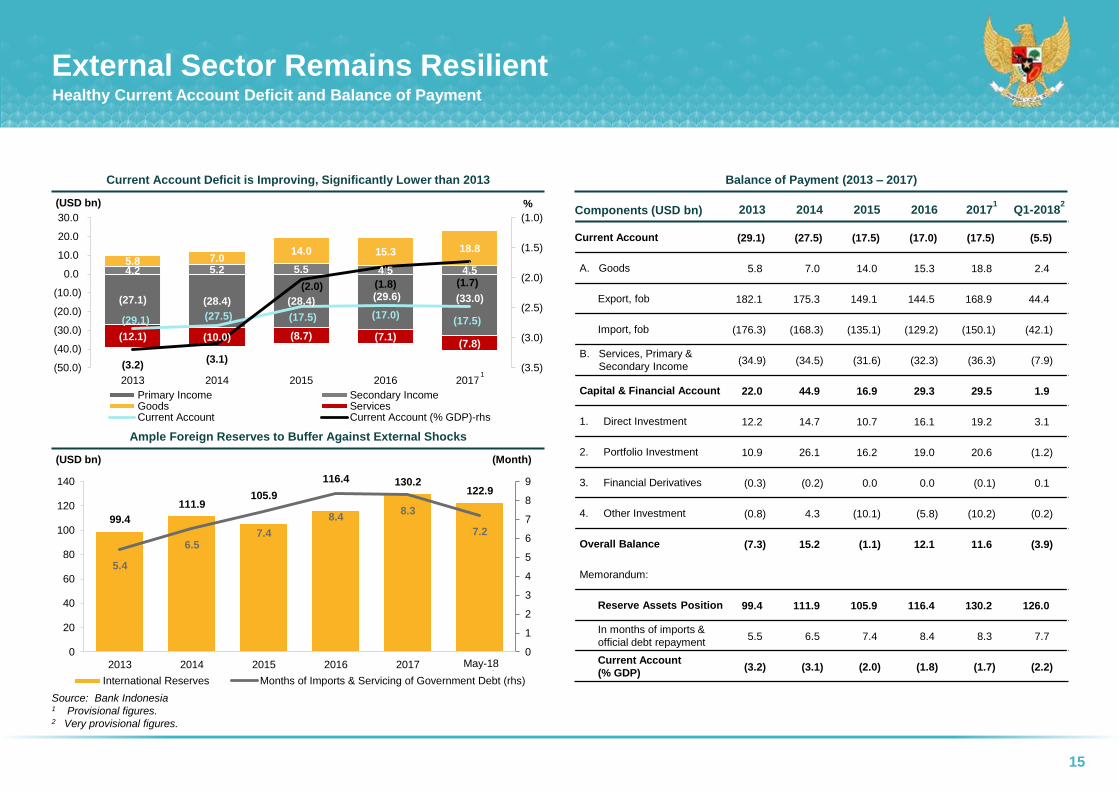
(27.1) (28.4) (28.4) (29.6) (33.0)
4.2 5.2 5.5 4.5 4.55.8 7.0
14.0 15.3 18.8
(12.1) (10.0) (8.7) (7.1)(7.8)
(29.1) (27.5) (17.5) (17.0)(17.5)
(3.2)(3.1)
(2.0) (1.8) (1.7)
2013 2014 2015 2016 2017*
(3.5)
(3.0)
(2.5)
(2.0)
(1.5)
(1.0)
(50.0)
(40.0)
(30.0)
(20.0)
(10.0)
0.0
10.0
20.0
30.0
%(USD bn)
Primary Income Secondary IncomeGoods ServicesCurrent Account Current Account (% GDP)-rhs
Source: Bank Indonesia1 Provisional figures.2 Very provisional figures.
External Sector Remains ResilientHealthy Current Account Deficit and Balance of Payment
Components (USD bn) 2013 2014 2015 2016 20171
Q1-20182
Current Account (29.1) (27.5) (17.5) (17.0) (17.5) (5.5)
A. Goods 5.8 7.0 14.0 15.3 18.8 2.4
Export, fob 182.1 175.3 149.1 144.5 168.9 44.4
Import, fob (176.3) (168.3) (135.1) (129.2) (150.1) (42.1)
B. Services, Primary &
Secondary Income(34.9) (34.5) (31.6) (32.3) (36.3) (7.9)
Capital & Financial Account 22.0 44.9 16.9 29.3 29.5 1.9
1. Direct Investment 12.2 14.7 10.7 16.1 19.2 3.1
2. Portfolio Investment 10.9 26.1 16.2 19.0 20.6 (1.2)
3. Financial Derivatives (0.3) (0.2) 0.0 0.0 (0.1) 0.1
4. Other Investment (0.8) 4.3 (10.1) (5.8) (10.2) (0.2)
Overall Balance (7.3) 15.2 (1.1) 12.1 11.6 (3.9)
Memorandum:
Reserve Assets Position 99.4 111.9 105.9 116.4 130.2 126.0
In months of imports &
official debt repayment5.5 6.5 7.4 8.4 8.3 7.7
Current Account
(% GDP)(3.2) (3.1) (2.0) (1.8) (1.7) (2.2)
Balance of Payment (2013 – 2017)Current Account Deficit is Improving, Significantly Lower than 2013
1
99.4
111.9105.9
116.4 130.2122.9
5.4
6.57.4
8.48.3
7.2
0
1
2
3
4
5
6
7
8
9
0
20
40
60
80
100
120
140
2013 2014 2015 2016 2017 18-May
(Month)(USD bn)
International Reserves Months of Imports & Servicing of Government Debt (rhs)
May-18
Ample Foreign Reserves to Buffer Against External Shocks

16
12.2
19.0
11.5 12.1 11.3 9.8 12.5
3.7
9.4 10.0 7.3 7.5
2.1
9.9 6.7 4.8
7.2
0.4
7.3 2.1
5.3 0.5 1.1
7.8
5.4
10.8
9.5 10.3 10.8 11.0
8.5
10.8
7.2 6.9 8.3
1.9
1.8
1.6
1.5 1.3
1.0
2.3
0.5
1.9
2.2
0.1 0.1
14.6
17.6
29.8
20.9 22.5 22.2
20.8 21.1
14.5 16.6 16.9
15.5
9.4
3.9
11.5
8.2 6.1
8.2
2.7
7.8
3.9
7.6
0.7 1.3
22.4
IDR Denominated Other CurrenciesSource: Ministry of Finance1 Debt Maturity Profile as of April 30, 2018. 2 Based on outstanding debt as of 31-May-2018.
Manageable External Debt Service RequirementsMore Prudent Risk Management
Well-Balanced Debt Maturity Profile¹ – Average Time to Maturity of 8.7 years
Balanced Debt Maturity Profile - Resilient Against External ShocksMarked by stable maturity profile and declining risks against interest rate and FX volatilities
USD billions
44.5% 42.6% 40.4% 41.8%
86.3% 87.9% 89.3% 89.6%
21.4% 22.7% 25.4% 23.0%
2015 2016 2017 Apr-18
FCY debt-to-Total Debt Fixed Interest-to-debt Maturing debt within 3 Years
5.9 6.0 5.9
8.910.4
9.1
3.3 3.6 4.0
4.54.2
3.99.2 9.6 9.9
13.414.6
13.0
2015 2016 2017 2018P² 2019P 2020P
Principal Repayment Interest Repayment
USD billions
17
Source: Ministry of Finance1 Original amount was Rp 414.5 tn, shifting to loan in amount of Rp 7.3 tn.
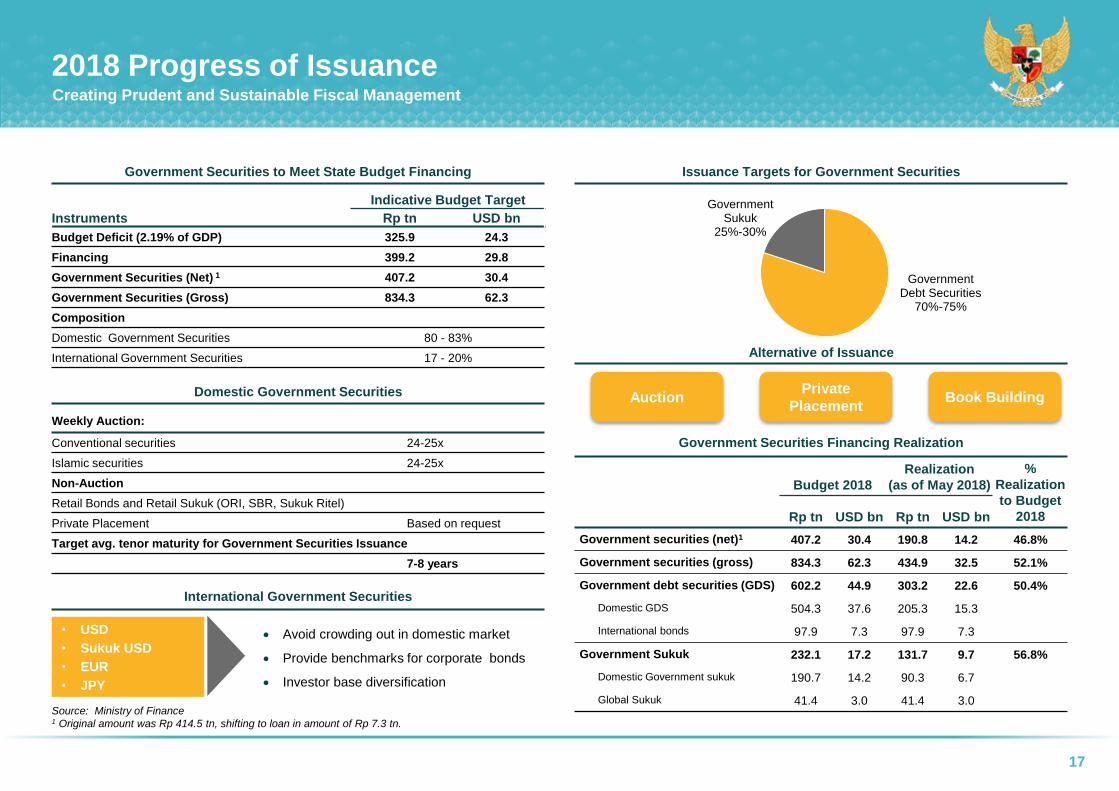
Domestic Government Securities
2018 Progress of IssuanceCreating Prudent and Sustainable Fiscal Management
Government Debt Securities
70%-75%
Government Sukuk
25%-30%
Weekly Auction:
Conventional securities 24-25x
Islamic securities 24-25x
Non-Auction
Retail Bonds and Retail Sukuk (ORI, SBR, Sukuk Ritel)
Private Placement Based on request
Target avg. tenor maturity for Government Securities Issuance
7-8 years
Instruments
Indicative Budget Target
Rp tn USD bn
Budget Deficit (2.19% of GDP) 325.9 24.3
Financing 399.2 29.8
Government Securities (Net) 1 407.2 30.4
Government Securities (Gross) 834.3 62.3
Composition
Domestic Government Securities 80 - 83%
International Government Securities 17 - 20%
International Government Securities
Avoid crowding out in domestic market
Provide benchmarks for corporate bonds
Investor base diversification
• USD
• Sukuk USD
• EUR
• JPY
Alternative of Issuance
Private
PlacementAuction Book Building
Government Securities Financing Realization
Budget 2018
Realization
(as of May 2018)
%
Realization
to Budget
2018Rp tn USD bn Rp tn USD bn
Government securities (net)1 407.2 30.4 190.8 14.2 46.8%
Government securities (gross) 834.3 62.3 434.9 32.5 52.1%
Government debt securities (GDS) 602.2 44.9 303.2 22.6 50.4%
Domestic GDS 504.3 37.6 205.3 15.3
International bonds 97.9 7.3 97.9 7.3
Government Sukuk 232.1 17.2 131.7 9.7 56.8%
Domestic Government sukuk 190.7 14.2 90.3 6.7
Global Sukuk 41.4 3.0 41.4 3.0
Issuance Targets for Government SecuritiesGovernment Securities to Meet State Budget Financing
18
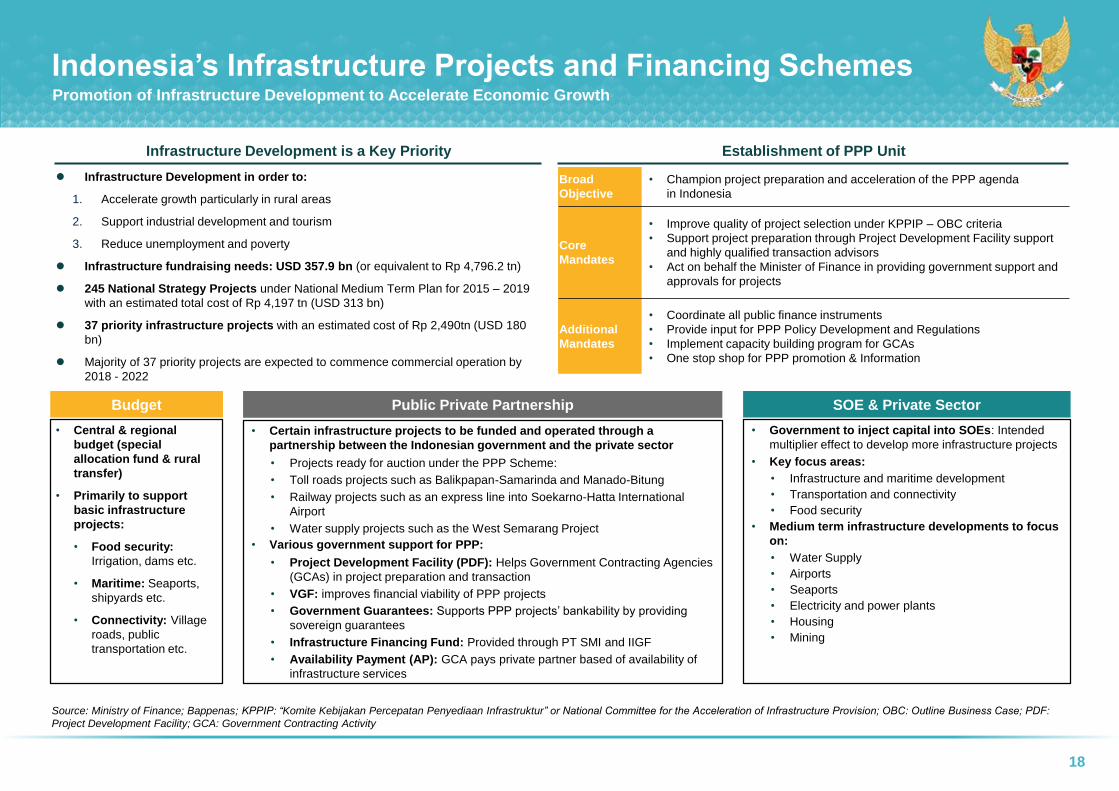
Source: Ministry of Finance; Bappenas; KPPIP: “Komite Kebijakan Percepatan Penyediaan Infrastruktur” or National Committee for the Acceleration of Infrastructure Provision; OBC: Outline Business Case; PDF:
Project Development Facility; GCA: Government Contracting Activity
Indonesia’s Infrastructure Projects and Financing SchemesPromotion of Infrastructure Development to Accelerate Economic Growth
Broad
Objective
• Champion project preparation and acceleration of the PPP agenda
in Indonesia
Core
Mandates
• Improve quality of project selection under KPPIP – OBC criteria
• Support project preparation through Project Development Facility support
and highly qualified transaction advisors
• Act on behalf the Minister of Finance in providing government support and
approvals for projects
Additional
Mandates
• Coordinate all public finance instruments
• Provide input for PPP Policy Development and Regulations
• Implement capacity building program for GCAs
• One stop shop for PPP promotion & Information
Establishment of PPP Unit
Budget Public Private Partnership SOE & Private Sector
• Central & regional
budget (special
allocation fund & rural
transfer)
• Primarily to support
basic infrastructure
projects:
• Food security:
Irrigation, dams etc.
• Maritime: Seaports,
shipyards etc.
• Connectivity: Village
roads, public
transportation etc.
• Certain infrastructure projects to be funded and operated through a
partnership between the Indonesian government and the private sector
• Projects ready for auction under the PPP Scheme:
• Toll roads projects such as Balikpapan-Samarinda and Manado-Bitung
• Railway projects such as an express line into Soekarno-Hatta International
Airport
• Water supply projects such as the West Semarang Project
• Various government support for PPP:
• Project Development Facility (PDF): Helps Government Contracting Agencies
(GCAs) in project preparation and transaction
• VGF: improves financial viability of PPP projects
• Government Guarantees: Supports PPP projects’ bankability by providing
sovereign guarantees
• Infrastructure Financing Fund: Provided through PT SMI and IIGF
• Availability Payment (AP): GCA pays private partner based of availability of
infrastructure services
• Government to inject capital into SOEs: Intended
multiplier effect to develop more infrastructure projects
• Key focus areas:
• Infrastructure and maritime development
• Transportation and connectivity
• Food security
• Medium term infrastructure developments to focus
on:
• Water Supply
• Airports
• Seaports
• Electricity and power plants
• Housing
• Mining
Infrastructure Development in order to:
1. Accelerate growth particularly in rural areas
2. Support industrial development and tourism
3. Reduce unemployment and poverty
Infrastructure fundraising needs: USD 357.9 bn (or equivalent to Rp 4,796.2 tn)
245 National Strategy Projects under National Medium Term Plan for 2015 – 2019
with an estimated total cost of Rp 4,197 tn (USD 313 bn)
37 priority infrastructure projects with an estimated cost of Rp 2,490tn (USD 180
bn)
Majority of 37 priority projects are expected to commence commercial operation by
2018 - 2022
Infrastructure Development is a Key Priority

19
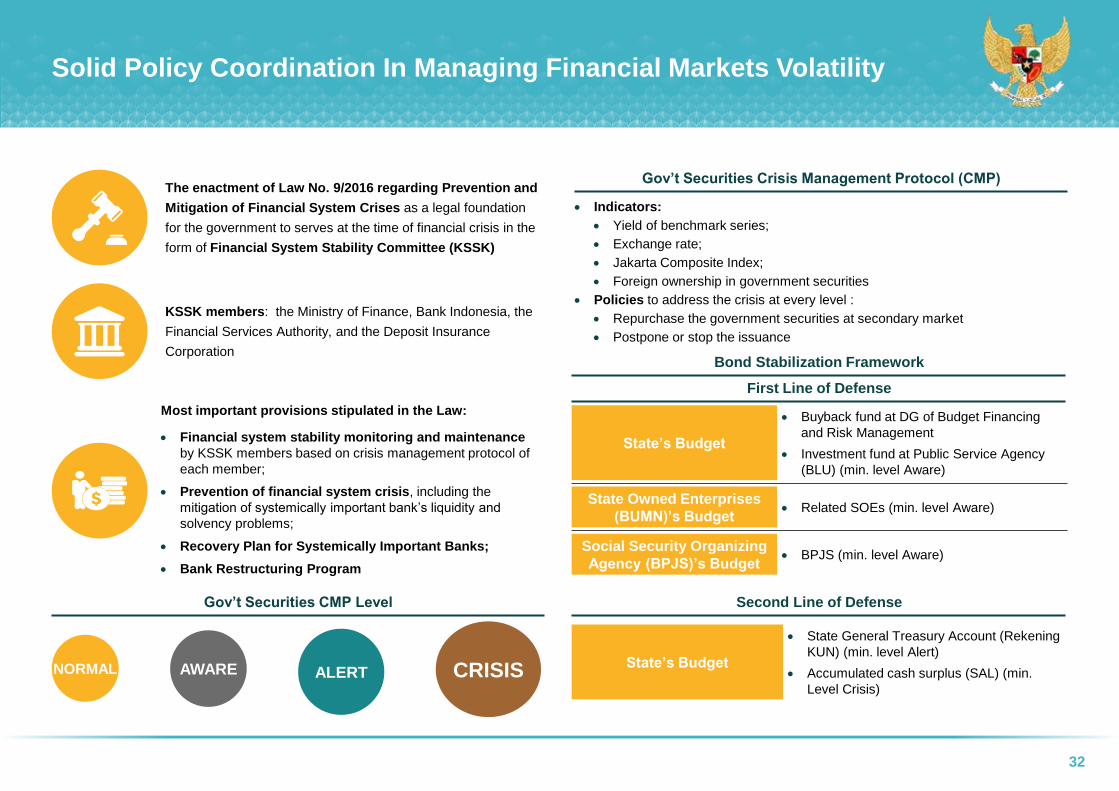
The enactment of Law No. 9/2016 regarding Prevention and
Mitigation of Financial System Crises as a legal foundation
for the government to serves at the time of financial crisis in the
form of Financial System Stability Committee (KSSK)
Most important provisions stipulated in the Law:
Financial system stability monitoring and maintenance
by KSSK members based on crisis management protocol of
each member;
Prevention of financial system crisis, including the
mitigation of systemically important bank’s liquidity and
solvency problems;
Recovery Plan for Systemically Important Banks;
Bank Restructuring Program
KSSK members: the Ministry of Finance, Bank Indonesia, the
Financial Services Authority, and the Deposit Insurance
Corporation
NORMAL AWARE ALERT CRISIS
Second Line of DefenseGov’t Securities CMP Level
First Line of Defense
State’s Budget
Buyback fund at DG of Budget Financing
and Risk Management
Investment fund at Public Service Agency
(BLU) (min. level Aware)
State Owned Enterprises
(BUMN)’s Budget Related SOEs (min. level Aware)
Social Security Organizing
Agency (BPJS)’s Budget BPJS (min. level Aware)
Indicators:
Yield of benchmark series;
Exchange rate;
Jakarta Composite Index;
Foreign ownership in government securities
Policies to address the crisis at every level :
Repurchase the government securities at secondary market
Postpone or stop the issuance
Bond Stabilization Framework
State’s Budget
State General Treasury Account (Rekening
KUN) (min. level Alert)
Accumulated cash surplus (SAL) (min.
Level Crisis)
Solid Policy Coordination In Managing Financial Markets Volatility
Gov’t Securities Crisis Management Protocol (CMP)
Recent Macroeconomic
Development
02Ampera Bridge in South Sumatera,
Indonesia
21
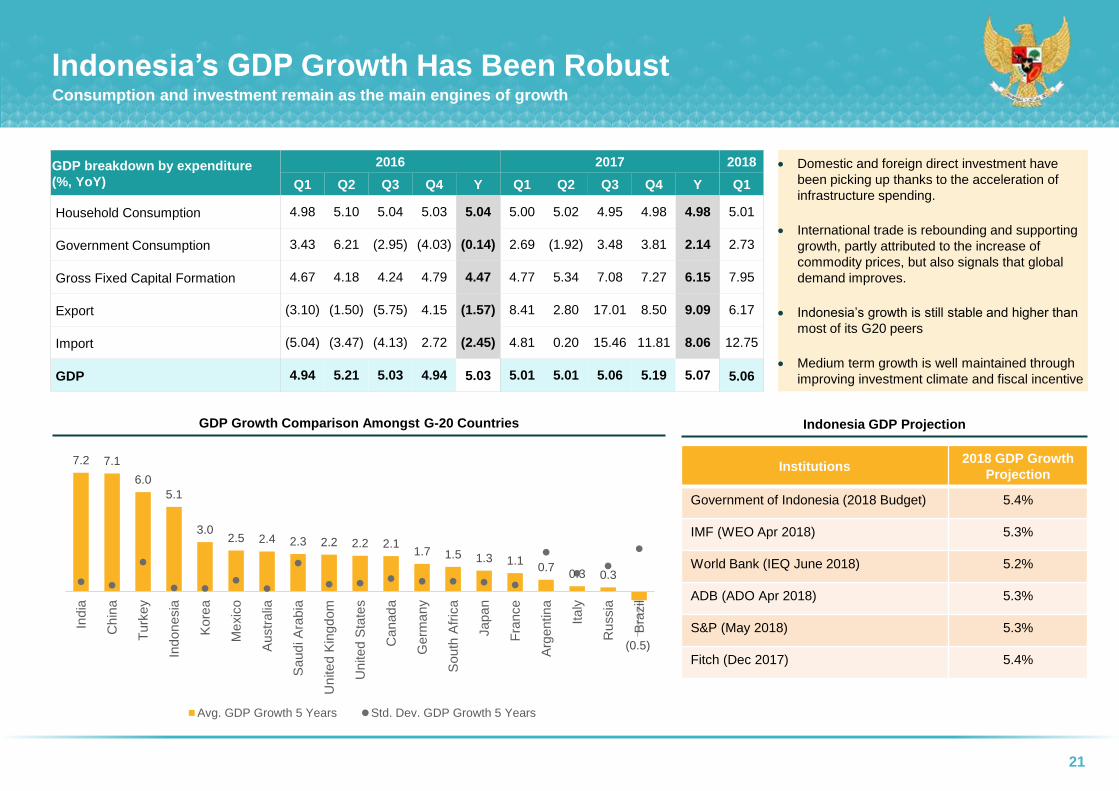
Indonesia’s GDP Growth Has Been RobustConsumption and investment remain as the main engines of growth
GDP breakdown by expenditure
(%, YoY)
2016 2017 2018
Q1 Q2 Q3 Q4 Y Q1 Q2 Q3 Q4 Y Q1
Household Consumption 4.98 5.10 5.04 5.03 5.04 5.00 5.02 4.95 4.98 4.98 5.01
Government Consumption 3.43 6.21 (2.95) (4.03) (0.14) 2.69 (1.92) 3.48 3.81 2.14 2.73
Gross Fixed Capital Formation 4.67 4.18 4.24 4.79 4.47 4.77 5.34 7.08 7.27 6.15 7.95
Export (3.10) (1.50) (5.75) 4.15 (1.57) 8.41 2.80 17.01 8.50 9.09 6.17
Import (5.04) (3.47) (4.13) 2.72 (2.45) 4.81 0.20 15.46 11.81 8.06 12.75
GDP 4.94 5.21 5.03 4.94 5.03 5.01 5.01 5.06 5.19 5.07 5.06
7.2 7.1
6.0
5.1
3.0 2.5 2.4 2.3 2.2 2.2 2.1
1.7 1.5 1.3 1.1 0.7
0.3 0.3
(0.5)
India
Ch
ina
Turk
ey
Indon
esia
Kore
a
Me
xic
o
Austr
alia
Saud
i A
rabia
Un
ite
d K
ing
dom
Un
ite
d S
tate
s
Ca
nad
a
Germ
any
South
Afr
ica
Japa
n
Fra
nce
Arg
entina
Ita
ly
Ru
ssia
Bra
zil
Avg. GDP Growth 5 Years Std. Dev. GDP Growth 5 Years
Institutions2018 GDP Growth
Projection
Government of Indonesia (2018 Budget) 5.4%
IMF (WEO Apr 2018) 5.3%
World Bank (IEQ June 2018) 5.2%
ADB (ADO Apr 2018) 5.3%
S&P (May 2018) 5.3%
Fitch (Dec 2017) 5.4%
Domestic and foreign direct investment have
been picking up thanks to the acceleration of
infrastructure spending.
International trade is rebounding and supporting
growth, partly attributed to the increase of
commodity prices, but also signals that global
demand improves.
Indonesia’s growth is still stable and higher than
most of its G20 peers
Medium term growth is well maintained through
improving investment climate and fiscal incentive
Indonesia GDP ProjectionGDP Growth Comparison Amongst G-20 Countries

22
GDP by Production SideManufacturing improves while service sector generally keeps on recording high growth
Agriculture (%, YoY) Mining (%, YoY)
3.363.81
3.14
2016 2017 Q1-2018
0.95 0.69 0.74
2016 2017 Q1-2018
Manufacturing (%, YoY) Construction (%, YoY)
4.26 4.27 4.50
2016 2017 Q1-2018
5.22
6.79 7.35
2016 2017 Q1-2018
Trade (%,YoY)
Transportation
(%, YoY)
Comm & Info
(%, YoY)
Financial Service
(%, YoY)
4.034.44
4.96
2016 2017 Q1-18
8.90
5.48
4.38
2016 2017 Q1-18
Se
co
nd
ary
Te
rtia
ryP
rim
ary
Primary sector grew marginally:
Agriculture slowed due to production decrease in food
crops
Mining growth increased supported by increasing metal
ores production, but the decline in energy commodity
production weighed on overall growth
Secondary sector on an improving trend:
Manufacturing sector growth increased particularly
supported by F&B, textile, and metal industries
Construction recorded high growth driven by
infrastructure acceleration program
Tertiary sector continues to show strong growth:
Trade accelerated in line with increasing export-import
as well as vehicle sales
Transportation, communication, and information
sectors consistently posted high growth supported by
improving logistic and digital economy
Financial service sector grew moderately as credit
growth remains soft
8.889.81
8.69
2016 2017 Q1-18
7.45
8.49 8.59
2016 2017 Q1-18

23
Regional GrowthMost of regions recorded positive growth in the first quarter 2018
5.06%
2017 National
GDP Growth
SUMATERA: 21.5% of GDP
2018:
4.37%
2017:
4.14
2017:
5.69
2018:
5.78%
2018:
3.25%
2017:
4.972018:
6.83%2017:
6.93
2018:
3.74%2017:
2.93
2017:
4.40
JAVA: 58.7% of GDP
KALIMANTAN: 8.2% of GDP
SULAWESI: 6.0% of GDP
PAPUA: 2.5% of GDP
BALI & NUSRA: 3.0% of GDP
2018:
18.42%
As the industrial center, Java still holds the biggest economic activity accounting for 58.67 percent of GDP
Maluku and Papua recorded high growth of 18.42 percent, underpinned by the increase of commodity price and mining
activity
2017:
4.30
2017:
5.61
2017:
4.332017:
6.99
2017:
3.73
2017:
4.89
2017 Regional GDP
Growth
2017 – Q1 Regional
GDP Growth
2018 – Q1 Regional
GDP Growth
Government effort aimed to
improve connectivity among
the islands and bring down the
logistics cost. The prices of
basic goods in the outlying
islands are becoming more
affordable as the result. This
will translate to improved
efficiencies, thriving regional
economies, and lowering the
development disparity among
the regions.
Infrastructure and connectivity
projects to create more
sustainable and equitable
economic growth in all regions.
Intergovernmental transfer,
including Village Fund, has
also promoted equality in the
region.

24
Direct Investment Grew by 11.8 Percent in Q1-2018Underpinned by improving investment climate
Direct Investment Share by Sectors Q1-2018Direct Investment Realization
FY-2016 FY-2017 Q1-2018
Nominal
(Rp Tn)
Growth
(% YoY)
Nominal
(Rp Tn)
Growth
(% YoY)
Nominal
(Rp Tn)
Growth
(% YoY)
Domestic 216.2 20.5 262.3 21.3 76.4 11.0
Foreign 396.6 8.4 430.5 8.5 108.9 12.4
Total 612.8 12.4 692.8 13.1 185.3 11.8
FDI Share by Country Origins Q1-2018 FDI Share by Country Origins 2010-2017
32.6%
16.7%
11.6%
8.3%
6.3%
24.5%
Singapore
Japan
S Korea
China
Hong Kong
Other
23.8%
12.2%
5.5%
5.4%
4.7%
4.6%
3.9%
3.5%
3.4%
32.9%
Singapore
Japan
US
S Korea
Netherland
Malaysia
China
Hong Kong
BVI
Other
Housing, Estate & Building
15%
Electricity, Gas, & Water Supply10%
Others45%
Metal, Machinery, &
Electronic Industry
12%
Transportation, Warehouse,
& Telecommunication
8%
Crops &
Plantation
10%
Source: NSWi BKPM
Positive FDI flow shows a high interest in Indonesia.
Nevertheless, Java island is still the main destination
for direct investment, roughly 55% of total FDI.
Government Efforts To Improve Investment Climate :
(1) Easing Import and Export Restrictions (2)
Reducing Dwelling Time (3) Revising and Perfecting
Tax Incentive (Tax Allowance and Tax Holiday)
Overall structural reform efforts are expected to boost
investment and exports to support Indonesia's
economic growth in the medium term.
25
Inflation has been More BenignCreate Substantial Foundation for Robust Consumption
Inflation Rate & Components (%)Inflation Rate (YTD, %)
3.0%
3…
3.2%
3.1%
3.0%
2.8%
0.2%
8.7%
3.6%
5.9%
0.7%
4.3%
(2.0)%
0.0%
2.0%
4.0%
6.0%
8.0%
10.0%
12.0%
J F M A M J J A S O N D J F M A M J J A S O N D J F M A M
2016 2017 2018
Inflation (CPI) Core Inflation Administered Price Volatile Food
Future Policies
Improving logistic and distribution
and stronger coordination
between institutions are some key
factor in inflation management
The monitoring of prices and
improvements to the trading of
some food commodities can
anticipate price game practices.
Inflation is more benign supported
by more stable food inflation as
supply side improves.
The administered price inflation is
the biggest source of pressure in
2017, but pressure is easing as
tariffs are adjusted at the end of
the first semester of 2017.
Indonesian Consumer Confidence
is showing a vibrant economic
activity and good expectation on
economy
Consumer Confidence Index
Source: Bank Indonesia
100
105
110
115
120
125
130
J M M J S N J M M J S N J M M
2016 2017 2018
11.1%
2.8%
7.0%
3.8%4.3%
8.4% 8.4%
3.4%3.0%
3.6%
1.3%
2008 2010 2012 2014 2016 May-18
Source: BPS
Source: BPS

26
(2.0)
(1.0)
0.0
1.0
2.0
3.0
M J J A S O N D
201
7-J F M A M J J A S O N D
201
8-J F M A
Non O&G O&G Total
Import Growth Upholds Increasing Domestic Economic
ActivitiesUntil April 2018, Trade Balance is Recording a Deficit of USD1.31 billion
Source: BPS
Cumulative Growth of Export CommodityTrade Balance (USD Billion)
Trade balance is recording deficit
cumulatively in April 2018, due to
high import growth that supports
growing domestic production
Import grew by 23.65% (YTD)
supported by higher demand for
festive seasons of Ramadhan and
Idul Fitri; capital good increase to
support infrastructure development
and military equipment; and raw
material increase that highlights
improving domestic productivity and
economic activity
Export grew by 8.77% (YTD),
underpinned by mining commodity
growth of 33.4% and manufacturing
of 5.3%
Deficit Jan-Apr
2018:
USD1.31 billion
Surplus FY 2016:
USD9.5 billion
Surplus FY 2017:
USD11.8 billion
Cumulative Growth of Import Goods
Contribution to
Total Import
Capital Goods
16.3%
Consumption
Goods 9.1%
Raw Materials
74.6%
Top 4 Export/Import (Non-O&G) by Country
April 2018 (USD Billion)
Export (Non O&G) Import (Non O&G)
China 3.4
Japan 1.6
United States 1.0
Thailand 0.9
1
2
3
4
China 1.8
United States 1.4
Japan 1.4
India 1.0
1
2
3
4
26.1%
21.9%
31.0%
(30.0)%
(10.0)%
10.0%
30.0%
50.0%
M J S N
201
7-J M M J S N
201
8-J M
Consumption goods Raw materials Capital goods
(5.1)%
5.3%
33.4%
4.0%
(60.0)%
(40.0)%
(20.0)%
0.0%
20.0%
40.0%
60.0%
M J J A S O N D
201
7-J F M A M J J A S O N D
201
8-J F M A
Agriculture Manufacturing Mining O&G
27
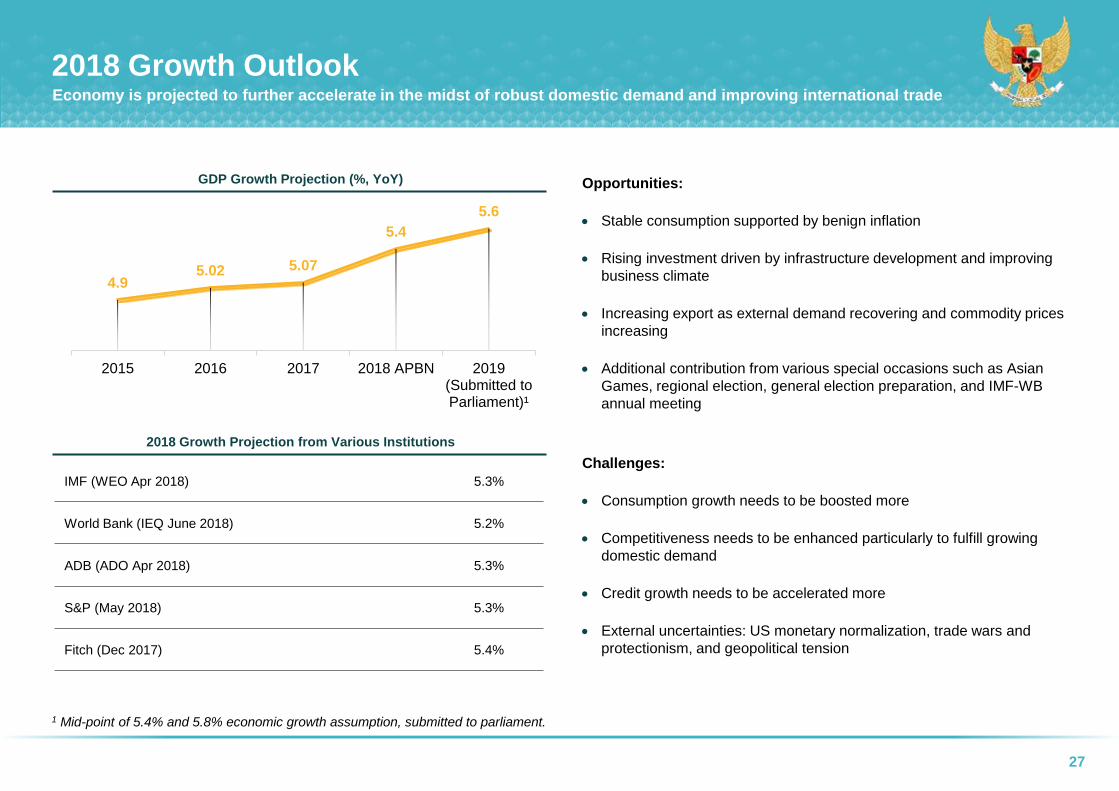
2018 Growth OutlookEconomy is projected to further accelerate in the midst of robust domestic demand and improving international trade
1 Mid-point of 5.4% and 5.8% economic growth assumption, submitted to parliament.
GDP Growth Projection (%, YoY)
2018 Growth Projection from Various Institutions
Challenges:
Consumption growth needs to be boosted more
Competitiveness needs to be enhanced particularly to fulfill growing
domestic demand
Credit growth needs to be accelerated more
External uncertainties: US monetary normalization, trade wars and
protectionism, and geopolitical tension
Opportunities:
Stable consumption supported by benign inflation
Rising investment driven by infrastructure development and improving
business climate
Increasing export as external demand recovering and commodity prices
increasing
Additional contribution from various special occasions such as Asian
Games, regional election, general election preparation, and IMF-WB
annual meeting
IMF (WEO Apr 2018) 5.3%
World Bank (IEQ June 2018) 5.2%
ADB (ADO Apr 2018) 5.3%
S&P (May 2018) 5.3%
Fitch (Dec 2017) 5.4%
4.95.02 5.07
5.4
5.6
2015 2016 2017 2018 APBN 2019(Submitted toParliament)¹

Financial Market Condition
03Lake Toba in North Sumatera,
Indonesia
29
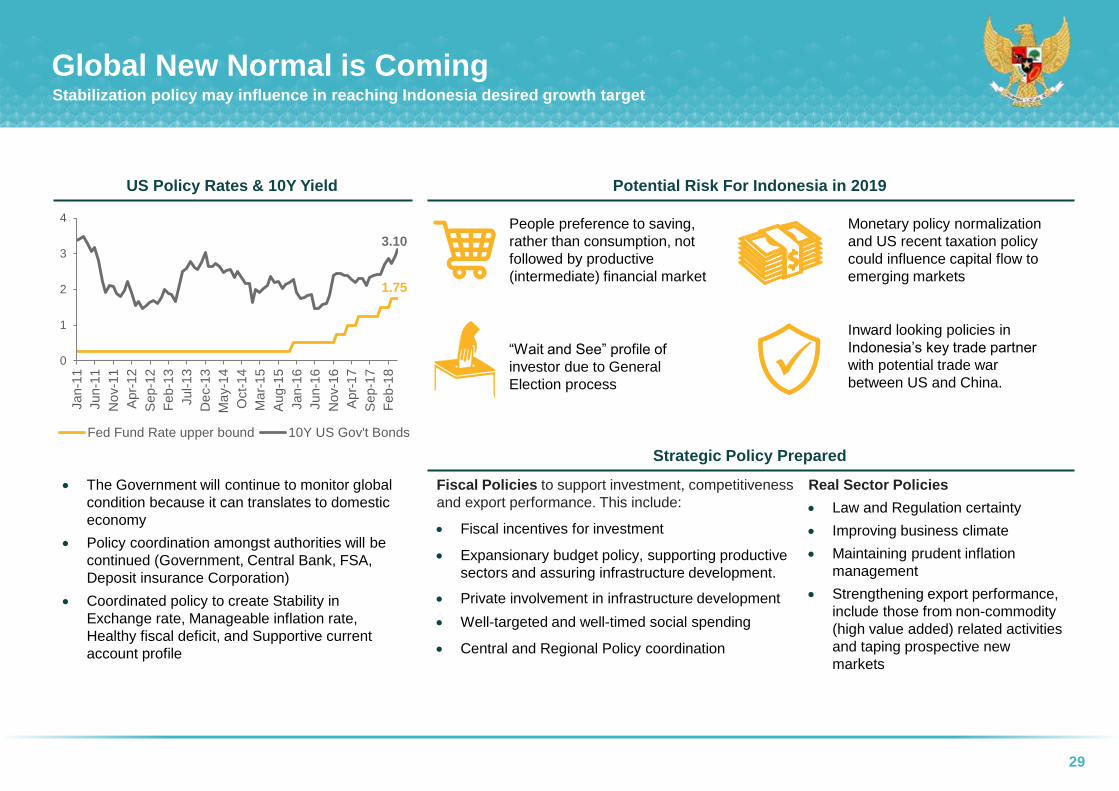
Global New Normal is Coming Stabilization policy may influence in reaching Indonesia desired growth target
The Government will continue to monitor global
condition because it can translates to domestic
economy
Policy coordination amongst authorities will be
continued (Government, Central Bank, FSA,
Deposit insurance Corporation)
Coordinated policy to create Stability in
Exchange rate, Manageable inflation rate,
Healthy fiscal deficit, and Supportive current
account profile
People preference to saving,
rather than consumption, not
followed by productive
(intermediate) financial market
“Wait and See” profile of
investor due to General
Election process
Monetary policy normalization
and US recent taxation policy
could influence capital flow to
emerging markets
Inward looking policies in
Indonesia’s key trade partner
with potential trade war
between US and China.
Fiscal Policies to support investment, competitiveness
and export performance. This include:
Fiscal incentives for investment
Expansionary budget policy, supporting productive
sectors and assuring infrastructure development.
Private involvement in infrastructure development
Well-targeted and well-timed social spending
Central and Regional Policy coordination
Real Sector Policies
Law and Regulation certainty
Improving business climate
Maintaining prudent inflation
management
Strengthening export performance,
include those from non-commodity
(high value added) related activities
and taping prospective new
markets
1.75
3.10
0
1
2
3
4
Jan-1
1
Jun-1
1
No
v-1
1
Apr-
12
Sep-1
2
Feb
-13
Jul-1
3
De
c-1
3
Ma
y-1
4
Oct-
14
Ma
r-1
5
Aug-1
5
Jan-1
6
Jun-1
6
No
v-1
6
Apr-
17
Sep-1
7
Feb
-18
Fed Fund Rate upper bound 10Y US Gov't Bonds
Strategic Policy Prepared
Potential Risk For Indonesia in 2019US Policy Rates & 10Y Yield
30
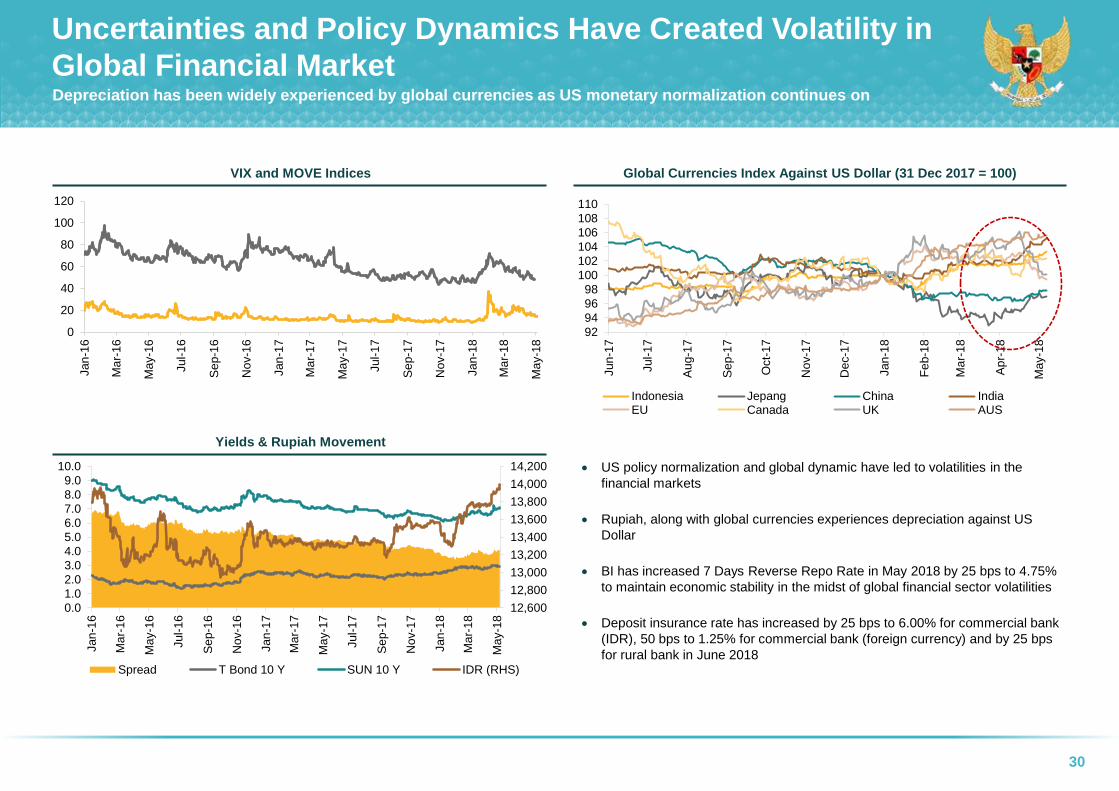
Uncertainties and Policy Dynamics Have Created Volatility in
Global Financial MarketDepreciation has been widely experienced by global currencies as US monetary normalization continues on
Global Currencies Index Against US Dollar (31 Dec 2017 = 100)VIX and MOVE Indices
Yields & Rupiah Movement
0
20
40
60
80
100
120
Jan
-16
Ma
r-1
6
Ma
y-1
6
Jul-
16
Se
p-1
6
Nov-1
6
Jan
-17
Ma
r-1
7
Ma
y-1
7
Jul-
17
Se
p-1
7
Nov-1
7
Jan
-18
Ma
r-1
8
Ma
y-1
8
92
94
96
98
100
102
104
106
108
110
Jun
-17
Jul-
17
Au
g-1
7
Se
p-1
7
Oct-
17
Nov-1
7
Dec-1
7
Jan
-18
Fe
b-1
8
Ma
r-1
8
Ap
r-18
Ma
y-1
8
Indonesia Jepang China IndiaEU Canada UK AUS
12,600
12,800
13,000
13,200
13,400
13,600
13,800
14,000
14,200
0.0
1.0
2.0
3.0
4.0
5.0
6.0
7.0
8.0
9.0
10.0
Jan
-16
Ma
r-1
6
Ma
y-1
6
Jul-
16
Se
p-1
6
Nov-1
6
Jan
-17
Ma
r-1
7
Ma
y-1
7
Jul-
17
Se
p-1
7
Nov-1
7
Jan
-18
Ma
r-1
8
Ma
y-1
8
Spread T Bond 10 Y SUN 10 Y IDR (RHS)
US policy normalization and global dynamic have led to volatilities in the
financial markets
Rupiah, along with global currencies experiences depreciation against US
Dollar
BI has increased 7 Days Reverse Repo Rate in May 2018 by 25 bps to 4.75%
to maintain economic stability in the midst of global financial sector volatilities
Deposit insurance rate has increased by 25 bps to 6.00% for commercial bank
(IDR), 50 bps to 1.25% for commercial bank (foreign currency) and by 25 bps
for rural bank in June 2018

31
Uncertainties and Policy Dynamics Have Created Volatility in
Global Financial Market (Cont’d)
Price Performance of Stock Market Indices of
Emerging Market Peers (2018 YTD)
10-Year Local Government Yield of
Emerging Market Peers (2018 YTD) Commentary
There has been volatility in Indonesia’s financial
markets and yield of local government 10-year
bond in 2018, in line with other emerging markets.
However, Indonesia’s financial services sector
stability and liquidity has remained solid
throughout 2018. As of April 2018,
Financial services institutions have maintained
adequate capital and liquidity, with the Capital
Adequacy Ratio (CAR) in the banking industry
recorded at 22.38%
RBC of the general insurance and life insurance
industries recorded at 310% and 454%, respectively
Excess reserve in the banking industry was Rp 618
trillion
Credit and market risk remain credible – gross NPL
ratio of 2.79% in the banking industry and NPF ratio
3.01% as reported by finance companies
Deposit guarantee coverage of the Deposit
Insurance Corporation (LPS) has reached 99.9% of
customers and 52.15% in terms of value,
demonstrating public confidence and trust in the
national banking system
80%
90%
100%
110%
120%
130%
Jan-2018
Feb-2018
Mar-2018
Apr-2018
May-2018
Jun-2018
Ind
ex
ed
Pri
ce
s
JCI (Indonesia) KLCI (Malaysia)
SET (Thailand) Hochiminh (Vietnam)
PSEI (Philippines) CSI 300 (China)
BOVESPA (Brazil) SENSEX 30 (India)
0.9%
1.1%
4.2%
(1.9)%
(6.5)%
(5.9)%
(2.3)%
(10.8)%
0%
2%
4%
6%
8%
10%
12%
Jan-2018
Feb-2018
Mar-2018
Apr-2018
May-2018
Jun-2018
Yie
ld (%
)
Indonesia Malaysia Thailand
Vietnam Philippines China
Brazil India
11.3%
7.8%
7.1%
6.1%
4.7%
4.2%
3.6%
2.9%
Source: Data Stream as of 1-Jun-2018Source: Data Stream as of 1-Jun-2018
There has been volatilities in the stock market and local bond market. However, financial services sectors have
remained resilient
32
The enactment of Law No. 9/2016 regarding Prevention and
Mitigation of Financial System Crises as a legal foundation
for the government to serves at the time of financial crisis in the
form of Financial System Stability Committee (KSSK)
Most important provisions stipulated in the Law:
Financial system stability monitoring and maintenance
by KSSK members based on crisis management protocol of
each member;
Prevention of financial system crisis, including the
mitigation of systemically important bank’s liquidity and
solvency problems;
Recovery Plan for Systemically Important Banks;
Bank Restructuring Program
KSSK members: the Ministry of Finance, Bank Indonesia, the
Financial Services Authority, and the Deposit Insurance
Corporation
NORMAL AWARE ALERT CRISIS
Second Line of DefenseGov’t Securities CMP Level
First Line of Defense
State’s Budget
Buyback fund at DG of Budget Financing
and Risk Management
Investment fund at Public Service Agency
(BLU) (min. level Aware)
State Owned Enterprises
(BUMN)’s Budget Related SOEs (min. level Aware)
Social Security Organizing
Agency (BPJS)’s Budget BPJS (min. level Aware)
Indicators:
Yield of benchmark series;
Exchange rate;
Jakarta Composite Index;
Foreign ownership in government securities
Policies to address the crisis at every level :
Repurchase the government securities at secondary market
Postpone or stop the issuance
Bond Stabilization Framework
State’s Budget
State General Treasury Account (Rekening
KUN) (min. level Alert)
Accumulated cash surplus (SAL) (min.
Level Crisis)
Solid Policy Coordination In Managing Financial Markets Volatility
Gov’t Securities Crisis Management Protocol (CMP)
33
Additional Measures to Strengthen Stability and Growth of
Financial Markets
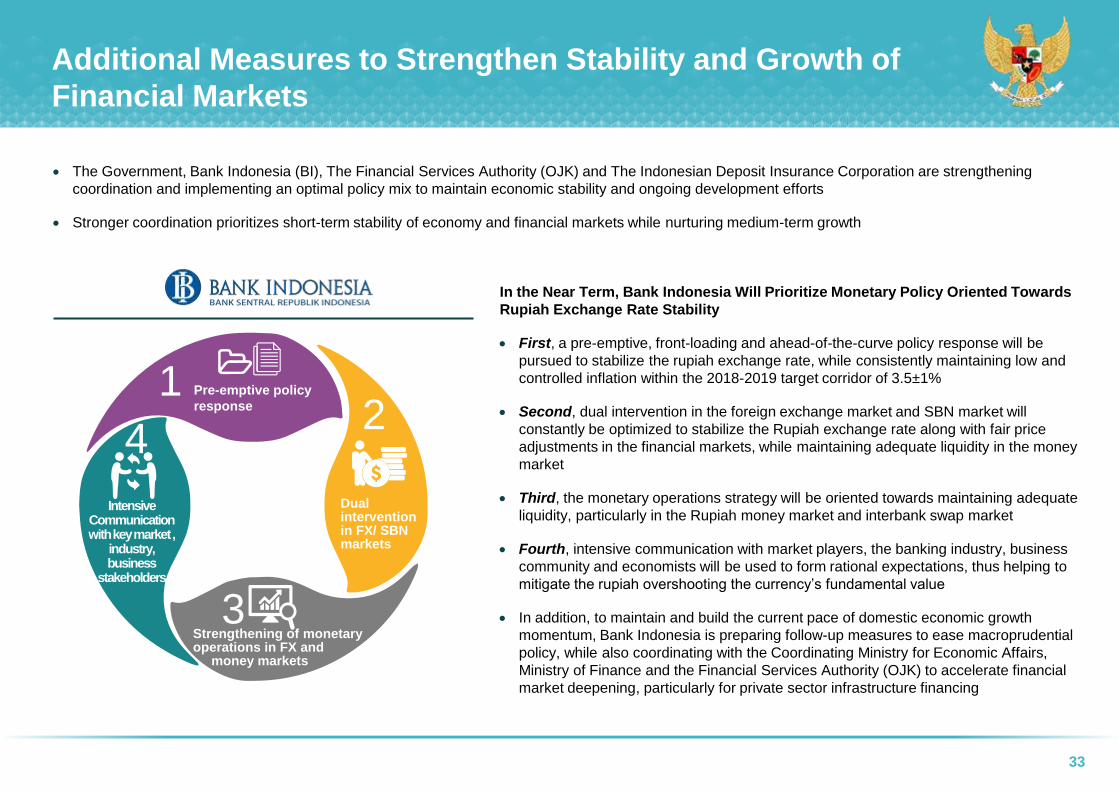
The Government, Bank Indonesia (BI), The Financial Services Authority (OJK) and The Indonesian Deposit Insurance Corporation are strengthening
coordination and implementing an optimal policy mix to maintain economic stability and ongoing development efforts
Stronger coordination prioritizes short-term stability of economy and financial markets while nurturing medium-term growth
In the Near Term, Bank Indonesia Will Prioritize Monetary Policy Oriented Towards
Rupiah Exchange Rate Stability
First, a pre-emptive, front-loading and ahead-of-the-curve policy response will be
pursued to stabilize the rupiah exchange rate, while consistently maintaining low and
controlled inflation within the 2018-2019 target corridor of 3.5±1%
Second, dual intervention in the foreign exchange market and SBN market will
constantly be optimized to stabilize the Rupiah exchange rate along with fair price
adjustments in the financial markets, while maintaining adequate liquidity in the money
market
Third, the monetary operations strategy will be oriented towards maintaining adequate
liquidity, particularly in the Rupiah money market and interbank swap market
Fourth, intensive communication with market players, the banking industry, business
community and economists will be used to form rational expectations, thus helping to
mitigate the rupiah overshooting the currency’s fundamental value
In addition, to maintain and build the current pace of domestic economic growth
momentum, Bank Indonesia is preparing follow-up measures to ease macroprudential
policy, while also coordinating with the Coordinating Ministry for Economic Affairs,
Ministry of Finance and the Financial Services Authority (OJK) to accelerate financial
market deepening, particularly for private sector infrastructure financing
Dualintervention in FX/ SBN markets
2
3Strengthening of monetary operations in FX and
money markets
1 Pre-emptive policy
response
Intensive Communication with key market ,
industry, business
stakeholders
4

34
Financial Sector Supervision Conducted by the Financial Services
Authority (OJK) is Focused on Maintaining a Healthy Financial
Sector
OJK continues to back the financial market deepening program in
terms of supply and demand, while strengthening market
infrastructure and facilitating municipal bond issuances and asset
securitization
OJK maintains financial services sector stability through industry
resilience, strengthening issuer fundamentals and implementing
appropriate policy measures when the financial markets experience
pressures
OJK nurtures credit growth and financial sector financing by
prioritizing financing that targets export commodities
In addition, OJK will continue to advocate financial inclusion to
stimulate quality economic growth through the development of
People’s Business Loan (KUR) clusters, waqf-based microfinance
and FinTech
Additional Measures to Strengthen Stability and Growth of
Financial Markets (Cont’d)
LPS is Open to Make Any Necessary Adjustments to the Guarantee
Rate
The Deposit Insurance Corporation (LPS) will intensify the monitoring
and evaluation of deposit guarantee schemes along with the Magnitude
and Guarantee Rate
LPS is open to make any necessary adjustments to the Guarantee Rate
at the first opportunity in accordance with the latest data available and
assessments of financial system stability
LPS will intensify monitoring and evaluation in order to maintain public
confidence in the national banking system of Indonesia
2018 State Budget Realization
Performance
04Komodo National Park in East Nusa
Tenggara, Indonesia
36
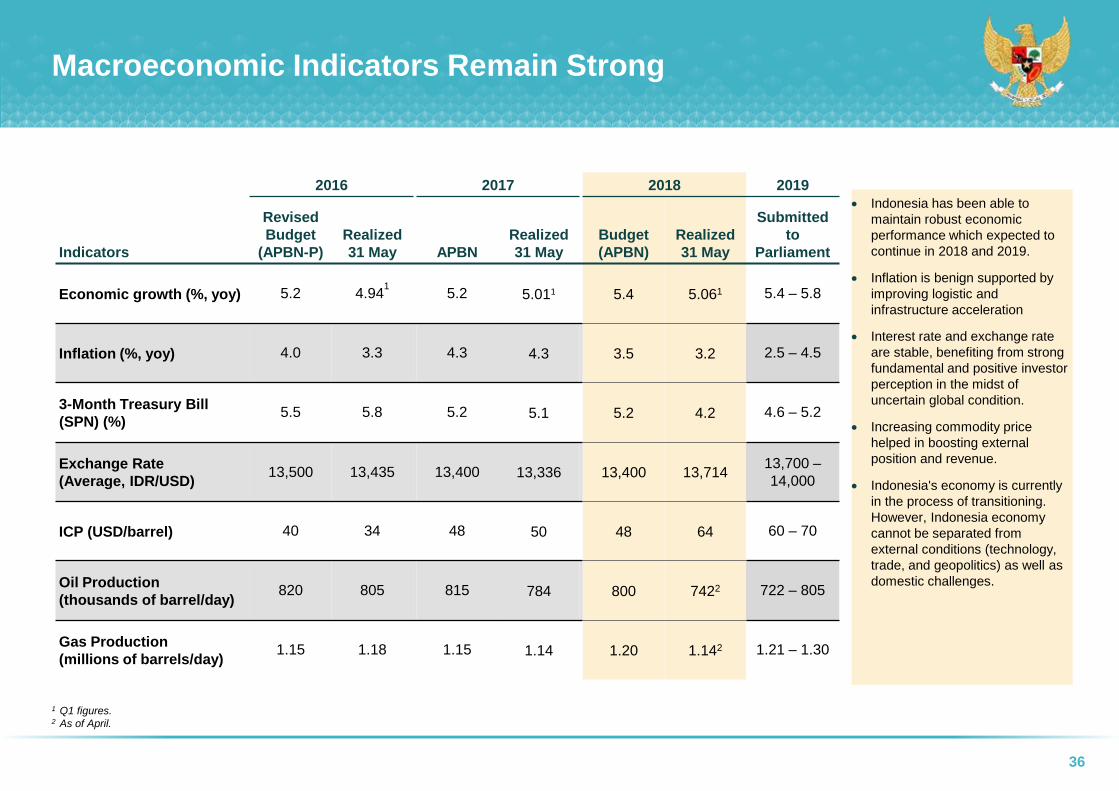
Macroeconomic Indicators Remain Strong
1 Q1 figures.2 As of April.
Indicators
2016 2017 2018 2019
Revised
Budget
(APBN-P)
Realized
31 May APBN
Realized
31 May
Budget
(APBN)
Realized
31 May
Submitted
to
Parliament
Economic growth (%, yoy) 5.2 4.941
5.2 5.011 5.4 5.061 5.4 – 5.8
Inflation (%, yoy) 4.0 3.3 4.3 4.3 3.5 3.2 2.5 – 4.5
3-Month Treasury Bill
(SPN) (%)5.5 5.8 5.2 5.1 5.2 4.2 4.6 – 5.2
Exchange Rate
(Average, IDR/USD)13,500 13,435 13,400 13,336 13,400 13,714
13,700 –
14,000
ICP (USD/barrel) 40 34 48 50 48 64 60 – 70
Oil Production
(thousands of barrel/day)820 805 815 784 800 7422 722 – 805
Gas Production
(millions of barrels/day)1.15 1.18 1.15 1.14 1.20 1.142 1.21 – 1.30
Indonesia has been able to
maintain robust economic
performance which expected to
continue in 2018 and 2019.
Inflation is benign supported by
improving logistic and
infrastructure acceleration
Interest rate and exchange rate
are stable, benefiting from strong
fundamental and positive investor
perception in the midst of
uncertain global condition.
Increasing commodity price
helped in boosting external
position and revenue.
Indonesia's economy is currently
in the process of transitioning.
However, Indonesia economy
cannot be separated from
external conditions (technology,
trade, and geopolitics) as well as
domestic challenges.
37
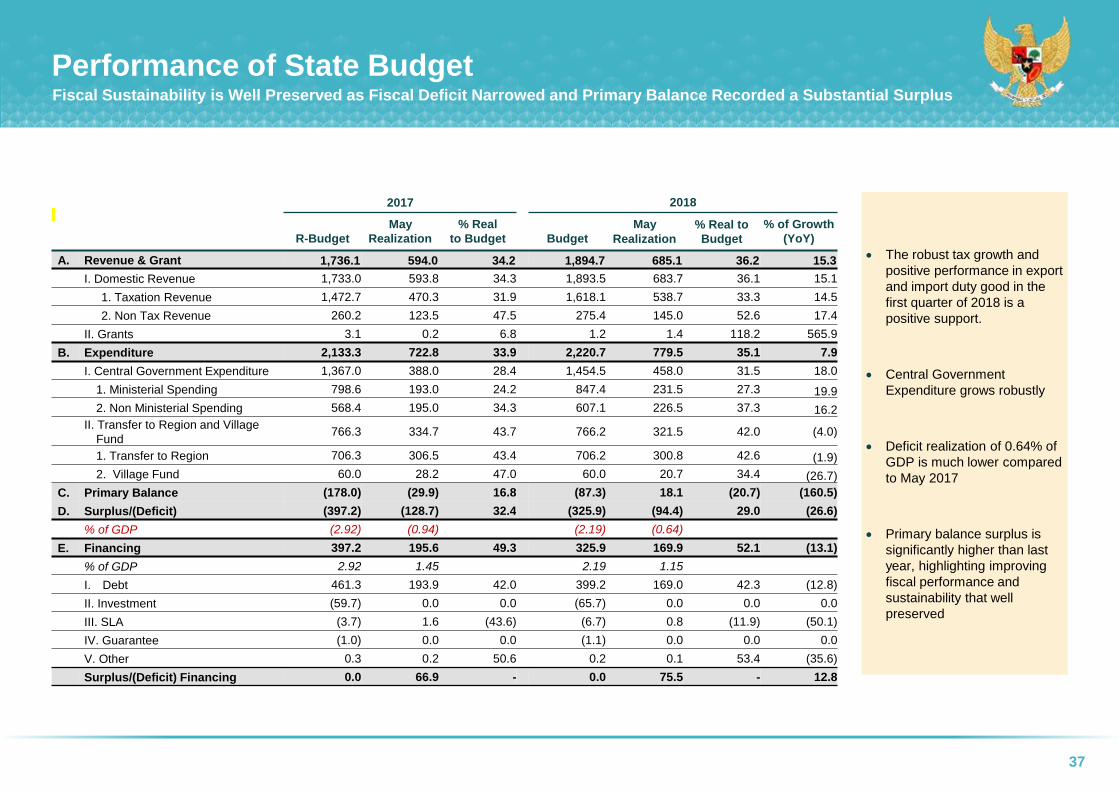
Performance of State BudgetFiscal Sustainability is Well Preserved as Fiscal Deficit Narrowed and Primary Balance Recorded a Substantial Surplus
The robust tax growth and
positive performance in export
and import duty good in the
first quarter of 2018 is a
positive support.
Central Government
Expenditure grows robustly
Deficit realization of 0.64% of
GDP is much lower compared
to May 2017
Primary balance surplus is
significantly higher than last
year, highlighting improving
fiscal performance and
sustainability that well
preserved
2017 2018
R-Budget
May
Realization
% Real
to Budget Budget
May
Realization
% Real to
Budget
% of Growth
(YoY)
A. Revenue & Grant 1,736.1 594.0 34.2 1,894.7 685.1 36.2 15.3
I. Domestic Revenue 1,733.0 593.8 34.3 1,893.5 683.7 36.1 15.1
1. Taxation Revenue 1,472.7 470.3 31.9 1,618.1 538.7 33.3 14.5
2. Non Tax Revenue 260.2 123.5 47.5 275.4 145.0 52.6 17.4
II. Grants 3.1 0.2 6.8 1.2 1.4 118.2 565.9
B. Expenditure 2,133.3 722.8 33.9 2,220.7 779.5 35.1 7.9
I. Central Government Expenditure 1,367.0 388.0 28.4 1,454.5 458.0 31.5 18.0
1. Ministerial Spending 798.6 193.0 24.2 847.4 231.5 27.3 19.9
2. Non Ministerial Spending 568.4 195.0 34.3 607.1 226.5 37.3 16.2
II. Transfer to Region and Village
Fund766.3 334.7 43.7 766.2 321.5 42.0 (4.0)
1. Transfer to Region 706.3 306.5 43.4 706.2 300.8 42.6 (1.9)
2. Village Fund 60.0 28.2 47.0 60.0 20.7 34.4 (26.7)
C. Primary Balance (178.0) (29.9) 16.8 (87.3) 18.1 (20.7) (160.5)
D. Surplus/(Deficit) (397.2) (128.7) 32.4 (325.9) (94.4) 29.0 (26.6)
% of GDP (2.92) (0.94) (2.19) (0.64)
E. Financing 397.2 195.6 49.3 325.9 169.9 52.1 (13.1)
% of GDP 2.92 1.45 2.19 1.15
I. Debt 461.3 193.9 42.0 399.2 169.0 42.3 (12.8)
II. Investment (59.7) 0.0 0.0 (65.7) 0.0 0.0 0.0
III. SLA (3.7) 1.6 (43.6) (6.7) 0.8 (11.9) (50.1)
IV. Guarantee (1.0) 0.0 0.0 (1.1) 0.0 0.0 0.0
V. Other 0.3 0.2 50.6 0.2 0.1 53.4 (35.6)
Surplus/(Deficit) Financing 0.0 66.9 - 0.0 75.5 - 12.8

38
Fiscal Deficit and Primary Balance on an Improving Trend
May Realization (RP Tn)
(71.1)
(189.1)
(128.7)
(94.5)
109.2
26.0
66.9 62.2(6.0)
(110.3)
(29.9)
18.0
2015 2016 2017 2018
Deficit Surplus of Financing Primary Balance
Fiscal deficit
realization(94.5) T
Primary surplus
Higher than previous
period, indicating that
fiscal sustainability
improves
18.0 T
62.2 T
Surplus of financing
realization in 30 May
2018 in-line with
previous year
39
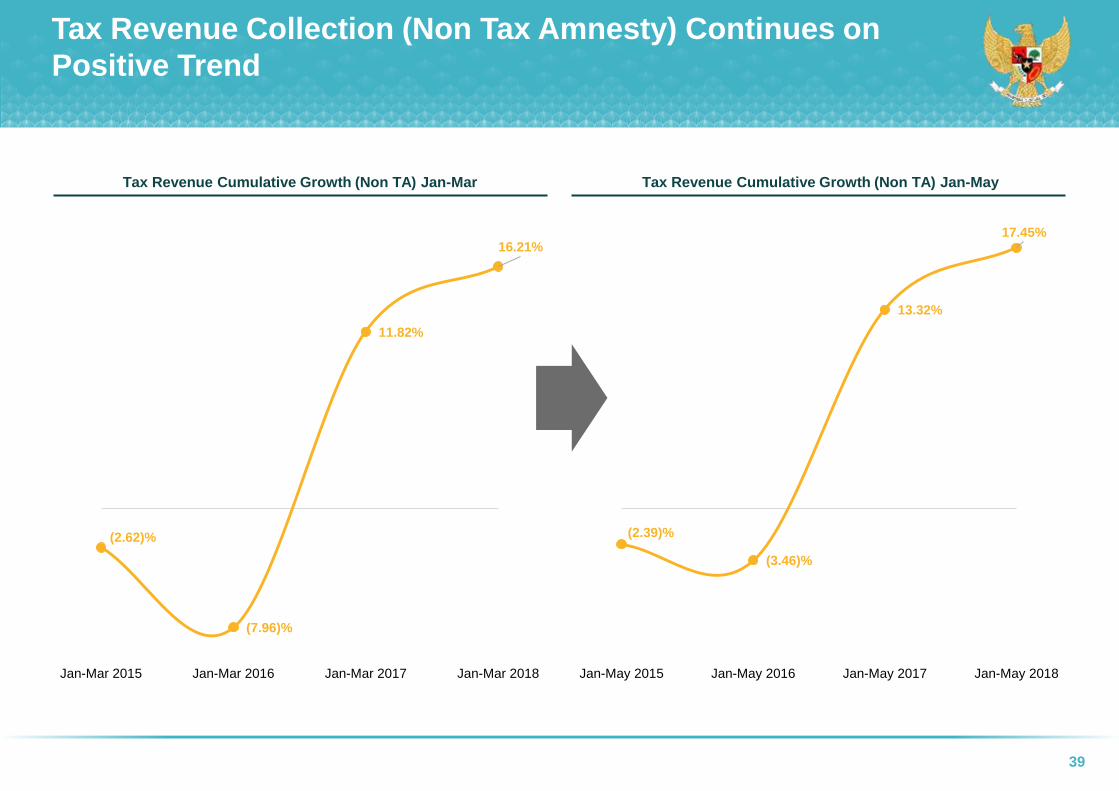
(2.62)%
(7.96)%
11.82%
16.21%
Jan-Mar 2015 Jan-Mar 2016 Jan-Mar 2017 Jan-Mar 2018
Tax Revenue Collection (Non Tax Amnesty) Continues on
Positive Trend
Tax Revenue Cumulative Growth (Non TA) Jan-MayTax Revenue Cumulative Growth (Non TA) Jan-Mar
(2.39)%
(3.46)%
13.32%
17.45%
Jan-May 2015 Jan-May 2016 Jan-May 2017 Jan-May 2018
40
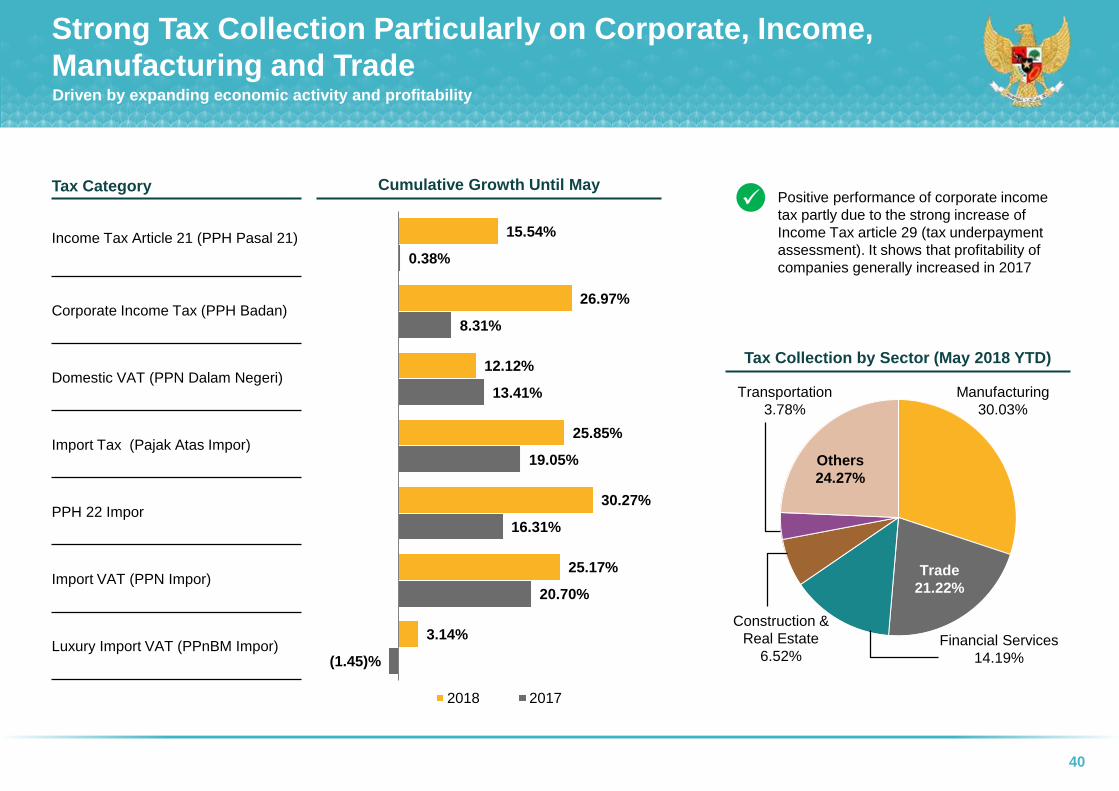
Strong Tax Collection Particularly on Corporate, Income,
Manufacturing and TradeDriven by expanding economic activity and profitability
Tax Category
Income Tax Article 21 (PPH Pasal 21)
Corporate Income Tax (PPH Badan)
Domestic VAT (PPN Dalam Negeri)
Import Tax (Pajak Atas Impor)
PPH 22 Impor
Import VAT (PPN Impor)
Luxury Import VAT (PPnBM Impor)
Cumulative Growth Until MayPositive performance of corporate income
tax partly due to the strong increase of
Income Tax article 29 (tax underpayment
assessment). It shows that profitability of
companies generally increased in 2017
Tax Collection by Sector (May 2018 YTD)
15.54%
26.97%
12.12%
25.85%
30.27%
25.17%
3.14%
0.38%
8.31%
13.41%
19.05%
16.31%
20.70%
(1.45)%
2018 2017
Manufacturing
30.03%
Trade
21.22%
Financial Services
14.19%
Transportation
3.78%
Construction &
Real Estate
6.52%
Others
24.27%

41
Source: EIS, CEISA, SPAN as of 1 May 2018
Custom and Excise Posted the Highest Growth in the Last
3 Years
Excise Revenue Growth (May YTD)Custom & Excise Revenue Growth (May YTD)
Export Duty Revenue Growth (May YTD)Import Duty Revenue Growth (May YTD)
(13.80)%
(26.46)%
6.97%
18.29%
May-2015 May-2016 May-2017 May-2018
(8.78)%
(35.49)%
7.83%
16.89%
May-2015 May-2016 May-2017 May-2018
(4.89)%
6.80%1.14%
14.11%
May-2015 May-2016 May-2017 May-2018
(75.27)%
(37.72)%
66.03%84.60%
May-2015 May-2016 May-2017 May-2018
42
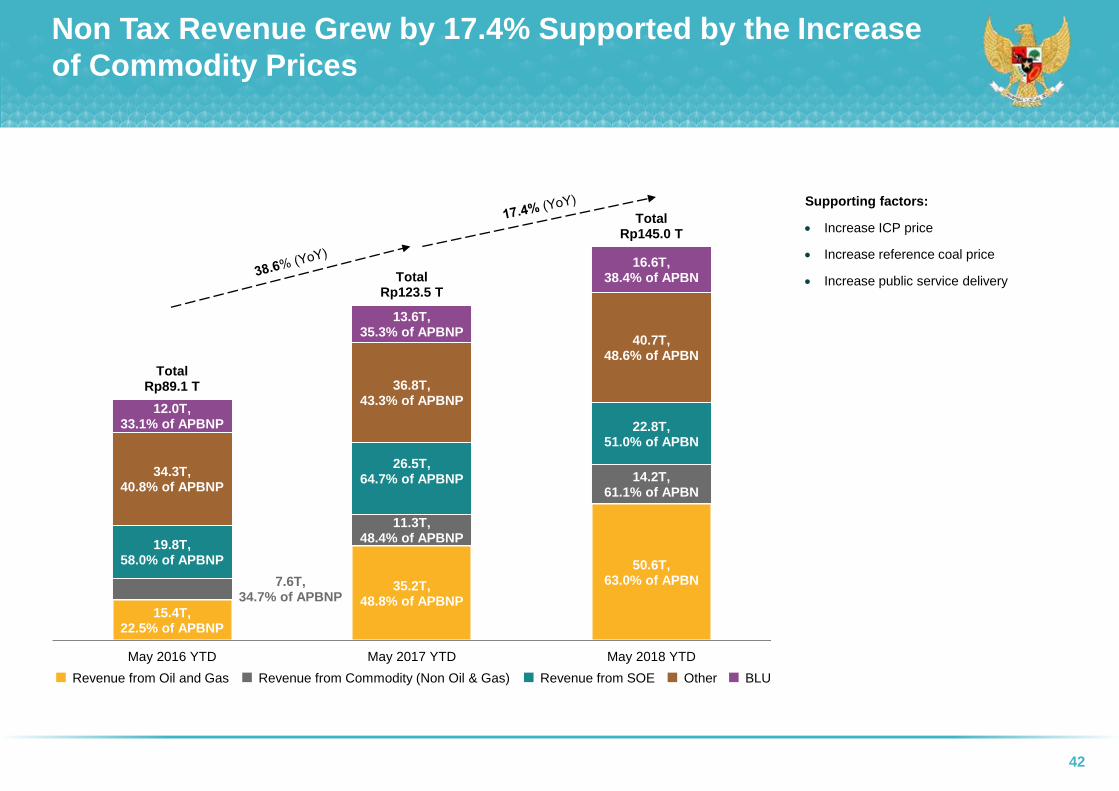
Non Tax Revenue Grew by 17.4% Supported by the Increase
of Commodity Prices
Revenue from Oil and Gas Revenue from Commodity (Non Oil & Gas) Revenue from SOE Other BLU
Supporting factors:
Increase ICP price
Increase reference coal price
Increase public service delivery
15.4T,22.5% of APBNP
35.2T,48.8% of APBNP
50.6T,63.0% of APBN7.6T,
34.7% of APBNP
11.3T,48.4% of APBNP
14.2T,61.1% of APBN
19.8T,58.0% of APBNP
26.5T,64.7% of APBNP
22.8T,51.0% of APBN
34.3T,40.8% of APBNP
36.8T,43.3% of APBNP
40.7T,48.6% of APBN
12.0T,33.1% of APBNP
13.6T,35.3% of APBNP
16.6T,38.4% of APBN
TotalRp89.1 T
TotalRp123.5 T
TotalRp145.0 T
May 2016 YTD May 2017 YTD May 2018 YTD
43
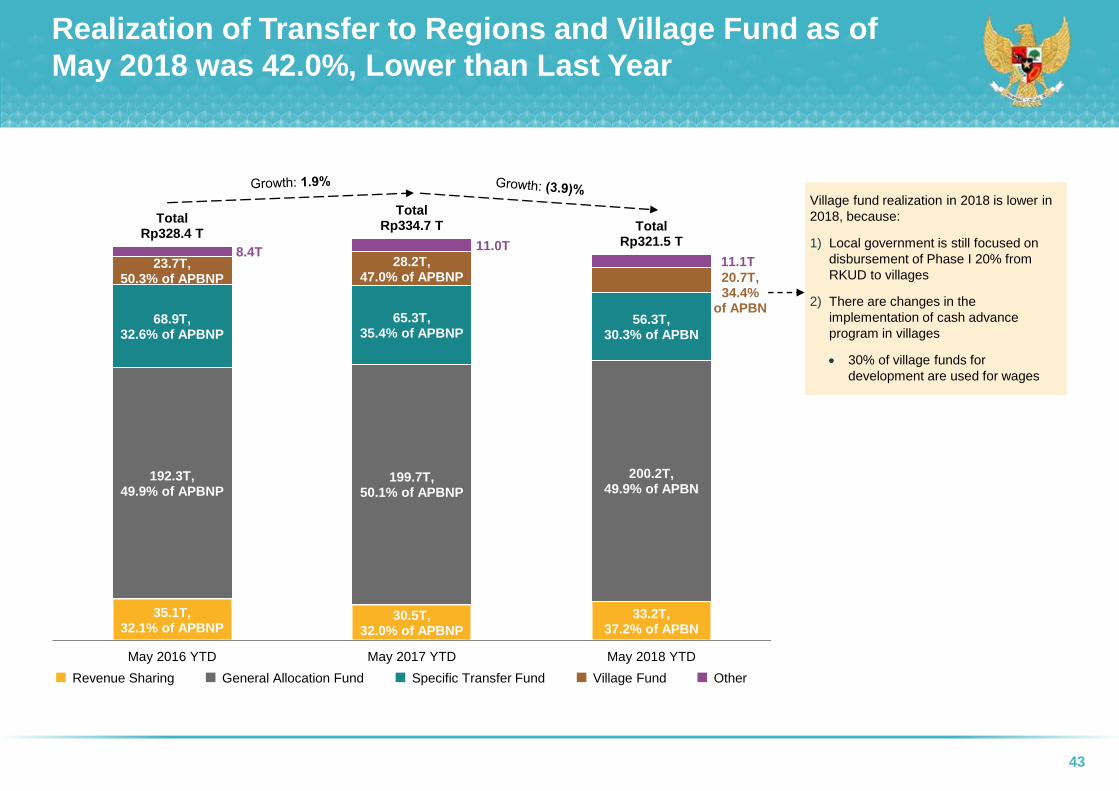
Realization of Transfer to Regions and Village Fund as of
May 2018 was 42.0%, Lower than Last Year
Revenue Sharing General Allocation Fund Specific Transfer Fund Village Fund Other
35.1T,32.1% of APBNP
30.5T,32.0% of APBNP
33.2T,37.2% of APBN
192.3T,49.9% of APBNP
199.7T,50.1% of APBNP
200.2T,49.9% of APBN
68.9T,32.6% of APBNP
65.3T,35.4% of APBNP
56.3T,30.3% of APBN
23.7T,50.3% of APBNP
28.2T,47.0% of APBNP 20.7T,
34.4%of APBN
8.4T 11.0T
11.1T
TotalRp328.4 T
TotalRp334.7 T Total
Rp321.5 T
May 2016 YTD May 2017 YTD May 2018 YTD
Village fund realization in 2018 is lower in
2018, because:
1) Local government is still focused on
disbursement of Phase I 20% from
RKUD to villages
2) There are changes in the
implementation of cash advance
program in villages
30% of village funds for
development are used for wages
44
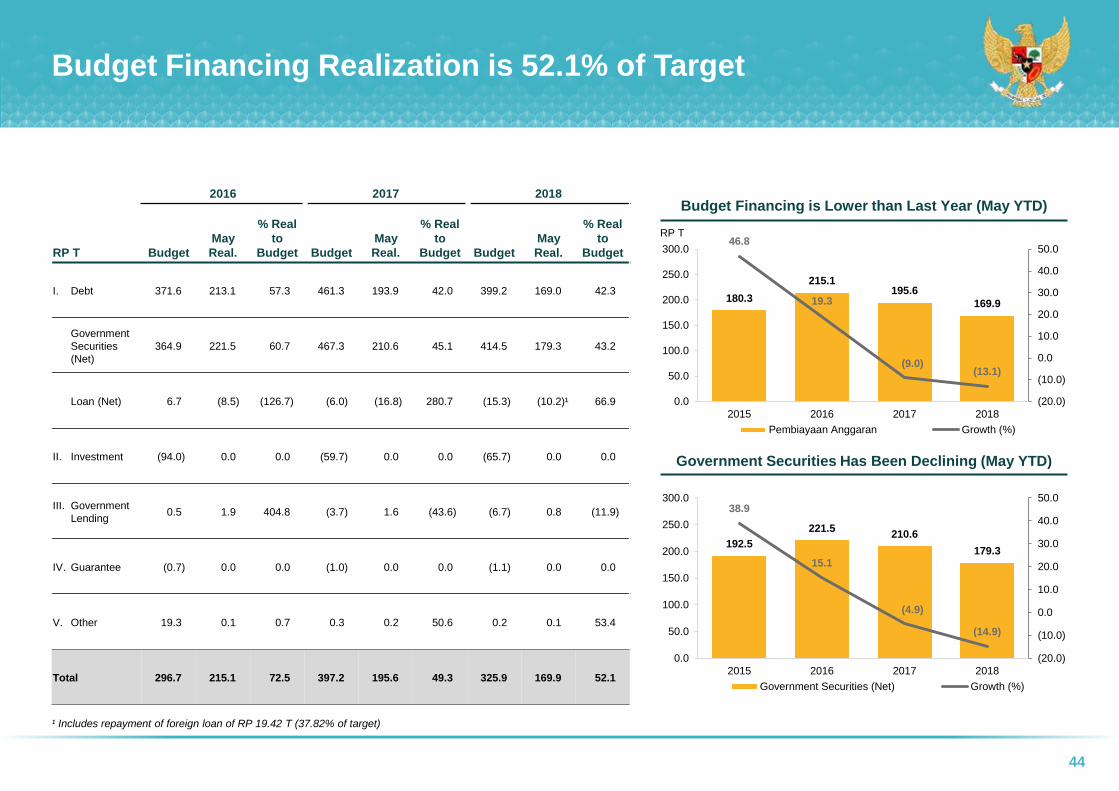
¹ Includes repayment of foreign loan of RP 19.42 T (37.82% of target)
Budget Financing Realization is 52.1% of Target
2016 2017 2018
RP T Budget
May
Real.
% Real
to
Budget Budget
May
Real.
% Real
to
Budget Budget
May
Real.
% Real
to
Budget
I. Debt 371.6 213.1 57.3 461.3 193.9 42.0 399.2 169.0 42.3
Government
Securities
(Net)
364.9 221.5 60.7 467.3 210.6 45.1 414.5 179.3 43.2
Loan (Net) 6.7 (8.5) (126.7) (6.0) (16.8) 280.7 (15.3) (10.2)¹ 66.9
II. Investment (94.0) 0.0 0.0 (59.7) 0.0 0.0 (65.7) 0.0 0.0
III. Government
Lending0.5 1.9 404.8 (3.7) 1.6 (43.6) (6.7) 0.8 (11.9)
IV. Guarantee (0.7) 0.0 0.0 (1.0) 0.0 0.0 (1.1) 0.0 0.0
V. Other 19.3 0.1 0.7 0.3 0.2 50.6 0.2 0.1 53.4
Total 296.7 215.1 72.5 397.2 195.6 49.3 325.9 169.9 52.1
180.3
215.1 195.6
169.9
46.8
19.3
(9.0)(13.1)
(20.0)
(10.0)
0.0
10.0
20.0
30.0
40.0
50.0
0.0
50.0
100.0
150.0
200.0
250.0
300.0
2015 2016 2017 2018
Pembiayaan Anggaran Growth (%)
Budget Financing is Lower than Last Year (May YTD)
Government Securities Has Been Declining (May YTD)
RP T
192.5
221.5 210.6
179.3
38.9
15.1
(4.9)
(14.9)
(20.0)
(10.0)
0.0
10.0
20.0
30.0
40.0
50.0
0.0
50.0
100.0
150.0
200.0
250.0
300.0
2015 2016 2017 2018
Government Securities (Net) Growth (%)
Fiscal Incentives to Support
Investment & Export
05Borobudur Temple in Central Java,
Indonesia

46
Taxation Incentive Scheme for Investment & Export (1/2)
Tax Incentive for
Upstream Oil & Gas
Gross Split & Cost
Recovery
Income Tax Incentive
for Local Incorporated
Bank
Income Tax and VAT
Incentives for the
development of
REIT/KIK DIRE
Income Tax Incentive
for Export Proceeds
Deposit
Income tax for deposit
interest from export
proceeds 0%-10%.
(normal tariff is 20%)
Tax Holiday
Income tax discount for
pioneer industries up to
100% between 5 to 20
years in accordance
with investment value.
Transition time for 2
years with tax deduction
of 50%
Tax Allowance
Investment allowance of
30% from investment
value (5% a year for 6
years), accelerated
depreciation and
amortization, Dividend
tariff for foreign
taxpayers up tp 10% or
according to tax treaty,
extended loss
compensation beyond 5
years (maximum 10
years)
Import Duties
Exemption Facility
For machineries and
capital goods for 2 years
and can be extended
(PMK 176/2009 stdtd
PMK 188/2015)
Import Duties Borne
By Government/
BMDTP
For specific industries
according to
recommendation from
Ministry of Industry for 1
year
Import Duty
Incentive for power plant
industries for public
VAT Exemption
For strategic goods
including macineries
and industrial equipment
Tax Incentive for General / Specific Sectors

47
Taxation Incentive Scheme for Investment & Export (2/2)
Special
Economic Zone
Facilities: Import
Duties, VAT,
Luxury goods
tax, excise, local
content
utilization
incentive, special
income tax
Industrial Zone
Facilities: tax
allowance, tax
holiday, import
duties, import
VAT
Free Trade
Zone
Exemption of
import duties,
VAT, luxury
goods tax,
excise
Bonded
Storage Area
(Kawasan
Penimbunan
Berikat)
Facilities: Import
duties, VAT,
luxury goods,
excise
Tax Incentive for Spatial/Zone
To reduce disparities and support economic growth
The ease of imports
used in the
production goods
which will be fully
exported
(Kemudahan Impor
Tujuan Ekspor)
Facilities: import duty
exemption, Import VAT
exemption of raw
materials used in
production goods will
be exported
Special Export
Assignment
(Penugasan Khusus
Ekspor)
Export financing for
specific sectors
through Indonesia’s
Export Financing
Agency (Lembaga
Pembiayaan Ekspor
Indonesia) that are
considered important
but commercially not
feasible
This assignment has
been given to PT INKA
(export of train coach
to Bangladesh), PT DI
(export of aircraft to
Africa) and small
medium industries
Bonded Storage Area
Facilities:
Import duties, VAT,
Import Income Tax
Special Tax Incentives to Support Export
48
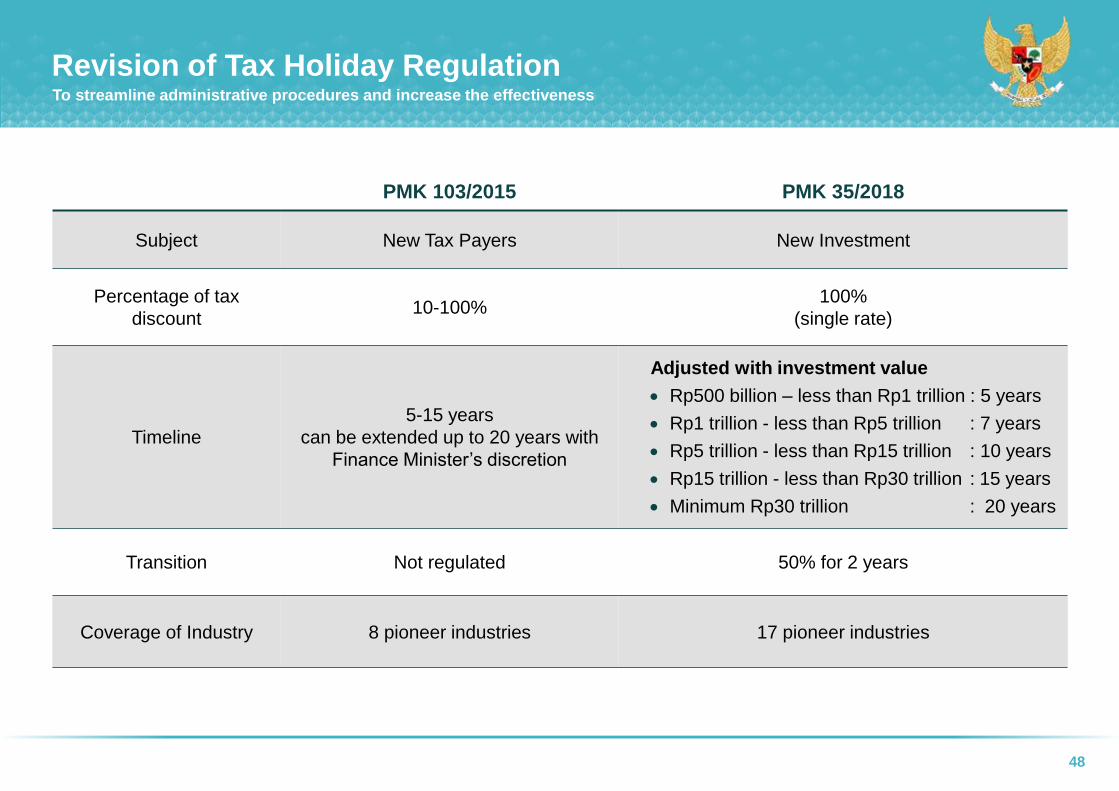
Revision of Tax Holiday RegulationTo streamline administrative procedures and increase the effectiveness
PMK 103/2015 PMK 35/2018
Subject New Tax Payers New Investment
Percentage of tax
discount10-100%
100%
(single rate)
Timeline
5-15 years
can be extended up to 20 years with
Finance Minister’s discretion
Transition Not regulated 50% for 2 years
Coverage of Industry 8 pioneer industries 17 pioneer industries
Adjusted with investment value
Rp500 billion – less than Rp1 trillion : 5 years
Rp1 trillion - less than Rp5 trillion : 7 years
Rp5 trillion - less than Rp15 trillion : 10 years
Rp15 trillion - less than Rp30 trillion : 15 years
Minimum Rp30 trillion : 20 years

Medium Term Fiscal Objectives
& 2019 Macro-fiscal Framework
06Wayang – Traditional Puppet
Theaters, Indonesia

50
Macroeconomic Assumptions 2019
Indicators
2016 2017 2018 2019
Realized Realized APBN Outlook
a. Economic growth
(%, YoY)5.02 5.07 5.4 5.4 – 5.8
b. Inflation
(%, YoY)3.02 3.61 3.5 2.5 – 4.5
c. 3-Month Treasury Bill
(%)5.7 4.98 5.2 4.6 – 5.2
d. Exchange Rate
(Rp/US$)13,307 13,384 13,400 13,700 – 14,000
e. ICP
(US$/barrel)40.2 51.2 48 60 – 70
f. Oil Lifting
(thousands of barrel per
day)
829 803.91 800 722 – 805
g. Gas Lifting
(thousand barrels per day
oil equivalent)
1,180 1,142.33 1,200 1,210 – 1,300
51
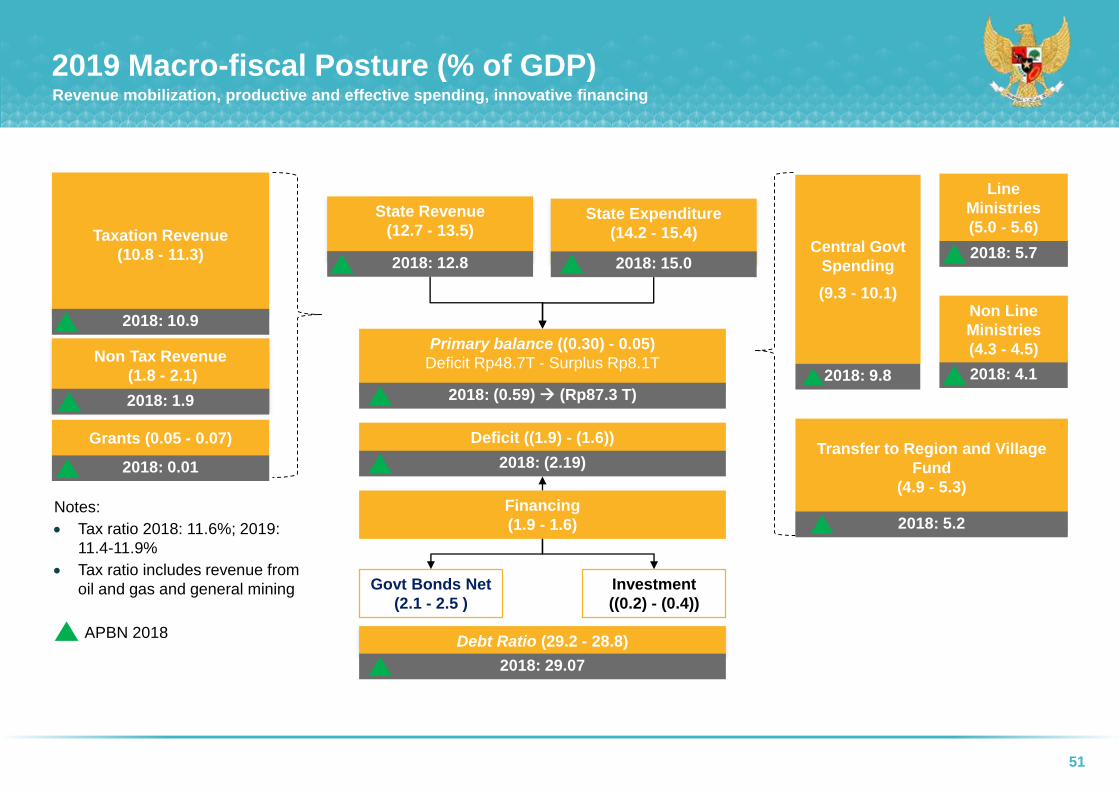
2019 Macro-fiscal Posture (% of GDP) Revenue mobilization, productive and effective spending, innovative financing
Taxation Revenue
(10.8 - 11.3)
Non Tax Revenue
(1.8 - 2.1)
State Revenue
(12.7 - 13.5)Central Govt
Spending
(9.3 - 10.1)
Transfer to Region and Village
Fund
(4.9 - 5.3)
Govt Bonds Net
(2.1 - 2.5 )
Deficit ((1.9) - (1.6))
Investment
((0.2) - (0.4))
Financing
(1.9 - 1.6)
Debt Ratio (29.2 - 28.8)
Grants (0.05 - 0.07)
Non Line
Ministries
(4.3 - 4.5)
Line
Ministries
(5.0 - 5.6)
Primary balance ((0.30) - 0.05)
Deficit Rp48.7T - Surplus Rp8.1T
State Expenditure
(14.2 - 15.4)
2018: 10.9
2018: 1.9
2018: 0.01
2018: 12.8
2018: 9.8
2018: 15.02018: 5.7
2018: 4.1
2018: 5.2
2018: (0.59) (Rp87.3 T)
2018: (2.19)
2018: 29.07
Notes:
Tax ratio 2018: 11.6%; 2019:
11.4-11.9%
Tax ratio includes revenue from
oil and gas and general mining
APBN 2018

52
1 Including revenue from oil & gas and general mining.2 Submitted to parliament for discussion.
Medium Term Fiscal FrameworkFocusing on quality and productive spending, expanding fiscal space and sustainability
Items (% of GDP) APBN 2018 20192 2020 2021 2022
Revenue & Grants 12.8 12.7 – 13.5 12.7 – 13.9 13.5 – 14.0 13.6 – 14.4
Tax Ratio1 11.6 11.4 – 11.9 11.4 – 12.5 11.6 – 13.0 11.8 – 13.6
Total Spending 15.0 14.2 – 15.4 14.3 – 15.6 15.0 – 15.7 15.1 – 16.0
Capital Expenditure 1.4 1.5 - 1.7 1.8 – 2.3 2.2 – 2.7 2.3 – 3.0
Primary Balance (0.59) 0.05 - (0.30) 0.05 – 0.1 0.10 – 0.01 0.1 – 0.05
Budget Deficit (2.19) (1.6) - (1.9) (1.6) - (1.7) (1.5) - (1.7) (1.5) - (1.6)
Debt Ratio 29.07 28.8 – 29.2 28.5 - 28.6 27.8 – 28.3 26.3 – 27.9
Strengthening quality of spending by increasing productive avenues
Enlarging fiscal space through revenue increase
Efficiencies in non-priority spending
Developing creative and innovative financing
Manageable deficit and debt level
Positive primary balance in 2020

Monetary Policy and
Banking Sector
07Raja Ampat in West Papua,
Indonesia
54
(0.33)
(0.85)
(1.19)
(1.67)
(1.76)
(1.91)
(2.08)
(2.75)
(3.48)
(3.90)
(6.26)
(8.43)
(1.50)
(0.85)
(1.22)
0.13
(1.02)
(1.41)
(1.46)
(1.11)
(1.12)
(3.57)
(5.84)
(10.15)
(12.00) (10.00) (8.00) (6.00) (4.00) (2.00) 0.00 2.00
PHP
KRW
CNY
IDR
SGD
MYR
THB
INR
ZAR
EUR
BRL
TRY
May vs April 2018
Point to Point Average
Source: BPS; Bank Indonesia
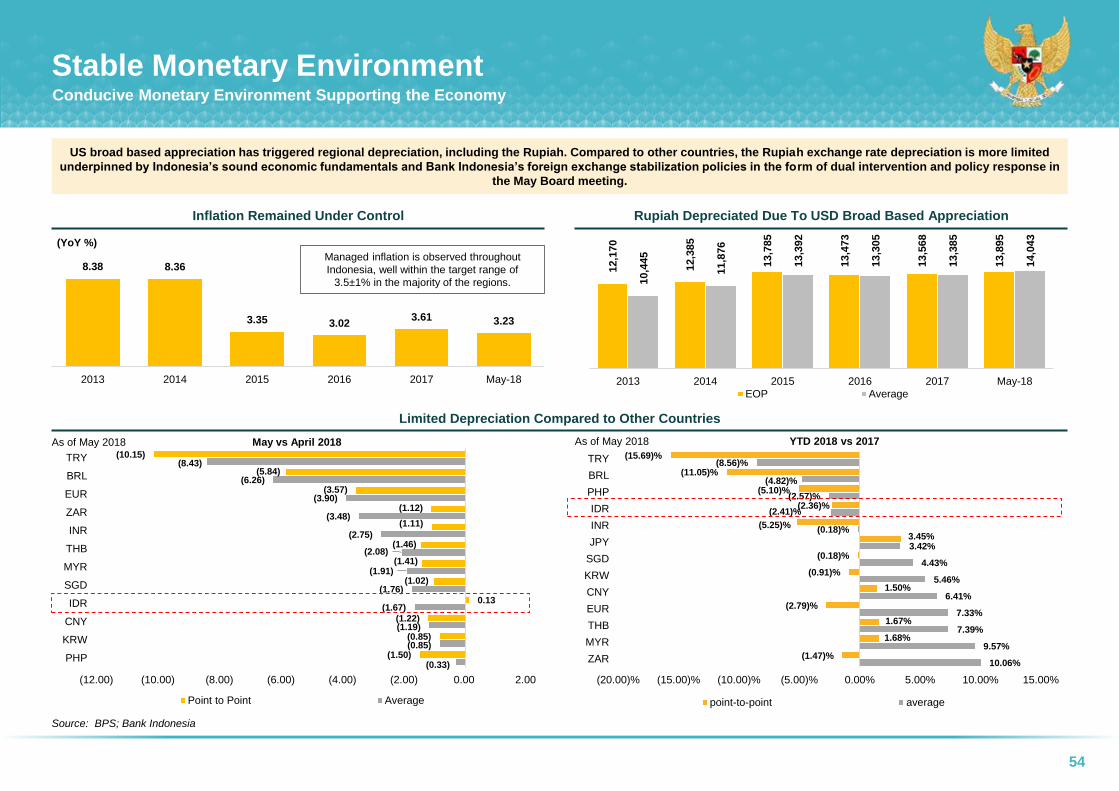
Stable Monetary EnvironmentConducive Monetary Environment Supporting the Economy
8.38 8.36
3.35 3.023.61 3.23
2013 2014 2015 2016 2017 May-18
(YoY %)
12,1
70
12,3
85
13,7
85
13,4
73
13,5
68
13,8
95
10,4
45
11,8
76
13,3
92
13,3
05
13,3
85
14,0
43
2013 2014 2015 2016 2017 May-18
EOP Average
US broad based appreciation has triggered regional depreciation, including the Rupiah. Compared to other countries, the Rupiah exchange rate depreciation is more limited
underpinned by Indonesia’s sound economic fundamentals and Bank Indonesia’s foreign exchange stabilization policies in the form of dual intervention and policy response in
the May Board meeting.
Rupiah Depreciated Due To USD Broad Based AppreciationInflation Remained Under Control
Limited Depreciation Compared to Other Countries
As of May 2018
Managed inflation is observed throughout
Indonesia, well within the target range of
3.5±1% in the majority of the regions.
10.06%
9.57%
7.39%
7.33%
6.41%
5.46%
4.43%
3.42%
(0.18)%
(2.41)%
(2.57)%
(4.82)%
(8.56)%
(1.47)%
1.68%
1.67%
(2.79)%
1.50%
(0.91)%
(0.18)%
3.45%
(5.25)%
(2.36)%
(5.10)%
(11.05)%
(15.69)%
(20.00)% (15.00)% (10.00)% (5.00)% 0.00% 5.00% 10.00% 15.00%
ZAR
MYR
THB
EUR
CNY
KRW
SGD
JPY
INR
IDR
PHP
BRL
TRY
point-to-point average
YTD 2018 vs 2017As of May 2018

55
(27.1) (28.4) (28.4) (29.6) (33.0)
4.2 5.2 5.5 4.5 4.55.8 7.0
14.0 15.3 18.8
(12.1) (10.0) (8.7) (7.1)(7.8)
(29.1) (27.5) (17.5) (17.0)(17.5)
(3.2)(3.1)
(2.0) (1.8) (1.7)
2013 2014 2015 2016 2017*
(3.5)
(3.0)
(2.5)
(2.0)
(1.5)
(1.0)
(50.0)
(40.0)
(30.0)
(20.0)
(10.0)
0.0
10.0
20.0
30.0
%(USD bn)
Primary Income Secondary IncomeGoods ServicesCurrent Account Current Account (% GDP)-rhs
Source: Bank Indonesia1 Provisional figures.2 Very provisional figures.
External Sector Remains ResilientHealthy Current Account Deficit and Balance of Payment
Components (USD bn) 2013 2014 2015 2016 20171
Q1-20182
Current Account (29.1) (27.5) (17.5) (17.0) (17.5) (5.5)
A. Goods 5.8 7.0 14.0 15.3 18.8 2.4
Export, fob 182.1 175.3 149.1 144.5 168.9 44.4
Import, fob (176.3) (168.3) (135.1) (129.2) (150.1) (42.1)
B. Services, Primary &
Secondary Income(34.9) (34.5) (31.6) (32.3) (36.3) (7.9)
Capital & Financial Account 22.0 44.9 16.9 29.3 29.5 1.9
1. Direct Investment 12.2 14.7 10.7 16.1 19.2 3.1
2. Portfolio Investment 10.9 26.1 16.2 19.0 20.6 (1.2)
3. Financial Derivatives (0.3) (0.2) 0.0 0.0 (0.1) 0.1
4. Other Investment (0.8) 4.3 (10.1) (5.8) (10.2) (0.2)
Overall Balance (7.3) 15.2 (1.1) 12.1 11.6 (3.9)
Memorandum:
Reserve Assets Position 99.4 111.9 105.9 116.4 130.2 126.0
In months of imports &
official debt repayment5.5 6.5 7.4 8.4 8.3 7.7
Current Account
(% GDP)(3.2) (3.1) (2.0) (1.8) (1.7) (2.2)
Balance of Payment (2013 – 2017)Current Account Deficit is Improving, Significantly Lower than 2013
1
Balance of Payment Remains Favourable
(29.1) (27.5)(17.5) (17.0) (17.5)
22.0
44.9
16.929.3
29.5
(7.3)
15.2
(1.1)
12.111.6
(40.0)
(10.0)
20.0
50.0
2013 2014 2015 2016 2017
Current Account Capital & Financial Account Overall Balance
(USD bn)
1
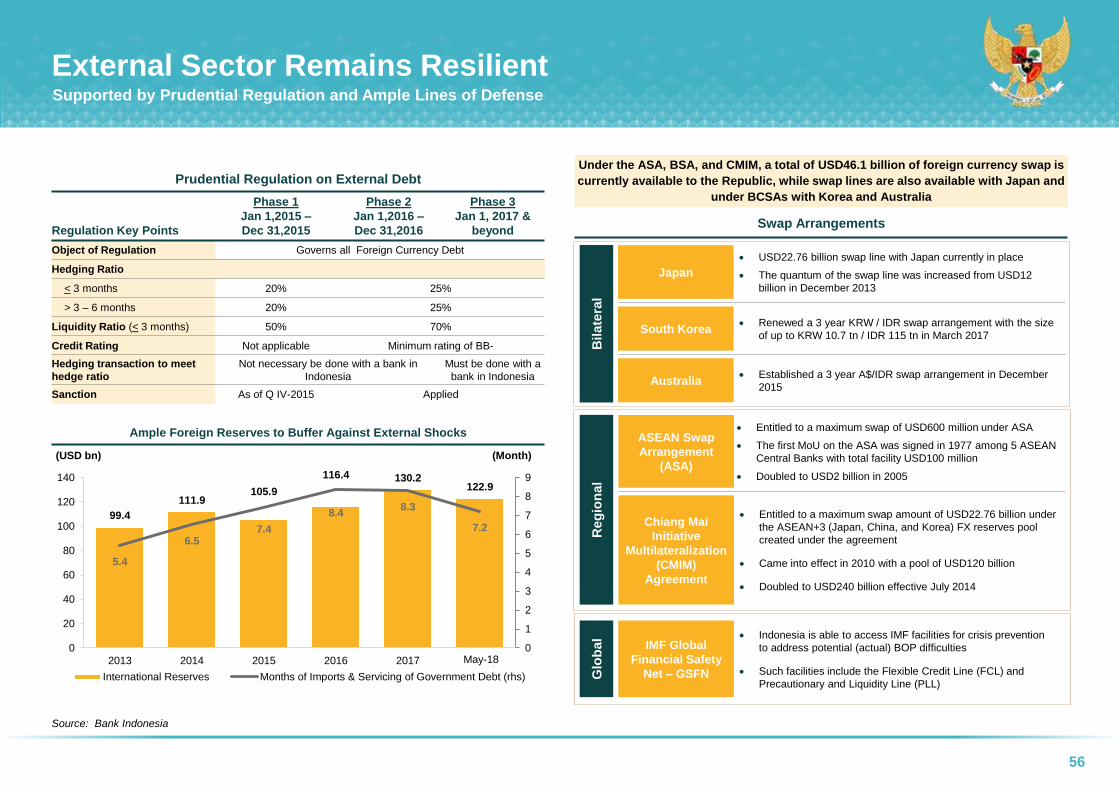
56
External Sector Remains ResilientSupported by Prudential Regulation and Ample Lines of Defense
Source: Bank Indonesia
Regulation Key Points
Phase 1
Jan 1,2015 –
Dec 31,2015
Phase 2
Jan 1,2016 –
Dec 31,2016
Phase 3
Jan 1, 2017 &
beyond
Object of Regulation Governs all Foreign Currency Debt
Hedging Ratio
< 3 months 20% 25%
> 3 – 6 months 20% 25%
Liquidity Ratio (< 3 months) 50% 70%
Credit Rating Not applicable Minimum rating of BB-
Hedging transaction to meet
hedge ratio
Not necessary be done with a bank in
Indonesia
Must be done with a
bank in Indonesia
Sanction As of Q IV-2015 Applied
IMF Global
Financial Safety
Net – GSFN
Indonesia is able to access IMF facilities for crisis prevention
to address potential (actual) BOP difficulties
Such facilities include the Flexible Credit Line (FCL) and
Precautionary and Liquidity Line (PLL)
Bilate
ral
Reg
ion
al
Glo
bal
Japan
USD22.76 billion swap line with Japan currently in place
The quantum of the swap line was increased from USD12
billion in December 2013
South Korea Renewed a 3 year KRW / IDR swap arrangement with the size
of up to KRW 10.7 tn / IDR 115 tn in March 2017
Australia Established a 3 year A$/IDR swap arrangement in December
2015
Swap Arrangements
Under the ASA, BSA, and CMIM, a total of USD46.1 billion of foreign currency swap is
currently available to the Republic, while swap lines are also available with Japan and
under BCSAs with Korea and Australia
ASEAN Swap
Arrangement
(ASA)
Entitled to a maximum swap of USD600 million under ASA
The first MoU on the ASA was signed in 1977 among 5 ASEAN
Central Banks with total facility USD100 million
Doubled to USD2 billion in 2005
Chiang Mai
Initiative
Multilateralization
(CMIM)
Agreement
Entitled to a maximum swap amount of USD22.76 billion under
the ASEAN+3 (Japan, China, and Korea) FX reserves pool
created under the agreement
Came into effect in 2010 with a pool of USD120 billion
Doubled to USD240 billion effective July 2014
Prudential Regulation on External Debt
99.4
111.9105.9
116.4 130.2122.9
5.4
6.57.4
8.48.3
7.2
0
1
2
3
4
5
6
7
8
9
0
20
40
60
80
100
120
140
2013 2014 2015 2016 2017 18-May
(Month)(USD bn)
International Reserves Months of Imports & Servicing of Government Debt (rhs)
May-18
Ample Foreign Reserves to Buffer Against External Shocks
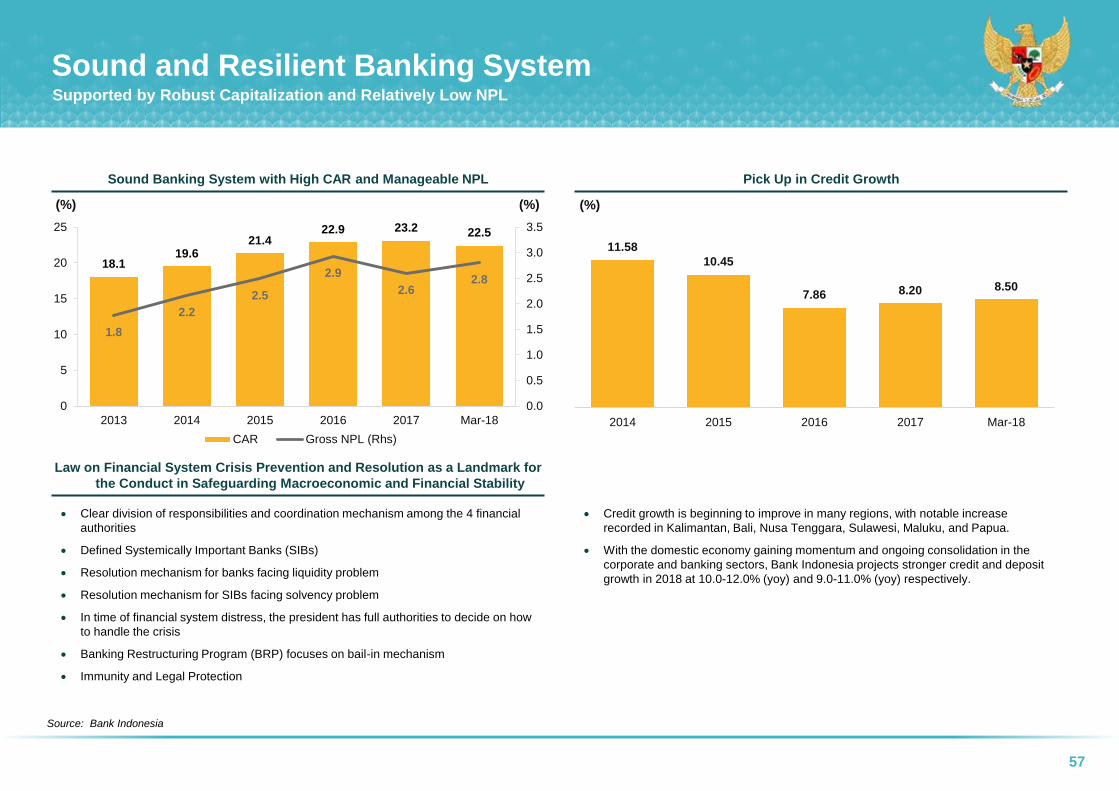
57
Sound and Resilient Banking SystemSupported by Robust Capitalization and Relatively Low NPL
Source: Bank Indonesia
18.119.6
21.422.9 23.2 22.5
1.8
2.2
2.5
2.9
2.62.8
0.0
0.5
1.0
1.5
2.0
2.5
3.0
3.5
0
5
10
15
20
25
2013 2014 2015 2016 2017 Mar-18
(%)(%)
CAR Gross NPL (Rhs)
11.58
10.45
7.86 8.20 8.50
2014 2015 2016 2017 Mar-18
(%)
Credit growth is beginning to improve in many regions, with notable increase
recorded in Kalimantan, Bali, Nusa Tenggara, Sulawesi, Maluku, and Papua.
With the domestic economy gaining momentum and ongoing consolidation in the
corporate and banking sectors, Bank Indonesia projects stronger credit and deposit
growth in 2018 at 10.0-12.0% (yoy) and 9.0-11.0% (yoy) respectively.
Clear division of responsibilities and coordination mechanism among the 4 financial
authorities
Defined Systemically Important Banks (SIBs)
Resolution mechanism for banks facing liquidity problem
Resolution mechanism for SIBs facing solvency problem
In time of financial system distress, the president has full authorities to decide on how
to handle the crisis
Banking Restructuring Program (BRP) focuses on bail-in mechanism
Immunity and Legal Protection
Pick Up in Credit GrowthSound Banking System with High CAR and Manageable NPL
Law on Financial System Crisis Prevention and Resolution as a Landmark for
the Conduct in Safeguarding Macroeconomic and Financial Stability

58
Recent Monetary Policy DecisionsPre-emptive Policy to Strengthen Stability
Source: Bank Indonesia
as of May 31, 2018
On 16th and 17th May 2018, the BI Board of Governors agreed to raise the BI 7-day Reverse Repo Rate by 25 bps to 4.50%, while
also raising the Deposit Facility (DF) and Lending Facility (LF) rates by 25 bps to 3.75% and 5.25% respectively,
effective 18-May-2018
On 30th May 2018, the BI Board of Governors agreed to raise the BI 7-day Reverse Repo Rate by 25 bps to 4.75%, while also
raising the Deposit Facility (DF) and Lending Facility (LF) rates by 25 bps to 4.00% and 5.50% respectively,
effective 31-May-2018
Global economic
growth in 2018 is
projected to improve,
despite the ongoing
global liquidity
rebalancing process.
Domestic economic
growth in Indonesia
was solid in the first
quarter of 2018,
bolstered by
domestic demand
The current
account deficit
narrowed in the
first quarter of
2018, backed by
external sector
resilience
The rupiah
depreciated in the
first quarter of
2018, sparked by
global USD
appreciation
Inflation in April 2018
was controlled within the
target corridor,
underpinned by food
price corrections and
anchored expectations
The financial
system remains
stable and the
bank
intermediation
function is
improving
The decision to increase the interest rate is part of Bank Indonesia's short-term policy action which prioritizes monetary policy on stability particularly for
the rupiah exchange rate

59
Bank Indonesia’s Policy DirectionTo Maintain Rupiah Stability and Support Growth
Source: Bank Indonesia
To form rational expectations, thus
helping to mitigate the rupiah
overshooting its fundamental level.
Intensive communication,
especially to market players,
banks, businesses, and
economists
4Sharia economy and finance
development to create halal economy
chain, sharia financal sector
development both for commercial and
social purposes, including its education
and communication
Sharia economy and finance
development
4
Strengthening the monetary
operations in the foreign
exchange and money markets
To maintain adequate liquidity in the
rupiah money market and interbank
swap market
3
Payment system development
to support digital economy
Electronification to support social
assistance disbursement and financial
transcation of the central and regional
government
3
To stabilise the rupiah exchange
rate, adjust fair prices in the financial
markets and maintain adequate
liquidity in the money market
Dual intervention in the foreign
exchange market and
government securities (Surat
Berharga Negara – SBN)
market in a measured way
2Coordination with the Coordinating
Ministry of Economic Affairs, the
Ministry of Finance, and the Financial
Services Authority to accelerate
financial market deepening, particularly
in private financing for infrastructure.
Policy coordination to
accelerate financial market
deepening
2
A pre-emptive, front-loading
and ahead-of-the-curve policy
response
To stabilise the rupiah exchange
rate, while consistently controlling
inflation within the 2018-2019 target
range of 3.5±1%
1
Further easing of
macroprudential policy
To bolster the growth of the property
sector which has positive impact to the
economy
1
Measures to Support GrowthMeasures to Stabilize Rupiah Exchange Rate
Debt Management and
Budget Financing
08Bromo Tengger Semeru National
Park in East Java, Indonesia

61
Source: Ministry of Finance1 Original amount was Rp 414.5 tn, shifting to loan in amount of Rp 7.3 tn.
Domestic Government Securities
2018 Progress of IssuanceCreating Prudent and Sustainable Fiscal Management
Government Debt Securities
70%-75%
Government Sukuk
25%-30%
Weekly Auction:
Conventional securities 24-25x
Islamic securities 24-25x
Non-Auction
Retail Bonds and Retail Sukuk (ORI, SBR, Sukuk Ritel)
Private Placement Based on request
Target avg. tenor maturity for Government Securities Issuance
7-8 years
Instruments
Indicative Budget Target
Rp tn USD bn
Budget Deficit (2.19% of GDP) 325.9 24.3
Financing 399.2 29.8
Government Securities (Net) 1 407.2 30.4
Government Securities (Gross) 834.3 62.3
Composition
Domestic Government Securities 80 - 83%
International Government Securities 17 - 20%
International Government Securities
Avoid crowding out in domestic market
Provide benchmarks for corporate bonds
Investor base diversification
• USD
• Sukuk USD
• EUR
• JPY
Alternative of Issuance
Private
PlacementAuction Book Building
Government Securities Financing Realization
Budget 2018
Realization
(as of May 2018)
%
Realization
to Budget
2018Rp tn USD bn Rp tn USD bn
Government securities (net)1 407.2 30.4 190.8 14.2 46.8%
Government securities (gross) 834.3 62.3 434.9 32.5 52.1%
Government debt securities (GDS) 602.2 44.9 303.2 22.6 50.4%
Domestic GDS 504.3 37.6 205.3 15.3
International bonds 97.9 7.3 97.9 7.3
Government Sukuk 232.1 17.2 131.7 9.7 56.8%
Domestic Government sukuk 190.7 14.2 90.3 6.7
Global Sukuk 41.4 3.0 41.4 3.0
Issuance Targets for Government SecuritiesGovernment Securities to Meet State Budget Financing
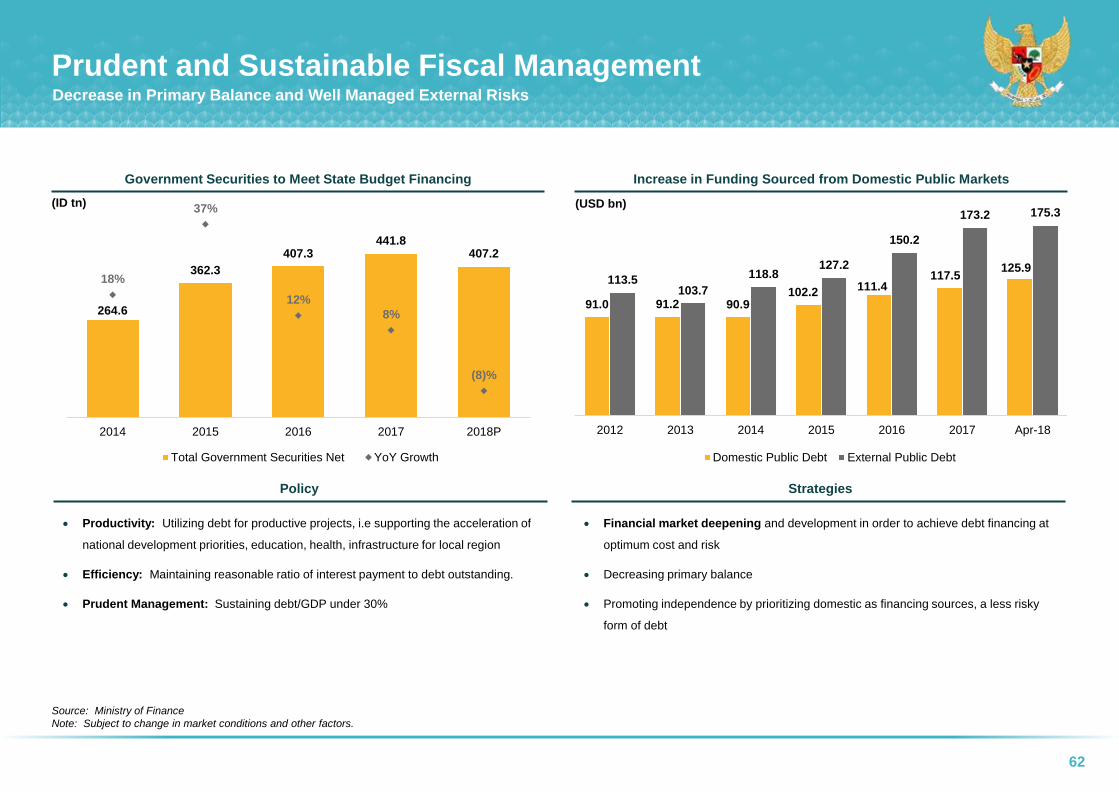
62
Source: Ministry of Finance
Note: Subject to change in market conditions and other factors.
StrategiesPolicy
Prudent and Sustainable Fiscal ManagementDecrease in Primary Balance and Well Managed External Risks
(ID tn) (USD bn)
Productivity: Utilizing debt for productive projects, i.e supporting the acceleration of
national development priorities, education, health, infrastructure for local region
Efficiency: Maintaining reasonable ratio of interest payment to debt outstanding.
Prudent Management: Sustaining debt/GDP under 30%
Financial market deepening and development in order to achieve debt financing at
optimum cost and risk
Decreasing primary balance
Promoting independence by prioritizing domestic as financing sources, a less risky
form of debt
91.0 91.2 90.9102.2
111.4117.5
125.9113.5
103.7
118.8127.2
150.2
173.2 175.3
2012 2013 2014 2015 2016 2017 Apr-18
Domestic Public Debt External Public Debt
264.6
362.3
407.3441.8
407.2
18%
37%
12%
8%
(8)%
2014 2015 2016 2017 2018P
Total Government Securities Net YoY Growth
Increase in Funding Sourced from Domestic Public Markets Government Securities to Meet State Budget Financing
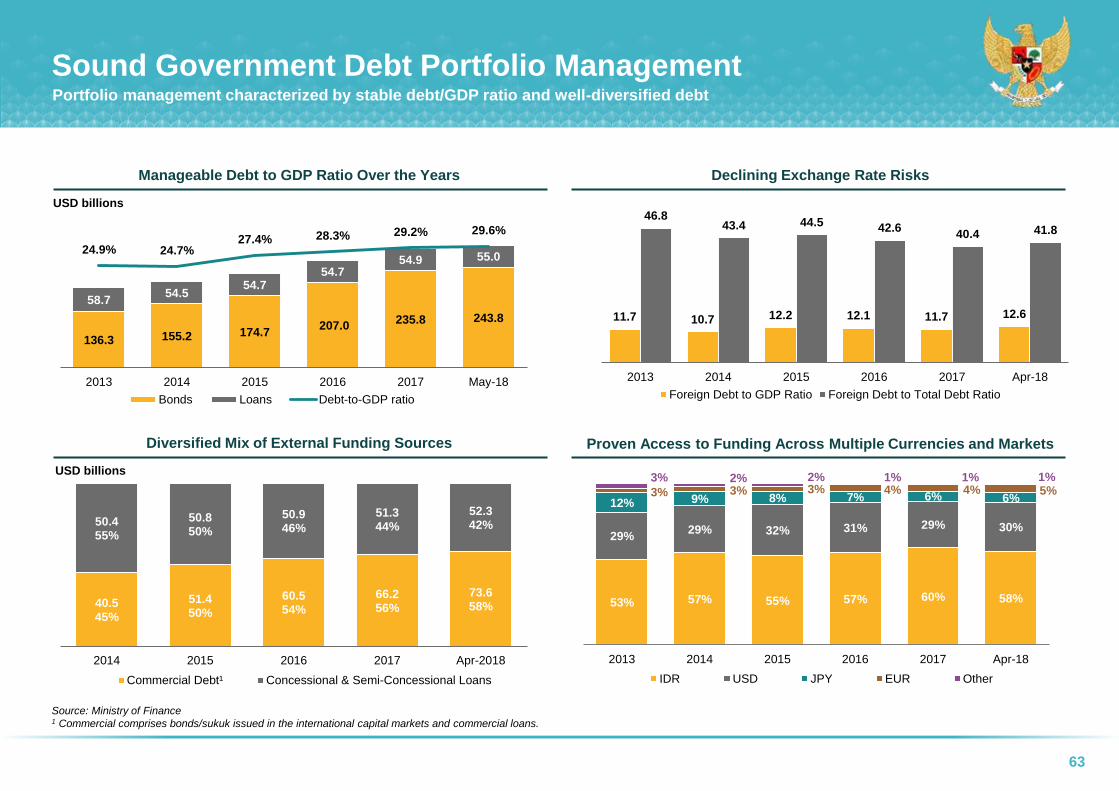
63
Source: Ministry of Finance1 Commercial comprises bonds/sukuk issued in the international capital markets and commercial loans.
Declining Exchange Rate RisksManageable Debt to GDP Ratio Over the Years
Proven Access to Funding Across Multiple Currencies and MarketsDiversified Mix of External Funding Sources
Sound Government Debt Portfolio ManagementPortfolio management characterized by stable debt/GDP ratio and well-diversified debt
USD billions
136.3 155.2 174.7207.0
235.8 243.8
58.754.5
54.754.7
54.9 55.024.9% 24.7%
27.4% 28.3% 29.2% 29.6%
2013 2014 2015 2016 2017 May-18
Bonds Loans Debt-to-GDP ratio
USD billions
11.7 10.7 12.2 12.1 11.7 12.6
46.843.4 44.5 42.6
40.4 41.8
2013 2014 2015 2016 2017 Apr-18
Foreign Debt to GDP Ratio Foreign Debt to Total Debt Ratio
40.5 45%
51.450%
60.554%
66.256%
73.658%
50.455%
50.850%
50.946%
51.344%
52.342%
2014 2015 2016 2017 Apr-2018
Commercial Debt¹ Concessional & Semi-Concessional Loans
53% 57% 55% 57% 60% 58%
29%29% 32% 31% 29% 30%
12% 9% 8% 7% 6% 6%3% 3% 3% 4% 4% 5%3% 2% 2% 1% 1% 1%
2013 2014 2015 2016 2017 Apr-18
IDR USD JPY EUR Other
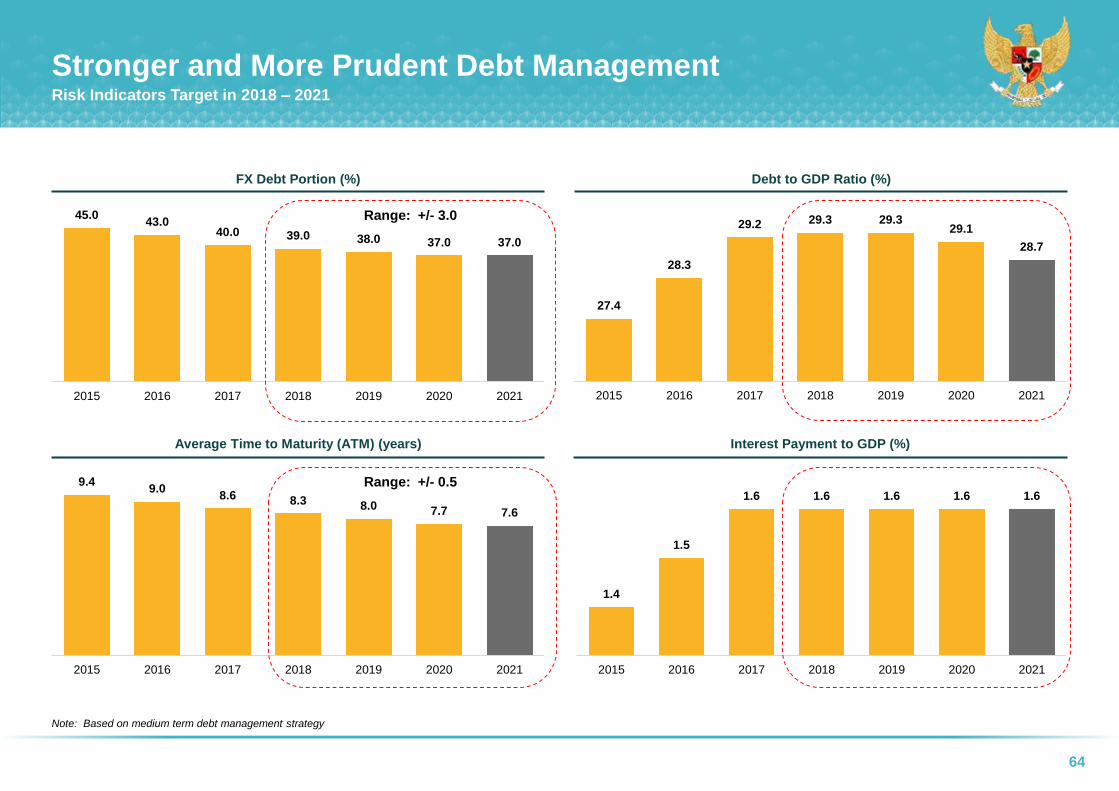
64
Stronger and More Prudent Debt ManagementRisk Indicators Target in 2018 – 2021
45.043.0
40.0 39.0 38.0 37.0 37.0
2015 2016 2017 2018 2019 2020 2021
27.4
28.3
29.2 29.3 29.329.1
28.7
2015 2016 2017 2018 2019 2020 2021
1.4
1.5
1.6 1.6 1.6 1.6 1.6
2015 2016 2017 2018 2019 2020 2021
9.49.0
8.6 8.3 8.0 7.7 7.6
2015 2016 2017 2018 2019 2020 2021
Range: +/- 3.0
Range: +/- 0.5
Interest Payment to GDP (%)Average Time to Maturity (ATM) (years)
Debt to GDP Ratio (%)FX Debt Portion (%)
Note: Based on medium term debt management strategy
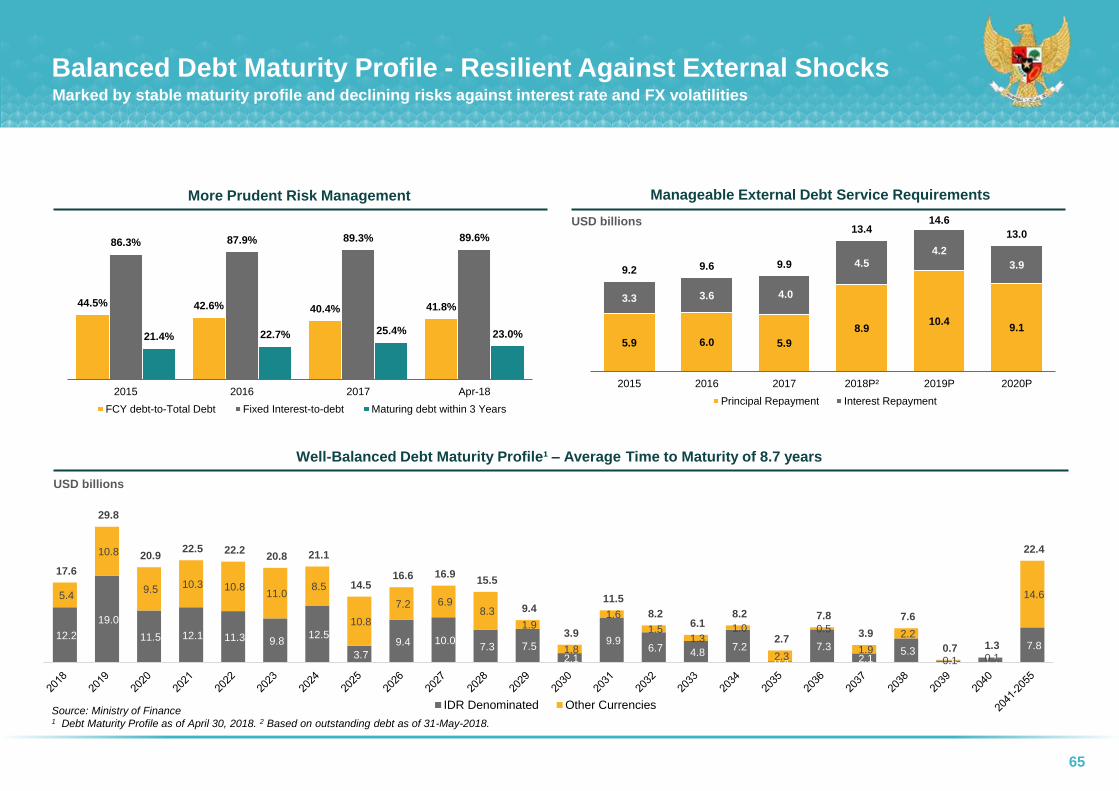
65
12.2
19.0
11.5 12.1 11.3 9.8 12.5
3.7
9.4 10.0 7.3 7.5
2.1
9.9 6.7 4.8
7.2
0.4
7.3 2.1
5.3 0.5 1.1
7.8
5.4
10.8
9.5 10.3 10.8 11.0
8.5
10.8
7.2 6.9 8.3
1.9
1.8
1.6
1.5 1.3
1.0
2.3
0.5
1.9
2.2
0.1 0.1
14.6
17.6
29.8
20.9 22.5 22.2
20.8 21.1
14.5 16.6 16.9
15.5
9.4
3.9
11.5
8.2 6.1
8.2
2.7
7.8
3.9
7.6
0.7 1.3
22.4
IDR Denominated Other CurrenciesSource: Ministry of Finance1 Debt Maturity Profile as of April 30, 2018. 2 Based on outstanding debt as of 31-May-2018.
Manageable External Debt Service RequirementsMore Prudent Risk Management
Well-Balanced Debt Maturity Profile¹ – Average Time to Maturity of 8.7 years
Balanced Debt Maturity Profile - Resilient Against External ShocksMarked by stable maturity profile and declining risks against interest rate and FX volatilities
USD billions
44.5% 42.6% 40.4% 41.8%
86.3% 87.9% 89.3% 89.6%
21.4% 22.7% 25.4% 23.0%
2015 2016 2017 Apr-18
FCY debt-to-Total Debt Fixed Interest-to-debt Maturing debt within 3 Years
5.9 6.0 5.9
8.910.4
9.1
3.3 3.6 4.0
4.54.2
3.99.2 9.6 9.9
13.414.6
13.0
2015 2016 2017 2018P² 2019P 2020P
Principal Repayment Interest Repayment
USD billions

66
Source: Ministry of Finance; Bappenas; KPPIP: “Komite Kebijakan Percepatan Penyediaan Infrastruktur” or National Committee for the Acceleration of Infrastructure Provision; OBC: Outline Business Case;
PDF: Project Development Facility; GCA: Government Contracting Activity
Indonesia’s Infrastructure Projects and Financing SchemesPromotion of Infrastructure Development to Accelerate Economic Growth
Broad
Objective Champion project preparation and acceleration of the PPP agenda
in Indonesia
Core
Mandates
Improve quality of project selection under KPPIP – OBC criteria
Support project preparation through Project Development Facility support
and highly qualified transaction advisors
Act on behalf the Minister of Finance in providing government support and
approvals for projects
Additional
Mandates
Coordinate all public finance instruments
Provide input for PPP Policy Development and Regulations
Implement capacity building program for GCAs
One stop shop for PPP promotion & Information
Budget Public Private Partnership SOE & Private Sector
Central & regional budget
(special allocation fund &
rural transfer)
Primarily to support basic
infrastructure projects:
Food security:
Irrigation, dams etc.
Maritime: Seaports,
shipyards etc.
Connectivity: Village
roads, public
transportation etc.
Certain infrastructure projects to be funded and operated through a partnership
between the Indonesian government and the private sector
Projects ready for auction under the PPP Scheme:
Toll roads projects such as Balikpapan-Samarinda and Manado-Bitung
Railway projects such as an express line into Soekarno-Hatta International Airport
Water supply projects such as the West Semarang Project
Various government support for PPP:
Project Development Facility (PDF): Helps Government Contracting Agencies
(GCAs) in project preparation and transaction
VGF: improves financial viability of PPP projects
Government Guarantees: Supports PPP projects’ bankability by providing
sovereign guarantees
Infrastructure Financing Fund: Provided through PT SMI and IIGF
Availability Payment (AP): GCA pays private partner based of availability of
infrastructure services
Government to inject capital into SOEs: Intended
multiplier effect to develop more infrastructure projects
Key focus areas:
Infrastructure and maritime development
Transportation and connectivity
Food security
Medium term infrastructure developments to focus on:
Water Supply
Airports
Seaports
Electricity and power plants
Housing
Mining
Infrastructure Development in order to:
1. Accelerate growth particularly in rural areas
2. Support industrial development and tourism
3. Reduce unemployment and poverty
Infrastructure fundraising needs: USD357.9 bn (or equivalent to Rp4,796.2 tn)
245 National Strategy Projects under National Medium Term Plan for 2015 – 2019 with an
estimated total cost of Rp4,197 tn (USD313 bn)
37 priority infrastructure projects with an estimated cost of Rp2,490 tn (USD180 bn)
Majority of 37 priority projects are expected to commence commercial operation by 2018 -
2022
Establishment of PPP UnitInfrastructure Development is a Key Priority

67
Note: From 2008 to Q1-2018, the Government has issued 75 guarantee documents with total value of USD28.84 billion, 5 of which (worth USD0.05 billion) have expired.
Government Guarantee for Basic Infrastructure DevelopmentSovereign guarantee reflects strong commitment to national development planning
Government Guarantee Program
Central Government Guarantee for
Infrastructure Programs
Guarantee
Documents
Committed
Guarantee Amount
(USD bn)
Exposure /
Outstanding
(USD bn)
1Coal Power Plant 10,000MW Fast
Track Program (FTP 1)34 6.70 2.49
2 Clean Water Supply Program 9 0.02 0.01
3Direct Lending from International
Financial Institution to SOEs4 2.03 0.56
4 Sumatra Toll Road 5 0.60 0.48
5Renewable energy, Coals & Gas
Power Plant 10,000 MW (FTP 2)11 11.59 1.59
6 Public-Private Partnerships (PPP) 5 5.74 1.42
7 Regional infrastructure financing 1 0.20 0.09
8Light Rail Transit (LRT) Jakarta
Bogor Depok Bekasi1 1.40 -
Total 70 28.29 6.63
Government Guarantees Portfolio
Credit
Guarantee
Business
Viability
Guarantee
• Power (Electricity) – Full credit guarantee for PLN’s
default on its payment obligation (FTP 1 10,000 MW,
35GW)
• Water – 70% guarantee of PDAM’s principal payment
obligation
• Infrastructure - Full credit guarantee on SOE’s default
(for lending from international financial institution) &
guarantee for PT SMI (local infrastructure financing)
• Toll road – Full credit guarantee on Hutama Karya’s
payment obligation (Sumatra Toll Road Development)
• Public Transportation (Light Rail Transit) – Full credit
guarantee for PT Kereta Api Indonesia’s debt payment
obligations for the development of LRT Jabodebek
• Power (Electricity) – Guarantee on the viability of
PLN obligation under Power Purchase
Agreements with IPPs (off-take and political risks)
under FTP-2 10.000MW and 35GW programs*
PPP
Guarantee
• Infrastructure – Guarantee on the obligation of
Government related entities in accordance to the
Agreement
Political Risk
Guarantee
• Infrastructure – Guarantee against infrastructure
risks for National Strategic Projects (Presidential
Decree No.58/2017) which are not covered by
other type of guarantees

Thank You